Renewable Energy Technology International AB Renewtec Report 008:2018 ISSN 2001-6255 Jörgen Held Renewable Energy Technology International AB Johanna Olofsson Lund University LignoSys - System study of small scale thermochemical conversion of lignocellulosic feedstock to biomethane

Welcome message from author
This document is posted to help you gain knowledge. Please leave a comment to let me know what you think about it! Share it to your friends and learn new things together.
Transcript
Renewable Energy Technology International AB
Renewtec Report 008:2018
ISSN 2001-6255
Jörgen Held Renewable Energy Technology International AB
Johanna Olofsson Lund University
LignoSys - System study of small scale thermochemical conversion of lignocellulosic
feedstock to biomethane
Publisher Renewable Energy Technology International AB Skarpskyttevägen 10 D SE-226 42 Lund SWEDEN [email protected]
© Renewable Energy Technology International AB. All rights reserved. Printed by Serviceförvaltningen/Tryckeriet Lunds kommun, Lund, SWEDEN, 2018 ISSN 2001-6255
Renewable Energy Technology International AB is a private company promoting the transfer to a sustainable and environmentally friendly energy system.
Postal address Skarpskyttevägen 10 D SE-226 42 LUND
Phone +46 (0)723-182 582
Email [email protected]
Website eng.renewtec.se
LIGNOSYS
Jörgen Held Renewable Energy Technology International AB
Johanna Olofsson
Lund University

LIGNOSYS
2
LIGNOSYS
3
Preface
This project has been financed by the Swedish Energy Agency, through the research programme; Biodrivmedel – Termokemiska Processer, Cortus Energy AB, Danish Gas Technology Centre, European Biogas Association, G4 Insights Inc., Institute for Biogas, Waste Management & Energy, Montanuniversität Leoben, OX2 Bio AB and SYSAV Utveckling AB. Lund University has conducted the system analysis and the project has been coordinated by Renewable Energy Technology International AB (Renewtec AB) in close collaboration with the project partners. The project has been carried out during the period January 2016 to December 2018. Project partners:
Matt Babicki, Principal G4 Insights Inc. Pål Börjesson, Lund University Thomas Kienberger, Montanuniversität Leoben Edson Ng, Principal G4 Insights Inc. Jörgen Held, CEO Renewtec AB Magnus Nelsson Folkelid, Business Manager Cortus Energy AB Johanna Olofsson, PhD student Lund University Fredrik Olrog, CEO OX2 Bio AB Anders Persson, CEO SYSAV Utveckling AB Niels Bjarne Rasmussen, Danish Gas Technology Centre Frank Scholwin, CEO Institute for Biogas, Waste Management & Energy Jan Stambasky, President European Biogas Association Arthur Wellinger, on behalf of the European Biogas Association
LIGNOSYS
4
Summary
The purpose of this report is to highlight the development and advances in thermo- and biochemical conversion of lignocellulosic feedstock to biomethane, raise the public awareness of the opportunities offered by this development, and provide decision and policy makers as well as market actors with key indicators which system solution, under which conditions, is preferred from a socioeconomic perspective. In addition synergies between the thermo- and biochemical conver-sion routes for lignocellulosic feedstock are identified. There has been a rapid progress in the development of gasification technologies suitable for biomethane production in the small scale (<10 MW th) during the last two decades. Common to this development is the development and progress of gasification technologies that are not dependent on an air separation unit but rather on allothermal (indirect) gasification. In this project the performance of three small scale (<10 MW th) thermochemical conversion routes for lignocellulosic feedstock to biomethane have been investi-gated by means of system studies. The three thermochemical options are:
Indirect gasification through the Heatpipe Reformer (HPR)
PyroCatalytic Hydrogenation (PCH)
Indirect gasification through the WoodRoll® process
For woody biomass the performance of the three thermochemical conversion routes are investigated, and for non-woody lignocellulose rich biomass (straw) the thermochemical conversion routes were to be compared to anaerobic digestion in combination with pretreatment of the feedstock and upgrading of the raw biogas to biomethane. However, it turned out that the thermochemical conversion routes are currently not developed to handle straw as a single fuel and therefore the compar-ison is made in a more qualitative manner based on co-gasification of straw and bark. On the other hand the system studies of thermochemical conversion of woody biomass are expanded to include an upscaled WoodRoll® system with a capacity of 16 MW bioSNG. This study shows that there are several technologies developed for bioSNG production based on small scale gasification and methanation of biomass. The three thermochemical conversion routes all have high conversion efficiencies, above 60%, based on LHV from biomass to bioSNG using wood chips with a water content of 40% as feedstock. In terms of environmental footprint there is no significant difference between them. There is currently no technology provider/ supplier of the HPR system and the PCH and WoodRoll® systems are still under development. The PCH will shortly be demonstrated in the 20 kWth scale in Alberta, Canada but without the hydrogen generation module. Cortus Energy has demonstrated the whole value chain of woody biomass to bioSNG in June 2018 in a 500 kWth WoodRoll® pilot plant in Köping, Sweden. An industrial scale Wood-Roll® of 6 MW syngas is under commissioning in Höganäs, Sweden. Here the syngas will be used to replace natural gas in an industrial process.
LIGNOSYS
5
All the investigated small scale thermochemical conversion routes have similar characteristics in terms of primary energy need and GHG balances as the large scale (200 MW bioSNG) facility reported within the MetDriv project. The most strik-ing result is that the PCH and the upscaled WoodRoll® system (16 MW bioSNG) are also competitive with the large scale facility in terms of bioSNG production cost, 74.6 and 61.7 EUR/MWh compared to 64.9 EUR/MWh. It’s important to understand that the investigated technologies are developed for the small scale. In this way they don’t suffer from the hard penalization related to down-scaling of technology developed for large scale installations. Thermochemical conversion of non-woody biomass such as straw has the potential to completely convert all the organic matter and hence produce more biomethane compared to the biochemical conversion route based on anaerobic digestion. The difference in conversion efficiency is quantified through the RED calculations of the GHG balance where the thermochemical route give rise to 2.4 g CO2-eq per MJ methane for biomass collection and transportation while the bio-chemical conversion route gives rise to 3.4 g CO2-eq per MJ methane. However, thermochemical conversion of straw is challenging due to the high content of alkali and chlorine resulting in a low ash melting temperature and the formation of highly corrosive compounds. This was confirmed in the lab scale gasification test with pelletised wheat straw conducted within the project. The bed material experienced agglomeration at 950 °C furnace temperature, corresponding to a bed temperature of 825 °C. There were no signs of agglomeration when wood pellets were gasified at the same temperature. This study has shown that the thermochemical conversion routes investigated here haven’t reached the state yet where they are able to handle straw as a single fuel. This might be circumvented by further development, addition of additives or co-gasification with other feedstocks but at the moment these are part of future development activities. Meanwhile anaerobic digestion offers a possibility to convert roughly half of the energy content in the straw to methane with the rest ending up in the digestate where the non-converted carbon contributes to attractive characteristics (increased C/N ratio, water containing properties etc.). However, the value of the non-converted carbon depends on the type of land where the digestate will be used as a fertiliser While there is still development work to be done before the first commercial scale bioSNG facility based on small scale technology is in place there are interesting possibilities to further reduce the production cost. One is related to a higher degree of automated operation and reduction of the number of personnel needed to run the facility. Another one is related to utilisation of low cost feedstocks such as RDF and different types of industrial and agricultural waste including straw. There are several synergies between bio- and thermochemical biomethane production such as heat integration, gasification of the digestate and cost sharing of the upgrading system and downstream equipment.
LIGNOSYS
6
The thermochemical conversion route produce excess process heat while the bio-chemical conversion route needs heat for the anaerobic process, the amount de-pends on the type of digestion, e.g. mesophilic or thermophilic digestion. Other examples of processes in need of heat are hygienization, drying of the digestate and in case of upgrading based on chemical scrubbing, regeneration of the scrubber liquid. The digestate may contain relatively large amounts of unconverted organic matter and, if the digestate can’t be used as a fertiliser, this energy might be recovered by thermochemical conversion of the digestate. The combination of thermochemical and biochemical facilities provides an oppor-tunity to share the cost for the upgrading and the downstream equipment. Especially facilities with a small raw gas flow (< 1,000 Nm3/h) benefits from cost sharing since the specific investment cost for upgrading is strongly reduced when going from gas flows below 1,000 Nm3/h to approx. 2,000 Nm3/h. The upgrading constitutes a significant part (approx. 10-20%) of the overall investment cost for both the bio- and thermochemical conversion routes (HPR and WoodRoll®). Decision support and key indicators Based on the data given by the technology providers the small scale technologies can compete with large scale bioSNG plants in terms of GHG emissions and primary energy need. However, the main finding is that two of the small scale technologies, PCH (4.6 MW bioSNG) and WoodRoll® (16 MW bioSNG) are also able to compete with large scale bioSNG facilities in terms of production cost. These findings provide the justification for the further development and implemen-tation of small scale thermochemical conversion of biomass to bioSNG. The conversion efficiencies, primary energy needs, GHG balances and bioSNG production costs presented in this report provide decision makers with important key indicators for the investigated technologies. For non-woody biomass, such as straw, the thermochemical conversion routes have the potential for higher conversion efficiency but they are currently not deve-loped to use straw as a single fuel. Meanwhile anaerobic digestion provides an opportunity to convert approx. half of the energy content in the straw to methane. The unconverted carbon ending up in the digestate contributes to attractive properties when used as a bio-fertiliser. Arable land in intensive agriculture areas dominated by annual crop production normally has a declining soil carbon content, thus an increase input of carbon via digestate could lead to significant benefit in these soils. This is especially the case in soils with a large difference between the actual soil carbon content and the soil organic carbon saturation capacity of the soil. On farmland dominated by perennial crops, such as ley crops, the benefit of digestate will normally be lower since the soil carbon content in these soils are higher and often close to the soil organic carbon saturation capacity. The project has its own webpage, http://lignosys.renewtec.se, where all presenta-tions, publications and results are available for download, free of charge.

LIGNOSYS
7
Finally, it might be noted that G4 Insights Inc. is developing an upscaled PCH system which will further reduce the bioSNG production cost. A follow-up of the ongoing development including the results and experiences from the PCH demon-stration in Alberta, Canada and the WoodRoll® demonstration in Höganäs, Sweden will provide additional input data for future system studies and economic analyses.
LIGNOSYS
8
Abbreviations and expressions used in this report
ASU Air Separation Unit Biomethane A gas of natural gas quality produced from resources of renewable origin. BioSNG A synthetic gas of natural gas quality produced from resources
of renewable origin. CCS Carbon Capture and Sequestration C/N ratio The ratio between carbon and nitrogen CO2-eq. Carbon dioxide equivalent CPI Consumer Price Index. The annual percentage change in the CPI is used as a measure of the inflation. CTH Chalmers University of Technology (Chalmers Tekniska Hög-
skola) DGC Danish Gas Technology Centre DME DiMethyl Ether ECN Energy Research Centre of the Netherlands ESME ECN System for Methanation GHG Greenhouse Gases GoBiGas Gothenburg Biomass Gasification GWP Global Warming Potential HPR Heatpipe Reformer ISO International Organization for Standardization kWth Kilo Watt thermal LCA Life Cycle Assessment LHV Lower Heating Value MILENA Multipurpose Integrated Lab-unit for Explorative and Innovative Achievements in biomass gasification MJ Mega Joule Moisture content WW/WD, weight of water/weight of dry matter MWth Mega Watt thermal n.a. not available Nm3
Normal cubic metre (Temperature: 0 °C, Pressure: 1.01325 bar) OLGA A Dutch acronym for oil-based gas wash PCH PyroCatalytic Hydrogenation PSI Paul Scherrer Institute RDF Refuse Derived Fuel RED Renewable Energy Directive SFC Swedish Gasification Center (Svenskt förgasningscentrum) SOC Soil Organic Carbon TGA Thermogravimetric analysis TREMP Topsoes’ recycle energy efficient methanation process Water content WW/(WD + WW), weight of water/(weight of dry matter and water) wt% Percentage by weight
LIGNOSYS
9
Content
1. Introduction ................................................................................................... 11
1.1 National and international technology development .................................... 12
2.1 BioSNG in a Swedish context ..................................................................... 12
2. Methodology and assumptions ...................................................................... 14
3. Objectives ..................................................................................................... 16
4. Thermochemical conversion ......................................................................... 17
4.1 Heatpipe Reformer (HPR)........................................................................... 17
4.3 PyroCatalytic Hydrogenation (PCH) ............................................................ 20
5. Status - gasification of lignocellulosic feedstock ............................................ 23
5.1 Gasification of straw ................................................................................... 23
5.2 Gasification of yellow wheat straw pellets in lab scale ................................ 24
6. Pretreatment of lignocellulose for anaerobic digestion .................................. 26
6.1 Physical pretreatment ................................................................................. 26
6.2 Chemical pretreatment ............................................................................... 27
6.3 Biological pretreatment ............................................................................... 27
7. Anaerobic digestion and upgrading ............................................................... 28
8. Economic analysis ........................................................................................ 29
8.1 Specific investment cost – small scale vs. large scale ................................ 29
8.2 Input data and calculations – woody biomass (base case) ......................... 30
8.3 BioSNG production cost – woody biomass (base case) .............................. 30
8.4 Input data and calculations – co-gasification of bark and straw ................... 34
8.5 BioSNG production cost – co-gasification of bark and straw ....................... 36
8.6 Economic sensitivity analysis ...................................................................... 37
9. System studies.............................................................................................. 38
9.1 GHG balances – methodology .................................................................... 38
9.2 Primary energy balances ............................................................................ 44
10. Synergies between bio- and thermochemical biomethane production processes ............................................................................................................ 46
11. Final results and discussion ....................................................................... 48
12. Conclusions and future outlook .................................................................. 50
13. Acknowledgement ...................................................................................... 51
14. References ................................................................................................. 52

LIGNOSYS
10
LIGNOSYS
11
1. Introduction Lignocellulosic biomass such as woody biomass, straw and grass is composed of cellulose, hemicellulose and lignin. Lignocellulose has evolved to resist degrada-tion and to confer hydrolytic stability and structural robustness to the cell walls of the plants. This robustness or "recalcitrance" is attributable to the crosslinking between the polysaccharides (cellulose and hemicellulose) and the lignin via ester and ether linkages. The lignin and the associated linkages make the biomass less degradable and are the main reason for the poor biogas yield in anaerobic digestion of lignocellulosic substrates. The biogas yield can be increased through proper pretreatment at the expense of higher investment and operational costs. The lignin poses no problem in thermochemical conversion such as indirect gasifi-cation, which opens up the possibility to produce biomethane through gasification and methanation of lignocellulosic feedstock in the small scale without the need of an air separation unit1. Since lignocellulosic feedstock is abundant and don’t compete with food produc-tion the potential to use it for biofuel production is of great interest. It’s possible to produce a number of biofuels through thermochemical conversion of ligno-cellulosic feedstock such as methane, methanol, ethanol, DME, and Fischer-Tropsch diesel but all these biofuels, except methane, rely on large installations (typically a few hundred MW) and oxygen-blown gasification. There are several reasons why methane is not as hard penalized as the other biofuels when moving to small scale installations. One is that during indirect gasification methane is formed in the gasification process. As much as 40-50% of the heating value of the syngas can be attributed to methane. Methane is a stable compound and if one wants to produce any other hydrocarbon or alcohol as final product the carbon and hydrogen in the methane is a major drawback. One way to avoid this is by raising the gasification temperature and thermally crack the methane but in indirect gasifi-cation the temperature in the gasifier is limited. Since methane is the simplest hydrocarbon, the synthesis step where hydrogen and carbon monoxide are converted to methane (methanation) is the simplest. Methanation is a strong exothermic process and it’s a huge advantage that as much as 40-50% of the heating value of the syngas is already in the form of methane. These are also the reasons why methane has the highest conversion efficiency from feedstock to final product of all 2nd generation biofuels. There are several advantages with small scale plants compared to large scale production:
It’s easier to secure the feedstock supply, and the logistics are simpler since less feedstock needs to be transported.
It’s easier to match the excess process heat with the local heat and steam demand.
Lower economic risk due to the lower investment cost compared to a large scale facility.
LIGNOSYS
12
The challenges are the need for highly automated processes since small scale plants can’t carry a large number of staff economically, the need for demonstration plants and long term tests. Since the development normally is done by small market players it might be hard to obtain guarantees and to be sure that the technology provider/supplier will be around during the whole expected life time of the plant.
1.1 National and international technology development
Sweden has a strong tradition in biomass gasification and there is national spear-head research and development within the field of gasification and methanation. This work is mainly carried out by Chalmers University of Technology, Cortus Energy AB in collaboration with the Royal Institute of Technology, and Mid Sweden University. However, technologies suited for small scale gasification and methanation are mainly developed on the international arena. Leading players are among others Technische Universität Wien (the Güssing gasifier), Energy Research Centre of the Netherlands (MILENA gasification technology, OLGA tar removal and ESME methanation), Paul Scherrer Institute (fluidised bed methana-tion), Technische Universität München (three phase methanation), Friedrich-Alexander Universität Erlangen-Nürnberg (Heatpipe Reformer) and Karlsruhe Institute of Technology (Honeycomb methanation catalyst). The GoBiGas plant in Gothenburg is for example based on gasification technology developed at Technische Universität Wien, Austria and methanation developed by Haldor Topsoe in Denmark. However, advances in syngas cleaning have been developed, implemented and demonstrated in the GoBiGas plant through the Bio-ProGReSs project based on technology developed at CTH in combination with Online Tar Measurements (CON-TAR) developed at Technische Universität Berlin.2
2.1 BioSNG in a Swedish context
There are many reasons why bioSNG through gasification and methanation of woody biomass is of particular interest in Sweden. Resources: Sweden is the third-largest country within the European Union in terms of area, 450,000 km2, and 57% of the total land area is classified as productive forest land3. The forestry industry is well developed and the logistics for biomass transportation are in place. It’s not uncommon with wood chips fuelled CHP production plants in the 100+ MW th scale. Currently (2018) the biggest is 380 MW th and located in Värtan, Stockholm, and the second biggest 265 MW th located in Igelsta, Södertälje. Natural gas price: According to EUROSTAT4 the natural gas price excluding VAT and other recoverable taxes and levies to non-household consumers is 48 EUR/MWh in the first half of 2018. This is almost twice as high as the natural gas price in continental Europe. However, the 48 EUR/MWh only reflect the cost where pipeline natural gas is currently available, i.e. the Southwest coast of Sweden. In
LIGNOSYS
13
the inland the cost for transportation and storage has to be added while local production and utilisation of bioSNG isn’t burden with these additional costs. Transport fuel: In Sweden the development of upgraded biogas as vehicle fuel continues to progress. At the end of 2017 there were 174 public filling stations5 and the share of upgraded biogas sold as vehicle gas (natural gas and biogas) was, in the first half of 2018, above 90%. Taxation: There is currently no energy tax on natural gas used as vehicle fuel6 and there is no energy and carbon dioxide tax on biomethane used as vehicle fuel. The carbon dioxide tax as per 1 July 2018 is 2.465 SEK per Nm3 natural gas7. This corresponds roughly to 21.5 EUR/MWh. Political ambitions: Sweden is supposed to have a fossil fuel independent vehicle fleet in 20308 and biomethane will play an important role in this transition since the technology is available, there is an existing infrastructure and the number of filling stations increases year by year. Competition: BioSNG has the highest conversion efficiency (~60-70%) of today’s commercially available second generation biofuels and it can be used with the highest efficiency and the lowest emissions. It can be mixed with natural gas in any proportion (0-100%) and distributed in the natural gas infrastructure and used in natural gas applications, which imply a worldwide development and market. In addition plants for bioSNG, contrary to other renewable transport fuels based on gasification, can be built in small and medium scale scale (<100 MW th) and still be economically feasible.
LIGNOSYS
14
2. Methodology and assumptions The project's main methodology for energy and greenhouse gas analysis is energy and life cycle assessment (LCA), which is integrated and developed into compara-tive system studies based on ISO methodology (ISO 140 44 for LCA) and the cal-culation methodology of the EU's Directive on renewable energy (RED). The sys-tem studies are done on a well-to-gate basis. Data for the HPR system is based on previous information provided by agnion Technology GmbH, the company who marketed the HPR before being acquired by Entrade, and by prof. Kienberger, the former head of research and development of the HPR as well as through the literature. In addition gasification of lignocellulosic feedstock, pelletised wood and pelletised straw, has been performed in a lab scale allothermal gasifier by DGC to support the investigation and the system analysis. The data for the system studies related to the PCH and the WoodRoll® systems is collected directly from the technology suppliers, G4 Insights Inc. and Cortus Energy AB. Wood chips with a water content of 40%, 2.5% ash and a lower heating value of 19.2 MJ/kg dry and ash free matter has been selected as feedstock in the comparison of the thermochemical bioSNG production routes. Wheat straw with a water content of 9.5%, 5.9% ash and a lower heating value of 19.2 MJ/kg dry and ash free matter has been selected as feedstock/substrate in the comparison between thermo- and biochemical conversion of non-woody ligno-cellulose rich biomass to biomethane. However, it turned out that the thermo-chemical conversion routes are currently not developed to handle straw as a single fuel and therefore the comparison is made in a more qualitative manner based on co-gasification of bark and wheat straw and compared to literature data. Bark with a water content of 55%, 3% ash and a lower heating value of 19.2 MJ/kg dry and ash free matter has been selected for the co-gasification analysis. Chemical scrubbing has been chosen as the preferred CO2 removal technology due to available excess process heat in the thermochemical conversion of ligno-cellulosic feedstock. The plant size has been chosen to approx. 5 MW bioSNG to match the planned development of the thermochemical systems as well as the capacity of existing chemical scrubbing systems. To have a fair comparison the same supplier for the chemical scrubbing system was used, Wärtsilä Puregas Solutions AB. The interface between the gasification and methanation system and the CO2 removal system has been calculated by the chemical scrubbing supplier, Wärtsilä Puregas Solutions AB. The gas quality should comply with the Swedish standard for biomethane as vehicle fuel or injection in to the gas grid, i.e. 95% methane and at a pressure of 4 bar gauge corresponding to the pressure level in the Swedish distribution grid.

LIGNOSYS
15
The annuity method has been used in the economic evaluation of the different bio-methane production routes. The following currency exchange rates have been used throughout the report and in recalculation of data found in the literature; 1 USD = 9.0 SEK and 1 EUR = 10.3 SEK.
LIGNOSYS
16
3. Objectives There are several aims of the project. One is to investigate and compare the performance, including cost, GHG emissions and energy efficiency, of new technology for production of biomethane through thermochemical conversion of lignocellulose in the small scale (<10 MW th). This will be done through system studies. For woody biomass three different thermochemical options will be studied.
Indirect gasification through heatpipes (the HPR system)
PyroCatalytic Hydrogenation (PCH)
Indirect gasification through the WoodRoll® process
Wheat straw, as non-woody lignocellulose rich biomass, will be investigated in a comparative study involving the thermochemical conversion routes and anaerobic digestion in combination with pretreatment of the feedstock and upgrading of the raw biogas to biomethane using chemical scrubbing. However, it turned out that the thermochemical conversion routes are currently not developed to handle straw as a single fuel and therefore the comparison is made in a more qualitative manner. On the other hand the system studies of thermochemical conversion of woody biomass are expanded to include an upscaled WoodRoll® system with a capacity of 16 MW bioSNG. Another aim is to identify synergies between the thermo- and biochemical conver-sion routes for lignocellulosic feedstock. Besides building up knowledge and competence related to small scale thermo-chemical conversion of lignocellulose to biomethane the study will result in key indicators and decision support how to use domestic biomass resources in an efficient and climate smart way as well as raise the public awareness of the oppor-tunities offered by this development.
LIGNOSYS
17
4. Thermochemical conversion
4.1 Heatpipe Reformer (HPR)
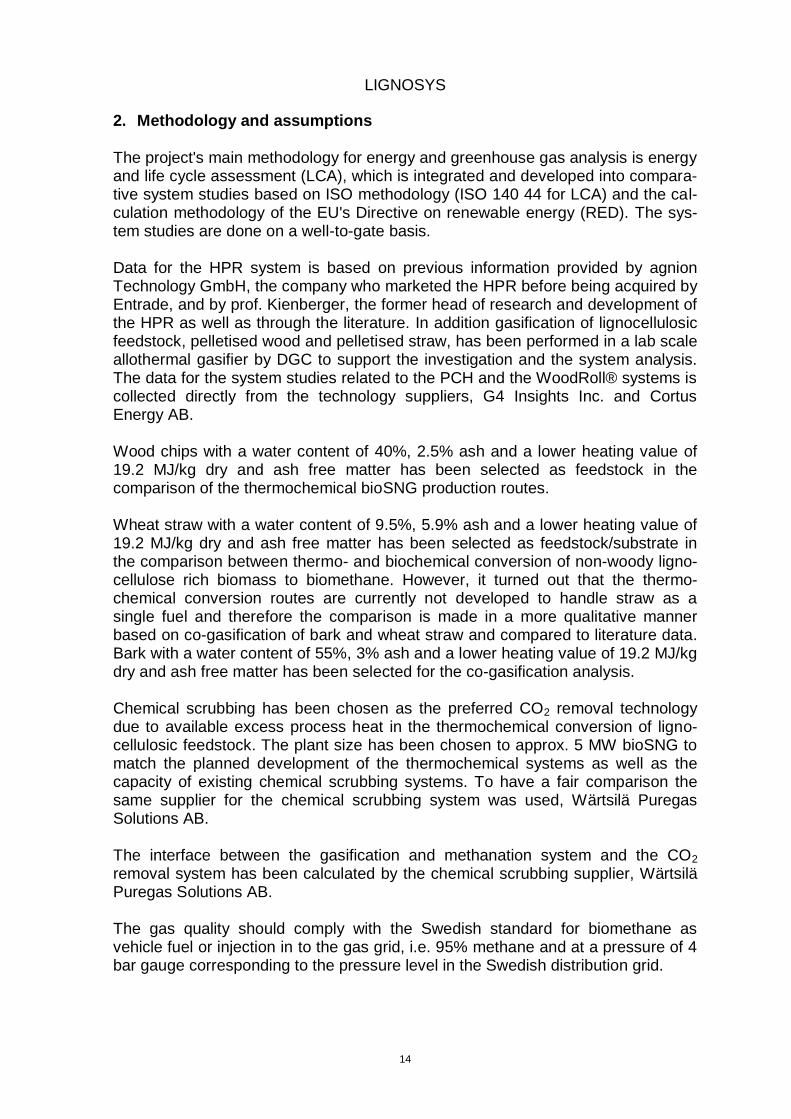
The HPR is based on two bubbling fluidized beds connected through heatpipes which transfer the heat from the combustion reactor to the reformer reactor. The research and development was carried out by agnion Highterm Research GmbH and the technology was commercialized by agnion Technologies GmbH in Pfaffenhofen a.d. Ilm, Germany. The company was later acquired by ENTRADE Energiesysteme AG and the development was stopped. However, the inventor of the HPR and the founder of agnion, Prof. Jürgen Karl at the Friedrich-Alexander University in Erlangen-Nuremberg has continued to do R&D work on the HPR. The group has a HPR in pilot scale, 100 kWth. It might be noteworthy that the original patents related to the HPR have expired. In the HPR heat is carried from the combustion reactor to the reformer reactor by means of a working media contained in the enclosed heatpipes. The transferred heat in combination with an oxidizing agent, in this case steam, results in a thermo-chemical decomposition of the biomass in the fluidized bed reformer into a tar rich syngas.
Figure 1. HPR by courtesy of agnion Technologies GmbH.
The major innovation provided by the agnion HPR concept is that it allows a high thermal transfer at a low temperature gradient. In other words even though the temperature difference between the combustor and reformer is small sufficient amounts of heat is transferred through the heatpipes. This is achieved through the working fluid that is contained in the enclosed pipes. The working fluid, such as sodium or potassium, evaporates in the part of the
LIGNOSYS
18
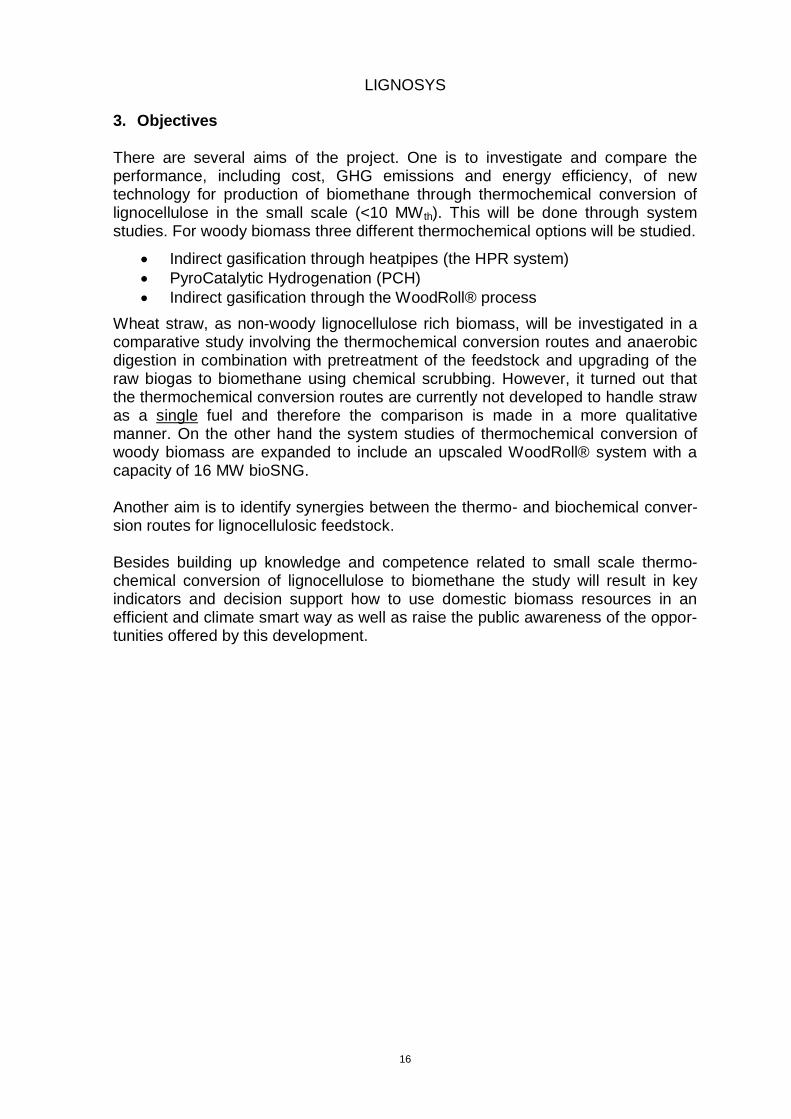
heatpipe that is in contact with the combustion reactor and condenses in the part of the heatpipe that is in contact with the fluidized bed reformer, see Figure 2.
The vertical heatpipes with the reformer on top of the combustor creates a self-induced circulation of the working fluid. The heat transfer is one order of magnitude higher compared to the heat transfer obtained by a gas-to-gas heat exchanger.
Figure 2. The vertical heatpipe by courtesy of agnion Technologies GmbH.
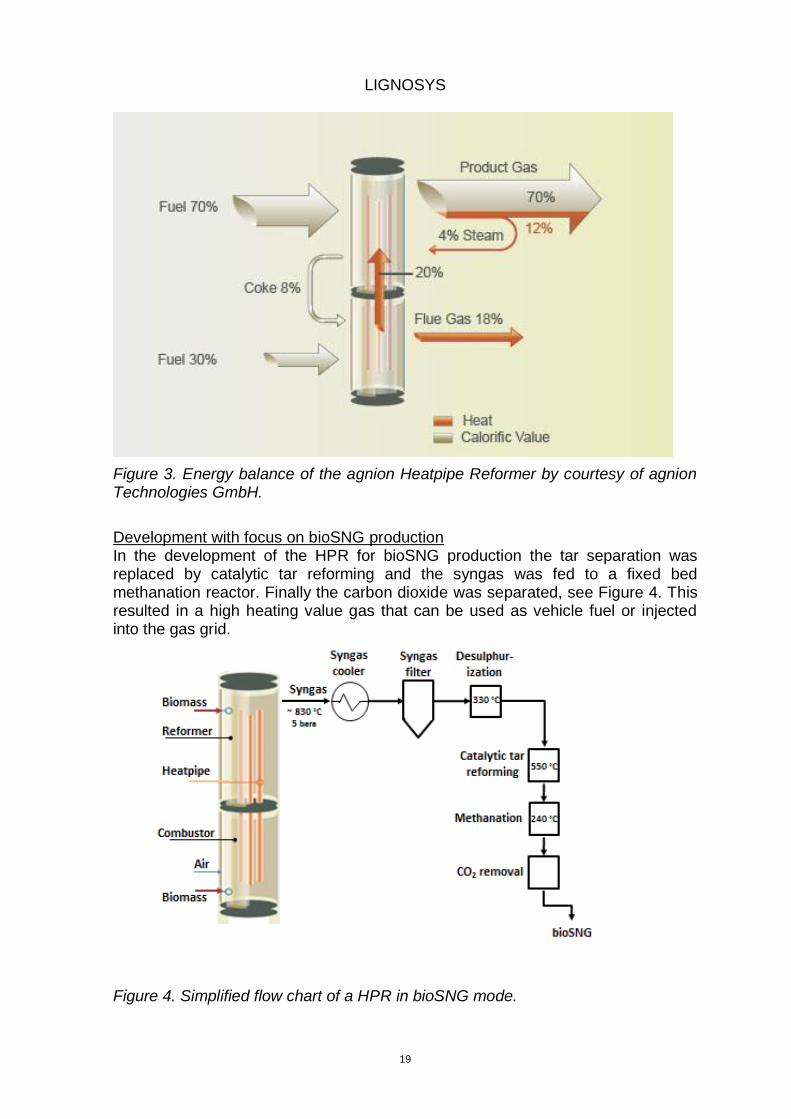
The agnion HPR came in modules of 1.4 MW th (1.3 MW th before). Commercial facilities were installed in Germany and Italy including tar separation based on an organic solvent scrubber (RME) and a gas engine for CHP production. Since the reformer operates at elevated pressure (4 barg) no additional compression was needed to feed the syngas into the gas engine. The agnion HPR has a cold gas efficiency of 70%. The electric efficiency for a 1.4 MW th plant operating in CHP mode is approx. 30%, in addition heat suitable for district heating is produced giving an overall efficiency of approx. 75%
9. The
energy balance for the agnion HPR is shown in Figure 3. The energy balance is based on wood chips with 20% water content as feedstock. In this report wood chips with a water content of 40% are used as feedstock and the economic analysis and the system study include drying of the biomass from 40% to 20%.
LIGNOSYS
19
Figure 3. Energy balance of the agnion Heatpipe Reformer by courtesy of agnion Technologies GmbH.
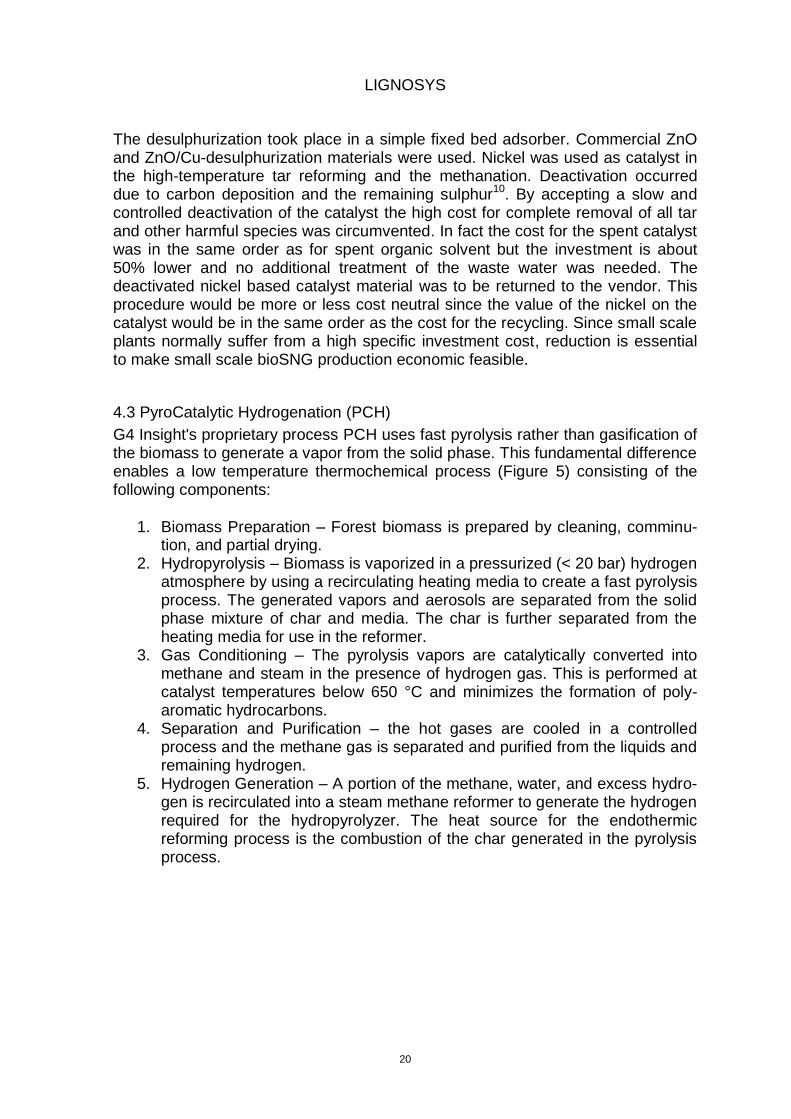
Development with focus on bioSNG production In the development of the HPR for bioSNG production the tar separation was replaced by catalytic tar reforming and the syngas was fed to a fixed bed methanation reactor. Finally the carbon dioxide was separated, see Figure 4. This resulted in a high heating value gas that can be used as vehicle fuel or injected into the gas grid. Figure 4. Simplified flow chart of a HPR in bioSNG mode.
LIGNOSYS
20
The desulphurization took place in a simple fixed bed adsorber. Commercial ZnO and ZnO/Cu-desulphurization materials were used. Nickel was used as catalyst in the high-temperature tar reforming and the methanation. Deactivation occurred due to carbon deposition and the remaining sulphur10. By accepting a slow and controlled deactivation of the catalyst the high cost for complete removal of all tar and other harmful species was circumvented. In fact the cost for the spent catalyst was in the same order as for spent organic solvent but the investment is about 50% lower and no additional treatment of the waste water was needed. The deactivated nickel based catalyst material was to be returned to the vendor. This procedure would be more or less cost neutral since the value of the nickel on the catalyst would be in the same order as the cost for the recycling. Since small scale plants normally suffer from a high specific investment cost, reduction is essential to make small scale bioSNG production economic feasible.
4.3 PyroCatalytic Hydrogenation (PCH)
G4 Insight's proprietary process PCH uses fast pyrolysis rather than gasification of the biomass to generate a vapor from the solid phase. This fundamental difference enables a low temperature thermochemical process (Figure 5) consisting of the following components:
1. Biomass Preparation – Forest biomass is prepared by cleaning, comminu-tion, and partial drying.
2. Hydropyrolysis – Biomass is vaporized in a pressurized (< 20 bar) hydrogen atmosphere by using a recirculating heating media to create a fast pyrolysis process. The generated vapors and aerosols are separated from the solid phase mixture of char and media. The char is further separated from the heating media for use in the reformer.
3. Gas Conditioning – The pyrolysis vapors are catalytically converted into methane and steam in the presence of hydrogen gas. This is performed at catalyst temperatures below 650 °C and minimizes the formation of poly-aromatic hydrocarbons.
4. Separation and Purification – the hot gases are cooled in a controlled process and the methane gas is separated and purified from the liquids and remaining hydrogen.
5. Hydrogen Generation – A portion of the methane, water, and excess hydro-gen is recirculated into a steam methane reformer to generate the hydrogen required for the hydropyrolyzer. The heat source for the endothermic reforming process is the combustion of the char generated in the pyrolysis process.
LIGNOSYS
21
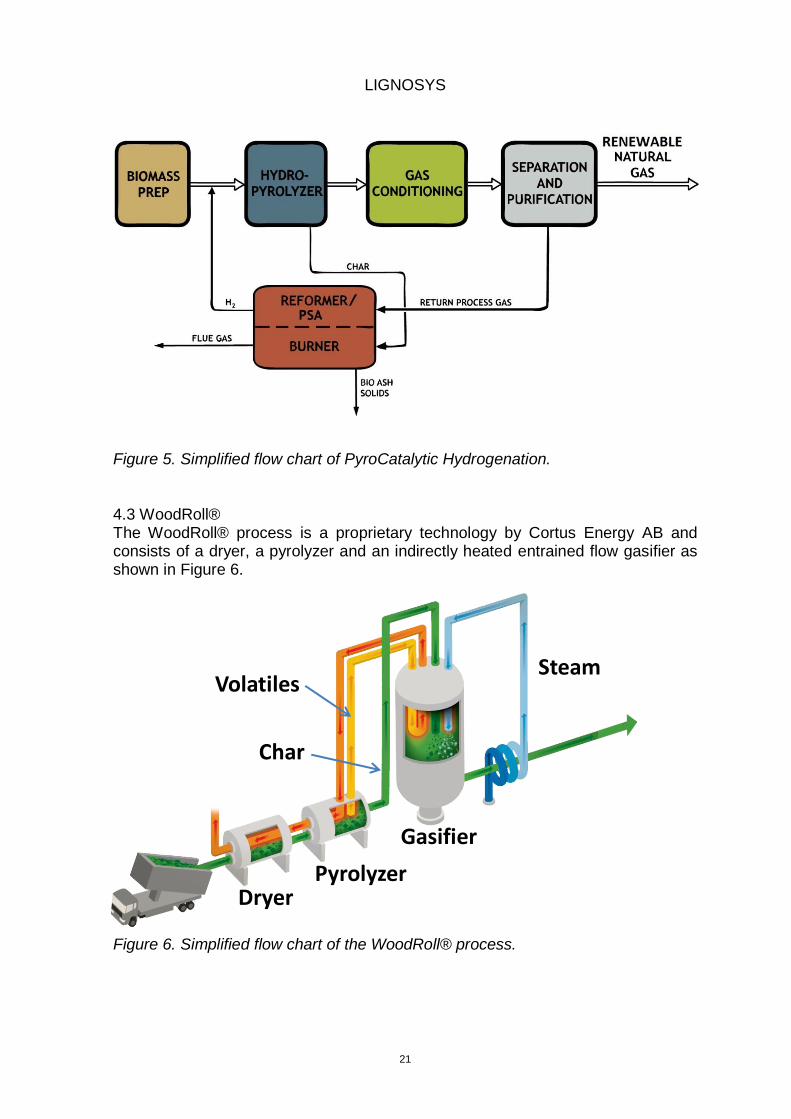
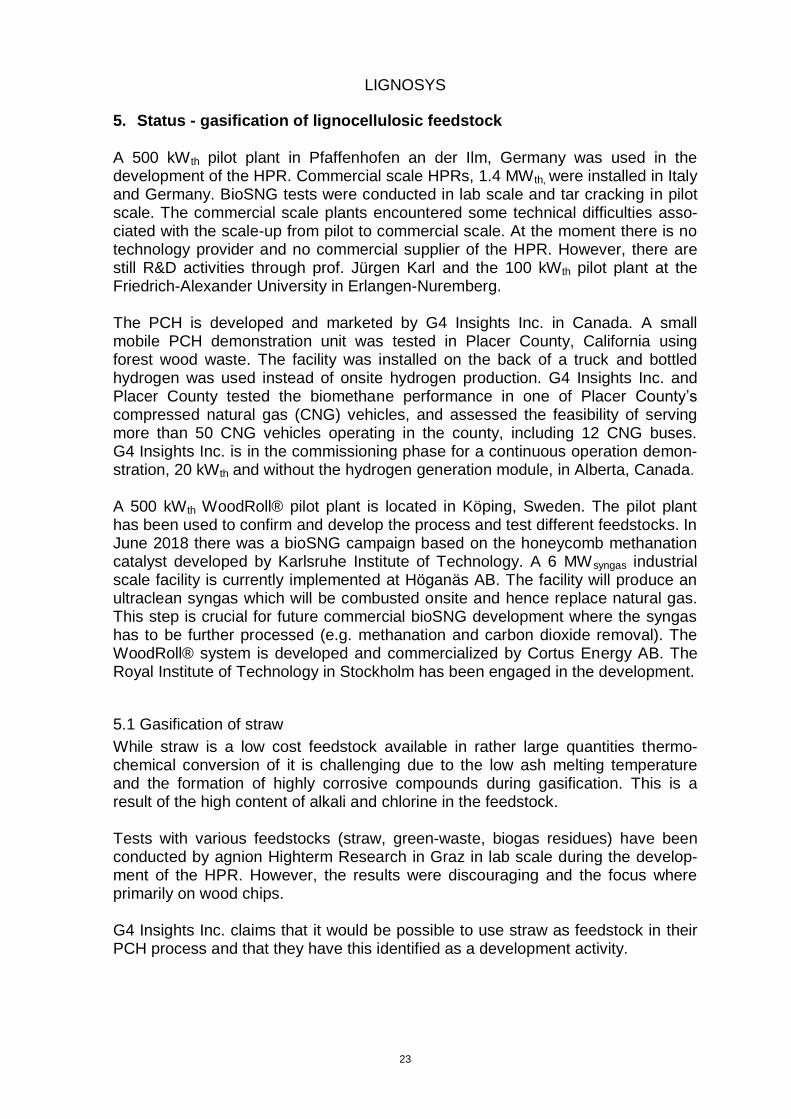
Figure 5. Simplified flow chart of PyroCatalytic Hydrogenation. 4.3 WoodRoll® The WoodRoll® process is a proprietary technology by Cortus Energy AB and consists of a dryer, a pyrolyzer and an indirectly heated entrained flow gasifier as shown in Figure 6.
Figure 6. Simplified flow chart of the WoodRoll® process.
Steam
Dryer Pyrolyzer
Gasifier
Volatiles
Char
Steam

LIGNOSYS
22
The biomass/waste is first dried and then pyrolyzed. The volatiles are then combusted in single ended recuperative heatpipes to provide heat to the gasifier. The char is ground and then introduced into the gasifier where it’s converted at 1,100 °C to syngas with steam as gasifying agent. The heat of the flue gas is used to heat the pyrolyzer and the dryer. The syngas is cooled down and the heat is used for steam generation.
.
LIGNOSYS
23
5. Status - gasification of lignocellulosic feedstock A 500 kW th pilot plant in Pfaffenhofen an der Ilm, Germany was used in the development of the HPR. Commercial scale HPRs, 1.4 MW th, were installed in Italy and Germany. BioSNG tests were conducted in lab scale and tar cracking in pilot scale. The commercial scale plants encountered some technical difficulties asso-ciated with the scale-up from pilot to commercial scale. At the moment there is no technology provider and no commercial supplier of the HPR. However, there are still R&D activities through prof. Jürgen Karl and the 100 kWth pilot plant at the Friedrich-Alexander University in Erlangen-Nuremberg. The PCH is developed and marketed by G4 Insights Inc. in Canada. A small mobile PCH demonstration unit was tested in Placer County, California using forest wood waste. The facility was installed on the back of a truck and bottled hydrogen was used instead of onsite hydrogen production. G4 Insights Inc. and Placer County tested the biomethane performance in one of Placer County’s compressed natural gas (CNG) vehicles, and assessed the feasibility of serving more than 50 CNG vehicles operating in the county, including 12 CNG buses. G4 Insights Inc. is in the commissioning phase for a continuous operation demon-stration, 20 kWth and without the hydrogen generation module, in Alberta, Canada. A 500 kWth WoodRoll® pilot plant is located in Köping, Sweden. The pilot plant has been used to confirm and develop the process and test different feedstocks. In June 2018 there was a bioSNG campaign based on the honeycomb methanation catalyst developed by Karlsruhe Institute of Technology. A 6 MWsyngas industrial scale facility is currently implemented at Höganäs AB. The facility will produce an ultraclean syngas which will be combusted onsite and hence replace natural gas. This step is crucial for future commercial bioSNG development where the syngas has to be further processed (e.g. methanation and carbon dioxide removal). The WoodRoll® system is developed and commercialized by Cortus Energy AB. The Royal Institute of Technology in Stockholm has been engaged in the development.
5.1 Gasification of straw
While straw is a low cost feedstock available in rather large quantities thermo-chemical conversion of it is challenging due to the low ash melting temperature and the formation of highly corrosive compounds during gasification. This is a result of the high content of alkali and chlorine in the feedstock. Tests with various feedstocks (straw, green-waste, biogas residues) have been conducted by agnion Highterm Research in Graz in lab scale during the develop-ment of the HPR. However, the results were discouraging and the focus where primarily on wood chips. G4 Insights Inc. claims that it would be possible to use straw as feedstock in their PCH process and that they have this identified as a development activity.
LIGNOSYS
24
Cortus Energy indicates that straw might be of interest as feedstock but only in combination with other fuels due to the low ash melting temperature. However, this is a matter for future development and the quest for low cost feedstocks. Primarily the focus is on “easier” feedstocks such as wood chips, forest residues and bark.
5.2 Gasification of yellow wheat straw pellets in lab scale
DGC has acquired a 1.5 kWth lab scale allothermal gasifier from Highterm Research in Austria and conducted a measurement campaign on pelletised yellow wheat straw. Steam was used as a gasifying agent. The results were compared to those obtained when pelletised wood were gasified. In the tests commercially available straw and wood pellets of 8 mm diameter and 6 mm respectively were gasified. The gasifier is electrically heated and 800 g
olivine (Mg²⁺, Fe²⁺)₂SiO₄ was used as a bed material to support and enhance the gasification process. To fluidize the gasifier 350 g/h steam was supplied and the 1 barg pressure was maintained during the gasification process. At least duplicate experiment was performed for 1 hour in each selected temperature. The gasifica-tion was performed at 750 oC, 800 oC, 850 oC, 900 oC and 950 oC allothermal temperature of the furnace. The actual bed temperature was 50 to 150 oC lower.
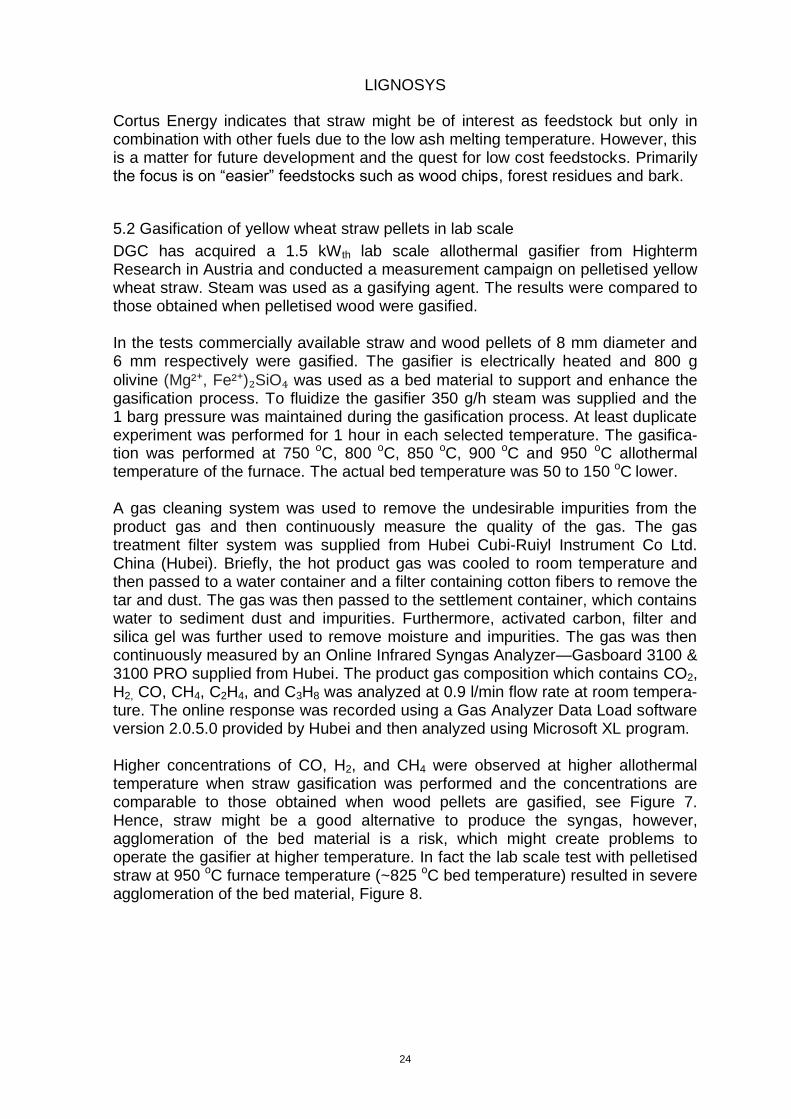
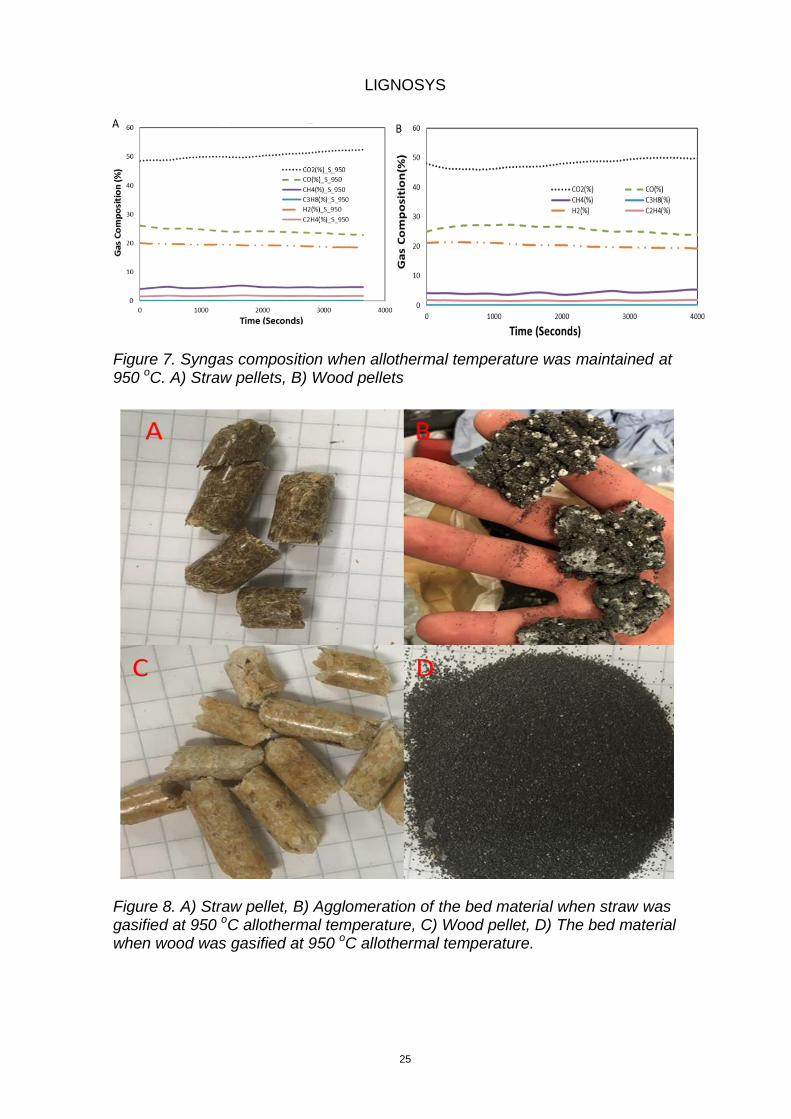
A gas cleaning system was used to remove the undesirable impurities from the product gas and then continuously measure the quality of the gas. The gas treatment filter system was supplied from Hubei Cubi-Ruiyl Instrument Co Ltd. China (Hubei). Briefly, the hot product gas was cooled to room temperature and then passed to a water container and a filter containing cotton fibers to remove the tar and dust. The gas was then passed to the settlement container, which contains water to sediment dust and impurities. Furthermore, activated carbon, filter and silica gel was further used to remove moisture and impurities. The gas was then continuously measured by an Online Infrared Syngas Analyzer—Gasboard 3100 & 3100 PRO supplied from Hubei. The product gas composition which contains CO2, H2, CO, CH4, C2H4, and C3H8 was analyzed at 0.9 l/min flow rate at room tempera-ture. The online response was recorded using a Gas Analyzer Data Load software version 2.0.5.0 provided by Hubei and then analyzed using Microsoft XL program. Higher concentrations of CO, H2, and CH4 were observed at higher allothermal temperature when straw gasification was performed and the concentrations are comparable to those obtained when wood pellets are gasified, see Figure 7. Hence, straw might be a good alternative to produce the syngas, however, agglomeration of the bed material is a risk, which might create problems to operate the gasifier at higher temperature. In fact the lab scale test with pelletised straw at 950 oC furnace temperature (~825 oC bed temperature) resulted in severe agglomeration of the bed material, Figure 8.
LIGNOSYS
25
Figure 7. Syngas composition when allothermal temperature was maintained at 950 oC. A) Straw pellets, B) Wood pellets
Figure 8. A) Straw pellet, B) Agglomeration of the bed material when straw was gasified at 950 oC allothermal temperature, C) Wood pellet, D) The bed material when wood was gasified at 950 oC allothermal temperature.
LIGNOSYS
26
6. Pretreatment of lignocellulose for anaerobic digestion Pretreatment is an important tool for conversion of lignocellulosic substrates such as straw. During the pretreatment process the compact structure of lignocellulose is disrupted and cellulose fiber is exposed. Pretreatment of the lignocellulosic material is carried out to overcome recalcitrance through the combination of chem-ical and structural changes to the lignin and carbohydrates11. A previous study have reported different methods of pretreatment, such as biological, chemical, mechanical and thermal process, as well as their combinations, to speed up sub-strate hydrolysis12. However, according to a study13 these traditional methods of pretreatment are cost intensive, as additional chemicals or energy are required. The pretreatment step is referred to as the technological bottleneck for anaerobic digestion processes from lignocellulose to be cost effective. At least 20% of the total production cost is represented by the pretreatment phase in all these different approaches14.
6.1 Physical pretreatment
Mechanical pretreatment of lignocellulosic material is an important step for improving the bioconversion efficiency, particle densification and distribution, enzymatic accessibility, and the overall transformation of lignocellulosic material into biofuels without the generation of toxic side streams15. This pretreatment also generates new surface area, improves flow properties, and increases the bulk density and porosity. In mechanical comminution, different mills are used to break down the lignocellulosic material and reduce the material’s crystallinity. Commonly used mills include attrition mills, ball mills, centrifugal mills, colloid mills, hammer mills, extruders, knife mills, pin mills and vibratory mills16. Steam explosion makes substrates more digestible by a combination of heating and sudden pressure change. The substrate is heated up in a closed system to a temperature of typically 160 to 220 °C, causing a rise in pressure. After a retention time of around 5 to 60 minutes, the pressure is released abruptly. This sudden drop in pressure causes intracellular water to evaporate very rapidly causing a phenomenon known as steam explosion or phase explosion. These forces rupture cells and their surrounding fibre. One study17 has been done with continuous AD and steam-exploded straw. Codigested steam-exploded wheat straw and manure were compared to codigestion with untreated straw and manure. No significant difference between steam-exploded and untreated straw in terms of process stability and methane yields was found. They also found that the inoculum they recovered from their continuous AD reactors was less effective at breaking down cellulose than the original inoculum that they used (from a biogas plant using organic waste and grass silage). They suggest this could be partially due to the accumulation of inhibitors (generated during the pretreatment). One of the disadvantages of steam explosion is that, like thermal pretreatment, the long retention times and high temperatures can actually decrease the methane yield. Another negative aspect is that only limited recovery of heat is possible from this pretreatment. One of the advantages of steam explosion is that it may allow new substrates like straw to be used for biogas production18.
LIGNOSYS
27
6.2 Chemical pretreatment
Common chemicals used in chemical pretreatment methods for improving the AD performance of agricultural residues are sulfuric acid (H2SO4), hydrochloric acid (HCl), acetic acid (CH3COOH), sodium hydroxide (NaOH), potassium hydroxide (KOH), lime (Ca(OH)2), aqueous ammonia (NH3∙H2O), and hydrogen peroxide (H2O2)
19,20. Alkali pretreatment involves the addition of bases to biomass, leading to an increase of internal surface by swelling, a decrease of polymerization degree and crystallinity, destruction of links between lignin and other polymers, and lignin breakdown21. Alkali pretreatment works better for low lignin content biomass and increasing the lignin content of biomass makes this method less effective22. NaOH, KOH and Ca(OH)2 are most reported chemicals used in alkaline pretreatment, in which process conditions are relatively mild but reaction times can be long23. These pretreatments are beneficial in one way or other in accomplishing the partial hydrolysis of lignocellulosic biomasses. Up to now, NaOH and KOH are the most effective alkali-treatments for improving the biomass digestibility. According to the study, the methane yield of NaOH-pretreated corn straw was found to be approxi-mately 220 mL/gVS, which was 73.4% higher than that of untreated corn straw. So, NaOH pretreatment has proven to be effective to improve the digestibility and increase the methane yield. However, due to concerns over sodium discharge in the process effluent that is difficult to be recycled, may limit its application on a commercial scale24. KOH though could be a solution to this problem. Considering that KOH is a strong base, KOH-pretreated anaerobic digestate is gaining more importance as a fertiliser in the agriculture sector25. It has also been reported that 2.5% KOH-treated corn stover generates maximum methane yield of 295 mL/gVS, and significantly improved 95.6% with regard to untreated corn stover26. However, the high chemical loading, the toxicity to microbes, the high cost when applied in large scale, and the environmental pollution caused by the KOH is also reported27.
6.3 Biological pretreatment
There are several biological pretreatment methods such as, anaerobic and aerobic microbial pretreatment, fungal pretreatment and enzyme addition. The microbial pretreatment methods can be conducted at low temperature but they are slow and don’t break down lignin. The advantage of enzymatic addition is the low energy consumption and the disadvantages are continuous addition is required and the high cost of enzymes. A more thorough description of the different pretreatment methods is found in an IEA Bioenergy report on Pretreatment of feedstock for enhanced biogas production18. In this study the results for the pretreatment and anaerobic digestion of straw including upgrading to vehicle fuel quality are taken from a study28 where the straw was mechanically pretreated.
LIGNOSYS
28
7. Anaerobic digestion and upgrading
Anaerobic digestion of non-woody lignocellulose rich substrates, such as wheat straw, is attracting much attention and there are a multitude of R&D activities involving different pretreatment methods, see Chapter 6. So far wheat straw has not been utilised for biogas production to any large extent in Sweden or anywhere else in Europe.
The economy for producing biogas of vehicle fuel quality has been investigated in a recent study28. The calculations are based on continuous stirred tank reactor processes, operated under mesophilic conditions (37 °C). The straw is pretreated to make the organic material more available for microorganisms. The pretreatment is based on mechanical methods (extruder and hammer mill). The methane production is assumed to be 224 m3 CH4/ton dry matter, which corresponds to 2.23 MWh/ton dry matter. The analysis in the study is based on a biogas plant producing 1,000 m3/h of biogas with a methane content of 55%. This corresponds to 5.45 MW of biomethane which implies that the biogas plant has a slightly higher capacity compared to the three thermochemical plants investigated in this report.
The investment cost for the biogas plant including upgrading is 9.05 MEUR and the annual feedstock cost is 1.94 MEUR based on an 18 EUR/MWh straw cost. With an economic lifetime of 15 years and 6% interest rate the production cost is approx. 90 EUR/MWh and 125 EUR/MWh if one includes injection in to the gas grid and distribution to a filling station. The investment cost of the filling stations is also included in the latter figure. The number is not directly comparable with the production cost obtained by thermochemical conversion of straw since the input parameters differ. The economic lifetime is shorter and the interest rate higher for the biogas plant but the thermochemical plants are burden with a 5% start-up cost.
In another biogas study29 the same input parameters were used but the economic lifetime was changed to 20 years and the interest rate to 11%. The production cost including injection in to the gas grid, distribution to a filling stations and the invest-ment in the filling station ended up at 115 EUR/MWh.
LIGNOSYS
29
8. Economic analysis
8.1 Specific investment cost – small scale vs. large scale
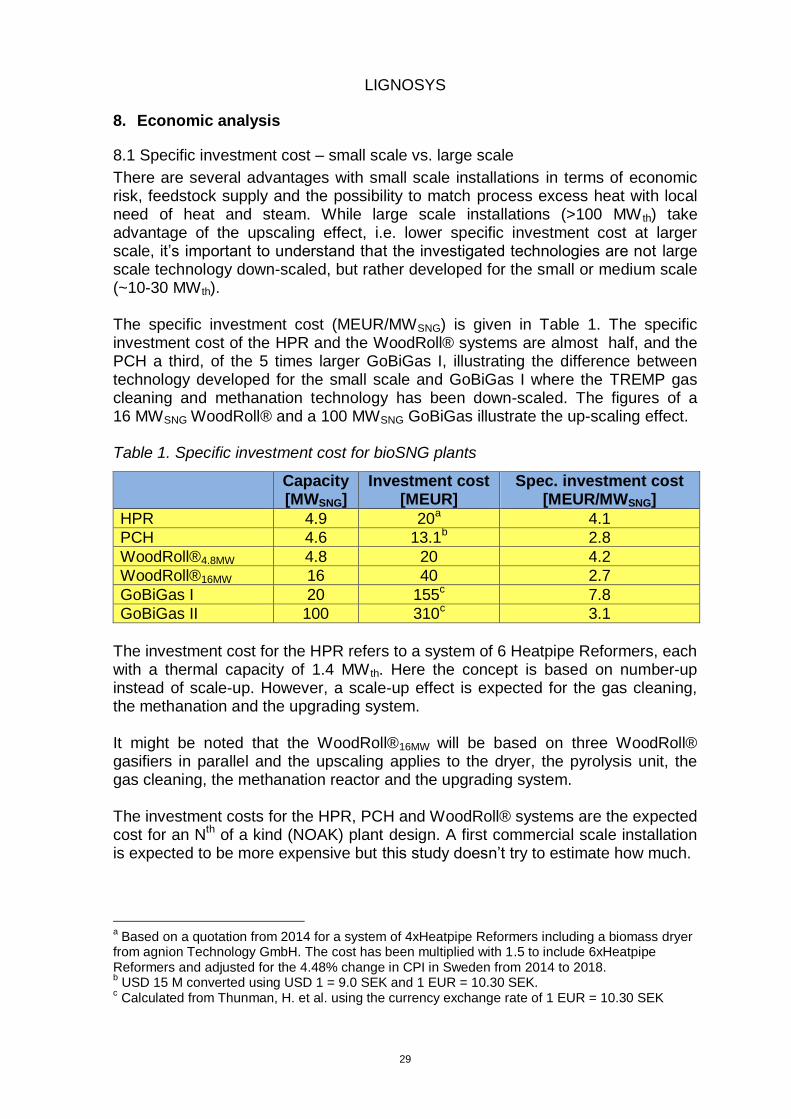
There are several advantages with small scale installations in terms of economic risk, feedstock supply and the possibility to match process excess heat with local need of heat and steam. While large scale installations (>100 MW th) take advantage of the upscaling effect, i.e. lower specific investment cost at larger scale, it’s important to understand that the investigated technologies are not large scale technology down-scaled, but rather developed for the small or medium scale (~10-30 MW th). The specific investment cost (MEUR/MWSNG) is given in Table 1. The specific investment cost of the HPR and the WoodRoll® systems are almost half, and the PCH a third, of the 5 times larger GoBiGas I, illustrating the difference between technology developed for the small scale and GoBiGas I where the TREMP gas cleaning and methanation technology has been down-scaled. The figures of a 16 MWSNG WoodRoll® and a 100 MWSNG GoBiGas illustrate the up-scaling effect. Table 1. Specific investment cost for bioSNG plants
Capacity [MWSNG]
Investment cost [MEUR]
Spec. investment cost [MEUR/MWSNG]
HPR 4.9 20a 4.1
PCH 4.6 13.1b 2.8
WoodRoll®4.8MW 4.8 20 4.2
WoodRoll®16MW 16 40 2.7
GoBiGas I 20 155c 7.8
GoBiGas II 100 310c 3.1
The investment cost for the HPR refers to a system of 6 Heatpipe Reformers, each with a thermal capacity of 1.4 MW th. Here the concept is based on number-up instead of scale-up. However, a scale-up effect is expected for the gas cleaning, the methanation and the upgrading system. It might be noted that the WoodRoll®16MW will be based on three WoodRoll® gasifiers in parallel and the upscaling applies to the dryer, the pyrolysis unit, the gas cleaning, the methanation reactor and the upgrading system. The investment costs for the HPR, PCH and WoodRoll® systems are the expected cost for an Nth of a kind (NOAK) plant design. A first commercial scale installation is expected to be more expensive but this study doesn’t try to estimate how much.
a Based on a quotation from 2014 for a system of 4xHeatpipe Reformers including a biomass dryer
from agnion Technology GmbH. The cost has been multiplied with 1.5 to include 6xHeatpipe Reformers and adjusted for the 4.48% change in CPI in Sweden from 2014 to 2018. b USD 15 M converted using USD 1 = 9.0 SEK and 1 EUR = 10.30 SEK.
c Calculated from Thunman, H. et al. using the currency exchange rate of 1 EUR = 10.30 SEK
LIGNOSYS
30
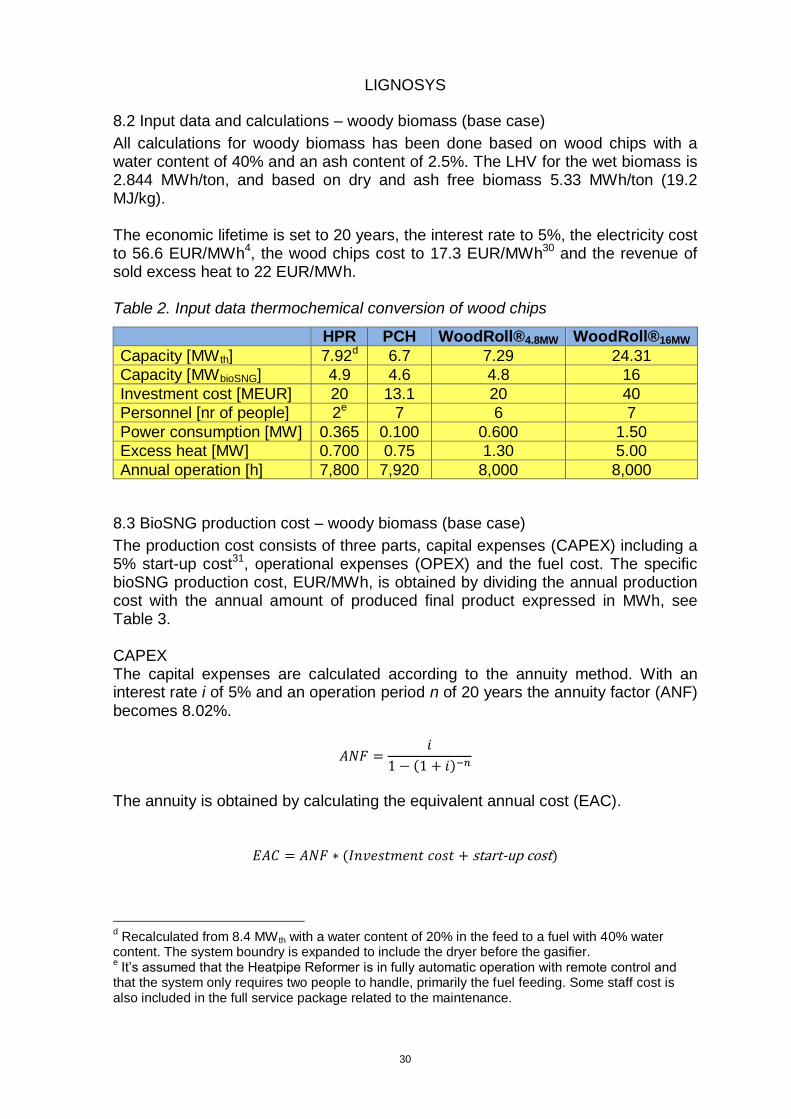
8.2 Input data and calculations – woody biomass (base case)
All calculations for woody biomass has been done based on wood chips with a water content of 40% and an ash content of 2.5%. The LHV for the wet biomass is 2.844 MWh/ton, and based on dry and ash free biomass 5.33 MWh/ton (19.2 MJ/kg). The economic lifetime is set to 20 years, the interest rate to 5%, the electricity cost to 56.6 EUR/MWh4, the wood chips cost to 17.3 EUR/MWh30 and the revenue of sold excess heat to 22 EUR/MWh. Table 2. Input data thermochemical conversion of wood chips
HPR PCH WoodRoll®4.8MW WoodRoll®16MW
Capacity [MW th] 7.92d 6.7 7.29 24.31
Capacity [MWbioSNG] 4.9 4.6 4.8 16
Investment cost [MEUR] 20 13.1 20 40
Personnel [nr of people] 2e 7 6 7
Power consumption [MW] 0.365 0.100 0.600 1.50
Excess heat [MW] 0.700 0.75 1.30 5.00
Annual operation [h] 7,800 7,920 8,000 8,000
8.3 BioSNG production cost – woody biomass (base case)
The production cost consists of three parts, capital expenses (CAPEX) including a 5% start-up cost31, operational expenses (OPEX) and the fuel cost. The specific bioSNG production cost, EUR/MWh, is obtained by dividing the annual production cost with the annual amount of produced final product expressed in MWh, see Table 3. CAPEX The capital expenses are calculated according to the annuity method. With an interest rate i of 5% and an operation period n of 20 years the annuity factor (ANF) becomes 8.02%.
𝐴𝑁𝐹 =𝑖
1 − (1 + 𝑖)−𝑛
The annuity is obtained by calculating the equivalent annual cost (EAC).
𝐸𝐴𝐶 = 𝐴𝑁𝐹 ∗ (𝐼𝑛𝑣𝑒𝑠𝑡𝑚𝑒𝑛𝑡 𝑐𝑜𝑠𝑡 + start-up cost)
d Recalculated from 8.4 MW th with a water content of 20% in the feed to a fuel with 40% water
content. The system boundry is expanded to include the dryer before the gasifier. e It’s assumed that the Heatpipe Reformer is in fully automatic operation with remote control and
that the system only requires two people to handle, primarily the fuel feeding. Some staff cost is also included in the full service package related to the maintenance.
LIGNOSYS
31
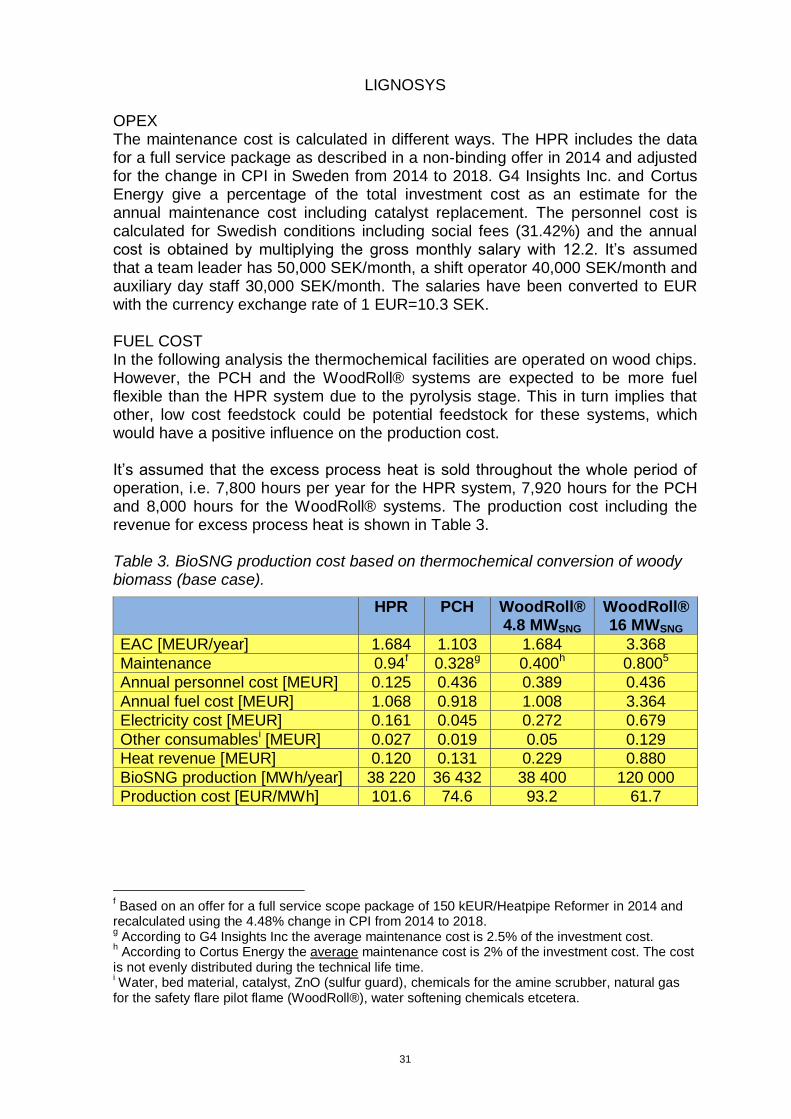
OPEX The maintenance cost is calculated in different ways. The HPR includes the data for a full service package as described in a non-binding offer in 2014 and adjusted for the change in CPI in Sweden from 2014 to 2018. G4 Insights Inc. and Cortus Energy give a percentage of the total investment cost as an estimate for the annual maintenance cost including catalyst replacement. The personnel cost is calculated for Swedish conditions including social fees (31.42%) and the annual cost is obtained by multiplying the gross monthly salary with 12.2. It’s assumed that a team leader has 50,000 SEK/month, a shift operator 40,000 SEK/month and auxiliary day staff 30,000 SEK/month. The salaries have been converted to EUR with the currency exchange rate of 1 EUR=10.3 SEK. FUEL COST In the following analysis the thermochemical facilities are operated on wood chips. However, the PCH and the WoodRoll® systems are expected to be more fuel flexible than the HPR system due to the pyrolysis stage. This in turn implies that other, low cost feedstock could be potential feedstock for these systems, which would have a positive influence on the production cost. It’s assumed that the excess process heat is sold throughout the whole period of operation, i.e. 7,800 hours per year for the HPR system, 7,920 hours for the PCH and 8,000 hours for the WoodRoll® systems. The production cost including the revenue for excess process heat is shown in Table 3. Table 3. BioSNG production cost based on thermochemical conversion of woody biomass (base case).
HPR PCH WoodRoll® 4.8 MWSNG
WoodRoll® 16 MWSNG
EAC [MEUR/year] 1.684 1.103 1.684 3.368
Maintenance 0.94f 0.328g 0.400h 0.8005
Annual personnel cost [MEUR] 0.125 0.436 0.389 0.436
Annual fuel cost [MEUR] 1.068 0.918 1.008 3.364
Electricity cost [MEUR] 0.161 0.045 0.272 0.679
Other consumablesi [MEUR] 0.027 0.019 0.05 0.129
Heat revenue [MEUR] 0.120 0.131 0.229 0.880
BioSNG production [MWh/year] 38 220 36 432 38 400 120 000
Production cost [EUR/MWh] 101.6 74.6 93.2 61.7
f Based on an offer for a full service scope package of 150 kEUR/Heatpipe Reformer in 2014 and recalculated using the 4.48% change in CPI from 2014 to 2018. g According to G4 Insights Inc the average maintenance cost is 2.5% of the investment cost.
h According to Cortus Energy the average maintenance cost is 2% of the investment cost. The cost
is not evenly distributed during the technical life time. i Water, bed material, catalyst, ZnO (sulfur guard), chemicals for the amine scrubber, natural gas for the safety flare pilot flame (WoodRoll®), water softening chemicals etcetera.
LIGNOSYS
32
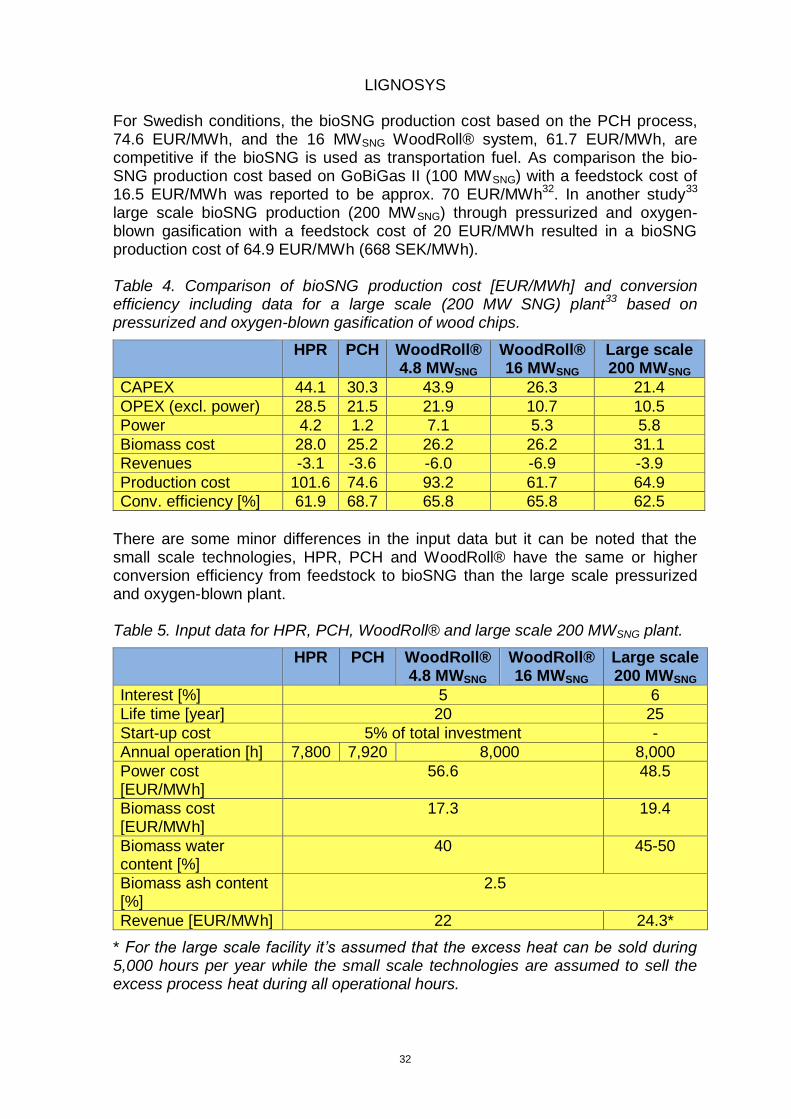
For Swedish conditions, the bioSNG production cost based on the PCH process, 74.6 EUR/MWh, and the 16 MWSNG WoodRoll® system, 61.7 EUR/MWh, are competitive if the bioSNG is used as transportation fuel. As comparison the bio-SNG production cost based on GoBiGas II (100 MWSNG) with a feedstock cost of 16.5 EUR/MWh was reported to be approx. 70 EUR/MWh32. In another study33 large scale bioSNG production (200 MWSNG) through pressurized and oxygen-blown gasification with a feedstock cost of 20 EUR/MWh resulted in a bioSNG production cost of 64.9 EUR/MWh (668 SEK/MWh). Table 4. Comparison of bioSNG production cost [EUR/MWh] and conversion efficiency including data for a large scale (200 MW SNG) plant33 based on pressurized and oxygen-blown gasification of wood chips.
HPR PCH WoodRoll® 4.8 MWSNG
WoodRoll® 16 MWSNG
Large scale 200 MWSNG
CAPEX 44.1 30.3 43.9 26.3 21.4
OPEX (excl. power) 28.5 21.5 21.9 10.7 10.5
Power 4.2 1.2 7.1 5.3 5.8
Biomass cost 28.0 25.2 26.2 26.2 31.1
Revenues -3.1 -3.6 -6.0 -6.9 -3.9
Production cost 101.6 74.6 93.2 61.7 64.9
Conv. efficiency [%] 61.9 68.7 65.8 65.8 62.5
There are some minor differences in the input data but it can be noted that the small scale technologies, HPR, PCH and WoodRoll® have the same or higher conversion efficiency from feedstock to bioSNG than the large scale pressurized and oxygen-blown plant. Table 5. Input data for HPR, PCH, WoodRoll® and large scale 200 MWSNG plant.
HPR PCH WoodRoll® 4.8 MWSNG
WoodRoll® 16 MWSNG
Large scale 200 MWSNG
Interest [%] 5 6
Life time [year] 20 25
Start-up cost 5% of total investment -
Annual operation [h] 7,800 7,920 8,000 8,000
Power cost [EUR/MWh]
56.6
48.5
Biomass cost [EUR/MWh]
17.3 19.4
Biomass water content [%]
40 45-50
Biomass ash content [%]
2.5
Revenue [EUR/MWh] 22 24.3*
* For the large scale facility it’s assumed that the excess heat can be sold during 5,000 hours per year while the small scale technologies are assumed to sell the excess process heat during all operational hours.
LIGNOSYS
33
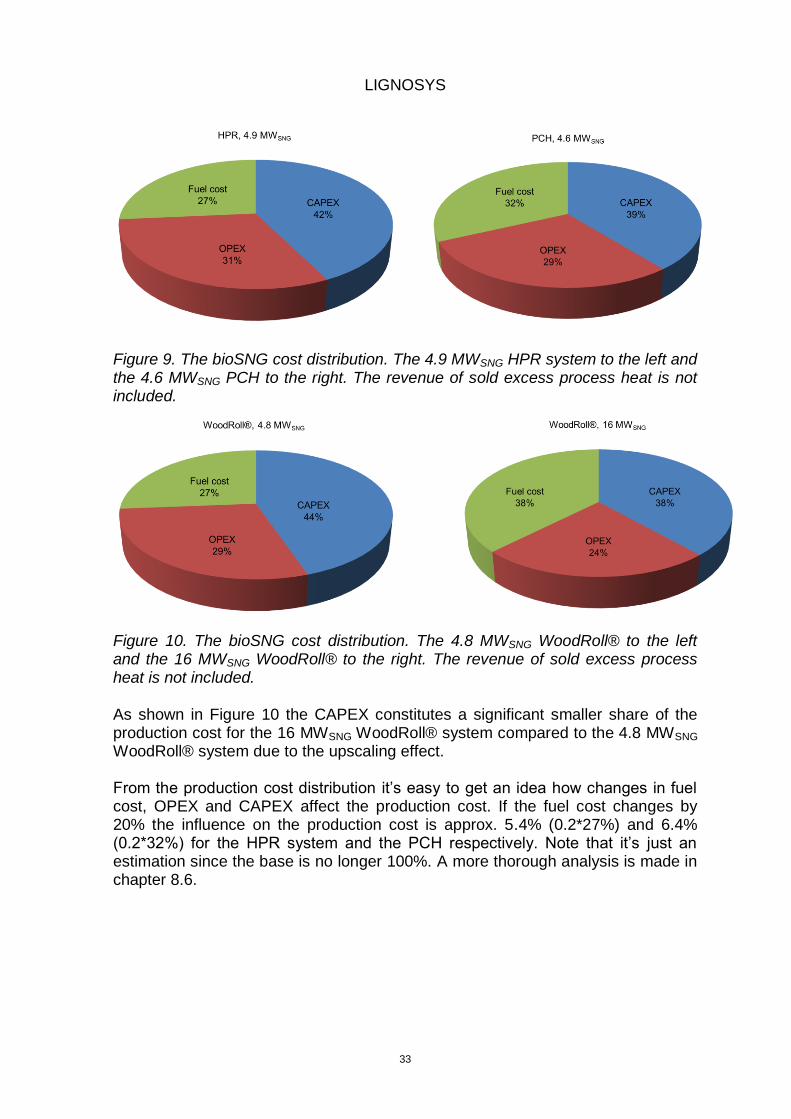
Figure 9. The bioSNG cost distribution. The 4.9 MWSNG HPR system to the left and the 4.6 MWSNG PCH to the right. The revenue of sold excess process heat is not included.
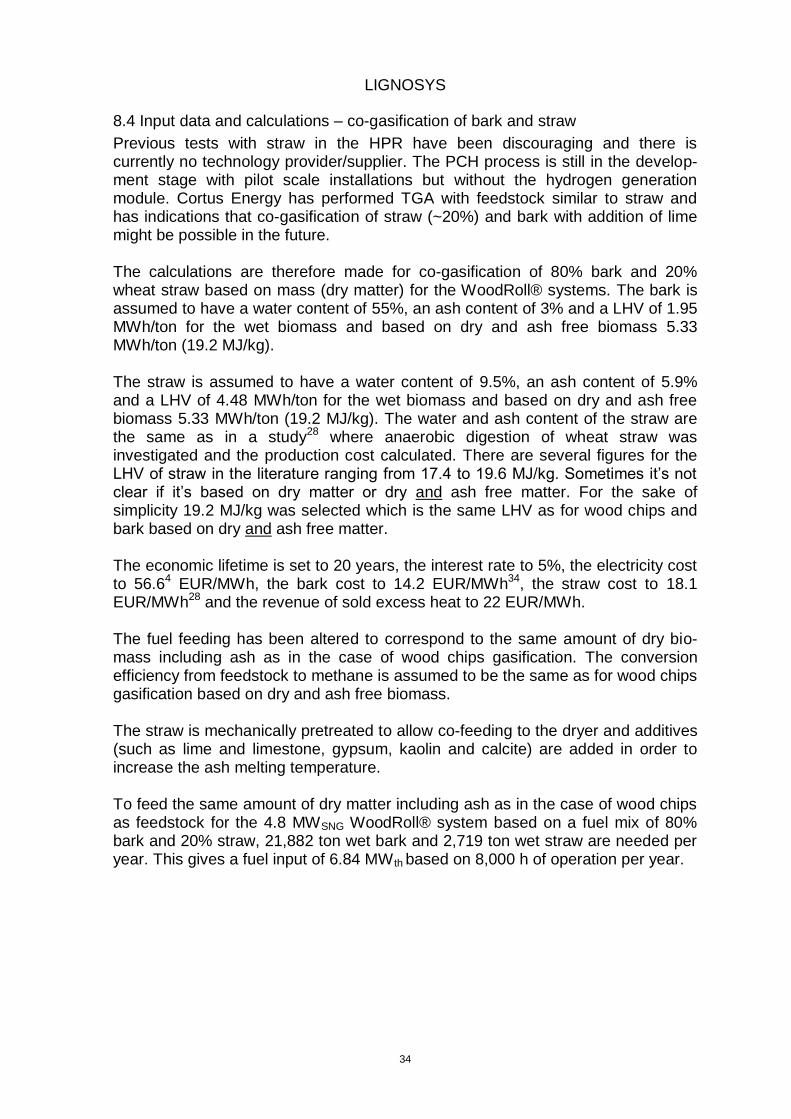
Figure 10. The bioSNG cost distribution. The 4.8 MWSNG WoodRoll® to the left and the 16 MWSNG WoodRoll® to the right. The revenue of sold excess process heat is not included. As shown in Figure 10 the CAPEX constitutes a significant smaller share of the production cost for the 16 MWSNG WoodRoll® system compared to the 4.8 MWSNG WoodRoll® system due to the upscaling effect. From the production cost distribution it’s easy to get an idea how changes in fuel cost, OPEX and CAPEX affect the production cost. If the fuel cost changes by 20% the influence on the production cost is approx. 5.4% (0.2*27%) and 6.4% (0.2*32%) for the HPR system and the PCH respectively. Note that it’s just an estimation since the base is no longer 100%. A more thorough analysis is made in chapter 8.6.
LIGNOSYS
34
8.4 Input data and calculations – co-gasification of bark and straw
Previous tests with straw in the HPR have been discouraging and there is currently no technology provider/supplier. The PCH process is still in the develop-ment stage with pilot scale installations but without the hydrogen generation module. Cortus Energy has performed TGA with feedstock similar to straw and has indications that co-gasification of straw (~20%) and bark with addition of lime might be possible in the future. The calculations are therefore made for co-gasification of 80% bark and 20% wheat straw based on mass (dry matter) for the WoodRoll® systems. The bark is assumed to have a water content of 55%, an ash content of 3% and a LHV of 1.95 MWh/ton for the wet biomass and based on dry and ash free biomass 5.33 MWh/ton (19.2 MJ/kg). The straw is assumed to have a water content of 9.5%, an ash content of 5.9% and a LHV of 4.48 MWh/ton for the wet biomass and based on dry and ash free biomass 5.33 MWh/ton (19.2 MJ/kg). The water and ash content of the straw are the same as in a study28 where anaerobic digestion of wheat straw was investigated and the production cost calculated. There are several figures for the LHV of straw in the literature ranging from 17.4 to 19.6 MJ/kg. Sometimes it’s not clear if it’s based on dry matter or dry and ash free matter. For the sake of simplicity 19.2 MJ/kg was selected which is the same LHV as for wood chips and bark based on dry and ash free matter. The economic lifetime is set to 20 years, the interest rate to 5%, the electricity cost to 56.64 EUR/MWh, the bark cost to 14.2 EUR/MWh34, the straw cost to 18.1 EUR/MWh28 and the revenue of sold excess heat to 22 EUR/MWh. The fuel feeding has been altered to correspond to the same amount of dry bio-mass including ash as in the case of wood chips gasification. The conversion efficiency from feedstock to methane is assumed to be the same as for wood chips gasification based on dry and ash free biomass. The straw is mechanically pretreated to allow co-feeding to the dryer and additives (such as lime and limestone, gypsum, kaolin and calcite) are added in order to increase the ash melting temperature. To feed the same amount of dry matter including ash as in the case of wood chips as feedstock for the 4.8 MWSNG WoodRoll® system based on a fuel mix of 80% bark and 20% straw, 21,882 ton wet bark and 2,719 ton wet straw are needed per year. This gives a fuel input of 6.84 MW th based on 8,000 h of operation per year.
LIGNOSYS
35
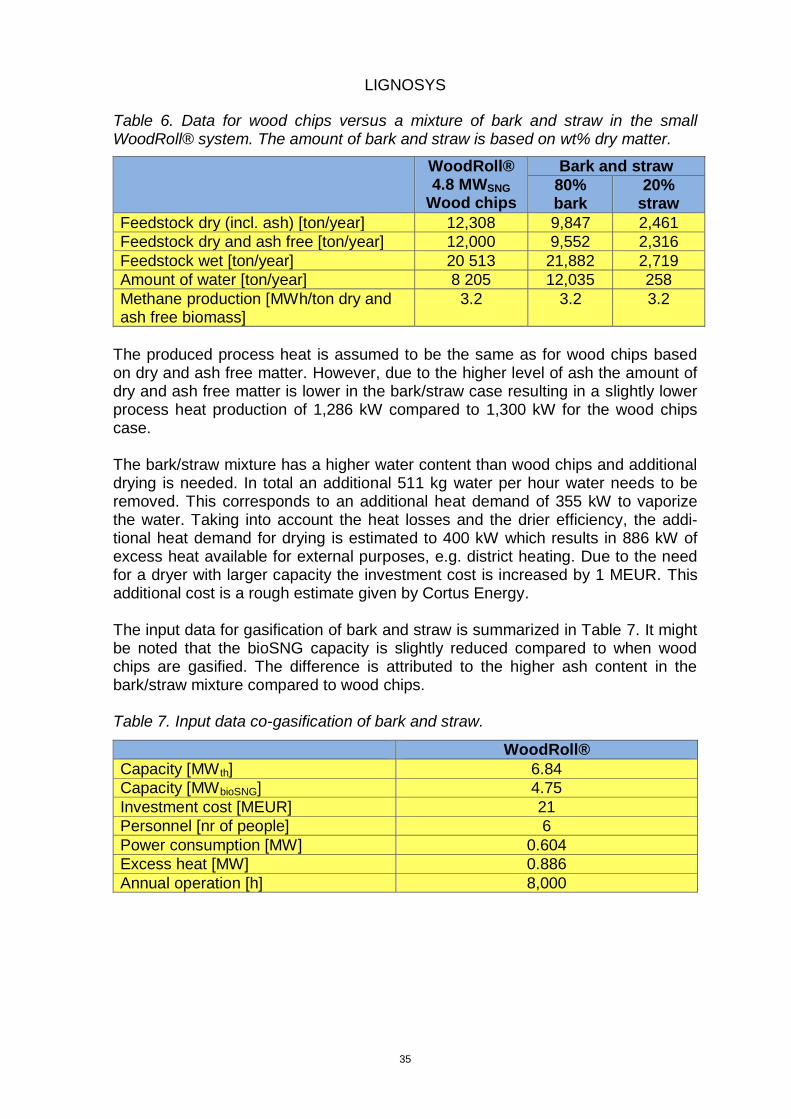
Table 6. Data for wood chips versus a mixture of bark and straw in the small WoodRoll® system. The amount of bark and straw is based on wt% dry matter.
WoodRoll® 4.8 MWSNG
Wood chips
Bark and straw
80% bark
20% straw
Feedstock dry (incl. ash) [ton/year] 12,308 9,847 2,461
Feedstock dry and ash free [ton/year] 12,000 9,552 2,316
Feedstock wet [ton/year] 20 513 21,882 2,719
Amount of water [ton/year] 8 205 12,035 258
Methane production [MWh/ton dry and ash free biomass]
3.2 3.2 3.2
The produced process heat is assumed to be the same as for wood chips based on dry and ash free matter. However, due to the higher level of ash the amount of dry and ash free matter is lower in the bark/straw case resulting in a slightly lower process heat production of 1,286 kW compared to 1,300 kW for the wood chips case. The bark/straw mixture has a higher water content than wood chips and additional drying is needed. In total an additional 511 kg water per hour water needs to be removed. This corresponds to an additional heat demand of 355 kW to vaporize the water. Taking into account the heat losses and the drier efficiency, the addi-tional heat demand for drying is estimated to 400 kW which results in 886 kW of excess heat available for external purposes, e.g. district heating. Due to the need for a dryer with larger capacity the investment cost is increased by 1 MEUR. This additional cost is a rough estimate given by Cortus Energy. The input data for gasification of bark and straw is summarized in Table 7. It might be noted that the bioSNG capacity is slightly reduced compared to when wood chips are gasified. The difference is attributed to the higher ash content in the bark/straw mixture compared to wood chips. Table 7. Input data co-gasification of bark and straw.
WoodRoll®
Capacity [MW th] 6.84
Capacity [MWbioSNG] 4.75
Investment cost [MEUR] 21
Personnel [nr of people] 6
Power consumption [MW] 0.604
Excess heat [MW] 0.886
Annual operation [h] 8,000
LIGNOSYS
36
8.5 BioSNG production cost – co-gasification of bark and straw
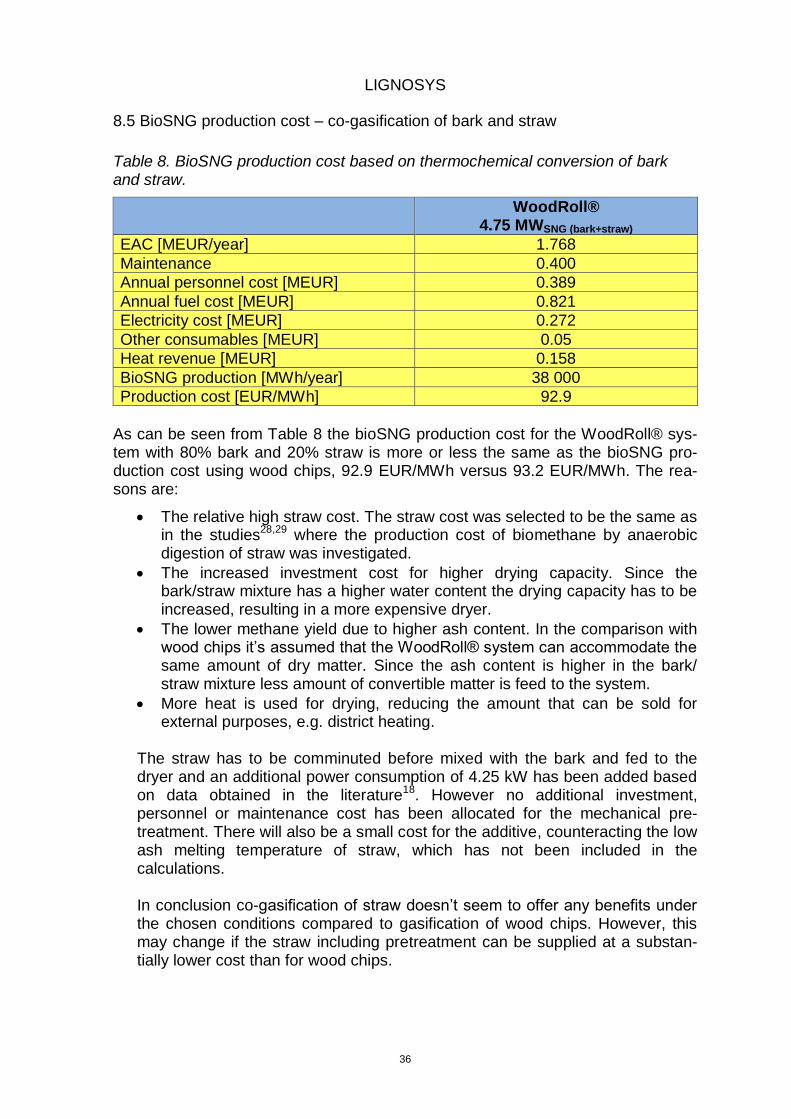
Table 8. BioSNG production cost based on thermochemical conversion of bark and straw.
WoodRoll® 4.75 MWSNG (bark+straw)
EAC [MEUR/year] 1.768
Maintenance 0.400
Annual personnel cost [MEUR] 0.389
Annual fuel cost [MEUR] 0.821
Electricity cost [MEUR] 0.272
Other consumables [MEUR] 0.05
Heat revenue [MEUR] 0.158
BioSNG production [MWh/year] 38 000
Production cost [EUR/MWh] 92.9
As can be seen from Table 8 the bioSNG production cost for the WoodRoll® sys-tem with 80% bark and 20% straw is more or less the same as the bioSNG pro-duction cost using wood chips, 92.9 EUR/MWh versus 93.2 EUR/MWh. The rea-sons are:
The relative high straw cost. The straw cost was selected to be the same as in the studies28,29 where the production cost of biomethane by anaerobic digestion of straw was investigated.
The increased investment cost for higher drying capacity. Since the bark/straw mixture has a higher water content the drying capacity has to be increased, resulting in a more expensive dryer.
The lower methane yield due to higher ash content. In the comparison with wood chips it’s assumed that the WoodRoll® system can accommodate the same amount of dry matter. Since the ash content is higher in the bark/ straw mixture less amount of convertible matter is feed to the system.
More heat is used for drying, reducing the amount that can be sold for external purposes, e.g. district heating.
The straw has to be comminuted before mixed with the bark and fed to the dryer and an additional power consumption of 4.25 kW has been added based on data obtained in the literature18. However no additional investment, personnel or maintenance cost has been allocated for the mechanical pre-treatment. There will also be a small cost for the additive, counteracting the low ash melting temperature of straw, which has not been included in the calculations. In conclusion co-gasification of straw doesn’t seem to offer any benefits under the chosen conditions compared to gasification of wood chips. However, this may change if the straw including pretreatment can be supplied at a substan-tially lower cost than for wood chips.
LIGNOSYS
37
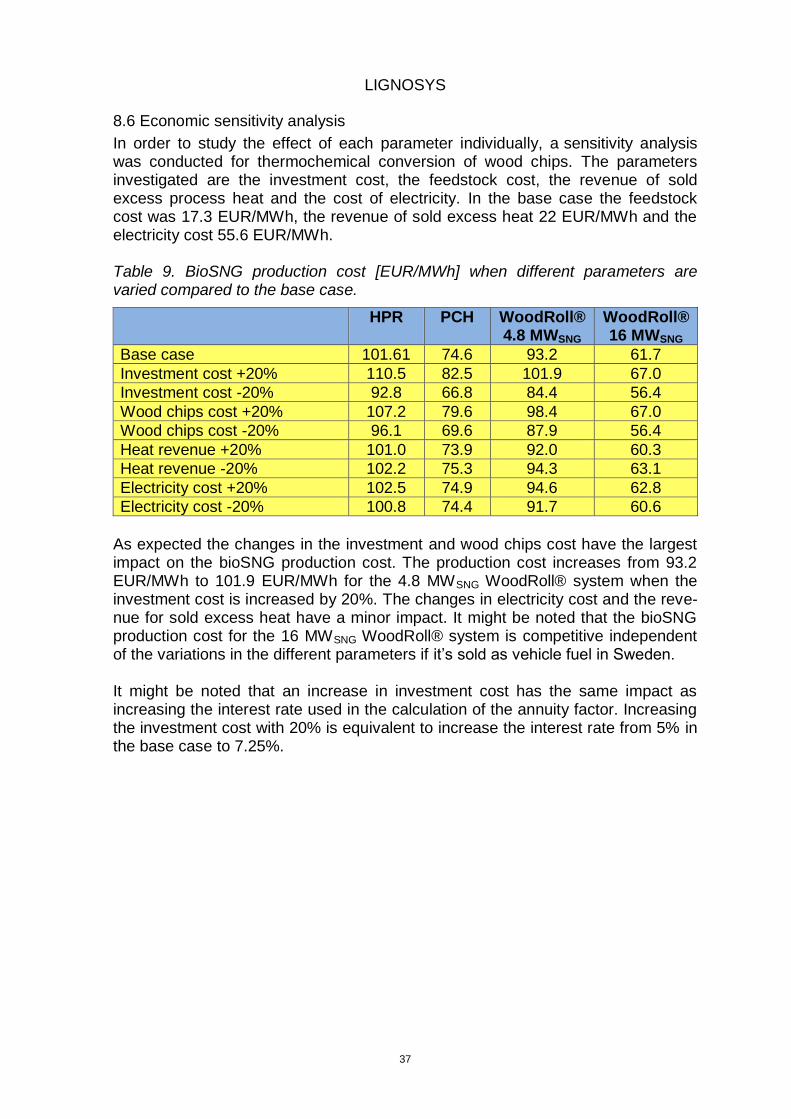
8.6 Economic sensitivity analysis
In order to study the effect of each parameter individually, a sensitivity analysis was conducted for thermochemical conversion of wood chips. The parameters investigated are the investment cost, the feedstock cost, the revenue of sold excess process heat and the cost of electricity. In the base case the feedstock cost was 17.3 EUR/MWh, the revenue of sold excess heat 22 EUR/MWh and the electricity cost 55.6 EUR/MWh. Table 9. BioSNG production cost [EUR/MWh] when different parameters are varied compared to the base case.
HPR PCH WoodRoll® 4.8 MWSNG
WoodRoll® 16 MWSNG
Base case 101.61 74.6 93.2 61.7
Investment cost +20% 110.5 82.5 101.9 67.0
Investment cost -20% 92.8 66.8 84.4 56.4
Wood chips cost +20% 107.2 79.6 98.4 67.0
Wood chips cost -20% 96.1 69.6 87.9 56.4
Heat revenue +20% 101.0 73.9 92.0 60.3
Heat revenue -20% 102.2 75.3 94.3 63.1
Electricity cost +20% 102.5 74.9 94.6 62.8
Electricity cost -20% 100.8 74.4 91.7 60.6
As expected the changes in the investment and wood chips cost have the largest impact on the bioSNG production cost. The production cost increases from 93.2 EUR/MWh to 101.9 EUR/MWh for the 4.8 MWSNG WoodRoll® system when the investment cost is increased by 20%. The changes in electricity cost and the reve-nue for sold excess heat have a minor impact. It might be noted that the bioSNG production cost for the 16 MWSNG WoodRoll® system is competitive independent of the variations in the different parameters if it’s sold as vehicle fuel in Sweden. It might be noted that an increase in investment cost has the same impact as increasing the interest rate used in the calculation of the annuity factor. Increasing the investment cost with 20% is equivalent to increase the interest rate from 5% in the base case to 7.25%.
LIGNOSYS
38
9. System studies
9.1 GHG balances – methodology
Greenhouse gas balances were set up according to the general guidelines of ISO 14044 for life cycle assessment. The functional unit was chosen as 1 MJ of methane as this is also comparable to the methodology of the EU renewable energy directive (RED). While the ISO standard sets general principles for LCA of any product system or function, the RED sets specific calculation rules for biofuels. As an example, the RED states that in cases where there are co-products from the biofuel system, the environmental impact is to be allocated between them based on the energy content (LHV) in each respective material (Annex V, C, article 17). In a corresponding situation, the ISO standards recommend to expand the studied system, to consider products which are substituted by the co-products, or by other means allocating environmental impacts. Such method choices can often be decisive to LCA results.
9.1.1 GHG balances - Thermochemical conversion of woody biomass
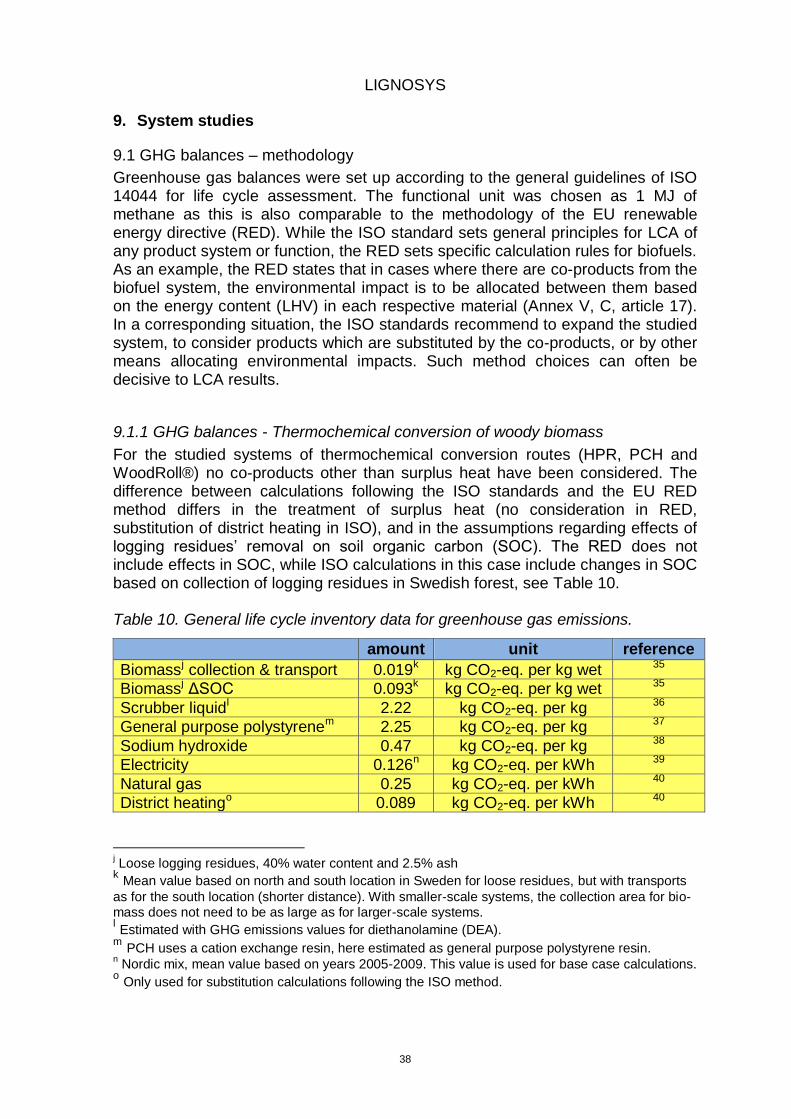
For the studied systems of thermochemical conversion routes (HPR, PCH and WoodRoll®) no co-products other than surplus heat have been considered. The difference between calculations following the ISO standards and the EU RED method differs in the treatment of surplus heat (no consideration in RED, substitution of district heating in ISO), and in the assumptions regarding effects of logging residues’ removal on soil organic carbon (SOC). The RED does not include effects in SOC, while ISO calculations in this case include changes in SOC based on collection of logging residues in Swedish forest, see Table 10. Table 10. General life cycle inventory data for greenhouse gas emissions.
amount unit reference
Biomassj collection & transport 0.019
k kg CO2-eq. per kg wet
35
Biomassj ΔSOC 0.093k kg CO2-eq. per kg wet 35
Scrubber liquidl 2.22 kg CO2-eq. per kg 36
General purpose polystyrenem 2.25 kg CO2-eq. per kg 37
Sodium hydroxide 0.47 kg CO2-eq. per kg 38
Electricity 0.126n kg CO2-eq. per kWh 39
Natural gas 0.25 kg CO2-eq. per kWh 40
District heatingo 0.089 kg CO2-eq. per kWh 40
j Loose logging residues, 40% water content and 2.5% ash k Mean value based on north and south location in Sweden for loose residues, but with transports
as for the south location (shorter distance). With smaller-scale systems, the collection area for bio-mass does not need to be as large as for larger-scale systems. l Estimated with GHG emissions values for diethanolamine (DEA). m PCH uses a cation exchange resin, here estimated as general purpose polystyrene resin. n Nordic mix, mean value based on years 2005-2009. This value is used for base case calculations.
o Only used for substitution calculations following the ISO method.
LIGNOSYS
39
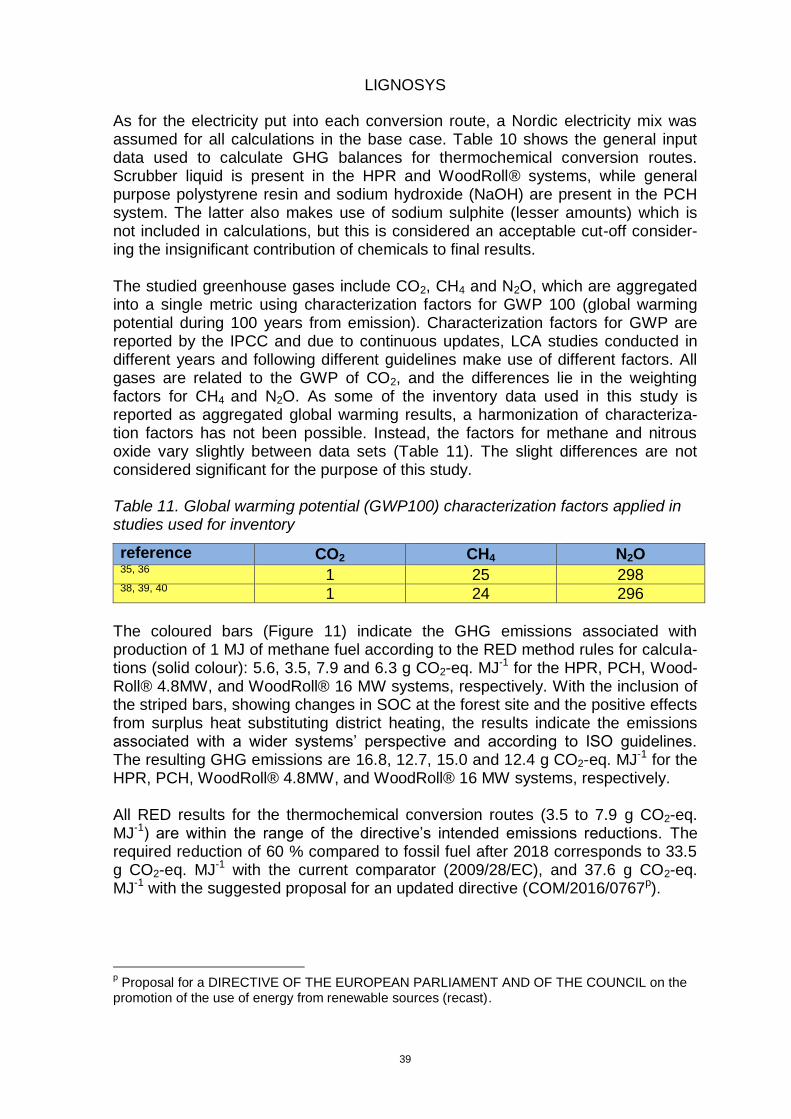
As for the electricity put into each conversion route, a Nordic electricity mix was assumed for all calculations in the base case. Table 10 shows the general input data used to calculate GHG balances for thermochemical conversion routes. Scrubber liquid is present in the HPR and WoodRoll® systems, while general purpose polystyrene resin and sodium hydroxide (NaOH) are present in the PCH system. The latter also makes use of sodium sulphite (lesser amounts) which is not included in calculations, but this is considered an acceptable cut-off consider-ing the insignificant contribution of chemicals to final results. The studied greenhouse gases include CO2, CH4 and N2O, which are aggregated into a single metric using characterization factors for GWP 100 (global warming potential during 100 years from emission). Characterization factors for GWP are reported by the IPCC and due to continuous updates, LCA studies conducted in different years and following different guidelines make use of different factors. All gases are related to the GWP of CO2, and the differences lie in the weighting factors for CH4 and N2O. As some of the inventory data used in this study is reported as aggregated global warming results, a harmonization of characteriza-tion factors has not been possible. Instead, the factors for methane and nitrous oxide vary slightly between data sets (Table 11). The slight differences are not considered significant for the purpose of this study. Table 11. Global warming potential (GWP100) characterization factors applied in studies used for inventory
reference CO2 CH4 N2O 35, 36 1 25 298 38, 39, 40 1 24 296
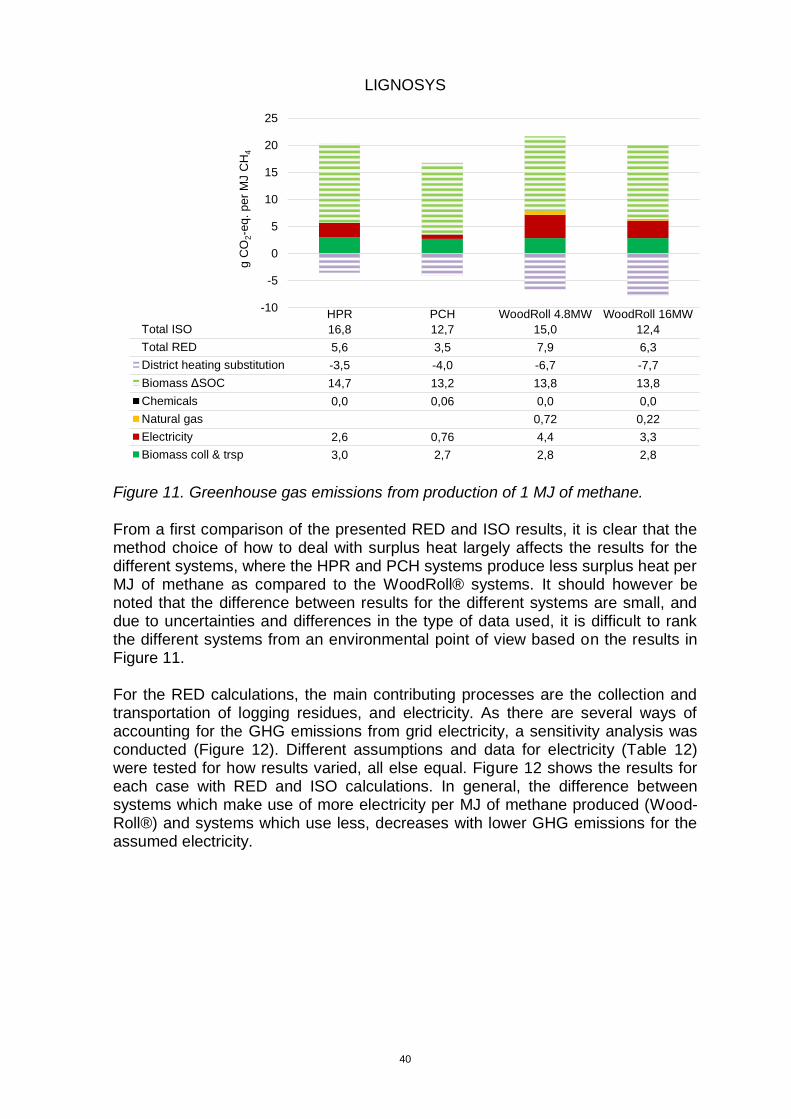
The coloured bars (Figure 11) indicate the GHG emissions associated with production of 1 MJ of methane fuel according to the RED method rules for calcula-tions (solid colour): 5.6, 3.5, 7.9 and 6.3 g CO2-eq. MJ-1 for the HPR, PCH, Wood-Roll® 4.8MW, and WoodRoll® 16 MW systems, respectively. With the inclusion of the striped bars, showing changes in SOC at the forest site and the positive effects from surplus heat substituting district heating, the results indicate the emissions associated with a wider systems’ perspective and according to ISO guidelines. The resulting GHG emissions are 16.8, 12.7, 15.0 and 12.4 g CO2-eq. MJ-1 for the HPR, PCH, WoodRoll® 4.8MW, and WoodRoll® 16 MW systems, respectively. All RED results for the thermochemical conversion routes (3.5 to 7.9 g CO2-eq. MJ-1) are within the range of the directive’s intended emissions reductions. The required reduction of 60 % compared to fossil fuel after 2018 corresponds to 33.5 g CO2-eq. MJ-1 with the current comparator (2009/28/EC), and 37.6 g CO2-eq. MJ-1 with the suggested proposal for an updated directive (COM/2016/0767p).
p Proposal for a DIRECTIVE OF THE EUROPEAN PARLIAMENT AND OF THE COUNCIL on the
promotion of the use of energy from renewable sources (recast).
LIGNOSYS
40
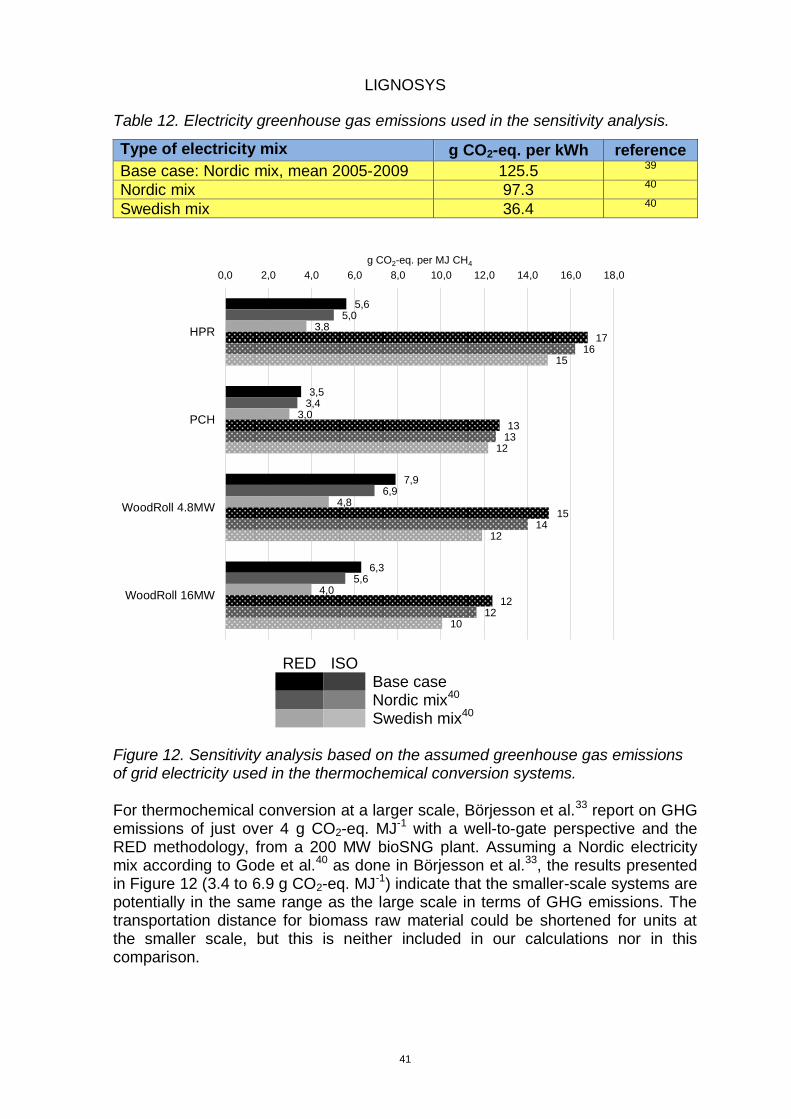
Figure 11. Greenhouse gas emissions from production of 1 MJ of methane. From a first comparison of the presented RED and ISO results, it is clear that the method choice of how to deal with surplus heat largely affects the results for the different systems, where the HPR and PCH systems produce less surplus heat per MJ of methane as compared to the WoodRoll® systems. It should however be noted that the difference between results for the different systems are small, and due to uncertainties and differences in the type of data used, it is difficult to rank the different systems from an environmental point of view based on the results in Figure 11. For the RED calculations, the main contributing processes are the collection and transportation of logging residues, and electricity. As there are several ways of accounting for the GHG emissions from grid electricity, a sensitivity analysis was conducted (Figure 12). Different assumptions and data for electricity (Table 12) were tested for how results varied, all else equal. Figure 12 shows the results for each case with RED and ISO calculations. In general, the difference between systems which make use of more electricity per MJ of methane produced (Wood-Roll®) and systems which use less, decreases with lower GHG emissions for the assumed electricity.
-10
-5
0
5
10
15
20
25
HPR PCH WoodRoll 4.8MW WoodRoll 16MW
Total ISO 16,8 12,7 15,0 12,4
Total RED 5,6 3,5 7,9 6,3
District heating substitution -3,5 -4,0 -6,7 -7,7
Biomass ΔSOC 14,7 13,2 13,8 13,8
Chemicals 0,0 0,06 0,0 0,0
Natural gas 0,72 0,22
Electricity 2,6 0,76 4,4 3,3
Biomass coll & trsp 3,0 2,7 2,8 2,8
g C
O2-e
q. p
er
MJ C
H4
LIGNOSYS
41
Table 12. Electricity greenhouse gas emissions used in the sensitivity analysis.
Type of electricity mix g CO2-eq. per kWh reference
Base case: Nordic mix, mean 2005-2009 125.5 39
Nordic mix 97.3 40
Swedish mix 36.4 40
RED ISO
Base case
Nordic mix40
Swedish mix40 Figure 12. Sensitivity analysis based on the assumed greenhouse gas emissions of grid electricity used in the thermochemical conversion systems. For thermochemical conversion at a larger scale, Börjesson et al.33 report on GHG emissions of just over 4 g CO2-eq. MJ-1 with a well-to-gate perspective and the RED methodology, from a 200 MW bioSNG plant. Assuming a Nordic electricity mix according to Gode et al.40 as done in Börjesson et al.33, the results presented in Figure 12 (3.4 to 6.9 g CO2-eq. MJ-1) indicate that the smaller-scale systems are potentially in the same range as the large scale in terms of GHG emissions. The transportation distance for biomass raw material could be shortened for units at the smaller scale, but this is neither included in our calculations nor in this comparison.
5,6
3,5
7,9
6,3
5,0
3,4
6,9
5,6
3,8
3,0
4,8
4,0
17
13
15
12
16
13
14
12
15
12
12
10
0,0 2,0 4,0 6,0 8,0 10,0 12,0 14,0 16,0 18,0
HPR
PCH
WoodRoll 4.8MW
WoodRoll 16MW
g CO2-eq. per MJ CH4
LIGNOSYS
42
For the ISO calculations the main contribution is from change in SOC due to removal of logging residues (Figure 12). These results should be interpreted as an indicator of potential GHG emissions as the actual emissions depend on several aspects, including geographic location and the chosen time scale of study35. Similarly for district heating, if and when surplus heat is transferred to a district heating grid, the local fuel mix at the grid is decisive to the benefits of replacing district heat with surplus heat. The district heating used here for illustrative purposes partly uses waste as fuel (14 % based on energy content40) which is to be used even if heat demand is lowered. Therefore the substitution benefits illustrated in Figure 11 should also be seen as an indication.
9.1.2 GHG Balances - Bio- and thermochemical conversion of non-woody biomass (wheat straw)
In order to provide a rough comparative case for wheat straw as raw material, several assumptions and simplifications for the calculations of the GHG emissions have been made. The thermochemical conversion of straw is based on a case of co-gasification of 20% straw (based on dry matter) and 80% bark in a WoodRoll® system. See chapter 8.4 for more details. For the GHG calculations, only the straw part of the total raw material and utilities is considered based on a physical allocation (mass dry matter) of 20 % to straw. Thus the results for methane from straw indicate the potential value of straw as a co-gasification substrate, but it should not be considered separate from the larger system which is required for its realization. For the anaerobic digestion of straw we rely on recently published work by Lantz et al.29. Since straw is assumed to be the sole raw material for digestion, nitrogen and phosphorous are added to the substrate in order to enable the conversion process. The studied system for anaerobic digestion of straw is thus designed to function with straw as the only raw material which constitutes an important differ-ence when compared to the co-gasification system. We have chosen to re-calculate the RED results from Lantz et al.29 following analogous assumptions for e.g. methane slip as for the thermochemical conver-sion routes studied in this report. The data used for this recalculation are present-ed in Table 13. In the calculations following the RED method, no use of the diges-tate is considered. Following the ISO standard for LCA, Lantz et al.29 quantify the disadvantages connected to removal of nutrients in straw which has to be compensated for by adding fertiliser the following year. These calculations are based on detailed analyses of nutrient content in digestate and soil, and involve elaborate method assumptions. Similar assumptions are made to quantify benefits related to the application of digestate to soil, which is assumed to replace mineral fertiliser. As the RED method avoids issues connected to soil at the specific harvest sites, we choose to only present results according to the RED method.
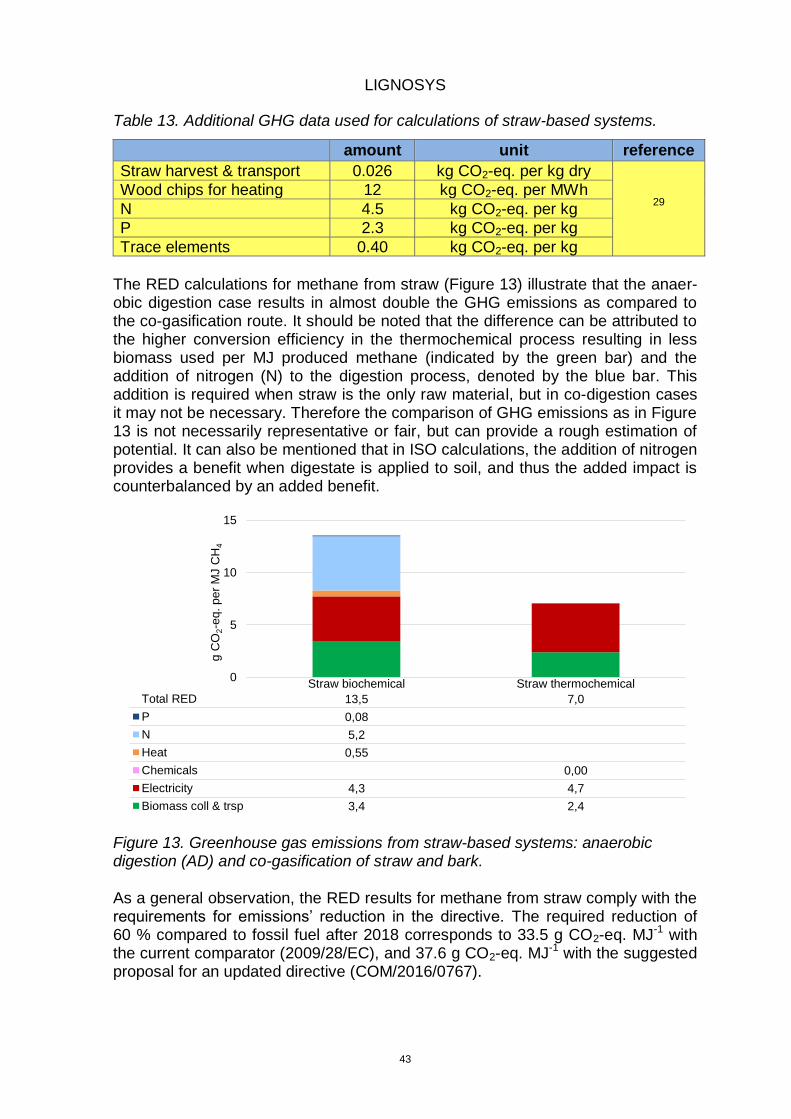
LIGNOSYS
43
Table 13. Additional GHG data used for calculations of straw-based systems.
amount unit reference
Straw harvest & transport 0.026 kg CO2-eq. per kg dry
29 Wood chips for heating 12 kg CO2-eq. per MWh
N 4.5 kg CO2-eq. per kg
P 2.3 kg CO2-eq. per kg
Trace elements 0.40 kg CO2-eq. per kg
The RED calculations for methane from straw (Figure 13) illustrate that the anaer-obic digestion case results in almost double the GHG emissions as compared to the co-gasification route. It should be noted that the difference can be attributed to the higher conversion efficiency in the thermochemical process resulting in less biomass used per MJ produced methane (indicated by the green bar) and the addition of nitrogen (N) to the digestion process, denoted by the blue bar. This addition is required when straw is the only raw material, but in co-digestion cases it may not be necessary. Therefore the comparison of GHG emissions as in Figure 13 is not necessarily representative or fair, but can provide a rough estimation of potential. It can also be mentioned that in ISO calculations, the addition of nitrogen provides a benefit when digestate is applied to soil, and thus the added impact is counterbalanced by an added benefit.
Figure 13. Greenhouse gas emissions from straw-based systems: anaerobic digestion (AD) and co-gasification of straw and bark. As a general observation, the RED results for methane from straw comply with the requirements for emissions’ reduction in the directive. The required reduction of 60 % compared to fossil fuel after 2018 corresponds to 33.5 g CO2-eq. MJ-1 with the current comparator (2009/28/EC), and 37.6 g CO2-eq. MJ-1 with the suggested proposal for an updated directive (COM/2016/0767).
0
5
10
15
Straw biochemical Straw thermochemical
Total RED 13,5 7,0
P 0,08
N 5,2
Heat 0,55
Chemicals 0,00
Electricity 4,3 4,7
Biomass coll & trsp 3,4 2,4
g C
O2-e
q. per
MJ C
H4
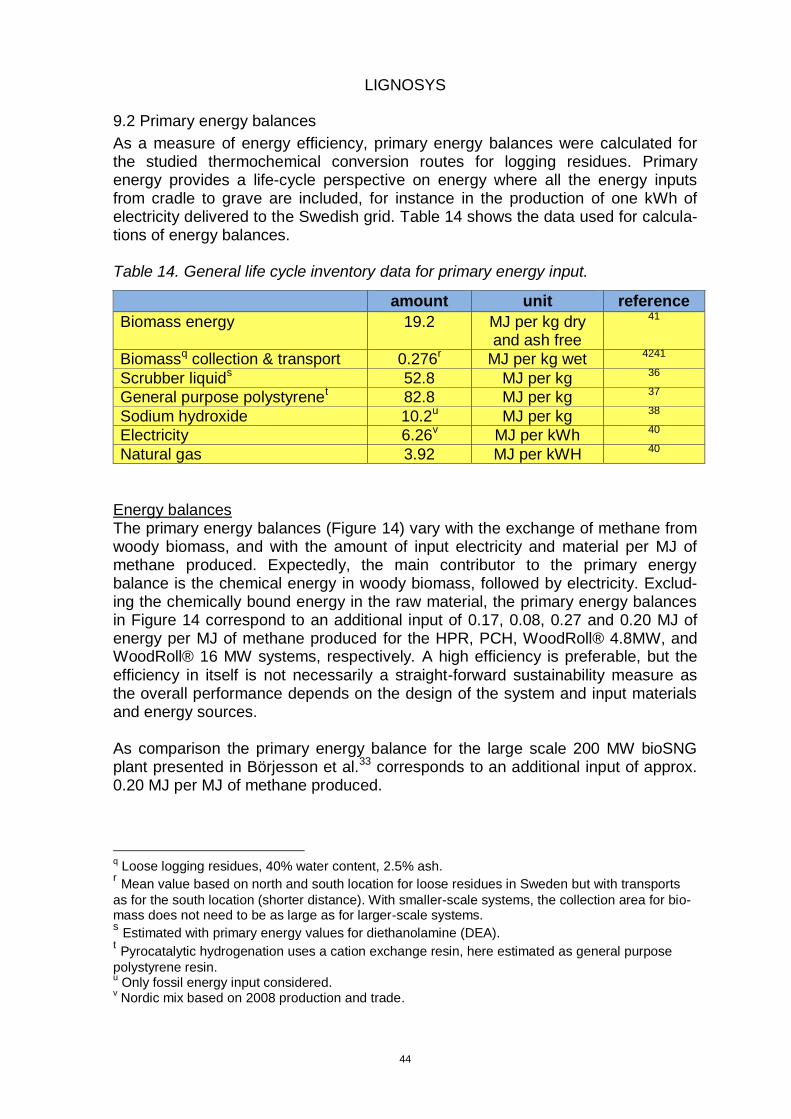
LIGNOSYS
44
9.2 Primary energy balances
As a measure of energy efficiency, primary energy balances were calculated for the studied thermochemical conversion routes for logging residues. Primary energy provides a life-cycle perspective on energy where all the energy inputs from cradle to grave are included, for instance in the production of one kWh of electricity delivered to the Swedish grid. Table 14 shows the data used for calcula-tions of energy balances. Table 14. General life cycle inventory data for primary energy input.
amount unit reference
Biomass energy 19.2 MJ per kg dry and ash free
41
Biomassq collection & transport 0.276r MJ per kg wet 4241
Scrubber liquids 52.8 MJ per kg 36
General purpose polystyrenet 82.8 MJ per kg 37
Sodium hydroxide 10.2u MJ per kg 38
Electricity 6.26v MJ per kWh 40
Natural gas 3.92 MJ per kWH 40
Energy balances The primary energy balances (Figure 14) vary with the exchange of methane from woody biomass, and with the amount of input electricity and material per MJ of methane produced. Expectedly, the main contributor to the primary energy balance is the chemical energy in woody biomass, followed by electricity. Exclud-ing the chemically bound energy in the raw material, the primary energy balances in Figure 14 correspond to an additional input of 0.17, 0.08, 0.27 and 0.20 MJ of energy per MJ of methane produced for the HPR, PCH, WoodRoll® 4.8MW, and WoodRoll® 16 MW systems, respectively. A high efficiency is preferable, but the efficiency in itself is not necessarily a straight-forward sustainability measure as the overall performance depends on the design of the system and input materials and energy sources. As comparison the primary energy balance for the large scale 200 MW bioSNG plant presented in Börjesson et al.33 corresponds to an additional input of approx. 0.20 MJ per MJ of methane produced.
q Loose logging residues, 40% water content, 2.5% ash.
r Mean value based on north and south location for loose residues in Sweden but with transports
as for the south location (shorter distance). With smaller-scale systems, the collection area for bio-mass does not need to be as large as for larger-scale systems. s Estimated with primary energy values for diethanolamine (DEA). t Pyrocatalytic hydrogenation uses a cation exchange resin, here estimated as general purpose
polystyrene resin. u Only fossil energy input considered.
v Nordic mix based on 2008 production and trade.
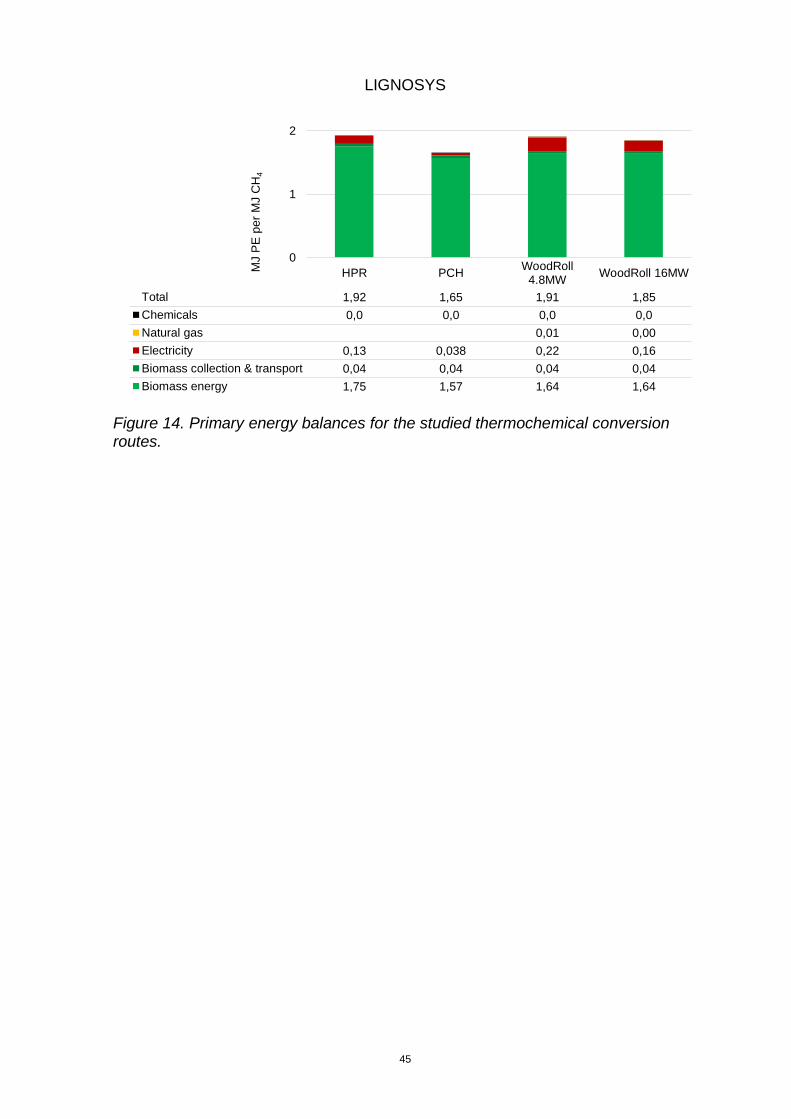
LIGNOSYS
45
Figure 14. Primary energy balances for the studied thermochemical conversion routes.
0
1
2
HPR PCHWoodRoll
4.8MWWoodRoll 16MW
Total 1,92 1,65 1,91 1,85
Chemicals 0,0 0,0 0,0 0,0
Natural gas 0,01 0,00
Electricity 0,13 0,038 0,22 0,16
Biomass collection & transport 0,04 0,04 0,04 0,04
Biomass energy 1,75 1,57 1,64 1,64
MJ P
E p
er
MJ C
H4
LIGNOSYS
46
10. Synergies between bio- and thermochemical biomethane production pro-cesses
There are several synergies between bio- and thermochemical biomethane pro-duction.
Heat integration Normally the thermochemical conversion path produces an excess of process heat while the biochemical conversion path needs heat in various amounts depending on process parameters, upgrading technology and if there is a need for drying of the digestate.
In the thermochemical biomethane route heat is generated when the syngas is cooled down after the gasifier and through the highly exothermal methanation reactions. Some of this heat is used to dry the feedstock, produce process steam and, in case of carbon dioxide separation through chemical absorption, for regen-eration of the scrubber liquid but there is still additional heat that can be used for district heating and/or providing the biochemical conversion path with heat. The heat needed for biochemical conversion depends on type of anaerobic process, e.g. mesophilic or thermophilic digestion, the need for hygienization, drying of the digestate etcetera.
Gasification of the digestate The optimal use of the digestate is as a bio-fertiliser to close the nutrients loop. However, for different reasons this may not be an option (contamination, no arable land in the vicinity, transport cost etc) and the digestate normally contains rather large amounts of unconverted organic material. For wheat straw the digestate can contain up to 50% of energy content in the substrate. This energy can be recovered by thermochemical conversion of the digestate. It might be noted that depending on the gasification technology small amount of biochar as a residue of the thermochemical process could be generated. This biochar has a beneficial effect on production of crops on almost any arable land. Its half-life has been reported to be more than 2,000 years43 and is effectively a ”low cost CCS”. So gasification of the solid part of the digestate alone or mixed with other biomasses could produce carbon for arable land. Mixed with the liquid part of the digestate it could make a substantial high quality fertiliser.
Cost sharing of the upgrading system and downstream equipment By combining thermo- and biochemical conversion of biomass at the same site it’s possible to take advantage of the strong reduction in specific investment cost for the upgrading due to the higher volume of raw gas, see Figure 15. In the HPR and the WoodRoll® one normally ends up with a gas after the methanation that con-tains approximately equal amounts of methane and carbon dioxide on dry basis (see Table 15). The carbon dioxide has to be removed just as in the biochemical conversion when raw biogas is upgraded to biomethane.
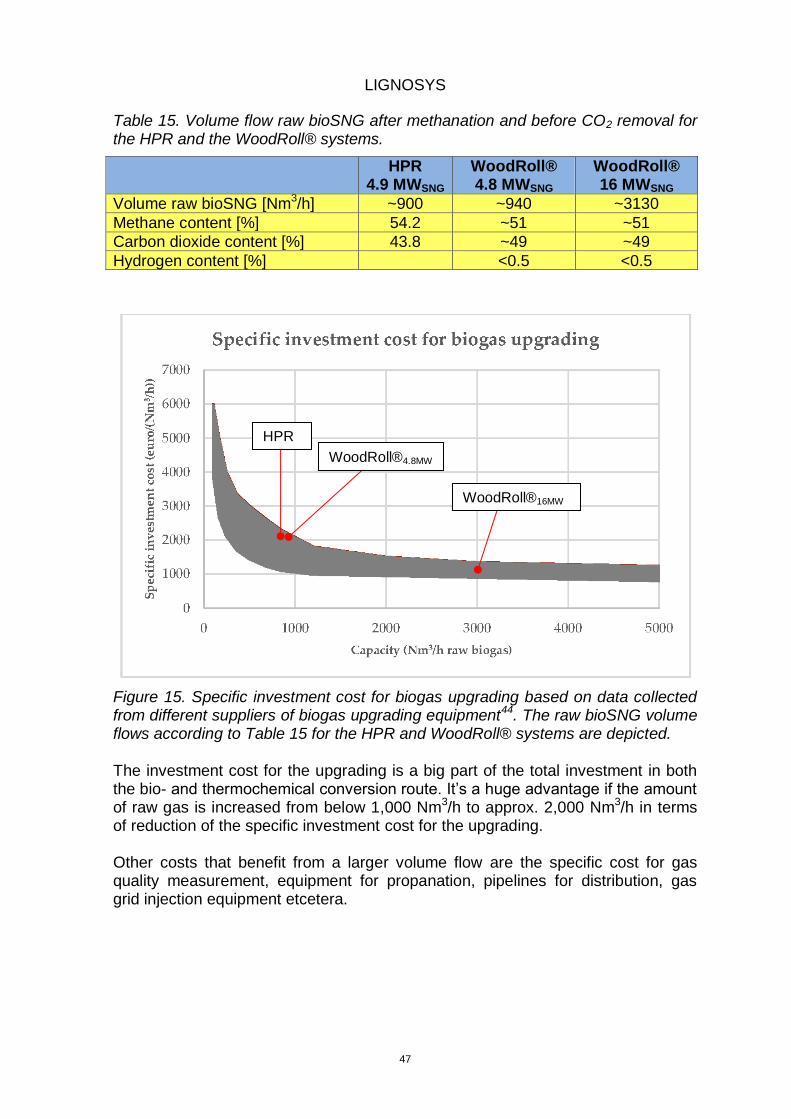
LIGNOSYS
47
Table 15. Volume flow raw bioSNG after methanation and before CO2 removal for the HPR and the WoodRoll® systems.
HPR 4.9 MWSNG
WoodRoll® 4.8 MWSNG
WoodRoll® 16 MWSNG
Volume raw bioSNG [Nm3/h] ~900 ~940 ~3130
Methane content [%] 54.2 ~51 ~51
Carbon dioxide content [%] 43.8 ~49 ~49
Hydrogen content [%] <0.5 <0.5
Figure 15. Specific investment cost for biogas upgrading based on data collected from different suppliers of biogas upgrading equipment44. The raw bioSNG volume flows according to Table 15 for the HPR and WoodRoll® systems are depicted. The investment cost for the upgrading is a big part of the total investment in both the bio- and thermochemical conversion route. It’s a huge advantage if the amount of raw gas is increased from below 1,000 Nm3/h to approx. 2,000 Nm3/h in terms of reduction of the specific investment cost for the upgrading. Other costs that benefit from a larger volume flow are the specific cost for gas quality measurement, equipment for propanation, pipelines for distribution, gas grid injection equipment etcetera.
WoodRoll®4.8MW
HPR
WoodRoll®16MW
LIGNOSYS
48
11. Final results and discussion The project has shown that there is good progress in the development of small scale gasification and methanation technologies including recent demonstrations of the complete value chain, from feedstock to bioSNG, in pilot scale. In case of the PCH the demonstration didn’t include the hydrogen generation module but for the WoodRoll® the whole system was demonstrated. In both cases the produced bioSNG was used as vehicle fuel showing the opportunity to produce a transporta-tion fuel with high conversion efficiency using woody biomass as feedstock. Small scale gasification and methanation has the potential to compete with large scale installations both in terms of environmental footprint and production cost. The key factor is that it’s technology developed for the small scale and not large scale technology that has been down-scaled. The conversion efficiencies from feedstock to bioSNG based on LHV are 61.9%, 68.7% and 65.8% for the HPR, PCH and WoodRoll® systems respectively. Note that WoodRoll® 4.8 MW SNG and WoodRoll 16 MW SNG both have the same conversion efficiency of 65.8%. As comparison the large scale 200 MW SNG plant presented in Börejsson et al.33 has a conversion efficiency of 62.5%. However, the conversion efficiency is just one measure. Another one is the need of primary energy needed to produce one MJ of bioSNG, excluding the chemically bound energy in the feedstock. Here the HPR, PCH, WoodRoll® 4.8 MW SNG and WoodRoll® 16 MW SNG end up with 0.17, 0.08, 0.27 and 0.20 MJ of primary energy per MJ of methane produced, respectively. These are similar numbers as for the 200 MW SNG plant which requires approx. 0.20 MJ of primary energy per MJ of methane produced. A third measure is the GHG balance where the HPR, PCH, WoodRoll® 4.8 MW SNG and WoodRoll® 16 MW SNG systems result in 5.6, 3.5, 7.9 and 6.3 g CO2-eq. MJ-1 respectively while the 200 MW SNG plant shows GHG emissions of just over 4 g CO2-eq. MJ-1 based on RED calculations. It should be noted that all RED results for the thermochemical conversion routes (3.5 to 7.9 g CO2-eq. MJ-1) are well below the directive’s intended emissions reductions. The required reduction of 60 % compared to fossil fuel after 2018 corresponds to 33.5 g CO2-eq. MJ-1 with the current comparator (2009/28/EC). Both the PCH (4.6 MW bioSNG) and the upscaled WoodRoll® (16 MW bioSNG) are able to produce bioSNG at a competitive cost, 74.6 and 61.7 EUR/MWh under Swedish conditions. A bioSNG production cost of 70-75 EUR/MWh is assumed to be competitive, corresponding more or less to the cost of natural gas plus the carbon dioxide tax. In fact the upscaled WoodRoll® seems to be on par with the results for the 200 MW bioSNG plant at 64.9 EUR/MWh. For woody biomass gasification is the preferred option due to the low degradability of such feedstock in anaerobic digestion processes. For non-woody lignocellulosic feedstock, such as straw, it seems like the thermo-chemical conversion routes investigated here need more development before they can handle feedstocks with high content of alkali and chlorine, which results in a
LIGNOSYS
49
low ash melting temperature and corrosive compounds, as a single fuel. The low ash melting temperature of yellow wheat straw was experienced first-hand during the lab scale gasification test of pelletised straw, conducted within the project. However, co-gasification of yellow straw and other low cost feedstocks such as bark will probably be demonstrated in the near future. Meanwhile anaerobic diges-tion offers a possibility to convert roughly half of the energy content in straw to methane and the rest ends up in the digestate where the non-converted carbon contributes to attractive characteristics (increased C/N ratio, water containing properties etcetera). However, the value of the non-converted carbon depends on the type of land where the digestate will be used as a fertiliser. Arable land in intensive agriculture areas dominated by annual crop production normally has a declining soil carbon content, thus an increase input of carbon via digestate could lead to significant benefit in these soils45,46. This is especially the case in soils with a large difference between the actual soil carbon content and the soil organic carbon saturation capacity of the soil. On farmland dominated by perennial crops, such as ley crops, the benefit of digestate will normally be lower since the soil carbon content in these soils are higher and often close to the soil organic carbon saturation capacity. There are obvious synergies between anaerobic digestion and thermochemical conversion of biomass to biomethane. Heat integration and cost sharing are two major advantages to consider for future combined facilities, especially for plants with a raw gas capacity below 1,000 Nm3/h due to the strong cost reduction related to carbon dioxide removal when the raw gas flow is increased.
LIGNOSYS
50
12. Conclusions and future outlook The project has shown that small scale gasification and methanation can compete with large scale facilities in terms of environmental impact and production cost. It’s important to understand that the technologies investigated here are developed for small scale production and do not suffer from problems related to down-scaling of technology developed for large scale installations. The small scale offers additional advantages such as an easier sourcing of the feedstock, shorter transportation distance of the feedstock and easier matching of the produced excess process heat with local heat demand. From an economical perspective it’s beneficial that the total investment cost is only a fraction of the investment cost of large scale installations. The next step in the development of small scale gasification and methanation is the demonstration in industrial scale. That is the step from demonstration in pilot scale during measurement campaigns to continuous operation in a scale that is of industrial interest. Such demonstrations are under commissioning through the PCH demo in Alberta, Canada and the 6 MW WoodRoll® installation in Höganäs, Sweden. While there still is development work to be done before the first commercial scale bio-SNG facility based on small scale technology is in place there are interesting possibilities to further reduce the production cost. One is related to a higher degree of automated operation and reduction of the number of personnel needed to run the facility. Another one is related to utilisation of low cost feedstocks such as RDF and different types of industrial and agricultural waste including straw. Nevertheless, this project has shown that the thermochemical conversion routes investigated here haven’t reached the state yet where they are able to handle straw as a single fuel. The lab scale gasification test of pelletised straw resulted in agglomeration of the bed material. This might be circumvented by further deve-lopment or co-gasification with other feedstocks but at the moment these are part of future development activities. Meanwhile anaerobic digestion offers a possibility to convert roughly half of the energy content in the straw to methane with the rest ending up in the digestate where the non-converted carbon contributes to attractive characteristics (increased C/N ratio, water containing properties etc.). However, the value of the non-converted carbon depends on the type of land where the digestate will be used as a fertiliser. Finally, it might be noted that G4 Insights Inc. is developing an upscaled PCH system which will further reduce the bioSNG production cost. A follow-up of the ongoing development including the results and experiences from the PCH demon-stration in Alberta, Canada and the WoodRoll® demonstration in Höganäs, Sweden will provide additional input data for future system studies and economic analyses.
LIGNOSYS
51
13. Acknowledgement The financial support from the Swedish Energy Agency is highly appreciated and the co-financing and contribution by the project partners have been crucial for the success of the project. With 10 partners from 5 countries and one European organisation there has been extensive information exchange within the project. The project has attracted attention beyond the project consortium and several external partners have contributed to the project in various ways. A special thank goes to Max Strandberg, Wärtsilä Puregas Solutions AB, who contributed with a lecture on the amine scrubber system, provided the complete interface calculations between the gasification and the upgrading system, and answered numerous questions related to upgrading, including cost data. Finally a special thanks to prof. Pål Börjesson who besides being an active super-visor also provided the text related to soil carbon.
LIGNOSYS
52
14. References 1 Held, J. Gasification – Status and technology. Swedish Gas Technology Centre, 2012.
2 Held, J. BioProGReSs – Biomass Product Gas Reforming Solutions. Renewtec Report 007:2018.
Renewable Energy Technology International AB, 2018, http://dx.doi.org/10.13140/RG.2.2.10378.36800 3 Productive forest land. The Swedish National Forest Inventory, SLU.
https://www.slu.se/en/Collaborative-Centres-and-Projects/the-swedish-national-forest-inventory/forest-statistics/forest-statistics/productive-forest-land/ visited 30 October 2018. 4 EUROSTAT. http://appsso.eurostat.ec.europa.eu/nui/submitViewTableAction.do, visited 14 Octo-
ber 2018. 5 Sweden Statistics. https://www.scb.se/hitta-statistik/statistik-efter-amne/energi/tillforsel-och-
anvandning-av-energi/leveranser-av-fordonsgas/pong/tabell-och-diagram/leveranser-av-fordonsgas-ar-totalt/ (in Swedish). Visited 15 October 2018. 6 Swedish Tax Office. Visited 7 November 2018
https://www.skatteverket.se/foretagochorganisationer/skatter/punktskatter/energiskatter/energiskatterpabranslen/skattebefrielseforbiodrivmedel.4.2b543913a42158acf800021393.html 7 Swedish Tax Office. Visited 7 November 2018.
https://www.skatteverket.se/foretagochorganisationer/skatter/punktskatter/energiskatter/skattesatserochvaxelkurser.4.77dbcb041438070e0395e96.html 8 An integrated climate and energy policy. Outlined in the Swedish Government Bills 2008/09: 162
and 2008/09: 163. 9 Gallmetzer, G. et al. The agnion Hetapipe-Reformer – operating experiences and evaluation of
fuel conversion and syngas composition. Biomass Conversion and Biorefinery Journal, April 2012, http://dx.doi.org/10.1007/s13399-012-0046-2 10
Kienberger, T. et al. Desulfurization and in situ tar reduction within catalytic methanation of biog-enous synthesis gas. Fuel (2013), http://dx.doi.org/10.1016/j.fuel.2013.01.061 11
Singh S, Cheng G, Sathitsuksanoh N, Wu D, Varanasi P, George A, Balan V, Gao X, Kumar R, Dale BE, Wyman CE, Simmons BA. Comparison of different biomass pretreatment techniques and their impact on chemistry and structure. Front Energy Res Bioenergy Biofuels. 2:1–12. http://dx.doi.org/10.3389/fenrg.2014.00062 12
Wagner AO, Schwarzenauer T, Illmer P. Improvement of methane generation capacity by aero-bic pre-treatment of organic waste with a cellulolytic Trichoderma viride culture. J Environ Manage 129:357–360. http://dx.doi.org/10.1016/j.jenvman.2013.07.030 13
Lim JW, Wang JY. Enhanced hydrolysis and methane yield by applying microaeration pretreat-ment to the anaerobic co-digestion of brown water and food waste. Waste Manag 33:813–819. http://dx.doi.org/10.1016/j. wasman.2012.11.013 14
Amin et al. Pretreatment methods of lignocellulosic biomass for anaerobic digestion. AMB Expr 7:72, 2017. http://dx.doi.org/10.1186/s13568-017-0375-4 15 Barakat A, Mayer C, Solhy A, Arancon RAD, De Vries H, Luque R, Barakat A, Mayer C, Solhy A,
Arancon RAD, De Vries H. Mechanical pretreatments of lignocellulosic biomass: towards facile and environmentally sound technologies for biofuels production. RSC Adv 4:48109–48127, 2014. http://dx.doi.org/10.1039/C4RA07568D 16 Cheng JJ, Timilsina GR. Status and barriers of advanced biofuel technologies: a review. Renew
Energy 36:3541–3549, 2011. http://dx.doi.org/10.1016/j.renene.2011.04.031 17
Risberg, K. et al. Biogas production from wheat straw and manure – Impact of pretreatment and process operating parameters. Bioresource Technology 149, 232-237, 2013. 18
Montgomery L.F.R, Bochmann G. Pretreatment of feedstock for enhanced biogas production. IEA Bioenergy report, 2014. 19 González G, Urrutia H, Roeckel M, Aspe E . Protein hydrolysis under anaerobic, saline condi-
tions in presence of acetic acid. J Chem Technology Biotechnology 157:151–157, 2005. http://dx.doi.org/10.1002/jctb.1165 20 Us E, Perendeci NA. Improvement of methane production from greenhouse residues : optimiza-
tion of thermal and H2SO4 pretreatment process by experimental design. Chem Eng J 181–182:120–131, 2012. http://dx.doi.org/10.1016/j.cej.2011.11.038
LIGNOSYS
53
21 Badiei M, Asim N, Jahim JM, Sopian K. Comparison of chemical pretreatment methods for cellu-
losic biomass. Procedia Soc Behav Sci 9:170–174, 2014. http://dx.doi.org/10.1016/j.apcbee.2014.01.030 22 Sun Y, Cheng J. Hydrolysis of lignocellulosic materials for ethanol production: a review. Biore-
source Technology 83:1–11, 2002. 23
Harmsen P, Huijgen W, Bermudez L, Bakker R. Literature review of physical and chemical pre-
treatment processes for lignocellulosic biomass. Report no. 1184, pp 1–49, 2010. http://www.wur.nl/en/Publication-details.htm?publicationId=publication-way-333936323031 24 Zheng M, Li X, Li L, Yang X, He Y. Enhancing anaerobic biogasification of corn stover through
wet state NaOH pretreatment. Bioresource Technology 100:5140–5145, 2009. http://dx.doi.org/10.1016/j.biortech.2009.05.045 25 Jaffar M, Pang Y, Yuan H, Zou D, Liu Y, Zhu B, Korai RM, Li X. Wheat straw pretreatment with
KOH for enhancing biomethane production and fertilizer value in anaerobic digestion. Chin J Chem Eng 24:404–409, 2016. http://dxdoi.org/10.1016/j.cjche.2015.11.005 26
Li L, Chen C, Zhang R, He Y, Wang W, Liu G. Pretreatment of corn stover for methane produc-
tion with the combination of potassium hydroxide and calcium hydroxide. Energy Fuels 29:5841–5846, 2015. http://dxdoi.org/10.1021/acs.energyfuels.5b01170 27 Li J, Zhang R, Abdul M, Siddhu H, He Y, Wang W, Li Y, Chen C, Liu G.Enhancing methane
production of corn stover through a novel way:sequent pretreatment of potassium hydroxide and steam explosion. Bioresource Technology 181:345–350, 2015. http://dxdoi.org/10.1016/j.biortech.2015.01.050 28
Lantz M. et al. An economic comparison of dedicated crops vs agricultural residues as feedstock for biogas of vehicle fuel quality. AIMS Energy, 5(5): 838-863. http://dx.doi.org/10.3934/energy.2017.5.838, 2017. 29
Lantz, M. et al. Biogas and ethanol from wheat grain or straw: Is there a trade-off between cli-mate impact, avoidance of iLUC and production cost? Energies 2018, 11, 2633 http://dx.doi.org/10.3390/en11102633 30
Swedish Official Statistics. Statistic Message, EN 0307 SM 1703 Wood fuel- and peat prices No. 1 / 2018. 31
Hannula I., Kurkela E. Liquid transportation fuels via large-scale fluidised-bed gasification of lig-nocellulosic biomass. VTT Technology 91, 2013. 32
Thunman H et al. Economic assessment of advanced biofuel production via gasification using real cost data from GoBiGas, a first-of its-kind industrial installation. Submitted to Energy Science & Engineering, 2018. Available as paper 4 at http://www.chalmers.se/SiteCollectionDocuments/SEE/News/Popularreport_GoBiGas_results_highres.pdf. Visited 6
th of November 2018.
33 Börjesson, P. et al. Methane as vehicle fuel – A well-to-wheel analysis (MetDriv).Report f3
2018:06. The Swedish Knowledge Centre for Renewable Transportation Fuels, 2018. 34
Swedish Official Statistics. Statistic Message, EN 0307 SM 1703 Wood fuel- and peat prices No. 1 / 2018. 35 Lindholm, E.L., Stendahl, J., Berg, S., Hansson, P.A. 2011. Greenhouse gas balance of harvest-
ing stumps and logging residues for energy in Sweden. Scandinavian Journal of Forest Research 26(6): 586-594. 36 Schowanek, D., Borsboom Oatel, T., Bouvy, A., Colling, J., de Ferrer, J. A., Eggers, D., Groen-
ke, K., Gruenenwald, T., Martinsson, J., Mckeown, P., Miller, B., Moons, S., Niedermann, K., Pé-rez, M., Schneider, C., Viot, J.F. 2017. New and updated life cycle inventories for surfactants used in European detergents: summary of the ERASM surfactant life cycle and ecofootprinting project. International Journal of Life Cycle Assessment 23(4): 867-886. 37 Plastics Europe 2012. General-Purpose Polystyrene (GPPS) and High-Impact Polystyrene
(HIPS). Eco-profiles and Environmental Product Declarations of the European Plastics Manufac-turers. Available at: https://www.plasticseurope.org/en/resources/eco-profiles visited 15 November 2018. 38 Biograce Excel tool. Version 4c. Available at: http://www.biograce.net.
LIGNOSYS
54
39 Swedish Energy Agency 2012. Vägledning till regelverket om hållbarhetskriterier för biodrivme-
del och flytande biobränslen. Version 3.0. ER 2012:27, Energimyndigheten. 40 Gode, J., Martinsson, F., Hagberg, L., Öman, A., Höglund, J., Palm, D. Miljöfaktaboken 2011.
Uppskattade emissionsfaktorer för bränslen, el, värme och transporter. Stockholm: Värmeforsk 41
Praktisk Skogshandbok 12:e upplagan, Sveriges Skogsvårdsförbund, 1986. 42
Lindholm, E.L., Berg, S., Hansson, P.A. 2010. Energy efficiency and the environmental impact of harvesting stumps and logging residues. European Journal of Forest Research 129(6): 1223–1235. 43
Hermansen, N. The effect of biochar on cultivated land and the environment. DCA – Danish Cen-tre For Food And Agricluture, 2016. http://dca.au.dk/en/current-news/news/show/artikel/saadan-virker-biokul-paa-dyrket-jord-og-miljoeet/ visited 14 December 2018. 44
Hoyer K. et al. Biogas Upgrading – Technical Review. Report 2016:275, Elforsk. 2016. 45 Lantz M., Börjesson P. (2014). Greenhouse gas and energy assessment of the biogas from co-
digestion injected into the natural gas grid - A Swedish case-study including effects on soil proper-ties. Renewable Energy, 71, 387-395. 46 Börjesson P., Prade T., Lantz M., Björnsson L. (2015). Energy crop-based biogas as vehicle fuel
– the impact of crop selection on energy efficiency and greenhouse gas performance. Energies, 8, 6033-6058.

www.renewtec.se
Renewable Energy Technology International AB
Related Documents