Renewable energy projects to electrify rural communities in Cape Verde Matteo Ranaboldo a,⇑ , Bruno Domenech Lega b , David Vilar Ferrenbach c , Laia Ferrer-Martí a , Rafael Pastor Moreno b , Alberto García-Villoria b a Universitat Politècnica de Catalunya, Department of Mechanical Engineering, Spain b Universitat Politècnica de Catalunya, Institute of Industrial and Control Engineering, Spain c ECOWAS Centre for Renewable Energy and Energy Efficiency (ECREEE), Cape Verde highlights The design of 2 off-grid electrification projects in Cape Verde is developed. Configurations with hybrid renewable energy systems and micro-grids are considered. A detailed micro-scale wind resource assessment is carried out. An optimization model is used in order to support the design. The proposed system is economically beneficial in comparison with diesel generation. article info Article history: Received 28 June 2013 Received in revised form 11 November 2013 Accepted 21 December 2013 Keywords: Rural electrification Off-grid generation Renewable energy Wind resource assessment Microgrids Cape Verde abstract Even though Cape Verde has high wind and solar energy resources, the conventional strategy for increas- ing access to electricity in isolated rural areas is by centralized microgrids with diesel generators. In this study, the design of 2 off-grid electrification projects based on hybrid wind–photovoltaic systems in Cape Verde is developed and analyzed. The design considers some significant novelty features in comparison with previous studies. First a detailed wind resource assessment is carried out combining meso-scale wind climate data and a specialized micro-scale wind flow model. Then a mathematical model is used for the design of off-grid projects considering a combination of individual systems and microgrids. In this study, locations far from the demand points are also considered as possible generation points. Various design configurations are analyzed and compared. The proposed configurations exploit the highest wind potential areas and are economically beneficial in comparison with diesel generator systems. Ó 2013 Elsevier Ltd. All rights reserved. 1. Introduction Cape Verde is an archipelago located in the Atlantic Ocean with a total population of half a million people. Its electrical energy pro- duction relies largely on diesel thermal plants [1] and is highly dependent on (totally imported) fuel. Cape Verde electric power price is therefore highly affected by fuel price fluctuation and is currently around 0.40$/kW h, among the most expensive in Africa [1]. The electrification rate was around 70% in 2010, relatively high in comparison with other countries of its region [1]. During the last decades, the conventional strategy for increasing access to electricity in rural areas of Cape Verde has been to extend the na- tional electricity grid or by autonomous microgrids with diesel generators [2]. Due to the complex geography and dispersed nat- ure of villages in mayor islands of Cape Verde, the expansion of the electricity grid can only reach a limited number of people. Fur- thermore, during the last decade connections to the grid increased rapidly while installed capacity remained stable; as a result of this tight demand-supply balance, the incidence of blackouts more than tripled and became longer in duration [1]. On the other side, local microgrids powered by small diesel generators, which supply electricity for a significant proportion of isolated communities or municipalities [2], have some clear disadvantages and limitations, such as the high and variable cost of the fuel, the requirement of a continuous supply and the inherent carbon dioxide and other polluting emission. Under these circumstances, stand-alone electrification systems that use renewable energy sources are a suitable alternative to provide electricity to isolated communities in a reliable and pollution-free manner [3]. Moreover, one of their main advantages is that they use local resources and do not depend on external 0306-2619/$ - see front matter Ó 2013 Elsevier Ltd. All rights reserved. http://dx.doi.org/10.1016/j.apenergy.2013.12.043 ⇑ Corresponding author. Address: Universitat Politècnica de Catalunya, Depart- ment of Mechanical Engineering, Building H Floor 0, Avda. Diagonal 647, 08028 Barcelona, Spain. Tel.: +34 934016579. E-mail address: [email protected] (M. Ranaboldo). Applied Energy 118 (2014) 280–291 Contents lists available at ScienceDirect Applied Energy journal homepage: www.elsevier.com/locate/apenergy

Welcome message from author
This document is posted to help you gain knowledge. Please leave a comment to let me know what you think about it! Share it to your friends and learn new things together.
Transcript

Applied Energy 118 (2014) 280–291
Contents lists available at ScienceDirect
Applied Energy
journal homepage: www.elsevier .com/ locate/apenergy
Renewable energy projects to electrify rural communities in Cape Verde
0306-2619/$ - see front matter � 2013 Elsevier Ltd. All rights reserved.http://dx.doi.org/10.1016/j.apenergy.2013.12.043
⇑ Corresponding author. Address: Universitat Politècnica de Catalunya, Depart-ment of Mechanical Engineering, Building H Floor 0, Avda. Diagonal 647, 08028Barcelona, Spain. Tel.: +34 934016579.
E-mail address: [email protected] (M. Ranaboldo).
Matteo Ranaboldo a,⇑, Bruno Domenech Lega b, David Vilar Ferrenbach c, Laia Ferrer-Martí a,Rafael Pastor Moreno b, Alberto García-Villoria b
a Universitat Politècnica de Catalunya, Department of Mechanical Engineering, Spainb Universitat Politècnica de Catalunya, Institute of Industrial and Control Engineering, Spainc ECOWAS Centre for Renewable Energy and Energy Efficiency (ECREEE), Cape Verde
h i g h l i g h t s
� The design of 2 off-grid electrification projects in Cape Verde is developed.� Configurations with hybrid renewable energy systems and micro-grids are considered.� A detailed micro-scale wind resource assessment is carried out.� An optimization model is used in order to support the design.� The proposed system is economically beneficial in comparison with diesel generation.
a r t i c l e i n f o
Article history:Received 28 June 2013Received in revised form 11 November 2013Accepted 21 December 2013
Keywords:Rural electrificationOff-grid generationRenewable energyWind resource assessmentMicrogridsCape Verde
a b s t r a c t
Even though Cape Verde has high wind and solar energy resources, the conventional strategy for increas-ing access to electricity in isolated rural areas is by centralized microgrids with diesel generators. In thisstudy, the design of 2 off-grid electrification projects based on hybrid wind–photovoltaic systems in CapeVerde is developed and analyzed. The design considers some significant novelty features in comparisonwith previous studies. First a detailed wind resource assessment is carried out combining meso-scalewind climate data and a specialized micro-scale wind flow model. Then a mathematical model is usedfor the design of off-grid projects considering a combination of individual systems and microgrids. In thisstudy, locations far from the demand points are also considered as possible generation points. Variousdesign configurations are analyzed and compared. The proposed configurations exploit the highest windpotential areas and are economically beneficial in comparison with diesel generator systems.
� 2013 Elsevier Ltd. All rights reserved.
1. Introduction
Cape Verde is an archipelago located in the Atlantic Ocean witha total population of half a million people. Its electrical energy pro-duction relies largely on diesel thermal plants [1] and is highlydependent on (totally imported) fuel. Cape Verde electric powerprice is therefore highly affected by fuel price fluctuation and iscurrently around 0.40$/kW h, among the most expensive in Africa[1]. The electrification rate was around 70% in 2010, relatively highin comparison with other countries of its region [1]. During thelast decades, the conventional strategy for increasing access toelectricity in rural areas of Cape Verde has been to extend the na-tional electricity grid or by autonomous microgrids with diesel
generators [2]. Due to the complex geography and dispersed nat-ure of villages in mayor islands of Cape Verde, the expansion ofthe electricity grid can only reach a limited number of people. Fur-thermore, during the last decade connections to the grid increasedrapidly while installed capacity remained stable; as a result of thistight demand-supply balance, the incidence of blackouts morethan tripled and became longer in duration [1]. On the other side,local microgrids powered by small diesel generators, which supplyelectricity for a significant proportion of isolated communities ormunicipalities [2], have some clear disadvantages and limitations,such as the high and variable cost of the fuel, the requirement of acontinuous supply and the inherent carbon dioxide and otherpolluting emission.
Under these circumstances, stand-alone electrification systemsthat use renewable energy sources are a suitable alternative toprovide electricity to isolated communities in a reliable andpollution-free manner [3]. Moreover, one of their main advantagesis that they use local resources and do not depend on external
M. Ranaboldo et al. / Applied Energy 118 (2014) 280–291 281
sources, which can promote the long-term sustainability of theprojects. Specifically, Photo-Voltaic (PV) systems have alreadybeen widely used in the last decades, while wind systems, lessused, are receiving increasing attention for off-grid generation[4]. In windy areas, the ratio investment/produced energy canmake wind energy a very favorable technology, especially whendemand increases and more powerful wind turbines are used (forinstance, when supplying to groups of households with microgrids[5]). In this context, hybrid systems that combine wind and solarenergy sources are a promising generation option [4].
Most stand-alone electrification projects based on wind and so-lar energies consist of installing individual systems [6,7]; thatmeans each consumption point (for example, households, healthcenters or schools) has its own generators. As an alternative,microgrids can be used: a generation point produces energy for anumber of consumption points. It is generally known that microgr-ids have several advantages in comparison with individual systems[8]. First, when using those configurations, user energy availabilitydoes not depend on the resource in its location. Second, equity be-tween user consumptions is improved by relying on the same gen-erators, i.e. all connected users share the same generated energy.Third, costs can be reduced by economies of scale (when installingmore powerful generators a lower ratio between the generatorscost and the energy produced could be reached). Finally, a greaterflexibility in consumption is permitted: consumption can punctu-ally be increased due to special days, admission of new users orthe development of productive activities, i.e. the implementationof local businesses could involve higher energy requirements. De-spite the advantages of microgrids, a too large extension may causeproblems due to the increasing cable cost [9]. Thus, the design ofstand-alone renewable energy projects is highly complex as it re-quires the characterization of both energy resources in every pointof the community and aims to find a good compromise betweenmicrogrids’ extension and individual electrification [5,10].
Various papers study the design of autonomous electrificationsystems at village level in developing countries through the useof renewable energies [4,10–14]. In this context, most studiesbasically focus on defining the best combination of renewablegeneration sources without considering energy resource spatialvariations [11–14]. HOMER developed by NREL is the most widelyused decision aid tool, which simulates and compares lifetimecosts of different alternatives of electrification [13,14]. However,recent rural electrification projects confirmed that significant windresource differences could be present between houses of a commu-nity in hilly terrain [15]. In these cases, a single wind resource data,as considered by e.g. [2,11–14], is not representative of the wholearea and detailed resource studies are required for defining gener-ators locations. Moreover very few studies focus on the design ofmicrogrids and the definition of the system, but with some limita-tions [16,17]. ViPOR [17] uses the output from HOMER to design adistribution system combining microgrids and individual systems.However, this tool limits the possible generation points and thenumber of microgrids; furthermore it does not consider voltagedrops in microgrid design. To overcome these limitations, a mixedinteger linear programming (MILP) model was developed for thedesign of wind electrification systems, considering the detail ofwind resource, the demand of each consumption point, the storagein batteries and the distribution through microgrids [5]. Recently,solar energy has been included in the previous model, to obtainthe optimal combination of wind-PV technologies for everyselected generation point [10].
Cape Verde is located in a sub-tropical region and receives asignificant solar radiation during the whole year. Furthermore,tropical trade winds are well developed over most of Cape Verdeislands and exposed sites have a large wind resource [18,19]. Inthe last years different studies have been carried out showing the
reliability of renewable energy projects and proposing an increaseof the penetration of renewable energy sources in Cape Verde[2,19–21]. In particular, a recent study [2] focusing on the commu-nities of Figueiras and Ribeira Alta (in the island of Santo Antão),proposes the replacement of the current diesel systems with hy-brid systems combining diesel, wind and solar energies. However,in that study the wind energy production was roughly estimatedby wind data of a far off meteorological station and was considereduniform around the community area. Therefore, the design of theprojects was just preliminary and mainly focused on the econom-ical comparison with current diesel systems.
In this context, this paper develops accurate studies to designoff-grid rural electrification projects with wind and solar energiesin 3 communities of Cape Verde: Figueiras and Ribeira Alta in SantoAntão Island and Achada Leite (currently not electrified) in Santi-ago Island. The design considers some novelty features in compar-ison with previous studies and is composed by two main steps.Firstly, a high resolution wind resource assessment is realizedcombining generalized wind climate data and a specific wind flowmodel that takes into account real topographical wind speedchanges to detect micro-scale wind resource variations [15]. Then,the previously mentioned MILP model [10] is applied. The modeloptimizes the technical design of the electrification system mini-mizing the cost and specifying the amount and size of the equip-ment to be installed. Moreover, in this study, locations with agood resource far from the demand points, i.e. users, are consid-ered as possible generation points, while generally generators areforced to be installed close to the users [5,10].
The final proposed electrification systems are totally based onrenewable energies and take advantage of best resource areas. Be-sides avoiding greenhouse gas emissions and reducing the externaldependency on fuel importations, they result to be economicallybeneficial in comparison with diesel generator systems and evenwith the hybrid wind–solar–diesel system proposed in ref. [2].The systems designed in this study can be used as pilot projectsin order to facilitate governmental investments on renewable en-ergy and spread their utilization in rural electrification projectsin Cape Verde.
The rest of the paper is organized as follows. First the studiedcommunities are described (Section 2) and the micro-scale windresource assessments are carried out (Section 3); in Section 4 theoptimization model for off-grid electrification design is summa-rized. Various design configurations for the electrification of thestudied communities are analyzed in Section 5. In Section 6 an eco-nomical and environmental analysis of the proposed solutions incomparison with diesel generation option is carried out. Finally(Section 7) the conclusions of the study are exposed.
2. Communities descriptions and previous studies
Cape Verde is a 10 islands archipelago located in the AtlanticOcean 500 km off the West African coastline, covering an area be-tween longitude 22–26�W and latitude 14–18�N (Fig. 1). The ana-lyzed communities are Figueiras and Ribeira Alta in Santo AntãoIsland, and Achada Leite in Santiago Island. Their location is shownin Fig. 2. The first two communities (Figueiras and Ribeira Alta) arestudied together due to their proximity. From now on, the 2studied projects will be referred to as ‘‘Santo Antão project’’ and‘‘Santiago project’’.
The solar resource of Cape Verde is high and rather uniformwith a mean global irradiance generally varying between 5 and7 kW h/(m2 day) along the year, according to NASA climatedatabase with a resolution of 0.5� (around 50 km) [22]. As spatialvariation of global irradiance is lower than 5% in areas of less than30 � 30 km even in mountainous areas [23], the solar resource is

Fig. 1. Cape Verde map [21].
Fig. 2. Mean wind speed at 50 m in Santo Antão and Santiago Islands [18]. Black point indicates studied communities’ locations.
282 M. Ranaboldo et al. / Applied Energy 118 (2014) 280–291
assumed to be uniform in the studied areas. In order to carry out aconservative analysis, the lowest resource month in Cape Verde isconsidered in this study, i.e. December with a mean global irradi-ance of 4.8 kW h/(m2 day) as by ref. [22].
The wind climate of the country is the typical of sub-tropical re-gion with trade winds prevailing: in most sites dominant winddirection is from the northeast during the whole year. A meso-scale wind resource map of the country is available [18], obtainedusing the KAMM/WAsP numerical wind-atlas method [24]. Theresulting resource map (Fig. 2) gives information about mean windspeed and power density at 50 m with a grid spacing of 0.05� oflatitude/longitude, based on a modelling resolution of 2.5 km.
Outputs of the numerical wind atlas have been verified in differentlocations in Cape Verde and show good results in comparison within-situ measurements [18]. Fig. 2 shows the meso-scale wind re-source maps in the islands of Santo Antão and Santiago, wherethe 3 analyzed communities are located. Wind resource in theareas of these communities is good with mean wind speeds at50 m between 5 and 7 m/s. The seasonal wind speed variationalong the year is around ±10% with respect to the annual mean va-lue with higher values in winter and lower in summer [22,25]. As ahigh variability of the wind resource is expected in hilly terraineven at a micro-scale [15], a detailed assessment is carried out inSection 3.
M. Ranaboldo et al. / Applied Energy 118 (2014) 280–291 283
2.1. Santo Antão project
Figueiras and Ribeira Alta communities are located in twoadjacent valleys on the northern coast of Santo Antão. The distancebetween the 2 communities is around 1 km. The communities ofFigueiras and Ribeira Alta are composed of 122 houses (450 inhab-itants) and 47 houses (180 inhabitants) respectively. The total areacovered by the project is around 16 km2. In each community thereare 2 schools and one health center. The two communities arecurrently electrified by two different microgrids (one for eachcommunity) based on diesel generator systems which supplyenergy to all users (houses and public buildings).
A recent study of the Global Environmental Facility (GEF) [2]developed a costs’ comparison between the current diesel systemand a proposed hybrid system based on a combination of diesel,wind and solar energies. The renewable energy contribution in thathybrid system was around 90% of which more than 70% was fromwind power in both communities. For this purpose an accurateanalysis of users’ future energy requirements and of initial and an-nual costs of the hybrid system components was carried out [2].However, the wind resource assessment was based on a manualextrapolation, by means of an empirical coefficient, of wind datameasured in a meteorological station located in another island(São Vicente Island) more than 50 km away from analyzed com-munities. The uncertainty of this assumption is high as the windclimates of the 2 islands are different, in this sense the selectionof the empirical coefficient is complex and its incorrect estimationcould lead to significant errors. Furthermore, the definition of windturbines positions and electric wires design were not analyzed by[2] as the resource was considered uniform in the community.Therefore, the described study [2] could be considered as a firstapproximation to the design of the project. In this study we aimto realize a detailed analysis and develop a real project consideringmicro-scale wind resource variation and microgrids design.
2.2. Santiago project
Achada Leite is a rural community located on the western coastof Santiago Island, the most populated island of Cape Verde. Thecommunity is composed by 42 houses and a school with a totalpopulation of around 90 inhabitants, distributed in an area of0.3 km2. Nowadays, no electrification systems are present; theclosest connection to national grid is around 3 km (straight linedistance) in mountainous terrain. To our knowledge, no previousstudy on the design of an Achada Leite electrification project hasbeen carried out until this document was finished. Thus, no datain terms of energy requirements and equipment costs areavailable. As the 3 studied communities have similar electricityrequirements, the same input data (in terms of per house energyand power demands) as for Figueiras and Ribeira Alta communities[2] will be used for Achada Leite design analysis.
3. Micro-scale wind resource assessment
In the areas of the studied communities no wind measurementsare available; therefore wind resource is estimated from thenumerical wind atlas [18]. In order to evaluate the wind resourcewith higher detail a micro-scale analysis is carried out with WAsPsoftware [26], a wind flow model, which assumes that the slope ofthe surface is small enough to neglect flow separation and linearizeflow equations. It permits calculating wind climate data of everypoint of a certain area considering topography and roughnesschanges. WAsP software has been and is currently widely usedfor evaluating wind resource differences at a small scale (in areasof less than 10 � 10 km2) in order to site turbines and its
operational limits are well known [27]. An important parameterto ensure WAsP performance is the topographical map quality.WAsP literature recommends that the map should extend to atleast 5 km from any point of evaluation in the predominant winddirection and the height contour interval should be less than20 m [26] with lower interval closer to the evaluated area. In bothislands the available map is sufficiently detailed with a height con-tour interval of 5 m. Regarding the orographic context, a centralparameter for defining the operational limits of the model is theruggedness index (RIX) that indicates the fraction of the surround-ing land above a critical slope (default 17�) [27]. In both studiedprojects RIX values are below 10% in the prevailing wind direction(N – NE), therefore WAsP modelling is expected to be reliable forrural communities’ studies [15,27].
The wind resource is modelled at 20 m a.g.l. which is the pro-posed hub height of wind turbines (with nominal power between600 and 7500 W). Different assessments were carried out usingthe 4 closest grid points of the meso-scale numerical wind atlas[18] surrounding the studied areas. Then, as a conservativeassumption, the meso-scale wind atlas which leads to the lowestwind resource in the analyzed areas is considered. Finally, asannual resource variation along the year is around ±10% [22], a de-crease of 10% on the mean wind speed is applied to wind climateaverage values [18] in order to consider less windy season.
3.1. Santo Antão project
As shown in the topographical map of Fig. 3 where darker col-ours indicate higher heights, Figueiras and Ribeira Alta are locatedin two valleys with areas of abrupt terrain in Santo Antão Island.The installation of wind turbines close to the houses is not ade-quate due to the presence of turbulence induced by slope steep-ness. As main wind has a basically constant direction fromNorth-East (trade winds), coastal areas are well exposed to mainflow. While in Ribeira Alta area the coast line is composed byhardly accessible valleys, in the coastal surrounding of Figueirascommunity (around 1 km North-West) a smooth hill is presentthat could be a promising location for wind turbines installation.Therefore, a detailed wind resource assessment is carried out inthis area (indicated as a black square in Fig. 3). As confirmed by sitevisit, the selected area is directly exposed to trade winds blowingfrom North-East and is well connected to the community by a con-structed path that reaches the football field located on the samehill. Due to the limited number of map points accepted by WAsPsoftware, a contour interval of 20 m is used in the areas far fromthe hill in order to fulfill the recommended map extension; inthe surrounding of the studied area, a 5 m contour interval is used.As terrain is basically composed by grass with few trees, a rough-ness length of 0.03 m is given to land areas and a null roughnesslength is assigned to the sea [26].
As previously stated, due to their proximity and the presence ofa single area for wind generation, the design of Figueiras and Ribe-ira Alta systems are studied together in a single project (the ‘‘SantoAntão project’’). The area of the project is shown in Fig. 3 (right)together with the wind resource map of the smooth hill close toFigueiras community (left). A good wind resource is present inthe site with a mean wind speed of more than 6 m/s at 20 ma.g.l. in best exposed locations.
3.2. Santiago project
Achada Leite is a coastal community located in smooth hilly ter-rain area in Santiago Island. The wind resource is evaluated for anentire area within a radius of around 1 km around the houses. Inthis case, the 5 m contour interval map is used in the whole areawithout exceeding the maximum number of points accepted by

Fig. 3. Santo Antão project topography (right) and mean wind speed at 20 m a.g.l. in the smooth hill close to Figueiras (left). Users’ positions are shown by black circles. The‘‘X’’ indicates the selected wind generation point.
284 M. Ranaboldo et al. / Applied Energy 118 (2014) 280–291
WAsP. A roughness length of 0.03 m is given to most land areas, asterrain is composed by grass with few trees, while a palm forest lo-cated in the center of the community is modelled with a higherroughness of 0.8 m and a null roughness length is assigned to thesea [26].
Resulting wind resource map (Fig. 4) shows a high variability ofresource in the analyzed area. Project area (indicated by a black
Fig. 4. Mean wind speed at 20 m a.g.l. in Santiago project area. Community housesand school positions are shown by black circles. The ‘‘X’’ indicates the selected windgeneration point.
square in Fig. 4) has a pretty low wind resource with mean windspeeds ranging from 2 m/s (in the palm forest area) to 3.5 m/s (athouses located at a higher elevation) at 20 m a.g.l. Meanwhile, ahigher wind resource area is located in the north of the communitywhere a promontory is located close to the sea (indicated by ablack ellipse in Fig. 4), therefore exploiting the trade winds blow-ing from north and north-east; mean wind speeds up to 6.5 m/sare present in this area.
4. Rural electrification systems design
In this Section stand-alone electrification systems usingwind-PV generation technologies and microgrid and/or individualdistribution schemes are firstly described (Section 4.1). Then theoptimization model for the design of the described electrificationsystems is outlined (Section 4.2) and finally input data used forthe design are reported (Section 4.3).
4.1. Technical description
The scheme of a stand-alone rural electrification system basedon wind-PV energies with microgrid distribution is shown in Fig. 5.
Characteristics and functions of each element are next summa-rized [10]:
� Wind generation includes wind turbines and controllers. Windturbines transform kinetic energy from the wind into electricalenergy. The electricity is generated in alternating current (AC).Wind controllers transform AC into direct current (DC) and pro-tect batteries from overcharging and deep discharge.� Photo-Voltaic (PV) generation includes PV panels and control-
lers. PV panels transform sunlight into electricity, generated indirect current (DC). Solar controllers protect batteries fromovercharging and deep discharge.
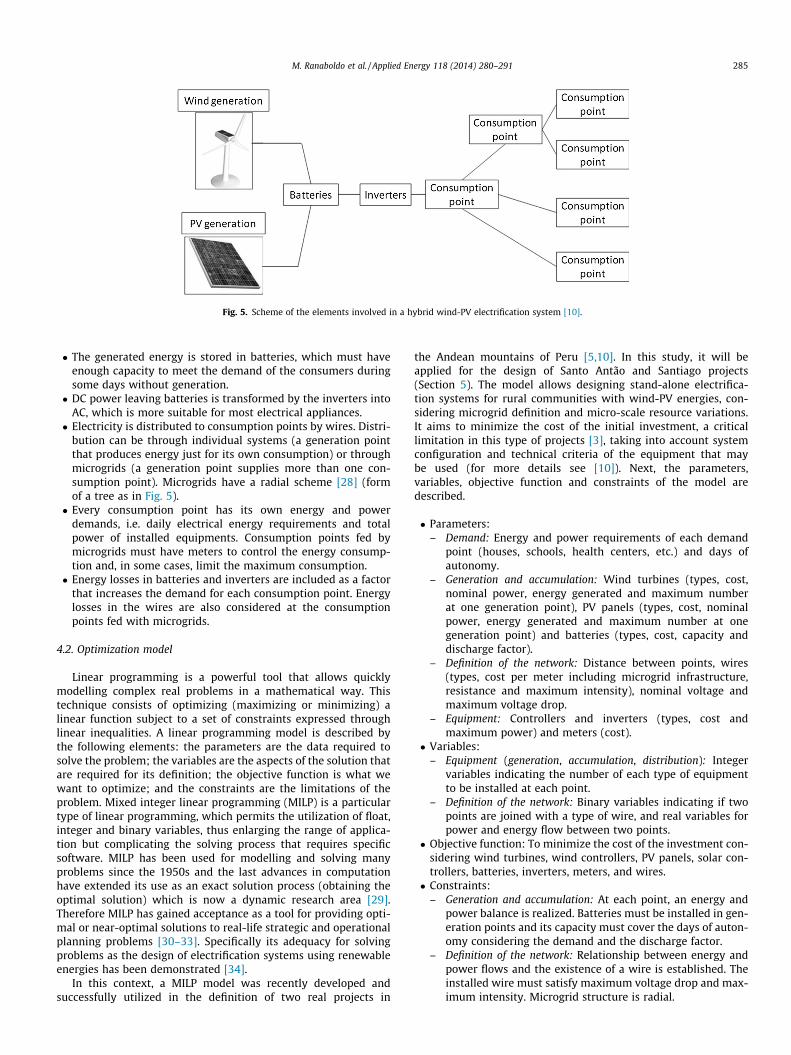
Fig. 5. Scheme of the elements involved in a hybrid wind-PV electrification system [10].
M. Ranaboldo et al. / Applied Energy 118 (2014) 280–291 285
� The generated energy is stored in batteries, which must haveenough capacity to meet the demand of the consumers duringsome days without generation.� DC power leaving batteries is transformed by the inverters into
AC, which is more suitable for most electrical appliances.� Electricity is distributed to consumption points by wires. Distri-
bution can be through individual systems (a generation pointthat produces energy just for its own consumption) or throughmicrogrids (a generation point supplies more than one con-sumption point). Microgrids have a radial scheme [28] (formof a tree as in Fig. 5).� Every consumption point has its own energy and power
demands, i.e. daily electrical energy requirements and totalpower of installed equipments. Consumption points fed bymicrogrids must have meters to control the energy consump-tion and, in some cases, limit the maximum consumption.� Energy losses in batteries and inverters are included as a factor
that increases the demand for each consumption point. Energylosses in the wires are also considered at the consumptionpoints fed with microgrids.
4.2. Optimization model
Linear programming is a powerful tool that allows quicklymodelling complex real problems in a mathematical way. Thistechnique consists of optimizing (maximizing or minimizing) alinear function subject to a set of constraints expressed throughlinear inequalities. A linear programming model is described bythe following elements: the parameters are the data required tosolve the problem; the variables are the aspects of the solution thatare required for its definition; the objective function is what wewant to optimize; and the constraints are the limitations of theproblem. Mixed integer linear programming (MILP) is a particulartype of linear programming, which permits the utilization of float,integer and binary variables, thus enlarging the range of applica-tion but complicating the solving process that requires specificsoftware. MILP has been used for modelling and solving manyproblems since the 1950s and the last advances in computationhave extended its use as an exact solution process (obtaining theoptimal solution) which is now a dynamic research area [29].Therefore MILP has gained acceptance as a tool for providing opti-mal or near-optimal solutions to real-life strategic and operationalplanning problems [30–33]. Specifically its adequacy for solvingproblems as the design of electrification systems using renewableenergies has been demonstrated [34].
In this context, a MILP model was recently developed andsuccessfully utilized in the definition of two real projects in
the Andean mountains of Peru [5,10]. In this study, it will beapplied for the design of Santo Antão and Santiago projects(Section 5). The model allows designing stand-alone electrifica-tion systems for rural communities with wind-PV energies, con-sidering microgrid definition and micro-scale resource variations.It aims to minimize the cost of the initial investment, a criticallimitation in this type of projects [3], taking into account systemconfiguration and technical criteria of the equipment that maybe used (for more details see [10]). Next, the parameters,variables, objective function and constraints of the model aredescribed.
� Parameters:– Demand: Energy and power requirements of each demand
point (houses, schools, health centers, etc.) and days ofautonomy.
– Generation and accumulation: Wind turbines (types, cost,nominal power, energy generated and maximum numberat one generation point), PV panels (types, cost, nominalpower, energy generated and maximum number at onegeneration point) and batteries (types, cost, capacity anddischarge factor).
– Definition of the network: Distance between points, wires(types, cost per meter including microgrid infrastructure,resistance and maximum intensity), nominal voltage andmaximum voltage drop.
– Equipment: Controllers and inverters (types, cost andmaximum power) and meters (cost).
� Variables:– Equipment (generation, accumulation, distribution): Integer
variables indicating the number of each type of equipmentto be installed at each point.
– Definition of the network: Binary variables indicating if twopoints are joined with a type of wire, and real variables forpower and energy flow between two points.
� Objective function: To minimize the cost of the investment con-sidering wind turbines, wind controllers, PV panels, solar con-trollers, batteries, inverters, meters, and wires.� Constraints:
– Generation and accumulation: At each point, an energy andpower balance is realized. Batteries must be installed in gen-eration points and its capacity must cover the days of auton-omy considering the demand and the discharge factor.
– Definition of the network: Relationship between energy andpower flows and the existence of a wire is established. Theinstalled wire must satisfy maximum voltage drop and max-imum intensity. Microgrid structure is radial.
286 M. Ranaboldo et al. / Applied Energy 118 (2014) 280–291
– Equipment: Installed wind and solar controllers must be ade-quately powered for wind turbines and PV panels, respec-tively. Due to technical constraints, an adequate windcontroller is considered to be included in each wind turbine.Inverters must satisfy power demand. Controllers andinverters must be installed in generation-accumulationpoints.
4.3. Input data
In order to carry out a consistent economical comparison withthe diesel system (Section 6), most of the data are taken fromthe previous study in Figueiras and Ribeira Alta communities [2].The same input data are also used for Santiago project design anal-ysis. Next, we present the main characteristics of the equipmentconsidered:
� Wind turbines (3 types): nominal power: 600, 3500 and7500 W; cost: $4856, $11794, $25000.� Solar panels (3 types): nominal power: 210, 2100 and 4200 W;
cost: $1488, $14881 and $29762.� Batteries (2 types): capacity: 840 and 1600 W h/day; cost:
$380.3 and $578.7; efficiency: 85%; autonomy: 1 day; minimumdischarge rate: 0.5.� Inverters (3 types): maximum power: 300, 4000 and 5000 W;
cost: $377, $3175 and $4762; efficiency: 85%.� Grid wire: cost: $5/m.� Electricity meter: cost: $50 each.
The considered wind turbines are commercial ones, whose priceincludes a 20 m tower and electronic controllers. The costs of the600 W and 3500 W nominal power wind turbines were suppliedby turbine manufacturers while the 7500 W wind turbine is thesame considered by [2]. Solar panels, batteries and inverters typesand costs are the same considered in [2]. The storage systems aredesigned for 1 day of autonomy, covering possible days of low gen-eration. A standard grid wire cost is assumed for low voltage line[10].
As explained in Section 2.2, users of Santo Antão and Santiagoprojects have similar characteristics and electricity requirements,therefore the same energy and power demands are consideredfor both studies. According to [2], an energy demand of 700 W h/day (taking into account eventual increases in the next years)and a power demand of 200 W are considered for each house.Schools and health centers demands are assumed to be the doubleof the houses demand. Total net energy demands are 126.7 kW h/day and 30.8 kW h/day respectively in Santo Antão and Santiagoprojects. Additionally, the wind resource maps considered in eachproject are those shown in Figs. 3 and 4 (Section 3) and a solar re-source of 4.8 kW h/(m2 day) is assumed (Section 2).
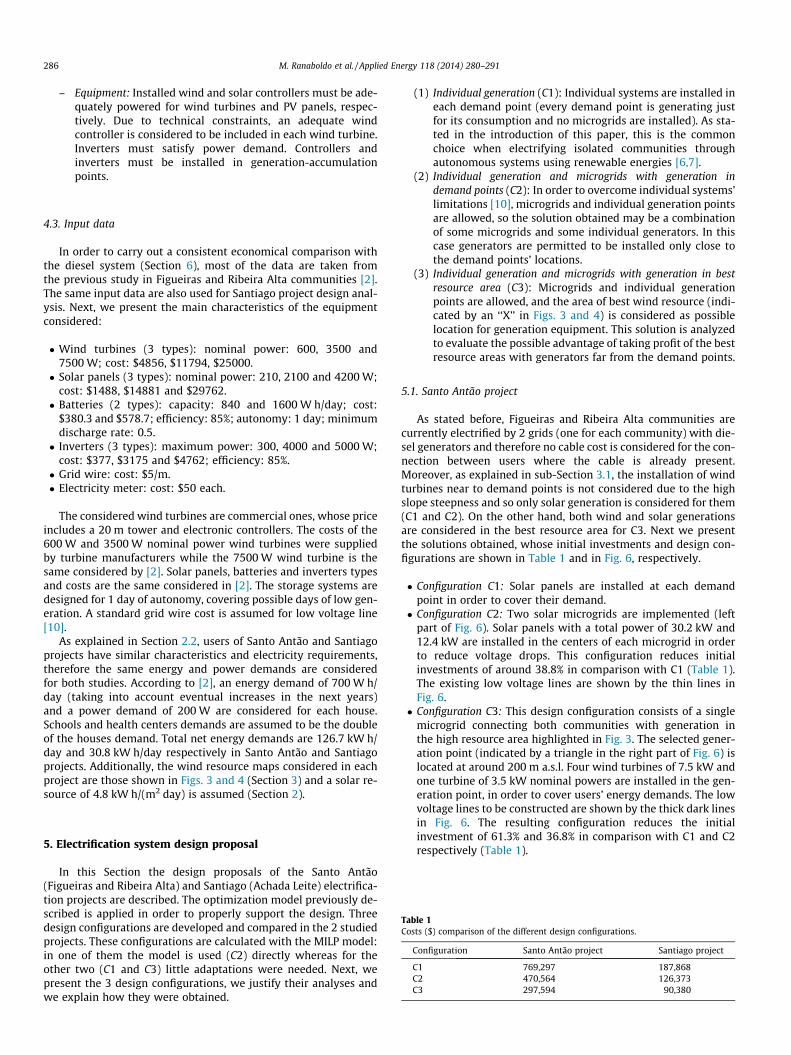
Table 1Costs ($) comparison of the different design configurations.
Configuration Santo Antão project Santiago project
C1 769,297 187,868C2 470,564 126,373C3 297,594 90,380
5. Electrification system design proposal
In this Section the design proposals of the Santo Antão(Figueiras and Ribeira Alta) and Santiago (Achada Leite) electrifica-tion projects are described. The optimization model previously de-scribed is applied in order to properly support the design. Threedesign configurations are developed and compared in the 2 studiedprojects. These configurations are calculated with the MILP model:in one of them the model is used (C2) directly whereas for theother two (C1 and C3) little adaptations were needed. Next, wepresent the 3 design configurations, we justify their analyses andwe explain how they were obtained.
(1) Individual generation (C1): Individual systems are installed ineach demand point (every demand point is generating justfor its consumption and no microgrids are installed). As sta-ted in the introduction of this paper, this is the commonchoice when electrifying isolated communities throughautonomous systems using renewable energies [6,7].
(2) Individual generation and microgrids with generation indemand points (C2): In order to overcome individual systems’limitations [10], microgrids and individual generation pointsare allowed, so the solution obtained may be a combinationof some microgrids and some individual generators. In thiscase generators are permitted to be installed only close tothe demand points’ locations.
(3) Individual generation and microgrids with generation in bestresource area (C3): Microgrids and individual generationpoints are allowed, and the area of best wind resource (indi-cated by an ‘‘X’’ in Figs. 3 and 4) is considered as possiblelocation for generation equipment. This solution is analyzedto evaluate the possible advantage of taking profit of the bestresource areas with generators far from the demand points.
5.1. Santo Antão project
As stated before, Figueiras and Ribeira Alta communities arecurrently electrified by 2 grids (one for each community) with die-sel generators and therefore no cable cost is considered for the con-nection between users where the cable is already present.Moreover, as explained in sub-Section 3.1, the installation of windturbines near to demand points is not considered due to the highslope steepness and so only solar generation is considered for them(C1 and C2). On the other hand, both wind and solar generationsare considered in the best resource area for C3. Next we presentthe solutions obtained, whose initial investments and design con-figurations are shown in Table 1 and in Fig. 6, respectively.
� Configuration C1: Solar panels are installed at each demandpoint in order to cover their demand.� Configuration C2: Two solar microgrids are implemented (left
part of Fig. 6). Solar panels with a total power of 30.2 kW and12.4 kW are installed in the centers of each microgrid in orderto reduce voltage drops. This configuration reduces initialinvestments of around 38.8% in comparison with C1 (Table 1).The existing low voltage lines are shown by the thin lines inFig. 6.� Configuration C3: This design configuration consists of a single
microgrid connecting both communities with generation inthe high resource area highlighted in Fig. 3. The selected gener-ation point (indicated by a triangle in the right part of Fig. 6) islocated at around 200 m a.s.l. Four wind turbines of 7.5 kW andone turbine of 3.5 kW nominal powers are installed in the gen-eration point, in order to cover users’ energy demands. The lowvoltage lines to be constructed are shown by the thick dark linesin Fig. 6. The resulting configuration reduces the initialinvestment of 61.3% and 36.8% in comparison with C1 and C2respectively (Table 1).

Fig. 6. Configurations C2 (left) and C3 (right) for the electrification of Santo Antão project.
Fig. 7. Configurations C2 (left) and C3 (right) for the electrification of Santiago project.
M. Ranaboldo et al. / Applied Energy 118 (2014) 280–291 287
288 M. Ranaboldo et al. / Applied Energy 118 (2014) 280–291
5.2. Santiago project
Next we present the solutions obtained in Santiago project,whose initial investments and design configurations are shownin Table 1 and in Fig. 7, respectively.
� Configuration C1: Due to low wind resource at communitypoints, the best design is obtained by installing solar panels inall demand points.� Configuration C2: A single microgrid with solar generation in a
point located in the center of the community, in order to reducevoltage drops, is obtained (left part of Fig. 7); a total power of10.7 kW is required to cover the all users’ demands. This config-uration reduces initial investments of around 32.7% in compar-ison with C1 (Table 1).� Configuration C3: This design configuration consists of a single
microgrid but with generation about 600 m north from thehouses. The generation point (indicated by a triangle in the rightpart of Fig. 7) is located on the top of a small hill at around100 m a.s.l. One wind turbine of 3.5 kW and another of7.5 kW nominal powers are installed in order to cover users’energy and power demands with the minimum initial invest-ment. The resulting configuration permits the exploitation of agood wind resource and reduces the initial investment of51.9% and 28.5% in comparison with C1 and C2 respectively(Table 1).
6. Economic and environmental assessment
An economic and environmental analysis of the proposed sys-tem is hereby carried out. The following two design configurationsare compared:
– ‘‘Proposed configuration’’: Refers to the design proposed in thisstudy. In both studied projects the most suitable solution is onemicrogrid and generation in best resource area (C3, seeSection 5).
– ‘‘Diesel configuration’’: Consists of a diesel generator and acentralized microgrid connecting the whole community. Thisis the conventional strategy in Cape Verde and the current
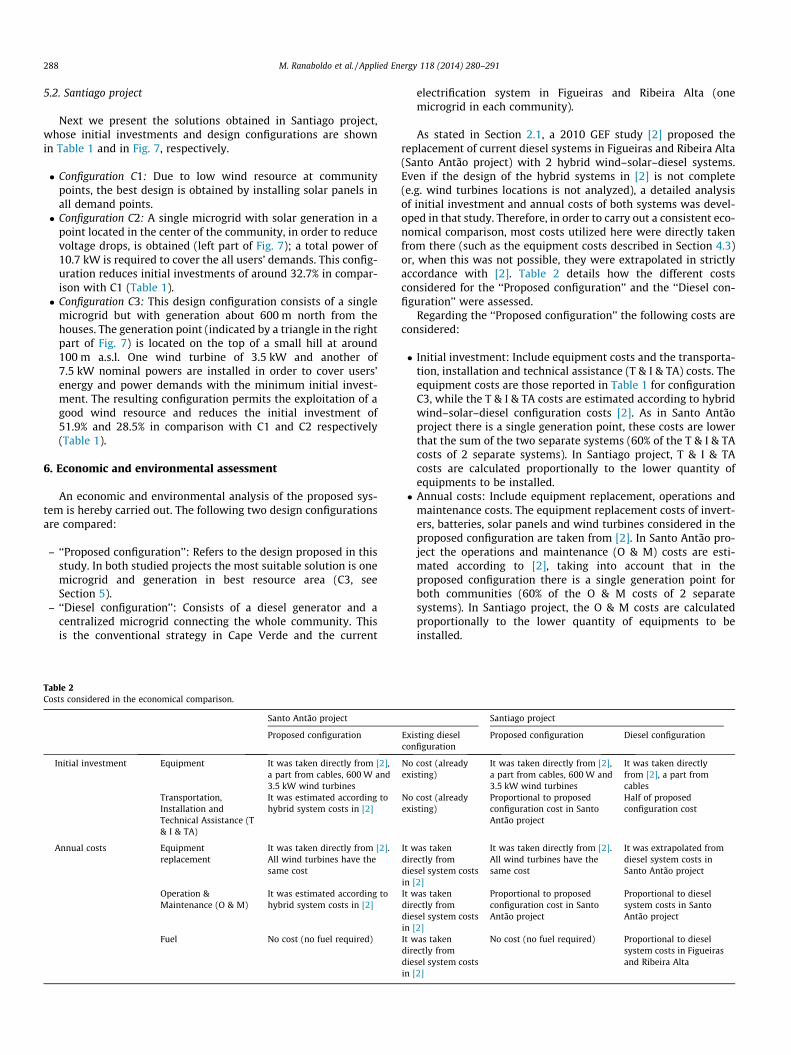
Table 2Costs considered in the economical comparison.
Santo Antão project
Proposed configuration
Initial investment Equipment It was taken directly from [2],a part from cables, 600 W and3.5 kW wind turbines
Transportation,Installation andTechnical Assistance (T& I & TA)
It was estimated according tohybrid system costs in [2]
Annual costs Equipmentreplacement
It was taken directly from [2].All wind turbines have thesame cost
Operation &Maintenance (O & M)
It was estimated according tohybrid system costs in [2]
Fuel No cost (no fuel required)
electrification system in Figueiras and Ribeira Alta (onemicrogrid in each community).
As stated in Section 2.1, a 2010 GEF study [2] proposed thereplacement of current diesel systems in Figueiras and Ribeira Alta(Santo Antão project) with 2 hybrid wind–solar–diesel systems.Even if the design of the hybrid systems in [2] is not complete(e.g. wind turbines locations is not analyzed), a detailed analysisof initial investment and annual costs of both systems was devel-oped in that study. Therefore, in order to carry out a consistent eco-nomical comparison, most costs utilized here were directly takenfrom there (such as the equipment costs described in Section 4.3)or, when this was not possible, they were extrapolated in strictlyaccordance with [2]. Table 2 details how the different costsconsidered for the ‘‘Proposed configuration’’ and the ‘‘Diesel con-figuration’’ were assessed.
Regarding the ‘‘Proposed configuration’’ the following costs areconsidered:
� Initial investment: Include equipment costs and the transporta-tion, installation and technical assistance (T & I & TA) costs. Theequipment costs are those reported in Table 1 for configurationC3, while the T & I & TA costs are estimated according to hybridwind–solar–diesel configuration costs [2]. As in Santo Antãoproject there is a single generation point, these costs are lowerthat the sum of the two separate systems (60% of the T & I & TAcosts of 2 separate systems). In Santiago project, T & I & TAcosts are calculated proportionally to the lower quantity ofequipments to be installed.� Annual costs: Include equipment replacement, operations and
maintenance costs. The equipment replacement costs of invert-ers, batteries, solar panels and wind turbines considered in theproposed configuration are taken from [2]. In Santo Antão pro-ject the operations and maintenance (O & M) costs are esti-mated according to [2], taking into account that in theproposed configuration there is a single generation point forboth communities (60% of the O & M costs of 2 separatesystems). In Santiago project, the O & M costs are calculatedproportionally to the lower quantity of equipments to beinstalled.
Santiago project
Existing dieselconfiguration
Proposed configuration Diesel configuration
No cost (alreadyexisting)
It was taken directly from [2],a part from cables, 600 W and3.5 kW wind turbines
It was taken directlyfrom [2], a part fromcables
No cost (alreadyexisting)
Proportional to proposedconfiguration cost in SantoAntão project
Half of proposedconfiguration cost
It was takendirectly fromdiesel system costsin [2]
It was taken directly from [2].All wind turbines have thesame cost
It was extrapolated fromdiesel system costs inSanto Antão project
It was takendirectly fromdiesel system costsin [2]
Proportional to proposedconfiguration cost in SantoAntão project
Proportional to dieselsystem costs in SantoAntão project
It was takendirectly fromdiesel system costsin [2]
No cost (no fuel required) Proportional to dieselsystem costs in Figueirasand Ribeira Alta
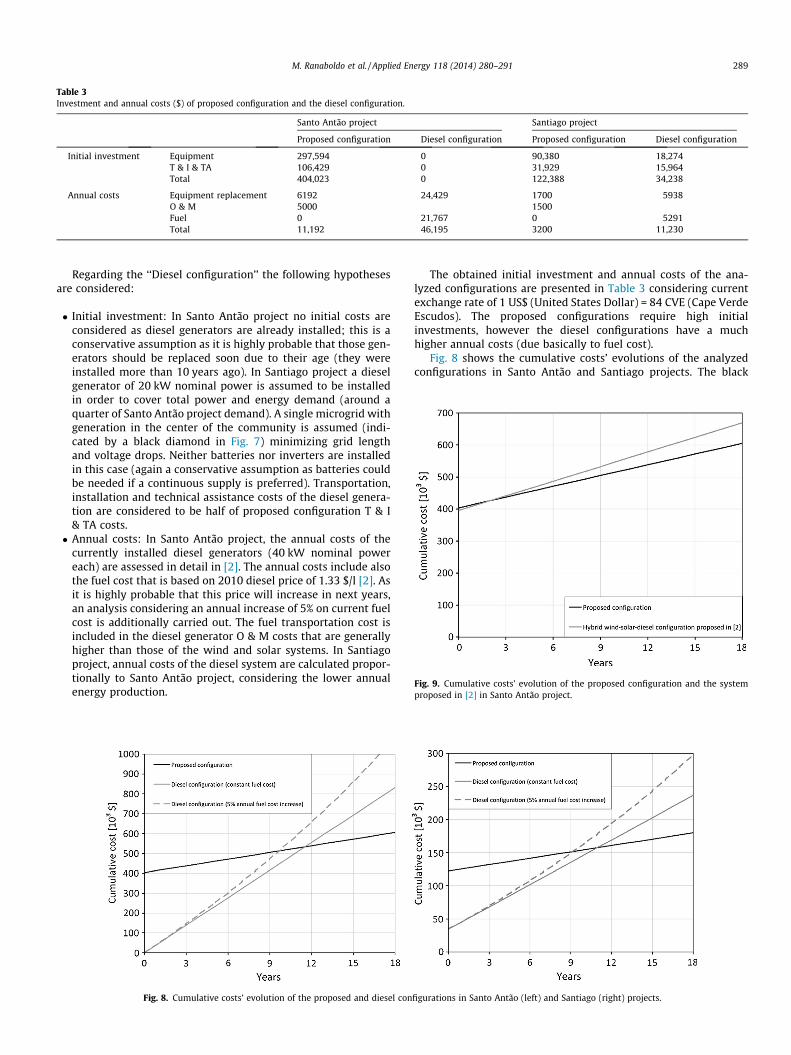
Table 3Investment and annual costs ($) of proposed configuration and the diesel configuration.
Santo Antão project Santiago project
Proposed configuration Diesel configuration Proposed configuration Diesel configuration
Initial investment Equipment 297,594 0 90,380 18,274T & I & TA 106,429 0 31,929 15,964Total 404,023 0 122,388 34,238
Annual costs Equipment replacement 6192 24,429 1700 5938O & M 5000 1500Fuel 0 21,767 0 5291Total 11,192 46,195 3200 11,230
Fig. 9. Cumulative costs’ evolution of the proposed configuration and the systemproposed in [2] in Santo Antão project.
M. Ranaboldo et al. / Applied Energy 118 (2014) 280–291 289
Regarding the ‘‘Diesel configuration’’ the following hypothesesare considered:
� Initial investment: In Santo Antão project no initial costs areconsidered as diesel generators are already installed; this is aconservative assumption as it is highly probable that those gen-erators should be replaced soon due to their age (they wereinstalled more than 10 years ago). In Santiago project a dieselgenerator of 20 kW nominal power is assumed to be installedin order to cover total power and energy demand (around aquarter of Santo Antão project demand). A single microgrid withgeneration in the center of the community is assumed (indi-cated by a black diamond in Fig. 7) minimizing grid lengthand voltage drops. Neither batteries nor inverters are installedin this case (again a conservative assumption as batteries couldbe needed if a continuous supply is preferred). Transportation,installation and technical assistance costs of the diesel genera-tion are considered to be half of proposed configuration T & I& TA costs.� Annual costs: In Santo Antão project, the annual costs of the
currently installed diesel generators (40 kW nominal powereach) are assessed in detail in [2]. The annual costs include alsothe fuel cost that is based on 2010 diesel price of 1.33 $/l [2]. Asit is highly probable that this price will increase in next years,an analysis considering an annual increase of 5% on current fuelcost is additionally carried out. The fuel transportation cost isincluded in the diesel generator O & M costs that are generallyhigher than those of the wind and solar systems. In Santiagoproject, annual costs of the diesel system are calculated propor-tionally to Santo Antão project, considering the lower annualenergy production.
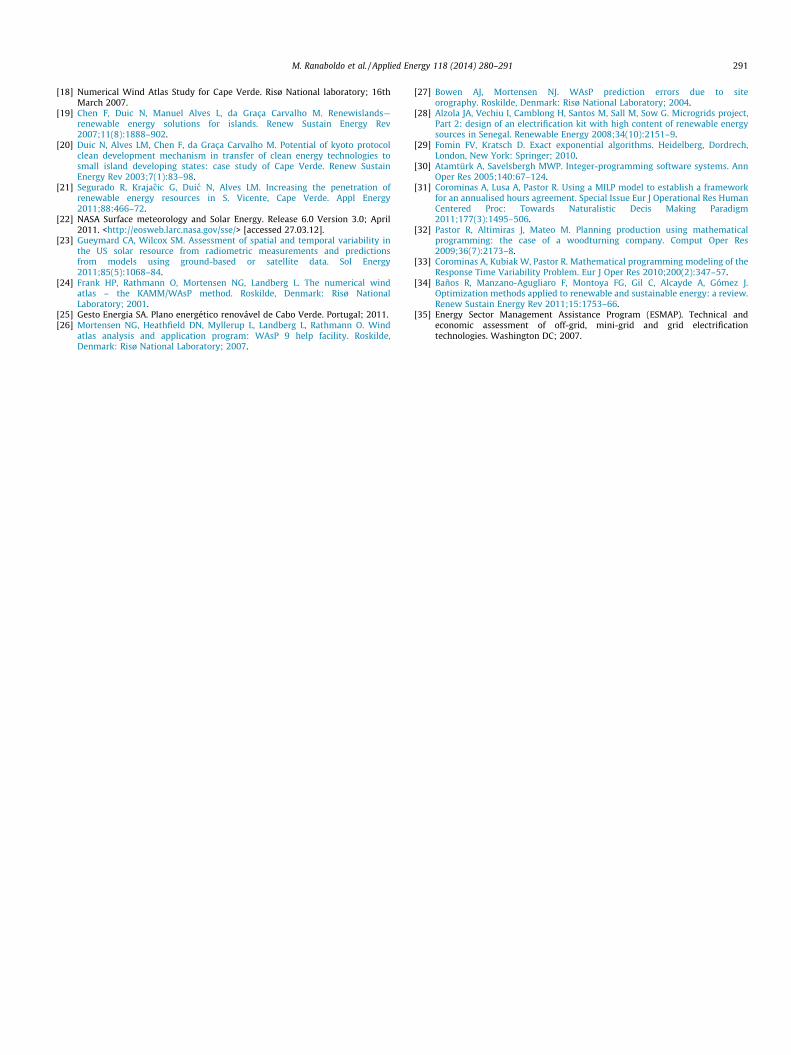
Fig. 8. Cumulative costs’ evolution of the proposed and diesel con
The obtained initial investment and annual costs of the ana-lyzed configurations are presented in Table 3 considering currentexchange rate of 1 US$ (United States Dollar) = 84 CVE (Cape VerdeEscudos). The proposed configurations require high initialinvestments, however the diesel configurations have a muchhigher annual costs (due basically to fuel cost).
Fig. 8 shows the cumulative costs’ evolutions of the analyzedconfigurations in Santo Antão and Santiago projects. The black
figurations in Santo Antão (left) and Santiago (right) projects.

290 M. Ranaboldo et al. / Applied Energy 118 (2014) 280–291
lines represent the proposed configuration while the grey linesrefer to the diesel configuration (the continuous line consideringa constant fuel cost while the dotted lines considering an annualincrease of 5% in fuel cost). The payback times of the proposedconfiguration are 11.5 years and 11 years respectively in SantoAntão and Santiago projects. These payback times decreases to9.7 and 9 years as diesel fuel price increases of 5% annually. There-fore, both proposed electrification projects’ configurations resulteconomically beneficial as the expected lifespan of the project ismuch longer than 12 years. It should be noted that, if the proposedconfiguration in Santo Antão project had been considered since thebeginning of the project design (therefore including the actual ini-tial investments of the diesel systems) its reliability would havebeen further increased. In this case, the payback time of the pro-posed configuration in comparison with the diesel configurationwould have been around 7.5 years.
As stated in Section 2.1, the GEF study [2] could not be consid-ered a complete design analysis due to some limitations, such asthe roughly estimation of wind energy production from a remotemeteorological station (resulting in a much higher wind resourcein comparison with Cape Verde wind atlas [18]) and the lack of tur-bines micro-siting analysis. Even thus, a costs comparison betweenthe hybrid wind–solar–diesel system defined in [2] (grey line) andthe proposed configuration (black line) is shown in Fig. 9. The pro-posed configuration, completely relying on renewable energies, iseconomically beneficial even in comparison with that system: ithas a similar (slightly higher) initial investment cost but a lowerannual cost resulting in a 2 years payback time.
Regarding environmental aspects, hardly assessable in detail, itis known that wind and solar technologies have a low impact; any-how, it should be considered that most critical components arebatteries that contain substances harmful to the environmentand must be correctly recycled. On the other hand, the utilizationof a diesel generator leads to the emission of different contaminantgases, such as SOx, NOx and CO2 [35]. Considering only carbondioxide emission, assuming an emission rate of 0.65 kg CO2/net-kW h [35], the emissions of the diesel generators are around 33.4tCO2 and 8.1 tCO2 per annum respectively in Santo Antão and San-tiago projects, which can be saved by the proposed configurationsbased on renewable energy.
7. Conclusions
In this study, the designs of off-grid electrification projectsbased on hybrid wind-PV energies in 3 rural communities in CapeVerde are analyzed. The studied sites are Figueiras and Ribeira Altain the island of Santo Antão (Santo Antão project), and Achada Leitein the island of Santiago (Santiago project).
Firstly the wind resource assessment is realized analyzing windresource variation at a micro-scale. While solar resource is consid-ered uniform, the detailed wind resource assessment shows highwind variability in all the communities, with low resource withinthem, but greater resource in areas some hundreds meters far. Sec-ondly, a mathematical MILP model for the optimization of the sys-tems design evaluating combination of microgrids and individualgenerators is outlined and applied.
For both projects, three different configurations are studied: (1)all the points with individual generation; (2) microgrids and indi-vidual points are allowed with generation only in demand points;and (3) microgrids and individual points are allowed with genera-tion in areas with best resource (far from demand points). Resultsshow that when generating only in demand points and allowingmicrogrids, two microgrids are formed in Santo Antão Island (onefor Figueiras and one for Ribeira Alta) and one microgrid is formedin Santiago Island (for Achada Leite). These configurations allow
saving more than 30% of the initial investment comparing withindividual generation configurations. Besides, when generating inwindy but remote points, initial investment can be additionally re-duced using more powerful equipment achieving a higher energyproduced/cost ratio: further cost decreases of around 30% were ob-tained in comparison with the configurations that consider onlygeneration in demand points. These finally proposed configura-tions enable a cost reduction of more than 50% in comparison withthe one that considers all individual generation points.
Besides the lack of continuous fuel supply and important reduc-tion in greenhouse gases emissions, the renewable energy systemproposed in this study resulted to be economically beneficial incomparison with a grid based on a diesel generator with a maxi-mum payback time lower than 12 years even in most conservativeanalysis.
Acknowledgments
This paper was supported by the Spanish Ministry of Education(FPU grant AP2009-0738), the MICINN Project ENE2010-15509 andby the Centre for Development Cooperation of the UniversitatPolitècnica de Catalunya. M.R. is very grateful for all the supportprovided by people of the ECREEE office in Praia, to Daniel Graçafor the information on diesel generator grids in Cape Verde, to Gus-tavo Herrera for the treatment of topographic maps and to JoaquinMataix for the consultancy about wind turbines characteristics andcosts. The authors would like to thank the anonymous reviewersfor their valuable comments and suggestions to improve the paper.
References
[1] Briceño-Garmendia CM, Benitez DA. Cape Verde’s infrastructure, a continentalperspective, the World Bank Africa Region Sustainable DevelopmentDepartment. Policy Research Working Paper 5687; 2011.
[2] Raimundo C, Branfield H, Mestre J. Pre-feasibility report for electrification ofFigueiras and Ribeira Alta with hybrid systems. Global Environ Facility 2010.
[3] Erdinc O, Uzunoglu M. Optimum design of hybrid renewable energy systems:overview of different approaches. Renew Sustain Energy Rev2012;16:1412–25.
[4] Zhou W, Lou C, Li Z, Lu L, Yang H. Current status of research on optimum sizingof stand-alone hybrid solar-wind power generation systems. Appl Energy2010;87(2):380–9.
[5] Ferrer-Martí L, Pastor R, Capo M, Velo E. Optimizing microwind ruralelectrification projects. A case study in Peru. J Global Optim 2011;50:127–43.
[6] Leary J, While A, Howell R. Locally manufactured wind power technology forsustainable rural electrification. Energy Policy 2012;43:173–83.
[7] Lemaire X. Off-grid electrification with solar home systems: the experience ofa fee-for-service concession in South Africa. Energy Sustainable Dev2011;15(3):277–83.
[8] Kirubi C, Jacobson A, Kammen DM, Mills A. Community-based electricmicrogrids can contribute to rural development: evidence from Kenya.World Dev 2009;37:1208–21.
[9] Nfah EM, Ngundam JM, Vandenbergh M, Schmid J. Simulation of off-gridgeneration options for remote villages in Cameroon. Renewable Energy2008;33(5):1064–72.
[10] Ferrer-Martí L, Domenech B, García-Villoria A, Pastor R. A MILP model todesign hybrid wind–photovoltaic isolated rural electrification projects indeveloping countries. Eur J Oper Res 2013;226:293–300.
[11] Saheb-Koussa D, Haddadi M, Belhamel M. Economic and technical study of ahybrid system (wind–photovoltaic–diesel) for rural electrification in Algeria.Appl Energy 2009;86(7–8):1024–30.
[12] Bekele G, Tadesse G. Feasibility study of small Hydro/PV/Wind hybrid systemfor off-grid rural electrification in ethiopia. Appl Energy 2012;97:5–15.
[13] Akella AK, Sharma MP, Saini RP. Optimum utilization of renewable energysources in a remote area. Renew Sustain Energy Rev 2007;11:894–908.
[14] Aagreh Y, Al-Ghzawi A. Feasibility of utilizing renewable energy systems for asmall hotel in Ajloun city, Jordan. Appl Energy 2013;103:25–31.
[15] Ranaboldo M, Ferrer-Martí L, Velo E. Micro-scale wind resource assessment foroff-grid electrification projects in rural communities. A case study in Peru. Int JGreen Energy 2014;11(1):75–90. http://dx.doi.org/10(1080/15435075), 2013,769878.
[16] Alzola JA, Vechiu I, Camblong H, Santos M, Sall M, Sow G. Microgrids project,part 2: design of an electrification kit with high content of renewable energysources in Senegal. Renewable Energy 2008;34(10):2151–9.
[17] Lambert TW, Hittle DC. Optimization of autonomous village electrificationsystems by simulated annealing. Sol Energy 2000;68:121–32.
M. Ranaboldo et al. / Applied Energy 118 (2014) 280–291 291
[18] Numerical Wind Atlas Study for Cape Verde. Risø National laboratory; 16thMarch 2007.
[19] Chen F, Duic N, Manuel Alves L, da Graça Carvalho M. Renewislands—renewable energy solutions for islands. Renew Sustain Energy Rev2007;11(8):1888–902.
[20] Duic N, Alves LM, Chen F, da Graça Carvalho M. Potential of kyoto protocolclean development mechanism in transfer of clean energy technologies tosmall island developing states: case study of Cape Verde. Renew SustainEnergy Rev 2003;7(1):83–98.
[21] Segurado R, Krajacic G, Duic N, Alves LM. Increasing the penetration ofrenewable energy resources in S. Vicente, Cape Verde. Appl Energy2011;88:466–72.
[22] NASA Surface meteorology and Solar Energy. Release 6.0 Version 3.0; April2011. <http://eosweb.larc.nasa.gov/sse/> [accessed 27.03.12].
[23] Gueymard CA, Wilcox SM. Assessment of spatial and temporal variability inthe US solar resource from radiometric measurements and predictionsfrom models using ground-based or satellite data. Sol Energy2011;85(5):1068–84.
[24] Frank HP, Rathmann O, Mortensen NG, Landberg L. The numerical windatlas – the KAMM/WAsP method. Roskilde, Denmark: Risø NationalLaboratory; 2001.
[25] Gesto Energia SA. Plano energético renovável de Cabo Verde. Portugal; 2011.[26] Mortensen NG, Heathfield DN, Myllerup L, Landberg L, Rathmann O. Wind
atlas analysis and application program: WAsP 9 help facility. Roskilde,Denmark: Risø National Laboratory; 2007.
[27] Bowen AJ, Mortensen NJ. WAsP prediction errors due to siteorography. Roskilde, Denmark: Risø National Laboratory; 2004.
[28] Alzola JA, Vechiu I, Camblong H, Santos M, Sall M, Sow G. Microgrids project,Part 2: design of an electrification kit with high content of renewable energysources in Senegal. Renewable Energy 2008;34(10):2151–9.
[29] Fomin FV, Kratsch D. Exact exponential algorithms. Heidelberg, Dordrech,London, New York: Springer; 2010.
[30] Atamtürk A, Savelsbergh MWP. Integer-programming software systems. AnnOper Res 2005;140:67–124.
[31] Corominas A, Lusa A, Pastor R. Using a MILP model to establish a frameworkfor an annualised hours agreement. Special Issue Eur J Operational Res HumanCentered Proc: Towards Naturalistic Decis Making Paradigm2011;177(3):1495–506.
[32] Pastor R, Altimiras J, Mateo M. Planning production using mathematicalprogramming: the case of a woodturning company. Comput Oper Res2009;36(7):2173–8.
[33] Corominas A, Kubiak W, Pastor R. Mathematical programming modeling of theResponse Time Variability Problem. Eur J Oper Res 2010;200(2):347–57.
[34] Baños R, Manzano-Agugliaro F, Montoya FG, Gil C, Alcayde A, Gómez J.Optimization methods applied to renewable and sustainable energy: a review.Renew Sustain Energy Rev 2011;15:1753–66.
[35] Energy Sector Management Assistance Program (ESMAP). Technical andeconomic assessment of off-grid, mini-grid and grid electrificationtechnologies. Washington DC; 2007.
Related Documents