Renewable Energy for Sustainable Agriculture (RESA) Renewable Energy Options for Farms and Value-Added Food Producers

Welcome message from author
This document is posted to help you gain knowledge. Please leave a comment to let me know what you think about it! Share it to your friends and learn new things together.
Transcript

Renewable Energy for Sustainable Agriculture (RESA)
Renewable Energy Options for
Farms and Value-Added Food Producers

MREA Overview • 22 years
• Demonstration, Education, Training
• Energy Fair (June 15-17)
• RESA Networking on June 17
• Grow Solar Wisconsin
• Solar Powering Your Community (Oct 10)
• Midwest Solar Training Network
• Site Assessment Certificate
• Solar Thermal Conference (Dec 6-7)
• Offices in Custer and Milwaukee Source: www.midwestrenew.org, www.midwestsolartraining.org

Primer Courses
• Trends in the RE Marketplace
• Renewable Energy Incentives
• Steps to Managing a Successful RE Project
• Electrical Load Analysis
• Renewable Energy Options for Farms and Value-Added Food Producers

Introductory Courses
• Basic Photovoltaics
• Residential PV Site Assessor
• Solar Domestic Hot Water
• Residential Solar Water Site Assessor
• Farm Micro-Power
• Intro to Wind

Advanced Courses
• PV System Design
• PV for Electric Vehicles
• Whole Farm Renewable Energy Design
• Water Pumping with Solar and Wind
• Solar Dehydration
• Solar Aquaponic Systems
• Small Scale Biodigesters
• Solar Process Heating
• Solar Thermal Conceptual Design
• Homebrew Wind
• Electric Tractor Conversion

Why Target Sustainable Ag?
• Large segments already support renewables
• High energy needs and costs (propane, fuel oil)
• Access to additional incentives (REAP, VAPG, Loan)
• Access to renewable resources
• Defined support networks
• Inclined to system design, operation, and maintenance
• Founding and flagship audience

RESA Partners
• Cooperative Development Services
• Environmental Law and Policy Center
• Growing Power
• Institute for Agriculture and Trade Policy
• Organic Valley
• Michael Fields Institute
• Midwest Organic & Sustainable Education Service (MOSES)
• Wisconsin Farmer’s Union

RESA Opportunities
• Education opportunities
• Case studies
• Model installations
• Technical network
• Technical training
• Instructor development
• Partnership network
• Scholarship pool
Solar for Humanity installation with Andy DeRocher of Full Spectrum Solar

US Dept. of Energy SunShot Initiative
Source: http://www1.eere.energy.gov/solar/sunshot/

Nothing is too wonderful
to be true if it be
consistent with the laws
of nature.
-Michael Faraday

Old Model: Centralized Distribution
“If Thomas Edison came back today, he would completely understand our entire grid”
Source: Bill Zarakas, The Brattle Group


Rejected Electrical Generation = 68%
Sources: https://flowcharts.llnl.gov/

System Losses

New Model: Distributed Generation

Distributed Energy = Distributed Benefit
Distributed Energy
Financial Beneficiaries
• Home/business owners
• Local property tax supported entities
• Local lenders
• Local businesses
• Local manufacturers
• Conservation agencies
Centralized Energy
Financial Beneficiaries
•Utility investors
•Energy dependent industries
•Global financiers
•Out of state manufacturers
•Energy distributors
•“Health” industry

Opportunity
Source: Solar Today. Nov/Dec 2011

Source: USGS
Learning from our experience
Production of Rare Earth Elements

Source: Solar Today. Nov/Dec 2011
What about Solyndra??

PV Price Trends by Size
Sources: Barbose, G. et al. 2010. Tracking the Sun III: The Installed Cost of Photovoltaics in the US from 1998-
2009. Lawrence Berkeley National Lab

2010-2011 PV Price Trends by Quarter
Sources: Solar Energy Industries Association. 2012. US Solar Market Insight.

Renewable Energy Projected Prices
Sources: NREL Energy Analysis Office (www.nrel.gov/analysis/docs/cost_curves_2002.ppt) 1These graphs are reflections of historical cost trends NOT precise annual historical data.
Updated: October 2002
Levelized cents/kWh in constant $20001
Wind
1980 1990 2000 2010 2020
PV
CO
E c
en
ts/k
Wh
1980 1990 2000 2010 2020
40
30
20
10
0
100
80
60
40
20
0
Biomass Geothermal Solar thermal
1980 1990 2000 2010 2020 1980 1990 2000 2010 2020 1980 1990 2000 2010 2020
CO
E c
en
ts/k
Wh
10
8
6
4
2
0
70
60
50
40
30
20
10
0
15
12
9
6
3
0

Price Variation by Size (PV)
Sources: Barbose, G. et al. 2010. Tracking the Sun III: The Installed Cost of Photovoltaics in the US from 1998-
2009. Lawrence Berkeley National Lab
Predicting the Future
Sources: Solar Energy Industries Association. 2012. US Solar Market Insight.

Hot Water
Chamomile Nusz

Space Heating
Solar Water Solar Air

Average Annual Solar Insolation

Average Annual Solar Insolation

Average Annual Solar Insolation
http://www.resource-solar.com/solar-energy.php

Agricultural Applications
•Hot water
• Space heating
• Season extension in greenhouses
•Make-up air heating
• Pool heating (e.g., aquaculture)
• Process heating
•Dehumidification
•Crop and wood drying
• Food dehydration

Direct/Open Loop The domestic hot water is
heated in the collector
Passive
No pumps
Indirect/Closed Loop
• A solar fluid is heated in the collector
and a heat exchanger is used to transfer
the solar heat to the DHW
Active
• Involves pumps
Solar Water System Categories
Florida Solar Energy Center Manual http://www2.fsec.ucf.edu/en/industry/resources/solar_thermal/manual/documents/Section_2_SolarWaterHeating.pdf

System Types
Open loop systems have limited use in northern climates,
including:
• Integrated Collector Storage (ICS)
• Flooded systems
• Recirculation systems
• Draindown ystems
Active, closed loop systems have proven most appropriate for
northern climates, including:
• Pressurized glycol systems
• Drainback systems

Evacuated Tube
Flat Plate
Closed Loop Collector Types
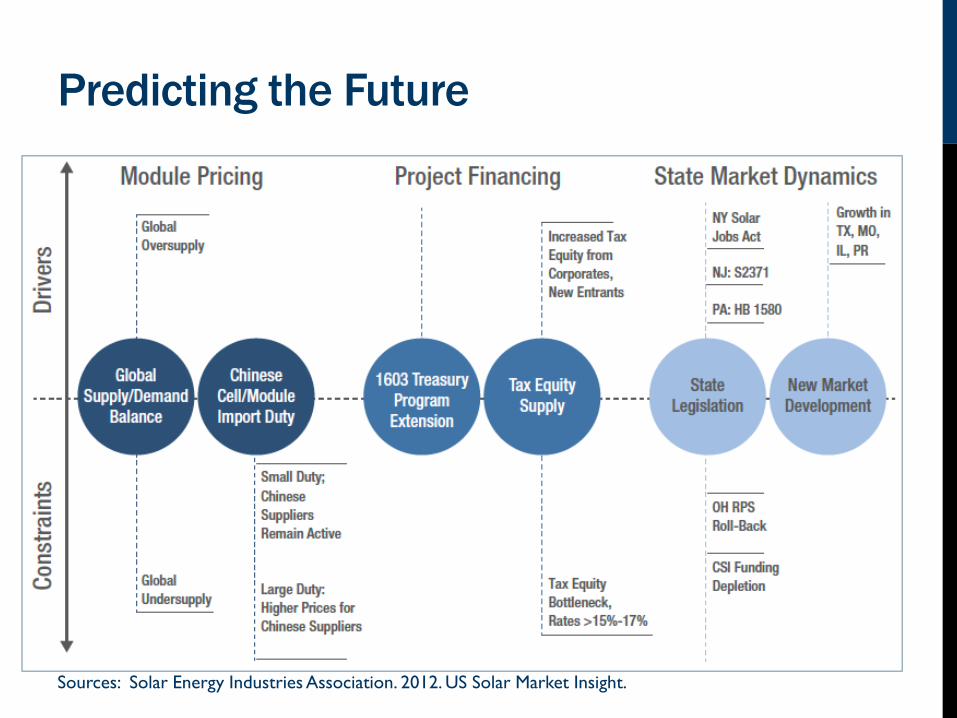
Water Heat
Exchange and
Storage
Pressurized
Glycol
Caleffi Idronics #3

System Design Considerations
Freeze Protection
• Northern climates have extended periods of freezing
weather
• Almost all climates in the US freeze periodically or
occassionally
• Systems either uses a solar fluid that will not freeze or
make sure that water is not exposed to freezing
conditions
Scaling
• Hard water can cause reductions in system efficiency
and can lead to failure

PV Module Types
Source: Talbot-Heindl, Chris. “Types of Modules.” Midwest Renewable Energy Association.
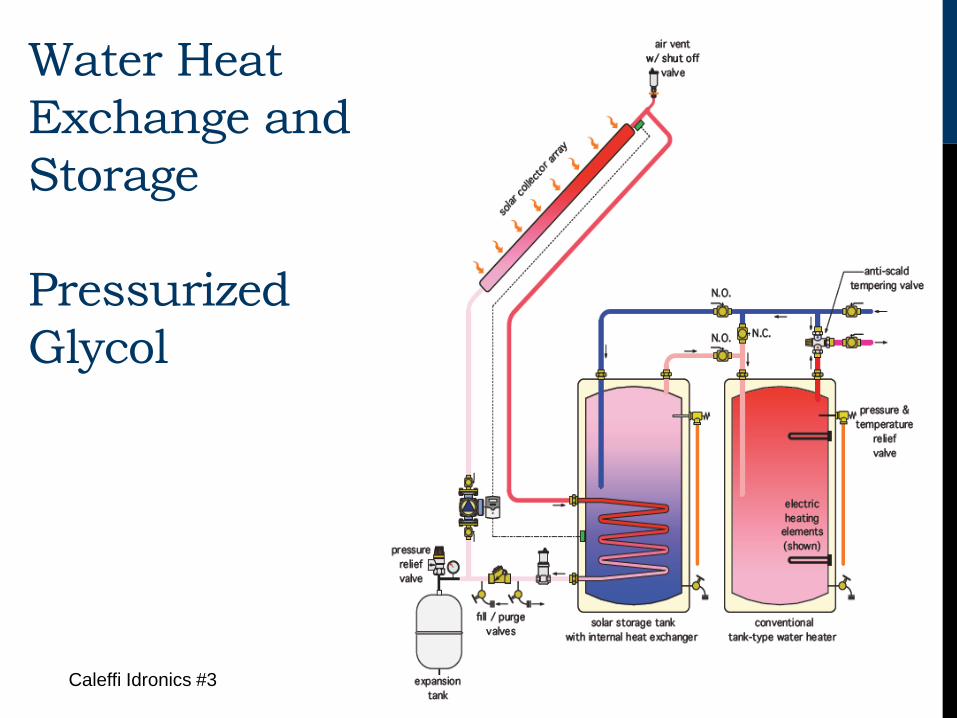
System Types Utility Interactive System
• AKA: Utility Intertied without Batteries
• Simplest System
Bimodal System
• AKA: Utility Intertied with Batteries
• Power all the time
PV Direct System
• Power only when needed
Stand-Alone System
• You are your own utility

PV Direct System – Ag Applications
• Greenhouse Fans
• Dehydrators
• Livestock tanks
• Water pumping

Utility Interactive System
Source: Talbot-Heindl, Chris. “Utility Interactive System.” Midwest Renewable Energy Association.

Prevailing winds. Midwest Renewable Energy Association. 2009.
The Wind Resource

Wind Quality
Annual Variation
Wind Speed Chart REI. Midwest Renewable Energy Association. 2010

Daily Variations
Hourly Wind Speed. 2000. Online image. ndsu.nodak.edu/ndsu/klemen/42_and_84_foot_comparisons. Mar 13 2010.
The Wind Resource

Wind Quality
Min. tower height. Midwest Renewable Energy Association. 2009.
30 ft
30 ft

Wind Quantity
V3 in Wind Power Equation
P = ½ d x A x V3
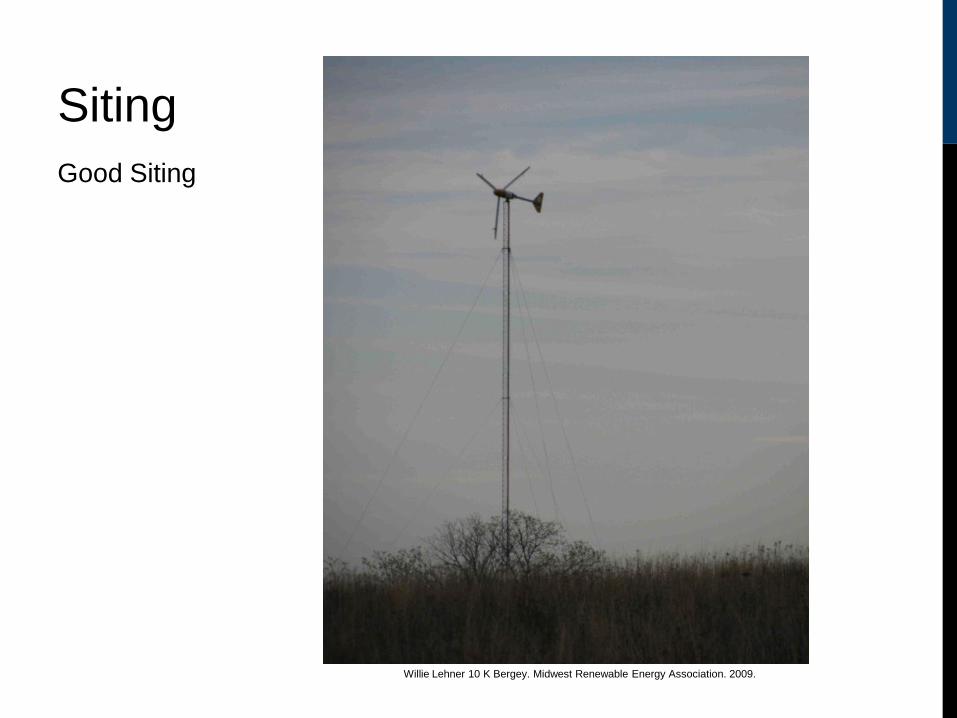
Willie Lehner 10 K Bergey. Midwest Renewable Energy Association. 2009.
Siting
Good Siting

Polonia Machines. Midwest Renewable Energy Association. 2005.
Siting Poor Siting

Energy Efficiency
Cost-Effectiveness of Efficiency
(1) 25 Watt PV Panel
(1) 25 Watt CFL
(100 W Equivalent)

Incentives and Net Cost
Local Net Metering
• Billing arrangement with the electric utility
• Credits electricity generated by a customer as an offset to energy used
• Net = what remains after deductions of energy outflows
• System owner receives retail credit
• Crediting arrangements vary by state and utility

Incentives and Net Cost
Feed-in Tariffs
• Tariffs or rates designed to accelerate renewable resource development
• Provide payment guarantee to producer through long-term power purchase agreement (PPA)
• Set payment based on actual cost of generation plus reasonable return
• Guarantee access to the electric grid
Incentives and Net Cost
Utility financial models
• Programs can include cash back rewards, grants, low-interest loans
• Examples:
• WE Energies Renewable Energy Program
• Interstate Power and Light Efficiency First Cash Back Reward Program

Incentives and Net Cost
Tax Policies
• Tax credits
• Treasury grants
• Depreciation
• Property tax exemptions
• Renewable resource credits
• Rebates
• Tax deductions
• Transfer credits
• Sales tax exemptions

Utility Rates
Three types of utility rates:
• Customer charge
• Energy charge
• Demand charge
Designed to allow the utility to recover its fixed and variable costs.
Varies by group of customers (residential, business, etc.)
Some voluntary rate structures (time-of-use or time-of-day, on-peak or off-peak hours)

Financial Benefits and Financing Three basic methods for modeling cost
• Payback
• Cost of energy comparison (cash flow)
• Return on investment
• Comparing discounted costs
Cost Modeling Tools
• Solar Photovoltaic Financial Dashboard
• www.ncsc.ncsu.edu/include_upload/calculators/solarpv.html
• Renewable Energy Economic & Financial Calculators
• www.ncsc.ncsu.edu/calculators.php
• OnGrid Solar Financial Analysis Tool
• www.ongrid.net/index.php?page=tool_about

Discussion
Jenny Heinzen
Small Wind Training Coordinator
Midwest Renewable Energy Association
715-592-6595, [email protected]
Related Documents