RENEWABLE ENERGY BENEFITS: MEASURING THE ECONOMICS

Welcome message from author
This document is posted to help you gain knowledge. Please leave a comment to let me know what you think about it! Share it to your friends and learn new things together.
Transcript

RENEWABLE ENERGY
BENEFITS:MEASURING THE
ECONOMICS

2
DISCLAIMERThe designations employed and the presentation of materials featured herein are provided on an “as is” basis, for informational purposes only, without any conditions, warranties or undertakings, either express or implied, from IRENA, its officials and agents, including but not limited to warranties of accuracy, completeness and fitness for a particular purpose or use of such content. The information contained herein does not necessarily represent the views of the Members of IRENA, nor is it an endorsement of any project, product or service provider. The designations employed and the presentation of material herein do not imply the expression of any opinion on the part of IRENA concerning the legal status of any region, country, territory, city or area or of its authorities, or concerning the delimitation of frontiers or boundaries.
ACKNOWLEDGEMENTSThis report benefited from contributions and review from a panel of experts: Frank Ackerman (Synapse Energy Economics, USA), Barbara Breitschopf (Fraunhofer Institute, Germany), Vaibhav Chaturvedi (Council on Energy, Environment and Water, India), Paul Ekins (Institute for Sustain-able Resources at University College London, UK) and Sgouris Sgouridis (Masdar Institute, UAE). The E3ME results and analysis were provided by: Hector Pollitt, Eva Alexandri and Ana Gonzalez- Martinez (Cambridge Econometrics, UK). Valuable input was also received from: Henning Wuester, Elizabeth Press, Sakari Oksanen, Dolf Gielen, Deger Saygin, Nicholas Wagner, Paul Komor, Michael Taylor, Ruud Kempener, Asami Miketa, Shunichi Nakada and Fatma BenFadhl (IRENA) and Imen Gherboudj (Masdar Institute, UAE).
IRENA would like to extend its gratitude to the Government of Germany for supporting this publication.
AUTHORSRabia Ferroukhi, Alvaro Lopez-Peña, Ghislaine Kieffer, Divyam Nagpal, Diala Hawila, Arslan Khalid, Laura El-Katiri, Salvatore Vinci and Andres Fernandez (IRENA).
For further information or to provide feedback, please contact IRENA, P.O. Box 236, Abu Dhabi, United Arab Emirates; Email: [email protected]
Material in this publication may be freely used, shared, copied, reproduced, printed and/or stored, provided that all such material is clearly attributed to IRENA and bears a notation that it is subject to copyright (© IRENA 2016).
Material contained in this publication attributed to third parties may be subject to third-party copy-right and separate terms of use and restrictions, including restrictions in relation to any commercial use.
This publication should be cited as: IRENA (2016), ‘Renewable Energy Benefits: Measuring The Economics’. IRENA, Abu Dhabi.
COPYRIGHT © IRENA 2016
Unless otherwise stated, this publication and material
featured herein are the property of IRENA and are
subject to copyright by IRENA.
ABOUT IRENA
The International Renewable Energy Agency (IRENA) is an intergovernmental organisa-tion that supports countries in their transition to a sustainable energy future, and serves as the principal platform for international co-operation, a centre of excellence, and a re-pository of policy, technology, resource and financial knowledge on renewable energy. IRENA promotes the widespread adoption and sustainable use of all forms of renewable energy, including bioenergy, geothermal, hydropower, ocean, solar and wind energy, in the pursuit of sustainable development, energy access, energy security and low-carbon economic growth and prosperity.
www.irena.org
3
FOREWORD
Accelerating the transition to a renewables-based energy system represents a unique opportunity
to meet climate goals while fueling economic growth, creating new employment opportunities and
enhancing human welfare. The world is united in the commitment to realise this opportunity, attested
by the inclusion of renewable energy targets both in the energy plans of 164 countries as well as in the
Nationally Determined Contributions (NDC) that will drive the implementation of the Paris Agreement
on climate. Decisions on energy sector investments made today will influence economic growth and
development for the coming decades. They will also define our ability to decarbonise energy, an
essential element of action on climate change. The transition to a renewables-based system can help
meet this objective, while generating new sources of growth, increasing incomes, creating jobs and
improving the health and wellbeing of millions.
The need for scaling up renewables is now undisputed, and the full range of benefits they can bring has
come to the fore in global discussions. As countries consider options at their disposal, understanding
the socio-economic benefits of the transition to a renewable energy future is of vital importance.
Renewable Energy Benefits: Measuring the Economics provides the first global quantification of
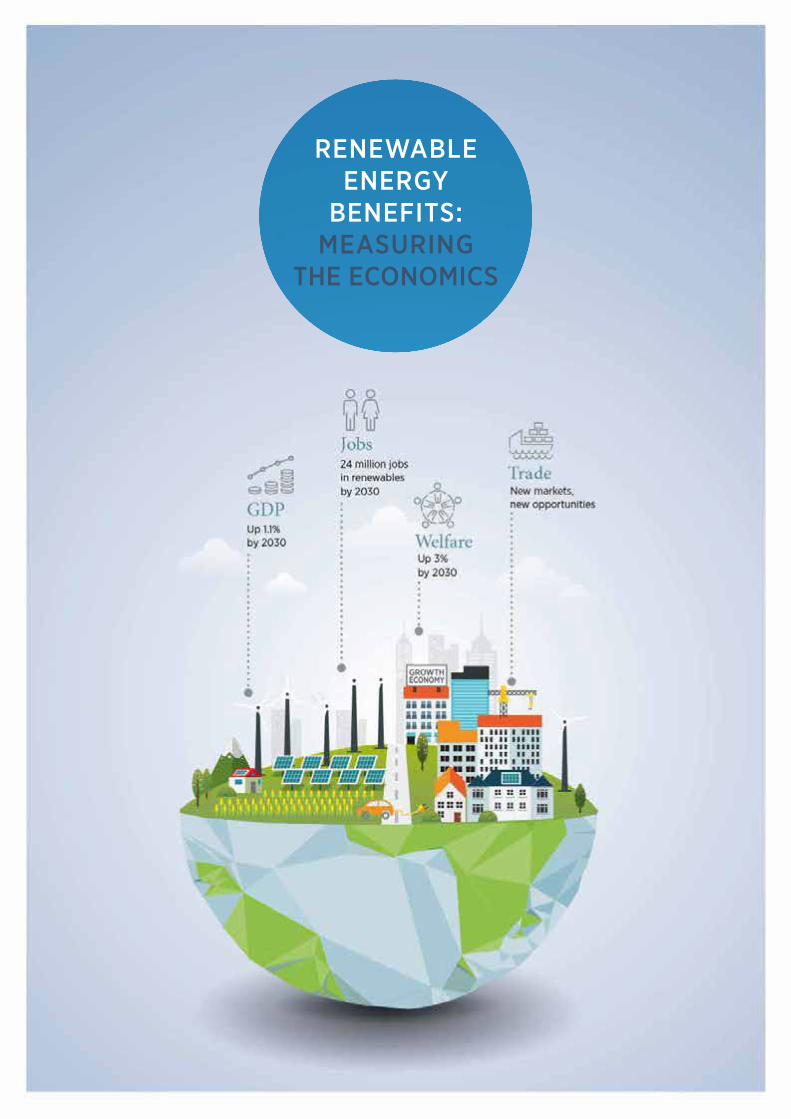
the macroeconomic impacts of renewable energy deployment. It finds that doubling the share of
renewables by 2030 would bring a range of positive impacts including an increase in global gross
domestic product (GDP) up to 1.1 percent, improvement of global welfare by 3.7 percent and over
24 million people working in the renewable energy sector.
This report provides the latest evidence that mitigating climate change through the deployment of
renewable energy and achieving other socio-economic objectives are mutually beneficial. Thanks
to the growing business case for renewable energy, an investment in one is an investment in both.
A full understanding of these benefits can tip the balance towards low-carbon investments and
future-proof our energy system.
A Renewable Energy Roadmap
Adnan Z. AminDirector-General
International Renewable Energy Agency
RENEWABLE ENERGY
BENEFITS:MEASURING THE
ECONOMICSA Renewable Energy Roadmap

FOREWORD . . . . . . . . . . . . . . . . . . . . . . . . . . . . . . . . . . . . . . . . . . . . . . . . . . . . . . . . . . . . . . . . . . . . . . . . . . .3
EXECUTIVE SUMMARY . . . . . . . . . . . . . . . . . . . . . . . . . . . . . . . . . . . . . . . . . . . . . . . . . . . . . . . . . . . 8
01 INTRODUCTION 12
1.1 EXISTING KNOWLEDGE . . . . . . . . . . . . . . . . . . . . . . . . . . . . . . . . . . . . . . . . . . . . . . . . . . . . . . . . . 15
1.2 OBJECTIVES OF THIS STUDY . . . . . . . . . . . . . . . . . . . . . . . . . . . . . . . . . . . . . . . . . . . . . . . . . . . 17
1.3 APPROACH USED FOR THIS STUDY . . . . . . . . . . . . . . . . . . . . . . . . . . . . . . . . . . . . . . . . . . . . . 20
02 ASSESSING ECONOMIC IMPACTS OF INCREASED RENEWABLE ENERGY DEPLOYMENT 22
2.1 RENEWABLES DEPLOYMENT INCREASES GLOBAL GDP . . . . . . . . . . . . . . . . . . . . . . . . 24
2.2 RENEWABLE ENERGY IMPROVES WELFARE . . . . . . . . . . . . . . . . . . . . . . . . . . . . . . . . . . . . 31
2.3 DOUBLING RENEWABLES CREATES MORE JOBS . . . . . . . . . . . . . . . . . . . . . . . . . . . . . . . 38
2.4 A HIGHER SHARE OF RENEWABLES SHIFTS PATTERNS OF GLOBAL TRADE . . . . 45
2.5 CONCLUDING REMARKS . . . . . . . . . . . . . . . . . . . . . . . . . . . . . . . . . . . . . . . . . . . . . . . . . . . . . . . . 53
03 MEASURING BENEFITS: METHODOLOGY AND ANALYSIS 54
3.1 METHODOLOGY . . . . . . . . . . . . . . . . . . . . . . . . . . . . . . . . . . . . . . . . . . . . . . . . . . . . . . . . . . . . . . . . 55
3.2 VARIABLES ANALYSED . . . . . . . . . . . . . . . . . . . . . . . . . . . . . . . . . . . . . . . . . . . . . . . . . . . . . . . . . 62
3.3 SENSITIVITY ANALYSIS . . . . . . . . . . . . . . . . . . . . . . . . . . . . . . . . . . . . . . . . . . . . . . . . . . . . . . . . . 67
3.4 MAIN LIMITATIONS . . . . . . . . . . . . . . . . . . . . . . . . . . . . . . . . . . . . . . . . . . . . . . . . . . . . . . . . . . . . . 71
3.5 KEY FINDINGS AND WAY FORWARD . . . . . . . . . . . . . . . . . . . . . . . . . . . . . . . . . . . . . . . . . . . 75
04 THE WAY FORWARD 76
TABLE OF CONTENTS
01
02
03
04
Table of contents . . . . . . . . . . . . . . . . . . . . . . . . . . 5
Lists of figures, tables and boxes . . . . . . . . . . . . 6
Abbreviations . . . . . . . . . . . . . . . . . . . . . . . . . . . . . 6
References . . . . . . . . . . . . . . . . . . . . . . . . . . . . . 82
Annex 1: Detailed description of the E3ME tool . . . . . . . . . . . . . . . . . . . . . . . . . . 85
Annex 2: Methods to estimate socio-economic impacts . . . . . . . . . . . . . . . . . . 89

6
ABBREVIATIONS
CEM Clean Energy Ministerial
CGE Computable general equilibrium
CO2 Carbon dioxide
COP Conference of the Parties
EU European Union
GDP Gross domestic product
GHG Greenhouse gas
GJ Gigajoules
GW Gigawatt
HDI Human Development Index
IMF International Monetary Fund
IEA International Energy Agency
IRENA International Renewable Energy Agency
LCOE Levelised Cost of Electricity
MW Megawatt
O&M Operations and maintenance
OECD Organisation for Economic Co-operation and Development
PV Photovoltaic
R&D Research and development
RE Renewable energy
SE4ALL United Nations Sustainable Energy for All initiative
UN United Nations
UNDP United Nations Development Programme
UNEP United Nations Environment Programme
USD U.S. dollar
WEO World Energy Outlook
LIST OF FIGURES
Figure 1: Conceptual framework for analysing the socio-economic e�ects of large-scale renewable energy deployment . . . . . . . . . . . . . . . . . 14
Figure 2: Basic structure of the E3ME tool used for the analysis . . . . . . . . . . . . . . . . . . . . . . . . . . . . . 21
Figure 3: GDP impacts (2030 GDP size, % change vs the Reference Case) . . . . . . . . . . . . . . . 26
Figure 4: National welfare impacts (% di�erence from the Reference Case) . . . . . . . . . . 35
Figure 5: Renewable energy employment in selected countries as of 2014 (thousand jobs) . . . . . . . . . . . . 38
Figure 6: Estimated employment in the renewable energy sector (million jobs) . . . . . . . . . . . . . . . . . . . 40
Figure 7a Changes in trade balance in the REmap and 7b: and REmapE Cases
(% di�erence from Reference Case) . . . . . . . . . . . . . 46
Figure 8: Net imports of fossil fuels in the Reference, REmap and REmapE Cases (USD billion, 2015) . . . . 48
Figure 9: Segments of a wind energy project value chain. . . . . . . . . . . . . . . . . . . . . . . . . . . . . . . . . 50
Figure 10: Basic structure of the E3ME tool used for the analysis . . . . . . . . . . . . . . . . . . . . . . . . . . . . . 57
Figure 11: Main mechanisms in the E3ME tool. . . . . . . . . . . . . . 58
Figure 12: Welfare indicator proposed, including the three dimensions of welfare, the sub-indicators and their weights . . . . . . . . . . . . 63
Figure 13: Methodology used for renewable energy jobs estimation . . . . . . . . . . . . . . . . . . . . . . . 65
Figure 14: Impacts of crowding out of capital (2030 GDP size, % change vs the Reference Case) . . . . . . . . . . . . . . . . . . . . . . . . . 69

LIST OF TABLES
Table 1: Impact on welfare in main cases showing sensitivity with full crowding out (% from the Reference Case) . . . . . . . . . . . . . . . . 34
Table 2: Jobs in renewable energy in 2030 by country (million jobs) . . . . . . . . . . . . . . . . . . . . 41
Table 3: Estimated direct and indirect employment in the renewable energy sector by technology (million jobs) . . . . . . . . . . . . . . . . . . . 42
Table 4: Distribution of renewable energy jobs along the various segments of value chain (million jobs) . . . . . . . . . . . . . . . . . . . . . . . . . . . . . 43
Table 5: Global employment in the energy sector in 2030 (million people) . . . . . . . . . . . . . . . . . . . . 44
Table 6: Structure of exogenous variables in the main cases . . . . . . . . . . . . . . . . . . . . . . . . . 60
Table 7: Main inputs and outputs in the analysis . . . . . . . . 61
Table 8: Structure of the sensitivity analysis . . . . . . . . . . . 67
LIST OF BOXES
Box 1: IRENA’s work on Renewable Energy Benefits . . . . . . . . . . . . . . . . . . . . . . . . . . . . 13
Box 2: Previous studies on the projected economic impacts of renewable energy deployment . . . . . . 16
Box 3: An overview of REmap 2030: A Renewable Energy Roadmap . . . . . . . . . . . . . . . 18
Box 4: E3ME, the tool used for this study . . . . . . . . . . . . . 20
Box 5: How do the study results compare with other studies? . . . . . . . . . . . . . . . . . . . . . . . . . . . . . 25
Box 6: Di�erences between GDP impacts in REmap and REmapE . . . . . . . . . . . . . . . . . . . . . . 25
Box 7: Financial crowding out can significantly a�ect GDP results . . . . . . . . . . . . . . . . . . . . . . . . . . 27
Box 8: Impact of fossil fuel production, trade and electricity prices on GDP growth . . . . . . . . . . . . . . 28
Box 9: IRENA initiatives to improve renewable energy project planning . . . . . . . . . . . . . . . . . . . . . . . . . . . 29
Box 10: Sectoral impacts in the two REmap Cases . . . . . . . 30
Box 11: GDP and other measures of welfare . . . . . . . . . . . . 32
Box 12: Role of renewables in achieving universal access to modern energy services . . . . . . . . . . . . . 36
Box 13: IRENA’s work on renewable energy employment . . . . . . . . . . . . . . . . . . . . . . . . 37
Box 14: Developing a local wind energy industry – Insights from IRENA’s forthcoming report Renewable Energy Benefits: Leveraging Local Industries . . . . . . . . . . . . . . . . . . 50
Box 15: Relationship between economic sectors and value chain segments . . . . . . . . . . . . . . . . . . . 64
Box 16: Impact of renewable energy deployment on water use in the power sector . . . . . . . . . . . . . . 72
7
RENEWABLE ENERGY
BENEFITS:MEASURING
THE ECONOMICS

9
Renewable Energy Benefits: Measuring the Economics provides the first quantification of the macroeconomic impact of doubling the global share of renewables in the energy mix by 2030. The adoption of the Sustainable
Development Goals and the Paris Agreement sent
a clear message that the transition to sustainable
energy is central to meeting development and
climate objectives. As policy makers consider
options at their disposal, understanding the
socio-economic benefits of this transition is of
vital importance. To inform international debate
and facilitate sound decision-making, Renewable
Energy Benefits: Measuring the Economics
provides the first global analysis of the impact of
renewable energy deployment on the economy
and the interdependencies between sectors and
markets.
The study analyses the linkages between the
energy system and the world’s economies
within a single quantitative framework. It
builds on IRENA’s previous work on the socio-
economic benefits of renewable energy and
IRENA’s roadmap for doubling the global share
of renewables, REmap 2030. It finds that, within
the timeline of the Sustainable Development
Goals, renewable energy can o¨er solutions for
the dual objective of ensuring economic growth
and the imperative to decarbonise economies
across the globe.
Accelerating the deployment of renewable energy will fuel economic growth, create new employment opportunities, enhance human welfare, and contribute to a climate- safe future. Advances in renewable energy
technologies and growing cost-competitiveness
have strengthened the business case of
renewables and opened new opportunities for
countries to transform their energy systems.
This study demonstrates that the benefits
of scaling up renewable energy surpass cost
competitiveness. Increased deployment can
meet the energy needs of a growing population,
drive development and improve well-being,
while reducing greenhouse gas emissions
and increasing natural resource productivity.
It provides empirical evidence that economic
growth and environmental conservation are
fully compatible, and that the conventional
consideration of trade-o¨s between the two is
outdated and erroneous.
EXECUTIVE SUMMARY
EXECUTIVE SUMMARY

1 0
Doubling the share of renewables in the global energy mix by 2030 would increase global GDP by up to 1.1% or USD 1.3 trillion. The report shows that
such a transition increases global GDP in
2030 between 0.6 % and 1.1%, or be-
tween around USD 700 billion and
USD 1.3 trillion compared to business as
usual. Most of these positive impacts on
GDP are driven by the increased invest-
ment in renewable energy deployment,
which triggers ripple effects through-
out the economy. If the doubling of the
renewable share is achieved through a
higher rate of electrification of final
energy uses, the increase in global
GDP is even higher, amounting to some
1.1%, or USD 1.3 trillion globally.
Improvements in human well-being and welfare would go far beyond gains in GDP. The benefits of renewables reach
well beyond the traditional and limited
measurements of economic performance.
Doubling the share of renewables by
2030 has a positive impact on global
welfare, which increases by 2.7 % com-
pared to a 0.6% GDP improvement. If
achieved through higher electrification
of heat and transport, global welfare
would further rise by 3.7%. A combined
indicator for welfare considers a number
of factors including:
• Economic impacts based on
consumption and investment;
• Social impacts based on expenditure
on health and education; and
• Environmental impacts, measured
as greenhouse gas emissions and
materials consumption.
Doubling the share of renewables increases direct and indirect employ-ment in the sector to 24.4 million by 2030. Renewable energy jobs will grow
across all technologies, with a high con-
centration in the same technologies that
account for a majority of the employment
today, namely bioenergy, hydropower
and solar. Along the renewable energy
value chain, most renewable energy jobs
will come from fuel supply (bioenergy
feedstocks), installations and equipment
manufacturing.
EXECUTIVE SUMMARY RENEWABLE ENERGY BENEFITS: MEASURING THE ECONOMICS
Given the distributed and labour-intensive nature of renewable energy, direct and indirect employment in the renewable energy sector could reach 24.4 million people in 2030.
Jobs
JobsRenewable energy improves human well-being and overall welfare well beyond GDP.
Welfare
GDP
TradeEmployment
Doubling the share of renewables in the global energy mix increases global GDP in 2030 by up to 1.1%, equivalent to USD 1.3 trillion.
Welfare
GDP
TradeEmployment
Welfare
GDP
TradeEmployment
Welfare
GDP
TradeEmployment
Welfare
GDP
TradeEmployment
Welfare
GDP
TradeEmploymentWelfare
GDP
TradeEmployment
1 1
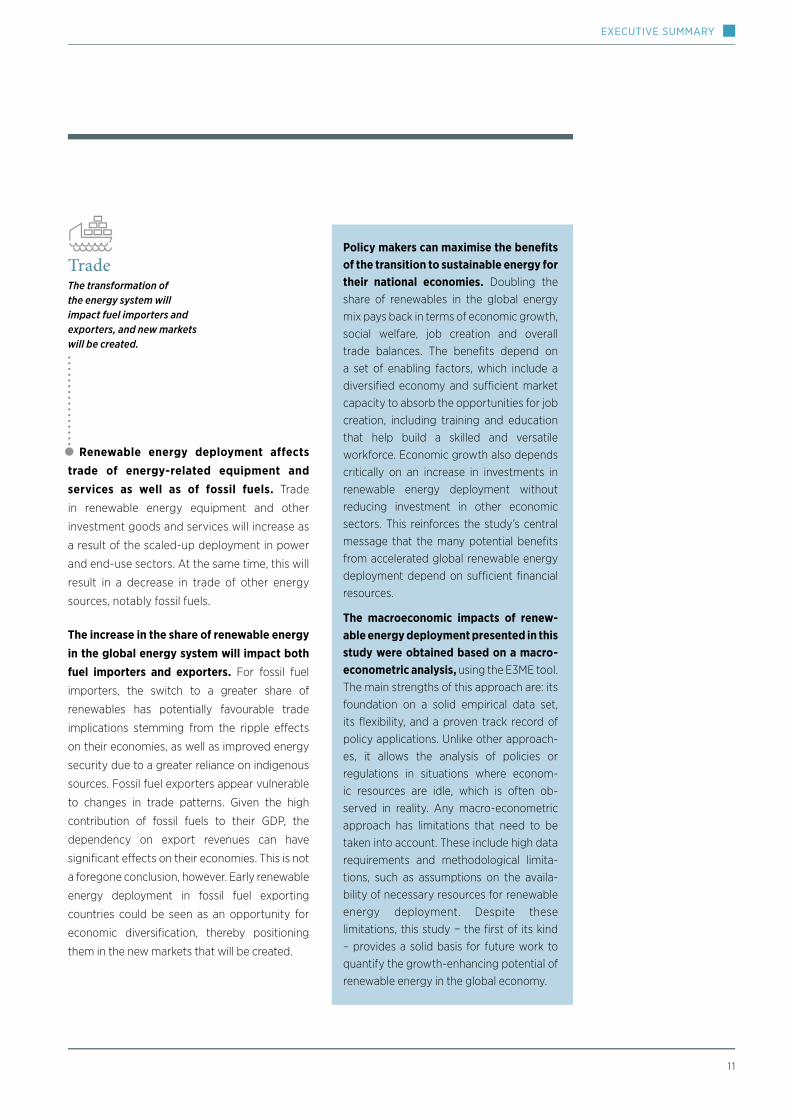
Renewable energy deployment affects trade of energy-related equipment and services as well as of fossil fuels. Trade
in renewable energy equipment and other
investment goods and services will increase as
a result of the scaled-up deployment in power
and end-use sectors. At the same time, this will
result in a decrease in trade of other energy
sources, notably fossil fuels.
The increase in the share of renewable energy in the global energy system will impact both fuel importers and exporters. For fossil fuel
importers, the switch to a greater share of
renewables has potentially favourable trade
implications stemming from the ripple e¨ects
on their economies, as well as improved energy
security due to a greater reliance on indigenous
sources. Fossil fuel exporters appear vulnerable
to changes in trade patterns. Given the high
contribution of fossil fuels to their GDP, the
dependency on export revenues can have
significant e¨ects on their economies. This is not
a foregone conclusion, however. Early renewable
energy deployment in fossil fuel exporting
countries could be seen as an opportunity for
economic diversification, thereby positioning
them in the new markets that will be created.
Policy makers can maximise the benefits of the transition to sustainable energy for their national economies. Doubling the share of renewables in the global energy mix pays back in terms of economic growth, social welfare, job creation and overall trade balances. The benefits depend on a set of enabling factors, which include a diversified economy and su«cient market capacity to absorb the opportunities for job creation, including training and education that help build a skilled and versatile workforce. Economic growth also depends critically on an increase in investments in renewable energy deployment without reducing investment in other economic sectors. This reinforces the study’s central message that the many potential benefits from accelerated global renewable energy deployment depend on su«cient financial resources.
The macroeconomic impacts of renew- able energy deployment presented in this study were obtained based on a macro- econometric analysis, using the E3ME tool. The main strengths of this approach are: its foundation on a solid empirical data set, its flexibility, and a proven track record of policy applications. Unlike other approach-es, it allows the analysis of policies or regulations in situations where econom-ic resources are idle, which is often ob-served in reality. Any macro-econometric approach has limitations that need to be taken into account. These include high data requirements and methodological limita-tions, such as assumptions on the availa-bility of necessary resources for renewable energy deployment. Despite these limitations, this study − the first of its kind – provides a solid basis for future work to quantify the growth-enhancing potential of renewable energy in the global economy.
The transformation of the energy system will impact fuel importers and exporters, and new markets will be created.
Welfare
Trade
EXECUTIVE SUMMARY
Welfare
GDP
TradeEmployment

INTRODUCTION
01
13
INTRODUCTION 01
Energy fuels global economic activity. As populations expand, living standards improve and consumption rises, total demand for energy is expected to increase by 21% by 2030 (IEA, 2015). At the same time, growing concerns over climate change are prompting governments worldwide to seek ways to supply energy while minimising greenhouse gas emissions and other environmental impacts. Decisions made today on energy sector investments and infrastructure lock in associated costs and benefits for at least a few decades. They also strongly influence how e¨ectively the energy sector underpins growth across the economy.
The energy sector influences the vibrancy and sustainability of the entire economy – from job creation to resource e«ciency and the environment. Major shifts in the sector can have a strong ripple e¨ect throughout the economy as evidenced in Japan following the 2011 earthquake, or by the recent volatility in oil prices. Making the energy supply more cost-e¨ective, reliable, secure and environmentally sustainable thus contributes to the long-term resilience of economic development.
The deployment of renewable energy technologies has seen remarkable growth in recent decades, supported by enabling policies and steep cost reductions. Improved energy security, fewer adverse climate change impacts and broader energy access are widely viewed as motivations for this increase. The business case for renewable energy is further strengthened by the socioeconomic benefits it can o¨er.
As many economies continue to struggle to regain momentum, policy makers are increasingly interested in the potential benefits of renewable energy deployment on
economic growth and job creation. However, further analysis and empirical evidence on this important subject is still needed. IRENA has been pioneering work in this field since 2011 (see Box 1). For example, it has recently
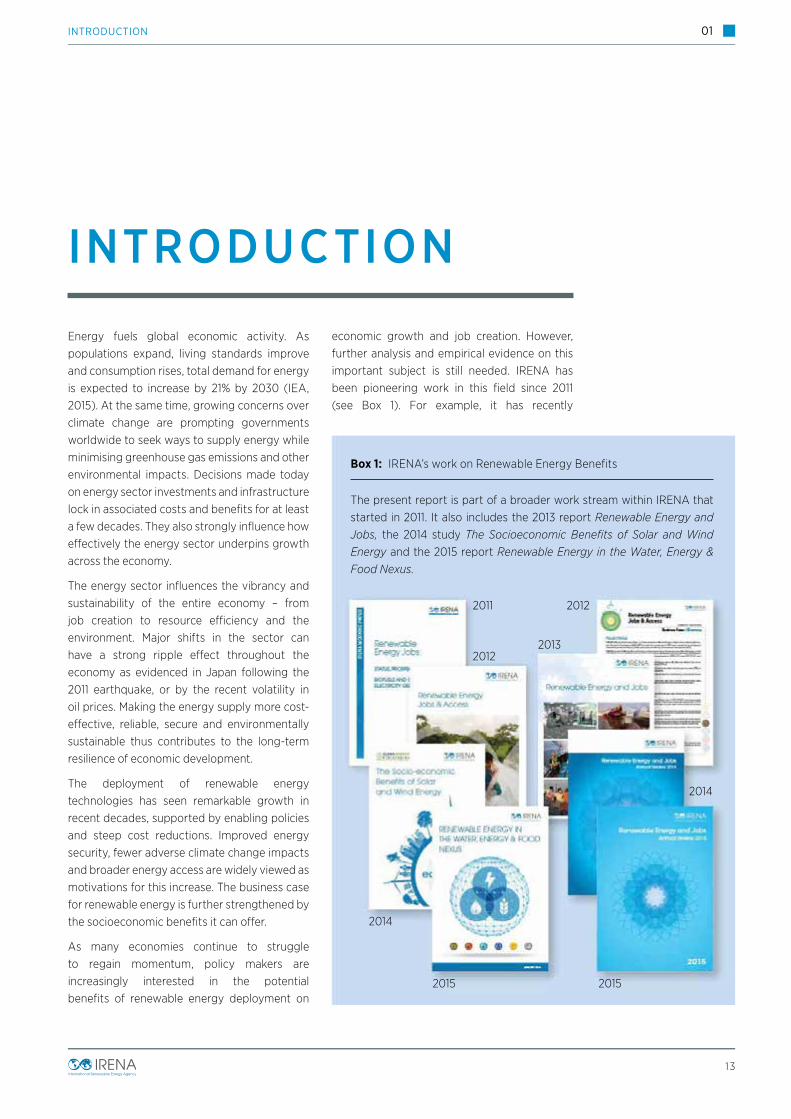
Box 1: IRENA’s work on Renewable Energy Benefits
The present report is part of a broader work stream within IRENA that started in 2011. It also includes the 2013 report Renewable Energy and Jobs, the 2014 study The Socioeconomic Benefits of Solar and Wind Energy and the 2015 report Renewable Energy in the Water, Energy & Food Nexus.
2011 2012
2014
20132012
2015 2015
2014
INTRODUCTION

14
RENEWABLE ENERGY BENEFITS: MEASURING THE ECONOMICS01
Socio-economic e�ects of large-scale renewable energy
Macroeconomice�ects
Distributionale�ects
Energy system-related e�ects
Additionale�ects
GrossImpacts
NetImpacts Positive Negative Benefits Costs Benefits Costs
Variables analysed in this report:
• Gross domestic product• Welfare• Employment• Trade balance (including trade in energy products, domestic production and trade in equipment).
Variables forfuture analysis:
• Types of owners• Regional distribution• Impacts across energy consumers and tax payers
Variables forfuture analysis:
• Additional generation and balancing costs• Additional grid and transaction costs• Externalities
Variables forfuture analysis:
• Risk reduction• Others
Figure 1: Conceptual framework for analysing the socio-economic e¨ects of large-scale renewable energy deployment.
estimated that the global renewable energy sector employs as many as 9.2 million people (IRENA, 2015a).
Renewable energy benefits therefore play a critical role in informing policy decisions and tipping the balance in favour of low-carbon investments. With a view to contribute to this field of knowledge, IRENA developed a conceptual framework to analyse the environmental, social and economic value from large-scale solar and wind energy deployment1 (IRENA and Clean Energy Ministerial, 2014). Its approach helps classify, quantify, aggregate
and compare socioeconomic e¨ects in a holistic manner. As shown in Figure 1, the conceptual framework identifies four separate dimensions in which the e¨ects can be categorised. The assessment of the macroeconomic e¨ects as displayed in the left-hand column are the core of the present study. The study also includes the energy system-related e¨ects, such as the cost of integrating variable renewables, which can have macroeconomic impacts.
Source: IRENA and CEM (2014), updated to reflect the scope of this report
15
INTRODUCTION 01
1.1 EXISTING KNOWLEDGE
Increasing the share of renewables can a¨ect the world’s economy through investment, trade and electricity prices, for example. A literature review was carried out to gather evidence on these e¨ects. It set a benchmark to compare the results of the present analysis as well as guided the selection of the methodology, inputs and indicators.
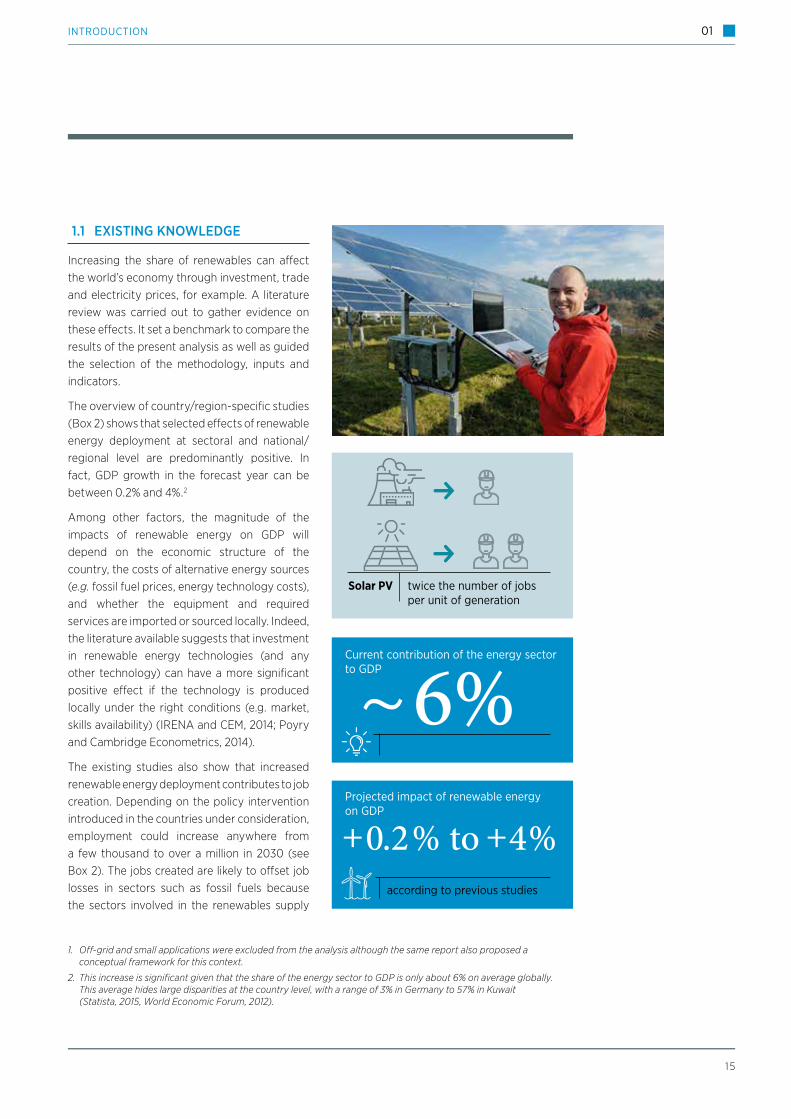
The overview of country/region-specific studies (Box 2) shows that selected e¨ects of renewable energy deployment at sectoral and national/regional level are predominantly positive. In fact, GDP growth in the forecast year can be between 0.2% and 4%.2
Among other factors, the magnitude of the impacts of renewable energy on GDP will depend on the economic structure of the country, the costs of alternative energy sources (e.g. fossil fuel prices, energy technology costs), and whether the equipment and required services are imported or sourced locally. Indeed, the literature available suggests that investment in renewable energy technologies (and any other technology) can have a more significant positive e¨ect if the technology is produced locally under the right conditions (e.g. market, skills availability) (IRENA and CEM, 2014; Poyry and Cambridge Econometrics, 2014).
The existing studies also show that increased renewable energy deployment contributes to job creation. Depending on the policy intervention introduced in the countries under consideration, employment could increase anywhere from a few thousand to over a million in 2030 (see Box 2). The jobs created are likely to o¨set job losses in sectors such as fossil fuels because the sectors involved in the renewables supply
R
R
Current contribution of the energy sector to GDP
Projected impact of renewable energy on GDP
according to previous studies
twice the number of jobs per unit of generation
Solar PV
~6% +0.2% to +4%
1. Off-grid and small applications were excluded from the analysis although the same report also proposed a conceptual framework for this context.
2. This increase is significant given that the share of the energy sector to GDP is only about 6% on average globally. This average hides large disparities at the country level, with a range of 3% in Germany to 57% in Kuwait (Statista, 2015, World Economic Forum, 2012).

1 6
RENEWABLE ENERGY BENEFITS: MEASURING THE ECONOMICS01
Box 2: Previous studies on the projected economic impacts3 of renewable energy deployment
Country/Region (Source)
Forecast year
Analysed policy intervention
Impact on GDP
Impact on employment
Chile(NRDC and ACERA, 2013)
2028 20% renewables in electricity generation (excl. large hydro)
+0.63% (USD 2.24 billion)
7,800 direct and indirect jobs (+0.09%)
EuropeanUnion(European Commission, 2014)
2030 -40% greenhouse gas emissions in 20304
+ 0.46% +1.25 million economy-wide jobs (+0.5%)
Germany(Lehr et al., 2012; Blazejczak et al. 2014; Bohringer et al. 2013)
2030 Di�erent targets for renewable energy deployment
Up to + 3% From negative* to + 1% on net employment
Ireland(Pöyry Manage-ment Consulting and Cambridge Econometrics, 2014)
2020 Meeting the target for wind by 2020
+0.2% to + 1.3% +1,150 to + 7,450 net jobs
Japan(IRENA and CEM, 2014)
2030 Adding 23.3 giga-watts (GW) of solar PV
+0.9% (USD 47.5 billion)
N/A
Mexico(own calculations based on PwC, 2015)
2030 21 GW of additional renewable power capacity
+0.2% +134,000 in the sector
Saudi Arabia(own calculations based on K.A.CARE, 2012)
2032 54 GW of renewable power capacity
+4% (USD 51 billion)
+137,000 in the sector5
United Kingdom(Cambridge Econometrics, 2012)
2030 Larger role of o�- shore wind instead of natural gas
+0.8% +70,000 net employment
USA(ICF International, 2015; Synapse Energy Economics et al. (2015))
2030 Decarbonisation driven by renewable energy
+0.6%, +0.5 to +1 million net
Note (*): if renewables are financed through a high labor tax or electricity surcharge
17
INTRODUCTION 01
chain are usually more distributed and labour-intensive than the conventional energy sector. For instance, solar PV creates at least twice the number of jobs per unit of electricity generated compared with coal or natural gas6. As a result, substituting fossil fuels for renewables could lead to a higher number of jobs overall.
The literature review also found that many studies focus on the economics of climate change policy and green growth. However, little specific evidence exists of the economic impact of global renewable energy deployment. This study thus addresses a major knowledge gap on the impact of renewable energy deployment on key economic variables.
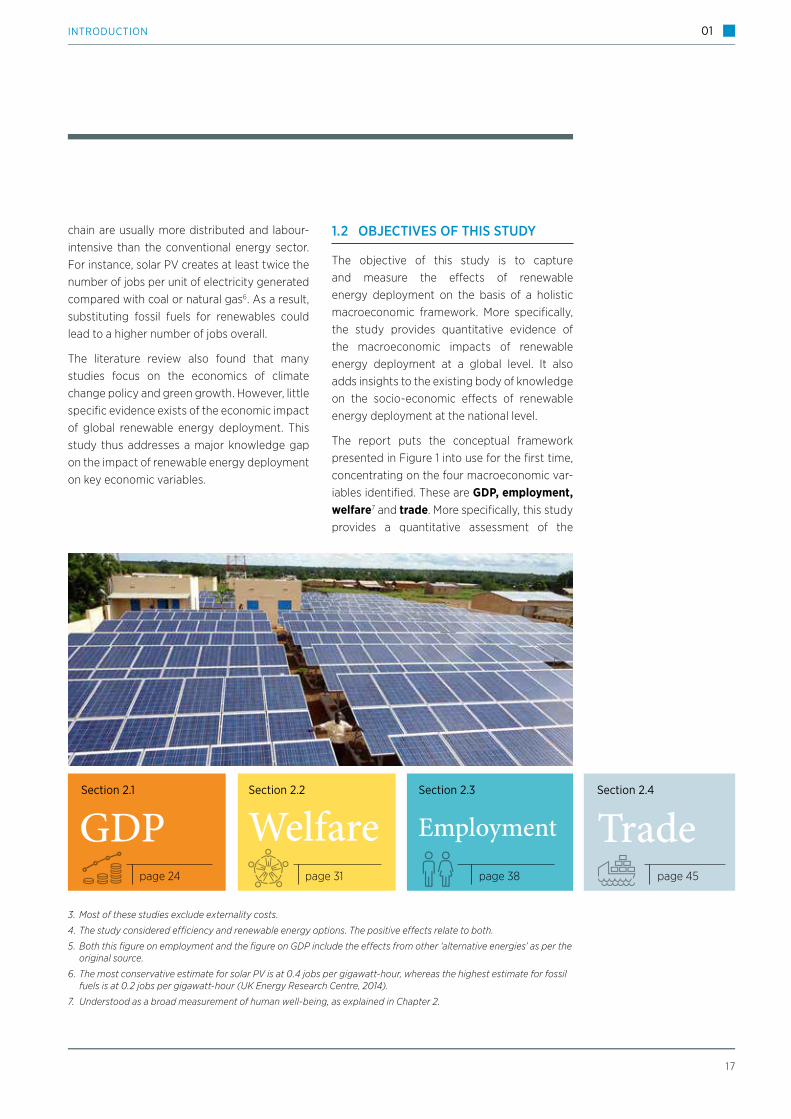
1.2 OBJECTIVES OF THIS STUDY
The objective of this study is to capture and measure the e¨ects of renewable energy deployment on the basis of a holistic macroeconomic framework. More specifically, the study provides quantitative evidence of the macroeconomic impacts of renewable energy deployment at a global level. It also adds insights to the existing body of knowledge on the socio-economic e¨ects of renewable energy deployment at the national level.
The report puts the conceptual framework presented in Figure 1 into use for the first time, concentrating on the four macroeconomic var-iables identified. These are GDP, employment, welfare7 and trade. More specifically, this study provides a quantitative assessment of the
Section 2.1
page 24
Section 2.2
page 31
Section 2.4
page 45
GDP Welfare TradeSection 2.3
page 38
Employment
3. Most of these studies exclude externality costs.
4. The study considered efficiency and renewable energy options. The positive effects relate to both.
5. Both this figure on employment and the figure on GDP include the effects from other ‘alternative energies’ as per the original source.
6. The most conservative estimate for solar PV is at 0.4 jobs per gigawatt-hour, whereas the highest estimate for fossil fuels is at 0.2 jobs per gigawatt-hour (UK Energy Research Centre, 2014).
7. Understood as a broad measurement of human well-being, as explained in Chapter 2.
1 8
RENEWABLE ENERGY BENEFITS: MEASURING THE ECONOMICS01
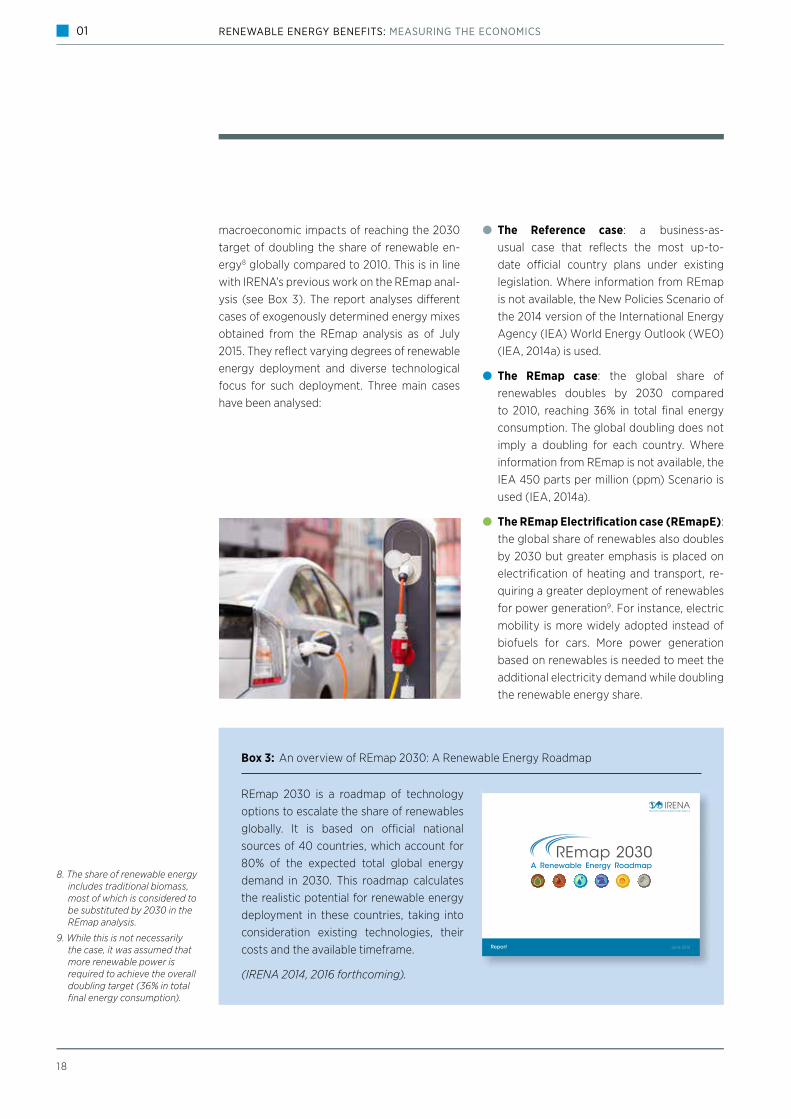
macroeconomic impacts of reaching the 2030 target of doubling the share of renewable en-ergy8 globally compared to 2010. This is in line with IRENA’s previous work on the REmap anal-ysis (see Box 3). The report analyses di¨erent cases of exogenously determined energy mixes obtained from the REmap analysis as of July 2015. They reflect varying degrees of renewable energy deployment and diverse technological focus for such deployment. Three main cases have been analysed:
● The Reference case: a business-as-usual case that reflects the most up-to-date o«cial country plans under existing legislation. Where information from REmap is not available, the New Policies Scenario of the 2014 version of the International Energy Agency (IEA) World Energy Outlook (WEO) (IEA, 2014a) is used.
● The REmap case: the global share of renewables doubles by 2030 compared to 2010, reaching 36% in total final energy consumption. The global doubling does not imply a doubling for each country. Where information from REmap is not available, the IEA 450 parts per million (ppm) Scenario is used (IEA, 2014a).
● The REmap Electrification case (REmapE): the global share of renewables also doubles by 2030 but greater emphasis is placed on electrification of heating and transport, re-quiring a greater deployment of renewables for power generation9. For instance, electric mobility is more widely adopted instead of biofuels for cars. More power generation based on renewables is needed to meet the additional electricity demand while doubling the renewable energy share.
Box 3: An overview of REmap 2030: A Renewable Energy Roadmap
REmap 2030 is a roadmap of technology options to escalate the share of renewables globally. It is based on o«cial national sources of 40 countries, which account for 80% of the expected total global energy demand in 2030. This roadmap calculates the realistic potential for renewable energy deployment in these countries, taking into consideration existing technologies, their costs and the available timeframe.
(IRENA 2014, 2016 forthcoming).
A Renewable Energy Roadmap
Report June 2014
8. The share of renewable energy includes traditional biomass, most of which is considered to be substituted by 2030 in the REmap analysis.
9. While this is not necessarily the case, it was assumed that more renewable power is required to achieve the overall doubling target (36% in total final energy consumption).

19
INTRODUCTION 01
Global share of renewables doubles by 2030Global share of renewables doubles by 2030
with respect to 2010 with respect to 2010 by larger emphasis on electrification
REmap
REmap
REmapE
REmapE
This report consists of three main chapters. Chapter 2 presents the main results of the econometric analysis of the macroeconomic impacts of renewable energy deployment at a global level. It shows the extent to which the impact of a transition to 36% renewables
would a¨ect economic growth (GDP), welfare, employment and international trade. The approach is based on solid empirical evidence using a model employed for policy analysis in a wide range of circumstances. The analysis is based on a set of cases defined by energy

20
RENEWABLE ENERGY BENEFITS: MEASURING THE ECONOMICS01
demand and supply mixes with di¨erent renewable shares. Although global in scope, the analysis also disaggregates the impacts by country or region.
Chapter 3 explains the approach taken to conduct the assessment. It provides details on the method used and the rationale behind the choice of the E3ME tool. It also explains the cases analysed, the sensitivity analysis10 carried out and the limitations of the study.
Finally, Chapter 4 outlines the conclusions and way forward.
1.3 APPROACH USED FOR THIS STUDY
This study relies on a macro-econometric approach and takes all relevant economic interactions into account within a single quantitative framework. The output results presented are thus ‘net’. This means they cover impacts on all economic sectors and include both positive and negative impacts. The main strength of this approach is its foundation on a solid empirical data set; it has a proven track record of policy applications. Unlike other approaches, it allows the representation of additional policies or regulations drawing from idle economic resources, a situation often observed in reality. Furthermore, the approach takes unemployment into account, a key concern for policy makers.
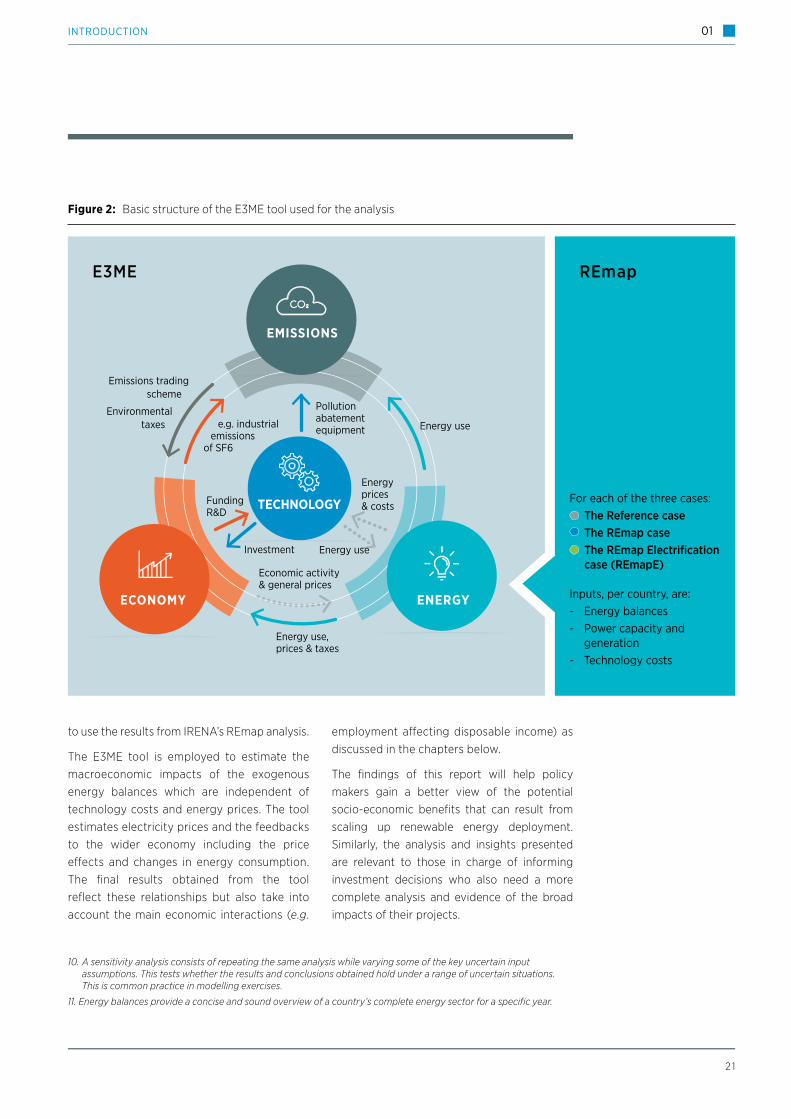
This analysis uses the Cambridge Econo-metrics’ E3ME tool (see Box 4) as illustrated in Figure 2. The tool connects the world’s economies to estimate the macroeconomic impacts of changes to the global energy mix. It also connects the energy system with technological evolution and emissions. For the purpose of this analysis, the links feeding into the energy system, shown as dotted arrows, have been disabled to make the technology costs and energy balances11 exogenous in order
Box 4: E3ME, the tool used for this study
The tool used in this report is E3MEa, developed by Cambridge Econometrics. The main features are the following:
● It is a global simulation tool based on post-Keynesian principles, in which behavioural parameters are estimated from historical time-series data.
● It includes 24 di¨erent electricity generation technologies and 43 economic sectors. The model covers 59 countries/regions globally and allows the addition of new countries, which was necessary for the analysis.
● It enables the use of exogenous energy mixes, a key requirement to analyse the REmap cases.
● It is flexible and can be tailored to di¨erent technological, sectoral and geographical disaggregation.
● It integrates the energy system and the world’s economies to provide estimates of the macroeconomic impacts of the di¨erent energy mixes.
● It has been applied extensively for policy analysis such as o«cial assessments of the EU’s 2030 climate and energy targets and the EU’s long-term Energy Roadmap. In East Asia, it has recently been applied to work out possible future energy mixes and is also being used in Latin America.
To summarise, the model provides a highly suitable framework for the types of questions being addressed, and has already been validated.
a More information can be found in www.e3me.com
2 1
INTRODUCTION 01
E3ME REmap
For each of the three cases:● The Reference case ● The REmap case● The REmap Electrification case (REmapE)
Inputs, per country, are:- Energy balances- Power capacity and generation- Technology costs
TECHNOLOGY
EMISSIONS
ENERGY ECONOMY
Energy use
Energy use
Energy prices& costs
Economic activity & general prices
Funding R&D
Investment
Pollution abatement equipment
Energy use, prices & taxes
e.g. industrial emissions
of SF6
Emissions tradingscheme
Environmentaltaxes
Energy use
Figure 2: Basic structure of the E3ME tool used for the analysis
to use the results from IRENA’s REmap analysis.
The E3ME tool is employed to estimate the macroeconomic impacts of the exogenous energy balances which are independent of technology costs and energy prices. The tool estimates electricity prices and the feedbacks to the wider economy including the price e¨ects and changes in energy consumption. The final results obtained from the tool reflect these relationships but also take into account the main economic interactions (e.g.
employment a¨ecting disposable income) as discussed in the chapters below.
The findings of this report will help policy makers gain a better view of the potential socio-economic benefits that can result from scaling up renewable energy deployment. Similarly, the analysis and insights presented are relevant to those in charge of informing investment decisions who also need a more complete analysis and evidence of the broad impacts of their projects.
10. A sensitivity analysis consists of repeating the same analysis while varying some of the key uncertain input assumptions. This tests whether the results and conclusions obtained hold under a range of uncertain situations. This is common practice in modelling exercises.
11. Energy balances provide a concise and sound overview of a country’s complete energy sector for a specific year.

ASSESSING ECONOMIC IMPACTS OF INCREASED
RENEWABLE ENERGY DEPLOYMENT
02

2 3
ASSESSING ECONOMIC IMPACTS OF INCREASED RENEWABLE ENERGY DEPLOYMENT 02
The energy sector contributes to economic activity in two ways. Firstly, energy is an important economic sector that creates jobs and value by extracting, transforming and distributing energy goods and services throughout the economy (World Economic Forum, 2012). Secondly, the energy sector’s impact ripples through the rest of the economy. Energy is an input to nearly every product and service in the economy and underpins the economic activity across each of its sectors.
Faced with the twin challenges of sluggish economic growth and the mounting imperative to decarbonise economies, countries are looking for solutions to improve their economic performance while minimising further greenhouse gas emissions. Given this context, renewable energy is emerging not only as a solution to meet growing energy demand while sharply reducing carbon emissions but also as a potential engine for economic growth and diversification.
This resonates strongly with the objective of green growth12, which is probably the only way to satisfy the needs of a growing population and drive development and well-being, while reducing greenhouse gas emissions and increasing natural resource productivity. Advancements in technology and growing cost-competitiveness has meant that renewables now o¨er governments the option to pursue such a vision for the energy sector and reduce the traditional trade-o¨ between economic growth and environmental conservation
The transition to an energy system based on renewables is a unique opportunity. It could balance the demand for su«cient energy to power economic growth and development with the urgent need to sharply reduce carbon emissions. A global consensus is emerging on the need to realise this opportunity illustrated through the pledges submitted to the UN Conference of the Parties (COP 21) in Paris as well as through national renewable energy targets that now exist in 164 countries (IRENA, 2015b). Indeed, the energy sector transformation is underway with renewable capacity additions in the power sector already exceeding those of conventional options since 2011.
The implicit relationship between the energy sector and the economy raises questions on the economy-wide impacts of the ongoing energy sector transformation. As discussed earlier, some national studies have quantified the impacts on GDP and employment, for instance, to inform the national dialogue. However, analytical work and empirical evidence on this important subject remains relatively limited, especially at the global level.
ASSESSING ECONOMIC IMPACTS OF INCREASED RENEWABLE ENERGY DEPLOYMENT
National renewable energy targets exist today in
164 countries
12. The Organisation for Economic Co-operation and Development (OECD) (2011) defines green growth as: “fostering economic growth and development, while ensuring that natural assets continue to provide the resources and environmental services on which our well-being relies.”
24
02 RENEWABLE ENERGY BENEFITS: MEASURING THE ECONOMICS
This study is the first to quantify the global macroeconomic impacts of renewable energy deployment targets. This chapter presents the main findings of the analysis, displaying impacts on economic growth (GDP), welfare, employment and international trade from doubling the share of renewables by 2030. The methodology behind the findings is presented in detail in Chapter 3.
2.1 RENEWABLES DEPLOYMENT INCREASES GLOBAL GDP
This section provides a framework for understanding the greater economic role of renewable energy through its impact on GDP13. As the most common measure of economic development and growth, IRENA estimated its impacts as part of the analysis.
The findings show that doubling the share
of renewables in the final global energy mix increases global GDP in 2030 between 0.6% and 1.1% compared to business as usual (Reference Case)14. The increase amounts to between USD 706 billion and USD 1.3 trillion15.
The magnitude of the impact is broadly consistent with the results obtained by national studies conducted to date (see Box 5). The subsequent sensitivity analysis to test the results is discussed in Chapter 3.
When renewable energy is doubled to 36% (REmap Case), global GDP increases by 0.6% in 2030, which equates USD 706 billion.16 This is equivalent to the combined economies of the Colombia and Malaysia as of today. The scale of GDP impacts varies across countries (see Figure 3). In the first IRENA case for doubling the share of renewables – the REmap Case – Japan experiences the greatest positive impact (2.3%). This results from a large investment in solar PV and substantial reduction of fossil fuel imports. Australia, Brazil, Germany, South Korea, Mexico and South Africa also experience positive impacts amounting to more than 1% of GDP. Many other countries, including large economies such as China, France, India, the UK and US, also benefit from positive impacts, though with less than 1% (0.2% in China and around 0.9% for the others). Most of these positive impacts on GDP can be explained by the increased investment required by renewable energy deployment, which triggers ripple e¨ects throughout the economy.
A few countries face a decline in GDP in line with their vulnerability to the dynamics of global fossil fuel markets. Oil and gas exporters such as Saudi Arabia, Russia, Nigeria and Venezuela
13. GDP measures supply and demand based on the value of goods and services produced and traded in a country during a given year. GDP is therefore the addition of a country‘s individual consumption expenditures (household payments for goods and services), governmental final demand (public expenditure on the supply of goods and services), net exports (exports minus imports) and investment (gross capital formation) (Mankiw, 2003).
14. This refers to a figure for GDP in 2030 that is 0.6% larger than in the Reference Case. It should not be confused with an addition of 0.6% to annual GDP growth between 2016 and 2030.
15. At 2015 prices.
16. At 2015 prices.
2 5
ASSESSING ECONOMIC IMPACTS OF INCREASED RENEWABLE ENERGY DEPLOYMENT 02
face reductions in their export volumes in the long term. Given the high share fossil fuels play in their GDP, the reduced trade in these fuels are expected to have e¨ects on their economies. The global deployment of renewable energy a¨ects fossil fuel exporters according to the degree of diversification in their economies.
In general, large oil and gas exporters rely on their energy sectors more than coal exporters rely on coal. The oil and gas sector, for example, represents around 25% of GDP in Saudi Arabia and Venezuela, and around 15% in Nigeria and Russia. By contrast, coal is around 8% of GDP in Australia and 5% in South Africa (World Bank, 2015a; Devaux 2013; Australian Bureau of Statistics, 2012; South Africa Embassy, 2013). As a result, coal exporters in general are less a¨ected by an increase in renewables. Whereas oil and gas exporting countries Saudi Arabia and Russia face a GDP decline of 2% and 0.7% respectively, coal exporters Australia and South Africa experience a GDP improvement. Some of these countries could, however, become bioenergy exporters (e.g. Russia). In this case, the GDP impact could be better than seen here17.
The high dependency of oil and gas exporting countries on export revenues and the vulnerability to potential oil price reductions creates economic fragility. The present situation is a case in point: GDP growth in Saudi Arabia is expected to slow down from 4%-5% in 2013/14 to below 3% in 2015 and 2016, according to the International Monetary Fund (IMF, 2015). This is not a foregone conclusion. Countries exporting oil and gas could embrace renewable energy deployment as an opportunity for economic diversification and positioning in the new markets that will be created. In addition, renewable energy deployment could be an opportunity to reduce domestic fossil fuel consumption. This could be achieved by
integrating renewable energy into an overall strategy which also includes the increase of energy e«ciency. This is already in progress in some of the countries analysed in this report (IRENA, 2016a).
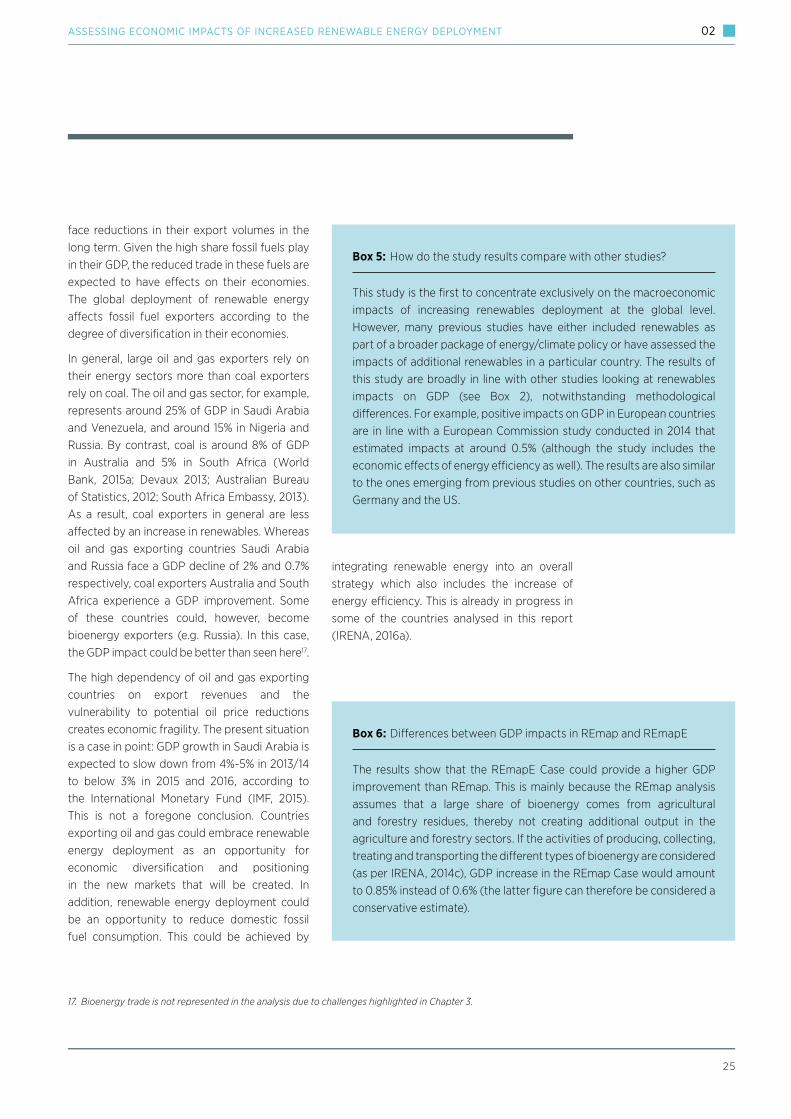
Box 5: How do the study results compare with other studies?
This study is the first to concentrate exclusively on the macroeconomic impacts of increasing renewables deployment at the global level. However, many previous studies have either included renewables as part of a broader package of energy/climate policy or have assessed the impacts of additional renewables in a particular country. The results of this study are broadly in line with other studies looking at renewables impacts on GDP (see Box 2), notwithstanding methodological di¨erences. For example, positive impacts on GDP in European countries are in line with a European Commission study conducted in 2014 that estimated impacts at around 0.5% (although the study includes the economic e¨ects of energy e«ciency as well). The results are also similar to the ones emerging from previous studies on other countries, such as Germany and the US.
Box 6: Di¨erences between GDP impacts in REmap and REmapE
The results show that the REmapE Case could provide a higher GDP improvement than REmap. This is mainly because the REmap analysis assumes that a large share of bioenergy comes from agricultural and forestry residues, thereby not creating additional output in the agriculture and forestry sectors. If the activities of producing, collecting, treating and transporting the di¨erent types of bioenergy are considered (as per IRENA, 2014c), GDP increase in the REmap Case would amount to 0.85% instead of 0.6% (the latter figure can therefore be considered a conservative estimate).
17. Bioenergy trade is not represented in the analysis due to challenges highlighted in Chapter 3.

26
02 RENEWABLE ENERGY BENEFITS: MEASURING THE ECONOMICS
When renewable energy is doubled through a higher rate of electrification of final energy uses and lower reliance on bioenergy, the increase in global GDP is even higher (see Box 6).
It amounts to 1.1%, which equates to USD 1.3 trillion.19 This is the second case analysed in this report i.e. REmapE. This increase is equivalent to the combined economies of South Africa, Chile and Switzerland today in the global economy. In most cases, the additional investment leads to higher levels of output and GDP. Several countries are notable for having a large positive impact on GDP due to higher investment, including Ukraine (3.7%), Japan (3.6%), India (2.4%), South Africa (2.2%), the US (1.8%) and Australia (1.7%) as shown in Figure 3. As in the REmap Case, oil and gas exporters also face a GDP decline which is slightly larger since global demand for oil is further reduced by the electrification of heat and transport.
In the electrification case, the positive impacts are generally greater and mainly reflect the higher amounts of investment required.
4
3
2
1
0
-1
-2
2030 GDP size% change vs the Reference Case
REmap REmapE
Rus
sia
Nig
eria
Saud
i Ara
bia
Res
t of O
PEC
Res
t of t
he W
orld
Den
mar
k
Ger
man
y
Fran
ce
Ital
y
UK
Res
t of E
U15
EU13
Turk
ey
Ukr
aine
Res
t of O
ECD US
Can
ada
Aus
tral
ia
Japa
n
Kore
a
Chi
na
Indi
a
Indo
nesi
a
Res
t of A
SEA
N
Bra
zil
Mex
ico
Res
t of
Latin
Am
eric
a
Sout
h A
fric
a
Figure 3: GDP impacts (2030 GDP size, % change vs the Reference Case)18
REmapE
+1.3 trillion USD
REmap
= current GDP from Colombia + Malaysia
= current GDP from Chile + South Africa + Switzerland
+0.6% vs.
vs.
vs.
+1.1%
Global GDP in 2030
+706 billion USD
18. The country grouping presented in the results is determined by the geographical resolution and aggregations in the E3ME tool. These in turn depend on data availability. The order of the bars is, to the extent possible, geographical.
19. At 2015 prices

27
ASSESSING ECONOMIC IMPACTS OF INCREASED RENEWABLE ENERGY DEPLOYMENT 02
Renewable energy investments, however, could ’crowd out’20 investment in other economic sectors, and in this case the GDP impacts could eventually turn slightly negative (see Box 7). In other words, the electrification case yields a higher but slightly riskier improvement in GDP depending on whether renewable energy crowds out investment in other economic sectors (see Chapter 3 for more detail).
ENERGY SECTOR INVESTMENTS AS A KEY DRIVER OF GDP GROWTH
A number of factors influence the GDP growth estimated in this study, including investment in renewable energy deployment, fossil fuel production and trade, and electricity prices (see Box 8). Investments in particular influence GDP growth the most, triggered by the capital-intensive nature of renewable energy technologies compared to alternative options. Most of the total cost of renewable energy plants is used for the upfront investment on physical assets, as opposed to fuel expenditure throughout the lifecycle of the plant.
As the demand for energy grows, proportionate investments in energy infrastructure will be needed. To avoid lock-in with unsustainable energy systems, and realise the potential benefits on o¨er, energy sector investments will increasingly need to be directed towards renewable energy. Investment in renewable energy across all sectors needs to be scaled up substantially.
The power sector will continue to attract the majority of new investment. This report estimates the investments based on the installed capacities per year, technology and country for each of the three cases; as well as the capital costs, discount rates and other parameters required for each technology in each country and year.
The results suggest that global annual investment in renewable power capacity in the REmap Case would need to be in the range of USD 500 billion to USD 750 billion between now and 2030. These results are broadly in line with earlier investment analysis presented in IRENA’s REthinking Energy: Renewable Energy and Climate Change, which showed that annual investments in the power sector should reach at least USD 400 billion up to 2020 and USD 600 billion for the decade up to 2030. (see IRENA, 2015c for further details). The investment needs will be higher when the doubling is achieved through greater electrification of heat and transport.
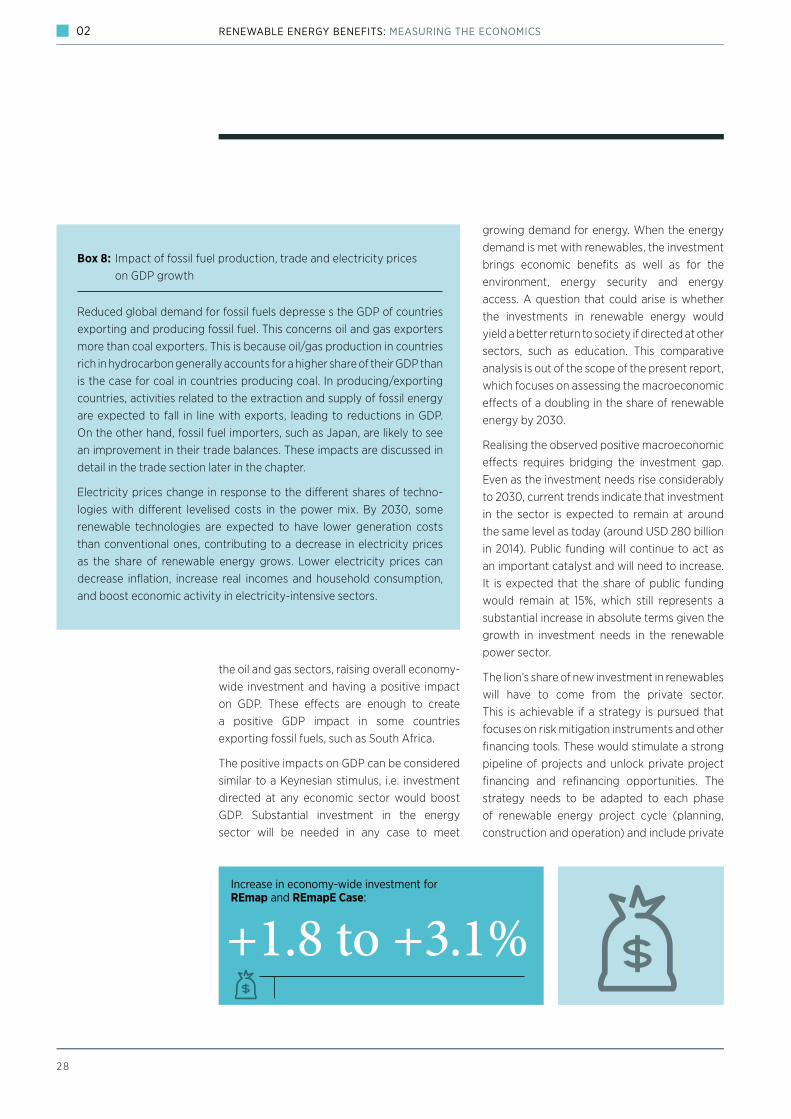
The projected increase in investments in renewable power yields a global economy-wide rise in annual investment of 1.8% in the REmap Case and 3.1% in the REmapE Case by 2030 even when accounting for reduction in investments by the oil and gas sector. In other words, the increased investment in the power sector outweighs the reduced investment in
Box 7: Financial crowding out can significantly a¨ect GDP results
A large share of GDP growth is driven by the increased investments needed to deploy the high capital needs of renewables. Some of these investments are financed through bank lending, potentially competing with lending to other productive sectors (i.e crowded out). A sensitivity analysis was conducted to examine this e¨ect (see Chapter 3). The results show that in the case of a full crowding out, GDP impacts could become marginally negative (-0.02% in REmap and -0.06% in REmapE as opposed to +0.6% and +1.1%). In the case of partial crowding out, the results are positive. In conclusion, unless the financing of renewables competes 100% with investments in other productive sectors, GDP impacts are expected to be positive.
20. “Crowding out” of capital refers to the possibility that the investments needed for increased renewable energy deployment compete with and displace investments elsewhere in the economy (e.g. in the manufacturing sector). This can have a negative effect on GDP.
28
02 RENEWABLE ENERGY BENEFITS: MEASURING THE ECONOMICS
the oil and gas sectors, raising overall economy-wide investment and having a positive impact on GDP. These e¨ects are enough to create a positive GDP impact in some countries exporting fossil fuels, such as South Africa.
The positive impacts on GDP can be considered similar to a Keynesian stimulus, i.e. investment directed at any economic sector would boost GDP. Substantial investment in the energy sector will be needed in any case to meet
growing demand for energy. When the energy demand is met with renewables, the investment brings economic benefits as well as for the environment, energy security and energy access. A question that could arise is whether the investments in renewable energy would yield a better return to society if directed at other sectors, such as education. This comparative analysis is out of the scope of the present report, which focuses on assessing the macroeconomic e¨ects of a doubling in the share of renewable energy by 2030.
Realising the observed positive macroeconomic e¨ects requires bridging the investment gap. Even as the investment needs rise considerably to 2030, current trends indicate that investment in the sector is expected to remain at around the same level as today (around USD 280 billion in 2014). Public funding will continue to act as an important catalyst and will need to increase. It is expected that the share of public funding would remain at 15%, which still represents a substantial increase in absolute terms given the growth in investment needs in the renewable power sector.
The lion’s share of new investment in renewables will have to come from the private sector. This is achievable if a strategy is pursued that focuses on risk mitigation instruments and other financing tools. These would stimulate a strong pipeline of projects and unlock private project financing and refinancing opportunities. The strategy needs to be adapted to each phase of renewable energy project cycle (planning, construction and operation) and include private
Box 8: Impact of fossil fuel production, trade and electricity prices on GDP growth
Reduced global demand for fossil fuels depresse s the GDP of countries exporting and producing fossil fuel. This concerns oil and gas exporters more than coal exporters. This is because oil/gas production in countries rich in hydrocarbon generally accounts for a higher share of their GDP than is the case for coal in countries producing coal. In producing/exporting countries, activities related to the extraction and supply of fossil energy are expected to fall in line with exports, leading to reductions in GDP. On the other hand, fossil fuel importers, such as Japan, are likely to see an improvement in their trade balances. These impacts are discussed in detail in the trade section later in the chapter.
Electricity prices change in response to the di¨erent shares of techno-logies with di¨erent levelised costs in the power mix. By 2030, some renewable technologies are expected to have lower generation costs than conventional ones, contributing to a decrease in electricity prices as the share of renewable energy grows. Lower electricity prices can decrease inflation, increase real incomes and household consumption, and boost economic activity in electricity-intensive sectors.
Increase in economy-wide investment for REmap and REmapE Case:
+1.8 to +3.1%

2 9
ASSESSING ECONOMIC IMPACTS OF INCREASED RENEWABLE ENERGY DEPLOYMENT 02
and public actors. Today’s investment decisions could lock in power systems and associated emissions for decades. This means that in the short term, greater focus must be placed on the planning phase to guarantee attractive renewable energy projects are in the pipeline (see Box 9).
CHANGES IN ECONOMIC STRUCTURE
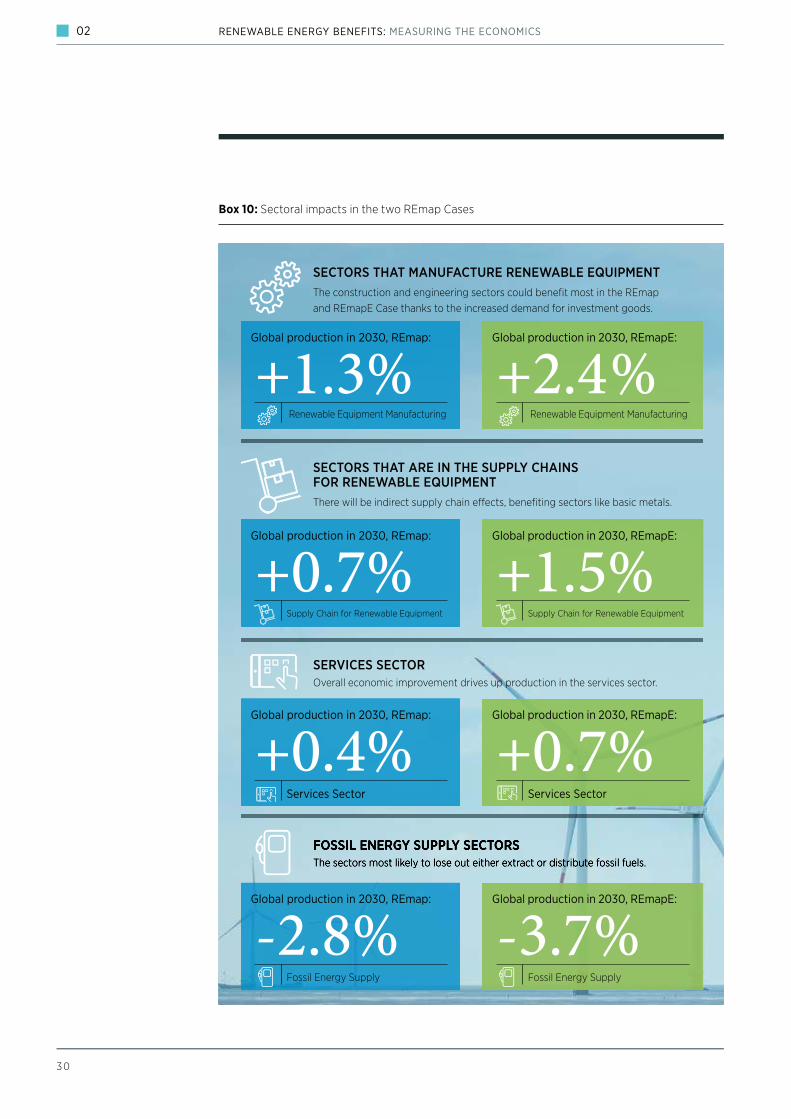
The importance of the investment e¨ect is felt not only in the overall GDP changes (global or by country) analysed above but also at the sectoral level. The general economic improvement caused by renewable energy deployment causes most economic sectors to increase their output but the benefits are greatest in sectors that produce investment goods and services. These are linked to renewable energy equipment manufacturing and installation.21
These sectors include companies predominantly in the construction, manufacturing and engineering sectors, in which output levels nowadays depend on volatile demand for investment goods and services. These sectors in many countries have still not fully recovered from the lasting e¨ects of the financial crisis
and subsequent recession. They have also been negatively a¨ected by the more recent slowdown in parts of the developing world. These sectors could therefore have spare capacity available to increase their output in the short term. Their economic output22 is estimated to increase by 1.3% in the REmap Case and by 2.4% in the REmapE Case in 2030 (see Box 10).
Box 9: IRENA initiatives to improve renewable energy project planning
IRENA’s Project Navigator and Sustainable Energy Marketplace tools, and the Regulatory Empowerment Project are designed to contribute to the objective of building a strong pipeline of projects. The Project Navigator provides project developers with knowledge, tools, case studies and best practices, while the Marketplace o¨ers a virtual platform that brings together project developers and investors to facilitate exchange of investment opportunities. The Regulatory Empowerment Project provides targeted technical assistance to regulatory decision makers to help them overcome existing governance gaps to reduce investment risks (IRENA, 2015d).
21. The tool used for the analysis in this report includes a disaggregation of 43 sectors, which are linked both to each other (e.g. showing supply chain effects) and to the different power generation technologies. In this way, the results provide estimates of how each sector is affected on the basis of its interactions with the power sector and the wider economy.
22. Measured in constant 2015 USD
3 0
02 RENEWABLE ENERGY BENEFITS: MEASURING THE ECONOMICS
Box 10: Sectoral impacts in the two REmap Cases
Global production in 2030, REmap:
Renewable Equipment Manufacturing
Supply Chain for Renewable Equipment
Services Sector
Fossil Energy Supply
Supply Chain for Renewable Equipment
Services Sector
Fossil Energy Supply
Global production in 2030, REmap:
Global production in 2030, REmap:
Global production in 2030, REmap:
Global production in 2030, REmapE:
Renewable Equipment Manufacturing
Global production in 2030, REmapE:
Global production in 2030, REmapE:
Global production in 2030, REmapE:
+1.3%
+0.7%
+0.4%
-2.8%
+2.4%
+1.5%
+0.7%
-3.7%
SECTORS THAT MANUFACTURE RENEWABLE EQUIPMENTThe construction and engineering sectors could benefit most in the REmap and REmapE Case thanks to the increased demand for investment goods.
SECTORS THAT ARE IN THE SUPPLY CHAINS FOR RENEWABLE EQUIPMENTThere will be indirect supply chain e¨ects, benefiting sectors like basic metals.
SERVICES SECTOR Overall economic improvement drives up production in the services sector.
FOSSIL ENERGY SUPPLY SECTORS The sectors most likely to lose out either extract or distribute fossil fuels.

3 1
ASSESSING ECONOMIC IMPACTS OF INCREASED RENEWABLE ENERGY DEPLOYMENT 02
Increased activity in these sectors has ripple e¨ects on the rest of the economy because the
construction, manufacturing and engineering
sector supply chains are also likely to benefit.
Notable examples include basic metals and non-
metallic mineral products (e.g. silicon), which
provide the materials used for manufacturing
renewables equipment. Economic output
increases by 0.7% in the REmap Case and by
1.5% in the REmapE Case by 2030 in these
sectors. The supply chain e¨ects can be traced
further back to the primary (non-energy)
extraction sector, although in macroeconomic
terms this is a relatively small industry.
Output also increases by 2030 in the services
sectors by 0.4% in the REmap Case and 0.7% in
the REmapE Case. Some of the service sectors
make up part of the supply chains for renewables
(e.g. planning or transport). However, most
of the impact on the services sectors are the
result of induced e¨ects, i.e. improvements in
the wider economy. For example, if electricity
prices fall there is an increase in real household
income, which can stimulate activity in the retail
or hospitality sectors. Changes in service sector
activity can make a significant di¨erence to the
induced employment results because many of
these sectors are relatively labour-intensive.
The main negative impacts occur in the fossil fuel industries, extraction, oil refineries and distribution chains. As overall demand for fossil fuels falls, these sectors are all a¨ected. At a global level the value of their output in real terms declines by 2.8% and 3.7% in the REmap and REmapE Case respectively compared to the Reference Case.
2.2 RENEWABLE ENERGY IMPROVES WELFARE
In the current global economic scenario, policy options need to be designed to maximise social benefits in terms of incomes, health, education, employment and general human well-being. Welfare is an important alternative to GDP as a way of considering the e¨ects of increased renewable energy deployment (see Box 11). Welfare measures can include sustainability as an additional dimension, particularly in view of an economy’s ability to support chosen development paths with a finite natural resource base over the long term (Daly and Cobb, 1989). This resource sustainability component is important because conventional measures of welfare, including GDP, o¨er only a snapshot of some of the factors defined as socio-economic welfare. GDP is therefore unable to account

32
02 RENEWABLE ENERGY BENEFITS: MEASURING THE ECONOMICS
GDP provides a standard measure for comparing economic output levels in di¨erent countries. However, it is known that GDP and variants such as Gross National Product cannot be employed to infer estimates of broader economic welfare, as first observed by Simon Kuznets in the 1930s. Many activities add to welfare but are excluded from GDP (e.g. leisure time). Others add to GDP but not to welfare. For example, cleaning up after an oil spill increases economic activity and GDP but human welfare is not better o¨ than before the spill. Another relevant example is the depletion of non-renewable natural resources. A country could increase its GDP by extracting more natural resources but this reduces the resources available for future generations (World Bank, 2011; UN University - International Human Dimensions Programme (UNU-IHDP) and United Nations Environment Programme (UNEP), 2014).
In the last few decades, significant work has been carried out within sustainable development discussions trying to propose better indicators of human welfare. In 1990, the United Nations Development Programme (UNDP) developed the Human Development Index (HDI). It expands the measurement of income to incorporate health and education.23 For instance, its results show that a country such as Australia ranked 20th in the world today in terms of GDP per capita, but comes second in terms of HDI (UNDP, 2014). Countries like Rwanda have significantly improved their HDI not as a consequence of higher GDP but higher life expectancy and longer schooling periods (UNDP, 2013).
Other institutions, including the World Bank, the OECD and the EC, have also worked on broader welfare measurements. The EU ‘Beyond GDP’ initiative builds on the work led by Nobel laureate Joseph Stiglitz and carried out for the French government.24 The World Bank adds the economic values of natural capital to the most commonly used value of produced capital.25 This includes agricultural land, protected areas, forests, minerals and energy resources. Intangible capital, such as institutional, social and human capital, is another category added by the World Bank. Studies based on this measure find that intangible capital is the largest and fastest growing form of capital thanks largely to educational advances in large developing countries (World Bank, 2011).
The recent Inclusive Wealth Report 2014 by the UN confirms the importance of human capital improvements since 1990. It shows that inclusive wealth can be significantly greater than GDP (e.g. ten times larger in the USA). It also shows how the inclusive wealth of a few countries has been reduced despite GDP improvements, due to the exhaustion of non-renewable natural resources (UNU-IHDP and UNEP, 2014). The latest milestone in this field is the adoption in 2015 of the 17 UN Sustainable Development Goals, which outline targets far broader than GDP alone (UN, 2015).
The broad body of existing work does not, however, reach a consensus on how to measure human welfare. Recent academic studies have compared the various measures (Giannetti et al., 2014). Some have concluded that welfare indicators should not replace but should complement GDP (Chancel et al., 2014).
Box 11: GDP and other measures of welfare
Welfare TradeJobs

3 3
ASSESSING ECONOMIC IMPACTS OF INCREASED RENEWABLE ENERGY DEPLOYMENT 02
for factors such as natural resource depletion and additional costs caused by health and environmental damage related to an economy’s chosen development path.
A review of the existing literature on welfare indicators has been used to identify three dimensions required for a comprehensive analysis. These are economic (consumption and investment in productive capital), social (including human capital improvements through health and education), and environmental (including the depletion of natural resources through consumption of materials). To explore the welfare impacts of increased renewable energy deployment, trying to go beyond the purely economic aspects captured by GDP, this report adopts a composite indicator of human wellbeing, comprising the three dimensions.
The proposed indicator includes, for the economic dimension, both consumption and investment, whereas other analyses base welfare only on consumption. This helps consider both
current consumption as a measure of present welfare and benefits resulting from a future more e«cient and sustainable economy where investment is counted as future consumption. On the social dimension, the proposed indicator includes a measure of expenditure on health and education. Health impacts from local air pollution are subtracted from this value. Lastly, the environmental impacts are summarised through greenhouse gas emissions26 and material consumption. In order to aggregate the components, the results for each are provided separately. Depending on the priorities, di¨erent weights can be attributed to derive
Doubling the share of renewables increases welfare
well beyond GDP growth
+2.7 to +3.7%
23. The latest methodology of the HDI (from 2010 onwards) is based on three sub-components: Gross National Income per capita (in USD purchasing power parity), life expectancy at birth and an education index composed of mean and expected years of schooling.
24. The English version can be found here: http://www.insee.fr/fr/publications-et-services/dossiers_web/stiglitz/doc-commission/RAPPORT_anglais.pdf
25. Comprising all human-made machinery, equipment and structures.
26. No climate feedbacks are included in the GDP estimates, as is standard in macroeconomic modelling exercises. There is therefore no double counting.
Consumption and Investment
Employment
Greenhouse gas emissions
Spending on health and education minus health impacts from local air pollution
Material consumption
Economic dimension
Social dimension
Environmental dimension Welfare
+
+
–
+
–

3 4
02 RENEWABLE ENERGY BENEFITS: MEASURING THE ECONOMICS
alternative values. In this report, equal weight is given to the economic, social and environmental dimensions (see Chapter 3).
The impact of renewable energy deployment on global welfare is positive, increasing by 2.7% (compared to 0.6% GDP improvement) if the share of renewables doubled. It would rise by 3.7% (compared to 1.1% GDP improvement) if achieved through the higher electrification of heat and transport. In other words, the benefits of renewable energy go beyond the traditional
and limited measurements of economic performance. They improve human welfare in a much broader manner and in a way that allows for future long-term growth and positive socio-economic development (Table 1).
The largest contributor to growth in this measure of welfare is the significant reduction of greenhouse gas emissions by 2030 (11% and 16% in the REmap and REmapE Cases respectively), followed by improved health and education and a reduced material consumption.
Table 1: Impact on welfare in main cases showing sensitivity with full crowding out (% from the Reference Case)27
Weight-ing
REmap (main case)
REmap (with full crowding out)
REmapE (main case)
RemapE (with full crowding out)
Economic dimension
Consumption + Investment 1/3 0.7 0.0 1.2 -0.2
Social dimension
Employment 1/6 0.1 -0.1 0.2 -0.2
Health and education 1/6 1.8 1.5 2.1 1.4
Environmental dimension
Greenhouse gas emissions28 (-) 1/6 -11.2 -11.2 -15.7 -15.7
Material consumption (-) 1/6 -1.6 -1.7 -1.9 -2.2
Total welfare impact 2.7 2.4 3.7 3.1
27. All the figures are expressed as percentage difference from the Reference Case, and the weightings are applied to obtain the total welfare impact (bottom row). A negative weighting is applied to the environmental indicators, where lower results indicate increased welfare.
28. Includes all greenhouse gasses. There is no valuation involved since the proposed welfare indicator, as explained in Chapter 3, calculates percentage changes of each sub-indicator in its own units (tonnes of CO2 equivalent in the case of greenhouse emissions).

35
ASSESSING ECONOMIC IMPACTS OF INCREASED RENEWABLE ENERGY DEPLOYMENT 02
Environmental e¨ects, currently not priced into most global economic systems, hence play an overwhelming role in improving overall welfare. If the weighting across the di¨erent dimensions were changed (e.g. to put a higher weighting on economic outcomes), the estimated total welfare impacts would be lower overall but would remain higher than the GDP impacts.
Intuitively, these results are not surprising. Some of the highest costs incurred by our economies include implicit economic losses through natural disasters caused by climate change, for example, or political conflicts over access to scarce natural resources. An overall improvement in the economy including growth in GDP at an aggregate level and per capita, as well as job creation, also increases tax collection
and disposable income, with some of these additional resources being spent on health and education. Reinforced by the reduced negative health e¨ects from air pollution, there are improvements on health and education components by around 2% in both cases.
Unlike when GDP is considered on its own, the welfare increase holds strong against the crowding out of capital, the most relevant sensitivity (see Chapter 3). This is primarily due to the continuously large positive e¨ect of renewables deployment on greenhouse gas emissions reduction and, to a lesser extent on material consumption.29 This result suggests that overall social welfare benefits are relatively independent from simple measures of economic growth such as GDP. Welfare improvements will
10
8
6
4
2
0
National welfare impacts% change vs the Reference Case
REmap REmapE
Den
mar
k
Ger
man
y
Fran
ce
Ital
y
UK
Res
t of E
U15
EU13
Turk
ey
Rus
sia
Ukr
aine
Res
t of O
ECD US
Can
ada
Aus
tral
ia
Japa
n
Kore
a
Chi
na
Indi
a
Indo
nesi
a
Res
t of A
SEA
N
Bra
zil
Mex
ico
Res
t of
Latin
Am
eric
aSo
uth
Afr
ica
Nig
eria
Saud
i Ara
bia
Res
t of O
PEC
Res
t of t
heW
orld
Figure 4: National welfare impacts (% di¨erence from the Reference Case)
29. Interestingly, where investment is displaced, material consumption is further reduced due to the decrease in investment and economic activity throughout the economy.

3 6
02 RENEWABLE ENERGY BENEFITS: MEASURING THE ECONOMICS
of course di¨er by country (Figure 4) but they are overall positive.
The highest welfare improvements are observed in countries such as India, Ukraine, the US, Australia, Indonesia, South Africa, China and Japan. This is primarily a response to the reduced health impact of air pollution and greenhouse gas emissions reductions. Developing economies are thus as likely as industrialised economies to benefit from changes to their economies from more substantial renewable energy deployment, assuming similarly conductive policy frameworks.
POSITIVE EFFECTS OF ENERGY ACCESS THROUGH RENEWABLES
Energy access plays an important role in analysing welfare. Access to reliable, cost-e¨ective and environmentally sustainable energy can have a multiplier e¨ect on development. This is the case for reduced health e¨ects, improved livelihoods, poverty alleviation, job creation, gender equality and enhanced access to water and food. This cross-cutting impact of energy is at the centre of the global discourse on the recently agreed Sustainable Development Goals. Globally, there are nearly 1.1 billion people who lack access to electricity and nearly 2.6 billion who rely on traditional biomass for heating (IEA and World Bank, 2015).
At the current pace of expansion, it is estimated that nearly 1 billion people will still lack access to electricity in 2030 and 2.5 billion will still be relying on traditional biomass for cooking (IEA, 2013). Achieving universal access would require annual investments to increase from the current USD 9 billion annually to nearly USD 50 billion (IEA and World Bank, 2015). This means substantial development impacts can be realised from investments in access delivery as well as from the downstream economic e¨ects. These impacts are specifically relevant to this analysis given the vital role renewable energy will play in meeting the objective of universal access to modern energy services (see Box 12).
Accounting for renewable energy deployment for expanded energy access would increase the welfare and other benefits estimated in this report even further. Over the past decade, several institutions have attempted to develop more comprehensive quantitative approaches for measuring access as well as its multi-faceted impacts. However, all these measures are based on existing data, which are inherently limited in scope. Despite this lack of data, there is growing evidence that o¨-grid renewable energy technologies can create significant
Box 12: Role of renewables in achieving universal access to modern energy services
Renewable energy solutions are well suited to expanding modern energy services in a timely and cost-e¨ective manner. An estimated 60% of the additional power generation required to achieve universal electricity access is projected to come from o¨-grid solutions – including both stand-alone and as mini-grids. Both are now among the most economic options for expanding access to many rural areas (IRENA, 2014d). These solutions can be deployed rapidly and customised to local needs. They o¨er an attractive option for electrifying areas where grid extension is technically or financially unviable.
O¨-grid renewable energy solutions are already deployed at scale bringing with them a wide array of socio-economic impacts. In Africa, where about 600 million people lack access, more than 28.5 million benefit from solar lighting products (Lighting Africa, 2015). Bangladesh has deployed over 3.86 million solar home systems, and these now provide basic electricity access to around 14% of the country’s population. More than 65,000 solar home systems are now installed every month under the programme. The programme replaces 180,000 metric tonnes (t) of kerosene per year, which has an estimated value of USD 225 million. Moreover, around 70,000 people are directly or indirectly employed in the o¨-grid solar sector.

3 7
ASSESSING ECONOMIC IMPACTS OF INCREASED RENEWABLE ENERGY DEPLOYMENT 02
value. This is related to additional household income and employment opportunities, both in the renewable energy supply chain and in downstream enterprises.
Few studies have attempted to quantify or consider these positive e¨ects, despite universal acknowledgement of the vital contribution of access to modern electricity to socio-economic development and economic growth. Some examples include the literature on renewable o¨-grid and mini-grid solutions in Southeast Asia, where energy poverty continues to be widespread among many rural communities (Bose et al., 2013; Mazumder et al., 2011; Khandker et al., 2009, World Bank, 2008). The costs and benefits of rural electrification can vary substantially between countries, thus limiting an extrapolation of case-based evidence for a global analysis. This report therefore
does not include an estimate of the impact of improving energy access while acknowledging its potentially large positive impact.
IRENA’s report The Socio-economic Benefits of Solar and Wind Energy presented a specific conceptual framework for analysing socio-economic e¨ects in the context of energy access (IRENA and CEM, 2014). A brief exploration of such a conceptual framework highlights the need for a comprehensive approach to collecting new data and analysing and disseminating the multi-faceted e¨ects of energy access initiatives. IRENA’s continuing analysis builds the knowledge base on the socio-economic impacts of o¨-grid renewable energy.
Renewable Energy Jobs & Access
A SERIES OF CASE STUDIES
Burkina FasovBiomass
PROJECT PROFILEFAFASO (“Foyers Améliorés au Faso” i.e., improved stoves in Burkina Faso) is a Dutch-German Energy Partner-ship Energising Development (GIZ-EnDEV) project that commenced in 2006 and is supported by co-financing from the Dutch Foreign Ministry (DGIS) and the German Ministry of International Cooperation (BMZ).
FAFASO covers all of Burkina Faso, with a focus on the biggest towns, Ouagadougou and Bobo Dioulasso, as well as the South-western and Eastern regions. The project helps to disseminate improved cookstoves (ICS) that save 35–80% of wood or charcoal compared to the traditional three-stone-fire. In 2006–2011, about 180 000 ICS were sold to households, institutions and productive units.
Most of the stoves disseminated are mobile, metal household stoves that are 35–45% more e�cient. For poorer households, a mobile ceramic stove is also available and saves 40% fuel.
In addition, FAFASO o�ers big mobile metal stoves for restaurants and school canteens (saving around 60%) as well as mud stoves for traditional beer brewing (saving about 80%).
The overall objective was to train ICS producers and help them sell the stoves commercially, so that dissemination would continue even in the absence of subsidies.
The project entails marketing (large-scale e�orts via TV and radio, small-scale cooking demonstrations, sales events, etc.), introduction of an ICS quality label, and e�orts to strengthen the commercial supply chain.
JOBS AND TRAININGTwo thirds of the overall budget of USD 3.2 million (up to late 2011) has gone into training and marketing e�orts; fixed costs for project personnel, etc. account for one third.
A typical training session involves an average of 30 trainees. By the end of 2010, FAFASO had trained a total of 729 people — 285 metal smiths, 264 masons, and 180 potters. The numbers expanded dramatically in 2009, when the project began to train masons and potters. In 2010, when very few potters were trained, the numbers were smaller.
These numbers cannot be considered to constitute new jobs. Rather, the individuals concerned are experienced craftsmen. The training o�ers them higher qualifications and an opportunity for a sustained role for themselves in the market. Many of the metal smiths and masons do employ apprentices.
Most of the potters are women in rural areas, whose main occupation remains work in the field and the household. But they acquire knowledge that helps them generate additional income (and cope with competition from plastic products). Pottery is caste-bound work dominated by certain families that are unlikely to employ apprentices.
As part of the training, all producers are taught to calculate the prices for the stoves, putting them in a better position in markets.
SUPPLY CHAINUpstream LinkagesThe stoves are produced domestically, in a decentralised, small-scale fashion. In general, the materials used are indigenous. Previously imported scrap metal is now locally procured, but this does not necessarily indicate increased demand and jobs.
JUNE 2012
Renewable Energy Jobs & Access
Box 13: IRENA’s work on renewable energy employment
Job creation is gaining prominence in the global renewable energy debate and represents a key argument strengthening the business case for renewables. IRENA’s work on renewable energy jobs (IRENA, 2011, 2012a&b, 2013a&b, 2014a and 2015a) helps bridge the knowledge gap on the topic. It provides a comprehensive view of the various dimensions of renewable energy employ- ment such as the current status and trends, future prospects, enabling policy frameworks, education and training requirements and energy access.
International Renewable Energy Agency
IRENA
IREN
A W
ORK
ING
PAP
ER
Renewable Energy Jobs:
STATUS, PROSPECTS & POLICIES
BIOFUELS AND GRID-CONNECTED ELECTRICITY GENERATION

3 8
02 RENEWABLE ENERGY BENEFITS: MEASURING THE ECONOMICS
2.3 DOUBLING RENEWABLES CREATES MORE JOBS
Jobs are instrumental to achieving economic and social development. Beyond their critical importance to wage generation and individual well-being, they are the core of many broader societal objectives, such as poverty reduction, economy-wide productivity growth and social cohesion. The development benefits from job creation include skills acquisition, female empowerment and improved stability in post-conflict societies. Jobs that contribute to these broader goals are valuable not only for those who hold them but for society as a whole (World Bank, 2012). It comes as no surprise, then, that job creation has been and will continue to remain a key priority for governments.
The creation of employment opportunities will be instrumental in ensuring sustainable growth in GDP and welfare. The global employment gap, which measures the number of jobs lost since the start of the 2008 economic crisis, currently stands at 61 million. If new labour market entrants are taken into account, an additional 280 million jobs need to be created by 2019 to close the employment gap (International Labour Organization, 2015). The employment gap has a ripple e¨ect throughout the economy which also illustrates the intimate interconnections between employment, wages, household consumption and aggregate demand.
Globally, the energy sector has played the dual role of fuelling economy-wide development and supporting a large number of jobs (World Economic Forum, 2012). In China, for
724
934
6533,390
437
371
176218
223
129
United States
Brazil
Rest of EU
India
China
Japan
Indonesia
Bangladesh
jobs in 2014
Germany
France
7.7 million
Figure 5: Renewable energy employment in selected countries as of 2014 (thousand jobs)
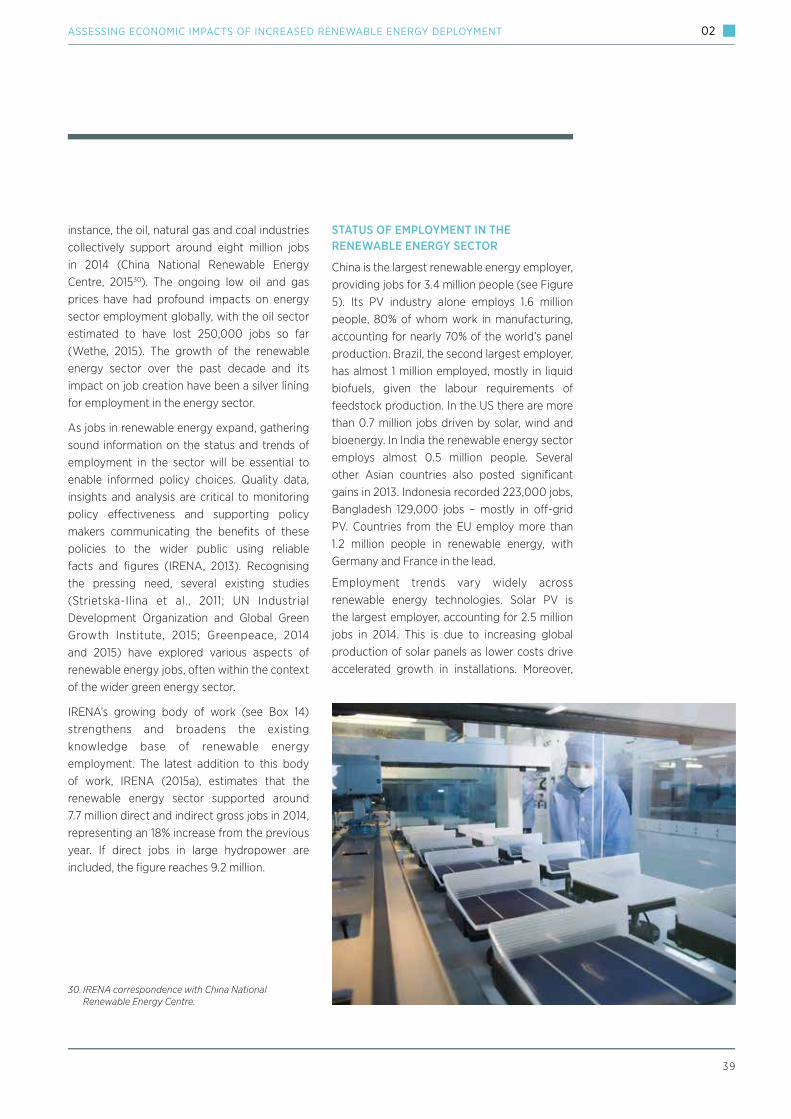
39
ASSESSING ECONOMIC IMPACTS OF INCREASED RENEWABLE ENERGY DEPLOYMENT 02
instance, the oil, natural gas and coal industries collectively support around eight million jobs in 2014 (China National Renewable Energy Centre, 201530). The ongoing low oil and gas prices have had profound impacts on energy sector employment globally, with the oil sector estimated to have lost 250,000 jobs so far (Wethe, 2015). The growth of the renewable energy sector over the past decade and its impact on job creation have been a silver lining for employment in the energy sector.
As jobs in renewable energy expand, gathering sound information on the status and trends of employment in the sector will be essential to enable informed policy choices. Quality data, insights and analysis are critical to monitoring policy e¨ectiveness and supporting policy makers communicating the benefits of these policies to the wider public using reliable facts and figures (IRENA, 2013). Recognising the pressing need, several existing studies (Strietska-Ilina et al., 2011; UN Industrial Development Organization and Global Green Growth Institute, 2015; Greenpeace, 2014 and 2015) have explored various aspects of renewable energy jobs, often within the context of the wider green energy sector.
IRENA’s growing body of work (see Box 14) strengthens and broadens the existing knowledge base of renewable energy employment. The latest addition to this body of work, IRENA (2015a), estimates that the renewable energy sector supported around 7.7 million direct and indirect gross jobs in 2014, representing an 18% increase from the previous year. If direct jobs in large hydropower are included, the figure reaches 9.2 million.
STATUS OF EMPLOYMENT IN THE RENEWABLE ENERGY SECTOR
China is the largest renewable energy employer, providing jobs for 3.4 million people (see Figure 5). Its PV industry alone employs 1.6 million people, 80% of whom work in manufacturing, accounting for nearly 70% of the world’s panel production. Brazil, the second largest employer, has almost 1 million employed, mostly in liquid biofuels, given the labour requirements of feedstock production. In the US there are more than 0.7 million jobs driven by solar, wind and bioenergy. In India the renewable energy sector employs almost 0.5 million people. Several other Asian countries also posted significant gains in 2013. Indonesia recorded 223,000 jobs, Bangladesh 129,000 jobs – mostly in o¨-grid PV. Countries from the EU employ more than 1.2 million people in renewable energy, with Germany and France in the lead.
Employment trends vary widely across renewable energy technologies. Solar PV is the largest employer, accounting for 2.5 million jobs in 2014. This is due to increasing global production of solar panels as lower costs drive accelerated growth in installations. Moreover,
30. IRENA correspondence with China National Renewable Energy Centre.
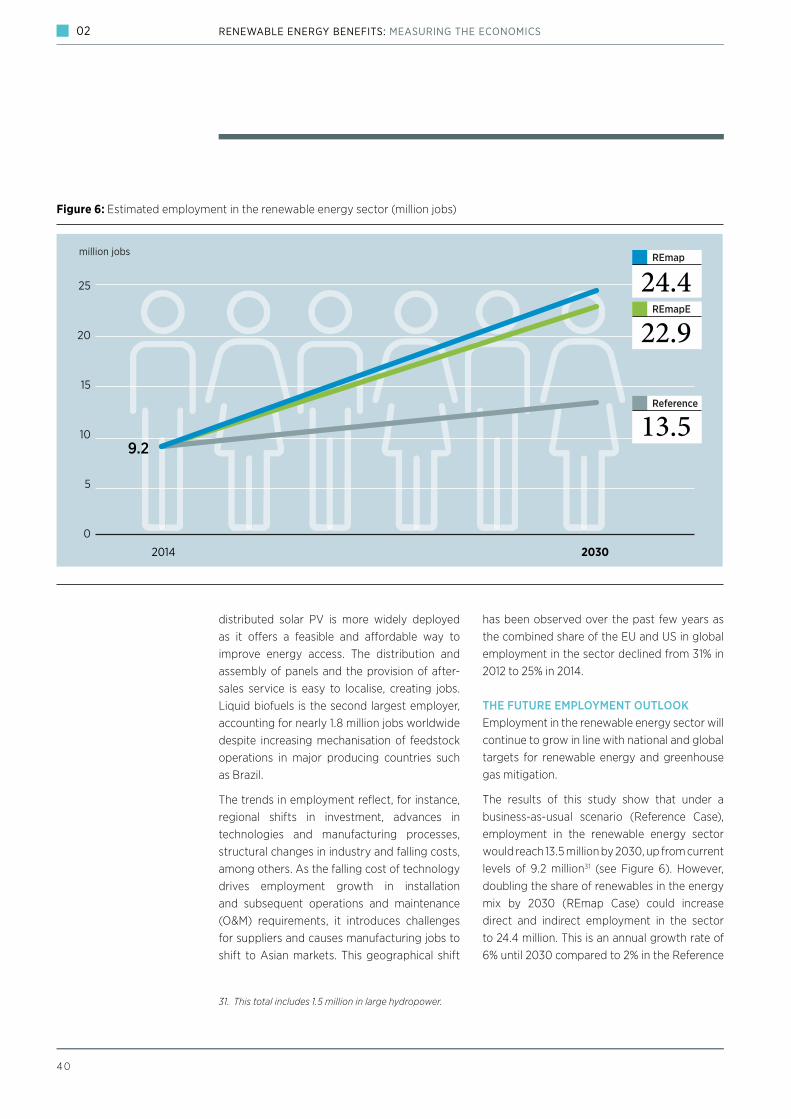
4 0
02 RENEWABLE ENERGY BENEFITS: MEASURING THE ECONOMICS
25
20
15
10
5
0
million jobs
2014 2030
REmap
REmapE
24.4
Reference
13.5
22.9
9.2
Figure 6: Estimated employment in the renewable energy sector (million jobs)
distributed solar PV is more widely deployed as it o¨ers a feasible and a¨ordable way to improve energy access. The distribution and assembly of panels and the provision of after-sales service is easy to localise, creating jobs. Liquid biofuels is the second largest employer, accounting for nearly 1.8 million jobs worldwide despite increasing mechanisation of feedstock operations in major producing countries such as Brazil.
The trends in employment reflect, for instance, regional shifts in investment, advances in technologies and manufacturing processes, structural changes in industry and falling costs, among others. As the falling cost of technology drives employment growth in installation and subsequent operations and maintenance (O&M) requirements, it introduces challenges for suppliers and causes manufacturing jobs to shift to Asian markets. This geographical shift
has been observed over the past few years as the combined share of the EU and US in global employment in the sector declined from 31% in 2012 to 25% in 2014.
THE FUTURE EMPLOYMENT OUTLOOKEmployment in the renewable energy sector will continue to grow in line with national and global targets for renewable energy and greenhouse gas mitigation.
The results of this study show that under a business-as-usual scenario (Reference Case), employment in the renewable energy sector would reach 13.5 million by 2030, up from current levels of 9.2 million31 (see Figure 6). However, doubling the share of renewables in the energy mix by 2030 (REmap Case) could increase direct and indirect employment in the sector to 24.4 million. This is an annual growth rate of 6% until 2030 compared to 2% in the Reference
31. This total includes 1.5 million in large hydropower.
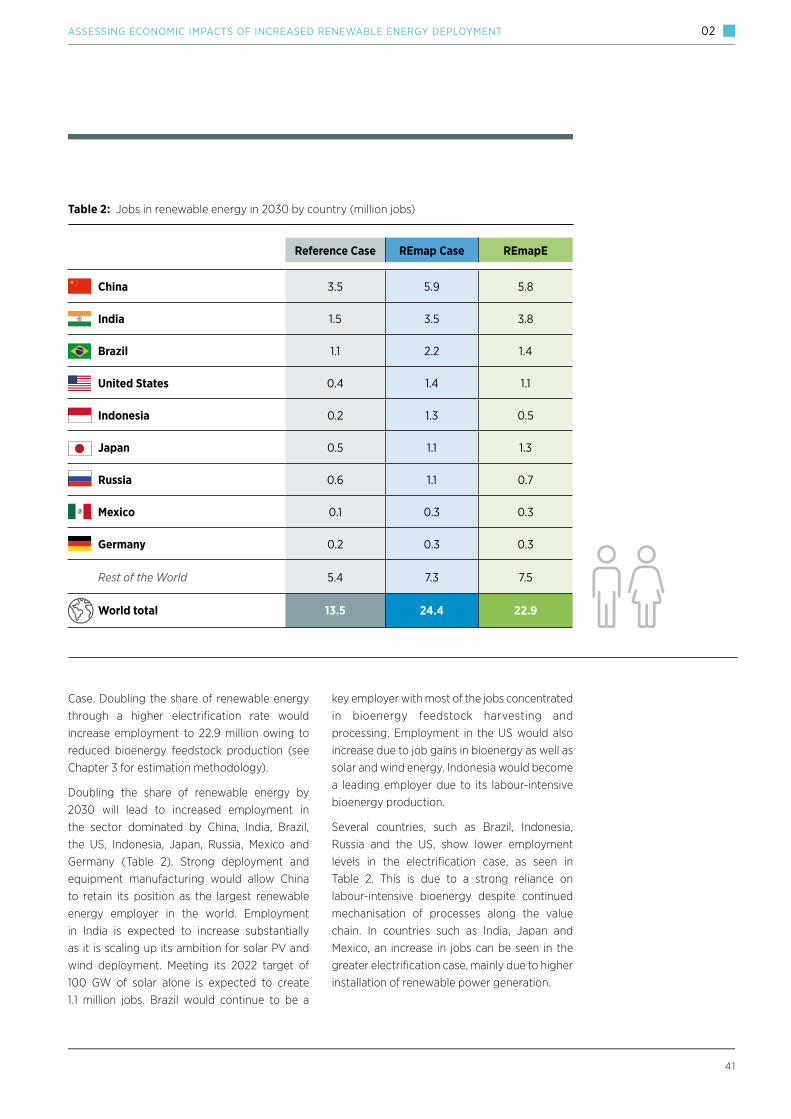
41
ASSESSING ECONOMIC IMPACTS OF INCREASED RENEWABLE ENERGY DEPLOYMENT 02
Table 2: Jobs in renewable energy in 2030 by country (million jobs)
Reference Case REmap Case REmapE
China 3.5 5.9 5.8
India 1.5 3.5 3.8
Brazil 1.1 2.2 1.4
United States 0.4 1.4 1.1
Indonesia 0.2 1.3 0.5
Japan 0.5 1.1 1.3
Russia 0.6 1.1 0.7
Mexico 0.1 0.3 0.3
Germany 0.2 0.3 0.3
Rest of the World 5.4 7.3 7.5
World total 13.5 24.4 22.9
Case. Doubling the share of renewable energy through a higher electrification rate would increase employment to 22.9 million owing to reduced bioenergy feedstock production (see Chapter 3 for estimation methodology).
Doubling the share of renewable energy by 2030 will lead to increased employment in the sector dominated by China, India, Brazil, the US, Indonesia, Japan, Russia, Mexico and Germany (Table 2). Strong deployment and equipment manufacturing would allow China to retain its position as the largest renewable energy employer in the world. Employment in India is expected to increase substantially as it is scaling up its ambition for solar PV and wind deployment. Meeting its 2022 target of 100 GW of solar alone is expected to create 1.1 million jobs. Brazil would continue to be a
key employer with most of the jobs concentrated in bioenergy feedstock harvesting and processing. Employment in the US would also increase due to job gains in bioenergy as well as solar and wind energy. Indonesia would become a leading employer due to its labour-intensive bioenergy production.
Several countries, such as Brazil, Indonesia, Russia and the US, show lower employment levels in the electrification case, as seen in Table 2. This is due to a strong reliance on labour-intensive bioenergy despite continued mechanisation of processes along the value chain. In countries such as India, Japan and Mexico, an increase in jobs can be seen in the greater electrification case, mainly due to higher installation of renewable power generation.

42
02 RENEWABLE ENERGY BENEFITS: MEASURING THE ECONOMICS
Employment in the renewable energy sector in 2030 is expected to remain concentrated in the same technologies as it is today (solar, bioenergy, large and small hydropower and wind) with minor shifts depending on the case. In the first doubling case, bioenergy is the leading technology. By contrast, solar energy is the largest employer in the electrification case where employment in other power producing technologies, such as hydropower and wind, also increase (Table 3).
Depending on the technology, the jobs will be distributed along di¨erent segments of the value chain. This includes equipment manufacturing, construction and installation, operation and maintenance, and fuel supply in the case of bioenergy. The results, presented in Table 4, show a steady increase in the number of jobs in hydropower, solar and wind throughout all these activities as we move between both cases. This is because more renewable power generation is needed, including from bioenergy. However, the reduced use of bioenergy for heat and transport reduces jobs in fuel supply. Doubling the renewables share with higher electrification adds more than 2.5 million direct and indirect installation and equipment manufacturing jobs combined due to the increased need for renewable power capacity. Jobs in bioenergy fuel supply, however, stay at levels equivalent to the Reference Case.
While accelerated renewable deployment will create employment opportunities across the value chain, it will also demand a wide range of
Table 3: Estimated direct and indirect employment in the renewable energy sector by technology (million jobs)
* The jobs in large hydropower in 2014 are direct only.
2014 Reference2030
REmap Case2030
REmapE2030
Bioenergy 3.0 4.4 9.0 4.9
Hydropower (small and large)
1.7* 4.8 5.5 6.4
Solar (including solar water heating)
3.3 2.6 6.4 7.2
Wind 1.0 1.7 3.3 4.1
Other renewables 0.2 0.1 0.2 0.2
World total 9.2 13.5 24.4 22.8

43
ASSESSING ECONOMIC IMPACTS OF INCREASED RENEWABLE ENERGY DEPLOYMENT 02
Table 4: Distribution of renewable energy jobs along the various segments of value chain (million jobs)
World total
Hydro- power Wind Solar
Bio- energy Other RE
Construction and installation
Reference 5.2 2.7 0.8 1.4 0.3 0.1
REmap 8.5 3.0 1.6 3.3 0.5 0.1
REmapE 9.7 3.4 1.9 3.7 0.6 0.1
Manufacturing
Reference 2.8 1.3 0.7 0.7 0.1 0.0
REmap 5.5 1.8 1.4 2.0 0.2 0.1
REmapE 6.7 2.2 1.8 2.4 0.2 0.1
O&M
Reference 2.8 1.3 0.7 0.7 0.1 0.0
REmap 5.5 1.8 1.4 2.0 0.2 0.1
REmapE 6.7 2.2 1.8 2.4 0.2 0.1
Fuel Supply
Reference 3.9 3.9
REmap 8.1 8.1
REmapE 3.9 3.9
All Segments
Reference 13.5 4.8 1.7 2.6 4.4 0.1
REmap 24.4 5.5 3.3 6.4 9.0 0.2
REmapE 22.8 6.4 4.1 7.2 4.9 0.2
skills and workforce capabilities. This raises the possibility of skills gaps and labour shortages, which are already obstructing the transition to sustainable energy in many countries (IRENA, 2013). Going forward, better training and education will play a crucial role in ensuring that renewable energy becomes a reliable part of the global energy system.
JOBS IN THE ENERGY SECTOR IN 2030
Looking beyond renewable energy, employment in the broader energy sector will also increase in both cases analysed (Table 5). While employment in the fossil fuel sector decreases due to lower fossil fuel demand in both cases, the nuclear sector remains stable. It shows only a slight increase in employment (6%) in the REmapE Case to compensate for the increased needs of power generation. Despite the reduction in the conventional energy sectors, the increase in renewable energy employment in both cases is such that overall energy sector employment remains larger when renewable energy is doubled. This includes not
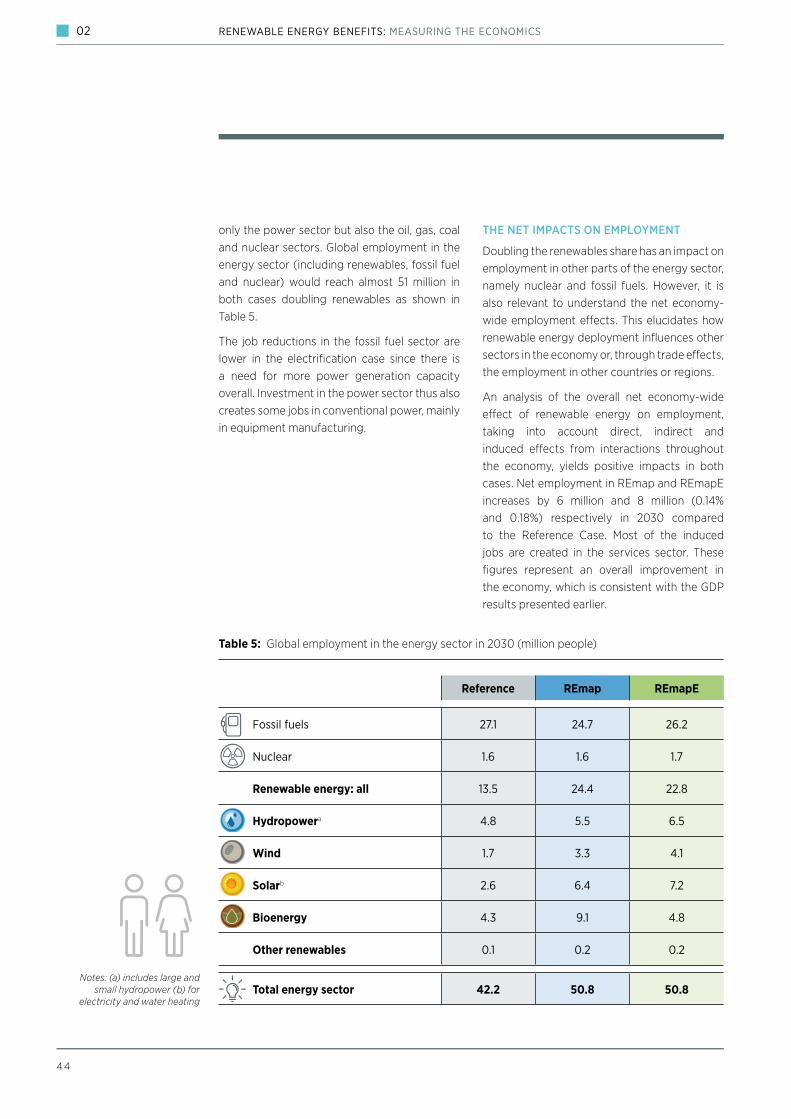
4 4
02 RENEWABLE ENERGY BENEFITS: MEASURING THE ECONOMICS
only the power sector but also the oil, gas, coal and nuclear sectors. Global employment in the energy sector (including renewables, fossil fuel and nuclear) would reach almost 51 million in both cases doubling renewables as shown in Table 5.
The job reductions in the fossil fuel sector are lower in the electrification case since there is a need for more power generation capacity overall. Investment in the power sector thus also creates some jobs in conventional power, mainly in equipment manufacturing.
THE NET IMPACTS ON EMPLOYMENT
Doubling the renewables share has an impact on employment in other parts of the energy sector, namely nuclear and fossil fuels. However, it is also relevant to understand the net economy-wide employment e¨ects. This elucidates how renewable energy deployment influences other sectors in the economy or, through trade e¨ects, the employment in other countries or regions.
An analysis of the overall net economy-wide e¨ect of renewable energy on employment, taking into account direct, indirect and induced e¨ects from interactions throughout the economy, yields positive impacts in both cases. Net employment in REmap and REmapE increases by 6 million and 8 million (0.14% and 0.18%) respectively in 2030 compared to the Reference Case. Most of the induced jobs are created in the services sector. These figures represent an overall improvement in the economy, which is consistent with the GDP results presented earlier.
Table 5: Global employment in the energy sector in 2030 (million people)
Notes: (a) includes large and small hydropower (b) for
electricity and water heating
Reference REmap REmapE
Fossil fuels 27.1 24.7 26.2
Nuclear 1.6 1.6 1.7
Renewable energy: all 13.5 24.4 22.8
Hydropowera 4.8 5.5 6.5
Wind 1.7 3.3 4.1
Solarb 2.6 6.4 7.2
Bioenergy 4.3 9.1 4.8
Other renewables 0.1 0.2 0.2
Total energy sector 42.2 50.8 50.8

45
ASSESSING ECONOMIC IMPACTS OF INCREASED RENEWABLE ENERGY DEPLOYMENT 02
2.4 A HIGHER SHARE OF RENEWABLES SHIFTS PATTERNS OF GLOBAL TRADE
The global market for goods and services permits their exchange and transfer and thereby acts as a key enabler for economic development. The past two decades have seen a substantial increase in the global export value of goods and services, quadrupling from USD 6.3 trillion in 1995 to USD 23.4 trillion in 2014. Consequently, total global exports account for a rising share of global GDP, growing from 20% in 1995 to 30% in 2014 (World Trade Organization, 2015).
World fuel exports have increased more than any other traded product over the past two decades, with an average annual growth rate of 12%. Measured in current US dollars, fuel exports in 2014 were more than eight times higher than in 1995. Fuels represented 17% of the world’s total exports in 2014 (up from 7% in 1995). The majority of countries are net fuel importers, and fuel exports are highly concentrated in a handful of countries.
Large economies, such as Japan, China, India and the EU, spend up to 7% of their GDP on energy imports. These values are in the same order of magnitude as expenditure on public health (3% in China, 8% in Japan) and education (under 4% in most countries of the world) (World Bank, 2015a). For these countries, renewable energy deployment could reduce imports. This e¨ect could act as a significant economic benefit, specifically for countries with large trade balance deficits.
A global scale-up in renewable energy deployment provides additional opportunities for all economies to meet growing demands for associated goods and services, including energy equipment. It also presents challenges, particularly for economies heavily reliant on fossil fuel exports. Therefore, a transition towards a greater share of renewables in the global energy mix will bring about a shift in trade and energy linkages and have impacts at the global and national level.
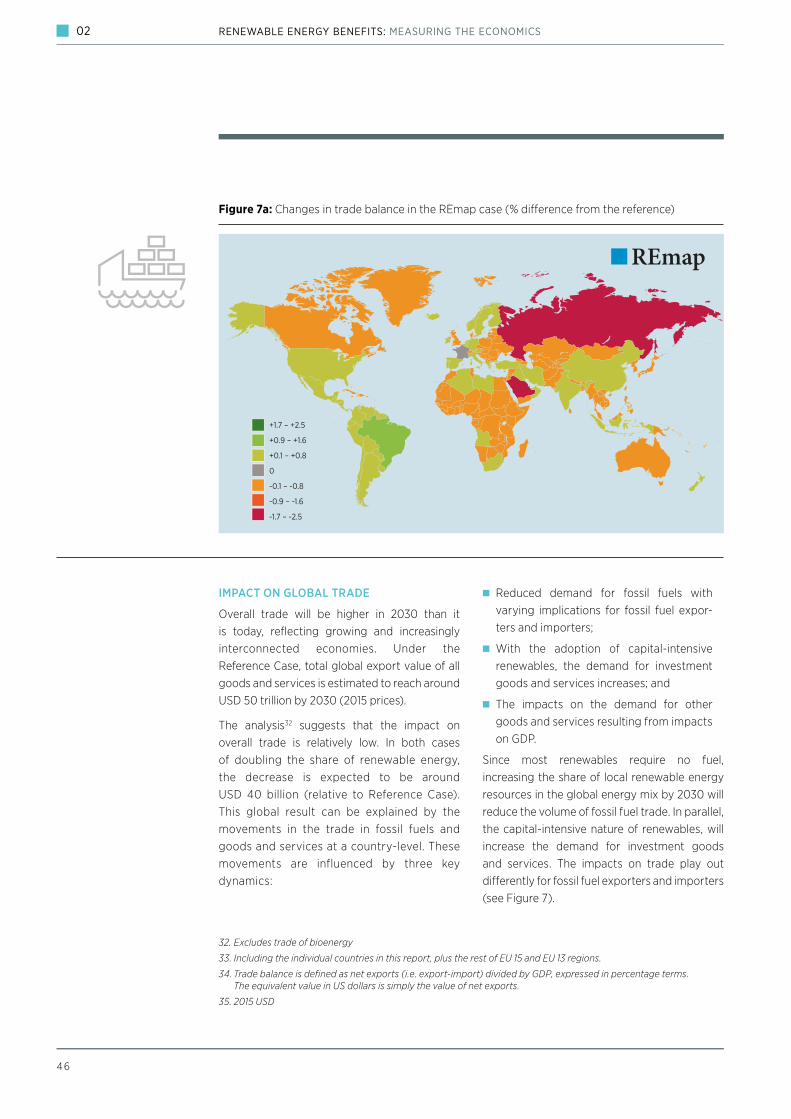
4 6
02 RENEWABLE ENERGY BENEFITS: MEASURING THE ECONOMICS
IMPACT ON GLOBAL TRADE
Overall trade will be higher in 2030 than it is today, reflecting growing and increasingly interconnected economies. Under the Reference Case, total global export value of all goods and services is estimated to reach around USD 50 trillion by 2030 (2015 prices).
The analysis32 suggests that the impact on overall trade is relatively low. In both cases of doubling the share of renewable energy, the decrease is expected to be around USD 40 billion (relative to Reference Case). This global result can be explained by the movements in the trade in fossil fuels and goods and services at a country-level. These movements are influenced by three key dynamics:
Reduced demand for fossil fuels with varying implications for fossil fuel expor-ters and importers;
With the adoption of capital-intensive renewables, the demand for investment goods and services increases; and
The impacts on the demand for other goods and services resulting from impacts on GDP.
Since most renewables require no fuel, increasing the share of local renewable energy resources in the global energy mix by 2030 will reduce the volume of fossil fuel trade. In parallel, the capital-intensive nature of renewables, will increase the demand for investment goods and services. The impacts on trade play out di¨erently for fossil fuel exporters and importers (see Figure 7).
Denmark Germany France Italy UK Rest of EU15 EU13 Turkey Russia Ukraine Rest of OECD nes US Canada Australia Japan Korea China India Indonesia Rest of ASEAN Brazil Mexico Rest of Latin America South Africa Nigeria Saudi Arabia Rest of OPEC Rest of the WorldBoT change vs Ref -0,2% 0,1% 0,0% 0,2% -0,2% 0,2% -0,2% 0,2% -2,2% -0,8% 0,1% 0,1% -0,1% -0,2% -0,1% -0,3% 0,1% 0,2% 0,2% -0,2% 1,0% 0,1% 0,3% BoT change vs Ref 0,5% 0,1% 0,1% 0,1% -0,1% 0,2% -0,2% 0,5% -1,8% -1,7% 0,0% 0,2% -0,8% -0,2% 0,0% 0,2% 0,4% 0,3% 0,1% 0,0% 0,9% 0,1% 0,1%
REmap
+1.7 – +2.5
+0.9 – +1.6
+0.1 – +0.8
0
-0.1 – -0.8
-0.9 – -1.6
-1.7 – -2.5
+1.7 – +2.5
+0.9 – +1.6
+0.1 – +0.8
0
-0.1 – -0.8
-0.9 – -1.6
-1.7 – -2.5
Figure 7a: Changes in trade balance in the REmap case (% di¨erence from the reference)
32. Excludes trade of bioenergy
33. Including the individual countries in this report, plus the rest of EU 15 and EU 13 regions.
34. Trade balance is defined as net exports (i.e. export-import) divided by GDP, expressed in percentage terms. The equivalent value in US dollars is simply the value of net exports.
35. 2015 USD
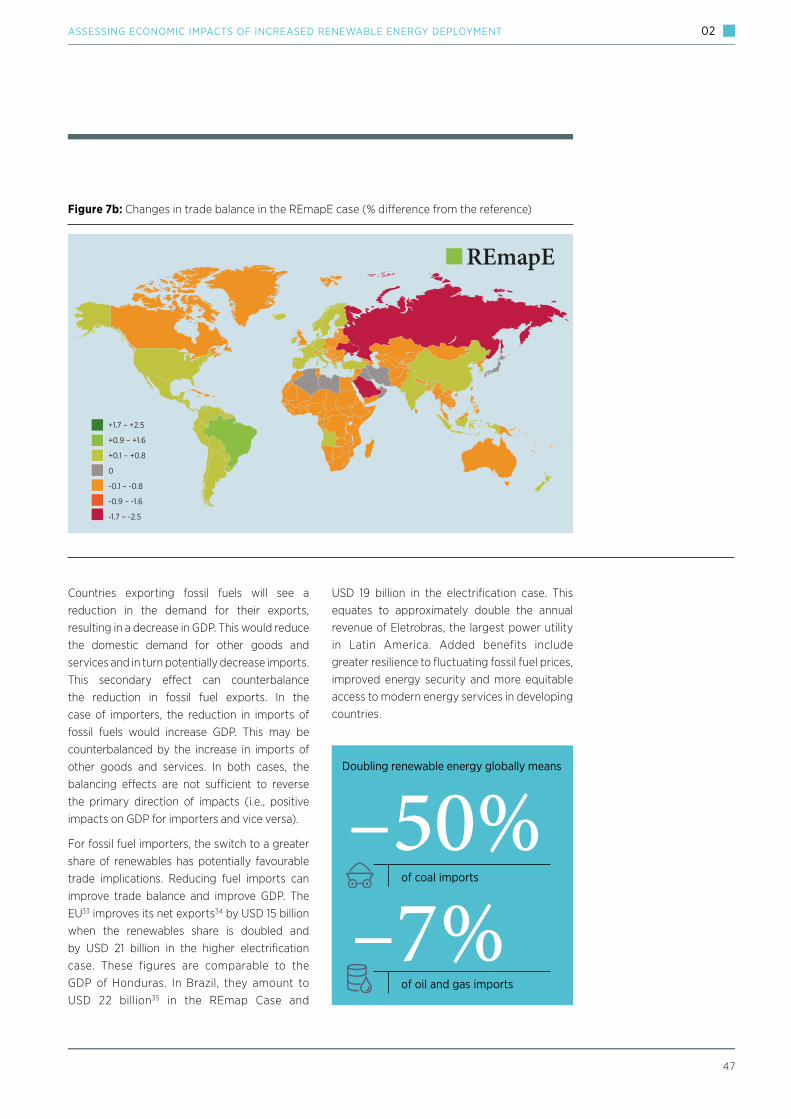
47
ASSESSING ECONOMIC IMPACTS OF INCREASED RENEWABLE ENERGY DEPLOYMENT 02
Countries exporting fossil fuels will see a reduction in the demand for their exports, resulting in a decrease in GDP. This would reduce the domestic demand for other goods and services and in turn potentially decrease imports. This secondary e¨ect can counterbalance the reduction in fossil fuel exports. In the case of importers, the reduction in imports of fossil fuels would increase GDP. This may be counterbalanced by the increase in imports of other goods and services. In both cases, the balancing e¨ects are not su«cient to reverse the primary direction of impacts (i.e., positive impacts on GDP for importers and vice versa).
For fossil fuel importers, the switch to a greater share of renewables has potentially favourable trade implications. Reducing fuel imports can improve trade balance and improve GDP. The EU33 improves its net exports34 by USD 15 billion when the renewables share is doubled and by USD 21 billion in the higher electrification case. These figures are comparable to the GDP of Honduras. In Brazil, they amount to USD 22 billion35 in the REmap Case and
USD 19 billion in the electrification case. This equates to approximately double the annual revenue of Eletrobras, the largest power utility in Latin America. Added benefits include greater resilience to fluctuating fossil fuel prices, improved energy security and more equitable access to modern energy services in developing countries.
Denmark Germany France Italy UK Rest of EU15 EU13 Turkey Russia Ukraine Rest of OECD nes US Canada Australia Japan Korea China India Indonesia Rest of ASEAN Brazil Mexico Rest of Latin America South Africa Nigeria Saudi Arabia Rest of OPEC Rest of the World0,1% -0,1% -0,2% -0,1% -0,3% 0,1% 0,2% 0,2% -0,2% 1,0% 0,1% 0,3% 0,1% -0,2% -1,8% 0,2% -0,1%0,2% -0,8% -0,2% 0,0% 0,2% 0,4% 0,3% 0,1% 0,0% 0,9% 0,1% 0,1% -0,5% -0,4% -2,5% 0,2% -0,3%
REmap
+1.7 – +2.5
+0.9 – +1.6
+0.1 – +0.8
0
-0.1 – -0.8
-0.9 – -1.6
-1.7 – -2.5
REmapE
Figure 7b: Changes in trade balance in the REmapE case (% di¨erence from the reference)
Doubling renewable energy globally means
of coal imports
of oil and gas imports
–50%–7%
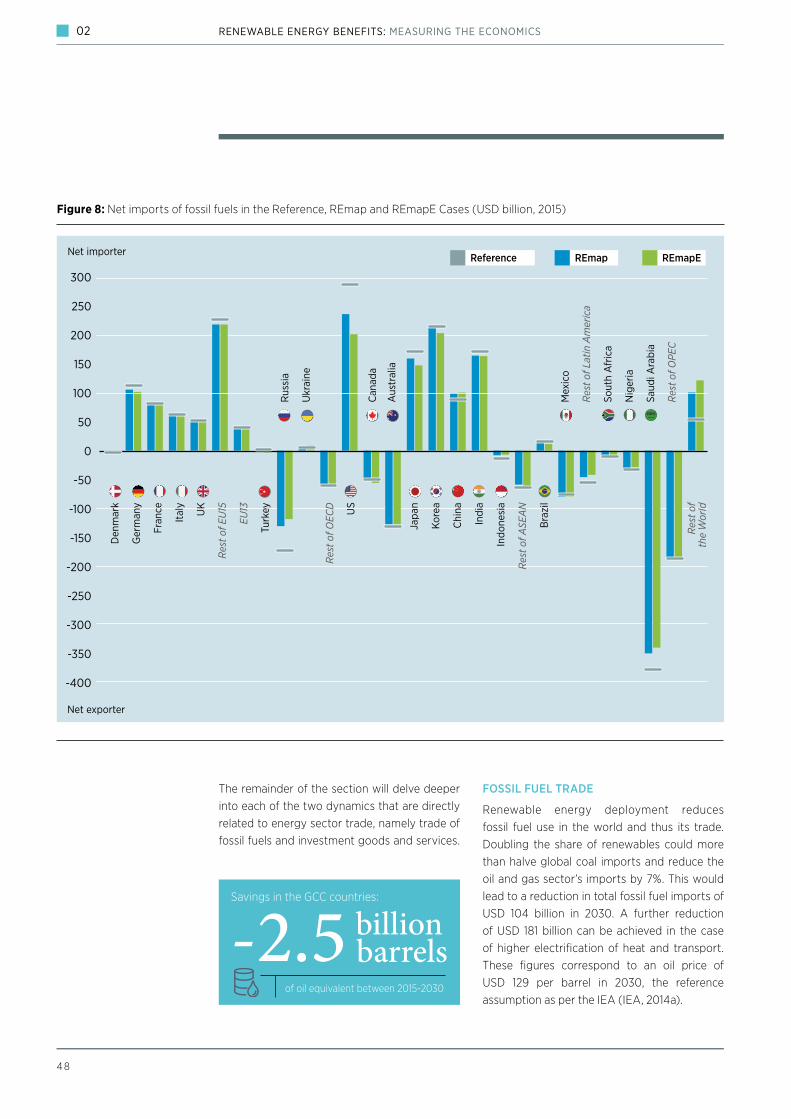
4 8
02 RENEWABLE ENERGY BENEFITS: MEASURING THE ECONOMICS
The remainder of the section will delve deeper into each of the two dynamics that are directly related to energy sector trade, namely trade of fossil fuels and investment goods and services.
FOSSIL FUEL TRADE
Renewable energy deployment reduces fossil fuel use in the world and thus its trade. Doubling the share of renewables could more than halve global coal imports and reduce the oil and gas sector’s imports by 7%. This would lead to a reduction in total fossil fuel imports of USD 104 billion in 2030. A further reduction of USD 181 billion can be achieved in the case of higher electrification of heat and transport. These figures correspond to an oil price of USD 129 per barrel in 2030, the reference assumption as per the IEA (IEA, 2014a).
300
250
200
150
100
50
0
-50
-100
-150
-200
-250
-300
-350
-400
Net importer
Den
mar
k
Ger
man
y
Fran
ce
Ital
y
UK
Res
t of E
U15
EU13
Turk
ey
Res
t of O
ECD
Japa
n
Kore
a
Chi
na
Indi
a
Indo
nesi
a
Res
t of A
SEA
N
Bra
zil
Res
t of
the
Wor
ldNet exporter
Rus
sia
Ukr
aine
US
Can
ada
Aus
tral
ia
Mex
ico
Res
t of L
atin
Am
eric
a
Sout
h A
fric
a
Nig
eria
Saud
i Ara
bia
Res
t of O
PEC
REmap REmapEReference
Figure 8: Net imports of fossil fuels in the Reference, REmap and REmapE Cases (USD billion, 2015)
Savings in the GCC countries:
of oil equivalent between 2015-2030
-2.5 billionbarrels
49
ASSESSING ECONOMIC IMPACTS OF INCREASED RENEWABLE ENERGY DEPLOYMENT 02
Importing countries that stand to benefit most from the doubling of the share of renewable energy include the US, Japan, India, Germany, Republic of Korea and the other EU 15 countries (see Figure 8). Reductions are larger in the greater electrification case, where fossil fuel demand for heat and transport is lower.
Energy exporters will see an overall reduction in coal, oil and gas exports as demand for these commodities is o¨set by increasing renewable energy use. This does not mean that all fossil fuel exporters will be equally a¨ected, however. Where the reductions in fossil fuel production take place depends largely on the relative extraction costs, which in the analysis is based on a supply curve36 approach. In the Reference Case, the production of unconventional sources (e.g. shale, deep sea and Arctic oil) increases compared to current levels in the period out to 2030. This is due to the overall increase in demand. However, there is much less expansion of unconventional oil in the cases in which the share of renewable energy doubles, given its higher extraction costs. This suggests that the majority of ‘stranded assets’ would be from unconventional sources in these cases37. Fossil fuel production among low-cost producers (e.g. members of the Organization of Petroleum Exporting Countries) would thus be only marginally reduced.
The macroeconomic e¨ect of reduced exports on national economies varies. Greater impacts are seen in countries where fossil fuel exports account for a larger share of GDP, suggesting that the countries most a¨ected would include Saudi Arabia and Venezuela (where oil exports account for 25% of GDP) (World Bank, 2015a; Devaux, 2013), plus Nigeria and Russia (where oil exports account for 15% of GDP). In addition,
coal exports account for around 8% of GDP in Australia and 5% of GDP in South Africa. Comparing the results for Australia and Saudi Arabia is illustrative; a 4% fall in coal exports from Australia causes its GDP to fall by 0.2%, while a 6.6% reduction in Saudi Arabia’s oil exports leads to a 1.8% reduction in GDP.
When considering export revenues it should also be remembered that fuel prices do not change in the analysis (see Chapter 3). If accelerated deployment of renewables led to lower global fuel prices, the impacts on the value of trade would increase in magnitude, both for fuel exporters and importers.
For fuel exporters, a timely reduction in the contribution of fossil fuels to total GDP would thus considerably reduce the risks associated with the energy transition. The renewable energy plans and targets in the Gulf Cooperation Council countries, for instance, could result in cumulative savings of 2.5 billion barrels of oil equivalent between 2015 and 2030. This equates to USD 55-87 billion (IRENA (2016a)). Even for countries exporting fuel, reducing domestic fuel consumption could have benefits, as the fuel savings could be added to exports, mitigating some of the loss of revenues.
The analysis presented here does not account for impacts on the trade of bioenergy, which could provide opportunities for some countries, such as Russia. While most national plans include increased bioenergy use, not all countries are endowed with the resources to meet growing demand, so inter-regional and possibly global trade in both solid and liquid bioenergy will be needed. The past decade has seen positive trends in both solid biomass and biofuel production and trade and this is likely to continue.
36. A supply curve relates the costs of production of each unit of energy to the total production. It is normally an upward curve, since cheaper production takes place first. By using such an approach, the model in this report allocates fossil fuel production in order of increasing unitary costs until all demand is covered.
37. See discussion in McGlade and Ekins (2015). In addition, the low oil prices experienced in 2015/2016 have provided some context for this. Investment in costly sources has been scaled back at times when extraction does not appear economically viable, while production by conventional producers has not changed.
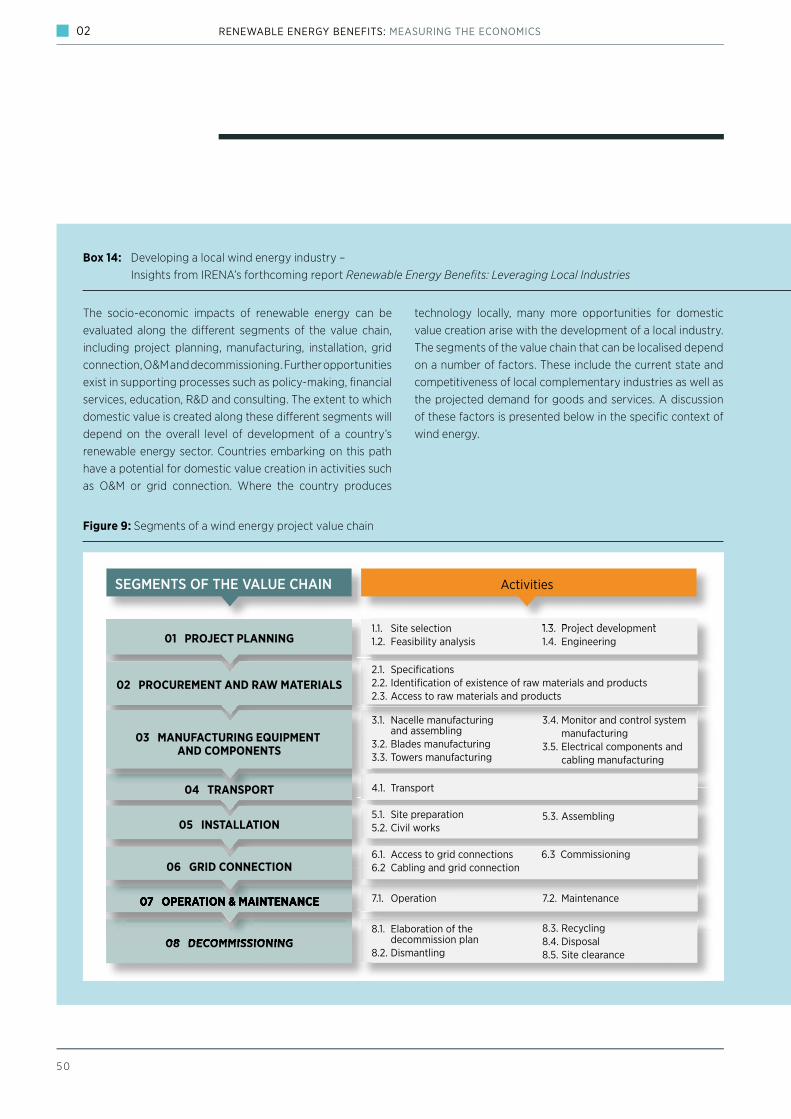
5 0
02 RENEWABLE ENERGY BENEFITS: MEASURING THE ECONOMICS
Box 14: Developing a local wind energy industry – Insights from IRENA’s forthcoming report Renewable Energy Benefits: Leveraging Local Industries
The socio-economic impacts of renewable energy can be evaluated along the di¨erent segments of the value chain, including project planning, manufacturing, installation, grid connection, O&M and decommissioning. Further opportunities exist in supporting processes such as policy-making, financial services, education, R&D and consulting. The extent to which domestic value is created along these di¨erent segments will depend on the overall level of development of a country’s renewable energy sector. Countries embarking on this path have a potential for domestic value creation in activities such as O&M or grid connection. Where the country produces
technology locally, many more opportunities for domestic value creation arise with the development of a local industry. The segments of the value chain that can be localised depend on a number of factors. These include the current state and competitiveness of local complementary industries as well as the projected demand for goods and services. A discussion of these factors is presented below in the specific context of wind energy.
01 PROJECT PLANNING1.3. Project development1.4. Engineering
3.4. Monitor and control system manufacturing3.5. Electrical components and cabling manufacturing
SEGMENTS OF THE VALUE CHAIN
1.3. Project development
Activities
02 PROCUREMENT AND RAW MATERIALS
08 DECOMMISSIONING
03 MANUFACTURING EQUIPMENT AND COMPONENTS
04 TRANSPORT
08 DECOMMISSIONING
07 OPERATION & MAINTENANCE07 OPERATION & MAINTENANCE
05 INSTALLATION
06 GRID CONNECTION
1.1. Site selection1.2. Feasibility analysis
2.1. Specifications 2.2. Identification of existence of raw materials and products2.3. Access to raw materials and products
3.1. Nacelle manufacturing and assembling3.2. Blades manufacturing3.3. Towers manufacturing
4.1. Transport
5.1. Site preparation5.2. Civil works
6.1. Access to grid connections 6.2 Cabling and grid connection
7.1. Operation
8.1. Elaboration of the decommission plan8.2. Dismantling
5.3. Assembling
7.2. Maintenance
8.3. Recycling8.4. Disposal8.5. Site clearance
6.3 Commissioning
Figure 9: Segments of a wind energy project value chain

5 1
ASSESSING ECONOMIC IMPACTS OF INCREASED RENEWABLE ENERGY DEPLOYMENT 02
Developing a wind energy project involves a wide array of activities and inputs along di¨erent segments of the value chain (Figure 8). Given that the majority of the project lifetime cost relates to the development phase, there is an incentive for governments to make e¨orts to support a domestic industry and localise as many activities as possible. This would create local jobs, reduce reliance on equipment and skills imports, and stimulate the local economy. For instance, between 64% and 85% of the total cost of a wind project is directed towards the turbines, which primarily include the tower, drivetrain and rotor blades. Countries have traditionally opted to produce towers and rotor blades domestically given the logistical challenges and costs associated with transporting them over long distances. The drivetrain or gearbox is a high-value component requiring advanced technological knowhow and resources to carry out regular O&M on operating systems (unlike towers and blades). Given these complexities, not all countries are willing to pursue the development of capacity to build gearboxes locally. Other segments of the value chain, such as installation and grid connection, also present potential opportunities for local value creation.
Identifying which segments of the value chain can be localised requires a careful assessment of the needs and the available resources and infrastructure. In this context, IRENA’s report Renewable Energy Benefits: Leveraging Local Industries analyses the activities involved along di¨erent segments of the value chain of solar and wind projects. It outlines the requirements in terms of manufacturing capacities, skills, raw material availability, access to financing and the presence of an enabling environment to support the development of a domestic industry. This would assist policy makers assessing the local services and components needed to develop projects and the strategic drivers to develop renewable energy industries.
Source: Renewable Energy Benefits: Leveraging Local Industries (forthcoming)

52
02 RENEWABLE ENERGY BENEFITS: MEASURING THE ECONOMICS
INVESTMENT GOODS AND SERVICES TRADE
Given the capital-intensive nature of renewable energy technologies, an increase in the demand for investment goods and services (e.g. solar panels, turbines, construction materials and engineering services) is expected as nearly all countries considered in the analysis scale-up renewable energy adoption. As industrial capacity varies from country to country, the e¨ects of how the increase in demand for renewable equipment will be met is less clear compared to fossil fuels. What is clear is that new markets will emerge, creating new trade flows while also providing opportunities for all economies in localising di¨erent segments of the renewable energy value chain. Some of these segments, such as construction material and service, are more easily localised. Additional opportunities lie in manufacturing, which can have larger economy-wide positive e¨ects in the case of increased exports as estimated for Germany (Edler, 2012).
Countries that already export renewables equipment clearly have a comparative advantage. As the market for renewable energy goods and services expands, economies of scale allow manufacturers to further commercialise technologies while the resulting falling costs in turn render their products increasingly competitive. Renewable energy technologies have the advantage of being largely transferrable across countries and continents. They open up opportunities to a wide range of countries, including in the developing world. Several developing countries have significantly increased their exports of renewable energy equipment such as solar panels, wind turbines and solar water heaters. China is a case in point. Having pursued an aggressive industrial policy early on, it has emerged as a major exporter of renewable energy. It exported over USD 10 billion in solar panels and cells, almost 80 times the value it exported only ten years earlier (UNEP, 2013). As countries develop their individual renewable energy sectors, localising di¨erent activities in the value chain can redirect investments. These are channelled into the local economy and would otherwise have been spent on importing fossil fuels or renewable energy goods and services (see Box 14).
Countries exporting equipment for the conventional energy industry (e.g. oil and gas, coal mining and handling units) would see demand for their products reduce. However, there is some transferability potential for skills and technology, as seen in geothermal project development. The technology and financial experience of exploring and drilling oil and gas has been applied to geothermal projects that have similar equipment needs and financial risk profiles (Hamilton, 2015; Galbraith, 2014). Simply put, many of the conventional energy goods and services exporters have the opportunity to adapt and participate in a global market for renewable energy.
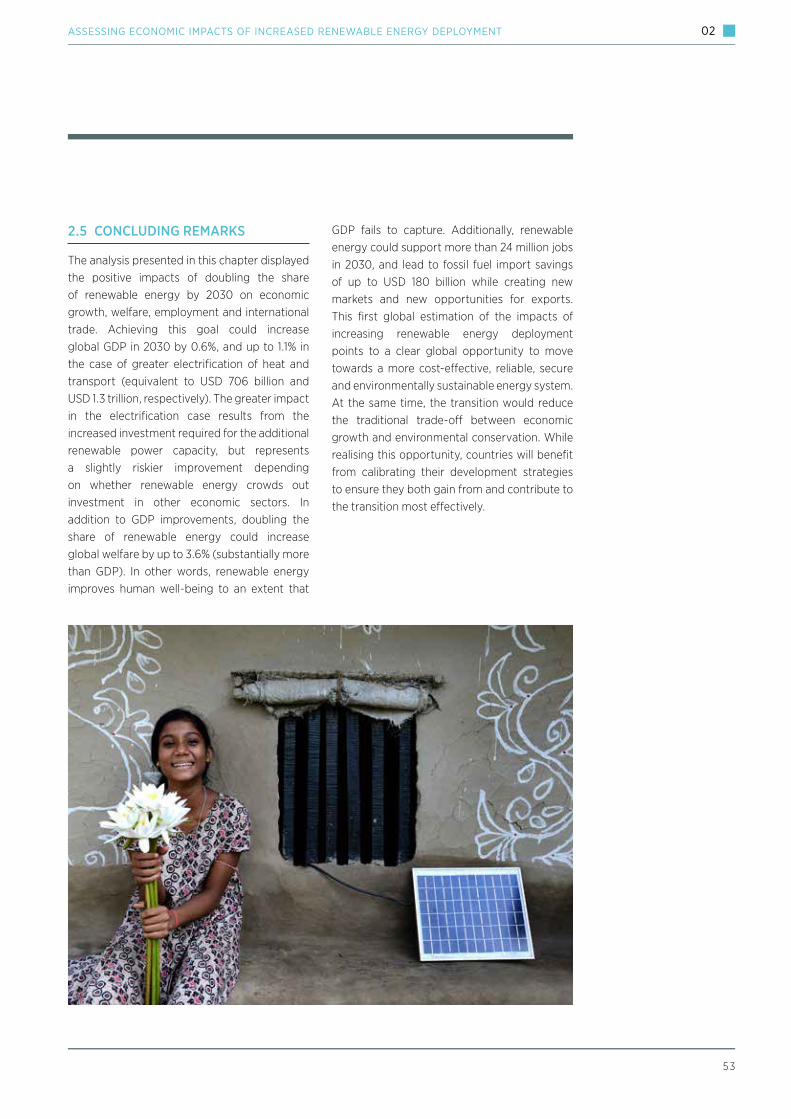
5 3
ASSESSING ECONOMIC IMPACTS OF INCREASED RENEWABLE ENERGY DEPLOYMENT 02
2.5 CONCLUDING REMARKS
The analysis presented in this chapter displayed the positive impacts of doubling the share of renewable energy by 2030 on economic growth, welfare, employment and international trade. Achieving this goal could increase global GDP in 2030 by 0.6%, and up to 1.1% in the case of greater electrification of heat and transport (equivalent to USD 706 billion and USD 1.3 trillion, respectively). The greater impact in the electrification case results from the increased investment required for the additional renewable power capacity, but represents a slightly riskier improvement depending on whether renewable energy crowds out investment in other economic sectors. In addition to GDP improvements, doubling the share of renewable energy could increase global welfare by up to 3.6% (substantially more than GDP). In other words, renewable energy improves human well-being to an extent that
GDP fails to capture. Additionally, renewable energy could support more than 24 million jobs in 2030, and lead to fossil fuel import savings of up to USD 180 billion while creating new markets and new opportunities for exports. This first global estimation of the impacts of increasing renewable energy deployment points to a clear global opportunity to move towards a more cost-e¨ective, reliable, secure and environmentally sustainable energy system. At the same time, the transition would reduce the traditional trade-o¨ between economic growth and environmental conservation. While realising this opportunity, countries will benefit from calibrating their development strategies to ensure they both gain from and contribute to the transition most e¨ectively.
MEASURING BENEFITS: METHODOLOGY AND
ANALYSIS
03

03
55
MEASURING BENEFITS: METHODOLOGY AND ANALYSIS
Chapter 2 presented the macroeconomic impacts of doubling the share of renewables in the global energy mix by 2030. This chapter delves into the analytical approach and methodology backing this analysis. It has the following aims:
To explain the methodology used for this analysis including the tool and the rationale for its selection, and present the three main cases assessed, namely the Reference Case, REmap and REmapE (section 3.1);
To provide details on the selected variables analysed, i.e. GDP, welfare, employment and international trade (section 3.2);
To present the sensitivity analysis for crowding out of capital, fossil fuel prices, fossil fuel subsidies, technology costs and carbon prices (section 3.3);
To discuss the main assumptions and limitations of the analysis that should be considered when interpreting the results (section 3.4);
To summarise the key findings and outline future areas of work building on this e¨ort (section 3.5).
3.1 METHODOLOGY
The macroeconomic impacts of renewable energy deployment presented in this study were obtained using the macro-econometric tool E3ME described in detail in Annex 1. Macro-econometrics38 have some limitations, especially the requirements for detailed time-series data and the Lucas Critique39, which were dealt with as follows. The data limitations can be managed by using an existing tool, such as E3ME, with tested data-sets for the countries analysed. With regard to the Lucas Critique, it is reasonable to assume limited behavioural change in this analysis; e.g. households consume the same amount of electricity across cases and do not necessarily consider the source of its generation.
Having considered these limitations, a macro-econometrics approach was selected because it has several advantages over competing approaches. First, it is based on well-established historical databases and has a proven track record of policy applications. Second, it allows the representation of additional policies or regulations drawing from idle economic resources, as is often observed in reality. Third, the approach takes unemployment into account, a key concern for policy makers. The rationale behind the selection of the approach is further explained in Annex 2 (see also IRENA and CEM (2014)).
MEASURING BENEFITS: METHODOLOGY AND ANALYSIS
38. A discussion on the advantages and limitations of macro-econometric approaches is beyond the scope of this study.
39. The “Lucas Critique” suggests that past observed relations (as embedded in the time-series data) cannot be extrapolated into a future under different policy conditions.
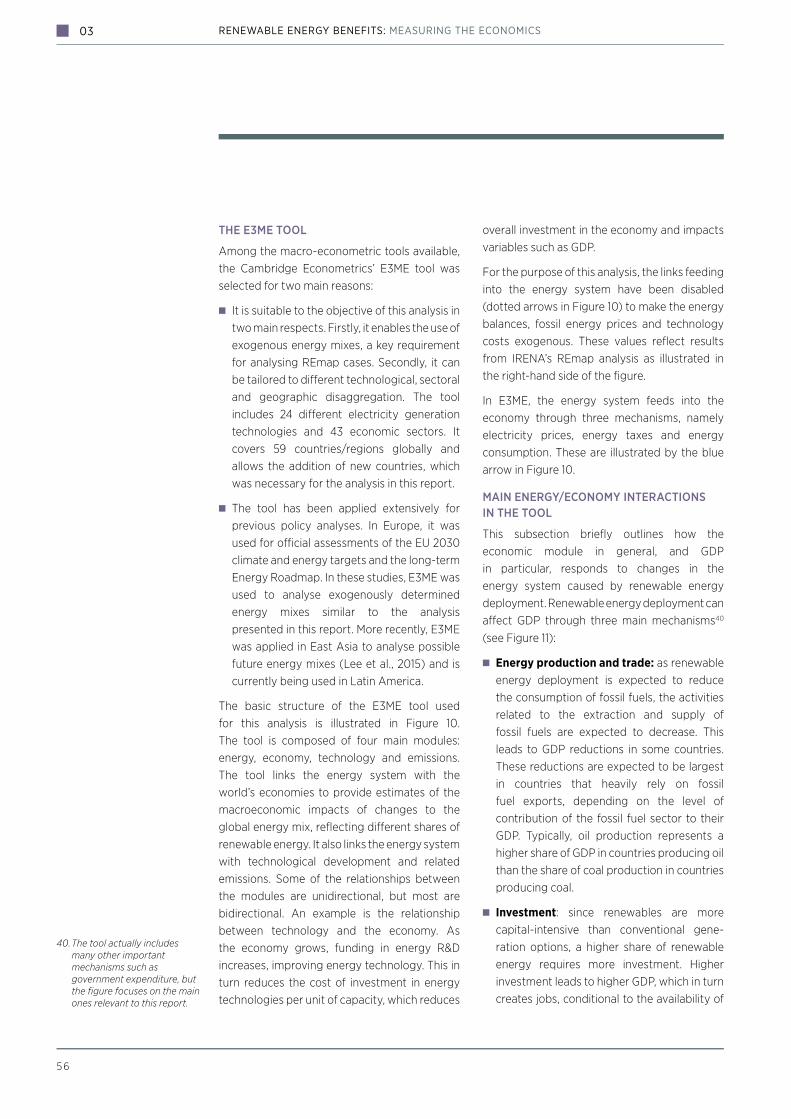
5 6
03 RENEWABLE ENERGY BENEFITS: MEASURING THE ECONOMICS
THE E3ME TOOL
Among the macro-econometric tools available, the Cambridge Econometrics’ E3ME tool was selected for two main reasons:
It is suitable to the objective of this analysis in two main respects. Firstly, it enables the use of exogenous energy mixes, a key requirement for analysing REmap cases. Secondly, it can be tailored to di¨erent technological, sectoral and geographic disaggregation. The tool includes 24 di¨erent electricity generation technologies and 43 economic sectors. It covers 59 countries/regions globally and allows the addition of new countries, which was necessary for the analysis in this report.
The tool has been applied extensively for previous policy analyses. In Europe, it was used for o«cial assessments of the EU 2030 climate and energy targets and the long-term Energy Roadmap. In these studies, E3ME was used to analyse exogenously determined energy mixes similar to the analysis presented in this report. More recently, E3ME was applied in East Asia to analyse possible future energy mixes (Lee et al., 2015) and is currently being used in Latin America.
The basic structure of the E3ME tool used for this analysis is illustrated in Figure 10. The tool is composed of four main modules: energy, economy, technology and emissions. The tool links the energy system with the world’s economies to provide estimates of the macroeconomic impacts of changes to the global energy mix, reflecting di¨erent shares of renewable energy. It also links the energy system with technological development and related emissions. Some of the relationships between the modules are unidirectional, but most are bidirectional. An example is the relationship between technology and the economy. As the economy grows, funding in energy R&D increases, improving energy technology. This in turn reduces the cost of investment in energy technologies per unit of capacity, which reduces
overall investment in the economy and impacts variables such as GDP.
For the purpose of this analysis, the links feeding into the energy system have been disabled (dotted arrows in Figure 10) to make the energy balances, fossil energy prices and technology costs exogenous. These values reflect results from IRENA’s REmap analysis as illustrated in the right-hand side of the figure.
In E3ME, the energy system feeds into the economy through three mechanisms, namely electricity prices, energy taxes and energy consumption. These are illustrated by the blue arrow in Figure 10.
MAIN ENERGY/ECONOMY INTERACTIONS IN THE TOOL
This subsection briefly outlines how the economic module in general, and GDP in particular, responds to changes in the energy system caused by renewable energy deployment. Renewable energy deployment can a¨ect GDP through three main mechanisms40 (see Figure 11):
Energy production and trade: as renewable energy deployment is expected to reduce the consumption of fossil fuels, the activities related to the extraction and supply of fossil fuels are expected to decrease. This leads to GDP reductions in some countries. These reductions are expected to be largest in countries that heavily rely on fossil fuel exports, depending on the level of contribution of the fossil fuel sector to their GDP. Typically, oil production represents a higher share of GDP in countries producing oil than the share of coal production in countries producing coal.
Investment: since renewables are more capital-intensive than conventional gene-ration options, a higher share of renewable energy requires more investment. Higher investment leads to higher GDP, which in turn creates jobs, conditional to the availability of
40. The tool actually includes many other important mechanisms such as government expenditure, but the figure focuses on the main ones relevant to this report.

03
57
MEASURING BENEFITS: METHODOLOGY AND ANALYSIS
METHODOLOGY 3.1
capital, workforce and production capacity in the di¨erent sectors.
Prices: electricity prices are expected to change as the shares of individual technolo-gies in the power mix and the levelised cost of generation evolve. Higher electricity prices can increase inflation, depress real incomes and reduce economic activity in energy-intensive sectors. However, a number of renewable technologies are expected to have lower costs than conventional technologies by 2030 and thus can reduce electricity
prices. The resulting lower electricity prices can stimulate economic activity and contribute to GDP growth.
The multiplier e¨ects are an important dimension of the interactions between energy and the economy. In particular, E3ME captures how an increase in GDP from renewable energy deployment would raise employment. This in turn would raise incomes41 and consumption, resulting in a further increase in GDP. This multiplier e¨ect, represented as a red loop in Figure 11, has an impact on other parts of the
Figure 10: Basic structure of the E3ME tool used for the analysis
E3ME REmap
For each of the three cases:● The Reference case ● The REmap case● The REmap Electrification case (REmapE)
Inputs, per country, are:- Energy balances- Power capacity and generation- Technology costs
TECHNOLOGY
EMISSIONS
ENERGY ECONOMY
Energy use
Energy use
Energy prices& costs
Economic activity & general prices
Funding R&D
Investment
Pollution abatement equipment
Energy use, prices & taxes
e.g. industrial emissions
of SF6
Emissions tradingscheme
Environmentaltaxes
Energy use
41. In the figure, the label indicates ‘real’ incomes because the variable also takes the inflation level into account.
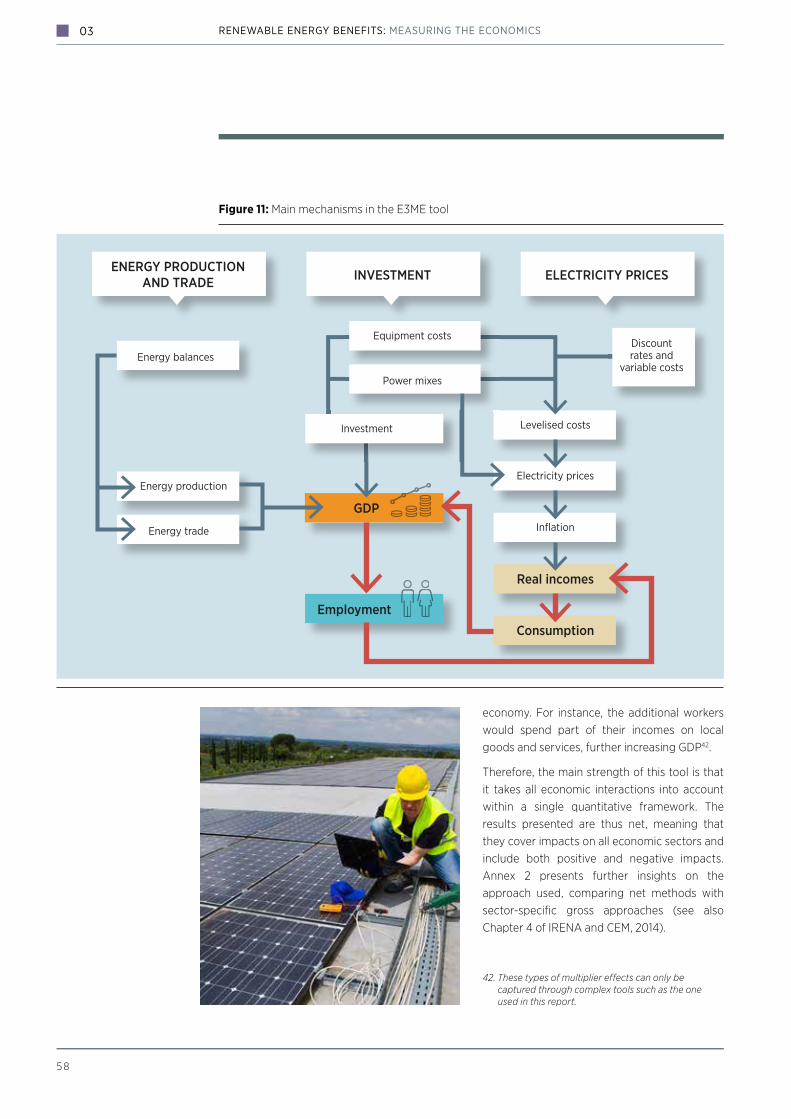
5 8
03 RENEWABLE ENERGY BENEFITS: MEASURING THE ECONOMICS
Figure 11: Main mechanisms in the E3ME tool
Levelised costs
ENERGY PRODUCTIONAND TRADE INVESTMENT ELECTRICITY PRICES
Energy balances
Energy production
Energy trade
GDP
Employment
Equipment costs
Electricity prices
Discountrates and
variable costsPower mixes
Inflation
Real incomes
Consumption
Investment
economy. For instance, the additional workers would spend part of their incomes on local goods and services, further increasing GDP42.
Therefore, the main strength of this tool is that it takes all economic interactions into account within a single quantitative framework. The results presented are thus net, meaning that they cover impacts on all economic sectors and include both positive and negative impacts. Annex 2 presents further insights on the approach used, comparing net methods with sector-specific gross approaches (see also Chapter 4 of IRENA and CEM, 2014).
42. These types of multiplier effects can only be captured through complex tools such as the one used in this report.

03
59
MEASURING BENEFITS: METHODOLOGY AND ANALYSIS
MAIN CASES ANALYSED
This report analyses di¨erent cases of exogenously determined energy mixes using the E3ME macro-econometric tool. These energy mixes are obtained from IRENA’s global roadmap for doubling the share of renewable energy in the world’s energy mix by 2030, entitled REmap2030. The roadmap is designed to demonstrate possible pathways and priority actions for meeting this target (i.e. from 18% in 2010 to 36% in 2030) in conjunction with improved energy access and e«ciency. These pathways are articulated into di¨erent levels of renewable energy deployment and combinations of technologies, referred to as cases. The three main cases include:
The Reference Case, a business-as-usual case that reflects the most up-to-date o«cial national plans under existing legislations. For countries which have not yet been covered by REmap, the New Policies Scenario of the 2014 edition of the IEA WEO (IEA, 2014) is used.
The REmap Case, which assesses the potential for the world to double its share of renewable energy by aggregating bottom-up country analysis representing approximately three-quarters of world energy demand. For countries not covered by REmap, the IEA 450 ppm Scenario is used (IEA, 2014).
The REmap Electrification Case (REmapE), which doubles the renewable energy share, with a greater emphasis on electrification of heat and transport. This requires a greater deployment of renewables for power generation.
For the purpose of this analysis, all other exogenous factors and policy measures are kept constant across the three main cases. This allows the impacts of di¨erent renewable energy shares to be isolated in line with the three cases, thereby facilitating the interpretation of results. Several interrelated factors (e.g. oil prices) would be expected to respond to changes in the share of renewable energy. However, they have been kept constant between cases. The most relevant of these factors have been tested in the sensitivity analysis presented in section 3.3. Table 6 presents the structure of the main cases analysed and the key exogenous variables. The table has three main components:
Exogenous variables that vary across the three main cases: the only assumptions that change are the renewables shares, derived from IRENA’s REmap analysis. They include the full power mix in each country in each case (including both gigawatts of installed capacity and gigawatt-hours of generation per technology) and the mix in final energy use in each case, by sector (industry, residential, commercial, transport and others).
Exogenous variables that are kept constant throughout the analysis. These do not vary in any of the main cases or in the sensitivity analyses. They include population, exchange and discount rates, fiscal policies and all econometric parameters embedded in the tool.
Exogenous variables that are kept constant throughout the main cases but tested in the sensitivity analyses. These include assumptions about the crowding out of capital, fossil fuel prices, fossil fuel subsidies, technology costs and carbon prices. Further details on these assumptions are provided in section 3.3.

6 0
03 RENEWABLE ENERGY BENEFITS: MEASURING THE ECONOMICS
Table 6: Structure of exogenous variables in the main cases
Reference REmap REmapE
Key exogenous variables that vary in the main cases
Renewable energy share as represented by the energy balances and power mixes
Reference Case from REmap analysis (or WEO New Policies Scenario for additional information)
REmap Case (or WEO 450 ppm Scenario for additional information)
REmap Electrification Case (or WEO 450 ppm Scenario for additional information)
Key exogenous variables that are kept constant throughout the analysis
Population projections Total population of 7.3 billion in 2015 and 8.2 billion in 2030, originally derived from the UN and consistent with the IEA WEO. In case of discrepancy, the analysis goes with the most detailed and updated projections (UN). Di�erences between IEA and UN are less than 5% so a limited impact is foreseen.
Exchange rates Held constant in line with the most recent year of data and projections available.
Discount rates for LCOE* calculations
Representing the cost of borrowing capital and kept fixed throughout the cases. The values used are 7.5% for OECD countries and China, and 10% for the rest of the world. For all coun-tries, a technology-specific risk premium is added (2% for nuclear, 2.5% for o�shore wind and concentrated solar power, and 3% for less mature technologies).
Characteristics of power technologies
Technical characteristics (e.g. e¯ciency, capacity factors, emission factors) and all costs (except for investment costs) are consistent with REmap and held constant.
Bioenergy prices Based on ongoing IRENA work (IRENA, 2014c), ensuring consistency with REmap.
Grid reinforcement and back-up generation costs
Simple representation of the costs of integrating variable renewable energy based on ongoing IRENA work (IRENA, 2015e). An electricity price mark-up was added according to the share of variable renewable energy.
Econometric parameters Derived from historical time series data.
Key exogenous variables that are kept constant throughout the main cases but tested in the sensitivity analyses
Assumptions about the crowding out of capital
No crowding out of capital i.e. investment in renewables does not displace investment elsewhere.
Fossil fuel prices (oil, gas and coal)
Taken from REmap and IEA WEO 2014 New Policies Scenario. In real 2015 USD:
Fossil fuel subsidies Based on REmap (IRENA, 2014b)
Technology costs Overnight investment costs based on REmap
Carbon prices Taken from IEA WEO New Policies Scenario and modelled as a fixed carbon price44.
Oil Gas Coal2015 USD 112.6/barrel43 USD 11.2/MMBtu** USD 94.4/t2030 USD 128.7/barrel USD 12.7/MMBtu USD 112.3/t
43. The oil prices that were used in the analysis are based on the New Policies Scenario of the IEA’s World Energy Outlook (WEO) 2014, in line with the 2014 REmap analysis. The figures do not take into account the recent drop in oil prices that occurred while the analysis was being carried out. To address this issue, one of the tests in the sensitivity analysis (see chapter 3) considers an oil price based on the “Low Price Scenario” of the latest World Energy Outlook (IEA, 2015).
44. The same price is considered for both possible carbon pricing policies: a carbon tax or a trading scheme. In reality, each of the two policies would imply different behaviour among economic agents involved, different levels of perceived risks and, overall, different economic impacts. Such analysis is beyond the scope of this report.
* Levelised cost of energy
** Million British thermal units

03
6 1
MEASURING BENEFITS: METHODOLOGY AND ANALYSIS
Table 7: Main inputs and outputs in the analysis
In addition to the exogenous variables, the Cases analysed are assumed to have a neutral e¨ect on governmental budgets. This demonstrates the impacts driven by a shift to renewables rather than by an overall fiscal stimulus or contraction. The E3ME tool does not include the full details of each national tax system. However, it is expected that the government balances will be a¨ected by a higher share of renewable energy. This occurs directly through changes in excise duties on energy products, carbon tax receipts and energy subsidies, and indirectly through income/corporate taxes, sales tax receipts, etc. Income tax has been used as the adjustment needed to balance the budget. This is the largest tax share in most countries and therefore should not influence results very much. It is assumed that the other tax rates remain fixed on the basis of the last year of available data. As a result, government expenditure increases in line with GDP growth, keeping constant the government’s fiscal position.
It is assumed that investments in renewables and other power generation technologies are financed by energy companies through future
sales of electricity. The price of electricity is set in each country by taking an average levelised cost (i.e. including both capital and operating costs) with a mark-up added for additional integration costs, hence a shift to cheaper sources of generation can lead to lower electricity prices if the reduction in levelised costs outweighs the integration costs. When interpreting the results, it is also important to be aware of the temporal dimension of investments. While there are upfront benefits from higher initial investment, the costs are distributed over a longer period as loans are repaid. There is also increased borrowing in the economy as a whole because E3ME does not impose crowding out of capital (meaning that in E3ME investment in renewables does not displace investment in other sectors). This is discussed further in Section 3.3.
INPUTS OUTPUTS
R Population projections
R Exchange rates
R Discount rates for LCOE* calculations
R Characteristics of power technologies
R Bioenergy prices
R Grid reinforcement and back-up generation costs
R Econometric parameters
R Energy balances
R Assumptions about the crowding out of capital
R Fossil fuel prices (oil, gas and coal)
R Fossil fuel subsidies
R Technology costs
R Carbon prices
GDP
Renewable energy jobsEconomy-wide jobs
Welfare
Trade in fossil fuelsTrade in other goods and services
62
03 RENEWABLE ENERGY BENEFITS: MEASURING THE ECONOMICS
3.2 VARIABLES ANALYSED
Four main variables have been selected for the present analysis:
GDP, aiming to measure economic output and growth;
welfare, a broader measurement of human well-being;
employment, a variable of significant impor-tance to policy makers given its key economic and social implications;
trade, in order to understand how renewable energy can a¨ect trade of fossil fuels and other goods and services.
GDP
GDP, the most common measure of economic development and growth, has been selected as a variable. The results provided in the report are in constant US dollars in 2015 omitting purchasing power parity.
WELFARE
The welfare indicator aims to capture a broader measure of human well-being and how it is a¨ected by renewable energy deployment. Despite intensive work in the field over the last few decades, there is no consensus on an indicator of human welfare. The substantive literature on measuring welfare (see Box 11) broadly identifies three possible dimensions important in determining overall levels of human welfare: economic, social and environmental.
To construct the welfare indicator used in this report, the relevant E3ME results are used as proxies of these three dimensions. This provides the respective sub-indicators of economic, social and environmental welfare described next.
Economic dimension of welfare; one sub-indicator:
Consumption plus investment: consumption is often used as a welfare measure. For example, the Intergovernmental Panel on Climate Change has used this approach (Intergovernmental Panel on Climate Change, 2001). However, this ignores improvements in capital that contribute to future consumption. The sub-indicator here thus includes the sum of both household consumption and economy-wide investment (i.e. capital formation) both measured in constant US dollars in 2015.
Social dimension of welfare; two sub-indicators:
Total employment: the rationale behind using employment as a sub-indicator for social welfare derives from its social value (e.g. in terms of status and self-esteem). This extends beyond pure wage e¨ects. While there is a probable correlation between economic welfare (i.e. the previous dimension) and employment e¨ects, employment is retained as a separate sub-indicator. Economy-wide employment is measured in terms of total jobs in all the 43 economic sectors considered.
Spending on health and education, corrected for health e¨ects from poor air quality: this sub-indicator draws on the example of the UN HDI. E3ME does not include measures of literacy or life expectancy. Spending on health and education is, therefore, used as a proxy. Also, the changes in healthcare costs resulting from di¨erent levels of air pollution are included so that the overall value of this sub-indicator is closer to a measure of welfare. The e¨ects of air quality on human health can actually be substantial and when
GDP Welfare TradeJobs
GDP Welfare TradeJobs
45. The coefficients employed to estimate health impacts are the lower end figures of the coefficients used in REmap.
46. Surface temperature or atmospheric concentrations would be more accurate but this is beyond the scope of the tool. The trends over time are quite smooth so the direction of the effect would probably be similar, although dimensions would vary.
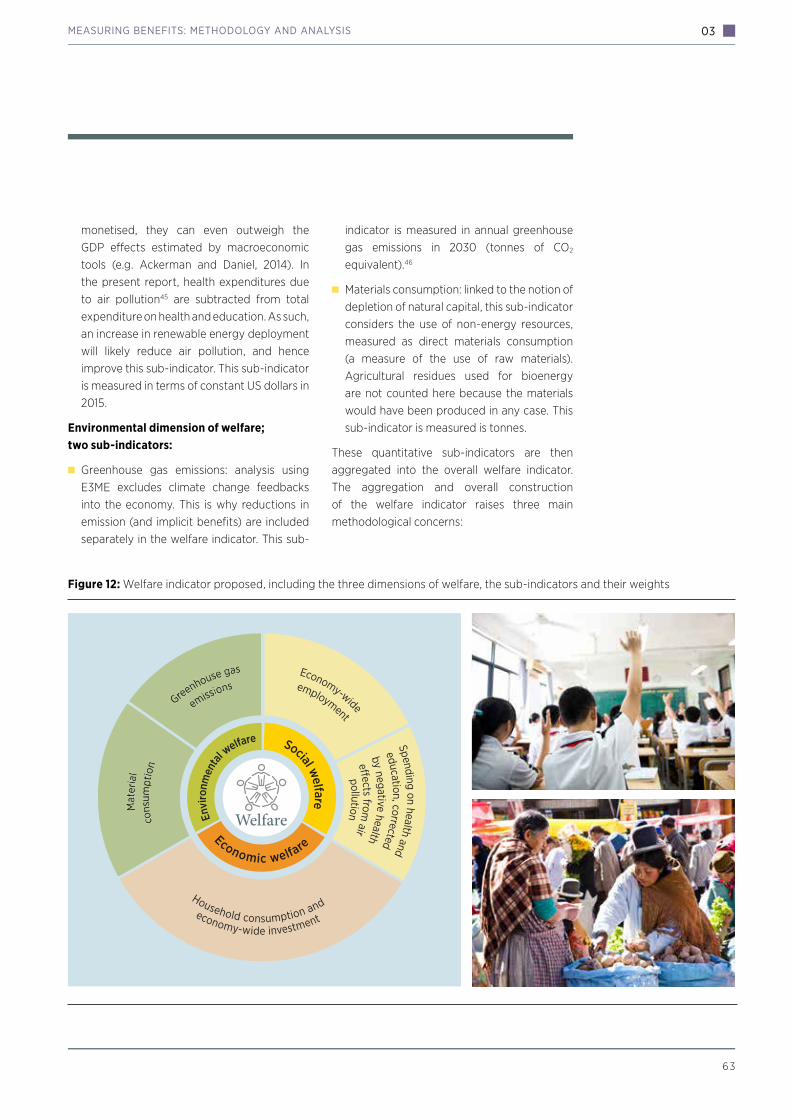
03
63
MEASURING BENEFITS: METHODOLOGY AND ANALYSIS
monetised, they can even outweigh the GDP e¨ects estimated by macroeconomic tools (e.g. Ackerman and Daniel, 2014). In the present report, health expenditures due to air pollution45 are subtracted from total expenditure on health and education. As such, an increase in renewable energy deployment will likely reduce air pollution, and hence improve this sub-indicator. This sub-indicator is measured in terms of constant US dollars in 2015.
Environmental dimension of welfare; two sub-indicators:
Greenhouse gas emissions: analysis using E3ME excludes climate change feedbacks into the economy. This is why reductions in emission (and implicit benefits) are included separately in the welfare indicator. This sub-
indicator is measured in annual greenhouse gas emissions in 2030 (tonnes of CO2 equivalent).46
Materials consumption: linked to the notion of depletion of natural capital, this sub-indicator considers the use of non-energy resources, measured as direct materials consumption (a measure of the use of raw materials). Agricultural residues used for bioenergy are not counted here because the materials would have been produced in any case. This sub-indicator is measured is tonnes.
These quantitative sub-indicators are then aggregated into the overall welfare indicator. The aggregation and overall construction of the welfare indicator raises three main methodological concerns:
Figure 12: Welfare indicator proposed, including the three dimensions of welfare, the sub-indicators and their weights
WelfareEnvi
ronm
enta
l welfare Social w
elfare
Greenhouse gas
emissions
Mat
eria
l co
nsum
ptio
n
Economic welfare
Mat
eria
lco
nsum
ptio
n
Greenhouse gas
emissions
Household consumption and economy-wide investment
Spending on health andeducation, corrected
Economy-wide
employment
by negative healthe�ects from
airpollution

6 4
03 RENEWABLE ENERGY BENEFITS: MEASURING THE ECONOMICS
Double counting: given the interrelated nature of many of these sub-indicators, a special e¨ort is made to avoid double counting.
Units of di¨erent sub-indicators: the aggre-gation of sub-indicators means each needs to be measured using the same units, which is in turn problematic. A possibility would be to express all of them in monetary units but this has a range of shortcomings. Firstly, some cannot be easily monetised. Secondly, there is a wide range of uncertainty relating to other sub-indicators about existing estimates for monetisation factors (e.g. damage values assigning a US dollar value to each tonne of emissions). Thirdly, the monetisation of other sub-indicators is feasible but has potential ethical implications. This study thus opted not to monetise, measuring each sub-indicator in its own units and working with the percentage di¨erence from the Reference Case when evaluating the overall welfare indicator.
Weighing the sub-indicators to obtain the overall welfare indicator: this issue, which reflects the subjective importance attributed to each sub-indicator, has been rarely
addressed in previous studies. In this report, equal weights are applied across each of the three dimensions of welfare (economic, social and environmental) and its associated sub-indicators (see Figure 12). The results are presented separately for each sub-indicator so that estimates of the aggregated welfare indicator can be made using di¨erent weights if needed.
There are important distributional e¨ects relating to welfare and the aggregate analysis presented does not provide a complete analysis. Many of the relationships are non-linear and adding the impacts across countries and across social groups within countries does not take into account sifginifant di¨erences. These distributional e¨ects are beyond the scope of the current study but are clearly important for future analysis. Nevertheless, the broad trends identified in this study are illustrative of the probable main impacts.
EMPLOYMENT
Employment is instrumental to achieving economic and social
development. It is thus a variable of significant importance for policy makers. The employment results provided by E3ME cover each of the 43 economic sectors represented. When constructing the tool, these sectors have been determined on the basis of data availability and the industrial classification system adopted in the tool (i.e. the way in which national economic statistics are compiled) (see Box 15).
Given that renewable energy is a relatively new sector, national economic statistics do not include it as an individual sector (as is the case for oil and gas, or coal) – and, as many of the jobs relate to investment, they are classified under the sectors that produce or install the investment goods.
Additional steps are therefore required to esti-mate the number of jobs directly attributable to
GDP Welfare TradeJobsBox 15: Relationship between economic sectors and value chain segments
The E3ME tool includes a representation of 43 economic sectors, thus providing employment estimates for each. However, the analysis of renewable energy employment is normally carried out via segments of the value chain (e.g. equipment manufacturing, construction and installation, fuel supply or O&M). Although related, these are not equivalent. For example, jobs in the construction and installation segment of the value chain will be mainly in the construction, engineering and metal goods economic sectors, while jobs in the fuel supply segment will be mainly in the agriculture and forestry, coal or oil and gas sectors. The employment estimations are provided for each economic sector, and they are allocated to segments of the value chain based on expert judgement. Such allocation a¨ects the distribution of jobs but not the total number.

03
65
MEASURING BENEFITS: METHODOLOGY AND ANALYSIS
renewables. The following paragraphs describe how this is done, and how the total estimate is split by technology and by segment of the value chain (equipment manufacturing, construction and installation, operations and maintenance and fuel supply).
Figure 13 provides an overview of the approach. Four inputs are used to estimate impacts by value chain segment:
Many of the jobs related to renewables result directly from the additional investment in new capacity. In E3ME, most of these jobs lie in the construction and engineering sectors. However, to estimate the jobs in the sectors that relate to renewables, it is necessary to separate investment in renewables from all the other investment that goes on in the economy. An additional tool run is set up for this purpose. Investment-related jobs are then allocated to manufacturing, and construction and installation (see Box 4).
The E3ME results for the power sector are used to derive jobs in operations and maintenance. As the sector in E3ME also includes employment in grid operations and maintenance, power retailing and customer support, the number of jobs in operations and maintenance is lower than the sectoral results for the tool. Furthermore, some of the jobs classified as the power sector also fall under construction and installation.
The E3ME results for the fuel sectors are used to estimate jobs in fossil and nuclear fuel supply.
As E3ME does not cover biofuels in detail, jobs in bioenergy production are estimated based on employment factors (jobs per GJ) derived from previous studies.
The total jobs are also allocated by generation technology (both conventional and renewable). For investment jobs, the allocation is made by the share of investment. For jobs in operations and
Figure 13: Methodology used for renewable energy jobs estimation
Additional investment run
Power sector E3ME results
Fuel sector E3ME results
Separate estimate Bioenergy supply
Fossil and nuclearfuel supply
Operations andmaintenance
Construction andinstallation
Manufacturing
Note: The employment results provided in this report are expressed as headcount number of jobs.

6 6
03 RENEWABLE ENERGY BENEFITS: MEASURING THE ECONOMICS
maintenance, an employment factor approach47 is applied, while maintaining consistency with the aggregate results. For fuel supply, the jobs are linked to the relevant technologies.
The approach applied for the estimation of renewable energy jobs is broadly consistent with that used for the macroeconomic results presented for the economy as a whole. The possible improvements in labour intensity/productivity over time are also accounted for in this estimation through the econometric equations that estimate sectoral employment.
The main di¨erences relate to secondary e¨ects such as changes in real wage rates, which are captured by the whole-economy approach but not included in the estimates of jobs solely in the renewable energy sector.
TRADE
Energy sector trade is composed of two main segments: fuels and investment goods and services. Both segments will experience changes since most renewables do not rely on fuels and are more capital-intensive than conventional
generation technologies. Trade is thus greatly a¨ected by renewable energy deployment in both exporting and importing countries as described in Chapter 2. In the doubling cases, there is likely to be lower international fossil fuel trade and increased trade of investment goods and services. Additional trade e¨ects can result from economy-wide induced e¨ects. For example, as renewables improve GDP, consumption may increase and imports of certain consumption goods could grow.
To analyse trade, two main indicators are used. The first is the trade balance expressed as total net exports (exports–imports of all goods and services, measured in terms of constant US dollars in 2015 and expressed as a share of GDP under the same terms). The analysis of the overall trade balance provides insights into trade in investment goods and services required for renewables, and trade in all other goods and services due to economy-wide induced e¨ects. The second indicator is fossil fuel trade expressed in terms of constant US dollars in 2015. It has traditionally been considered energy trade.
47. For more details on the employment factor methodology see (IRENA, 2013).
Welfare TradeJobs
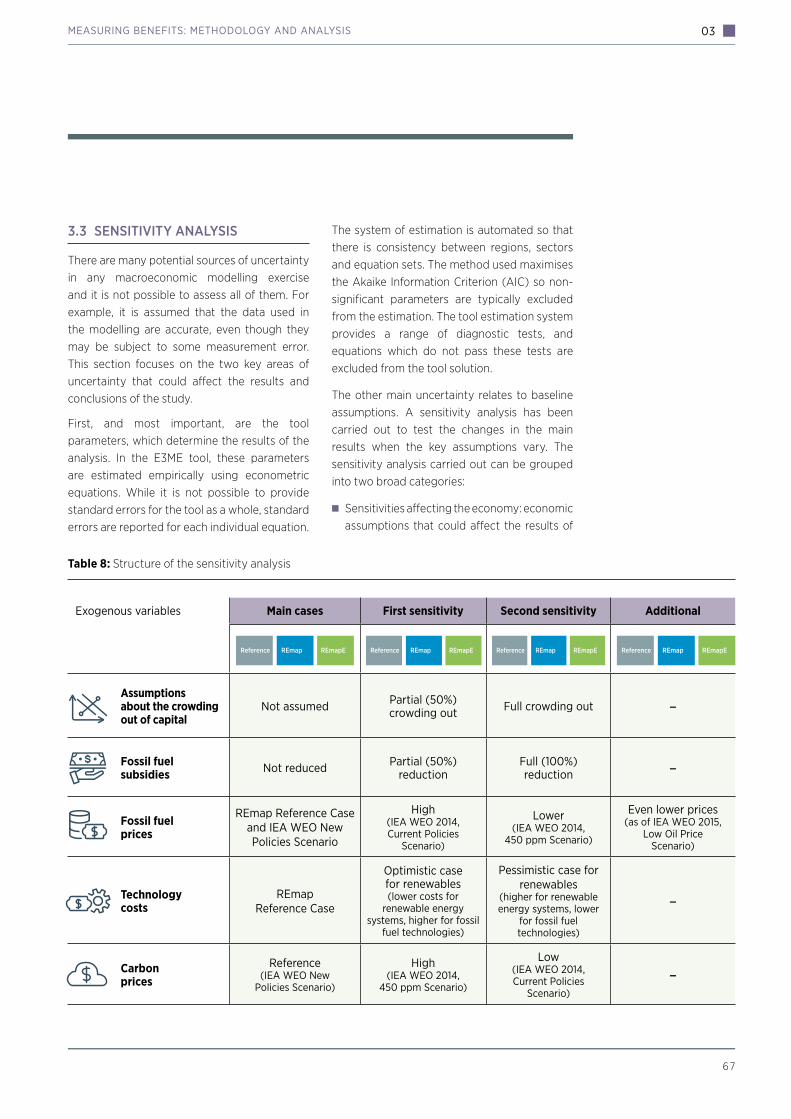
03
67
MEASURING BENEFITS: METHODOLOGY AND ANALYSIS
Exogenous variables Main cases First sensitivity Second sensitivity Additional
Assumptions about the crowding out of capital
Not assumed Partial (50%) crowding out Full crowding out –
Fossil fuel subsidies Not reduced Partial (50%)
reductionFull (100%) reduction –
Fossil fuel prices
REmap Reference Case and IEA WEO New Policies Scenario
High (IEA WEO 2014, Current Policies
Scenario)
Lower (IEA WEO 2014,
450 ppm Scenario)
Even lower prices (as of IEA WEO 2015,
Low Oil Price Scenario)
Technology costs
REmap Reference Case
Optimistic case for renewables (lower costs for
renewable energy systems, higher for fossil
fuel technologies)
Pessimistic case for renewables
(higher for renewable energy systems, lower
for fossil fuel technologies)
–
Carbon prices
Reference (IEA WEO New
Policies Scenario)
High (IEA WEO 2014,
450 ppm Scenario)
Low (IEA WEO 2014, Current Policies
Scenario)
–
3.3 SENSITIVITY ANALYSIS
There are many potential sources of uncertainty in any macroeconomic modelling exercise and it is not possible to assess all of them. For example, it is assumed that the data used in the modelling are accurate, even though they may be subject to some measurement error. This section focuses on the two key areas of uncertainty that could a¨ect the results and conclusions of the study.
First, and most important, are the tool parameters, which determine the results of the analysis. In the E3ME tool, these parameters are estimated empirically using econometric equations. While it is not possible to provide standard errors for the tool as a whole, standard errors are reported for each individual equation.
The system of estimation is automated so that there is consistency between regions, sectors and equation sets. The method used maximises the Akaike Information Criterion (AIC) so non-significant parameters are typically excluded from the estimation. The tool estimation system provides a range of diagnostic tests, and equations which do not pass these tests are excluded from the tool solution.
The other main uncertainty relates to baseline assumptions. A sensitivity analysis has been carried out to test the changes in the main results when the key assumptions vary. The sensitivity analysis carried out can be grouped into two broad categories:
Sensitivities a¨ecting the economy: economic assumptions that could a¨ect the results of
Table 8: Structure of the sensitivity analysis
Reference REmap REmapE Reference REmap REmapE Reference REmap REmapE Reference REmap REmapE

6 8
03 RENEWABLE ENERGY BENEFITS: MEASURING THE ECONOMICS
the analysis include taxation policy, income and price elasticities and crowding out of capital. The latter has been chosen given its importance, as indicated by the literature, specially that dealing with the economic costs of climate change mitigation.
Sensitivities a¨ecting the energy system: as noted earlier, the energy system inputs are exogenous and fixed based on IRENA’s REmap analysis. As such, any sensitivity analysis carried out would mainly capture the secondary e¨ects. As an example, a decrease in fossil fuel prices would not translate into increased demand as the quantity remains fixed, blocking the primary e¨ects of the sensitivity. The e¨ects that will be observed are those related to the income e¨ect. Nevertheless, in line with standard practice in the literature, four sensitivities a¨ecting the energy system have been tested, namely: fossil fuel prices, carbon prices, technology costs and fossil fuel subsidies.
Table 8 displays the structure of the sensitivity analyses. In the first column, it shows the three main cases (i.e. the analysis presented in Chapter 2). The second and third columns show the two sets of sensitivity analyses carried out. For the fossil fuel price assumption, an additional tool run is carried out using low energy prices (notably oil). This is in line with the significant fall in prices registered during 2015 as shown in the fourth column.
The sensitivity analyses are not intended to be used as scenarios in their own right. The purpose is not to understand how crowding out of capital, for instance, a¨ects the global economy but to test whether the economic impacts of a shift towards renewables are dependent on the assumptions made about crowding out of capital.
In order to isolate and assess the particular e¨ects of each exogenous assumption, the sensitivity value for each is tested inde-pendently, keeping the other assumptions fixed to their original values. The sensitivity analysis on fossil fuel subsidies, for instance, reduces subsidies while holding constant other exogenous variables tested (oil, gas and coal prices, technology costs, carbon prices and assumptions about crowding out of capital) fixed. This assumes that the exogenous variables are independent from each other even though correlations might exist in some cases. For instance, reduced energy subsidies could decrease demand for oil products, a¨ecting oil prices.
A brief discussion of each variable tested follows. The results are presented only for one of the macroeconomic variables analysed in this report, GDP. This encapsulates how the overall results are a¨ected by each sensitivity.

03
69
MEASURING BENEFITS: METHODOLOGY AND ANALYSIS
SENSITIVITY AFFECTING THE ECONOMY
The literature on the economic costs of climate change mitigation suggests that crowding out of capital is a key concern, potentially increasing costs. A shift from a fuel-intensive world to a capital-intensive world will require higher upfront borrowing to finance the investments. The analysis assumes that these investment costs are earned back over time through electricity prices but the necessary financing for the initial investments must be available. Some economists have asserted that making this finance available could “crowd out” available finance to other sectors, potentially harming the economy. For instance, it could reduce investment in transport infrastructure or manufacturing capacity.
The potential e¨ects of crowding out have been tested in the study through two sensitivities (see Table 8). In the full crowding out case, the tool forces savings in the economy to be equal to investment and excludes additional lending from banks (i.e. a fixed money supply). In the partial crowding out case, the tool assumes that savings need to be at least 50% of investment. The main case assumes there is no crowding out, and that the financial sector can provide the necessary loans for investing in renewables without reducing lending to other sectors.
The results show that the crowding out e¨ect has a major influence on the results (Figure 14) in line with the literature on the topic. In the case of a full crowding out of capital, the impact on GDP is close to zero or slightly negative. This is particularly relevant in the REmapE Case, where investment is highest, and the crowding out assumption thus has the biggest e¨ect. However, these negative e¨ects are minor, and the sensitivity with a partial (50%) crowding out e¨ect remains positive. Therefore, unless full crowding out takes place, GDP impacts are positive.
SENSITIVITIES AFFECTING THE ENERGY SECTOR
Four sensitivities are analysed on exogenous variables a¨ecting the energy sector, namely fossil fuel subsidies, fossil fuel prices, technology costs and carbon prices. Since the energy balance is fixed in this analysis (as per the REmap analysis), these sensitivities only capture secondary e¨ects. Future work could address this limitation in order to observe the full implications of these sensitivities on the results.
Reducing fossil fuel subsidies. In the first sensitivity, fossil fuel subsidies are halved and in the
second they are completely eliminated. While global GDP increases 0.60% and 1.10% in the REmap and REmapE cases, these values range from 0.57% to 0.60% and from 1.05% to 1.07% respectively in the sensitivities.
Changing fossil fuel prices. The main cases in this study are assessed on the basis of the prices of fossil
fuels from the IEA’s New Policies Scenario in the 2014 WEO (IEA, 2014a) and in line with REmap analysis. In the first sensitivity, fossil fuel prices
Figure 14: Impacts of crowding out of capital (2030 GDP size, % change vs the Reference Case)
Main case Partial crowding out Full crowding out
REmap REmapE
1.0
0.8
0.6
0.4
0.2
0
-0.2
% change in 2030 global GDPvs. Reference Case
70
03 RENEWABLE ENERGY BENEFITS: MEASURING THE ECONOMICS
are kept higher than in the main cases and are adopted from the Current Policies Scenario of the IEA WEO 2014. In the second sensitivity, the fossil fuel prices considered are lower than in the main cases and are adopted from the WEO’s 450 ppm Scenario. A third additional case is analysed, in which prices are even lower, to reflect the recent developments in the oil market. The price for this sensitivity is based on the Low Oil Price Scenario of the latest WEO 2015 (IEA, 2015), which estimates a price of USD 55 per barrel in 2020 and USD 70 per barrel in 2030. The results show that, while global GDP increases by 0.60% and 1.10% in the main cases (REmap and REmapE respectively), these values range from 0.49% to 0.62% and from 0.86% to 1.10% respectively in di¨erent sensitivities.
Evolving technology costs. The reference technology costs in the main cases are based
on REmap. Two sensitivities of di¨erent evolutions of technology costs have been tested. In the first sensitivity, an optimistic case for renewables is considered i.e. lower
technology costs for renewables and slightly higher costs for conventional technologies with technological uncertainty. In the second sensitivity, a pessimistic case for renewables is considered where the opposite conditions are tested. In these sensitivities, the global GDP improvements in the REmap and REmapE cases range from 0.45% to 0.67% and from 0.77% to 1.17% respectively.
Di¤erent carbon prices. The values and sectoral/geographical application of carbon prices in
the main case are based on the New Policies Scenario of IEA’s World Energy Outlook 2014 (IEA, 2014a). Two sensitivities are tested, one based on the 450ppm Scenario and the second on the Current Policies Scenario of the World Energy Outlook 2014. Compared to the main cases, where global GDP improves 0.60% and 1.10% in the REmap and REmapE cases respectively, the values range from 0.50% to 0.64% and from 0.92% to 1.14% in the respective sensitivities.
03
7 1
MEASURING BENEFITS: METHODOLOGY AND ANALYSIS
3.4 MAIN LIMITATIONS
Quantitative tools are useful for assessing the e¨ects of policy decisions – in this case, the increased deployment of renewable energy. However, they are all based on assumptions and have limitations that should be considered when interpreting the results. This section outlines some of the main assumptions and limitations of the analysis along with a discussion of how they may a¨ect the results.
EXOGENOUS AND FIXED ENERGY MIX
The energy mix of each country is exogenous to the analysis and is based on IRENA’s REmap. It is also considered fixed in that any relationship between variables that may a¨ect the energy mixes are excluded. The demand for the di¨erent energy sources, for example, does not respond to prices (i.e. zero price elasticity), which largely conditions the results of the sensitivities conducted. This limitation is linked to the objective of the study which was to analyse the economic e¨ects of doubling the share of renewable energy as per the REmap analysis. This approach does have advantages. Most notable is the high degree of technological detail behind the exogenous energy mixes, especially given that REmap follows a bottom-up approach.
MACROECONOMIC AND WELFARE IMPACTS OF ENERGY ACCESS
Renewables can play a significant role in providing access to modern energy services and has a vast potential to improve welfare (see Box 12) and local economies. The benefits can be realised through two main mechanisms. The first is the economic ripple e¨ects of the investments needed to provide energy access, nearly USD 50 billion each year until 2030 (IEA and World Bank, 2015). The second is the induced economic e¨ect through, for instance, new opportunities for local businesses, reduced time spent collecting traditional sources of energy or enhanced productivity. The
present analysis does not account for these macroeconomic and welfare benefits due to data and methodological limitations. The GDP and welfare estimations provided in this report could thus be considered conservative. The socio-economic benefits of improved energy access through renewable energy are the subject of ongoing IRENA analysis.
AVAILABILITY OF RESOURCES TO SUPPORT RENEWABLE ENERGY DEPLOYMENT
The analysis assumes that the production capacities of the supplying sectors and the resources needed (financial and human, among others) are su«cient and do not impose a limit on renewable energy deployment. An analysis of how limited resources and capacities might a¨ect the results is beyond the scope of this report. The results should therefore be interpreted in this context.
Production capacity of the supplying sectors. Assumptions on the rates of capacity utilisation within the economy are among the most influential in economic modelling exercises. In many cases, it is assumed that all the available capacity is utilised, limiting the total production in the economy to the baseline values. However, the E3ME tool does not assume this, and therefore, if a policy is able to draw from underutilised resources, its overall impact is positive. For example, it is assumed that the steel, transport and service sectors do not have any limiting capacities and can continue generating output as needed to support the renewable energy deployment plans. In this way, the tool results include the multiplier e¨ects of increased production and investment in supply chains.
Availability of financial resources. The same principle is applied to capital markets, where it is assumed that additional financial resources are available. If banks see profitable opportunities for investment, they will be able to provide loans without reducing lending elsewhere (i.e. without crowding out investment in other sectors). As
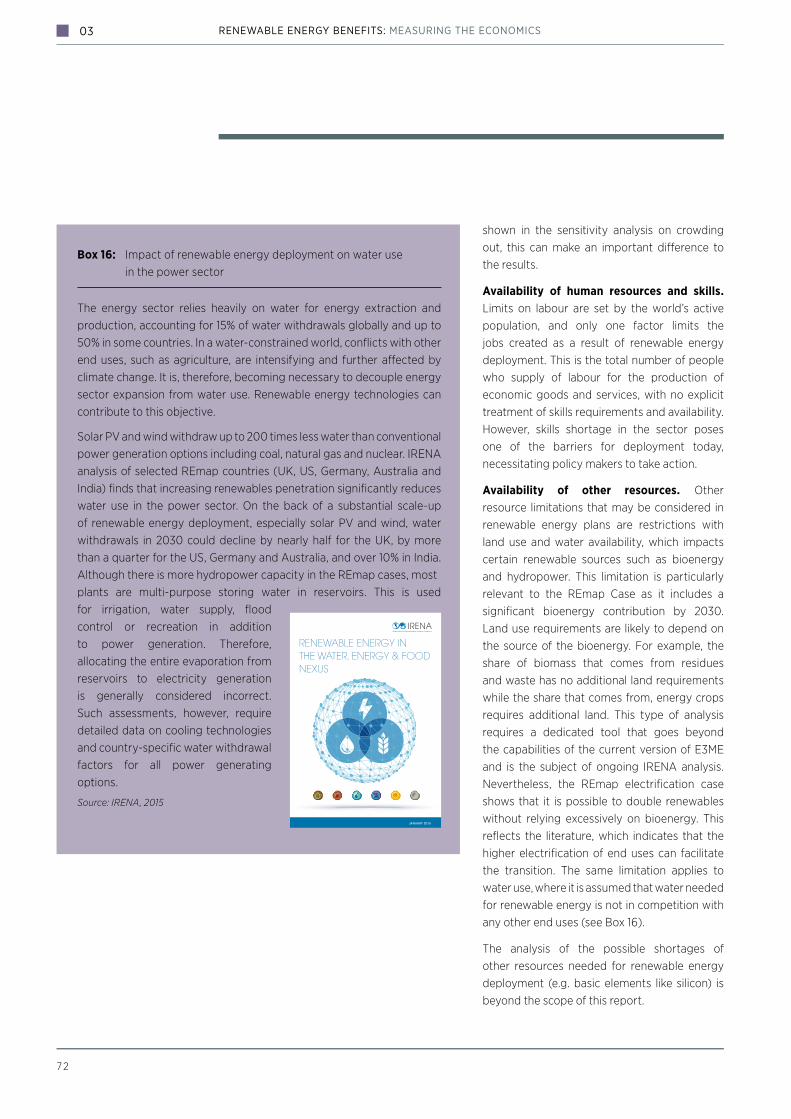
7 2
03 RENEWABLE ENERGY BENEFITS: MEASURING THE ECONOMICS
shown in the sensitivity analysis on crowding out, this can make an important di¨erence to the results.
Availability of human resources and skills. Limits on labour are set by the world’s active population, and only one factor limits the jobs created as a result of renewable energy deployment. This is the total number of people who supply of labour for the production of economic goods and services, with no explicit treatment of skills requirements and availability. However, skills shortage in the sector poses one of the barriers for deployment today, necessitating policy makers to take action.
Availability of other resources. Other resource limitations that may be considered in renewable energy plans are restrictions with land use and water availability, which impacts certain renewable sources such as bioenergy and hydropower. This limitation is particularly relevant to the REmap Case as it includes a significant bioenergy contribution by 2030. Land use requirements are likely to depend on the source of the bioenergy. For example, the share of biomass that comes from residues and waste has no additional land requirements while the share that comes from, energy crops requires additional land. This type of analysis requires a dedicated tool that goes beyond the capabilities of the current version of E3ME and is the subject of ongoing IRENA analysis. Nevertheless, the REmap electrification case shows that it is possible to double renewables without relying excessively on bioenergy. This reflects the literature, which indicates that the higher electrification of end uses can facilitate the transition. The same limitation applies to water use, where it is assumed that water needed for renewable energy is not in competition with any other end uses (see Box 16).
The analysis of the possible shortages of other resources needed for renewable energy deployment (e.g. basic elements like silicon) is beyond the scope of this report.
Box 16: Impact of renewable energy deployment on water use in the power sector
The energy sector relies heavily on water for energy extraction and production, accounting for 15% of water withdrawals globally and up to 50% in some countries. In a water-constrained world, conflicts with other end uses, such as agriculture, are intensifying and further a¨ected by climate change. It is, therefore, becoming necessary to decouple energy sector expansion from water use. Renewable energy technologies can contribute to this objective.
Solar PV and wind withdraw up to 200 times less water than conventional power generation options including coal, natural gas and nuclear. IRENA analysis of selected REmap countries (UK, US, Germany, Australia and India) finds that increasing renewables penetration significantly reduces water use in the power sector. On the back of a substantial scale-up of renewable energy deployment, especially solar PV and wind, water withdrawals in 2030 could decline by nearly half for the UK, by more than a quarter for the US, Germany and Australia, and over 10% in India. Although there is more hydropower capacity in the REmap cases, mostplants are multi-purpose storing water in reservoirs. This is usedfor irrigation, water supply, flood control or recreation in addition to power generation. Therefore, allocating the entire evaporation from reservoirs to electricity generation is generally considered incorrect. Such assessments, however, require detailed data on cooling technologies and country-specific water withdrawal factors for all power generating options.
Source: IRENA, 2015
JANUARY 2015
RENEWABLE ENERGY IN THE WATER, ENERGY & FOOD NEXUS

03
7 3
MEASURING BENEFITS: METHODOLOGY AND ANALYSIS
ENERGY INVESTMENTS BEYOND THE POWER SECTOR
This study does not include the investments needed in end use sectors to achieve the REmap and REmapE cases, which is another disadvantage. This has some impact on the comparison of results between cases. However, this is not a major limitation in the analysis, since the capital stock in end use sectors needs to be replaced more often. The additional required investments compared to the Reference Case are thus lower than those in the power sector. Indeed, IRENA analysis (IRENA, 2015c) highlights that the power sector would require around three-quarters of the total investments needed to double the renewable energy share. In addition, the investments needed in biofuel production capacity in the REmap Case are not represented. However, these should be relatively minor in comparison to investments in the power sector in line with the 450 ppm Scenario in the IEA World Energy Investment Outlook (IEA, 2014b). In other words, the analysis in this report accounts for the majority of the investment needed, namely in the power sector.
The representation of investment in the power sector is more accurate than that in the oil and gas sectors, which is represented as a fixed proportion of output. This is another possible limitation to this analysis. It means the reduction of investment in the oil and gas sectors may be slightly undervalued in this analysis. This is because the price of fossil fuels between the analysed cases is assumed to be the same. Thus the decline in output and hence investment in these sectors is a result of reduced volume alone and not lower prices (which could be expected in a world with falling fossil fuel demand). This implies that the e¨ects of renewable energy deployment on overall investment in the economy are overvalued
because the reduction from the oil and gas sectors is not entirely captured. However, this e¨ect would be counterbalanced with the increased investments required in end use and biofuels, so the overall conclusions of this report are unlikely to be a¨ected.
COMPOSITION OF RETAIL ELECTRICITY PRICES
Retail electricity prices are determined as a fixed mark-up of wholesale electricity prices, which are based on the LCOE of each technology. This is weighted according to its share in the generation mix in each country and case. This can be considered as average rather than marginal pricing, which means that fixed and investment costs are included and there is no ‘missing money’ problem.48 In computing the LCOE of each technology, investment, fuel and carbon costs are taken into account. Sensitivity analyses relating to technology costs, fossil fuel prices and carbon prices have been carried out for each one of these parameters. Once wholesale electricity prices are obtained, retail electricity prices are worked out as a fixed mark-up of the wholesale price. The mark-up includes the system costs associated with increased penetration of renewable energy (e.g. grid integration). This impact is relatively minor because the analysed power mixes from IRENA’s REmap study already include additional back-up capacity needs.49
Calculating retail electricity prices in this manner fails to account for two factors. Firstly, the possible cost of supporting renewables (in cases where such costs are charged to electricity consumers). Secondly, the merit order e¨ect and other influences that renewables may have on wholesale power markets. However, these prices only a¨ect the overall macroeconomic results through the consumer price index,
48. ‘Missing money’ is a common problem in macroeconomic models representing the power sector in detail. If marginal pricing is assumed, only variable costs are covered for those technologies in the margin so the money corresponding to fixed and investment costs is missing (i.e. not paid from consumers to producers).
49. By adding additional gas capacity and assigning it a rather low capacity factor of around 35%.
74
03 RENEWABLE ENERGY BENEFITS: MEASURING THE ECONOMICS
in which electricity is a small fraction. These limitations are thus considered to have a limited impact on the overall results.
EXOGENOUS VARIABLES ACROSS CASES
This study assumes several variables to be constant across cases, notably technology costs, fossil fuel prices and carbon prices (as shown in Table 2). This makes the scenarios slightly less realistic. It influences the observed trade e¨ects in fossil fuel exporting countries where the reduction of exports in the REmap Case is due to reduced volumes and not to reduced prices. However, it is necessary to keep these assumptions constant across cases to isolate the economic e¨ects of renewable energy from the economic e¨ects of a lower oil price, for instance.
CLIMATE CHANGE AND OTHER ENVIRONMENTAL EXTERNALITIES
The macroeconomic results presented do not incorporate an economic estimation of the e¨ects of renewable energy on climate change mitigation nor the reduction of other environmental externalities. While these e¨ects are accounted for in the welfare indicator, the GDP results do not include such valuation in terms of US dollars. This is due to the uncertainties and a wide range of conversion values (e.g. social costs of carbon, damage values) reported in the literature. The GDP improvements highlighted in this analysis could thus be considered conservative.
A ballpark estimation proves that additional benefits are in the same order of magnitude as reported GDP improvements. Renewable energy deployment in line with REmap could achieve an annual reduction of CO2 emissions50 of around 8.4 gigatonnes by 2030 (IRENA, 2016, forthcoming). This would indicate a social cost of carbon of USD 20-50/t51, implying an improvement in the global economy of USD 170-420 billion in 2030. This is comparable to the USD 706 billion added to global GDP
in 2030 in the REmap Case. These additional benefits would be even greater if reduced emissions from other greenhouse gases are included or if reduced environmental externa-lities from other pollutants are factored in.
BIOENERGY TRADE
Modern bioenergy will probably have a significant role in a global system based on renewable energy. Bioenergy is expected to increase, as outlined by IRENA research on the topic (e.g. IRENA, 2014c). Some countries, such as Canada, Nigeria, Russia and Ukraine, have the potential to become major bioenergy exporters. Bioenergy exports could partly o¨set the decline in the trade balance observed for some fossil-fuel exporting countries, such as Russia. However, bioenergy trade is not characterised in this analysis so these e¨ects are not shown in the trade balance results presented in this report.
DATA GAPS
Macro-econometric tools are data-intensive. They require, for instance, detailed historical datasets on the structure of the economy (time series covering the period since 1970 and input-output tables with sectoral disaggregation). The data are collected from statistical o«ces and compiled according to accounting conventions. There is at present no equivalent to the Global Trade Analysis project (GTAP) database maintained by Purdue University and widely used in computable general equilibrium (CGE) modelling for time series. This means a large amount of resources must be put into collecting suitable datasets. Data limitations can prove to be a particular drawback when trying to obtain country-level results for economies without solid statistical institutions and procedures. The quality of existing renewable energy data thus remains uneven, necessitating greater harmonisation of data reporting categories.
50. Excluding other greenhouse gases such as methane. If the avoided emissions of these gases were also
taken into account, the additional economic benefit
of renewable energy deployment could be even
greater.
51. Real 2015.

03
75
MEASURING BENEFITS: METHODOLOGY AND ANALYSIS
3.5 KEY FINDINGS AND WAY FORWARD
The analysis presented in this report shows that doubling the share of renewables in the energy mix will bring substantial benefits to the global economy. In particular, global GDP in 2030 will increase by 0.6%-1.1%, adding between USD 706 billion and USD 1.3 trillion to the economy. These GDP improvements can be considered conservative since they do not account for the avoided negative economic impacts of climate change and environmental externalities, the positive impacts of expanding access to modern energy services, or the contribution of bioenergy-related activities to the GDP.
The results obtained in this report stand the normal tests of econometrics. A sensitivity analysis has been carried out, which highlights the importance of crowding out of capital.
Like all quantitative tools, the one used for this analysis has limitations that need to be considered when interpreting its results. One of this study’s drawbacks is that it assumes an exogenous, fixed energy mix. The resulting price elasticity of demand in the study’s underlying tool is thus zero. Secondly, energy access remains an undervalued variable due to pre-existing data and methodology limitations. Thirdly, and owing to the scope of this report, the tool assumes that the production capacities of supplying sectors and the financial, human and other resources needed are su«cient. It assumes they do not impose a limit on renewable energy deployment. The results of this report should therefore be interpreted in this context.
Finally, the main limitations of this analysis define a path forward for future research outlined below;
R Use a more dynamic approach and explore the e¨ects of variable demand elasticity.
R Estimate the macroeconomic and welfare impacts of enhanced energy ac-cess through renewables, building on IRENA’s continuing work;
R Examine the structural and distri- butional e¨ects of renewable energy deployment to understand the economic sectors most a¨ected;
R Analyse skills availability and needs in the renewable energy sector to address skills shortages (IRENA, 2013);
R Develop an indicator of energy equipment trade based on work carried out by institutions such as the OECD or UNEP. An indicator of this type would shed light on the location of energy equip-ment (e.g. turbines, solar panels) manu-facture and demand. It would thus reveal trade flows, and
R Refine the analysis by adding more countries or new economic variables such as household incomes and consumption.

THE WAY FORWARD
04

7 7
THE WAY FORWARD 04
The great energy challenge of the future is to meet the demand growth of a growing world. Decisions made today on energy sector investments and infrastructure have long-lasting implications. Environmental con-sciousness and energy security concerns have compelled policy makers to explore energy supply options that are cost-e¨ective, reliable, secure and environmentally sustainable. Re-newable energy is a key part of the solution. It can contribute to the long-term resilience of the global energy system, which underpins economic development.
Recent global agreements on climate and sustainable development confirm the emerging consensus on the role of renewables, which is further attested by the adoption of renewable energy targets in at least 164 countries to date. As countries around the world step up e¨orts in this direction, a better understanding of the wider economic impact will support informed decision-making. This, in turn, will help to maximise the benefits of an accelerated transition to renewables.
Renewable Energy Benefits: Measuring the Economics provides the first global quanti-fication of the macroeconomic impact of renewable energy deployment, as estimated by selected variables. The assessment uses a macro-econometric tool which allows to estimate the impact of deployment on GDP, welfare, employment and trade. As the results show, doubling the share of renewables in the energy mix by 2030 would increase global GDP by up to 1.1 percent, improve welfare by up to 3.7 percent and support over 24 million jobs in the sector.
Despite their many benefits and their growing competitiveness, the deployment of renewable energy technologies still falls short of its potential. This is partly because markets fail to account for externalities and to consider asymmetry of information, further aggravated by system inertia. As a result, renewable energy deployment requires a conducive enabling environment to level the playing field supported by firm government commitment.
THE WAY FORWARD: THE CENTRAL ROLE OF ENABLING FRAMEWORKS
Government commitments can take the form of credible, time-bound renewable energy targets, which serve to anchor investor confidence and set out the trajectory for development of the sector. Importantly, targets must be backed by dedicated policies and regulatory frameworks. These ensure predictable revenue stream for projects, create a stable investment environment and can help to overcome non-economic barriers. While a deployment policy triggers investment in the sector, a mix of policies can support the broader development of the enabling environment.
E¨ective deployment policies have supported the growth of renewables globally. More than 145 countries (as of early 2015) have introduced regulatory (e.g. feed-in tari¨, net metering, auctions), and fiscal incentives and public financing (e.g. capital subsidy, investment or production tax credit). This number has increased nearly ten times over the past decade. Renewables now make up a distinct share of the energy mix in several countries, with substantial growth anticipated in the coming decades. Rapidly declining technology costs and increasing shares of variable generation have led
THE WAY FORWARD
GDP Welfare TradeJobs
GDP Welfare TradeJobs
GDP Welfare TradeJobsGDP Welfare TradeJobs
GDP Welfare TradeJobs
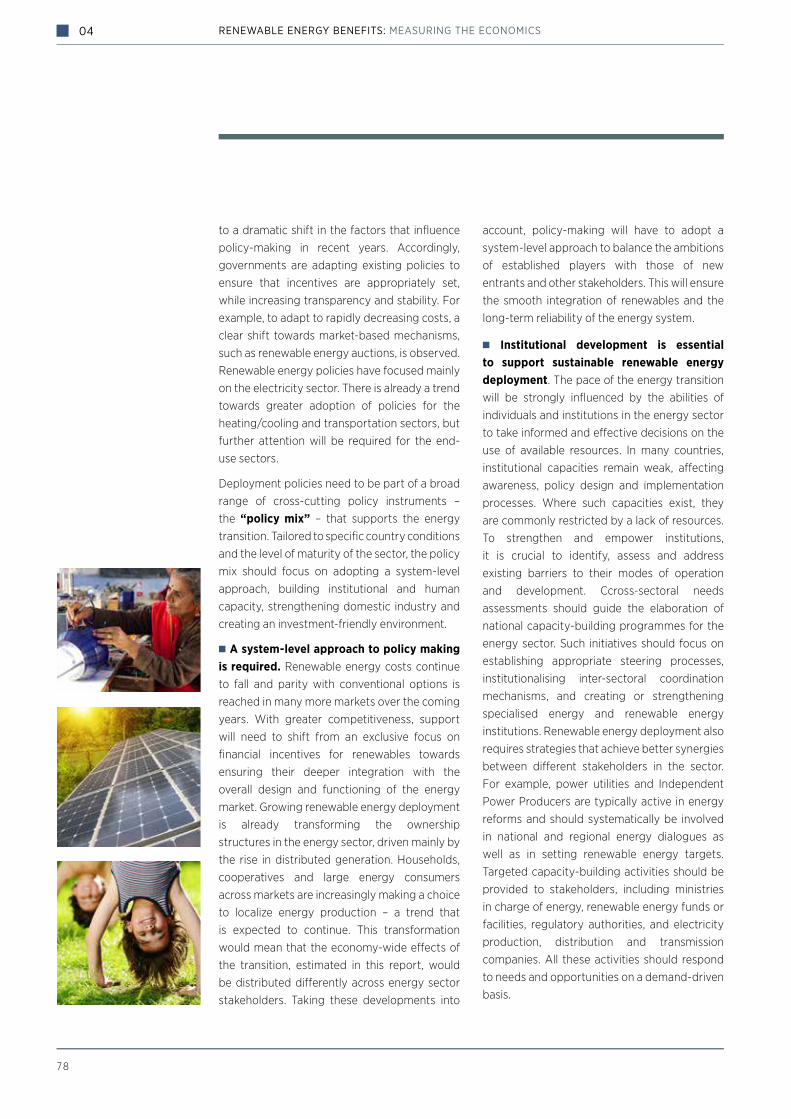
78
04 RENEWABLE ENERGY BENEFITS: MEASURING THE ECONOMICS
to a dramatic shift in the factors that influence policy-making in recent years. Accordingly, governments are adapting existing policies to ensure that incentives are appropriately set, while increasing transparency and stability. For example, to adapt to rapidly decreasing costs, a clear shift towards market-based mechanisms, such as renewable energy auctions, is observed. Renewable energy policies have focused mainly on the electricity sector. There is already a trend towards greater adoption of policies for the heating/cooling and transportation sectors, but further attention will be required for the end-use sectors.
Deployment policies need to be part of a broad range of cross-cutting policy instruments – the “policy mix” – that supports the energy transition. Tailored to specific country conditions and the level of maturity of the sector, the policy mix should focus on adopting a system-level approach, building institutional and human capacity, strengthening domestic industry and creating an investment-friendly environment.
A system-level approach to policy making is required. Renewable energy costs continue to fall and parity with conventional options is reached in many more markets over the coming years. With greater competitiveness, support will need to shift from an exclusive focus on financial incentives for renewables towards ensuring their deeper integration with the overall design and functioning of the energy market. Growing renewable energy deployment is already transforming the ownership structures in the energy sector, driven mainly by the rise in distributed generation. Households, cooperatives and large energy consumers across markets are increasingly making a choice to localize energy production – a trend that is expected to continue. This transformation would mean that the economy-wide e¨ects of the transition, estimated in this report, would be distributed di¨erently across energy sector stakeholders. Taking these developments into
account, policy-making will have to adopt a system-level approach to balance the ambitions of established players with those of new entrants and other stakeholders. This will ensure the smooth integration of renewables and the long-term reliability of the energy system.
Institutional development is essential to support sustainable renewable energy deployment. The pace of the energy transition will be strongly influenced by the abilities of individuals and institutions in the energy sector to take informed and e¨ective decisions on the use of available resources. In many countries, institutional capacities remain weak, a¨ecting awareness, policy design and implementation processes. Where such capacities exist, they are commonly restricted by a lack of resources. To strengthen and empower institutions, it is crucial to identify, assess and address existing barriers to their modes of operation and development. Ccross-sectoral needs assessments should guide the elaboration of national capacity-building programmes for the energy sector. Such initiatives should focus on establishing appropriate steering processes, institutionalising inter-sectoral coordination mechanisms, and creating or strengthening specialised energy and renewable energy institutions. Renewable energy deployment also requires strategies that achieve better synergies between di¨erent stakeholders in the sector. For example, power utilities and Independent Power Producers are typically active in energy reforms and should systematically be involved in national and regional energy dialogues as well as in setting renewable energy targets. Targeted capacity-building activities should be provided to stakeholders, including ministries in charge of energy, renewable energy funds or facilities, regulatory authorities, and electricity production, distribution and transmission companies. All these activities should respond to needs and opportunities on a demand-driven basis.

79
THE WAY FORWARD 04
Skills development through education and training is essential to support the expansion of the renewable energy sector. This requires systematic access across all layers of the society to education and training in relevant fields, including engineering, economics, science, environmental management, finance, business and commerce. Professional training, as well as school or university curricula must evolve adequately to cover renewable energy, sustainability and climate change. Vocational training programmes can also o¨er opportunities to acquire specialisation and take advantage of the growing renewable energy job market. The elaboration of specific, certified skills and the categorisation of trainees based on their level of experience and training is recommended. Policies and measures should target the development of skills, both through financial support and through strategic planning to meet demand for specific skills. Planning that integrates education and training policies within national renewable energy strategies has proven to be essential. National renewable energy policies an action plans
could include support policies that incorporate renewable energy into technical and tertiary curricula, develop training institutes and centres of excellence and provide dedicated financial support. These policies should be accompanied by continued collaboration between industry and policy makers from the energy and education sectors. In addition, R&D is needed to stimulate technological breakthroughs, improve products and services, and increase the applicability of technologies to local conditions. These can accelerate deployment, reduce costs and address country-specific issues.
Strengthening domestic capabilities and boosting the development of local industries can help to maximise the benefits of deploying renewables. As a result of increasing renewable energy deployment, new markets will emerge, creating new trade flows while providing opportunities for all economies to localise di¨erent segments of the renewable energy value chain. The segments that can be localised depend on the state and competitiveness of local complementary industries as well as the

8 0
04 RENEWABLE ENERGY BENEFITS: MEASURING THE ECONOMICS
projected demand for goods and services. Some segments, such as construction materials and services, are more easily localised than others, such as manufacturing. Cross-cutting policy interventions, like industrial upgrades, supplier-development programmes and industrial-cluster cultivation can contribute to increased competitiveness and production quality. Nascent industries can be further supported through measures that create demand for local goods and services. However, these measures need to be planned with a target deadline and designed in a way that ensures technology transfer and leverages existing industrial capabilities.
An investment-friendly environment is essential to overcome financing barriers and attract investors. To double the share of renewables by 2030, global annual investments in the renewable power sector need to be in the range of USD 500 billion to USD 750 billion between now and 2030 (compared to over USD 270 billion in 2014). The lion’s share of new investments will need to come from private sources. As deployment grows and new markets emerge, developers are improving in forecasting cash-flows, while financiers are able to more accurately assess risk and design financing products suited for renewable energy projects. Nevertheless, actual and perceived risks continue to slow down investment growth in renewable energy, especially in new markets. Policy makers and international financial institutions must deploy the right policy and financial tools to address these risks and mobilise private sector investment. Public funding will continue to remain an important catalyst and will need to increase. Ample experience shows that public finance can de-risk investments and thus leverage considerable funding from private sources, both domestic and international. Any strategy to mobilise private investment needs to focus on risk mitigation instruments and other financing tools, both to develop a strong pipeline of projects, and to unlock private
project financing and refinancing opportunities. Investment strategies need to be tailored to each phase of the renewable energy project cycle: planning, construction and operation. Given that investment decisions today can lock-in energy systems and associated emissions for decades, a greater focus is needed on planning in the short-term to ensure the development of a pipeline of attractive renewable energy projects. The success of any investment strategy will rely on the active participation of a broad spectrum of private and public actors, including development finance institutions, climate finance institutions, private equity funds, institutional investors, export credit agencies and green and commercial banks.
CONCLUSIONS
As countries strengthen their policy and regulatory frameworks to transform their energy systems, they have a unique op-portunity to meet climate goals while also fuelling economic growth and improving welfare. Scaling up renewable energy can generate new sources of growth, increase incomes, create jobs and improve wel-fare. Going forward, holistic, adaptable frameworks that capture and measure the multiple impacts of renewable energy deployment can tip the balance in favour of low-carbon investments.
Policy makers responsible for taking to-day’s critical investment decisions need more complete analysis and evidence of the broad impacts of their choices. IRENA’s Renewable Energy Benefits: Measuring the Economics, provides a first glimpse of the great opportunities of-fered by the energy transition, paving the way for further exploration of the topic.

GDP Jobs Welfare Trade
RENEWABLE ENERGY
BENEFITS:MEASURING THE
ECONOMICS
REFERENCES
8 2
RENEWABLE ENERGY BENEFITS: MEASURING THE ECONOMICS
REFERENCES
ABS (2012), Year Book Australia, 2012: Mining Industry, Economic Contribution, Australian Bureau of Statistics, Canberra, Australia.
Ackerman, F. and J. Daniel (2014), (Mis)understanding Climate Policy: The Role of Economic Modelling, England, Wales, Northern Ireland, and WWF-UK, Cambridge, USA.
AEA Technology Environment (2005), Damages per Tonne Emissions of PM2.5, NH3, SO2, NOx and VOCs from Each EU25 Member State (Excluding Cyprus) and Surrounding Seas, AEA Technology Environment, Didcot, UK.
AEE (2015), Facts: The Most Important Data on Renewable Energy in Germany, Clear and Concise, Agentur für Erneuerbare Energien, Berlin, Germany.
Anger, A. and T. Barker (2015), Finance and the Macroeconomics of Environmental Policies: The E«ects of the Financial System and Financial Crises on Global Growth and the Environment, Palgrave Macmillan, Basingstoke, UK, pp. 153-193.
Blazejczak, J. G.B. Frauke, E. Dietmar, W.-P. Schill (2014), Economic E«ects of Renewable Energy Expansion: a Model-Based Analysis for Germany, Renewable and Sustainable Energy Reviews, 40, 1070-1080, doi:10.1016/j.rser.2014.07.134.
Böhringer, C., Keller, A., and van der Werf, E. (2013). Are green hopes too rosy? Employment and welfare impacts of renewable energy promotion, Energy Economics, 36, pp. 277–285. doi:10.1016/j.eneco.2012.08.029.
Bose, T.K., Uddin, M.R. and Mondal, A. (2013), Impacts of Electricity Access to Rural SMEs, International Journal of Managing Value and Supply Chains (IJMVSC), 4(4), pp. 17-28.
CE (2012), A Study into the Economics of Gas and O«shore Wind, Cambridge Econometrics, Cambridge, UK.
Chancel, L., G. Thiry and D. Demailly (2014), Beyond-GDP Indicators: to What End?, Institut du Développement Durable et des Relations Internationales, Paris, France.
China National Renewable Energy Centre (2015), IRENA communication with experts.
Daly, H., J. Cobb, C.W. Cobb (1989), For the Common Good: redirecting the economy toward community, the environment, and a sustainable future, Beacon Press, Boston, USA.
Devaux P. (2013), Economic Diversification in the GCC: Dynamic Drive Needs to be Confirmed, Conjoncture, Economic Research – BNP PARIBAS, Baudouin Prot, Paris, France, pp. 17-25.
Doornik, J.A and M. Ooms (2007), Introduction to Ox: An Object-Oriented Matrix Language, Timberlake Consultants Press, London, UK.
EC (2013), Progress on ‚GDP and beyond‘ Actions, European Commission, Brussels, Belgium.
EC (2014), A Policy Framework for Climate and Energy in the Period from 2020 up to 2030, European Commission, Brussels, Belgium.
Edler, D. (2012) Modeling Economic Impacts of Renewable Energy Expansion – The Experience for Germany, EcoMod 2012, International Conference on Economic Modeling, Sevilla, Spain.
Engle, R.F and C.W.J Granger (1987), Co-integration and Error Correction: Representation, Estimation and Testing, Econometrica, 55(2), pp. 251-76.
ERI (2014), Renewable Energy-Based Rural Electrification: the mini-grid experience from India, Energy and Resources Institute, New Delhi, India.
Galbraith, K. (2014), Geothermal Industry Grows With Help From Oil and Gas Drilling, New York Times, Business Day, Green Column, 23 July 2014.
Giannetti B.F, F. Agostinhoa, C.M.V.B. Almeidaa, D. Huisinghb, A Review of Limitations of GDP and Alternative Indices to Monitor Human Wellbeing and to Manage Eco-system Functionality, Journal of Cleaner Production, 87, 11-25, doi:10.1016/j.jclepro.2014.10.051.
Greenpeace (2014), Energy [R]evolution: A Sustainable USA Energy Outlook, Third edition, Amsterdam, Netherlands.
Greenpeace (2015), Energy [R]evolution: A Sustainable World Energy Outlook 2015. 100% Renewable Energy for All, Amsterdam, Netherlands.
Abay Analistas Económicos y Sociales (2014), El Impacto de las Energías Renovables en la Economía con el Horizonte 2030, Greenpeace, Amsterdam, Netherlands.
Hamilton, T. (2015), Geothermal industry reaches out to out-of-work oil drillers, Corporate Knights.
Hendry, D.F, A. Pagan and J.D. Sargan (1984), Dynamic Specification, Handbook of Econometrics, Vol II, Elsevier Science Publishers, Amsterdam, Netherlands.
ICF International (2015), Economic Analysis of US Decarbonization Pathways: Summary and Findings, ICF International, Faifax, USA.
IEA (2013), World Energy Outlook 2013, International Energy Agency, Paris, France.
IEA (2014a), World Energy Outlook 2014, International Energy Agency, Paris, France.
IEA (2014b), World Energy Investment Outlook, International Energy Agency, Paris, France.
IEA (2014c), The Multiple Benefits of Energy E³ciency, International Energy Agency, Paris, France.
IEA (2015), World Energy Outlook 2015, International Energy Agency, Paris, France.
International Energy Agency and World Bank (2015), Sustainable Energy for All 2015 – Progress Toward Sustainable Energy, World Bank, Washington, DC, USA.
ILO (2015), World Employment and Social Outlook – Trends 2015, International Labour Organization, Geneva, Switzerland.
ILO (2015), World Employment and Social Outlook – Trends 2015, Washington DC, USA.
IMF (2013), How Large Are Global Energy Subsidies?, International Monetary Fund, Washington DC, USA.
REFERENCES
8 3
IMF (2015), Sta« Report for the 2015 Article IV Consultation with Saudi Arabia, International Monetary Fund, Washington DC, USA.
IPCC (2001), Climate Change 2001: Mitigation, Intergovernmental Panel on Climate Change, Geneva, Switzerland.
IRENA (2011), Renewable Energy Jobs: Status, Prospects and Policies, International Renewable Energy Agency, Abu Dhabi, UAE.
IRENA (2012a), Renewable Energy Jobs and Access, International Renewable Energy Agency, Abu Dhabi, UAE.
IRENA (2012b), Renewable Energy Jobs and Access. A Series of Case Studies, International Renewable Energy Agency, Abu Dhabi, UAE.
IRENA (2013), Renewable Energy and Jobs, International Renewable Energy Agency, Abu Dhabi, UAE.
IRENA (2014), Adapting Renewable Energy Policies to Dynamic Market Conditions, International Renewable Energy Agency, Abu Dhabi, UAE.
IRENA (2014a), Renewable Energy and Jobs – Annual Review 2014, International Renewable Energy Agency, Abu Dhabi, UAE.
IRENA (2014b), REmap 2030: a Renewable Energy Roadmap, International Renewable Energy Agency, Abu Dhabi, UAE.
IRENA (2014c), Global Bioenergy Supply and Demand Projections. A Working Paper for REmap 2030, International Renewable Energy Agency, Abu Dhabi, UAE.
IRENA (2014d), Accelerating O«-grid Renewable Energy: Key Findings and Recommendations from IOREC 2014, International Renewable Energy Agency, Abu Dhabi, UAE.
IRENA (2015a), Renewable Energy and Jobs – Annual Review 2015, International Renewable Energy Agency, Abu Dhabi, UAE.
IRENA (2015b), Renewable Energy Target Setting, International Renewable Energy Agency, Abu Dhabi, UAE.
IRENA (2015c), REthinking Energy: Renewable Energy and Climate Change, International Renewable Energy Agency, Abu Dhabi, UAE.
IRENA (2015d), Africa 2030: Roadmap for a Renewable Energy Future, International Renewable Energy Agency, Abu Dhabi, UAE.
IRENA (2015e), From Baseload to Peak: Renewables Provide a Reliable Solution, International Renewable Energy Agency, Abu Dhabi, UAE.
IRENA (2015f), Renewable Energy in the Food, Energy and Water Nexus, International Renewable Energy Agency, Abu Dhabi, UAE.
IRENA (2015g), Renewable Power Generation Costs in 2014, International Renewable Energy Agency, Abu Dhabi, UAE.
IRENA (2015h), Renewable Energy Prospects: Mexico, REmap 2030 Analysis, International Renewable Energy Agency, Abu Dhabi, UAE.
IRENA (2016a forthcoming), Second Volume of REmap 2030: a Renewable Energy Roadmap, International Renewable Energy Agency, Abu Dhabi, UAE.
IRENA (2016b, forthcoming), Renewable Energy Market Analysis: GCC Region, International Renewable Energy Agency, Abu Dhabi, UAE.
IRENA (2016c forthcoming), Renewable Energy Benefits: Leveraging Local Industries, International Renewable Energy Agency, Abu Dhabi, UAE.
IRENA and CEM (2014), The Socioeconomic Benefits of Solar and Wind Energy, International Renewable Energy Agency and Clean Energy Ministerial, Abu Dhabi, UAE.
K.A.CARE (2012), Saudi Arabia’s Renewable Energy Strategy and Solar Energy Deployment Roadmap, King Abdullah City for Atomic and Renewable Energy, Riyadh, Saudi Arabia.
Khandker, S.R., Barnes, D.F. and Samad, H.A. (2009), Welfare Impacts of Rural Electrification: A Case Study from Bangladesh, World Bank, Washington DC, USA.
Kossoy A. et al. (2015), State and Trends of Carbon Pricing 2015, World Bank, Washington, DC, USA.
Lighting Africa (2015), Solar Lighting Products Improve Energy Access for 28.5 million People in Africa, Lighting Africa, Washington, DC, USA.
Lee, K., M.H Pesaran and R.G. Pierse (1990), Aggregation Bias in Labour Demand Equations for the UK Economy, Disaggregation in Econometric Modelling, chapter 6, Routledge, London, UK.
Lee, S., H. Pollitt and S-J. Park (2015), Low-Carbon, Sustainable Future in East Asia: Improving Energy Systems, Taxation and Policy Cooperation, Taylor & Francis, London, UK.
Lehr, U., C. Lutz and D. Edler (2012), Green Jobs? Economic Impacts of Renewable Energy in Germany, Energy Policy, 47, 358-364.
Lévêque, F. (2014), The Economics and Uncertainties of Nuclear Power, Cambridge University Press, Cambridge, UK.
Mankiw, N. G. (2003), Macroeconomics, Fifth edition, Worth Publishers, London, UK.
Mazumder, A., Keramat, S.A. and Rubel, M.M.H. (2011), An Analysis of the Socio-economic Impacts of Rural Electrification in Dumuria Upazilla, Khulna, Bangladesh Research Publication Journal, 5(4), pp. 329-336.
McCulla, S. H. and S. Smith (2007), Measuring the Economy: A Primer on GDP and the National Income and Product Accounts, Bureau of Economic Analysis, US Department of Commerce. Washington, DC, USA.
McGlade, C., and P. Ekins (2015), The Geographical Distribution of Fossil Fuels Unused When Limiting Global Warming to 2°C, Nature, 517(7533), pp. 187-190.
Mercure, J-F. (2012), FTT: Power A Global Model of the Power Sector with Induced Technological Change and Natural Resource Depletion, Energy Policy, 48, pp. 799–811.
NRDC and ACERA (2013), Beneficios Económicos de Energías Renovables No Convencionales en Chile, Natural Resources Defense Council and Asociación Chilena de Energías Renovables.
NRDC and ACERA, (2013), Beneficios Económicos de Energías Renovables No Convencionales en Chile, Natural Resources Defense Council and Asociación Chilena de Energías Renovables, Santiago, Chile.
REFERENCES
8 4
RENEWABLE ENERGY BENEFITS: MEASURING THE ECONOMICS
OECD (2011), Towards Green Growth, Organisation for Economic Co-operation and Development, Paris, France.
Pollin R., H. Garrett-Peltier, J. Heintz, B. Hendricks (2014), Green Growth. A U.S. Program for Controlling Climate Change and Expanding Job Opportunities, Massachusetts, USA.
Pollitt, H., Mercure, J.-F. (2016, forthcoming), The Role of Money and the Financial Sector in Energy-Economy Models Used for Assessing Climate Policy, ArXiv.
Pöyry Management Consulting and Cambridge Econometrics (2014), The Value of Wind Energy to Ireland, Pöyry Management Consulting (UK) Ltd.
PwC (2015), Estudio sobre las Inversiones Necesarias para que México Cumpla con sus Metas de Energías Limpias, PricewaterhouseCoopers, Mexico City, Mexico.
Rutovitz, J. (2010), South African Energy Sector Jobs to 2030, University of Technology, Sydney, Australia.
Simas, M. and S. Pacca (2014), Assessing Employment in Renewable Energy Technologies: A Case Study for Wind Power in Brazil, Renewable and Sustainable Energy Reviews, 31, pp. 83–90.
South Africa embassy (2013), Trade & Investment, Key Sectors, Minerals and Mining, South African Embassy, Amsterdam, Netherlands.
Statista (2015), Energy Industry: Share of GDP by Country.
Stiglitz, J.E., A. Sen, J.-P. Fitoussi (2009), Report by the Commission on the Measurement of Economic Performance and Social Progress, L‘Institut national de la statistique et des études économiques, Paris, France.
Stiglitz, J.E., A. Sen, J-P. Fitoussi (2009), Report by the Commission on the Measurement of Economic Performance and Social Progress (CMEPSP).
Strietska-Ilina O. et al.(2011), Skills for Green Jobs: a Global View. Synthesis Report Based on 21 Country Studies, International Labour O«ce, Skills and Employability Department, Job Creation and Enterprise Development Department, International Labour Organization, Geneva, Switzerland.
Synapse Energy Economics, Labor Network for Sustainability and 350.org (2015), The Clean Energy Future: Protecting the Climate, Creating Jobs and Saving Money, Synapse Energy Economics, Massachusetts, USA.
UK Energy Research Centre (2014) Low Carbon Jobs: the Evidence for Net Job Creation from Policy Support for Energy E³ciency and Renewable Energy, UKERC Technology & Policy Assessment Function, London, UK.
UN (2015), Transforming our World: the 2030 Agenda for Sustainable Development, United Nation, New York, USA.
UN University – International Human Dimensions Programme and United Nations Environment Programme (2014), Inclusive Wealth Report 2014. Measuring Progress Toward Sustainability, Cambridge University Press, Cambridge, UK.
UNDP (2013), Human Development Report 2013, Explanatory note on Rwanda”, United Nations Development Programme, New York, USA.
UNDP (2014), Human Development Report 2014. Sustaining Human Progress: Reducing Vulnerability and Building Resilience, United Nations, New York, USA.
UNEP (2011), Towards a Green Economy: Pathways to Sustainable Development and Poverty Eradication, United Nations Environment Programme, New York, USA.
UNEP (2013), Green Economy and Trade – Trends, Challenges and Opportunities, United Nations Environment Programme, New York, USA.
UNIDO and GGGI (2015), Global Green Growth: Clean Energy Industry Investments and Expanding Job Opportunities, Vol. I: Overall Findings, United Nations Industrial Development Organization and Global Green Growth Institute, Vienna, Austria and Seoul, South Korea.
Van der Zwaan, B., L. Cameron, and T. Kober (2013), Potential for Renewable Energy Jobs in the Middle East, Energy Policy. 60, 296-304, doi:10.1016/j.enpol.2013.05.014.
WB (2008), Designing Sustainable O«-Grid Rural Electrification Projects: Principles and Practices, World Bank, Washington, DC, USA.
WB (2011), The Changing Wealth of Nations: Measuring Sustainable Development in the New Millennium, World Bank, Washington DC, USA.
WB (2012), World Development Report 2013, World Bank, Washington DC, USA.
WB (2015a), World Development Indicators Database, World Bank, Washington DC, USA.
WB (2015b), Pricing Carbon: http://www.worldbank.org/en/programs/pricing-carbon
WEF (2012), Energy for Economic Growth: Energy Vision Update 2012, World Economic Forum, Geneva, Switzerland.
Wei, M., S. Patadia and D.M. Kammen (2010), Putting Renewables and Energy E³ciency to Work: How Many Jobs Can the Clean Energy Industry Generate in the USA?, Energy Policy, 38(2), pp. 919–931.
Wethe D. (2015), Global Oil Job Cuts Top 250,000, Bloomberg Business, access on 21 November, 2015.
WHO (2014), 7 Million Premature Deaths Annually Linked to Air Pollution, World Health Organization, Geneva, Switzerland.
WTO (2015), International Trade Statistics 2015, World Trade Organization, Geneva, Switzerland.
REFERENCES (continuance)
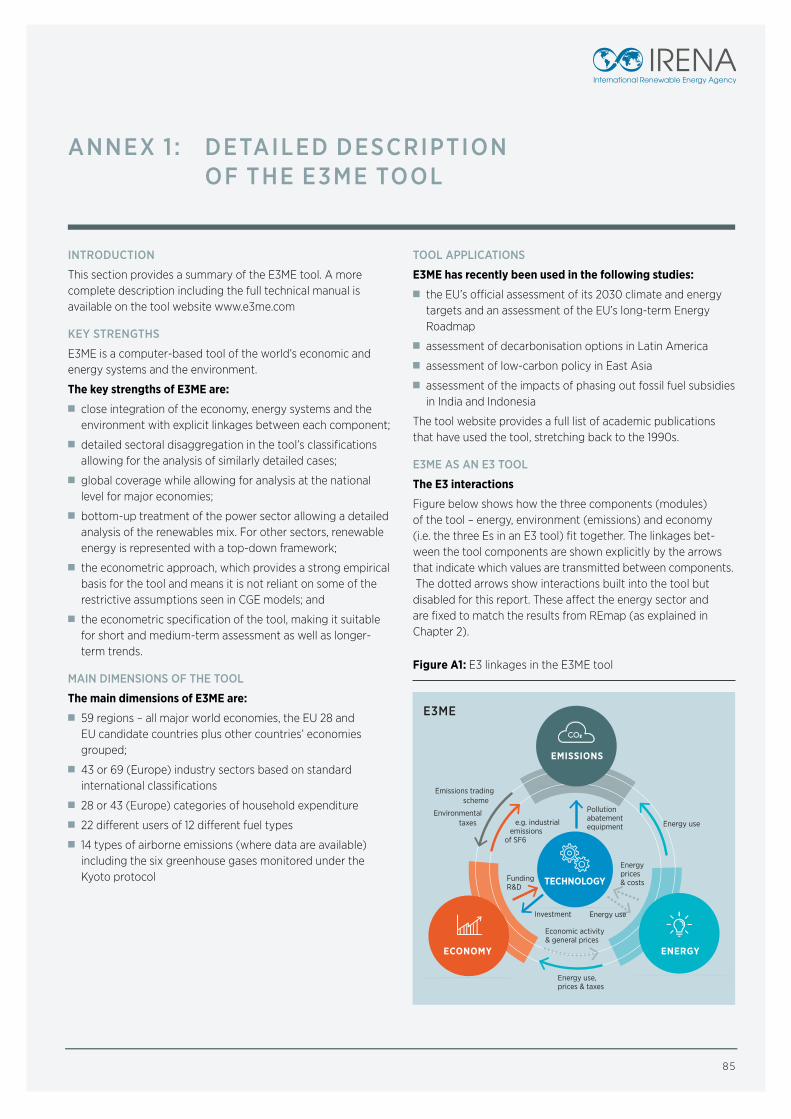
8 5
ANNEX 1 : DETAILED DESCRIPTION OF THE E3ME TOOL
INTRODUCTION
This section provides a summary of the E3ME tool. A more complete description including the full technical manual is available on the tool website www.e3me.com
KEY STRENGTHS
E3ME is a computer-based tool of the world’s economic and energy systems and the environment.
The key strengths of E3ME are:
close integration of the economy, energy systems and the environment with explicit linkages between each component;
detailed sectoral disaggregation in the tool’s classifications allowing for the analysis of similarly detailed cases;
global coverage while allowing for analysis at the national level for major economies;
bottom-up treatment of the power sector allowing a detailed analysis of the renewables mix. For other sectors, renewable energy is represented with a top-down framework;
the econometric approach, which provides a strong empirical basis for the tool and means it is not reliant on some of the restrictive assumptions seen in CGE models; and
the econometric specification of the tool, making it suitable for short and medium-term assessment as well as longer-term trends.
MAIN DIMENSIONS OF THE TOOL
The main dimensions of E3ME are:
59 regions – all major world economies, the EU 28 and EU candidate countries plus other countries’ economies grouped;
43 or 69 (Europe) industry sectors based on standard international classifications
28 or 43 (Europe) categories of household expenditure
22 di¨erent users of 12 di¨erent fuel types
14 types of airborne emissions (where data are available) including the six greenhouse gases monitored under the Kyoto protocol
TOOL APPLICATIONS
E3ME has recently been used in the following studies:
the EU’s o«cial assessment of its 2030 climate and energy targets and an assessment of the EU’s long-term Energy Roadmap
assessment of decarbonisation options in Latin America
assessment of low-carbon policy in East Asia
assessment of the impacts of phasing out fossil fuel subsidies in India and Indonesia
The tool website provides a full list of academic publications that have used the tool, stretching back to the 1990s.
E3ME AS AN E3 TOOL
The E3 interactions
Figure below shows how the three components (modules) of the tool – energy, environment (emissions) and economy (i.e. the three Es in an E3 tool) fit together. The linkages bet- ween the tool components are shown explicitly by the arrows that indicate which values are transmitted between components. The dotted arrows show interactions built into the tool but disabled for this report. These a¨ect the energy sector and are fixed to match the results from REmap (as explained in Chapter 2).
Figure A1: E3 linkages in the E3ME tool
E3ME
TECHNOLOGY
EMISSIONS
ENERGY ECONOMY
Energy use
Energy use
Energy prices& costs
Economic activity & general prices
Funding R&D
Investment
Pollution abatement equipment
Energy use, prices & taxes
e.g. industrial emissions
of SF6
Emissions tradingscheme
Environmentaltaxes
Energy use

REFERENCES RENEWABLE ENERGY BENEFITS: MEASURING THE ECONOMICS
8 6
Estimations of energy demand and feedbacks to the economy
The standard version of E3ME includes five sets of equations for energy demand – an aggregate equation set and one set for each of the four main fuel types. However, in this study the equations were not used because energy demand was instead made consistent with the projections in REmap.
However, the linkages to the economy are included. Feedbacks to the economy for the main section occur through the input-output relationships in the tool, which determine output levels within the energy extraction and distribution sectors. For example, if the steel sector uses 10% less coal in energy terms, it is assumed that (after correcting for prices) consumption of coal by the steel sector in economic terms also falls by 10%. Production of coal will be a¨ected either in the same country or through the trade relationships described below.
Treatment of renewables
E3ME covers low-carbon technologies in the power sector through the FTT power sector model (Mercure, 2012). Although FTT can provide estimates of renewable shares itself, when considering cases of di¨erent renewables penetration rates it can fix the renewables shares as defined in the cases analysed. The tool will then determine an electricity price based on average LCOE of the power mix. The tool will also feedback fuel consumption and the required investment to the economic part of the tool.
Final use of biofuels is also included in the tool’s energy equations. The use of other renewables by final energy users (e.g. decentralised solar) is covered by the tool’s classifications but at a lower level of detail.
The role of technology
Technological progress plays an important role in the E3ME tool, a¨ecting all three Es: economy, energy and environment. The approach to constructing the measure of technological progress in E3ME is adapted from that of Lee et al. (1990). It adopts a direct measure of technological progress by using cumulative gross investment but this is altered by using data on R&D expenditure, thus forming a quality adjusted measure of investment. The tool’s endogenous technical progress indicators appear in nine of E3ME’s econometric equation sets including trade, the labour market and prices. Investment and R&D in new technologies also appears in E3ME’s energy and materials demand equations to capture energy/resource savings technologies as well as pollution abatement equipment.
As described above, E3ME includes a set of specific technologies for the power sector, including both conventional and renewable options. These options are assigned specific characteristics, relating to cost, build time and intermittency, for instance.
Energy prices
A large global reduction in fossil fuel demand could prompt a fall in global energy prices. In the analysis in this report, fossil fuel prices are set as exogenous across all cases to match the assumptions in REmap. Cost-supply curves have been used only to determine the source of fuel supplies rather than prices.
Electricity prices are set using an average LCOE calculation as described above.
Material consumption
The specification of the materials submodel in E3ME follows that of the energy submodel. The units of analysis are thousands of tonnes, and materials demands are split into seven types of material and 16 user groups. The level of material consumption is estimated as a function of economic activity rates, relative prices and technology. Feedbacks are provided to the material extraction sectors (agriculture and mining).
Materials used for energy are not included in the materials demand equations but are instead estimated using a fixed energy-weight ratio. In the analysis in this report, biomass used for energy was not counted in the results for materials demand.
GDP AND ECONOMIC INDICATORS
GDP and output
GDP is formed as the sum of household expenditure, government consumption, investment and international trade (see below). With the exception of government consumption, which is treated as exogenous, there are estimated econometric equations for each component. Each equation includes a combination of quantity and price terms, and tool parameters are estimated using historical datasets covering each year since 1970. They are summarised in turn in the paragraphs below.
The tool also provides estimates of economic output and Gross Value Added by sector. Output by product group is worked out in a similar way to GDP by summing across the components of demand (including intermediate demand). Gross Value Added by industry is calculated by subtracting intermediate costs from output and correcting for net taxes.
Household consumption
Household consumption (or household expenditure) is determined using two sets of econometric equations. The first estimates total household budgets, which are assumed in the long run to move in line broadly with changes in real incomes. However, other factors like demographic development may a¨ect aggregate savings ratios so the relationship is not entirely one-to-one. In the short run, additional factors may also a¨ect rates of consumption. Changes to inflation rates or to unemployment rates may cause households to delay major purchases due to uncertainty over future incomes or prices.
ANNEX 1

87
Once the tool has estimated the aggregate consumption, a second set of equations determines spending by product group. In these equations, relative prices are used to estimate spending on each product. Consumption by each product is then scaled to be consistent with the total.
Investment
Investment (Gross Fixed Capital Formation) is one of the most important equation sets within the tool. Following post-Keynesian theory, investment is made by companies in expectation of future profits. Although relative prices and interest rates can also determine rates of investment, there is no explicit representation of finance in E3ME and it is assumed that banks make the necessary money available for lending. This assumption is tested in the crowding out sensitivities in the main report.
Stock building can be an important component of short-term economic growth but is less important in the long term. In E3ME, stock building is treated as exogenous.
Bilateral trade between regions
An important part of the modelling concerns international trade. E3ME solves for detailed bilateral trade between regions (similar to a two-tier Armington model). For most sectors, trade is modelled in three stages:
econometric estimation of regional sectoral import demand
econometric estimation of regional bilateral imports from each partner
forming exports from other regions’ import demands
Trade volumes are determined by a combination of economic activity indicators, relative prices and technology.
Trade in fossil fuels
Trade in fossil fuels is modelled using a di¨erent approach because the commoditised nature of fuels violates the Armington assumption of di¨erentiated production. A cost-supply curve approach is applied instead. It is assumed that the lowest-cost sources are used first given the existing rates of extraction (as a ratio of reserves) and within a range of uncertainty (i.e. production is not fully optimised). As discussed in the report, this approach provides important insights into the aggregate trade e¨ects.
Welfare
As discussed in this report, there is no standardised treatment of welfare in macroeconomic analysis. The indicator designed draws on the outputs available from the model and covers the economic, social and environmental dimensions of welfare. Results for each component are provided as percentage di¨erence from reference so readers can use their own weightings to estimate aggregate welfare outcomes.
Economic multipliers and price formation
Multipliers in E3ME
There are several loops of dependency in E3ME, which result in e¨ects similar to multipliers. Supply chains are represented by input-output tables which produce Type I multipliers. There is another loop from output to employment, incomes, household demand and further output, which gives the induced e¨ects associated with Type II multipliers.
However, there are additional feedback loops in E3ME. Expectations of higher future output can lead to additional investment, in turn leading to demand for investment goods (plus supply chain e¨ects). There are also trade interactions because an increase in GDP in one country will lead to higher demand for imports from other countries (which can feed back to the first country etc).
It should also be noted that E3ME includes measures of capacity that could limit multiplier e¨ects. The limit is most obvious in the labour market where population places a constraint on participation. Rising wages caused by a tighter labour market could crowd out some employment increases (see labour market section below). In other sectors, implicit capacity constraints are modelled using econometric equations which can a¨ect prices (see below). These equations are described in more detail in the tool manual.
Price formation in E3ME
Aside from wages (see below), E3ME’s economic module includes three sets of prices: domestic prices, import prices and export prices. Each is determined in the tool as a mark-up of unit costs.
In the long run it is assumed that all changes in production costs are passed on to final prices unless international competition prevents this from happening (e.g. in commoditised sectors). However, this constraint is not applied in the short run so there is an adjustment path for prices. Other factors that could a¨ect prices included investment and R&D since a higher quality product commands a higher price.
As noted above, the measures of capacity in the tool can also a¨ect price formation. If a sector’s output increases towards capacity, firms will have the incentive to increase prices and their rates of profitability. This is typically a short-term e¨ect since in the long run companies will invest in new capacity. Nevertheless, it is important as a determinant of overall output levels.
ANNEX 1
REFERENCES RENEWABLE ENERGY BENEFITS: MEASURING THE ECONOMICS
8 8
THE LABOUR MARKET
The treatment of the labour market distinguishes E3ME from other macroeconomic models. E3ME includes econometric equation sets for employment, average working hours, wage rates and participation rates. The first three of these are disaggregated by economic sector while participation rates are disaggregated by gender and five-year age band.
Employment is a function of economic output, real wage rates, average working hours and technology. In the results presented in this report, employment impacts are mostly determined by changes in economic output (notably in sectors that produce renewables equipment) and changes in wage rates. Wage rates are determined in the tool using a union-bargaining approach and typically increase when unemployment falls, o¨setting some of the initial employment gains.
A full specification of all the E3ME equations is provided in the tool manual.
Unemployment
The labour force is determined by multiplying labour market participation rates by population. Unemployment (both voluntary and involuntary) is worked out by taking the di¨erence between the labour force and employment.
Econometric specification
The econometric techniques used to specify the functional form of the equations are the concepts of cointegration and error-correction methodology, particularly as promoted by Engle and Granger (1987) and Hendry et al. (1984). The process involves two stages. The first is a levels relationship, whereby an attempt is made to identify the existence of a cointegrating relationship between the chosen variables. This is selected on the basis of economic theory and a priori reasoning. For example, the list of variables for employment demand contains real output, real wage costs, hours worked, energy prices and the two measures of technological progress. If a cointegrating relationship exists then the second stage regression is carried out. This is known as the error-correction representation. It involves a dynamic, first-di¨erence regression of all the variables from the first stage. This is accompanied by lags of the dependent variable, lagged di¨erences of the exogenous variables and the error-correction term (the lagged residual from the first stage regression).
Stationarity tests on the residual from the levels equation are performed to check whether a cointegrating set is obtained. Due to the size of the tool, the equations are estimated individually rather than through a cointegrating VAR. For both regressions, the estimation technique used is instrumental variables. This is principally because of the simultaneous nature of many of the relationships e.g. wage, employment and price determination. E3ME’s parameter estimation is carried out using a customised set of software routines based in the Ox programming language (Doornik, 2007). Its main advantage is that parameters for all sectors and countries may be estimated using an automated approach.
COMPARISON WITH CGE MODELS
E3ME is often compared to CGE models. In many ways the modelling approaches are similar; they are used to answer similar questions and use similar inputs and outputs. However, beneath the surface there are substantial di¨erences, and it is important to be aware of this when interpreting tool results. The two types of models come from distinct economic backgrounds. They are in general consistent in their accounting and identity balances but di¨er substantially in their treatment of behavioural relationships.
Ultimately this comes down to assumptions about optimisation. The CGE tool favours fixing behaviour in line with economic theory. For example, it assumes that individuals act rationally in their own self-interest and that prices adjust to market clearing rates. In this way aggregate demand automatically adjusts to meet potential supply, and output levels are determined by available capacity.
By contrast, econometric models like E3ME interrogate historical datasets to determine behavioural factors on an empirical basis. They do not assume optimal behaviour. The tool is demand-driven and makes the assumption that supply adjusts to meet demand (subject to any supply constraints) but at a level likely to be below maximum capacity.
This has important practical implications for scenario analysis, including scenarios of energy policy. The assumptions of optimisation in CGE models mean that all resources are fully utilised and it is not possible to increase economic output and employment by adding regulation. On the other hand, E3ME allows for the possibility of unused capital and labour resources that may be utilised under the right policy conditions. It is therefore possible (although not guaranteed) that additional regulation could lead to increases in investment, output and employment. For example, as demonstrated in this report, the additional investment required to increase renewables capacity could lead to additional job creation and multiplier e¨ects, depending on how the investment is financed.
The econometric specification in E3ME follows an error-correction methodology that estimates both the impacts of short-term shocks and the path that the key tool variables follow towards a long-term outcome. The equations are estimated separately for each sector and region. Further information about the approach is provided in the tool manual.
ANNEX 1
8 9
ANNEX 2: METHODS TO ESTIMATE SOCIO-ECONOMIC IMPACTS
A range of methods, both quantitative and qualitative, can be applied to assess the economic impact of implementing di¨erent energy policies and deploying varying energy tech-nologies across diverse geographical areas. A comprehensive review of these methods employed to analyse the impact of future scenarios of renewables deployment can be found in IRENA’s report The Socio-economic Benefits of Solar and Wind Energy (IRENA and CEM, 2014).
GROSS METHODS: THE RENEWABLE ENERGY SECTOR ALONE
Gross methods consider only the e¨ects of a particular sector and potentially its supply chain on the economy. For the renewables sector, this implies assessing its contribution to the economy, but without taking into account the e¨ects on other sectors such as fossil fuels. Gross methods on their own cannot provide estimates of macroeconomic impacts and are therefore less relevant to the present study. The Box A1 provides some examples of gross methods. Further information about the approach is provided in IRENA and CEM (2014).
NET METHODS: THE FULL ECONOMY
Net methods aim to examine the e¨ects of a sector across the economy as a whole, including the positive e¨ects in the sector itself and its suppliers and the negative impacts of displaced activities. The following methods are examples of such an approach:
Net input-output methods show how goods and services are bought and sold across the productive sectors of the economy. They compares two scenarios to obtain net results.52 They have two key limitations in that they exclude the e¨ects of changes in electricity prices as well as international trade and important economic actors such as households and governments.
Macro-econometric models go beyond the input-output analysis and include households, the public sector and international trade. They also introduce price-based interactions through econometric relationships based on historically observed data.
CGE models are similar in coverage to macro-econometric models. However, they model the economy from a supply side perspective (see next section) and assume that markets are perfect.
Economic simulation models provide an ad hoc representa-tion of real world relationships without a specific underlying economic paradigm.
Table A1 presents an overview of the main features of each method, including key attributes, applicability, resources needed and data requirements. It shows that the net input-output method requires less data than the other methods reviewed because it only accounts for productive sectors. The other methods require more data as they cover a broader set of variables.
A key methodological challenge in net macroeconomic analyses is how to bring together the technologically detailed approach needed to assess the energy system and the broader economy-wide analysis required to provide macroeconomic results. This report adopts a soft link (i.e. output from the former being an
Box A1: Examples of gross methods
One of the most commonly used methods for gross analysis is the employment factors, which enables the calculation of gross employment e¨ects without using a large-scale modelling tool (IRENA, 2013). Employment factors are recommended for quick and simple assessments and can only provide employment figures without other aspects of economic value creation. This method has been used to estimate employment in renewable energy at a global scale (IRENA, 2015; Teske et al., 2012) and a national scale, for instance in Brazil (Simas and Pacca, 2014), South Africa (Rutovitz et al., 2010) and the US (Wei et al., 2010). It has been used at a regional scale (e.g. for the Middle East by van der Zwaan et al., 2013). The study on the Middle East concludes that to achieve ambitious climate change mitigation goals, the renewable energy sector in the region would employ around 180,000 direct and indirect workers in 2030.
More advanced gross methods estimate employment and value added for the renewable energy sector and its suppliers (e.g. the steel sector). Examples are the supply chain and gross input-output analyses used in studies carried out in the US (the JEDI tool developed by the US National Renewable Energy Laboratory) and Spain (Greenpeace & Abay Asesores, 2014). The latter, for instance, concludes that the renewable energy sector contributed around 1.3% to Spanish GDP in 2015.
ANNEX 2
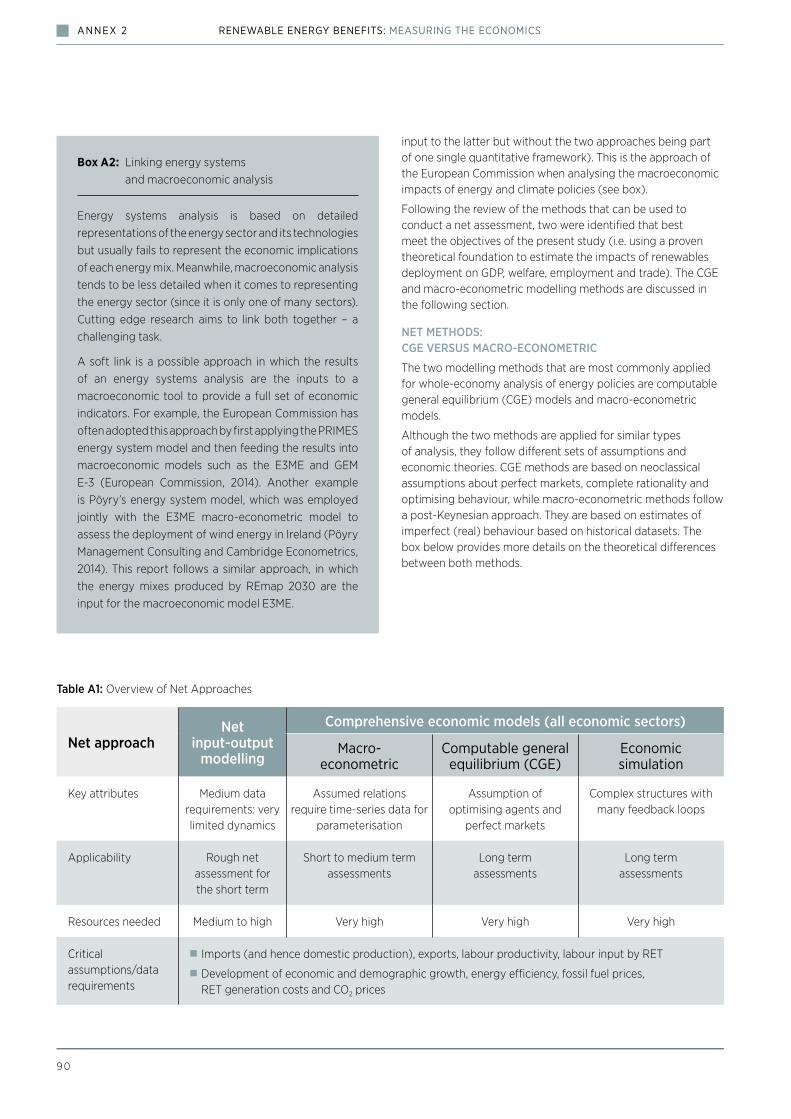
REFERENCES
9 0
RENEWABLE ENERGY BENEFITS: MEASURING THE ECONOMICS
input to the latter but without the two approaches being part of one single quantitative framework). This is the approach of the European Commission when analysing the macroeconomic impacts of energy and climate policies (see box).
Following the review of the methods that can be used to conduct a net assessment, two were identified that best meet the objectives of the present study (i.e. using a proven theoretical foundation to estimate the impacts of renewables deployment on GDP, welfare, employment and trade). The CGE and macro-econometric modelling methods are discussed in the following section.
NET METHODS: CGE VERSUS MACRO-ECONOMETRIC
The two modelling methods that are most commonly applied for whole-economy analysis of energy policies are computable general equilibrium (CGE) models and macro-econometric models.
Although the two methods are applied for similar types of analysis, they follow di¨erent sets of assumptions and economic theories. CGE methods are based on neoclassical assumptions about perfect markets, complete rationality and optimising behaviour, while macro-econometric methods follow a post-Keynesian approach. They are based on estimates of imperfect (real) behaviour based on historical datasets. The box below provides more details on the theoretical di¨erences between both methods.
Box A2: Linking energy systems and macroeconomic analysis
Energy systems analysis is based on detailed representations of the energy sector and its technologies but usually fails to represent the economic implications of each energy mix. Meanwhile, macroeconomic analysis tends to be less detailed when it comes to representing the energy sector (since it is only one of many sectors). Cutting edge research aims to link both together – a challenging task.
A soft link is a possible approach in which the results of an energy systems analysis are the inputs to a macroeconomic tool to provide a full set of economic indicators. For example, the European Commission has often adopted this approach by first applying the PRIMES energy system model and then feeding the results into macroeconomic models such as the E3ME and GEM E-3 (European Commission, 2014). Another example is Pöyry’s energy system model, which was employed jointly with the E3ME macro-econometric model to assess the deployment of wind energy in Ireland (Pöyry Management Consulting and Cambridge Econometrics, 2014). This report follows a similar approach, in which the energy mixes produced by REmap 2030 are the input for the macroeconomic model E3ME.
Table A1: Overview of Net Approaches
Net approachNet
input-output modelling
Comprehensive economic models (all economic sectors)
Macro- econometric
Computable general equilibrium (CGE)
Economic simulation
Key attributes Medium data requirements: very limited dynamics
Assumed relations require time-series data for
parameterisation
Assumption of optimising agents and
perfect markets
Complex structures with many feedback loops
Applicability Rough net assessment for the short term
Short to medium term assessments
Long term assessments
Long term assessments
Resources needed Medium to high Very high Very high Very high
Critical assumptions/data requirements
Imports (and hence domestic production), exports, labour productivity, labour input by RET
Development of economic and demographic growth, energy e«ciency, fossil fuel prices, RET generation costs and CO2 prices
ANNEX 2

91
Box A3: Details on the theoretical di¨erences between CGE and macro-econometric methods
CGE tool: Macro-econometric tool:
perfect competition
constant returns to scale
equilibrium solution
full employment or voluntary unemployment only
projection based on a base year of data
can be guess-estimated parameters
varying competition over sectors
varying returns to scale
supply matches demand but may be less than potential supply
voluntary and involuntary unemployment
projection based on historical relationships, with time-series data required
PHOTO CREDITS
Title page Sandia Labs / Flickr https://www.flickr.com/photos/sandialabs/5856871477/sizes/s/in/photostream/
page 12 Taiwan, Richie Chan page 15 dotshock / shutterstockpage 17 4 MW Hybrid Solar PV diesel mini-
grid project for 30 rural villages (selected for funding in the IRENA/ADFD Project Facility), Mali
Photograph: Agence Malienne pour le Développement de l’Energie Domestique et de l’Electrification rurale (AMADER), Mali
page 18 Kasto80 / Dreamstime.compage 22 Kara Harms / Flickr
https://www.flickr.com/photos/kara_allyson/8683649822/in/photolist-eekYyo
page 24 Engineers in Khonkaen, Thailand, kanphiphat / shutterstock
page 29 Soraya Kerouipage 29 India, Samrat35 / Dreamstime.compage 31 Small hydro power plant in Turkey,
Dmitry Naumov / shutterstockpage 31 Bright Green Energy Foundation,
Bangladeshpage 32 Wind Farming,
Braden Gunem / dreamstime
page 32 Yassine Anaia
page 32 E«cient cookstoves sold in Uganda, Photograph: GVEP International
page 33 Solar panel sculpture in Zadar, Croatia, Salajean / Dreamstime.com
page 39 Solar R & D center, Lukeqiang / Dreamstime.com
page 42 Installing solar panels, atm2003 / shutterstock
page 45 Trade port, Thailand, Sorapop Udomsri / shutterstock
page 45 Crane loading freight ship, MOLPIX / shutterstock
page 51 Transporting rotor blades for wind power plant turbines, Reinhard Tiburzy
page 51 Inner Mongolia, China, maoyunping / shutterstock
page 52 In the development of China, Wxj651208 / Dreamstime.com
page 53 Solar light, Sundarbans, Samrat35 / Dreamstime.com
page 54 Solar panel, Kvisitsopa / Dreamstime.com
page 58 Photovoltaic engineer, Lucarelli Temistocle
page 63 Raised hands in class of middle school, hxdbzxy / shutterstock
page 63 Market, Bolivia, Elifranssens / Dreamstime.com
page 66 Geothermal plant, Christopher Wood / Dreamstime.com
page 66 Harvesting sugar cane crop, Againstar / shutterstock
page 68 Small hydroelectric family installation, Moc Chau, Vietnam, John Bill / shutterstock
page 70 O¨shore wind turbine installation, Yobidaba / Dreamstime.com
page 70 Zurijeta / shutterstock
page 75 merzzie / shutterstock
page 76 Patrick Foto / shutterstock
page 78 Barefoot College, India
page 78 Solar Power Plant, asharkyu / shutterstock
page 78 Happy kids, Zurijeta / shutterstock
page 79 Tidal power, Verena Matthew /Dreamstime.com
page 79 Oil Palm, Tan Kian Yong / Dreamstime.com
page 81 Sun flower cultivation, North India, Digitalfestival / Dreamstime.com
ANNEX 2
RENEWABLE ENERGY
BENEFITS:MEASURING THE
ECONOMICSA Renewable Energy Roadmap
Copyright © IRENA 2016
IRENA HEADQUARTERSP.O. Box 236, Abu Dhabi
United Arab Emirates
www.irena.org
Related Documents


![[PPT]Chapter 18 Renewable Energy 18-1 Renewable …environmentalscienceclass.weebly.com/.../ch_18_notes.ppt · Web viewChapter 18 Renewable Energy 18-1 Renewable Energy Today Renewable](https://static.cupdf.com/doc/110x72/5b029fb97f8b9a6a2e900bdf/pptchapter-18-renewable-energy-18-1-renewable-envir-viewchapter-18-renewable.jpg)