iStockphoto/Carmen Martínez Banús

Welcome message from author
This document is posted to help you gain knowledge. Please leave a comment to let me know what you think about it! Share it to your friends and learn new things together.
Transcript

Investing in energy and resource efficiency
iSto
ckph
oto/
Carm
en M
artín
ez B
anús

Investing in energy and resource efficiencyRenewable energy
AcknowledgementsChapter Coordinating Authors: Ton van Dril, Raouf Saidi and Xander van Tilburg, Energy Research Centre of the Netherlands (ECN) and Derek Eaton (UNEP).
Derek Eaton and Fatma Ben Fadhl (in the initial stages of the project) of UNEP managed the overall preparation chapter, including the elaboration of modelling scenarios, the handling of peer reviews, interacting with the coordinating authors on revisions, conducting supplementary research and bringing the chapter to final production.
The lead authors who contributed technical background papers and other material for this chapter were Lachlan Cameron (ECN), Suani Coelho (Brazilian Reference Center on Biomass, CENBIO) Heleen de Coninck (ECN), Amit Kumar (Tata Energy and Resources Institute, TERI, India), Alexandra Mallet (Sussex University, UK), Joyce McLaren (National Renewable Energy Laboratory, NREL, USA), Tom Mikunda (ECN), Jos Sijm (ECN),
Raouf Saidi (ECN), Laura Würtenberger (ECN), Peter Zhou (EECG Consultants). Additional material was prepared by Andrea M. Bassi, John P. Ansah and Zhuohua Tan (Millennium Institute); Andrew Joiner and Tilmann Liebert (UNEP), Ana Lucía Iturriza and Yasuhiko Kamakura (ILO).
We would like to thank the many colleagues and individuals who commented on various drafts and provided specific inputs and advice, including John Christensen (UNEP Risoe Centre on Energy, Climate and Sustainable Development, Denmark), Yasuhiko Kamakura (ILO), Punjanit Leagnava (UNEP), Anil Markandya (Basque Centre for Climate Change, Spain), Mohan Munasinghe (Munasinghe Institute for Development, Sri Lanka), David Ockwell (Sussex University, UK), Martina Otto (UNEP), Ian Parry (IMF), Mark Radka (UNEP), Serban Scrieciu (UNEP), Virginia Sonntag-O’Brien (REN21), Shannon Wang (OECD), Peter Wooders (IISD), and Dimitri Zenghelis (Grantham Research Institute, London School of Economics and Political Science, UK).
Copyright © United Nations Environment Programme, 2011Version -- 02.11.2011
198
Renewable energy
ContentsList of acronyms 201
Key messages 202
1 Introduction 2041.1 The energy sector and the position of renewable sources of energy . . . . . . . . . . . . . . . . . . . . . . . . . . . . 205
2 Challenges and opportunities 2062.1 Energy security. . . . . . . . . . . . . . . . . . . . . . . . . . . . . . . . . . . . . . . . . . . . . . . . . . . . . . . . . . . . . . . . . . . . . . . . . . . . . . . 2062.2 Climate change . . . . . . . . . . . . . . . . . . . . . . . . . . . . . . . . . . . . . . . . . . . . . . . . . . . . . . . . . . . . . . . . . . . . . . . . . . . . . . 2062.3 Impacts of energy technologies on health and ecosystems . . . . . . . . . . . . . . . . . . . . . . . . . . . . . . . . . . . . 2072.4 Energy poverty. . . . . . . . . . . . . . . . . . . . . . . . . . . . . . . . . . . . . . . . . . . . . . . . . . . . . . . . . . . . . . . . . . . . . . . . . . . . . . . 208
3 Investing in renewable energy 2103.1 Recent trends in renewable energy investment. . . . . . . . . . . . . . . . . . . . . . . . . . . . . . . . . . . . . . . . . . . . . . . . 2103.2 Technical advances and cost competitiveness . . . . . . . . . . . . . . . . . . . . . . . . . . . . . . . . . . . . . . . . . . . . . . . . . 2113.3 Externalities, subsidies and cost competition . . . . . . . . . . . . . . . . . . . . . . . . . . . . . . . . . . . . . . . . . . . . . . . . . . 2143.4 Employment potential in renewable energy. . . . . . . . . . . . . . . . . . . . . . . . . . . . . . . . . . . . . . . . . . . . . . . . . . . 2173.5 Investment required for renewable energy . . . . . . . . . . . . . . . . . . . . . . . . . . . . . . . . . . . . . . . . . . . . . . . . . . . . 219
4 Quantifying the implications of investing in renewable energy 2214.1 Business-as-usual (BAU) . . . . . . . . . . . . . . . . . . . . . . . . . . . . . . . . . . . . . . . . . . . . . . . . . . . . . . . . . . . . . . . . . . . . . . 2214.2 Green investment scenarios . . . . . . . . . . . . . . . . . . . . . . . . . . . . . . . . . . . . . . . . . . . . . . . . . . . . . . . . . . . . . . . . . . 222
5 Overcoming barriers: enabling conditions 2265.1 Policy commitment to renewable energy . . . . . . . . . . . . . . . . . . . . . . . . . . . . . . . . . . . . . . . . . . . . . . . . . . . . . 2265.2 Risks and returns . . . . . . . . . . . . . . . . . . . . . . . . . . . . . . . . . . . . . . . . . . . . . . . . . . . . . . . . . . . . . . . . . . . . . . . . . . . . . 2275.3 Financing mechanisms . . . . . . . . . . . . . . . . . . . . . . . . . . . . . . . . . . . . . . . . . . . . . . . . . . . . . . . . . . . . . . . . . . . . . . . 2305.4 Electricity infrastructure and regulations . . . . . . . . . . . . . . . . . . . . . . . . . . . . . . . . . . . . . . . . . . . . . . . . . . . . . . 2325.5 Innovation and R&D . . . . . . . . . . . . . . . . . . . . . . . . . . . . . . . . . . . . . . . . . . . . . . . . . . . . . . . . . . . . . . . . . . . . . . . . . . 2335.6 Technology transfer and skills. . . . . . . . . . . . . . . . . . . . . . . . . . . . . . . . . . . . . . . . . . . . . . . . . . . . . . . . . . . . . . . . . 2345.7 Sustainability standards . . . . . . . . . . . . . . . . . . . . . . . . . . . . . . . . . . . . . . . . . . . . . . . . . . . . . . . . . . . . . . . . . . . . . . 235
6 Conclusions 236
References 237
199
Towards a green economy
List of figuresFigure 1: Evolution of fossil fuel prices . . . . . . . . . . . . . . . . . . . . . . . . . . . . . . . . . . . . . . . . . . . . . . . . . . . . . . . . . . . . . . . 204Figure 2: Renewable energy share of global final energy consumption, 2009 . . . . . . . . . . . . . . . . . . . . . . . . . 205Figure 3: Global new investment in renewable energy in US$ billions. . . . . . . . . . . . . . . . . . . . . . . . . . . . . . . . . 211Figure 4: Range in recent levelised cost of energy for selected commercially available renewable-energy technologies. . . . . . . . . . . . . . . . . . . . . . . . . . . . . . . . . . . . . . . . . . . . . . . . . . . . . . . . . . . . . . . . . . . . . . . . . . . . . . . . 213Figure 5: External costs of energy sources related to global health and climate change. . . . . . . . . . . . . . . . 215Figure 6: Trends in BAU and G2 scenarios in total energy consumption and renewable penetration rate . . . . . . . . . . . . . . . . . . . . . . . . . . . . . . . . . . . . . . . . . . . . . . . . . . . . . . . . . . . . . . . . . . . . . . . . . . . . . . . . . . . . 223Figure 7: Trends in BAU and G2 scenarios: power generation (left axis) and renewable penetration rate in power sector (right axis) . . . . . . . . . . . . . . . . . . . . . . . . . . . . . . . . . . . . . . . . . . . . . . . . . . . . . . . . . . . . . . . . . . . . . 223Figure 8: Total employment in the energy sector, and its disaggregation into fuel and power, and energy efficiency under the G2 scenario. . . . . . . . . . . . . . . . . . . . . . . . . . . . . . . . . . . . . . . . . . . . . . . . . . . . . . . . . . . . . 225Figure 9: Total energy-related emissions and reductions under G2 by source, relative to BAU . . . . . . . . . 225Figure 10: Policies for supporting renewable energy technologies . . . . . . . . . . . . . . . . . . . . . . . . . . . . . . . . . . . 230Figure 11 : Public finance mechanisms across stages of technological development . . . . . . . . . . . . . . . . . . 231Figure 12: Illustrative financing options for the poor . . . . . . . . . . . . . . . . . . . . . . . . . . . . . . . . . . . . . . . . . . . . . . . . . 231Figure 13: Public-sector low-carbon R&D spending per capita as a function of GDP per capita and CO2 emissions . . . . . . . . . . . . . . . . . . . . . . . . . . . . . . . . . . . . . . . . . . . . . . . . . . . . . . . . . . . . . . . . . . . . . . . . . . . . . . . . . . . . . . 234
List of tablesTable 1: Primary energy demand by region in the IEA Current Policies scenario . . . . . . . . . . . . . . . . . . . . . . . 204Table 2: World primary energy mix in the IEA Current Policies scenario. . . . . . . . . . . . . . . . . . . . . . . . . . . . . . . . 207Table 3: Millennium Development Goals and links to energy access . . . . . . . . . . . . . . . . . . . . . . . . . . . . . . . . . . 208Table 4: Stages of technological maturity . . . . . . . . . . . . . . . . . . . . . . . . . . . . . . . . . . . . . . . . . . . . . . . . . . . . . . . . . . . 212Table 5: Learning rates of electricity-generating technologies . . . . . . . . . . . . . . . . . . . . . . . . . . . . . . . . . . . . . . . . 214Table 6: Energy technologies for power generation in the EU – moderate fuel price scenario . . . . . . . . . . 216Table 7: Mitigation project costs per tonne of CO2 (US$ at 2007 prices), given different values for natural gas prices . . . . . . . . . . . . . . . . . . . . . . . . . . . . . . . . . . . . . . . . . . . . . . . . . . . . . . . . . . . . . . . . . . . . . . . . . . . . . . . . . . . . . . . . . . 217Table 8: Employment in renewable energy, by technology and by country. . . . . . . . . . . . . . . . . . . . . . . . . . . . 218Table 9: Average employment over life of facility. . . . . . . . . . . . . . . . . . . . . . . . . . . . . . . . . . . . . . . . . . . . . . . . . . . . . 218Table 10: Lifespan of selected power and transportation assets. . . . . . . . . . . . . . . . . . . . . . . . . . . . . . . . . . . . . . . 219Table 11: Comparison of energy mix in 2030 and 2050 in various GER and IEA scenarios. . . . . . . . . . . . . . . 224Table 12: Emission abatement shares from GER modelling compared with IEA . . . . . . . . . . . . . . . . . . . . . . . 224
List of boxesBox 1: Carbon markets . . . . . . . . . . . . . . . . . . . . . . . . . . . . . . . . . . . . . . . . . . . . . . . . . . . . . . . . . . . . . . . . . . . . . . . . . . . . . . 217Box 2: Tunisia’s Solar Energy Plan . . . . . . . . . . . . . . . . . . . . . . . . . . . . . . . . . . . . . . . . . . . . . . . . . . . . . . . . . . . . . . . . . . . . 227Box 3: Brazilian ethanol . . . . . . . . . . . . . . . . . . . . . . . . . . . . . . . . . . . . . . . . . . . . . . . . . . . . . . . . . . . . . . . . . . . . . . . . . . . . . 229Box 4: Grameen Shakti programme in Bangladesh . . . . . . . . . . . . . . . . . . . . . . . . . . . . . . . . . . . . . . . . . . . . . . . . . . . 232
200
Renewable energy
List of acronymsAGECC Advisory Group on Energy and
Climate ChangeBAU Business-as-usualCCS Carbon capture and storage CDM Clean Development Mechanism CENBIO Brazilian Reference Center on
BiomassCO2 Carbon dioxideDEFRA Department for Environment, Food
and Rural Affairs (UK)ECN Energy Research Centre of the
NetherlandsEEA European Environment AgencyEIA Energy Information AdministrationELI Environmental Law InstituteEREC European Renewable Energy Council ESMAP Energy Sector Management
Assistance ProgrammeEU European UnionEU ETS European Union Emissions Trading
SchemeGDP Gross domestic productGER Green Economy ReportGHG Greenhouse gasGNESD Global Network on Energy for
Sustainable DevelopmentGSI Global Subsidies InitiativeHRS High Road Strategies IEA International Energy AgencyIIASA International Institute for Applied
Systems AnalysisILO International Labour OrganizationIOE International Organisation of
EmployersIPCC Intergovernmental Panel on Climate
ChangeIQ Intelligence quotientIRENA International Renewable Energy
Agency ITIF The Information Technology and
Innovation FoundationITUC International Trade Union
ConfederationLCOE Levelised cost of energy MDGs Millennium Development GoalsMI Millennium Institute
NH3 AmmoniaNMVOCs Non-Methane Volatile Organic
CompoundsNOX Nitrogen oxidesNRC National Research CouncilNREL National Renewable Energy
LaboratoryOECD Organisation for Economic Co-
operation and DevelopmentOPEC Organization of the Petroleum
Exporting CountriesPFM Public Finance MechanismPM10 Particulate matter of 10 microns in
diameter or smallerPV PhotovoltaicR&D Research and developmentREN Renewable energyRPS Renewables portfolio standard SHSs Solar household systemsSO2 Sulfur dioxideSRREN Special Report on Renewable
Energy Sources and Climate Change Mitigation (IPCC)
T21 Threshold 21 model (Millennium Institute)
UN DESA United Nations Department of Economic and Social Affairs
UNCTAD United Nations Conference on Trade and Development
UNDP United Nations Development Programme
UNEP United Nations Environment Programme
UNEP SEFI United Nations Environment Programme Sustainable Energy Finance Initiative
UNFCCC United Nations Framework Convention on Climate Change
UNIDO United Nations Industrial Development Organization
WEO World Energy OutlookWHO World Health OrganizationWMO World Meteorological OrganizationWTO World Trade OrganizationWWEA World Wind Energy Association
201

Towards a green economy
Key messages1. Investments in renewable energy have grown considerably with major emerging economies taking the lead. For 2010, new investment in renewable energy is estimated to have reached a record high of US$ 211 billion, up from US$ 160 billion in 2009. The growth is increasingly taking place in non-OECD countries, especially the large emerging economies of Brazil, China and India.
2. Renewable energy can make a major contribution to the twin challenges of responding to a growing global demand for energy services, while reducing the negative impacts associated with current production and use. Investments in renewable energy are making a growing contribution towards mitigating climate change, but to stay below a 2 degree Celsius increase in average global temperature, these developments need to be significantly enhanced. Renewable energy has other social and environmental benefits, including mitigating or avoiding many health problems and impacts on ecosystems caused by the extraction, transportation, processing and use of fossil fuels.
3. Renewable energy can help enhance energy security at global, national and local levels. Most of the future growth in energy demand is expected to occur in developing countries, and against a background of rising fossil fuel prices and resource constraints; this raises serious concerns about energy security. In off-grid areas, renewable energy sources can ensure a more stable and reliable supply of energy. Examples include local mini-grids and household level PV or biogas systems.
4. Renewable energy can play an important role in a comprehensive global strategy to eliminate energy poverty. In addition to being environmentally unsustainable, the current energy system is also highly inequitable, leaving 1.4 billion people without access to electricity and 2.7 billion dependent on traditional biomass for cooking. Many developing countries have a rich endowment of renewable energy that can help meet this need.
5. The cost of renewable energy is increasingly competitive with that derived from fossil fuels. Improved cost-competitiveness is due to rapid R&D progress, economies of scale, learning effects through greater cumulative deployment and increased competition among suppliers. In the European context, for example, hydro and on-shore wind can already compete with fossil fuel and nuclear technologies, and off-shore wind will soon be competitive with natural gas technologies. Solar energy for water heating purposes (low temperature solar thermal) is commercially mature and commonly used in China and many other parts of the world.
6. Renewable energy services would be even more competitive if the negative externalities associated with fossil fuel technologies were taken into account. These include both the current and future health impacts of various air pollutants, as well as the costs necessary to adapt to climate change and ocean acidification resulting from CO2 emissions. The existing evidence clearly shows that the external costs from fossil fuel technologies are substantially higher than those of most renewable energy alternatives.
202

Renewable energy
7. Substantially increasing investments in renewable energy can be part of an integrated strategy to green the path of global economic development. Modelling studies carried out for the Green Economy Report (GER) project that an average annual investment of approximately US$ 650 billion over the next 40 years in power generation, using renewable energy sources and second-generation biofuels for transport, could raise the share of renewable energy sources in total energy supply to 27 per cent by 2050, compared with less than 15 per cent under a business-as-usual (BAU) scenario. Increased use of renewable energy sources could contribute more than one-third of the total reduction in greenhouse gas emissions (GHG) of 60 per cent achieved by 2050, relative to BAU.
8. A shift to renewable energy sources brings many new employment opportunities, but not without transitional challenges. Due to the higher labour intensity of various renewable energy technologies compared with conventional power generation, increased investment in renewable energy will add to employment, especially in the short-term, according to modelling conducted for the GER. Overall impacts on employment of investing in renewable energy, taking into account possible effects in fossil fuel-related sectors, will vary by national context, depending on supportive policies, available resources and national energy systems.
9. Policy support will need to be expanded considerably to promote accelerated investment in renewable energy. These investments carry enhanced risks, such as those typically associated with the development and diffusion of new technologies, exacerbated by high upfront capital costs. A range of public support mechanisms have been developed to mitigate risks and to enhance returns. The growing competitiveness of renewable energy has been achieved in part due to policy support to overcome barriers.
10. Government policy to support increased investment in renewable energy needs to be carefully designed in an integrated manner; there is no one-size-fits-all approach. The range of regulatory policies, fiscal incentives and public financing mechanisms to support renewable energy is broad and can be complemented with support to R&D as well as other measures, such as those to stimulate investments in adapting grid infrastructure. The diversity of circumstances among countries, including existing energy systems and potential renewable development, requires that policy frameworks be carefully designed and tailored to specific situations.
203
Towards a green economy
1 IntroductionThis chapter assesses the options for increasing investment in greening the energy sector by increasing the supply from renewable energy technologies.1 The current highly carbon-intensive energy system depends on a finite supply of fossil fuels that are getting harder and more expensive to extract leading to concerns about national energy security in many countries. The challenges are compounded by the need to provide clean and efficient energy services to the 2.7 billion people without access. It is, thus, not sustainable in economic, social, and environmental terms. Furthermore, the current state of the energy sector leaves many countries exposed to large swings in oil import prices and also costs billions in public subsidies.
Greening the energy sector will require improvements in energy efficiency and a much greater supply of energy services from renewable sources, both of which will lead to reducing greenhouse gas emissions (GHG) and other types of pollution. In most instances, improvement in energy efficiency has net economic benefits. Global energy demand is still likely to grow in order to meet development needs, in the context of growing populations and income levels. Greening the sector also aims to end “energy poverty” for the estimated 1.4 billion people who currently lack access to electricity. Moreover, 2.7 billion people who are dependent on traditional biomass for cooking need healthier and
more sustainable energy sources (IEA 2010a). Modern renewables offer considerable potential for enhancing energy security at global, national and local levels. In order to secure all these benefits, enabling policies are required to ensure that the investments are made for greening the energy sector.
This chapter is structured as follows: Section 1 briefly describes features of world energy supply and the growing role of renewable sources of energy within it. Section 2 discusses the challenges and opportunities related to the energy sector, and the potential contribution of renewable energy. Section 3 reviews investments in renewable energy, covering recent trends, developments in cost-competitiveness, the importance of externalities, employment effects and expected investment needs. Section 4 presents the results of green investment scenarios (from the GER modelling chapter), in which investments in renewable energy are considerably expanded, as part of an integrated strategy also addressing energy efficiency and other aspects of demand. Section 5 discusses the barriers to increasing investments in the renewable energy sector and the policies to address these. Section 6 concludes the chapter.
1950
1960
1970
1980
1990
2000
2009
16
14
12
10
8
6
4
2
0
Coal Natural gas Crude oil
2005
US$
/MBt
u
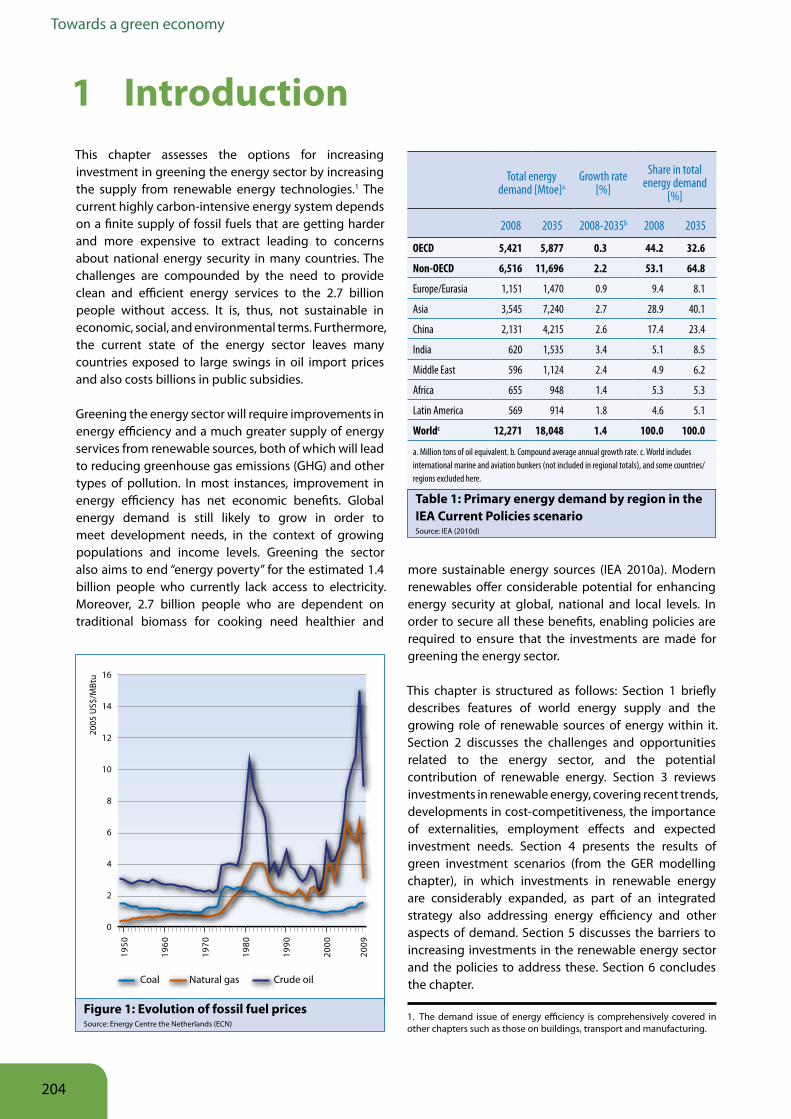
Figure 1: Evolution of fossil fuel pricesSource: Energy Centre the Netherlands (ECN)
1. The demand issue of energy efficiency is comprehensively covered in other chapters such as those on buildings, transport and manufacturing.
Table 1: Primary energy demand by region in the IEA Current Policies scenarioSource: IEA (2010d)
Total energy demand [Mtoe]a
Growth rate [%]
Share in total energy demand
[%]
2008 2035 2008-2035b 2008 2035
OECD 5,421 5,877 0.3 44.2 32.6
Non-OECD 6,516 11,696 2.2 53.1 64.8
Europe/Eurasia 1,151 1,470 0.9 9.4 8.1
Asia 3,545 7,240 2.7 28.9 40.1
China 2,131 4,215 2.6 17.4 23.4
India 620 1,535 3.4 5.1 8.5
Middle East 596 1,124 2.4 4.9 6.2
Africa 655 948 1.4 5.3 5.3
Latin America 569 914 1.8 4.6 5.1
Worldc 12,271 18,048 1.4 100.0 100.0
a. Million tons of oil equivalent. b. Compound average annual growth rate. c. World includes international marine and aviation bunkers (not included in regional totals), and some countries/regions excluded here.
204
Renewable energy
1 1 The energy sector2 and the position of renewable sources of energy
World primary energy demand3 is expected to continue growing. The International Energy Agency’s (IEA) Current Policies scenario, which assumes no major change in policies as of mid-2010, projects a growth rate of 1.4 per cent per year up to 2035 (Table 1). The fastest growth is expected in non-OECD countries with a projected rate of 2.2 per cent per year, particularly in China and India and other emerging economies in Asia and the Middle East. Many non-OECD countries are also expected to see large increases in imports of oil or gas or both.
Energy demand is growing against the backdrop of fluctuating, but generally increasing fossil-fuel prices (see Figure 1). Expenditure on oil alone increased from 1 per cent of global GDP in 1998 to around 4 per cent at the peak in 2007, and is projected to remain high in the period to 2030 (IEA 2008b).
Findings from this chapter indicate that the share of renewables in total energy supply is expanding and that the greening of the energy sector can contribute to the growth of income, jobs and access by the poor to affordable energy, which are other objectives of sustainable development. Worldwide investment in renewable energy assets – without large hydropower – grew by a factor of seven from US$ 19 billion in 2004 to US$ 143 billion in 2010. For OECD countries the share of renewable energy sources in total primary energy demand has risen from 4.6 per cent in 1973 to 7.7 per cent in 2009 (IEA 2010d).
This chapter follows the IEA definition of renewable energy:
Renewable energy is derived from natural processes that are replenished constantly. In its various forms, it derives directly or indirectly from the sun, or from heat generated deep within the earth. Included in the definition is energy generated from solar, wind, biomass, geothermal, hydropower and ocean resources, and biofuels and hydrogen derived from renewable resources (IEA 2008a).
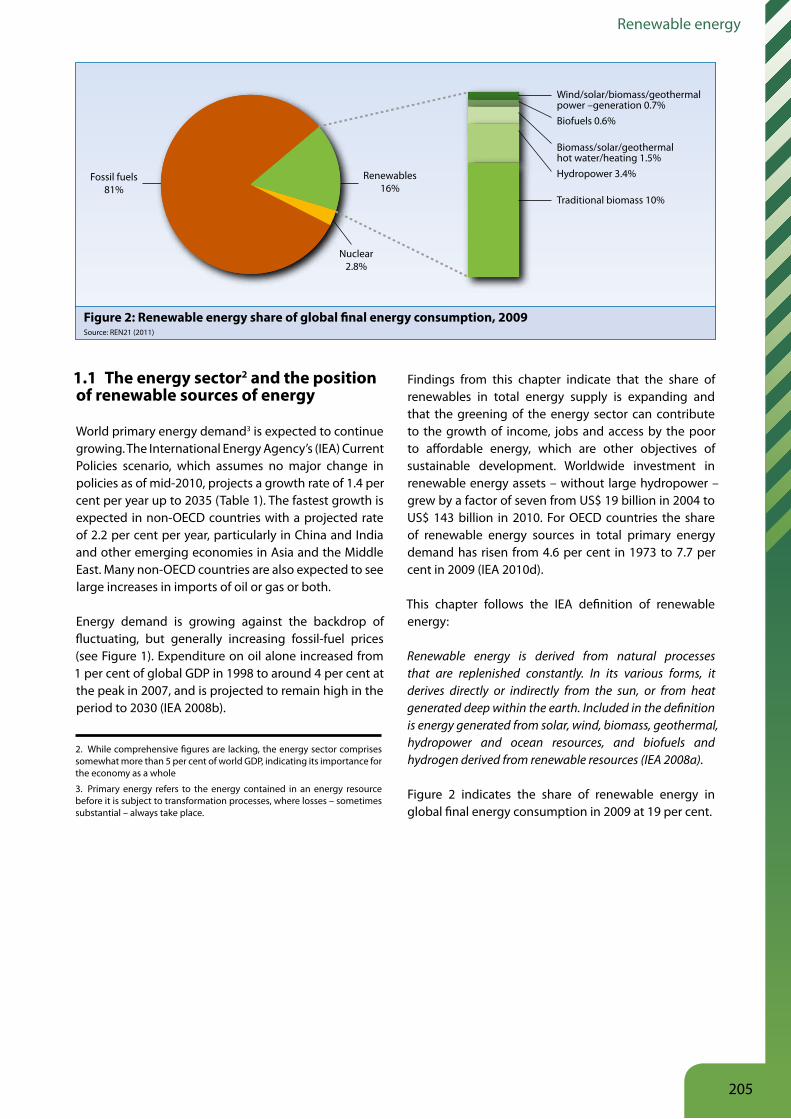
Figure 2 indicates the share of renewable energy in global final energy consumption in 2009 at 19 per cent.
Wind/solar/biomass/geothermalpower –generation 0.7%Biofuels 0.6%
Biomass/solar/geothermalhot water/heating 1.5%Hydropower 3.4%
Traditional biomass 10%
Fossil fuels81%
Nuclear2.8%
Renewables16%
Figure 2: Renewable energy share of global final energy consumption, 2009 Source: REN21 (2011)
2. While comprehensive figures are lacking, the energy sector comprises somewhat more than 5 per cent of world GDP, indicating its importance for the economy as a whole
3. Primary energy refers to the energy contained in an energy resource before it is subject to transformation processes, where losses – sometimes substantial – always take place.
205

Towards a green economy
2 Challenges and opportunitiesThe global community and national governments are faced with four major challenges with respect to the energy sector: 1) concerns about energy security; 2) combating climate change; 3) reducing pollution and public-health hazards; and 4) addressing energy poverty. Greening the energy sector, including by substantially increasing investment in renewable energy, provides an opportunity to make a significant contribution to addressing these challenges.
2 1 Energy security
Increasing energy demand together with rising energy prices raise concerns about energy security, a topic which covers a range of issues but primarily is associated with the reliability and affordability of national energy supply. Such concerns are particularly relevant for low-income countries, but also for emerging and developed economies, where a relatively high dependence on a limited range of suppliers can mean higher risks to the security of national energy supply due to geo-political and other developments. Risks to national energy security can also carry downwards to impinge on energy security at local levels.
The IEA’s Reference Scenario, the trends of which are depicted in Tables 1 and 2, represent a baseline of how global energy markets would evolve without policy changes (IEA 2009a). In the scenario, oil importing countries (especially developing countries and emerging economies) are expected to become increasingly dependent on OPEC countries for oil. While total non-OPEC output is expected to remain about constant until 2030, production in OPEC countries is projected to increase, especially in the Middle East. OPEC’s share in the world oil market consequently rises from 44 per cent in 2008 to 52 per cent in 2030, above its historical peak in 1973. For natural gas, increases in exports are mainly projected to come from Russia, Iran and Qatar, which would increase the world economy’s energy dependency on these countries (IEA 2009a).
The increase in oil prices since 2002 has increased pressure on the balance of payments of developing countries (Figure 1). To protect consumers from increased fossil-fuel prices, some countries have increased their fuel subsidies putting additional strain on government budgets, and underpinning the demand for fossil fuel imports. Oil accounts for 10 to 15 per cent of total imports for oil- importing African countries and absorbs over 30 per cent of their export revenue on average
(UNCTAD 2006, ESMAP 2008a). Some African countries, including Kenya and Senegal, devote more than half of their export earnings to energy imports, while India spends 45 per cent. Investing in renewable sources that are available locally – in many cases abundantly – could enhance energy security for such countries (GNESD 2010). Energy security would then be influenced more by access to renewable technologies, including both their affordability as well as the capacity to adapt and deploy those technologies. Diversifying the energy matrix thus presents both a considerable challenge and opportunity for oil importing countries.
2 2 Climate change
The Intergovernmental Panel on Climate Change’s (IPCC) fourth assessment report (IPCC 2007) underscored the importance of mitigating future human-induced climate change – mostly driven by the combustion of fossil fuels
– and adapting to the changes that occur. Estimates of the damages of climate change and costs of mitigation and adaptation vary widely. Substantial damages will occur even with a rapid greening of the energy system, but will be much higher if no action is taken. The annual global costs of adapting to climate change have been estimated by the United Nations Framework on Climate Change Convention (UNFCCC 2009) to be at least US$ 49
- US$ 171 billion by 20304. About half of these costs will be borne by developing countries. Moreover, climate change is likely to worsen inequality because its impacts are unevenly distributed over space and time and disproportionately affect the poor (IPCC 2007).
The Intergovernmental Panel on Climate Change (2007) and International Energy Agency (IEA) (2008c) estimate that in order to limit the rise of average global temperature to 2 degrees Celsius, the concentration of GHGs should not exceed 450 parts per million (ppm) CO2-eq. This translates to a peak of global emissions in 2015 and at least a 50 per cent cut in global emissions by 2050, compared with 2005. In 2009, the G8 committed to an 80 per cent cut in their emissions by 2050 in order to contribute to a global 50 per cent cut by 2050,
4. This estimate is very rough, approximate and conservative; it does not include key sectors of the economy such as energy, manufacturing, retailing, mining, and tourism, nor the impacts on ecosystems and the goods and services they provide. Other studies that take into account additional direct and indirect impact of climate change related to water, health, infrastructure, coastal zones, ecosystems, etc., have assessed that cost of adaptation to be 2-3 times greater than that put forward by the UNFCCC (IIED 2009). In general, adaptation costs should only be interpreted as lower-bound estimates of the possible economic impacts of climate change (see also Stern 2006).
206

Renewable energy
although a precise baseline was not specified. The 80 per cent reduction would yield some space for developing countries to have a less stark reduction trajectory while reaching the global 50 per cent target. There are still large uncertainties, however, concerning how to reach the emission reduction goals and the two-degree target agreed by most countries at the UN Climate Change Conference in Copenhagen in 2009. If pledges made subsequent to the conference were implemented together with other policy options under consideration in the negotiations,5 emissions in 2020 are projected to reach 49 GtCO2-eq, which leaves a gap of at least 5 GtCO2-eq relative to the projected level required for the two-degree target of 39-44 GtCO2-eq (UNEP 2010b). In the IEA Current Policies Scenario, fossil fuels are projected to continue dominating energy supply in 2030 (see Table 2). Additionally, several models project that GHG emissions will rise fastest in high-growth countries such as China and India (IEA 2010b, 2010d).
A shift from fossil fuels to renewable energy in the energy supply can contribute to achieving ambitious emissions-reduction targets, together with significant improvements in energy efficiency. To reduce emissions to a level that would keep the concentration of GHGs at 450 ppm in 2050, the IEA projects that renewable energy would need to account for 27 per cent of the required CO2 reductions, while the remaining part would result primarily from energy efficiency and alternative mitigation options such as carbon capture and sequestration (CCS) (IEA 2010b). A major part of the CO2 reductions resulting from the promotion of renewables would take place in developing countries.
2 3 Impacts of energy technologies on health and ecosystems
There are high indirect costs associated with the pollution arising from combustion of fossil and traditional fuels. The release of both black carbon particles (from incomplete combustion of fossil fuels) and other forms of air pollution (sulphur and nitrogen oxides, photochemical smog precursors, and heavy metals, for example) have a detrimental effect on public health (UNEP and WMO 2011). Indoor air pollution from burning solid fuel accounted for 2.7 per cent of the global burden of disease in 2000 and is ranked as the largest environmental contributor to health problems after unsafe drinking water and lack of sanitation (WHO
2006). Burning fossil fuels costs the United States about US$ 120 billion a year in health costs, mostly because of thousands of premature deaths from air pollution (NRC 2010). This figure reflects primarily health damage from air pollution associated with electricity generation and motor vehicle use. According to the IEA, the costs of air pollution controls worldwide amounted to about € 155 billion in 2005 and are estimated to triple by 2030 (IIASA 2009; IEA 2009a).6 Renewable energy can mitigate or avoid many of these public health risks caused by the mining, production and combustion of fossil fuels.
The use of fossil and traditional energy sources in both developed and developing countries also impacts global biodiversity and ecosystems through deforestation, decreased water quality and availability, acidification of water bodies, and increased introduction of hazardous substances into the biosphere (UNEP 2010a). These impacts also reduce the natural capabilities of the planet to respond to climate change.
Renewable energy technologies are not without impacts and careful planning to address possible environmental and social impacts are essential. Production of biofuels, for example, can have negative impacts on biodiversity and ecosystems, while the environmental and social impacts of large-scale hydropower can be significant. The World Commission on Dams has provided guidelines for reducing possible negative impacts of hydropower development. First-generation biofuels have also received substantial attention for their impacts due to land-use change and agricultural production practices, leading to the development of biofuel sustainability standards (see Section 5.7). Increased mining activity and deforestation could result from increased use of renewable energy sources requiring rare earth elements,
Table 2: World primary energy mix in the IEA Current Policies scenarioSource: IEA (2010d)
Total energy use
[Mtoe]Growth rate2008-2035a
[%]
Share in total energy mix
[ % ]
2008 2035 2008 2035
Coal 3,315 5,281 1.7 27.0 29.3
Oil 4,059 5,026 0.8 33.1 27.8
Gas 2,596 4,039 1.7 21.2 22.4
Nuclear 712 1,081 1.6 5.8 6.0
Hydro 276 439 1.7 2.2 2.4
Biomass and agricultural waste and/or residueb
1,225 1,715 1.3 10.0 9.5
Other renewables 89 468 6.3 0.7 2.6
Total 12,271 18,048 1.4 100.0 100.0
a. Compound average annual growth rate. b. Includes traditional and modern uses.
5. These options include countries moving to higher ambition, conditional pledges; and the negotiations adopting rules that avoid a net increase in emissions from (a) “lenient” accounting of land use, land-use change and forestry activities, and (b) the use of surplus emission units (UNEP 2010b). .
6. The IEA calculation includes international costs of pollution control equipment and has been done using a four per cent (social) real discount rate. All costs and prices are expressed in constant € 2005 and include “current policy” pollution control legislation.
207
Towards a green economy
and this is an area getting increased attention to reduce possible negative impacts as much as possible (IPCC 2011).
2 4 Energy poverty
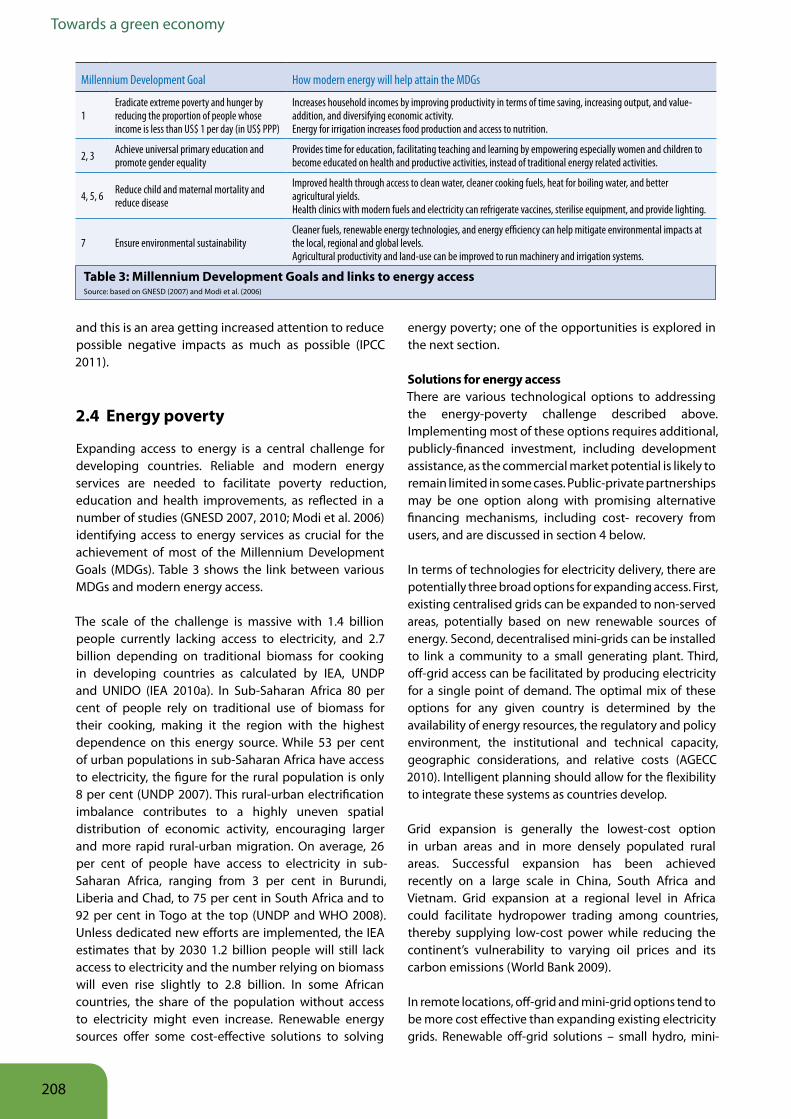
Expanding access to energy is a central challenge for developing countries. Reliable and modern energy services are needed to facilitate poverty reduction, education and health improvements, as reflected in a number of studies (GNESD 2007, 2010; Modi et al. 2006) identifying access to energy services as crucial for the achievement of most of the Millennium Development Goals (MDGs). Table 3 shows the link between various MDGs and modern energy access.
The scale of the challenge is massive with 1.4 billion people currently lacking access to electricity, and 2.7 billion depending on traditional biomass for cooking in developing countries as calculated by IEA, UNDP and UNIDO (IEA 2010a). In Sub-Saharan Africa 80 per cent of people rely on traditional use of biomass for their cooking, making it the region with the highest dependence on this energy source. While 53 per cent of urban populations in sub-Saharan Africa have access to electricity, the figure for the rural population is only 8 per cent (UNDP 2007). This rural-urban electrification imbalance contributes to a highly uneven spatial distribution of economic activity, encouraging larger and more rapid rural-urban migration. On average, 26 per cent of people have access to electricity in sub-Saharan Africa, ranging from 3 per cent in Burundi, Liberia and Chad, to 75 per cent in South Africa and to 92 per cent in Togo at the top (UNDP and WHO 2008). Unless dedicated new efforts are implemented, the IEA estimates that by 2030 1.2 billion people will still lack access to electricity and the number relying on biomass will even rise slightly to 2.8 billion. In some African countries, the share of the population without access to electricity might even increase. Renewable energy sources offer some cost-effective solutions to solving
energy poverty; one of the opportunities is explored in the next section.
Solutions for energy accessThere are various technological options to addressing the energy-poverty challenge described above. Implementing most of these options requires additional, publicly-financed investment, including development assistance, as the commercial market potential is likely to remain limited in some cases. Public-private partnerships may be one option along with promising alternative financing mechanisms, including cost- recovery from users, and are discussed in section 4 below.
In terms of technologies for electricity delivery, there are potentially three broad options for expanding access. First, existing centralised grids can be expanded to non-served areas, potentially based on new renewable sources of energy. Second, decentralised mini-grids can be installed to link a community to a small generating plant. Third, off-grid access can be facilitated by producing electricity for a single point of demand. The optimal mix of these options for any given country is determined by the availability of energy resources, the regulatory and policy environment, the institutional and technical capacity, geographic considerations, and relative costs (AGECC 2010). Intelligent planning should allow for the flexibility to integrate these systems as countries develop.
Grid expansion is generally the lowest-cost option in urban areas and in more densely populated rural areas. Successful expansion has been achieved recently on a large scale in China, South Africa and Vietnam. Grid expansion at a regional level in Africa could facilitate hydropower trading among countries, thereby supplying low-cost power while reducing the continent’s vulnerability to varying oil prices and its carbon emissions (World Bank 2009).
In remote locations, off-grid and mini-grid options tend to be more cost effective than expanding existing electricity grids. Renewable off-grid solutions – small hydro, mini-
Table 3: Millennium Development Goals and links to energy accessSource: based on GNESD (2007) and Modi et al. (2006)
Millennium Development Goal How modern energy will help attain the MDGs
1Eradicate extreme poverty and hunger by reducing the proportion of people whose income is less than US$ 1 per day (in US$ PPP)
Increases household incomes by improving productivity in terms of time saving, increasing output, and value-addition, and diversifying economic activity.Energy for irrigation increases food production and access to nutrition.
2, 3 Achieve universal primary education and promote gender equality
Provides time for education, facilitating teaching and learning by empowering especially women and children to become educated on health and productive activities, instead of traditional energy related activities.
4, 5, 6 Reduce child and maternal mortality and reduce disease
Improved health through access to clean water, cleaner cooking fuels, heat for boiling water, and better agricultural yields.Health clinics with modern fuels and electricity can refrigerate vaccines, sterilise equipment, and provide lighting.
7 Ensure environmental sustainabilityCleaner fuels, renewable energy technologies, and energy efficiency can help mitigate environmental impacts at the local, regional and global levels.Agricultural productivity and land-use can be improved to run machinery and irrigation systems.
208

Renewable energy
wind, bio-energy, and the increasingly popular solar household systems (SHSs) – have the potential to alleviate rural energy poverty and even to displace costly diesel-based power generation (GNESD 2010; IEA 2010a; REN21 2011). Furthermore, they can contribute to the decoupling of energy supply and GHG emissions, and avoid increasing fuel imports for low-income countries. SHSs typically generate around 30 to 60 watts from a PV module and include a rechargeable battery to power, for example, 4 to 6 compact fluorescent lamps, a TV, and potentially a mobile-phone charger. The technology is also useful for providing clean drinking water. The price in Asia for an average system ranges from US$ 360 – 480 for 40 peak watts, thus US$ 8–11/watt, while in Africa it is higher at US$ 800 (e.g. in Ghana) for 50 watts, thus US$ 16–17/watt (ESMAP 2008b). The main advantage of renewable off-grid solutions is that running costs are very low, although upfront investments are still high.7
The availability and diffusion of clean biomass technologies, such as improved and alternative cook
stoves and biogas systems, which reduce unsustainable and inefficient use of firewood and hazardous air pollution, can constitute an intermediate step to the provision of modern energy services for rural populations dependent on biomass. In fact, some have singled out clean biomass technologies for households and small industries as a priority for Africa, with the potential of developing industries suitable for rural areas and to leap-frog development of energy technologies (Karekezi et al. 2004). Projections by the IEA, UNDP and UNIDO (IEA 2010a) for ensuring universal access to modern cooking facilities by 2030 recognise this potential and include 51 per cent of the investment target of US$ 2.6 billion per year allocated to biogas systems and 23 per cent to advanced biomass cooking stoves, both in rural areas.
For many remote rural areas and for a large proportion of the 1.4 billion who lack access to energy, renewable energy sources thus present an increasingly viable option for addressing their unmet demand. IEA, UNDP and UNIDO (IEA 2010a) estimated investment to ensure access to electricity for all by 2030 at US$ 756 billion, corresponding to a relatively modest sum of US$ 36 billion per year, the bulk of which would be for off-grid systems, including various renewable options, in addition to conventional diesel generation.8
7. Potential financing mechanisms are discussed in section 5.3.
8. The estimated investment needs are not broken down by IEA, UNDP and UNIDO (IEA 2010a) according to energy source, but in discussing opportunities for renewables, the potential promise of combining different sources of renewable energy in a power system supplying rural mini-grids is highlighted.
209

Towards a green economy
3 Investing in renewable energyBoth the challenges and opportunities facing the energy sector call for scaling up investment in renewable energy. This section summarizes recent investment trends in renewable energy and the associated evolution of the competitiveness of renewable energy technologies. This is followed by an analysis of how this competiveness is distorted by the lack of mechanisms to account for the larger negative externalities associated with the use of fossil fuels, reviewed in Section 2. The section then discusses the potential employment potential offered by renewable energy. The section closes with a review of estimates of the future investment required to meet the challenges of growing energy demand and climate change mitigation, complementing needed investments to improve energy efficiency across sectors.
3 1 Recent trends in renewable energy investment
During the past 10 years the growth of investment in renewable energy has been rapid, albeit from a low base. From 2004 to 2010, total investments into renewable energy exhibited a compound annual growth rate of 36 per cent9. There were a number of reasons for this performance:
■ The relatively easy access to capital for project developers and technology manufacturers in the developed world and major emerging economies and low interest rates supported the growth of renewable energy technologies;
■ For some renewable energy technologies, technological developments have led to a significant decline in costs and increased reliability of the technology, which have made investments more attractive;
■ High oil prices contributed to the interest in renewable energy investments; and
■ Regulatory support for renewable energy technologies increased over the past 10 years. Between 2004 and early 2011, for example, the number of countries that have supportive renewable energy policies in place rose from about 40 to almost 120 (REN21 2011).
For 2010, Bloomberg New Energy Finance estimates that global new investment in renewable energy hit a new record of US$ 211 billion. This is an increase of more than 30 per cent from the US$ 160 billion invested globally in 2009 and the US$ 159 billion in 2008 (UNEP SEFI 2011).
The global financial crisis that began in 2008 appears to have temporarily reduced investment in renewable energy, with growth in new investments slowing in 2008 and 2009 (see Figure 3). Despite more difficult access to capital, especially the availability of debt finance, the sector as a whole has so far proven to be fairly resilient.
This buoyancy may be due partly to the stimulus provided by discretionary fiscal packages in many countries (IEA 2009b) launched in 2008 and 2009, some of which included support for renewable energy (HSBC 2009). In the US, for example, there were two separate packages, with a total of around US$ 32 billion allocated to renewable energy.10 South Korea and China also included renewable energy investments in their stimulus spending programmes. An estimated US$ 194 billion in green stimulus funding had been allocated to support clean energy globally, including renewable energy technologies, energy-smart technologies, carbon capture and storage, and transport (UNEP SEFI 2011). Less than 10 per cent had actually been spent by the end of 2009, and just under half by the end of 2010. The delay reflects the time it takes for spending to be approved through administrative processes, and the fact that some projects were only formally presented after the programmes were announced.
The investments in renewable energy in emerging economies have been growing rapidly since 2005 (UNEP SEFI 201111). In that year OECD countries accounted for almost 77 per cent of global investment in renewable energy.12 By 2007, however, the share of non-OECD countries had risen to 29 per cent and further increased to 40 per cent in 2008 (Bloomberg New Energy Finance database). In 2008, for example, China was the second-largest country for renewable energy investments after Spain, with the US ranking third. Brazil was ranked fourth and India seventh. China took the lead though in 2009, maintaining this position in 2010, with US$ 49 billion in new investment in renewable energy. Overall, from 2005 to 2008, investments in renewable energy assets grew by more than 200 per cent in OECD countries, but
9. The Emergency Economic Stabilization Act and the American Recovery and Reinvestment Act; these included the extension of the Production Tax Credits for wind and the Investment Tax Credit for solar.
10. The Emergency Economic Stabilization Act and the American Recovery and Reinvestment Act; these included the extension of the Production Tax Credits for wind and the Investment Tax Credit for solar.
11. See also previous editions of the UNEP SEFI Sustainable Energy Investment Trends Report (UNEP SEFI 2008a, 2009, 2010).
12. New financial investment in renewable energy excludes small scale systems, as well as corporate and government investment in R&D, which are included in Figure 5 and accounted for US$ 68 billion, or almost one-third, of the US$ 211 billion total in 2010 (UNEP SEFI 2011).
210

Renewable energy
by more than 500 per cent in non-OECD countries. In 2010, new financial investments in renewable energy by developing countries, at US$ 72 billion, edged past the amount invested that year by developed countries, at US$ 70.5 billion (UNEP SEFI 2011). This recent rapid growth has led to predictions that developing economies may well soon have larger installed renewable energy generating capacity than the OECD countries (ITIF 2009, Pew Charitable Trusts 2010).
Among developing countries, by far the largest share of investments in renewable energy has been in the three large emerging economies of China, India and Brazil, which together account for almost US$ 60 billion, or 90 per cent. Other developing countries, while representing only 10 per cent of the total, are also experiencing accelerated growth, with Latin America (excluding Brazil) seeing investments almost tripling, Asia rising almost one-third, and Africa increasing five-fold in 2010 (UNEP SEFI 2011). These investments tend though to be concentrated still in a limited number of countries. For renewable energy investments to expand on a large scale in other developing countries, however, major efforts are needed to develop infrastructure such as transmission and distribution systems, improve the functioning of financial markets and other institutions, and provide a supportive incentive framework.
In addition to installing significant renewable energy capacity, fast-growing emerging markets have also built up large equipment manufacturing industries in the sector, both for export to the global market and for local use. China has, for example, become the world’s largest producer of solar PV panels and solar water heaters. The government has supported investment in manufacturing capacity for renewable energies, for example, by establishing preferential electricity tariffs for the solar industry.
3 2 Technical advances and cost competitiveness
As renewable energy technologies have matured their costs have come down, making many of them increasingly competitive with other energy technologies. This section briefly reviews such developments, drawing on recent reviews of relative maturity and costs of different energy technologies (for example, IPCC 2011; IEA 2010b, c, d).
Overall, the IPCC (2011) review of renewable energy technologies concluded that technical potential, at a global level, does not present a constraint to continued
growth in the use of these technologies. In its assessment, the review also found that a growing number of these are technically mature and are being deployed at significant scale. Table 4 shows the stages of maturity of principal renewable energy technologies according to four stages of maturity: research and development; demonstration and deployment; diffusion; and commercially mature. The most mature technology is hydropower, which currently meets 16 per cent of the world’s electricity demand. Many hydropower installations are large-scale where impacts potentially can be significant on livelihoods, biodiversity, water supply, etc. In order to address potential adverse impacts installations should follow sustainability guidelines as developed by the World Commission on Dams or other best practices.13 Smaller-scale hydropower projects, by contrast, have fewer such impacts and have great potential in many developing countries. In terms of sustainable biomass applications, the production of sugarcane bioethanol-based transport fuels in Brazil is a commercially mature technology (see Box 3 in Section 5). Onshore applications of wind energy are also commercially mature, while offshore wind energy is in the diffusion phase and, in some situations, approaching the commercially mature phase.
Solar energy technologies for heating purposes (low temperature solar thermal), are commercially mature and commonly used in many parts of the world. Solar PV for electricity in small-scale applications is approaching commercial maturity, such as solar roof-top home systems or solar lanterns in off-grid areas, but is generally still dependent on subsidies or price support mechanisms. Concentrating solar thermal power has been in the demonstration and deployment phase for
0
50
100
150
200
250
2010200920082007200620052004
33
57
90
129
159 160
211
75% 57% 43% 23% 0.4% 32%
US$
bill
ion
Growth:
Figure 3: Global new investment in renewable energy in US$ billionsSource: UNEP SEFI (2011)
13. For example, the International Hydropower Association’s Hydropower Sustainability Assessment Protocol; available at: http://hydrosustainability.org/
211

Towards a green economy
some time and diffusion has recently begun in a few locations. Geothermal energy can be harnessed for heat in almost any temperate climate, and in some locations also for power generation. It is mature in many countries, including among others Italy, Kenya, New Zealand, the Philippines and the United States; Iceland and El Salvador, for example, derive over 15 per cent of their electricity needs from geothermal sources (IPCC 2008).
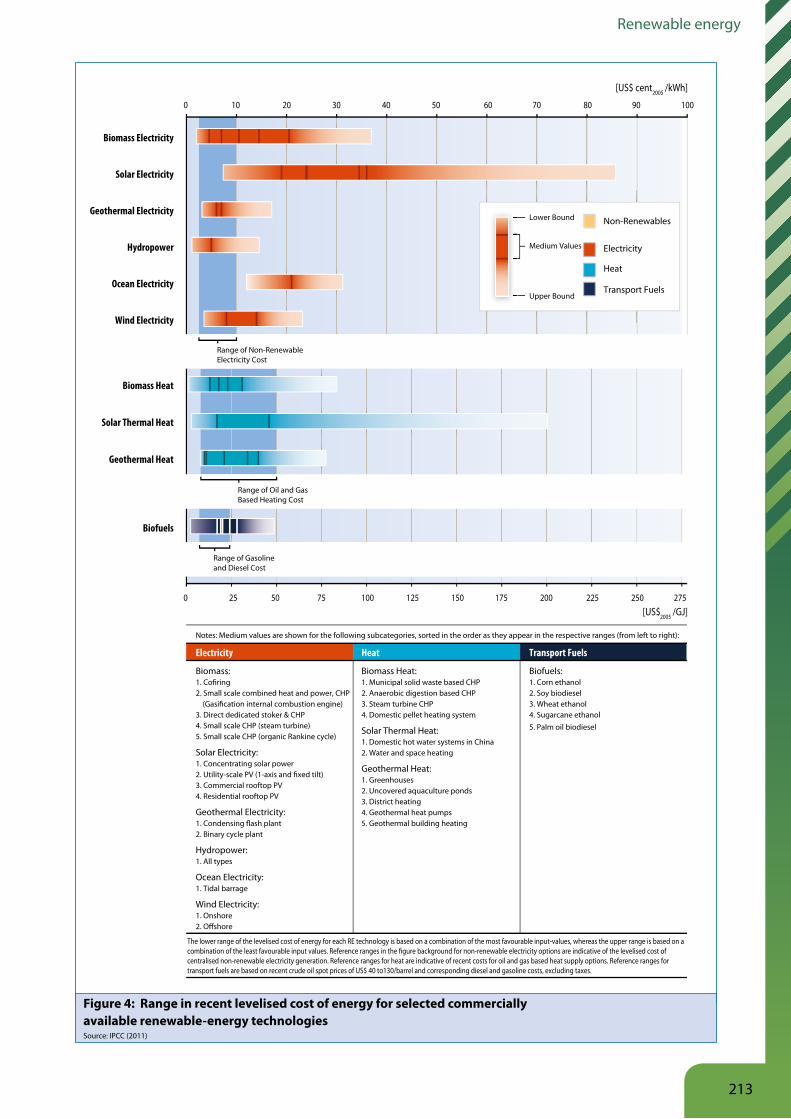
Diffusion and commercial maturity of many renewable energy technologies reflects ongoing, and in some notable cases rapid, improvements in their cost competitiveness. Figure 4 from the IPCC (2011) illustrates cost estimates (per kWh) under a levelised cost of energy analysis (LCOE) for principal renewable energy technologies, grouped according to three principal uses: electricity generation, heat and fuel for transport. The figure highlights the large range of variability of (unsubsidized) cost estimates for any given technology. For each of the three groups of technologies, the costs can be compared to a corresponding range from non-renewable technologies, which also depend on assumed prices for fossil fuels. Overall the IPCC review demonstrates that costs of renewable technologies are increasingly competitive with fossil fuel technologies,
though this is dependent on specific circumstances, such as locations with favourable resource conditions or without other low-cost energy options. The analysis also indicates though that further rapid deployment is dependent on supporting policies (discussed below in Section 5).
The IPCC (2011) review of renewable energy technologies also illustrates the pace at which costs have declined for some specific technologies. For example, average global PV module prices dropped from about US$ 22 per watt in 1980 to less than US$ 1.5 per watt in 2010 (IPCC 2011)14. Cost reductions are driven by R&D, achieving economies of scale, learning effects through deployment and increased competition among suppliers, although the relative importance of individual factors is not always fully understood.
The importance of learning effects, which refers to the tendency for the costs of new technologies to decline as cumulative production or cumulative investment in R&D, and thus experience and know-how, increases is
Table 4: Stages of technological maturity Source: Based on Table 1.3 in IPCC (2011)
Aquatic plant-derived fuels
Hydropower
Biofuels
Wind
Solar
Geothermal
Ocean
Higher-altitude wind generator
Research and Development Demonstration and Deployment Diffusion Commercially Mature
Solar fuels
Submarine geothermal
Ocean currents
Hydrokinetic turbines
Pyrolysis-based biofuelsLignocellulose sugar-based biofuels
Wind kites
Solar cooling
Engineered geothermal systems
WaveTidal currentsSalinity gradientsOcean thermal energy conversion
Gasification-based powerLignocellulose syngas-based biofuels
Offshore, large turbine
Solar cookingConcentrating PVConcentrating solar thermal power
Run-of-riverReservoirsPumped storage
Traditional usageCookstovesDomestic heatingSmall/large-scale boilersAnaerobic digestionCombined heat and powerCo-firing fossil fuelsCombustion-based powerSugar and starch-based ethanolPlant and seed oil-based biodieselGaseous biofuels
Onshore, large turbinesDistributed, small turbinesTurbines for water pumping
Photovoltaic (PV)Low temp solar thermalPassive solar architecture
Direct use applicationsGeothermal heat pumpsHydrothermal, binary cycleHydrothermal, condensing flash
Tidal range
14. The IPCC (2011) cites Bloomberg New Energy Finance as the source of these price estimates, which are calculated in US$ with 2005 as the base year.
212
Renewable energy
Geothermal Heat
Solar Thermal Heat
Biomass Heat
Wind Electricity
Ocean Electricity
Hydropower
Geothermal Electricity
Solar Electricity
Biomass Electricity
0 10 20 30 40 50 60 70 80 90 100
27525022520017515012510075500 25
[US$ cent2005 /kWh]
[US$2005 /GJ]
Range of Oil and Gas Based Heating Cost
Range of Non-Renewable Electricity Cost
Range of Gasoline and Diesel Cost
Non-Renewables
Heat
Transport Fuels
Electricity
Lower Bound
Upper Bound
Medium Values
The lower range of the levelised cost of energy for each RE technology is based on a combination of the most favourable input-values, whereas the upper range is based on a combination of the least favourable input values. Reference ranges in the figure background for non-renewable electricity options are indicative of the levelised cost of centralised non-renewable electricity generation. Reference ranges for heat are indicative of recent costs for oil and gas based heat supply options. Reference ranges for transport fuels are based on recent crude oil spot prices of US$ 40 to130/barrel and corresponding diesel and gasoline costs, excluding taxes.
Biomass Heat:1. Municipal solid waste based CHP2. Anaerobic digestion based CHP3. Steam turbine CHP4. Domestic pellet heating system
Solar Thermal Heat:1. Domestic hot water systems in China2. Water and space heating
Geothermal Heat:1. Greenhouses2. Uncovered aquaculture ponds3. District heating4. Geothermal heat pumps5. Geothermal building heating
5. Palm oil biodiesel
Biofuels:1. Corn ethanol2. Soy biodiesel3. Wheat ethanol4. Sugarcane ethanol
Biomass:1. Cofiring2. Small scale combined heat and power, CHP (Gasification internal combustion engine)3. Direct dedicated stoker & CHP4. Small scale CHP (steam turbine)5. Small scale CHP (organic Rankine cycle)
Solar Electricity:1. Concentrating solar power2. Utility-scale PV (1-axis and fixed tilt) 3. Commercial rooftop PV4. Residential rooftop PV
Geothermal Electricity:1. Condensing flash plant2. Binary cycle plant
Hydropower:1. All types
Ocean Electricity:1. Tidal barrage
Wind Electricity:1. Onshore2. O�shore
Biofuels
Notes: Medium values are shown for the following subcategories, sorted in the order as they appear in the respective ranges (from left to right):
Transport FuelsHeatElectricity
Figure 4: Range in recent levelised cost of energy for selected commerciallyavailable renewable-energy technologiesSource: IPCC (2011)
213

Towards a green economy
illustrated by Table 5. This shows a range of percentage declines in the investment cost of various technologies associated with a doubling of cumulative production capacity.15 Thus, the investment costs of solar PV decline, on average, by between 18 and 28 per cent as production capacity is doubled, compared to a lower decline of between 5 and 7 per cent for advanced coal. In general, the learning rates are higher for less mature energy technologies, such as wind and solar, whose cumulative production capacity or knowledge stock is usually much smaller than conventional technologies. Consequently, the investment costs – and, hence, total production costs – may decline much faster over time for renewable- energy technologies than for conventional technologies.
Most importantly, the analysis does not take two forms of market distortions into account: energy subsidies, which heavily favour fossil fuel technologies, and the differences in unaccounted external costs, which are generally larger for fossil fuel technologies. These are reviewed in the next section.
3 3 Externalities, subsidies and cost competition
The considerable externalities generated by fossil fuel energy sources include both the current and future health impacts of various air and other pollutants, as well as the costs necessary to adapt to climate change and ocean acidification resulting from CO2 emissions. In many cases, there is a lack of political willingness to apply mechanisms to price these externalities. Failure to do so distorts the relative costs and returns of investing in renewable energy compared to fossil fuel alternatives.
The health externalities from fossil fuel energy usage are widespread and difficult to translate into monetary terms. In a recent study on global health, the World Health Organization found external environmental risks accounted
for up to 10 per cent of the global death and disease burden; over half of which is a direct result of fossil fuel use (WHO 2009). ExternE, a project funded by the European Commission, cites increased morbidity rates, congestive heart failure, and a loss of IQ in children among the many externalities readily assessed due to air particulate matter and byproducts of fossil fuel combustion.16 A study from Harvard Medical School showed the true cost of energy from coal in the United States to include an externalised US$ 0.27 per kWh (Epstein et al. 2011), compared to an average cost of energy production of US$ 0.09 per kWh of electricity production (EIA 2011). By way of comparison, a study of government energy subsidies to the fossil fuel industry by the Environmental Law Institute demonstrates US subsidies for coal in the same year at US$ 0.27 per kWh (ELI 2009).
Climate change-related externalities from fossil fuel combustion affect consumers directly through changes in weather patterns, loss of arable land/agricultural yield, increased water scarcity, and diminished ecosystems (NRC 2010). Largely a result of CO2 emissions, these impacts are difficult to assess in monetary terms and require complex cost-benefit analysis compared with energy usage. A study of the external cost of electricity production in the EU by the European Environmental Agency (EEA 2008) examined the specific damage costs associated with emissions of CO2, as well as impacts associated with other air pollutants (NOx, SO2, NMVOCs, PM10, NH3); in 2008 traditional fossil fuel electricity-generation externalities were estimated to reach 25.9 Eurocent/kWh (in the EU-27).
Figure 5, from the IPCC SRREN (2011), displays the additional cost (in US cents) per kilowatt hour of energy produced by the most common renewable and fossil sources over facility lifecycles, differentiating between costs in terms of health impacts and those due to climate change. The figure illustrates the wide range of estimates available for both categories of external costs. In general, external costs from generating electricity from coal or gas-fired plants produces higher externalities than renewable energy technology alternatives, with differences on the graph being larger than they appear due to the logarithmic scale. In addition, the median external costs of climate change impacts from the use of coal or gas for electricity generation exceed the health impacts by about one order of magnitude.17 There is evidence, though, indicating that an integrated approach addressing both air pollutants and GHG emissions can be considerably less costly than dealing
Table 5: Learning rates of electricity-generating technologiesLearning rates of electricity-generating technologies in bottom-up energy system models (per cent)Sources: Messner (1997), Seebregts et al. (1999), Kypreos and Bahn (2003), and Barreto and Klaassen (2004)
Technology Investment cost reduction (%)
Advanced coal 5-7
Natural gas combined cycle 10-15
New nuclear 4-7
Fuel cell 13-19
Wind power 8-15
Solar PV 18-28
15. These rates have been either assumed or estimated econometrically, based on expert knowledge or empirical studies. For a review of the literature on learning curves, including 42 learning rates of energy technologies, see McDonald and Schrattenholzer (2002) and Junginger et al. (2008).
16. See http://www.externe.info/
17. Except where carbon capture and storage (CCS) is potentially possible.
214

Renewable energy
with those issues separately (IPCC 2007), strengthening the argument for taking measures to control air pollution.
The size of the externalities calculations indicates that various renewable technologies would already be competitive if important external costs were internalised to producers and consumers, but are primarily illustrative as there are acknowledged uncertainties in climate-change modelling and the calculation of the resulting damage costs. Because these external costs are not adequately reflected in energy prices, consumers, producers and decision-makers do not receive accurate price signals that are necessary to reach decisions about how best to use resources.
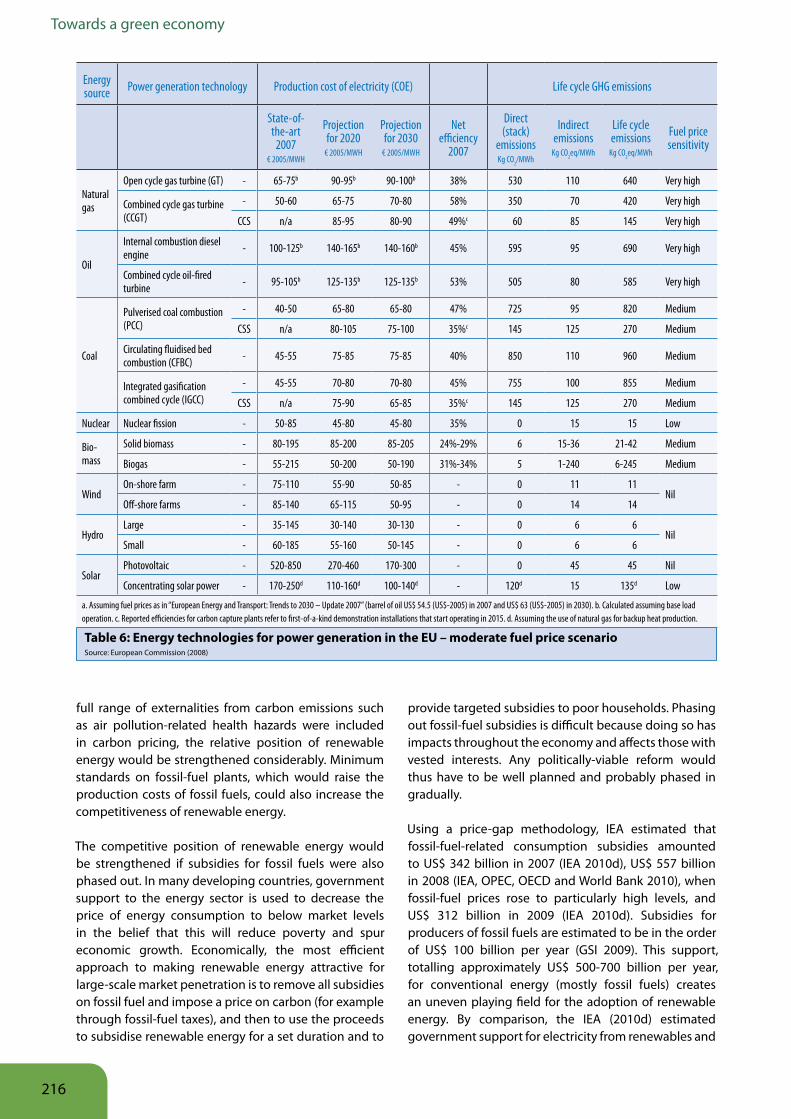
Governments should, though, consider these externalities in formulating policy and strategy for the energy sector. Table 6 by the European Commission (2008) is an example of how
incorporating the external costs of CO2 emissions, together with expected cost reductions for various technologies can alter the competitiveness, in economic terms, of renewable energy technologies in the EU. The table, providing a range of estimates for various technologies, under a moderate fuel-price scenario illustrates how some sources of renewable electricity – in particular hydro and wind – can compete with fossil fuels and nuclear technologies in the EU. It also shows that in the EU the production cost of electricity from on-shore wind could soon be competitive with natural gas technologies. For biomass in the EU, the wide range reflects uncertainties in the costs of biomass. Costs of other renewable energy technologies, namely those for which only prototypes presently exist, are still significantly higher than conventional technologies.18 The cost of electricity generated in the EU by solar PV is projected to fall by around a factor of three by 2030, but it is expected to remain considerably more expensive than that generated by other sources.
Table 6 also illustrates the important role played by the carbon price in assessing the cost-competitiveness of renewable energy generation compared with that derived from fossil fuels. The scenarios assume that each tonne of CO2 directly emitted attracts a levy of € 0/ tCO2 in 2007, € 41/tCO2 in 2020 and € 47/tCO2 in 2030. This assumes a relatively steep rise compared with the current (2011) levels of € 10-15, highlighting the potential of carbon markets (see Box 1).19 If the
Renewable Energy(B) Solar Thermal(B) Geothermal(B) Wind 2.5 MW O�shore(B) Wind 1.5 MW Onshore(C) Wind O�shore(B) Hydro 300 kW(B) PV (2030) (B) PV (2000) (C) PV Southern Europe(C) Biomass CHP 6 MWel (D) Biomass Grate Boiler ESP 5 and 10 MW Fuel
Coal Fired Plants(A) Existing US Plants(B) Coal Comb.C n=46%(B) Coal n=43%(B) Lignite Comb.C n=48%(B) Lignite n=40%(C) Hard Coal 800 MW(C) Hard Coal Postcom. CCS(C) Lignite Oxyfuel CCS
Natural Gas Fired Plants(A) Existing US Plants(B) Natural Gas n=58%(C) Natural Gas Comb.C(C) Natural Gas Postcom.CCS
Health
Climate Change
1010.10.01External Costs [US$ cent/kWh]
Figure 5: External costs of energy sources related to global health and climate change (logarithmic scale)Source: IPCC (2011)
18. Note that steam cycle power plants require a reliable supply of water that in many areas is an increasingly valuable commodity subject to competing uses. Hence the analysis presented in Table 6 makes conservative assumptions concerning production costs of electricity from fossil fuels.
19. The Fourth Assessment Report of the IPCC (2007) reviewed damage cost estimates in peer-reviewed literature at the time of preparation of the assessment (up to 2005), reporting an average of US$ 12 per tonne of CO2, and an upper bound at US$ 95 per tonne of CO2. As discussed below, a more recent review by the German Aerospace Centre and Fraunhofer Institute for System and Innovation Research (DLR/ISI, 2006) proposed a much higher range of € 15-280 per tonne of CO2, based primarily on a modelling report for the UK Department for Environment, Food and Rural Affairs (DEFRA).
215
Towards a green economy
full range of externalities from carbon emissions such as air pollution-related health hazards were included in carbon pricing, the relative position of renewable energy would be strengthened considerably. Minimum standards on fossil-fuel plants, which would raise the production costs of fossil fuels, could also increase the competitiveness of renewable energy.
The competitive position of renewable energy would be strengthened if subsidies for fossil fuels were also phased out. In many developing countries, government support to the energy sector is used to decrease the price of energy consumption to below market levels in the belief that this will reduce poverty and spur economic growth. Economically, the most efficient approach to making renewable energy attractive for large-scale market penetration is to remove all subsidies on fossil fuel and impose a price on carbon (for example through fossil-fuel taxes), and then to use the proceeds to subsidise renewable energy for a set duration and to
provide targeted subsidies to poor households. Phasing out fossil-fuel subsidies is difficult because doing so has impacts throughout the economy and affects those with vested interests. Any politically-viable reform would thus have to be well planned and probably phased in gradually.
Using a price-gap methodology, IEA estimated that fossil-fuel-related consumption subsidies amounted to US$ 342 billion in 2007 (IEA 2010d), US$ 557 billion in 2008 (IEA, OPEC, OECD and World Bank 2010), when fossil-fuel prices rose to particularly high levels, and US$ 312 billion in 2009 (IEA 2010d). Subsidies for producers of fossil fuels are estimated to be in the order of US$ 100 billion per year (GSI 2009). This support, totalling approximately US$ 500-700 billion per year, for conventional energy (mostly fossil fuels) creates an uneven playing field for the adoption of renewable energy. By comparison, the IEA (2010d) estimated government support for electricity from renewables and
Table 6: Energy technologies for power generation in the EU – moderate fuel price scenarioSource: European Commission (2008)
Energy source Power generation technology Production cost of electricity (COE) Life cycle GHG emissions
State-of-the-art
2007€ 2005/MWH
Projection for 2020
€ 2005/MWH
Projection for 2030
€ 2005/MWH
Net efficiency
2007
Direct (stack)
emissionsKg CO2/MWh
Indirect emissions
Kg CO2eq/MWh
Life cycle emissions
Kg CO2eq/MWh
Fuel price sensitivity
Natural gas
Open cycle gas turbine (GT) - 65-75b 90-95b 90-100b 38% 530 110 640 Very high
Combined cycle gas turbine (CCGT)
- 50-60 65-75 70-80 58% 350 70 420 Very high
CCS n/a 85-95 80-90 49%c 60 85 145 Very high
Oil
Internal combustion diesel engine - 100-125b 140-165b 140-160b 45% 595 95 690 Very high
Combined cycle oil-fired turbine - 95-105b 125-135b 125-135b 53% 505 80 585 Very high
Coal
Pulverised coal combustion (PCC)
- 40-50 65-80 65-80 47% 725 95 820 Medium
CSS n/a 80-105 75-100 35%c 145 125 270 Medium
Circulating fluidised bed combustion (CFBC) - 45-55 75-85 75-85 40% 850 110 960 Medium
Integrated gasification combined cycle (IGCC)
- 45-55 70-80 70-80 45% 755 100 855 Medium
CSS n/a 75-90 65-85 35%c 145 125 270 Medium
Nuclear Nuclear fission - 50-85 45-80 45-80 35% 0 15 15 Low
Bio-mass
Solid biomass - 80-195 85-200 85-205 24%-29% 6 15-36 21-42 Medium
Biogas - 55-215 50-200 50-190 31%-34% 5 1-240 6-245 Medium
WindOn-shore farm - 75-110 55-90 50-85 - 0 11 11
NilOff-shore farms - 85-140 65-115 50-95 - 0 14 14
HydroLarge - 35-145 30-140 30-130 - 0 6 6
NilSmall - 60-185 55-160 50-145 - 0 6 6
SolarPhotovoltaic - 520-850 270-460 170-300 - 0 45 45 Nil
Concentrating solar power - 170-250d 110-160d 100-140d - 120d 15 135d Low
a. Assuming fuel prices as in “European Energy and Transport: Trends to 2030 – Update 2007” (barrel of oil US$ 54.5 (US$-2005) in 2007 and US$ 63 (US$-2005) in 2030). b. Calculated assuming base load operation. c. Reported efficiencies for carbon capture plants refer to first-of-a-kind demonstration installations that start operating in 2015. d. Assuming the use of natural gas for backup heat production.
216
Renewable energy
for biofuels at US$ 57 billion in 2009. Realigning these subsidies is the most obvious way to alter the market advantage in favour of sustainable energy production, as was recognised by the G20 in 2009 when it pledged to phase out “inefficient and wasteful” fossil-fuel subsidies (Victor 2009; GSI 2009, 2010). The IEA has calculated that a complete removal of consumption subsidies would reduce CO2 emissions by 5.8 per cent, or 2 Gt, in 2020 (IEA 2010d).
3 4 Employment potential in renewable energy
Employment in the renewable energy sector has become substantial – in 2010 more than 3.5 million people worldwide were estimated to be working either directly or indirectly in the sector. A small group of countries currently account for the majority of jobs, especially
Brazil, China, Japan, Germany and the United States (see Table 8). China accounts for the largest number, with total employment in renewable energy in 2010 estimated at more than 1.1 million workers (Institute for Labor Studies et al. 2010). In Germany, the industry employed 278,000 people in 2008, with 117,500 new jobs having been created since 2004 (UNEP, ILO, IOE and ITUC 2008). These five countries are also those with the largest investments in renewable energy assets, R&D, and production.
Among technologies, wind energy generation has undergone particularly rapid growth, jobs having more than doubled from 235,000 in 2005 to 550,000 in 2009 (WWEA 2010). The most dynamic growth took place in Asia, where employment grew by 14 per cent between 2007 and 2009, followed by North America. Among power generation options, solar PV offers the higher employment rates, though this is likely to decrease
Box 1: Carbon markets
Carbon markets are an instrument for reducing carbon emissions and targeting greenhouse-gas externalities from fossil-fuel use. They are essentially a group obligation to limit the total emissions of specified sources. A limited amount of tradable emission allowances are sold or given gratis, thus creating an artificial market from which a carbon price can emerge. This price imposes extra costs on the use of fossil fuels, making non-fossil based alternatives more competitive. These alternatives can include not only renewables, but also energy-efficiency measures, nuclear power generation, carbon capture and storage (CCS) and the reduction of non-CO2 greenhouse gases. As of 2010, the two most prominent schemes for developing markets for carbon emissions are the EU Emissions Trading Scheme (EU-ETS) and the Clean Development Mechanism (CDM). These are actually
interlinked as the ETS is the principal market in which CDM credits are traded. Owing to the low current carbon prices and uncertainty about their future levels, however, carbon pricing mechanisms have not yet led to large-scale deployment of renewables.
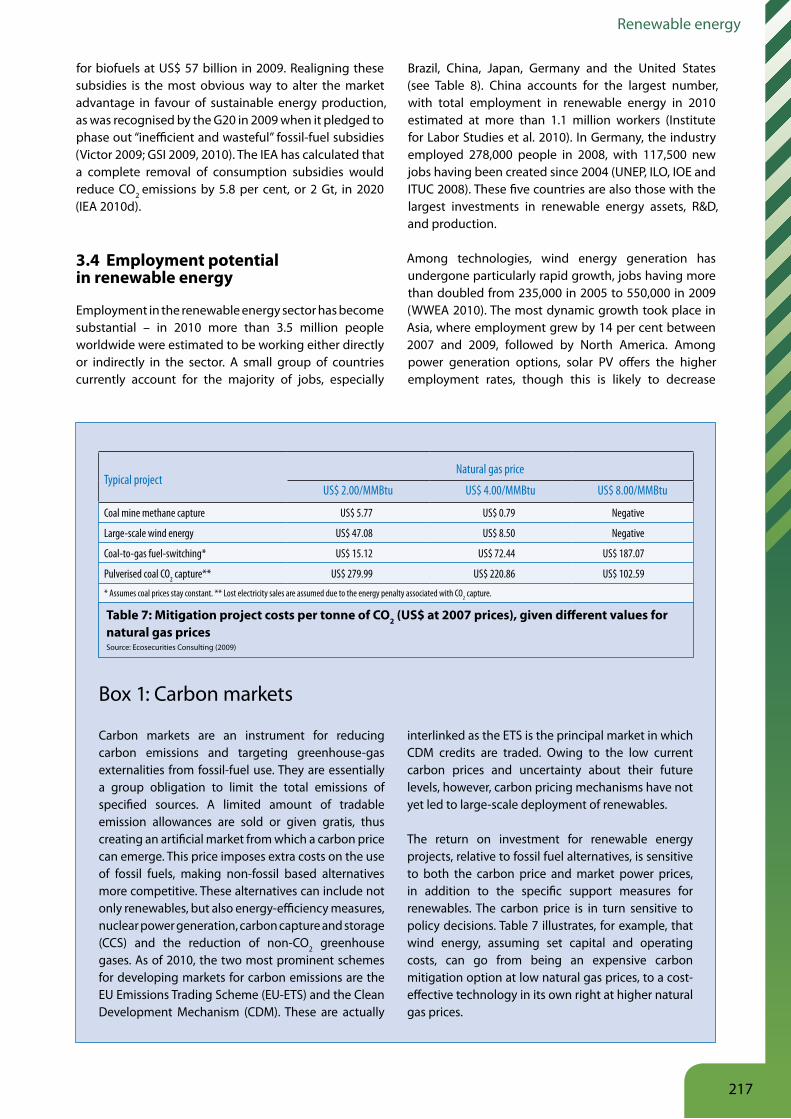
The return on investment for renewable energy projects, relative to fossil fuel alternatives, is sensitive to both the carbon price and market power prices, in addition to the specific support measures for renewables. The carbon price is in turn sensitive to policy decisions. Table 7 illustrates, for example, that wind energy, assuming set capital and operating costs, can go from being an expensive carbon mitigation option at low natural gas prices, to a cost-effective technology in its own right at higher natural gas prices.
Table 7: Mitigation project costs per tonne of CO2 (US$ at 2007 prices), given different values for natural gas pricesSource: Ecosecurities Consulting (2009)
Typical projectNatural gas price
US$ 2.00/MMBtu US$ 4.00/MMBtu US$ 8.00/MMBtu
Coal mine methane capture US$ 5.77 US$ 0.79 Negative
Large-scale wind energy US$ 47.08 US$ 8.50 Negative
Coal-to-gas fuel-switching* US$ 15.12 US$ 72.44 US$ 187.07
Pulverised coal CO2 capture** US$ 279.99 US$ 220.86 US$ 102.59
* Assumes coal prices stay constant. ** Lost electricity sales are assumed due to the energy penalty associated with CO2 capture.
217
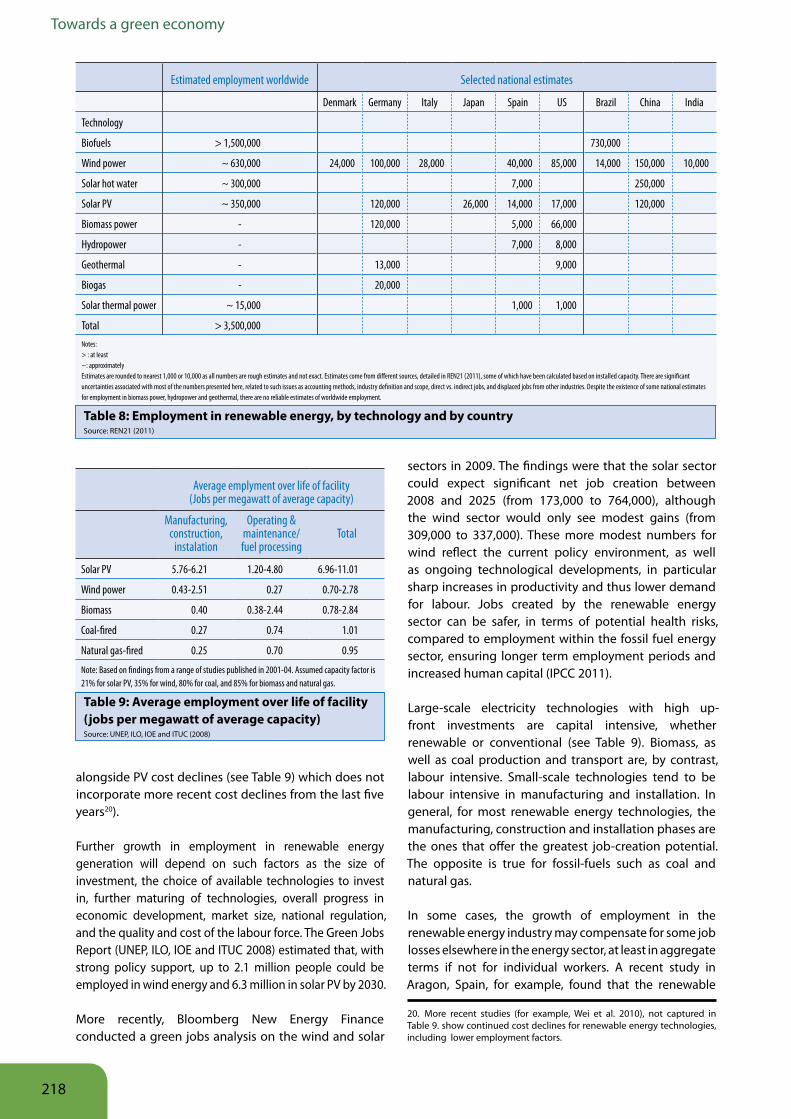
Towards a green economy
alongside PV cost declines (see Table 9) which does not incorporate more recent cost declines from the last five years20).
Further growth in employment in renewable energy generation will depend on such factors as the size of investment, the choice of available technologies to invest in, further maturing of technologies, overall progress in economic development, market size, national regulation, and the quality and cost of the labour force. The Green Jobs Report (UNEP, ILO, IOE and ITUC 2008) estimated that, with strong policy support, up to 2.1 million people could be employed in wind energy and 6.3 million in solar PV by 2030.
More recently, Bloomberg New Energy Finance conducted a green jobs analysis on the wind and solar
sectors in 2009. The findings were that the solar sector could expect significant net job creation between 2008 and 2025 (from 173,000 to 764,000), although the wind sector would only see modest gains (from 309,000 to 337,000). These more modest numbers for wind reflect the current policy environment, as well as ongoing technological developments, in particular sharp increases in productivity and thus lower demand for labour. Jobs created by the renewable energy sector can be safer, in terms of potential health risks, compared to employment within the fossil fuel energy sector, ensuring longer term employment periods and increased human capital (IPCC 2011).
Large-scale electricity technologies with high up-front investments are capital intensive, whether renewable or conventional (see Table 9). Biomass, as well as coal production and transport are, by contrast, labour intensive. Small-scale technologies tend to be labour intensive in manufacturing and installation. In general, for most renewable energy technologies, the manufacturing, construction and installation phases are the ones that offer the greatest job-creation potential. The opposite is true for fossil-fuels such as coal and natural gas.
In some cases, the growth of employment in the renewable energy industry may compensate for some job losses elsewhere in the energy sector, at least in aggregate terms if not for individual workers. A recent study in Aragon, Spain, for example, found that the renewable
Table 8: Employment in renewable energy, by technology and by countrySource: REN21 (2011)
Estimated employment worldwide Selected national estimates
Denmark Germany Italy Japan Spain US Brazil China India
Technology
Biofuels > 1,500,000 730,000
Wind power ~ 630,000 24,000 100,000 28,000 40,000 85,000 14,000 150,000 10,000
Solar hot water ~ 300,000 7,000 250,000
Solar PV ~ 350,000 120,000 26,000 14,000 17,000 120,000
Biomass power - 120,000 5,000 66,000
Hydropower - 7,000 8,000
Geothermal - 13,000 9,000
Biogas - 20,000
Solar thermal power ~ 15,000 1,000 1,000
Total > 3,500,000Notes: > : at least~: approximatelyEstimates are rounded to nearest 1,000 or 10,000 as all numbers are rough estimates and not exact. Estimates come from different sources, detailed in REN21 (2011), some of which have been calculated based on installed capacity. There are significant uncertainties associated with most of the numbers presented here, related to such issues as accounting methods, industry definition and scope, direct vs. indirect jobs, and displaced jobs from other industries. Despite the existence of some national estimates for employment in biomass power, hydropower and geothermal, there are no reliable estimates of worldwide employment.
Table 9: Average employment over life of facility (jobs per megawatt of average capacity)Source: UNEP, ILO, IOE and ITUC (2008)
Average emplyment over life of facility(Jobs per megawatt of average capacity)
Manufacturing, construction,
instalation
Operating & maintenance/fuel processing
Total
Solar PV 5.76-6.21 1.20-4.80 6.96-11.01
Wind power 0.43-2.51 0.27 0.70-2.78
Biomass 0.40 0.38-2.44 0.78-2.84
Coal-fired 0.27 0.74 1.01
Natural gas-fired 0.25 0.70 0.95
Note: Based on findings from a range of studies published in 2001-04. Assumed capacity factor is 21% for solar PV, 35% for wind, 80% for coal, and 85% for biomass and natural gas.
20. More recent studies (for example, Wei et al. 2010), not captured in Table 9. show continued cost declines for renewable energy technologies, including lower employment factors.
218

Renewable energy
energy industry generates between 1.8 and 4 times more jobs per MW installed than conventional sources (Llera Sastresa et al. 2010). China’s growing labour force in renewable energy generation may be partially offset by job losses, estimated at more than half a million by the Chinese Academy of Social Sciences, resulting from the closing of more than 500 small inefficient power plants between 2003 and 2020 (Institute for Labor Studies et al. 2010). Presumably, labour retrenchment will take the form of not replacing workers that retire. In other cases, redeployment of workers to other sectors will be needed, accompanied by targeted retraining programmes.
3 5 Investment required for renewable energy
Forecasts for future investment needs are based on estimated costs of meeting climate change mitigation targets, while still satisfying the growing demand for energy. For the 450 ppm scenario, the IEA’s World Energy Outlook 2010 (IEA 2010d) projects that a total additional investment in low-carbon technologies and energy efficiency (not only renewable energy) of US$ 18 trillion is needed in the period 2010 to 2035.21 Only US$ 2.2 trillion (or 12 per cent) is incurred in the first 10 of these 25 years, but more than half in the second decade, 2020-2030. The World Energy Outlook 2010 does not specify the proportion or amount of these totals to be devoted only to renewable energy, but analysis in the previous year’s Outlook estimated the needed investments in renewables by 2020 at US$ 1.7 trillion under the 450 ppm scenario (IEA 2009a).
There are a number of other analyses with varying estimates of the investments required in renewable energy. The World Economic Forum (2010) suggests that to limit the global average temperature increase to 2°C, global investment in clean energy needs to reach US$ 500 billion per annum by 2020, while current policies imply that this figure would likely only reach US$ 350 billion per annum by 2020. Greenpeace and the European Renewable Energy Council (Greenpeace/EREC 2010) estimate that a total additional investment in renewable energy over 2007-2030 of US$ 9.0 trillion
(averaging US$ 390 billion per year) is required for the “Advanced Energy [R]evolution scenario”.22 The target of this scenario is the reduction of CO2 emissions down to a level of around 10 Gt per year by 2050, and a second objective of phasing out of nuclear energy.23
New Energy Finance estimated that for CO2 to peak before 2020, annual investments in renewable energy, energy efficiency and carbon capture and storage need to reach US$ 500 billion by 2020, rising to US$ 590 billion by 2030.24 This represents an annual average investment of 0.44 per cent of GDP between 2006 and 2030. In summary, various sources estimate the capital investments into renewable energies required for mitigating climate change to be around US$ 500 billion per year until 2020.
For climate mitigation, however, it is not only the scale of investments into renewable energy capacity that is crucial, but also the timing of these investments. This is due to the risk of locking-in a high-carbon power infrastructure because the energy sector is characterised by long life spans of power plants and distribution infrastructure (see Table 10). The carbon emissions in the decades to come are, therefore, determined by today’s investment decisions. The early retirement or retrofitting of power assets, for example, tends to be very expensive and careful transition strategies are therefore needed (Blyth 2010).
Some studies also show that any significant delays in action by governments and the private-sector to move the energy sector onto a low-carbon growth path will lead to significantly higher costs to reach a given mitigation target. For example, the IEA (2009a) estimates that every year of delay in moving the energy sector onto the 450 ppm trajectory would add approximately US$ 500 billion to the global costs for mitigating climate change. Such modelling is sensitive to assumptions about marginal abatement costs at different points in time, but the outcomes are broadly consistent with other studies. Another study (Edmonds et al. 2008) estimates that delaying mitigation actions in developing countries after 2012 could double the total discounted costs to
Table 10: Lifespan of selected power and transportation assetsSource: Stern (2006)
Infrastructure Expected lifetime (years)
Hydro station 75++
Building 45+++
Coal station 45+
Nuclear station 30-60
Gas turbine 25
Aircraft 25-35
Motor vehicle 12-20
21. These estimates are additional to investment costs projected under the Current Policies Scenario.
22. The total projected investment over 2007-2030 in renewable energy for the Reference scenario is US$ 5.1 trillion and for the Advanced Energy [R]evolution, US$ 14.1 trillion. The IPCC (2011) selected this scenario as one of four illustrative scenarios, out of its review of 164 scenarios from 16 different large-scale models. The Advanced Energy [R]evolution represents a scenario in which considerable investments are made in reducing growth in energy demand, and without the use of CCS to reduce GHG emissions.
23. The [R]evolution scenario has a similar target, but assumes a technical lifetime of 40 years for coal-fired power plants, instead of 20 years; the estimated additional investment needed for this scenario averages to US$ 229 billion per year above the Reference scenario.
24. As quoted in UNEP SEFI (2009).
219

Towards a green economy
society by year 2020, with even greater cost increases by years 2035, and 2050, respectively.
It is important to note that the estimated costs of eliminating energy poverty are much smaller than estimates of energy investments to cope with growing energy demand or to address the challenge of mitigating climate change. In April 2010, the UN Secretary-General’s Advisory Group on Energy and Climate Change (AGECC 2010) published a report, which estimates the required capital investment for universal modern energy access to meet basic needs25 to be US$ 35-40 billion per year
through 2030. For improving energy efficiency in low-income countries, the same report estimates the need for an average of US$ 30-35 billion per year. A portion of these costs could be accounted for by renewable energy technologies (as discussed in section 2 above). A bigger push to invest in renewable energy more broadly need not, though, come at the expense of the relatively modest costs of ensuring universal access to modern energy.
25. Energy required for cooking, heating, lighting, communication, healthcare and education.
220

Renewable energy
4 Quantifying the implications of investing in renewable energy
To assess the implications of increasing investments in greening the world economy, including greening the energy sector, the Millennium Institute (MI) conducted a quantitative analysis based on its Threshold 21 national model (T21) adapted for the purpose of the global Green Economy Report (T21-Global). Described in more detail in the modelling chapter, T21-Global is a system dynamics model of the global economy in which the economic, social, and environmental spheres interact with each other.
This modelling exercise covers both energy supply and demand. Energy supply is broken down into electricity and non-electricity. It includes a variety of fossil-fuel sources as well as nuclear, biomass, hydro and other renewable sources. Fossil-fuel production is based on stocks and flows, including discovery and recovery processes. Fossil-fuel prices are endogenous in the model, i.e. determined as a result of the interactions between the forces of supply and demand considered within the model. Energy demand is determined by GDP, energy prices, and technology (i.e. level of energy efficiency), and is disaggregated by source according to the IEA classification. In the model, GDP is also dependent on energy demand, which implies a feedback mechanism that plays an important role in the various scenarios.
The scenarios modelled for the next few decades up to 2030 and 2050 include: 1) business-as-usual (BAU), which is based on the historical trajectory and assumes no major change in policy and external conditions; 2) allocating 1 or 2 per cent of the global GDP as additional investments into business as usual – BAU1 and BAU2 respectively; and 3) allocating 1 or 2 per cent of the global GDP as additional investments to green 10 economic sectors – G1 and G2, respectively. Under G2, the energy sector receives a much larger allocation, bringing the analysis closer to the policy targets of reducing GHG emissions to levels necessary to maintain atmospheric concentrations of CO2 at 450 ppm. The presentation below focuses, therefore, on G2 and its comparison with BAU2.26
4 1 Business-as-usual (BAU)
The BAU scenario in the GER modelling analysis is similar to the WEO 2009 Reference Scenario27 (IEA 2009a), in which world energy resources are generally adequate to meet demand in the foreseeable future. With respect to oil, however, the long-term picture is of serious concern, even with a peak of conventional oil projected to take place after 2035.
This BAU scenario should be interpreted as representing how energy use would evolve over the next 40 years if current trends were simply extrapolated. This assumption, however, ignores important potential consequences of climate change on economic activity or other aspects of human well-being, and is thus optimistic in terms of the likely implications of following a BAU path.
In the BAU scenario, the current growth (2.4 per cent annually) of world primary energy demand slackens between 2010 and 2050 to an average yearly increase of 1.2 per cent, due to slowing population growth and economic growth. Despite slower growth, however, global energy demand still increases by about one-third, from approximately 13,000 Mtoe today to almost 17,100 Mtoe in 2050. Similarly, world electricity demand would continue to grow, but at a much slower pace (from above 3 per cent now to 1.1 per cent per year by 2050).
Under BAU, fossil fuels remain the dominant source of energy, with a constant share of about 80 per cent through to 2050. Currently, renewable energy supplies some 13 per cent of world’s energy demand, most of which is traditional biomass and large-scale hydropower. Under the BAU scenario, energy from modern renewables (excluding hydro, traditional biomass and agricultural waste and residues) would continue to register the strongest – but gradually reduced – growth rates (from around 3 per cent per year now to 1.1 per cent during 2030-2050).28 Among the other sources in the energy mix, nuclear energy continues to expand, but the annual growth rate in supply drops from 1.3 per cent in short term to 0.6 per cent in the long run. Constant growth of coal and natural gas (1.3 per cent and 1.5 per cent annual growth respectively) and the projected decline in oil in the mid to longer term allows coal and natural gas to account for the largest shares of demand: 24 per cent for natural gas, 33 per cent for coal
26. More detail on the scenarios, including G1, is presented in the modelling chapter.
27. At the global aggregated level, this is also reasonably similar to the WEO 2010 (IEA 2010d) Current Policies Scenario.
28 Increases in the supply of energy from modern renewables are more modest than growth in total investments reviewed in Section 3.1, as the latter include total financial investments.
221
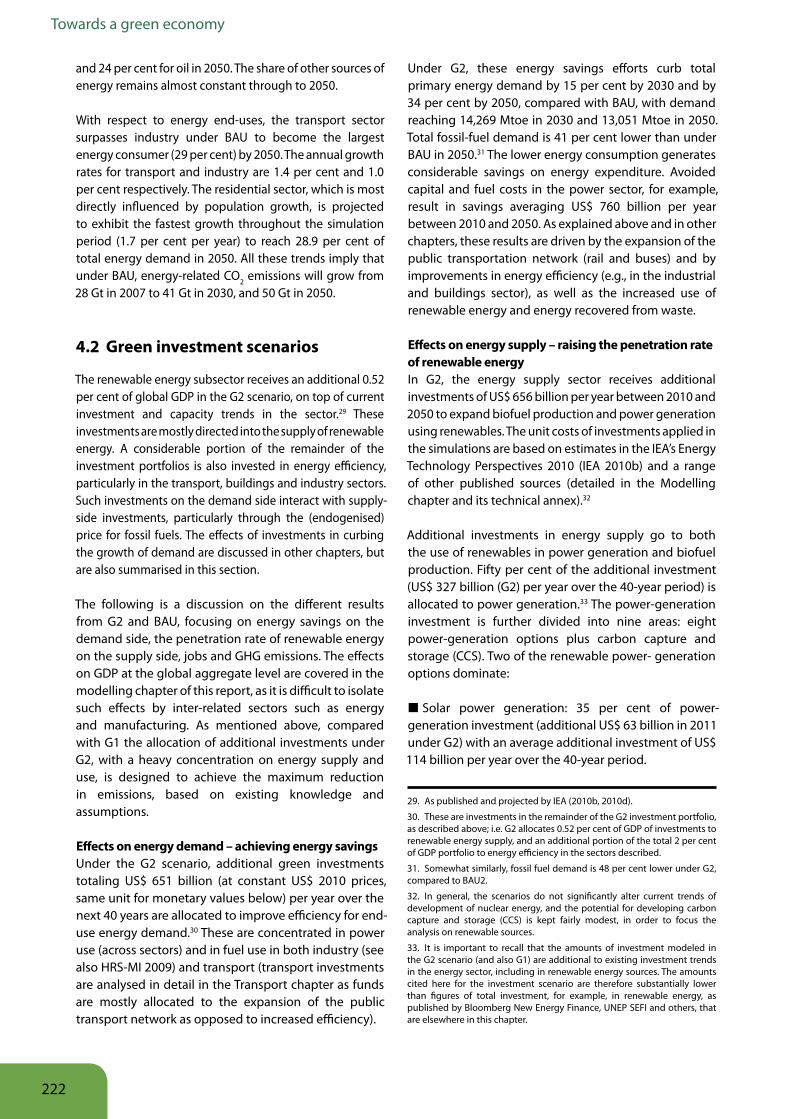
Towards a green economy
and 24 per cent for oil in 2050. The share of other sources of energy remains almost constant through to 2050.
With respect to energy end-uses, the transport sector surpasses industry under BAU to become the largest energy consumer (29 per cent) by 2050. The annual growth rates for transport and industry are 1.4 per cent and 1.0 per cent respectively. The residential sector, which is most directly influenced by population growth, is projected to exhibit the fastest growth throughout the simulation period (1.7 per cent per year) to reach 28.9 per cent of total energy demand in 2050. All these trends imply that under BAU, energy-related CO2 emissions will grow from 28 Gt in 2007 to 41 Gt in 2030, and 50 Gt in 2050.
4 2 Green investment scenarios
The renewable energy subsector receives an additional 0.52 per cent of global GDP in the G2 scenario, on top of current investment and capacity trends in the sector.29 These investments are mostly directed into the supply of renewable energy. A considerable portion of the remainder of the investment portfolios is also invested in energy efficiency, particularly in the transport, buildings and industry sectors. Such investments on the demand side interact with supply-side investments, particularly through the (endogenised) price for fossil fuels. The effects of investments in curbing the growth of demand are discussed in other chapters, but are also summarised in this section.
The following is a discussion on the different results from G2 and BAU, focusing on energy savings on the demand side, the penetration rate of renewable energy on the supply side, jobs and GHG emissions. The effects on GDP at the global aggregate level are covered in the modelling chapter of this report, as it is difficult to isolate such effects by inter-related sectors such as energy and manufacturing. As mentioned above, compared with G1 the allocation of additional investments under G2, with a heavy concentration on energy supply and use, is designed to achieve the maximum reduction in emissions, based on existing knowledge and assumptions.
Effects on energy demand – achieving energy savings Under the G2 scenario, additional green investments totaling US$ 651 billion (at constant US$ 2010 prices, same unit for monetary values below) per year over the next 40 years are allocated to improve efficiency for end-use energy demand.30 These are concentrated in power use (across sectors) and in fuel use in both industry (see also HRS-MI 2009) and transport (transport investments are analysed in detail in the Transport chapter as funds are mostly allocated to the expansion of the public transport network as opposed to increased efficiency).
Under G2, these energy savings efforts curb total primary energy demand by 15 per cent by 2030 and by 34 per cent by 2050, compared with BAU, with demand reaching 14,269 Mtoe in 2030 and 13,051 Mtoe in 2050. Total fossil-fuel demand is 41 per cent lower than under BAU in 2050.31 The lower energy consumption generates considerable savings on energy expenditure. Avoided capital and fuel costs in the power sector, for example, result in savings averaging US$ 760 billion per year between 2010 and 2050. As explained above and in other chapters, these results are driven by the expansion of the public transportation network (rail and buses) and by improvements in energy efficiency (e.g., in the industrial and buildings sector), as well as the increased use of renewable energy and energy recovered from waste.
Effects on energy supply – raising the penetration rate of renewable energyIn G2, the energy supply sector receives additional investments of US$ 656 billion per year between 2010 and 2050 to expand biofuel production and power generation using renewables. The unit costs of investments applied in the simulations are based on estimates in the IEA’s Energy Technology Perspectives 2010 (IEA 2010b) and a range of other published sources (detailed in the Modelling chapter and its technical annex).32
Additional investments in energy supply go to both the use of renewables in power generation and biofuel production. Fifty per cent of the additional investment (US$ 327 billion (G2) per year over the 40-year period) is allocated to power generation.33 The power-generation investment is further divided into nine areas: eight power-generation options plus carbon capture and storage (CCS). Two of the renewable power- generation options dominate:
■ Solar power generation: 35 per cent of power-generation investment (additional US$ 63 billion in 2011 under G2) with an average additional investment of US$ 114 billion per year over the 40-year period.
29. As published and projected by IEA (2010b, 2010d).
30. These are investments in the remainder of the G2 investment portfolio, as described above; i.e. G2 allocates 0.52 per cent of GDP of investments to renewable energy supply, and an additional portion of the total 2 per cent of GDP portfolio to energy efficiency in the sectors described.
31. Somewhat similarly, fossil fuel demand is 48 per cent lower under G2, compared to BAU2.
32. In general, the scenarios do not significantly alter current trends of development of nuclear energy, and the potential for developing carbon capture and storage (CCS) is kept fairly modest, in order to focus the analysis on renewable sources.
33. It is important to recall that the amounts of investment modeled in the G2 scenario (and also G1) are additional to existing investment trends in the energy sector, including in renewable energy sources. The amounts cited here for the investment scenario are therefore substantially lower than figures of total investment, for example, in renewable energy, as published by Bloomberg New Energy Finance, UNEP SEFI and others, that are elsewhere in this chapter.
222
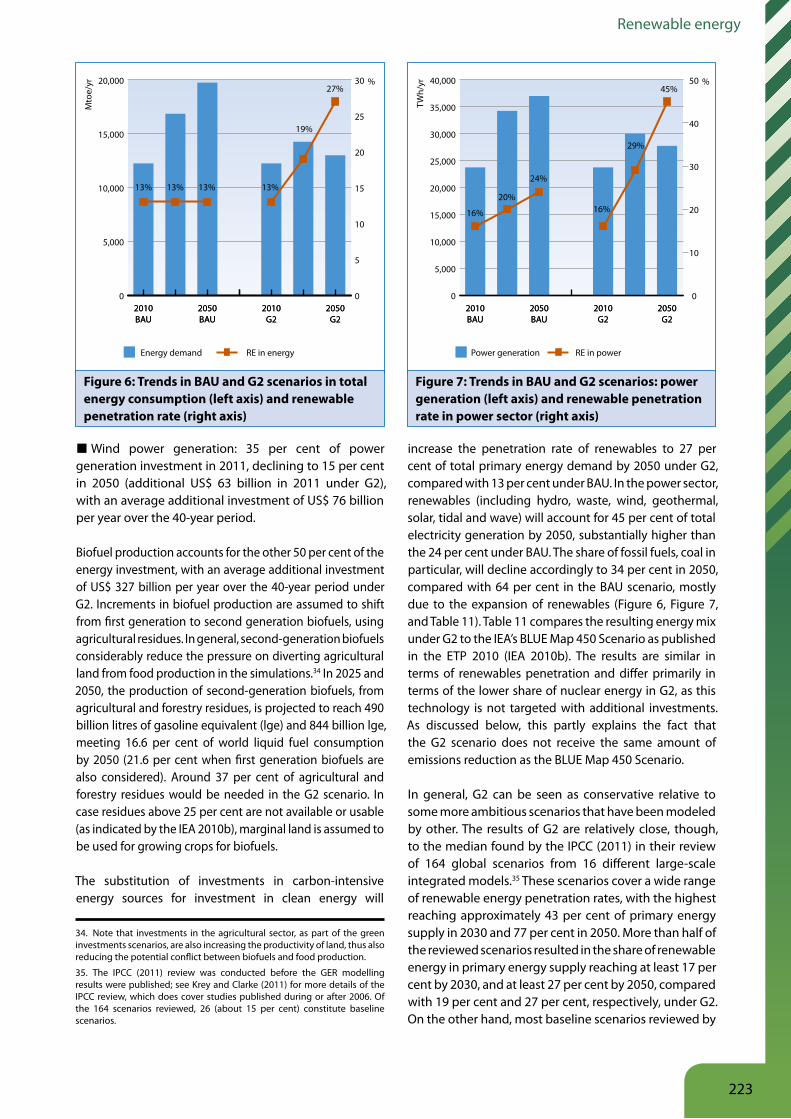
Renewable energy
■ Wind power generation: 35 per cent of power generation investment in 2011, declining to 15 per cent in 2050 (additional US$ 63 billion in 2011 under G2), with an average additional investment of US$ 76 billion per year over the 40-year period.
Biofuel production accounts for the other 50 per cent of the energy investment, with an average additional investment of US$ 327 billion per year over the 40-year period under G2. Increments in biofuel production are assumed to shift from first generation to second generation biofuels, using agricultural residues. In general, second-generation biofuels considerably reduce the pressure on diverting agricultural land from food production in the simulations.34 In 2025 and 2050, the production of second-generation biofuels, from agricultural and forestry residues, is projected to reach 490 billion litres of gasoline equivalent (lge) and 844 billion lge, meeting 16.6 per cent of world liquid fuel consumption by 2050 (21.6 per cent when first generation biofuels are also considered). Around 37 per cent of agricultural and forestry residues would be needed in the G2 scenario. In case residues above 25 per cent are not available or usable (as indicated by the IEA 2010b), marginal land is assumed to be used for growing crops for biofuels.
The substitution of investments in carbon-intensive energy sources for investment in clean energy will
increase the penetration rate of renewables to 27 per cent of total primary energy demand by 2050 under G2, compared with 13 per cent under BAU. In the power sector, renewables (including hydro, waste, wind, geothermal, solar, tidal and wave) will account for 45 per cent of total electricity generation by 2050, substantially higher than the 24 per cent under BAU. The share of fossil fuels, coal in particular, will decline accordingly to 34 per cent in 2050, compared with 64 per cent in the BAU scenario, mostly due to the expansion of renewables (Figure 6, Figure 7, and Table 11). Table 11 compares the resulting energy mix under G2 to the IEA’s BLUE Map 450 Scenario as published in the ETP 2010 (IEA 2010b). The results are similar in terms of renewables penetration and differ primarily in terms of the lower share of nuclear energy in G2, as this technology is not targeted with additional investments. As discussed below, this partly explains the fact that the G2 scenario does not receive the same amount of emissions reduction as the BLUE Map 450 Scenario.
In general, G2 can be seen as conservative relative to some more ambitious scenarios that have been modeled by other. The results of G2 are relatively close, though, to the median found by the IPCC (2011) in their review of 164 global scenarios from 16 different large-scale integrated models.35 These scenarios cover a wide range of renewable energy penetration rates, with the highest reaching approximately 43 per cent of primary energy supply in 2030 and 77 per cent in 2050. More than half of the reviewed scenarios resulted in the share of renewable energy in primary energy supply reaching at least 17 per cent by 2030, and at least 27 per cent by 2050, compared with 19 per cent and 27 per cent, respectively, under G2. On the other hand, most baseline scenarios reviewed by
0
5,000
10,000
15,000
20,000
2050G2
2010G2
2050BAU
2010BAU
0
5
10
15
20
25
30
2050G2
2010G2
2050BAU
2010BAU
%M
toe/
yr
Energy demand RE in energy
13% 13% 13% 13%
19%
27%
0
5,000
10,000
15,000
20,000
25,000
30,000
35,000
40,000
2050G2
2010G2
2050BAU
2010BAU
0
10
20
30
40
50
2050G2
2010G2
2050BAU
2010BAU
%
TWh/
yr
Power generation RE in power
16%
20%
24%
16%
29%
45%
Figure 7: Trends in BAU and G2 scenarios: power generation (left axis) and renewable penetration rate in power sector (right axis)
Figure 6: Trends in BAU and G2 scenarios in total energy consumption (left axis) and renewable penetration rate (right axis)
34. Note that investments in the agricultural sector, as part of the green investments scenarios, are also increasing the productivity of land, thus also reducing the potential conflict between biofuels and food production.
35. The IPCC (2011) review was conducted before the GER modelling results were published; see Krey and Clarke (2011) for more details of the IPCC review, which does cover studies published during or after 2006. Of the 164 scenarios reviewed, 26 (about 15 per cent) constitute baseline scenarios.
223

Towards a green economy
the IPCC show moderately stronger deployment of RE than BAU from the GER modelling.
Effects on employment – increasing jobs from greening the energy sectorThe total employment in the energy supply sector is projected to decrease slightly over time in the BAU scenario, from 19 million in 2010 to 18.6 million in 2050, owing to increasing labour productivity in fossil-fuel extraction and processing. In the green investment scenarios, there is some short-term net job creation primarily because of the higher labour intensity of renewable energy generation compared with thermal power generation. In the longer term, increasing productivity also leads to a roughly comparable decline, reaching 18.3 million in 2050 in the G2 case. Between 330,000 and 1 million jobs would be created in the production and processing of biofuels and agriculture residues, which would rise to 3 million if a mix of agricultural residues and conventional feedstock is used. There is a major shift in employment, however, with growth in renewable power generation and biofuels production matched by a considerable decline in coal extraction and processing, and to some extent gas production (Figure 8). The additional investment in energy efficiency in the buildings sector36 also included in the G2 scenario, however, leads to an additional 5.1 million jobs in 2050. The net effect is thus a projected increase in energy-sector employment of approximately 21 per cent over a comparable BAU scenario.37
It should be noted that the modelling of renewable-energy investment includes only “direct jobs” that will substitute new jobs from not expanding energy of other sources (in the case of increased demand) or even replace existing jobs in other energy technologies. It does not include “indirect jobs” – created or displaced
– in sectors that supply energy industries. These are
the sectoral effects, whereas the wider effects on output and jobs in the rest of the economy38 (covered in the Modelling chapter) depend on how the relative availability and price of capital, labour and energy are affected as a result of increased investment in renewable energy. It should also be pointed out that considerable net job creation can imply higher-cost energy, which can constrain economic growth and development. Finally, the global analysis does not capture effects on specific countries. Some of these, such as oil-exporting countries, may well see negative effects on employment in the energy sector.
Effects on GHG emissionsUnder the green investment scenarios, global energy intensity (in terms of Mtoe/US$ billion GDP) declines by 36 per cent by 2030, and the cumulative global energy- related CO2 emissions would be considerably mitigated by 2050 (Figure 9). Under G2, emissions are approximately 60 per cent lower in 2050 as compared to BAU. In absolute amounts, this corresponds to a decline from 30.6 Gt of energy-related CO2 emissions in 2010 to about 20 Gt in 2050 (see Figure 9).
Table 12 compares the contribution to emissions reduction under G2 from both demand- and supply-side investments with those of the IEA’s BLUE Map scenario. Both exercises project a contribution to emissions abatement of 46 per cent from supply-side investments. The green investment scenario G2, however, does not
Table 12: Emission abatement shares from GER modelling compared with IEA
*WEO 450 Scenario
*ETP BLUE Map G2 G2
2030 2050 2030 2050
End-use electricity efficiency 49%
19% 22% 27%
Fuel efficiency 35% 23% 28%
Industry 7% 6%
Transportation 8% 16% 22%
Supply-side abatement 50% 46% 54% 46%
Power generation from low carbon sources (RE & Nuclear)
30% 27% 39% 33%
Biofuels 3% 6% 5%
CCS 17% 19% 9% 7%
NB: Columns may not add up to 100% due to rounding. *Additional sources: IEA (2010b, 2010d)
Table 11: Comparison of energy mix in 2030 and 2050 in various GER and IEA scenarios
% 2030 2050*WEO GER *WEO GER *ETP GER
Scenarios Current Policies BAU 450 G2 BLUE
Map G2
Coal 29 31 19 25 15 15
Oil 30 28 27 24 19 21
Gas 21 23 21 23 21 25
Nuclear 6 6 10 8 17 12
Hydro 2 2 3 3
29
4
Biomass and wastes 10 8 14 12 16
Other RE 2 3 5 5 8
Total 100 100 100 100 100 100
*Additional sources: IEA (2010b, 2010d)
36. These are essentially for the buildings sector, as potential job implications of investments in energy efficiency in industrial and transport sectors could not be captured.
37. The point of comparison for employment generation is the simulated effects of an additional investment of 2 per cent of GDP in current investment patterns (see the Modelling chapter for more details).
38. Also sometimes referred to as “induced jobs” (NREL 1997).
224
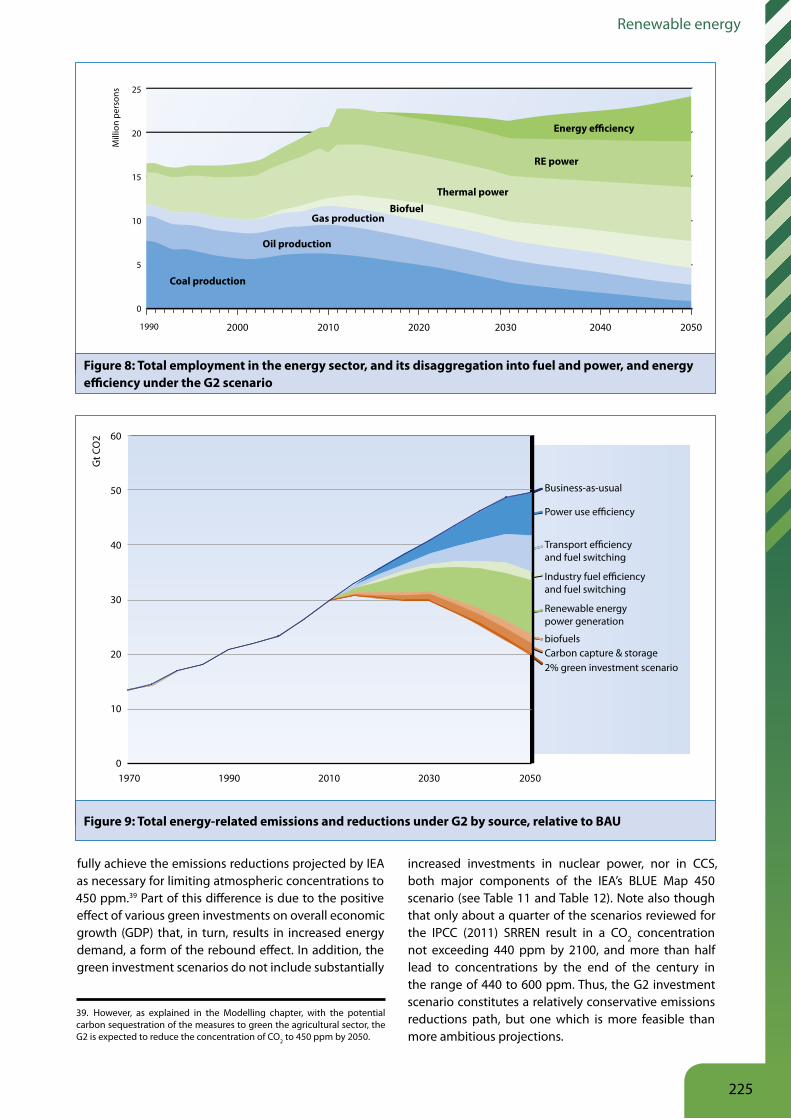
Renewable energy
fully achieve the emissions reductions projected by IEA as necessary for limiting atmospheric concentrations to 450 ppm.39 Part of this difference is due to the positive effect of various green investments on overall economic growth (GDP) that, in turn, results in increased energy demand, a form of the rebound effect. In addition, the green investment scenarios do not include substantially
increased investments in nuclear power, nor in CCS, both major components of the IEA’s BLUE Map 450 scenario (see Table 11 and Table 12). Note also though that only about a quarter of the scenarios reviewed for the IPCC (2011) SRREN result in a CO2 concentration not exceeding 440 ppm by 2100, and more than half lead to concentrations by the end of the century in the range of 440 to 600 ppm. Thus, the G2 investment scenario constitutes a relatively conservative emissions reductions path, but one which is more feasible than more ambitious projections.
Coal production
Oil production
Gas productionBiofuel
Thermal power
RE power
Energy e�ciency
1990 2000 2010 2020 2030 2040 2050
25
20
15
10
5
0
Mill
ion
pers
ons
Figure 8: Total employment in the energy sector, and its disaggregation into fuel and power, and energy efficiency under the G2 scenario
2050
Gt C
O2 60
50
40
30
20
10
01970 1990 2010 2030
Business-as-usual
Power use e�ciency
Transport e�ciency and fuel switching
Industry fuel e�ciency and fuel switching
Renewable energy power generation
biofuelsCarbon capture & storage2% green investment scenario
Figure 9: Total energy-related emissions and reductions under G2 by source, relative to BAU
39. However, as explained in the Modelling chapter, with the potential carbon sequestration of the measures to green the agricultural sector, the G2 is expected to reduce the concentration of CO2 to 450 ppm by 2050.
225

Towards a green economy
5 Overcoming barriers: enabling conditionsThe preceding analysis has explored the results from increased investments in renewable energy, in terms of energy savings, penetration of renewable energy, increased jobs, and reduced GHG emissions. However, as noted in section 3, current levels of investment in renewable energy are still below what is needed to address the challenges facing the energy sector outlined earlier in the chapter. This section discusses the barriers to increasing investments in renewable energy and the measures that are needed to address these barriers.
The major barriers and respective policy responses may be grouped under the following headings: 1) energy policy framework; 2) risks and returns associated with renewable energy investments, including fiscal policy instruments; 3) financing constraints for renewable energy projects; 4) electricity infrastructure and regulations; 5) market failure related to investments in innovation and R&D; 6) technology transfer and skills; and 7) sustainability standards.
5 1 Policy commitment to renewable energy
In general, the growth in investment and deployment of renewable energy technologies, documented above, has been driven by an increasing number and variety of policies (IPCC 2011). These are reviewed below in the subsequent sub-sections. Individual policies to overcome various barriers to renewable energy development and deployment are most effective when they are part of a broad enabling policy framework, which builds on complementarity between a range of measures operating at multiple stages of the chain from research and development, through to deployment and diffusion. An enabling policy framework for renewable energy includes clear commitments to long-term development of the sector. Such commitment can be manifested by targets for investment in additional capacity and penetration rates within the energy mix. When supported by other enabling policies, setting targets to achieve these goals can send a strong signal to potential investors.
Important targets for energy access have been announced at the international level. The AGECC (2010) calls on the UN and its Member States to commit themselves to two achievable goals: universal access to
modern energy services and a global energy intensity reduction of 40 per cent by 2030. The report highlights that, “Delivering these two goals is key to achieving the [MDGs], improving the quality and sustainability of macroeconomic growth, and helping to reduce carbon emissions over the next 20 years”.
Many countries have already adopted targets for renewable energy. By early 2011, there were national policy targets in 98 countries, including all 27 EU member states (REN21 2011).40 A large number of these targets concern renewables’ shares of electricity production, and generally fall in the range of 10-30 per cent within the next 1-2 decades. Targets are also set for the share of renewable energy in total primary or final energy supply, installed capacities of various specific technologies, the total amounts of energy production from renewables, or for the share of biofuels in transportation fuels. While earlier many targets were set for the 2010-2012 timeframe, targets set more recently concern the next decade to 2020 or beyond. For example, EU countries have set a target of 20 per cent of their final energy supply to be provided by renewable sources by 2020.
Policy targets for renewable energy have also been established in many developing countries. In fact, more than half of the national targets have been set by developing countries. Between 1997 and 2010, the number of developing countries with national targets doubled from 22 to 45. Developing countries with targets for 2020 or beyond include, among others, Brazil, China, Egypt, India, Kenya, the Philippines and Thailand. Box 2 illustrates the example of Tunisia, which has been encouraging the use of renewable energy since 2004. In addition to such national targets, there are many countries with sub-national targets at the state or provincial level.
The REN21 Global Status Report 2011 (REN21 2011) illustrates that a number of countries had either met their targets for 2011 or were about to do so. Finland and Sweden had already met their targets for 2020. The report also indicates though that some countries have not met their targets, while others have revised their targets downwards. For example, India missed its target for 2 GW of added wind power in 2010. The US reduced its target for
40. The following description and examples of policy targets here are based on information from the REN21 Global Status Report 2011 (REN21 2011).
226

Renewable energy
about 950 million litres of advanced cellulosic biofuels by 2011 (as originally envisioned in the Energy Independence and Security Act of 2007) to about 25 million liters, due to difficulties in financing commercial production. The range of experience highlights the need to adjust targets according to evolving conditions. The achievement of targets requires a strategy of tailored policy measures, discussed in the further in the following sections.
5 2 Risks and returns
As is the case in other sectors, the nature of risks, relative to expected returns, influences the incentive to invest in renewable energy. If a project or company has an expected risk-adjusted rate of return on investment that is sufficiently high, it is considered an interesting opportunity for financing. Taking first the risks in renewable energy projects, these can be categorised as follows (UNEP SEFI, New Energy Finance and Chatham House 2009):
■ Technical and project-specific risks, including risks associated with lead times, construction costs, novelty of the technology, fuel and resources, and operations and management. Newer technologies have higher risks than traditional ones. As long as investors are unfamiliar with a technology and there is little in-country expertise, the perceived risk is high. Resource availability may also be an issue for specific technologies like geothermal where determination of good locations is costly and subject
to uncertainty. Some resource dependency also occurs with hydro, wind, and biomass-based technologies. Risks will therefore differ at regional or national levels.
■ Country-specific institutional risks such as stability of the government, reliability of the legal system, transparency of business dealings, currency risks, and general instability due to wars, famine and strikes. For large-scale investments in a specific country, a long-term stable policy regime with a sound legal basis is needed;
■ Political risk and regulatory risks, such as unexpected changes in policy or uncertainty about the future direction of policy. Given the long pay-back periods, the contribution of policies to predictability, clarity and long-term stability in the investment climate, are viewed as critical in being able to stimulate more investments;41 and,
■ Business and market risks, including: 1) financial risks relating to the capital structure of the project such as high upfront capital intensity and the project’s ability to generate enough cash flow; 2) economic risks relating to interest rates, exchange rates, inflation, commodity prices, counterparty credit risk; and 3) market risks associated with, for example, future electricity and carbon prices (which may also be influenced by political and regulatory risks). Most renewable energy technologies are less vulnerable to the price and availability of fuel during the operation of a project. Those technologies that are dependent on biomass, however, do face potential market-price risks if the opportunity cost of biomass production is related to agricultural commodity prices and also because a reduction in fossil-fuel prices can make renewable energy less competitive in fuel and
Box 2: Tunisia’s Solar Energy Plan
In order to become less dependent on energy imports and the volatile prices of oil and gas, the Government of Tunisia decided to develop the country’s potential for renewable energy generation. A 2004 law on energy management provided a legal framework. In 2005, funding mechanisms such as the National Fund for Energy Management became available for deploying renewable energy technologies and increasing energy efficiency. Between 2005 and 2008, clean energy plans enabled the government to save nearly € 900 million in energy expenditures (equivalent to 10 per cent of primary energy consumption), with an initial investment in clean energy infrastructure of only € 260 million. The renewable energy supplies and energy efficiency measures are expected to have reduced total energy
consumption from conventional sources by about 20 per cent in 2011. In December 2009, the government presented the first national Solar Energy Plan and other complementary plans with the objective of increasing the share of renewable energy sources to 4.3 per cent of total energy generation in 2014, up from the current level of 0.8 per cent. The objective is to transform Tunisia into an international clean-energy hub. The Solar Energy Plan is based on three main technologies: solar PV, concentrating solar power and solar water heating systems, and comprises 40 renewable energy projects. The Plan’s budget through to 2016 is € 2 billion, while its savings on energy imports are expected to reach more than 20 per cent per year by the end of that year.Source: Agence Nationale pour la Maîtrise de l’Énergie (2009)
41. This includes either anticipating or being able to adapt to unanticipated adverse effects from the deployment of a new renewable energy project. A prominent example is the production of biofuels, in which the EU and the US have adjusted their respective policy support
227

Towards a green economy
power markets. Such risks may be reduced with second generation, relative to first generation biofuels.
Various government initiatives, including regulatory policies, fiscal incentives and public financing mechanisms, can reduce many of these risks and thus increase expected returns (Ecofys 2008). Such measures include offering long-term policy commitment to increased deployment of renewable energy investment, helping to mitigate political and regulatory risks. Shorter-term political commitment is similarly important. Owing to the long-lead times for project development, clarity over the development of regulation in support of renewable energy over a five-year horizon is desirable. Political and regulatory risks, as well as some country-specific risks, can also be reduced through government-sponsored initiatives to share risks, including through loan guarantees (discussed again under section 5.3) or public participation in the project or related infrastructure investments. Technical and project-specific risks can be addressed through action to improve permitting procedures, as well as grid connection procedures in the case of power generation projects. Well-designed measures to reduce the above risks have been estimated to decrease the production costs by as much as 30 per cent, in a European context (Ecofys 2008).
A range of further public support mechanisms can also enhance returns to investments in renewable energy, by either helping to lower costs or to enhance income. Measures to reduce costs include subsidies and fiscal measures, such as investment tax deduction, production tax deduction, and preferential depreciation schemes. Public finance mechanisms, such as loans, also lower risks to investors and this particular type of support is discussed in more detail in the next section.
Direct subsidies for renewable energy have been used to provide assistance in the early stages of market diffusion. In July 2009, for example, China initiated the Golden Sun Policy, which provides subsidies for 500 MW of PV projects until 2012 to temporarily support the domestic solar industry in response to reduced demand for PV panels in Germany and Spain. The policy supports large-scale PV, which complements the existing Solar Roofs Program that began in March 2009 (REN21 2010). Such subsidies can be in the form of investment support and grants to reduce capital costs, or in the form of operating support. Currently, they are estimated at US$ 27 billion in 2007 for renewables (excluding hydroelectricity) and US$ 20 billion for biofuels at the global level, clearly dwarfed by subsidies to fossil fuels.
Subsidies, however, need to be judiciously designed. Subsidies will most likely need to be adjusted over time in order to be efficient, and such changes are likely to be opposed by businesses or consumers who benefit
from them. Such support also needs to take into account requirements of international agreements, in particular the rules and regulations of the WTO. Box 3 gives the example of Brazil, which used taxes on petrol to cross-subsidise ethanol from sugarcane.
Taxes can be an alternative fiscal measure to subsidies (or used in combination) in order to shape the structure of incentives facing producers and consumers in energy markets. A tax is one of the most efficient measures for addressing the externalities of carbon emissions in energy production and use. Given the pervasiveness of energy use and, thus, the broad tax base, it may be desirable on both efficiency and equity grounds to embed such tax measures in a broader fiscal reform package with a view to offsetting a carbon tax with reductions in other taxes, especially those which distort markets; this would produce a win-win for society as a whole.
Renewable energy producers, for example, may be granted exemptions from general energy taxes. Such measures are potentially most effective where overall energy taxes are high, such as in Nordic countries (IEA 2008e). The United States and Sweden, for example, provide a 30 per cent tax credit for solar PV, France offers a 50 per cent income tax credit, and Australia provides rebates up to AUS$ 8/watt (REN21 2010).
In addition to measures to reduce costs for renewable energy investments, governments employ a range of production support measures to enhance the income earned on such investments. These include obligation schemes, such as renewable portfolio standards for energy utilities mandated by government (discussed below under section 5.4) or feed-in tariffs.
Support mechanisms can elicit private investment in renewable energy, and while most support is implemented in high-income countries, incentives are becoming common place in developing countries. Currently 79 countries have at least some form of regulatory policy, such as a renewable quota, and 80 countries have at least one form of fiscal incentive in place (REN21 2011). Public finance and investment are being utilised, but at a slower rate than other mechanisms. In most support schemes the government must be actively involved to assure investment certainty.
Feed-in tariffs, much like preferential pricing, guarantee payment of a fixed amount per unit of electricity produced or a premium on top of market electricity prices. Feed-in schemes can be flexible and tailored; for example, tariffs can be based on technology-specific costs, possibly decreasing over time to follow actual cost reductions. This instrument is popular with project developers for the long-term certainty it can provide and, thereby, a considerable reduction of
228
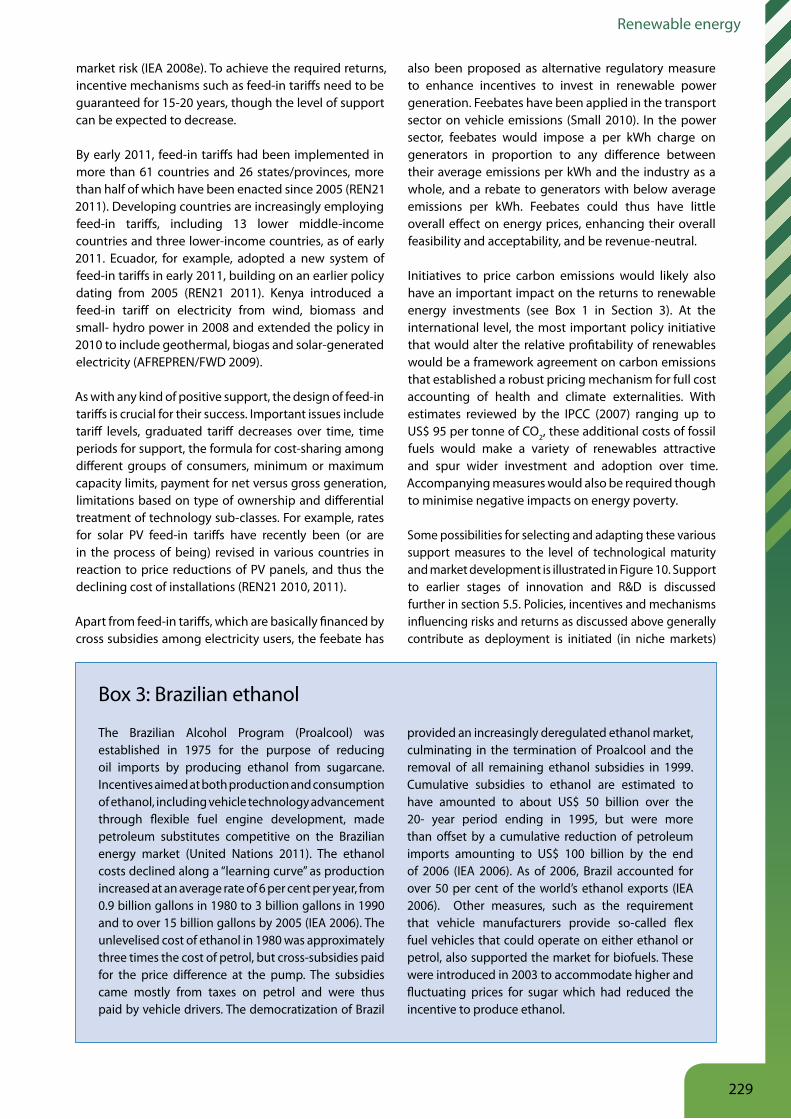
Renewable energy
market risk (IEA 2008e). To achieve the required returns, incentive mechanisms such as feed-in tariffs need to be guaranteed for 15-20 years, though the level of support can be expected to decrease.
By early 2011, feed-in tariffs had been implemented in more than 61 countries and 26 states/provinces, more than half of which have been enacted since 2005 (REN21 2011). Developing countries are increasingly employing feed-in tariffs, including 13 lower middle-income countries and three lower-income countries, as of early 2011. Ecuador, for example, adopted a new system of feed-in tariffs in early 2011, building on an earlier policy dating from 2005 (REN21 2011). Kenya introduced a feed-in tariff on electricity from wind, biomass and small- hydro power in 2008 and extended the policy in 2010 to include geothermal, biogas and solar-generated electricity (AFREPREN/FWD 2009).
As with any kind of positive support, the design of feed-in tariffs is crucial for their success. Important issues include tariff levels, graduated tariff decreases over time, time periods for support, the formula for cost-sharing among different groups of consumers, minimum or maximum capacity limits, payment for net versus gross generation, limitations based on type of ownership and differential treatment of technology sub-classes. For example, rates for solar PV feed-in tariffs have recently been (or are in the process of being) revised in various countries in reaction to price reductions of PV panels, and thus the declining cost of installations (REN21 2010, 2011).
Apart from feed-in tariffs, which are basically financed by cross subsidies among electricity users, the feebate has
also been proposed as alternative regulatory measure to enhance incentives to invest in renewable power generation. Feebates have been applied in the transport sector on vehicle emissions (Small 2010). In the power sector, feebates would impose a per kWh charge on generators in proportion to any difference between their average emissions per kWh and the industry as a whole, and a rebate to generators with below average emissions per kWh. Feebates could thus have little overall effect on energy prices, enhancing their overall feasibility and acceptability, and be revenue-neutral.
Initiatives to price carbon emissions would likely also have an important impact on the returns to renewable energy investments (see Box 1 in Section 3). At the international level, the most important policy initiative that would alter the relative profitability of renewables would be a framework agreement on carbon emissions that established a robust pricing mechanism for full cost accounting of health and climate externalities. With estimates reviewed by the IPCC (2007) ranging up to US$ 95 per tonne of CO2, these additional costs of fossil fuels would make a variety of renewables attractive and spur wider investment and adoption over time. Accompanying measures would also be required though to minimise negative impacts on energy poverty.
Some possibilities for selecting and adapting these various support measures to the level of technological maturity and market development is illustrated in Figure 10. Support to earlier stages of innovation and R&D is discussed further in section 5.5. Policies, incentives and mechanisms influencing risks and returns as discussed above generally contribute as deployment is initiated (in niche markets)
Box 3: Brazilian ethanol
The Brazilian Alcohol Program (Proalcool) was established in 1975 for the purpose of reducing oil imports by producing ethanol from sugarcane. Incentives aimed at both production and consumption of ethanol, including vehicle technology advancement through flexible fuel engine development, made petroleum substitutes competitive on the Brazilian energy market (United Nations 2011). The ethanol costs declined along a “learning curve” as production increased at an average rate of 6 per cent per year, from 0.9 billion gallons in 1980 to 3 billion gallons in 1990 and to over 15 billion gallons by 2005 (IEA 2006). The unlevelised cost of ethanol in 1980 was approximately three times the cost of petrol, but cross-subsidies paid for the price difference at the pump. The subsidies came mostly from taxes on petrol and were thus paid by vehicle drivers. The democratization of Brazil
provided an increasingly deregulated ethanol market, culminating in the termination of Proalcool and the removal of all remaining ethanol subsidies in 1999. Cumulative subsidies to ethanol are estimated to have amounted to about US$ 50 billion over the 20- year period ending in 1995, but were more than offset by a cumulative reduction of petroleum imports amounting to US$ 100 billion by the end of 2006 (IEA 2006). As of 2006, Brazil accounted for over 50 per cent of the world’s ethanol exports (IEA 2006). Other measures, such as the requirement that vehicle manufacturers provide so-called flex fuel vehicles that could operate on either ethanol or petrol, also supported the market for biofuels. These were introduced in 2003 to accommodate higher and fluctuating prices for sugar which had reduced the incentive to produce ethanol.
229
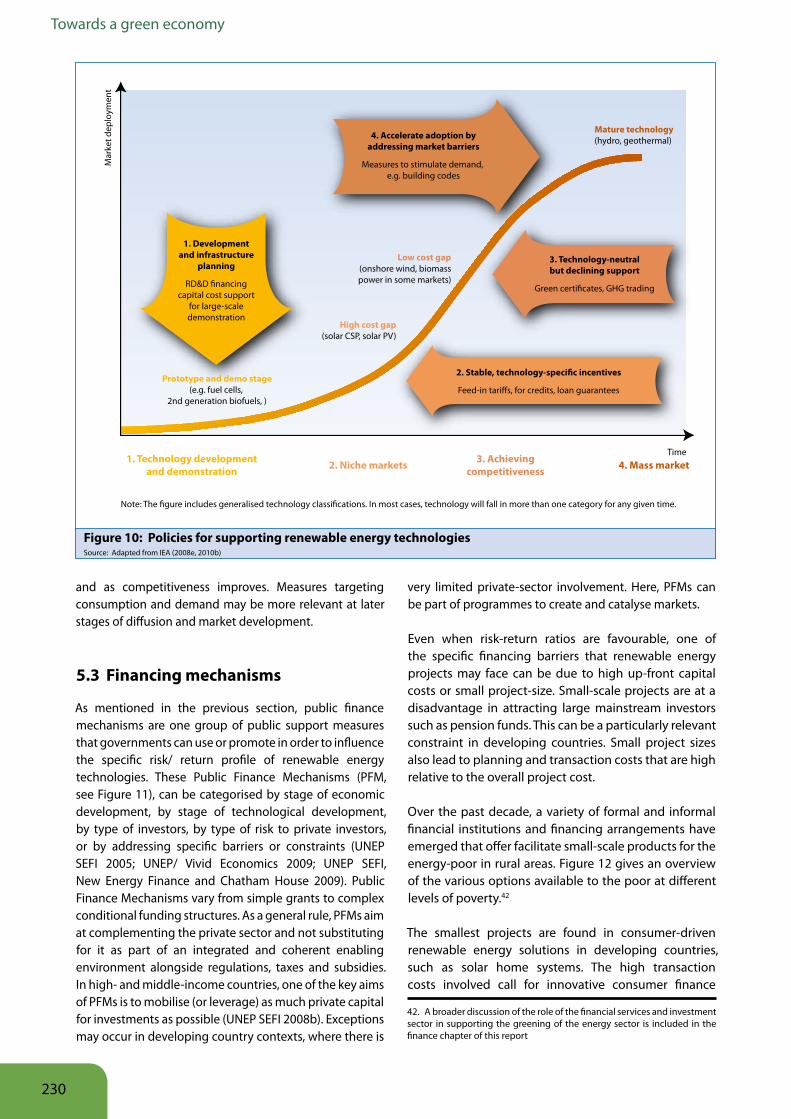
Towards a green economy
and as competitiveness improves. Measures targeting consumption and demand may be more relevant at later stages of diffusion and market development.
5 3 Financing mechanisms
As mentioned in the previous section, public finance mechanisms are one group of public support measures that governments can use or promote in order to influence the specific risk/ return profile of renewable energy technologies. These Public Finance Mechanisms (PFM, see Figure 11), can be categorised by stage of economic development, by stage of technological development, by type of investors, by type of risk to private investors, or by addressing specific barriers or constraints (UNEP SEFI 2005; UNEP/ Vivid Economics 2009; UNEP SEFI, New Energy Finance and Chatham House 2009). Public Finance Mechanisms vary from simple grants to complex conditional funding structures. As a general rule, PFMs aim at complementing the private sector and not substituting for it as part of an integrated and coherent enabling environment alongside regulations, taxes and subsidies. In high- and middle-income countries, one of the key aims of PFMs is to mobilise (or leverage) as much private capital for investments as possible (UNEP SEFI 2008b). Exceptions may occur in developing country contexts, where there is
very limited private-sector involvement. Here, PFMs can be part of programmes to create and catalyse markets.
Even when risk-return ratios are favourable, one of the specific financing barriers that renewable energy projects may face can be due to high up-front capital costs or small project-size. Small-scale projects are at a disadvantage in attracting large mainstream investors such as pension funds. This can be a particularly relevant constraint in developing countries. Small project sizes also lead to planning and transaction costs that are high relative to the overall project cost.
Over the past decade, a variety of formal and informal financial institutions and financing arrangements have emerged that offer facilitate small-scale products for the energy-poor in rural areas. Figure 12 gives an overview of the various options available to the poor at different levels of poverty.42
The smallest projects are found in consumer-driven renewable energy solutions in developing countries, such as solar home systems. The high transaction costs involved call for innovative consumer finance
1. Developmentand infrastructure
planning
RD&D �nancingcapital cost support
for large-scaledemonstration
4. Accelerate adoption byaddressing market barriers
Measures to stimulate demand, e.g. building codes
Mature technology(hydro, geothermal)
Low cost gap(onshore wind, biomasspower in some markets)
High cost gap(solar CSP, solar PV)
Prototype and demo stage(e.g. fuel cells,
2nd generation biofuels, )
3. Achievingcompetitiveness 4. Mass market
Time
Mar
ket d
eplo
ymen
t
2. Niche markets1. Technology developmentand demonstration
3. Technology-neutralbut declining support
Green certi�cates, GHG trading
2. Stable, technology-speci�c incentives
Feed-in tari�s, for credits, loan guarantees
Note: The �gure includes generalised technology classi�cations. In most cases, technology will fall in more than one category for any given time.
Figure 10: Policies for supporting renewable energy technologiesSource: Adapted from IEA (2008e, 2010b)
42. A broader discussion of the role of the financial services and investment sector in supporting the greening of the energy sector is included in the finance chapter of this report
230

Renewable energy
Insurance companies
Commercial/postal banks
FX/remittance
Micro �nance institutions
Saving & credit cooperatives
Community-based organizations
Rotating saving & credit associations
Mor
e fo
rmal
Less
form
al
Very poor Poor Less poor
Stage 1R&D
Stage 2Demonstration
Stage 3Deployment
Stage 4Di�usion
Stage 5Commercial maturity
Guarantees and insurance products/risk mitigation instruments
Public/privateVC funds
R&Dsupport
Grants
Incubators
Credit lines
Project development assistance
Other PFMsPFMs to engage
institutional investors
Loan facilities
Public/private equity funds
Carbon
Soft loansMezzanine debt
Of greatest interest to institutional investors
Figure 12: Illustrative financing options for the poorSource: UNDP (2009)
Figure 11 : Public finance mechanisms across stages of technological developmentSource: UNEP SEFI (2009)
231

Towards a green economy
mechanisms that address the particular needs of rural developing country customers. These mechanisms can make renewables attractive and cost effective for addressing energy poverty in off-grid situations (Box 4).
Beyond private companies and governments, however, bilateral and multilateral development assistance agencies are also expected to scale up funding while collaborating with existing energy programmes and funds43 to administer and distribute resources (IEA 2010d). Engaging developing countries in the global mitigation challenge will require international funding and the agreement to establish the Copenhagen Green Climate Fund at the 2009 UNFCCC conference represents potentially significant progress in this area. Countries producing renewable energy may also benefit from increased revenues from selling emissions credits (through the CDM) or green certificates, and lower risk
5 4 Electricity infrastructure and regulations
The increased use of renewable energy in power generation faces specific barriers due to the demands it makes on existing electricity infrastructure. Electricity generation by wind and solar PV adds variability and lower predictability to the power system, requiring more attention to the design and regulation of energy
systems and markets (Owen 2006; Heal 2009; IEA 2008d). More reserve capacity, storage or increased trade between countries or regions is needed to provide the necessary flexibility to match demand with variability in supply. Smart grids with variable cost pricing and micro-metering is a new area of development with the potential to provide increased demand flexibility and enhance energy efficiency.
The additional investment costs for adapting the distribution and transmission systems, though substantial, should be manageable. For example, the ECF (2009) roadmap 2050 indicates that the investments required to expand the grid and effectively reduce intermittency challenges amount to around 10 per cent of overall investment in electricity generation.
In some situations, vested interests and control of access to the grid by incumbent power companies can pose barriers for independent providers of power from renewable sources. Similarly, oil companies may impede the distribution of biofuels through networks, such as pipelines, that they control. The construction sector may be reluctant to integrate renewable heating and cooling technology in their practices and building codes. Authorities have to be alert to signals from renewable
Box 4: Grameen Shakti programme in Bangladesh
Grameen Shakti (or Grameen Energy in English), founded in 1996, provides electrification to rural communities in Bangladesh through a market-based approach: micro-credit. The experience of Grameen Shakti provides an example of successful entrepreneurship combined with effective energy policy. Capitalising on the network and experience of the Grameen Bank, Grameen Shakti provides soft credits through different financial packages to make solar-home systems (SHSs) available and affordable to rural populations. By creating a market for solar energy and providing multiple advantages over kerosene, Grameen Shakti succeeded in installing over 320,000 SHSs by December 2009.
One aspect that has been essential to the success of the program has been the creation of partnerships with indigenous organizations that have succeeded in cutting programme costs and increasing business development (United Nations 2011). Government financial and policy support provided
the coordination necessary for safe investments in renewable energy. Through effective policy guidelines, the industry had a greater potential for success and future growth (IPCC 2011). Grameen Shakti has also installed numerous improved cooking stoves and biogas plants that contribute to the reduction of woody biomass use and, in turn, decrease indoor pollution, while biogas technology further helps with sustainable waste management.
Grameen Shakti aims to install over 1 million SHSs by 2015, and simultaneously provide the necessary maintenance, while training the necessary technicians and users, thereby generating local employment, and generating social value through stakeholder engagement. Grameen Shakti demonstrates the potential that can be mobilised to reduce energy poverty efficiently, while also contributing to mitigate climate change, with innovative financing and business models in partnership with public support (Wang et al. 2011).
43. Such as the Climate Investment Funds, the Global Environment Facility and GTZ’s Energising Development (IEA 2010d).
232
Renewable energy
energy companies and move quickly to address such market entry barriers.
Regulations may thus be needed to promote the types of investments in infrastructure necessary for further development of electricity from renewable sources. In Europe, for example, the 2009 Renewable Energy Directive requires EU countries to provide acceleration of authorisation procedures for grid infrastructure, including coordinated approval of grid infrastructure with administrative and planning procedures.
Beyond regulations on electricity infrastructure, governments can establish obligations for renewable energy consumption or production more generally (as discussed in section 5.2). In an obligation system – also referred to as a renewables portfolio standard (RPS) or renewable energy target – a minimum amount or proportion from eligible renewable energy sources is prescribed. The obligation is typically imposed on consumption, often through supply or distribution companies. The implementation of an obligation system usually involves a penalty for non-compliance to ensure that the obligated parties meet their renewable energy purchase obligations (Gillingham and Sweeney 2010).
Obligations for renewables, however, can only be implemented when supply has developed sufficiently to ensure price competition among suppliers. They are typically used for mature technology and may be the successor of fiscal incentives or subsidies (see Figure 10). For investors, the perceived policy risks of obligations are smaller than those of subsidies, since they are not subject to government budget decisions. As of early 2011, there were 10 national and at least 30 state/provincial/regional jurisdictions with RPS policies (REN21 2011). Most of these require renewable power shares between 5 and 20 per cent.
5 5 Innovation and R&D
The technological development of renewable energy faces barriers due to the market failures inherent in innovation. Knowledge spillovers from research and development activities to create better products at lower costs benefit both consumers and other enterprises, but the potential innovator may not receive sufficient share of these to justify the investments (Gillingham and Sweeney 2010). Furthermore, new technologies can be intuitive and easily learned, which contributes to cost reductions, which others are also able to apply. Both situations result in a general under-investment along all stages of the innovation chain.
There is little systematic evidence quantifying the extent of this market failure in renewables and thus to
what extent investment and innovation in this sector would be higher if the market failure were eliminated. Nonetheless, the costs of some of the important technologies for renewable energy have declined steeply as installed capacity has increased, as seen above in section 3.3 in the discussion of learning effects for solar PV (IPCC 2011). These learning effects represent an important spillover benefit, as the cost reductions are generated and disseminated throughout the industry relatively “free-of-charge” (Jamasb 2007).
To achieve a socially optimal rate of innovation, therefore, policy support is needed (Tomlinson et al. 2008; Grubb 2004). In particular, public support for R&D is essential for supporting high-risk, fundamental research with a long-term perspective, whilst the private sector tends to focus on near-competitive technologies and shorter-term demonstration projects.
The public sector can support research institutes and academic institutions, fund research programmes targeted at specific technologies, and supply grants or use other means support to private-sector R&D efforts. Energy research has been found to be most effective when targeted R&D programmes, e.g. “technology push” projects, are joined seamlessly with “market pull” policies on deployment (IEA 2010b; IPCC 2011; United Nations 2011).
Research and development for the energy sector in the 28 IEA member countries has recently shown signs of growth, having been stagnant for some time. In 2006, when the share of renewables was just above 10 per cent, R&D spending in real terms was only slightly above levels registered 30 years earlier (IEA 2008e). In 2009, R&D and deployment in renewable energy by governments and business totalled US$ 24.6 billion (UNEP SEFI 2010). Government support to R&D increased in that year by 50 per cent, accounting for US$ 9.7 billion. Corporate spending, at US$ 14.9 billion, declined somewhat, reflecting the economic recession. There are also many differences between countries in terms of public R&D expenditure (see Figure 13).
In developing countries, R&D for renewables may warrant specific attention, although there are many positive signs already. In many cases, local technical capabilities for developing or adapting technologies are virtually absent. The focus here should be on creating capacity to facilitate technology transfer, adapt technologies to local market conditions and support private-sector players that install, manufacture, operate and maintain the technologies. At the 2010 UNFCCC, COP16 in Cancun, Mexico countries agreed to establish a Climate Technology Mechanism. Its purpose is to accelerate the development and transfer of climate friendly technologies, especially to developing countries,
233
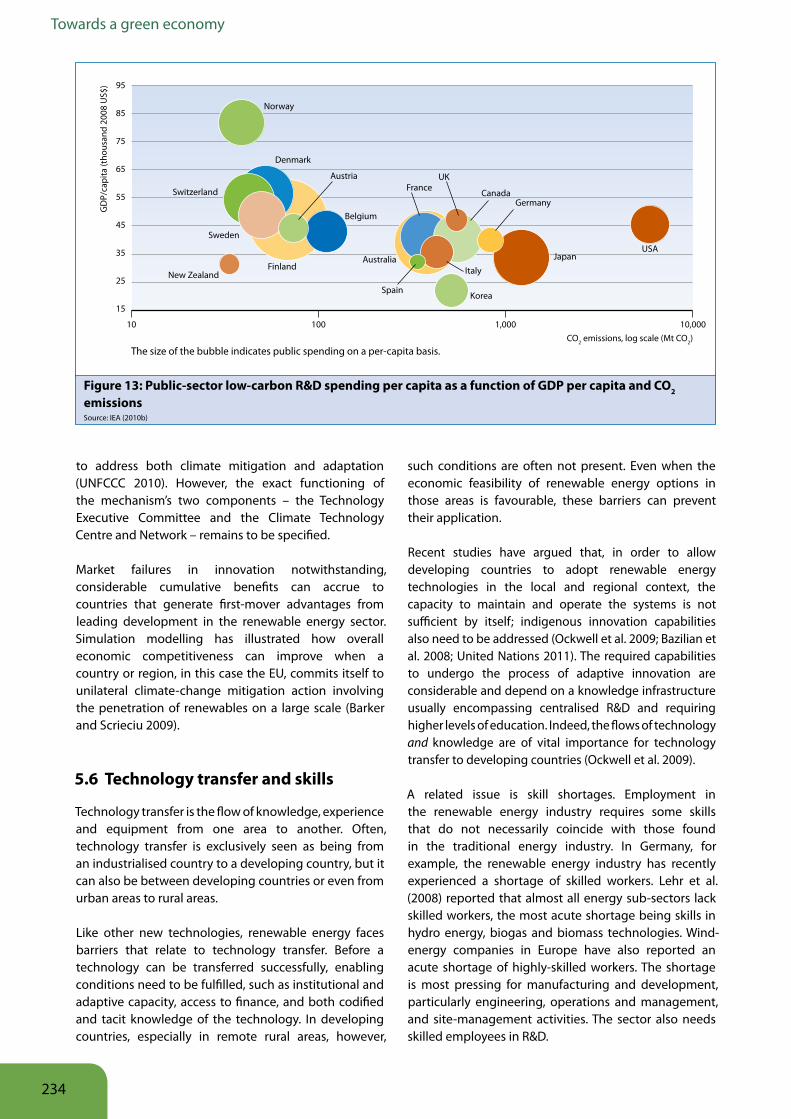
Towards a green economy
to address both climate mitigation and adaptation (UNFCCC 2010). However, the exact functioning of the mechanism’s two components – the Technology Executive Committee and the Climate Technology Centre and Network – remains to be specified.
Market failures in innovation notwithstanding, considerable cumulative benefits can accrue to countries that generate first-mover advantages from leading development in the renewable energy sector. Simulation modelling has illustrated how overall economic competitiveness can improve when a country or region, in this case the EU, commits itself to unilateral climate-change mitigation action involving the penetration of renewables on a large scale (Barker and Scrieciu 2009).
5 6 Technology transfer and skills
Technology transfer is the flow of knowledge, experience and equipment from one area to another. Often, technology transfer is exclusively seen as being from an industrialised country to a developing country, but it can also be between developing countries or even from urban areas to rural areas.
Like other new technologies, renewable energy faces barriers that relate to technology transfer. Before a technology can be transferred successfully, enabling conditions need to be fulfilled, such as institutional and adaptive capacity, access to finance, and both codified and tacit knowledge of the technology. In developing countries, especially in remote rural areas, however,
such conditions are often not present. Even when the economic feasibility of renewable energy options in those areas is favourable, these barriers can prevent their application.
Recent studies have argued that, in order to allow developing countries to adopt renewable energy technologies in the local and regional context, the capacity to maintain and operate the systems is not sufficient by itself; indigenous innovation capabilities also need to be addressed (Ockwell et al. 2009; Bazilian et al. 2008; United Nations 2011). The required capabilities to undergo the process of adaptive innovation are considerable and depend on a knowledge infrastructure usually encompassing centralised R&D and requiring higher levels of education. Indeed, the flows of technology and knowledge are of vital importance for technology transfer to developing countries (Ockwell et al. 2009).
A related issue is skill shortages. Employment in the renewable energy industry requires some skills that do not necessarily coincide with those found in the traditional energy industry. In Germany, for example, the renewable energy industry has recently experienced a shortage of skilled workers. Lehr et al. (2008) reported that almost all energy sub-sectors lack skilled workers, the most acute shortage being skills in hydro energy, biogas and biomass technologies. Wind-energy companies in Europe have also reported an acute shortage of highly-skilled workers. The shortage is most pressing for manufacturing and development, particularly engineering, operations and management, and site-management activities. The sector also needs skilled employees in R&D.
95
85
75
65
55
45
35
25
15
GD
P/ca
pita
(tho
usan
d 20
08 U
S$)
CO2 emissions, log scale (Mt CO2)10 100 1,000 10,000
Norway
Denmark
Belgium
Switzerland
Sweden
FinlandNew Zealand
Austria
Australia
Spain
FranceUK
CanadaGermany
Italy
Korea
JapanUSA
The size of the bubble indicates public spending on a per-capita basis.
Figure 13: Public-sector low-carbon R&D spending per capita as a function of GDP per capita and CO2 emissionsSource: IEA (2010b)
234
Renewable energy
5 7 Sustainability standards
Renewable energy is not synonymous with sustainability. The term renewable refers largely to the naturally regenerative nature of the energy source, whereas sustainability has a broader scope, including economic, social and environmental considerations. Although renewable energy technologies are generally perceived as being more sustainable compared to nonrenewable sources, due to smaller environmental impacts, there is still a need to develop agreed standards to reduce and manage these impacts. The environmental and social impacts of large hydropower reservoirs are one prominent example, including their potential to release carbon dioxide and methane from decaying biomass in tropical locations. Concern about minimizing impacts has led to the development of policy principles and guidelines under the coordination of the World Commission on Dams. Biofuels are another example, as their production in some circumstances has been associated with unsustainable land use and land-use change, with potential consequences for GHG balances, biodiversity and food security; at the same time, there is also a risk of excessive water use and contamination (UNEP 2009).44 Different renewable technologies may, therefore, rank differently according to
varying sustainability criteria. Methodologies to quantify effects and trade-offs are still under development.45
For biofuels, the sustainability challenge is slowly being addressed on the project and policy level. National biofuels policy, regulatory frameworks, international standards, and environmental impact assessment methodologies increasingly incorporate sustainability criteria and standards. For example, sustainability criteria for biofuels and bio-liquids were developed and adopted in the EU Renewable Energy Sources Directive (EU Directive 2009/28/EC), to be implemented by member states. Certification schemes can be used for validating the fulfillment of sustainability criteria. However, many countries lack the institutional capacity to effectively implement and enforce certification schemes, inhibiting the development and adoption of sustainability standards for biofuels.
Another challenge is balancing stringency and flexibility, as manifested in the introduction of sustainability standards for biofuels in the EU, which has led to trade disputes within the WTO. Overly rigid standards would be a disincentive for producers to enter the market and may limit investment, particularly in developing countries (Devereaux and Lee 2009). Policy makers, therefore, need to balance long-term sustainability concerns with shorter-term interests when promoting renewable energy.
44. Impacts on GHG balances vary depending on feedstock, location, input and production methods, previous land use, conversion technology, all throughout the life-cycle (UNEP 2009).
45. See for example ongoing climate policy planning guidance work by UNEP: http://www.MCA4climate.info.
235

Towards a green economy
6 ConclusionsThe challenges posed to the global community and national governments, in terms of energy security, climate change, health impacts, and energy poverty are pressing, making the greening of the energy sector an imperative. The existing challenges are exacerbated by the expected growth in the global demand for energy, as population and incomes rise. Shifting from fossil fuels to renewable energy plays a critical role in greening the energy sector, along with other changes, in particular raising energy efficiency.
The cost effectiveness of renewable energy technologies has evolved considerably in recent decades. Many renewable energy technologies are maturing rapidly and their costs becoming competitive with fossil fuel alternatives. Consequently, the investments in deploying renewable energy increased dramatically in the last decade.
These developments have been driven by a range of policies. National targets for renewable energy are spreading. A number of governments have supported innovation to help reduce costs, while many more are increasingly putting in place regulations, fiscal incentives and financing mechanisms that mitigate risks and increase returns to investing in renewable energy. At the international level, the formal creation in 2011 of the International Renewable Energy Agency (IRENA) indicates a willingness of governments to work collaboratively in expanding the role of renewable energy.
Despite encouraging progress, a number of roadblocks still remain on the route towards a green energy sector. Most importantly, the overall incentive framework under which the energy sector operates has not yet been reconfigured to consistently support the development and deployment of renewable energy technologies and a managed phasing-out of emissions from fossil fuel sources. This is due to both vested interests and an energy system, comprised of both hardware, such as electricity infrastructure, and software, in the form of organisations and institutions, that are locked in to supporting conventional energy technologies. Although developing countries may have fewer cumulative investments in conventional energy systems, they face financial constraints and also a shortage of institutional and human capacity to acquire and manage new technologies.
To reduce such roadblocks, policymakers need to take an integrated approach that supports various stages of the development and diffusion of renewable energy technologies within an overall strategy that also addresses the rest of the energy system, on both supply and demand sides. In so doing, there is considerable scope for governments to work with market forces to create a level playing-field for the further growth of renewable energy. Phasing out subsidies for fossil fuels and pricing in health and environmental externalities from fossil-fuel combustion can speed up the transformation of the energy sector, though attention needs to be paid to impacts on low-income groups.
Increasing investments in renewable energy, as part of a green economy strategy spanning all major sectors, can contribute to reducing health and environmental impacts from energy production and use, while ensuring the basis for long-term economic growth. Such a strategy is based on the substitution of fossil fuel energy with renewable energy, savings from energy efficiency in manufacturing, buildings and construction, and transport, and behavioural change. Such an integrated strategy can increase national energy security and reduce carbon emissions while providing new employment opportunities that may, in global terms, more than compensate for jobs that disappear. This, however, should not prevent policymakers from recognising that in specific countries, depending on the extent to which fossil-fuel subsidies are phased out and negative externalities addressed, there could be net declines in employment, at least in the short term. The focus should be on specific countries and on practical ways of building capacity and skills to facilitate a transition to a green economy.
In order also to play a role as part of an integrated strategy to reduce energy poverty, specific aspects of renewable energy development needs to be tailored to the circumstances in rural areas where the majority of the poor in developing countries live. Mini-grids and off-grids may provide a cost-effective means of delivering electricity to the poor, while also reducing growth in GHG emissions. This requires additional financing flows, as well as continued development of new financing models.
236
Renewable energy
ReferencesAFREPREN/FWD Energy, Environment and Development Network
for Africa. (2009). The Role of Feed-in Tariff Policy in Renewable Energy Development in Developing Countries. September 2009.
AGECC. (2010). Energy for a Sustainable Future, Summary Report and Recommendations. The Secretary-General’s Advisory Group on Energy and Climate Change (AGECC). Available at: http://www.un-e n e rg y. o rg / p u b l i c a t i o n s / 5 5 8 - a g e cc - re p o r t - e n e rg y - fo r - a -sustainable-future
Agence Nationale pour la Maîtrise de l’Énergie. (2009). Plan Solaire Tunisien, Ministère de l’Industrie, de l’Energie et des PME, Government of Tunisia, Tunis.
Barker, T. and Scrieciu, S.S. (2009). “Unilateral Climate Change Mitigation, Carbon Leakage and Competitiveness: an Application to the European Union”. International Journal of Global Warming 1(4): 405-417.
Barreto, L. and Klaassen, G. (2004). Emission trading and the role of learning-by-doing spillovers in the “bottom-up” energy-system ERIS model. International Journal of Energy Technology and Policy, 2(1), 70–95.
Bazilian, M., de Coninck, H., Radka, M., Nakhooda, S., Boyd, W., MacGill, I., Amin, A.-L., von Malmborg, F., Uosukainen, J., and Bradley. R. (2008). Considering technology within the UN climate change negotiations. Energy Research Centre of the Netherlands (ECN), ECN-E--08-077, Petten, Netherlands.
Blyth, W. (2010). “The economics of transition in the power sector”, Information paper, International Energy Agency (IEA), Paris, January 2010.
Devereaux, C. and Lee, H. (2009). Biofuels and Certification: A Workshop at Harvard Kennedy School. Discussion Paper 2009-07, Belfer Center for Science and International Affairs, June 2009, Cambridge, M.A.
DLR-ISI. (2006). External costs of electricity generation from renewable energies compared to electricity generation from fossil energy sources, German Aerospace Centre (DLR) and the Fraunhofer Institute for System and Innovation Research (ISI).
ECF. (2009). Roadmap 2050, A practical guide to a prosperous low carbon Europe, Technical analysis. European Climate Foundation (ECF), The Hague, The Netherlands.
Ecofys. (2008). Policy Instrument Design to Reduce Financing Costs in Renewable Energy Technology Projects. Report for the IEA Implementing Agreement on Renewable Energy Technology Deployment (RETD), Utrecht, the Netherlands, October. Available at: www.ecofys.com/com/publications/documents/RETD_PID0810_Main.pdf
EcoSecurities Consulting. (2009). Assigning Carbon Price Estimates to Alternative Policy Scenarios, January 30, 2009.
Edmonds, J., Clarke, L., Lurz, J. and Wise, M. (2008). “Stabilizing CO2 Concentrations with Incomplete International Cooperation.” Climate Policy 8 (4): 355-76).
EEA. (2008). “EN35 - External costs of electricity production”, European Environment Agency (EEA). Available at: http://www.eea. europa.eu/data-and-maps/indicators/en35-external-costs-of-electricity-production-1/en35.
EIA. (2011). Electric Power Monthly with data for December 2010, US Energy Information Administration (EIA), EIA report released March 11, 2011, Washington, D.C.
ELI. (2009). Estimating U.S. Government Subsidies to Energy Sources: 2002-2008, Environmental Law Institute (ELI), Washington, D.C.
Epstein, P.R., Buonocore, J.J., Eckerle, K., Hendryx, M., Stout, B.M., Heinberg, R., Clapp, R.W., May,B., Reinhart, N.L., Ahern, M.M., Doshi, S.K. and Glustrom, L. (2011). “Full cost accounting for the life cycle of coal”, in Ecological Economics Reviews. Robert Costanza, Karin Limburg & Ida Kubiszewski, Eds. Ann. N.Y. Acad. Sci. 1219: 73–98.
ESMAP. (2008a). Coping with Oil Price Volatility. Energy Security, Energy Sector Management Assistance Program (ESMAP), World Bank, Washington D.C.
ESMAP. (2008b). Beyond the Grid: Innovative Programmes in Bangladesh and Sri Lanka. Energy Sector Management Assistance Program (ESMAP) Knowledge Exchange Series. Available at: http:// www.esmap.org/esmap/sites/esmap.org/files/KES10_SriLanka_Electricity%20Beyond%20the%20Grid.pdf.
European Commission. (2008). Energy Sources, Production Costs and Performance of Technologies for Power Generation, Heating and Transport, Commission Staff Working Document accompanying the Communication from the Commission to the European Parliament, the Council, the European Economic and Social Committee and the Committee of the Regions, Second Strategic Energy Review, An EU Energy Security and Solidarity Action Plan, SEC(2008)2872.
Gillingham, K. and Sweeney, J. (2010): “Market Failure and the Structure of Externalities”. In Harnessing Renewable Energy in Electric Power Systems: Theory, Practice, Policy, ed. Boaz M., A.J. Padilla, and R. Schmalensee, pp. 69-92, Earthscan Publications Ltd., London, U.K.
GNESD. (2007). Reaching the Millennium Development Goals and beyond – access to modern forms of energy as a prerequisite. Global Network on Energy for Sustainable Development, Roskilde.
GNESD. (2010) Energy, Climate Change and Poverty Alleviation, Global Network on Energy for Sustainable Development (GNESD) Policy Paper prepared by AFREPREN, ENDA-TM and Fundacion Bariloche.
Greenpeace and European Renewable Energy Council (EREC). (2010) Energy [r]evolution: a sustainable world energy outlook, European Renewable Energy Council, Amsterdam. Available at: http://www.erec.org/index.php?id=139.
Grubb, M. (2004). “Technology Innovation and Climate Change Policy: an overview of issues and options”, Keio Economic Studies 41(2): 103-132.
GSI. (2009). Building Fossil-Fuel Subsidy Reform - Have we got all the blocks? Global Subsidies Initiative (GSI) Policy Brief, Geneva, Switzerland.
GSI. (2010). Relative Subsidies to Energy Sources: GSI estimates, Global Subsidies Initiative (GSI), Geneva, Switzerland.
Heal, G. (2009). “The Economics of Renewable Energy”. National Bureau of Economic Research (NBER) Working Paper No. 15081, Cambridge, M.A., June 2009.
HRS-MI. (2009). Climate Policy and Energy – Intensive Manufacturing: the Competitiveness Impacts of American Energy and Security Act of 2009. High Road Strategies and Millennium Institute, Arlington, V.A.
HSBC. (2009). A Climate for Recovery The Colour of Stimulus Goes Green, HSBC Global Research, February 2009.
IEA. (2006) The Energy Situation in Brazil: An Overview, International Energy Agency, OECD Publishing, Paris.
IEA. (2008a). Renewables Information 2008 edition, International Energy Agency, OECD Publishing, Paris.
IEA. (2008b). World Energy Outlook 2008, International Energy Agency, OECD Publishing, Paris.
IEA. (2008c). IEA Energy Technology Perspectives 2008, International Energy Agency, OECD Publishing, Paris.
IEA. (2008d). Empowering Variable Renewables: Options for Variable Electricity Systems, International Energy Agency, OECD Publishing, Paris.
IEA. (2008e). Deploying Renewables – Principles for Effective Policies. Available at: http://www.iea.org/textbase/nppdf/ free/2008/DeployingRenewables2008.pdf.
IEA. (2009a). World Energy Outlook 2009, International Energy Agency, OECD Publishing, Paris.
IEA. (2009b). The impact of the financial and economic crisis on global energy investment. Paris.
IEA. (2010a). Energy Poverty: How to make modern energy access universal? Special Excerpt from IEA World Energy Outlook 2010, by International Energy Agency (IEA), Organisation for Economic Co-operation and Development (OECD), United Nations Industrial Development Organization (UNIDO), and United Nations Development Programme (UNDP), 2010. Available at: http://www. iea.org/speech/2010/jones/weo_poverty_chapter.pdf.
237
Towards a green economy
IEA. (2010b). Energy Technology Perspectives 2010, International Energy Agency, OECD Publishing, Paris.
IEA. (2010c). Projected Costs of Generating Electricity 2010, International Energy Agency, OECD Publishing, Paris.
IEA. (2010d): World Energy Outlook 2010, International Energy Agency, OECD Publishing, Paris.
IEA, OPEC, OECD and World Bank. (2010). Analysis of the Scope of Energy Subsidies and Suggestions for the G-20 initiative, joint report prepared for submission to the G20 Summit Meeting Toronto (Canada), 26-27 June 2010.
IIASA. (2009). Emissions of Air Pollutants for the World Energy Outlook 2009 Energy Scenarios Final Report, (report prepared for the International Energy Agency using the GAINS model), IIASA, Laxenberg. Available at www.worldenergyoutlook.org
IIED. (2009). Assessing the Costs of Adaptation to Climate Change: A Review of the UNFCCC and Other Recent Estimates, International Institute for Environment and Development and Grantham Institute for Climate Change, London.
Institute for Labor Studies and Ministry of Human Resources and Social Security, China. (2010). Study on Green Employment in China. International Labor Organization (ILO), March 2010.
IPCC. (2007). Climate Change 2007: Mitigation of Climate Change. Contribution of Working Group III to the Fourth Assessment Report of the Intergovernmental Panel on Climate Change (IPCC). Edited by B. Metz, O.R. Davidson, P.R. Bosch, R. Dave and L.A. Meyer, Cambridge University Press, Cambridge, UK and New York, USA.
IPCC. (2008). Scoping Meeting on Renewable Energy Sources, Proceedings, Presented in Luebeck, Germany, 20-25 January 2008, 59-80. Available at: http://www.iea-gia.org/documentsFridleifsson etalIPCCGeothermalpaper2008FinalRybach20May08_000.pdf.
IPCC. (2011). Special Report on Renewable Energy Sources and Climate Change Mitigation. Working Group III – Mitigation of Climate Change. Edited by O. Edenhofer, R. Pichs-Madruga, and Y. Sokoma. Published for the Intergovernmental Panel on Climate Change.
ITIF. (2009). Rising tigers, sleeping giant: Asian nations set to dominate the clean energy race by outinvesting the United States, Information Technology and Innovation Foundation (ITIF) & The Breakthrough Institute.
Jamasb, T. (2007). Technical change theory and learning curves: patterns of progress in electricity generation technologies. Energy Journal 28: 51-71.
Junginger, M., Lako P., Lensink, S., Sark, W. van and Weiss, M. (2008). Technological learning in the energy sector, Utrecht University and Energy Centre of the Netherlands (ECN), Report No. 500102 017. Study performed within the framework of the Netherlands Research Programme on Scientific Assessment and Policy Analysis for Climate Change (WAB). Available at: http://www.rivm.nl/bibliotheek/rapporten/500102017.pdf
Karekezi, S., Lata, K. and Coelho, S.T. (2004). “Traditional Biomass Energy: Improving its Use and Moving to Modern Energy Use”, thematic background paper for the International Conference for Renewable Energies, Bonn 2004. Availabe at: http://www.ren21.n e t / Po r t a l s / 9 7 / d o c u m e n t s / B o n n % 2 0 2 0 0 4 % 2 0 - % 2 0 T B P /Traditional%20Biomass%20Energy.pdf
Krey, V. and Clarke, L. (2011). “Role of renewable energy in climate mitigation: a synthesis of recent scenarios”, Climate Policy, 11, 1-28.
Kypreos, S., and Bahn, O. (2003). “A MERGE model with endogenous technological progress”, Environmental Modelling and Assessment, 8(3), 249–259.
Lehr, U., Nitsch, J., Kratzat, M., Lutz, C. and Edlerd, D. (2008): “Renewable energy and employment in Germany”, Energy Policy, 36, 108-117.
Llera Sastresa, E., Aranda Usón, A.,Zabalza Bribián, I. and Scarpellini, S. (2010). “Local impact of renewable on employment: assessment methodology and case study,” Renewable and Sustainable Energy Review, 14 (2010), 689-690.
McDonald, A. and Schrattenholzer, L. (2002). “Learning curves and technology assessment”. International Journal of Technology Management. 23 (7/8), 718-745. Reprinted as RP-03-002. International Institute for Applied Systems Analysis (IIASA), Laxenburg, Austria. Available at: http://www.iiasa.ac.at/cgi-bin/ pubsrch?RR03002.
Messner, S. (1997). “Endogenized technological learning in an energy systems model”, Journal of Evolutionary Economics, 7(3), 291-313.
Modi, V., McDade, S., Lallement, D. and Saghir, J. (2006). Energy and the Millennium Development Goals. Energy Sector Management Assistance Programme, United Nations Development Programme, UN Millennium Project, and World Bank, New York. Available at: http://www.unmillenniumproject.org/documents/MP_Energy_Low_Res.pdf
NRC. (2010). Hidden Costs of Energy: Unpriced Consequences of Energy Production and Use. National Research Council (NRC), Washington, D.C.
NREL. (1997). Dollars from Sense: The Economic Benefits of Renewable Energy. National Renewable Energy Laboratory (NREL) and U.S. Department of Energy.
Ockwell, D.G., Watson, J., Mallett, A., Haum, R., MacKerron, G. and Verbeken, A.-M. (2009). Scoping note on the difficulties developing countries face in accessing markets for eco-innovation, Commissioned and published by Organization for Economic Development and Co-operation (OECD) Environment Directorate, Paris.
Owen, A.D. (2006). “Renewable energy: externality costs as market barriers.” Energy Policy 34: 632-642.
Pew Charitable Trusts. (2010). Who’s Winning the Clean Energy Race? Washington D.C.
REN21. (2009). Renewables Global Status Report 2009 Update, Renewable Energy Policy Network for the 21st Century (REN21), Paris, June 2009.
REN21. (2010). Renewables 2010 Global Status Report, Renewable Energy Policy Network for the 21st Century (REN21), Paris, July 2010.
REN21. (2011). Renewables 2011 Global Status Report, Renewable Energy Policy Network for the 21st Century (REN21), Paris, July 2011.
Seebregts, A. J., Kram, T., Schaeffer, G.J. and Bos, A.J.M. (1999). Modelling technological progress in a MARKAL model for Western Europe including clusters of technologies. Netherlands Energy Research Foundation (ECN).
Small, K. A. (2010). Energy Policies for Passenger Transportation: A Comparison of Costs and Effectiveness. Discussion paper, University of California, Irvine.
Stern, N.H. (2006). Economics of Climate Change: The Stern Review, Cambridge, UK, Cambridge University Press.
Tomlinson, S., Zorlu, P. and Langley, C. (2008). Innovation and. Technology Transfer: Framework for a Global Climate Deal, E3G/ Chatham House, London.
UNCTAD. (2006). Meeting trade and development challenges in an era of high and volatile energy prices: Oil and gas in LDCs and African countries, Report by the UNCTAD Secretariat, Geneva.
UNDP. (2007). Energizing the Least developed Countries to achieve the Millennium Development Goals: The Challenges and Opportunities of Globalization, Issues paper prepared for UN Ministerial Conference of the Least Developed Countries, “Making Globalization work for the LDCs”, Istanbul 9-11 July, 2007.
UNDP and WHO. (2008). The Energy Access Situation in Developing Countries, A Review Focusing On the LDCs and Sub-Saharan Africa, United Nations Development Programme (UNDP), .New York.
UNEP. (2009). Towards Sustainable Production and Use of Resources: Assessing Biofuels, United Nations Environment Programme (UNEP), Paris.
UNEP. (2010a). Advancing the Biodiversity Agenda: A UN System-wide Contribution, United Nations Environment Programme (UNEP), Nairobi.
UNEP. (2010b). The Emissions Gap Report: Are the Copenhagen Accord Pledges Sufficient to Limit Global Warming to 2ºC or 1.5ºC? A preliminary assessment. United Nations Environment Programme (UNEP), Nairobi.
UNEP, ILO, IOE and ITUC. (2008). Green Jobs: Towards Decent Work in a Sustainable, Low Carbon World, United Nations Office at Nairobi (UNON), Nairobi.
UNEP SEFI. (2005). Public finance mechanisms to catalyze sustainable energy growth, United Nations Environment Programme (UNEP) UNEP Sustainable Energy Finance Initiative (SEFI) and BASE, Paris.
238

Renewable energy
UNEP SEFI. (2008a). Global Trends in Sustainable Energy Investment 2008. United Nations Environment Programme (UNEP) Sustainable Energy Finance Initiative (SEFI) and New Energy Finance: Paris.
UNEP SEFI. (2008b). Public Finance Mechanisms to Mobilise Investment in Climate Change Mitigation. United Nations Environment Programme (UNEP) Sustainable Energy Finance Initiative (SEFI), Paris.
UNEP SEFI. (2009). Global Trends in Sustainable Energy Investment 2009. United Nations Environment Programme (UNEP) UNEP Sustainable Energy Finance Initiative (SEFI) and New Energy Finance, Paris.
UNEP SEFI. (2010). Global Trends in Sustainable Energy Investment 2010. United Nations Environment Programme (UNEP) UNEP Sustainable Energy Finance Initiative (SEFI) and Bloomberg New Energy Finance, Paris.
UNEP SEFI. (2011). Global Trends in Renewable Energy Investment 2011. United Nations Environment Programme (UNEP) UNEP Sustainable Energy Finance Initiative (SEFI) and Bloomberg New Energy Finance, Paris.
UNEP SEFI, New Energy Finance and Chatham House. (2009). Private Financing of Renewable Energy: A Guide for Policymakers. United Nations Environment Programme (UNEP) UNEP Sustainable Energy Finance Initiative (SEFI), Paris; New Energy Finance, London; Chatham House, London.
UNEP/Vivid Economics. (2009). Catalysing Low Carbon Growth in Developing Economies: public finance mechanisms to scale up private sector investment in climate solutions, UNEP, Paris.
UNEP and WMO. (2011). Integrated Assessment of Black Carbon and Tropospheric Ozone: Summary for Decision Makers. United Nations Environment Programme (UNEP), Nairobi; World Meteorological Organization (WMO), Geneva.
UNFCCC. (2009). Recommendations on future financing options for enhancing the development, deployment, diffusion and transfer of technologies under the Convention, Report by the Chair of the Export Group on Technology Transfer (EGTT ), FCCC/SB/2009/2, Bonn, Germany.
UNFCCC. (2010). Outcome of the work of the Ad Hoc Working Group on long-term Cooperative Action under the Convention. United Nations Framework Convention on Climate Change (UNFCCC), 16th Conference of the Parties, Cancun, Mexico.
United Nations. (2011). World Economic and Social Survey 2011: The Great Green Technological Transformation, United Nations Department of Economic and Social Affairs (UN/DESA), New York.
Victor, D. (2009). Untold billions: fossil-fuel subsidies, their impacts and the path to reform, Global Subsidies Initiative (GSI) Paper GSI, Geneva, Switzerland.
Wang, L., Bandyopadhyay, S., Cosgrove-Davies, M. and Samad, H. (2011). Quantifying Carbon and Distributional Benefits of Solar Home System Programs in Bangladesh, Policy Research Working Paper 5545, The World Bank, Environment Department, Washington, D.C.. Available at: http://www-wds.worldbank.org/servlet/WDSContentServer/WDSP/IB/2011/01/24/000158349_20110124114152/Rendered/PDF/WPS5545.pdf.
Wei, M., Patadia, S. and Kammen, D. (2010). “Putting renewables and energy efficiency to work: How many jobs can the clean energy industry generate in the US?” Energy Policy 38:919-931.
WEF. (2010). Green Investing 2010: Policy Mechanisms to Bridge the Public Financing Gap, World Economic Forum (WEF).
WHO. (2006). Fuel for life: household energy and health. World Health Organization, Geneva. Available at: http://www.who.int/ indoorair/publications/fuelforlife/.
WHO. (2009). “The Poor man’s fuel. The continued use of paraffin for domestic energy requirements in low income households” Bulletin of the World Health Organization; 87(9), doi: 10.1590/ S0042-96862009000900014.
World Bank. (2009). “Africa’s Development in a Changing Climate- Key policy advice from World Development Report 2010 and Making Development Climate Resilient: A World Bank Strategy for Sub-Saharan Africa”. Available at: http://siteresources.worldbank. org/INT WDR2010/R esources/5287678-1252586925350/Africa- WDR-2010-booklet.pdf
WWEA. (2010). World Wind Energy Report 2009. World Wind Energy Association (WWEA), Bonn.
239
Related Documents