RENAL FUNCTION IN THE PRETERM NEONATE AND THE NEWBORN RABBIT (DE NIERFUNKTIE VAN DE PRETERME PASGEBORENE EN HET PASGEBOREN KONIJN) PROEFSCHRIFT ter verkrijging van de graad van Doctor aan de Erasmus Universiteit Rotterdam op gezag van de rector magnificus Pro£ Dr. A.H.G. Rinnooy Kan en volgens besluit van het College van Dekanen. De openbare verdediging zal plaatsvinden op vrijdag 27 november 1987 om 14.00 uur door ALBERTUS JACOBUS VANDER HEDDEN geboren te Hengelo (0) 1987 Offsetdrukkerij Kanters B.V., Alblasserdam

Welcome message from author
This document is posted to help you gain knowledge. Please leave a comment to let me know what you think about it! Share it to your friends and learn new things together.
Transcript

RENAL FUNCTION IN THE PRETERM NEONATE AND
THE NEWBORN RABBIT
(DE NIERFUNKTIE VAN DE PRETERME PASGEBORENE EN
HET PASGEBOREN KONIJN)
PROEFSCHRIFT
ter verkrijging van de graad van Doctor aan de Erasmus Universiteit Rotterdam
op gezag van de rector magnificus Pro£ Dr. A.H.G. Rinnooy Kan
en volgens besluit van het College van Dekanen. De openbare verdediging zal plaatsvinden op
vrijdag 27 november 1987 om 14.00 uur
door
ALBERTUS JACOBUS VANDER HEDDEN
geboren te Hengelo (0)
1987 Offsetdrukkerij Kanters B.V.,
Alblasserdam

PROMOTIECOMMISSIE
Promotoren: Prof. Dr. P.J.J. Sauer Prof. Dr. L.A.H. Monnens
Overige leden: Prof. Dr. M.A.D.H. Schalekamp Prof. Dr. M. W. van Hof
The animal experiments in this thesis have been performed at the Laboratory of Pediatric Nephrology, Centre Hospitalier Universitaire Vaudois, Lausanne, Switzerland. The clinical studies in this thesis have been performed at the neonatal intensive care unit of the Sophia Children's Hospital, Rotterdam. Animal experimental studies were supported by grant no. 3.927-0.80 of the Swiss National Science Foundation and by the Sophia Foundation for Medical Research.

0.. c.M ""'r \) 0\. b.
~ )on1Yl'j J ~+-)~ 1 mCJlf-t ~ ~~r

Cover design: Gert-Jan (7 years) and Marijke (5 years) van der Heijden.
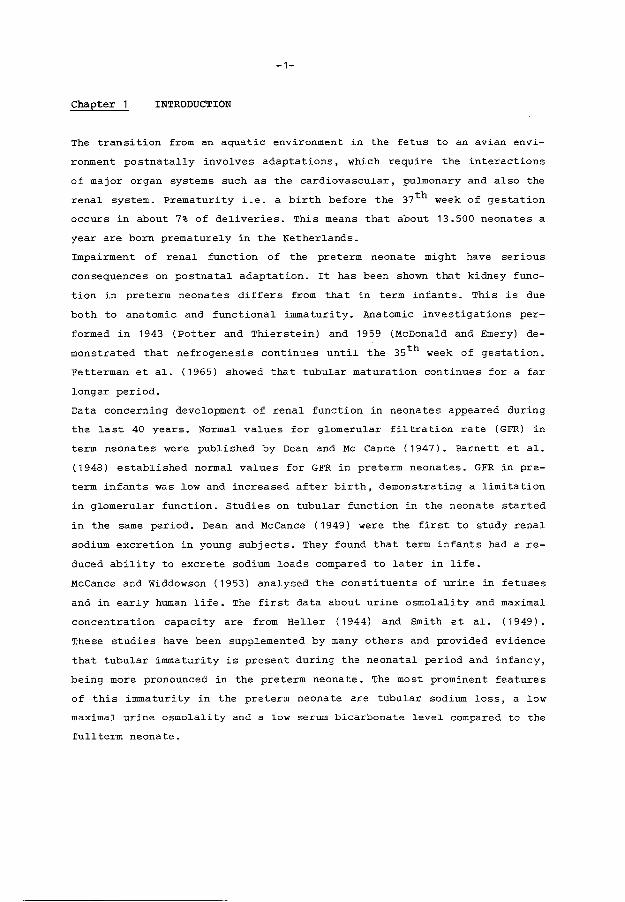
CONTENTS
1 • INTRODUCTION
2. RENAL FUNCTION IN THE PRETERM NEONATE
2.A. Development and evaluation of glomerular filtration in
the preterm neonate
2 .A. 1. Abstract
2.A.2. Introduction
2.A.3. Measurement of GFR
2.A.4. Conclusions
2.B. Renal tubular function in the preterm neonate
2 .B.1. Abstract
2.B.2. Introduction
2.B.3. Glomerulotubular balance, beta-2-microglobulin and
sodium/potassium homeostasis
2.B.4. Renal water handling
2.B.5. Acid-base balance
2.B.6. Glucose, phosphate and aminoacid reabsorption
2.B.7. Conclusions
2.C. Mechanisms of renal tubular acidification
2.C.1. General aspects
2.C.2. Mechanisms of renal tubular acidification in the
neonate
3. EFFECT OF HYPERCAPNIC ACIDOSIS ON RENAL FUNCTION
IN THE NEWBORN RABBIT
3 .1. Abstract
3.2. Introduction
3.3. Materials and methods
3.4. Results
3.5. Discussion
3.6. References
page
5
5
5
6
7
10
12
12
13
13
16
17
17
18
20
20
23
25
25
26
26
29
33
35
I

4. BICARBONATE REABSORPTION BY THE NEWBORN RABBIT KIDNEY
4.1. Abstract
4.2. Introduction
4.3. Materials and methods
4.4. Results
4.5. Discussion
4.6. References
5. GLOMERULAR FILTRATION RATE IN THE PRETERM NEONATE:
THE RELATION TO GESTATIONAL AND POSTNATAL AGE
5.1. Abstract
5.2. Introduction
5.3. Materials and methods
5.4. Results
5.5. Discussion
5.6. References
6. TEMPORARY RENAL FUNCTIONAL IMPAIRMENT IN PRETERM
page
37
37
39
39
42
48
51
55
55
56
56
59
62
66
NEONATES RELATED TO INTRAUTERINE EXPOSURE TO INDOMETHACIN 69
6 .1.
6.2.
6.3.
6.4.
6.5.
6.6.
7.
7. 1.
7.2.
7.3.
7.4.
Abstract
Introduction
Patients and methods
Results
Discussion
References
GENERAL DISCUSSION
Clinical implications of the study
Summary
Samenvatting
References
Acknowledgements
Curriculum vitae
69
70
70
73
75
79
83
93
96
99
102
116
118

ABBREVIATIONS
ANP
AV
AVP
BW
CH20
cinulin
cosmol
CpAH
EPAH FE bicarbonate
FENa
GA
GFR
ID
Kf
MAP
PA
pda
PG
PROM
RBF
RDS
RVR
sv
T~
Atrial natriuretic peptide
Artificial ventilation
Arginine vasopressin
Birth weight
Free water clearance
Inulin clearance
Osmolar clearance
Clearance of para-aminohippurate
Extraction of para-aminohippurate
Fractional bicarbonate excretion
Fractional sodium excretion
Gestational age
Glomerular filtration rate
Indomethacin
Ultrafiltration coefficient
Mean arterial pressure
Postnatal age
Persistent ductus arteriosus
Prostaglandin(s)
Premature rupture of membranes
Renal blood flow
Respiratory distress syndrome
Renal vascular resistance
Spontaneous ventilation
Plasma half life.

-1-
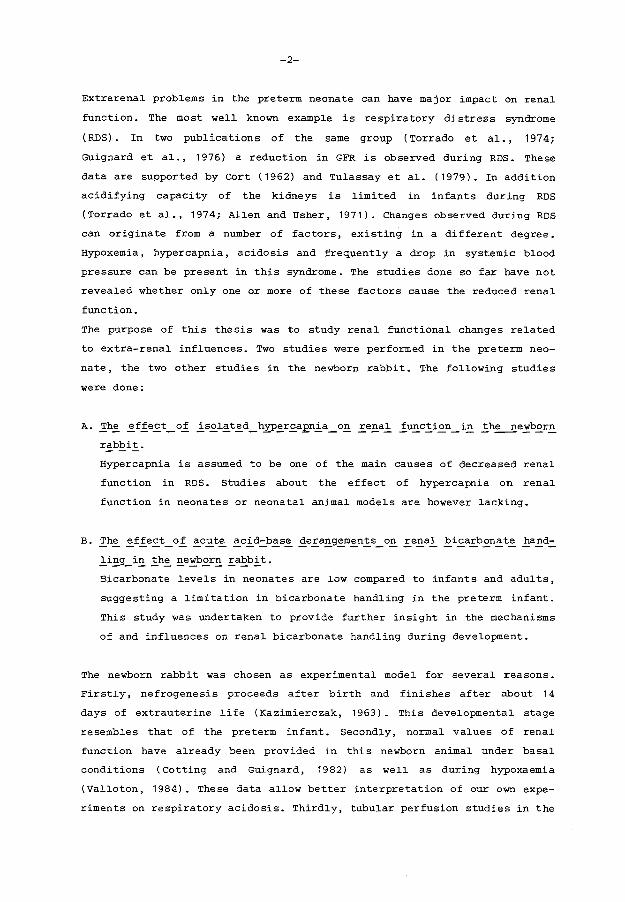
Chapter INTRODUCTION
The transition from an aquatic environment in the fetus to an avian envi-
ronment postnatally involves adaptations, which require the interactions
of major organ systems such as the cardiovascular, pulmonary and also the
renal system. Prematurity i.e. a birth before the 37th week of gestation
occurs in about 7% of deliveries. This means that about 13.500 neonates a
year are born prematurely in the Netherlands.
Impairment of renal function of the preterm neonate might have serious
consequences on postnatal adaptation. It has been shown that kidney func
tion in preterm neonates differs from that in term infants. This is due
both to anatomic and functional immaturity. Anatomic investigations per
formed in 1943 (Potter and Thierstein) and 1959 (McDonald and Emery) de
monstrated that nefrogenesis continues until the 35th week of gestation.
Fetterman et al. (1965) showed that tubular maturation continues for a far
longer period.
Data concerning development of renal function in neonates appeared during
the last 40 years. Normal values for glomerular filtration rate (GFR) in
term neonates were published by Dean and Me Cance ( 1947). Barnett et al.
(1948) established normal values for GFR in preterm neonates. GFR in pre-
term infants was low and increased after birth, demonstrating a limitation
in glomerular function. Studies on tubular function in the neonate started
in the same period. Dean and McCance (1949) were the first to study renal
sodium excretion in young subjects. They found that term infants had a re
duced ability to excrete sodium loads compared to later in life.
McCance and Widdowson (1953) analysed the constituents of urine in fetuses
and in early human life. The first data about urine osmolality and maximal
concentration capacity are from Heller ( 1944) and Smith et al. ( 1949).
These studies have been supplemented by many others and provided evidence
that tubular immaturity is present during the neonatal period and infancy,
being more pronounced in the preterm neonate. The most prominent features
of this immaturity in the preterm neonate are tubular sodium loss, a low
maximal urine osmolality and a low serum bicarbonate level compared to the
fullterm neonate.
-2-
Extrarenal problems in the preterm neonate can have major impact on renal
function. The most well known example is respiratory distress syndrome
( RDS). In two publications of the same group (Torr ado et al., 1974;
Guignard et al., 1976) a reduction in GFR is observed during RDS. These
data are supported by Cort (1962) and Tulassay et al. (1979). In addition
acidifying capacity of the kidneys is limited in infants during RDS
(Terrade et al., 1974; Allen and Usher, 1971). Changes observed during RDS
can originate from a number of factors, existing in a different degree.
Hypoxemia, hypercapnia, acidosis and frequently a drop in systemic blood
pressure can be present in this syndrome. The studies done so far have not
revealed whether only one or more of these factors cause the reduced renal
function.
The purpose of this thesis was to study renal functional changes related
to extra-renal influences. Two studies were performed in the preterm neo
nate , the two other studies in the newborn rabbit. The following studies
were done:
A. _!h~ ~f_fe~t_of 2:_s~l~t~d_h_yp~r~a.E.n2:_a_oE_ renal
rabbit.
function in the newborn ------------
Hypercapnia is assumed to be one of the main causes of decreased renal
function in RDS. Studies about the effect of hypercapnia on renal
function in neonates or neonatal animal models are however lacking.
B. _!h~ ~f_!eE_t_o_! ~cE_t~ ~cl:_d.::b~s~ ~eE_aE_g~m~n!_s_oE_ renal E_i~aE_b~n~t~ hand
l:_iE_g_iE_!_h~E_e~b~rE_E.aE.b!_t.
Bicarbonate levels in neonates are low compared to infants and adults,
suggesting a limitation in bicarbonate handling in the preterm infant.
This study was undertaken to provide further insight in the mechanisms
of and influences on renal bicarbonate handling during development.
The newborn rabbit was chosen as experimental model for several reasons.
Firstly, nefrogenesis proceeds after birth and finishes after about 14
days of extrauterine life (Kazimierczak, 1963). This developmental stage
resembles that of the pre term infant. Secondly, normal values of renal
function have already been provided in this newborn animal under basal
conditions ( Cotting and Guignard, 1982) as well as during hypoxaemia
(Valloton, 1984). These data allow better interpretation of our own expe
riments on respiratory acidosis. Thirdly, tubular perfusion studies in the
-3-
newborn rabbit demonstrate a limitation in bicarbonate reabsorptive capa
city (Schwartz and Evans, 1983), while data on overall bicarbonate hand
ling in this animal are lacking.
c. :E_h~ _5!e:::_e1:_o.Em~n_! ~f_g1:_o~e.E_u1:_a.E_ f~n~tl:_o~ i~ _!h~ l?.r~t~r~ ~e~n~t~.
The GFR in the preterm neonate is known to increase with advancing ges
tational age and postnatal age. In this study we evaluated the changes
in GFR in preterm neonates from 27-36 weeks with and without respira
tory problems.
D. :E_h~ ~f_fe~t_o_f _Er~n~t~l_e~p~s~r~ _!o_I~d~m~th_a~i~ ~n_r~n~l_f~n~tl:_o~ in
p.E_e_!e.E_m_ n~o~a_!e~ _5!u.E_i~g-th_e_fl:_r~t-w~e~ ~f_ll:_f~.
Indomethacin is known to impair renal blood flow (RBF) and GFR in expe
rimental animals and in neonates, exposed after birth. GFR was evalua
ted by the continuous inulin infusion method, in circumstances where
the neonate was already exposed in utero.
A review of the relevant literature about renal functi?nal development in
the preterm human neonate precedes the experimental studies.
Chapter 2 reviews data from literature on glomerular function, tubular
function and renal acid-base regulation in the preterm infant.
Chapter 3 deals with the effect of acute isolated hypercapnic acidosis on
renal function in the newborn rabbit.
Chapter 4 is a study on bicarbonate handling in the newborn rabbit during
acute changes in acid-base balance.
In chapter 5 the development of glomerular function in the preterm neonate
and its relationship to gestational age and postnatal age is studied using
the continuous inulin infusion technique.
-4-
Chapter 6 describes the effect of exposure to indomethacin during preg-
nancy on renal function in preterm neonates.
Chapter 7 reviews the results of the chapters 3 - 6 and discusses the re
levant data from literature. In the final paragraph conclusions concerning
clinical implications of these studies are presented.
Chapter 2
2.A.
-5-
RENAL FUNCTION IN THE PRETERM NEONATE
DEVELOPMENT AND EVALUATION OF GLOMERULAR FILTRATION IN THE
PRETERM NEONATE
2.A.1. Abstract
Glomerulogenesis in the human being finishes after 35-36 weeks of gesta
tion. Changes in glomerular function after birth are the result of changes
in net ultrafiltration pressure, ultrafiltration coefficient and Renal
Blood Flow (RBF). The markedly lower RBF seems mainly responsible for the
lowered glomerular filtration rate (GFR) in the neonate.
In this chapter we discuss the different methods applicated in the preterm
newborn to evaluate changes in GFR. Only the classic inulin clearance as
well as the continuous inulin infusion technique provide exact data, but
are not easy to perform. In general pediatric practice the use of tables
for "normal values" of serum creatinine is advised. Patient values can be
compared to those "normal values".
* Partly published in the "Tijdschrift veer Kindergeneeskunde
1985;53:181-185."
A.J. v.d. Heijden and I.M.E. Frohn-Mulder.
-6-
2.A.2. Introduction
Nefrogenesis in the human fetus begins in the middle of the third week of
pregnancy with the appearance of the rudimentary, non-functioning prone
phros. Although the nephrotomes hollow out and become vesicles, there is
no formation of true nephrons. By the end of the fourth week the prone
phric nephrotomes and the cranial portion of the pronephric system have
been resorbed; the formation of the mesonephros begins. The mesonephros
obliterates also and all but those portions that persist beyond fetal life
have disappeared by the third month. An outgrowth of the mesonephric duct
forms the ureteric buds, necessary for differentiation of the metanephros.
The ureteric buds together with the metanephric system, appearing at about
the fifth week of gestation develop into the final kidney.
The formation of glomeruli goes on up to the 35th week of gestation and
urine production starts as early as around the 9th to 12th week of gesta-
tion. This is the main source of amniotic fluid. Urine production increa
ses during pregnancy. Mean hourly urine flow is about 12 ml at 32 weeks,
increasing up to 28 ml at 40 weeks of gestation (Campbell et al., 1973).
The fetal urine is hypotonic during pregnancy with sodium and chloride as
major components. The amounts of creatinine and urea present in the urine
reflect the development of glomerular filtration: the urine-to-plasma
ratio_of these substances is greater than 1 (McCance and Widdowson, 1953).
However, only the placental barrier is responsible for the elimin~tion
of waste products.
Glomerular filtration depends on the net ultrafiltration pressure across
the glomerular membrane, the ultrafiltration coefficient (Kf) and on the
plasma flow through the glomerular capillaries.
The net ultrafiltration pressure is the resultant of differences in hydro
static pressure along the glomerular membrane and the osmotic pressure of
the non-filtered colloids. The ultrafiltration coefficient depends on the
total capillary surface area and the permeability per unit of surface
area. The plasma flow depends on systemic blood pressure, renal vascular
resistance and the hematocrit.
Changes in GFR, present in neonates, will so depend on changes in one or
more of the above mentioned factors. Animal experiments provide evidence
for these changes. The development of glomerular ultrafiltration in the
rat was extensively studied by Ichikawa et aL ( 1979}. Equality between
efferent osmotic pressure and transglomerular hydraulic pressure differen-
ces was usually achieved in immature rats ( 30-45 days old}, indicating
-7-
that the ultrafiltration coefficient (Kf) is not the factor limiting GFR
in these rats.
The mean vaJ.ue for transcapiJ.J.ary pressure differences, P, is sJ.ightJ.y
J.ower in immature than in aduJ. t rats, on average about 3 mm Hg. It is,
therefore, the markedJ.y J.ower gJ.omeruJ.ar pJ.asma fJ.ow ( 79 ..:_ 5 vs 136 ..:_ 10
nJ./min per gram kidney weight), which is responsibJ.e for the J.ower GFR in
immature rats. We can concJ.ude that the immature kidney has a high
arterioJ.ar resistance with a concomittant J.ow pJ.asma fJ.ow. AJ.so other
experimental. studies indicate, that renaJ. vascuJ.ar resistance decreases
postnataJ.J.y and renaJ. perfusion increases (Aperia and Herin, 1975; Gruskin
et aJ.., 1970; Spitzer and EdeJ.mann, 1971). Systemic bJ.ood pressure in the
human neonate increases rapidJ.y (VersmoJ.d et aJ.., 1981), faciJ.itating an
increase in renal. plasma fJ.ow.
GFR in the human neonate is J.ow compared to infants and aduJ.ts. This J.ow
GFR depends probabJ.y on the presence of a high renaJ. vascuJ.ar resistance
before deJ.ivery, decreasing thereafter, as is suggested by the above men
tioned experimental. data.
In addition to this deveJ.opment of renaJ. function it is weJ.J. known that
aJ.so gJ.omeruJ.ar structures are stiJ.J. deveJ.oping untiJ. the 35th week of
gestation.
2.A.3. Measurement of GFR
Many methods have been used to assess GFR in the preterm neonate. AJ.J. have
however their J.imitations, either the compJ.exity of the method or the in
accuracy in estabJ.ishing GFR.
1. Inulin clearance --------InuJ.in, a vegetable fructose poJ.ysaccharide with a moJ.ecuJ.ar weight of
about 5000 DaJ.ton, is totaJ.J.y fiJ.tered even in the very young preterm
neonate ( CouJ. thard and Ruddock, 1983B) and may be considered as an
ideaJ. marker of gJ.omeruJ.ar fiJ.tration.
The traditional. inulin cJ.earance requires intravenous infusion and cor-
rectJ.y timed urine coJ.J.ection periods. A boJ.us injection of inulin pre
cedes a continuous inuJ.in infusion. An equiJ.ibration time of 60-90 mi
nutes is needed, after which urine is coJ.J.ected, using 3-4 coJ.J.ection
periods of 20-30 minutes each. In between the coJ.J.ection periods bJ.ood
sampJ.es are taken to determine the inuJ.in concentration. Inulin cJ.ea-

-8-
ranee is calculated from urinary excretion divided by the inulin plasma
concentration.
(Cin = Uin • V; Cin
Pin
inulin clearance; uin inulin urine concentra-
tion; V urinary volume; Pin= inulin plasma concentration).
Bladder catheterisation is needed, which can easily lead to urethral
damage especially in the very small neonate. A considerable risk for
introducing infections exists. Intravenous infusion is necessary.
This technique has been used by different groups. Strauss et al. (1981)
investigated GFR in heal thy full term infants during the first 4 hours
of extrauterine life. They found a GFR varying from 0. 5 to 9 ml/min
during the first hour of extrauterine life, declining to 0.8-3.7 ml/min
after 4 hours. Gui~nard et al. (1975) measured GFR in 22 newborns with
a postnatal age varying from 1-22 days, and found an increase in GFR
from 10 ml/min per m2 on day 1 to 30 ml/min per m2 on day 12 postnatal
ly. Only 2 neonates with a gestational age of less than 35 weeks were
included in this study, so later on data of another 12 preterm neonates
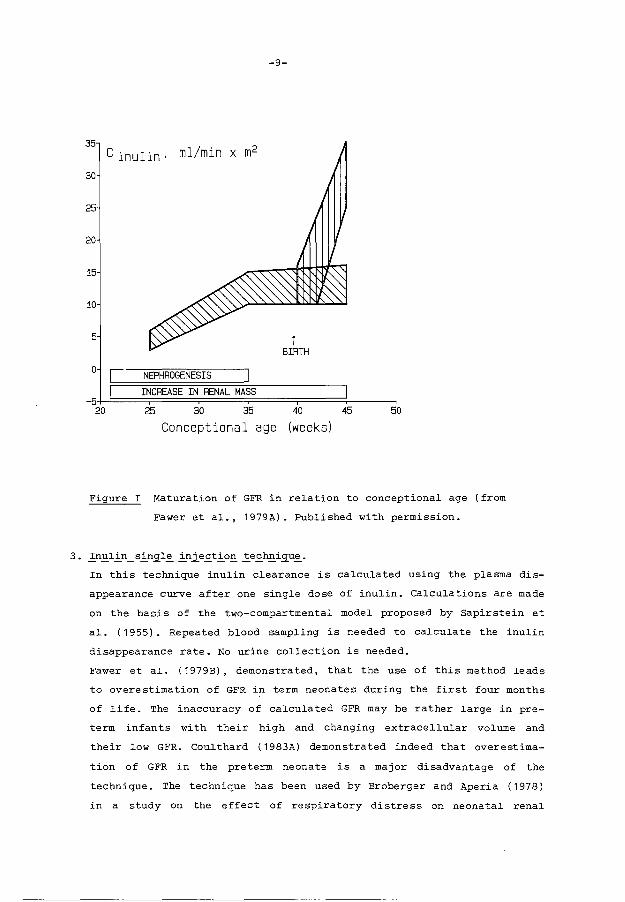
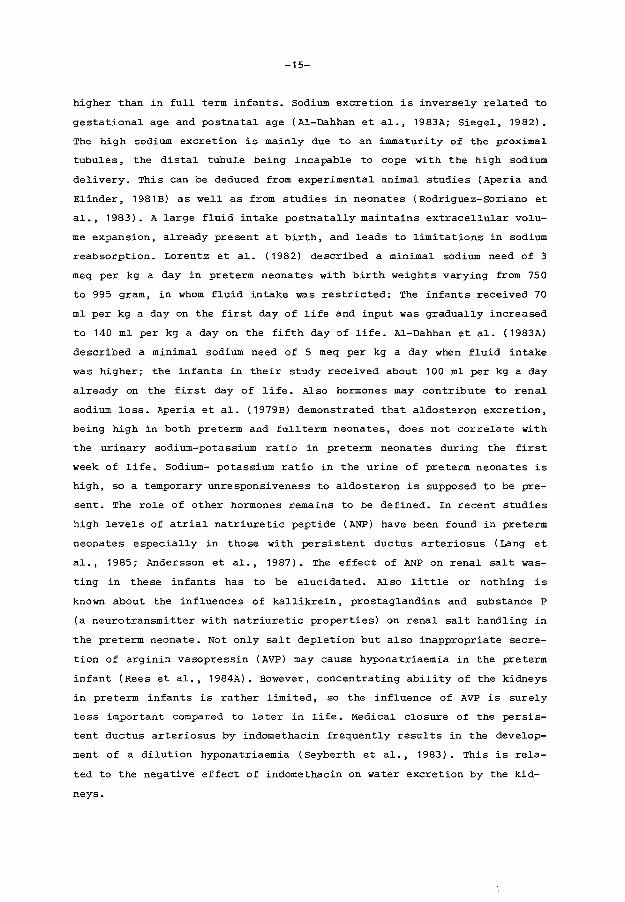
were added ( Fawer et al. , 1979A) . An increase in GFR expressed in
ml/min per m2 , which correlated with gestational age was found in the
preterm neonates in contrast to term neonates. GFR in the latter group
showed no rise with increasing gestational age. Postnatally a signifi
cant rise in GFR was present in all investigated infants (figure 1).
2. Creatinine clearance
The excretion of creatinine in the urine per time bnit, divided by the
plasma creatinine level is used as a measure for GFR in this method. An
accurate urine collecti.on is required. This is a difficult procedure,
especially in the pre term female neonate. Urine loss due to leakage
along collection bags occurs frequently. Moreover serum creatinine va
lues are rapidly changing during the first days of life ( Sertel and
Scopes, 1973). Creatinine clearance is known to overestimate real GFR.
The method is broadly applicated, while intravenous infusion is no pre
rogative in contrast to all other methods (Aperia et al., 1981A; Siegel
and Oh, 1976; Arant, 1978). Aperia found a good correlation between
inulin and creatinine clearance using a rather small number of patients
(1981A). Siegel (1976) and Arant (1978) did not observe a postnatal in-
crease in GFR using creatinine clearances, in contrast to the study of
Fawer et al. (1979A).
-9-
35
C inulin· ml/min x m2
30
25
20
15
50
Figure I Maturation of GFR in relation to conceptional age (from
Fawer et al., 1979A). Published with permission.
3. _!n~ll:_n _ sl:_n~l~ l:_nie~tl:_o.!!_ _!e~h.!!_igu~.
In this technique inulin clearance is calculated using the plasma dis
appearance curve after one single dose of inulin. Calculations are made
on the basis of the two-compartmental model proposed by Sapirstein et
al. (1955). Repeated blood sampling is needed to calculate the inulin
disappearance rate. No urine collection is needed.
Fawer et al. (1979B), demonstrated, that the use of this method leads
to overestimation of GFR in term neonates during the first four months
of life. The inaccuracy of calculated GFR may be rather large in pre
term infants with their high and changing extracellular volume and
their low GFR. Coulthard ( 1983A) demonstrated indeed that overestima-
tion of GFR in the preterm neonate is a major disadvantage of the
technique. The technique has been used by Broberger and Ape ria ( 197 8)
in a study on the effect of respiratory distress on neonatal renal

-10-
function and by Catterton et al. , ( 1980) in a study on the effect of
indomethacin on GFR.
Svenningsen (1975) applied the method with polyfructosan, an inulinlike
substance with a somewhat lower molecular weight. It is however unknown
if polyfructosan is as reliable as inulin in the preterm neonate, while
the disadvantages of the single injection technique remain present.
4. Continuous inulin infusion -------------During a constant inulin infusion a steady state can be reached, in
which the inulin infusion rate equals urinary inulin excretion rate,
assuming that no other way for inulin excretion exists. This means that
inulin clearance can be calculated from the infused amount of inulin
per time unit divided by the plasma inulin concentration
(Cin = I.R = Uin • V; C = inulin clearance; Pin= inulin plasmaconcen-
pin Pin
tration; I = inulin concentration in infusion; R = infusion rate; Uin =
inulin urine concentration; V = urinary volume). This method has for
the first time been applicated to the preterm neonate by Leake et al.
( 1976), demonstrating stable inulin plasma levels after 78 minutes of
continuous inulin infusion. Coulthard (1983A) demonstrated however that
it takes at least 18 to 24 hours before steady state plasma concentra-
tions are reached. We could confirm his data. The mean GFR in his stu-
dy was 0.84 ml/min per kg. No correlation between GFR and postnatal age
was found in his study.
5 . .QtE:eE. E:_e.!_h~d~ No radioisotopic evaluation of GFR in preterm newborns
has as yet been performed.
2.A.4. Conclusions
Many investigations on GFR in neonates have been performed. Unfortunately,
the results of these studies vary and are frequently conflicting. Moreover
GFR has been expressed in many different ways (ml/min, ml/min per kg,
ml/min per m2 , ml/min per 1.73 m2), which still increases confusion.
When GFR is expressed per body surface area, studies have to be used, in
which a surprisingly small number of antropometric data on very young in
fants is included (Boys, 1935; Sendroy and Cecchini, 1954; Haycock et al.,
1978) . This may artificially increase or decrease the observed GFR. It

-11-
would be more logical to express GFR only in ml/min or in ml/min per kg
(Coulthard and Hey, 1984).
The traditional inulin clearance and the continuous inulin infusion pro
vide in our opinion the most reliable data on GFR. Both have however their
restrictions. The traditional inulin clearance requires bladder catheteri
sation, the continuous infusion requires a fairly long infusion period. It
seems therefore reasonable to reserve these techniques only for patients,
in whom exact evaluation of GFR is •of major clinical importance and for
scientific studies. Repeated measurements of plasma creatinine values,
using a reliable technique as for instance the Jaffe method will be suf
ficient in most clinical situations. The creatinine values obtained can
be compared with "normal values" as reported in literature (Stonestreet
and Oh, 1978; Feldman and Guignard, 1982; Rudd et al., 1983; Trompeter et
al., 1983). In table I a useful example of normal values from the study of
Rudd et al. (1983) is presented. Relative small changes in plasma creati
nine values may reflect major changes in GFR.
PLASMA CREATININE VALUES IN THE FIRST MONTH OF LIFE
Gestation Postnatal age (days)
(weeks) 2 2 2 7 14 21 28
All Breathing Ventilated All babies
babies Spontaneously
28 116±40 108 ± 20 121 ±45 84±32 72±32 60±33 58±24 (n=24) (n=8) (n= 16) (n=22) (n=25) (n=25) (n=24)
29-32 104±38 100±32 115±43 83±41 69±32 59±32 52±33 (n=50) (n=36) (n=16) (n=56) (n=42) (n=29) (A=30)
33-36 93±39 94±39 87±46 68±44 55±36 50±37 35±24 (n=36) (n=32) (n=4) (n=31) (n=27) (n=20) (n=12)
37-42 75±38 75±38 50±36 38±20 35±20 30±18 (n=27) (n=27) (n=39) (n= 19) (n=19) (n=15)
Mean plasma creatinine /Lmol/1 ± 2 SO. Conversion Sl to traditional units: 1 /Lmol/1 "'0.0113 mg/1 00 ml
Table I Plasma creatinine values during the first month of life.
(from Rudd et al., 1983). Published with permission.
-12-
Chapter 2 RENAL FUNCTION IN THE PRETERM NEONATE
2.B. RENAL TUBULAR FUNCTION IN THE PRETERM NEONATE
2.B.1. Abstract
Renal tubular function and functional changes in the preterm neonate are
discussed. The proximal tubule has a limited capacity to preserve sodium,
leading to a daily sodium need of 3 to 5 meq/kg/day. The reabsorption of
glucose, phosphate and aminoacids is also low compared to older children
but increases quickly after birth. At the level of the distal tubule, a
temporary insensitivity for aldosteron leads to a lowered sodium-potassium
exchange. concentration capacity is restricted with a maximal urine osmo
lality of about 360 mosm/liter. The kidneys are despite this immature tu
bular function capable to preserve their homeostatic function.
* Accepted for publication in the "Tijdschrift voor Kindergeneeskunde".
A.J. v.d. Heijden, E.D. Wolff, J. Nauta.
-13-
2.B.2. Introduction
Anatomic investigations into dimensions and characteristics of the ne
phrons in the kidney at birth demonstrate that glomerular maturation pre
cedes tubular maturation. Fetterman et al. ( 1965) demonstrated this in
morfometric studies of subjects varying in age from 0 to 18 years. Glome
rulogenesis finishes after 35-36 weeks of gestation, tubular maturation
continues for a far longer period. These anatomic data indicate that glo
merulotubular disbalance may exist in the preterm infant. In this chapter
we review the literature on tubular function, functional development and
adaptation after birth in the preterm neonate.
2.B.3. Glomerulotubular balance, ~ 2 microglobulin clearance and Na/K
homeostasis
Differences between glomerular and tubular morfological development may
probably lead to renal loss of solutes and water, especially in the very
young newborn (glomerulotubular disbalance). Differences of dimensions of
nephrons between newborns and adults are striking. Proximal tubuli are
markedly underdeveloped relative to their corresponding glomeruli. This
proximal convoluted tubule is the segment of the nephron, which undergoes
most of the growth during development. Even in the proximal convoluted
tubule differences in growth have been demonstrated. The luminal surface
area, through which phosphate is cotransported with sodium, increases for
instance several-fold more than the total length of the proximal tubule
(Hay and Evans, 1979). Heterogeneity between individual nephrons at the
same level of the cortex is also evident. Thereabove the dimensions of
glomeruli and nephrons in the outer cortex of the immature kidney prove to
be more markedly smaller than those in the inner cortex, compared with the
adult kidney. Animal experiments show however that glomerulotubular
balance exists in the newborn experimental animal (Kon et al., 1984).
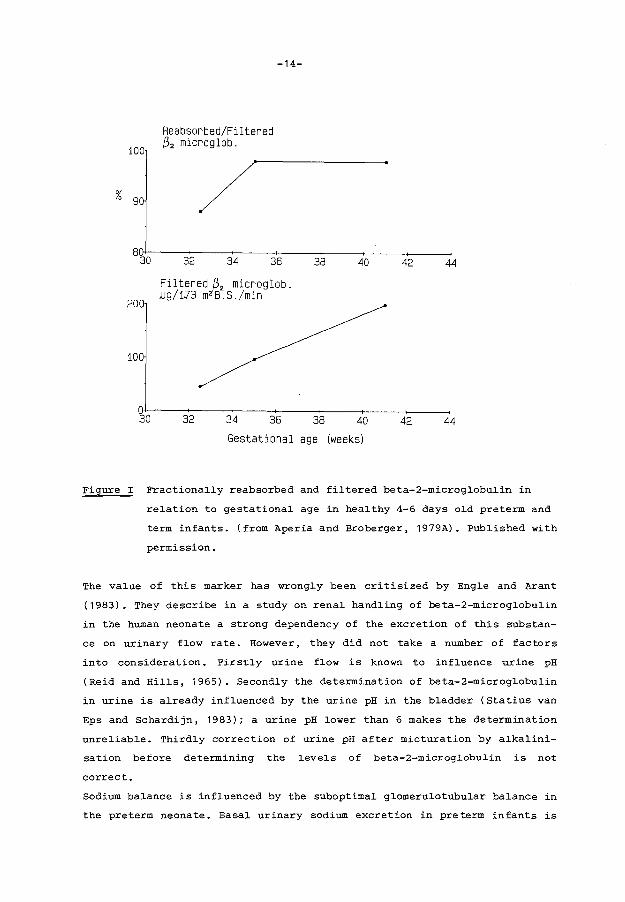
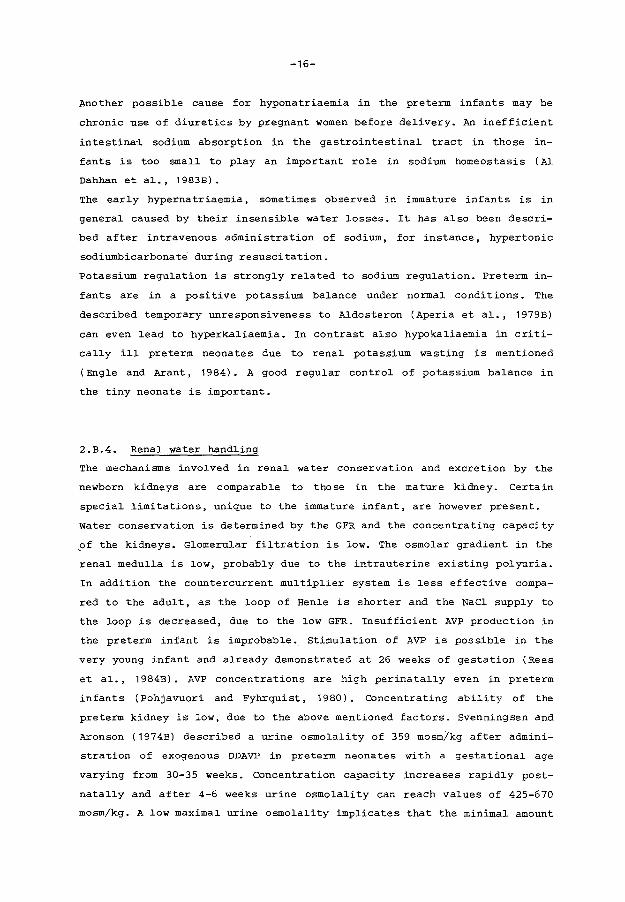
The fractional reabsorption of beta-2-microglobulin, a small naturally oc
curring protein with a molecular weight of 11.800 Dalton is a good marker
of proximal tubular function. Aperia et al. ( 1979A, 1983B) demonstrated
that this fractional reabsorption of beta-2-microglobulin increased during
gestation reaching a level of 98% of the filtered amount after 35 weeks of
gestation (figure 1). Thereafter the increase in beta-2-microglobulin
reabsorption still continues, but in a much slower way until the 21st
month of life (van Oort et al., 1980).
%
100
90
Reabsorbed/Filtered (3 2 microglob.
-14-
80~~--~~--~----7---------~----~--~ 30 32 34 36 38
200
100
~0
Filtered ~2 microglob. ~g/1J3 m2 B.S./min
32 34 36
40
38 40
Gestational age (weeks)
42 44
42 44
Figure I Fractionally reabsorbed and filtered beta-2-microglobulin in
relation to gestational age in healthy 4-6 days old preterm and
term infants. (from Aperia and Broberger, 1979A). Published with
permission.
The value of this marker has wrongly been critisized by Engle and Arant
(1983). They describe in a study on renal handling of beta-2-microglobulin
in the human neonate a strong dependency of the excretion of this substan
ce on urinary flow rate. However, they did not take a number of factors
into consideration. Firstly urine flow is known to influence urine pH
(Reid and Hills, 1965). Secondly the determination of beta-2-microglobulin
in urine is already influenced by the urine pH in the bladder (Statius van
Eps and Schardijn, 1983); a urine pH lower than 6 makes the determination
unreliable. Thirdly correction of urine pH after micturation by alkalini
sation before determining the levels of beta-2-microglobulin is not
correct.
Sodium balance is influenced by the suboptimal glomerulotubular balance in
the preterm neonate. Basal urinary sodium excretion in preterm infants is
-15-
higher than in full term infants. Sodium excretion is inversely related to
gestational age and postnatal age (Al-Dahhan et al., 1983A; Siegel, 1982).
The high sodium excretion is mainly due to an immaturity of the proximal
tubules, the distal tubuJ.e being incapable to cope with the high sodium
delivery. This can be deduced from experimental animal studies (Aperia and
Elinder, 1981B) as well as from studies in neonates (Rodriguez-soriano et
al., 1983). A large fluid intake postnatally maintains extracellular volu
me expansion, already present at birth, and leads to limitations in sodium
reabsorption. Lorentz et al. (1982) described a minimal sodium need of 3
meq per kg a day in preterm neonates with birth weights varying from 750
to 995 gram, in whom fluid intake was restricted: The infants received 70
ml per kg a day on the first day of life and input was gradually increased
to 140 ml per kg a day on the fifth day of life. Al-Dahhan et al. (1983A)
described a minimal sodium need of 5 meq per kg a day when fluid intake
was higher; the infants in their study received about 100 ml per kg a day
already on the first day of life. Also hormones may contribute to renal
sodium loss. Aperia et al. (1979B) demonstrated that aldosteron excretion,
being high in both preterm and fullterm neonates, does not correlate with
the urinary sodium-potassium ratio in preterm neonates during the first
week of life. Sodium- potassium ratio in the urine of preterm neonates is
high, so a temporary unresponsiveness to aldosteron is supposed to be pre
sent. The role of other hormones remains to be defined. In recent studies
high levels of atrial natriuretic peptide (ANP) have been found in preterm
neonates especially in those with persistent ductus arteriosus (Lang et
al., 1985; Andersson et al., 1987). The effect of ANP on renal salt was
ting in these infants has to be elucidated. Also little or nothing is
known about the influences of kallikrein, prostaglandins and substance P
(a neurotransmitter with natriuretic properties) on renal salt handling in
the preterm neonate. Not only salt depletion but also inappropriate secre
tion of arginin vasopressin (AVP) may cause hyponatriaemia in the preterm
infant (Rees et al., 1984A). However, concentrating ability of the kidneys
in preterm infants is rather limited, so the influence of AVP is surely
less important compared to later in life. Medical closure of the persis
tent ductus arteriosus by indomethacin frequently results in the develop
ment of a dilution hyponatriaemia (Seyberth et al., 1983). This is rela
ted to the negative effect of indomethacin on water excretion by the kid
neys.
-16-
Another possib~e cause for hyponatriaemia in the preterm infants may be
chronic use of diuretics by pregnant women before de~ivery. An inefficient
intestina·~ sodium absorption in the gastrointestina~ tract in those in
fants is too smal~ to p~ay an important ro~e in sodium homeostasis ( Al
Dahhan et al., 1983B).
The ear~y hypernatriaemia, sometimes observed in immature infants is in
genera~ caused by their insensib~e water ~osses. It has also been descri
bed after intravenous administration of sodium, for instance, hypertonic
sodiumbicarbonate during resuscitation.
Potassium regu~ation is strong~y re~ated to sodium regu~ation. Preterm in
fants are in a positive potassium ba~ance under norma~ conditions. The
described temporary unresponsiveness to Aldosteron (Aperia eta~., 1979B)
can even lead to hyperkaliaemia. In contrast also hypokaliaemia in criti
cal~y ill preterm neonates due to renal potassium wasting is mentioned
(Engle and Arant, 1984). A good regular control of potassium balance in
the tiny neonate is important.
2.B.4. Renal water handling
The mechanisms involved in renal water conservation and excretion by the
newborn kidneys are comparable to those in the mature kidney. Certain
special limitations, unique to the immature infant, are however present.
Water conservation is determined by the GFR and the concentrating capacity
pf the kidneys. Glomerular filtration is low. The osmolar gradient in the
renal medulla is low, probably due to the intrauterine· existing polyuria.
In addition the countercurrent multiplier system is less effective compa
red to the adult, as the loop of Henle is shorter and the NaCl supply to
the loop is decreased, due to the low GFR. Insufficient AVP production in
the preterm infant is improbab~e. Stimulation of AVP is possible in the
very young infant and already demonstrated at 26 weeks of gestation (Rees
et al., 1984B). AVP concentrations are high perinatally even in preterm
infants (Pohjavuori and Fyhrquist, 1980). Concentrating ability of the
preterm kidney is low, due to the above mentioned factors. Svenningsen and
Aronson (1974B) described a urine osmolality of 359 mosm/kg after admini
stration of exogenous DDAVP in pre term neonates with a gestational age
varying from 30-35 weeks. concentration capacity increases rapidly post
natally and after 4-6 weeks urine osmolality can reach values of 425-670
mosm/kg. A low maximal urine osmolality implicates that the minimal amount

-17-
of urine, necessary for eliminating the by the body produced solutes is
high. Ten mosm per kg a day need to be excreted ( Hol.l.iday and Segar,
1957) . Maximal urine osmolality is about 360 mosm/kg ( Svenningsen and
Aronson, 1974B). So a minimal. urine production of 27 ml./kg a day (about 1
ml./kg per hour) is required.
Water excretion depends on GFR and diluting capacity. The newborn can op
timally dilute his urine and a urine osmolality between 30 and 50 mosm/kg
H20 can be reached (Aperia et al., 1983A; Coulthard and Hey, 1985). A
water l.oad of 200 ml./kg a day can be excreted without an increment in GFR
and without evidence that maximal. diuresis has been achieved; neither the
osmolar excretion rate nor plasma osmolal.i ty changes during this high
fl.uid intake. (Coulthard and Hey, 1985).
2.B.5. Acid-base bal.ance
This subject is separately discussed in chapter 2C.
2.B.6. Glucose, Phosphate and aminoacid reabsorption
Reabsorption of glucose, phosphate and aminoacids occurs in the proximal.
tubule. Tudvad and Vesterdal. described al.ready in 1953 that renal. trans-
port capacity for glucose is limited in preterm infants. Glucosuria can be
present when serum gl.ucose concentration is as l.ow as 5.5 mmol./L. Tubul.ar
reabsorptive capacity for gl.ucose has more extensively been studied by
Arant ( 1978) • A gl.ucose reabsorption of 92% of the fil. tered l.oad is pre
sent in neonates with a gestational. age of 30 weeks, increasing to 99.7%
at 34 weeks of gestation, reflecting an increasing tubular transport capa
city with gestational. age. A significant increase in glucose excretion
combined with sodium and solute excretion has been reported during paren
teral feeding (Stonestreet et al.., 1980).
Phosphaturia in the preterm neonate is described by Me Crory et al..
(1952). More recently Karl.en et al.. (1985) confirmed and further analysed
this observation. Fractional phosphate excretion is high during the first
week of l.ife in the pre term infant compared to ful.l term infants ( 20% vs
3%). After this first week urinary phosphate excretion decreases quickly
and is even lower than observed in ol.der children (Brodehl. et al., 1982).
This seems to be an adaptive response to increase and preserve phosphate
stores. The data are supported by phosphate bal.ance studies in young
-18-
growing rats (Caverzasio et al., 1982). Rapidly growing young rats have a
higher phosphate reabsorption than older rats.
Aminoaciduria also occurs in preterm neonates (O'Brien and Butterfield,
1963). Brodehl and Gelissen ( 1968) investigated renal reabsorptive capa-
city for aminoacids in term infants and found limitations in reabsorption
compared to later in life. Although studies in preterm neonates are lack
ing we assume that they probably have an even lower reabsorptive capacity.
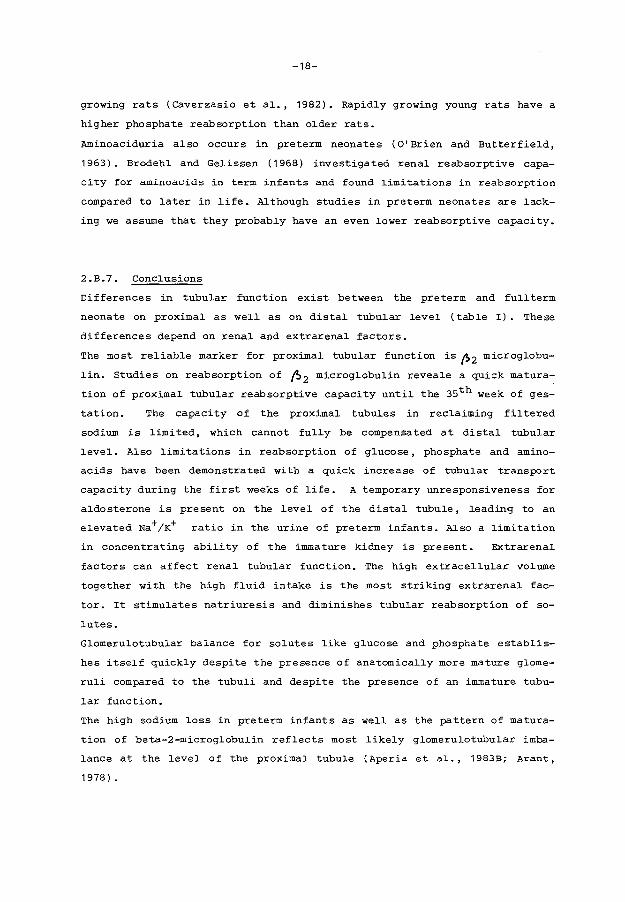
2.B.7. Conclusions
Differences in tubular function exist between the pre term and full term
neonate on proximal as well as on distal tubular level (table I) . These
differences depend on renal and extrarenal factors.
The most reliable marker for proximal tubular function is ~2 microglobu
lin. Studies on reabsorption of /.) 2 microglobulin reveale a quick matura
tion of proximal tubular reabsorptive capacity until the 35th week of ges-
tation. The capacity of the proximal tubules in reclaiming filtered
sodium is limited, which cannot fully be compensated at distal tubular
level. Also limitations in reabsorption of glucose, phosphate and amino
acids have been demonstrated with a quick increase of tubular transport
capacity during the first weeks of life. A temporary unresponsiveness for
aldosterone is present on the level of the distal tubule, leading to an
elevated Na+/K+ ratio in the urine of preterm infants. Also a limitation
in concentrating ability of the immature kidney is present. Extrarenal
factors can affect renal tubular function. The high extracellular volume
together with the high fluid intake is the most striking extrarenal fac
tor. It stimulates natriuresis and diminishes tubular reabsorption of so-
lutes.
Glomerulotubular balance for solutes like glucose and phosphate establis
hes itself quickly despite the presence of anatomically more mature glome
ruli compared to the tubuli and despite the presence of an immature tubu
lar function.
The high sodium loss in preterm infants as well as the pattern of matura
tion of beta-2-microglobulin reflects most likely glomerulotubular imba
lance at the level of the proximal tubule (Aperia et al., 1983B; Arant,
1978).
-19-
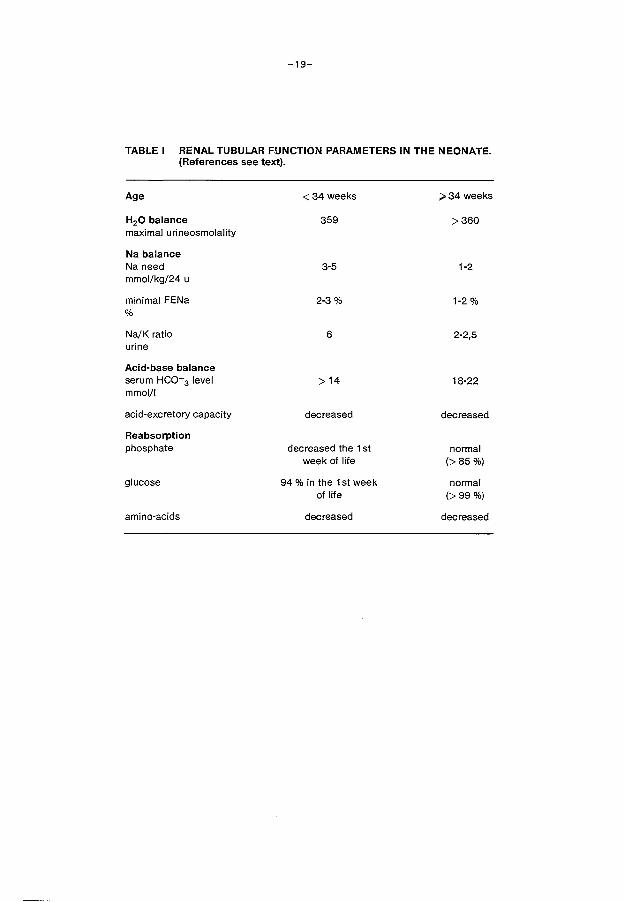
TABLE I RENAL TUBULAR FUNCTION PARAMETERS IN THE NEONATE. (References see text).
Age <34weeks >34 weeks
H20 balance 359 >360 maximal urineosmolality
Na balance Na need 3-5 1-2 mmol/kg/24 u
minimal FENa 2-3% 1-2% %
Na/K ratio 6 2-2,5 urine
Acid-base balance serum HC0-3 level >14 18-22 mmol/1
acid-excretory capacity decreased decreased
Reabsorption phosphate decreased the 1st normal
week of life (>85%)
glucose 94 % in the 1st week normal of life (>99%)
amino-acids decreased decreased

-20-
Chapter 2 RENAL FUNCTION IN THE PRETERM NEONATE
2.C. MECHANISMS OF RENAL TUBULAR ACIDIFICATION
2.C.1. General aspects
Renal regulation of acid-base balance consists of reabsorption of filtered
bicarbonate and net excretion of hydrogen ions in the form of either ammo
nium (NH4 +) or acid buffer salts. The proximal tubule is responsible for
the bulk of bicarbonate reabsorption, while the smaller amounts escaping
proximal reabsorption are reabsorbed in more distal segments of the
nephron. Net acid excretion occurs predominantly in the distal segments of
the nephron. Giebisch (1986) described in a review article, gathering data
from many experimental studies, the mechanisms responsible for bicarbonate
reabsorption and net acid excretion in the human being. Active bicarbonate
reabsorption on proximal tubular level depends on transepithelial hydrogen
ion secretion. This hydrogen ion secretion occurs by means of a sodium
hydrogen ion exchange at the luminal side of tubular cells. Hydrogen ions
secreted by the tubular cell couple with filtered bicarbonate to carbonic
acid (H2co3 ). Carbonic acid is converted to H2o and co2 under influence of
carbonic anhydrase present in the luminal wall of the proximal tubular
cells and only a small amount diffuses back into the cell as H2co3 • A low
permeability for HC03 in the apical cell membrane is supposed to be pre
s~nt. Na+-ions, which are transported in the cell via the sodium-hydrogen
ion exchange are eliminated from the cell to the peri tubular fluid by a
sodium-potassium ATP-ase. Also bicarbonate is actively extruded across the
basolateral membrane of proximal tubular cells together with sodium with a
stoichiometry of three bicarbonate ions to one sodium ion (figure I).
Passive reabsorption of bicarbonate does not substantially affect net bi-
carbonate reabsorption. It is mainly important when a large transcellular
bicarbonate gradient exists.
In the distal tubule and in the collecting ducts active electrogenic hy-
drogen ion secretion is present. This transport is sodium independent in
contrast to the described proximal sodium hydrogen ion exchange, but dis-
tal tubular sodium delivery is of importance for the maintenance of a lu-
men potential difference. Hydrogen ion secretion at the luminal tubular
side depends on basolateral bicarbonate chloride exchange (figure II). So
chloride concentration in the peritubular medium is crucial in this mecha-
nism.
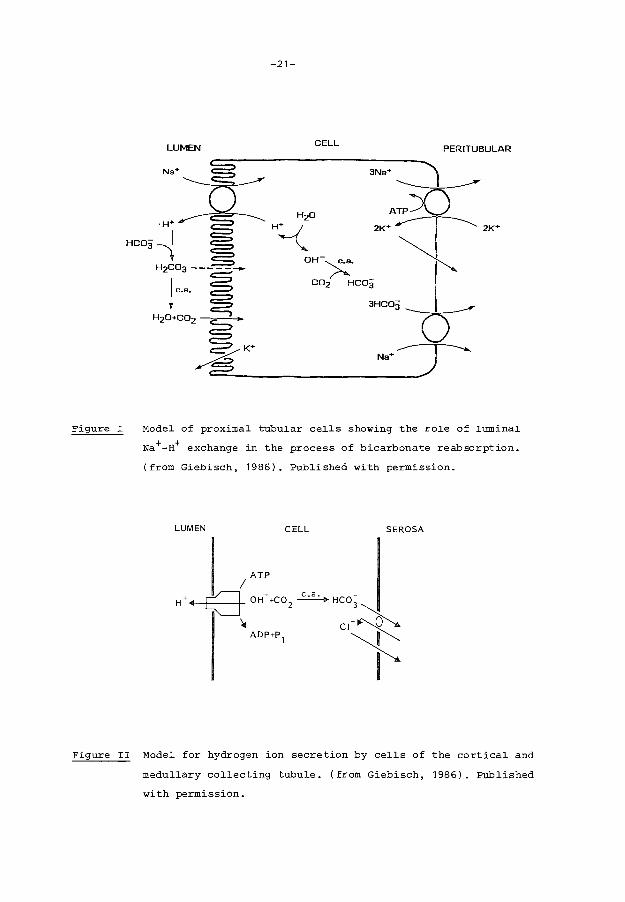
Figure I
-21-
LUMEN CELL PER I TUBULAR
Model of proximal tubular cells showing the role of luminal
Na+-H+ exchange in the process of bicarbonate reabsorption.
(from Giebisch, 1986). Published with permission.
LUMEN CELL SEROSA
ATP I
(] OH- +C0 2 ~ Hco;
• c•~l ADP+P 1 ......_ ~
I
Figure II Model for hydrogen ion secretion by cells of the cortical and
medullary collecting tubule. (from Giebisch, 1986). Published
with permission.
-22-
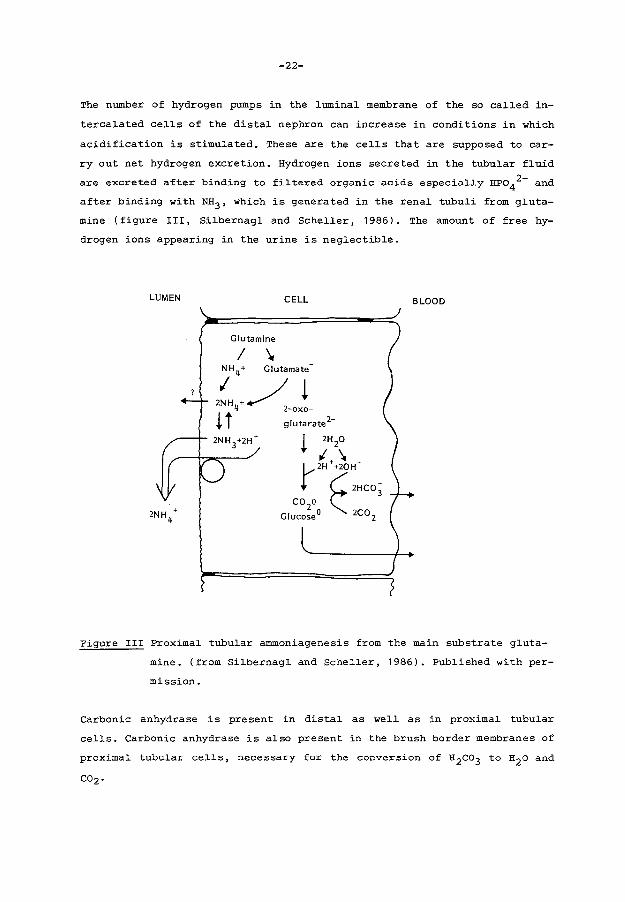
The number of hydrogen pumps in the luminal membrane of the so called in
tercalated cells of the distal nephron can increase in conditions in which
acidification is stimulated. These are the cells that are supposed to car
ry out net hydrogen excretion. Hydrogen ions secreted in the tubular fluid
are excreted after binding to fi~tered organic acids especia~~y HPo42- and
after binding with NH3 , which is generated in the rena~ tubu~i from g~uta
mine (figure III, Si~bernag~ and Scheller, 1986). The amount of free hy
drogen ions appearing in the urine is neglectible.
LUMEN CELL BLOOD
Figure III Proximal tubu~ar ammoniagenesis from the main substrate gluta
mine. (from Si~bernag~ and Sche~~er, 1986). Pub~ished with per-
mission.
Carbonic anhydrase is present in dista~ as well as in proxima~ tubular
ce~~s. Carbonic anhydrase is a~so present in the brush border membranes of
proxima~ tubu~ar ce~~s, necessary for the conversion of H2co3 to H2o and

-23-
2.C.2 Mechanisms of renal tubular acidification in the newborn
Newborn infants have lower serum bicarbonate levels than adults (Edelmann
Jr. et al., 1967A). This is even more pronounced in the preterm neonate.
Also metabolic acidosis is frequently observed in the premature infant
(Svenningsen and Lindquist, 1973). These data suggest a limitation in
renal acidifying capacity of newborns.
Clinical studies on this subject have been performed in two different
ways. Firstly bicarbonate reabsorption studies were performed (Edelmann
Jr. et al., 1967A; Tudvad et al., 1954; Svenningsen and Lindquist, 1973)
in which the bicarbonate load of the glomeruli varied. Secondly renal
tubular acid excretory capacity has been tested by means of acid loading
with NH4 Cl (Edelmann Jr. et al., 1967A; Edelmann Jr. et aL, 1967B;
Kerpel-Fronius et al., 1970; Sulyok et al., 1972; Svenningsen and Lind
quist, 1973; Svenningsen, 1974A).
Edelmann Jr. et al. ( 1967A) demonstrated in full term neonates that the
presence of a low serum bicarbonate level is the resultant of a low bicar
bonate threshold (defined as the serum bicarbonate level at which more
than 0.02 mmol HCo3- per 100 ml GFR appears in the urine). This phenomenon
remained present during the first year of life in the 6 children tested in
his study. Confirmations of the data were provided by an earlier study of
Tudvad et al. (1954) and later on by Svenningsen (1974A). The low bicarbo
nate threshold originates probably from the known heterogeneity of ne
phrons during the early stages of development and from proximal tubular
immaturity. However, also extrarenal factors may influence renal thres
hold. Evidence for extrarenal factors is provided by animal experiments.
The puppy as well as the fetal lamb both have a low bicarbonate threshold
compared to the adult animaL The threshold can easily be increased by
means of moderate extracellular volume contraction, thus leading to an
increase in serum bicarbonate levels in those animals (Moore et al., 1972;
Robillard et al., 1977). The study of Zilleruello et al. (1986) on frac
tional bicarbonate excretion in preterm infants during metabolic acidosis
and respiratory acidosis is an indication that extrarenal factors have the
same influence on bicarbonate reabsorption in the newborn. However, while
no filtration studies were performed in this study, no definite conclu
sions on bicarbonate reabsorption can be drawn from their results.
-24-
In evaluating distal tubular acidification acid loading studies have been
performed by Kerpel-Fronius et al. (1970) and Sulyok et al. (1972). They
demonstrated, after loading preterm infants with ammonium chloride, a cor
relation of blood bicarbonate levels, urinary excretion of ammonia and of
titrable acid with birth weight. The smaller premature infants tend to be
more acidotic and have lower NH4+ and titrable acid excretion rates. The
renal excretion of an acid load increases with both gestational and post
natal age.
So evidence is provided for tubular immaturity of the hydrogen ion excre
tory mechanisms. This is especially of importance in preterm infants re
ceiving a high protein intake. Data about renal tubular acidification in
the tiny premature infant remain however scarce.
Chapter 3
-25-
EFFECT OF HYPERCAPNIC ACIDOSIS ON RENAL FUNCTION IN THE
NEWBORN RABBIT
3.1. Abstract
Anaesthetized mechanically-ventilated newborn rabbits were exposed to dif
ferent degrees of hypercapnia. One hour of normocapnia was used as a con
trol period. Renal function studies demonstrated an increase in renal vas
cular resistance with a concomitant decrease in effective renal plasma
flow in a11 hypercapnic animals, combined with a less pronounced decrease
in glomerular filtration rate. Filtration fraction rose significantly. A
decrease in systemic b1ood pressure was only observed when the Paco2 ex
ceeded 100 mm Hg combined with an arterial pH below or equal to 7.10. We
conclude that normoxemic hypercapnia in the newborn rabbit leads to an
increase in renal vascular resistance and suggest that the renal vasocon
striction predominates at the level of the efferent arteriole.
* Published in "Pediatric Research 1986; 20: 798-801".
A.J. v.d. Heijden and J.P. Guignard.

-26-
3. 2. Introduction
A decrease in glomerular filtration rate (GFR) and urine output has been
described in newborn infants presenting with severe respiratory distress
syndrome ( 1 ,2,3). The factors responsible for these disturbances include
hypoxemia, hypercapnia, acidosis and a fall in systemic blood pressure.
The effect of isolated acute hypercapnic acidosis has not been extensively
studied in animals whose nephrogenesis has not yet been completed. Rosen
berg et al. ( 4) observed a consi stant but not significant decrease in
renal blood flow (RBF) in lambs undergoing mild hypercapnia (Paco2 60-70
mm Hg). In contrast, no changes were observed in fetal and adult sheep.
Alward et al. (5) observed a decrease in RBF, a stable GFR and an increase
in renal vascular resistance ( RVR) in piglets exposed to combined hyper
capnia (Paco2 70 mm Hg) and hypoxemia (Pao2 35 mm Hg). In adult animals
most studies have been performed in anaesthetised dogs, who frequently
presented with a decrease in RBF and GFR when the Paco2 exceeded 70 to 80
mm Hg (6, 7 ,8). The purpose of the present study was to investigate the
role of acute hypercapnia on renal function in the newborn rabbit before
the end of nephrogenesis.
3.3. Materials and methods
Experiments were performed on 5 to 12-day-old New Zealand white rabbits
(n=45), with a body weight varying from 81 to 214 g. The animals were
anaesthetised with 25 mg/kg sodium pentobarbital 0.5% intraperitoneally.
Additional small doses of pentobarbital were administered when needed
throughout the experiment. After tracheotomy the animals were artificial
ly ventilated (Harvard 683 Rodent Ventilator, Millis, M.A.). The respira
tory rate was kept constant at 40/min and tidal volume was adjusted for
age and weight. Body temperature, recorded by an intraesophageal thermome
ter was kept constant at 38.5°C, using a heating table and an infrared
lamp. The femoral vein and artery were catheterized with polyethylene
catheters (PE 10). Bladder catheterisation was performed for urine samp
ling. Arterial and ventilatory pressures were continuously measured, using
Statham transducers and recorded on a multichannel recorder (Model 7B
Polygrap Grass Instruments, Quincy, M.A.). The animals were paralysed for
the duration of the experiment with tubocurarine (25 ;rg/kg), which was
repeated as needed. Following surgery the animals received a priming dose
of an inulin-PAR solution (100 and 1.25 mg/kg, respectively). Thereafter a

-27-
solution containing 50 g mannitol, 3 g inulin, 0. 15 g PAH, 100 mmol NaCl
and 5 mmol KCl/liter, was infused at a rate of 1 ml/100 g/h, to provide
stable plasma levels of inulin ( 20-40 mg/1 00 ml) and PAH ( 0. 2-1 mg/1 00
ml). NaHco3 was added to the solution in varying amounts (see below).
The experiments were started 90-120 min after surgery when urinary flow
and blood pressure had stabilised. During the experiments timed urinary
collections of 30 min each were obtained and arterial blood sampling was
performed at the midpoint of alternate urinary collection periods (figure
I). Clearances of inuline and PAH ( CPAH) were calculated from standard
equations and used as estimates of GFR and effective renal plasma flow.
EXPERIMENTAL PROTOCOL
lnulin+PAH Priming Tubarine .. .. U1 U2 U3 U4 U5 U6
A A. A A BO 81 82 83
'===P=re=p=a=r=a=ti=on===il 61
=E=q=u=ilib=r=a=t=io=n=T=i=m=e==lll Control Period 1 t:l ==E=x=p=e=ri=m=e=n=t=a=l P=e=r=io=d==d
== 30 minutes
U 1.2.3.4.5.6 == Urine collection period of 30 minutes
B 0.1.2.3 == Blood samples
Figure I
The extraction of PAH was measured in a separate group of six hypercapnic
newborn animals infused with 1 mmol NaHC03/ kg per h (Paco2 = 96 ~ 6 (SEM)
mm Hg for 60 min) and compared to the value previously observed in a group
of 14 normocapnic newborn rabbits (Paco2 = 40 + 2 (SEM) mm Hg) studied in
this laboratory (9). The extraction was 0.55 + 0.03 (SEM) in the normo
capnic animals, and 0.56 ~ 0.09 (SEM) in the hypercapnic animals. A value
of 0.55 was subsequently used in the calculation of RBF, given by the for
mula (CPAH/EpAH)/(1-hematocrit) and the filtration fraction (FF) as GFR/
(CPAH/EPAH). RVR was calculated as mean arterial pressure (MAP)/RBF.
-28-
The fo~~owing chemica~ methods were used for b~ood and urine ana~ysis:
Inu~in and PAR by the Anthron-method and the Bratton-Marsha~~ method res
pective~y· (Technicon Auto-ana~yser, Technicon Instruments Corporation,
Terrytown, NY); gas-ana~ysis under anaerobic conditions with a b~ood gas
analyser (pH/Blood-Gas- Analyser 168, Corning, Ha~stead, Essex, Eng~and).
The fo~~owing experimenta~ protoco~s were used. The first 2 urinary co~
lection periods a~ways served as contro~s:
Group I (n=8) and group II (n=7): normocapnia was maintained during 3 con
secutive h.; the infusion de~ivered 0.5 (group I) and 1 (group II) mmo~
NaHC03/kg/h respective~y.
GrouE III (n=8) hypercaJ2nia: a Paco2 of 100 mm Hg was obtained using a
fixed gas mixture containing 13% co2 , 40% 02 and 47% N2. NaHC03 was added
to the infusion to deliver 0.5 mmo~ NaHco3/kg per h. Hypercapnia was
introduced fo~~owing the first contro~ hour and was maintained for 2 h.
Group IV (n=8) hyEercapnia: a Paco2 of 100 mm Hg was simi~ar~y obtained
and NaHco3 was added to the infusion to deliver 1 mmol NaHC03/kg per h.
The protocol was the same as used in group III.
GrouE V (n=8) hypercapnia: a Paco2 of 80 mm Hg was obtained, using a fix
·ed gas mixture containing 8% co2 , 40% o 2 and 52% N2 • The infusion de~ive
red 0.5 mmo~ NaHC03/kg/h.
Data ana~ysis: Because of the ~arge interindividual and inter~itter va
riations each anima~ was used as his own contro~. The changes between
contro~ and experimenta~ periods have been eva~ua ted by ca~cu~ ting the
significance of the difference between their means and zero, using the
t-test ( 1 0). In a~~ cases a p < 0.05 was considered statistical~y signi
ficant.
-29-
3.4. Results
Groups I and II:
Infusion of 0.5 mmol and 1 mmol sodiumbicarbonate during 3 consecutive h.
of normocapnia did not significantly influence blood pH, P a co2 and MAP.
Except for a significant rise in urinary flow rate in group II due to the
higher solute load, renal function remained essentially stable.
Effect of hypercapnia with a PaCO~ of 100 mm Hg and a NaHCOJ infusion rate
of 0.5 mmol NaHCOJ/kg/h (group III).
The Paco2 was increased from 39 mm Hg to 103 mm Hg in the 1st h. of hyper
capnia and to 106 mm Hg in the 2nd h. The serum pH diminished abruptly
from 7.48 to 7.10 during hypercapnia and remained stable for 2 hours. MAP
decreased slightly, but significantly, from 33.5 to 30.5 mm Hg, and urina
ry flow rate from 0.057 to 0.043 ml/min.kg (p<0.05). There was no signifi
cant change in urinary output between the 1st and 2nd h. of hypercapnia.
CPAH fell from 6.42 to 3.86 ml/min.kg within the 1st h. of hypercapnia and
to 3.33 ml/min.kg during the 2nd h. The clearance of inulin fell from 1.66
to 1.33 within 1 h. and to 1.22 ml/min.kg (table I) within the 2nd h.
Effect of hypercapnia with a P3Co~ of 100 mm Hg and a NaHCOJ infusion rate
of 1 mmol NaHC03/kg/h (Group IV).
The NaHco3 infusion rate was doubled in this group to partly blunt the
decrease in serum pH while maintaining the same P a co2 • The increase in
Paco2 was similar to that present in the first group, from 39 mm Hg to 104
mm Hg. The decrease in serum pH was less pronounced, from 7.51 to 7.17. No
decrease in MAP was observed and although urinary flow rate decreased from
0.064 to 0.058 ml/min.kg, the fall was not significant. However the de
crease of CPAH was similar from 5. 91 to 4. 14 in the 1st hypercapnic h.
and to 3.07 ml/min.kg in the 2nd hypercapnic h. The decrease in GFR obser
ved during the 1st h. oi hypercapnia was not significant from 1.56 to 1.36
ml/min.kg, but later reached statistical significance (p<0.05) (table I).

-30-
Effect of hypercapnia with a Paco~ of 80 mm Hg and a NaHCOa infusion rate
of 0.5 mmol NaHCOa/kg/h (Group V).
The Paco2 increased from 35 to 78 mm Hg in the 1st and to 80 mm Hg in the
2nd h. of hypercapnia. Serum pH decreased from 7.51 to 7.20 and remained
stable afterwards. MAP remained stable throughout the experiment and the
observed decrease in urinary volume was not significant. A marked decrease
in CPAH from 7.45 to 5.16 during the 1st h. and to 4.43 ml/kg per min du
ring the 2nd h. was also observed in this group. GFR declined from 2.03
to 1.57 and to 1.64 ml/min.kg in the 1st and 2nd h. respectively (table
I).
The decrease in RBF is shown in table II, together with the concomitant
increase in RVR. Filtration fraction increased in all hypercapnic groups.
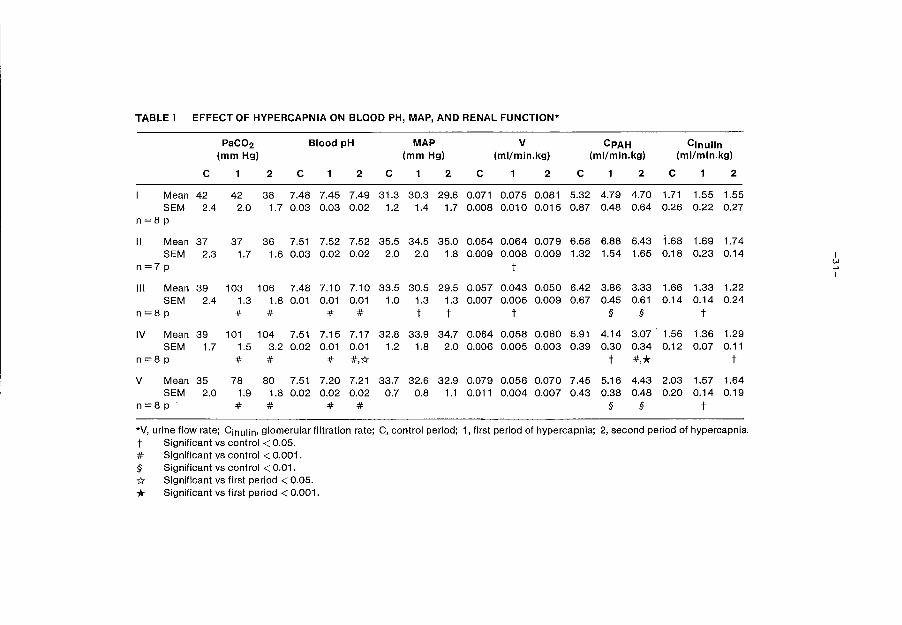
TABLE I EFFECT OF HYPERCAPNIA ON BLOOD PH, MAP, AND RENAL FUNCTION*
PaC02 Blood pH MAP v CPAH Cinulin (mmHg) (mmHg) (ml/min.kg) (ml/min.kg) (ml/min.kg)
c 1 2 c 1 2 c 1 2 c 1 2 c 1 2 c 1 2
Mean 42 42 38 7.48 7.45 7.49 31.3 30.3 29.6 0.071 0.075 0.081 5.32 4.79 4.70 1.71 1.55 1.55 SEM 2.4 2.0 1. 7 0.03 0.03 0.02 1.2 1.4 1.7 0.008 0.010 0.015 0.87 0.48 0.64 0.26 0.22 0.27
n=8p
II Mean 37 37 36 7.51 7.52 7.52 35.5 34.5 35.0 0.054 0.064 0.079 6.58 6.88 6.43 1.68 1.69 1.74 SEM 2.3 1.7 1.6 0.03 0.02 0.02 2.0 2.0 1.8 0.009 0.008 0.009 1.32 1.54 1.65 0.18 0.23 0.14 I
n=7p t ~ I
Ill Mean 39 103 106 7.48 7.10 7.10 33.5 30.5 29.5 0.057 0.043 0.050 6.42 3.86 3.33 1.66 1.33 1.22 SEM 2.4 1.3 1.8 0.01 0.01 0.01 1.0 1.3 1.3 0.007 0.005 0.009 0.67 0.45 0.61 0.14 0.14 0.24
n=8p # # # # t t t § § t
IV Mean 39 101 104 7.51 7.15 7.17 32.8 33.9 34.7 0.064 0.058 0.060 5.91 4.14 3.07 1.56 1.36 1.29 SEM 1.7 1.5 3.2 0.02 0.01 0.01 1.2 1.8 2.0 0.006 0.005 0.003 0.39 0.30 0.34 0.12 0.07 0.11
n=8p # # # #,{( t *·* t
v Mean 35 78 80 7.51 7.20 7.21 33.7 32.6 32.9 0.079 0.056 0.070 7.45 5.16 4.43 2.03 1.57 1.64 SEM 2.0 1.9 1.8 0.02 0.02 0.02 0.7 0.8 1.1 0.011 0.004 0.007 0.43 0.38 0.48 0.20 0.14 0.19
n=8p # # # # § § t
*V, urine flow rate; Cinulin• glomerular filtration rate; C, control period; 1, first period of hypercapnia; 2, second period of hypercapnia.
t Significant vs control < 0.05. # Significant vs control < 0.001. § Significant vs control < 0.01.
* Significant vs first period < 0.05.
* Significant vs first period < 0.001.
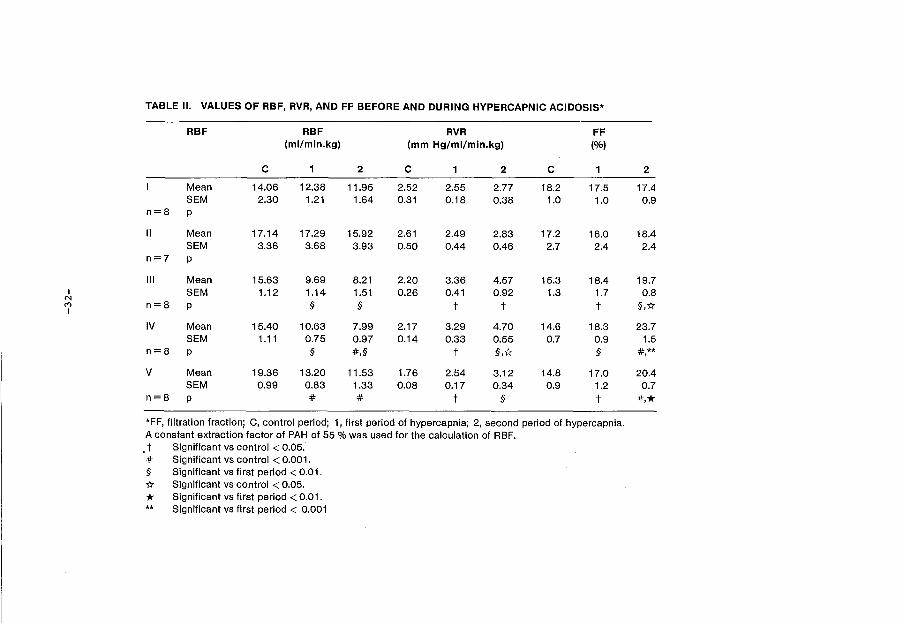
TABLE II. VALUES OF RBF, RVR, AND FF BEFORE AND DURING HYPERCAPNIC ACIDOSIS*
RBF RBF RVR FF (ml/min.kg) (mm Hg/ml/min.kg) (%)
c 1 2 c 1 2 c 1 2
Mean 14.06 12.38 11.95 2.52 2.55 2.77 18.2 17.5 17.4 SEM 2.30 1.21 1.64 0.31 0.18 0.38 1.0 1.0 0.9
n=8 p
II Mean 17.14 17.29 15.92 2.61 2.49 2.83 17.2 16.0 18.4 SEM 3.36 3.68 3.93 0.50 0.44 0.46 2.7 2.4 2.4
n=7 p
Ill Mean 15.63 9.69 8.21 2.20 3.36 4.57 15.3 18.4 19.7 I SEM 1.12 1.14 1.51 0.26 0.41 0.92 1.3 1.7 0.8
N M I
n=8 p § § t t t §,1:1:
IV Mean 15.40 10.63 7.99 2.17 3.29 4.70 14.6 18.3 23.7 SEM 1.11 0.75 0.97 0.14 0.33 0.55 0.7 0.9 1.5
n=8 p § #,§ t §,1:1: § #** ' v Mean 19.36 13.20 11.53 1.76 2.54 3.12 14.8 17.0 20.4
SEM 0.99 0.83 1.33 0.08 0.17 0.34 0.9 1.2 0.7 n=8 p # # t § t *·* *FF, filtration fraction; C, control period; 1, first period of hypercapnia; 2, second period of hypercapnia. A constant extraction factor of PAH of 55% was used for the calculation of RBF. . t Significant vs control < 0.05 . # Significant vs control < 0.001. § Significant vs first period < 0.01. 1:1: Significant vs control < 0.05.
* Significant vs first period < 0.01. ** Significant vs first period < 0.001
-33-
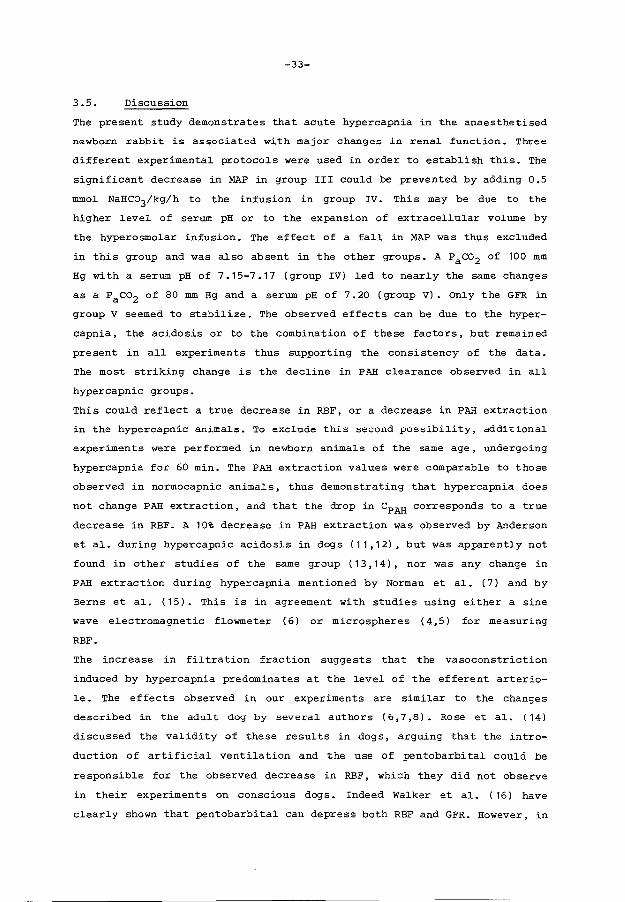
3.5. Discussion
The present study demonstrates that acute hypercapnia in the anaesthetised
newborn rabbit is associated wi.th major changes in renal function. Three
different experimental protocols were used in order to establish this. The
significant decrease in MAP in group III could be prevented by adding 0.5
mmol NaHC03/kg/h to the infusion in group IV. This may be due to the
higher level of serum pH or to the expansion of extracellular volume by
the hyperosmolar infusion. The effect of a fall in MAP was thus excluded
in this group and was also absent in the other groups. A Paco2 of 100 mm
Hg with a serum pH of 7.15-7.17 (group IV) led to nearly the same changes
as a Paco2 of 80 mm Hg and a serum pH of 7.20 (group V). Only the GFR in
group V seemed to stabilize. The observed effects can be due to the hyper
capnia, the acidosis or to the combination of these factors, but remained
present in all experiments thus supporting the consistency of the data.
The most striking change is the decline in PAH clearance observed in all
hypercapnic groups.
This could reflect a true decrease in RBF, or a decrease in PAH extraction
in the hypercapnic animals. To exclude this second possibility, additional
experiments were performed in newborn animals of the same age, undergoing
hypercapnia for 60 min. The PAH extraction values were comparable to those
observed in normocapnic animals, thus demonstrating that hypercapnia does
not change PAH extraction, and that the drop in CPAH corresponds to a true
decrease in RBF. A 10% decrease in PAH extraction was observed by Anderson
et al. during hypercapnic acidosis in dogs (11,12), but was apparently not
found in other studies of the same group ( 13, 14), nor was any change in
PAH extraction during hypercapnia mentioned by Norman et al. ( 7) and by
Berns et al. (15). This is in agreement with studies using either a sine
wave electromagnetic flowmeter (6) or microspheres (4,5) for measuring
RBF.
The increase in filtration fraction suggests that the vasoconstriction
induced by hypercapnia predominates at the level of the efferent arterio
le. The effects observed in our experiments are similar to the changes
described in the adult dog by several authors (6,7,8). Rose et al. (14)
discussed the validity of these results in dogs, arguing that the intro
duction of artificial ventilation and the use of pentobarbital could be
responsible for the observed decrease in RBF, which they did not observe
in their experiments on conscious dogs. Indeed Walker et al. ( 16) have
clearly shown that pentobarbital can depress both RBF and GFR. However, in
-34-
the protocol used by Rose, the levels of Paco2 were much lower than in our
study, or in the studies mentioned above (6,7,8). It should also be noted
that in another study the same group did not find a decrease in RBF in si
milar conditions despite the use of pentobarbital, at least when MAP was
stable (13). That the decrease in RBF observed in our experiments is not
due either to pentobarbital or to the artificial ventilation is demonstra
ted by the stability of the two control groups throughout the experiment.
Several mechanisms may contribute to the decrease in RBF observed during
hypercapnia. A major activation of the renin-angiotensin system has been
found in neonates with respiratory distress syndrome ( 17) as well as in
adults with acute hypercapnia (18). This has been confirmed in animal ex
periments by Kurtz and Zehr ( 19). A predominant effect of angiotensin II
on the efferent arteriole of the rabbit kidney has been observed by
Edwards (20), which may explain the increase in filtration fraction in our
experiments.
The changes in RBF observed in our experiments can thus be due to a direct
stimulation of the renin-angiotensin system by hypercapnia, or to a stimu
lation via the renal nerves as suggested by different authors (7,12,13,15,
20).
Arginine vasopressin (AVP) may be another important factor. An hyperosmo
lar infusion was used in our newborn rabbits. This may have stimulated AVP
secretion, as has been demonstrated in the fetal sheep (21). The hyperse
cretion of AVP did certainly not influence renal hemodynamics or urinary
volume in the two control groups. Hypercapnia per se also stimulates AVP
secretion, as observed in the adult dog by Berns et al. (15). Thus a role
for AVP in our experiments cannot be excluded.
In conclusion, acute hypercapnic acidosis in the anaesthetised newborn
rabbit leads to an increase in RVR, a decrease in RBF and, as a result of
this, a decrease in GFR. We suggest that the renal disturbances observed
in neonates with respiratory distress syndrome could be due, at least in
part, to the effect of hypercapnic acidosis superimposed on the already
known effects of hypoxemia.
-35-
3.6. References
1. Guignard JP, Torrado A, Mazouni SM, Gautier E. Renal function in res
piratory distress syndrome. J Pediatr 1976; 88: 845-850.
2. Torrado A, Guignard JP, Prod'hom LS, Gautier E. Hypoxaemia and renal
function in newborns with respiratory distress syndrome (RDS). Helv
Paediatr Acta 1974; 29: 399-405.
3. Cort RL. Renal function in the respiratory distress syndrome. Acta
Paediatr Scand 1962; 51: 313-323.
4. Rosenberg AA, Koehler RC, Jones Jr. MD. Distribution of cardiac output
in fetal and neonatal lambs with acute respiratory acidosis. Pediatr
Res 1984; 18: 731-735.
5. Alward CT, Hook JB, Helmrath TA, Bailie MD. Effects of asphyxia on re
nal function in the newborn piglet. Pediatr Res 197.8; 12: 225-228.
6. Bersentes TJ, Simmons DH. Effects of acute acidosis on renal hemodyna
mics. Am J Physiol 1967; 212: 633-640.
7. Norman JN, Macintyre J, Shearer JR, Craigen IM, Smith G. Effect of
carbon dioxide on renal blood flow. Am J Physiol 1970; 219: 672-676.
8. Farber MO, Szwed JJ, Dowell AR, Strawbridge RA. The acute effects of
respiratory and metabolic acidosis on renal function in the dog. Clin
Sci Mol Med 1976; 50: 165-169.
9. Valloton M. Maturation de la fonction renale chez le lapin nouveau-ne:
effet de l'hypoxemie. These, Universite de Lausanne, Switzerland,
1985.
10. Snedecor G. Statistical methods, applied to experiment in agriculture
and in biology. Ames (Iowa): Iowa State College Press, 1950.
-36-
11. Anderson RJ, Henrich WL, Gross PA, Dillingham MA. Role of renal ner
ves, angiotensin II, and prostaglandins in the antinatriuretic res
ponse· to acute hypercapnic acidosis in the dog. Circ Res 1982; 50:
294-300.
12. Anderson RJ, Pluss RG, Pluss WT, Bell J, Zerbe GG. Effect of hypoxia
and hypercapnic acidosis on renal autoregulation in the dog: role of
renal neryes. Clin Sci 1983; 65: 533-538.
13. Anderson RJ, Rose Jr. CE, Berns AS, Erickson AL, Arnold PE. Mechanism
of effect of hypercapnic acidosis on renin secretion in the dog. Am J
Physiol 1980; 238: F119-F125.
14. Rose Jr. CE, Walker BE, Erickson A, Kaiser DL, carey RM, Anderson RJ.
Renal and cardiovascular responses to acute hypercapnic acidosis in
conscious dogs: role of renin-angiotensin. J Cardiovasc Pharmacal
1982; 4: 676-687.
15. Berns AS, Anderson RJ, McDonald KM. Effect of hypercapnic acidosis on
renal water excretion in the dog. Kidney Int 1979; 15: 116-125.
16. Walker LA, Buscemi-Bergin M, Gellai M. Renal hemodynamics in conscious
rats: effects of anesthesia, surgery, and recovery. Am J Physiol 1983;
245: F67-F74.
17. Broughton Pipkin F, Smales ORC. A study of factors affecting blood
pressure and angiotensin II in newborn infants. J Pedia tr 1977; 91 :
113-119.
18. Anderson WH, Datta J, Samols E. The renin angiotensin system in pa
tients with acute respiratory insufficiency. Chest 1976; 69 ( suppl):
309-311.
19. Kurz KD, Zehr JE. Mechanisms of enhanced renin secretion during co2-
retention in dogs. Am J Physiol 1978; 234: H573-H581.

-37-
20. Edwards RM. Segmenta1 effects of norepinephrine and angiotensin II on
iso1ated rena1 microvesse1s. Am J Physio1 1983; 244: F526-F534.
21. Weitzman RE, Fisher DA, Robi11ard J, Erenberg A, Kennedy R, Smith F.
Arginine vasopressin response to an osmotic stimu1us in the feta1
sheep. Pediatr Res 1978; 12: 35-38.
-38-
Chapter 4 BICARBONATE REABSORPTION BY THE NEWBORN RABBIT KIDNEY
4.1. Abstract
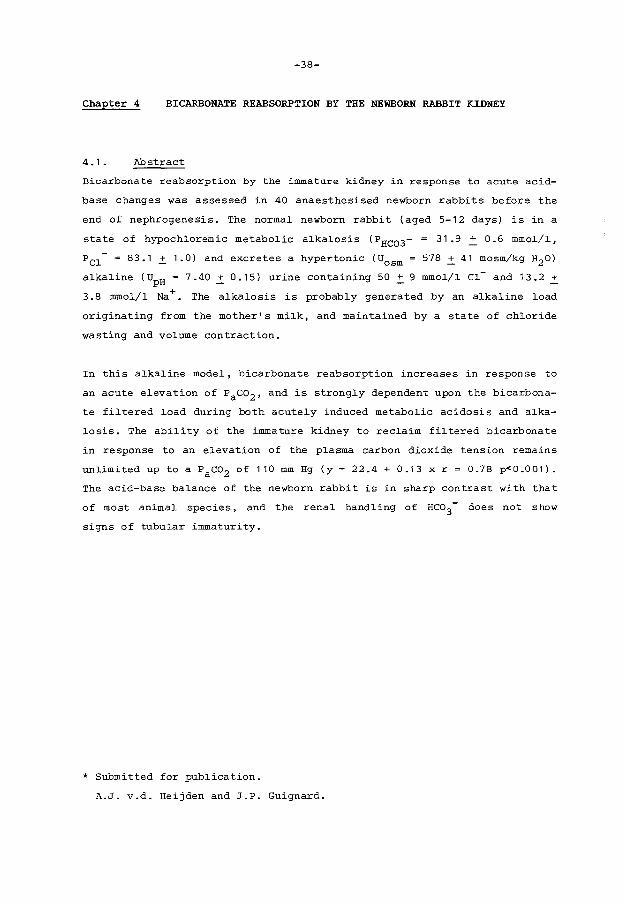
Bicarbonate reabsorption by the immature kidney in response to acute acid-
base changes was assessed in 40 anaesthesised newborn rabbits before the
end of nephrogenesis. The normal newborn rabbit (aged 5-12 days) is in a
state of hypochloremic metabolic alkalosis (PHC03- 31.9 + 0.6 mmol/1,
Pel-= 83.1 + 1.0) and excretes a hypertonic (Uosm 578 ~ 41 mosm/kg H20)
alkaline (UpH = 7.40 ~ 0.15) urine containing 50~ 9 mmol/1 Cl- and 13.2 ~
3.8 mmol/1 Na+. The alkalosis is probably generated by an alkaline load
originating from the mother's milk, and maintained by a state of chloride
wasting and volume contraction.
In this alkaline model, bicarbonate reabsorption increases in response to
an acute elevation of Paco2 , and is strongly dependent upon the bicarbona
te filtered load during both acutely induced metabolic acidosis and alka
losis. The ability of the immature kidney to reclaim filtered bicarbonate
in response to an elevation of the plasma carbon dioxide tension remains
unlimited up to a Paco2 of 110 mm Hg (y = 22.4 + 0.13 x r = 0.78 p<0.001).
The acid-base balance of the newborn rabbit is in sharp contrast with that
of most animal species, and the renal handling of HC03- does not show
signs of tubular immaturity.
* Submitted for publication.
A.J. v.d. Heijden and J.P. Guignard.
-39-
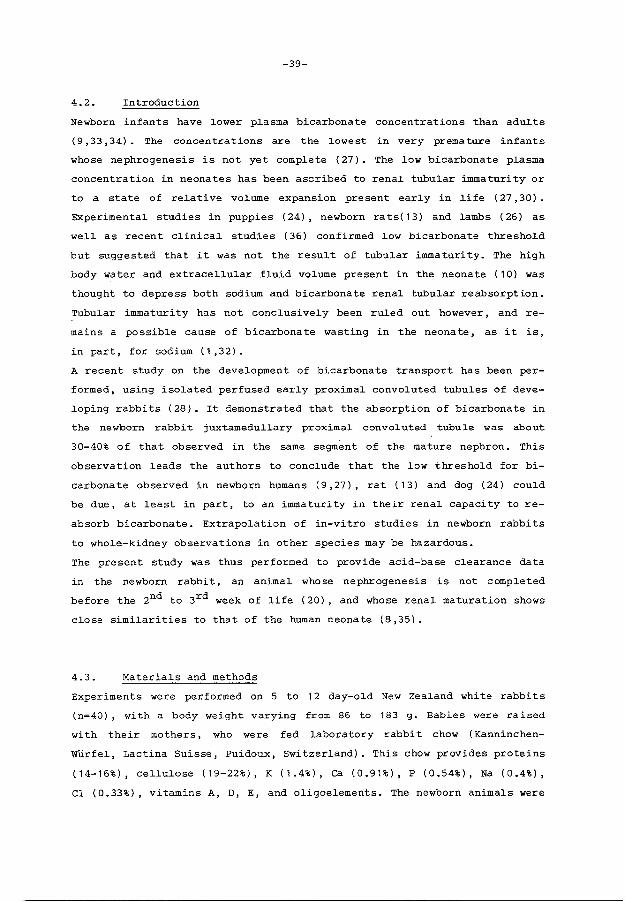
4.2. Introduction
Newborn infants have lower plasma bicarbonate concentrations than adults
(9,33,34). The concentrations are the lowest in very premature infants
whose nephrogenesis is not yet complete (27). The low bicarbonate plasma
concentration in neonates has been ascribed to renal tubular immaturity or
to a state of relative volume expansion present early in life (27 ,30).
Experimental studies in puppies (24), newborn rats(13) and lambs (26) as
well as recent clinical studies (36) confirmed low bicarbonate threshold
but suggested that it was not the result of tubular immaturity. The high
body water and extracellular fluid volume present in the neonate (10) was
thought to depress both sodium and bicarbonate renal tubular reabsorption.
Tubular immaturity has not conclusively been ruled out however, and re
mains a possible cause of bicarbonate wasting in the neonate, as it is,
in part, for sodium (1,32).
A recent study on the development of bicarbonate transport has been per
formed, using isolated perfused early proximal convoluted tubules of deve
loping rabbits (28). It demonstrated that the absorption of bicarbonate in
the newborn rabbit juxtamedullary proximal convoluted tubule was about
30-40% of that observed in the same segment of the mature nephron. This
observation leads the authors to conclude that the low threshold for bi
carbonate observed in newborn humans (9,27), rat (13) and dog (24) could
be due, at least in part, to an immaturity in their renal capacity tore-
absorb bicarbonate. Extrapolation of in-vitro studies in newborn rabbits
to whole-kidney observations in other species may be hazardous.
The present study was thus performed to provide acid-base clearance data
in the newborn rabbit, an animal whose nephrogenesis is not completed
before the 2nd to 3rd week of life (20), and whose renal maturation shows
close similarities to that of the human neonate (8,35).
4.3. Materials and methods
Experiments were performed on 5 to 12 day-old New Zealand white rabbits
(n=40), with a body weight varying from 86 to 183 g. Babies were raised
with their mothers, who were fed laboratory rabbit chow (Kanninchen
Wurfel, Lactina Suisse, Puidoux, Switzerland). This chow provides proteins
(14-16%), cellulose (19-22%), K (1.4%), Ca (0.91%), P (0.54%), Na (0.4%),
Cl (0.33%), vitamins A, D, E, and oligoelements. The newborn animals were

-40-
anaesthetized with 25 mg/kg 0.5% sodium pentobarbital. intraperitoneal.l.y.
Additional. smal.l. doses of pentobarbital were administered when needed
throughout the experiment. After tracheotomy the animals were artificial.l.y
ventilated (Harvard 683 Rodent Ventilator, Mil.l.is, MA, USA). The respira
tory rate was kept constant at 40/min and tidal. volume was adjusted for
age and weight. Body temperature, recorded by an intraesophageal. thermo
meter, was kept constant at 38.5• c, using a heating tabl.e and an infrared
lamp. The femoral vein and artery were catheterized with pol.yethyl.ene ca
theters (PE 10). Bladder catheterization was performed for urine sampling.
The first urine and bl.ood samples were obtained immediately after cathete
rization, in order to obtain basal. val.ues.
Arterial. and ventilatory pressures were continuously measured, using Stat
ham P23ID transducers and recorded on a multichannel recorder (Model. 7B
Polygraph, Grass Instruments, Quincy, MA, USA). The animals were paralyzed
for the duration of the experiment with tubocurarine (25 pg/kg), which was
repeated as needed. Following surgery the animals received a priming dose
of an inulin solution ( 100 mg/kg) • Thereafter a solution containing 3 g
inul.in and 5 mmol KCL per l.iter was infused at a rate of 1 ml/100 g/h to
provide stabl.e plasma levels of inul.in (20-40 mg/100 ml). Mannitol., NaCl,
NaHco3 and NH4 Cl were added to the infusion depending on the protocol that
was used (see bel.ow).
EXPERIMENTAL PROTOCOL
Inulin Priming Tubarine
uo v v U1 U2 U3 U4 U5 U6
A A A A BO B1 B2 B3
Preparation 11 Equilibration Time I' Control Period 1 bl ==E=x==p=e=r"=m=e=n=t=a=l =P=er=io=d==="
= 30 minutes
U 0.1.2.3.4.5.6 = Urine collection period of 30 minutes
B 0.1.2.3 = Blood samples
Figure I

-41-
The experiments were started 90-120 min after surgery, when urine flow
rate and blood pressure had stabilized. During the experiment timed
urinary collections of 30 min each were obtained and arterial blood
sampling was performed at the midpoint of alternate urinary collection
periods (figure I).
We previously demonstrated that blood pressure, heart rate and renal func
tions remain stable for up to 3 hours after equilibration in this animal
preparation ( 8, 17 , 35) • The clearance of inulin was calculated from the
standard equation and used as an estimate of GFR. The following chemical
methods were used for blood and urinary analysis: inulin by the Anthron
method (Technicon Autoanalyzer, Technicon Instruments Corporation, Terry
town, NY, USA); Na and K by flame photometry (Flame Photometer 543,
Instrument Laboratory, Inc., Lexington, Mass, USA); Cl by colorimetric
electrotitration (Chloride Meter 920, Corning, Halstead, Essex, England),
osmolali 1:.y by vapour pressure osmometry ( Wescor 51 OOc Vapour Pressure
Osmometer, Wescor Inc., Logan, Utah, USA) : gas-analysis under anaerobic
conditions with a blood gas-analyser (pH/Blood-Gas Analyser 168, Corning,
Halstead, Essex, England).
Filtered bicarbonate was taken as the product of the filtration rate and
the plasma bicarbonate concentration without correction for the Donnan
factor. Bicarbonate reabsorption was calculated from the filtered minus
the excreted rate, and expressed in pmol per ml GFR. The following expe
rimental protocols were used, where the first two urine collection periods
always served as controls:
Group 1 (n=8) Normocapnia:
Normocapnia with a P a co2 close to 40 mm Hg was maintained during 3 con
secutive h. The infusion contained 100 mmol/l NaCl, 50 mmol/l NaHco3 and
50 g/l mannitol in addition to the other solutes described above.
Group 2 (n=8) Hypercapnia:
Following a normocapnic control period, hypercapnia with a Paco2 close to
80 mm Hg was induced, using a gas mixture containing 8% co2 , 40% o2
and
52% N2 . Hypercapnia was maintained for 2 h. The infusion was the same as
described for group 1.
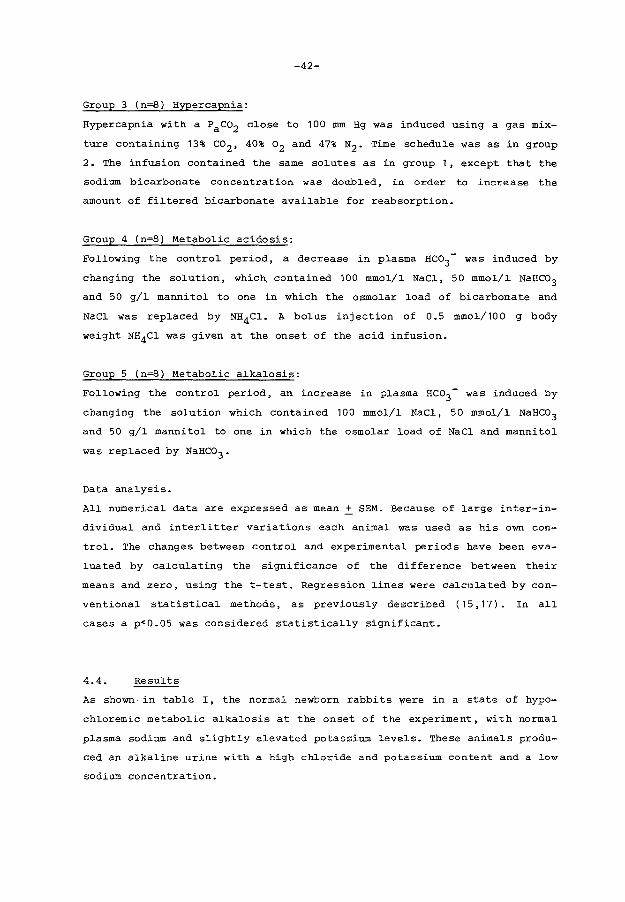
-42-
Group 3 (n=8) Hypercapnia:
Hypercapnia with a Paco2 close to 100 mm Hg was induced using a gas mix
ture containing 13% co2 , 40% o 2 and 47% N2 • Time schedule was as in group
2. The infusion contained the same solutes as in group 1, except that the
sodium bicarbonate concentration was doubled, in order to increase the
amount of filtered bicarbonate available for reabsorption.
Group 4 (n=8) Metabolic acidosis:
Following the control period, a decrease in plasma HC03- was induced by
changing the solution, which. contained 100 mmol/1 NaCl, 50 mmol/1 NaHC03 and 50 g/1 mannitol to one in which the osmolar load of bicarbonate and
NaCl was replaced by NH4Cl. A bolus injection of 0.5 mmol/100 g body
weight NH4Cl was given at the onset of the acid infusion.
Group 5 (n=8) Metabolic alkalosis:
Following the control period, an increase in plasma Hco3- was induced by
changing the solution which contained 100 mmol/1 NaCl, 50 mmol/1 NaHC03 and 50 g/1 mannitol to one in which the osmolar load of NaCl and mannitol
was replaced by NaHC03 •
Data analysis.
All numerical data are expressed as mean ~ SEM. Because of large inter-in
dividual and interlitter variations each animal was used as his own con-
trol. The changes between control and experimental periods have been eva
luated by calculating the significance of the difference between their
means and zero, using the t-test. Regression lines were calculated by con
ventional statistical methods, as previously described ( 15,17). In all
cases a p<0.05 was considered statistically significant.
4.4. Results
As shown in table I, the normal newborn rabbits were in a state of hypo
chloremic metabolic alkalosis at the onset of the experiment, with normal
plasma sodium and slightly elevated potassium levels. These animals produ
ced an alkaline urine with a high chloride and potassium content and a low
sodium concentration.
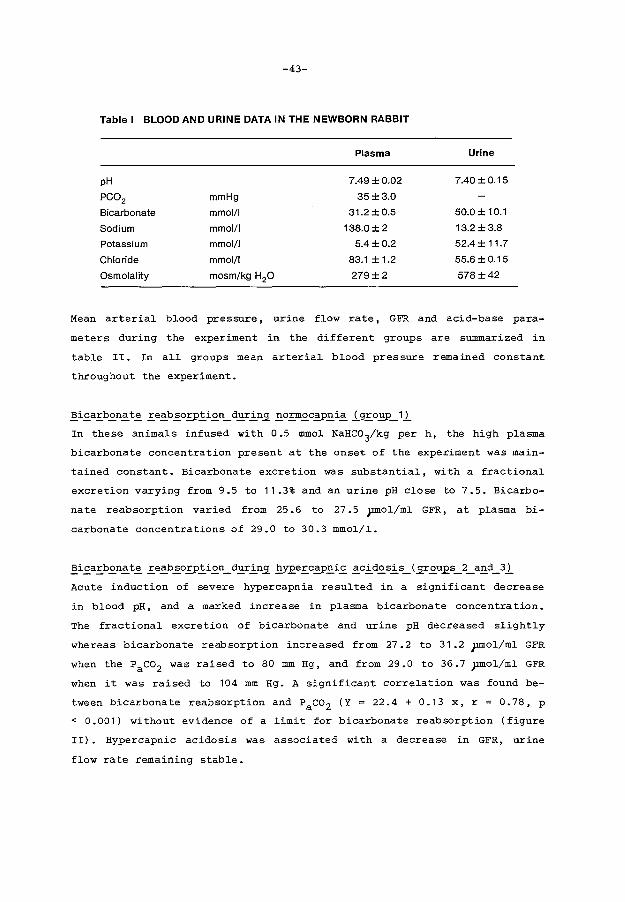
-43-
Table I BLOOD AND URINE DATA IN THE NEWBORN RABBIT
Plasma Urine
pH 7.49 ±0.02 7.40±0.15
PC02 mmHg 35±3.0
Bicarbonate mmol/1 31.2±0.5 50.0 ± 10.1
Sodium mmol/1 138.0 ± 2 13.2 ±3.8
Potassium mmol/1 5.4±0.2 52.4 ± 11.7
Chloride mmol/1 83.1 ±1.2 55.6 ±0.15
Osmolality mosm/kg H20 279±2 578±42
Mean arterial blood pressure, urine flow rate, GFR and acid-base para
meters during the experiment in the different groups are summarized in
table II. In all groups mean arterial blood pressure remained constant
throughout the experiment.
~i_£aE_b~n~t~_E.e~b~O.EJ>.!i~n_d.:!:!_r.!_n:;L_£O_E.m~c2J>_£i~.i_g_E.o_£P_1.l_
In these animals infused with 0.5 mmol NaHC03/kg per h, the high plasma
bicarbonate concentration present at the onset of the experiment was main-
tained constant. Bicarbonate excretion was substantial, with a fractional
excretion varying from 9.5 to 11.3% and an urine pH close to 7.5. Bicarbo
nate reabsorption varied from 25.6 to 27.5 pmol/ml GFR, at plasma bi
carbonate concentrations of 29.0 to 30.3 mmol/1.
~i.£aE>~n~t~_E.e~b~O.EJ>.!i~n_d~r.!_n:;!.E_Y.E.e_E.C2J>_£i.£~C.!_d~s.!_s_(_sr~u.J2.S_2_a_£d_3.l_
Acute induction of severe hypercapnia resulted in a significant decrease
in blood pH, and a marked increase in plasma bicarbonate concentration.
The fractional excretion of bicarbonate and urine pH decreased slightly
whereas bicarbonate reabsorption increased from 27.2 to 31.2 pmol/ml GFR
when the Paco2 was raised to 80 mm Hg, and from 29.0 to 36.7 pmol/ml GFR
when it was raised to 104 mm Hg. A significant correlation was found be-
tween bicarbonate reabsorption and Paco2 (Y = 22.4 + 0.13 x, r o. 78' p
< 0.001) without evidence of a limit for bicarbonate reabsorption (figure
II). Hypercapnic acidosis was associated with a decrease in GFR, urine
flow rate remaining stable.

-44-
50 Reabsbrbed Hco;
pmol/ml GFR
40 • • I
• • •
• 30
• p =<0.001
• r =0.78 • n =32 •
20 20 30 40 50 60 70 80 90 100 110 120
PaCO mm Hg 2
Figure II Bicarbonate reabsorption as a function of the plasma carbon
dioxide tension.
~e_!a_£o~i_£~c.!_d.£s.!_s_(_2r.£U.£_!)
Infusion of NH4 Cl at a rate of 1.5 mmol/kg per h after a bolus injection
of 0.05 mmol/kg induced a sharp decrease in plasma bicarbonate, from 29.3
to 18.7 mmol/l, associated with a significant decrease in bicarbonate re
absorption from 26.6 to 18.0 pmol/ml GFR and a non significant decrease in
the fractional excretion of bicarbonate. Urine pH also decreased slightly,
as did glomerular filtration rate. Urine flow rate remained stable.
~i_£a.E_b.£n~t~.E_e~b~o.E_P_!i.£Il_d_£r.!_n_[_!!a.!!_C2_3-iE_fE_s.!_oE_.i_g.E_o_£p_5l
Infusion of hypertonic bicarbonate at a rate of 3 mmol/kg per h. moderate
ly increased plasma bicarbonate concentration, from 30.4 to 33.2 mmol/l.
This was associated with a slight non significant increase in bicarbonate
reabsorption and a non significant increase in bicarbonate fractional ex-
cretion. A slight transient decrease in GFR and urine flow rate was noted
during the first hour of bicarbonate infusion.
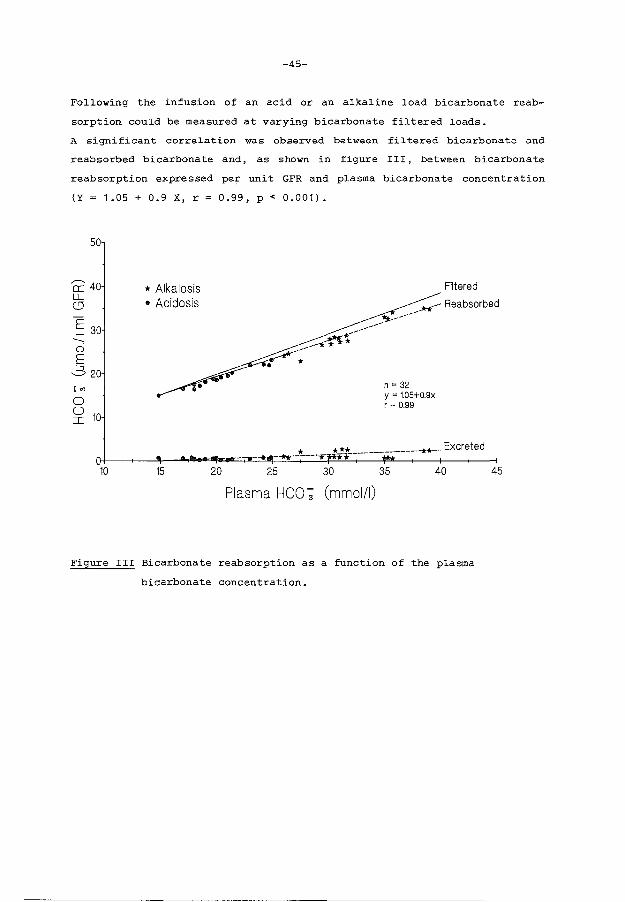
-45-
Following the infusion of an acid or an alkaline load bicarbonate reab
sorption could be measured at varying bicarbonate filtered loads.
A significant correlation was observed between filtered bicarbonate and
reabsorbed bicarbonate and, as shown in figure III, between bicarbonate
reabsorption expressed per unit GFR and plasma bicarbonate concentration
(Y = 1.05 + 0.9 X, r = 0.99, p < 0.001).
50
::::::: 0 E 22o
'"' 0
~ 10
*Alkalosis • Acidosis
----~:{*f'f-
.-~-----o. *
~-------
n = 32
Filtered
-*1<-- Reabsorbed
y = 1.05+0.9x r = 0.99
Plasma HCO ~ (mmol/1)
Figure III Bicarbonate reabsorption as a function of the plasma
bicarbonate concentration.
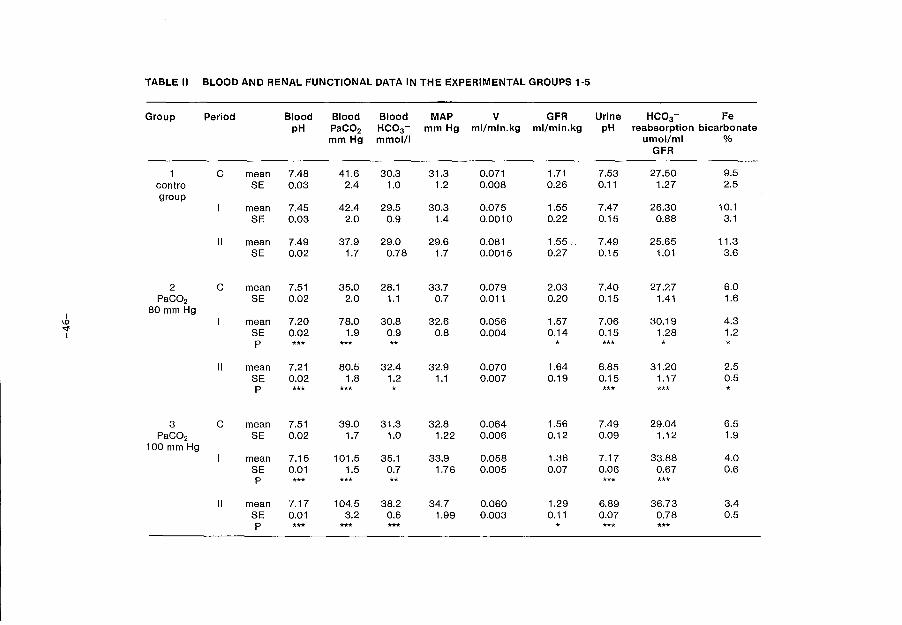
TABLE II BLOOD AND RENAL FUNCTIONAL DATA IN THE EXPERIMENTAL GROUPS 1-5
Group Period Blood Blood Blood MAP v GFR Urine HC03- Fe pH PaC02 HC03- mm Hg ml/min.kg ml/min.kg pH reabsorption bicarbonate
mmHg mmol/1 umol/ml o/o GFR
c mean 7.48 41.6 30.3 31.3 0.071 1.71 7.53 27.50 9.5 control SE 0.03 2.4 1.0 1.2 0.008 0.26 0.11 1.27 2.5 group
mean 7.45 42.4 29.5 30.3 0.075 1.55 7.47 26.30 10.1 SE 0.03 2.0 0.9 1.4 0.0010 0.22 0.15 0.88 3.1
II mean 7.49 37.9 29.0 29.6 0.081 1.55. 7.49 25.65 11.3 SE 0.02 1.7 0.78 1.7 0.0015 0.27 0.15 1.01 3.6
2 c mean 7.51 35.0 28.1 33.7 0.079 2.03 7.40 27.27 6.0 PaC02 SE 0.02 2.0 1.1 0.7 0.011 0.20 0.15 1.41 1.6
I 80 mm Hg
\() I mean 7.20 78.0 30.8 32.6 0.056 1.57 7.06 30.19 4.3 '<I' SE 0.02 1.9 0.9 0.8 0.004 0.14 0.15 1.28 1.2 I
p *** *** ** * *** *
II mean 7.21 80.5 32.4 32.9 0.070 1.64 6.85 31.20 2.5 SE 0.02 1.8 1.2 1.1 0.007 0.19 0.15 1.17 0.5 p *** *** * *** *** *
3 c mean 7.51 39.0 31.3 32.8 0.064 1.56 7.49 29.04 6.5 PaC02 SE 0.02 1.7 1.0 1.22 0.006 0.12 0.09 1.12 1.9
100 mm Hg mean 7.15 101.5 35.1 33.9 0.058 1.36 7.17 33.88 4.0 SE 0.01 1.5 0.7 1.76 0.005 0.07 0.06 0.67 0.6 p *** *** ** *** ***
II mean 7.17 104.5 38.2 34.7 0.060 1.29 6.89 36.73 3.4 SE 0.01 3.2 0.6 1.99 0.003 0.11 0.07 0.78 0.5 p *** *** *** * *** ***

TABLE II BLOOD AND RENAL FUNCTIONAL DATA IN THE EXPERIMENTAL GROUPS 1·5 (continued)
Group Period Blood Blood Blood MAP v GFR Urine HC03 - FE pH PaC02 HC03- mm Hg ml/min.kg ml/min.kg pH reabsorption bicarbonate
mm Hg mmol/1 umol/ml % GFR
4 c mean 7.49 38.3 29.3 35.4 0.068 1.91 7.47 26.56 5.7 metabolic SE 0.02 2.3 0.9 '1.4 0.008 0.17 0.12 1.44 1.7 acidosis
mean 7.35 38.7 21.7 36.3 0.070 1.51 7.25 20.85 5.9 SE 0.02 0.9 1.0 1.8 0.007 0.17 0.09 0.88 1.2 p *** *** * ** *
II mean 7.33 35.1 18.7 35.3 0.082 1.48 7.09 18.07 4.3 SE 0.02 2.1 0.8 1.7 0.009 0.16 0.09 0.77 0.7 p *** *** * *** ***
I r--<f 5 c mean 7.48 40.8 30.4 36.6 0.081 2.21 7.25 29.77 3.9 I
metabolic SE 0.02 2.1 0.8 1.6 0.010 0.28 0.14 0.82 0.9 alkalosis
mean 7.49 40.7 30.7 36.3 0.068 1.78 7.25 29.94 4.1 SE 0.01 2.0 1.2 1.5 0.009 0.26 0.11 0.90 0.7 p *
II mean 7.54 39.3 33.2 37.0 0.076 2.00 7.65 32.52 7.7 SE 0.02 2.5 1.3 1.9 0.012 0.30 0.08 2.34 2.7 p ***
MAP= mean arterial pressure; V =urine flow rate; GFR =glomerular filtration rate; FE bicarbonate= fractional excretion of bicarbonate; C =control period; I= first experimental period; II= second experimental period; P* =significant vs control, p < 0.05; P** =significant vs control, p < 0.01; P*** = siginificant vs control, p < 0.001.
-48-
4.5. Discussion
A pronounced hypochloremic metabolic alkalosis was present in our newborn
rabbits less than 2 weeks of age, as previously described in our laborato
ry ( 18, 25) • In an unpublished study (Schwartz and zavilowi tz, quoted in
ref. 28), Schwartz et al. also found an elevated plasma bicarbonate con
centration in their newborn rabbits during the first week of life and sug
gested that it was probably due to the presence of a substantial load of
bicarbonate generating substances in mother's milk. Analysis of rabbit's
milk, performed in our laboratory 3, 5 and 8 days after delivery, showed
small amounts of bicarbonate in the milk, the concentrations varying from
1.8 to 4.4 mmol/l, with pH values between 6. 72 and 7.00. The same milk
contained substantial amounts of chloride ( 39-45 mmol/l) , sodium ( 37-46
mmol/l), and potassium (40-54 mmol/l). The alkaline load in rabbit's milk
appeared to consist of calcium carbonate compounds, potential generators
of bicarbonate in the intestine (5). This was suggested by the very high
calcium concentration of the milk (67, 90 and 114 mmol/l on day 3, 5 and 8
after delivery, respectively) and by the pattern of milk titration studies
revealing a very high buffering capacity of the rabbit's milk, as compared
to cow's milk (Grigoras 0, Guignard JP, unpublished observation). An addi
tional factor responsible for the generation of the alkalosis could be a
state of extracellular volume contraction, which has been shown to induce
relative bicarbonate regeneration (12). Indirect evidence for volume con
traction in our newborn rabbits rests on the following findings: 1) the
excretion of a hypertonic urine (mean Uosm = 578 mosm/kg H2o); 2) a very
low sodium fractional excretion rate (mean FENa at the onset of the
experiment = 0.89%); 3) the occurrence of hypochloremia. Other mechanisms
responsible for generating a metabolic alkalosis, such as an excess acid
loss could not be demonstrated: neither vomiting, nor chloridorrhea was
observed and early renal acid loss is unlikely, the animals always excre
ting an alkaline urine when they were tested.
The concomittance of volume contraction, sodium avidity and hypochloremia
is probably responsible for the perpetuation of the metabolic alkalosis
(7,16). Whether the low GFR present in these hypochloremic animals contri
butes to the maintenance of the alkalosis remains to be demonstrated (2,6,
12). The hypochloremia observed in our animals receiving milk with a high
chloride content points to a defect in chloride intestinal absorption and/
or renal wasting. The occurrence of an elevated urine chloride concentra-

-49-
tion and of a relatively high fractional excretion of chloride ( 1 .38 ~
0.25%) in comparison with sodium (0.89%), in the presence of marked hypo
chloremia ( 83 ~ 1 mmol/1) suggests renal chloride wasting. The high rate
of potassium urinary excretion is easily explained by the state of volume
contraction, sodium avidity and chloride depletion, all leading to increa
sed potassium secretion in the distal tubule. The maintenance of slightly
elevated plasma potassium levels can, in turn, be explained by the high
potassium content of the milk.
As a consequence of the metabolic alkalosis, bicarbonate concentration in
the first urine sample collected at the onset of the experiment was high.
It remained so during the control period of all animals with mean frac
tional bicarbonate excretion rates varying substantially, but always ex
ceeding 3.9%. This is in agreement with the value of 4.8% observed by
Schwartz and Zavilowitz (unpublished observations quoted in ref. 28).
During our experiments however, the excretion of bicarbonate could have
been increased by the infusion of mannitol, as the latter substance has
been shown to depress bicarbonate reabsorption (25,31).
Bicarbonate reabsorption has been shown to be influenced by several fac
tors, such as the plasma carbon dioxide tension (4,14,19,21,29), the bi
carbonate filtered load (14,15,23,29), the state of extracellular volume
and of effective arterial blood volume (21,22,24,26), the body's potassium
stores and indirectly by the chloride concentration probably acting via
its effect on GFR (12). Whether factors such as the Paco2 and the bicarbo
nate filtered load also influence bicarbonate reabsorption in this alkalo
tic model was investigated by raising the Paco2 , or by changing the bicar
bonate filtered load, either by infusing the animals with an acid or an
alkaline load. The significant correlation between bicarbonate reabsorp
tion and the paco2 in our newborn animals clearly indicates that bicarbo
nate reabsorption can be stimulated by raising the Paco2 . It is generally
accepted that extracellular pH rather than blood Paco2 regulates bicarbo
nate reabsorption (23) and that it is the alteration in intracellular pH,
which is critical in determining bicarbonate reabsorption. Since induction
of hypercapnia in our animals also significantly decreased blood pH and
probably also intracellular pH, an independent effect of plasma Paco2 and
pH cannot be distinguished in the present study.
The increase in bicarbonate reabsorption induced by hypercapnia could al
so have a hemodynamic basis. In acute circumstances hypercapnia has been

-50-
shown to resu1t in vasoconstriction, a fa11 in GFR (21) and a marked in
crease in bicarbonate reabsorption expressed per unit of GFR. A decrease
in GFR was present in our hypercapnic anima1s and this decrease can we11
have contributed to the increase in bicarbonate reabsorption.
As previously demonstrated in several species, alterations in fi1 tered
bicarbonate resu1t in proportionate changes in bicarbonate reabsorption
(14,15,23,29). A tight re1ationship in the superficia1 proxima1 convoluted
tubule of the rat between the fi1tered load of bicarbonate and bicarbonate
reabsorption has been demonstrated by Cogan et a1. (6) using micropuncture
techniques. The same ho1ds true for who1e kidney bicarbonate reabsorption
by the immature rabbit kidney. This is surprising considering the state of
immaturity of superficia1 nephrons before the end of nephrogenesis. This
may we11 be explained however by recent observations showing that in the
rabbit (3,19), in contrast to the rat (11), bicarbonate reabsorption capa
city is higher in deep nephrons than in superficia1 nephrons.
Whi1e experiments in dogs have provided persuasive evidence that at con
stant b1ood pH bicarbonate reabsorption is a function of fi1tered bicar
bonate rather than of each of its two components (i.e. GFR and blood
Hco3-) separately (23), the mechanism whereby bicarbonate reabsorption
is stimulated by an increase in the filtered load awaits elucidation.
In conc1usion a state of hypochloremic metabolic a1ka1osis exists in the
newborn rabbit in the absence of hypokalemia. The factor ( s) responsib1e
for the generation of the metabo1ic a1ka1osis remain hypothetica1. Its
maintenance however is probab1y exp1ained by a state of ch1oride wasting
leading to hypochloremia and consequent vo1ume contraction. Bicarbonate
reabsorptive capacity is very efficient in this neonatal animal mode1 and
responds norma11y to the main factors inf1uencing bicarbonate reabsorp
tion, i.e. arterial Pco2 and bicarbonate fi1tered 1oad.

-51-
4.6. References
1. Aperia A, Broberger 0, Herin P, Zetterstrom R. Sodium excretion in re
lation to sodium intake and aldosterone excretion in newborn pre-term
and full-term infants. Acta Pediatr Scand 1979; 70: 183-187.
2 Berger BE, Cogan MG, Sebastian A. Reduced glomerular filtration and
enhanced bicarbonate reabsorption maintain metabolic alkalosis in
humans. Kidney Int 1984; 26: 205-208.
3. Berry CA. Heterogeneity of tubular transport processes in the nephron.
Annu Rev Physiol 1982; 44: 181-208.
4. Brazeau P, Gilman A. Effect of plasma co2 tension on renal tubular re
absorption of bicarbonate. Am J Physiol 1953; 175: 33-38.
5. Clarkson, EM, McDonald SJ, De Wardener HE. The effect of a high intake
of calcium carbonate in normal subjects and patients with chronic re
nal failure. Clin Sci 1966; 30: 425-438.
6. Cogan MG, Liu FY. Metabolic alkalosis in the rat. Evidence that redu
ced glomerular filtration rather than enhanced tubular bicarbonate re
absorption is responsible for maintaining the alkalotic state. J Clin
Invest 1983; 71: 1141-1160.
7. Cohen JJ. Correction of metabolic alkalosis by the kidney after iso
metric expansion of extracellular fluid. J Clin Invest 1968; 47:
1181-1192.
8. Cotting J, Guignard JP. Postnatal development of renal function in the
newborn rabbit. Kidney Int 1982; 21: 904-905.
9. Edelmann Jr. CM, Rodriguez Soriano J, Boichis H, Gruskin AB, Acosta
MI. Renal bicarbonate reabsorption and hydrogen ion excretion in nor
mal infants. J Clin Invest 1967; 43: 1309-1317.

-52-
10. Friis-Hansen B. Body water compartments in children: changes during
growth and related changes in body composition. Pediatrics 1961;
28: )69-181.
11. Frommer JP, Laski ME, Wesson DE, Kurtzmann NA. Distal tubular carbo
nic-anhydrase independent (CAl) bicarbonate ( HCO-3 ) reabsorption in
the rat: effect of ameloride (AM). Kidney Int 1983; 23:231.
12. Galla JH, Bonduris DN, Luke, RG. Correction of acute chloride-deple
tion alkalosis in the rat without volume expansion. Am J Physiol 1983;
244: F217-F221.
13. Goldstein L. Renal ammonia and acid excretion in infant rats. Am J
Physiol 1970; 218: 1394-1398.
14. Guignard JP. Mecanisme de la reabsorption renale des bicarbonates chez
le rat. Helv Physiol Acta 1966; 24: 193-226.
15. Guignard JP, Filloux B, Peters G. Urinary acidification and electro
lyte excretion in renal hypertensive rats. Nephron 1970; 7: 430-446.
16. Harrington JT. Metabolic alkalosis. Kidney Int 1984; 26: 88-97.
17. V.d. Heijden AJ, Guignard JP, Gautier E. The influence of acute
acid-base changes on bicarbonate handling in the newborn rabbit.
Pediatr Res 1986; 20: 1058.
18. V.d. Heijden AJ, Guignard JP. Effect of hypercapnic acidosis on renal
function in the newborn rabbit. Pediatr Res 1986; 20: 798-801.
19. Jacobson HR. Effects of co2 and acetazolamide on bicarbonate and fluid
transport in rabbit proximal tubules. Am J Physiol 1981; 240: F54-F62.
20. Kaissling B, Kriz W. Structural analysis of the rabbit kidney. Adv
Anat Embryol Cell Biol 1979; 56: 1-123.

-53-
21. Kurtzman NA. Relationship of extracellular volume and co2 tension to
renal bicarbonate reabsorption. Am J Physiol 1970; 219: 1299-1304.
22. Kurtzman NA. Regulation of renal bicarbonate reabsorption by extra
cellular volume. J Clin Invest 1970; 49: 586-595.
23. Langberg H, Mathisen f, Holdaas H, Kiil F. Filtered bicarbonate and
plasma pH as determinants of renal bicarbonate reabsorption. Kidney
Int 1981; 20: 780-788.
24. Moore ES, Fine BP, Satrasook SS, Vergel ZM, Edelmann Jr. CM. Renal
reabsorption of bicarbonate in puppies: effect of extracellular volume
contraction on the renal threshold for bicarbonate. Pediatr Res 1972;
6: 859-967.
25. Poole-Wilson PA, Patrick J, MacGregor GA, Jones NF. Renal excretion of
bicarbonate and hydrogen ions: effects of mannitol diuresis in normal
man. Clin Sci 1972; 43: 561-567.
26. Robillard JE, Sessions C, Burmeister L, Smith Jr. FG. Influence of fe
tal extracellular volume contraction on renal reabsorption of bicar-
bonatein fetal lambs. Pediatr Res 1977; 11: 49-655.
27. Schwartz GJ, Haycock GB, Edelmann Jr. CM, Spitzer A. Late metabolic
acidosis: a reassessment of the definition. J Pediatr 1979; 95:
102-107.
28. Schwartz GJ, Evan AP. Development of solute transport in rabbit proxi
mal tubule. I. Hco3 and glucose absorption. Am J Physiol 1983; 245:
F382-F390.
29. Slaughter BD, Osiecki HS, Cross RB, Budtz-Olsen 0, Jedrzejczyk H. The
regulation of bicarbonate reabsorption. The role of arterial pH, Pco2 and plasma bicarbonate concentration. Pflugers Arch 1974; 349: 29-40.
30. Spitzer A. Renal physiology and functional development. In: Edelmann
Jr. CM, ed. Pediatric kidney disease. Boston: Little Brown, 1978:
25-128.
-54-
31. Stinebaugh BJ, Bartow SA, Eknoyan G, Martinez-Maldonado M, Suki WN.
Renal handling of bicarbonate: effect of mannitol diuresis. Am J
Physiol 1971; 220: 1271-1274.
32. Sulyok E, Varga F, Gyory E, Jobst K, Csaba IF. Postnatal development
of renal sodium handling in premature infants. J Pediatr 1979; 95;
787-792.
33. Svenningsen NW. Renal acid-base tiration studies in infants with and
without metabolic acidosis in the postnatal period. Pediatr Res 1974;
8: 659-672.
34. Torrado A, Guignard JP, Prod'hom LS, Gautier E. Hypoxaemia and renal
function in newborns with respiratory distress syndrome (RDS). Helv
Paediatr Acta 1974; 29: 399-405.
35. Valloton M. Maturation de la fonction renale chez le lapin nouveau-ne:
effet de l'hypoxemie. These, Universite de Lausanne, Switzerland,
1985.
36. Zilleruelo G, Sultan S, Bancalari E, Steele B, Strauss J. Renal bi
carbonate handling in low birth weight infants during metabolic aci
dosis. Biol Neonate 1986; 49: 132-139.

Chapter 5
-55-
GLOMERULAR FILTRATION RATE IN THE PRETERM INFANT: THE RELA
TION TO GESTATIONAL AND POSTNATAL AGE
5.1. Abstract
In 41 preterm neonates with a gestational age (GA) varying from 27 to 36
weeks, glomerular filtration rate (GFR) was measured by means of the con
tinuous inulin infusion technique. Reliability of the technique was con
firmed. During postnatal development GFR was found to increase in two
ways. Firstly, an increase with advancing gestational age, associated with
the increase in body weight (BW) (GFR (ml/min) = 0.15 x GA- 3.20; r = 0.48; p = 0.0048). Secondly a postnatal increase, being independent from
increment in BW. An increase in GFR (ml/min.kg) from 0.88 + 0.23 to 1.18 +
0. 28 was observed between day 4 and day 11 postnatally (p <0 .0 08) • This
latter increase is probably associated with changes in renal hemodynamics.
No significant influence of artificial ventilation on GFR could be demon
strated in preterm neonates.
* Submitted for publication.
A.J. v.d. Heijden, W.F.A. Grose, J.J. Ambagtsheer, A.P. Provoost,
E.D. Wolff and P.J.J. Sauer.

-56-
5.2. Introduction
Developmental changes in glomerular filtration (GFR) in neonates and espe
cially in pre term neonates have been the subject of many studies. An in
crease of the GFR with gestational age ( GA) has been described by most
authors (1,4,10,14,20), although Aperia et al. (3) reported no increase.
Furthermore data have been published indicating a rapid postnatal in
crease of GFR (3,14). This was, however, contradicted in other studies
(1,10,20) (table I).
TABLE I THE EFFECT OF GESTATIONAL· AND POSTNATAL AGE ON THE DEVELOPMENT OF GLOMERULAR FILTRATION; DATA FROM LITERATURE
Author and reference
AI Dahhan et al Ape ria et al Arant Jr. Coulthard Faweret al Leake et al
(1) (3)
(4) (10) (14) (20)
GFR markers
creatinine creatinine creatinine inulina inulinb
inulin°
Effect of GA Effect of PA on GFR on GFR
GA: gestational age; PA: postnatal age; a: 24 hours continuous inulin infusion technique; b: traditional inulin clearance; c:120 minutescontinuous inulin infusion.
The aim of the present study is to establish the effect of GA on the deve
lopment of GFR as well as the effect of postnatal age (PA). As the role of
artificial ventilation on renal function is not completely defined, the
effect of artificial ventilation on GFR was also studied. For these purpo-
ses, the GFR was measured in 41 preterm neonates using the continuous inu-
lin infusion technique, reported to be a reliable technique also in the
very young infant (8).
5.3. Materials and Methods
Patients
The GFR was measured in 41 preterm neonates, all admitted to the neonatal
intensive care unit of the Sophia Children's Hospital. The GA varied be-
tween 27 and 36 weeks (mean 30.6 wks) , the PA varied between 3 and 11
days. In 8 infants measured at day 4 or 5 the measurement was repeated at
day 11 to determine the postnatal increase in GFR. The GA was estimated
-57-
from the mother's menstrual history and on physical assessment using the
criteria of Dubowi tz et al. ( 12) • Birth weight varied from 810 to 273 5
grams (mean 1384 grams). All infants were in stable clinical condition at
the time of the study. Infants receiving nephrotoxic drugs were not inclu-
ded.
Relevant clinical data are summarized in table II. Fifteen neonates needed
artificial ventilation.
GFR measurement
Inulin was administered as a glucose 10%-inulin solution containing 25 g
inulin/l, at an infusion rate of 0.6 ml/kg.h. After 24 hours of infusion
the inulin clearance (Cin) was calculated from the infusion rate (R), the
inulin level in the infusate (I) and the plasma inulin level (Pin) with
the following equation: (C.n= I.R). ~ --
pin
The protocol was only performed when intravenous therapy was obligatory
for clinical reasons. Blood sampling was performed, when possible, to-
gether with sampling for other laboratory data. Informed parental consent
was obtained.
Inulin determination
Serum: At least 75 pl serum is deproteinized with an equal volume 0.6 N
HCl04 and centrifugated. The amount of endogenous glucose and fructose in
serum is immediately measured (A1). Then serum is incubated during 15 mi
nutes at 70° C. During this incubation period inulin is converted into
fructose (A2 ). The difference between A2 and A1 is the amount of fructose
originating from the acid hydrolysis of inulin.
The determination of the amount of fructose is performed by an enzymatic
method (Boehringer Mannheim 716260) adapted to a Co bas Bio (Hoffman La
Roche, Basel), in which the conversion of NADP to NADPH is measured (5).
Serum blanc values of fructose-like substances were determined as soon as
possible after deproteinisation. The recoveries of inulin at 200 mg/l and
500 mg/l were determined.

-58-
TABLE II CLINICAL DATA OF THE STUDY GROUP
Pat. Gest. Birth Day of Diagnosis** Artificial GFR nr age weight GFR ventilation ml/min
weeks grams measurement
1 30.0 1930 4* RDS 2.51 ·2 30.0 1010 4 RDS/p.d.a. 1.14 3 30.4 910 11 1.06 4 34.0 1940 4 RDS/icterus 1.80 5 29.0 1580 4* RDS/asfyxia + 0.77 6 29.0 1380 4 RDS/icterus + 1.41 7 28.0 1250 4 icterus 1.63 8 29.0 1240 4 ADS/pneumonia/icterus + 1.44 9 29.4 1330 4* 1.26
10 34.0 1280 4 pneumonia 1.28 11 27.0 970 5* wet lung disease + 0.87 12 29.4 1135 11 RDS/p.d.a. + 0.43 13 34.0 2735 4 ADS/pneumonia + 4.67 14 30.0 1210 4* wet lung disease 1.10 15 30.0 1115 4* RDS/p.d.a. + 1.05 16 30.0 1050 9 1.10 17 28.0 1010 10 pneumonia 1.13 18 28.4 1100 4 ADS/pneumonia + 1.12 19 28.0 1125 10 pneumonia/asfyxia + 1.07 20 31.0 1365 11 ADS/pneumonia + 2.00 21 36.0 2580 4 RDS + 2.90 22 28.0 1100 4 RDS/p.d.a/pne~monia + 1.02 23 31.0 1375 4 0.99 24 31.0 1920 4 PROM 1.98 25 27.0 900 5 RDS/p.d.a/pneumonia + 0.68 26 27.0 810 5 ADS/pneumonia + 0.59 27 34.0 1280 3 pneumonia 1.01 28 32.0 1030 5 1.09 29 33.0 1140 4 icterus 1.05 30 31.0 1670 7 icterus 1.26 31 32.0 1930 4* wet lung disease/icterus 1..71 32 27.0 1080 7 1.08 33 33.0 1430 4* icterus 1.01 34 33.0 970 4 pneumonia 0.84 35 34.5 2170 4 RDS/wet lung disease 2.13 36 30.0 990 4 icterus 0.97 37 30.4 1310 3 RDS/icterus + 1.32
38 28.0 1050 3 RDS 1.28
39 32.0 1735 4 ADS/pneumonia 1.72
40 33.0 1985 3 RDS/icterus 1.77
41 33.0 1615 4 icterus 1.26
* GFR measurement was repeated on day 11. ** The diagnoses small for gestational age and prematurity are not mentioned in the diagnostic list.
RDS =respiratory distress syndrome; p.d.a. =persistent ductus arteriosus; PROM= premature rupture of membranes.
-59-
Statistics
All values are expressed as mean ~ SD. Differences between the mean values
of groups of infants with or without artificial ventilation were tested
using the Mann Withney test. The GFR values measured in the infants at day
4 and 11 were compared using the paired Student's t-test. A p level of
less than 0.05 was considered as significant. The relationship between GA
and GFR (ml/min or ml/min.kg) was calculated using linear regression.
5.4. Results
A. The reliability of the inulin determination.
The reliability of our test system was evaluated in various ways.
1) _!h~ E_y_£r~lys2:_s_s_!e.E_
The hydrolysis proved to be completed between 5 and 15 minutes at
70° C, an incubation time up to 60 minutes did not influence the re
sults. Also glucose and fructose remained stable under these condi
tions. Although the hydrolysis at room temperature is slow, a few per
cents per hour, the blanc values were determined <;iS soon as possible
after deproteinization. These values varied between 1.6 and 48.4 mg/l
"inulin" (average 19.3 mg/l, n=73) and are well above the noise of the
analysis (4-5 mg/l). The recoveries at 200 and 500 mg/l levels were
101% + 5.8% and 103% + 4.4% respectively.
2) _!h~ l:_n_!u~i~n_p~rl:_o_£
As a reliable inulin clearance depends strongly on a stable plasma con
centration in an equilibrium situation, we controlled the validity of
our infusion time. In 9 infants the infusion was continued for 30 hours
and serum inulin concentrations were determined after 24 and 30 hours
of infusion (table III). There was no statistically significant diffe
rence between the two sets of values, thus reflecting stable plasma
concentrations.
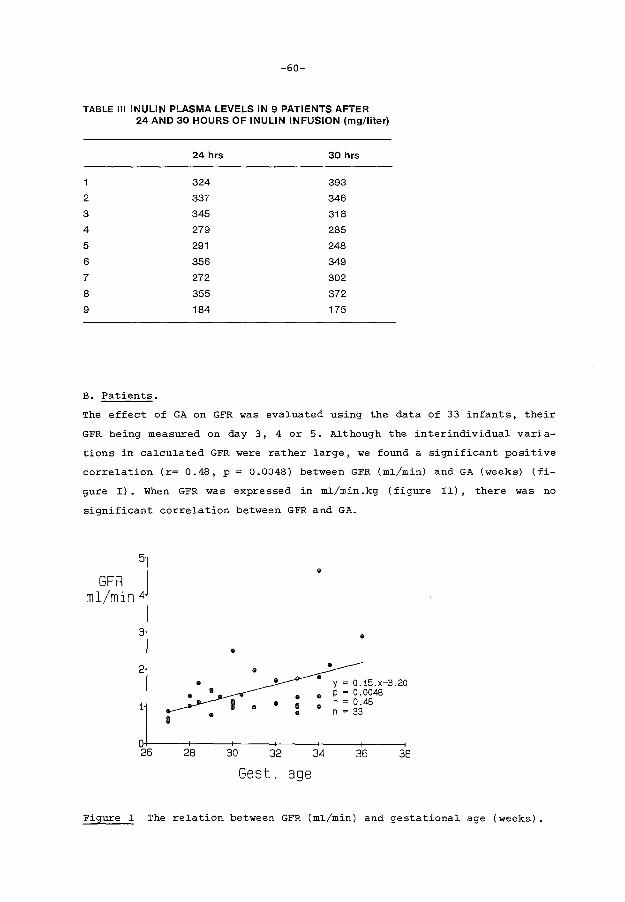
-60-
TABLE Ill INULIN PLASMA LEVELS IN 9 PATIENTS AFTER 24 AND 30 HOURS OF INULIN INFUSION (mg/liter)
24 hrs 30 hrs
1 324 393
2 337 346
3 345 318
4 279 285
5 291 248
6 356 349
7 272 302
8 355 372
9 184 175
B. Patients.
The effect of GA on GFR was evaluated using the data of 33 infants, their
GFR being measured on day 3, 4 or 5. Although the interindividual varia
tions in calculated GFR were rather large, we found a significant positive
correlation (r= 0.48, p = 0.0048) between GFR (ml/min) and GA (weeks) (fi
gure I). When GFR was expressed in ml/min .kg (figure II), there was no
significant correlation between GFR and GA.
5 • GFR
ml/min 4
3 • •
2 • • y = 0.15.x-3.20
• • p = 0.0048
1 • a • r = 0.48 • n = 33
8
0 26 28 30 32 34 36 38
Gest. age
Figure I The relation between GFR (ml/min) and gestational age (weeks).

5
GFR ml/min. kg 4
3
2
1
0 26
• • •• • •• • •
•
28
-61-
• • i •• • I I I •
• •
30 32 34 36 38
Gest. age Figure II The relation between GFR (ml/min.kg) and gestational age (weeks).
In order to establish the effect of PA on GFR we repeated the GFR measure
ments on day 11 in 8 infants previously measured on day 4 or 5. A signifi
cant increase in GFR was present. The GFR increased from 1.28 .:!:_ 0.57 ml/
min to 1.68 .:!:_ 0.57 ml/min. (p < 0.007). This increase was also present
when GFR was expressed relative to body weight (0.88 .:!:_ 0.23 ml/min.kg to
1.18 .:!:_ 0.28 ml/min.kg; p < 0.008) (figure III).
GFR as a function of postnatal age 2.6
~---------------------· 2.6
2.4 2.4
2.2 2.2
2.0 2.0 0)
c 1.8 .E - 1.6 E
1.8 ..::.::: c
1.6 .E -0: 1.4 1.4 E LL (') 1.2 0:
1.2 LL (')
1.0 1.0
0.8 0.8
0.6 0.6
0.4 4 11 4 11
0.4
Postnatal Age (days)
Figure III GFR as a function of postnatal age (r--i: mean values+ SEM).
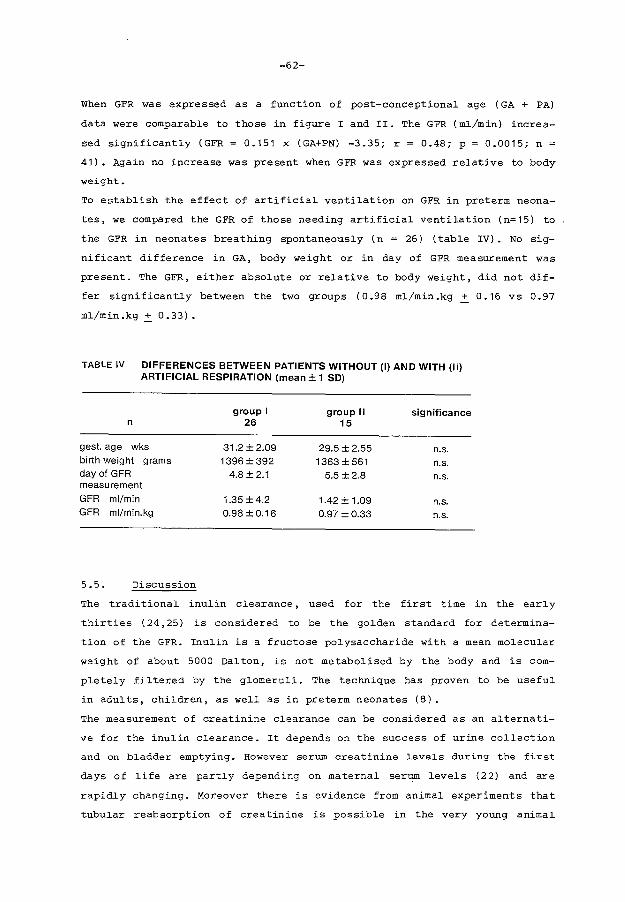
-62-
When GFR was expressed as a function of post-conceptional age ( GA + PA)
data were comparable to those in figure I and II. The GFR (ml/min) increa-
sed significantly (GFR = 0.151 x (GA+PN) -3.35; r = 0.48; p = 0.0015; n =
41). Again no increase was present when GFR was expressed relative to body
weight.
To establish the effect of artificial ventilation on GFR in preterm neona
tes, we compared the GFR of those needing artificial ventilation (n=15) to
.the GFR in neonates breathing spontaneously (n = 26) (table IV). No sig
nificant difference in GA, body weight or in day of GFR measurement was
present. The GFR, either absolute or relative to body weight, did not dif
fer significantly between the two groups (0.98 ml/min.kg + 0.16 vs 0.97
ml/min.kg + 0.33).
TABLE IV DIFFERENCES BETWEEN PATIENTS WITHOUT (I) AND WITH (II) ARTIFICIAL RESPIRATION (mean± 1 SD)
group I group II significance n 26 15
gest. age wks 31.2 ±2.09 29.5 ± 2.55 n.s. birth weight grams 1396 ±392 1363±561 n.s. day of GFR 4.8 ±2.1 5.5±2.8 n.s. measurement GFR ml/min 1.35 ±4.2 1.42 ± 1.09 n.s. GFR ml/min.kg 0.98 ± 0.16 0.97±0.33 n.s.
5.5. Discussion
The traditional inulin clearance, used for the first time in the early
thirties ( 24, 25) is considered to be the golden standard for determina
tion of the GFR. Inulin is a fructose polysaccharide with a mean molecular
weight of about 5000 Dalton, is not metabolised by the body and is com
pletely filtered by the glomeruli. The technique has proven to be useful
in adults, children, as well as in preterm neonates (8).
The measurement of creatinine clearance can be considered as an alternati-
ve for the inulin clearance. It depends on the success of urine collection
and on bladder emptying. However serum creatinine levels during the first
days of life are partly depending on maternal serum levels (22) and are
rapidly changing. Moreover there is evidence from animal experiments that
tubular reabsorption of creatinine is possible in the very young animal

-63-
(2,11). It is uncertain whether this latter finding applies to the preterm
newborn.
The single injection technique for measuring GFR has been practised by
Broberger using inulin (6) and Svenningsten using polyfructosan (27).
Coulthard (9) however, demonstrated that the use of single injection
techniques can lead to an overestimation of up to 10% of the real value
of GFR. Only in a few patients trustworthy results can be obtained by this
technique. These data are in accordance with those of Fawer et al. (13).
Continuous infusion without urine collection may be an alternative method
to measure GFR. After an equilibration period the amount of infused inulin
will be equal to the amount excreted by the kidneys. This equilibration
time will depend on the plasma half life (T~) and on the level of GFR it
self. T~ in neonates has been reported to be greater than 4 hours ( 9) •
This long T~ in neonates can be attributed to the combination of a low GFR
and the large extracellular fluid space, wherein inulin is distributed
( 15). After an infusion period of five times the T~ the inulin plasma
levels reach a value within 3% of the steady state concentration. This
explains that an infusion for 24 hours is needed in p:.:eterm infants. A
short interruption of the infusion requires again a fairly long infusion
period before a stable plasma level is achieved.
Another complicating factor is the large fluctuation of serum blancs for
inulin in neonates, due to variations in "fructose-like" substances. We
found serum blanc values up to 50 mg/liter, independent of the exogenous
administered inulin. This may lead to an inacceptable inaccuracy in calcu-
lation of GFR. By means of our stepwise procedure we were able to elimi
nate this problem, as is demonstrated in the recovery of 101% and 103%
after addition of exogenous inulin to at random chosen plasma samples. we
applicated the latter technique in our study.
Our data demonstrate that GFR rises during development in two different
ways. In the first place there is an effect of increase in body weight as
indicated by the correlation between GFR, expressed in ml/min, and GA
(figure I) and the lack in correlation between GA and GFR expressed in
ml/min.kg. In the second place there is a further increase in GFR postna
tally (figure III). This increase appears independent of an increase in
body weight. This latter finding, earlier demonstrated by Fawer et al.
(14) was critisized by Coulthard (10). He considered the observed increase
in GFR relative to body weight during early postnatal life as an artefact.
-64-
This was in his opinion related to a temporary decrease in body weight
postnatally, while it was absent when GFR was expressed per kg of so cal
led proj'ected weight. This is the weight obtained by a parallel projection
from the birth weight along the centiles of Gairdner and Pearson (16), as
if the babies had continued to grow at a rate observed during intrauterine
life. We found an increase in GFR of 3 0%; much more than can be expected
to occur as a consequence of body weight changes. Body weight in the 8
neonates studied by us, was not significantly different at day 4 and day
11.
Also from animal experiments there is evidence that GFR is rising postna
tally independent of an increase in body weight. This increase appears to
depend on hemodynamic changes in the kidney. An increase in renal blood
flow (RBF) has been described (17,26). More recently it was demonstrated
in sheep that a postnatal increase in GFR without changes in RBF can
occur, probably depending on intrarenal redistribution of blood flow
resulting in a rise in glomerular plasma flow in outer cortical nephrons
(23).
The GFR in patients with ventilatory support was not significantly diffe
rent from that of infants without (table IV). This indicates that artifi
cial ventilation had no significant effect on the level of GFR. However,
13 of the 26 neonates breathing spontaneously had respiratory problems, as
for instance respiratory distress syndrome (RDS), known to decrease GFR
(7,18,28). We compared the artificially ventilated newborns also to those
without known respiratory diseases. Again no significant differences were
found. This contrasts to the data of Leslie et al. ( 21) , who did find a
negative effect of artificial ventilation on glomerular filtration using
creatinine clearance. In their study the reported values for creatinine
clearance are surprisingly low for the infants needing artificial ventila
tion as well as for those breathing spontaneously. The observed changes in
GFR in neonates with RDS and those needing artificial ventilation reported
in the literature, are probably due to a combination of negative influen
ces: hypoxemia, hypercapnia and variations in systemic blood pressure. We
demonstrated for instance in the newborn rabbit model a significant de
crease in GFR related to acute hypercapnic acidosis (19).

-65-
In conclusion we found that the 24 hours inulin infusion technique is suf
ficiently accurate to evaluate the development of GFR in the preterm in
fant. The GFR of the newborn rises in two different ways during develop
ment. Firstly, an increase during gestation, associated with body growth.
Secondly, a postnatal increase independent of an increase in body weight.
We were not able to demonstrate a significant effect of artificial venti
lation upon the GFR in preterm infants.
-66-
5.6. References
1 • Al-Dahhan J, Haycock GH, Chantler C, Stimmler L ( 1983) Sodium homeo
stasis in term and pre term neonates. I Renal aspects. Arch Dis Child
58:335-342.
2. Alt JM, Colenbrander B,
development of tubular
693-702.
For sling ML, MacDonald AA
function in the pig. Q J
( 1984) Perinatal
Exp Physiol 69:
3. Aperia A, Broberger o, Elinder G, Herin P, Zetterstrom R (1981) Post
natal development of renal function in pre-term and full-term infants.
Acta Paediatr Scand 70:183-187.
4. Arant Jr. BS (1978) Developmental patterns of renal functional matu
ration compared in the human neonate. J Pediatr 92:705-712.
5. Bergmeijer HU, Bernt E, Schmidt F, Storks H (1974) Methods for deter
mination of metabolites. In: Bergmeijer HU, ed. Methoden der enzyma
tischen Analyse. Verlag Chemie, Weinheim, Bd2, pp 1241-1246.
6. Broberger U, Aperia A ( 1978) Renal function in idiopatic respiratory
distress syndrome. Acta Paediatr Scand 67:313-319.
7. Cort RL ( 1962) Renal function in the respiratory distress syndrome.
Acta Paediatr Scand 51:313-323.
8. Coulthard MG, Ruddock V (1983A) Validation of inulin as a marker for
glomerular filtration in preterm babies. Kidney Int 23: 407-409.
9. Coulthard MG (1983B) Comparison of methods of measuring renal function
in preterm babies using inulin. J Pediatr 102:923-930.
10. Coulthard MG (1985) Maturation of glomerular filtration in preterm and
mature babies. Early Hum Dev 11:281-292.
11. Duarte-Silva M, Guignard JP ( 1985) Creatinine transport by the matu
ring rabbit kidney. Kidney Int 28:595.

-67-
12. Dubowitz LMS, Dubowitz V, Goldberg c (1970) Clinical assessment of
gestational age in the newborn infant. J Pediatr 77:1-10.
13. Fawer CL, Torr ado A, Guignard JP ( 1979A) Single injection clearance
in the neonate. Biol Neonate 35:321-324.
14. Fawer CL, Torrado A, Guignard JP, (1979B) Maturation of renal func
tion in full-term and premature neonates. Helv Paediatr Acta 34:
11-21.
15. Friis-Hansen B ( 1961) Body water compartments in children: changes
during growth and related changes in body composition. Pedia tries
28:169-181.
16. Gairdner D, Pearson J (1971). A growth chart for premature and other
infants. Arch Dis Child 46:783-787.
17. Gruskin AB, Edelmann Jr. CM, Yuan S ( 1970) Matur<ttional changes in
renal blood flow in pigltes. Pediatr Res 4:7-13.
18. Guignard JP, Torrado A, Mazouni SM, Gautier E (1976) Renal function in
respiratory distress syndrome. J Pediatr 88: 845-850.
19. V.d. Heijden AJ, Guignard JP (1986) Effect of hypercapnic acidosis on
renal function in the newborn rabbit. Pediatr Res 20:798-801.
20. Leake RD, Trygstad CW, Oh W ( 1976) Inulin clearance in the newborn
infant: relationship to gestational and postnatal age. Pediatr Res
10:759-762.
21. Leslie GI, Philips III JB, Work J, RamS, Cassady G (1986) The effect
of assisted ventilation on creatinine clearance and hormonal control
of electrolyte balance in very low birth weight infants. Pediatr Res
20:447-452.
-68-
22. Manzke H, Spreter von Kreudenstein P, Dorner K, Kruse K ( 19 80) Quan
titative measurements of the urinary excretion of creatinine, uric
acid, hypoxanthine and xanthine, uracil, cyclic AMP, and cyclic GMP in
healthy newborn infants. Eur J Pediatr 133; 157-161.
23. Nakamura KT, Matherne GP, McWeeny OJ, Smith BA, Robillard JE (1987)
Renal hemodynamics and functional changes during the transition from
fetal to newborn life in sheep. Pediatr Res 21:229-234.
24. Richards AN, Westfall BB, Bott PA ( 1934) Renal excretion of inulin,
creatinine and xylose in normal dogs. Proc Soc Exp Biol Med 32:73-75.
25. Shannon JA, Smith HW (1935) The excretion of inulin, xylose and urea
by normal and phlorizinized man. J Clin Invest 14:393-401.
26. Spitzer A, Edelmann Jr. CM (1971) Maturational changes in pressure
gradients for glomerular filtration. Am J Physiol 221:1431-1435.
27. Svenningsen NW (1975) Single injection polyfructosan clearance in nor
mal and asphyxiated neonates. Acta Paediatr Scand 64:87-95.
28. Tulassay T, Ritvay J, Bors Z, Bliky B, (1979) Alterations in creatini
ne clearance during respiratory distress syndrome. Biol Neonate 35:
258-263.
-69-
Chapter 6 RENAL FUNCTIONAL IMPAIRMENT IN PRETERM NEONATES RELATED TO
INTRAUTERINE INDOMETHACIN EXPOSURE
6.1. Abstract
Renal function was measured during the first 4 days postnatally in 9 pre
term neonates (gest. age 26.2 to 31 weeks) exposed to indomethacin (ID)
during the last 2 days of pregnancy (group I). The data were compared to
those obtained from 9 control neonates (gest. age 28 to 34.5 weeks) (group
II). Five out of the 9 neonates in group I were markedly oedematous at
birth, none in group II. Urine production in group I was low (32.2 ~ 16.8
ml/kg.day on day 1 increasing to 68.6 ~ 21.4 ml/kg.day on day 4) and dif
fered significantly from group II (75.2 ~ 26.8 ml/kg.day on day 1 increa
sing to 84.8 ~ 20.9 ml/kg.day on day 4; p < 0.001). Fluid intake was adap
ted to urine production when necessary.
A continuous inulin infusion was started directly after admission and con
tinued for 5 days. After at least 48 hours of inulin infusion renal func
tion was evaluated for 3 consecutive days.
The values of the inulin clearance (Cin), serum creatinine (Screat), urine
osmolality ( Uosmol) , osmolar clearance ( Cosmol) and free water clearance
( SI20 ) were stable in both groups during the study period. Cin was lower
in group I than in group II (p < 0.001), while Screat was higher in group
I than in group II (p < 0.0001). Uosmol was higher in group I (p < 0.01),
while Cosmol and cH20 were lower in group I (p < 0.02 respectively
p < 0.01). Fractional sodium excretion (FENa) was not different between
the groups. In conclusion a short course of ID therapy to pregnant women
leads to a significant functional impairment of the kidneys in their
offspring just after exposure. This requires adaptation of fluid intake.
* Submitted for publication.
A.J. v.d. Heijden, A.P. Provoost, J. Nauta, W.F.A. Grose, W.A. Oranje
E.D. Wolff and P.J.J. Sauer.
-70-
6.2. Introduction
Indomethacin ( ID) has been used as an inhibitor of preterm labor in the
pregnant woman since 1974 (1). Even recently it has been reported that
short courses of this drug before 35 weeks of gestation are save and with
out any risk of side effects (2). However, side effects are well known. In
the animal model intrauterine closure of the ductus arteriosus has been
described (3,4), as well as a decrease in cerebral blood flow (5) and an
arrest in fetal nefrogenesis ( 6) • In the human newborn there are various
reports about persistent fetal circulation (7,8,9), cardiac insufficiency
( 1 0) and irreversible renal insufficiency ( 11 , 12, 13) • Recently we also
described an infant, who remained totally anuric after birth, while his
mother has been treated with ID for 6 weeks (14). Furthermore, it has been
reported that treatment of preterm newborns with ID for medical closure of
the patent ductus arteriosus results in a temporary decrease in renal
function (15,16,17,18). These observations prompted us to an evaluation of
the renal function in preterm neonates, exposed to ID during the last days
of intrauterine life.
6.3. Patients and methods
6.3 .1 Patients
Renal function studies were performed in 20 preterm newborn infants born
after intrauterine exposure to ID. Nine patients (group I) were selected
for further analysis of renal function. Eleven infants were excluded
because of perinatal asphyxia, unstable circulation, for having received
nephrotoxic medication and because of discontinuation of the study due to
technical reasons. Gestational age varied from 26.2 to 31 weeks (mean 28.1
weeks) and birth weight from 1000 to 1640 gram (mean 1290 gram) (group I).
The patients were compared to 9 newborns (group II), whose mothers did not
receive ID during pregnancy. Gestational age in this group varied from 28
to 34.5 weeks (mean 31 .1 weeks) and birth weight from 920 to 2055 gram
(mean 1503 gram). Blood pressure was monitored in all infants using an in
dwelling catheter in the radial or tibial artery or by means of an elec
tronic blood pressure monitor ( Dynamap, Kri tic on) . Blood pressure was
within the normal limits for age in all children ( 19) • Fluid intake con
sisted of a glucose-NaCl solution, providing 10 gr glucose/100 ml and 3-5
meq Na+/kg body weight.day, while on the second day of life amino-acids
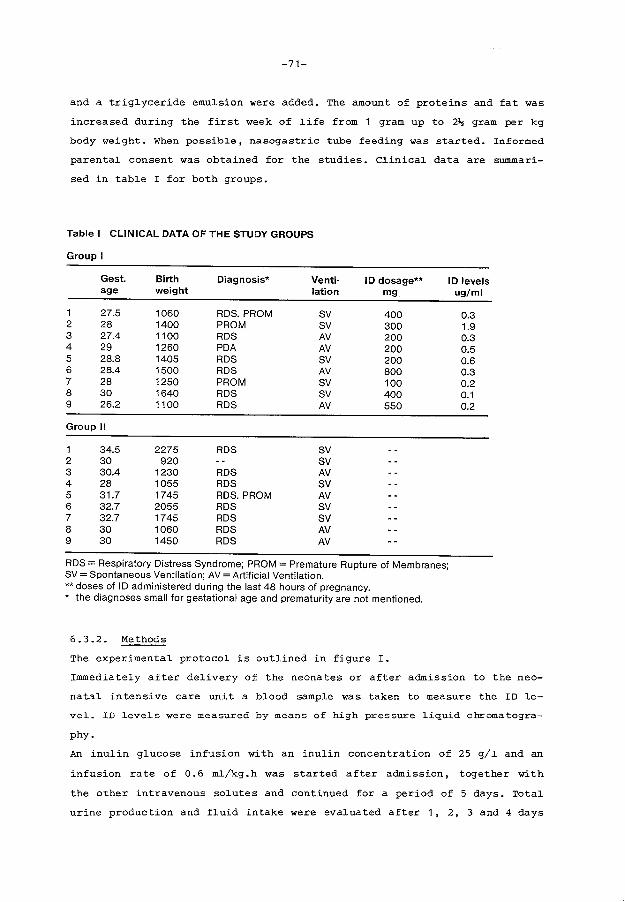
-71-
and a trig~yceride emu~sion were added. The amount of proteins and fat was
increased during the first week of ~ife from 1 gram up to 2~ gram per kg
body weight. When possible, nasogastric tube feeding was started. Informed
parenta~ consent was obtained for the studies. C~inical data are summari-
sed in tab~e I for both groups.
Table I CLINICAL DATA OF THE STUDY GROUPS
Group I
Gest. Birth Diagnosis* Venti· ID dosage** ID levels age weight lation mg ug/ml
1 27.5 1060 RDS. PROM SV 400 0.3 2 28 1400 PROM sv 300 1.9 3 27.4 1100 RDS AV 200 0.3 4 29 1260 PDA AV 200 0.5 5 28.8 1405 RDS SV 200 0.6 6 28.4 1500 RDS AV 800 0.3 7 28 1250 PROM sv 100 0.2 8 30 1640 RDS SV 400 0.1 9 26.2 1100 RDS AV 550 0.2
Group II
1 34.5 2275 RDS SV 2 30 920 sv 3 30.4 1230 RDS AV 4 28 1055 RDS SV 5 31.7 1745 RDS. PROM AV 6 32.7 2055 RDS sv 7 32.7 1745 RDS sv 8 30 1060 RDS AV 9 30 1450 RDS AV
RDS = Respiratory Distress Syndrome; PROM= Premature Rupture of Membranes; SV =Spontaneous Ventilation; AV =Artificial Ventilation. **doses of I 0 administered during the last 48 hours of pregnancy. * the diagnoses small for gestational age and prematurity are not mentioned.
6.3.2. Methods
The experimenta~ protoco~ is out~ined in figure I.
Immediate~y after de~ivery of the neonates or after admission to the nee-
nata~ intensive care unit a b~ood samp~e was taken to measure the ID ~e
vel. ID levels were measured by means of high pressure liquid chromatogra-
phy.
An inu~in g~ucose infusion with an inu~in concentration of 25 g/~ and an
infusion rate of 0.6 m~/kg.h was started after admission, together with
the other intravenous so~utes and continued for a period of 5 days. Tota~
urine production and f~uid intake were eva~uated after 1, 2, 3 and 4 days
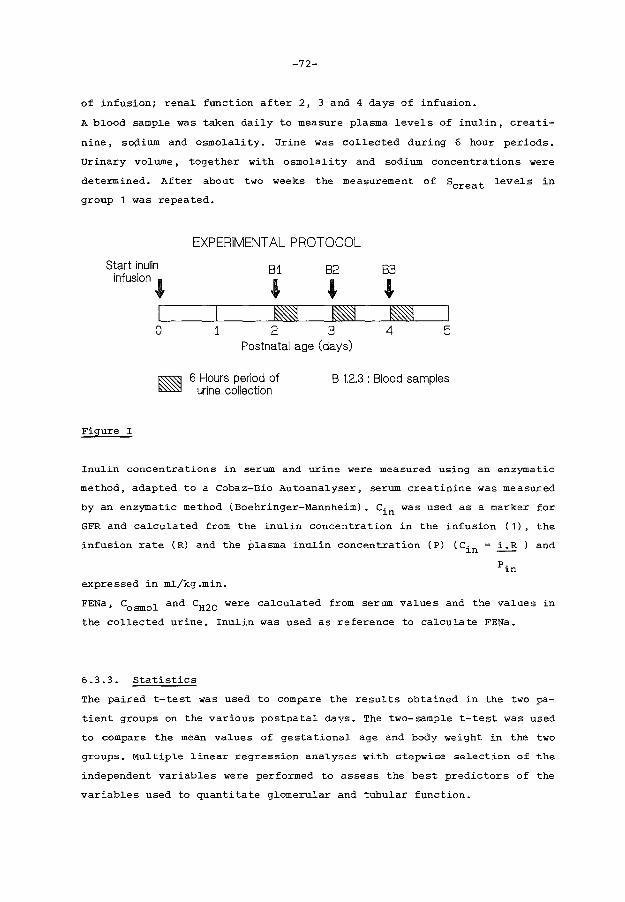
-72-
of infusion; renal function after 2, 3 and 4 days of infusion.
A blood sample was taken daily to measure plasma levels of inulin, creati
nine, so\'lium and osmolality. Urine was collected during 6 hour periods.
Urinary volume, together with osmolality and sodium concentrations were
determined. After about two weeks the measurement of Screat levels in
group 1 was repeated.
Start inulin infusion'
0
Figure I
EXPERIMENTAL PROTOCOL
81 82 83
' ' ' ~ ~ ~ 1 2 3 4 5
Postnatal age (days)
6 Hours period of urine collection
B 1.2.3 : Blood samples
Inulin concentrations in serum and urine were measured using an enzymatic
method, adapted to a Cobaz-Bio Autoanalyser, serum creatinine was measured
by an enzymatic method (Boehringer-Mannheim). Cin was used as a marker for
GFR and calculated from the inulin concentration in the infusion (1), the
infusion rate (R) and the plasma inulin concentration (P) (Cin = i.R and
Pin
expressed in ml/kg.min.
FENa, Cosmol and cH20 were calculated from serum values and the values in
the collected urine. Inulin was used as reference to calculate FENa.
6.3.3. Statistics
The paired t-test was used to compare the results obtained in the two pa
tient groups on the various postnatal days. The two-sample t-test was used
to compare the mean values of gestational age and body weight in the two
groups. Multiple linear regression analyses with stepwise selection of the
independent variables were performed to assess the best predictors of the
variables used to quantitate glomerular and tubular function.
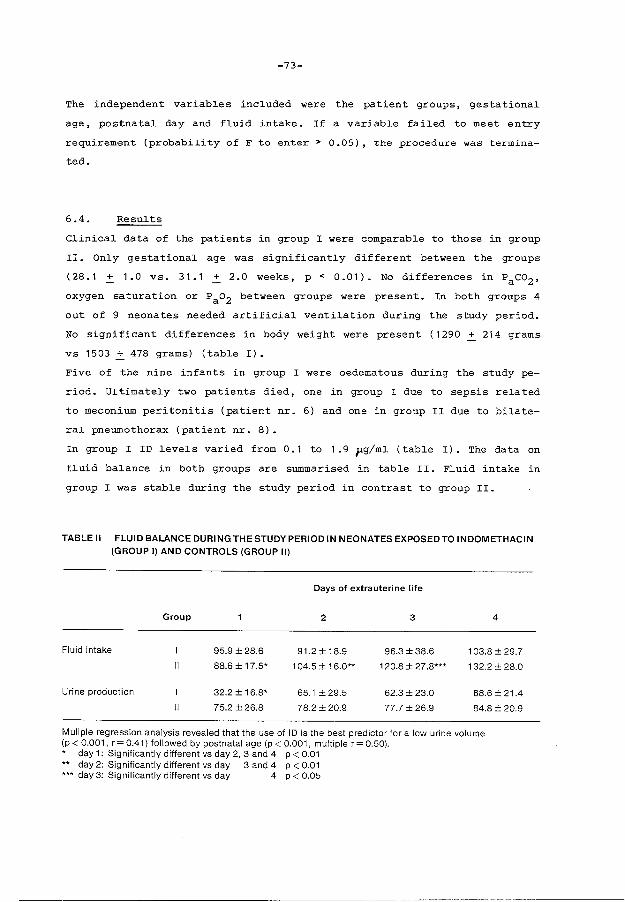
-73-
The independent variables included were the patient groups, gestational
age, postnatal day and fluid intake. If a variable failed to meet entry
requirement (probability ofF to enter> 0.05), the procedure was termina-
ted.
6.4. Results
Clinical data of the patients in group I were comparable to those in group
II. Only gestational age was significantly different between the groups
(28.1 + 1.0 vs. 31.1 .:!:. 2.0 weeks, p < 0.01). No differences in Paco2 ,
oxygen saturation or Pao2 between groups were present. In both groups 4
out of 9 neonates needed artificial ventilation during the study period.
No significant differences in body weight were present ( 1290 + 214 grams
vs 1503.:!:. 478 grams) (table I).
Five of the nine infants in group I were oedematous during the study pe
riod. Ultimately two patients died, one in group I due to sepsis related
to meconium peritonitis (patient nr. 6) and one in group II due to bilate
ral pneumothorax (patient nr. 8).
In group I ID levels varied from 0.1 to 1.9 flg/ml (table I). The data on
fluid balance in both groups are summarised in table II. Fluid intake in
group I was stable during the study period in contrast to group II.
TABLE II FLUID BALANCE DURINGTHESTUDYPERIODIN NEONATES EXPOSED TO INDOMETHACIN (GROUP I) AND CONTROLS (GROUP II)
Days of extrauterine life
Group 2 3 4
Fluid intake 95.9 ±28.6 91.2 ± 18.9 96.3 ±38.6 103.8 ±29.7
II 88.6 ± 17.5* 1 04.5 ± 1 6.0** 120.8 ± 27 .8*** 132.2 ± 28.0
Urine production I 32.2 ± 16.8* 65.1 ±29.5 62.3±23.0 68.6 ± 21.4
II 75.2 ±26.8 78.2±20.9 77.7±26.9 84.8±20.9
Muliple regression analysis revealed that the use of ID is the best predictor for a low urine volume (p < 0.001, r= 0.41) followed by postnatal age (p < 0.001, multiple r = 0.50). * day 1: Significantly different vs day 2, 3 and 4 p < 0.01 ** day 2: Significantly different vs day 3 and 4 p < 0.01 *** day 3: Significantly different vs day 4 p < 0.05

-74-
Intrauterine exposure to ID was found to be the best predictor for a low
urine output among the variables included in the study (multiple r =
0.41). Postnatal age was second best. By adding postnatal age to the
regression equation multiple r rose to 0.50, indicating that urine output
increased with postnatal age. Other variables failed to meet entry re
quirements. In both groups parameters of glomerular function, i.e. Cin and
Screat• did not change during the study period. However group I had a sig
nificantly lower cin compared to that of group II (p < 0.002, r = 0.77)
and a significantly higher Screat (p < 0.0001, r =0.70). No correlation
was found between the measured values and gestational age (table II I) •
Screat in group I after about 2 weeks was 55 pmol/L ~ 16.
TABLE Ill GLOMERULAR FUNCTION PARAMETERS IN NEONATES EXPOSED TO INDOMETHACIN (GROUP I} AND CONTROLS (GROUP II}
Days of extrauterine life
Group 2 3 4
Inulin clearance 0.65± 0.15 0.63± 0.13 0.51 ± 0.13 ml/min.kg
II 0.85± 0.15 0.89± 0.17 0.91 ± 0.12
Screatinine 103.9 ±24.6 100.0 ±22.8 103.7 ±36.7 umol/1
II 56.2± 10.7 50.6 ± 12.6 50.7±17.1
Multiple regression analysis revealed that inulin clearance correlates negatively with the exposure to ID (p < 0.001, r= 0.77). Serum creatinine values were higher in the ID treated infants.
Renal tubular functional parameters are s=marised in table IV. None of
the parameters changed during the study in the two groups. Multiple re
gression analysis demonstrated that the exposure to ID was the only pre
dictor for a high uosmol (p < 0.01, r = 0.38). Cosmol was less in group I
compared to that in group II (p < 0.02, r = 0.38) as was cH20 (p < 0.01,
r = 0.39). Neither fluid intake nor postnatal age were significant predic
tors of the observed changes. FENa did not differ between the groups.
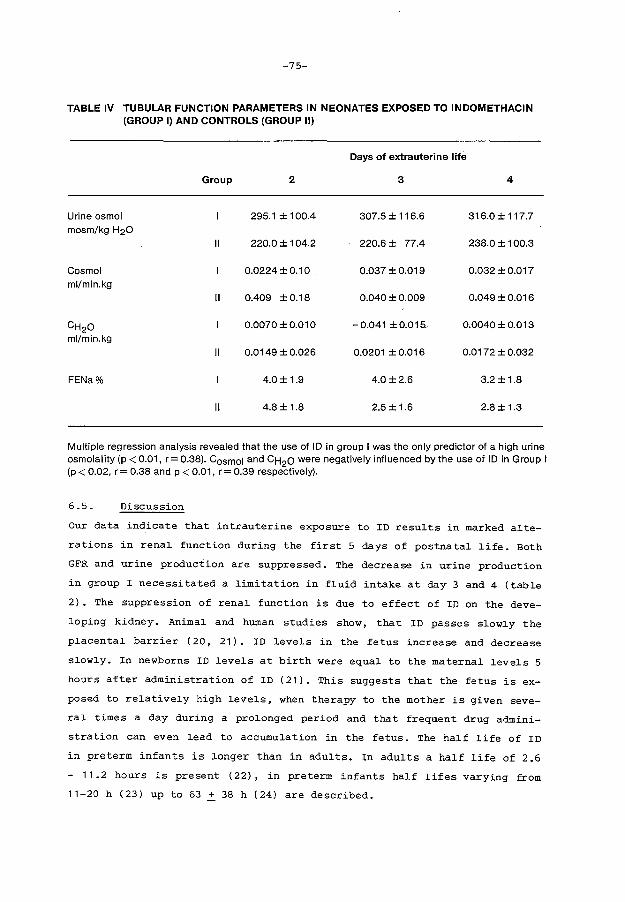
-75-
TABLE IV TUBULAR FUNCTION PARAMETERS IN NEONATES EXPOSED TO INDOMETHACIN (GROUP I) AND CONTROLS (GROUP II)
Days of extrauterine life
Group 2 3 4
Urine osmol 295.1 ± 1 00.4 307.5 ± 116.6 316.0±117.7 mosm/kg H20
II 220.0 ± 104.2 220.6± 77.4 238.0 ± 100.3
Cosmo I 0.0224 ± 0.1 0 0.037 ± 0.019 0.032 ± 0.017 ml/min.kg
II 0.409 ±0.18 0.040 ± 0.009 0.049 ± 0.016
CH20 0.0070 ± 0.01 0 -0.041 ± 0.015" 0.0040 ± 0.013 ml/min.kg
II 0.0149 ± 0.026 0.0201 ± 0.016 0.0172 ± 0.032
FENa% 4.0 ± 1.9 4.0±2.6 3.2 ± 1.8
II 4.8± 1.8 2.5 ± 1.6 2.8 ± 1.3
Multiple regression analysis revealed that the use of ID in group I was the only predictor of a high urine osmolality (p < 0.01, r = 0.38). Cosmo I and CH2o were negatively influenced by the use of ID in Group I (p < 0.02, r = 0.38 and p < 0.01, r = 0.39 respectively).
6.5. Discussion
Our data indicate that intrauterine exposure to ID results in marked alte
rations in renal function during the first 5 days of postnatal life. Both
GFR and urine production are suppressed. The decrease in urine production
in group I necessitated a limitation in fluid intake at day 3 and 4 (table
2). The suppression of renal function is due to effect of ID on the deve
loping kidney. Animal and human studies show, that ID passes slowly the
placental barrier (20, 21). ID levels in the fetus increase and decrease
slowly. In newborns ID levels at birth were equal to the maternal levels 5
hours after administration of ID (21). This suggests that the fetus is ex
posed to relatively high levels, when therapy to the mother is given seve
ral times a day during a prolonged period and that frequent drug admini
stration can even lead to accumulation in the fetus. The half life of ID
in preterm infants is longer than in adults. In adults a half life of 2.6
- 11.2 hours is present (22), in preterm infants half lifes varying from
11-20 h (23) up to 63 ~ 38 h (24) are described.

-76-
Consequently the effect of ID given prenatally can continue for a consi
derable period postnatally. The levels of ID in our present study varied
from 0.1 to 1.9 ug/ml, which is in the same range as observed when using
ID for medical closure of the patent ductus arteriosus (25,26).
we used cin for measuring GFR, as creatinine clearances during the first
days of extrauterine life are not reliable (27). A disadvantage of the
Cin' measured with a continuous inulin infusion is, that the GFR can only
be calculated after a prolonged period of inulin infusion because of the
known long equilibration time in the preterm infant ( 28) . A small, but
significant, difference in gestational age between the study groups is
present. This is due to the fact that preterm labor in the referring hos
pital is nowadays generally treated with ID. Therefore few preterm babies
are born without ID exposure. The cin was expressed in ml/min per kg in
order to minimize the effects of differences existing between the two
groups. The difference in gestational age between both groups does proba
bly not influence the results of the present study. In another study on 33
neonates with a gestational age varying from 27 to 36 weeks, in whom Cin
was measured on day 3, 4 or 5, no correlation of the GFR per kg BW with
gestational age between 27 and 34.5 weeks was observed (figure II, chapter
5). The data of Coulthard (29) concerning neonates with a comparable ges
tational age support these results. In our study groups no correlation
existed between the measured values and gestational or postnatal age.
We assume that GFR increased to normal values after the observation pe
_riod, since Screat in all infants was normal for age after 2 weeks (30).
Cin was not repeated at that time because of ethical and practical rea
sons. Intravenous infusion was not longer necessary in a number of pa
tients and some were referred to another hospital. Also in the other 11
newborns exposed to ID but excluded from the statistical analysis no long
lasting effects on GFR were observed, as judged from the serum creatinine
values. Renal tubular water handling was negatively influenced in the new
borns exposed to ID. The observed effects on renal water handling are in
accordance to those observed during medical treatment for a patent ductus
arteriosus and can be attributed to either the low GFR or the improvement
of concentrating capacity. Changes in FENa were not demonstrated in our
study.
Although the effect on renal function in group I was temporary, we consi
der the use of this drug as controversial.

-77-
It is known from animal studies that differentiation processes in the ma
turing fetus are accompagnied by major changes in prostaglandin activity
(31). The data of Novy et al. on intrauterine development of monkeys expo
sed to ID (6), demonstrating an arrest in nefrogenesis related to the use
of ID, are in our opinion alarming. Total kidney volume in these monkey
fetuses was reduced about 38% compared to non-exposed fetuses.
Furthermore, the effects of inhibition of prostaglandin synthesis on other
organ systems cannot be neglected.
In the rabbit intrauterine closure of the ductus arteriosus can lead to
intrauterine death (3,4), and in the newborn pig ID treatment leads to an
important reduction in cerebral blood flow (5). In the newborn baby there
are reports about reduction in cerebral blood flow velocities associated
with ID treatment (32,33), persisting fetal circulation (7,8,9) and tem
porary insufficiency of the mitral valve (10). Itskowitz et al. (11) des
cribed three women in whom pregnancy ended with an oligohydramnios and
perinatal death after exposure to ID for 4-6 days.
Cantor ( 12) reported transient anuria after 9 weeks of ID treatment for
Still's disease of the mother. Veersema et al. (13) described a so called
renal non functioning syndrome in a newborn related to 8 weeks ID treat
ment of the pregnant mother. We also described one newborn with the same
symptoms ( 14) and we recently observed another infant remaining totally
anuric associated with an intrauterine exposure of 9 weeks to ID.
It is known that ID impairs GFR in adults as well as in preterm newborns.
In adults this phenomenon occurs especially in situations in which high
levels of angiotensin II are present (34). In human preterm neonates an
impairment of GFR has been observed during ID treatment of the patent duc
tus arteriosus (15,16,17,18). The underlying mechanism of the effect of
ID upon GFR in adults, in neonates exposed after birth and in the newborns
exposed during pregnancy is probably the same. Levels of angiotensin II
are indeed high in newborns and decline after birth ( 35) . Inhibition of
prostaglandin synthesis blocks the antagonising effect of prostaglandins
on angiotensin II induced vasoconstriction.
There is evidence from animal studies that renal vascular resistance is
high and cortical perfusion low compared to later in life (36,37,38).
The inhibition of prostaglandin synthesis may so further increase renal
vascular resistance, resulting in an impaired renal blood flow and a
concomi ttantly reduced GFR. When ID is used for longer periods during

-78-
pregnancy a severe rena~ insufficiency can deve~op; sometimes irreversib~e
functiona~ damage occurs (11,12,13,14).
In conc~usion, a significant suppression of g~omeru~ar function combined
with a marked antidiuresis is present in neonates born after intrauterine
exposure to ID. This has major imp~ications on the f~uid management of the
newborns concerned and on the administration of drugs such as digoxin or
nephrotoxic drugs. A~though the a~terations in rena~ function may be tran
sient, we consider pro~onged ID treatment during pregnancy as an important
risk factor for the deve~oping fetus.
-79-
6.6. References
1. Zuckerman H, Reiss U, Rubinstein I. Inhibition of human premature la
bor by indomethacin. Obstet Gynecol 1974;44:787-92.
2. Niebyl JR, Witter FR. Neonatal outcome after indomethacin treatment
for preterm labor. Am J Obstet Gynecol 1986;155:747-49.
3. Sharpe GL, Thalme B, Larsson KS. Studies on closure of the ductus ar
teriosus. XI. Ductal closure in utero by a prostaglandin synthetase
inhibitor. Prostaglandins 1974;8:363-68.
4. Harris WH. The effects of repeated doses of indomethacin on fetal rab
bit mortality and on the patency of the ductus arteriosus. Can J Phy
siol Pharmacol 1980;58:212-16.
5. Leffler CW, Busija DW, Beasly DG, Fletcher AM, Green RS. Effects of
indomethacin on cardiac output distribution in no:t;mal and asfyxia ted
piglets. Prostaglandins 1986;31:183-90.
6. Novy MJ. Effects of indomethacin on labor, fetal oxygenation, and fe
tal development in rhesus monkeys. Adv Prostaglandin Thromboxane Res
1978;4:285-300.
7. Csaba IF, Sulyok E, Ertl T. Relationship of maternal treatment with
indomethacin to persistence of fetal circulation syndrome. J Pediatr
1978;92:484.
8. Wilkinson AR, Aynsley-Green A, Mitchell MD. Persistent pulmonary hy
pertension and abnormal prostaglandin E levels in preterm infants af
ter maternal treatment with naproxan. Arch Dis Child 1979;54:942-45.
9. Molina V, Krauel J, Baraibar R, Campistol J. Persistencia de la cir
culaci6n fetal. A prosp6sito de un caso asociado a tratamiento materno
con indometacina. An Esp Pediatr 1980;13:163-68.
-80-
10. Magny JF, Petit J, Saby MA, Dehan M, Gabilan JC. Administration mater
nelle d I indometacine et insuffisance tricuspide neona tale. Arch Fr
Pediatr 1987;44:189-90.
11. Itskovitz J, Abramovici H, Brandes J. Oligohydramnion, meconium and
perinatal death concurrent with indomethacin treatment in human preg
nancy. J Reprod Med 1980;24:137-40.
12. Cantor B, Tyler T, Nelson RM, Stein GH. Oligohydramnios and transient
neonatal anuria. A possible association with the maternal use of pros
taglandin synthetase inhibitors. J Reprod Med 1980;24:220-23.
13. Veersema D, De Jong PA, Van Wijck JAM. Indomethacin and the fetal re
nal non function syndrome. Eur J Obstet Gynecol Reprod Biol 1 983; 16:
113-21.
14. V.d. Heijden AJ, Tibboel D, Fetter WPF, Wolff ED. Intrauterine exposu
re to indomethacin. Eur J Pediatr 1986;145:579-80.
15. Seyberth HW, Rascher w, Hackenthal R, Wille L. Effect of prolonged in
domethacin therapy on renal function and selected vasoactive hormones
in very-low-birth-weight infants with symptomatic patent ductus arte
riosus. J Pediatr 1983;103:979-84.
16. Betkerur MV, Yeh TF, Miller K, Glasser RJ, Fildes RS. Indomethacin and
its effect on renal function and urinary kallikrein excretion in pre
mature infants with patent ductus arteriosus. Pediatrics 1981; 68:
99-102.
17. Seyberth HW, Rascher W, Wille L, Hackenthal E, Ulmer HE. Evaluation of
adverse renal reactions to prolonged indomethacin therapy in preterm
infants with persistent ductus arteriosus. Pediatr Pharmacol 1983;3:
259-66.
18. John EG, Vasan U, Hastreiter AR, Bhat R, Evans MA. Intravenous indome
thacin and changes of renal function in premature infants with patent
ductus arteriosus. Pediatr Pharmacol 1984;4:11-19.
-81-
19. Versmold HT, Kitterman JA, Phibbs RH, Gregory GA, Tooley WH. Aortic
blood pressure during the first 12 hours of life in infants with birth
weight 610 to 4,220 grams. Pediatrics 1981;67:607-13.
20. Anderson DF, Phernetton TM, Rankin JHG. The measurement of placental
drug clearance in near-term sheep: indomethacin. J Pharmacol Exp Ther
1980;213:100-4.
21. Traeger A, ~6schel H, Zaumseil J. Zur Pharmacokinetick von Indometha
cin bei Schwangeren, Kreissenden und deren Neugeborenen. Zentralbl
Gynakol 1973;95:635-41.
22. Helleberg L. Clinical pharmacokinetics of indomethacin. Clin Phar
macokinet 1981;6:245-58.
23. Evans MA, Bhat R, Vidyasagar D, Vadapalli M, Fischer E, Hastreiter A.
Gestational age and indomethacin elimination in the neonate. Clin
Pharmacol Ther 1979;26:746-51.
24. Regazzi MB, Rondanelli R, Vidale E, Chirico G, Rondini G, Chiara A,
Piccolo A. Pharmacokinetics and clinical efficacy of indomethacin in
premature infants with patent ductus arteriosus. Int J Clin Pharmacol
Res 1984;4:109-12.
25. Thalji AA, Carr I, Yeh TF, Raval D, Luken JA, Pildes RS. Pharmacokine
tics of intravenously administered indomethacin in premature infants.
J Pediatr 1980;97:995-1000.
26. Yaffe SJ, Friedman WF, Rogers D, Lang P, Ragni M, Saccar C. The dispo
sition of indomethacin in preterm babies. J Pediatr 1980;97:1001-6.
27. Manzke H, Spreter von Kreudenstein P, Dorner K, Kruse K. Quantitative
measurements of the urinary excretion of creatinine, uric acid, hypo
xanthine and xanthine, uracil, cyclic AMP, and cyclic GMP in healthy
newborn infants. Eur J Pediatr 1980;133:157-61.
28. Coulthard MC. Comparison of methods of measuring renal function in
preterm babies using inulin. J Pediatr 1983;102:923-30.
-82-
29. Coulthard MC, Maturation of glomerular filtration in preterm and matu
re babies. Early Hum Dev 1985;11:281-92.
30. Rudd PT, Hughes EA, Placzek MM, Hodes DT. Reference ranges for plasma
creatinine during the first month of life. Arch Dis Child 1983;58:
212-15.
31. Pace-Asciak CR. Biosynthesis and catabolism of prostaglandins during
animal development. Adv Prostaglandin Thromboxane Res 1976;1:35-46.
32. Bejar R, Vigliocco G, Gramajo H, Sahn D, Merritt A, McFeely E, Heldt
G. Decrease of the cerebral blood flow velocities by indomethacin
(INDO). Pediatr Res 1987;21:352A.
33. Laudignon N, Chemtob s, Bard H, Aranda JV. Effect of indomethacin ce
rebral blood velocity of premature newborns. Pediatr Res 1987;21 :237A.
34. Nadler SP, Brenner BM. Role of arachidonic acid metabolites. In: Bren
ner BM, Stein JH, eds. Body fluid homeostasis. Churchill Livingstone,
1987:109-129.
35. Fiselier TJW, Lijnen P, Monnens L, Van Munster P, Jansen M, Peer P.
Levels of renin, angiotensin I and II, angiotensin-converting enzyme
and aldosterone in infancy and childhood. Eur J Pediatr 1983;141:3-7.
36. Gruskin AB, Edelmann Jr. CM; Yuan S. Maturational changes in renal
blood flow in piglets. Pediatr Res 1970;4:7-13.
37. Olbing H, Blaufox MD, Aschinberg LC, Silkans GI, Bernstein J, Spitzer
A, Edelmann Jr. C, Liang TCW. Postnatal changes in renal glomerular
blood flow distribution in puppies. J Clin Invest 1973;52:2885-95.
38. Tavani Jr. N, Calcagno P, Zimmet S, Flamenbaum W, Eisner G, Jose P.
Ontogeny of single nephron filtration distribution in canine puppies.
Pediatr Res 1980;14:799-802.
-83-
Chapter 7 GENERAL DISCUSSION
In chapter 3 the effect of acute hypercapnic acidosis on renal function in
the newborn rabbit is investigated. Major changes in renal hemodynamics
were observed. A dramatic fall in RBF was combined with a less pronounced
decrease in GFR during acute hypercapnia leading to an increase in filtra
tion fraction. we attributed this finding to an increase in renal vascular
resistance, predominating at the 1eve1 of the efferent arteriole. However,
the increase in filtration fraction may also be related to intrarena1 re
distribution of blood flow, while differences in fi1 tration fraction be
tween surface and deep nephrons are shown to be present in other animal
experiments (Seldin and Giebisch, 1985). The observations show that severe
acute hypercapnic acidosis per se leads to vasoconstriction in the kidney.
This is in agreement with data from experiments in the adult animal (Ber
sentes and Simmons, 1967; Norman et a1., 1970; Farber et al., 1976).
The mechanisms contributing to the decrease in RBF were not investigated
in this study, but it is of no doubt that hormonal influences are of major
importance. Kurtz and Zehr (1978) demonstrated an incre?se in renin relea
se during co2 retention in dogs, mediated via the hormonal catecholamine
system and via the renal nerve pathway. These findings were confirmed by
others with or without a decrease in MAP or RBF (Anderson et a1., 1980,
1982; Rose et al., 1982). The observations of Edwards ( 1983) that the
effect of Angiotensin II in rabbit kidneys predominates at the level of
the efferent arteriole may explain the in our study observed increase in
filtration fraction.
Denervation procedures were performed by different authors in studies
aiming at defining the influence of renal nerves on renal hemodynamics du
ring hypercapnia. Bersentes and Simmons (1967) found no improvement of RBF
after denervation during hypercapnia in contrast to Norman et aL ( 1970)
and Berns et a1. ( 1979) • The decrease in GFR found by Anderson et a1.
(1983) during hypercapnia was abolished by denervation. Other experiments
have shown, that renal denervation can partially (Edwards, 1983) or total
ly (Anderson et a1., 1980) normalise elevated renin levels. The changes in
RBF, observed in our experiments can be due to a direct stimulation of the
renin-angiotensin system by hypercapnia or to a stimulation via the renal
nerves.
-84-
Arginin Vasopressin (AVP) is another, although less probable candidate.
Hypercapnia per se stimulates AVP secretion as observed in the adult dog
by Berns·et al. (1979). Their study suggests that AVP may be one of the
important factors causing renal vasoconstriction and antidiuresis in
hypercapnia. On the other hand the influence of AVP may be less pronounced
in the newborn animal, as suggested by the study of Robillard and Weitz
mann ( 1980). Exogenous administration of AVP in the fetal sheep did not
lead to rena). vasoconstriction in contrast to observations in the adult
animal. However a role for AVP in our experiments cannot be excluded.
Evidence for a role of catecholamines in the observed renal vasocon
striction is presented in the study of Bersentes and Simmons ( 196 7) • The
vasoconstrictory response in their experiments was prevented by admini
stration of phenoxybenzamine, an alpha blocking agent.
The effect of prostaglandins on changes in RBF during hypercapnic acidosis
has not extensively been studied, but the study of Anderson et al. (1982)
suggests an important role for prostaglandins in maintaining RBF during
hypercapnic acidosis. They found in the anaesthetized dog, that pretreat
ment with indomethacin resulted in a significant decrease in RBF and GFR
during hypercapnic acidosis. In animals without indomethacin pretreatment
only a small decrease in GFR was noted.
In conclusion it seems that the negative effect of acute hypercapnic aci
dosis on renal hemodynamics is the resultant of imbalance between vasocon
strictive hormones (renin-angiotensin system, catecholamines, AVP) and
:rasodilator hormones as prostaglandins. In this respect these data are
consistent with the observed changes in renal function related to the use
of ID as inhibitor of preterm labor as described in chapter 6.
The effect of acute hypoxemia on renal function in the newborn rabbit has
extensively been studied by Valloton (1984). In her experiments, in which
newborn rabbits of the same age as in our study were used, Pao2 was dimi
nished from normal values to 40 mm Hg. A significant decrease in urine vo
lume combined with a decrease in RBF and GFR were noted. Filtration frac
tion remained stable. The calculated RVR rose. Other studies on hypoxemia
in very young animals have been performed by Millard et al. (1979), Weiss
man and Clarke ( 1981) and Weissman et al. ( 1983) using the lamb, Rowe
and Straus (1973) using the piglet and John et al. (1980) using the puppy.
In all these studies changes in renal hemodynamics, i.e. a decrease in
renal plasma flow and/or in GFR, were described.
-85-
Interestingly, one study has been performed in which the combined effect
of hypoxemia and hypercapnia in a newborn animal (the piglet) was evalua
ted (Alward et al. 1978). A decrease in REF together with a stable GFR, so
an increase in filtration fraction was present in those experiments. In
the adult dog Rose et al. demonstrated, that a combination of mild hyper
capnia and hypoxemia led to a significant decrease in effective renal
plasma flow and GFR, which could not be observed during hypercapnia or
hypoxemia alone.
Also metabolic acidosis can alter renal hemodynamics. Robillard and Kisker
( 1987) studied the effects of severe lactic acidosis in the chronically
catheterised fetal sheep model. They observed a significant decrease in
REF combined with an increase in RVR in these fetuses. Also blood flow de
creased in the outer portion of the renal cortex during acidosis. pH chan
ges were rather large in their experiments. The pH decreased from 7.37 to
6.95. Our own data on renal hemodynamics during metabolic acidosis in
chapter 4 support these findings. We also observed a significant decrease
in REF and GFR in the newborn rabbit, associated with a decline in pH from
7.49 to 7.33 (table II, chapter 4). In the adult dog 2 studies have been
performed. Bersentes and Simmons (1967) demonstrated a renal vasoconstric
tion during severe metabolic acidosis, when serum pH decreased more than
0.20; Farber et al. (1976) confirmed these results.
In conclusion we assume that our experiments in the newborn rabbit and
data from the literature about hypercapnic acidosis, hypoxemia and meta
bolic acidosis indicate the background of changes in renal hemodynamics
occurring in neonates with respiratory distress syndrome (Guignard et al.,
1976; Cort, 1962; Tulassay et al., 1979).
In chapter 4 the influence of acute acid-base changes on bicarbonate hand
ling in the newborn rabbit was studied.
Data from literature demonstrate a low serum bicarbonate level in young
animals compared to later in life. This low serum bicarbonate level can be
related to renal proximal tubular immaturity as well as to extrarenal in
fluences on bicarbonate handling. Evidence for proximal tubular immaturity
is provided by studies in developing rats by Aperia (1987). She demonstra
ted that the Na+/H+ exchange in immature tubular cells of the rat is less
efficient compared to that in more mature tubular cells. Bicarbonate reab
sorption, in part depending on this Na + /H+ exchange may so be decreased
in the developing kidney compared to later in life.

-86-
The fetal lamb has a low bicarbonate threshold compared to the adult ewe
(Robillard et al., 1977), and the same applies to the newborn puppy (Moore
et aL, 1972). The low threshold for bicarbonate in these studies could
easily be increased by a minor volume depletion. This relation between
renal bicarbonate threshold and extracellular volume exists also in the
adult animal, as documented by Kurtzmann ( 1970) • The above mentioned ob
servations suggest, that the low serum bicarbonate level present in the
human newborn is in part associated with the high extracellular volume,
present in the neonate (Friis Hansen, 1961), and does not only depend on a
tubular immaturity in bicarbonate handling.
Kleinman (1978) demonstrated that tubular bicarbonate reabsorption mecha
nisms in the newborn dog were as efficient as those reported for the adult
dog. Bicarbonate reabsorption increased as Paco2 rose.
Schwartz and Evans (1983) found evidence in micropuncture studies in the
newborn rabbit juxtamedullary proximal convoluted tubules for tubular im
maturity in renal capacity to reabsorb bicarbonate. This prompted us to
delineate bicarbonate handling of the kidneys in the whole neonatal rabbit
model. The newborn rabbit is in a state of hypochloremic metabolic alkalo
sis compared to the adult rabbit, in sharp contrast to the described data
from other species and also to data from human neonates. The origin of the
alkalosis lies probably in three factors. Firstly we found evidence for
renal chloride wasting in this young animal, suggesting a different tubu
lar chloride handling. This can lead to the development and maintenance of
a metabolic alkalosis, as is for instance known to be present in humans
with Bartter's syndrome. Secondly, mother's milk of the rabbit provides a
considerable alkaline load to the newborn rabbit. Thirdly, this newborn
animal seems to be in a state of volume contraction. Indirect evidence for
volume contraction rests on the presence of a high urine osmolality (mean
Uosmol = 578 mosm/kg H2o); a low FENa ( 0 .89%) and the presence of hypo
chloremia (83 mmol/l). Volume contraction enhances bicarbonate reabsorp
tion. Bicarbonate reabsorption studies in this chapter show that the capa
city of the newborn rabbit's kidney to reclaim filtered bicarbonate is
very efficient and responds normally to changes in Paco2 and filtered
bicarbonate load.
The study underlines the importance of evaluation of whole kidney function
in animals before interpretating in vitro micropuncture studies to whole
kidney observations in other species.

-87-
Our observations do not provide definite answers on questions about the
presence or absence of immaturity in renal acid-base regulation in the
human neonate. We may only conclude from our data as well as from the data
of Robillard et al. (1977), Moore et al. (1972) and Kleinman (1978) that
no convincing evidence exists to postulate limitations in bicarbonate re
absorptive capacity in neonatal animals before or just after the end of
nefrogenesis. In contrast evidence is provided that extrarenal factors
have a considerable impact on bicarbonate reabsorption. Further support
for this statement is present in a study on renal bicarbonate handling in
low birth weight infants by Zilleruello et al. (1986). They found a mini
mal or absent fractional bicarbonate excretion in the urine of preterm
newborns, when blood pH was equal or less than 7.22 and Paco2 exceeded 50
mm Hg. However, data on glomerular filtration are not presented, so no
conclusions on bicarbonate reabsorption or bicarbonate threshold can be
drawn from their data. The number of investigations in this study is also
limited.
The observed impairment of renal acidification in newborns with severe RDS
by Allen and Usher (1971) and Torrado et al. (1974) ~ggests a limitation
in acid excretion in those infants. This may be due to an impaired capa
city in excreting an acid load in the newborn mentioned by Hatemi and
McCance ( 1961), who investigated the acidifying capacity in 7 days old
newborns and by Kerpel Fronius et al. (1970) and Sulyok et al. (1972).
More recent studies are lacking, while acid loading in newborns is now
adays not possible on medical ethical grounds.
Further evidence for a decrease in distal acidification during RDS is gi
ven by Androgue et al. ( 1983). They showed that acid-base regulation in
the kidney of the anaesthetized dog during hypercapnia is different from
the regulation under normal conditions. Proximal acidification increases,
distal acidification decreases however. A decrease between pco2 in the
urine and blood during respiratory acidosis under conditions, in which
bicarbonaturia was maintained, was found. In conclusion we demonstrated
that the rabbit, being in a state of hypochloremic metabolic alkalosis
does show a perfect capacity in bicarbonate reabsorption of the kidney.
This study, as well as the other mentioned studies, indicates that
bicarbonate reabsorption in the neonate can be influenced by extra-renal
factors in the same way as in the adult, despite the presence of proximal
tubular immaturity.
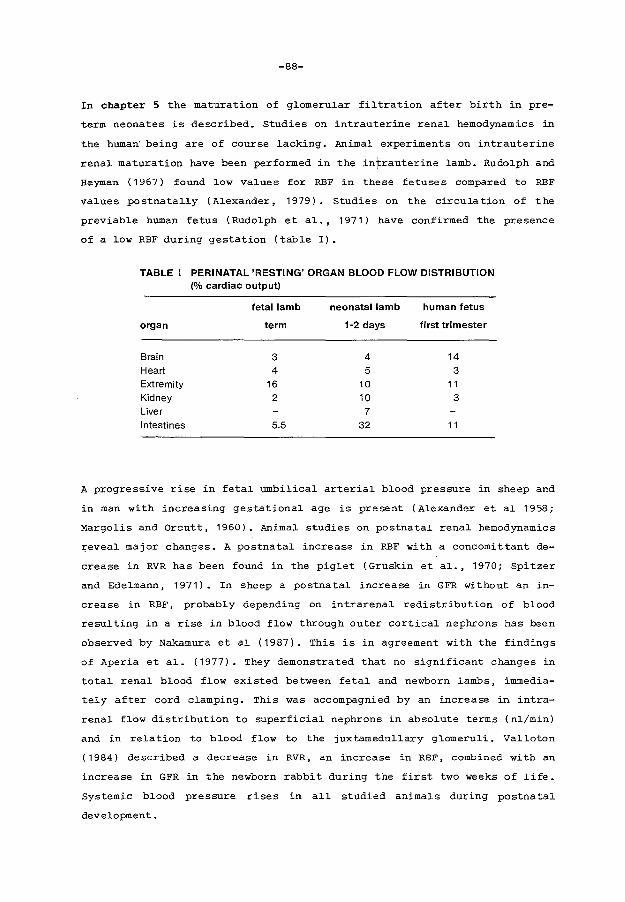
-88-
In chapter 5 the maturation of g~omeru~ar fi~tration after birth in pre-
term neonates is described. Studies on intrauterine rena~ hemodynamics in
the human being are of course ~acking. Anima~ experiments on intrauterine
rena~ maturation have been performed in the intrauterine ~amb. Rudo~ph and
Heyman ( 1967) found low values for RBF in these fetuses compared to REF
values postnatally (Alexander, 1979). Studies on the circulation of the
previable human fetus (Rudo~ph eta~ •• 1971} have confirmed the presence
of a ~ow RBF during gestation (tab~e I).
TABLE I PERINATAL 'RESTING' ORGAN BLOOD FLOW DISTRIBUTION (% cardiac output)
fetal lamb neonatal lamb human fetus
organ term 1·2 days first trimester
Brain 3 4 14 Heart 4 5 3 Extremity 16 10 11 Kidney 2 10 3 Liver 7 Intestines 5.5 32 11
A progressive rise in feta~ umbi~ica~ arteria~ b~ood pressure in sheep and
in man with increasing gestationa~ age is present (A~exander et a~ 1958;
Margo~is and Orcutt, 1960). Anima~ studies on postnatal renal hemodynamics
~evea~ major changes. A postnata~ increase in RBF with a concomittant de
crease in RVR has been found in the pig~et (Gruskin eta~ •• 1970; Spitzer
and Edelmann, 1971). In sheep a postnata~ increase in GFR without an in
crease in REF, probab~y depending on intrarena~ redistribution of b~ood
resu~ting in a rise in b~ood f~ow through outer cortica~ nephrons has been
observed by Nakamura eta~ (1987). This is in agreement with the findings
of Aperia et al. (1977). They demonstrated that no significant changes in
total renal b~ood f~ow existed between feta~ and newborn ~ambs, immedia
te~y after cord c~amping. This was accompagnied by an increase in intra
rena~ f~ow distribution to superficia~ nephrons in absolute terms (n~/min)
and in relation to blood flow to the juxtamedu~lary glomeruli. Va11oton
(1984) described a decrease in RVR, an increase in RBF, combined with an
increase in GFR in the newborn rabbit during the first two weeks of ~ife.
Systemic b~ood pressure rises in a~~ studied anima~s during postnata~
development.

-89-
In our study we evaluated changes in GFR during the first two weeks of
life. GFR increases in two different ways. In the first place an effect
of growth is present, demonstrated by a correlation between GFR expressed
in ml per minute and gestational age. In the second place GFR increases
postnatally. The data are in agreement with studies of Fawer et al.
(1979A) and Aperia et al. (1981A). In full term infants the rise in GFR is
paralleled by an increase in PAR clearance, indicating an increase in re
nal plasma flow (Guignard et al., 1975), accepting a constant PAR extrac
tion in those infants, which is improbable. Whether the same applies to
the preterm neonate is uncertain. The observed increase in PAR clearance,
together with the progressive rise in blood pressure in the first day
(Versmold et al., 1981) may be partly responsible for the postnatal matu
ration of GFR according to the animal experiments mentioned before.
We failed to demonstrate a negative influence of artificial ventilation on
glomerular filtration. This is in sharp contrast to data from Leslie et
al. ( 1986) in neonates and also to data from animal studies (Fewell and
Norton, 1980; Tyler, 1983). The explanation for our contrasting results
may be the selection of our patients. Only neonates with a stable clinical
condition were admitted to our study. Leslie et al. ( 1986) found indeed
that the decrease in GFR during artificial ventilation was accompagnied by
a significant decreased blood pressure; Priebe et al. ( 19 81) indica ted
that adequate intravascular volume plays a major role in maintaining a
normal renal function during positive end-expiratory pressure ventilation.
The low GFR found in other studies may probably be explained by disturban
ces in blood pressure, acid-base balance or hypoxemia and not by the ef
fect of artificial ventilation per se.
The changes in renal hemodynamics occuring perinatally are probably rela
ted to actions of a variety of hormones and vasoactive substances such as
catecholamines, bradykinin, histamin, the renin-angiotensin system, gluco
corticoids, antidiuretic hormone, atrial natriuretic peptide, endogenous
digoxin-like substance, prostaglandins. Evidence for hormonal influences
is provided in a number of studies (Mott JC, 1975; Padbury et al., 1985;
Leffler et al., 1985).
-90-
In chapter 6 we evaluated the influence of intrauterine exposure to indo
methacin, a cyclooxigenase inhibitor, on renal function in the neonate
born premature despite this therapy.
Nadler and Brenner (1987) recently reviewed the synthesis and role of ara
chidonic acid metabolism in the kidney. The kidney is capable of syntheti
sing products of all three families of compounds derived from arachidonic
acid. Most prostaglandins (PG's) are believed to act only locally, so it
is not surprising that their synthesis is compartimentali sed, allowing
specific actions on specific nephron processes. PGI 2 is the primary cyclo
oxigenase product in renal cortical arterioles; PGE2 is present in many
other parts of the nephron.
A number of stimuli for prostaglandin synthesis are known. Important are
vasoactive hormones. Major vasoactive hormones as angiotensin II, vaso
pressin, bradykinin and norepinephrin can stimulate prostaglandin synthe
sis.
The major renal effects of cyclooxigenase metabolites are an effect on re
nal hemodynamics and an effect on water and sodium handling.
1. The effect on renal hemodynamics
Infusion of PGE2 and PGI 2 in renal arteries leads to a reduced vascular
resistance and increased renal blood flow in a number of species. Also the
distribution of renal blood flow is influenced by PG's.
Juxta-medullary blood flow increases more than superficial cortical blood
flow during PG infusion. PG' s are important modulators of renal blood
flow, especially under circumstances, wherein increases in circulating and
intrarenal vasoconstrictive factors are present. They attenuate vasocon
strictive effects of these factors. Edwards ( 1985) demonstrated for in
stance in microperfusion studies in segments of arterioles of the rabbit
that norepinephrin induced vasoconstriction could be attenuated by arachi
donic acid perfusion. This effect could be blocked by addition of cyclo
oxigenase inhibitors.
Futhermore interactions between PG's and angiotensin II in the regulation
of renal vascular resistance are of major importance. PG's stimulate renin
release by juxtaglomerular cells, but counteract renal vasoconstrictory
effects of angiotensin II (figure I).
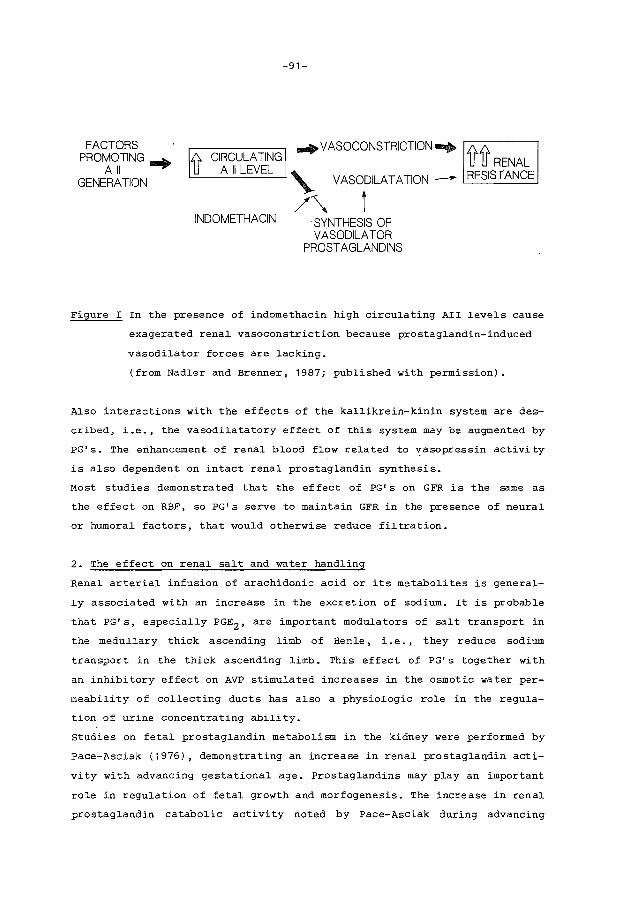
-91-
FACTORS PROMOTING am+
All GENERATION
.;). CIRCULATING .... VASOCONSTRICTION..... .;)..;).
U A II LEVEL
INDOMETHACIN
VASODILATATION
t SYNTHESIS OF VASODILATOR
PROSTAGLANDINS
U U RENAL - RESISTANCE
Figure I In the presence of indomethacin high circulating AII levels cause
exagerated renal vasoconstriction because prostaglandin-induced
vasodilator forces are lacking.
(from Nadler and Brenner, 1987; published with permission).
Also interactions with the effects of the kallikrein-kinin system are des
cribed, i.e., the vasodilatatory effect of this system may be augmented by
PG's. The enhancement of renal blood flow related to ~asopressin activity
is also dependent on intact renal prostaglandin synthesis.
Most studies demonstrated that the effect of PG' s on GFR is the same as
the effect on RBF, so PG's serve to maintain GFR in the presence of neural
or humoral factors, that would otherwise reduce filtration.
2. The effect on renal salt and water handling
Renal arterial infusion of arachidonic acid or its metabolites is general
ly associated with an increase in the excretion of sodium. It is probable
that PG's, especially PGE2 , are important modulators of salt transport in
the medullary thick ascending limb of Henle, i.e., they reduce sodium
transport in the thick ascending limb. This effect of PG's together with
an inhibitory effect on AVP stimulated increases in the osmotic water per
meability of collecting ducts has also a physiologic role in the regula-
tion of urine concentrating ability.
Studies on fetal prostaglandin metabolism in the kidney were performed by
Pace-Asciak (1976), demonstrating an increase in renal prostaglandin acti
vity with advancing gestational age. Prostaglandins may play an important
role in regulation of fetal growth and morfogenesis. The increase in renal
prostaglandin catabolic activity noted by Pace-Asciak during advancing
-92-
gestation parallels major renal morfological events. Novy (1978) mentioned
that indomethacin administration to pregnant monkeys led to an arrest in
nefrogenesis in their fetuses. Kidney growth was severely impaired in
these fetuses.
Several case reports concerning oligohydramnios and irreversible anuria
after delivery in neonates due to intrauterine exposure to ID drew atten
tion to the adverse effects on renal function in the human fetus ( Itzko
vitz et al., 1980; Cantor et al., 1980; Veersema et al., 1983; v.d. Heij
den et al., 1986). In our study we demonstrated an impairment in renal
function in preterm neonates during the first days of life after intra
uterine exposure to ID during a relative short period. The observation of
a reduced GFR resembles that observed in adults. ID can decrease renal
function in adults especially in situations in which renal and systemic
vasoconstriction occurs, for instance, congestive heart failure, liver
cirrhosis and nephrotic syndrome (Walshe and Venuto, 1979; Dunn, 1984;
Arisz et al., 1976) • The same applies probably for the human fetus and
newborn. Levels of angiotensin II are high in newborns and decline after
birth (Fiseliers et al., 1983).
ID can so disturb the balance between the different vasoactive hormones
leading to an increase in renal vascular resistance. In a study on the
effect of ID on renal function in neonatal rabbits a dramatic increase in
renal vascular resistance was observed, confirming this hypothesis
(Duarte-Silva et al., 1986). The depressing effect on renal function that
we observed was reversible. However, this still has important implications
on medical management of those often critically ill neonates during the
first week of life. Adjustment of fluid intake and dosages of different
drugs as for example aminoglycosides and digoxin seems to be necessary.
Our observation of fetal anuria in two newborns after intrauterine
exposure to ID during 6 and 9 weeks respectively confirms the case
histories already described. Longlasting ID therapy during pregnancy
presents a high risk for the fetus.
In the context of the described changes in renal hemodynamics, the overall
adaptation of renal function in the newborn is astonishing. This has al
ready been mentioned by Me Crory in 1972, stating: "Our clinical experien
ce attests to the admirable way in which the young infant's kidney regula
tes his water and electrolyte balance in the varied circumstances normally
encountered in the postnatal period".

-93-
The more knowledge is obtained, the more this statement is confirmed. Even
in the very preterm neonate glomerulotubular balance established itself
quickly despite a difference in morphological maturation between glomeruli
and tubuli pointing to glomerular preponderance. In clearance and micro
puncture studies in the newborn guinea pig Kaskel et al. (1987) beautiful
ly demonstrated that glomerulotubular balance during the early postnatal
life is made possible by a high permeability of the proximal tubuli, which
compensates for existing low net reabsorptive pressures in the tubuli. In
the more mature animal, in which hydraulic conductance diminishes (Larsson
and Horsten, 1976), an increase in active transport mechanisms for sodium
is postulated (Kaskel et al., 1987). In the developing rat maintenance of
glomerulotubular balance appears to be due to a combination of factors.
Glomerular plasma flow rises, the ultrafiltration coefficient increases.
Concurrently peritubular capillary reabsorption increases, presumably
reflecting an enlargement of peri tubular capillary reabsorption surface
area (Kon et al., 1984). These data are probably the physiological basis
for the existence of glomerulotubular balance in the immature animal and
the quick establishment of glomerulotubular balance in the preterm neonate
(Aperia et al., 1983).
7 .1. Clinical implications of the study
The purpose of the studies performed was to analyse renal functional adap
tation to extrauterine life and renal functional changes due to a number
of extrarenal influences.
The study in chapter 3 on hypercapnic acidosis together with the data in
chapter 5 on changes in glomerular function in the neonate leads to the
following statements.
A Renal functional adaptation to extrauterine life is excellent even in
the tiny premature neonate. However, GFR is low and negative influen
ces on renal hemodynamics can lead to important decreases in glomeru
lar function.
B Extreme hypercapnic acidosis is proven to have a negative impact on
RBF and GFR in the newborn rabbit. Hypercapnia may aggravate renal
functional decrease due to other factors in preterm neonates. Mainte
nance of an adequate ventilation and a pH within the normal range
-94-
therefore has a positive influence on renal function. A critical and
frequent control of renal function is needed in neonates with severe
respiratory distress permitting adaptations in fluid and drug regi
mes.
The study on acid-base regulation in the newborn rabbit (chapter 4) leads
to the following statements.
A Micropuncture studies in animal models are of extreme importance to
elucidate physiological mechanisms. Complementary investigations in
the whole animal model are however needed before results of micro
puncture studies lead to interpretations of mechanisms in the human
being.
B Bicarbonate handling of the immature kidney responds to extrarenal
influences in the same way as that of the mature kidney despite the
presence of proximal tubular immaturity.
C We suggest that a maintenance dose of sodium bicarbonate in the tiny
premature infant may be beneficial considering the known sodium loss
on proximal tubular level. and the limitations of the kidneys of these
infants in excreting an acid load.
The study on the influence of indomethacin in chapter 6 leads to the
following statements.
A Longlasting indomethacin treatment of pregnant women bears an unaccep
table risk for the fetus considering the data on oligohydramnios and
irreversible anuria post partum in such infants.
B When preterm infants are born shortly after ID exposure in utero glo
merular function is restricted indicating that adaptations in drug
dosages are needed.
C When preterm infants are born shortly after ID exposure in utero the
renal capacity in excreting a water load is restricted indicating
that adaptations in fluid intake are needed.

-95-
D A case control study concerning other side effects of intrauterine in
domethacin exposure is needed, as we now know the list of complica
tions of indomethacin administration postnatally: a reduction in cere
bral blood flow velocity, gastrointestinal bleeding and the risk of
intracerebral hemorrhage.

-96-
7.2. Summary
Nephrogenesis in the human being proceeds until the 35th week of gesta
tion. The anatomic immaturity of the kidneys in preterm neonates concurs
with a functional immaturity on glomerular as well as on tubular level.
The studies in this thesis are performed in order to analyse the effect of
extrarenal influences on renal function in the developing kidney. Studies
are in part performed in newborn rabbits before the end of nephrogenesis,
and in part in preterm human neonates.
Chapter 1 describes the backgrounds and the questions posed in this inves
tigation. The questions may be summarised as follows:
1. What is the effect of isolated hypercapnic acidosis on renal hemodyna
mics in the newborn rabbit?
2. What is the capacity of the immature kidney of the newborn rabbit to
reclaim filtered bicarbonate during acute acid-base changes?
3. How does glomerular function develop in the preterm neonate?
4. How does the immature kidney of the preterm human newborn respond to
exposure to indomethacin during pregnancy?
Chapter 2 summarises data on renal functional development from literature.
~he development of glomerular function, tubular function and acid-base re
gulation are separately discussed.
Chapter 3 is a study on the effect of isolated hypercapnia on renal hemo
dynamics in the newborn rabbit. Acute hypercapnia with a Paco2 of 80 mm Hg
and 100 mm Hg leads to an increase in renal vascular resistance, combined
with a decrease in effective renal plasma flow. Renal vasoconstriction due
to hypercapnia predominates at the level of the efferent arteriole leading
to an increase in filtration fraction. The results suggest that the renal
disturbances observed in neonates with respiratory distress may, at least
in part, be due to the effect of hypercapnic acidosis superimposed on the
already known effects of hypoxemia.
-97-
Chapter 4 is a study on renal bicarbonate handling in the newborn rabbit
during acute acid-base changes. The normal newborn rabbit is, in contrast
to observations in other species, in a hypochloremic metabolic alkalotic
state compared to the adult rabbit. The alkalosis is probably generated by
an alkaline load contained in the rabbit's mother's milk and maintained by
a state of renal tubular chloride wasting and volume contraction.
Bicarbonate reabsorption proves to be strongly dependent on the bicarbona
te filtered load during acute metabolic alkalosis and acidosis. A linear
positive relationship exists between increments in Paco2 and bicarbonate
reabsorption. The immature kidney in this animal shows an adequate respon
se to changes in the bicarbonate filtered load and Paco2 •
Chapter 5 describes the normal development of glomerular filtration rate
in 41 preterm neonates, using the continuous inulin infusion technique.
The reliability of this method for establishing glomerular filtration rate
was evaluated. The technical procedure as well as the duration of the inu
lin infusion proves to be adequate. The in this study investigated preterm
neonates demonstrate an increase in glomerular filtration rate in two dif
ferent ways. An increase is present, closely depending on an increase in
body weight and an increase is present related to postnatal age indepen
dent on body growth, probably associated with changes in renal hemodyna-
mics. In this study no differences in glomerular filtration rate between
neonates with or without artificial ventilation can be demonstrated.
Chapter 6 is a study on the effect of recent intrauterine exposure to in
domethacin on renal function in the pre term neonate just after delivery.
Nine preterm neonates exposed to indomethacin during the last two days of
pregnancy are compared with 9 neonates not exposed to this drug. Renal
functional evaluation is performed using a continuous inulin infusion for
5 consecutive days. Exposed neonates are markedly more oedematous than
controls. Renal functional evaluation reveals that glomerular filtration
is significantly decreased in exposed neonates compared to controls. Also
a significant decrease in water excretory capacity is present during the
study period. Renal functional impairment is temporary. This study under
lines the need for critical evaluation of renal function and fluid balance
in neonates intrauterine exposed to indomethacin, even after a short
-98-
period of treatment. Treatment of pregnant women for longer periods may be
harmful for renal functional development in the fetus. It may also cause
renal failure.
Chapter 7 is a general discussion reviewing the results of the previous
studies as well as data from literature on the same issues. Mechanisms
that may be related to the observations in the studies are highlighted.
The role of vasoactive hormones is discussed; especially the role of pros
taglandins on renal function during maturation is reviewed in order to
explain the observed effects of indomethacin on renal function described
in chapter 6. Considering our observations it is concluded that the over
all adaptation of renal function of the immature kidney is good. Finally
clinical implications of the studies are proposed.
-99-
7.3. Samenvatting
De nefrogenese van de mens eind.igt omstreeks de 35ste zwangerschapsweek.
De zodoende aanwezige anatomische onrijpheid van de nieren bij preterme
pasgeborenen gaat samen met een functionele onrijpheid. De in dit proef
schrift beschreven studies werden verricht om de reactie van de zich ont
wikkelende nieren op extrarenale veranderingen te bestuderen. De onder
zoeken werden deels verricht bij het pasgeboren konijn voor de beeindi
ging van de nefrogenese; deels bij preterme pasgeborenen.
In hoofdstuk 1 wordt een kort overzicht gegeven van de achtergrond van het
onderzoek. Vervolgens worden de in het proefschrift gestelde vragen opge
somd, namelijk:
1) Wat is het effect van geisoleerde respiratoire acidose op de hemodyna
miek in de nier bij het pasgeboren konijn?
2) In hoeverre zijn de nieren van het pasgeboren konijn in staat tot bi
carbonaatreabsorptie tijdens acute veranderingen van het zuur-base
evenwicht?
3) Hoe ontwikkelt zich de glomerulaire functie bij de preterme pasgebo-
rene?
4) Hoe is de reactie van de nieren van de preterme pasgeborene op intra
uterine blootstelling aan indomethacine?
In hoofdstuk 2 wordt een li teratuuroverzicht gegeven van de nierfunctie
ontwikkeling bij de preterme pasgeborene. De ontwikkeling van glomerulaire
functie, tubulaire functie en de renale zuur-base regulerende mechanismen
worden afzonderlijk behandeld.
In hoofdstuk 3 wordt het effect van geisoleerde respiratoire acidose op de
hemodynamiek van de nier bij het pasgeboren konijn beschreven. Acute res
piratoire acidose met een Paco2 van 80 mm Hg en 100 mm Hg resulteert in
een toename van de renale vaatweerstand gecombineerd met een afname van de
effectieve renale plasmaflow. De optredende renale vasoconstrictie is het
meest uitgesproken op het niveau van de efferente arteriolen, hetgeen
leidt tot een toename van de filtratiefractie. Uit de resultaten van deze
studie blijkt, dat de veranderingen in nierfunctie, welke worden waargeno-

-100-
men bij pasgeborenen met hyaliene membranen ziekte mede het gevolg kunnen
zijn van de hierbij aanwezige respiratoire acidose.
In hoofdstuk 4 wordt de bicarbonaat reabsorptiecapaciteit van de nieren
bij het pasgeboren konijn beschreven. In vergelijking met het volwassen
konijn bestaat er een hypochloraemische metabole alkalose bij het pasge
boren konijn •. Deze alkalose lijkt te berusten op een combinatie van fac
toren. Ten eerste zijn er aanwijzingen voor een hoog aanbod van alkali in
de moedermelk van het konijn. Ten tweede is er sprake van tubulair chloor
verlies. Ten derde is het pasgeboren konijn in een staat van volumecon
tractie. Be ide laatste factoren onderhouden een eenmaal bestaande alka
lose.
De hoeveelheid bicarbonaat, welke tijdens metabole alkalose en acidose ge
resorbeerd wordt, is in hoge mate afhankelijk van de hoeveelheid gefil
treerd bicarbonaat.
Er bestaat een lineaire positieve relatie tussen een toename van Paco2 en
de bicarbonaatreabsorptie. De onrijpe nier van dit pasgeboren proefdier
reageert adequaat op veranderingen in de hoeveelheid gefiltreerd bicarbo
naat en in de Paco2 • Uit de studie blijkt, dat de immaturiteit van de nie
ren, althans bij het jonge konijn, in bovenbeschreven omstandigheden geen
beperkende factor is voor bicarbonaatreabsorptie.
In hoofdstuk 5 wordt de normale ontwikkeling van de glomerulusfiltratie
van de preterme neonaat behandeld. De glomerulaire filtratiesnelheid wordt
bij 41 neonaten d.m. v. de continue inuline infusie vastgelegd. zowel de
technische procedure van de inulinebepaling als de toegepaste infusieduur
zijn voldoende voor een betrouwbare vaststelling van de glomerulusfiltra
tie. De glomerulusfiltratie van de in deze studie onderzochte pasgeborenen
neemt na de geboorte op 2 manieren toe: In de eerste plaats is er een toe
name aanwezig, welke nauw samenhangt met een toename in lichaamsgewicht.
In de tweede plaats bestaat er een toename, welke samenhangt met de post
natale leeftijd onafhankelijk van lichaamsgroei. Deze laatste stijging be
rust vermoedelijk op veranderingen van de hemodynamische verhoudingen in
de nier. In deze studie kan geen relatie tussen de glomerulusfiltratie en
beademing van de pasgeborenen worden aangetoond.
-101-
In hoofdstuk 6 wordt het effect van recente kortdurende intrauterine
blootstelling aan indomethacine op de nierfunctie van preterme neonaten
onderzocht. Negen kinderen, geboren na recente indomethacine toediening
worden vergeleken met 9 kinderen zonder deze therapie. De nierfunctie
wordt geevalueerd gedurende de eerste 5 extrauterine dagen d.m.v. continue
inuline infusie. Vijf behandelde pasgeborenen hadden klinisch manifest
oedeem. De glomerulaire fil tratiesnelheid in deze groep is significant
verlaagd in vergelijking met de controlegroep. Ook de waterklaring en de
osmolaire klaring zijn significant lager in de behandelde groep in verge
lijking met de controle groep. De effecten op de nierfunctie lijken van
tijdelijke aard te zijn.
Uit de studie blijkt het belang van nierfunctiebewaking en een goede con
trole van de vochtbalans bij pasgeborenen, waarvan de moeders recent indo
methacine toegediend kregen tijdens de zwangerschap, zelfs indien dit een
kortdurende therapie is. Langdurige indomethacinebehandeling van zwangeren
is mogelijk blijvend schadelijk voor de nierfunctieontwikkeling van de
foetus.
In hoofdstuk 7 worden de resultaten van de studies evenals relevante lite
ratuurgegevens besproken. De mechanismen, welke verband houden met de be
schreven bevindingen worden toegelicht. De rol van vasoactieve hormonen,
met name van prostaglandines op de nierfunctie en functieontwikkeling bij
de pasgeborene wordt besproken. In het licht van de gegevens uit onze
studies en de gegevens uit de literatuur blijkt, dat de aanpassingsmoge
lijkheden van de nier ondanks de zowel morphologische als functionele on
rijpheid bij de preterme neonaat uitstekend zijn. Tenslotte worden kli
nische consequenties uit de verichtte studies getrokken.

-102-
7.4. References
Al-Dahhan J, Haycock GB, Chantler C, Stimmler L. Sodium homeostasis in
term and preterm neonates. I Renal aspects. Arch Dis Child 1983A; 58:
335-342.
Al-Dahhan J, Haycock GB, Chantler C, Stimmler L. Sodium homeostasis in
term and preterm neonates. II Gastrointestinal aspects. Arch Dis Child
1983B; 58: 343-345.
Alexander DP, Nixon DA, Widdas WF, Wohlzogen FX. Gestational variations in
the composition of the foetal fluids and foetal urine in the sheep. J
Physiol (London) 1958; 140: 1-13.
Alexander G. Cold thermogenesis. In: Robertshaw D, ed. Environmental Phy
siology. III. Baltimore: University Park Press, 1979: 43-155.
Allen AC, Usher R. Renal acid excretion in infants with the respiratory
distress syndrome. Pediatr Res 1971; 5: 345-355.
Alward CT, Hook JB, Helmrath TA, Bailie MD. Effects of asphyxia on renal
function in the newborn piglet. Pediatr Res 1978; 12: 225-228.
Anderson RJ, Rose Jr. CE, Berns AS, Erickson AL, Arnold PE. Mechanism of
effect of hypercapnic acidosis on renin secretion in the dog. Am J Physiol
1980; 238: F119-F125.
Anderson RJ, Henrich WL, Gross PA, Dillingham MA. Role of renal nerves,
angiotensin II, and prostaglandins in the an tina triuretic response to
acute hypercapnic acidosis in the dog. Circ Res 1982; 50: 294-300.
Anderson RJ, Pluss RG, Pluss WT, Bell J, Zerbe GG. Effect of hypoxia and
hypercapnic acidosis on renal autoregulation in the dog: role of renal
nerves. Clin Sci 1983; 65: 533-538.
Andersson S, Tikkanen I, Pesonen E, Meretoja 0, Hynynen M, Fyhrquist F.
Atrial natriuretic peptide in patent ductus arteriosus. Pediatr Res 1987;
21 : 396-398.

-103-
Androgue HJ, Stinebaugh BJ, Gougoux A, Lemieux G, Vinay P, Tam sc, Gold
stein MB, Halperin ML. Decreased distal acidification in acute hypercapnia
in the dog. Am J Physiol 1983; 244: F19-F27.
Aperia A, Herin P. Development of glomerular perfusion rate and nephron
filtration rate in rats 17-60 days old. Am J Physiol 1975; 228:
1319-1325.
Aperia A, Broberger 0, Herin P, Joelsson I. Renal hemodynamics in the
perinatal period a study in lambs. Acta Physiol Scand 1977; 99: 261-269.
Aperia A, Broberger U. Beta-2-microglobulin, an indicator of renal tubular
maturation and dysfunction in the newborn. Acta Paediatr Scand 1979A; 68:
669-676.
Aperia A, Broberger 0, Herin P, zetterstrom R. Sodium excretion in rela
tion to sodium intake and aldosterone excretion in newborn pre-term and
full-term infants. Acta Paediatr Scand 1979B; 68: 813-817.
Aperia A, Broberger 0, Elinder G, Herin P, Zetterstrom R. Postnatal deve
lopment of renal function in pre-term and full-term infants. Acta Paediatr
Scand 1981A; 70: 183-187.
Aperia A, Elinder G. Distal tubular sodium reabsorption in the developing
rat kidney. Am J Physiol 1981B; 240: F487-F491.
Aperia A, Broberger o, Herin P. Thodenius K, Zetterstrom R. Postnatal con
trol of water and electrolyte homeostasis in pre-term and full-term in
fants. Acta Paediatr Scand 1983A; suppl 305: 61-65.
Aperia A, Broberger 0, Broberger U, Herin P, Zetterstrom R. Glomerular tu
bular balance in preterm and fullterm infants. Acta Paediatr Scand 1983B;
suppl 305: 70-76.
Aperia A. Neonatal nephrology in health and disease. In: Murakami K, Kita
gawa T, Yabuta K, Sakai T, eds. Recent advances in pediatric nephrology.
Amsterdam: Elsevier 1987: 21-27.

-104-
Arant Jr. BS. Developmental patterns of renal functional maturation compa
red in the human neonate. J Pediatr 1978; 92: 705-712.
Arisz L, Donker AJM, Brentjens JRH, Van der Hem GK. The effect of indome
thacin on proteinuria and kidney function in the nephrotic syndrome. Acta
Med Scand 1976; 199: 121-125.
Barnett HL, ijare WK, McNamara H, Hare RS. Influence of postnatal age on
kidney function of premature infants. Proc Soc Exp Biol Med 1948; 69:
55-57.
Berns AS, Anderson RJ, McDonald KM. Effect of hypercapnic acidosis on re
nal water excretion in the dog. Kidney Int 1979; 15: 116-125.
Bersentes TJ, Simmons DH. Effect of acute acidosis on renal hemodynamics.
Am J Physiol 1967; 212: 633-640.
Boyd E. The growth of the surface area of the human body. Minneapolis:
University of Minnesota Press, 1935.
Broberger U, Aperia A. Renal function in idiopathic respiratory distress
syndrome. Acta Paediatr Scand 1978; 67: 313-319.
Brodehl J, Gellissen K. Endogenous renal transport of free amino acids in
infancy and childhood. Pediatrics 1968; 42: 395-404.
Brodehl J, Gellissen K, Weber HP. Postnatal development of tubular phos
phate reabsorption. Clin Nephrol 1982; 17: 163-171.
Campbell S, Wladimiroff JW, Dewhurst CJ. The antenatal measurement of
fetal urine production. J Obstet Gynaecol Br Cwlth 1973; 80: 680-686.
Cantor B, Tyler T, Nelson RM, Stein GH. Oligohydramnios and transient neo
natal anuria. A possible association with the maternal use of prostaglan
din synthetase inhibitors. J Reprod Med 1980; 24: 220-223.
Catterton z, Sellers Jr. B, Gray B. Inulin clearance in the premature in
fant receiving indomethacin. J Pediatr 1980; 96: 737-739.
-105-
caverzasio J, Bonjour JP, Fleisch H. Tubular handling of Pi in young gro
wing and adult rats. Am J Physiol 1982; 242: F705-F710.
Cort RL. Renal function in the respiratory distress syndrome. Acta Pae
diatr Scand. 1962; 51: 313-323.
Cotting J, Guignard JP. Developmental patterns of renal functional matura
tion in the newborn rabbit. Int J Pediatr Nephrol 1982; 3: 112.
Coulthard MG. Comparison of methods of measuring renal function in preterm
babies using inulin. J Pediatr 1983A; 102: 923-930.
Coulthard MG, Ruddock V. Validation of inulin as a marker for glomerular
filtration in preterm babies. Kidney Int 1983B; 23: 407-409.
Coulthard MG, Hey EN. Weight as the best standard for glomerular filtra
tion in the newborn. Arch Dis Child 1984; 59: 373-375.
Coulthard MG, Hey EN. Effect of varying water intake on renal function in
healthy preterm babies. Arch Dis Child 1985; 60: 614-620.
Dean RFA, McCance RA. Inulin, diodone, creatinine and urea clearances in
newborn infants. J Physiol (Lond) 1947; 106: 431-439.
Dean RFA, McCance RA. The renal responses of infants and adults to the
administration of hypertonic solutions of sodium chloride and urea. J
Physiol (Lond) 1949; 109: 81-97.
Duarte-Silva M, Gouyon JB, Guignard JP. Renal effects of indomethacin and
dopamine in newborn rabbits. Kidney Int 1986; 30: 453-459.
Dunn MJ. Nonsteroidal antiinflammatory drugs and renal function. Annu Rev
Med 1984; 35: 411-428.
Edelmann Jr. CM, Boichis H, Rodriguez Soriano J, Stark H. The renal
response of children to acute ammonium chloride acidosis. Pedia tr Res
1967A; 1: 452-460.

-106-
Edelmann Jr. CM, Rodriguez Soriano J, Boichis H, Gruskin AB, Acosta MI.
Renal bicarbonate reabsorption and hydrogen ion excretion in normal
infants. J Clin Invest 1967B; 46: 1309-1317.
Edwards RM. Segmental effects of norepinephrine and angiotensin II on iso-
lated renal microvessels. Am J Physiol 1983; 244: F526-F534.
Edwards RM. Effects of prostaglandins on vasoconstrictor action in isola
ted renal arterioles. Am J Physiol 1985; 248: F779-F784.
Engle WD, Arant Jr. BS. Renal handling of beta-2-microglobulin in the hu
man neonate. Kidney Int 1983; 24: 358-363.
Engle WD, Arant Jr. BS. Urinary potassium excretion in the critically ill
neonate. Pediatrics 1984; 74: 259-264.
Farber MO, Szwed JJ, Dowell AR, Strawbridge RA. The acute effects of res
piratory and metabolic acidosis on renal function in the dog. Clin Sci Mol
Med 1976; 50: 165-169.
Fawer CL, Torrado A, Guignard JP. Maturation of renal function in full
term and premature neonates. Helv Paediatr Acta 1979A; 34: 11-21.
Fawer CL, Torrado A, Guignard JP. Single injection clearance in the neona-
te. Biol Neonate 1979B; 35: 321-324.
Feldman H, Guignard JP. Plasma creatinine in the first month of life. Arch
Dis Child 1982; 57: 123-126. J
Fetterman GH, Shuplock NA, Philipp FJ, Gregg HS. The growth and maturation
of human glomeruli and proximal convolutions from term to adulthood. Stu
dies by microdissection. Pediatrics 1965; 35: 601-619.
Fewell JE, Norton Jr. JB. Continuous positive airway pressure impairs re-
nal function in newborn goats. Pediatr Res 1980; 14: 1132-1134.
-107-
Fiselier TJW, Lijnen P, Monnens L, Van Munster P, Jansen M, Peer P. Levels
of renin, angiotensin I and II, angiotensin-converting enzyme and aldoste
rone in infancy and childhood. Eur J Pediatr 1983; 141: 3-7.
Friis-Hansen B. Body water compartments in children: changes during growth
and related changes in body composition. Pediatrics 1961; 28: 169-181.
Giebisch G. Mechanisms of renal tubular acidification. Klin Wochenschr
1986; 64: 853-861.
Gruskin AB, Edelmann Jr. CM, Yuan s. Maturational changes in renal blood
flow in piglets. Pediatr Res 1970; 4: 7-13.
Guignard JP, Torrado A, Da Cunha 0, Gautier E. Glomerular filtration rate
in the first three weeks of life. J Pediatr 1975; 87: 268-272.
Guignard JP, Torrado A, Mazouni SM, Gautier E. Renal function in respira
tory distress syndrome. J Pediatr 1976; 88: 845-850.
Hatemi N, McCance RA. Renal aspects of acid-base control in the newly
born. III. Response to acidifying drugs. Acta Paediatr Scand 1961; 50:
603-616.
Hay DA, Evans A. Maturation of the proximal tubule in puppy kidney: a com
parison to adult. Anat Rec 1979; 195: 273-300.
Haycock GB, Schwartz GJ, Wisotsky DH. Geometric method for measuring body
surface area: a height-weight formula validated in infants, children, and
adults. J Pediatr 1978; 93: 62-66.
Heller H. The renal function of newborn infants. J Physiol (London) 1944;
102: 429-440.
Holliday MA, Segar WE. The maintenance need for water in parenteral fluid
therapy. Pediatrics 1957; 19: 823-832.
Ichikawa I, Maddox DA, Brenner BM. Maturational development of glomerular
ultrafiltration in the rat. Am J Physiol 1979; 236: F465-F471.
-108-
Itzkovitz J, Abramovici H, Brandes JM. Oligohydramnion, meconium and pe
rinatal death concurrent with indomethacin treatment in human preg
nancy. J Reprod Med 1980; 24: 137-140.
John EG, Bhat R, Zeis PM, Vidyasagar D. Effects of hypoxia, hypocarbia
and acidemia on renal function and renal hemodynamics in puppies. Int J
Pediatr Nephrol 1980; 1: 167-171.
Karlen J, Aperia .A, Zetterstrom R. Renal excretion of calcium and phos
phate in preterm and term infants. J Pediatr 1985; 106: 814-819.
Kaskel FJ, Kumar AM, Lockhart EA, Evan A, Spitzer A. Factors affecting
proximal tubular reabsorption during development. Am J Physiol 1987;
252: F188-F197.
Kazimierczak J. Histochemical study of oxidative enzymes in rabbit kid
ney before and after birth. Acta Anat (Basel) 1963; 55: 352-369.
Kerpel-Fronius E, Heim T, Sulyok E. The development of the renal acidify
ing processes and their relation to acidosis in low-birth-weight infants.
Biol Neonate 1970; 15: 156-168.
Kleinman LI. Renal bicarbonate reabsorption in the newborn dog. J Phy
siol 1978; 281: 487-498.
Kon V, Hughes ML, Ichikawa I. Physiologic basis for the maintenance of
glomerulotubular balance in young growing rats. Kidney Int 1984; 25:
391-396.
Kurtzman NA. Regulation of renal bicarbonate reabsorption by extracellular
volume. J Clin Invest 1970; 49: 586-595.
Kurz KD, Zehr JE. Mechanisms of enhanced renin secretion during co2 re
tention in dogs. Am J Physiol 1978; 234: H573-H581.
Lang RE, Unger T, Ganten D, Weil J, Bidlingmaier F, Dohlemann D. -Atrial
natriuretic peptide concentrations in plasma of children with congenital
heart and pulmonary diseases. Br Med J 1985; 291: 1241.
-109-
Larsson L, Horster M. Ultrastructure and net fluid transport in isolated
perfused developing proximal tubules. J Ultrastruct Res 1976; 54:
276-283.
Larsson L, Aperia A, Elinder G. Structural and functional development of
the nephron. Acta Paediatr Scand 1983; suppl 305: 56-60.
Leake RD, Trygstad CW, Oh W. Inulin clearance in the newborn infant: rela
tionship to gestational and postnatal age. Pediatr Res 1976; 10: 759-762.
Leffler CW, Crofton J, Brooks DP, Share L, Hessler JR, Green RS. Changes
in plasma arginine vasopressin during transition from fetus to newborn
following minimal trauma delivery of lambs and goats. Biol Neonate 1985;
48: 43-48.
Leslie GI, Philips III JB, Work J, Ram S, Cassady G. The effect of assis
ted ventilation on creatinine clearance and hormonal control of electro-
lyte balance in very low birth weight infants. Pediatr Res 1986; 20:
447-452.
Lorenz JM, Kleinman LI, Kotagal UR, Reller MD. Water balance in very low
birth-weight infants: relationship to water and sodium intake and effect
on outcome. J Pediatr 1982; 101: 423-432.
McCance RA, Widdowson EM. Renal functions before birth. Proc R soc Lond
( Biol) 1953; 141 : 488-497.
McCrory WW, Forman CW, McNamara H, Barnett HL. Renal excretion of inorganic
phosphate in newborn infants. J Clin Invest 1952; 31: 357-366.
McCrory ~- Developmental nephrology. Cambridge: Harvard University Press,
1972: 159.
MacDonald MS, Emery JL. The late intrauterine and postnatal development of
human renal glomeruli. J Anat 1959; 93: 331-344.
Margolis AJ, Orcutt RE. Pressures in human umbilical vessels in utero. Am
J Obsted Gynecol 1960; 80: 573-576.

-110-
Millard RW, Baig H, Vatner SF. Prostaglandin control of the renal circu
lation in response to hypoxemia in the fetal lamb in utero. Circ Res
1979; 45: 172-179.
Moore ES, Fine BP, Satrasook SS, Vergel ZM, Edelmann Jr. CM. Renal reab
sorption of bicarbonate in puppies: effect of extracellular volume con
traction on the renal threshold for bicarbonate. Pediatr Res 1972; 6:
859-867.
Mott JC. The place of the renin-angiotensin system before and after birth.
Br Med Bull 1975; 31: 44-50.
Nadler SP, Brenner BM. Role of arachidonic acid metabolites. In: Brenner
BM, Stein JH, eds. Body fluid homeostatis. Churchill Livingstone, 1987:
109-129.
Nakamura KT, Matherne GP, McWeeny OJ, Smith BA, Robillard JE. Renal hemo
dynamics and functional changes during the transition from fetal to new
born life in sheep. Pediatr Res 1987; 21: 229-234.
Norman JN, Macintyre J, Shearer JR, Craigen IM, Smith G. Effect of carbon
dioxide on renal blood flow. Am J Physiol 1970; 219: 672-676.
Novy MJ. Effects of indomethacin on labor, fetal oxygenation and fetal de
velopment in rhesus monkeys. Adv Prostaglandin Thromboxane Res 1978; ·4:
287-300.
O'Brien D, Butterfield LJ. Further studies on renal tubular conservation
of free amino a.cids in early infancy. Arch Dis Child 1963; 38: 437-442.
Van Oort A, Monnens L, Van Munster P. Beta-2-microglobulin clearance, an
indicator of renal tubular maturation. Int J P'ediatr Nephrol 1980; 1:
80-84.
Pace-Asciak CR. Biosynthesis and catabolism of prostaglandins during ani
mal development. Adv Prostaglandin Tromboxane Res 1976; 1: 35-46.
-111-
Padbury JF, Polk DH, Newnham JP, Lam RW. Neonatal adaptation: greater sym
pathoadrenal response in preterm than full-term fetal sheep at birth. Am J
Physiol 1985; 248: E443-E449.
Pohjavuori M, Fyhrquist F. Hemodynamic significance of vasopressin in the
newborn infant. J Pediatr 1980; 97: 462-465.
Potter EL, Thierstein ST. Glomerular development in the kidney as an index
of fetal maturity. J Pediatr 1943; 22: 695-706.
Priebe HJ, Heimann JC, Hedly-Whyte J. Mechanisms of renal dysfunction
during positive end-expiratory pressure ventilation. J Appl Physiol 1981;
50: 643-649.
Rees L, Brook CGD, Shaw JCL, Forsling ML. Hyponatraemia in the first week
of life in preterm infants. Part I Arginine vasopressin secretion. Arch
Dis Child 1984A; 59: 414-422.
Rees L, Shaw JCL, Brook CGD, Forsling GML. Hyponatraemia in the first week
of life in pre term infants. Part II Sodium and water-balance. Arch Dis
Child 1984B; 59: 423-429.
Reid EL, Hills AG. Diffusion of carbon dioxide out of the distal nephron
in man during antidiuresis. Clin Sci 1965; 28: 15-28.
Robillard JE, Sessions c, Burmeister L, Smith Jr. FG. Influence of fetal
extracel.lular volume contraction on renal reabsorption of bicarbonate in
fetal lambs. Pediatr Res 1977; 11: 649-655.
Robillard JE, Weitzman RE. Developmental aspects of the fetal renal res
ponse to exogenous arginine vasopressin. Am J Physiol 1980; 238: F407-F414.
Robillard JE, Kisker CT. Effect of metabolic acidosis on fetal renal hae
modynamics. J Dev Physiol 1987; 9: 105-112.

-112-
Rodriguez-Soriano J, Vallo A, Oliveros R, Castillo G. Renal handling of
sodium in premature and full-term neonates: a study using clearance
methods during water diuresis. Pediatr Res 1983; 17: 1013-1016
Rose Jr. CE, Walker BR, Erickson A, Kaiser DL, Carey RM, Anderson RJ. Re
nal and cardiovascular responses to acute hypercapnic acidosis in con
scious dogs: role of renin-angiotensin. J Cardiovasc Pharmacol 1982; 4:
676-687.
Rose Jr. CE, Kimmel DP, Godine Jr. RL, Kaiser DL, Carey RM. Synergistic
effects of acute hypoxemia and hypercapnic acidosis in conscious dogs:
renal dysfunction and activation of the renin-angiotensin system. Circ
Res 1983; 53: 202-213.
Rowe MI, Strauss J. The renal response of the newborn to hypoxia. Pediatr
Res 1973; 7: 411.
Rudd PT, Hughes EA, Placzek MM, Hodes DT. Reference ranges for plasma
creatinine during the first month of life. Arch Dis Child 1983; 58:
212-215.
Rudolph AM, Heymann MA. The circulation of the fetus in utero: methods for
studying distribution of blood flow, cardiac output and organ blood flow.
Cir Res 1967; 21: 163-184.
Rudolph AM, Heymann MA, Teramo KAW, Barrett CT, Raiha NCR. Studies on the
circulation of the previable human fetus. Pediatr Res 1971; 5: 452-465.
Sapirstein LA, Vidt DG, Mandel MJ, Hanusek G. Volumes of distribution and
clearances of intravenously injected creatinine in the dog. Am J Physiol
1955; 181: 330-336.
Schwartz GJ, Evan AP. Development of solute transport in rabbit proximal
tubule. I. HC03- and glucose absorption. Am J Physiol 1983; 245:
F382-F390.
Seldin and Giebisch: The Kidney, Physiology and Pathophysiology, Volume I,
1985, Raven Press, 542-543.

-113-
Sendroy Jr. J. Cecchini LP. Determination of human body surface area from
height and weight. J Appl Physiol 1954; 7: 1-12.
Sertel H, Scopes J. Rates of creatinine clearance in babies less than one
week of age. Arch Dis Child 1973; 48: 717-720.
Seyberth HW, Rascher W, Hackenthal R, Wille L. Effect of prolonged indome
thacin therapy on renal function and selected vasoactive hormones in very
low-birth-weight infants with symptomatic patent ductus arteriosus. J Pe
diatr 1983; 103: 979-984.
Siegel SR, Oh w. Renal function as a marker of human fetal maturation.
Acta Paediatr Scand 1976; 65: 481-485.
Siegel SR. Hormonal and renal interaction in body fluid regulation in the
newborn infant. Clin Perinatal 1982; 9: 535-557.
Silbernagl S, Scheller D. Formation and excretion of NH3 pects of an old problem. Klin Wochenschr 1986; 64: 862-870.
NH4 + New as-
Smith CA, Yudkin S, Young W, Minkowski A. Cushman M. Adjustment of elec
trolytes and water following premature birth (With special reference to
edema). Pediatrics 1949; 3: 34-48.
Spitzer A, Edelmann Jr. CM. Maturational changes in pressure gradients for
glomerular filtration. Am J Physiol 1971; 221: 1431-1435.
Statius van Eps LW, Schardijn GHC. Beta-2-microglobuline and the renal tu
bule. Karger Continuing Education Series 1983; 3: 103-143.
Stonestreet BS, Oh W. Plasma creatinine levels in low-birth-weight infants
during the first three months of life. Pediatrics 1978; 61: 788-789.
Stonestreet BS, Rubin L, Pollak A, Cowett RM, Oh W. Renal functions of low
birth weight infants with hyperglycemia and glucosuria produce? by glucose
infusions. Pediatrics 1980; 66: 561-567.
-114-
Strauss J, Daniel SS, James LS. Postnatal adjustment in renal function.
Pediatrics 1981; 68: 802-808.
Sulyok E, Heim T, Soltesz G, Jaszai V. The influence of maturity on renal
control of acidosis in newborn infants. Biol Neonate 1972; 21: 418-435.
Sulyok E, Nemeth M, Tenyi L, Csaba L, Gyory E, Eril T, Varga F. Postnatal
development of renin-angiotensin-aldosterone system, RAAS, in relation to
electrolyte balance in premature infants. Pediatr Res 1979; 13: 817-820.
Svenningsen NW, Lindquist B. Incidence of metabolic acidosis in term, pre
term and small-for-gestational age infants in relation to dietary protein
intake. Acta Paediatr Scand 1973; 62: 1-10.
Svenningsen NW. Renal acid-base titration studies in infants with and
without metabolic acidosis in the postneona tal period. Pediatr Res 1 974A;
8: 659-672.
Svenningsen NW, Aronson AS. Postnatal development of renal concentration
capacity as estimated by DDAVP- test in normal and asphyxia ted neonates.
Biol Neonate 1974B; 25: 230-241.
Svenningsen NW. Single injection polyfructosan clearance in normal and
asphyxiated neonates. Acta Paediatr Scand 1975; 64: 87-95.
Torrado A, Guignard JP, Prod'hom LS, Gautier E. Hypoxaemia and renal func
tion in newborns with respiratory distress syndrome (RDS). Helv Paediatr
Acta 1974; 29: 339-405.
Trompeter RS, Al-Dahhan J, Haycock GB, Chik G, Chantler C. Normal values
for plasma creatinine concentration related to maturity in normal term and
preterm infants. Int J Pediatr Nephrol 1983; 4: 145-148.
Tudvad F, Vesterdal J. The maximal tubular transfer of glucose and para
aminohippurate in premature infants. Acta Paediatr Scand 1953; 42: 337-345.
-115-
Tudvad F, McNamara H, Barnett HL. Renal response of premature infants to
administration of bicarbonate and potassium. Pediatrics 1954; 13: 4-16.
Tulassay T, Ritvay J, Bors Z, Bliky B. Alterations in creatinine clearance
during respiratory distress syndrome. Biol Neonate 1979; 35: 258-263.
Tyler DC. Positive end-expiratory pressure, a review. Crit Care Med 1983;
11: 300-308.
Valloton M. Maturation de la fonction renale chez le lapin nouveau-ne
effet de l'hypoxemie. These Universite de Lausanne, Suisse 1984.
Veersema D, De Jong PA, Van Wijck JAM. Indomethacin and the fetal renal
nonfunctioning syndrome. Eur J Obstet Gynecol Reprod Biol 1983; 16:
113-121.
Versmold HT, Kitterman JA, Phibbs RH, Gregory GA, Tooley WH. Aortic blood
pressure during the first 12 hours of life in infants ~ith birth weight
610 to 4,220 grams. Pediatrics 1981; 67: 607-613.
Walshe JJ, Venuto RC. Acute oliguric renal failure induced by indometha
cin: possible mechanism. Ann Int Med 1979; 91: 47-49.
Weismann DN, Clarke WR. Postnatal age-related renal responses to hypoxemia
in lambs. Circ Res 1981; 49: 1332-1338.
Weismann DN, Herrig JE, McWeeny OJ, Ayres NA, Robillard JE. Renal and
adrenal responses to hypoxaemia during angiotensin-converting enzyme inhi
bition in lambs. Circ Res 1983; 52: 179-187.
Zilleruelo G, SultanS, Bancalari E, Steele B, Strauss J. Renal bicarbona
te handling in low birth weight infants during metabolic acidosis. Biol
Neonate 1986; 49: 132-139.
-116-
ACKNOWLEDGEMENTS
Dit promotieonderzoek is mogelijk gemaakt door de hulp van velen.
In de eerste plaats dank ik Janny. Dankzij haar vermogen tot relati
veren heeft dit proefschrift nooit een overheersende rol in mijn leven ge
speeld.
Gert-Jan en Marijke dank ik voor de tekeningen op het omslag, Thijs
voor het aangenaam gezelschap tijdens het schrijven.
Mijn ouders dank ik voor de mogelijkheden die zij mij geboden hebben.
Het enthousiasme waarmee zij samen een drukke huisartspraktijk voerden is
voor mij een voorbeeld.
Prof. Dr. H.K.A. Visser dank ik voor mijn opleiding tot kinderarts in een
zo boeiend ziekenhuis als het Sophia Kinderziekenhuis.
Mijn promotor, Prof. Dr. P.J.J. Sauer, Pieter, dank ik van harte voor de
kritische en prettige begeleiding.
Mijn promotor, Prof. Dr. L.A.M. Monnens, Leo, dank ik voor de stimulerende
gesprekken. De terugweg ui t Ni jmegen werd hierdoor al ti jd korter dan de
heenweg.
De overige leden van de promotiecommissie, Prof. Dr. M.A.D.H. Schalekamp
en Prof. Dr. M.W. van Hof dank ik voor het kritisch doornemen van het
manuscript.
Je remercie Monsieur Le Professeur Jean-Pierre Guignard, qui m1 a tout
appris sur la recherche medicale. J 1 ai une grande admiration pour sa
~apaci te de combiner la clinique et la recherche, tout en etant le seul
pediatre nephrologue a Lausanne. La facon dont lui et sa femme Francoise
m1 ont acceuilli, restera gravee dans ma memoire comme un example d 1 hospi
talite.
Mes remerciements les plus chaleureux vont aussi a Mademoiselle Michelle
Thonney, laborantine du laboratoire de nephrologie a Lausanne pour son
devouement. Grace a elle j 1 ai appris les techniques experimentales et la
precision du travail sur l 1 animal. La patience et l 1 assiduite, avec la
quelle elle a essaye de m1 apprende le francais restent pour moi une te
moignage de notre amitie.
Je remercie aussi Monsieur le Professeur Emile Gautier pour les discus
sions constructives tout au long demon travail a Lausanne.
Merci aussi a Mesdames Eliane Aubert, Marianna Duarte-Silva, Olympia
Grigoras, Jacqueline Jagdeep et Marianne Valloton, ainsi qu 1 a Monsieur
Pietro Alinei pour leur collaboration et leur soutien.

-117-
Wil Grose en Joke Ambagtsheer dank ik voor de nauwkeurige en kritische op
zet van de inulinebepalingen in het Sophia Kinderziekenhuis.
Hermien Zoethout begeleidde mij gedurende mijn eerste jaren als arts
assistent in het Sophia Kinderziekenhuis en bepaalde mede mijn keuze voor
de kindernefrologie.
Eric Wolff, Ram Sukhai, Jeroen Nauta, Coby Langendoen en Joanna Kist- van
Hol the tot Echten, mijn collega' s van de kindernefrologische groep, dank
ik voor de zeer plezierige samenwerking.
Bram Provoost begeleidde mijn computer escapades met veel geduld en tijd.
De prettige samenwerking met hem als exponent van de afdeling kinderchi
rurgie is van groot belang voor de kindernefrologie in het Sophia Kinder
ziekenhuis.
De heer P. Mulder van de afdeling Biostatistiek dank ik voor de statisti
sche adviezen bij hoofdstuk 6.
Wilma Oranje en Lilly-Ann van der Velden, student-assistenten, dank ik
voor de hulp bij de tijdrovende inulineklaringen.
De verpleegkundigen en artsen van de afdeling pasgeborenen dank ik voor
hun eindeloos geduld bij het uitvoeren van de inulineklaringen. Zender hen
waren de klinische onderzoekingen niet tot stand gekomen.
Annelies de Reus dank ik voor het vele werk wat zij verzette bij de voor
bereiding en afronding van het proefschrift. De plezierige samenwerking
met haar is voor mij een stimulans geweest.
Ik dank Ellen Berkouwer en Marike van Groen voor hun bijdragen aan het
typewerk.
Annemarie Oudesluys-Murphy dank ik voor de hulp bij de vertaling van
hoofdstuk 3.
Ellen Nelemans-v .d. Broek dank ik voor de nauwkeurige con troles van de
literatuurlijst.
De figuren en tabellen werden vervaardigd door John de Kuyper en Hilly
Versprille van de audiovisuele dienst van het Sophia Kinderziekenhuis.
De Sophia Stichting Wetenschappelijk Onderzoek dank ik voor het mij toe
bedeelde fellowship in 1984, hetwelk mij het mogelijk maakte de in dit
proefschrift beschreven dierexperimentele studies te verrichten.
De stage in Lausanne is voor ons een onvergetelijke ervaring.
Al degenen die hier niet met name zijn genoemd weten hoeveel ik hen ver
schuldigd ben voor hun enthousiasme en vriendschap.
-118-
CURRICULUM VITAE
De schrijver van dit proefschrift werd op 19 mei 1950 te Hengelo (0) ge
boren. In 1968 behaalde hij het diploma gymnasium-)1 aan het gemeentelijk
gymnasium te Hengelo ( 0). In datzelfde jaar werd de studie medicijnen
aangevangen aan de Rijksuniversiteit te Groningen.
Van 1970 tot 1972 was hij student-assistent in het laboratorium voor
vegetatieve fysiologie in Groningen (hoofd: prof. dr. W.G. Zijlstra). Het
artsdiploma werd in februari 1975 behaald. Na 1 jaar militaire dienst was
hij gedurende 9 maanden werkzaam op de afdeling kindergeneeskunde van het
Diaconessenhuis te Groningen (Dr. N.J. Jansonius en Dr. H.A. Polman, kin
derartsen). Van 1977 tot 1981 specialiseerde hij zich in de kindergenees
kunde in het Sophia Kinderziekenhuis te Rotterdam (hoofd: prof. dr. H.K.A.
Visser). Op 1 januari 1981 werd hij als kinderarts in het specialisten
register ingeschreven. Vanaf 1981 is hij werkzaam als wetenschappelijk
hoofdmedewerker op de afdeling kindernefrologie van het Sophia Kinder
ziekenhuis.
In 1984 verbleef hij in Lausanne (Zwitserland) na het verkrijgen van een
research fellowship van de Sophia Stichting Wetenschappelijk onderzoek.
Aldaar werd gedurende 1 jaar dierexperimenteel onderzoek verricht in het
"Laboratoire de Nephrologie Pediatrie" ( hoofd: prof. dr. J.P. Guignard)
van het Centre Hopitalier Universitaire Vaudois. Hij is getrouwd met Janny
van Eerden en heeft drie kinderen: Gert-Jan, Marijke en Thijs.

De uitgave van dit proefschrift is mede mogelijk gemaakt
dankzij de financiele steun van de volgende firma's:
de afdeling antiobiotica Glaxo B.V.
Fresenius B.V.
afd. Nederland MSD
Sandoz B.V.

Related Documents