AUTHOR QUERY FORM Book: Comprehensive Remote Sensing Chapter: 10428 Please e-mail your responses and any corrections to: E-mail: [email protected] Dear Author, Any queries or remarks that have arisen during the processing of your manuscript are listed below and are highlighted by flags in the proof. (AU indicates author queries; ED indicates editor queries.) Please check your proof carefully and answer all AU queries. Mark all corrections and query answers at the appropriate place in the proof (e.g., by using on-screen annotation in the PDF file http://www.elsevier.com/book-authors/science-and-technology-book-publishing/ overview-of-the-publishing-process) or compile them in a separate list, and tick off below to indicate that you have answered the query. Please return your input as instructed by the project manager. Location in Chapter Query / remark AU:1, page 1 “Dymond (2005)” is cited in the text but not provided in the reference list. Please provide it the reference list or delete this citation from the text. AU:2, page 2 “Brundtland Commission (1987)” is cited in the text but not provided in the reference list. Please provide it the reference list or delete this citation from the text. AU:3, page 2 “Griggs et al. (2013)” is cited in the text but not provided in the reference list. Please provide it the reference list or delete this citation from the text. AU:4, page 2 “Jon (2001)” is cited in the text but not provided in the reference list. Please provide it the reference list or delete this citation from the text. AU:5, page 2 “Roberts et al. (2005)” is cited in the text but not provided in the reference list. Please provide it the reference list or delete this citations from the text. AU:6, page 3 “Lake and Tim (2012)” is cited in the text but not provided in the reference list. Please provide it the reference list or delete this citation from the text. AU:7, page 4 In the sentence beginning with “For example, ...” should it be ‘growth domestic product’ or ‘gross domestic product’. AU:8, page 5 The citation “Omer et al. (2008)” has been changed to “Omer (2008)” to match the author name/date in the reference list. Please check here and in subsequent occurrences, and correct if necessary. AU:9, page 6 The citation “Lindholm et al. (1989)” has been changed to “Lindholm et al. (1989a,b)” to match the author name/date in the reference list. Please check here and in subsequent occurrences, and correct if necessary. AU:10, page 6 Please provide the full form of “DLR”. AU:11, page 7 Citation “Pinter et al. (2003)” has not been found in the reference list. Please supply full details for this reference. AU:12, page 7 This sentence is a repetition of the earlier one. Please check. REMS: 10428 To protect the rights of the author(s) and publisher we inform you that this PDF is an uncorrected proof for internal business use only by the author(s), editor(s), reviewer(s), Elsevier and typesetter SPi. It is not allowed to publish this proof online or in print. This proof copy is the copyright property of the publisher and is confidential until formal publication. These proofs may contain colour figures. Those figures may print black and white in the final printed book if a colour print product has not been planned. The colour figures will appear in colour in all electronic versions of this book.

Welcome message from author
This document is posted to help you gain knowledge. Please leave a comment to let me know what you think about it! Share it to your friends and learn new things together.
Transcript

AUTHOR QUERY FORM
Book: Comprehensive Remote SensingChapter: 10428
Please e-mail your responses and anycorrections to:E-mail: [email protected]
Dear Author,
Any queries or remarks that have arisen during the processing of your manuscript are listed below and are highlighted byflags in the proof. (AU indicates author queries; ED indicates editor queries.) Please check your proof carefully andanswer all AU queries. Mark all corrections and query answers at the appropriate place in the proof (e.g., by usingon-screen annotation in the PDF file http://www.elsevier.com/book-authors/science-and-technology-book-publishing/overview-of-the-publishing-process) or compile them in a separate list, and tick off below to indicate that you haveanswered the query.Please return your input as instructed by the project manager.
Location in Chapter Query / remark
AU:1, page 1 “Dymond (2005)” is cited in the text but not provided in the referencelist. Please provide it the reference list or delete this citation fromthe text.
AU:2, page 2 “Brundtland Commission (1987)” is cited in the text but not providedin the reference list. Please provide it the reference list or delete thiscitation from the text.
AU:3, page 2 “Griggs et al. (2013)” is cited in the text but not provided in thereference list. Please provide it the reference list or delete this citationfrom the text.
AU:4, page 2 “Jon (2001)” is cited in the text but not provided in the reference list.Please provide it the reference list or delete this citation from the text.
AU:5, page 2 “Roberts et al. (2005)” is cited in the text but not provided in thereference list. Please provide it the reference list or delete this citationsfrom the text.
AU:6, page 3 “Lake and Tim (2012)” is cited in the text but not provided in thereference list. Please provide it the reference list or delete this citationfrom the text.
AU:7, page 4 In the sentence beginning with “For example, . . .” should it be ‘growthdomestic product’ or ‘gross domestic product’.
AU:8, page 5 The citation “Omer et al. (2008)” has been changed to “Omer (2008)”to match the author name/date in the reference list. Please check hereand in subsequent occurrences, and correct if necessary.
AU:9, page 6 The citation “Lindholm et al. (1989)” has been changed to “Lindholmet al. (1989a,b)” to match the author name/date in the reference list.Please check here and in subsequent occurrences, and correct ifnecessary.
AU:10, page 6 Please provide the full form of “DLR”.
AU:11, page 7 Citation “Pinter et al. (2003)” has not been found in the reference list.Please supply full details for this reference.
AU:12, page 7 This sentence is a repetition of the earlier one. Please check.
REMS: 10428
To protect the rights of the author(s) and publisher we inform you that this PDF is an uncorrected proof for internal business use only by the author(s), editor(s), reviewer(s), Elsevier andtypesetter SPi. It is not allowed to publish this proof online or in print. This proof copy is the copyright property of the publisher and is confidential until formal publication.
These proofs may contain colour figures. Those figures may print black and white in the final printed book if a colour print product has not been planned. The colour figures will appear incolour in all electronic versions of this book.
AU:13, page 10 The citation “Seto (2010)” has been changed to “Seto et al. (2010)” tomatch the author name/date in the reference list. Please check here andin subsequent occurrences, and correct if necessary.
AU:14, page 10 The citation “Sutton et al. (2003)” has been changed to “Sutton(2003)” to match the author name/date in the reference list. Pleasecheck here and in subsequent occurrences, and correct if necessary.
AU:15, page 11 Please provide complete details for reference “Bourgeau-Chavezet al. (2009)”.
AU:16, page 11 “Boyd and Danson (2005)” was a duplicate and was thus removedfrom the Reference list. Please check if appropriate.
AU:17, page 11 Please check the inserted year and publisher location for reference“Bukata (2005)”.
AU:18, page 12 “DeFries et al. (2000)” was a duplicate and was thus removed from theReference list. Please check if appropriate.
AU:19, page 12 Please check the inserted journal title, volume number and page rangefor reference “Gatto (1995)”.
AU:20, page 13 “Jonkman and Vrijling (2008)” was a duplicate and was thus removedfrom the Reference list. Please check if appropriate.
AU:21, page 13 Please check the inserted journal title, volume number and page rangefor reference “Lathrop et al. (1991).”
AU:22, page 13 Please provide contribution title for reference “Le Toan et al. (2007)”.
AU:23, page 13 Please check the inserted publisher name and location for reference“Messner and Meyer (2006)”.
AU:24, page 13 Please check the inserted volume number and page range for reference“Miao et al. (2010)”.
AU:25, page 14 Please provide the volume number and page range for reference“Novitski et al. (2016)”.
AU:26, page 14 “Ozesmi and Bauer (2002)” was a duplicate and was thus removedfrom the Reference list. Please check if appropriate.
AU:27, page 14 Please provide publisher details for reference “Pearce (1993)”.
AU:28, page 14 Please provide the page range for reference “Prince (1991)”.
AU:29, page 14 Please check the inserted volume number for reference “Schwarz andManceur (2014)”.
AU:30, page 15 Please check the inserted page range for reference “Tucker andSellers (1986)”.
AU:31, page 15 Please provide complete details for reference “Tuominen et al. (2009)”.
AU:32, page 15 Please provide publisher details for reference “Urban (2006)”.
AU:33, page 16 Please provide the websites for “PAR: Photosynthetically ActiveRadiation” and “NDVI: Normalized Difference Vegetation Index”.
AU:34, page 11 References that occur in the reference list but are not cited in the text.Please position each reference in the text or delete it from the referencelist. Al-Adamat et al., 2003; Albuquerque et al., 2013; Almeida et al.,2014;Bai et al., 2008;Berni et al., 2009;Diamond, 2005; Foody, 2003;Hawkes, 2001; Huang and Xia, 2001; Huete et al., 1997; Jiang et al.,2008; Justice et al., 1998; Lim et al., 2003; Liu and Huete, 1995;Robert et al., 2005; Rouse et al., 1974; Running et al., 1999; Saatchiet al., 2007; Santos et al., 2014; Seaquist et al., 2003; Snyder et al.,1998; Sudhira et al., 2004; Wessman, 1991.
REMS: 10428
To protect the rights of the author(s) and publisher we inform you that this PDF is an uncorrected proof for internal business use only by the author(s), editor(s), reviewer(s), Elsevier andtypesetter SPi. It is not allowed to publish this proof online or in print. This proof copy is the copyright property of the publisher and is confidential until formal publication.
These proofs may contain colour figures. Those figures may print black and white in the final printed book if a colour print product has not been planned. The colour figures will appear incolour in all electronic versions of this book.

a0010 Remote Sensing for Ecosystem SustainabilityJ Qi, Michigan State University, East Lansing, MI, United States; Zhejiang University, Zhejiang, Republic of ChinaJ Chen, Michigan State University, East Lansing, MI, United StatesR Lafortezza, University of Bari “A. Moro”, Bari, Italy; Michigan State University, East Lansing, MI, United StatesZ Li, Michigan State University, East Lansing, MI, United States
ã 2016 Elsevier Inc. All rights reserved.
Introduction 1Ecosystem—Definition 1Ecosystem Sustainability and Sustainability Science 2Sustainability and sustainable development 2Four pillars of sustainability science 2Indicators of Ecosystem Sustainability 3Remote sensing challenges of ecosystem sustainability 4Remote Sensing Key Ecosystem Sustainability Indicators 5Environmental Sustainability Indicators 5Remote sensing sunlight use efficiency 5Remote sensing water resources 5Remote sensing soil resources 6Remote sensing plants and vegetation 6Remote sensing nutrients 7Biodiversity 7Landscape and land uses 8Remote Sensing of Typical Ecosystems Sustainability 8Remote Sensing Forest Ecosystem Sustainability 8Remote Sensing Wetland Ecosystem Sustainability 9Remote Sensing Grassland Ecosystem Sustainability 9Remote Sensing Urban Ecosystem Sustainability 10Concluding Remarks 11References 11
s0010 Introduction
s0015 Ecosystem—Definition
p0010 From an ecological perspective, an ecosystem is a dynamic system formed by the interaction of plant, animal, and a community of
organisms with their nonliving environment within a geographic unit or region. From a broad perspective, an ecosystem is any
system formed by interconnecting and interacting biological, physical, and social components within a geographic unit or region,
and involving humans.
p0015 Ecosystem services refer to the benefits human can derive from ecosystems, which are often categorized by provisional services
such as water and food, regulating services such as floods and drought, supporting services such as soil and nutrient cycling, and
socio-cultural services such as recreation, religion, and other nonmaterial benefits. These services are the fundamental benefits that
humans rely on to survive, evolve, progress, sustain, and flourish. Changes in any of these ecosystem services, resulting from either
climate change or unsustainable human activities such as deforestation and overgrazing, may negatively affect human well-being
and even human survivorship (e.g., Dymond, 2005 Au1).
p0020 The state of an ecosystem can be characterized by a set of ecosystem indicators such as environmental, biophysical, ecological,
and social attributes. These attributes such as climate, vegetation type, water, nutrient, soil, and human population are fundamental
characteristics of an ecosystem and they are critical in providing ecosystem services that human rely on for development and
sustainability.
p0025 These ecosystem attributes are spatially heterogenic and may vary with time. While the spatial heterogeneity is largely perceived
to be related to physical environmental conditions of geographic locations, variations with time is largely related to human
activities, sometime termed human disturbances. Many of these ecosystem attributes, if not all, can be measured, assessed, and
monitored by remote sensing and their states and trajectories can be quantified, analyzed, and even projected for sustainable
planning, development, and intervention, if needed.
Comp. by: G.Rajesh Stage: Proof Chapter No.: 10428 Title Name: REMSDate:12/10/16 Time:18:21:41 Page Number: 1
Comprehensive Remote Sensing http://dx.doi.org/10.1016/B978-0-12-409548-9.10428-2 1
REMS: 10428
To protect the rights of the author(s) and publisher we inform you that this PDF is an uncorrected proof for internal business use only by the author(s), editor(s), reviewer(s), Elsevier andtypesetter SPi. It is not allowed to publish this proof online or in print. This proof copy is the copyright property of the publisher and is confidential until formal publication.
These proofs may contain colour figures. Those figures may print black and white in the final printed book if a colour print product has not been planned. The colour figures will appear incolour in all electronic versions of this book.

s0020 Ecosystem Sustainability and Sustainability Science
s0025 Sustainability and sustainable developmentp0030 Sustainability can be defined as a socio-ecological process characterized by the pursuit of a common ideal (e.g., Brown et al., 1987;
Gatto, 1995; Marshall and Toffel, 2005; Santillo, 2007; Wandemberg, 2015). However, ecosystem sustainability reflects an ecosys-
tem’s capacity to endure and maintain its functions and services indefinitely. In other words, ecosystem sustainability is a system’s
ability to maintain its functions and services after disturbances by either human or nature and very often by both. Temporary
variation in functions and services is deemed to be a part of the system but the variabilities should be within a range that does not
permanently transition the system into a different state that need human interventions to restore it.
p0035 Sustainable development is a development process with a goal of improving the quality of life while maintaining the ability of
ecosystems to continue and provide ecosystem services that human depends on. Earlier sustainable development (e.g., Brundtland
Commission, 1987 Au2; Gladwin et al., 1995; Pearce, 1993) definition seemed to be more human-centric, focusing on “Development
that meets the needs of the present generation, without compromising the ability of future generations to meet their own needs.”
This guiding principle focuses on the ability of future generations but has neglected the natural assets of an ecosystem or Earth
system. Griggs et al. (2013) Au3stated that sustainable development is the “development that meets the needs of the present while
safeguarding the Earth’s life-support system on which the welfare of current and future generations depends.” This view of
sustainable development recognizes the fact that natural resources are limited and that human needs should be placed in the
context of finite ecosystem services provided by the nature or the Earth.
s0030 Four pillars of sustainability sciencep0040 Before discussing ecosystem sustainability, it is necessary to review sustainability science, because maintaining a sustainable
ecosystem requires a full understanding of what drives an ecosystem to change, the core of sustainability science, and ways to
prevent the changes from reaching tipping points. Sustainability science focuses on the essential elements of a system that are in
balance to maintain a stable state. Four essential elements have been termed four pillars of sustainability science (Fig. 1):
environmental, economic, social, and cultural, according to traditional social science literature (e.g., Basiago, 1998; Haimes,
1992; Au4Jon, 2001; Roberts et al., 2005 Au5; Roseland, 2000).
p0045 It should be noted that all four pillars are constantly changing and evolving but they must maintain a dynamic balance in order
to support a stable and sustainable system. All four pillars are also interconnected and affect one another, yet each remains a unique
dimension that can tip the balance when subjected to disturbances (Fig. 2). A key issue of sustainable development is how to
maintain a balance among all of these dimensions while improving the quality of life.
s0035 The environmental dimension of sustainabilityp0050 The environmental dimension of sustainability is the ability of the ecosystem to support a defined level of environmental quality and
natural resource extraction rates indefinitely that meet the needs of human society within which these resources exist. This dimension
has recently been discussed extensively due to rapid human exploitation of limited natural resources and increasing climate variability
that have caused concerns and imposed threats to human systems. It highlights the functions and services provided by an ecosystem
that benefit human society, including water, air, food, soil, plants, and minerals etc. to support sustainable development. While the
environment itself can be characterized by a set of quantitative and qualitative ecosystem variables, the perceived values are related to
human desires for quality of life, as stated in 9 of 17 United Nations’ sustainable development goals or SDGs (https://
sustainabledevelopment.un.org/sdgs). It is recognized that there is a disparity in quality of life among societies and perceived
ecosystem values may vary with time, geography, culture, and society. Nevertheless, the environmental dimension of ecosystem
sustainability has been the primary driver to push for sustainability research as humans realize that resources are limited and their
over-exploitation will eventually result in an environment that is no longer suitable or desirable for humans.
Comp. by: G.Rajesh Stage: Proof Chapter No.: 10428 Title Name: REMSDate:12/10/16 Time:18:21:42 Page Number: 2
Fig. 1f0010 Sustainability framework that maintains a balance among the four pillars of sustainability—social, environmental, economic, and culturaldimensions—to ensure a sustainable system.
2 Remote Sensing for Ecosystem Sustainability
REMS: 10428
To protect the rights of the author(s) and publisher we inform you that this PDF is an uncorrected proof for internal business use only by the author(s), editor(s), reviewer(s), Elsevier andtypesetter SPi. It is not allowed to publish this proof online or in print. This proof copy is the copyright property of the publisher and is confidential until formal publication.
These proofs may contain colour figures. Those figures may print black and white in the final printed book if a colour print product has not been planned. The colour figures will appear incolour in all electronic versions of this book.

s0040 The economic dimension of sustainabilityp0055 The economic dimension of sustainability is the ability of an economy to support a defined level of economic production
indefinitely to meet the needs of a society within which they exist. This dimension has been a human pursuit for improved quality
of live, wealth, and standard of living condition. It is also an essential component of sustainable development to ensure a system’s
(society, community, or nation) financial capability to purchase goods and other natural resources such as food. However, in many
countries economic development relies heavily on extraction and often the over-exploitation of natural resources, thus drastically
and frequently changing the environment to the point that “environmental” pillar of sustainability is threatened. This raises
questions like “What is sustainable development?”
s0045 The social dimension of sustainabilityp0060 The social dimension of sustainability is the ability of a social system, such as a country, family, or organization, to function at a
defined level of social well-being and harmony indefinitely. This dimension includes governance structure, regulations, policy,
education, wealth, health, and resource management, where the society as a whole follows institutional policies for a perceived
standard of living and quality of life.
s0050 The cultural dimension of sustainabilityp0065 The cultural dimension of sustainability is the ability of a society to experience cultural harmony by sharing and respecting
differences in religion, beliefs, culture, language, age, gender, and ethnicity. Without these consensuses and cultural harmony, a
system is in an unstable dynamic and sustainable state that eventually leads to a tipping point of changing from one state to
another.
p0070 It should be recognized that with emerging research in sustainability science and a new understanding of the requirements for a
sustainable ecosystem state, however, other pillars such as climate change were added to reflect the global environment beyond a
single ecosystem or community and the nature of increasing global connectivity through tele-coupling processes. The literature
suggests that the sustainability of an ecosystem cannot be fully assessed as a stand-alone system; rather, it should be considered with
tele-coupled systems that have impacts through energy, information, and material flows. Therefore, when assessing remote sensing
capability for ecosystem sustainability, it is important to include the geospatial dimension of these four pillars and their
corresponding attributes that are physically, socially, and culturally connected or tele-coupled.
p0075 All four dimensions of sustainability can be characterized by a set of indicators or biophysical, ecological, social, cultural, and
economic variables, some of which are qualitative and abstract while others are quantitative. It is important to recognize that these
variables dynamically interact with each other to collectively form a system. Further, variations from the mean in these variables are
a norm, but should be within a range that does not exceed the tipping point that results in an imbalance among the four pillars of
sustainability.
p0080 Remote sensing can be an effective tool and approach to assess ecosystem sustainability by providing quantitative information
about historical patterns and concurrent states of key ecosystem indicators or variables that are critical in maintaining a balance of
the four pillars of sustainability science (e.g., Berry et al., 2003; Kates et al., 2001; Lake and Tim, 2012 Au6; Naidoo et al., 2008; Rapport,
1995; Renetzeder et al., 2010; Rose et al., 2015; Sample, 1994; Wulder et al., 2004). In conjunction with process-based models such
as hydrological or biogeochemical or agent-based models, remotely sensed information can be effectively ingested into these
models to infer key social, economic, and cultural information for sustainability assessment. The following sections provide some
examples of how remotely sensed data and information are used in supporting quantitative analyses of the four pillars of
sustainability, with an emphasis on the environmental sustainability of an ecosystem.
s0055 Indicators of Ecosystem Sustainability
p0085 The key of ecosystem sustainability is its ability to maintain a balance among the four supporting pillars: environment, economy,
society, and culture. While these pillars are broad with qualitative terms, they can be characterized by a set of quantitative measures
or indicators to represent their state and trajectory. What remote sensing technologies can provide is the spatio-temporal dynamics
Comp. by: G.Rajesh Stage: Proof Chapter No.: 10428 Title Name: REMSDate:12/10/16 Time:18:21:42 Page Number: 3
Fig. 2f0015 The four dimensions of sustainability—environmental, economic, social, and cultural dimensions of sustainability—that are interconnectedthrough direct interactions and/or tele-coupling across space and time.
Remote Sensing for Ecosystem Sustainability 3
REMS: 10428
To protect the rights of the author(s) and publisher we inform you that this PDF is an uncorrected proof for internal business use only by the author(s), editor(s), reviewer(s), Elsevier andtypesetter SPi. It is not allowed to publish this proof online or in print. This proof copy is the copyright property of the publisher and is confidential until formal publication.
These proofs may contain colour figures. Those figures may print black and white in the final printed book if a colour print product has not been planned. The colour figures will appear incolour in all electronic versions of this book.
of some of these key indicators, such as scale, magnitude, and trajectory of critical biophysical, ecological, and socioeconomic
attributes as well as their geographic locations in relation to other systems. While it is challenging to directly observe socioeconomic
variables through remote sensing, it is possible to derive some clues of economic and social activities such as urban development,
basic infrastructures, mining, and land uses in general that are important in sustainability assessment (e.g., Buyantuyev and Wu,
2010; Gatrell and Jensen, 2008; Gong et al., 2013; Long et al., 2007).
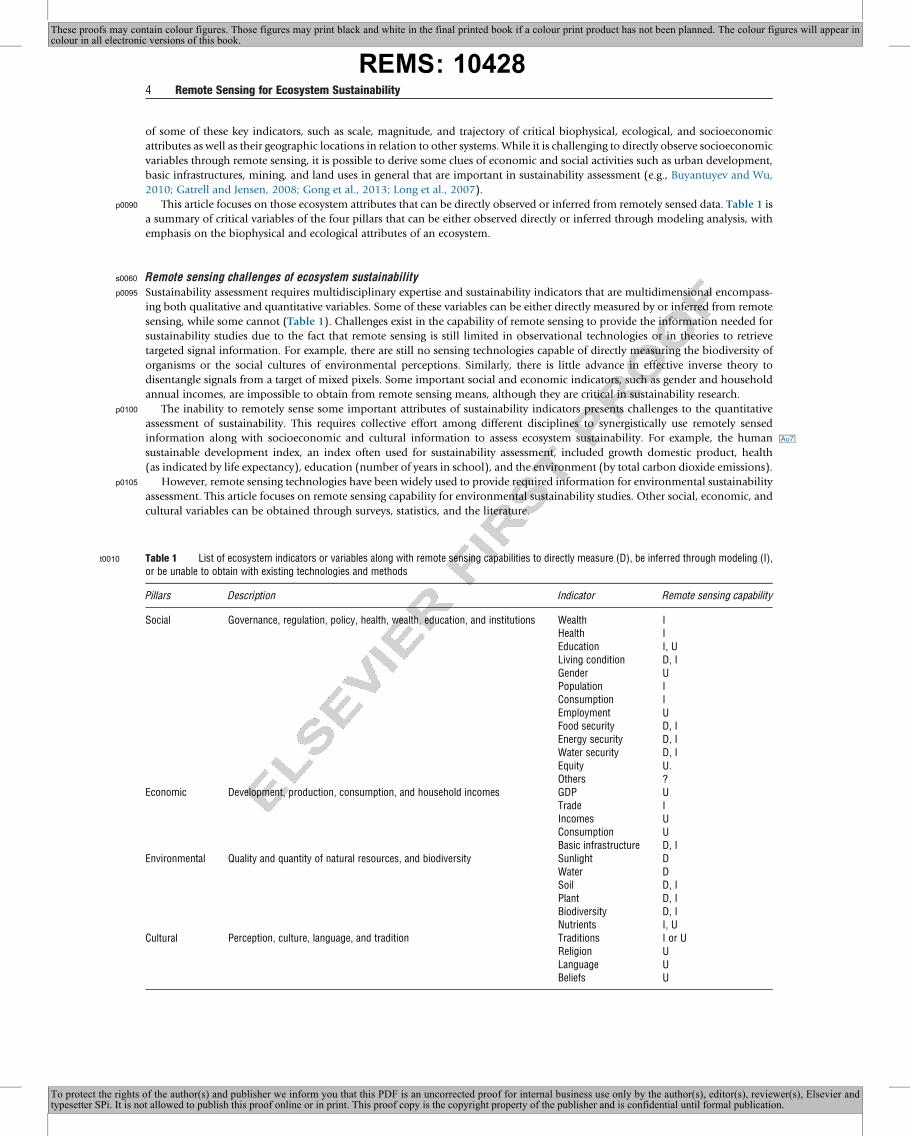
p0090 This article focuses on those ecosystem attributes that can be directly observed or inferred from remotely sensed data. Table 1 is
a summary of critical variables of the four pillars that can be either observed directly or inferred through modeling analysis, with
emphasis on the biophysical and ecological attributes of an ecosystem.
s0060 Remote sensing challenges of ecosystem sustainabilityp0095 Sustainability assessment requires multidisciplinary expertise and sustainability indicators that are multidimensional encompass-
ing both qualitative and quantitative variables. Some of these variables can be either directly measured by or inferred from remote
sensing, while some cannot (Table 1). Challenges exist in the capability of remote sensing to provide the information needed for
sustainability studies due to the fact that remote sensing is still limited in observational technologies or in theories to retrieve
targeted signal information. For example, there are still no sensing technologies capable of directly measuring the biodiversity of
organisms or the social cultures of environmental perceptions. Similarly, there is little advance in effective inverse theory to
disentangle signals from a target of mixed pixels. Some important social and economic indicators, such as gender and household
annual incomes, are impossible to obtain from remote sensing means, although they are critical in sustainability research.
p0100 The inability to remotely sense some important attributes of sustainability indicators presents challenges to the quantitative
assessment of sustainability. This requires collective effort among different disciplines to synergistically use remotely sensed
information along with socioeconomic and cultural information to assess ecosystem sustainability. For example, Au7the human
sustainable development index, an index often used for sustainability assessment, included growth domestic product, health
(as indicated by life expectancy), education (number of years in school), and the environment (by total carbon dioxide emissions).
p0105 However, remote sensing technologies have been widely used to provide required information for environmental sustainability
assessment. This article focuses on remote sensing capability for environmental sustainability studies. Other social, economic, and
cultural variables can be obtained through surveys, statistics, and the literature.
Comp. by: G.Rajesh Stage: Proof Chapter No.: 10428 Title Name: REMSDate:12/10/16 Time:18:21:42 Page Number: 4
Table 1t0010 List of ecosystem indicators or variables along with remote sensing capabilities to directly measure (D), be inferred through modeling (I),or be unable to obtain with existing technologies and methods
Pillars Description Indicator Remote sensing capability
Social Governance, regulation, policy, health, wealth, education, and institutions Wealth IHealth IEducation I, ULiving condition D, IGender UPopulation IConsumption IEmployment UFood security D, IEnergy security D, IWater security D, IEquity U.Others ?
Economic Development, production, consumption, and household incomes GDP UTrade IIncomes UConsumption UBasic infrastructure D, I
Environmental Quality and quantity of natural resources, and biodiversity Sunlight DWater DSoil D, IPlant D, IBiodiversity D, INutrients I, U
Cultural Perception, culture, language, and tradition Traditions I or UReligion ULanguage UBeliefs U
4 Remote Sensing for Ecosystem Sustainability
REMS: 10428
To protect the rights of the author(s) and publisher we inform you that this PDF is an uncorrected proof for internal business use only by the author(s), editor(s), reviewer(s), Elsevier andtypesetter SPi. It is not allowed to publish this proof online or in print. This proof copy is the copyright property of the publisher and is confidential until formal publication.
These proofs may contain colour figures. Those figures may print black and white in the final printed book if a colour print product has not been planned. The colour figures will appear incolour in all electronic versions of this book.

s0065 Remote Sensing Key Ecosystem Sustainability Indicators
p0110 Although the essential elements of ecosystem sustainability are the four supporting pillars—environment, economy, society, and
culture—this article focuses on the discussions primarily related to the environmental dimension of sustainability, where remote
sensing has the ability to directly or indirectly infer its biophysical and ecological attributes as listed in Table 1. For most attributes
related to the economic, social, and cultural dimensions, remote sensing approaches to quantify them are still limited but whenever
possible, discussions will be included in this article.
s0070 Environmental Sustainability Indicators
p0115 Environmental sustainability indicators are primarily related to the quality and quantity of the environment and natural resources
that support functions and services indefinitely. These indicators may include the quality and quantity of primary natural resources
such as air, sunlight, water, soil, plants, and nutrients among many others, some of which can be measured by or inferred from
remote sensing. Discussions in the other articles covered some of these attributes and therefore this article focuses on sunlight,
water, soil, plants, nutrients, biodiversity, and landscapes that are found to be critical for all these biophysical attributes.
s0075 Remote sensing sunlight use efficiencyp0120 Sunlight is probably the most essential condition for life and other organic forms on Earth. It is a source of energy that is not only
inexhaustible, but also totally nonpolluting ( Au8Omer, 2008). Different ecosystems utilize sunlight differently and some are more
efficient in converting sunlight to other forms of energy that can be used directly for human benefit, such as photosynthesis, and
solar renewable energy for electricity or heating and cooling.
p0125 Remote sensing has been used to estimate the amount of solar radiation reaching the canopy (Frouin and Pinker, 1995;
Propastin et al., 2012; Seaquist and Olsson, 1999) and a portion of the solar radiation can be effectively converted into biomass
through photosynthesis. Imagery from satellite sensors have been used to effectively measure total photosynthetic active radiation
(PAR), intercepted PAR by the canopy, and absorbed PAR (APAR) accounting for soil effect and fraction PAR (FPAR) converted by
living plants (e.g., Asrar et al., 1984; Huete et al., 2002; Xiao et al., 2004). Previous and ongoing research has confirmed the capacity
of remote sensing methods to estimate plant photosynthesis-related phenomena, particularly at a global scale (e.g., Goward and
Huemmrich, 1992; Goward et al., 1994; Prince and Goward, 1995; Ruimy et al., 1994, 1999; Sellers, 1987; Tucker and Sellers,
1986) that relies on the established spectral vegetation indices (VIs) such as the normalized difference vegetation index (NDVI).
However, relying on spectral VIs to estimate photosynthesis may result in some significant uncertainties for different ecosystems.
For example, Roujean and Breon (1995) stated that some uncertainties exist when using NDVI–fAPAR relationship and brought up
feasible suggestions, for example, establishing a new vegetation ratio renormalized difference vegetation index, to help lessen
dispersions on abovementioned correlations.
p0130 A widely employed Moderate Resolution Imaging Spectroradiometer (MODIS) FPAR/LAI product is one of the most well-
known and easily accessible remotely sensed information collections designed for vegetation studies (Myneni et al., 2002); it has
been evaluated and verified in many case studies (Fensholt et al., 2004; Hill et al., 2006; Wang et al., 2001, 2004; Yang et al., 2006).
This remote sensing product was often used to help determine the proportion of plant cover in different parts around the world.
An example is the continuous field of vegetation products produced derived fromMODIS imagery (e.g., DeFries et al., 1999, 2000).
These remote sensing products have also been used to generate a robust terrestrial drought severity index globally (e.g., Mu et al.,
2013; Zhao and Running, 2010).
p0135 The global terrestrial net primary production (NPP) is another important biophysical attribute that is critical in assessing an
ecosystem’s ability to utilize sunlight energy. A proxy of the NPP is commonly associated with an ecosystem’s leaf area index (LAI)
that represents the total amount of biomass of an ecosystem, such as agricultural crops and rangeland forage. This indicator has
been widely studied and estimated from remote sensing imagery such as MODIS (e.g., Myneni et al., 2002). Some large-scale but at
a coarser spatial resolution LAI products have been produced using GIMMS data (e.g., Zhu et al., 2013). Subsequent uses of these
products are very broad and an example is to fuse the information with site-level observations to evaluate the performance of
climate models such as the Community Land Model by injecting FPAR dynamic changes and spatial patterns into the model based
on the solar radiance partition scheme aspect (Wang et al., 2013).
p0140 It should be noted that there are other environmental and biological factors that affect light use efficiency, such as plant types
(e.g., C3 vs. C4 plants) as well as the availability of water in plants and ambient temperature that can affect light use efficiency.
In general, remote sensing capabilities for such applications are quite effective and accurate products such as those produced by
MODIS sensors.
s0080 Remote sensing water resourcesp0145 Water resource is of immeasurable importance to both natural ecosystem dynamics and human eco-society development all over
the world. It is one of the key drivers to life and resource cycling on the planet and, thus, to ecosystem sustainability. Due to climate
change and increasing human uses, water storage, uses, and spatial and temporal distribution are changing and have significantly
impacted the water availability for a variety of ecosystem services including agricultural food production, fisheries, and basic
Comp. by: G.Rajesh Stage: Proof Chapter No.: 10428 Title Name: REMSDate:12/10/16 Time:18:21:43 Page Number: 5
Remote Sensing for Ecosystem Sustainability 5
REMS: 10428
To protect the rights of the author(s) and publisher we inform you that this PDF is an uncorrected proof for internal business use only by the author(s), editor(s), reviewer(s), Elsevier andtypesetter SPi. It is not allowed to publish this proof online or in print. This proof copy is the copyright property of the publisher and is confidential until formal publication.
These proofs may contain colour figures. Those figures may print black and white in the final printed book if a colour print product has not been planned. The colour figures will appear incolour in all electronic versions of this book.
human consumptions (e.g., Vorosmarty et al., 2000, 2010). In addition to water scarcity, excessive water such as flood is a major
natural disaster that has affected millions of people worldwide (e.g., Jonkman and Vrijling, 2008; Messner and Meyer, 2006).
p0150 Water quality has also long been a major concern due to increasing pollution from climate change and human activities (e.g.,
Hall and Ellis, 1985; Au9Lindholm et al., 1989a,b). Thus, a need to monitor water quantity and quality, as well as its effective
management, has become a primary prerequisite of sustainable development. Solutions to these needs rely on efficient information
collection, and remote sensing has been a primary source of information for water quantity and quality assessment.
p0155 Remote sensing of water quantity has been studied for quite sometime already (see, e.g., Gitelson et al., 1993, 2008; Sawaya
et al., 2003) using the spectral reflectance feature of water bodies. Simple methods, such as the normalized difference water index
(NDWI), have been developed to delineate open water features (McFeeters, 1996). However, obtaining the total volume of water
through optical remote sensing remains a challenge, as it requires information of, for example, lake depth and river hydrology in
order to obtain an accurate estimate of total water volumes. The recent development of the GRACE satellite, jointly implemented by
NASA and DLR Au10, has proved to be feasible to obtain total volume using the Earth’s gravitational system, which could provide more
water quantity information at large scales (Richey et al., 2015), although accuracy could remain an issue.
p0160 Remotely sensed data combined with Geographic Information System (GIS) techniques have been widely applied in the quality
assessment of freshwater resources (e.g., Han and Jordan, 2005; Olmanson et al., 2008; Torbick et al., 2008; Wang and Shi, 2008).
Reliable spatial coverage and cost-efficient remote monitoring techniques for inland lakes and coastal waters have been developed
and used by numerous researchers to address eutrophication issues (Bukata, 2005; Gege, 1998; Gitelson et al., 2008; Miller et al.,
2006; Ruddick et al., 2001; Schofield et al., 1999; Simis et al., 2005, 2007; Stumpf and Tomlinson, 2005).
p0165 Water quality indicators that can be inferred from remotely sensed data include colored dissolved organic matter, chlorophyll
concentrations, sediments, and algal concentrations. Landsat, for example, has a long history in water quality detection of the Great
Lakes, from the observation of colors in Lake Erie (Strong, 1974), calcium carbonate precipitation in Lake Michigan and Lake
Ontario (Strong, 1978), chlorophyll detection in central Lake Michigan and Green Bay (Lathrop and Lillesand, 1986), total
suspended solids or Secchi depth in Green Bay (Lathrop et al., 1991), or phycocyanin detection in western Lake Erie (Vincent et al.,
2004). While some Landsat studies have looked back at water quality over time (Olmanson et al., 2008), none have created
algorithms for the purpose of assessing chlorophyll trends over the lifetime of the Landsat program.
p0170 Although these studies proved that remote sensing is effective in water quality assessment, it should be noted that remote
sensing remains a challenge to operationalize water quality retrieval algorithms across large geographic areas. Examples are the
methods developed for the Midwest region of the United States. Using Landsat proved to be quite accurate in inland lakes in
Minnesota, but much uncertainty exists when applied to deep-water lakes in Michigan (e.g., Novitski et al., 2016).
s0085 Remote sensing soil resourcesp0175 Soil is another basic element of all ecosystems and natural communities. Soil health refers to the capacity of soil to maintain
equilibrium within a living system in different ecological aspects. Considering the fact that the assessment of soil health is of crucial
relevance to agricultural production and sustainability, scientists from different disciplines have been involved in soil quality
research for years. Some proposed indicators of soil quality for land management and crop monitoring could be measured using
satellite-retrieved information, for example, spatial–temporal changes in organic matter levels, crop characteristics such as yield and
plant vigor, and pest distribution and movement (Doran and Zeiss, 2000).
p0180 One of the most severe problems in the sustainable development of soil management is the widespread phenomenon of soil
erosion. Consequently, many models for estimating and predicting soil erosion risks have been developed using empirical data and
algorithms; remote sensing and GIS were implied to provide promising informative and analytical evidence for improvements in
this field. For example, a case study was carried out in Rondonia, Brazilian Amazonia, a region that had experienced high rates of
deforestation during the past 20 years and thus suffered a significant soil erosion and soil loss (Lu et al., 2004). The study combined
the Revised Universal Soil Loss Equation, topographic factor (LS) generated from a digital elevation model (DEM), cover-
management factor (C) retrieved from spectral mixture analysis of Landsat ETM+ images, and the soil erodibility factor (K) from
survey data, to generate a soil distribution map and calculate soil erosions. Similar studies were carried to assess soil degradation in
pasture and agroforestry lands, as demonstrated by a case study in the Upper Nam Wa Watershed, in Thailand (Bahadur, 2009),
where researchers examined the impacts of cultivation shifts on soil erosion.
p0185 In addition to soil erosion, salinization is the most common and has been studied by many researchers. A summarized review
for keynote publications of remotely sensed data potentiality related to soil salinity was discussed to draw conclusions on the
constraints and advantages of airborne remote sensing capabilities for such applications (e.g., Farifteh et al., 2006). Attempts were
also made to use spatial landscape characteristics to depict spatio-temporal changes in soil salinity in irrigated croplands. For
example, Abbas et al. (2013) used Indian Remote Sensing Linear Imaging Self Scanning (IRS-1B LISS-II) digital data, supplemented
by ground truth data of soil samples and SAR analysis, for monitoring the occurrence of salt-affected lands. They discovered that the
improper reuse of low quality groundwater for irrigation would most likely increase the risk of soil salinization in the basin. Such
exploration of causes for soil degradation is of great importance to formulate sustainability strategy in precision agriculture.
s0090 Remote sensing plants and vegetationp0190 The photosynthesis process of plants and biomass, including the above- and below-ground sections, as well as of some organisms,
can convert radiant solar energy into the chemicals required by living creatures. While remote sensing of photosynthesis was
discussed earlier, here the focus is on crops, grasslands, and forests. In general, the sustainable development of plant management is
Comp. by: G.Rajesh Stage: Proof Chapter No.: 10428 Title Name: REMSDate:12/10/16 Time:18:21:43 Page Number: 6
6 Remote Sensing for Ecosystem Sustainability
REMS: 10428
To protect the rights of the author(s) and publisher we inform you that this PDF is an uncorrected proof for internal business use only by the author(s), editor(s), reviewer(s), Elsevier andtypesetter SPi. It is not allowed to publish this proof online or in print. This proof copy is the copyright property of the publisher and is confidential until formal publication.
These proofs may contain colour figures. Those figures may print black and white in the final printed book if a colour print product has not been planned. The colour figures will appear incolour in all electronic versions of this book.

a key element to secure and maintain crop and foliage production for food security. Since the last century, remote sensing
techniques have become prevalent for understanding vegetation phenology. It was affirmed that remote sensing had performed
quite well when modeling, defining, and mapping the biophysical, spatial, and temporal patterns in crops, grasslands, and forests
(e.g., Idso et al., 1977; Au11Pinter et al., 2003; Prince, 1991; Treitz and Howarth, 1999; Tucker and Sellers, 1986). These studies included
crop yields, grassland primary production, and forest biomass.
p0195 Many of these biophysical variables or vegetation indicators can be remotely sensed, directly or indirectly, using simple VIs. One
of the most commonly used indices is the NDVI, which is a significant indicator for evaluating bioproperties using the visible and
near-infrared (NIR) bands of the electromagnetic spectrum. Several well-known sensors, namely, NOAA advanced
very-high-resolution radiometer and Terra/Aqua MODIS have the required spectral bands that produce even global scale NDVI
products for large-scale analyses of vegetation dynamics across the globe. For example, these products were used to explore spatial
correlation features and clustering patterns of vegetation productivity in the pastures of Inner Mongolia, China, together with
climate information (Wang et al., 2015) to assess ecosystem vegetation dynamics. Another case study was conducted in the Dengei
pahad microwatershed, Khurda District, Odisha, involving a 16-year series of IRS satellite data to calculate land cover change using
NDVI as a principle index, especially for vegetation land cover type (Rout et al., 2015). These are just examples of the many studies
that utilize remote sensing imagery to examine vegetation dynamics at multiple spatio-temporal scales.
p0200 Plant diversity can also be inferred from remotely sensed data by examining the spectral patterns of mixed pixels. For example,
John et al. (2008) used the MODIS enhanced vegetation index (EVI) time series to predict plant diversity in arid grasslands.
p0205 Plant disease is a major threat to food production and plant diversity, which requires monitoring mechanisms to take the
appropriate measures for ensuring food production, an important sustainable management strategy. Physiological stress to plants
typically causes a rise in temperature and change in leaf color, which can be sensed remotely. A recent paper providing an overview
of insights in the application of noninvasive optical sensors for plant disease detection, identification, and quantification at
different levels (Mahlein et al., 2012) has concluded that: (1) the most promising sensor types are thermography, chlorophyll
fluorescence, and hyperspectral sensors, (2) imaging systems are preferable to nonimaging systems, and (3) a multidisciplinary
approach is urgently needed.
s0095 Remote sensing nutrientsp0210 The topic of sustainable nutrient management is often intermixed as a subtitle within other research interests. Nutrients are
dynamically exchanged within different ecosystems, as in the aforementioned water-, soil-, and plant-related systems. Sustainable
nutrient management is also a hotspot for interdisciplinary research.
p0215 Given the complex conditions of a wide range of pasture ages, soil types, management strategies, and climates, only remote
sensing techniques could offer a feasible solution to help assess local pasture biogeochemistry and nutrient cycling spatially over
the vast study area. For example, a case study was designed to understand the biogeochemical dynamics in cattle pasture receded
from forests in two study sites located in the central Amazon Basin (Asner et al., 2004). The study used a Landsat TM collection for
pasture age evaluation as well as live photosynthetic vegetation, senescent, nonphotosynthetic vegetation, and bare soil coverage
extraction. The results confirmed the potential of remote sensing to be applied for reliable estimations of pasture land use change in
three aspects: pasture area, pasture condition, and nutrient cycling.
p0220 In another study, DEM and airborne visible and infrared imaging spectrometer data were introduced to assist in designing a
bottom-up illustration map of predicted nutrient availability across the landscape in Kauai, Hawaii (Porder et al., 2005).
Approximately 17% of the landscape was identified as nutrient-poor; higher clusters of nutrient availability were evident on valley
slopes and floors.
p0225 A recent review of the long-term experiments for sustainable nutrient management in China pointed out that China had turned
into a net carbon sink. Satellite remote sensing data combined with other information can be used to confirm or validate carbon
budget at national level. For example Au12, a recent review of the long-term experiments for sustainable nutrient management in China
confirmed that China had turned into a net carbon sink (Miao et al., 2010).
p0230 For sustainable crop management, reasonable control of nitrogen (N) plays a key role and significantly affects the final yield.
The accurate assessment of castor bean nitrogen and pigment is a demanding requirement for crop development. In a recent study,
a remote sensing algorithm was developed for such studies (Reddy and Matcha, 2010), where the researchers used a portal
spectroradiometer to measure leaf reflectance with a higher spatial resolution and identified two reflectance ratios of 455/605 and
505/605 nm that were highly correlated to leaf nitrogen content. This plot level finding with hand-held remote sensing device
provides an opportunity to scale up for large-scale analysis.
s0100 Biodiversityp0235 Biodiversity, which represents the variety and variability of life in all forms (i.e., species richness), is a key element of an ecosystem
and its definition, as well as its relationship with human well-being is discussed elsewhere in this book. Here the biodiversity term
is placed in the context of ecosystem sustainability, as it is an important indicator of an ecosystem health and therefore its
environmental sustainability.
p0240 Remote sensing may offer the potential to infer biodiversity information, such as landscape metrics derived from remotely
sensed data that is strongly correlated with biodiversity indicators. For example, Petrosyan (2010) developed a model using remote
sensing data to observe sustainable ecosystem based on the concept of biodiversity, while Duro et al. (2007) measured sustainable
Comp. by: G.Rajesh Stage: Proof Chapter No.: 10428 Title Name: REMSDate:12/10/16 Time:18:21:43 Page Number: 7
Remote Sensing for Ecosystem Sustainability 7
REMS: 10428
To protect the rights of the author(s) and publisher we inform you that this PDF is an uncorrected proof for internal business use only by the author(s), editor(s), reviewer(s), Elsevier andtypesetter SPi. It is not allowed to publish this proof online or in print. This proof copy is the copyright property of the publisher and is confidential until formal publication.
These proofs may contain colour figures. Those figures may print black and white in the final printed book if a colour print product has not been planned. The colour figures will appear incolour in all electronic versions of this book.

development from the perspective of biodiversity using four key indicators derived from remote sensing data, including produc-
tivity, disturbance, topography, and land cover. These attributes were found to be well correlated with the richness of biodiversity.
p0245 It should be noted that remote sensing data continuity, data affordability, and access to high-quality data are still a problem in
many parts of the world that prevents researchers from linking satellite data to biological information for biodiversity studies (e.g.,
Turner et al., 2015).
s0105 Landscape and land usesp0250 Landscape ecology is an important dimension of environmental attributes that are critical for maintaining an ecosystem health and
biodiversity and is filling the knowledge gap in sustainable development (e.g., Termorshuizen and Opdam, 2009). Landscape
ecology pertains to the generation and dynamics of ecosystem patterns, as well as the implications of population-, community-,
and ecosystem-level process patterns (Urban, 2006). Thus, landscape metrics has been widely used as a crucial indicator in studying
sustainable planning and development. Landscape metrics quantify the composition and configuration of ecosystems across a
landscape (e.g., patch size, shape, nearest-neighbor distance, proximity index, etc.) thus allowing quantitative comparison between
different landscapes or within the same landscape at different times. Once spatial information on landscapes has been derived from
remotely sensed data, pattern analysis can take place considering each landscape unit (e.g., land use/cover type) as part of a discrete
patch mosaic.
p0255 Some frameworks have been proposed to use the landscape approach to advance the integrated research of sustainable
development, such as the principles of defining terms and concepts (e.g., Axelsson et al., 2011). The notions of using landscape
ecology have been suggested for studying the sustainability of landscape (e.g., Leitao and Ahern, 2002). In these studies, numerical
landscape metrics derived from land cover maps was made available for analyzing landscape planning as well as ecosystem
management. Landscape metrics quantify the composition and configuration of ecosystems across a landscape (e.g., patch size,
shape, nearest-neighbor distance, proximity index, etc.) thus allowing quantitative comparison between different landscapes or
within the same landscape at different times. Once spatial information on landscapes has been derived from remotely sensed data,
pattern analysis can take place considering each landscape unit (e.g., land use/cover type) as part of a discrete patch mosaic.
p0260 Landscape classification for ecological purposes requires that broadly-described land use/cover types be reclassified as, for
example, habitat quality or units of landscape for some target guild or species (Lafortezza et al., 2010). Even small changes in
management, such as changes in farm tillage from conventional to minimum tillage, have implications for ecological outcomes
such as carbon sequestration, runoff, soil loss, and habitat. Further, land use/cover is essential to the landscape, indirectly
influencing the sustainability of ecosystems. For example, land cover information derived from remotely sensed data, combined
with other qualitative assessment data, can serve as a useful tool to evaluate human impacts on the landscape and, hence, on
ecosystem sustainability (Burkhard et al., 2009). Moreover, land cover itself can also be used as a critical environmental indicator.
Chen (2002) found significant impacts of land cover change on regional sustainable development using remote sensing and GIS
techniques.
s0110 Remote Sensing of Typical Ecosystems Sustainability
s0115 Remote Sensing Forest Ecosystem Sustainability
p0265 Over the last decades, remotely sensed data have played a key role in quantifying, mapping, and monitoring forest ecosystems
across different regions (e.g., Boyd and Danson, 2005; Dubayah et al., 2010). Numerous studies used optical sensors to primarily
establish the extent and floristic composition of forest areas and track the progress of deforestation and/or other disturbances, such
as forest fires or insect outbreaks, through changes in spectral indices.
p0270 VIs are usually used in the assessment of forest health indicators such as concentration of nitrogen, carbon, and leaf pigments,
important indicators of forest ecosystem sustainability (e.g., Daughtry, 2001; Fourty et al., 1996; Gitelson et al., 2002). These
indices were based on spectral properties of vegetation at or near red edge (Red) and in the NIR spectral regions, which are primarily
related to forest physiology determined by a combination of foliage chlorophyll concentration, canopy area, and canopy structure.
Healthy forests have strong reflectance peak in the NIR but low reflectance in the Red wavelength, where chlorophyll absorption is
strongest (see, e.g., Tuominen et al., 2009).
p0275 Amongmany spectral VIs, the NDVI is the most frequently used andmost well-known as a good forest health indicator. Another
commonly used vegetation index is the EVI as an operational remote sensing product of MODIS (e.g., Huete et al., 1999), which
has been used to study forest ecosystems. Variants of these spectral VIs include the red edge normalized difference vegetation index,
which can only be calculated from hyperspectral data to study subtle changes in tree canopy chlorophyll content (Sims and
Gamon, 2002), the water band index, the NDWI, and the moisture stress index to study changes in canopy water content (Ceccato
et al., 2001; Gao, 1996; PeNUelas et al., 1993).
p0280 Spectral VIs were also used to estimate the amount of stress-related pigments in vegetation. For example, carotenoids and
anthocyanins are pigments that are present in higher concentrations in stressed vegetation. Particularly, anthocyanin pigment
concentration is typically high in senescence and in new leaves. The anthocyanin reflectance index 700 was developed and used to
estimate the total amount of anthocyanin in vegetation (Gitelson et al., 2001).
p0285 It should be recognized that these spectral indices derived from optical remote sensing sensors are extensively used in forest
studies they are incapable to infer vertical distribution of woody material of a forest. Forest biomass, total amount of carbon, and
Comp. by: G.Rajesh Stage: Proof Chapter No.: 10428 Title Name: REMSDate:12/10/16 Time:18:21:43 Page Number: 8
8 Remote Sensing for Ecosystem Sustainability
REMS: 10428
To protect the rights of the author(s) and publisher we inform you that this PDF is an uncorrected proof for internal business use only by the author(s), editor(s), reviewer(s), Elsevier andtypesetter SPi. It is not allowed to publish this proof online or in print. This proof copy is the copyright property of the publisher and is confidential until formal publication.
These proofs may contain colour figures. Those figures may print black and white in the final printed book if a colour print product has not been planned. The colour figures will appear incolour in all electronic versions of this book.

forest volume can be retrieved with greater confidence using SAR and LiDAR data that is primarily sensitive to such forest
biophysical properties like tree height, biomass, and vertical structure (Giannico et al., 2016; Lucas et al., 2008; Mitchard et al.,
2012; Ranson et al., 1997; Sun et al., 2011). These aspects of forest dynamics have been further extended to estimate forest fuel
loads and fires (e.g., Erdody and Moskal, 2010; Lavrov et al., 2006), carbon stocks (e.g., Garcıa et al., 2010; Le Toan et al., 2007),
structures (e.g., Chambers et al., 2007), and nutrient cycling (e.g., DeFries, 2008; Treuhaft et al., 2010).
p0290 Radar remote sensing has the advantages of cloud-free capabilities, which is important when one considers studying forests in
tropical or subtropical environment where frequent cloud cover prevents quality optical remote sensing acquisitions.
s0120 Remote Sensing Wetland Ecosystem Sustainability
p0295 Wetland is an important ecosystem playing a vital role in environmental functions such as biodiversity, regulating services (e.g.,
Adam et al., 2010; Kadykalo and Findlay, 2016; Mitsch and Gosselink, 2007). In many remote sensing analyses, wetland is treated
as one type of land cover but their ecological characteristics are complex and critical to ecosystem resilience to disturbances.
Wetland sizes and shapes vary greatly, as do the diversity of plant species and vegetation structures and types that make remote
sensing of plant species challenging (e.g., Adam et al., 2010). Water levels fluctuate daily and seasonally, which can confound
spectral classification, and many wetland plant species are spectrally similar to one another making the separation of unique
signatures difficult, particularly when only a few broad spectral bands are available for classification (Bourgeau-Chavez et al., 2009;
Ozesmi and Bauer, 2002; Wickham et al., 2004). The presence of water interspersed with the vegetation dampens the overall
spectral reflectance of the vegetation and further diminishes the separability of individual species (Adam et al., 2010; Silva et al.,
2008). Periphyton and algae can form large floating masses around wetland vegetation and may further complicate wetland
vegetation classification.
p0300 Despite these limitations, the remotely sensed multispectral imagery from Landsat, SPOT, and other major data sources (Adam
et al., 2010; Ozesmi and Bauer, 2002; Silva et al., 2008), as well as synthetic aperture radar images (Hess et al., 1995; Kasischke and
Bourgeau-Chavez, 1997; Kushwaha et al., 2000; Townsend and Walsh, 1998), have a long history of use in wetland mapping
applications. The multispectral imagery of high-resolution satellite systems is of particular interest for wetland mapping because, in
addition to the typical spectral bands (i.e., visible blue, green, red, and NIR) the red edge band facilitates the identification of
vegetative conditions and has been shown to reveal differences between healthy trees and those impacted by disease or pollution.
This feature could be useful in identifying wetland features affected by hydrologic stress. The NIR band that is partially less affected
by the atmosphere enables a broader vegetation analysis and biomass studies (Asmaryan et al., 2013). Incorporating spectral VIs
such as NDVI and texture measures resulted in greater accuracy in wetland mapping and, therefore, these indices will continue to
improve our understanding of wetland landscape environments (Lane et al., 2014).
p0305 A quantifiable relationship exists between hydrological characteristics (frequency and duration) and plant species composition
in the seasonal floodplains for wetland biodiversity studies. This relationship can be used to predict the occurrence of indicator
species at a site of known flood duration or frequency. By combining independent remote sensing dry–wet interpretation and
vegetation survey techniques it is possible to identify relationships between the state of vegetation and hydroperiod in floodplains
to quantify wetland seasonality and phenology. The high-temporal resolution MODIS imagery for generating near-real time maps
of flood extent in this wetland system is considered excellent (Townsend and Walsh, 2001).
p0310 Mangrove wetlands are unique in many aspects such as biodiversity and flood regulation. However, due to sea level rises and
human disturbances mangrove forested wetlands are changing at a much rapid rate (e.g., Gilman et al., 2008). Mangroves grow at
the land–sea interface and, therefore, remotely sensed pixels often consists of signals from mangroves, soil, water, and other
substrate vegetation (Kuenzer et al., 2011). Textural and spectral characteristics of the canopy and leaves are the main features used
to distinguish mangrove communities (Dıaz and Blackburn, 2003). Spectral variations of the mangrove canopy reflectance can be
depicted as a function of several optical properties, such as LAI, background reflectance, and leaf inclination (Dıaz and Blackburn,
2003). The spectral signature of a single species is defined by age, vitality, and phenological and physiological characteristics
(Blasco et al., 1998). The spectral-response signal also depends on the internal leaf structure, mainly composed of palisade
parenchyma and spongy mesophyll, as well as the number of cell layers, intercell spaces, air–water interfaces, and cell size
(Jones et al., 2004). These leaf components include salt, sugar, water, protein, oil, lignin, starch, and cellulose, as well as the leaf
structure. Additionally, intertidal effects and soil type influence the spectral signal of plant communities (Blasco et al., 1998).
Mangroves with lower-stand density are significantly influenced by intertidal effects; the sparser the vegetation canopies, the greater
the influence of the ground surface (Gao, 1998).
p0315 In the past, aerial images were an indispensable technique particularly for the local mapping of mangroves, local change
detection, and habitat-management support (Kuenzer et al., 2011). Conventional space-borne satellite sensors have played an
important role inmapping mangroves over large geographical regions. The data most commonly used stem from Landsat-5 TM and
SPOT. Data from other sensors such as Landsat MSS, Landsat-7 ETM+, IRS 1C/1D LISS III, and the Advanced Space-borne Thermal
Emission and Reflection Radiometer were also used by investigators to map mangroves.
s0125 Remote Sensing Grassland Ecosystem Sustainability
p0320 Remote sensing plays an increasing role in grassland ecosystem sustainability research, especially regarding large spatial and/or
long-term temporal scales. Numerous studies have applied remote sensing technologies to examine grassland ecosystem
Comp. by: G.Rajesh Stage: Proof Chapter No.: 10428 Title Name: REMSDate:12/10/16 Time:18:21:43 Page Number: 9
Remote Sensing for Ecosystem Sustainability 9
REMS: 10428
To protect the rights of the author(s) and publisher we inform you that this PDF is an uncorrected proof for internal business use only by the author(s), editor(s), reviewer(s), Elsevier andtypesetter SPi. It is not allowed to publish this proof online or in print. This proof copy is the copyright property of the publisher and is confidential until formal publication.
These proofs may contain colour figures. Those figures may print black and white in the final printed book if a colour print product has not been planned. The colour figures will appear incolour in all electronic versions of this book.

productivity, including NPP, biomass, biodiversity, and even fire ecology (Chiesi et al., 2005; Kuenzer and Knauer, 2013; Smith
et al., 2008; Sun and Zhu, 2001; Wang et al., 2010; Wulder et al., 2004). For example, empirical relationship between grassland
biomass and spectral VIs from remote sensing such as NDVI has been well established and applied over large scales to estimate NPP
and grassland biomass (Anyamba and Tucker, 2005; Gu et al., 2013; Tucker, 1979; Tucker et al., 1985).
p0325 For remote sensing in grassland research, significant effort was made to improve vegetation sensitivity while suppressing noises
related to soil substrate variability and atmospheric effects. For example, because NDVI is subject to external factor impacts such as
soil and atmosphere, particularly in sparsely vegetated regions, improved spectral VIs were developed including, the soil-adjusted
vegetation index and modified soil-adjusted vegetation indices (MSAVI), for more accurate estimates of grassland biomass and
foliage that are critical for livestock grazing, soil erosion protection, and water cycles (e.g., Huete, 1988; Kaufman and Tanre, 1992;
Qi et al., 1994). These indices were further developed into a global optimized, EVI that is a line of MODIS product (e.g., Huete et al.,
1999, 2002). The EVI combined with FPAR significantly improved the performance of above-ground biomass estimation (e.g.,
Wu, 2012).
p0330 In addition to grassland biomass and NPP estimation, remotely sensed imagery and spectral indices were also applied to assess
land degradations such as desertification and degradation (Bastin et al., 1995; Collado et al., 2002; Sternberg et al., 2011). For
example, by combining vegetation fraction images, NDVI images with auxiliary field information and rainfall information,
grassland desertification could be assessed, quantified, and monitored (e.g., Holm et al., 2003; Wang et al., 2009). Grassland
biomass has been related to the green vegetation index, brightness index, and wetness index, and subsequently used to assess
impacts of grazing practices on total biomass production of shortgrass steppe (Todd et al., 1998).
p0335 Remote sensing can enhance the assessment of soil properties of grasslands, an important indicator of long-term sustainability
of an ecosystem. For example, combination of high-resolution remotely sensed images and LiDAR data with plant community
information can quite effectively predict the soil organic carbon content in alpine grasslands, and effectively reduce the amount of
field work required by soil surveys (Ballabio et al., 2012).
p0340 Nitrogen in plant canopies is central to a number of important grassland ecosystem processes. Partial least squares regression
models have been employed for predicting the mass-based canopy percentage of nitrogen across management types using input
from airborne and field-based imaging spectrometers (Pellissier et al., 2015).
s0130 Remote Sensing Urban Ecosystem Sustainability
p0345 Urbanization has caused a number of significant environmental concerns that are relevant to urban sustainability and sustainable
development. The most obvious impact of urbanization is the urban sprawl and large-scale creation of impervious surfaces that
have considerable hydrological consequences such as increasing surface runoff, delivering pollutants to rivers, and causing erosion
(e.g., Jat et al., 2008; Au13Seto et al., 2010; Weng, 2001).
p0350 Remote sensing is increasingly used for the analysis of urban ecosystems and for developing pathways that support management
decisions and investment for sustainable urban development. For example, by using time series remote sensing images researches
can monitor urban sprawl across time and space and assess its effects on the four dimensions of sustainability. Knowing the rate
and geographic regions of urban sprawl allows a holistic assessment of urban planning and development strategies (e.g., Bhatta
et al., 2010; Seto et al., 2010; Au14Sutton, 2003).
p0355 Impervious areas are generally considered an indicator of urban sprawl (Epsteln et al., 2002) and they constitute the key feature
of urban sprawl. Impervious surfaces can be determined through remotely acquired data (Jat et al., 2008; Yang and Liu, 2005). The
most time consuming and costly, yet most accurate method to measure impervious areas and urban sprawl is the manual extraction
of impervious surface features from remote sensing images through heads up digitizing. Remote sensing pattern recognition
approaches, such as supervised, unsupervised, and knowledge-based expert system approaches, have recently been used to measure
impervious areas and urban sprawl (Lu and Weng, 2005; Mundia and Aniya, 2005; Taubenbock et al., 2012). With ancillary soil
data of urban planning and development, urban sprawl can be fully assessed, monitored, and hopefully, regulated to ensure a
sustainable environmental condition.
p0360 Urban heating and the formation of the urban heat island (UHI) is another attribute of urbanization and land use transfor-
mation that is a vital parameter for urban sustainability. This urban indicator is not only a key environmental sustainability
measure but also a social sustainability indicator as it is directly related to human health, ecosystem function, local weather, and
possibly climate (Imhoff et al., 2010; Roth et al., 1989; Schwarz and Manceur, 2014; Schwarz et al., 2011; Zhang et al., 2013). The
UHI phenomenon is generally seen as being caused by a reduction in latent heat flux and an increase in sensible heat in urban areas
as vegetated and evaporating soil surfaces are replaced by relatively impervious low albedo paving and building materials. This
creates a difference in temperature between urban and surrounding nonurban areas (e.g., Mariani et al., 2016; Schwarz et al., 2011).
p0365 Remotely sensed data of land surface temperature (LST), urban green cover, and other surface characteristics have been widely
used to describe the UHI phenomenon (Gallo and Owen, 1999; Weng et al., 2004). The urban–rural differences in air temperature
were linearly related to urban–rural differences in the vegetative cover (derived from NDVI) and surface radiant temperature (e.g.,
Gallo and Owen, 1999). Use of satellite-derived data may contribute to a globally consistent method for analyzing the UHI
phenomena and its impacts on human health. The LST data have been combined with impervious surface area, as well as vegetative
cover, to characterize temperature differences across space and time (Xian and Crane, 2005; Yuan and Bauer, 2007). The latest
MODIS LST data were also widely used to evaluate the surface temperature differences between urban and surrounding suburban
Comp. by: G.Rajesh Stage: Proof Chapter No.: 10428 Title Name: REMSDate:12/10/16 Time:18:21:43 Page Number: 10
10 Remote Sensing for Ecosystem Sustainability
REMS: 10428
To protect the rights of the author(s) and publisher we inform you that this PDF is an uncorrected proof for internal business use only by the author(s), editor(s), reviewer(s), Elsevier andtypesetter SPi. It is not allowed to publish this proof online or in print. This proof copy is the copyright property of the publisher and is confidential until formal publication.
These proofs may contain colour figures. Those figures may print black and white in the final printed book if a colour print product has not been planned. The colour figures will appear incolour in all electronic versions of this book.

areas (Cao et al., 2016; Zhou et al., 2014) to assess UHI severity, duration, and geographic areas, an important sustainability
information for potential human intervention and mitigation.
s0135 Concluding Remarks
p0370 The environmental pillar of the ecosystem sustainability is changing, driven by escalated climate variability and human activities,
thus demanding human interventions to mitigate further changes or adapt some irreversible changes that have already happened.
There are important indicators of environmental sustainability that can be monitored, analyzed, and even predicted, through
remote sensing technologies. Knowledge of the nature, extent, spatial distribution, potential, and limitations of key environmental
indicators such as those discussed in this article provides an important clue to develop pathways toward a sustainable ecosystem.
Advances in remote sensing technologies and the reduced cost of sensors have provided multispectral, multiresolution, and
multitemporal data to quantify quantity and quality of these key ecosystem indicators.
p0375 Despite the tremendous advances in sensor technology, data processing, analysis and interpretation techniques, however, there
are numerous ecosystem sustainability indicators that remote sensing is still unable to retrieve. Therefore, continued research is
needed to develop new sensing technologies and innovative information retrieval methods.
p0380 It should be noted that a sustainable ecosystem is supported by well-balanced four pillars of sustainability: environmental,
economic, social, and cultural. Remote sensing is capable of monitoring and assessing most environment-related variables, but
often it is incapable of inferring information in the social, culture, and economic dimensions of ecosystem sustainability.
Therefore, a multidisciplinary collaboration is critical for ecosystem sustainability research.
References Au34
Abbas A, Khan S, Hussain N, Hanjra MA, and Akbar S (2013) Characterizing soil salinity in irrigated agriculture using a remote sensing approach. Physics and Chemistry of the Earth,Parts A/B/C 55: 43–52.
Adam E, Mutanga O, and Rugege D (2010) Multispectral and hyperspectral remote sensing for identification and mapping of wetland vegetation: a review. Wetlands Ecology andManagement 18(3): 281–296.
Al-Adamat RA, Foster ID, and Baban SM (2003) Groundwater vulnerability and risk mapping for the Basaltic aquifer of the Azraq basin of Jordan using GIS, Remote sensing andDRASTIC. Applied Geography 23(4): 303–324.
Albuquerque MTD, Sanz G, Oliveira SF, Martınez-Alegrıa R, and Antunes IMHR (2013) Spatio-temporal groundwater vulnerability assessment-a coupled remote sensing and GISapproach for historical land cover reconstruction. Water Resources Management 27(13): 4509–4526.
Almeida P, Altobelli A, D’Aietti L, Feoli E, Ganis P, Giordano F, Napolitano R, and Simonetti C (2014) The role of vegetation analysis by remote sensing and GIS technology forplanning sustainable development: a case study for the Santos estuary drainage basin (Brazil). Plant Biosystems—An International Journal Dealing with all Aspects of PlantBiology 148(3): 540–546.
Anyamba A and Tucker CJ (2005) Analysis of Sahelian vegetation dynamics using NOAA-AVHRR NDVI data from 1981–2003. Journal of Arid Environments 63(3): 596–614.Asmaryan S, Warner TA, Muradyan V, and Nersisyan G (2013) Mapping tree stress associated with urban pollution using the Worldview-2 red edge band. Remote Sensing Letters
4(2): 200–209.Asner GP, Townsend AR, Bustamante M, Nardoto GB, and Olander LP (2004) Pasture degradation in the central Amazon: linking changes in carbon and nutrient cycling with remote
sensing. Global Change Biology 10(5): 844–862.Asrar G, Fuchs M, Kanemasu E, and Hatfield J (1984) Estimating absorbed photosynthetic radiation and leaf area index from spectral reflectance in wheat. Agronomy Journal 76(2):
300–306.Axelsson R, Angelstam P, Elbakidze M, Stryamets N, and Johansson KE (2011) Sustainable development and sustainability: landscape approach as a practical interpretation of
principles and implementation concepts. Journal of Landscape Ecology 4(3): 5–30.Bahadur KK (2009) Mapping soil erosion susceptibility using remote sensing and GIS: a case of the Upper Nam Wa Watershed, Nan Province, Thailand. Environmental Geology 57(3):
695–705.Bai ZG, Dent DL, Olsson L, and Schaepman ME (2008) Proxy global assessment of land degradation. Soil Use and Management 24(3): 223–234.Ballabio C, Fava F, and Rosenmund A (2012) A plant ecology approach to digital soil mapping, improving the prediction of soil organic carbon content in alpine grasslands. Geoderma
187–188: 102–116.Basiago AD (1998) Economic, social, and environmental sustainability in development theory and urban planning practice. Environmentalist 19(2): 145–161.Bastin GN, Pickup G, and Pearce G (1995) Utility of AVHRR data for land degradation assessment: a case study. International Journal of Remote Sensing 16(4): 651–672.Berni JA, Zarco-Tejada PJ, Suarez L, and Fereres E (2009) Thermal and narrowband multispectral remote sensing for vegetation monitoring from an unmanned aerial vehicle. IEEE
Transactions on Geoscience and Remote Sensing 47(3): 722–738.Berry JK, Detgado JA, Khosla R, and Pierce FJ (2003) Precision conservation for environmental sustainability. Journal of Soil and Water Conservation 58(6): 332–339.Bhatta B, Saraswati S, and Bandyopadhyay D (2010) Urban sprawl measurement from remote sensing data. Applied Geography 30: 731–740.Blasco F, et al. (1998) Recent advances in mangrove studies using remote sensing data. Marine and Freshwater Research 49(4): 287–296.
Au15Bourgeau-Chavez, L., Riordan, K., Powell, R., Miller, N. and Nowels, M. (2009). Improving wetland characterization with multi-sensor, multi-temporal SAR and optical/infrared datafusion.
Au16Boyd DS and Danson FM (2005) Satellite remote sensing of forest resources: three decades of research development. Progress in Physical Geography 29(1): 1–26.Brown BJ, Hanson ME, Liverman DM, and Merideth RW Jr (1987) Global sustainability: toward definition. Environmental Management 11(6): 713–719.
Au17Bukata RP (2005) Satellite monitoring of inland and coastal water quality: retrospection, introspection, future directions. New York: Taylor & Francis. pp. 37–75.Burkhard B, Kroll F, Muller F, and Windhorst W (2009) Landscapes’ capacities to provide ecosystem services—a concept for land-cover based assessments. Landscape Online
15(1): 22.Buyantuyev A and Wu J (2010) Urban heat islands and landscape heterogeneity: linking spatiotemporal variations in surface temperatures to land-cover and socioeconomic patterns.
Landscape Ecology 25(1): 17–33.Cao C, et al. (2016) Urban heat islands in China enhanced by haze pollution. Nature Communications 7.Ceccato P, Flasse S, Tarantola S, Jacquemoud S, and Gregoire J-M (2001) Detecting vegetation leaf water content using reflectance in the optical domain. Remote Sensing of
Environment 77(1): 22–33.
Comp. by: G.Rajesh Stage: Proof Chapter No.: 10428 Title Name: REMSDate:12/10/16 Time:18:21:43 Page Number: 11
Remote Sensing for Ecosystem Sustainability 11
REMS: 10428
To protect the rights of the author(s) and publisher we inform you that this PDF is an uncorrected proof for internal business use only by the author(s), editor(s), reviewer(s), Elsevier andtypesetter SPi. It is not allowed to publish this proof online or in print. This proof copy is the copyright property of the publisher and is confidential until formal publication.
These proofs may contain colour figures. Those figures may print black and white in the final printed book if a colour print product has not been planned. The colour figures will appear incolour in all electronic versions of this book.
Chambers JQ, Asner GP, Morton DC, Anderson LO, Saatchi SS, Espırito-Santo FD, Palace M, and Souza C Jr (2007) Regional ecosystem structure and function: ecological insightsfrom remote sensing of tropical forests. Trends in Ecology & Evolution 22: 414–423.
Chen X (2002) Using remote sensing and GIS to analyse land cover change and its impacts on regional sustainable development. International Journal of Remote Sensing 23(1):107–124.
Chiesi M, Maselli F, Bindi M, Fibbi L, Cherubini P, Arlotta E, Tirone G, Matteucci G, and Seufert G (2005) Modelling carbon budget of Mediterranean forests using ground and remotesensing measurements. Agricultural and Forest Meteorology 135(1): 22–34.
Collado AD, Chuvieco E, and Camarasa A (2002) Satellite remote sensing analysis to monitor desertification processes in the crop-rangeland boundary of Argentina. Journal of AridEnvironments 52(1): 121–133.
Daughtry CS (2001) Discriminating crop residues from soil by shortwave infrared reflectance. Agronomy Journal 93(1): 125–131.DeFries R (2008) Terrestrial vegetation in the coupled human-earth system: contributions of remote sensing. Annual Review of Environment and Resources 33: 369–390. http://dx.doi.
org/10.1146/annurev.environ.33.020107.113339.DeFries RS, Townshend JRG, and Hansen MC (1999) Continuous fields of vegetation characteristics at the global scale at 1-km resolution. Journal of Geophysical Research
104: 16911–16923.Au18DeFries RS, Hansen MC, Townshend JRG, Janetos AC, and Loveland TR (2000) A new global 1-km dataset of percentage tree cover derived from remote sensing. Global Change
Biology 6(2): 247–254.Diamond J (2005) Collapse: how societies choose to fail or succeed. New York: Viking Penguin. pp. 130.Dıaz BM and Blackburn GA (2003) Remote sensing of mangrove biophysical properties: evidence from a laboratory simulation of the possible effects of background variation on
spectral vegetation indices. International Journal of Remote Sensing 24(1): 53–73.Doran JW and Zeiss MR (2000) Soil health and sustainability: managing the biotic component of soil quality. Applied Soil Ecology 15(1): 3–11.Dubayah RO, Sheldon SL, Clark DB, Hofton MA, Blair JB, Hurtt GC, and Chazdon RL (2010) Estimation of tropical forest height and biomass dynamics using lidar remote sensing at La
Selva, Costa Rica. Journal of Geophysical Research 115,G00E09. http://dx.doi.org/10.1029/2009JG000933.Duro DC, Coops NC, Wulder MA, and Han T (2007) Development of a large area biodiversity monitoring system driven by remote sensing. Progress in Physical Geography 31(3):
235–260.Epsteln J, Payne K, and Kramer E (2002) Techniques for mapping suburban sprawl. Photogrammetric Engineering & Remote Sensing 63(9): 913–918.Erdody TL and Moskal LM (2010) Fusion of LiDAR and imagery for estimating forest canopy fuels. Remote Sensing of Environment 114(4): 725–737.Farifteh J, Farshad A, and George RJ (2006) Assessing salt-affected soils using remote sensing, solute modelling, and geophysics. Geoderma 130(3): 191–206.Fensholt R, Sandholt I, and Rasmussen MS (2004) Evaluation of MODIS LAI, fAPAR and the relation between fAPAR and NDVI in a semi-arid environment using in situ measurements.
Remote Sensing of Environment 91(3): 490–507.Foody GM (2003) Remote sensing of tropical forest environments: towards the monitoring of environmental resources for sustainable development. International Journal of Remote
Sensing 24(20): 4035–4046.Fourty T, Baret F, Jacquemoud S, Schmuck G, and Verdebout J (1996) Leaf optical properties with explicit description of its biochemical composition: direct and inverse problems.
Remote Sensing of Environment 56(2): 104–117.Frouin R and Pinker RT (1995) Remote sensing of land surface for studies of global change estimating photosynthetically active radiation (PAR) at the earth’s surface from satellite
observations. Remote Sensing of Environment 51(1): 98–107.Gallo KP and Owen TW (1999) Satellite-based adjustments for the urban heat island temperature bias. Journal of Applied Meteorology 38(6): 806–813.Gao B-C (1996) NDWI—a normalized difference water index for remote sensing of vegetation liquid water from space. Remote Sensing of Environment 58(3): 257–266.Gao J (1998) A hybrid method toward accurate mapping of mangroves in a marginal habitat from SPOT multispectral data. International Journal of Remote Sensing 19(10):
1887–1899.Garcıa M, Riano D, Chuvieco E, and Danson FM (2010) Estimating biomass carbon stocks for a Mediterranean forest in central Spain using LiDAR height and intensity data. Remote
Sensing of Environment 114(4): 816–830.Gatrell JD and Jensen RR (2008) Sociospatial applications of remote sensing in urban environments. Geography Compass 2(3): 728–743.
Au19Gatto M (1995) Sustainability: is it a well defined concept? Ecological Applications 5(4): 1181–1183.Gege P (1998) Characterization of the phytoplankton in Lake Constance for classification by remote sensing. Archivos Hydrobiology 53: 179–193.Giannico V, Lafortezza R, John R, Sanesi G, Pesola L, and Chen J (2016) Estimating stand volume and above-ground biomass of urban forests using LiDAR. Remote Sensing 8(4):
339. 1–14.Gilman F, Ellison J, Duke N, and Field C (2008) Threats to mangroves from climate change and adaptation options: a review. Aquatic Botany 89: 237–250.Gitelson A, Garbuzov G, Szilagyi F, Mittenzwey KH, Karnieli A, and Kaiser A (1993) Quantitative remote sensing methods for real-time monitoring of inland waters quality. International
Journal of Remote Sensing 14(7): 1269–1295.Gitelson AA, Merzlyak MN, and Chivkunova OB (2001) Optical properties and nondestructive estimation of anthocyanin content in plant leaves. Photochemistry and Photobiology
74(1): 38–45.Gitelson AA, Zur Y, Chivkunova OB, and Merzlyak MN (2002) Assessing carotenoid content in plant leaves with reflectance spectroscopy. Photochemistry and Photobiology 75(3):
272–281.Gitelson AA, Dall’Olmo G, Moses W, Rundquist DC, Barrow T, Fisher TR, Gurlin D, and Holz J (2008) A simple semi-analytical model for remote estimation of chlorophyll-a in turbid
waters: validation. Remote Sensing of Environment 112: 3582–3593.Gladwin TN, Kennelly JJ, and Krause TS (1995) Shifting paradigms for sustainable development: implications for management theory and research. Academy of Management Review
20(4): 874–907.Gong C, Yu S, Joesting H, and Chen J (2013) Determining socioeconomic drivers of urban forest fragmentation with historical remote sensing images. Landscape and Urban Planning
117: 57–65.Goward SN and Huemmrich KF (1992) Vegetation canopy PAR absorptance and the normalized difference vegetation index: an assessment using the SAIL model. Remote Sensing of
Environment 39(2): 119–140.Goward SN, Waring RH, Dye DG, and Yang J (1994) Ecological remote sensing at OTTER: satellite macroscale observations. Ecological Applications 4(2): 322–343.Gu Y, Wylie BK, and Bliss NB (2013) Mapping grassland productivity with 250-m eMODIS NDVI and SSURGO database over the Greater Platte River Basin, USA. Ecological Indicators
24: 31–36.Haimes YY (1992) Sustainable development: a holistic approach to natural resource management. IEEE Transactions on Systems, Man and Cybernetics 22(3): 413–417.Hall MJ and Ellis JB (1985) Water quality problems of urban areas. Geo Journal 11: 265. http://dx.doi.org/10.1007/BF00186340.Han L and Jordan K (2005) Estimating and mapping chlorophyll-a concentration in Pensacola Bay, Florida using Landsat ETM+ data. International Journal of Remote Sensing
26: 5245–5254.Hawkes J (2001) The fourth pillar of sustainability: culture’s essential role in public planning. Melbourne: Common Ground.Hess LL, Melack JM, Filoso S, and Wang Y (1995) Delineation of inundated area and vegetation along the Amazon floodplain with the SIR-C synthetic aperture radar. IEEE
Transactions on Geoscience and Remote Sensing 33(4): 896–904.Hill MJ, Senarath U, Lee A, Zeppel M, Nightingale JM, Williams RDJ, and McVicar TR (2006) Assessment of the MODIS LAI product for Australian ecosystems. Remote Sensing of
Environment 101(4): 495–518.
Comp. by: G.Rajesh Stage: Proof Chapter No.: 10428 Title Name: REMSDate:12/10/16 Time:18:21:43 Page Number: 12
12 Remote Sensing for Ecosystem Sustainability
REMS: 10428
To protect the rights of the author(s) and publisher we inform you that this PDF is an uncorrected proof for internal business use only by the author(s), editor(s), reviewer(s), Elsevier andtypesetter SPi. It is not allowed to publish this proof online or in print. This proof copy is the copyright property of the publisher and is confidential until formal publication.
These proofs may contain colour figures. Those figures may print black and white in the final printed book if a colour print product has not been planned. The colour figures will appear incolour in all electronic versions of this book.

Holm AM, Cridland SW, and Roderick ML (2003) The use of time-integrated NOAA NDVI data and rainfall to assess landscape degradation in the arid shrubland of Western Australia.Remote Sensing of Environment 85(2): 145–158.
Huang GH and Xia J (2001) Barriers to sustainable water-quality management. Journal of Environmental Management 61(1): 1–23.Huete AR (1988) A soil-adjusted vegetation index (SAVI). Remote Sensing of Environment 25(3): 295–309.Huete AR, Liu HQ, Batchily K, and van Leeuwen W (1997) A comparison of vegetation indices over a global set of TM images for EOS-MODIS. Remote Sensing of Environment 59(3):
440–451.Huete, A., Justice, C. and Van Leeuwen, W. (1999). MODIS vegetation index (MOD13). Algorithm theoretical basis document, version 3: 213.Huete A, et al. (2002) Overview of the radiometric and biophysical performance of the MODIS vegetation indices. Remote Sensing of Environment 83(1–2): 195–213.Idso SB, Jackson RD, and Regionato RJ (1977) Remote sensing of crop yields. Science 196(4285): 19–25.Imhoff ML, Zhang P, Wolfe RE, and Bounoua L (2010) Remote sensing of the urban heat island effect across biomes in the continental USA. Remote Sensing of Environment 114(3):
504–513.Jat MK, Garg PK, and Khare D (2008) Monitoring and modelling of urban sprawl using remote sensing and GIS techniques. International Journal of Applied Earth Observation and
Geoinformation 10(1): 26–43.Jiang Z, Huete AR, Didan K, and Miura T (2008) Development of a two-band enhanced vegetation index without a blue band. Remote Sensing of Environment 112(10): 3833–3845.John J, Chen J, Lu N, Guo K, Liang C, Wei Y, Noormets A, Ma K, and Han X (2008) Predicting plant diversity based on remote sensing products in the semi-arid region of Inner
Mongolia. Remote Sensing of Environment 112(5): 2018–2032.Jones J, Dale P, Chandica AL, and Breitfuss M (2004) Changes in the distribution of the grey mangrove Avicennia marina (Forsk.) using large scale aerial color infrared photographs:
are the changes related to habitat modification for mosquito control? Estuarine, Coastal and Shelf Science 61(1): 45–54.Au20Jonkman SN and Vrijling JK (2008) Loss of life due to floods. Journal of Flood Risk Management 1: 43–56. http://dx.doi.org/10.1111/j.1753-318X.2008.00006.x.
Justice CO, et al. (1998) The moderate resolution imaging spectroradiometer (MODIS): land remote sensing for global change research. IEEE Transactions on Geoscience and RemoteSensing 36(4): 1228–1249.
Kadykalo AN and Findlay CS (2016) The flow regulation services of wetlands. Ecosystem Services 20(1): 91–103.Kasischke ES and Bourgeau-Chavez LL (1997) Monitoring South Florida wetlands using ERS-1 SAR imagery. Photogrammetric Engineering and Remote Sensing 63(3): 281–291.Kates RW, Clark WC, Corell R, Hall JM, Jaeger CC, Lowe I, McCarthy JJ, Schellnhuber HJ, Bolin B, Dickson NM, and Faucheux S (2001) Sustainability science. Science 292(5517):
641–642.Kaufman YJ and Tanre D (1992) Atmospherically resistant vegetation index (ARVI) for EOS-MODIS. IEEE Transactions on Geoscience and Remote Sensing 30: 261–270.Kuenzer C and Knauer K (2013) Remote sensing of rice crop areas. International Journal of Remote Sensing 34(6): 2101–2139.Kuenzer C, Bluemel A, Gebhardt S, Quoc TV, and Dech S (2011) Remote sensing of mangrove ecosystems: a review. Remote Sensing 3(5): 878–928.Kushwaha S, Dwivedi R, and Rao B (2000) Evaluation of various digital image processing techniques for detection of coastal wetlands using ERS-1 SAR data. International Journal of
Remote Sensing 21(3): 565–579.Lafortezza R, Coomes DA, Kapos V, and Ewers RM (2010) Assessing the impacts of fragmentation on plant communities in New Zealand: scaling from survey plots to landscapes.
Global Ecology and Biogeography 19(5): 741–754.Lane CR, et al. (2014) Improved wetland classification using eight-band high resolution satellite imagery and a hybrid approach. Remote Sensing 6(12): 12187–12216.Lathrop RG Jr and Lillesand TM (1986) Use of Thematic Mapper data to assess water quality in Green Bay and central Lake Michigan. Photogrammetric Engineering and Remote
Sensing 52: 671–680.Au21Lathrop RG, Lillesand TM, and Yandell BS (1991) Testing the utility of simple multi-date Thematic Mapper calibration algorithms for monitoring. International Journal of Remote
Sensing 12(10).Lavrov A, Utkin AB, Vilar R, and Fernandes A (2006) Evaluation of smoke dispersion from forest fire plumes using lidar experiments and modelling. International Journal of Thermal
Sciences 45(9): 848–859.Au22Le Toan T, Quegan S, Woodward I, Lomas M, Delbart N, and Picard G (2007) Climatic Change 67(2–3): 379. http://dx.doi.org/10.1007/s10584-004-3155-5.
Leitao AB and Ahern J (2002) Applying landscape ecological concepts and metrics in sustainable landscape planning. Landscape and Urban Planning 59(2): 65–93.Lim K, Treitz P, Baldwin K, Morrison I, and Green J (2003) Lidar remote sensing of biophysical properties of tolerant northern hardwood forests. Canadian Journal of Remote Sensing
29(5): 658–678.Lindholm T, Eriksson JE, and Meriluoto JA (1989a) Toxic cyanobacteria and water quality problems—examples from a eutrophic lake on Aland, south west Finland. Water Research
23(4): 481–486.Lindholm T, Eriksson JE, and Meriluoto JAO (1989b) Toxic cyanobacteria and water quality problems—examples from a eutrophic lake on land, South West Finland. Water Research
23(4): 481–486.Liu HQ and Huete A (1995) A feedback based modification of the NDVI to minimize canopy background and atmospheric noise. IEEE Transactions on Geoscience and Remote Sensing
33(2): 457–465.Long H, Tang G, Li X, and Heilig GK (2007) Socio-economic driving forces of land-use change in Kunshan, the Yangtze River Delta economic area of China. Journal of Environmental
Management 83(3): 351–364.Lu D and Weng Q (2005) Urban classification using full spectral information of Landsat ETM+ imagery in Marion County, Indiana. Photogrammetric Engineering & Remote Sensing
71(11): 1275–1284.Lu D, Li G, Valladares GS, and Batistella M (2004) Mapping soil erosion risk in Rondonia, Brazilian Amazonia: using RUSLE, remote sensing and GIS. Land Degradation &
Development 15(5): 499–512.Lucas R, Accad A, Randall L, Bunting P, and Armoston J (2008) Assessing human impacts on Australian forests through integration of remote sensing data. In: Lafortezza R, Chen J,
Sanesi G, and Crow T (eds.) Patterns and processes in forest landscapes. Multiple use and sustainable management, pp. 213–239. The Netherlands: Springer.Mahlein AK, Oerke EC, Steiner U, and Dehne HW (2012) Recent advances in sensing plant diseases for precision crop protection. European Journal of Plant Pathology 133(1):
197–209.Mariani L, Parisi SG, Cola G, Lafortezza R, Colangelo G, and Sanesi G (2016) Climatological analysis of the mitigating effect of vegetation on the urban heat island of Milan, Italy.
Science of the Total Environment 569: 762–773.Marshall JD and Toffel MW (2005) Framing the elusive concept of sustainability: a sustainability hierarchy. Environmental Science & Technology 39(3): 673–682.McFeeters SK (1996) The use of the normalized difference water index (NDWI) in the delineation of open water features. International Journal of Remote Sensing 17(7): 1425–1432.
Au23Messner F and Meyer V (2006) Flood damage, vulnerability and risk perception – challenges for flood damage research. In: Flood risk management: hazards, vulnerability andmitigation measures. NATO Science Series, vol. 67, pp. 149–167, New York: Springer.
Au24Miao Y, Stewart BA, and Zhang F (2010) Long-term experiments for sustainable nutrient management in China. A review. Agronomy for Sustainable Development 31(2): 397–414.Miller P, Shutler J, Moore G, and Groom S (2006) SeaWIFS discrimination of harmful algal bloom evolution. International Journal of Remote Sensing 27: 2287–2301.Mitchard ETA, Saatchi SS, White LJT, Abernethy KA, Jeffery KJ, Lewis SL, Collins M, Lefsky MA, Leal ME, Woodhouse IH, and Meir P (2012) Mapping tropical forest biomass with
radar and spaceborne LiDAR in Lope National Park, Gabon: overcoming problems of high biomass and persistent cloud. Biogeosciences 9: 179–191. http://dx.doi.org/10.5194/bg-9-179-2012.
Mitsch WJ and Gosselink JG (2007) Wetlands, 4th edn. Hoboken, NJ: Wiley.Mu Q, Zhao M, Kimball JS, McDowell NG, and Running SW (2013) A remotely sensed global terrestrial drought severity index. Bulletin of the American Meteorological Society 94(1):
83–98.
Comp. by: G.Rajesh Stage: Proof Chapter No.: 10428 Title Name: REMSDate:12/10/16 Time:18:21:43 Page Number: 13
Remote Sensing for Ecosystem Sustainability 13
REMS: 10428
To protect the rights of the author(s) and publisher we inform you that this PDF is an uncorrected proof for internal business use only by the author(s), editor(s), reviewer(s), Elsevier andtypesetter SPi. It is not allowed to publish this proof online or in print. This proof copy is the copyright property of the publisher and is confidential until formal publication.
These proofs may contain colour figures. Those figures may print black and white in the final printed book if a colour print product has not been planned. The colour figures will appear incolour in all electronic versions of this book.

Mundia CN and Aniya M (2005) Analysis of land use/cover changes and urban expansion of Nairobi city using remote sensing and GIS. International Journal of Remote Sensing 26(13): 2831–2849.
Myneni RB, Hoffman S, Knyazikhin Y, Privette JL, Glassy J, Tian Y, Wang Y, Song X, Zhang Y, Smith GR, and Lotsch A (2002) Global products of vegetation leaf area and fractionabsorbed PAR from year one of MODIS data. Remote Sensing of Environment 83(1): 214–231.
Naidoo R, Balmford A, Costanza R, Fisher B, Green RE, Lehner B, Malcolm TR, and Ricketts TH (2008) Global mapping of ecosystem services and conservation priorities. Proceedingsof the National Academy of Sciences 105(28): 9495–9500.
Au25Novitski LN, Esselman PC, Qi J, Lawawirojwong S, Suepa T, and Stevenson RJ (2016) Estimating chlorophyll in the great lakes with MODIS and Landsat boosted regression treealgorithms. Remote Sensing of Environment (in review).
Olmanson L, Bauer M, and Brezonik P (2008) A 20-year Landsat water clarity census of Minnesota’s 10,000 lakes. Remote Sensing of Environment 112: 4086–4097.Omer AM (2008) Energy, environment and sustainable development. Renewable and Sustainable Energy Reviews 12(9): 2265–2300.
Au26Ozesmi SL and Bauer ME (2002) Satellite remote sensing of wetlands. Wetlands Ecology and Management 10(5): 381–402.Au27Pearce DW (1993) Blueprint 3: measuring sustainable development. Earthscan (Vol. 3).
Pellissier PA, Ollinger SV, Lepine LC, Palace MW, and McDowell WH (2015) Remote sensing of foliar nitrogen in cultivated grasslands of human dominated landscapes. RemoteSensing of Environment 167: 88–97.
PeNUelas J, Filella I, Biel C, Serrano L, and SavE R (1993) The reflectance at the 950–970 nm region as an indicator of plant water status. International Journal of Remote Sensing 14(10): 1887–1905.
Petrosyan A (2010) A model for incorporated measurement of sustainable development comprising remote sensing data and using the concept of biodiversity. Journal of SustainableDevelopment 3(2): 9.
Porder S, Asner GP, and Vitousek PM (2005) Ground-based and remotely sensed nutrient availability across a tropical landscape. Proceedings of the National Academy of Sciences ofthe United States of America 102(31): 10909–10912.
Au28Prince SD (1991) Satellite remote sensing of primary production: comparison of results for Sahelian grasslands 1981–1988. International Journal of Remote Sensing 12(6).Prince SD and Goward SN (1995) Global primary production: a remote sensing approach. Journal of Biogeography 22(4/5): 815–835.Propastin PA, Kappas MW, Herrmann SM, and Tucker CJ (2012) Modified light use efficiency model for assessment of carbon sequestration in grasslands of Kazakhstan: combining
ground biomass data and remote-sensing. International Journal of Remote Sensing 33(5): 1465–1487.Qi J, Chehbouni A, Huete AR, Kerr YH, and Sorooshian S (1994) A modified soil adjusted vegetation index. Remote Sensing of Environment 48(2): 119–126.Ranson KJ, Sun G, Weishampel JF, and Knox RG (1997) Forest biomass from combined ecosystem and radar backscatter modeling. Remote Sensing of Environment 59(1): 118–133.Rapport DJ (1995) Ecosystem health: an emerging integrative science. In: Evaluating and monitoring the health of large-scale ecosystems, pp. 5–31. Berlin, Heidelberg: Springer.Reddy KR and Matcha SK (2010) Remote sensing algorithms for castor bean nitrogen and pigment assessment for fertility management. Industrial Crops and Products 32(3):
411–419.Renetzeder C, Schindler S, Peterseil J, Prinz MA, Mucher S, and Wrbka T (2010) Can we measure ecological sustainability? Landscape pattern as an indicator for naturalness and land
use intensity at regional, national and European level. Ecological Indicators 10(1): 39–48.Richey AS, Thomas BF, Lo MH, Reager JT, Famiglietti JS, Voss K, Swenson S, and Rodell M (2015) Quantifying renewable groundwater stress with GRACE.Water Resources Research
51(7): 5217–5238.Robert KW, Parris TM, and Leiserowitz AA (2005) What is sustainable development? Goals, indicators, values, and practice. Environment: Science and Policy for Sustainable
Development 47(3): 8–21.Rose RA, Byler D, Eastman JR, Fleishman E, Geller G, Goetz S, Guild L, Hamilton H, Hansen M, Headley R, and Hewson J (2015) Ten ways remote sensing can contribute to
conservation. Conservation Biology 29(2): 350–359.Roseland M (2000) Sustainable community development: integrating environmental, economic, and social objectives. Progress in Planning 54(2): 73–132.Roth M, Oke TR, and Emery WJ (1989) Satellite-derived urban heat islands from three coastal cities and the utilization of such data in urban climatology. International Journal of
Remote Sensing 10(11): 1699–1720.Roujean JL and Breon FM (1995) Estimating PAR absorbed by vegetation from bidirectional reflectance measurements. Remote Sensing of Environment 51(3): 375–384.Rouse JW Jr, Haas R, Schell J, and Deering D (1974) Monitoring vegetation systems in the Great Plains with ERTS. Washington, DC: NASA. Special publication 351: 309.Rout J, Ojha A, Samal RN, Rajesh G, and Pattnaik AK (2015) Vegetation area monitoring through NDVI technique: a case study of Dengei Pahad Micro Watershed, Khurda District,
Odisha. Journal of Remote Sensing & GIS 6(1): 11–16.Ruddick KG, Gons HJ, Rijkeboer M, and Tilstone G (2001) Optical remote sensing of chlorophyll a in case 2 waters by use of an adaptive two-band algorithm with optimal error
properties. Applied Optics 40: 3575–3585.Ruimy A, Saugier B, and Dedieu G (1994) Methodology for the estimation of terrestrial net primary production from remotely sensed data. Journal of Geophysical Research:
Atmospheres 99(D3): 5263–5283.Ruimy A, Kergoat L, and Bondeau A Intercomparison, T.P.O.F.T.P.N.M. (1999) Comparing global models of terrestrial net primary productivity (NPP): analysis of differences in light
absorption and light-use efficiency. Global Change Biology 5(S1): 56–64.Running SW, Nemani R, Glassy JM, and Thornton PE (1999) MODIS daily photosynthesis (PSN) and annual net primary production (NPP) product (MOD17) Algorithm Theoretical
Basis Document. SCF At-Launch Algorithm ATBD Documents, University of Montana, (available online at: http://ntsg.umt.edu/sites/ntsg.umt.edu/files/modis/ATBD/ATBD_MOD17_v21.pdf).
Saatchi S, Halligan K, Despain DG, and Crabtree RL (2007) Estimation of forest fuel load from radar remote sensing. IEEE Transactions on Geoscience and Remote Sensing 45(6):1726–1740.
Sample A (ed.) (1994) Remote sensing and GIS in ecosystem management. Washington, DC: Island Press.Santillo D (2007) Reclaiming the definition of sustainability. Environmental Science and Pollution Research 14(1): 60–66.Santos WJR, et al. (2014) Soil moisture in the root zone and its relation to plant vigor assessed by remote sensing at management scale. Geoderma 221–222: 91–95.Sawaya KE, Olmanson LG, Heinert NJ, Brezonik PL, and Bauer ME (2003) Extending satellite remote sensing to local scales: land and water resource monitoring using high-resolution
imagery. Remote Sensing of Environment 88(1): 144–156.Schofield O, Grzymski J, Bissett WP, Kirkpatrick GJ, Millie DF, Moline M, and Roesler CS (1999) Optical monitoring and forecasting systems for harmful algal blooms: possibility or
pipe dream? Journal of Phycology 35: 1477–1496.Au29Schwarz N and Manceur AM (2014) Analyzing the influence of urban forms on surface urban heat islands in Europe. Journal of Urban Planning and Development 141(3)A4014003.
Schwarz N, Lautenbach S, and Seppelt R (2011) Exploring indicators for quantifying surface urban heat islands of European cities with MODIS land surface temperatures. RemoteSensing of Environment 115(12): 3175–3186.
Seaquist JW and Olsson L (1999) Rapid estimation of photosynthetically active radiation over the West African Sahel using the Pathfinder Land Data Set. International Journal ofApplied Earth Observation and Geoinformation 1(3): 205–213.
Seaquist JW, Olsson L, and Ardo J (2003) A remote sensing-based primary production model for grassland biomes. Ecological Modelling 169(1): 131–155.Sellers PJ (1987) Canopy reflectance, photosynthesis, and transpiration, II. The role of biophysics in the linearity of their interdependence. Remote Sensing of Environment 21(2):
143–183.Seto KC, Sanchez-Rodrıguez R, and Fragkias M (2010) The new geography of contemporary urbanization and the environment. Annual Review of Environment and Resources 35(1):
167.Silva TS, Costa MP, Melack JM, and Novo EM (2008) Remote sensing of aquatic vegetation: theory and applications. Environmental Monitoring and Assessment 140(1–3): 131–145.
Comp. by: G.Rajesh Stage: Proof Chapter No.: 10428 Title Name: REMSDate:12/10/16 Time:18:21:44 Page Number: 14
14 Remote Sensing for Ecosystem Sustainability
REMS: 10428
To protect the rights of the author(s) and publisher we inform you that this PDF is an uncorrected proof for internal business use only by the author(s), editor(s), reviewer(s), Elsevier andtypesetter SPi. It is not allowed to publish this proof online or in print. This proof copy is the copyright property of the publisher and is confidential until formal publication.
These proofs may contain colour figures. Those figures may print black and white in the final printed book if a colour print product has not been planned. The colour figures will appear incolour in all electronic versions of this book.

Simis SGH, Peters SWM, and Gons HJ (2005) Remote sensing of the cyanobacterial pigment phycocyanin in turbid inland water. Limnology and Oceanography 50(1): 237–245.Simis SGH, Ruiz-Verdu A, Domınguez-Gomez JA, Pena-Martinez R, Peters SWM, and Gons HJ (2007) Influence of phytoplankton pigment composition on remote sensing of
cyanobacterial biomass. Remote Sensing of Environment 106: 414–427.Sims DA and Gamon JA (2002) Relationships between leaf pigment content and spectral reflectance across a wide range of species, leaf structures and developmental stages. Remote
Sensing of Environment 81(2–3): 337–354.Smith B, Knorr W, Widlowski JL, Pinty B, and Gobron N (2008) Combining remote sensing data with process modelling to monitor boreal conifer forest carbon balances. Forest
Ecology and Management 255(12): 3985–3994.Snyder WC, Wan Z, Zhang Y, and Feng YZ (1998) Classification-based emissivity for land surface temperature measurement from space. International Journal of Remote Sensing 19
(14): 2753–2774.Sternberg T, Tsolmon R, Middleton N, and Thomas D (2011) Tracking desertification on the Mongolian steppe through NDVI and field-survey data. International Journal of Digital
Earth 4(1): 50–64.Strong AE (1974) Remote sensing of algal blooms by aircraft and satellite in Lake Erie and Utah Lake. Remote Sensing of Environment 3: 99–107.Strong AE (1978) Chemical whitings and chlorophyll distributions in the Great Lakes as viewed by Landsat. Remote Sensing of Environment 7: 61–72.Stumpf RP and Tomlinson MC (2005) Remote sensing of harmful algal blooms. In: Miller RL, Del Castillo CE, and McKee BA (eds.) Remote sensing of coastal aquatic environments,
pp. 277–296. AH Dordrecht, The Netherlands: Springer. Chapter 12.Sudhira HS, Ramachandra TV, and Jagadish KS (2004) Urban sprawl: metrics, dynamics and modelling using GIS. International Journal of Applied Earth Observation and
Geoinformation 5(1): 29–39.Sun R and Zhu QJ (2001) Estimation of net primary productivity in China using remote sensing data. Journal of Geographical Sciences 11(1): 14–23.Sun G, Ranson KJ, Guo Z, Zhang Z, Montesano P, and Kimes D (2011) Forest biomass mapping from LiDAR and radar synergies. Remote Sensing of Environment 115: 2906–2916.Sutton PC (2003) A scale-adjusted measure of “urban sprawl” using nighttime satellite imagery. Remote Sensing of Environment 86: 353–369.Taubenbock H, et al. (2012) Monitoring urbanization in mega cities from space. Remote Sensing of Environment 117: 162–176.Termorshuizen JW and Opdam P (2009) Landscape services as a bridge between landscape ecology and sustainable development. Landscape Ecology 24(8): 1037–1052.Todd SW, Hoffer RM, and Milchunas DG (1998) Biomass estimation on grazed and ungrazed rangelands using spectral indices. International Journal of Remote Sensing 19(3):
427–438.Torbick N, Hu F, Zhang J, Qi J, Zhang H, and Becker B (2008) Mapping chlorophyll-a concentrations in West Lake China using Landsat 7 ETM+. Journal of Great Lakes Research
34: 3.Townsend PA and Walsh SJ (1998) Modeling floodplain inundation using an integrated GIS with radar and optical remote sensing. Geomorphology 21(3): 295–312.Townsend PA and Walsh SJ (2001) Remote sensing of forested wetlands: application of multitemporal and multispectral satellite imagery to determine plant community composition
and structure in southeastern USA. Plant Ecology 157(2): 129–149.Treitz PM and Howarth PJ (1999) Hyperspectral remote sensing for estimating biophysical parameters of forest ecosystems. Progress in Physical Geography 23(3): 359–390.Treuhaft RN, Goncalves FG, Drake JB, Chapman BD, dos Santos JR, Dutra LV, Graca PMLA, and Purcell GH (2010) Biomass estimation in a tropical wet forest using Fourier
transforms of profiles from lidar or interferometric SAR. Geophysical Research Letters 37(23).Tucker CJ (1979) Red and photographic infrared linear combinations for monitoring vegetation. Remote Sensing of Environment 8(2): 127–150.
Au30Tucker CJ and Sellers PJ (1986) Satellite remote sensing of primary production. International Journal of Remote Sensing 7(11): 1395–1416.Tucker CJ, Vanpraet CL, Sharman MJ, and Van Ittersum G (1985) Satellite remote sensing of total herbaceous biomass production in the Senegalese Sahel: 1980–1984. Remote
Sensing of Environment 17(3): 233–249.Au31Tuominen, J., Haapanen, R., Lipping, T. and Kuosmanen, V. (2009). Remote sensing of forest health. INTECH Open Access Publisher.
Turner W, Rondinini C, Pettorelli N, Mora B, Leidner AK, Szantoi Z, Buchanan G, Dech S, Dwyer J, Herold M, and Koh LP (2015) Free and open-access satellite data are key tobiodiversity conservation. Biological Conservation 182: 173–176.
Au32Urban, D.L. (2006). Landscape ecology. Encyclopedia of Environmetrics.Vincent RK, Qin X, McKay RM, Miner J, Czajkowski K, Savino J, and Bridgeman T (2004) Phycocyanin detection from Landsat TM data for mapping cyanobacterial blooms in Lake
Erie. Remote Sensing of Environment 89: 381–392.Vorosmarty CJ, Green P, Salisbury J, and Lammers RB (2000) Global water resources: vulnerability from climate change and population growth. Science 289(5477): 284–288. http://
dx.doi.org/10.1126/science.289.5477.284.Vorosmarty CJ, McIntyre PB, Gessner MO, Dudgeon D, Prusevich A, Green P, Glidden S, Bunn SE, Sullivan CA, Reidy Liermann C, and Davies PM (2010) Global threats to human
water security and river biodiversity. Nature 467: 555–561. http://dx.doi.org/10.1038/nature09440.Wandemberg JC (2015) Sustainable by design. ISBN 1516901789Amazon. p. 122 (Retrieved 16 February 2016).Wang M and Shi W (2008) Satellite-observed algae blooms in China’s Lake Taihu. Eos, Transactions American Geophysical Union 89(22): 201–202.Wang Y, Tian Y, Zhang Y, El-Saleous N, Knyazikhin Y, Vermote E, and Myneni RB (2001) Investigation of product accuracy as a function of input and model uncertainties: case study
with SeaWiFS and MODIS LAI/FPAR algorithm. Remote Sensing of Environment 78(3): 299–313.Wang Y, Woodcock CE, Buermann W, Stenberg P, Voipio P, Smolander H, Hame T, Tian Y, Hu J, Knyazikhin Y, and Myneni RB (2004) Evaluation of the MODIS LAI algorithm at a
coniferous forest site in Finland. Remote Sensing of Environment 91(1): 114–127.Wang GJ, Fu MC, Xiao QP, and Wang Z (2009) Monitoring grassland desertification around the built-up area of the city based on multi-temporal remotely sensed images.
In: Management and Service Science, 2009 MASS ’09. International Conference on, , pp. 1–4.Wang K, Franklin SE, Guo X, and Cattet M (2010) Remote sensing of ecology, biodiversity and conservation: a review from the perspective of remote sensing specialists. Sensors
(Basel, Switzerland) 10(11): 9647–9667.Wang K, Mao J, Dickinson RE, Shi X, Post WM, Zhu Z, and Myneni RB (2013) Evaluation of CLM4 solar radiation partitioning scheme using remote sensing and site level FPAR
datasets. Remote Sensing 5(6): 2857–2882.Wang Z, Li G, Dai Y, Wang Z, and Sha Z (2015) Assessment of spatio-temporal vegetation productivity pattern based on MODIS-NDVI and geo-correlation analysis. In: Geo-
informatics in resource management and sustainable ecosystem, pp. 673–681. Berlin, Heidelberg: Springer.Weng Q (2001) Modeling urban growth effects on surface runoff with the integration of remote sensing and GIS. Environmental Management 28(6): 737–748.Weng Q, Lu D, and Schubring J (2004) Estimation of land surface temperature–vegetation abundance relationship for urban heat island studies. Remote Sensing of Environment 89(4):
467–483.Wessman CA (1991) Proceedings of the International Workshop on modern techniques in soil ecology relevant to organic matter breakdown, nutrient cycling and soil biological
processes remote sensing of soil processes. Agriculture, Ecosystems & Environment 34(1): 479–493.Wickham J, Stehman S, Smith J, and Yang L (2004) Thematic accuracy of the 1992 national land-cover data for the western United States. Remote Sensing of Environment 91(3):
452–468.Wu C (2012) Use of a vegetation index model to estimate gross primary production in open grassland. Journal of Applied Remote Sensing 6(1)063532.Wulder MA, Hall RJ, Coops NC, and Franklin SE (2004) High spatial resolution remotely sensed data for ecosystem characterization. BioScience 54(6): 511–521.Xian G and Crane M (2005) Assessments of urban growth in the Tampa Bay watershed using remote sensing data. Remote Sensing of Environment 97(2): 203–215.Xiao X, et al. (2004) Satellite-based modeling of gross primary production in an evergreen needleleaf forest. Remote Sensing of Environment 89(4): 519–534.Yang X and Liu Z (2005) Use of satellite-derived landscape imperviousness index to characterize urban spatial growth. Computers, Environment and Urban Systems 29(5): 524–540.
Comp. by: G.Rajesh Stage: Proof Chapter No.: 10428 Title Name: REMSDate:12/10/16 Time:18:21:44 Page Number: 15
Remote Sensing for Ecosystem Sustainability 15
REMS: 10428
To protect the rights of the author(s) and publisher we inform you that this PDF is an uncorrected proof for internal business use only by the author(s), editor(s), reviewer(s), Elsevier andtypesetter SPi. It is not allowed to publish this proof online or in print. This proof copy is the copyright property of the publisher and is confidential until formal publication.
These proofs may contain colour figures. Those figures may print black and white in the final printed book if a colour print product has not been planned. The colour figures will appear incolour in all electronic versions of this book.

Yang W, Tan B, Huang D, Rautiainen M, Shabanov NV, Wang Y, Privette JL, Huemmrich KF, Fensholt R, Sandholt I, and Weiss M (2006) MODIS leaf area index products: fromvalidation to algorithm improvement. IEEE Transactions on Geoscience and Remote Sensing 44(7): 1885–1898.
Yuan F and Bauer ME (2007) Comparison of impervious surface area and normalized difference vegetation index as indicators of surface urban heat island effects in Landsat imagery.Remote Sensing of Environment 106(3): 375–386.
Zhang H, Qi ZF, Ye XY, Cai YB, Ma WC, and Chen MN (2013) Analysis of land use/land cover change, population shift, and their effects on spatiotemporal patterns of urban heatislands in metropolitan Shanghai, China. Applied Geography 44: 121–133.
Zhao M and Running SW (2010) Drought-induced reduction in global terrestrial net primary production from 2000 through 2009. Science 329(5994): 940–943.Zhou D, Zhao S, Liu S, Zhang L, and Zhu C (2014) Surface urban heat island in China’s 32 major cities: spatial patterns and drivers. Remote Sensing of Environment 152: 51–61.Zhu Z, Bi J, Pan Y, Ganguly S, Anav A, Xu L, Samanta A, Piao S, Nemani RR, and Myneni RB (2013) Global data sets of vegetation leaf area index (LAI) 3g and fraction of
photosynthetically active radiation (FPAR) 3g derived from global inventory modeling and mapping studies (GIMMS) normalized difference vegetation index (NDVI3g) for theperiod 1981 to 2011. Remote Sensing 5(2): 927–948.
Relevant Websites
http://www.csr.utexas.edu/grace/—GRACE: Gravity Recovery and Climate Experiment.http://www.dlr.de—DLR: German Aerospace Center.http://www.nasa.gov/—NASA: National Aeronautics and Space Administration.https://sustainabledevelopment.un.org/sdgs—SDG: United Nations’ Sustainable Development Goals.
Au33PAR: Photosynthetically Active Radiation.NDVI: Normalized Difference Vegetation Index.
Comp. by: G.Rajesh Stage: Proof Chapter No.: 10428 Title Name: REMSDate:12/10/16 Time:18:21:44 Page Number: 16
16 Remote Sensing for Ecosystem Sustainability
REMS: 10428
To protect the rights of the author(s) and publisher we inform you that this PDF is an uncorrected proof for internal business use only by the author(s), editor(s), reviewer(s), Elsevier andtypesetter SPi. It is not allowed to publish this proof online or in print. This proof copy is the copyright property of the publisher and is confidential until formal publication.
These proofs may contain colour figures. Those figures may print black and white in the final printed book if a colour print product has not been planned. The colour figures will appear incolour in all electronic versions of this book.

Non-Print Items
Abstract:
An ecosystem is a system formed by the interaction of a community of organisms with their environment within a geographic unit or region, and
ecosystem sustainability is an ecosystem’s capacity to endure and maintain its functions and services indefinitely. Although some literature is emerging
on the development of sustainability science frameworks, there is little information available on framing ecosystem sustainability. Part of the
challenge is that it requires the full integration of natural and human systems with a quantitative nexus among all fundamental elements of an
ecosystem. In this article, we first review key elements of ecosystem sustainability, and then provide a review of remote sensing capabilities to provide
spatio-temporal dynamics of key indicators of an ecosystem that are critical to its sustainability. While traditional sustainability science tends to focus
on four pillars of sustainability—social, environmental, economic, and cultural—ecosystem sustainability will need to be placed in the global
context. This article focuses on the environmental dimension of sustainability science with a review of remote sensing capabilities for such
applications.
Keywords: Coupled nature and human systems; Ecosystems; Geospatial information; Landscape ecology; Remote sensing; Sustainability;
Sustainability indicators
REMS: 10428
To protect the rights of the author(s) and publisher we inform you that this PDF is an uncorrected proof for internal business use only by the author(s), editor(s), reviewer(s), Elsevier andtypesetter SPi. It is not allowed to publish this proof online or in print. This proof copy is the copyright property of the publisher and is confidential until formal publication.
These proofs may contain colour figures. Those figures may print black and white in the final printed book if a colour print product has not been planned. The colour figures will appear incolour in all electronic versions of this book.
Related Documents