Colloids and Surfaces A: Physicochem. Eng. Aspects 389 (2011) 291–298 Contents lists available at ScienceDirect Colloids and Surfaces A: Physicochemical and Engineering Aspects jo ur nal homep a ge: www.elsevier.com/locate/colsurfa Removal of oil from oil-in-water emulsion using a packed bed of commercial resin Soumitra Maiti ∗,1 , I.M. Mishra ∗ , S.D. Bhattacharya, J.K. Joshi 2 Department of Chemical Engineering, Indian Institute of Technology, Roorkee, Roorkee 247667, Uttarakhand, India a r t i c l e i n f o Article history: Received 28 June 2010 Received in revised form 27 July 2011 Accepted 31 July 2011 Available online 5 August 2011 Keywords: o/w Emulsion Emulsion stability Coalescence Coalescer bed Droplet size distribution SEM FTIR Zeta potential a b s t r a c t The present study reports the removal of oil from oil-in-water (o/w) emulsion using a commercial resin which is a co-polymer of styrene and di-vinyl benzene. The stability of the 0.05% (w/w) o/w emulsion was investigated for different surfactant concentrations (0.25–4%), mixing time (5–60 min) and stirring rate (500–2500 rpm). The emulsion stability was estimated by measuring the relative volume of emulsion after 24 h of the preparation of emulsion and the zeta potential. 1% of surfactant, 18 min of mixing time and 2000 rpm stirring were found to be the optimum conditions for the most stable emulsions. A series of experiments were performed to investigate the effect of such parameters as influent oil concentration (30–500 mg/dm 3 ), bed height (30–100 mm) and flow rate (10–20 dm 3 /h) on the oil removal efficiency of the resin. More than 89% of emulsified oil was removed under optimal operating conditions: 10 dm 3 /h flow velocity, 75 mm bed height, and 500 mg/dm 3 influent concentration of oil in the o/w emulsion. SEM and FTIR results indicate that the hydrogen bonding and hydrophilic interaction were the principal driving forces for the adhesion of oil onto the polymeric resin surfaces. The results indicated that the resin is very effective in removing oil from o/w emulsion. © 2011 Elsevier B.V. All rights reserved. 1. Introduction The presence of oil in wastewater is a major concern in a number of industries such as food industry, petroleum refinery, vegetable oil and hydrogenated oil manufacturing, petrochemical industry, metal processing, and metallurgical industries. Oil contamination is generally of two types: immiscible mixture and miscible solution. Immiscible mixture may be in the form of free oil or emulsions – which may be unstable or stable emulsion. Stable oil-in-water (o/w) or water-in-oil (w/o) emulsions and miscible solutions are very difficult to be treated for removing oil or water, as the case may be, from one another. Oil emulsions are deleterious to envi- ronment as they impede penetration of sunlight and absorption of oxygen from air by the water bodies contaminated by oil, and in many cases are toxic to the aquatic life. Because of these reasons, the Ministry of Environment and Forests, Government of India has prescribed the discharge wastewater quality with oil concentration not exceeding 5 mg/dm 3 [1]. Chinese government has also set the discharge limit for mineral oil as 5 mg/dm 3 onto groundwater [2]. ∗ Corresponding authors. E-mail addresses: [email protected] (S. Maiti), [email protected] (I.M. Mishra). 1 CSIR-Central Building Research Institute, Roorkee, India. Tel.: +91 9760197534. 2 Head, Environmental Division, Engineers India Limited, R&D Center, Sector 16, Gurgaon, India. Since the concentration of oil in water, either in miscible or immis- cible form, generally is very large in wastewater emanating from the petroleum refineries, metal processing and vegetable oil pro- cessing industries, it is necessary to use such treatment methods as are capable of reducing oil concentration in wastewater to less than 5 mg/dm 3 . Immiscible oil in water is generally in free form or unstable dispersed form. However, both o/w and w/o, emulsions are very dif- ficult to deal with as they are in stable form, finely dispersed in the mixture, and the presence of a surfactant and co-surfactant makes them more difficult to treat. These wastewaters generally have interfacial films and electrostatic repulsion forces operating on fine droplets to sustain emulsion stability [3]. O/w emulsion stability with respect to film/layer formation and coalescence/aggregation of the droplets and the rheology of the aqueous dispersion medium are very important aspects in the emulsion treatment. The droplet size distribution is determined mainly by the amount of the surfac- tants and the energy expended during emulsification [4]. Conventional oil removal methods which include such methods as gravity separation and tilted plate interception (TPI), API separa- tor, floatation and chemical coagulation do not meet the statutory requirements of oil concentration in the treated water. Common commercial methods used for de-emulsification and oil removal are chemical–physical, viz. first chemical de-emulsification and then air flotation or gravity separation [5,6]. However, such methods suffer from the use of costly chemicals and the problem of han- dling and disposal of large volume of sludge. Physico-chemical 0927-7757/$ – see front matter © 2011 Elsevier B.V. All rights reserved. doi:10.1016/j.colsurfa.2011.07.041

Welcome message from author
This document is posted to help you gain knowledge. Please leave a comment to let me know what you think about it! Share it to your friends and learn new things together.
Transcript
Rr
SD
a
ARRAA
KoECCDSFZ
1
oomiI–(vmromtpnd
(
G
0d
Colloids and Surfaces A: Physicochem. Eng. Aspects 389 (2011) 291– 298
Contents lists available at ScienceDirect
Colloids and Surfaces A: Physicochemical andEngineering Aspects
jo ur nal homep a ge: www.elsev ier .com/ locate /co lsur fa
emoval of oil from oil-in-water emulsion using a packed bed of commercialesin
oumitra Maiti ∗,1, I.M. Mishra ∗, S.D. Bhattacharya, J.K. Joshi2
epartment of Chemical Engineering, Indian Institute of Technology, Roorkee, Roorkee 247667, Uttarakhand, India
r t i c l e i n f o
rticle history:eceived 28 June 2010eceived in revised form 27 July 2011ccepted 31 July 2011vailable online 5 August 2011
eywords:/w Emulsion
a b s t r a c t
The present study reports the removal of oil from oil-in-water (o/w) emulsion using a commercial resinwhich is a co-polymer of styrene and di-vinyl benzene. The stability of the 0.05% (w/w) o/w emulsion wasinvestigated for different surfactant concentrations (0.25–4%), mixing time (5–60 min) and stirring rate(500–2500 rpm). The emulsion stability was estimated by measuring the relative volume of emulsionafter 24 h of the preparation of emulsion and the zeta potential. 1% of surfactant, 18 min of mixing timeand 2000 rpm stirring were found to be the optimum conditions for the most stable emulsions. A seriesof experiments were performed to investigate the effect of such parameters as influent oil concentration
3 3
mulsion stabilityoalescenceoalescer bedroplet size distributionEMTIR(30–500 mg/dm ), bed height (30–100 mm) and flow rate (10–20 dm /h) on the oil removal efficiency ofthe resin. More than 89% of emulsified oil was removed under optimal operating conditions: 10 dm3/hflow velocity, 75 mm bed height, and 500 mg/dm3 influent concentration of oil in the o/w emulsion.SEM and FTIR results indicate that the hydrogen bonding and hydrophilic interaction were the principaldriving forces for the adhesion of oil onto the polymeric resin surfaces. The results indicated that the
emov
eta potentialresin is very effective in r
. Introduction
The presence of oil in wastewater is a major concern in a numberf industries such as food industry, petroleum refinery, vegetableil and hydrogenated oil manufacturing, petrochemical industry,etal processing, and metallurgical industries. Oil contamination
s generally of two types: immiscible mixture and miscible solution.mmiscible mixture may be in the form of free oil or emulsions
which may be unstable or stable emulsion. Stable oil-in-watero/w) or water-in-oil (w/o) emulsions and miscible solutions areery difficult to be treated for removing oil or water, as the caseay be, from one another. Oil emulsions are deleterious to envi-
onment as they impede penetration of sunlight and absorption ofxygen from air by the water bodies contaminated by oil, and inany cases are toxic to the aquatic life. Because of these reasons,
he Ministry of Environment and Forests, Government of India has
rescribed the discharge wastewater quality with oil concentrationot exceeding 5 mg/dm3 [1]. Chinese government has also set theischarge limit for mineral oil as 5 mg/dm3 onto groundwater [2].∗ Corresponding authors.E-mail addresses: [email protected] (S. Maiti), [email protected]
I.M. Mishra).1 CSIR-Central Building Research Institute, Roorkee, India. Tel.: +91 9760197534.2 Head, Environmental Division, Engineers India Limited, R&D Center, Sector 16,urgaon, India.
927-7757/$ – see front matter © 2011 Elsevier B.V. All rights reserved.oi:10.1016/j.colsurfa.2011.07.041
ing oil from o/w emulsion.© 2011 Elsevier B.V. All rights reserved.
Since the concentration of oil in water, either in miscible or immis-cible form, generally is very large in wastewater emanating fromthe petroleum refineries, metal processing and vegetable oil pro-cessing industries, it is necessary to use such treatment methodsas are capable of reducing oil concentration in wastewater to lessthan 5 mg/dm3.
Immiscible oil in water is generally in free form or unstabledispersed form. However, both o/w and w/o, emulsions are very dif-ficult to deal with as they are in stable form, finely dispersed in themixture, and the presence of a surfactant and co-surfactant makesthem more difficult to treat. These wastewaters generally haveinterfacial films and electrostatic repulsion forces operating on finedroplets to sustain emulsion stability [3]. O/w emulsion stabilitywith respect to film/layer formation and coalescence/aggregationof the droplets and the rheology of the aqueous dispersion mediumare very important aspects in the emulsion treatment. The dropletsize distribution is determined mainly by the amount of the surfac-tants and the energy expended during emulsification [4].
Conventional oil removal methods which include such methodsas gravity separation and tilted plate interception (TPI), API separa-tor, floatation and chemical coagulation do not meet the statutoryrequirements of oil concentration in the treated water. Commoncommercial methods used for de-emulsification and oil removal are
chemical–physical, viz. first chemical de-emulsification and thenair flotation or gravity separation [5,6]. However, such methodssuffer from the use of costly chemicals and the problem of han-dling and disposal of large volume of sludge. Physico-chemical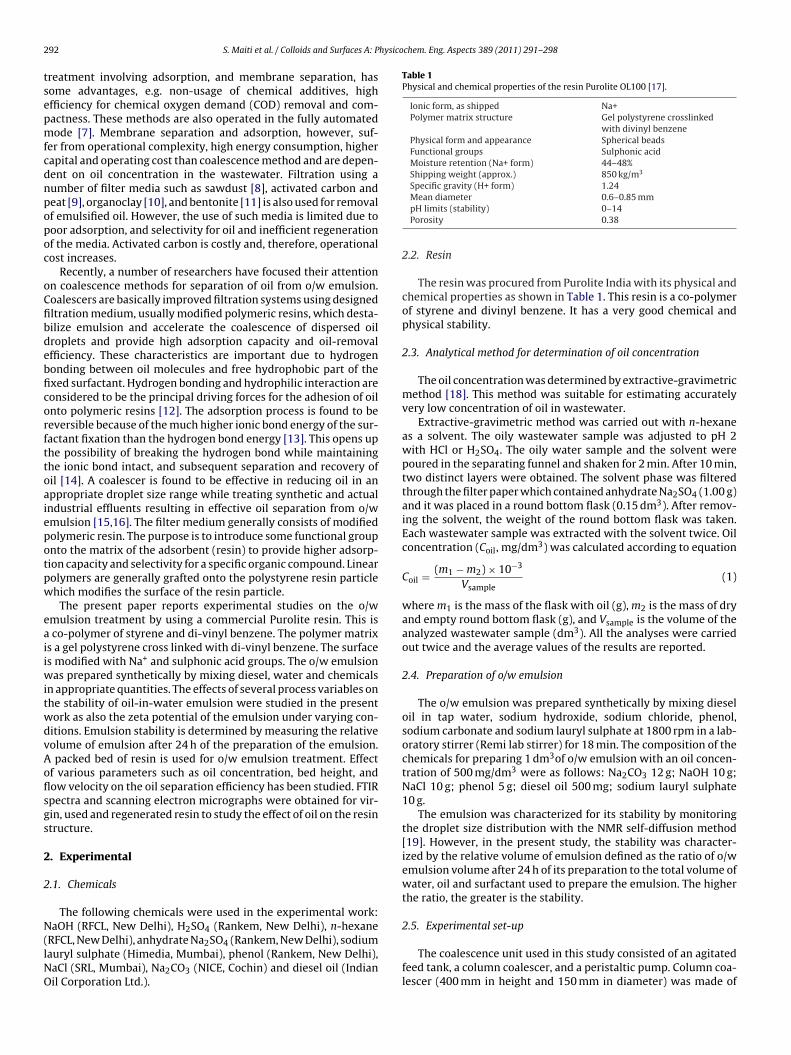
2 hysicochem. Eng. Aspects 389 (2011) 291– 298
tsepmfcdnpopoc
oCfibdebficorfttoaiepotpw
eaiiwitwdvAoflsgs
2
2
N(lNO
Table 1Physical and chemical properties of the resin Purolite OL100 [17].
Ionic form, as shipped Na+Polymer matrix structure Gel polystyrene crosslinked
with divinyl benzenePhysical form and appearance Spherical beadsFunctional groups Sulphonic acidMoisture retention (Na+ form) 44–48%Shipping weight (approx.) 850 kg/m3
Specific gravity (H+ form) 1.24
92 S. Maiti et al. / Colloids and Surfaces A: P
reatment involving adsorption, and membrane separation, hasome advantages, e.g. non-usage of chemical additives, highfficiency for chemical oxygen demand (COD) removal and com-actness. These methods are also operated in the fully automatedode [7]. Membrane separation and adsorption, however, suf-
er from operational complexity, high energy consumption, higherapital and operating cost than coalescence method and are depen-ent on oil concentration in the wastewater. Filtration using aumber of filter media such as sawdust [8], activated carbon andeat [9], organoclay [10], and bentonite [11] is also used for removalf emulsified oil. However, the use of such media is limited due tooor adsorption, and selectivity for oil and inefficient regenerationf the media. Activated carbon is costly and, therefore, operationalost increases.
Recently, a number of researchers have focused their attentionn coalescence methods for separation of oil from o/w emulsion.oalescers are basically improved filtration systems using designedltration medium, usually modified polymeric resins, which desta-ilize emulsion and accelerate the coalescence of dispersed oilroplets and provide high adsorption capacity and oil-removalfficiency. These characteristics are important due to hydrogenonding between oil molecules and free hydrophobic part of thexed surfactant. Hydrogen bonding and hydrophilic interaction areonsidered to be the principal driving forces for the adhesion of oilnto polymeric resins [12]. The adsorption process is found to beeversible because of the much higher ionic bond energy of the sur-actant fixation than the hydrogen bond energy [13]. This opens uphe possibility of breaking the hydrogen bond while maintaininghe ionic bond intact, and subsequent separation and recovery ofil [14]. A coalescer is found to be effective in reducing oil in anppropriate droplet size range while treating synthetic and actualndustrial effluents resulting in effective oil separation from o/wmulsion [15,16]. The filter medium generally consists of modifiedolymeric resin. The purpose is to introduce some functional groupnto the matrix of the adsorbent (resin) to provide higher adsorp-ion capacity and selectivity for a specific organic compound. Linearolymers are generally grafted onto the polystyrene resin particlehich modifies the surface of the resin particle.
The present paper reports experimental studies on the o/wmulsion treatment by using a commercial Purolite resin. This is
co-polymer of styrene and di-vinyl benzene. The polymer matrixs a gel polystyrene cross linked with di-vinyl benzene. The surfaces modified with Na+ and sulphonic acid groups. The o/w emulsion
as prepared synthetically by mixing diesel, water and chemicalsn appropriate quantities. The effects of several process variables onhe stability of oil-in-water emulsion were studied in the presentork as also the zeta potential of the emulsion under varying con-itions. Emulsion stability is determined by measuring the relativeolume of emulsion after 24 h of the preparation of the emulsion.
packed bed of resin is used for o/w emulsion treatment. Effectf various parameters such as oil concentration, bed height, andow velocity on the oil separation efficiency has been studied. FTIRpectra and scanning electron micrographs were obtained for vir-in, used and regenerated resin to study the effect of oil on the resintructure.
. Experimental
.1. Chemicals
The following chemicals were used in the experimental work:aOH (RFCL, New Delhi), H2SO4 (Rankem, New Delhi), n-hexane
RFCL, New Delhi), anhydrate Na2SO4 (Rankem, New Delhi), sodiumauryl sulphate (Himedia, Mumbai), phenol (Rankem, New Delhi),aCl (SRL, Mumbai), Na2CO3 (NICE, Cochin) and diesel oil (Indianil Corporation Ltd.).
Mean diameter 0.6–0.85 mmpH limits (stability) 0–14Porosity 0.38
2.2. Resin
The resin was procured from Purolite India with its physical andchemical properties as shown in Table 1. This resin is a co-polymerof styrene and divinyl benzene. It has a very good chemical andphysical stability.
2.3. Analytical method for determination of oil concentration
The oil concentration was determined by extractive-gravimetricmethod [18]. This method was suitable for estimating accuratelyvery low concentration of oil in wastewater.
Extractive-gravimetric method was carried out with n-hexaneas a solvent. The oily wastewater sample was adjusted to pH 2with HCl or H2SO4. The oily water sample and the solvent werepoured in the separating funnel and shaken for 2 min. After 10 min,two distinct layers were obtained. The solvent phase was filteredthrough the filter paper which contained anhydrate Na2SO4 (1.00 g)and it was placed in a round bottom flask (0.15 dm3). After remov-ing the solvent, the weight of the round bottom flask was taken.Each wastewater sample was extracted with the solvent twice. Oilconcentration (Coil, mg/dm3) was calculated according to equation
Coil = (m1 − m2) × 10−3
Vsample(1)
where m1 is the mass of the flask with oil (g), m2 is the mass of dryand empty round bottom flask (g), and Vsample is the volume of theanalyzed wastewater sample (dm3). All the analyses were carriedout twice and the average values of the results are reported.
2.4. Preparation of o/w emulsion
The o/w emulsion was prepared synthetically by mixing dieseloil in tap water, sodium hydroxide, sodium chloride, phenol,sodium carbonate and sodium lauryl sulphate at 1800 rpm in a lab-oratory stirrer (Remi lab stirrer) for 18 min. The composition of thechemicals for preparing 1 dm3of o/w emulsion with an oil concen-tration of 500 mg/dm3 were as follows: Na2CO3 12 g; NaOH 10 g;NaCl 10 g; phenol 5 g; diesel oil 500 mg; sodium lauryl sulphate10 g.
The emulsion was characterized for its stability by monitoringthe droplet size distribution with the NMR self-diffusion method[19]. However, in the present study, the stability was character-ized by the relative volume of emulsion defined as the ratio of o/wemulsion volume after 24 h of its preparation to the total volume ofwater, oil and surfactant used to prepare the emulsion. The higherthe ratio, the greater is the stability.
2.5. Experimental set-up
The coalescence unit used in this study consisted of an agitatedfeed tank, a column coalescer, and a peristaltic pump. Column coa-lescer (400 mm in height and 150 mm in diameter) was made of
S. Maiti et al. / Colloids and Surfaces A: Physicochem. Eng. Aspects 389 (2011) 291– 298 293
Fp
tsh(s
prtlvcffc
s
E
Ee(
a
2
iTm
blofatiw
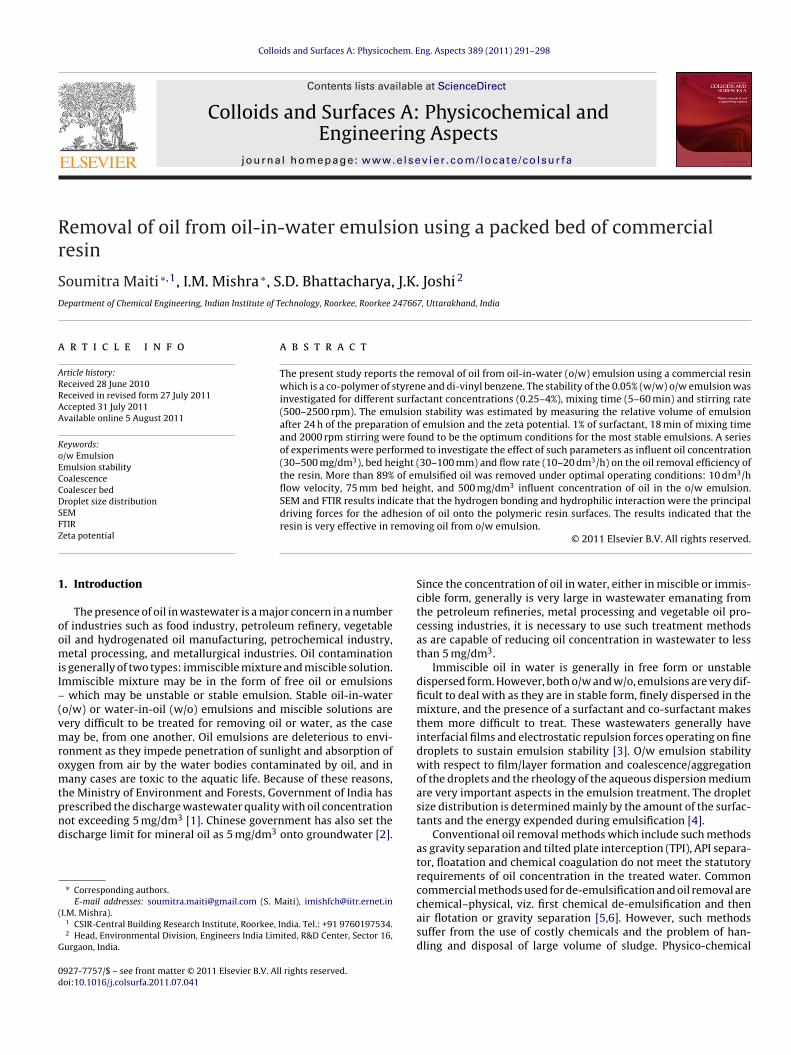
ig. 1. Schematic diagram of experimental set-up: (1) Stirrer, (2) mixing vessel, (3)eristaltic pump, (4) inlet of emulsion, (5) resin bed, and (6) manometer.
ransparent acrylic pipe and flanges of acrylic sheet. It had threeections of equal diameter of 150 mm inlet section (130 mm ineight), coalescer section (120 mm in height), and the outlet section150 mm in height). The schematic diagram of the experimentalet-up is shown in Fig. 1.
The emulsion was introduced into the coalescer by a peristalticump. In the coalescer micro-droplets of oil were captured by theesin bed forming an oil film around the resin beads (spherical par-icles). Continuous film drainage occurs in the resin bed and thearge droplets of oil are sheared off at the exit face by the upwardelocity of the emulsion. The large oil droplets rise to the top of theoalescer column. The oil droplets collapse at the top of the unit toorm a separated layer of oil which was discharged continuouslyrom the side outlet at the top. The treated water was taken offontinuously at a lower level through a side outlet.
The removal efficiency of the coalescer was determined by mea-uring the initial and final concentrations of oil in water.
= Ci − Co
Ci× 100 (2)
= oil removal efficiency (%), Ci = oil concentration in the influ-nt stream (mg/dm3), Co = oil concentration in the effluent streammg/dm3).
All the experiments were carried out in duplicate and the aver-ge values of the results are reported.
.6. Fourier transform infrared (FTIR) spectroscopy
Fourier transformed infrared (FTIR) spectroscopy is useful indentifying chemicals that are either organic or inorganic in nature.he IR spectrum represents the molecular absorption and trans-ission, creating a molecular fingerprint of the sample.For the analysis of liquid sample, one drop of the sample was put
etween two plates and then optical scan was done with a wave-ength in the scan range from 400 to 4000 cm−1. For the analysisf resin, the resins were milled with potassium bromide (KBr) toorm a very fine powder. This powder was then compressed into
thin pellet which can be analyzed. After that, pellet was put into
he optical scan system. KBr is used as a carrier as it is transparentn the IR region. The FTIR instrument (Thermo model AVATR 370)as used for this purpose.
Fig. 2. Effect of surfactant concentration on emulsion stability.
2.7. Scanning electron microscopy (SEM)
The SEM micrographs were obtained using a LEO electron micro-scope. SEM analysis was done for observing the change in surfacestructure of the resin during the experiment. The resin used inthis study is non-conductive in nature and therefore, it was goldsputtered so as to make it conductive.
2.8. Zeta potential
The zeta potential of the o/w emulsion was measured by using azetasizer (Malvern Nano ZS90) having a disposable folded capillarycell made of polystyrene. The capillary cell was filled with the o/wemulsion and then placed inside the instrument for measuring thezeta potential.
3. Results and discussion
The most important task in the preparation of o/w emulsion isthe selection of a suitable surfactant which will satisfactorily emul-sify the ingredients at a given temperature. For preparing a stableemulsion the emulsifier has to be chosen in such a way that thehydrophile–lipophile balance (HLB) of the emulsifier and the emul-sified mixture are nearly the same. Sodium lauryl sulphate was usedas an emulsifier because of the fact that its HLB is very close to thatof diesel oil. The stability of o/w emulsion is defined as the resis-tance of the dispersed oil droplets against coalescence. The effectsof various process variables on the stability of o/w emulsion werestudied as described in the following sections.
3.1. Effect of surfactant concentration on emulsion stability
The stability of emulsion depends largely on the concentra-tion of the surfactant. It was observed that with an increase in thesurfactant concentration up to a certain concentration, the stabil-ity of emulsion increases. Thereafter, the stability of the emulsionstarts decreasing. The concentration at which the emulsion sta-bility is found to be maximum is called the optimal surfactantconcentration. Fig. 2 shows that as the concentration of the sur-factant increases from 0.25% to 1%, the stability of the emulsionincreases from 86% to 93%. The surfactant is preferentially absorbedat the interface, and a tough film is formed which prevents thecoalescence of oil droplets. But as the concentration of the surfac-tant is increased further, the emulsion stability decreased due torapid coalescence of the oil droplets. Thus, the optimum emulsifierdosage for this system was found to be 1%.
3.2. Effect of agitation on emulsion stability
During emulsification, the interfacial area between two liquidphases increases. The liquids tend to minimize this surface areaand, therefore, mechanical energy is required for emulsification to
294 S. Maiti et al. / Colloids and Surfaces A: Physico
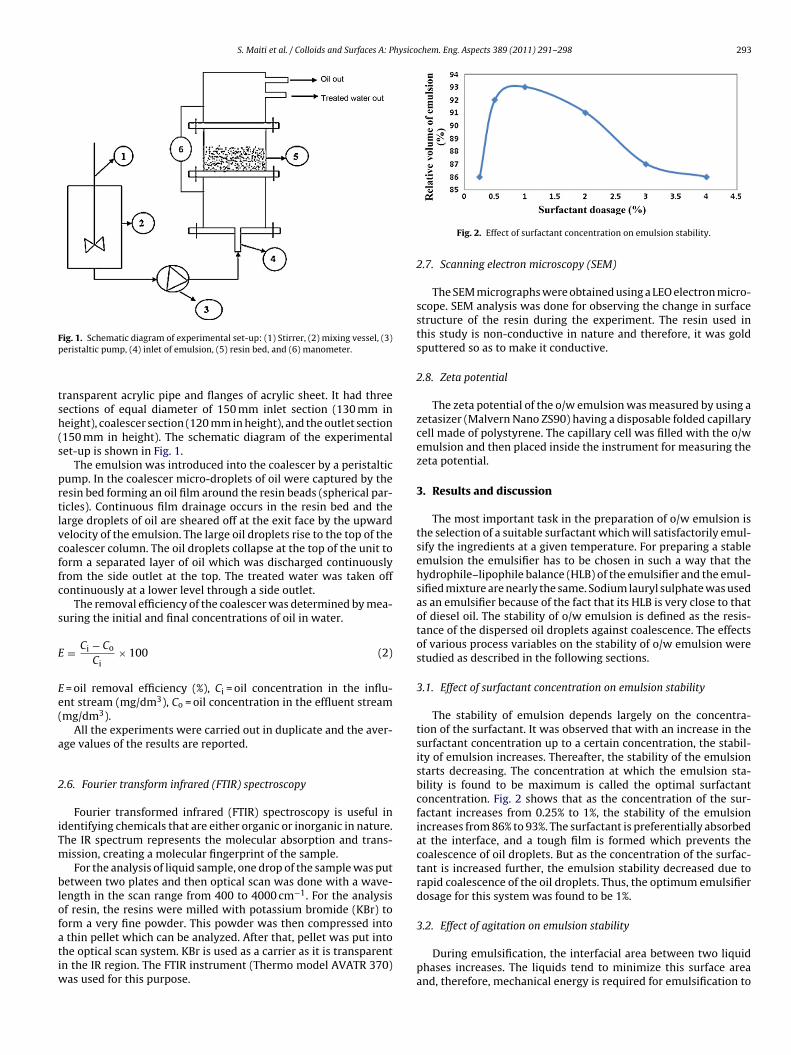
Fig. 3. Effect of stirring intensity on emulsion stability.
ptmib1wui
3
ttsvsami
After the preparation of a stable o/w emulsion, this emulsion
Fig. 4. Effect of mixing time on emulsion stability.
roceed. This mechanical energy is supplied by the agitation. Theype and severity of agitation applied to oil in water mixture deter-
ine the oil droplet size. Higher the turbulence and shearing actionn a system, the smaller will be the oil droplets and more stable wille the emulsion. Fig. 3 shows the relative volume of emulsion after8 min of stirring and settling for 24 h versus stirring intensity. Itas found that from 500 rpm to 2000 rpm stirring the relative vol-me of the emulsion increased rapidly and after that the increase
n the relative volume is very slow and gradual.
.3. Effect of mixing time on emulsification
Mixing time is one of the most important factors to determinehe stability of o/w emulsion. With an increase in the mixing time,he size of the oil droplets decreases, thereby stabilizing the emul-ion. As mixing time increases from 5 min to 20 min, the relativeolume of emulsion also increases from 79% to 95% (Fig. 4). Thetability remains almost constant from 20 min to 30 min and there-
fter decreases slowly with an increase in mixing time. Excessiveixing time causes the emulsifier to drop out from the oil waternterface as a result of which emulsion volume decreases.
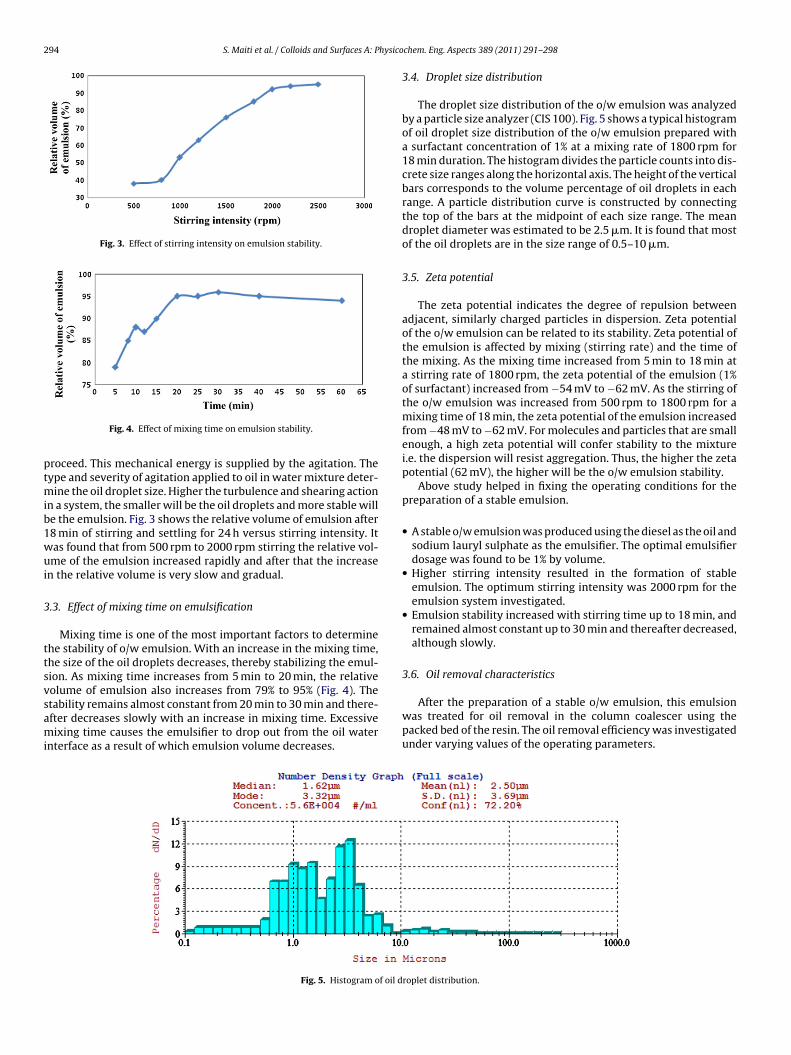
Fig. 5. Histogram of oil d
chem. Eng. Aspects 389 (2011) 291– 298
3.4. Droplet size distribution
The droplet size distribution of the o/w emulsion was analyzedby a particle size analyzer (CIS 100). Fig. 5 shows a typical histogramof oil droplet size distribution of the o/w emulsion prepared witha surfactant concentration of 1% at a mixing rate of 1800 rpm for18 min duration. The histogram divides the particle counts into dis-crete size ranges along the horizontal axis. The height of the verticalbars corresponds to the volume percentage of oil droplets in eachrange. A particle distribution curve is constructed by connectingthe top of the bars at the midpoint of each size range. The meandroplet diameter was estimated to be 2.5 �m. It is found that mostof the oil droplets are in the size range of 0.5–10 �m.
3.5. Zeta potential
The zeta potential indicates the degree of repulsion betweenadjacent, similarly charged particles in dispersion. Zeta potentialof the o/w emulsion can be related to its stability. Zeta potential ofthe emulsion is affected by mixing (stirring rate) and the time ofthe mixing. As the mixing time increased from 5 min to 18 min ata stirring rate of 1800 rpm, the zeta potential of the emulsion (1%of surfactant) increased from −54 mV to −62 mV. As the stirring ofthe o/w emulsion was increased from 500 rpm to 1800 rpm for amixing time of 18 min, the zeta potential of the emulsion increasedfrom −48 mV to −62 mV. For molecules and particles that are smallenough, a high zeta potential will confer stability to the mixturei.e. the dispersion will resist aggregation. Thus, the higher the zetapotential (62 mV), the higher will be the o/w emulsion stability.
Above study helped in fixing the operating conditions for thepreparation of a stable emulsion.
• A stable o/w emulsion was produced using the diesel as the oil andsodium lauryl sulphate as the emulsifier. The optimal emulsifierdosage was found to be 1% by volume.
• Higher stirring intensity resulted in the formation of stableemulsion. The optimum stirring intensity was 2000 rpm for theemulsion system investigated.
• Emulsion stability increased with stirring time up to 18 min, andremained almost constant up to 30 min and thereafter decreased,although slowly.
3.6. Oil removal characteristics
was treated for oil removal in the column coalescer using thepacked bed of the resin. The oil removal efficiency was investigatedunder varying values of the operating parameters.
roplet distribution.
S. Maiti et al. / Colloids and Surfaces A: Physicochem. Eng. Aspects 389 (2011) 291– 298 295
3
Fmtasvisalgosmcc
3t
pliaotg
3
oorjgatoPm
erated resin. The SEM micrograph of virgin resin (Fig. 9(A)) shows asingle phase polymeric matrix with some impurities present overthe surface layer. The resin material is composed of hydrophobic
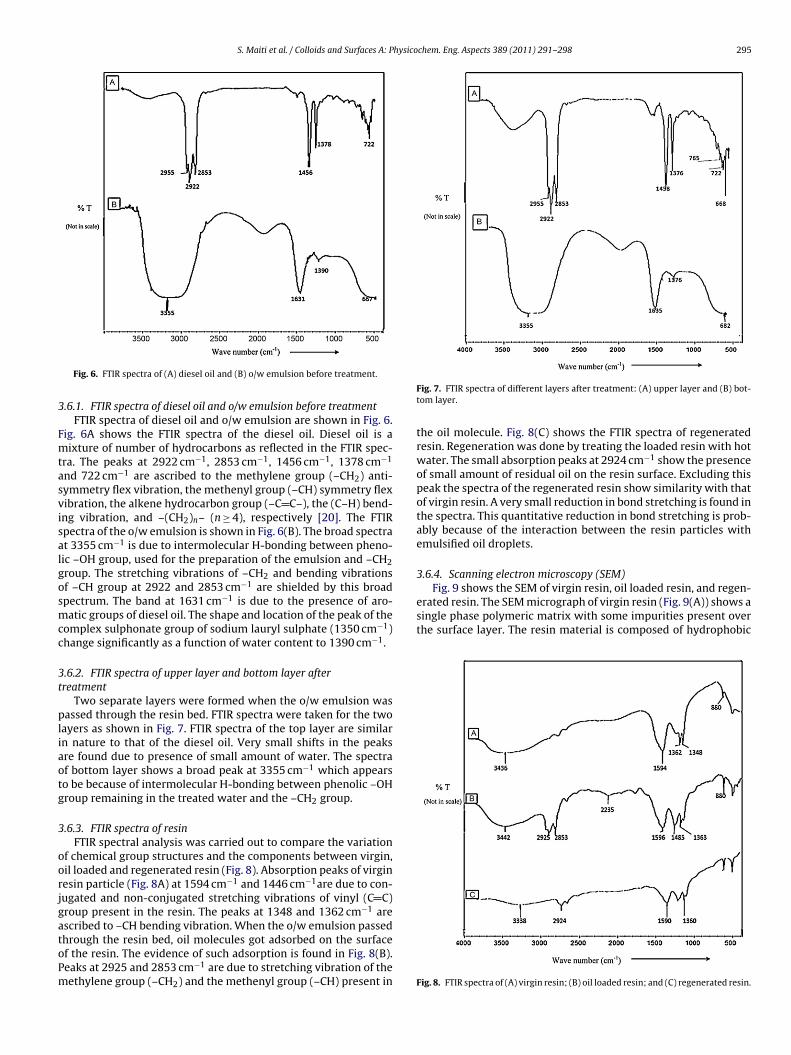
Fig. 6. FTIR spectra of (A) diesel oil and (B) o/w emulsion before treatment.
.6.1. FTIR spectra of diesel oil and o/w emulsion before treatmentFTIR spectra of diesel oil and o/w emulsion are shown in Fig. 6.
ig. 6A shows the FTIR spectra of the diesel oil. Diesel oil is aixture of number of hydrocarbons as reflected in the FTIR spec-
ra. The peaks at 2922 cm−1, 2853 cm−1, 1456 cm−1, 1378 cm−1
nd 722 cm−1 are ascribed to the methylene group (–CH2) anti-ymmetry flex vibration, the methenyl group (–CH) symmetry flexibration, the alkene hydrocarbon group (–C C–), the (C–H) bend-ng vibration, and –(CH2)n– (n ≥ 4), respectively [20]. The FTIRpectra of the o/w emulsion is shown in Fig. 6(B). The broad spectrat 3355 cm−1 is due to intermolecular H-bonding between pheno-ic –OH group, used for the preparation of the emulsion and –CH2roup. The stretching vibrations of –CH2 and bending vibrationsf –CH group at 2922 and 2853 cm−1 are shielded by this broadpectrum. The band at 1631 cm−1 is due to the presence of aro-atic groups of diesel oil. The shape and location of the peak of the
omplex sulphonate group of sodium lauryl sulphate (1350 cm−1)hange significantly as a function of water content to 1390 cm−1.
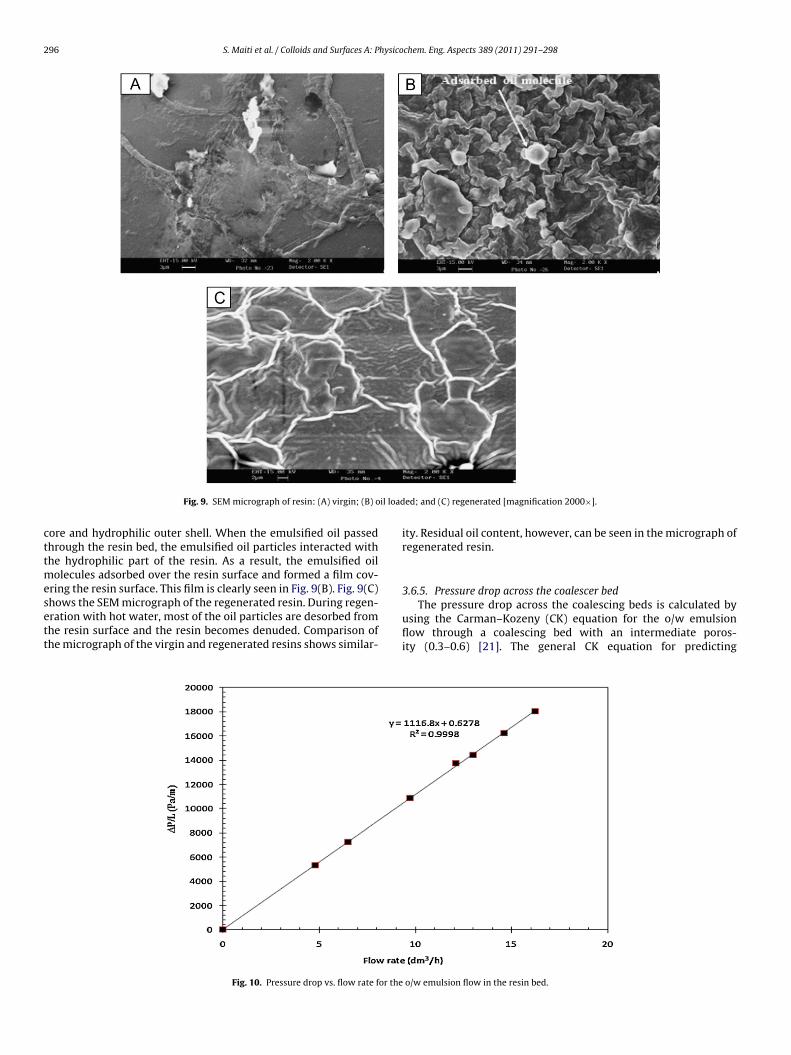
.6.2. FTIR spectra of upper layer and bottom layer afterreatment
Two separate layers were formed when the o/w emulsion wasassed through the resin bed. FTIR spectra were taken for the two
ayers as shown in Fig. 7. FTIR spectra of the top layer are similarn nature to that of the diesel oil. Very small shifts in the peaksre found due to presence of small amount of water. The spectraf bottom layer shows a broad peak at 3355 cm−1 which appearso be because of intermolecular H-bonding between phenolic –OHroup remaining in the treated water and the –CH2 group.
.6.3. FTIR spectra of resinFTIR spectral analysis was carried out to compare the variation
f chemical group structures and the components between virgin,il loaded and regenerated resin (Fig. 8). Absorption peaks of virginesin particle (Fig. 8A) at 1594 cm−1 and 1446 cm−1are due to con-ugated and non-conjugated stretching vibrations of vinyl (C C)roup present in the resin. The peaks at 1348 and 1362 cm−1 arescribed to –CH bending vibration. When the o/w emulsion passed
hrough the resin bed, oil molecules got adsorbed on the surfacef the resin. The evidence of such adsorption is found in Fig. 8(B).eaks at 2925 and 2853 cm−1 are due to stretching vibration of theethylene group (–CH2) and the methenyl group (–CH) present inFig. 7. FTIR spectra of different layers after treatment: (A) upper layer and (B) bot-tom layer.
the oil molecule. Fig. 8(C) shows the FTIR spectra of regeneratedresin. Regeneration was done by treating the loaded resin with hotwater. The small absorption peaks at 2924 cm−1 show the presenceof small amount of residual oil on the resin surface. Excluding thispeak the spectra of the regenerated resin show similarity with thatof virgin resin. A very small reduction in bond stretching is found inthe spectra. This quantitative reduction in bond stretching is prob-ably because of the interaction between the resin particles withemulsified oil droplets.
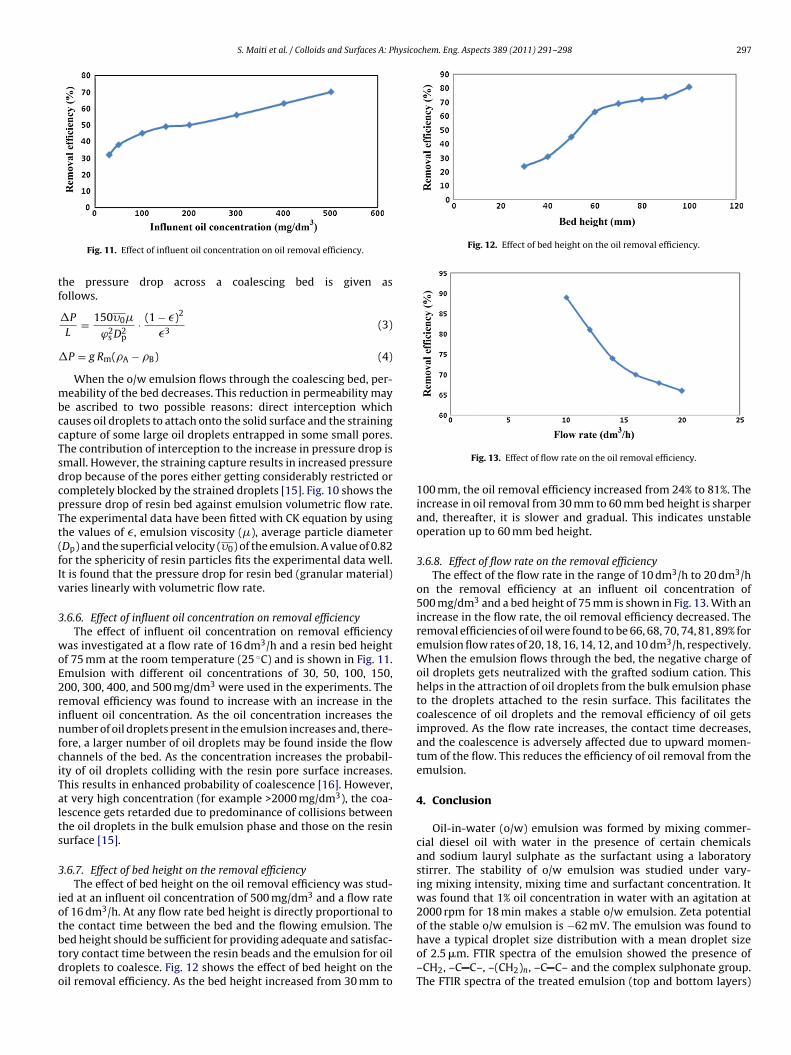
3.6.4. Scanning electron microscopy (SEM)Fig. 9 shows the SEM of virgin resin, oil loaded resin, and regen-
Fig. 8. FTIR spectra of (A) virgin resin; (B) oil loaded resin; and (C) regenerated resin.
296 S. Maiti et al. / Colloids and Surfaces A: Physicochem. Eng. Aspects 389 (2011) 291– 298
il load
cttmesett
Fig. 9. SEM micrograph of resin: (A) virgin; (B) o
ore and hydrophilic outer shell. When the emulsified oil passedhrough the resin bed, the emulsified oil particles interacted withhe hydrophilic part of the resin. As a result, the emulsified oil
olecules adsorbed over the resin surface and formed a film cov-ring the resin surface. This film is clearly seen in Fig. 9(B). Fig. 9(C)
hows the SEM micrograph of the regenerated resin. During regen-ration with hot water, most of the oil particles are desorbed fromhe resin surface and the resin becomes denuded. Comparison ofhe micrograph of the virgin and regenerated resins shows similar-Fig. 10. Pressure drop vs. flow rate for the
ed; and (C) regenerated [magnification 2000×].
ity. Residual oil content, however, can be seen in the micrograph ofregenerated resin.
3.6.5. Pressure drop across the coalescer bed
The pressure drop across the coalescing beds is calculated byusing the Carman–Kozeny (CK) equation for the o/w emulsionflow through a coalescing bed with an intermediate poros-ity (0.3–0.6) [21]. The general CK equation for predicting
o/w emulsion flow in the resin bed.
S. Maiti et al. / Colloids and Surfaces A: Physicochem. Eng. Aspects 389 (2011) 291– 298 297
tf
�
mbccTsdcpTt(fIv
3
woE2rinfciTalts
3
iotbtdo
Fig. 12. Effect of bed height on the oil removal efficiency.
Fig. 11. Effect of influent oil concentration on oil removal efficiency.he pressure drop across a coalescing bed is given asollows.
�P
L= 150�0�
ϕ2s D2
p· (1 − �)2
�3(3)
P = g Rm(�A − �B) (4)
When the o/w emulsion flows through the coalescing bed, per-eability of the bed decreases. This reduction in permeability may
e ascribed to two possible reasons: direct interception whichauses oil droplets to attach onto the solid surface and the strainingapture of some large oil droplets entrapped in some small pores.he contribution of interception to the increase in pressure drop ismall. However, the straining capture results in increased pressurerop because of the pores either getting considerably restricted orompletely blocked by the strained droplets [15]. Fig. 10 shows theressure drop of resin bed against emulsion volumetric flow rate.he experimental data have been fitted with CK equation by usinghe values of �, emulsion viscosity (�), average particle diameterDp) and the superficial velocity (�0) of the emulsion. A value of 0.82or the sphericity of resin particles fits the experimental data well.t is found that the pressure drop for resin bed (granular material)aries linearly with volumetric flow rate.
.6.6. Effect of influent oil concentration on removal efficiencyThe effect of influent oil concentration on removal efficiency
as investigated at a flow rate of 16 dm3/h and a resin bed heightf 75 mm at the room temperature (25 ◦C) and is shown in Fig. 11.mulsion with different oil concentrations of 30, 50, 100, 150,00, 300, 400, and 500 mg/dm3 were used in the experiments. Theemoval efficiency was found to increase with an increase in thenfluent oil concentration. As the oil concentration increases theumber of oil droplets present in the emulsion increases and, there-
ore, a larger number of oil droplets may be found inside the flowhannels of the bed. As the concentration increases the probabil-ty of oil droplets colliding with the resin pore surface increases.his results in enhanced probability of coalescence [16]. However,t very high concentration (for example >2000 mg/dm3), the coa-escence gets retarded due to predominance of collisions betweenhe oil droplets in the bulk emulsion phase and those on the resinurface [15].
.6.7. Effect of bed height on the removal efficiencyThe effect of bed height on the oil removal efficiency was stud-
ed at an influent oil concentration of 500 mg/dm3 and a flow ratef 16 dm3/h. At any flow rate bed height is directly proportional tohe contact time between the bed and the flowing emulsion. The
ed height should be sufficient for providing adequate and satisfac-ory contact time between the resin beads and the emulsion for oilroplets to coalesce. Fig. 12 shows the effect of bed height on theil removal efficiency. As the bed height increased from 30 mm toFig. 13. Effect of flow rate on the oil removal efficiency.
100 mm, the oil removal efficiency increased from 24% to 81%. Theincrease in oil removal from 30 mm to 60 mm bed height is sharperand, thereafter, it is slower and gradual. This indicates unstableoperation up to 60 mm bed height.
3.6.8. Effect of flow rate on the removal efficiencyThe effect of the flow rate in the range of 10 dm3/h to 20 dm3/h
on the removal efficiency at an influent oil concentration of500 mg/dm3 and a bed height of 75 mm is shown in Fig. 13. With anincrease in the flow rate, the oil removal efficiency decreased. Theremoval efficiencies of oil were found to be 66, 68, 70, 74, 81, 89% foremulsion flow rates of 20, 18, 16, 14, 12, and 10 dm3/h, respectively.When the emulsion flows through the bed, the negative charge ofoil droplets gets neutralized with the grafted sodium cation. Thishelps in the attraction of oil droplets from the bulk emulsion phaseto the droplets attached to the resin surface. This facilitates thecoalescence of oil droplets and the removal efficiency of oil getsimproved. As the flow rate increases, the contact time decreases,and the coalescence is adversely affected due to upward momen-tum of the flow. This reduces the efficiency of oil removal from theemulsion.
4. Conclusion
Oil-in-water (o/w) emulsion was formed by mixing commer-cial diesel oil with water in the presence of certain chemicalsand sodium lauryl sulphate as the surfactant using a laboratorystirrer. The stability of o/w emulsion was studied under vary-ing mixing intensity, mixing time and surfactant concentration. Itwas found that 1% oil concentration in water with an agitation at2000 rpm for 18 min makes a stable o/w emulsion. Zeta potentialof the stable o/w emulsion is −62 mV. The emulsion was found to
have a typical droplet size distribution with a mean droplet sizeof 2.5 �m. FTIR spectra of the emulsion showed the presence of–CH2, –C C–, –(CH2)n, –C C– and the complex sulphonate group.The FTIR spectra of the treated emulsion (top and bottom layers)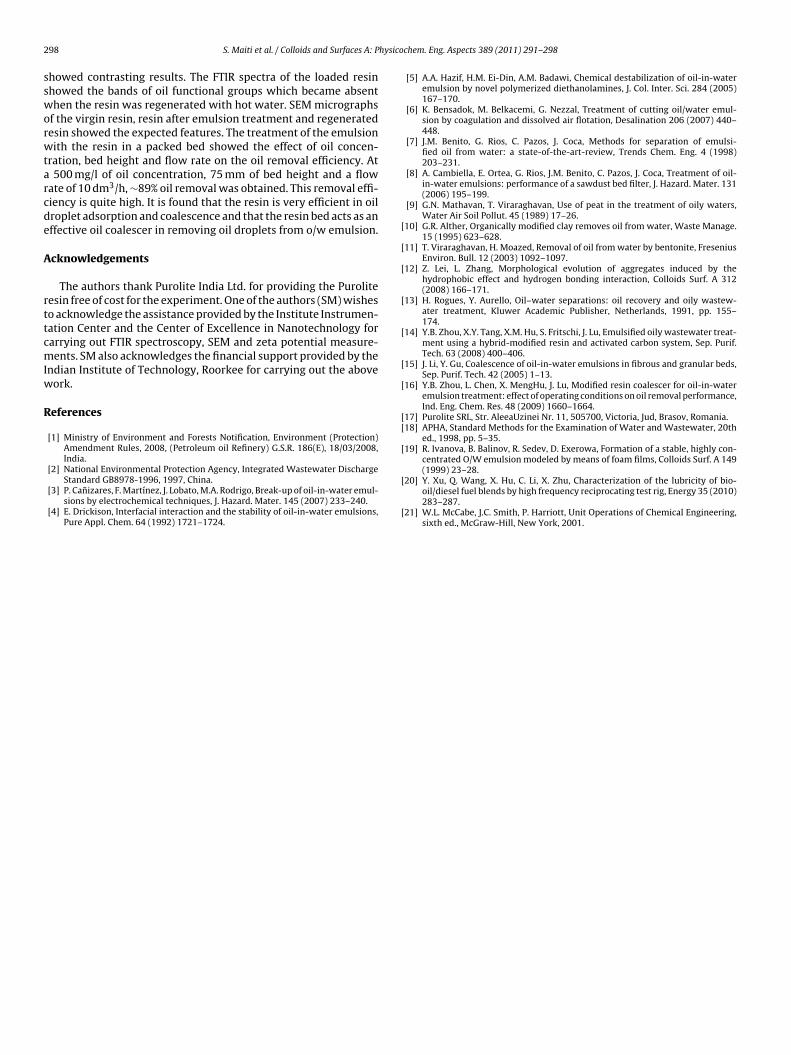
2 hysico
ssworwtarcde
A
rttcmIw
R
[
[
[
[
[
[
[
[[
[
98 S. Maiti et al. / Colloids and Surfaces A: P
howed contrasting results. The FTIR spectra of the loaded resinhowed the bands of oil functional groups which became absenthen the resin was regenerated with hot water. SEM micrographs
f the virgin resin, resin after emulsion treatment and regeneratedesin showed the expected features. The treatment of the emulsionith the resin in a packed bed showed the effect of oil concen-
ration, bed height and flow rate on the oil removal efficiency. At 500 mg/l of oil concentration, 75 mm of bed height and a flowate of 10 dm3/h, ∼89% oil removal was obtained. This removal effi-iency is quite high. It is found that the resin is very efficient in oilroplet adsorption and coalescence and that the resin bed acts as anffective oil coalescer in removing oil droplets from o/w emulsion.
cknowledgements
The authors thank Purolite India Ltd. for providing the Puroliteesin free of cost for the experiment. One of the authors (SM) wisheso acknowledge the assistance provided by the Institute Instrumen-ation Center and the Center of Excellence in Nanotechnology forarrying out FTIR spectroscopy, SEM and zeta potential measure-ents. SM also acknowledges the financial support provided by the
ndian Institute of Technology, Roorkee for carrying out the aboveork.
eferences
[1] Ministry of Environment and Forests Notification, Environment (Protection)Amendment Rules, 2008, (Petroleum oil Refinery) G.S.R. 186(E), 18/03/2008,India.
[2] National Environmental Protection Agency, Integrated Wastewater Discharge
Standard GB8978-1996, 1997, China.[3] P. Canizares, F. Martínez, J. Lobato, M.A. Rodrigo, Break-up of oil-in-water emul-sions by electrochemical techniques, J. Hazard. Mater. 145 (2007) 233–240.
[4] E. Drickison, Interfacial interaction and the stability of oil-in-water emulsions,Pure Appl. Chem. 64 (1992) 1721–1724.
[
[
chem. Eng. Aspects 389 (2011) 291– 298
[5] A.A. Hazif, H.M. Ei-Din, A.M. Badawi, Chemical destabilization of oil-in-wateremulsion by novel polymerized diethanolamines, J. Col. Inter. Sci. 284 (2005)167–170.
[6] K. Bensadok, M. Belkacemi, G. Nezzal, Treatment of cutting oil/water emul-sion by coagulation and dissolved air flotation, Desalination 206 (2007) 440–448.
[7] J.M. Benito, G. Rios, C. Pazos, J. Coca, Methods for separation of emulsi-fied oil from water: a state-of-the-art-review, Trends Chem. Eng. 4 (1998)203–231.
[8] A. Cambiella, E. Ortea, G. Rios, J.M. Benito, C. Pazos, J. Coca, Treatment of oil-in-water emulsions: performance of a sawdust bed filter, J. Hazard. Mater. 131(2006) 195–199.
[9] G.N. Mathavan, T. Viraraghavan, Use of peat in the treatment of oily waters,Water Air Soil Pollut. 45 (1989) 17–26.
10] G.R. Alther, Organically modified clay removes oil from water, Waste Manage.15 (1995) 623–628.
11] T. Viraraghavan, H. Moazed, Removal of oil from water by bentonite, FreseniusEnviron. Bull. 12 (2003) 1092–1097.
12] Z. Lei, L. Zhang, Morphological evolution of aggregates induced by thehydrophobic effect and hydrogen bonding interaction, Colloids Surf. A 312(2008) 166–171.
13] H. Rogues, Y. Aurello, Oil–water separations: oil recovery and oily wastew-ater treatment, Kluwer Academic Publisher, Netherlands, 1991, pp. 155–174.
14] Y.B. Zhou, X.Y. Tang, X.M. Hu, S. Fritschi, J. Lu, Emulsified oily wastewater treat-ment using a hybrid-modified resin and activated carbon system, Sep. Purif.Tech. 63 (2008) 400–406.
15] J. Li, Y. Gu, Coalescence of oil-in-water emulsions in fibrous and granular beds,Sep. Purif. Tech. 42 (2005) 1–13.
16] Y.B. Zhou, L. Chen, X. MengHu, J. Lu, Modified resin coalescer for oil-in-wateremulsion treatment: effect of operating conditions on oil removal performance,Ind. Eng. Chem. Res. 48 (2009) 1660–1664.
17] Purolite SRL, Str. AleeaUzinei Nr. 11, 505700, Victoria, Jud, Brasov, Romania.18] APHA, Standard Methods for the Examination of Water and Wastewater, 20th
ed., 1998, pp. 5–35.19] R. Ivanova, B. Balinov, R. Sedev, D. Exerowa, Formation of a stable, highly con-
centrated O/W emulsion modeled by means of foam films, Colloids Surf. A 149(1999) 23–28.
20] Y. Xu, Q. Wang, X. Hu, C. Li, X. Zhu, Characterization of the lubricity of bio-oil/diesel fuel blends by high frequency reciprocating test rig, Energy 35 (2010)283–287.
21] W.L. McCabe, J.C. Smith, P. Harriott, Unit Operations of Chemical Engineering,sixth ed., McGraw-Hill, New York, 2001.
Related Documents