Citation: Behfar, M.; Heshmati, A.; Mehri, F.; Khaneghah, A.M. Removal of Ochratoxin A from Grape Juice by Clarification: A Response Surface Methodology Study. Foods 2022, 11, 1432. https://doi.org/10.3390/ foods11101432 Academic Editor: Yun Wang Received: 9 April 2022 Accepted: 10 May 2022 Published: 16 May 2022 Publisher’s Note: MDPI stays neutral with regard to jurisdictional claims in published maps and institutional affil- iations. Copyright: © 2022 by the authors. Licensee MDPI, Basel, Switzerland. This article is an open access article distributed under the terms and conditions of the Creative Commons Attribution (CC BY) license (https:// creativecommons.org/licenses/by/ 4.0/). foods Article Removal of Ochratoxin A from Grape Juice by Clarification: A Response Surface Methodology Study Majid Behfar 1 , Ali Heshmati 1, *, Freshteh Mehri 1 and Amin Mousavi Khaneghah 2, * 1 Nutrition Health Research Center, Hamadan University of Medical Sciences, Hamadan 6517659947, Iran; [email protected] (M.B.); [email protected] (F.M.) 2 Department of Food Science and Nutrition, Faculty of Food Engineering, University of Campinas (UNICAMP), Campinas 13083-862, Brazil * Correspondence: [email protected] (A.H.); [email protected] (A.M.K.) Abstract: This study achieved maximum removal of ochratoxin A (OTA) during the grape juice clarification process with minimal reduction in antioxidant compounds (phenolic acid, flavonoids, and antioxidant capacity by FRAP) by the RSM method. Independent variables included three types of clarifiers—gelatin, bentonite, and diatomite (diatomaceous earth)—at a concentration level of 0.25–0.75% and clarification time of 1–3 h. OTA was measured by high-performance liquid chromatography with fluorescence detection. Clarifying agent concentration and clarification time affected the reduction amount of OTA and antioxidant compounds in grape juice. There was a direct linear correlation between the reduction amounts of OTA and antioxidant compounds and capacity with the concentration of bentonite, gelatin, and diatomite, and the clarification time. The reduction amount of OTA and antioxidant capacity followed the linear mode. However, the decreased phenolic acid and flavonoid values followed the quadratic model. The study results showed that if the concentrations of bentonite, gelatin, and diatomite and clarification time were 0.45, 0.62, 0.25%, and 1 h, respectively, the maximum amount of OTA reduction (41.67%) occurred. Furthermore, the phenolic acid, flavonoid, and antioxidant activity decrease amounts were at their lowest levels, i.e., 23.86, 7.20, and 17.27%, respectively. Keywords: ochratoxin A; grape juice; clarification; antioxidant compounds; mycotoxin 1. Introduction Fruits and vegetables are the main components of the human diet, mainly cultivated in different regions [1]. Today, the tendency to consume fruit-derived products such as grape juice is growing because they are a good source of sugars (fructose, glucose), organic acids (tartaric acid, malic acid, citric acid), minerals (Cu, Fe, Mn), phenolics (catechin, malvidin 3,5-diglucoside, Cyanidin-3,5-diglucoside), and vitamins [2–6]. In addition, they contain various antioxidants, which play a vital role in human health and disease risk decreases, such as cancer and cardiovascular diseases [7,8]. In 2017, the global consumption of fruit juices was estimated at 35 billion liters [9]. The high sugar levels in grapes cause this product to be spoiled by various fungi, such as mycotoxin-producing molds [5,10]. Therefore, despite the critical role of grapes in humans’ diet and health, one of the greatest concerns is the contamination of these foodstuffs with different types of mycotoxins. The different types of mycotoxin include ochratoxin A (OTA), patulin, aflatoxins, citrinin alternariol, and tenuazonic acid, and fumonisin B2 might be created during fungi growth on grapes [11]. However, OTA is the most critical mycotoxin, and its occurrence has been reported in grapes and products obtained from grapes, such as grape juice, raisins, pekmez, and wine [12–15]. OTA is a secondary metabolite produced by specific fungi species, including As- pergillus and Penicillium [16]. OTA has also been categorized as a group 2B carcinogen for Foods 2022, 11, 1432. https://doi.org/10.3390/foods11101432 https://www.mdpi.com/journal/foods

Welcome message from author
This document is posted to help you gain knowledge. Please leave a comment to let me know what you think about it! Share it to your friends and learn new things together.
Transcript
Citation: Behfar, M.; Heshmati, A.;
Mehri, F.; Khaneghah, A.M. Removal
of Ochratoxin A from Grape Juice by
Clarification: A Response Surface
Methodology Study. Foods 2022, 11,
1432. https://doi.org/10.3390/
foods11101432
Academic Editor: Yun Wang
Received: 9 April 2022
Accepted: 10 May 2022
Published: 16 May 2022
Publisher’s Note: MDPI stays neutral
with regard to jurisdictional claims in
published maps and institutional affil-
iations.
Copyright: © 2022 by the authors.
Licensee MDPI, Basel, Switzerland.
This article is an open access article
distributed under the terms and
conditions of the Creative Commons
Attribution (CC BY) license (https://
creativecommons.org/licenses/by/
4.0/).
foods
Article
Removal of Ochratoxin A from Grape Juice by Clarification:A Response Surface Methodology StudyMajid Behfar 1, Ali Heshmati 1,*, Freshteh Mehri 1 and Amin Mousavi Khaneghah 2,*
1 Nutrition Health Research Center, Hamadan University of Medical Sciences, Hamadan 6517659947, Iran;[email protected] (M.B.); [email protected] (F.M.)
2 Department of Food Science and Nutrition, Faculty of Food Engineering,University of Campinas (UNICAMP), Campinas 13083-862, Brazil
* Correspondence: [email protected] (A.H.); [email protected] (A.M.K.)
Abstract: This study achieved maximum removal of ochratoxin A (OTA) during the grape juiceclarification process with minimal reduction in antioxidant compounds (phenolic acid, flavonoids,and antioxidant capacity by FRAP) by the RSM method. Independent variables included threetypes of clarifiers—gelatin, bentonite, and diatomite (diatomaceous earth)—at a concentration levelof 0.25–0.75% and clarification time of 1–3 h. OTA was measured by high-performance liquidchromatography with fluorescence detection. Clarifying agent concentration and clarification timeaffected the reduction amount of OTA and antioxidant compounds in grape juice. There was adirect linear correlation between the reduction amounts of OTA and antioxidant compounds andcapacity with the concentration of bentonite, gelatin, and diatomite, and the clarification time. Thereduction amount of OTA and antioxidant capacity followed the linear mode. However, the decreasedphenolic acid and flavonoid values followed the quadratic model. The study results showed that ifthe concentrations of bentonite, gelatin, and diatomite and clarification time were 0.45, 0.62, 0.25%,and 1 h, respectively, the maximum amount of OTA reduction (41.67%) occurred. Furthermore,the phenolic acid, flavonoid, and antioxidant activity decrease amounts were at their lowest levels,i.e., 23.86, 7.20, and 17.27%, respectively.
Keywords: ochratoxin A; grape juice; clarification; antioxidant compounds; mycotoxin
1. Introduction
Fruits and vegetables are the main components of the human diet, mainly cultivated indifferent regions [1]. Today, the tendency to consume fruit-derived products such as grapejuice is growing because they are a good source of sugars (fructose, glucose), organic acids(tartaric acid, malic acid, citric acid), minerals (Cu, Fe, Mn), phenolics (catechin, malvidin3,5-diglucoside, Cyanidin-3,5-diglucoside), and vitamins [2–6]. In addition, they containvarious antioxidants, which play a vital role in human health and disease risk decreases,such as cancer and cardiovascular diseases [7,8]. In 2017, the global consumption of fruitjuices was estimated at 35 billion liters [9].
The high sugar levels in grapes cause this product to be spoiled by various fungi,such as mycotoxin-producing molds [5,10]. Therefore, despite the critical role of grapesin humans’ diet and health, one of the greatest concerns is the contamination of thesefoodstuffs with different types of mycotoxins. The different types of mycotoxin includeochratoxin A (OTA), patulin, aflatoxins, citrinin alternariol, and tenuazonic acid, andfumonisin B2 might be created during fungi growth on grapes [11]. However, OTA isthe most critical mycotoxin, and its occurrence has been reported in grapes and productsobtained from grapes, such as grape juice, raisins, pekmez, and wine [12–15].
OTA is a secondary metabolite produced by specific fungi species, including As-pergillus and Penicillium [16]. OTA has also been categorized as a group 2B carcinogen for
Foods 2022, 11, 1432. https://doi.org/10.3390/foods11101432 https://www.mdpi.com/journal/foods
Foods 2022, 11, 1432 2 of 17
humans by the International Agency for Research on Cancer [17]. Various toxic effects ofOTA on human health have been reported, such as teratogenic, carcinogenic, mutagenic,neurotoxic, hepatotoxic, and immunotoxic effects [14,18]. Furthermore, OTA causes var-ious human nephropathies, including Balkan Endemic Nephropathy (BEN) and chronicinterstitial nephropathy (CIN) in humans, and increases lipid peroxidation, inhibitingmacromolecular synthesis and the inhibition of mitochondrial respiration [19,20].
The presence of OTA in grape-derived products is reported in many countries, wherethe content is related to cultivation, transportation, and storage [13,14,17,21]. Due to thehigh contamination of grape OTA, the maximum level for this mycotoxin in products suchas wine, wine-based drinks, and grape juice is considered 2.0 µg/kg [22]. In order to removeOTA from contaminated foodstuffs, different strategies, such as physical, chemical, andbiological methods, have been suggested [23]. The physical methods are uneconomical [24].The residue of synthetic chemicals and fungicides applied for OTA control has harmfulimpacts on human health [25]. In biological methods, although metabolized OTA formscreated by S. cerevisiae are less toxic, they may be converted to OTA in the digestivesystem [26].
The application of adsorbents is the most common practice for OTA reduction [27].The reduction of OTA by bentonite, gelatin, and diatomite was reported in previousstudies [12,28,29]. In addition to OTA removal, these clarifiers might decrease antioxidantcompounds [30–33]. As antioxidant compound removal could decrease the nutritionalvalue of grape juice, it is necessary to optimize the applied clarifier level to decrease thehighest level of OTA. In contrast, antioxidant compound amounts did not change or had alow loss. This study aimed to optimize bentonite, gelatin, and diatomite levels and clarifythe time for obtaining the highest removal of OTA and lowest reduction in antioxidantcomponents and capacity.
2. Materials and Methods2.1. Materials
A grape sample (Askari cultivar) was collected from a garden in Hamadan (Iran). OTA,2,4,6-Tris(2-pyridyl)-s-triazine (TPTZ), Folin–Ciocalteu reagent, gallic acid, and catechinwere supplied by Sigma (St Louis, MO, USA). Sodium carbonate, phosphate-bufferedsaline (PBS), sodium nitrate, methanol, sodium acetate, aluminum chloride, ferric chloride,sodium hydroxide, hydrochloric acid, acetonitrile, ferrous sulphate, and other chemicalswere supplied by Merck (Darmstadt, Germany). Immunoaffinity columns (IAC) werebought from Libios (Pontcharra-Sur-Turdine, France). Bentonite was bought from MojallaliInc. (Tehran, Iran). Gelatin by Diaco (Tehran, Iran) and diatomite earth were supplied byNeutron (Tehran, Iran). A Millipore Milli-Q purification system (Millipore, Milford, CT,USA) was used to prepare ultra-pure water.
2.2. Grape Juice Preparation
First, the OTA concentration in collected grape samples was measured according tothe method mentioned below. The OTA content of grape specimens was lower than thelimit of detection (LOD). Then, grape samples were washed. For washing, grape samples(5 kg) were immersed in 10 L of tap water for 10 min. Furthermore, they were placed on asteel strainer to dry. Then, they were crushed and pressed by juicing mashing (Pars Khazar,Tehran, Iran) to obtain grape juice.
For grape skin and seed removal, grape juice was filtered through Whatman No. 2 filterpaper. For this study, OTA was spiked into filtered grape juice at a concentration of 5 µg/L.The initial concentration of OTA was considered fixed based on the instrument limitation.
2.3. Addition of Clarifier to Grape Juice
As shown in Table 1, three types of clarifiers, i.e., bentonite, gelatin, and diatomiteearth, were added to grape juice at different levels (0.25, 0.5, and 0.75% w/v) and agitatedfor 10 min by a magnetic stirrer (MTOPS, HS15-03P model, Korea). Samples were placed
Foods 2022, 11, 1432 3 of 17
at ambient temperature for different times (1, 2, and 3 h). Couples were passed throughWhatman filter paper (No. 2).
2.4. OTA Clean-Up and Measurement
Before analysis, unclarified grape juice and clarified grape juice samples were stirredentirely. The OTA extraction and analysis method was similar to our previous study, withslight modifications [34]. First, methanol (25 mL), deionized water (160 mL), and NaCl(2.5 g) were added to 40 mL juice samples and they were stirred for 10 min by a magneticstirrer. Then, they were filtered through Whatman No. 1 filter paper. Twenty-five mLof filtrated sample was mixed with PBS (125 mL). Samples were centrifuged at 1252 g,for 10 min (Hettich, Tuttlingen, Germany). Fifty mL of the centrifuged specimen waspassed through IAC. OTA was eluted with methanol (1 mL). The volume of collectedfluid was increased to 2 mL with methanol. In the final step, 50 µL was injected into theHPLC instrument.
2.5. Apparatus of OTA Analysis
OTA’s determination and quantity measurement was performed by an HPLC system(Milford, MA, USA) equipped with a binary pump and fluorescence detector (model 2475,Milford, MA, USA). OTA separation was carried out on a reversed phase C18 column(ODC) (250 mm × 4.6 mm, i.d., 5 µm) at 25 ◦C. The mobile phase utilized for OTA analysiswas composed of a water, acetonitrile, and methanol mixture (5:3:2, v/v/v) and deliveredto HPLC at a 1 mL/min rate under isocratic elution conditions. The measurement of OTAin the fluorescence detector was carried out at the wavelength of excitation of 335 nm andthe wavelength of 465 nm.
2.6. Validation of the OTA Analysis
To validate the OTA analysis method, linearity, accuracy, precision, and sensitivitywere determined. The limit of detection (LOD) and the limit of quantification (LOQ) weredetermined to identify the method’s sensitivity. The signal-to-noise ratios of 3:1 and 10:1were considered for LOD and LOQ estimation. To obtain the analysis method’s accuracy,the recovery of OTA was measured. At first, the blank grape juice samples were spikedwith OTA at 2.5, 5, and 10 µg/kg concentration levels. Then, OTA was extracted accordingto the method above. The recovery was calculated according to the following equation:
Recovery (%) = found OTA concentration/spiked OTA concentration × 100 (1)
The recovery test was repeated three times, and the relative standard deviation of threeruns was calculated to show intra-day precision. For inter-day precision determination, therecovery test was performed on three consecutive days, and the relative standard deviationof nine repeats was calculated. To determine the linearity of the analysis method, thecalibration curves were constructed using the peak area ratio of working standard solutionsof OTA prepared at concentration levels of 0.1–25 µg/kg and analyzed by HPLC versusOTA concentration.
2.7. Measurement of Total Phenolic Acid Content
The total phenolic acid content (TPC) of the grape juice samples was determinedaccording to the method suggested by Pankaj and Wan (2017) in a previous study [35].Briefly, 0.5 mL of standard solution or sample was mixed with 1 mL of Folin–Ciocalteureagent. After 6 min of incubation at room temperature, 2 mL of sodium carbonate solution(20%) was added. The mixture was placed for 60 min at 30 ◦C. Finally, the absorbance of thesamples was recorded at 760 nm against the blank using a spectrophotometer (ShimadzuUV–Vis Mini 1240, Tokyo, Japan). The TPC was determined by a suitable calibration curve(6.25–100 µg/mL) and reported as µg of gallic acid equivalents/mL [35].
Foods 2022, 11, 1432 4 of 17
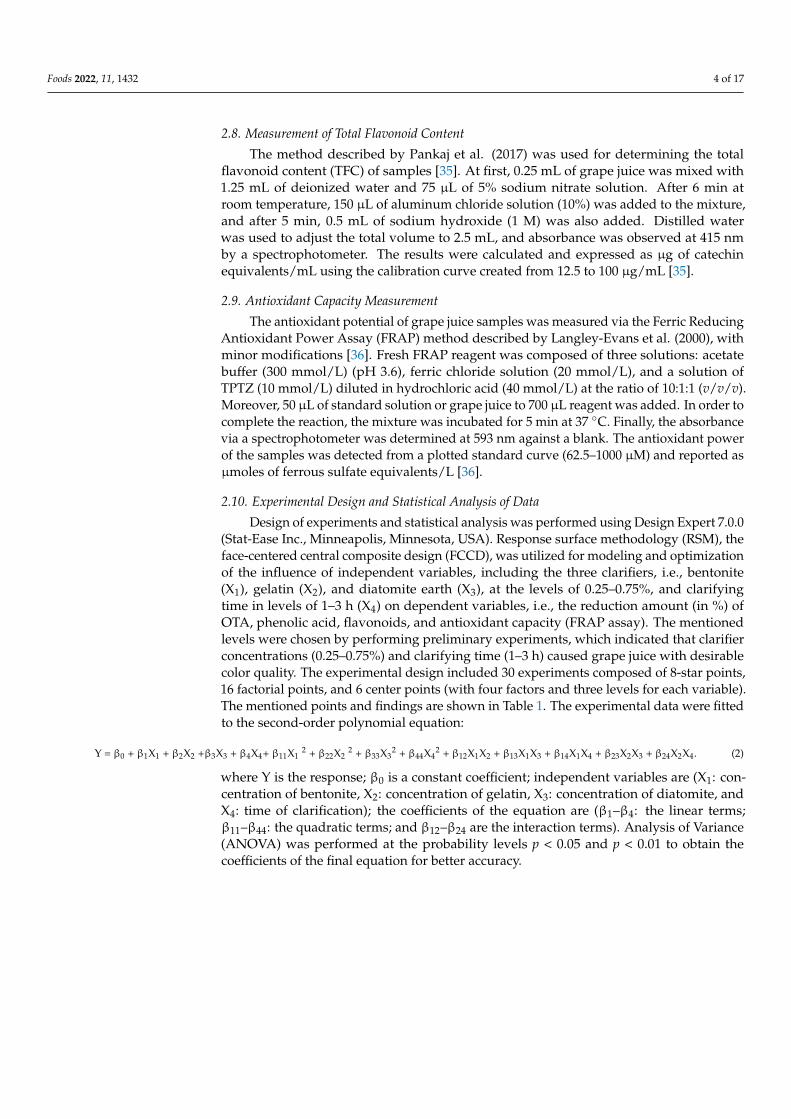
2.8. Measurement of Total Flavonoid Content
The method described by Pankaj et al. (2017) was used for determining the totalflavonoid content (TFC) of samples [35]. At first, 0.25 mL of grape juice was mixed with1.25 mL of deionized water and 75 µL of 5% sodium nitrate solution. After 6 min atroom temperature, 150 µL of aluminum chloride solution (10%) was added to the mixture,and after 5 min, 0.5 mL of sodium hydroxide (1 M) was also added. Distilled waterwas used to adjust the total volume to 2.5 mL, and absorbance was observed at 415 nmby a spectrophotometer. The results were calculated and expressed as µg of catechinequivalents/mL using the calibration curve created from 12.5 to 100 µg/mL [35].
2.9. Antioxidant Capacity Measurement
The antioxidant potential of grape juice samples was measured via the Ferric ReducingAntioxidant Power Assay (FRAP) method described by Langley-Evans et al. (2000), withminor modifications [36]. Fresh FRAP reagent was composed of three solutions: acetatebuffer (300 mmol/L) (pH 3.6), ferric chloride solution (20 mmol/L), and a solution ofTPTZ (10 mmol/L) diluted in hydrochloric acid (40 mmol/L) at the ratio of 10:1:1 (v/v/v).Moreover, 50 µL of standard solution or grape juice to 700 µL reagent was added. In order tocomplete the reaction, the mixture was incubated for 5 min at 37 ◦C. Finally, the absorbancevia a spectrophotometer was determined at 593 nm against a blank. The antioxidant powerof the samples was detected from a plotted standard curve (62.5–1000 µM) and reported asµmoles of ferrous sulfate equivalents/L [36].
2.10. Experimental Design and Statistical Analysis of Data
Design of experiments and statistical analysis was performed using Design Expert 7.0.0(Stat-Ease Inc., Minneapolis, Minnesota, USA). Response surface methodology (RSM), theface-centered central composite design (FCCD), was utilized for modeling and optimizationof the influence of independent variables, including the three clarifiers, i.e., bentonite(X1), gelatin (X2), and diatomite earth (X3), at the levels of 0.25–0.75%, and clarifyingtime in levels of 1–3 h (X4) on dependent variables, i.e., the reduction amount (in %) ofOTA, phenolic acid, flavonoids, and antioxidant capacity (FRAP assay). The mentionedlevels were chosen by performing preliminary experiments, which indicated that clarifierconcentrations (0.25–0.75%) and clarifying time (1–3 h) caused grape juice with desirablecolor quality. The experimental design included 30 experiments composed of 8-star points,16 factorial points, and 6 center points (with four factors and three levels for each variable).The mentioned points and findings are shown in Table 1. The experimental data were fittedto the second-order polynomial equation:
Y = β0 + β1X1 + β2X2 +β3X3 + β4X4+ β11X12 + β22X2
2 + β33X32 + β44X4
2 + β12X1X2 + β13X1X3 + β14X1X4 + β23X2X3 + β24X2X4. (2)
where Y is the response; β0 is a constant coefficient; independent variables are (X1: con-centration of bentonite, X2: concentration of gelatin, X3: concentration of diatomite, andX4: time of clarification); the coefficients of the equation are (β1–β4: the linear terms;β11–β44: the quadratic terms; and β12–β24 are the interaction terms). Analysis of Variance(ANOVA) was performed at the probability levels p < 0.05 and p < 0.01 to obtain thecoefficients of the final equation for better accuracy.
Foods 2022, 11, 1432 5 of 17
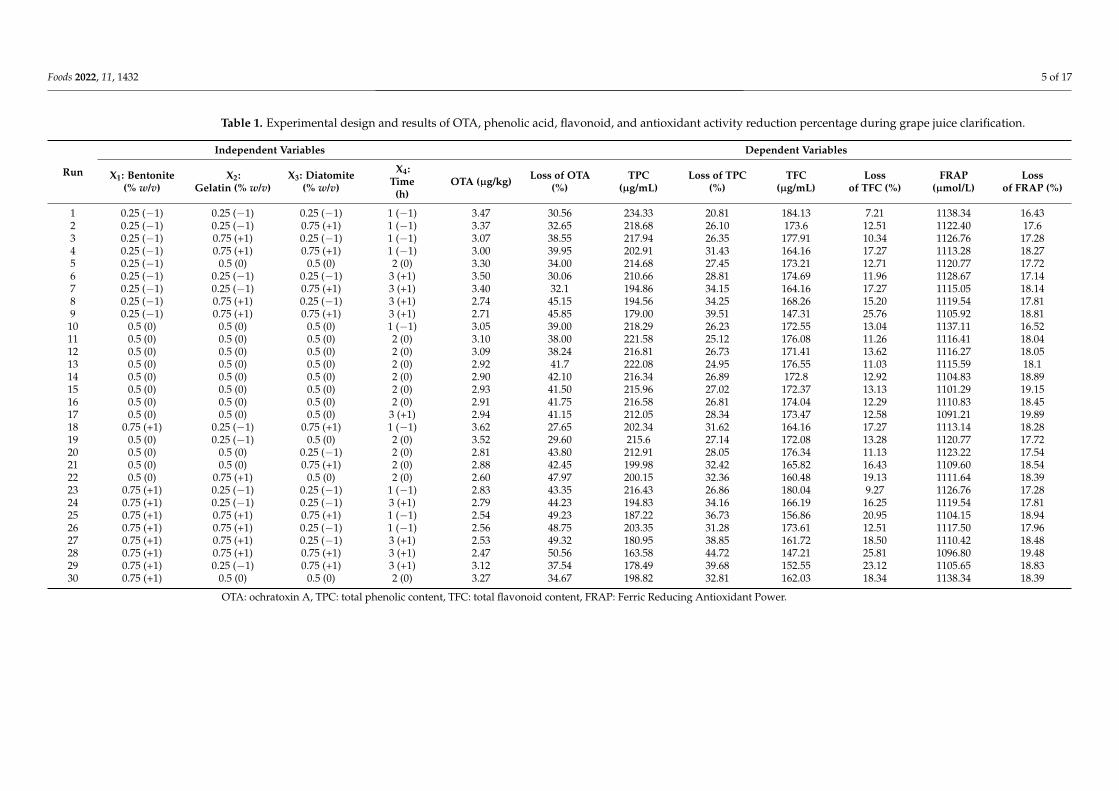
Table 1. Experimental design and results of OTA, phenolic acid, flavonoid, and antioxidant activity reduction percentage during grape juice clarification.
Run
Independent Variables Dependent Variables
X1: Bentonite(% w/v)
X2:Gelatin (% w/v)
X3: Diatomite(% w/v)
X4:Time
(h)OTA (µg/kg) Loss of OTA
(%)TPC
(µg/mL)Loss of TPC
(%)TFC
(µg/mL)Loss
of TFC (%)FRAP
(µmol/L)Loss
of FRAP (%)
1 0.25 (−1) 0.25 (−1) 0.25 (−1) 1 (−1) 3.47 30.56 234.33 20.81 184.13 7.21 1138.34 16.432 0.25 (−1) 0.25 (−1) 0.75 (+1) 1 (−1) 3.37 32.65 218.68 26.10 173.6 12.51 1122.40 17.63 0.25 (−1) 0.75 (+1) 0.25 (−1) 1 (−1) 3.07 38.55 217.94 26.35 177.91 10.34 1126.76 17.284 0.25 (−1) 0.75 (+1) 0.75 (+1) 1 (−1) 3.00 39.95 202.91 31.43 164.16 17.27 1113.28 18.275 0.25 (−1) 0.5 (0) 0.5 (0) 2 (0) 3.30 34.00 214.68 27.45 173.21 12.71 1120.77 17.726 0.25 (−1) 0.25 (−1) 0.25 (−1) 3 (+1) 3.50 30.06 210.66 28.81 174.69 11.96 1128.67 17.147 0.25 (−1) 0.25 (−1) 0.75 (+1) 3 (+1) 3.40 32.1 194.86 34.15 164.16 17.27 1115.05 18.148 0.25 (−1) 0.75 (+1) 0.25 (−1) 3 (+1) 2.74 45.15 194.56 34.25 168.26 15.20 1119.54 17.819 0.25 (−1) 0.75 (+1) 0.75 (+1) 3 (+1) 2.71 45.85 179.00 39.51 147.31 25.76 1105.92 18.81
10 0.5 (0) 0.5 (0) 0.5 (0) 1 (−1) 3.05 39.00 218.29 26.23 172.55 13.04 1137.11 16.5211 0.5 (0) 0.5 (0) 0.5 (0) 2 (0) 3.10 38.00 221.58 25.12 176.08 11.26 1116.41 18.0412 0.5 (0) 0.5 (0) 0.5 (0) 2 (0) 3.09 38.24 216.81 26.73 171.41 13.62 1116.27 18.0513 0.5 (0) 0.5 (0) 0.5 (0) 2 (0) 2.92 41.7 222.08 24.95 176.55 11.03 1115.59 18.114 0.5 (0) 0.5 (0) 0.5 (0) 2 (0) 2.90 42.10 216.34 26.89 172.8 12.92 1104.83 18.8915 0.5 (0) 0.5 (0) 0.5 (0) 2 (0) 2.93 41.50 215.96 27.02 172.37 13.13 1101.29 19.1516 0.5 (0) 0.5 (0) 0.5 (0) 2 (0) 2.91 41.75 216.58 26.81 174.04 12.29 1110.83 18.4517 0.5 (0) 0.5 (0) 0.5 (0) 3 (+1) 2.94 41.15 212.05 28.34 173.47 12.58 1091.21 19.8918 0.75 (+1) 0.25 (−1) 0.75 (+1) 1 (−1) 3.62 27.65 202.34 31.62 164.16 17.27 1113.14 18.2819 0.5 (0) 0.25 (−1) 0.5 (0) 2 (0) 3.52 29.60 215.6 27.14 172.08 13.28 1120.77 17.7220 0.5 (0) 0.5 (0) 0.25 (−1) 2 (0) 2.81 43.80 212.91 28.05 176.34 11.13 1123.22 17.5421 0.5 (0) 0.5 (0) 0.75 (+1) 2 (0) 2.88 42.45 199.98 32.42 165.82 16.43 1109.60 18.5422 0.5 (0) 0.75 (+1) 0.5 (0) 2 (0) 2.60 47.97 200.15 32.36 160.48 19.13 1111.64 18.3923 0.75 (+1) 0.25 (−1) 0.25 (−1) 1 (−1) 2.83 43.35 216.43 26.86 180.04 9.27 1126.76 17.2824 0.75 (+1) 0.25 (−1) 0.25 (−1) 3 (+1) 2.79 44.23 194.83 34.16 166.19 16.25 1119.54 17.8125 0.75 (+1) 0.75 (+1) 0.75 (+1) 1 (−1) 2.54 49.23 187.22 36.73 156.86 20.95 1104.15 18.9426 0.75 (+1) 0.75 (+1) 0.25 (−1) 1 (−1) 2.56 48.75 203.35 31.28 173.61 12.51 1117.50 17.9627 0.75 (+1) 0.75 (+1) 0.25 (−1) 3 (+1) 2.53 49.32 180.95 38.85 161.72 18.50 1110.42 18.4828 0.75 (+1) 0.75 (+1) 0.75 (+1) 3 (+1) 2.47 50.56 163.58 44.72 147.21 25.81 1096.80 19.4829 0.75 (+1) 0.25 (−1) 0.75 (+1) 3 (+1) 3.12 37.54 178.49 39.68 152.55 23.12 1105.65 18.8330 0.75 (+1) 0.5 (0) 0.5 (0) 2 (0) 3.27 34.67 198.82 32.81 162.03 18.34 1138.34 18.39
OTA: ochratoxin A, TPC: total phenolic content, TFC: total flavonoid content, FRAP: Ferric Reducing Antioxidant Power.
Foods 2022, 11, 1432 6 of 17
2.11. Optimization
OTA’s reduction amount (in %) was kept at the maximum level for optimization. Incontrast, the reduction amount (in %) of other responses, such as phenolic acid, flavonoids,and antioxidant capacity (FRAP assay) reduction content, was kept at the minimum value,and the independent variables (X1, X2, X3, X4) were placed within the range (between lowerand higher level). The higher desirability value (0–1) was chosen among the optimumconditions suggested by the Design Expert software.
3. Results and Discussion3.1. Method Validation
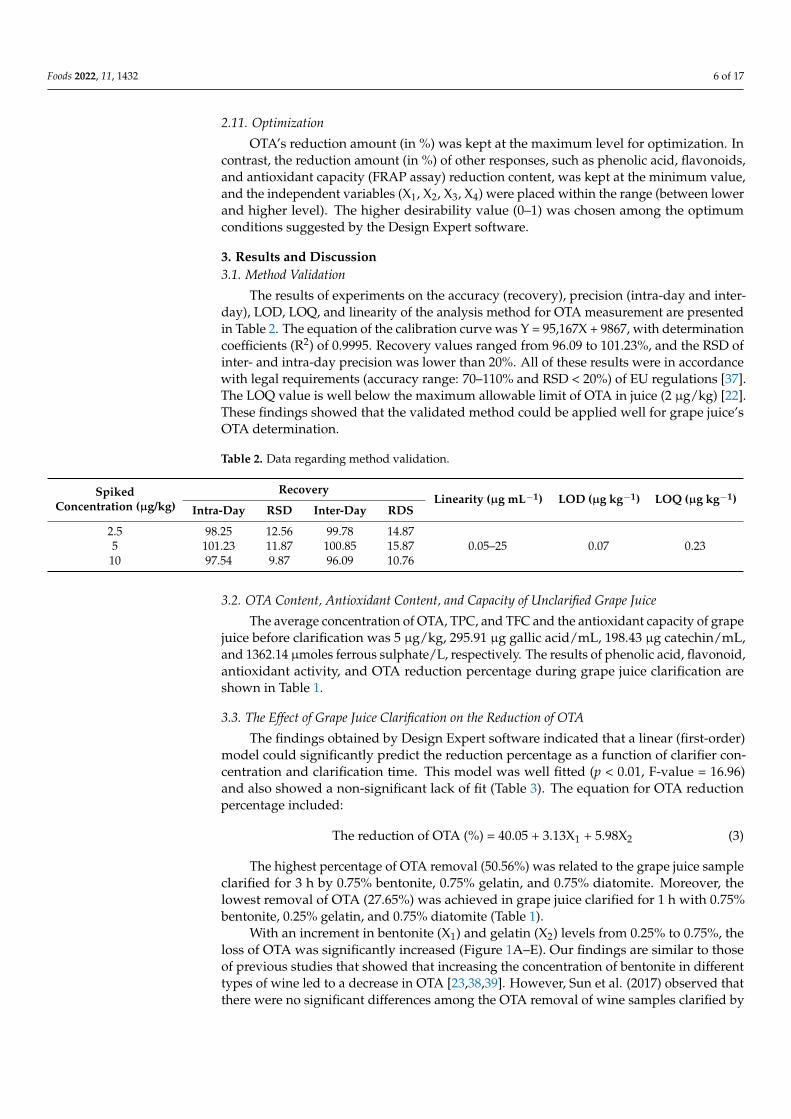
The results of experiments on the accuracy (recovery), precision (intra-day and inter-day), LOD, LOQ, and linearity of the analysis method for OTA measurement are presentedin Table 2. The equation of the calibration curve was Y = 95,167X + 9867, with determinationcoefficients (R2) of 0.9995. Recovery values ranged from 96.09 to 101.23%, and the RSD ofinter- and intra-day precision was lower than 20%. All of these results were in accordancewith legal requirements (accuracy range: 70–110% and RSD < 20%) of EU regulations [37].The LOQ value is well below the maximum allowable limit of OTA in juice (2 µg/kg) [22].These findings showed that the validated method could be applied well for grape juice’sOTA determination.
Table 2. Data regarding method validation.
SpikedConcentration (µg/kg)
RecoveryLinearity (µg mL−1) LOD (µg kg−1) LOQ (µg kg−1)
Intra-Day RSD Inter-Day RDS
2.5 98.25 12.56 99.78 14.875 101.23 11.87 100.85 15.87 0.05–25 0.07 0.2310 97.54 9.87 96.09 10.76
3.2. OTA Content, Antioxidant Content, and Capacity of Unclarified Grape Juice
The average concentration of OTA, TPC, and TFC and the antioxidant capacity of grapejuice before clarification was 5 µg/kg, 295.91 µg gallic acid/mL, 198.43 µg catechin/mL,and 1362.14 µmoles ferrous sulphate/L, respectively. The results of phenolic acid, flavonoid,antioxidant activity, and OTA reduction percentage during grape juice clarification areshown in Table 1.
3.3. The Effect of Grape Juice Clarification on the Reduction of OTA
The findings obtained by Design Expert software indicated that a linear (first-order)model could significantly predict the reduction percentage as a function of clarifier con-centration and clarification time. This model was well fitted (p < 0.01, F-value = 16.96)and also showed a non-significant lack of fit (Table 3). The equation for OTA reductionpercentage included:
The reduction of OTA (%) = 40.05 + 3.13X1 + 5.98X2 (3)
The highest percentage of OTA removal (50.56%) was related to the grape juice sampleclarified for 3 h by 0.75% bentonite, 0.75% gelatin, and 0.75% diatomite. Moreover, thelowest removal of OTA (27.65%) was achieved in grape juice clarified for 1 h with 0.75%bentonite, 0.25% gelatin, and 0.75% diatomite (Table 1).
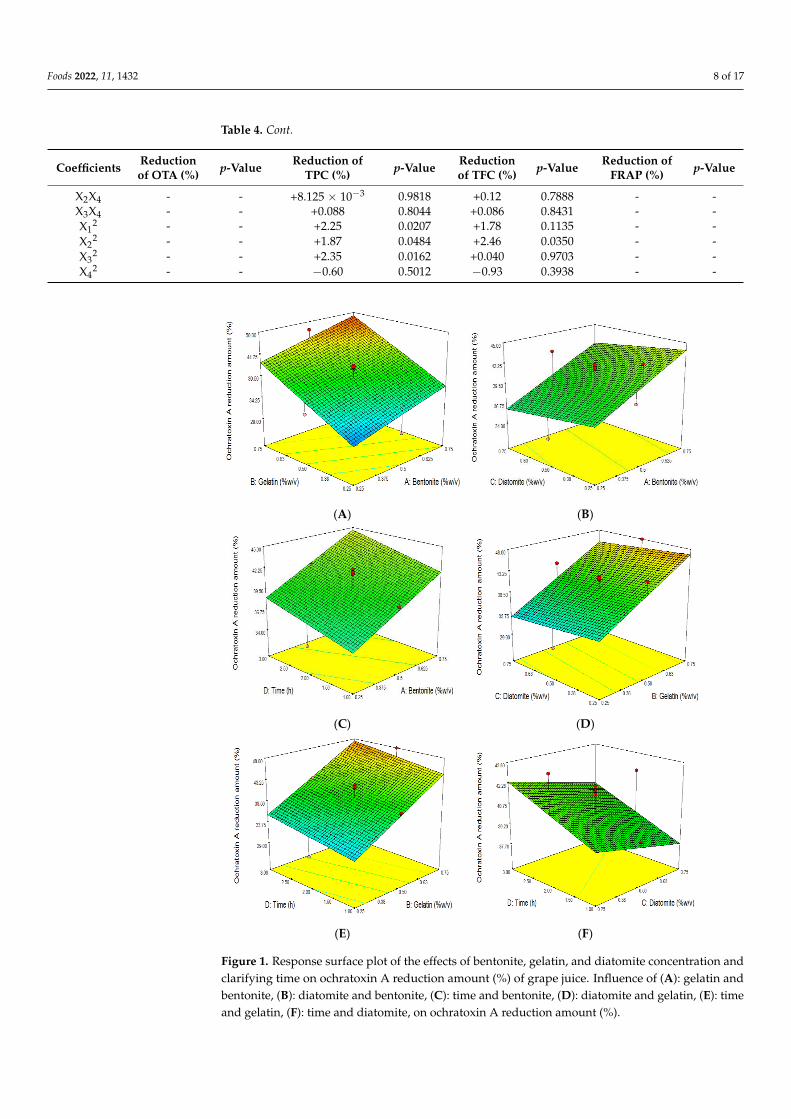
With an increment in bentonite (X1) and gelatin (X2) levels from 0.25% to 0.75%, theloss of OTA was significantly increased (Figure 1A–E). Our findings are similar to thoseof previous studies that showed that increasing the concentration of bentonite in differenttypes of wine led to a decrease in OTA [23,38,39]. However, Sun et al. (2017) observed thatthere were no significant differences among the OTA removal of wine samples clarified by
Foods 2022, 11, 1432 7 of 17
various concentrations of bentonite (0.12, 0.16, and 0.20 mg/mL), and they could result in a10% loss of OTA [29].
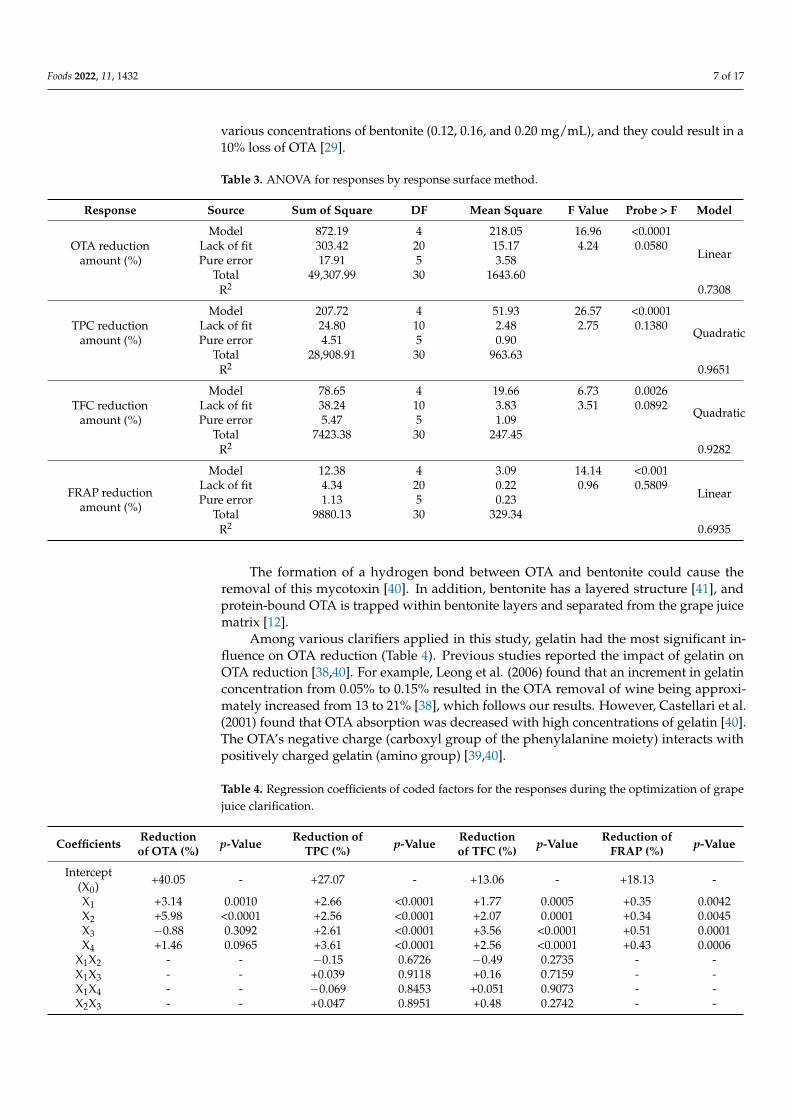
Table 3. ANOVA for responses by response surface method.
Response Source Sum of Square DF Mean Square F Value Probe > F Model
OTA reductionamount (%)
Model 872.19 4 218.05 16.96 <0.0001
LinearLack of fit 303.42 20 15.17 4.24 0.0580Pure error 17.91 5 3.58
Total 49,307.99 30 1643.60R2 0.7308
TPC reductionamount (%)
Model 207.72 4 51.93 26.57 <0.0001
QuadraticLack of fit 24.80 10 2.48 2.75 0.1380Pure error 4.51 5 0.90
Total 28,908.91 30 963.63R2 0.9651
TFC reductionamount (%)
Model 78.65 4 19.66 6.73 0.0026
QuadraticLack of fit 38.24 10 3.83 3.51 0.0892Pure error 5.47 5 1.09
Total 7423.38 30 247.45R2 0.9282
FRAP reductionamount (%)
Model 12.38 4 3.09 14.14 <0.001
LinearLack of fit 4.34 20 0.22 0.96 0.5809Pure error 1.13 5 0.23
Total 9880.13 30 329.34R2 0.6935
The formation of a hydrogen bond between OTA and bentonite could cause theremoval of this mycotoxin [40]. In addition, bentonite has a layered structure [41], andprotein-bound OTA is trapped within bentonite layers and separated from the grape juicematrix [12].
Among various clarifiers applied in this study, gelatin had the most significant in-fluence on OTA reduction (Table 4). Previous studies reported the impact of gelatin onOTA reduction [38,40]. For example, Leong et al. (2006) found that an increment in gelatinconcentration from 0.05% to 0.15% resulted in the OTA removal of wine being approxi-mately increased from 13 to 21% [38], which follows our results. However, Castellari et al.(2001) found that OTA absorption was decreased with high concentrations of gelatin [40].The OTA’s negative charge (carboxyl group of the phenylalanine moiety) interacts withpositively charged gelatin (amino group) [39,40].
Table 4. Regression coefficients of coded factors for the responses during the optimization of grapejuice clarification.
Coefficients Reductionof OTA (%) p-Value Reduction of
TPC (%) p-Value Reductionof TFC (%) p-Value Reduction of
FRAP (%) p-Value
Intercept(X0) +40.05 - +27.07 - +13.06 - +18.13 -
X1 +3.14 0.0010 +2.66 <0.0001 +1.77 0.0005 +0.35 0.0042X2 +5.98 <0.0001 +2.56 <0.0001 +2.07 0.0001 +0.34 0.0045X3 −0.88 0.3092 +2.61 <0.0001 +3.56 <0.0001 +0.51 0.0001X4 +1.46 0.0965 +3.61 <0.0001 +2.56 <0.0001 +0.43 0.0006
X1X2 - - −0.15 0.6726 −0.49 0.2735 - -X1X3 - - +0.039 0.9118 +0.16 0.7159 - -X1X4 - - −0.069 0.8453 +0.051 0.9073 - -X2X3 - - +0.047 0.8951 +0.48 0.2742 - -
Foods 2022, 11, 1432 8 of 17
Table 4. Cont.
Coefficients Reductionof OTA (%) p-Value Reduction of
TPC (%) p-Value Reductionof TFC (%) p-Value Reduction of
FRAP (%) p-Value
X2X4 - - +8.125 × 10⁻³ 0.9818 +0.12 0.7888 - -X3X4 - - +0.088 0.8044 +0.086 0.8431 - -X1
2 - - +2.25 0.0207 +1.78 0.1135 - -X2
2 - - +1.87 0.0484 +2.46 0.0350 - -X3
2 - - +2.35 0.0162 +0.040 0.9703 - -X4
2 - - −0.60 0.5012 −0.93 0.3938 - -Foods 2022, 11, x FOR PEER REVIEW 9 of 18
(A) (B)
(C) (D)
(E) (F)
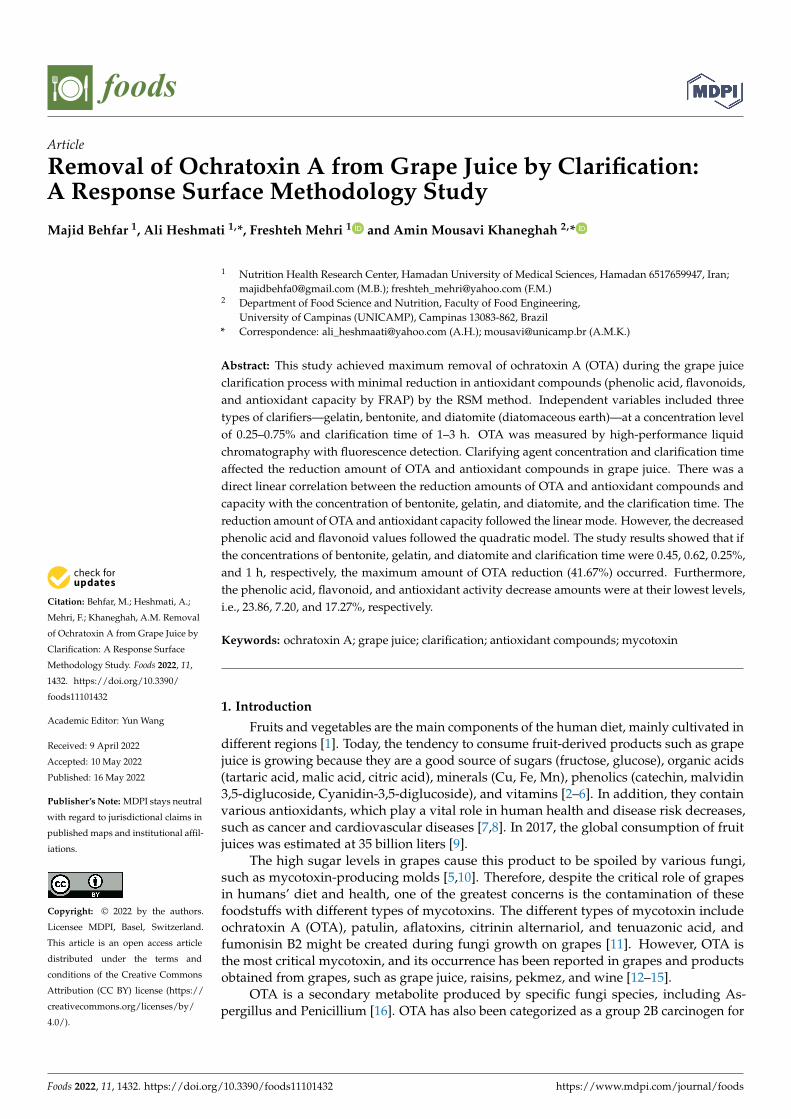
Figure 1. Response surface plot of the effects of bentonite, gelatin, and diatomite concentration and
clarifying time on ochratoxin A reduction amount (%) of grape juice. Influence of (A): gelatin and
bentonite, (B): diatomite and bentonite, (C): time and bentonite, (D): diatomite and gelatin, (E): time
and gelatin, (F): time and diatomite, on ochratoxin A reduction amount (%).
The formation of a hydrogen bond between OTA and bentonite could cause the re-
moval of this mycotoxin [40]. In addition, bentonite has a layered structure [41], and pro-
tein-bound OTA is trapped within bentonite layers and separated from the grape juice
matrix [12].
Among various clarifiers applied in this study, gelatin had the most significant influ-
ence on OTA reduction (Table 4). Previous studies reported the impact of gelatin on OTA
reduction [38,40]. For example, Leong et al. (2006) found that an increment in gelatin con-
centration from 0.05% to 0.15% resulted in the OTA removal of wine being approximately
increased from 13 to 21% [38], which follows our results. However, Castellari et al. (2001)
Figure 1. Response surface plot of the effects of bentonite, gelatin, and diatomite concentration andclarifying time on ochratoxin A reduction amount (%) of grape juice. Influence of (A): gelatin andbentonite, (B): diatomite and bentonite, (C): time and bentonite, (D): diatomite and gelatin, (E): timeand gelatin, (F): time and diatomite, on ochratoxin A reduction amount (%).

Foods 2022, 11, 1432 9 of 17
Among the three clarifiers, the minimum effect on OTA reduction was related todiatomite. As shown in Table 4, the effect of this independent variable on OTA is not signif-icant (p > 0.05). However, diatomite has been applied in the juice production industry [42],and there is limited information about its effect on OTA. Lulamba et al. (2019) indicatedthat diatomite (200 mL/7gr) in beer and distilled water led to an OTA decrease to 38.4 and17.9%, respectively. Diatomite has a layered structure, and OTA bonded with protein couldbe trapped in these layers [43]. Moreover, it is presumed that hydrogen exists in diatomitewith the formula SiO2·nH2O, which plays a role in forming hydrogen bonds.
Based on Table 4, the influence of clarification time on OTA reduction was insignificant(p > 0.05), although, with a longer time, the removal of OTA was greater. Our results aresimilar to those of Sun et al.’s (2017) study. These authors found no significant difference inthe clarification of different wine samples clarified by bentonite and gelatin [29].
3.4. The Effect of Grape Juice Clarification on the Reduction of TPC
The behavior of TPC during the grape juice clarification process has high importancebecause the phenolic compounds, such as resveratrol, have antioxidant, cardioprotective,antidiabetic, anticancer, and antiaging properties, and their removal causes nutritional lossin grape juice [44,45]. The experimental results demonstrated that the decrease in TPCfollowed the quadratic polynomial model (Table 3):
The reduction of TPC = 27.07 + 2.66X1 + 2.56X2 + 2.61X3 + 3.61X4 + 2.25X12 + 1.87X2
2 + 2.35X32 (4)
The linear effects of all factors (p < 0.01) and the quadratic effects of bentonite, gelatin,and diatomite (p < 0.05) significantly influenced the decline in TPC, whereas the remain-ing terms were not significant (p > 0.05) (Table 4). The highest decline in TPC (44.71%)was obtained by using the following conditions: X1: 0.75%, X2: 0.75%, X3: 0.75%, andX4: 3 h. Meanwhile, the lowest reduction (20.8%) was achieved by utilizing the followingparameters: X1: 0.25%, X2: 0.25%, X3: 0.25%, and X4: 1 h (Table 1).
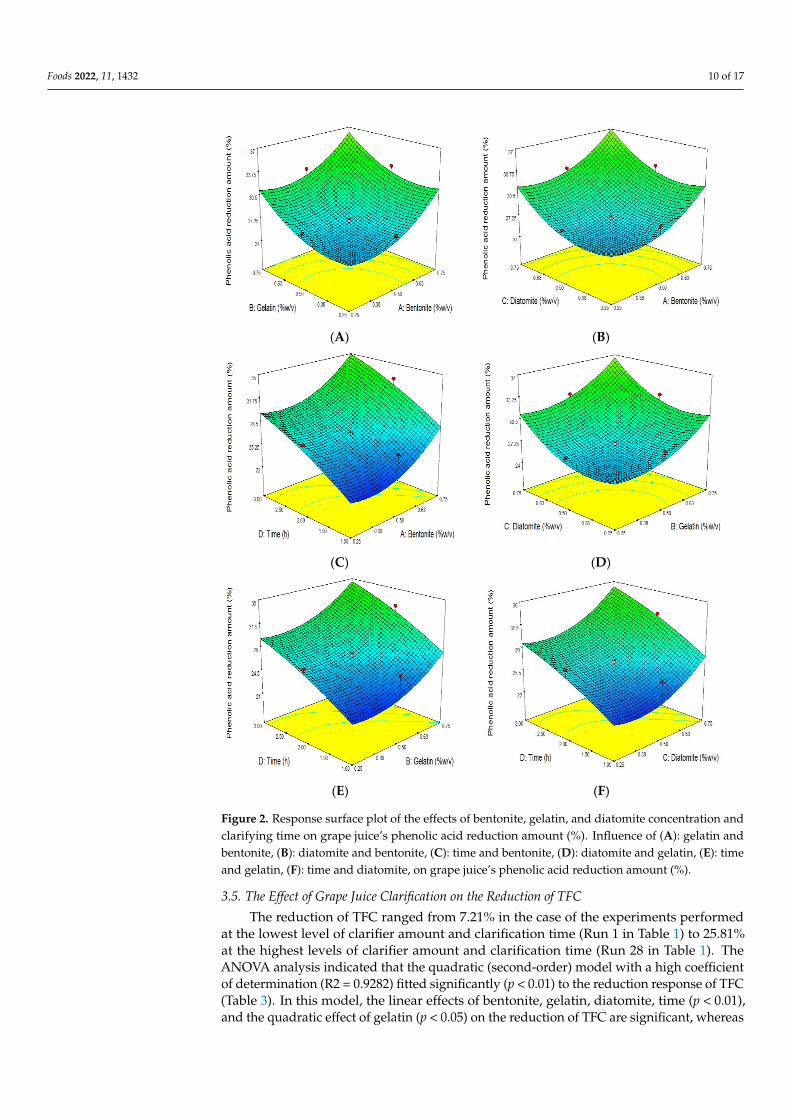
There are various conflicting reports about the effect of bentonite on wine TPC. Forexample, some researchers suggested that enhancing bentonite increases TPC removal,which is in line with our studies [32,46]. Meanwhile, several authors presented contrastingresults and mentioned that adding bentonite reduces TPC loss [47,48]. The platelets ofbentonite carry a negative charge and can electrostatically bond to positively chargedproteins that contain TPC and tannin [48–50]. In addition, cations located in bentonitessuch as Al3+, Ca2+, Mg2+, Mn2+, Zn2+, Cu2+, Fe2+, Na+, K+, and H+ interact directly withnegatively charged phenolic acids in juice or wine [31].
As presented in Table 4, gelatin had a weak role in TPC removal because it has thelowest regression coefficients. The reduction of phenolic acid by gelatin was reported inother studies [46,47,51]. Because of the low pH of fruit juice, gelatin had a positive chargeand could absorb negatively charged phenolic acid [32,51].
The reduction of TPC by diatomite has been documented [30,52]. For example, Ca-panoglu et al. (2013) found that the utilization of diatomite for grape juice filtration causeda reduction in TPC from 276 to 259 mg/g (approximately 6.16% loss) [30]. In another study,Fang et al. (2007) indicated that the application of diatomite as a filtering agent for bayberryjuice led to a decrease of 2–5% in TPC [52]. It is thought that the hydrogen bond formationbetween the active silanol groups of diatomite and the hydroxyl groups of TPC could resultin phenolic acid removal [31,53].
When the clarifiers were in contact with grape juice for 3 h instead of 1 h, more TPCwas removed (Figure 2C,E,F). Table 4 shows that the clarification time (X4) has the greatestinfluence on the decline in TPC from grape juice due to its higher coefficient compared toother factors.
Foods 2022, 11, 1432 10 of 17
Foods 2022, 11, x FOR PEER REVIEW 11 of 18
which is in line with our studies [32,46]. Meanwhile, several authors presented contrasting
results and mentioned that adding bentonite reduces TPC loss [47,48]. The platelets of
bentonite carry a negative charge and can electrostatically bond to positively charged pro-
teins that contain TPC and tannin [48–50]. In addition, cations located in bentonites such
as Al3+, Ca2+, Mg2+, Mn2+, Zn2+, Cu2+, Fe2+, Na+, K+, and H+ interact directly with negatively
charged phenolic acids in juice or wine [31].
As presented in Table 4, gelatin had a weak role in TPC removal because it has the
lowest regression coefficients. The reduction of phenolic acid by gelatin was reported in
other studies [46,47,51]. Because of the low pH of fruit juice, gelatin had a positive charge
and could absorb negatively charged phenolic acid [32,51].
The reduction of TPC by diatomite has been documented [30,52]. For example, Ca-
panoglu et al. (2013) found that the utilization of diatomite for grape juice filtration caused
a reduction in TPC from 276 to 259 mg/g (approximately 6.16% loss) [30]. In another study,
Fang et al. (2007) indicated that the application of diatomite as a filtering agent for bay-
berry juice led to a decrease of 2–5% in TPC [52]. It is thought that the hydrogen bond
formation between the active silanol groups of diatomite and the hydroxyl groups of TPC
could result in phenolic acid removal [31,53].
When the clarifiers were in contact with grape juice for 3 h instead of 1 h, more TPC
was removed (Figure 2C,E,F). Table 4 shows that the clarification time (X4) has the greatest
influence on the decline in TPC from grape juice due to its higher coefficient compared to
other factors.
(A) (B)
(C) (D)
Foods 2022, 11, x FOR PEER REVIEW 12 of 18
(E) (F)
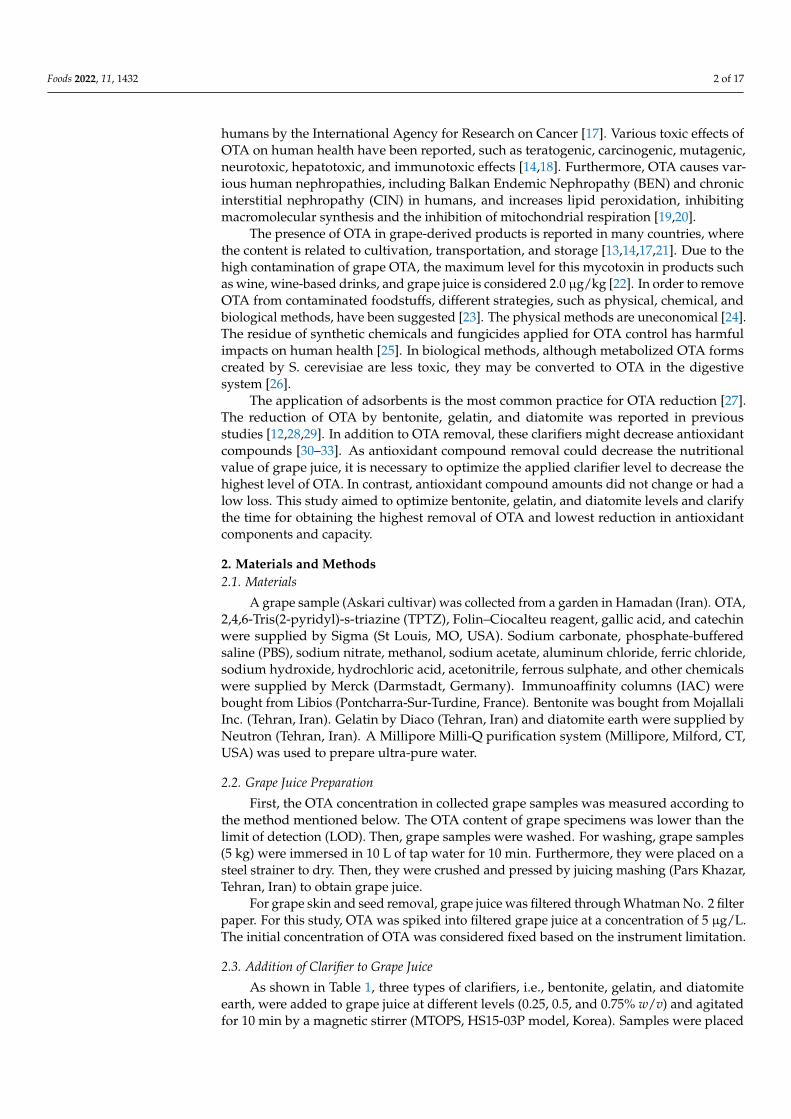
Figure 2. Response surface plot of the effects of bentonite, gelatin, and diatomite concentration and
clarifying time on grape juice’s phenolic acid reduction amount (%). Influence of (A): gelatin and
bentonite, (B): diatomite and bentonite, (C): time and bentonite, (D): diatomite and gelatin, (E): time
and gelatin, (F): time and diatomite, on grape juice’s phenolic acid reduction amount (%).
3.5. The Effect of Grape Juice Clarification on the Reduction of TFC
The reduction of TFC ranged from 7.21% in the case of the experiments performed at
the lowest level of clarifier amount and clarification time (Run 1 in Table 1) to 25.81% at
the highest levels of clarifier amount and clarification time (Run 28 in Table 1). The
ANOVA analysis indicated that the quadratic (second-order) model with a high coeffi-
cient of determination (R2 = 0.9282) fitted significantly (p < 0.01) to the reduction response
of TFC (Table 3). In this model, the linear effects of bentonite, gelatin, diatomite, time (p <
0.01), and the quadratic effect of gelatin (p < 0.05) on the reduction of TFC are significant,
whereas the residue of terms is not significant (p > 0.05) (Table 4). The multiple regression
equation for the reduction of TFC is as follows:
The reduction of TFC (%) = 13.06 + 1.77X1 + 2.07X2 + 3.56X3 + 2.56X4 + 2.46X22 (5)
Among the significant effects, bentonite has the least influence on the reduction of
TFC compared to other effects (Table 4). The reduction of TFC was stable when adding
bentonite (X1) and gelatin (X2) from 0.25 to 0.5%. However, increasing the bentonite and
gelatin concentration to 0.75% improved TFC reduction (Figure 3A–E). Fang et al. (2007)
expressed that the refining and filtration of wine with bentonite (0.2 g/L), gelatin (0.2 g/L),
and diatomite (2 g/L) resulted in a decrease in TFC from 341.1 (mg/L) to 289.7 (mg/L)
(approximately 15.07% reduction), which is within the range of our data [52]. However,
the reduction of TFC (approximately 5% reduction) in mulberry wine clarified by benton-
ite was lower than in our findings [4]. It was proposed that hydrogen bonds between the
benzene rings of anthocyanin and bentonite caused the complex formation and the re-
moval of flavonoids, including anthocyanin [48].
The interaction effects of gelatin on the reduction of TFC with bentonite, diatomite,
and time were investigated and are shown in Figure 3A,D,E. Among the second-order
coefficients, gelatin has the highest value. Therefore, it showed the most substantial im-
pact on the reduction of TFC (Table 4). Ren et al. (2020) found that the clarifying of berry
wine with gelatin resulted in a reduction in TFC (approximately 16.5%) [54]. Anthocya-
nins and gelatin are positively charged; therefore, they could not absorb each other [50].
However, tannins containing a negative charge could play the role of mediator between
both mentioned components and settle them.
With increasing diatomite (X3) from 0.25 up to 0.75%, the reduction of TFC was line-
arly increased (Figure 3B,D,F). In a study conducted by Capanoglu et al. (2013), the filtra-
tion of grape juice concentrates with diatomaceous earth resulted in the reduction of TFC
from 122 to 15 mg/mL (approximately 87.7% reduction) [30]. In another study, the authors
showed that diatomaceous earth caused the reduction of total anthocyanins of açai juice
Figure 2. Response surface plot of the effects of bentonite, gelatin, and diatomite concentration andclarifying time on grape juice’s phenolic acid reduction amount (%). Influence of (A): gelatin andbentonite, (B): diatomite and bentonite, (C): time and bentonite, (D): diatomite and gelatin, (E): timeand gelatin, (F): time and diatomite, on grape juice’s phenolic acid reduction amount (%).
3.5. The Effect of Grape Juice Clarification on the Reduction of TFC
The reduction of TFC ranged from 7.21% in the case of the experiments performedat the lowest level of clarifier amount and clarification time (Run 1 in Table 1) to 25.81%at the highest levels of clarifier amount and clarification time (Run 28 in Table 1). TheANOVA analysis indicated that the quadratic (second-order) model with a high coefficientof determination (R2 = 0.9282) fitted significantly (p < 0.01) to the reduction response of TFC(Table 3). In this model, the linear effects of bentonite, gelatin, diatomite, time (p < 0.01),and the quadratic effect of gelatin (p < 0.05) on the reduction of TFC are significant, whereas
Foods 2022, 11, 1432 11 of 17
the residue of terms is not significant (p > 0.05) (Table 4). The multiple regression equationfor the reduction of TFC is as follows:
The reduction of TFC (%) = 13.06 + 1.77X1 + 2.07X2 + 3.56X3 + 2.56X4 + 2.46X22 (5)
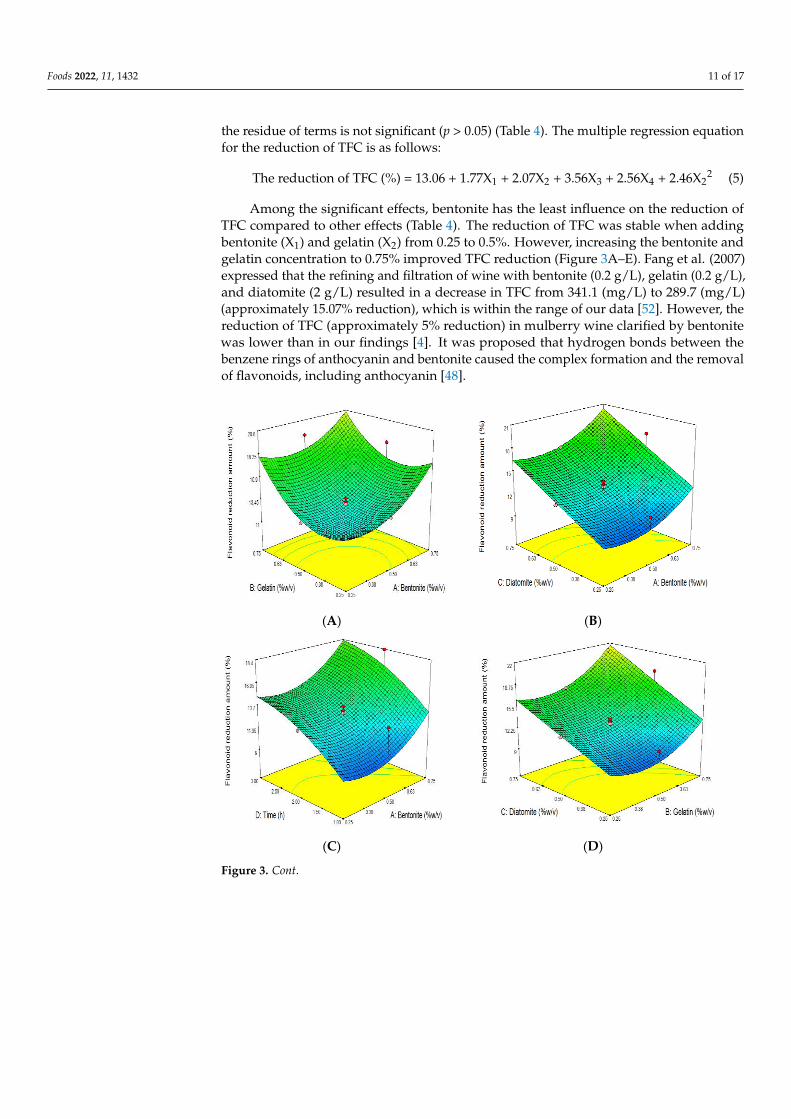
Among the significant effects, bentonite has the least influence on the reduction ofTFC compared to other effects (Table 4). The reduction of TFC was stable when addingbentonite (X1) and gelatin (X2) from 0.25 to 0.5%. However, increasing the bentonite andgelatin concentration to 0.75% improved TFC reduction (Figure 3A–E). Fang et al. (2007)expressed that the refining and filtration of wine with bentonite (0.2 g/L), gelatin (0.2 g/L),and diatomite (2 g/L) resulted in a decrease in TFC from 341.1 (mg/L) to 289.7 (mg/L)(approximately 15.07% reduction), which is within the range of our data [52]. However, thereduction of TFC (approximately 5% reduction) in mulberry wine clarified by bentonitewas lower than in our findings [4]. It was proposed that hydrogen bonds between thebenzene rings of anthocyanin and bentonite caused the complex formation and the removalof flavonoids, including anthocyanin [48].
Foods 2022, 11, x FOR PEER REVIEW 13 of 18
by 20.4% [33]. The positively charged anthocyanins in grape juice could flocculate with
diatomite’s negatively charged hydroxyl group [50].
(A) (B)
(C) (D)
(E) (F)
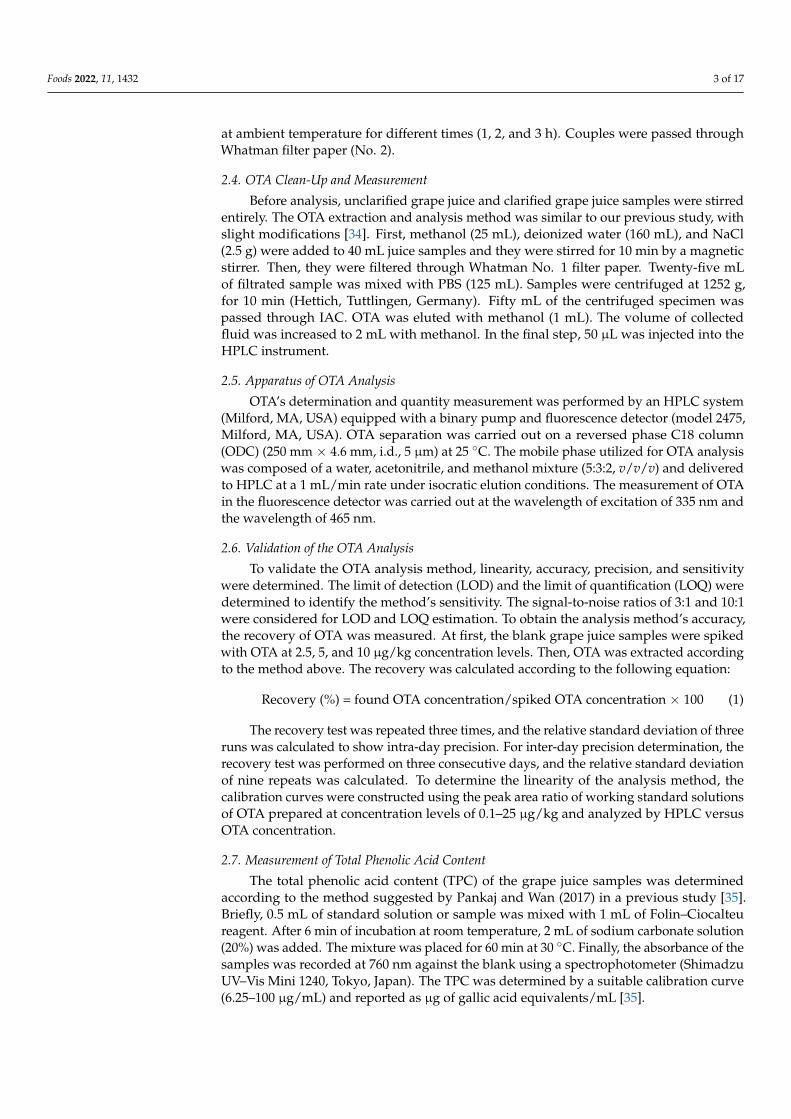
Figure 3. Response surface plot of the effects of bentonite, gelatin, and diatomite concentration and
clarifying time on flavonoid reduction amount (%) of grape juice. Influence of (A): gelatin and ben-
tonite, (B): diatomite and bentonite, (C): time and bentonite, (D): diatomite and gelatin, (E): time
and gelatin, (F): time and diatomite, on grape juice’s flavonoid reduction amount (%).
There is a direct relation between clarification time and the reduction of TFC (Figure
3C,E,F). Flavonoids are a type of active food constituent found in nature and are of par-
ticular interest because of their potential antioxidant activity and possible beneficial ef-
fects on human health [55,56]. As a result, their decrease during the clarification of grape
juice must be minimized.
Figure 3. Cont.

Foods 2022, 11, 1432 12 of 17
Foods 2022, 11, x FOR PEER REVIEW 13 of 18
by 20.4% [33]. The positively charged anthocyanins in grape juice could flocculate with
diatomite’s negatively charged hydroxyl group [50].
(A) (B)
(C) (D)
(E) (F)
Figure 3. Response surface plot of the effects of bentonite, gelatin, and diatomite concentration and
clarifying time on flavonoid reduction amount (%) of grape juice. Influence of (A): gelatin and ben-
tonite, (B): diatomite and bentonite, (C): time and bentonite, (D): diatomite and gelatin, (E): time
and gelatin, (F): time and diatomite, on grape juice’s flavonoid reduction amount (%).
There is a direct relation between clarification time and the reduction of TFC (Figure
3C,E,F). Flavonoids are a type of active food constituent found in nature and are of par-
ticular interest because of their potential antioxidant activity and possible beneficial ef-
fects on human health [55,56]. As a result, their decrease during the clarification of grape
juice must be minimized.
Figure 3. Response surface plot of the effects of bentonite, gelatin, and diatomite concentrationand clarifying time on flavonoid reduction amount (%) of grape juice. Influence of (A): gelatin andbentonite, (B): diatomite and bentonite, (C): time and bentonite, (D): diatomite and gelatin, (E): timeand gelatin, (F): time and diatomite, on grape juice’s flavonoid reduction amount (%).
The interaction effects of gelatin on the reduction of TFC with bentonite, diatomite,and time were investigated and are shown in Figure 3A,D,E. Among the second-ordercoefficients, gelatin has the highest value. Therefore, it showed the most substantialimpact on the reduction of TFC (Table 4). Ren et al. (2020) found that the clarifyingof berry wine with gelatin resulted in a reduction in TFC (approximately 16.5%) [54].Anthocyanins and gelatin are positively charged; therefore, they could not absorb eachother [50]. However, tannins containing a negative charge could play the role of mediatorbetween both mentioned components and settle them.
With increasing diatomite (X3) from 0.25 up to 0.75%, the reduction of TFC was linearlyincreased (Figure 3B,D,F). In a study conducted by Capanoglu et al. (2013), the filtration ofgrape juice concentrates with diatomaceous earth resulted in the reduction of TFC from122 to 15 mg/mL (approximately 87.7% reduction) [30]. In another study, the authorsshowed that diatomaceous earth caused the reduction of total anthocyanins of açai juiceby 20.4% [33]. The positively charged anthocyanins in grape juice could flocculate withdiatomite’s negatively charged hydroxyl group [50].
There is a direct relation between clarification time and the reduction of TFC (Figure 3C,E,F).Flavonoids are a type of active food constituent found in nature and are of particular interest be-cause of their potential antioxidant activity and possible beneficial effects on human health [55,56].As a result, their decrease during the clarification of grape juice must be minimized.
3.6. The Effect of Grape Juice Clarification on the Reduction of Antioxidant Capacity
Due to the antioxidative properties of grapes and their ability to reduce or preventoxidative stress [57], the assessment of clarifying grape juice antioxidant capacity hashigh importance. In this study, the antioxidant capacity reduction (assessed by the FRAPmethod) of grape juice samples ranged between 16.43% (Run 1) and 19.89% (Run 17)(Table 1). For generating a relationship between the antioxidant capacity reduction andclarifier concentration, and clarification time (Table 3), a linear polynomial equation is givenas follows:
Reduction of antioxidant capacity (%) = 18.13 + 0.35X1 + 0.34X2 + 0.51X3 + 0.43X4 (6)
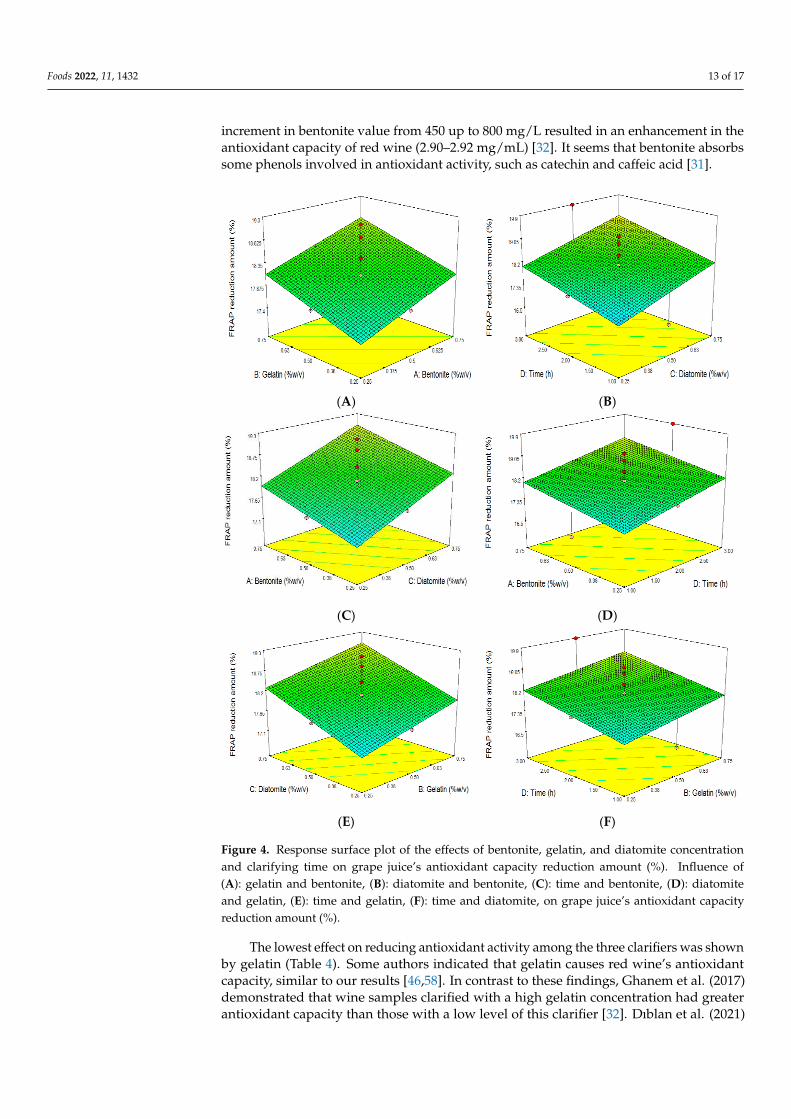
The increase in clarifier agent concentration from 0.25 to 0.75% was positively asso-ciated with antioxidant activity reduction (Figure 4A–F). Our data agree with those ofother researchers who used bentonite in different concentrations for the clarification ofred wine and showed that a diminution in antioxidant content is linked to an increasein bentonite [46,58]. In contrast to our findings, Ghanem et al. (2017) observed that an
Foods 2022, 11, 1432 13 of 17
increment in bentonite value from 450 up to 800 mg/L resulted in an enhancement in theantioxidant capacity of red wine (2.90–2.92 mg/mL) [32]. It seems that bentonite absorbssome phenols involved in antioxidant activity, such as catechin and caffeic acid [31].
Foods 2022, 11, x FOR PEER REVIEW 15 of 18
(A) (B)
(C) (D)
(E) (F)
Figure 4. Response surface plot of the effects of bentonite, gelatin, and diatomite concentration and
clarifying time on grape juice’s antioxidant capacity reduction amount (%). Influence of (A): gelatin
and bentonite, (B): diatomite and bentonite, (C): time and bentonite, (D): diatomite and gelatin, (E):
time and gelatin, (F): time and diatomite, on grape juice’s antioxidant capacity reduction amount
(%).
Figure 4. Response surface plot of the effects of bentonite, gelatin, and diatomite concentrationand clarifying time on grape juice’s antioxidant capacity reduction amount (%). Influence of(A): gelatin and bentonite, (B): diatomite and bentonite, (C): time and bentonite, (D): diatomiteand gelatin, (E): time and gelatin, (F): time and diatomite, on grape juice’s antioxidant capacityreduction amount (%).
The lowest effect on reducing antioxidant activity among the three clarifiers was shownby gelatin (Table 4). Some authors indicated that gelatin causes red wine’s antioxidantcapacity, similar to our results [46,58]. In contrast to these findings, Ghanem et al. (2017)demonstrated that wine samples clarified with a high gelatin concentration had greaterantioxidant capacity than those with a low level of this clarifier [32]. Dıblan et al. (2021)
Foods 2022, 11, 1432 14 of 17
found that the binding of phenolic acid as an antioxidant compound to protein clarifierssuch as gelatin could decrease the antioxidant capacity of grape juice [31].
Diatomite, with a high coefficient, has the most significant effect on reducing antioxidantcapacity (Table 4). In order to manufacture grape juice concentrate, Capanoglu et al. (2013)employed diatomite for filtration and reported that it diminished antioxidant activity from439 to 378 µmol/g (approximately 13.9%) [30]. On the other hand, according to Farah-mand et al. (2017), diatomite filtration reduces the antioxidant content of pomegranate juicefrom 8 to 7.1 µg/mL (approximately 11.25%) [59]. It is explained that some antioxidantcomponents in grape juice, such as anthocyanin, have a positive charge and can flocculatewith negatively charged diatomite [50,60].
As seen in Figure 4B,D,F, the elimination of antioxidant activity can be improved byexpanding the clarifier’s contact time (X4) with grape juice from 1 to 3 h. To our knowledge,no data exist on clarification time’s influence on antioxidant activity.
3.7. Process Optimization
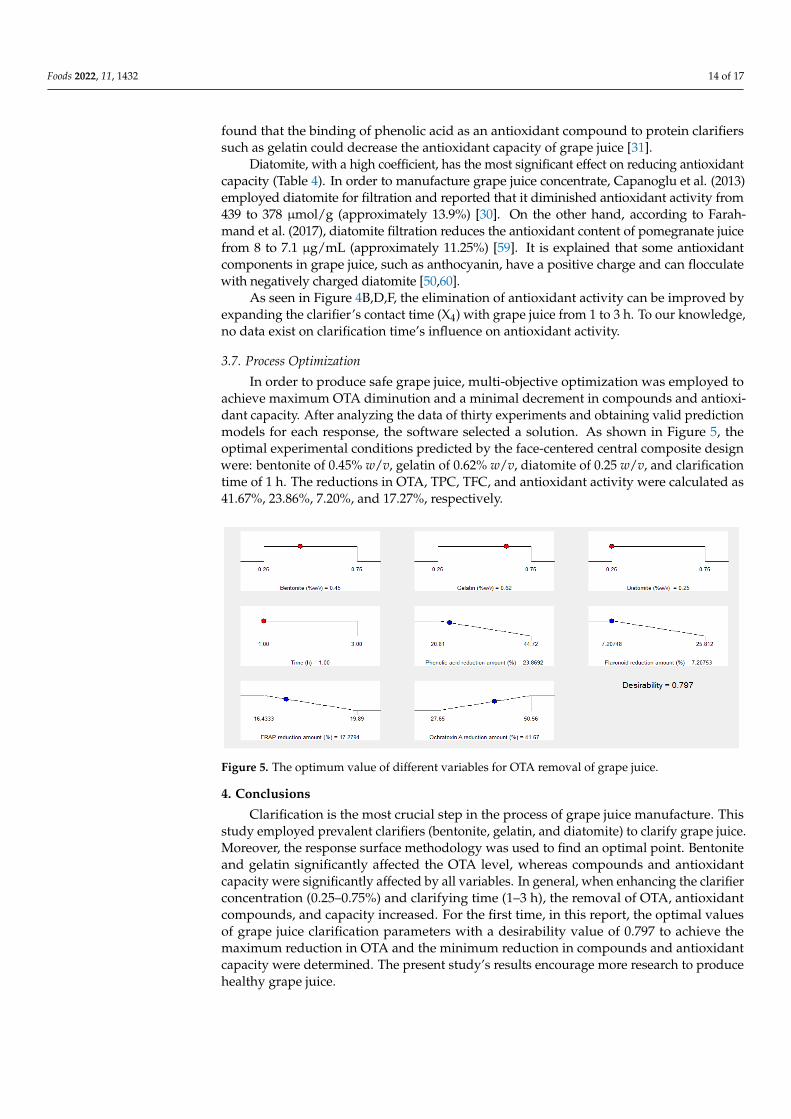
In order to produce safe grape juice, multi-objective optimization was employed toachieve maximum OTA diminution and a minimal decrement in compounds and antioxi-dant capacity. After analyzing the data of thirty experiments and obtaining valid predictionmodels for each response, the software selected a solution. As shown in Figure 5, theoptimal experimental conditions predicted by the face-centered central composite designwere: bentonite of 0.45% w/v, gelatin of 0.62% w/v, diatomite of 0.25 w/v, and clarificationtime of 1 h. The reductions in OTA, TPC, TFC, and antioxidant activity were calculated as41.67%, 23.86%, 7.20%, and 17.27%, respectively.
Foods 2022, 11, x FOR PEER REVIEW 16 of 18
Figure 5. The optimum value of different variables for OTA removal of grape juice.
4. Conclusions Clarification is the most crucial step in the process of grape juice manufacture. This
study employed prevalent clarifiers (bentonite, gelatin, and diatomite) to clarify grape juice. Moreover, the response surface methodology was used to find an optimal point. Bentonite and gelatin significantly affected the OTA level, whereas compounds and anti-oxidant capacity were significantly affected by all variables. In general, when enhancing the clarifier concentration (0.25–0.75%) and clarifying time (1–3 h), the removal of OTA, antioxidant compounds, and capacity increased. For the first time, in this report, the opti-mal values of grape juice clarification parameters with a desirability value of 0.797 to achieve the maximum reduction in OTA and the minimum reduction in compounds and antioxidant capacity were determined. The present study’s results encourage more re-search to produce healthy grape juice.
Author Contributions: Conceptualization, A.H. and M.B.; methodology, A.H. and F.M.; software, A.H. and M.B.; validation, A.H.; formal analysis, M.B.; investigation, M.B.; resources, M.B.; data curation, M.B.; writing—original draft preparation, A.H. and M.B.; writing—review and editing, A.M.K.; visualization, A.H.; supervision, A.H.; project administration, M.B.; funding acquisition, A.H. and A.M.K. All authors have read and agreed to the published version of the manuscript.
Funding: This study with No. 140003111880 was financially supported by the Center of Research and Technology of Hamadan University of Medical Sciences and Health Services.
Institutional Review Board Statement: The study was conducted in accordance with the Declara-tion of Helsinki, and approved by the Ethics Committee of Hamadan University of Medical Sciences and Health Services (protocol code: IR.UMSHA.REC.1400.109 and date of approval: 1 May 2021).
Informed Consent Statement: Not applicable.
Data Availability Statement: The data obtained from the study are presented and discussed in the manuscript.
Acknowledgments: The authors are thankful to Amir Daraei Garmakhany for his help in conduct-ing the optimization.
Conflicts of Interest: All the authors declare that they do not have any conflict of interest in this study.
References 1. Balali-Mood, M.; Riahi-Zanjani, B.; Mahdizadeh, A.; Moradi, V.; Fazeli-Bakhtiyari, R. Arsenic and lead contaminations in
commercial fruit juices of markets in Mashhad, Iran. Iran. J. Toxicol. 2018, 12, 15–20. 2. Muñoz-Robredo, P.; Robledo, P.; Manríquez, D.; Molina, R.; Defilippi, B.G. Characterization of sugars and organic acids in
commercial varieties of table grapes. Chil. J. Agric. Res. 2011, 71, 452.
Figure 5. The optimum value of different variables for OTA removal of grape juice.
4. Conclusions
Clarification is the most crucial step in the process of grape juice manufacture. Thisstudy employed prevalent clarifiers (bentonite, gelatin, and diatomite) to clarify grape juice.Moreover, the response surface methodology was used to find an optimal point. Bentoniteand gelatin significantly affected the OTA level, whereas compounds and antioxidantcapacity were significantly affected by all variables. In general, when enhancing the clarifierconcentration (0.25–0.75%) and clarifying time (1–3 h), the removal of OTA, antioxidantcompounds, and capacity increased. For the first time, in this report, the optimal valuesof grape juice clarification parameters with a desirability value of 0.797 to achieve themaximum reduction in OTA and the minimum reduction in compounds and antioxidantcapacity were determined. The present study’s results encourage more research to producehealthy grape juice.
Foods 2022, 11, 1432 15 of 17
Author Contributions: Conceptualization, A.H. and M.B.; methodology, A.H. and F.M.; software,A.H. and M.B.; validation, A.H.; formal analysis, M.B.; investigation, M.B.; resources, M.B.; datacuration, M.B.; writing—original draft preparation, A.H. and M.B.; writing—review and editing,A.M.K.; visualization, A.H.; supervision, A.H.; project administration, M.B.; funding acquisition, A.H.and A.M.K. All authors have read and agreed to the published version of the manuscript.
Funding: This study with No. 140003111880 was financially supported by the Center of Researchand Technology of Hamadan University of Medical Sciences and Health Services.
Institutional Review Board Statement: The study was conducted in accordance with the Declarationof Helsinki, and approved by the Ethics Committee of Hamadan University of Medical Sciences andHealth Services (protocol code: IR.UMSHA.REC.1400.109 and date of approval: 1 May 2021).
Informed Consent Statement: Not applicable.
Data Availability Statement: The data obtained from the study are presented and discussed inthe manuscript.
Acknowledgments: The authors are thankful to Amir Daraei Garmakhany for his help in conductingthe optimization.
Conflicts of Interest: All the authors declare that they do not have any conflict of interest in this study.
References1. Balali-Mood, M.; Riahi-Zanjani, B.; Mahdizadeh, A.; Moradi, V.; Fazeli-Bakhtiyari, R. Arsenic and lead contaminations in
commercial fruit juices of markets in Mashhad, Iran. Iran. J. Toxicol. 2018, 12, 15–20. [CrossRef]2. Muñoz-Robredo, P.; Robledo, P.; Manríquez, D.; Molina, R.; Defilippi, B.G. Characterization of sugars and organic acids in
commercial varieties of table grapes. Chil. J. Agric. Res. 2011, 71, 452. [CrossRef]3. Cosme, F.; Pinto, T.; Vilela, A. Phenolic compounds and antioxidant activity in grape juices: A chemical and sensory view.
Beverages 2018, 4, 22. [CrossRef]4. Dutra, M.d.C.P.; Rodrigues, L.L.; de Oliveira, D.; Pereira, G.E.; dos Santos Lima, M. Integrated analyses of phenolic compounds
and minerals of Brazilian organic and conventional grape juices and wines: Validation of a method for determination of Cu, Feand Mn. Food Chem. 2018, 269, 157–165. [CrossRef]
5. Heshmati, A.; Nili-Ahmadabadi, A.; Rahimi, A.; Vahidinia, A.; Taheri, M. Dissipation behavior and risk assessment of fungicideand insecticide residues in grape under open-field, storage and washing conditions. J. Clean. Prod. 2020, 270, 122287. [CrossRef]
6. Dutra, M.d.C.P.; Viana, A.C.; Pereira, G.E.; Nassur, R.d.C.M.R.; dos Santos Lima, M. Whole, concentrated and reconstituted grapejuice: Impact of processes on phenolic composition,“foxy” aromas, organic acids, sugars and antioxidant capacity. Food Chem.2021, 343, 128399. [CrossRef]
7. Chanson-Rolle, A.; Braesco, V.; Chupin, J.; Bouillot, L. Nutritional composition of orange juice: A comparative study betweenFrench commercial and home-made juices. Food Nutr. Sci. 2016, 7, 252. [CrossRef]
8. Jiménez, M.; Juárez, N.; Jiménez-Fernández, V.; Monribot-Villanueva, J.; Guerrero-Analco, J. Phenolic compounds and antioxidantactivity of wild grape (Vitis tiliifolia). Ital. J. Food Sci. 2018, 30, 1.
9. Khazaei, S.; Talebi Ghane, E.; Bashirian, S.; Mehri, F. The concentration of potentially toxic elements (PTEs) in fruit juices: A globalsystematic review, meta-analysis and probabilistic health risk assessment. Int. J. Environ. Anal. Chem. 2021, 1–13. [CrossRef]
10. Genchev, R.; Angelova, G.; Laskova, I.; Gotcheva, V.; Angelov, A. Mycoflora of fresh chokeberry (Aronia melanocarpa) andochratoxin-producing ability of Penicillium isolates. Qual. Assur. Saf. Crops Foods 2015, 7, 123–131. [CrossRef]
11. Welke, J.E. Fungal and mycotoxin problems in grape juice and wine industries. Curr. Opin. Food Sci. 2019, 29, 7–13. [CrossRef]12. Heshmati, A.; Ghadimi, S.; Ranjbar, A.; Khaneghah, A.M. Assessment of processing impacts and type of clarifier on the
concentration of ochratoxin A in pekmez as a conventional grape-based product. LWT 2020, 119, 108882. [CrossRef]13. Heshmati, A.; Mozaffari Nejad, A.S. Ochratoxin A in dried grapes in Hamadan province, Iran. Food Addit. Contam. Part B 2015, 8,
255–259. [CrossRef] [PubMed]14. Ortiz-Villeda, B.; Lobos, O.; Aguilar-Zuniga, K.; Carrasco-Sánchez, V. Ochratoxins in wines: A review of their occurrence in the
last decade, toxicity, and exposure risk in humans. Toxins 2021, 13, 478. [CrossRef] [PubMed]15. Wei, D.; Wu, X.; Xu, J.; Dong, F.; Liu, X.; Zheng, Y.; Ji, M. Determination of Ochratoxin A contamination in grapes, processed
grape products and animal-derived products using ultra-performance liquid chromatography-tandem mass spectroscopy system.Sci. Rep. 2018, 8, 1–8.
16. Khaneghah, A.M.; Fakhri, Y.; Abdi, L.; Coppa, C.F.S.C.; Franco, L.T.; de Oliveira, C.A.F. The concentration and prevalence ofochratoxin A in coffee and coffee-based products: A global systematic review, meta-analysis and meta-regression. Fungal Biol.2019, 123, 611–617. [CrossRef]
17. Heshmati, A.; Zohrevand, T.; Khaneghah, A.M.; Nejad, A.S.M.; Sant’Ana, A.S. Co-occurrence of aflatoxins and ochratoxin A indried fruits in Iran: Dietary exposure risk assessment. Food Chem. Toxicol. 2017, 106, 202–208. [CrossRef]
Foods 2022, 11, 1432 16 of 17
18. Batrinou, A.; Houhoula, D.; Papageorgi, E. Rapid detection of mycotoxins on foods and beverages with enzyme-linked im-munosorbent assay. Qual. Assur. Saf. Crops Foods 2020, 12, 40–49. [CrossRef]
19. Bui-Klimke, T.R.; Wu, F. Ochratoxin A and human health risk: A review of the evidence. Crit. Rev. Food Sci. Nutr. 2015, 55,1860–1869. [CrossRef]
20. Nourbakhsh, F.; Tajbakhsh, E. Neurotoxicity mechanism of Ochratoxin A. Qual. Assur. Saf. Crops Foods 2021, 13, 34–45. [CrossRef]21. Mehri, F.; Esfahani, M.; Heshmati, A.; Jenabi, E.; Khazaei, S. The prevalence of ochratoxin A in dried grapes and grape-derived
products: A systematic review and meta-analysis. Toxin Rev. 2020, 41, 1–10. [CrossRef]22. Oteiza, J.M.; Khaneghah, A.M.; Campagnollo, F.B.; Granato, D.; Mahmoudi, M.R.; Sant’Ana, A.S.; Gianuzzi, L. Influence of
production on the presence of patulin and ochratoxin A in fruit juices and wines of Argentina. LWT 2017, 80, 200–207. [CrossRef]23. Var, I.; Kabak, B.; Erginkaya, Z. Reduction in ochratoxin A levels in white wine, following treatment with activated carbon and
sodium bentonite. Food Control 2008, 19, 592–598. [CrossRef]24. Quintela, S.; Villarán, M.C.; de Armentia, I.L.; Elejalde, E. Ochratoxin A removal in wine: A review. Food Control 2013, 30, 439–445.
[CrossRef]25. Shukla, S.; Park, J.H.; Kim, M. Efficient, safe, renewable, and industrially feasible strategy employing Bacillus subtilis with
alginate bead composite for the reduction of ochratoxin A from wine. J. Clean. Prod. 2020, 242, 118344. [CrossRef]26. Dachery, B.; Hernandes, K.C.; Veras, F.F.; Schmidt, L.; Augusti, P.R.; Manfroi, V.; Zini, C.A.; Welke, J.E. Effect of Aspergillus
carbonarius on ochratoxin a levels, volatile profile and antioxidant activity of the grapes and respective wines. Food Res. Int. 2019,126, 108687. [CrossRef] [PubMed]
27. Cosme, F.; Inês, A.; Silva, D.; Filipe-Ribeiro, L.; Abrunhosa, L.; Nunes, F.M. Elimination of ochratoxin A from white and red wines:Critical characteristics of activated carbons and impact on wine quality. LWT 2021, 140, 110838. [CrossRef]
28. Lulamba, T.E.; Stafford, R.A.; Njobeh, P.B. The relative effectiveness of two filter aids in removing ochratoxin A during beerfiltration. J. Inst. Brew. 2019, 125, 422–432. [CrossRef]
29. Sun, X.; Niu, Y.; Ma, T.; Xu, P.; Huang, W.; Zhan, J. Determination, content analysis and removal efficiency of fining agents onochratoxin A in Chinese wines. Food Control 2017, 73, 382–392. [CrossRef]
30. Capanoglu, E.; de Vos, R.C.; Hall, R.D.; Boyacioglu, D.; Beekwilder, J. Changes in polyphenol content during production of grapejuice concentrate. Food Chem. 2013, 139, 521–526. [CrossRef]
31. Dıblan, S.; Özkan, M. Effects of various clarification treatments on anthocyanins, color, phenolics and antioxidant activity of redgrape juice. Food Chem. 2021, 352, 129321. [CrossRef] [PubMed]
32. Ghanem, C.; Taillandier, P.; Rizk, M.; Rizk, Z.; Nehme, N.; Souchard, J.P.; El Rayess, Y. Analysis of the impact of fining agentstypes, oenological tannins and mannoproteins and their concentrations on the phenolic composition of red wine. LWT Food Sci.Technol. 2017, 83, 101–109. [CrossRef]
33. Pacheco-Palencia, L.A.; Hawken, P.; Talcott, S.T. Phytochemical, antioxidant and pigment stability of açai (Euterpe oleracea Mart.)as affected by clarification, ascorbic acid fortification and storage. Food Res. Int. 2007, 40, 620–628. [CrossRef]
34. Heshmati, A.; Mehri, F.; Nili-Ahmadabadi, A.; Khaneghah, A.M. The fate of ochratoxin A during grape vinegar production. Int. J.Environ. Anal. Chem. 2021, 1–10. [CrossRef]
35. Pankaj, S.K.; Wan, Z.; Colonna, W.; Keener, K.M. Effect of high voltage atmospheric cold plasma on white grape juice quality. J.Sci. Food Agric. 2017, 97, 4016–4021. [CrossRef]
36. Langley-Evans, S.C. Antioxidant potential of green and black tea determined using the ferric reducing power (FRAP) assay. Int. J.Food Sci. Nutr. 2000, 51, 181–188. [CrossRef]
37. Stroka, J.; Ambrosio, M.; Doncheva, I.; Lerda, D.; Mischke, C.; Breidbach, A. Validation of an Analytical Method to Determine theContent of Ochratoxin A in Animal Feed. European Commission Joint Research Centre Institute for Reference Materials and Measurements;Office for Official Publications of the European Communities: Luxembourg, 2009; p. 54.
38. Leong, S.L.L.; Hocking, A.D.; Scott, E.S. The effect of juice clarification, static or rotary fermentation and fining on ochratoxin A inwine. Aust. J. Grape Wine Res. 2006, 12, 245–251. [CrossRef]
39. Mine Kurtbay, H.; Bekçi, Z.; Merdivan, M.; Yurdakoç, K. Reduction of ochratoxin A levels in red wine by bentonite, modifiedbentonites, and chitosan. J. Agric. Food Chem. 2008, 56, 2541–2545. [CrossRef]
40. Castellari, M.; Versari, A.; Fabiani, A.; Parpinello, G.P.; Galassi, S. Removal of ochratoxin A in red wines by means of adsorptiontreatments with commercial fining agents. J. Agric. Food Chem. 2001, 49, 3917–3921. [CrossRef]
41. Nones, J.; Riella, H.G.; Trentin, A.G.; Nones, J. Effects of bentonite on different cell types: A brief review. Appl. Clay Sci. 2015, 105,225–230. [CrossRef]
42. Downing, D. Canning of juices, fruit drinks and water. In A Complete Course in Canning, Book III; Woodhead Publishing:Cambridge, UK, 1996.
43. Al-Ghouti, M.A.; Al-Degs, Y.S.; Khraisheh, M.A.; Ahmad, M.N.; Allen, S.J. Mechanisms and chemistry of dye adsorption onmanganese oxides-modified diatomite. J. Environ. Manag. 2009, 90, 3520–3527. [CrossRef] [PubMed]
44. Concenco, F.; Brotto, G.F.; Nora, L. Grape wine and juice: Comparison on resveratrol levels. Int. J. Adv. Res. Sci. Eng. Technol.2019, 6, 368–386. [CrossRef]
45. Gulcin, I. Antioxidants and antioxidant methods: An updated overview. Arch. Toxicol. 2020, 94, 651–715. [CrossRef] [PubMed]46. Gonçalves, F.J.; Jordão, A.M. Influence of different commercial fining agents on proanthocyanidin fraction and antioxidant activity
of a red wine from Baga grapes. OENO One 2009, 43, 111–120. [CrossRef]

Foods 2022, 11, 1432 17 of 17
47. Balík, J.; Kyseláková, M.; Tríska, J.; Vrchotová, N.; Veverka, J.; Híc, P.; Totušek, J.; Lefnerová, D. The changes of selected phenolicsubstances in wine technology. Czech J. Food Sci. 2009, 26, S3–S12. [CrossRef]
48. Dordoni, R.; Galasi, R.; Colangelo, D.; De Faveri, D.M.; Lambri, M. Effects of fining with different bentonite labels and doses oncolloidal stability and colour of a Valpolicella red wine. Int. J. Food Sci. Technol. 2015, 50, 2246–2254. [CrossRef]
49. González-Neves, G.; Favre, G.; Gil, G. Effect of fining on the colour and pigment composition of young red wines. Food Chem.2014, 157, 385–392. [CrossRef]
50. Wasila, H.; Li, X.; Liu, L.; Ahmad, I.; Ahmad, S. Peel effects on phenolic composition, antioxidant activity, and making ofpomegranate juice and wine. J. Food Sci. 2013, 78, C1166–C1172. [CrossRef]
51. Bagci, P.O. Effective clarification of pomegranate juice: A comparative study of pretreatment methods and their influence onultrafiltration flux. J. Food Eng. 2014, 141, 58–64. [CrossRef]
52. Fang, Z.; Zhang, M.; Du, W.; Sun, J. Effect of fining and filtration on the haze formation in bayberry (Myrica rubra Sieb. et Zucc.)juice. J. Agric. Food Chem. 2007, 55, 113–119. [CrossRef]
53. Ibrahim, S.M.; Bin Jumah, M.N.; Othman, S.I.; Alruhaimi, R.S.; Al-Khalawi, N.; Salama, Y.F.; Allam, A.A.; Abukhadra, M.R.Synthesis of Chitosan/Diatomite Composite as an Advanced Delivery System for Ibuprofen Drug; Equilibrium Studies and the ReleaseProfile; ACS Omega: Washington, DC, USA, 2021.
54. Ren, M.; Liu, S.; Li, R.; You, Y.; Huang, W.; Zhan, J. Clarifying effect of different fining agents on mulberry wine. Int. J. Food Sci.Technol. 2020, 55, 1578–1585. [CrossRef]
55. Martínez-Patiño, J.C.; Gullón, B.; Romero, I.; Ruiz, E.; Brncic, M.; Žlabur, J.Š.; Castro, E. Optimization of ultrasound-assistedextraction of biomass from olive trees using response surface methodology. Ultrason. Sonochemistry 2019, 51, 487–495. [CrossRef][PubMed]
56. Perez-Vizcaino, F.; Fraga, C.G. Research trends in flavonoids and health. Arch. Biochem. Biophys. 2018, 646, 107–112. [CrossRef]57. Sridhar, K.; Charles, A.L. In vitro antioxidant activity of Kyoho grape extracts in DPPH and ABTS assays: Estimation methods for
EC50 using advanced statistical programs. Food Chem. 2019, 275, 41–49. [CrossRef] [PubMed]58. Yildirim, H.K. Effects of fining agents on antioxidant capacity of red wines. J. Inst. Brew. 2011, 117, 55–60. [CrossRef]59. Farahmand, M.; Golmakani, M.T.; Mesbahi, G.; Farahnaky, A. Investigating the effects of large-scale processing on phytochemicals
and antioxidant activity of pomegranate juice. J. Food Process. Preserv. 2017, 41, e12792. [CrossRef]60. Zhang, L.; Wu, G.; Wang, W.; Yue, J.; Yue, P.; Gao, X. Anthocyanin profile, color and antioxidant activity of blueberry (Vaccinium
ashei) juice as affected by thermal pretreatment. Int. J. Food Prop. 2019, 22, 1035–1046. [CrossRef]
Related Documents