• DO NOT REMOVE FROM LIBRARY m 31 ,. p IRII s953 1 r I I Removal of Magnesia From DOlomitic Southern Florida Phosphate Concentrates by Aqueous S02 Leaching By J. P. Hansen, B. E. Davis, and T. O. Llewellyn UNITED STATES DEPARTMENT OF THE INTERIOR MINES 75TH A

Welcome message from author
This document is posted to help you gain knowledge. Please leave a comment to let me know what you think about it! Share it to your friends and learn new things together.
Transcript
•P~EASE DO NOT REMOVE FROM LIBRARY
m 31 ,. p
~ IRII s9531
rII
Removal of Magnesia From DOlomiticSouthern Florida Phosphate Concentratesby Aqueous S02 Leaching
By J. P. Hansen, B. E. Davis, and T. O. Llewellyn
UNITED STATES DEPARTMENT OF THE INTERIOR i~~iO~.~~
MINES 75TH A~
Report of Investigations 8953
Removal of Magnesia From Dolomitic Southern Florida Phosphate Concentrates by Aqueous S02 Leaching
By J. P. Hansen, B. E. Davis, and T. O. Llewellyn
UNITED STATES DEPARTMENT OF THE INTERIOR Donald Paul Hodel, Secretary
BUREAU OF MINES Robert C. Horton, Director
Research at the Tuscaloosa Research Center is carried out under a memorandum of agreement between the Bureau of Mines, U.S. Department of the Interior, and the University of Alabama.
Library of Congress Cataloging in Publication Data:
Hansen, J, p, (John Paul), 1928-Removal of magnesia from dolomitic southern Florida phosphate
concentrates by aqueous S02 leaching.
(Report of investigations / United States Department of the Interior, Bureau of Mines; 8953)
Bibliography: p. 10-11.
Supt. of Docs. no. : I 28.23:8953.
1. Magnesium ores-Florida. 2. Dolomite-Florida. 3. Leaching. 4. Sulphur dioxide. I. Davis, B. E. (Broderick E.). II. Llewellyn, T. 0. III. Title. IV. Series: Report of investigations (United States. Bureau of Mines) ; 8953.
TN23, U43 [TN799.M2] 6228 [669'.723] 84-600371
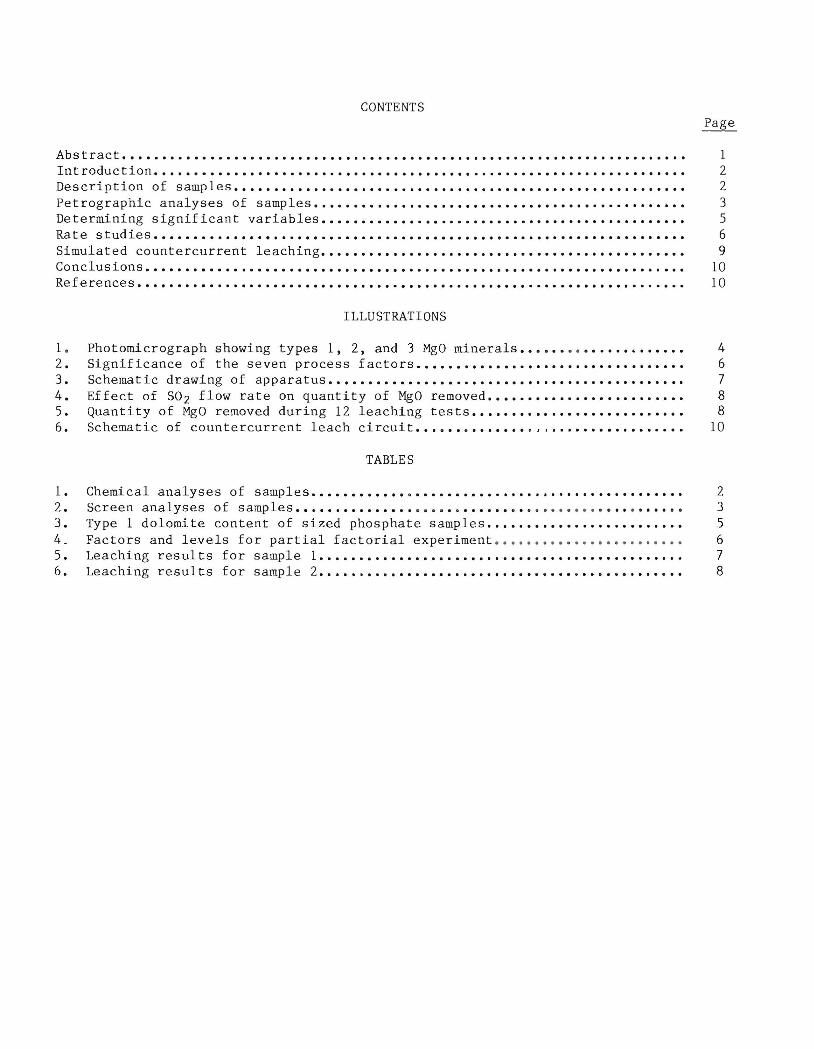
CONTENTS
Abstract....................................................................... 1 Introduction ••..••••••••••.••.•.••.•••••••••••••••••...•...•...••.•.•.•.•••.••• 2 Description of samples......................................................... 2 Petrographic analyses of samples............................................... 3 Determining significant variables.............................................. 5 Rate studies................................................................... 6 Simulated countercurrent leaching.............................................. 9 Conclusions. • • • • • . • • • •• . . • • • • • • • • . • • . • • • • •• •••. . • • • • • • • . • • • • • • . . • . •• • • • • • • • . •• • 10 References. • • • . • • . • • . . . • . • . • • • . • •• • •••• • • • . • • • • • • . . . • • . •• • • . . •. . •• • • • • •. . . . . • . . 10
ILLUSTRATIONS
1 . Photomicrograph showing types 1, 2, and 3 MgO minerals... . .. . . ............. 4 2. Significance of the seven process factors.................................. 6 3. Schematic drawing of apparatus............................................. 7 4. Effect of S02 flow rate on quantity of MgO removed......................... 8 5. Quantity of MgO removed during 12 leaching tests........................... 8 6. Schematic of countercurrent leach circuit...... . ....... . ................... 10
TABLES
1. Chemical analyses of samples .•...••.•••• 0 • • • • • • • • • • • • • • • • • • • • • • • •• • • • • • • • • • 2 2. Screen analyses of samples............... .... .......... ...... ... .. .. .. ..... 3 3. Type 1 dolomite content of sized phosphate samples......................... 5 4_ Factors and levels for partial factorial experiment ........................ 6 5. Leaching results for sample 1.............................................. 7 6. Leaching results for sample 2.............................................. 8

UNIT OF MEASURE ABBREVIATIONS USED IN THIS REPORT
°c degree Celsius mL/min milliliter per minute
g gram min minute
h hour 11m micrometer
in inch pct percent
lb pound t metric ton
lb/ton pound per ton wt pct weight percent
mL milliliter
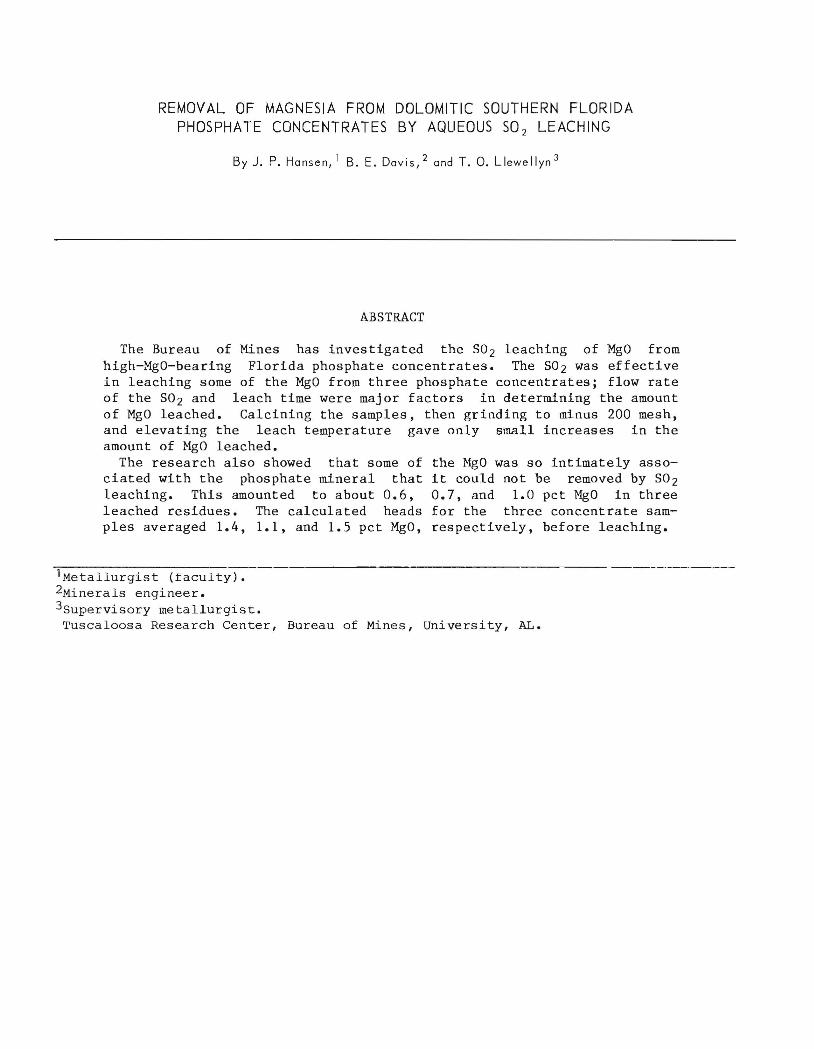
REMOVAL OF MAGNESIA FROM DOLOMITIC SOUTHERN FLORIDA PHOSPHATE CONCENTRATES BY AQUEOUS S02 LEACHING
By J. P. Hansen, 1 B. E. Davis, 2 and T. O. Llewellyn 3
ABSTRACT
The Bureau of Mines has investigated the S02 leaching of MgO from high-MgO-bearing Florida phosphate concentrates. The S02 was effective in leaching some of the MgO from three phosphate concentrates; flow rate of the S02 and leach time were major factors in determining the amount of MgO leached. Calcining the samples, then grinding to minus 200 mesh, and elevating the leach temperature gave only small increases in the amount of MgO leached.
The research also showed that some of the MgO was so intimately associated with the phosphate mineral that it could not be removed by S02 leaching. This amounted to about 0.6, 0.7, and 1.0 pct MgO in three leached residues. The calculated heads for the three concentrate samples averaged 1.4, 1.1, and 1.5 pct MgO, respectively, before leaching.
lMetallurgist (faculty). 2Minerals engineer. 3Supervisory metallurgist. Tuscaloosa Research Center, Bureau of Mines, University, AL.
2
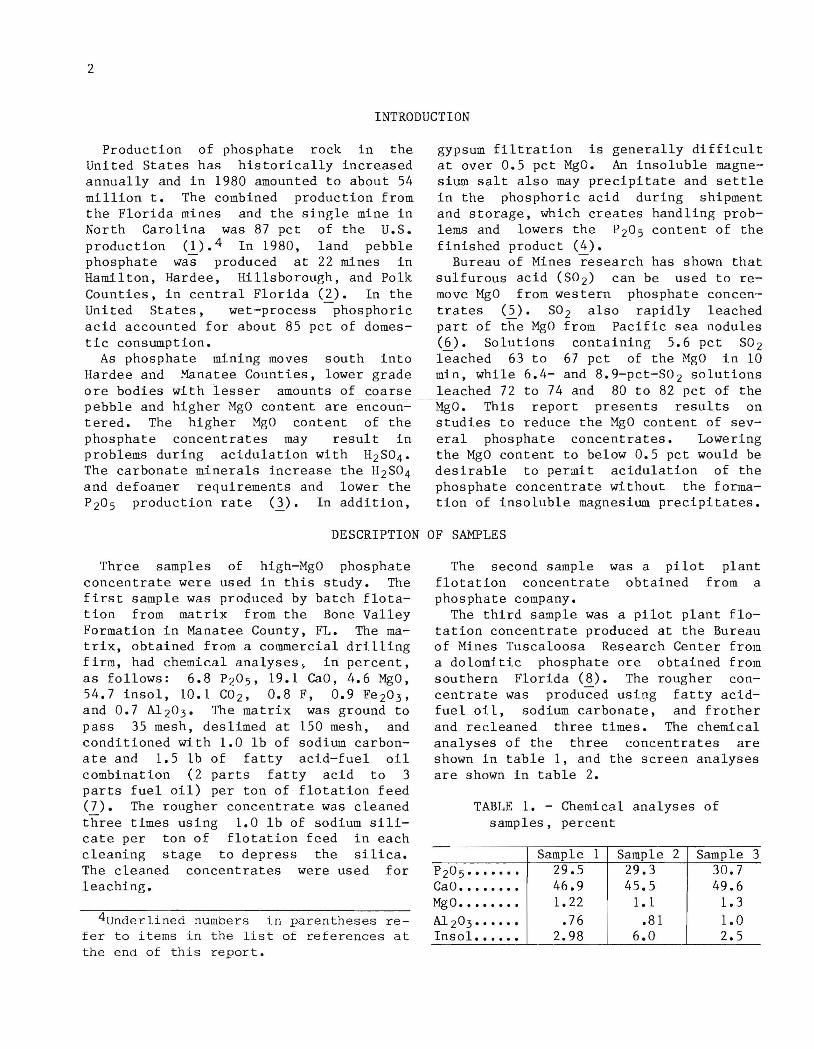
INTRODUCTION
Production of phosphate rock in the United States has historically increased annually and in 1980 amounted to about 54 million t. The combined production from the Florida mines and the single mine in North Carolina was 87 pct of the U.S. production (1).4 In 1980, land pebble phosphate was produced at 22 mines in Hamilton, Hardee, Hillsborough, and Polk Counties, in central Florida (2). In the United States, wet-process -phosphoric acid accounted for about 85 pct of domestic consumption.
As phosphate mining moves south into Hardee and Manatee Counties, lower grade ore bodies with lesser amounts of coarse pebble and higher MgO content are encountered. The higher MgO content of the phosphate concentrates may result in problems during acidulation with H2S0 4 • The carbonate minerals increase the H2S0 4 and defoamer requirements and lower the P 20 5 production rate (1). In addition,
gypsum filtration is generally difficult at over 0.5 pct MgO. An insoluble magnesium salt also may precipitate and settle in the phosphoric acid during shipment and storage, which creates handling problems and lowers the P20 5 content of the finished product (4).
Bureau of Mines research has shown that sulfurous acid (S02) can be used to remove MgO from western phosphate concen-trates (5). S02 also rapidly leached part of the MgO from Pacific sea nodules (6). Solutions containing 5.6 pct S02 leached 63 to 67 pct of the MgO in 10 min, while 6.4- and 8.9-pct-S0 2 solutions leached 72 to 74 and 80 to 82 pct of the MgO. This report presents results on studies to reduce the MgO content of several phosphate concentrates. Lowering the MgO content to below 0.5 pct would be desirable to permit acidulation of the phosphate concentrate without the formation of insoluble magnesium precipitates.
DESCRIPTION OF SAMPLES
Three samples of high-MgO phosphate concentrate were used in this study. The first sample was produced by batch flotation from matrix from the Bone Valley Formation in Manatee County, FL. The matrix, obtained from a commercial drilling firm, had chemical analyses, in percent, as follows: 6.8 P205, 19.1 CaO, 4.6 MgO, 54.7 insol, 10.1 C02, 0.8 F, 0.9 Fe203, and 0.7 Al 20 3 • The matrix was ground to pass 35 mesh, deslimed at 150 mesh, and conditioned with 1.0 lb of sodium carbonate and 1.5 lb of fatty acid-fuel oil combination (2 parts fatty acid to 3 parts fuel oil) per ton of flotation feed (I). The rougher concentrate was cleaned three times using 1.0 lb of sodium silicate per ton of flotation feed in each cleaning stage to depress the silica. The cleaned concentrates were used for leaching.
4Underlined numbers in parentheses refer to items in the list of references at the end of this report.
The second sample was a pilot plant flotation concentrate obtained from a phosphate company.
The third sample was a pilot plant flotation concentrate produced at the Bureau of Mines Tuscaloosa Research Center from a dolomitic phosphate ore obtained from southern Florida (8). The rougher concentrate was produced using fatty acidfuel oil, sodium carbonate, and frother and recleaned three times. The chemical analyses of the three concentrates are shown in table 1, and the screen analyses are shown in table 2.
TABLE 1. - Chemical analyses of samples, percent
Sample 1 Sample 2 Sample P20 5· •••••• 29.5 29.3 30.7 CaO •••••••• 46.9 45.5 49.6 "MgO •••••••• 1.22 1.1 1.3
Al 20 3· ••••• .76 .81 1.0 Insol ••.••• 2.98 6.0 2.5
3
3
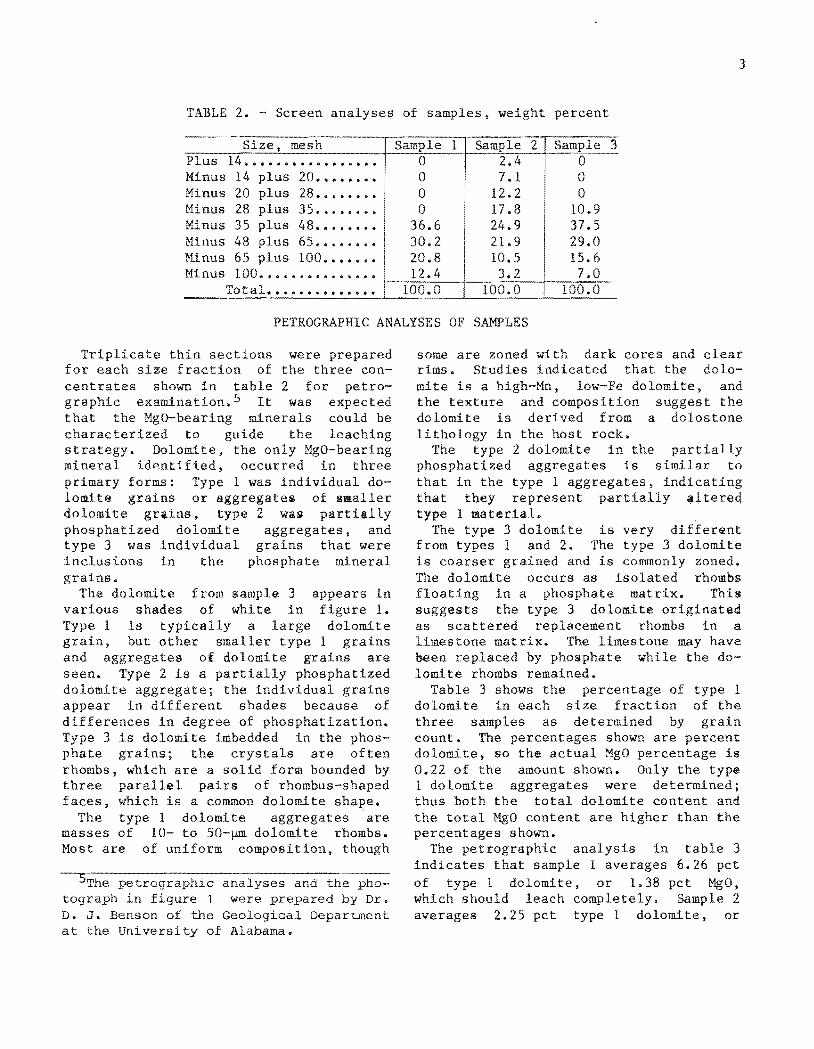
TABLE 2. - Screen of
Size, mesh Sample 1 Sample 2 3 Plus 14 •••.•. ., •...•..•.. 0 2.4 Minus 14 plus 20., ., • ., •••• 0 7.1 0 Minus 20 28 .......... 0 12.2 0 Minus 28 plus 35 ......•. 0 17.8 10.9 Minus 35 plus 48 ....•... 36.6 24.9 37.5 Minus 48 65 ........ .2 21.9 29.0 Minus 65 100 ••••••• 20.8 10.5 15.6 Minus 100 •••.•••..•••••. 12.4 3.2 7.0
Total •••••••••••••• 100.0 100.0 100.0
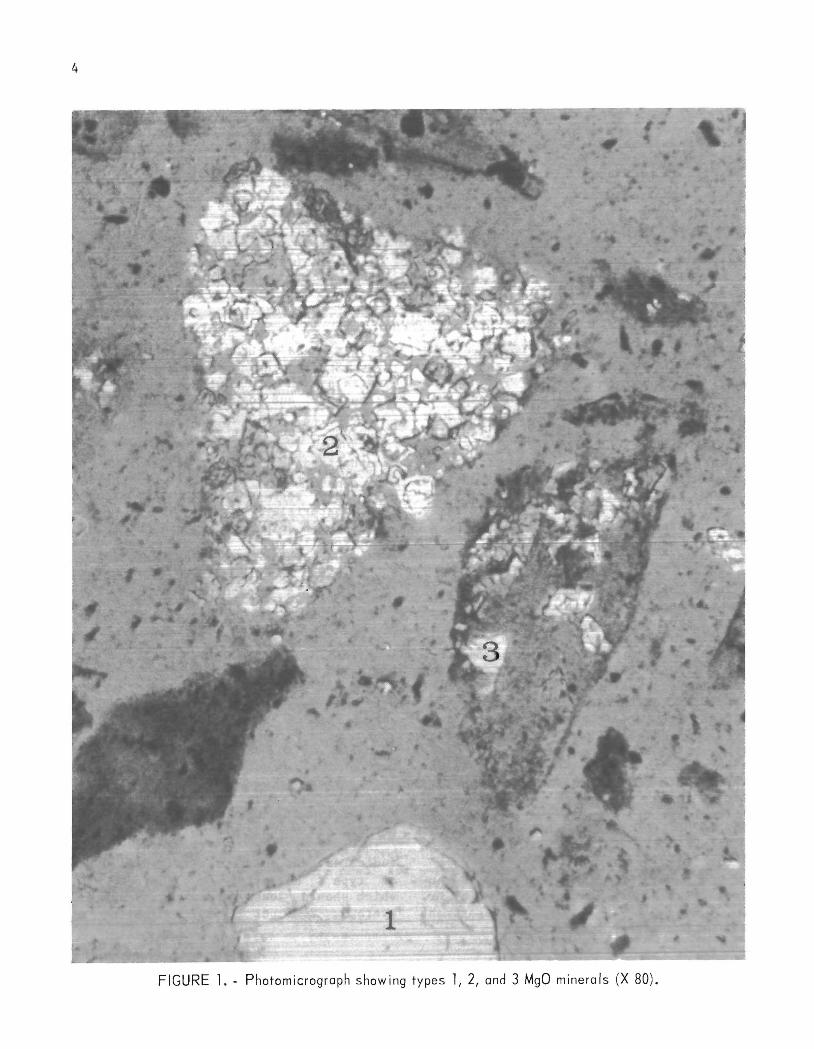
PETROGRAPHIC ANALYSES OF SAMPLES
thin sections for each size fraction of cent rates shown in table graphic examination. 5 It that the
were the three con-2 for petro-
could be leaching
st mineral
the only occurred in three
1 was individual dolomite dolomite phosphatized dolomite type 3 was individual inclusions in the
of smaller was
aggregates, and grains that were
phosphate mineral
The dolomite from 3 appears in various shades of white in 1.
grain, and
is a but other smaller
of dolomite are phosphatized
the individual appear different shades because of differences in degree of phosphatization. Type 3 is dolomite imbedded in the phate ; the crystals are often rhombs, which are a solid form bounded by three pairs of faces, which is a common dolomite shape.
The type 1 dolomite masses of 10- to Most are of uniform
tograph in figure 1 D. J. Benson of the
dolomite
at the Universi of Alabama.
are rhombs.
some are zoned with dark cores and clear rims. Studies indicated that the dolomite is a high-Mn, low-Fe dolomite, and the texture and tion suggest the dolomite is derived from a dolostone
in the host rock. 2 dolomite in the
phosphatized that in the type that they
1 material. The type 3 dolomite
from types 1 and 2. is very
The diffenmt
3 dolomite is coarser and is zoned. The dolomite occurs as isolated rhombs float in a matrix. This suggests the dolomite originated as scattered rhombs in a limestone matrix. The limestone may have been by while the dolomite rhombs remained.
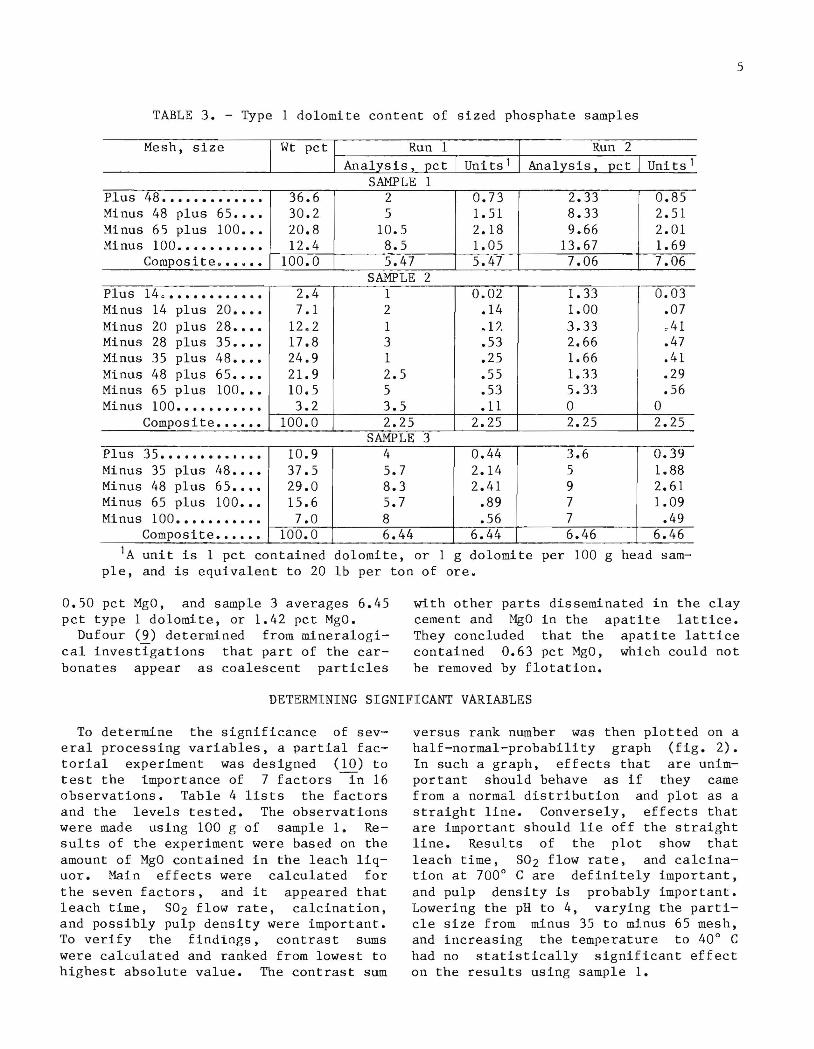
Table 3 shows the of 1 dolomite in each size fraction of the three samples as determined count. The percentages shown are percent dolomite, so the actual MgO is 0.22 of the amount shown. 1 dolomite were determined; thus both the total dolomite content and the total are than the
is in table 3 indicates that sample 1 averages 6.26 pct of 1 dolomite, or 1.38 pct MgO, which should leach completely. Sample 2 averages 2.25 1 dolomite, or
4
FIGURE 1. - Photomicrograph show ing types 1,2, and 3 MgO minerals (X 80).
5
TABLE 3. - Type 1 dolomite content of sized phosphate samples
Mesh, size
Units'
Plus 48 .............. 36.6 2 0.73 2.33 0.85 Minus 48 plus 65 •••• 30.2 5 1. 51 8.33 2.51 Minus 65 plus 100 ••• 20.8 10.5 2.18 9.66 2.01 Minus 100 ••••••••••• 12.4 8.5 1. 05 13.67 1. 69
Composite •••••• 100.0 5.47 5.47 7.06 7.06 SAMPLE 2
Plus 14," •••••••••••• 2.4 1 0.02 1.33 0.03 Minus 14 plus 20 •••• 7.1 2 .14 1.00 .07 Minus 20 plus 28 .... 12.2 1 .11. 3.33 041 Minus 28 plus 35 .•.. 17.8 3 .53 2.66 .47 Minus 35 plus 48 .... 24.9 1 .25 1. 66 .41 Minus 48 plus 65 •••• 21.9 2.5 .55 1.33 .29 Minus 65 plus 100 ••• 10.5 5 .53 5.33 .56 Minus 100 ••••••••••• 3.2 3.5 .11 0 0
Composite •••••• 100.0 2.25 2.25 2.25 2.25 SAMPLE 3
Plus 35 ••••••••••••• 10.9 4 0.44 3.6 0.39 Minus 35 plus 48 .... 37.5 5.7 2.14 5 1.88 Minus 48 plus 65 .... 29.0 8.3 2.41 9 2.61 Minus 65 plus 100 ••• 15.6 5.7 .89 7 1.09 Minus 100 ••••••••••• 7.0 8 .56 7 .49
Composite •••••• 100.0 6.44 6.44 6.46 6.46
'A unit is 1 pct contained dolomite, or 1 g dolomite per 100 g head sample, and is equivalent to 20 lb per ton of ore.
0.50 pct MgO, and sample 3 averages 6.45 pct type 1 dolomite, or 1.42 pct MgO.
Dufour (9) determined from mineralogical investigations that part of the carbonates appear as coalescent particles
with other parts disseminated in the clay cement and MgO in the apatite lattice. They concluded that the apatite lattice contained 0.63 pct MgO, which could not be removed by flotation.
DETERMINING SIGNIFICANT VARIABLES
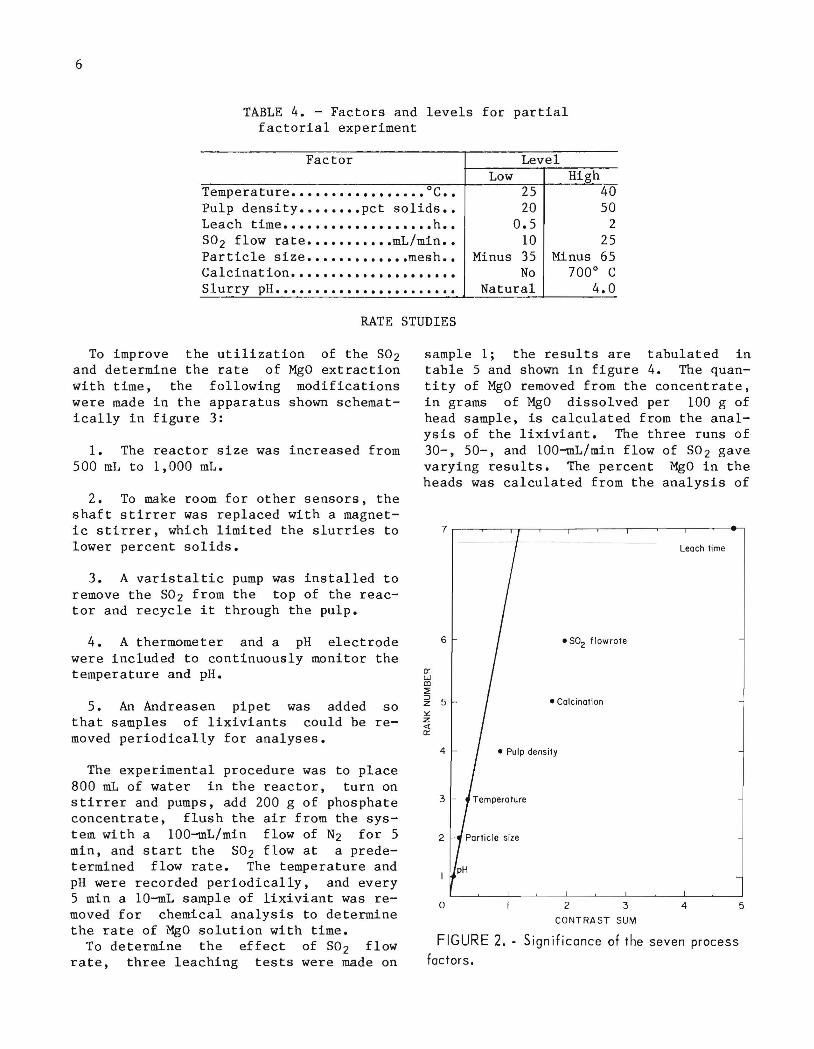
To determine the significance of several processing variables, a partial factorial experiment was designed (10) to test the importance of 7 factors -rn 16 observations. Table 4 lists the factors and the levels tested. The observations were made using 100 g of sample 1. Results of the experiment were based on the amount of MgO contained in the leach liquor. Main effects were calculated for the seven factors, and it appeared that leach time, S02 flow rate, calcination, and possibly pulp density were important. To verify the findings, contrast sums were cal~ulated and ranked from lowest to highest absolute value. The contrast sum
versus rank number was then plotted on a half-normal-probability graph (fig. 2). In such a graph, effects that are unimportant should behave as if they came from a normal distribution and plot as a straight line. Conversely, effects that are important should lie off the straight line. Results of the plot show that leach time, S02 flow rate, and calcination at 700 0 C are definitely important, and pulp density is probably important. Lowering the pH to 4, varying the particle size from minus 35 to minus 65 mesh, and increasing the temperature to 40 0 C had no statistically significant effect on the results using sample 1.
6
TABLE 4. - Factors and levels for partial factorial experiment
Factor
Temperature ••••••••••••••••• oc •• Pulp density •••••••• pct solids •• Leach time ••••••••••••••••••• h •• S02 flow rate ••••••••••• mL/min •• Particle size ••••••••••••• mesh •• Calcination ••••••••••••••••••••• Slurry pH .•••.••.•..•••.•.......
RATE STUDIES
Level Low
25 20
0.5 10
Minus 35 No
Natural
High 40 50
2 25
Minus 65 700° C
4.0
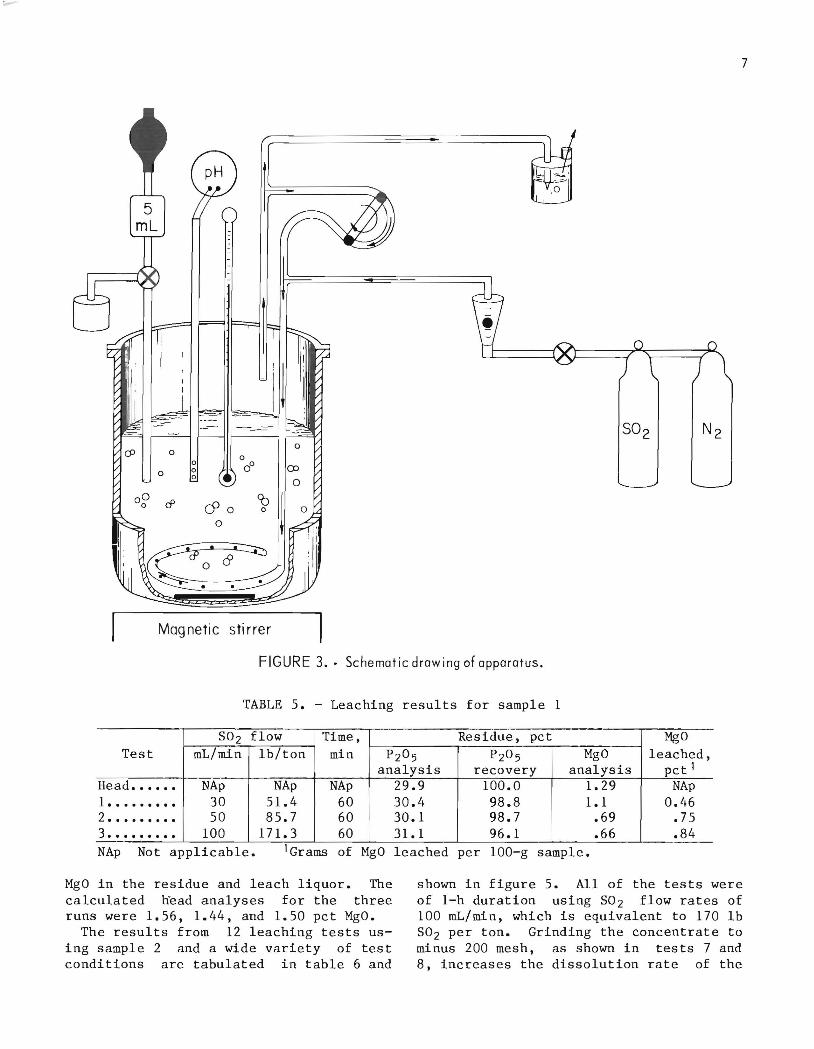
To improve the utilization of the S02 and determine the rate of MgO extraction with time, the following modifications were made in the apparatus shown schematically in figure 3:
1. The reactor size was increased from 500 mL to 1,000 mL.
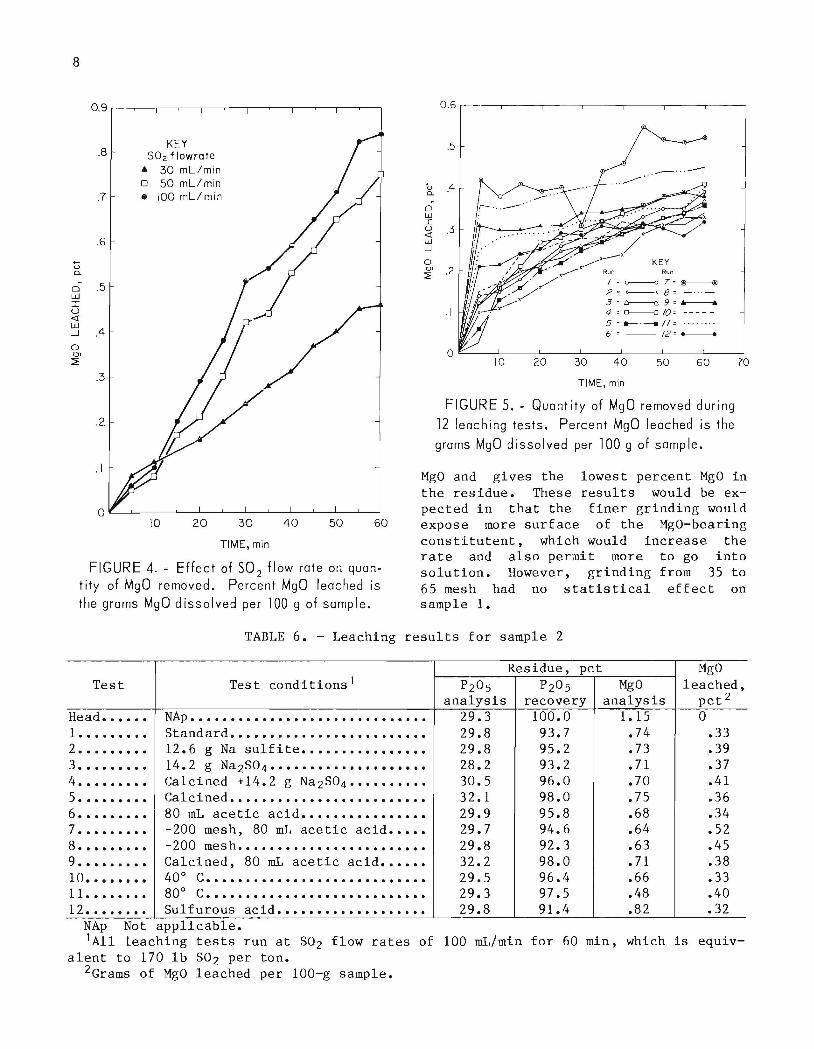
sample 1; the results are tabulated in table 5 and shown in figure 4. The quantity of MgO removed from the concentrate, in grams of MgO dissolved per 100 g of head sample, is calculated from the analysis of the lixiviant. The three runs of 30-, 50-, and 100-mL/min flow of S02 gave varying results. The percent MgO in the heads was calculated from the analysis of
2. To make room for other sensors, the shaft stirrer was replaced with a magnetic stirrer, which limited the slurries to lower percent solids.
3. A varistaltic pump was installed to remove the S02 from the top of the reactor and recycle it through the pulp.
4. A thermometer and a pH electrode were included to continuously monitor the temperature and pH.
5. An Andreasen pipet was added so that samples of lixiviants could be removed periodically for analyses.
The experimental procedure was to place 800 mL of water in the reactor, turn on stirrer and pumps, add 200 g of phosphate concentrate, flush the air from the system with a 100-mL/min flow of N2 for 5 min, and start the S02 flow at a predetermined flow rate. The temperature and pH were recorded periodically, and every 5 min a 10-mL sample of lixiviant was removed for chemical analysis to determine the rate of MgO solution with time.
To determine the effect of S02 flow rate, three leaching tests were made on
ex: w CD ::;:
6
~ 5 ~ z « ex:
4
3
2
o
Leach time
• S02 flowrote
• Calcination
• Pulp density
2 3 4
CONTRAST SUM
FIGURE 2. - Significance of the seven process
factors.
5
5 mL
Mag netic sti rrer
7
S02 N2
FIGURE 3 •• Schematic drawing of apparatus.
TABLE 5. - Leaching results for sample 1
S02 flow Time, Residue, pct MgO Test mL/min lb/ton min P2 0 5 P2 0 5 MgO leached,
analysis recovery analysis pct 1
Head •••••• NAp NAp NAp 29.9 100.0 1. 29 NAp 1 ••••••••• 30 51.4 60 30.4 98.8 1.1 0.46 2 ••••••••• 50 85.7 60 30.1 98.7 .69 .75 3 ••••••••• 100 171.3 60 31.1 96.1 .66 .84 NAp Not applicable. lGrams of MgO leached per 100-g sample.
MgO in the residue and leach liquor. The calculated head analyses for the three runs were 1.56, 1.44, and 1.50 pct MgO.
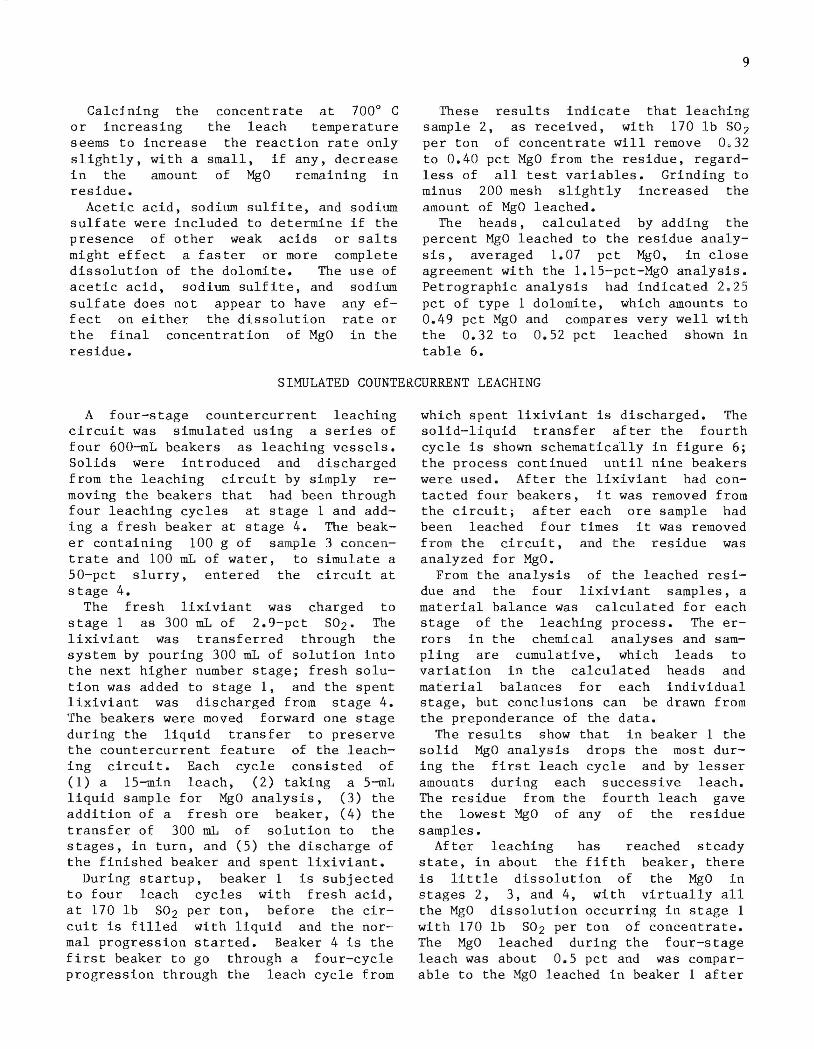
The results from 12 leaching tests using sample 2 and a wide variety of test conditions are tabulated in table 6 and
shown in figure 5. All of the tests were of 1-h duration using S02 flow rates of 100 mL/min, which is equivalent to 170 lb S02 per ton. Grinding the concentrate to minus 200 mesh, as shown in tests 7 and 8, increases the dissolution rate of the
8
0.9
.8 KEY
50 2 flowrate
• 30 mL/min 0 50 mL/min
.7 • 100 mLimin
.6
t; a.
0 .5 w :r: u <! W
.4 -.J
0 Dl
::2'
.3
.2
10 20 30 40 50 60
TIME, min
U a.
0' w :r: u <! w ..J
0 D'
::2:
0.6
.5
.4
.3
.2
.1
-"'--
KEY Run Run
/ = 0-----0 7 = @------------@
2 0 ,--, 8 0 - ... -
3 0 fr------6 9 0 a------. 4 0 0------0/0 0 -----
5 0 .-._// 0 ........
6 0 -- 12 0
------
o~--~----~--~~--~----~----~--~ 10 20 30 40 50 60
TIME, min
FIGURE 5. - Quantity of MgO removed during
12 leaching tests. Percent MgO leached is the
grams MgO dissolved per 100 9 of sample.
70
FIGURE 4. - Effect of SO 2 flow rate on quantity of MgO removed. Percent MgO leached is
the grams MgO dissolved per 100 9 of samp Ie.
MgO and gives the lowest percent MgO in the residue. These results would be expected in that the finer grinding would expose more surface of the MgO-bearing constitutent, whiGh would increase the rate and also permit more to go into solution. However, grinding from 35 to 65 mesh had no statistical effect on sample 1.
TABLE 6. - Leaching results for sample 2
Residue, pct MgO Test Test conditions' P20S P20S MgO leached,
analysis recovery analysis pct 2
Head •••••• NAp •••••••••••••••••••••••••••••• 29.3 100.0 1.15 0 1 ••••••••• Standard •.............•.......... 29.8 93.7 .74 .33 2 ••••••••• 12.6 g Na sulfite •••••••••••••••• 29.8 95.2 .73 .39 3 ••••••••• 14.2 g Na2S04· .•...•...•••••••••• 28.2 93.2 .71 .37 4 ••••••••• Calcined +14.2 g Na2S04· ••••••••. 30.5 96.0 .70 .41 5 ••••••••• Calcined ......................... 32.1 98.0 .75 .36 6 ••••••••• 80 mL acetic acid ................ 29.9 95.8 .68 .34 7 ••••••••• -200 mesh, 80 mL acetic acid ••••• 29.7 94.6 .64 .52 8 ••••••••• -200 mes h •••.•••••••••••••••.••.. 29.8 92.3 .63 .45 9 ••••••••• Calcined, 80 mL acetic acid •••••• 32.2 98.0 .71 .38 10 •••••••• 40° C •••••••••••••••••••••••••••• 29.5 96.4 .66 .33 11 •••••••• 80° C •••••••••••••••••••••••••••• 29.3 97.5 .48 .40 12 •••••••• Sulfurous ac id ................... 29.8 91.4 .82 .32
NAp Not applicable. 'A1l leaching tests run at S02 flow rates of 100 mL/min for 60 min, which is equiv
alent to 170 lb S02 per ton. 2Grams of MgO leached per 100-g sample.
Calcining the concentrate at 700 0 C or increasing the leach temperature seems to increase the reaction rate only slightly, with a small, if any, decrease in the amount of MgO remaining in residue.
Acetic acid, sodium sulfite, and sodium sulfate were included to determine if the presence of other weak acids or salts might effect a faster or more complete dissolution of the dolomite. The use of acetic acid, sodium sulfite, and sulfate does not appear to have fect on either the dissolution the final concentration of MgO residue.
sodium any efrate or in the
9
These results indicate that leaching sample 2, as received, with 170 lb S02 per ton of concentrate will remove 0.32 to 0.40 pct MgO from the residue, regardless of all test variables. Grinding to minus 200 mesh slightly increased the amount of MgO leached.
The heads, calculated by adding the percent MgO leached to the residue analysis, averaged 1.07 pct MgO, in close agreement with the 1.15-pct-MgO analysis. Petrographic analysis had indicated 2 . 25 pct of type 1 dolomite, which amounts to 0.49 pct MgO and compares very well with the 0.32 to 0.52 pct leached shown in table 6.
SIMULATED COUNTERCURRENT LEACHING
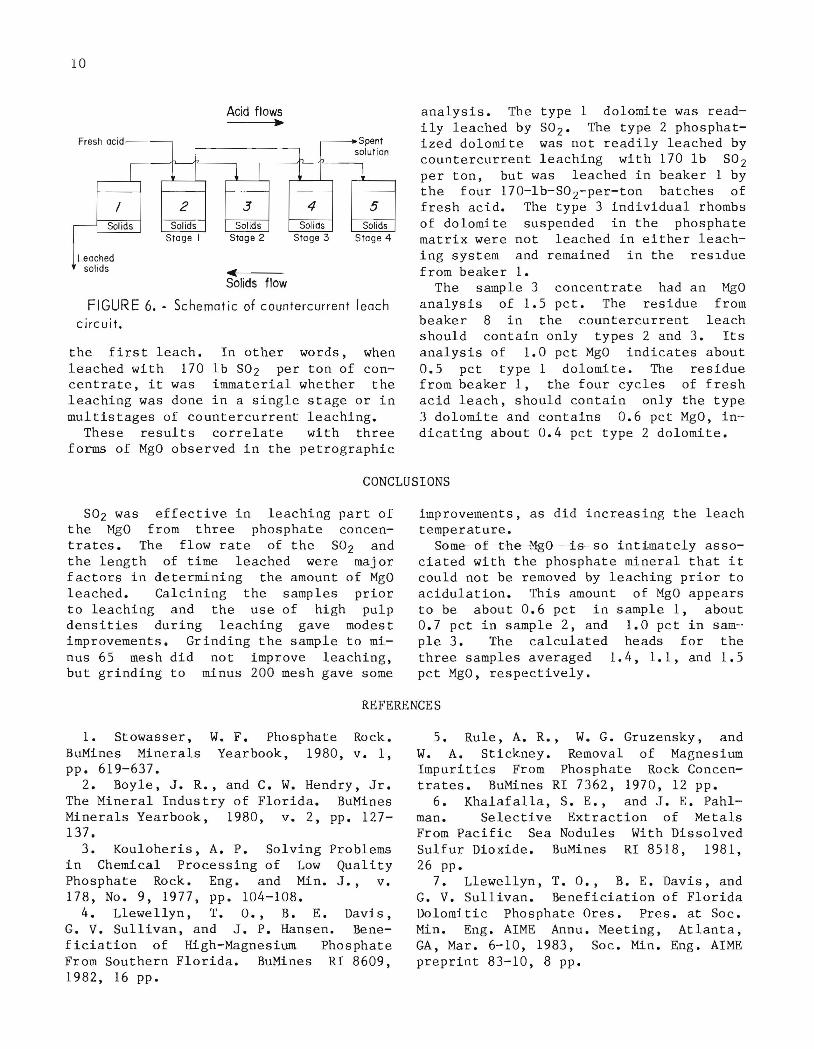
A four-stage countercurrent leaching circuit was simulated using a series of four 600-mL beakers as leaching vessels. Solids were introduced and discharged from the leaching circuit by simply removing the beakers that had been through four leaching cycles at stage 1 and adding a fresh beaker at stage 4. The beaker containing 100 g of s ample 3 conce ntrate and 100 mL of water, to simulate a 50-pct slurry, entered the circuit at stage 4.
The fresh lixiviant was charged to stage 1 as 300 mL of 2.9-pct S02. The lixiviant was transferred through the system by pouring 300 mL of solution into the next higher number stage; fresh solution was added to stage 1, and the spent lixiviant was discharged from stage 4. The beakers were moved forward one stage during the liquid transfer to preserve the countercurrent feature of the leaching circuit. Each cycle consisted of (1) a 15-min leach, (2) taking a 5-mL liquid sample for MgO analysis, (3) the addition of a fresh ore beaker, (4) the transfer of 300 mL of solution to the stages, in turn, and (5) the discharge of the finished beaker and spent lixiviant.
During startup, beaker 1 is subjected to four leach cycles with fresh acid, at 170 lb S02 per ton, before the circuit is filled with liquid and the normal progression started. Beaker 4 is the first beaker to go through a four-cycle progression through the leach cycle from
which spent lixiviant is discharged. The solid-liquid transfer after the fourth cycle is shown schematically in figure 6; the process continued until nine beakers were used. After the lixiviant had contacted four beakers, it was removed from the circuit; after each ore sample had been leached four times it was removed f r om the circuit, and the residue was analyzed for MgO.
From the analysis of the leached residue and the four lixiviant samples, a material balance was calculated for each stage of the leaching process. The errors in the chemical analyses and sampling are cumulative, which leads to variation in the calculated heads and material balances for each individual stage, but conclusions can be drawn from the preponderance of the data.
The results show that in beaker 1 the solid MgO analysis drops the most during the first leach cycle and by lesser amounts during each successive leach. The residue from the fourth leach gave the lowest MgO of any of the residue samples.
After leaching has reached steady state, in about the fifth beaker, there is little dissolution of the MgO in stages 2, 3, and 4, with virtually all the MgO dissolution occurring in stage 1 with 170 lb S02 per ton of concentrate. The MgO leached during the four-stage leach was about 0.5 pct and was comparable to the MgO leached in beaker 1 after
10
Fresh acid
j,
I I
/ 2 ,-- Solids Solids
Stage I
Leached sol ids
Acid flows ~
~ I - . . -
3 Solids
Stage 2
• Solids flow
__ Spent
~ solution
l ~
4 5 Solids Solids
Stoge 3 Stage 4
FIGURE 6. - Schematic of countercurrent leach
circuit.
the first leach. In other words, when leached with 170 lb S02 per ton of concentrate, it was immaterial whether the leaching was done in a single stage or in multistages of countercurrent leaching.
These results correlate with three forms of MgO observed in the petrographic
analysis. The type 1 dolomite was readily leached by S02' The type 2 phosphatized dolomite was not readily leached by countercurrent leaching with 170 lb S02 per ton, but was leached in beaker 1 by the four 170-lb-S0 2-per-ton batches of fresh acid. The type 3 individual rhombs of dolomite suspended in the phosphate matrix were not leached in either leaching system and remained in the resldue from beaker 1 •
The sample 3 concentrate had an MgO analysis of 1.5 pct. The residue from beaker 8 in the countercurrent leach should contain only types 2 and 3. Its analysis of 1.0 pct MgO indicates about 0.5 pct type 1 dolomite. The residue from beaker 1, the four cycles of fresh acid leach, should contain only the type 3 dolomite and contains 0.6 pct MgO, in-dicating about 0.4 pct type 2 dolomite.
CONCLUSIONS
S02 was effective in leaching part of the MgO from three phosphate concentrates. The flow rate of the S02 and the length of time leached were major factors in determining the amount of MgO leached. Calcining the samples prior to leaching and the use of high pulp densities during leaching gave modest improvements. Grinding the sample to minus 65 mesh did not improve leaching, but grinding to minus 200 mesh gave some
improvements, as did increasing the leach temperature.
Some of theMgO is so intimately associated with the phosphate mineral that it could not be removed by leaching prior to acidulation. This amount of MgO appears to be about 0.6 pct in sample 1, about 0.7 pct in sample 2, and 1.0 pct in sam-pIe 3. The calculated heads for the three samples averaged 1.4, 1.1, and 1.5 pct MgO, respectively.
REFERENCES
1. Stowasser, W. F. Phosphate Rock. BuMines Minerals Yearbook, 1980, v. 1, pp. 619-637.
2. Boyle, J. R., and C. W. Hendry, Jr. The Mineral Industry of Florida. BuMines Minerals Yearbook, 1980, v. 2, pp. 127-137.
3. Kouloheris, A. P. Solving Problems in Chemical Processing of Low Quality Phosphate Rock. Eng. and Min. J., v. 178, No.9, 1977, pp. 104-108.
4. Llewellyn, T. 0., B. E. Davis, G. V. Sullivan, and J. P. Hansen. Beneficiation of High-Magnesium Phosphate From Southern Florida. BuMines RI 8609, 1982,16 pp.
5. Rule, A. R., W. G. Gruzensky, and W. A. Stickney. Removal of Magnesium Impurities From Phosphate Rock Concentrates. BuMines RI 7362, 1970, 12 pp.
6. Khalafalla, S. E., and J. E. Pahlman. Selective Extraction of Metals From Pacific Sea Nodules With Dissolved Sulfur Dioxide. BuMines RI 8518, 1981, 26 pp.
7. Llewellyn, T. 0., B. E. Davis, and G. V. Sullivan. Beneficiation of Florida Dolomitic Phosphate Ores. Pres. at Soc. Min. Eng. AIME Annu. Meeting, Atlanta, GA, Mar. 6-10, 1983, Soc. Min. Eng. AIME preprint 83-10, 8 pp.
8. Davis, B. E., T. O. Llewellyn, and C. W. Smith. Continuous Beneficiation of Dolomitic Phosphate Ores. BuMines RI 8903, 1984, 14 pp.
9. Dufour, P., B. Pelletier, J. J. Predali, and G. Ranchin. Beneficiation of South Florida Phosphate Rock With High Carbonate Content. Paper in Proceedings,
",u.s. GPO: 1985-505-019/20,053
11
2nd International Congress on Phosphorous Compounds (Apr. 21-25, 1980, Boston, MA). Institut Mondial du Phosphate, 1980, pp. 247-267.
10. Davies, O. L. Design and Analysis of Industrial Experiments. Ch. X. Fractional Factorial Experiments. Hafner, 1956, pp. 440-495.
INT_-BU .O F MINE S, P G H. , P A . 2798 1
Related Documents