Journal of Membrane Science 175 (2000) 1–17 Removal of assimilable organic carbon and biodegradable dissolved organic carbon by reverse osmosis and nanofiltration membranes Isabel C. Escobar * , Seungkwan Hong, Andrew A. Randall Civil & Environmental Engineering Department, University of Central Florida, P.O. Box 162450, Orlando, FL 32816-2450, USA Received 30 September 1999; received in revised form 8 March 2000; accepted 10 March 2000 Abstract The main objective of this study was to evaluate the effectiveness of reverse osmosis (RO) and nanofiltration (NF), under various solution chemistries, on bacterial regrowth potential as quantified by assimilable organic carbon (AOC) and biodegrad- able dissolved organic carbon (BDOC). The bench-scale experiments, using tap groundwater spiked with acetate as organic carbon, revealed that AOC removals by RO/NF membranes were strongly dependent on charge repulsion. AOC removals were greater at conditions of low ionic strength and low hardness, and were slightly higher at high pH values. BDOC removals by NF membrane also increased with decreasing hardness and ionic strength, and increasing pH. However, the RO membrane showed less dependence on feed solution chemistry for BDOC removal, suggesting that BDOC removal was determined by the combined effect of both size exclusion and charge repulsion. The bench-scale observations were compared to a full-scale drinking water treatment plant that used nanofiltration as a primary treatment process. From full-scale operation, it was ob- served that nanofiltration was a very effective means to reduce BDOC, but conversely, did not reject the bulk of raw water AOC. The high BDOC rejection by NF membranes at full scale can be explained by size exclusion, since a significant fraction of BDOC in raw surficial ground water consists of compounds, such as humic and fulvic acids, which are larger than the pores of NF membranes. The insignificant AOC rejection observed in the full-scale system was probably due to the low pH, high hardness, and high ionic strength (TDS) of the raw groundwater combined with acid addition during pretreatment. These solution environments repress the electrostatic interaction between charged organic compounds and membranes, allowing passage of small molecular weight compounds and thus reducing AOC rejection. © 2000 Elsevier Science B.V. All rights reserved. Keywords: Assimilable organic carbon (AOC); Reverse osmosis (RO); Water treatment; Organic separation; Biostability 1. Introduction Bacterial proliferation in a drinking water dis- tribution system is a major concern because of the degradation of the distribution water quality, the acceleration of pipe corrosion, and other undesirable * Corresponding author. Tel.: +1-407-823-6698; fax: +1-407-823-3315. E-mail address: [email protected] (I.C. Escobar) effects. For bacterial growth to occur, various nutri- ent sources must be present. In particular, organic compounds, either dissolved or particulate, provide energy and carbon sources for heterotrophic bacteria to produce new cellular materials. The organic carbon in water supplies is mainly composed of humic and fulvic acids, carbohydrates, proteins, and carboxylic acids. In many distribution systems, it is assumed that the level of biodegradable organic matter (BOM) is the limiting nutrient for bacterial growth [1], although 0376-7388/00/$ – see front matter © 2000 Elsevier Science B.V. All rights reserved. PII:S0376-7388(00)00398-7

Welcome message from author
This document is posted to help you gain knowledge. Please leave a comment to let me know what you think about it! Share it to your friends and learn new things together.
Transcript

Journal of Membrane Science 175 (2000) 1–17
Removal of assimilable organic carbon and biodegradable dissolvedorganic carbon by reverse osmosis and nanofiltration membranes
Isabel C. Escobar∗, Seungkwan Hong, Andrew A. RandallCivil & Environmental Engineering Department, University of Central Florida, P.O. Box 162450, Orlando, FL 32816-2450, USA
Received 30 September 1999; received in revised form 8 March 2000; accepted 10 March 2000
Abstract
The main objective of this study was to evaluate the effectiveness of reverse osmosis (RO) and nanofiltration (NF), undervarious solution chemistries, on bacterial regrowth potential as quantified by assimilable organic carbon (AOC) and biodegrad-able dissolved organic carbon (BDOC). The bench-scale experiments, using tap groundwater spiked with acetate as organiccarbon, revealed that AOC removals by RO/NF membranes were strongly dependent on charge repulsion. AOC removals weregreater at conditions of low ionic strength and low hardness, and were slightly higher at high pH values. BDOC removals byNF membrane also increased with decreasing hardness and ionic strength, and increasing pH. However, the RO membraneshowed less dependence on feed solution chemistry for BDOC removal, suggesting that BDOC removal was determined bythe combined effect of both size exclusion and charge repulsion. The bench-scale observations were compared to a full-scaledrinking water treatment plant that used nanofiltration as a primary treatment process. From full-scale operation, it was ob-served that nanofiltration was a very effective means to reduce BDOC, but conversely, did not reject the bulk of raw waterAOC. The high BDOC rejection by NF membranes at full scale can be explained by size exclusion, since a significant fractionof BDOC in raw surficial ground water consists of compounds, such as humic and fulvic acids, which are larger than thepores of NF membranes. The insignificant AOC rejection observed in the full-scale system was probably due to the low pH,high hardness, and high ionic strength (TDS) of the raw groundwater combined with acid addition during pretreatment. Thesesolution environments repress the electrostatic interaction between charged organic compounds and membranes, allowingpassage of small molecular weight compounds and thus reducing AOC rejection. © 2000 Elsevier Science B.V. All rightsreserved.
Keywords:Assimilable organic carbon (AOC); Reverse osmosis (RO); Water treatment; Organic separation; Biostability
1. Introduction
Bacterial proliferation in a drinking water dis-tribution system is a major concern because of thedegradation of the distribution water quality, theacceleration of pipe corrosion, and other undesirable
∗ Corresponding author. Tel.:+1-407-823-6698;fax: +1-407-823-3315.E-mail address:[email protected] (I.C. Escobar)
effects. For bacterial growth to occur, various nutri-ent sources must be present. In particular, organiccompounds, either dissolved or particulate, provideenergy and carbon sources for heterotrophic bacteriato produce new cellular materials. The organic carbonin water supplies is mainly composed of humic andfulvic acids, carbohydrates, proteins, and carboxylicacids. In many distribution systems, it is assumed thatthe level of biodegradable organic matter (BOM) isthe limiting nutrient for bacterial growth [1], although
0376-7388/00/$ – see front matter © 2000 Elsevier Science B.V. All rights reserved.PII: S0376-7388(00)00398-7
2 I.C. Escobar et al. / Journal of Membrane Science 175 (2000) 1–17
a small number of studies suggest that phosphorusmay be limiting for some systems [2,3]. Thus, BOMconcentration, often measured as assimilable organiccarbon (AOC) and biodegradable dissolved organiccarbon (BDOC), provides a good indicator for thebacterial regrowth potential of the treated water. Fur-ther, AOC has actually been correlated with bacterialcounts in water distribution systems [4,5].
Membrane filtration offers a versatile treatment al-ternative to improve the biological stability of thefinished water. Especially, reverse osmosis (RO) andnanofiltration (NF) technologies, mainly because oftheir small pore sizes, have a great potential to removebiodegradable organic substances from source watersand consequently reduce the potential for bacterialgrowth in the distribution system. However, systematicstudies concerning AOC or BDOC removal by mem-branes are rarely found in the literature. The few exist-ing studies [6–9] showed that RO and NF were effec-tive in rejecting higher molecular weight compounds(e.g. humic acids) typically quantified as DOC andBDOC. However, the lower molecular weight com-pounds typically quantified as AOC (e.g. acetic acidand amino acids) were rejected to varying degrees de-pending on the membrane material and probably thesolution environment.
This paper addresses the effectiveness of RO andNF processes, as a drinking water technology, for theremoval of AOC as well as BDOC. In this researcha series of well-controlled, bench-scale filtration, ex-periments were performed at various feed solutionchemistries using commercial thin-film compositepolyamidic NF and cellulosic RO membranes. In ad-dition, the electrokinetic properties of the membraneswere carefully characterized and related to the perfor-mance in order to elucidate fundamental mechanismsof AOC and BDOC removal by RO/NF membranes.Lastly, full-scale NF membrane performance datacollected from Palm Beach County Water UtilitiesDistrict (PBCWUD) was compared to the bench scaletest results.
2. Background
2.1. Biodegradable dissolved organic carbon
The BDOC content represents the fraction of dis-solved organic carbon (DOC) that is assimilated
and/or mineralized by a heterotrophic flora [10]. Theinoculum for the test consists of environmental bac-teria, suspended or alternately fixed on a support,such as sand or porous beads. BDOC is the differ-ence between initial DOC of the water sample andthe minimum DOC observed during the incubationperiod of 28 days for suspended indigenous bacte-ria or 5–7 days for bacteria attached to sand [11].Joret et al. [12] reported that BDOC values represent10–30% of the total dissolved organic carbon contentof drinking water. Block et al. [13] showed that an ab-sence of biodegradable organics after water treatmentwas essential for limiting bacterial regrowth. Servaiset al. [14] suggested that a BDOC concentration of0.16 mg/l or less in the finished water was requiredfor the desired biological stability, which correspondsto no BDOC consumption within the distributionsystem. More recently, Volk et al. [11] determined avalue of 0.15 mg/l at 20◦C and 0.30 mg/l at 15◦C forachieving biological stability in distribution systemsof Paris suburbs. Additionally, coliform occurrenceswere related to the existence of BDOC content morethan 0.10–0.15 mg/l in their study [11].
2.2. Assimilable organic carbon
AOC refers to a fraction of the total organic carbon(TOC) which can be utilized by two specific strainsof bacteria, resulting in an increase in biomass con-centration that is quantified. AOC typically comprisesjust a small fraction (0.1–9.0%) of the TOC. The in-oculum for the AOC bioassay can be composed ofa mixture of pure bacterial strains cultivated in labo-ratory conditions (Pseudomonas fluorescensP17 andSpirillum NOX) [11], or mixtures of environmentalbacteria [12] characterized by a great nutritional ver-satility, or mixtures of bacteria that utilize groups ofspecific compounds [13]. Bacterial growth is moni-tored in the water samples by colony counts, and theaverage growth (Navg) observed during the incubationis converted into AOC units (mg/l as acetate-carbon)by using a growth yield of the bacteria from calibra-tion curves derived from standard concentrations oforganic compounds (acetate or oxalate). A significantcorrelation exists between the AOC concentration andthe density of heterotrophic bacteria in distribution wa-ter supplies [13,15]. Van der Kooij [15] showed thatheterotrophic bacteria in a non-chlorinated system did

I.C. Escobar et al. / Journal of Membrane Science 175 (2000) 1–17 3
not increase when AOC levels were lower than 10mg/l.LeChevallier et al. [5], on the other hand, suggestedthat the regrowth might be limited by AOC levels lessthan 50–100mg/l in a system maintaining a disinfec-tant residual.
The AOC concentration may be regarded as ameasure of the biological stability of the water withrespect to heterotrophic growth, while the quotientAOC/BDOC may be regarded as an indication ofthe relative biological stability of the biodegradableorganic compounds present in drinking water [5].Studies performed by Van der Kooij [4] suggestedthat BDOC could not be used to predict the levelof regrowth because no significant correlation wasfound between this parameter and the counts of het-erotrophic bacteria. Moreover, since the detection limitof 0.1 mg/l is used in the BDOC bioassay, significantAOC changes on the order ofmg/l as acetate-carbonare not usually detectable by BDOC analysis. There-fore, AOC and BDOC bioassays should be usedtogether to supplement each other’s information.
2.3. Removal of BOM by membrane filtration
Organic removal by membrane filtration has been atopic of many investigations. Clair et al. [9] used re-verse osmosis membranes (FilmTec FT30 compositebrackish water desalination, Dow Chemical, Ger-many), previously used by Lynch and Smith [16], totreat surface water with a DOC range of 8.1–22.3 mg/l.The membrane permeate contained 0.3–0.43 mg/l ofDOC (96–98% reduction), which were similar re-sults to those obtained by Lynch and Smith [16].More recently, Cho et al. [17] studied the naturalorganic matter (NOM) rejection using ultrafiltrationpolyamide thin film composite (TFC) membranes(MWCO=8000 Da) as well as regenerated cellulosemembranes (MWCO=3000 Da). It was shown thatdespite the large pores of UF membranes, the signifi-cant fractions of DOC were removed after membranefiltration, however, the degree of DOC removal wasstrongly affected by feed solution chemistry. DOC re-jection decreased significantly as calcium concentra-tion increased, decreased less significantly as pH de-creased, and was nearly unaffected by changes in ionicstrength. Based on these observations, they concludedthat DOC removal was determined by several mecha-nisms including charge repulsion, size exclusion, and
hydrophobic interaction. However, BDOC and AOCremovals were not determined in these studies.
Sibille et al. [6] performed studies using ground-water from the city of Auvers s/Oise, France, whichwas treated via ozonation followed by biological gran-ular activated carbon filtration and nanofiltration inorder to investigate the effects of membrane treatmenton biological regrowth potential using NF membranes.The results of the experiments were that nanofiltrationproduced a considerable gain in potable water qualityby decreasing the bacterial counts (from 820 to 340cfu/ml), DOC (from 1.6 to 1.4 mg/l) and BDOC (from0.35 to 0.25 mg/l). However, nanofiltration membraneslet through to the permeate a low concentration ofbiodegradable organic matter (BDOC=0.25 mg/l) thatmight have still had a significant fraction of AOC init. Unfortunately, AOC was not measured.
Noble et al. [7] determined AOC removals by threedifferent schemes: (1) coagulation, flocculation andgranular activated carbon (GAC), (2) conventionalpotable water treatment (i.e. coagulation, flocculation,and sand–anthracite), and (3) NF using sulfonatedpolyesther sulfide membranes with a molecularweight cutoff of 1000 Da (Nitto Denko NTR 7450,Hydranautics, San Diego, CA). The raw groundwatercontained TOC=11 mg/l and AOC averaging 362mgas acetate-C/l. For GAC columns, the effluent TOCwas 1.6 mg/l and the AOC of the effluent water was202mg as acetate-C/l; a considerable reduction, butthe effluent still contained a high AOC concentration.The high AOC of the GAC effluent was probably dueto carbon fines from the column present in the efflu-ent water. When sand–anthracite columns (both dualand monomedium) were used, the effluent TOC was1.3 mg/l and AOC was 54mg as acetate-C/l, whichwas much lower than the influent AOC probably dueto the addition of ferric chloride for coagulation andthe absence of carbon fines in the effluent. Finally,it was determined that when nanofiltration was used,there was a significant reduction in permeate TOC(0.63 mg/l) but no significant difference between AOCvalues of the influent and the permeate (AOC=334mgas acetate-C/l), which meant that membrane filtrationdid not produce biologically stable water.
Finally, Agbekodo et al. [8] treated water fromthe River Oise at the Méry-sur-Oise Plant (France)by nanofiltration using FilmTec NF70 (Dow Chem-ical, Germany) membranes. The treatment process
4 I.C. Escobar et al. / Journal of Membrane Science 175 (2000) 1–17
consisted of clarification and sand-filtration, followedby the addition of sulfuric acid to drop the pH to6.5, 10 and 5mm filters, and a three-stage nanofiltra-tion process. The raw water DOC ranged between 4and 7 mg/l while the permeate DOC was constant at0.15 mg/l. Of the permeate DOC, 60% was composedof amino acids, 18% of sugars, 15% of fatty-aromaticacids, and 7% of aldehydes. The BDOC (concentrationnot stated) composition was 63% amino acids, 22%sugars, 10% fatty-aromatic acids, and 5% aldehydes.In the study, it was concluded that amino acids passedthrough the nanofiltration membranes, and they areusually readily available to bacteria (AOC-formingcompounds). Thus, different researchers observedthat even though membrane filtration considerablyreduces the DOC of the permeate water, it might letthrough a significant portion of the raw water AOCand BDOC through.
3. Experimental
3.1. Raw water quality
The laboratory tap water (chlorinated groundwater)at the University of Central Florida was used for thebench-scale raw water matrix. The raw water sam-ples were withdrawn after a 5 min flushing period,and care was taken not to contaminate the raw watermatrix. The average composition over the period ofthe studies of the UCF laboratory tap water is givenin Table 1. The raw water was spiked with organics
Table 1University of Central Florida Laboratory Tap Water Qualitya
Parameter Average concentration
Alkalinity 120±31 mg/l as CaCO3Hardness 190±38 mg/l as CaCO3Total dissolved solids (TDS) 160±15 mg/lIonic strength
(IS=2.5×10⁻⁵×TDS)4×10⁻³
pH 7.50–8.00Turbidity 0.25 NTUHeterotrophic plate count (HPC) 0–5 cfu/mlAOC 55.6±29.95mg as
acetate-C/l backgroundBDOC 0.22±0.11 mg/l backgroundDOC 1.92±0.087 mg/l backgroundChemical addition 0.2 mg/l sodium acetate
a Source: experimental analysis over the period of study.
(0.2 mg/l acetate as carbon) to determine the reten-tion of AOC and the low molecular weight fraction ofBDOC. Final concentrations of AOC and BDOC wereapproximately 257mg/l as acetate-C and 0.42 mg/l, re-spectively. In addition, NaCl (0–10−1 M) and CaCl2(0–0.25×10⁻¹ M) were added to the raw water matrixto evaluate the effects of ionic strength and divalentcation concentrations (i.e. hardness) on the retentionof organic matter by the membrane. Finally, the pH ofthe raw water was varied from 5.5 to 7.5 using HCl inorder to assess its effect on the removal of AOC andBDOC.
3.2. Membranes used
The membranes used in this project were manu-factured by Fluid Systems (San Diego, CA), and theywere CA-SD and TFC-S for RO and NF membranes,respectively. The CA-SD membrane is a celluloseacetate blend RO membrane (MWCO≤100 Da) typi-cally used for industrial, municipal, ground, and sur-face water applications where chlorination is desired.This membrane is capable of producing 348 l/m-day(28 gfd) water at 2.9 MPa (420 psi; typical operat-ing pressure range 1.7–3.1 MPa (250–450 psi)) with95.5% chloride ion rejection on 2000 mg/l NaCl so-lution at 25◦C and pH 5.7. The CA-SD membraneswere kept wet and stored in a dark area away fromlight at a cool temperature (5–10◦C). Then they wererinsed with feed water at low pressure (<0.41 MPa or60 psi) for a short time before starting the evaluation.This membrane was tested as flat sheets at operatingpressures of 1.0–1.2 MPa (150–180 psi).
The TFCS is a thin film composite NF membrane(i.e. polyester fabric substrate, porous polysulfonesupport, and a cross-linked aromatic polyamide rejec-ting surface) with MWCO of 200 Da. The waterand salt transport coefficients for this membraneare 2.2×10⁻⁶ g/cm2 s atm and 1.8×10⁻⁶ cm/s, res-pectively. Ideal operating pressure ranges from 0.3to 1.2 MPa (50–150 psi) with an optimum pres-sure of 0.54 MPa (80 psi). At this optimum pres-sure, the membranes have a capability of producing186 l/m-day (15 gfd) water with 80% chloride rejec-tion for a 500 mg/l NaCl solution, at 10% recovery,25◦C, and pH 7.5. TFC-S membranes were storedand prepared following the same procedure as CA-SDmembranes. The TFCS membrane was tested as

I.C. Escobar et al. / Journal of Membrane Science 175 (2000) 1–17 5
Fig. 1. Flat sheet membrane cell testing unit.
flat sheets at a pressure of 0.54 MPa (80 psi) in thisstudy.
3.3. Flat sheet membrane filtration tests
Experiments were conducted using a circular flatsheet membrane test unit as shown in Fig. 1. The cellunit contained two cells, each with 81.3 cm2 (12.6 sq.in.) active membrane area. In this cell configuration,the feed water was fed to the cell through the sideinlet, and the concentrate and the permeate were col-lected from the center of top and bottom of the cell, re-spectively. As a result, the flow pattern inside the cellwas not clearly defined and the tangential flow veloc-ity was not determined. Feed flow of approximately1.14 l/min (0.3 gpm) per cell was supplied by a sin-gle 250 W (1/3 hp) pump. In order to adjust the flowrate, distilled water was run through the membranesfor the first 4 h for stabilization. During this period,flow meters were used to adjust the flow to each cell,and flow rates were measured hourly until the end ofthe experiment.
The flat sheet membranes were handled accordingto manufacturer instructions. Each membrane filmwas evaluated at a single set of operating conditionsof approximately 37.8–75.7 l/day (10–20 gfd) fluxand 1–5% recovery. Each film was discarded afterone experiment, but each experiment was duplicated.Temperature was maintained at ambient conditions(∼=22±3◦C) by closed loop recirculation of a sidestream of the feed water in a continuously fed bathfor heat exchange. Each experiment was continueduntil 1 l of permeate had been collected for anal-ysis, approximately 24 h. Flows for 10–20 gfd fluxand 1% recovery were 2.5–3.5 ml/min permeate and
345 ml/min concentrate. Samples for UV-254 analysiswere withdrawn every 1–2 h to monitor any changesin organic carbon rejection with operation time. Withrespect to AOC and BDOC, because of the quan-tity of sample required for analysis (approximately1 l), it was unfeasible to take periodic samples. Also,there was an initial attempt to use distilled water todetermine leakage, but the microbial flora used inboth bioassays needed water with more electrolytesto prevent cell lysis.
3.4. Experimental design
A total of 24 different experiments were designedfor this study. Each experiment was duplicated forreproducibility. The independent parameters usedwere membrane type (TFC-S or CA-SD), pH (5.5 or7.5), hardness (0.0019–0.0269 M), and ionic strength(0.0040–0.1040 M) or TDS (160–4160 mg/l). The tapwater contained approximately 0.0019 M of hardnessand 0.0040 M of ionic strength and was designatedas Solution A. The Solutions B–F were made to de-termine the effect of hardness and ionic strength onAOC/BDOC removal (Table 2).
3.5. Statistical analysis
The statistical analysis was performed using SPSSStudent Version 9.0 (SPSS Inc., Chicago, IL). Ex-periments were performed varying membrane type(TFC-S or CA-SD), pH (5.5 or 7.5), ionic strength(0.0040–0.1040 M) or TDS (160–4160 mg/l), andhardness (190–2690 mg/l as CaCO3). In order to stan-dardize and compare the different parameters, theywere transformed using Eq. (1), so that values would
6 I.C. Escobar et al. / Journal of Membrane Science 175 (2000) 1–17
Table 2Experimental design details
Solution A B C D E F
Chemical addition N/A 0.001 M NaCl 0.0005 M CaCl2 0.001 M NaCl, 0.0005 M CaCl2 0.025 M CaCl2 0.1 M NaClHardness (M) 0.0019 0.0019 0.0024 0.0024 0.0269 0.0019Ionic strength 0.0040 0.0050 0.0053 0.0063 0.0665 0.1040
be unitless and fall between−1 and+1. The inde-pendent variable membrane type was assigned a valueof x=−1 for CA-SD andx=+1 for TFC-S mem-branes, while pH was also transformed, so pH=5.5corresponded tox=−1 and pH=7.5 corresponded tox=+1.
xi1 = εi1 − [max(εi1) + min(εi1)]/2
[max(εi1) + min(εi1)]/2(1)
where xi1 is the transformed value andεi1 is theoriginal value.
The model parameters were considered significantby the magnitude of theirp-values. All the analy-sis was performed using the logarithm base 10 ofremoval (delta) values (i.e. raw−permeate). The loga-rithm transformations of the dependent variables (i.e.AOC and BDOC) were used after residual analysisshowed that the data was subject to multiplicativeerrors. When the variance is a function of its mean,the least squares assumption of homoscedasticity (i.e.constant variance for all levels of the independentvariables) can be satisfied by transforming the depen-dent variable. This transformation is called variancestabilizing [18]. In the case of multiplicative distribu-tions, the logarithm of the independent variable hasapproximately constant variance.
A total of 30 different models that either did notinvolve interactions (main effects only) or involvedinteractions (two-, three-, or four-level) were tested.The preferred models were chosen based on thehighest coefficient of determination (R2) and lowestmean square error (MSE). Even though third- andfourth-order interaction models were tested, simplermodels (i.e. first- and second-order interactions) werefavored ifR2 and MSE values were within 10% even ifthe simpler models contained the lowerR2 and MSE.
Since both compounds added to lower the pH from7.5 to 5.5 (HCl) and compounds added to increase thehardness (CaCl2) increase ionic strength, a correlation
matrix using Pearson’s product moment correlationcoefficient (r) was made. The Pearson’s coefficient isa measure of the strength of the linear relationship be-tween variables, and the greater the value of the coeffi-cient, the greater the correlation between the variables.Table 3 shows the correlation matrix for the indepen-dent variables: membrane type, pH, ionic strength, andhardness. From the table, it was observed that neithermembrane type nor pH correlated with any of the otherparameters. On the other hand, ionic strength and hard-ness correlated with a Pearson’s coefficient of 0.386(p-value=0.063, not significant at 95% confidence),which implied a weak correlation. Correlation does notimply causality, but determines that the correlated vari-ables are confounded with each other; therefore, theireffects are dependent on each other. After confound-ing was determined, the chosen models were re-testedby excluding ionic strength from the independent vari-ables and observing the effects of this removal on thecoefficients of hardness. Fortunately, the removal ofionic strength did not alter the coefficients of hardnessby more than 20%. Therefore, the confounding effectsbetween hardness and ionic strength were not strong.
Table 3Correlation matrix for the transformed independent variablesa
Correlation matrix MT pHt ISt Ht
MT Pearson correlation 1.000 0.000 0.000 0.000Significant (two-tailed)<0.0001 1.000 1.000 1.000
pHt Pearson correlation 0.000 1.000 0.000 0.000Significant (two-tailed) 1.000<0.0001 1.000 1.000
ISt Pearson correlation 0.000 0.000 1.000 0.386Significant (two-tailed) 1.000 1.000<0.0001 0.063
Ht Pearson correlation 0.000 0.000 0.386 1.000Significant (two-tailed) 1.000 1.000 0.063<0.0001
a Independent variables are membrane type (MT), pH, ionicstrength (IS), and hardness (H) using Pearson’s correlation coef-ficients.
I.C. Escobar et al. / Journal of Membrane Science 175 (2000) 1–17 7
3.6. Zeta potential experiments
In order to assess changes in membrane surfacecharge at various solution chemistries, membrane sur-face zeta potentials were determined using a stream-ing potential analyzer (BI-EKA, Brookhaven Ins.,Holtsville, NY). The zeta potential of the membranesurface was calculated from the measured streamingpotentials using the Helmholtz–Smoluchowski equa-tion [19]. The pH titration was first performed at abackground electrolyte concentration of 10−2 M NaClto determine the isoelectric point of the membrane. Inaddition, the divalent cation (Ca2+) concentration wasvaried from 10−4 to 5×10⁻² M at two different pHvalues: 5.5 and 7.5. The solution chemistries chosenfor zeta-potential experiments were similar to those offeed waters used in the flat sheet membrane filtrationtests. The matrix solution was distilled deionized waterwith 10−2 M NaCl as electrolyte background. For pHtitrations, HCl and NaOH were added to vary the pHfrom 4 to 10. For calcium titrations, CaCl2 was addedto vary the calcium concentration from 0 to 0.05 M.
3.7. Full scale membrane water treatment plant
The NF membrane plant studied treated raw waterfrom the Biscayne Aquifer (FL) that is a shallow,surficial aquifer, with significant surface influenceand some salt-water intrusion. The characteristicsof this raw water are summarized in Table 4. Thisplant utilizes a 32:16 NF membrane array, madeof TFCS spiral-wound elements designed to reject
Table 4Average water quality in the Biscayne aquifera
Parameter 1-Year average values
Dissolved oxygen <1–2 mg/lpH 7.0Alkalinity 219 mg/l as CaCO3Total hardness 249 mg/l as CaCO3
Color 32 PCUAmmonia-nitrogen 1.20 mg/lSulfate (SO4) 20 mg/lTotal dissolved solids (TDS) 200 mg/lHeterotrophic plate counts 214 cfu/mlColiform occurrences 0
a Source: Eugenia P. Carey, Regulatory Compliance Managerfor Palm Beach County Board of County Commissioners WaterUtilities Department.
95% of hardness and 85% of chlorides at normaloperating conditions. The NF plant was designed for35.2×106 l/day (9.3 MGD), but operated at an aver-age of 29.5×10⁶ l/day (7.8 MGD) during the study.Before static cartridge filters, 140 mg/l of sulfuric acidand 2 mg/l of antiscalant were added to reduce scal-ing. The water then passed through cartridge filtersand the NF array. The membrane-filtered water wasdisinfected by adding 4 mg/l of chlorine and 1.3 mg/lof ammonia. The water was then aerated and 45 mg/lof sodium hydroxide was added for pH adjustment.
The sampling point was located immediately afterthe membranes and prior to post-membrane chem-ical additions. Sample collection was performed byfollowing a guideline outlined in Standard Methodsprocedure # 9060A [20]. The procedure requires theaddition of a 10% sodium thiosulfate (Na2S2O3) solu-tion to neutralize the chlorine residual in the samples.Kaplan and Bott [21] found that the addition of thio-sulfate did not significantly stimulate the growth ofP17 or NOX, thus having no effect on AOC concen-trations. Sample storage was implemented accordingto procedure 9060B after collection.
3.8. Reagent water and glassware
Water for the preparation of all solutions wasultra-pure water of equivalent quality to that producedby a Milli-Q-UV plus system (Millipore Corp.). Thewater quality met or exceeded the Type I reagentwater specifications provided in Table 1080:I of Stan-dard Methods [20]. Purified water used for microbio-logical testing met the quality criteria specified inTable 9020:I of Standard Methods [20]. Laboratorychemicals were American Chemical Society reagentgrade or higher purity. Glassware was cleaned in a sinkemploying a detergent wash, an acid wash, and severaldistilled water rinses. The glassware was then muffledat 550◦C for 4 h to remove any organic contamina-tion. All glassware used for microbiological testingwas autoclaved prior to use. Silicon/PTFE septa werepretreated by heating in a 100 mg/l sodium persulfatesolution for 30 min without allowing it to boil.
3.9. AOC bioassay
AOC was measured using the rapid method ofLeChevallier et al. [22], except that plate counts were
8 I.C. Escobar et al. / Journal of Membrane Science 175 (2000) 1–17
used to enumerate bacteria rather that ATP fluores-cence, in conjunction with Standard Methods [20]procedure # 9217 and the method of Van der Kooij[23]. The procedure used is outlined in great detailin Escobar and Randall [24]. Quality control for theAOC bioassay was performed using blank controls,100mg/l sodium acetate standards, and duplicatesamples. The 100mg/l sodium acetate standards in-oculated with P17 produced an average AOC of93.80±20.00mg/l as acetate-C, while for NOX, theyproduced an average AOC of 77.20±12.53mg/l asacetate-C. Experimental yield values from acetatestandards for P17, 4.08±0.81×10⁶ cfu/mg acetate-C,and NOX, 9.26±1.50×10⁶ cfu/mg acetate-C, com-pared reasonably well with the literature valuesas specified in Standard Methods, 4.1×10⁶ and1.2×107 cfu/mg acetate-C for P17 and NOX, respec-tively. No controls were made to assess the effectof the thiosulfate (used to neutralize chlorine resid-ual) since it has been determined not to affect AOCconcentration [21] and is included in the StandardMethod [20]. The method detection limit (MDL) for
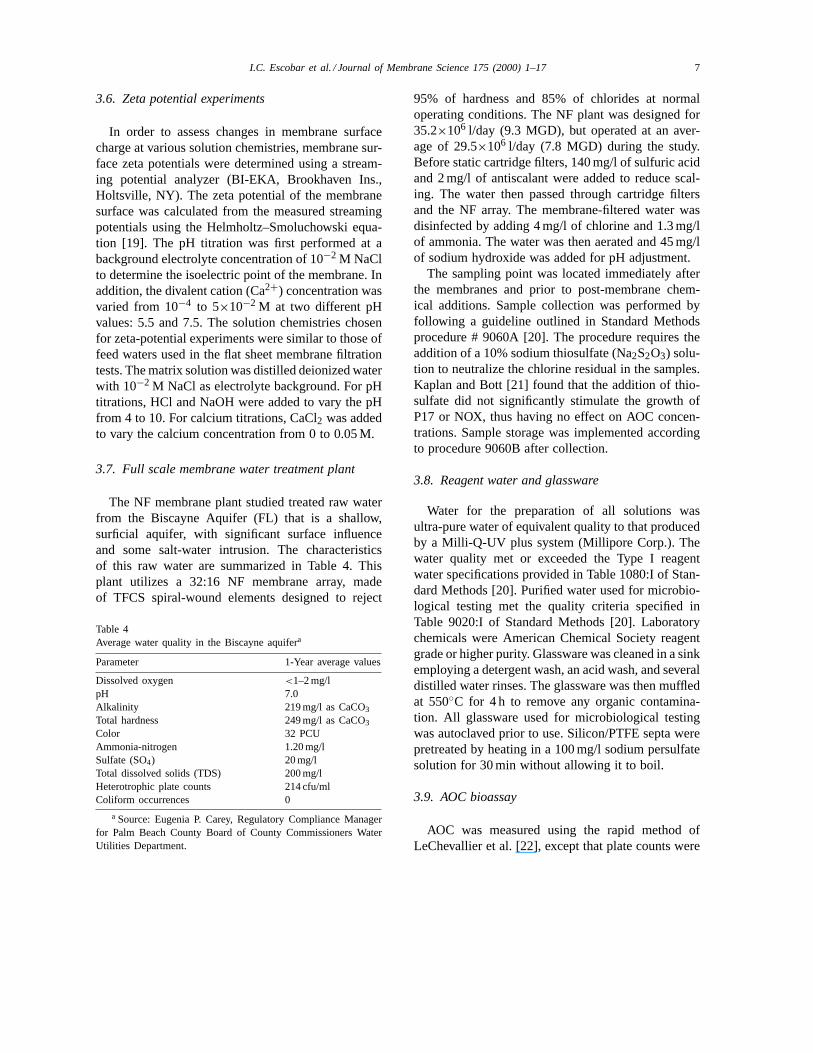
Fig. 2. Effect of pH on surface zeta potentials of TFC-S and CA-SD membranes (background electrolyte solution of 10−2 M of NaCl).
the AOC bioassay was determined to be 57mg asacetate-C/l via replicate analysis.
3.10. BDOC analysis
The procedure for BDOC determination followedthe technique using sand fixed bacteria [24,25]. TheMDL for BDOC was determined to be 0.15 mg/l.
4. Results and discussion
4.1. Membrane surface charge
Fig. 2 shows zeta potential (i.e. membrane surfacecharge) versus pH with background electrolyte solu-tions of 10−2 M of NaCl for both TFC-S and CA-SDmembranes. From Fig. 2, it was observed that bothmembranes were more negative at higher pH than atlower pH values. This was attributed to the higher de-gree of deprotonation of membrane surface functionalgroups, such as carboxyl, at high pH. The drop in the
I.C. Escobar et al. / Journal of Membrane Science 175 (2000) 1–17 9
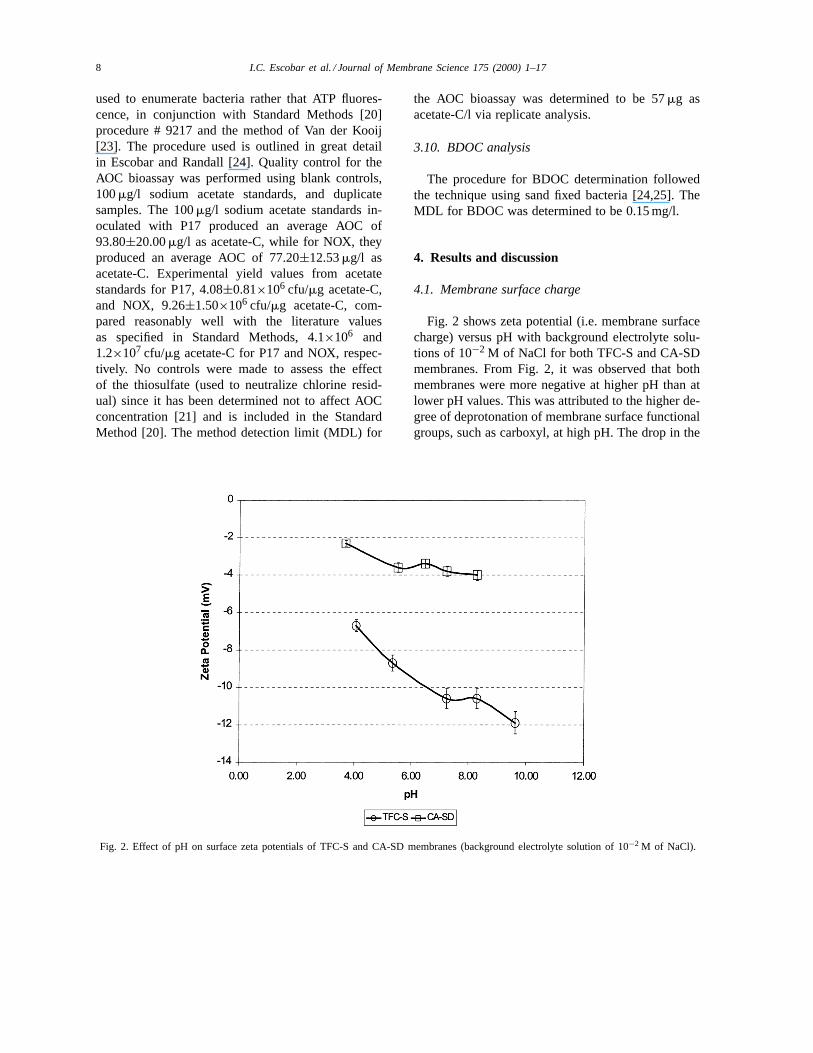
Fig. 3. Effect of calcium concentration on surface zeta potentials of TFC-S and CA-SD membranes (background electrolyte solution of10−2 M of NaCl).
negative charge as a function of pH was more pro-nounced for the TFC-S membranes than for CA-SDmembranes, which was expected since celluloseacetate membranes possess less ionizable functionalgroups, and as a result, are not as negatively chargedas TFC-S membranes.
Fig. 3 shows the titration curves for both mem-branes when calcium ions were added to a solutionwith an electrolyte background of 10−2 M of NaCl.From this figure, it is observed that the addition ofcalcium significantly decreased the negative chargeof the membranes. For the TFC-S membranes, whencalcium concentration was increased up to 0.05 M,the absolute value of the negative charge decreased byapproximately 6 mV at both pH 5.5 and 7.5. Similarly,for the CA-SD membranes, when calcium was added,the drop in the absolute value of the charge was notas strong. But it was still noticeable at 1.2 and 5.0 mVfor a solution with pH 5.5 and 7.5, respectively; thus,it became either closer to zero or slightly positive.This observation can be explained by effective mask-ing of the initially negative membrane surface chargeby divalent cations. In addition, specific adsorptionof divalent cations to membrane surface functional
groups may contribute to the neutralization of thenegative charge of the membrane. Similar trends werereported by Hong and Elimelech [26].
4.2. AOC relative removals
Figs. 4 and 5 show the relative AOC removal,defined as (feed−permeate)/feed, for both CA-SDand TFC-S membranes at pH values of 7.5 and5.5, respectively. The AOC of the raw water was55.6±29.95mg/l as acetate-C, and the raw water wasspiked with 200mg/l as acetate-C, so the feed AOCwas approximately 256mg/l as acetate-C. It shouldbe noted that since the detection limit for the AOCbioassay was 57mg/l as acetate-C, it might not bepossible to differentiate between AOC removals in therange of 80–100%, particularly accounting for preci-sion between duplicate samples. From both figures,at low concentrations of hardness and ionic strength(Solutions A–D), there was no significant differencebetween TFC-S and CA-SD membranes althoughTFC-S was a looser NF membrane. The rejection wasgreater than 90% for all cases at pH=7.5 and greaterthan 75% at pH=5.5. High AOC rejections may not

10 I.C. Escobar et al. / Journal of Membrane Science 175 (2000) 1–17
Fig. 4. AOC relative removal (1−permeate/feed) by CA-SD and TFC-S membranes at pH=7.5.
Fig. 5. AOC relative removal (1−permeate/feed) by CA-SD and TFC-S membranes at pH=5.5.

I.C. Escobar et al. / Journal of Membrane Science 175 (2000) 1–17 11
be explained simply by size exclusion, since the sig-nificant fractions of AOC compounds (mainly acetate)were small enough to pass through both membranes(note that the MWCOs of TFC-S and CA-SD are 200and 100 Da, respectively). This observation suggestedthat the main mechanism of AOC removal by both ROand NF membranes was probably charge repulsion.
In order to further verify the importance of chargerepulsion, solution hardness and ionic strength wereincreased by adding CaCl2 (Solution E) and NaCl(Solution F). At higher concentrations of hardnessand ionic strength, the rejection of AOC was signifi-cantly reduced for both membranes. As divalent cation(Ca2+) concentration increased (Solution E), AOC re-movals were reduced to 40% CA-SD and 7% TFC-Sat pH 7.5, and 60% CA-SD and 42% TFC-S at pH5.5. The increase in ionic strength by NaCl additionalone (Solution F) also affected AOC removal signif-icantly with an exception of CA-SD membrane at pH7.5 (46% TFC-S at pH 7.5, and 48% CA-SD and 27%TFC-S at pH 5.5). This exception was probably dueto analytical error since the trend of decreasing rawwater AOC was observed during the analysis of thissample. No other samples showed similar trends. Thedecrease in AOC removals can be explained by thereduced charge repulsion at high hardness and ionicstrength. As hardness and ionic strength increased, thecharges of the membranes and AOC compounds weremore effectively screened (Fig. 3), leading to smallercharge repulsion between them, and thus a significantreduction in AOC rejection. It should be also noted thatthe decrease in AOC rejection was much more pro-nounced with TFC-S than CA-SD membranes. Thisis not surprising since TFC-S membranes were morenegatively charged than CA-SD membranes (Fig. 2),and thus were more affected by charge masking dueto increasing hardness and ionic strength.
From both Figs. 4 and 5, AOC relative removalsby both membranes were slightly better at pH=7.5than at pH=5.5. This observation can be attributableto greater electrostatic repulsion between the mem-branes and AOC compounds at higher pH values.As solution pH increased, the membranes and AOCcompounds became more negatively charged due tothe dissociation of their functional groups (Fig. 2).At pH 7.5, the main form of AOC compounds, aceticacids (pKa=4.74) were almost completely dissoci-ated, while at pH 5.5, only 85% of acetic acids were
deprotonated to acetate ions. Membrane functionalgroups were also more dissociated with increasingpH. As a result, the charge repulsion between themembranes and AOC compounds became more sig-nificant at higher pH. Lastly, it should be noted thatthe observed pH effect on AOC rejection was not asstriking as hardness and ionic strength because of thesmall pH range tested.
The effect of hardness on AOC removal was some-what different at pH 7.5 and 5.5 (Solution E). The re-duction in AOC removal at pH 5.5 was not as drasticas at pH 7.5. It is hypothesized that at low pH, AOCcompounds as well as membrane functional groups aremore protonated (more neutrally charged), and as a re-sult, much less membrane functional groups and AOCcompounds were available for interacting with hard-ness (Ca2+), explaining the reduced effect of hardnessshown in Fig. 5 (Solution E). In addition, a decrease inmembrane pore size due to reduced electrostatic repul-sion between pore functional groups might be partiallyresponsible for minimizing hardness effect at low pH.The reduced membrane pore size with decreasing pHwas supported by a decrease in permeate flow rate forSolution E as pH decreased from 7.5 to 5.5. For TFC-Smembranes operating at a pressure of 80 psi, the per-meate flow rate at pH of 7.5 was 3.2 ml/min, whileit was 2.7 ml/min at pH of 5.5. Likewise, for CA-SDmembranes operating at a pressure of 180 psi, the per-meate flow rates were 1.8 and 1.3 ml/min at pH=7.5and 5.5, respectively.
4.3. BDOC relative removals
While AOC compounds are mainly composed ofsmall, highly-charged organic carbon compoundssuch as acetate, BDOC compounds are (especially innatural waters) composed of both AOC compounds aswell as larger, more heterogeneous compounds suchas humic and fulvic acids. The BDOC compounds intesting solutions used in bench-scale experiments (i.e.tap water spike with acetate) are a blend of the acetateadded and the organics originated from tap water.The BDOC compounds from tap water are presumedto be a mixture of heterogeneous organic substanceswith various size and charge characteristics. Thus,the rejection mechanism of BDOC compounds wasexpected to be more complicated than that of AOCcompounds.
12 I.C. Escobar et al. / Journal of Membrane Science 175 (2000) 1–17
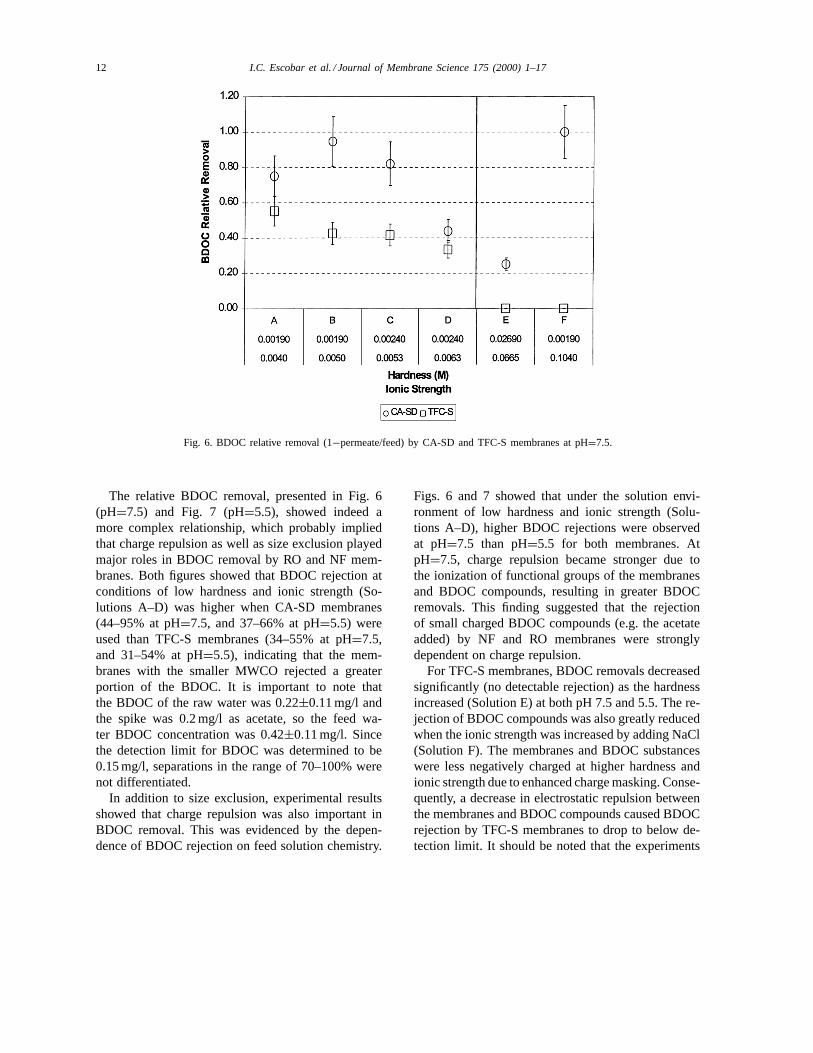
Fig. 6. BDOC relative removal (1−permeate/feed) by CA-SD and TFC-S membranes at pH=7.5.
The relative BDOC removal, presented in Fig. 6(pH=7.5) and Fig. 7 (pH=5.5), showed indeed amore complex relationship, which probably impliedthat charge repulsion as well as size exclusion playedmajor roles in BDOC removal by RO and NF mem-branes. Both figures showed that BDOC rejection atconditions of low hardness and ionic strength (So-lutions A–D) was higher when CA-SD membranes(44–95% at pH=7.5, and 37–66% at pH=5.5) wereused than TFC-S membranes (34–55% at pH=7.5,and 31–54% at pH=5.5), indicating that the mem-branes with the smaller MWCO rejected a greaterportion of the BDOC. It is important to note thatthe BDOC of the raw water was 0.22±0.11 mg/l andthe spike was 0.2 mg/l as acetate, so the feed wa-ter BDOC concentration was 0.42±0.11 mg/l. Sincethe detection limit for BDOC was determined to be0.15 mg/l, separations in the range of 70–100% werenot differentiated.
In addition to size exclusion, experimental resultsshowed that charge repulsion was also important inBDOC removal. This was evidenced by the depen-dence of BDOC rejection on feed solution chemistry.
Figs. 6 and 7 showed that under the solution envi-ronment of low hardness and ionic strength (Solu-tions A–D), higher BDOC rejections were observedat pH=7.5 than pH=5.5 for both membranes. AtpH=7.5, charge repulsion became stronger due tothe ionization of functional groups of the membranesand BDOC compounds, resulting in greater BDOCremovals. This finding suggested that the rejectionof small charged BDOC compounds (e.g. the acetateadded) by NF and RO membranes were stronglydependent on charge repulsion.
For TFC-S membranes, BDOC removals decreasedsignificantly (no detectable rejection) as the hardnessincreased (Solution E) at both pH 7.5 and 5.5. The re-jection of BDOC compounds was also greatly reducedwhen the ionic strength was increased by adding NaCl(Solution F). The membranes and BDOC substanceswere less negatively charged at higher hardness andionic strength due to enhanced charge masking. Conse-quently, a decrease in electrostatic repulsion betweenthe membranes and BDOC compounds caused BDOCrejection by TFC-S membranes to drop to below de-tection limit. It should be noted that the experiments
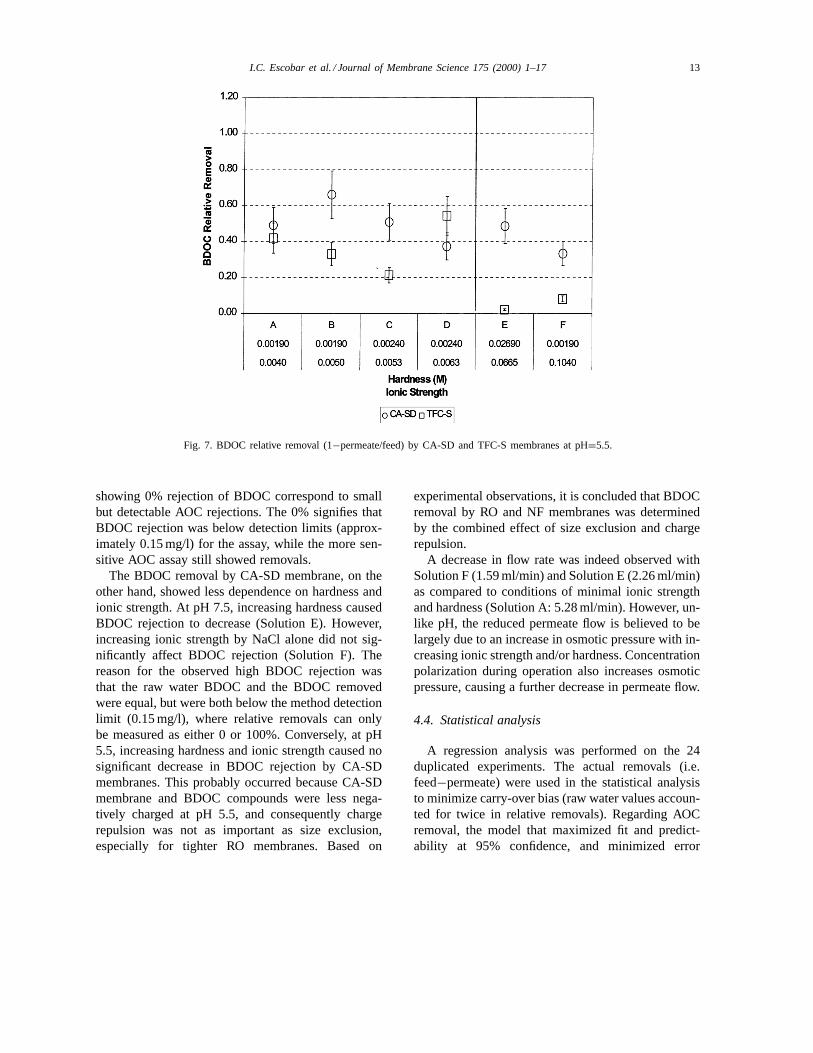
I.C. Escobar et al. / Journal of Membrane Science 175 (2000) 1–17 13
Fig. 7. BDOC relative removal (1−permeate/feed) by CA-SD and TFC-S membranes at pH=5.5.
showing 0% rejection of BDOC correspond to smallbut detectable AOC rejections. The 0% signifies thatBDOC rejection was below detection limits (approx-imately 0.15 mg/l) for the assay, while the more sen-sitive AOC assay still showed removals.
The BDOC removal by CA-SD membrane, on theother hand, showed less dependence on hardness andionic strength. At pH 7.5, increasing hardness causedBDOC rejection to decrease (Solution E). However,increasing ionic strength by NaCl alone did not sig-nificantly affect BDOC rejection (Solution F). Thereason for the observed high BDOC rejection wasthat the raw water BDOC and the BDOC removedwere equal, but were both below the method detectionlimit (0.15 mg/l), where relative removals can onlybe measured as either 0 or 100%. Conversely, at pH5.5, increasing hardness and ionic strength caused nosignificant decrease in BDOC rejection by CA-SDmembranes. This probably occurred because CA-SDmembrane and BDOC compounds were less nega-tively charged at pH 5.5, and consequently chargerepulsion was not as important as size exclusion,especially for tighter RO membranes. Based on
experimental observations, it is concluded that BDOCremoval by RO and NF membranes was determinedby the combined effect of size exclusion and chargerepulsion.
A decrease in flow rate was indeed observed withSolution F (1.59 ml/min) and Solution E (2.26 ml/min)as compared to conditions of minimal ionic strengthand hardness (Solution A: 5.28 ml/min). However, un-like pH, the reduced permeate flow is believed to belargely due to an increase in osmotic pressure with in-creasing ionic strength and/or hardness. Concentrationpolarization during operation also increases osmoticpressure, causing a further decrease in permeate flow.
4.4. Statistical analysis
A regression analysis was performed on the 24duplicated experiments. The actual removals (i.e.feed−permeate) were used in the statistical analysisto minimize carry-over bias (raw water values accoun-ted for twice in relative removals). Regarding AOCremoval, the model that maximized fit and predict-ability at 95% confidence, and minimized error
14 I.C. Escobar et al. / Journal of Membrane Science 175 (2000) 1–17
included the membrane type (MT), the transformedionic strength (IS), and the transformed hardness (H),all unitless, as shown in Eq. (2)
log(AOC removed) = 2.08− 0.088 MT
−0.12 IS− 0.27H (2)
This model displayed an adjustedR2=0.71 and meansquare of error (MSE) of 0.0287.
From the statistical model, it was determined thathardness, ionic strength and membrane type weresignificant in the prediction of AOC removals. Ashardness and ionic strength increase, the membranesurface charge becomes less negative and chargerepulsion decreases, so the role of size exclusionin rejection becomes increasingly important, whichwould explain the importance of membrane type inthe model. Since the CA-SD membranes had lowerMWCO than TFC-S membranes, rejection was betterwhen CA-SD membranes were used.
From the model, the independent variable pH wasfound to be less significant at 95% confidence levelin the prediction of AOC removals. Experimental datashown in Figs. 4 and 5 also indicated that the effectof pH on AOC relative removal was relatively smallcompared to hardness and ionic strength. The pKa foracetate, the main component of AOC, is 4.74; that is,below this pH value, the predominant form is aceticacid, while above is acetate. Since the pH values tested(5.5 and 7.5) were above the pKa, the majority of AOCcompounds at both pH are in the form of acetate andconsequently the pH effect was not observed as clearlyas hardness and ionic strength.
BDOC removal was affected by the transformed in-dependent variables ionic strength (IS), hardness (H),pH, and membrane type (MT), and their interactionsat a 95% confidence level, as shown in Eq. (3)
log(BDOC removed)
= −1.08− 0.43 MT − 0.36 pH− 0.91H
−0.13(MT)(IS)
−0.23(MT)(H) − 0.32(pH)(H) (3)
This adjustedR2 was 0.98 and the MSE was 0.0135.In natural waters, BDOC-forming compounds are
mainly humic and fulvic acids (large organic carbonmolecules) as well as AOC compounds (e.g. acetate,
propionate). For this reason, BDOC-forming com-pounds are more heterogeneous than AOC-formingcompounds, so their rejection is expected to be morecomplex than the rejection of AOC compounds. Themodel suggests that all independent parameters testedwere significant and related to each other, implyingthat BDOC removal was largely governed by the com-bined effect of several mechanisms, such as chargerepulsion, size exclusion, and possibly hydrophobicinteractions [16].
4.5. Comparison of nanofiltration between full-scaleand bench-scale
Full-scale NF membrane plant operating data wascollected over approximately 12 months starting fromSeptember 1997. Figs. 8 and 9 show the monthly AOCand BDOC concentrations of raw and NF filtered wa-ters during this sampling period. The quality of thewater obtained from the surficial Biscayne aquifershowed a high variation. This was attributed to therainfall occurring on the surface in February, March,and particularly in July. All of the maximum sourcewater values for AOC, and BDOC occurred during themonth of July, coinciding with a period of heavy rain-fall, 4.60 in., following a drought, when only 0.02 in.of rain fell. Differences in the aquifer raw water werevisible and occurred at the other plants operated byPBCWUD also. Color, odor, and other customer com-plaints were also the highest during this period.
The year-average AOC concentrations were 141 and147mg/l as acetate-C for the raw water and nanofil-tration effluent, respectively. There was no significantdifference between the raw water and the nanofiltrate,suggesting that nanofiltration did not significantly re-move AOC from the raw water. In fact, the averageeffluent AOC concentrations increased slightly com-pared to the raw water AOC. This may be due tothe addition of antiscalant and low purity acid (rela-tive to the low detection levels of the AOC bioassay),which may have contained carbon-compound impuri-ties. AOC contribution from chemical feeds has beenseen and documented previously [27,28].
The poor AOC rejection observed in the full-scalesystem were consistent with the hypothesis that chargerepulsion was the main mechanism for AOC removalby NF membranes. In general, compounds quantifiedas AOC are from the fraction of BDOC composed of

I.C. Escobar et al. / Journal of Membrane Science 175 (2000) 1–17 15
Fig. 8. Monthly AOC concentrations (mg acetate-C/l) for raw water and nanofiltrate.
smaller, highly charged organic substances. Most ofthese organic compounds are small enough to passthrough NF membranes, and thus, their retention byNF membranes is mainly governed by electrostaticrepulsion. It is also expected that AOC would be re-moved poorly at feed solution environments, which
Fig. 9. Monthly BDOC concentrations (mg/l) for raw water and nanofiltrate.
repress electrostatic interactions between the mem-branes and charged organic compounds. This is typi-cally the case with a membrane treating groundwater,which would have (after pretreatment) low pH, highionic strength, and high hardness. In fact, these so-lution chemistries were present at the full-scale plant
16 I.C. Escobar et al. / Journal of Membrane Science 175 (2000) 1–17
studied and are easily created in typical full-scaleoperation with multi-stage high recovery systems,explaining the observed low AOC rejection.
In contrast to the AOC observations, monthlyBDOC data showed that nanofiltration removed ap-proximately 97% of the raw water BDOC. AverageBDOC concentrations were 2.80 and 0.10 mg/l forthe raw water and nanofiltration effluent, respectively.In addition, unlike AOC, the BDOC of nanofiltratedid not change with raw water BDOC, indicating thatthe main mechanism of BDOC removal by NF mem-branes was size exclusion. In natural waters, BDOC-forming compounds typically consist of large organicmacromolecules such as humic and fulvic acids (un-like the bench scale experiments where BDOC hada disproportionate fraction of acetate). Thus, it isnot surprising that BDOC was significantly removedby the full-scale TFC-S NF membrane which had amolecular cut off of 200 Da.
5. Conclusions
• Bench-scale studies and streaming potential analy-sis of both RO and NF membranes suggested thatAOC rejection was a function of charge repulsionbetween the membrane surface and the AOC com-pounds.
• Increased hardness, ionic strength, or hydrogen ionswere shown to mask the negative surface charge ofthe membrane. Charge masking due to increasedhardness and ionic strength, or lower pH resulted insignificant reductions in the removal of AOC andthe low molecular weight fraction of BDOC.
• Full-scale nanofiltration removed the bulk of the rawwater BDOC but virtually all of the AOC passedthrough. BDOC was probably rejected due to sizeexclusion, while AOC could not be rejected in theabsence of significant charge repulsion.
• High raw water hardness and ionic strength ingroundwater treatment, combined with acid addi-tion to prevent scaling/fouling, results in a solutionchemistry which allows compounds that are notsieved out (e.g. low molecular weight AOC com-pounds) to pass almost unhindered through NFmembranes and a significant fraction may also passthrough RO membranes. This has significant im-plications for the biostability of membrane treated
drinking water since AOC has been correlated withincreased bacterial populations in water distribu-tion systems, especially in the absence of or at lowchlorine residuals.
Acknowledgements
The authors would like to extend sincere appreci-ation to Mark LeChevallier, James Taylor, EugeniaCarey, Jaya Navani, and Christian Volk for invalu-able technical support, and Tom Stocker from FluidSystems for providing the membrane samples. Ad-ditionally, the AWWARF and EPA STAR fellowshipprogram are thanked for providing financial support.
References
[1] M.W. LeChevallier, W. Shulz, R.G. Lee, Bacterial nutrientsin drinking water, Appl. Environ. Microbiol. 57 (1991) 857–862.
[2] I. Miettinen, T. Vartiainen, T. Martikainen, Determination ofassimilable organic carbon in humus-rich drinking waters,Water Res. 33 (1999) 2277–2282.
[3] A. Sathasivan, S. Ohgaki, K. Yamamoto, N. Kamiko, Roleof inorganic phosphorus in controlling regrowth in waterdistribution system, Water Sci. Technol. 35 (1997) 37–44.
[4] D. Van der Kooij, Assimilable organic carbon as an indicatorof bacterial regrowth, J. Am. Water Works Assoc. 84 (1992)57–65.
[5] M.W. LeChevallier, T. Babcock, R.G. Lee, Examinationand characterization of distribution system biofilms, Appl.Environ. Microbiol. 53 (1987) 2714–2724.
[6] I. Sibille, L. Mathieu, J. Paquin, D. Gatel, J. Block, Microbialcharacteristics of a distribution system fed with nanofiltereddrinking water, Water Res. 31 (1997) 2318–2326.
[7] P.A. Noble, D.L. Clark, B.H. Olson, Biological stability ofgroundwater, J. Am. Water Works Assoc. 88 (1996) 87–96.
[8] K. Agbekodo, B. Legube, P. Cote, Organic in NF permeate,J. Am. Water Works Assoc. 88 (1996) 67–74.
[9] T.A. Clair, J.R. Kramer, M. Sydor, D. Eaton, Concentrationof aquatic dissolved organic matter by reverse osmosis, WaterRes. 25 (1991) 1033–1037.
[10] P.M. Huck, Measurement of biodegradable organic matterand bacterial regrowth in drinking water, J. Am. Water WorksAssoc. 82 (1990) 78–86.
[11] C. Volk, C. Renner, C. Robert, J.C. Joret, Comparison oftwo techniques for measuring biodegradable dissolved organiccarbon in water, Environ. Technol. 15 (1994) 545–556.
[12] J.C. Joret, Y. Levi, C. Volk, Biodegradable dissolved organiccarbon (BDOC) content of drinking water and potentialregrowth of bacteria, Water Sci. Technol. 2 (1991) 95–101.
I.C. Escobar et al. / Journal of Membrane Science 175 (2000) 1–17 17
[13] J.P. Block, K. Haudidier, J.L. Paquin, J. Miazga, Y. Levi,Biofilm accumulation in drinking water distribution systems,Biofouling 6 (1993) 333–343.
[14] P. Servais, G. Billen, P. Laurent, Y. Levi, G. Randon, Bacterialregrowth in distribution systems, in: Proceedings of theAWWA WQTC Conference, Miami, FL, 7–10 November1993.
[15] D. Van der Kooij, Assimilable organic carbon (AOC) indrinking water, in: G.A. McFeters (Ed.), Drinking WaterMicrobiology, New York, 1990.
[16] S.C. Lynch, J.K. Smith, Evaluation of reverse osmosis toconcentrate organic contaminants from water, Adv. Chem.Ser. 241 (1987) 437–465.
[17] J. Cho, G. Amy, J. Pellegrino, Membrane filtration of naturalorganic matter: initial comparison of rejection and flux declinewith charged ultrafiltration (UF) membrane, J. Membr. Sci.,1999, in press.
[18] W. Mendenhall, T. Sincich, A Second Course in BusinessStatistics: Regression Analysis, 4th Edition, Dellen PublishingCompany, New York, NY, 1993.
[19] A.E. Childress, M. Elimelech, Effect of solution chemistryon the surface charge of polymeric reverse osmosis andnanofiltration membranes, J. Membr. Sci. 119 (1996) 253–268.
[20] American Public Health Association, Standard Methods forWastewater and Water Treatment, 19th Edition, Washington,DC, 1995.
[21] L.A. Kaplan, T.L. Bott, Nutrients for Bacterial Growthin Drinking Water: Bioassay Evaluation, EPA/600/2-89/030,U.S. Environmental Protection Agency, Cincinnati, 1989.
[22] M.W. LeChevallier, N. Shaw, L. Kaplan, T. Bott, Developmentof a rapid assimilable organic carbon method for water, Appl.Environ. Microbiol. 59 (1993) 1526–1531.
[23] D. Van der Kooij, Assimilable organic carbon as an indicatorof bacterial regrowth, J. Am. Water Works Assoc. 84 (1982)57–65.
[24] I.C. Escobar, A.A. Randall, Influence of nanofiltration ondistribution system biostability, J. Am. Water Works Assoc.91 (1999) 76–89.
[25] J.C. Joret, Y. Levi, Méthode Rapide d’évaluation du CarboneÉliminable des eaux par voie Biologique, Trib. Cebedeau 39(1986) 3–9.
[26] S. Hong, M. Elimelech, Chemical and physical aspectsof natural organic carbon (NOM) fouling of nanofiltrationmembranes, J. Membr. Sci. 132 (1997) 159–181.
[27] P. Hiemstra, J. Van Paassen, B. Rietman, J. Verdouw, Aerobicversus anaerobic nanofiltration: fouling of membranes, in:Proceedings of the AWWA Membrane Conference, LongBeach, CA, 28 February–3 March 1999.
[28] D. Van der Kooij, H.S. Vrouwenvelder, H.R. Veenendaa,Tools for assessing water quality characteristics related withbiofouling of membranes for nanofiltration or reverse osmosisin water treatment, in: Proceedings of the AWWA MembraneConference, Long Beach, CA, 28 February–3 March 1999.
Related Documents