arXiv:quant-ph/0407164v1 20 Jul 2004 Remote Spectral Measurement Using Entangled Photons Giuliano Scarcelli, Alejandra Valencia, Samuel Gompers and Yanhua Shih Department of Physics, University of Maryland, Baltimore County, Baltimore, Maryland 21250 Abstract By utilizing the frequency anticorrelation of two-photon states produced via spontaneous parametric down conversion (SPDC), the working principle of a novel remote spectrometer is demonstrated. With the help of a local scan- ning monochromator, the spectral transmission function of an optical element (or atmosphere) at remote locations can be characterized for wide range of wavelengths with expected high resolution. 1

Welcome message from author
This document is posted to help you gain knowledge. Please leave a comment to let me know what you think about it! Share it to your friends and learn new things together.
Transcript
arX
iv:q
uant
-ph/
0407
164v
1 2
0 Ju
l 200
4
Remote Spectral Measurement Using Entangled Photons
Giuliano Scarcelli, Alejandra Valencia, Samuel Gompers and Yanhua Shih
Department of Physics, University of Maryland, Baltimore County, Baltimore, Maryland 21250
Abstract
By utilizing the frequency anticorrelation of two-photon states produced via
spontaneous parametric down conversion (SPDC), the working principle of a
novel remote spectrometer is demonstrated. With the help of a local scan-
ning monochromator, the spectral transmission function of an optical element
(or atmosphere) at remote locations can be characterized for wide range of
wavelengths with expected high resolution.
1
Two-photon states generated via SPDC have been a very resourceful tool for studying
fundamental aspects of quantum theory [1]. Recently also their practical applications have
been exploited opening new fields like quantum information processing, quantum metrology,
quantum imaging and quantum lithography [2]. In this paper we use SPDC as a frequency
anticorrelated two-photon source to demonstrate the working principle of a novel remote
spectrometer: a local scanning monochromator is located in a laboratory, but it defines
the wavelength measured at remote locations because of the frequency anticorrelation be-
tween photons in a pair emitted by SPDC. The process is equivalent to carry a “conjugate
monochromator” to remote locations. The proposed method shows a number of interesting
features: SPDC sources offer the natural possibility of wide spectral ranges of operation, and
due to the frequency anticorrelation between the two photons in a pair and the coincidence-
like type of detection, it is possible to make the two detectors operate in very different spec-
tral regions without affecting the measurement with spurious signals and without changing
the resolution of the measurement determined by the local monochromator.
The process of SPDC involves passing a pump laser beam through a nonlinear material,
for example, a non-centrosymmetric crystal. Occasionally, the coherent nonlinear interaction
leads to the annihilation of a high frequency pump photon and the simultaneous creation of
two lower frequency photons, signal and idler, which satisfy the phase matching conditions
[3]:
ωp = ωs + ωi, kp = ks + ki (1)
where ωj , kj (j = s, i, p) are frequencies and wavevectors of the signal (s), idler (i), and
pump (p) respectively.
The schematic setup of the remote spectrometer is shown in Fig. 1. Photon pairs are gen-
erated through the SPDC process in a local laboratory. The signal photon is sent to a remote
location (e.g. space) passing through the optical element (or atmosphere) whose transmis-
sion spectral function is to be measured. The idler photon passes through a monochromator
in the laboratory. The signal and the idler are then detected by photon counting detectors
2
D1, in the space, and D2, in the laboratory. Each detector is connected to an event timer, an
electronic device that records the registration time history at which a “click” detection event
on the detector has occurred [4]. The registration time history of detector D1 of the space
station is sent back to the laboratory through a classical communication channel (telephone,
internet etc.). The two individual registration time-histories are analyzed to achieve maxi-
mum “coincidences” by shifting the time bases of the two. The remote spectrometer is now
properly set. The spectral function of the remote spectral filter is obtained by measuring
the rate of coincidence counts at each wavelength defined by the monochromator.
Perhaps the most important feature of the remote spectrometer is the enormous range
of wavelengths that can be analyzed. This aspect comes, as previously mentioned, from
the frequency correlation between the signal and idler photons. According to Eq. (1), if
a pump laser at 400nm is used, a scanning monochromator working in the visible region
(400nm − 700nm) will be able to remotely analyze a virtually infinitely large range of
infrared wavelengths. The resolution of the remote characterization will be determined by
the monochromator’s inherent resolution. Thus, using a high resolution monochromator in
visible wavelengths will permit high resolution calibrations in infrared wavelengths.
Considering the experimental setup in Fig. 1, the joint detection counting rate, Rc, of
detectors D1 and D2, on the time interval T , is given by the Glauber formula [5]:
Rc ∝1
T
∫ T
0
∫ T
0dt1dt2 G
(2)(t1, r1; t2, r2) (2)
In Eq. (2) G(2)(t1, r1; t2, r2) is the second order correlation function defined as:
G(2)(t1, r1; t2, r2) ≡ | 〈0|E(+)2 (t2, r2)E
(+)1 (t1, r1) |Ψ〉 |2 =| ψ(t1, r1; t2, r2) |
2 (3)
Here ψ is defined as the effective two-photon wavefunction [6]. E(±)i (ti, ri), i = 1, 2, are
positive-frequency and negative-frequency components of the field at detectors D1 and D2
that can be written as:
E(+)1 (t1, r1) =
∫dω f(ω) a(ω) e−i[ωt1−k(ω)r1]
E(+)2 (t2, r2) =
∫dωΠ(ω − ωM) a(ω) e−i[ωt2−k(ω)r2] (4)
3
where f(ω) is the spectral function to be measured and Π(ω − ωM) simulates the spectral
function of the monochromator: a narrow-bandpass function centered at wavelength ωM .
The signal-idler two-photon state of SPDC can be calculated by applying the first order
perturbation theory of quantum mechanics [3]. Restricting the calculation to one dimension
and collinear SPDC, the two-photon state is:
|Ψ〉 =∫ ∞
−∞dν Φ(ν) a†s(ω
0s + ν) a†i (ω
0i − ν) |0〉 , (5)
where Φ(ν) is the spectral amplitude of SPDC and is determined by the wavevector phase
matching inside the nonlinear crystal, a† is the photon creation operator, |0〉 denotes the
vacuum state. Here ω0s and ω0
i are the central frequencies of the signal-idler radiation field,
ν is a parameter satisfying:
ωs = ω0s + ν, ωi = ω0
i − ν, ω0s + ω0
i = ωp, (6)
Using Eq. (4) and Eq. (5), and expanding the wavevector k to the second order in ν, the
effective two-photon wave function becomes:
ψ(τ) =∫dν Φ(ν) f(ω0
s + ν)Π(ω0i − ν − ωMe
−iντ e−i[k′′
1r1+k
′′
2r2]ν2
2 (7)
where τ ≡ [(t2 −r2
u2) − (t1 −
r1
u1)]; u1,2 ≡ 1/k′1,2(ω
0s,i) are the inverse first order dispersions
of the media in which the signal and the idler propagate. Eq. (7) indicates that ψ(τ) is the
Fourier transform of a product of four functions. The second order dispersion of the media
will contribute to the broadening of the function G(2) [7]: depending on the propagation
distance, this broadening may affect the operational decision of the “coincidence” time
window width. The second order dispersion can be “cancelled” by introducing into the
optical path a different type of dispersive material that has the same magnitude of second
order dispersion but an opposite sign [8], see Eq. (7). Based on these considerations, we will
ignore the second order dispersion in the following. In this case, we can treat Π(ω0i −ν−ωM )
as a δ-function if f(ω0s +ν) and Φ(ν) are much wider then Π(ω0
i −ν−ωM). G(2)(τ) becomes:
G(2) ∼|∫dν Φ(ν) f(ω0
s + ν)δ(ω0i − ν − ωM) e−iντ |2 (8)
4
and the coincidence counting rate is then:
Rc ∼ |Φ(ω0i − ωM) f(ωp − ωM)|2 (9)
Furthermore, if Φ(ω0i − ωM) is relatively flat compared to function f(ωp − ωM), which can
be achieved experimentally, Eq. (9) becomes,
Rc ∼ |f(ωp − ωM)|2 (10)
i.e the rate of coincidence counts reproduces exactly the spectral function of the remote
optical element, but reversed in frequency with respect to the frequency of the pump.
The detailed experimental demonstration setup is shown in the lower part of Fig. 1. An
Argon ion laser line of 457.9nm was used to pump a 8mm LBO crystal for SPDC. The LBO
was cut for type II degenerate collinear phase matching. The LBO crystal was slightly tilted
in the case of non-degenerate collinear phase matching. After passing through the crystal,
the pump beam was blocked by two mirrors with high reflectivity at the pump wavelength
and by a Newport RG715 color glass filter. The orthogonally polarized photon pair was then
split by a polarizing beam splitter. The transmitted signal photons were detected by a single-
photon counting moduleD1 (Perkin-Elmer SPCM-AQR-14) after passing through the optical
element to be characterized. The reflected idler photons were sent to a monochromator (CVI
Digikrom CM110) with 2nm resolution through a 38mm focal length lens. A 50mm focal
length lens was placed at its focal distance from the LBO crystal in order to collect the
necessary wide spectrum of SPDC radiation into the monochromator. The output of the
monochromator was then collected and detected by another single-photon counting module
D2. The photocurrent pulses from detectors D1 and D2 were then sent to the “coincidence
counting circuit” with 5ns integrating time window.
In order to meet the requirement that led to Eq. (10), in which we assumed a relatively
flat SPDC spectrum, Φ(ω0i − ωM), compared to the filter function, f(ωp − ωM), we needed
to collect the entire region of relevant SPDC spectrum and couple all the wavelengths into
the monochromator with the same efficiency. The choice of the lenses was made exactly to
pursue this objective.
5

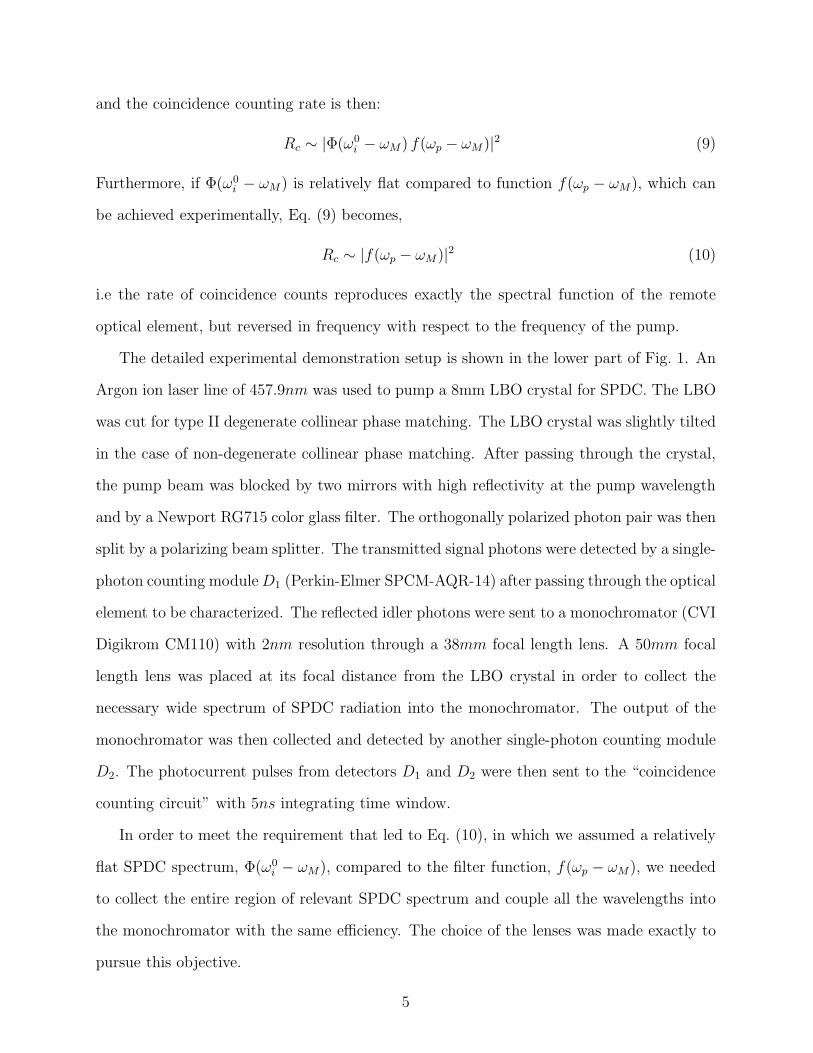
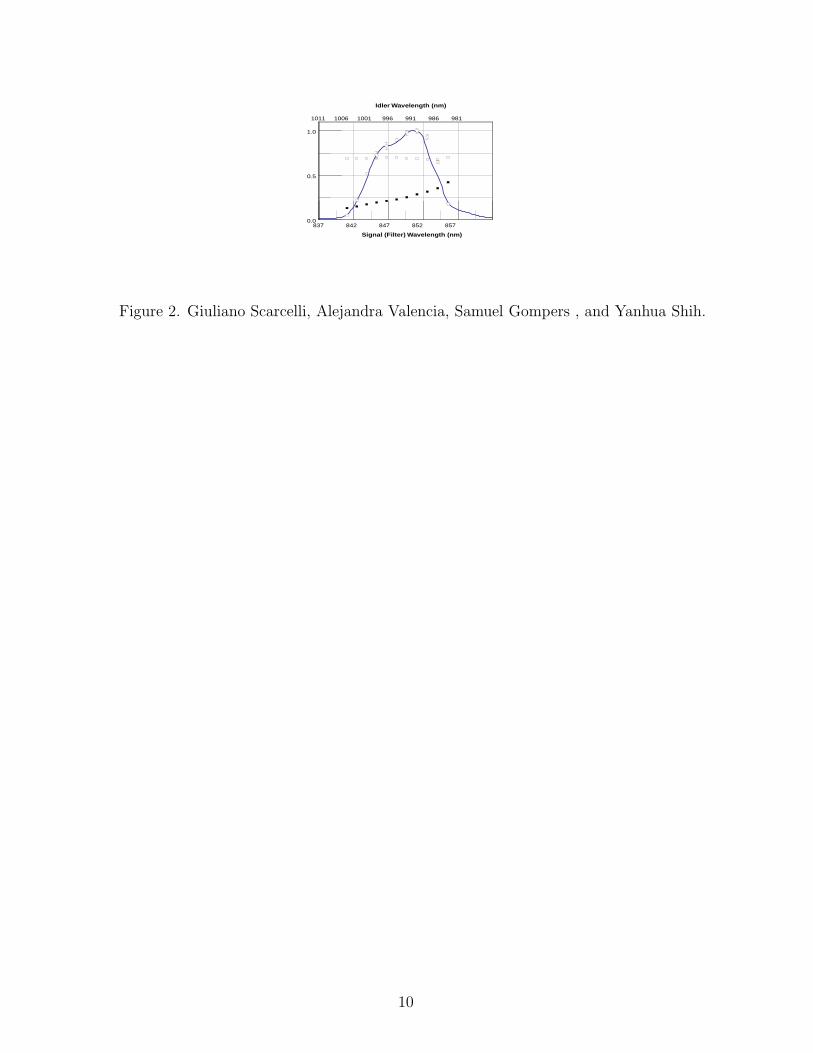
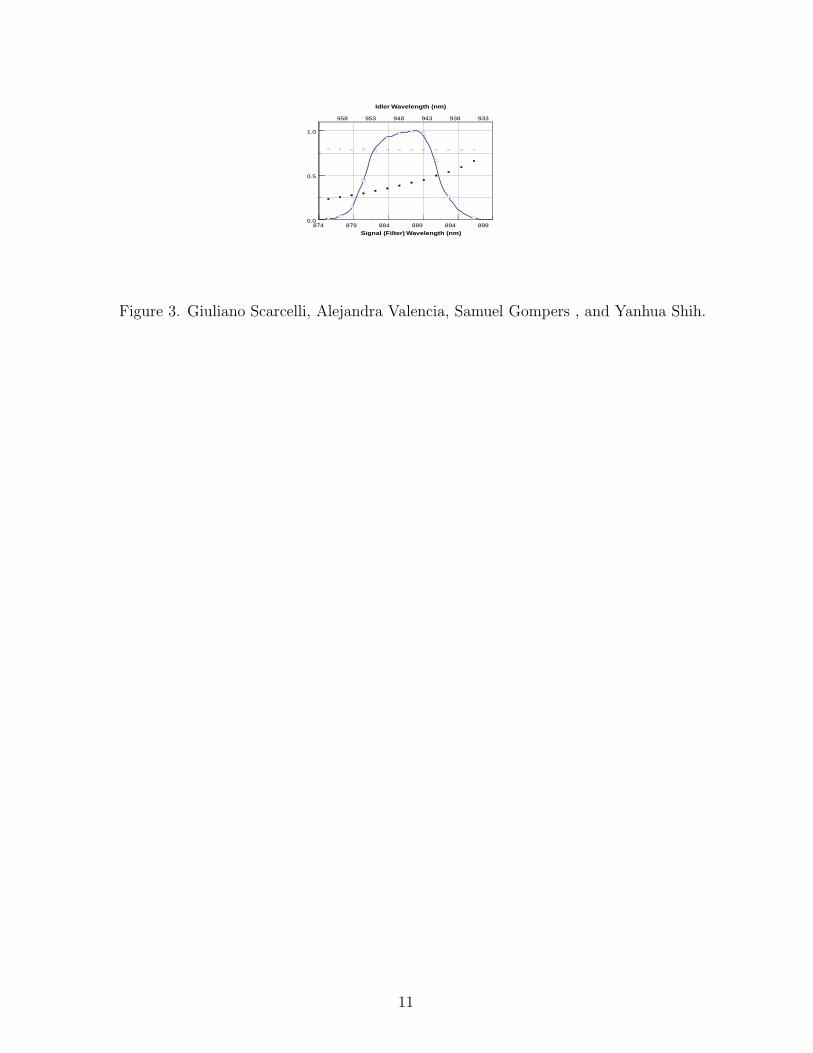
Fig. 2, Fig. 3 and Fig. 4 report three typical measurements for bandpass filters centered
at 850nm, 885.6nm and 916nm with bandwidths of 10nm, 11nm and 10nm, respectively.
In the graphs, we provided two scales of wavelengths, referred to the signal and the idler
wavelengths. These wavelengths can also be read as local “actually” measured wavelength
(λ-idler) and “remote” indirectly measured wavelength (λ-signal). The reported single de-
tector counting rates of D2 are slightly “tilted” at longer wavelengths. The tilting slope
is mainly determined by the coupling efficiency of the monochromator [9]. To account for
this, we normalized the coincidence counts accordingly (see figure captions for details). It
is clear from these experimental data that the remote measurements agree with the stan-
dard laboratory classical spectral transmissivity calibration curves and with the theoretical
predictions.
The authors would like to thank H. Malak, V. Berardi and M.H. Rubin for helpful
discussions and encouragement. This research was supported in part by ONR, NSF and
NASA-CASPR program.
6

REFERENCES
[1] A.Einstein, B.Podolsky, N.Rosen, Phys. Rev. 47, 777 (1935).
[2] See for example recent review papers: J.P. Dowling, G.J. Milburn, quant-ph/0206091
and A. Migdall, Physics Today 52, 41 (1999).
[3] D.N. Klyshko, Photons and Nonlinear Optics (Gordon & Breach, New York,1988); A.
Yariv, Quantum Electronics, John Wiley and Sons, New York, (1989).
[4] C. Steggerda et al, Proceedings of the 10th International Workshop on Laser Ranging
Instrumentation, Ed. F.M. Yang, Chinese Academy of Sciences Press, 404 (1996).
[5] R.J. Glauber, Phys. Rev. 130, 2529 (1963); 131, 2766 (1963).
[6] M.H. Rubin, D.N. Klyshko, Y.H. Shih, and A.V. Sergienko, Phys. Rev. A 50, 5122
(1994).
[7] A.Valencia, M.V.Chekhova, A.Trifonov and Y.Shih, Phys. Rev. Lett. 88, 183601 (2002).
[8] J.D. Franson, Phys. Rev. A, 45, 3126 (1992).
[9] W.Demtroder, Laser Spectroscopy (2nd edition, Springer, 1998).
7

FIGURES
FIG. 1. Scheme of a remote spectrometer and the experimental setup
FIG. 2. Experimental characterization of a 10nm bandpass filter centered at 850nm. The solid
line is a direct measurement of the transmissivity function of the 850nm spectral filter by using
classical method; hollow squares are the single counts of detector D1 (∼ 2.5 Mc/second); filled
squares are the single counts of detector D2 (peak of ∼ 10 Kc/s). The circles are the normalized
coincidence counts weighted by the single counts of detector D2 (peak of ∼ 900 cc/s).
FIG. 3. Experimental characterization of a 11nm bandpass filter centered at 885.6nm. The
solid line is the standard characterization; hollow squares are the single counts of D1 (∼ 3 Mc/s);
filled squares are the single counts of D2 (peak of ∼ 12 Kc/s). The circles are the normalized cc
weighted by the single counts of D2 (peak of ∼ 1100 cc/s) .
FIG. 4. Experimental characterization of a 11nm bandpass filter centered at 916nm. The solid
line is the standard characterization; hollow squares are the single counts of D1 (∼ 1.5 Mc/s);
filled squares are the single counts of D2 (peak of ∼ 10 Kc/s). The circles are the normalized cc
weighted by the single counts of D2 (peak of ∼ 900 cc/s).
8

Ar+
458 nm
LBO
PBS M
f=50mmLens
D1Filter to beAnalyzed
D2
f=38mmLens
f=100mmLens
Monochromator
FilterCutoff
Space Station
PC
D1
D2
Source ofEntangled Photons
Event Detection History
Event Detection History
EventTimer
1
EventTimer
2
Laboratory
ClassicalChannel
Monochromator
Cw Laser
M
Optical Element to be analyzed
Figure 1. Giuliano Scarcelli, Alejandra Valencia, Samuel Gompers , and Yanhua Shih.
9
837 842 847 852 857 0.0
0.5
1.0
Idler Wavelength (nm)
Signal (Filter) Wavelength (nm)
1011 1006 1001 996 991 986 981
Figure 2. Giuliano Scarcelli, Alejandra Valencia, Samuel Gompers , and Yanhua Shih.
10
874 879 884 889 894 899 0.0
0.5
1.0
Idler Wavelength (nm)
Signal (Filter) Wavelength (nm)
958 953 948 943 938 933
Figure 3. Giuliano Scarcelli, Alejandra Valencia, Samuel Gompers , and Yanhua Shih.
11

901 906 911 916 921 926 0.0
0.5
1.0
931 926 921 916 911 906
Idler Wavelength (nm)
Signal (Filter) Wavelength (nm)
Figure 4. Giuliano Scarcelli, Alejandra Valencia, Samuel Gompers , and Yanhua Shih.
12
Related Documents