1 Data Integration and Visualization for Crisis Applications R. Meisner 1 , S. Lang 2 , E. Jungert 3 , A. Almer 4 , D. Tiede 2 , N. Sparwasser 1 , K. Mertens 5 , R. Göbel 6 , T. Blaschke 2 , A. de la Cruz 7 , H. Stelzl 4 , K. Silverarg 3 Contact: [email protected]; [email protected] 1 German Aerospace Center (DLR), Oberpfaffenhofen, Germany; 2 Center for Geoinformatics (Z_GIS), Salzburg, Austria; 3 Swedish Defence Research Agency (FOI), Linköping, Sweden; 4 Joanneum Research (JR), Graz, Austria; 5 Royal Military Academy, Brussels, Belgium; 6 University of Applied Sciences, Hof, Germany; 7 European Satellite Center (EUSC), Torrejon, Spain; 1. Introduction In most crisis situations, rapid yet reliable information provision is highly supportive – if not crucial – for crisis-related decision making and effective disaster management. Disaster response based on satellite data and GIS- Information, pushed and challenged by a series of events in the recent past, moves ahead in providing maps and other information products more rapidly and at a higher degree of automation and consistency. In order to fulfil this demand, there is a need for effective data integration and advanced data visualisation. These two topics may appear distinct at first glimpse, yet from an operational point of view they are strongly interlinked and of mutual interdependence. In this chapter we highlight key aspects of crisis-related visualisation strategies comprising methods and models such as predefined landscape models, and tools including 2D and 3D web viewers and globe viewers, and we discuss their inextricable linkage with data integration. We also include a section on rapid scene generation based on an integrated workflow for including information extraction, analysis and delivery. We close this chapter with an overview of visualisation tools used in the GMOSS context. The tools are grouped in a genetic approach, looking whether they are coming from a GIS environment or from computer graphics. But irrespective of the history of the tools being used, the development of a sound methodology and pre-defined workflows for providing visualisations on demand rely on thorough, yet effective data integration. This includes several technical challenges, such as: The need for a widely applicable model and workflow from data capture to visualisation; The use of various visualisation approaches which are currently not exchangeable;

Welcome message from author
This document is posted to help you gain knowledge. Please leave a comment to let me know what you think about it! Share it to your friends and learn new things together.
Transcript

1
Data Integration and Visualization for Crisis
Applications
R. Meisner1, S. Lang
2, E. Jungert
3, A. Almer
4, D. Tiede
2, N. Sparwasser
1, K.
Mertens5, R. Göbel
6, T. Blaschke
2, A. de la Cruz
7, H. Stelzl
4, K. Silverarg
3
Contact: [email protected]; [email protected]
1German Aerospace Center (DLR), Oberpfaffenhofen, Germany; 2Center for Geoinformatics (Z_GIS),
Salzburg, Austria; 3Swedish Defence Research Agency (FOI), Linköping, Sweden; 4Joanneum Research (JR),
Graz, Austria; 5Royal Military Academy, Brussels, Belgium; 6University of Applied Sciences, Hof, Germany; 7European Satellite Center (EUSC), Torrejon, Spain;
1. Introduction
In most crisis situations, rapid yet reliable information provision is highly
supportive – if not crucial – for crisis-related decision making and effective
disaster management. Disaster response based on satellite data and GIS-
Information, pushed and challenged by a series of events in the recent past, moves
ahead in providing maps and other information products more rapidly and at a
higher degree of automation and consistency. In order to fulfil this demand, there
is a need for effective data integration and advanced data visualisation. These two
topics may appear distinct at first glimpse, yet from an operational point of view
they are strongly interlinked and of mutual interdependence. In this chapter we
highlight key aspects of crisis-related visualisation strategies comprising methods
and models such as predefined landscape models, and tools including 2D and 3D
web viewers and globe viewers, and we discuss their inextricable linkage with
data integration. We also include a section on rapid scene generation based on an
integrated workflow for including information extraction, analysis and delivery.
We close this chapter with an overview of visualisation tools used in the GMOSS
context. The tools are grouped in a genetic approach, looking whether they are
coming from a GIS environment or from computer graphics. But irrespective of
the history of the tools being used, the development of a sound methodology and
pre-defined workflows for providing visualisations on demand rely on thorough,
yet effective data integration. This includes several technical challenges, such as:
The need for a widely applicable model and workflow from data capture to
visualisation;
The use of various visualisation approaches which are currently not
exchangeable;

2
The generation of 3D visualisations from GIS-databases and make use of
various methods showing proposed or potential changes;
The definition of methods to enhance speed and quality for the generation
of three dimensional, realistic landscape models.
Until a few years ago, Geographic Information Systems (GIS) used for
representing and modelling reality on one hand, and near-realistic landscape
visualisations on the other hand used completely different technologies. Today,
landscape visualisations are increasingly generated from GIS databases. The
growing accessibility of this technique is pushed forward by ever increasing cost-
efficiency, capability and availability of computer hardware, visualisation
software, and GIS data. Within the last twenty years, great achievements were
made concerning the level of detail, the degree of realism and the overall visual
quality of computer visualisations (Sheppard, 2000). Utilizing these increased
capabilities we will be able to address the above mentioned challenges induced by
the time constraints of ‘near-real time applications’ as imposed in any kind of
crises management. Still, with those capabilities at hand we also need to be
cautious, with a certain sense of responsibility. Current visualisation technology
has to be carefully evaluated concerning its usability for responders and decision
makers. More specifically, it requires a common understanding, a common
language between GIS scientists and visualisation specialists and a common set of
objectives. By creating and agreeing on a common operational picture (COP, see
chapter 2.3), we may achieve this common understanding on (1) the situation as
such, (2) the data needed to represent it and (3) the information packages required
and exchanged.
2. Requirements for security applications
2.1 Speed, real-time delivery and realism
Scenario techniques and photorealistic visualisations of scenarios have been
proven to be useful in the context of planning and participatory decisions in
general (e.g. Tress & Tress 2002). Tied into a spatial referencing system as
realised in GIS-based landscape visualisation, they become a powerful means for
producing true representations of status-quo and future situations, of great use for
various consultation exercises (Appleton & Lovet 2003). GIS-technology enables
integrating datasets such as large-scale baseline maps, digital elevation models

3
(DEM) for terrain representation, and any other auxiliary GIS layers on e.g.
critical infrastructure or population. For deriving and updating GIS data, remote
sensing imagery is a virtually unlimited, yet not fully exploited source (see
Blaschke et al. 2006 or Tiede & Blaschke 2005). However, detecting smaller or
narrower features such as power lines or single buildings requires imagery with a
sufficient spatial resolution (around 1 m or less), coupled with appropriate
analysis techniques. Whereas time constraints and high accuracy requirements in
certain situations do not allow for new developments, in other situations,
automated techniques built on established algorithms may significantly improve
the entire process, stepping beyond labour intensive visual interpretation. A
general limitation of remote sensing data is, that certain classes of critical features
such as administrative boundaries or no-go zones may be ‘invisible’ and therefore
hard to detect, unless they coincide with specific land-use patterns.
Visualisation in this context means representing reality. More specifically, the
effort, the proposed method and the quality of the visualisation largely depend on
an agreed ‘sufficient’ level of realism for a particular application. Whereas not
any kind of visualisation technique would necessarily require a ‘realistic
representation’ – as for example a baseline map showing the important features at
a disaster site with conventional symbology may be considered a highly efficient
means of communication – the techniques discussed here share a common
demand for realistic depictions. Technically, today computer models are capable
to render a high degree of (pseudo)realism, a fact impressively proven by the
game industry. However, in terms of the effort required, the degree of realism
negatively corresponds with the preparation work. Likewise, the degree of
automation and the flexibility in terms of adapting it to a changing situation won’t
allow a high degree of realism (see figure 1).
Fig. 1
Crises management has to find a trade-off between what might be possible and
what is feasible, i.e. to critically examine which level of detail and which degree
of realism is really required in the very situation.

4
2.2 Detection and ground sensor network
Today, there is a wide variety of different sensors available. Space-, air-borne and
in situ sensors need to be incorporated and data produced by these sensors need to
be integrated. A sensor network is commonly understood as a “computer network of
many, spatially distributed devices using sensors to monitor conditions at different
locations” (see http://en.wikipedia.org/wiki/Sensor_network). In non-technical
terms we may view a sensor network as serving the goal of “bringing together and
coordinate all necessary knowledge and response information quickly and effectively”
(see http://www.sensornet.gov). The following section exemplifies this by
illustrating the use of a rather unusual radar sensor and a ground sensor net both
designed for vehicle detection and tracking.
2.2.1 CARABAS
CARABAS is a synthetic aperture radar (SAR) carried by an air plane, flying at a
distance of 12 kilometres and at an altitude of about 6,000 meters. Compared to
traditional radars, CARABAS uses a very long wavelength (typically ranging
between 3 and 15 meters unlike the much more common microwave SAR that
uses wavelengths in the size of centimetres). Objects that are much smaller than
the wavelength do not significantly affect the result of the radar. The effect of this
is that CARABAS can see through vegetation, i.e. tree trunks and branches in a
forest does not prevent the radar for seeing what is on the ground. Objects,
arranged in a pattern, hidden in a forest are in spite of that detected by
CARABAS, which can bee seen in figure 2.
Fig. 2
2.2.2 Ground sensor neworkt
Complementary, a sensor network for ground surveillance can be used for
detection, tracking and classification of vehicles. The network can be made up by
arrays of either acoustic or seismic sensors, i.e. microphones and geophones.
Signal processing takes place in each of the sensor nodes. All sensors know their
position and orientation. In a multi-hop radio network they can communicate with
the other nodes and thus association and fusion of combined data can be
performed. The unattended ground sensor network (UGS) used here has not been

5
put into practice commercially yet, but it exists as a simulation connected to
MOSART (Tyskeng, 2003). The simulation though is verified using data from
real microphones and geophones (see figure 3).
Fig. 3
2.3 Common Operational Picture (COP)
The main purpose of a common operational picture (COP) is to present
information regarding relevant processes that may take place over longer or
shorter periods in time. One objective, among others, is to build an environment
for coordination and monitoring of emergency situations where situational
awareness should be determined, refined, compared and shared among users to
enable a common operational understanding. To bring such events to their ends
will require information often coming from a large number of different sources.
Consequently, all data generated by these different sources have to be merged or
gathered into a general overview of the situation and this has to be done in real
time or at least near real time. Such requirements may be hard to fulfil. However,
in many cases the users are willing to accept some delay if the information can be
presented in a way that will increase the users trust in the information. This will
also make it simpler for the users to make adequate and correct decisions.
From a user’s perspective, the COP is a highly dynamic interface environment in
which data can be distributed and exchanged. By this a consistent information
database is developed where each user can contribute, process and add value to
this database according to the processing needs within any specific emergency
situation or task. In general, users can be considered experts in different fields and
have different information requirements due to different responsibilities.
According to that users may interpret the information residing in the COP in
different ways depending on background, knowledge and other aspects of
individual attitude. For this reason, a COP should be consistent among all users
meaning a picture that with respect to the actual information coincides with the
operational pictures of all other users. Otherwise, inconsistency of information
may cause an obvious risk that users may have different awareness of the crisis

6
and consequently they may draw diverging conclusions when interpreting a given
situation. Hence, crisis management or other similar activities will become
difficult without a common operational picture, due to the lack of consistent
information and insufficient situational awareness. Basically, this is the main
intention when using a COP, to give the users an awareness of the current
situation in the ongoing process (i.e. the crisis). To provide means for delivering
incoming information to the users, visualization techniques are required as well. A
system for the support of a COP presentation must include capabilities for
selection, analysis and visualization of relevant information to, if needed, give the
users a high degree of situation awareness of the ongoing process. From a service
perspective the COP-system can regarded as part of a service architecture to
which various services can be attached. Such an approach will make it possible to
see the COP-system as a decision support tool as well.
Summarizing, the COP aims at providing all the necessary tools to assure that the
decision makers have received correct situation awareness. In order to accomplish
this, the COP-System must be able to manage the very diverse incoming
information, to fuse this information, when ever necessary, and to present it in a
well-organized manner to the decision makers. Furthermore, the users must also
be able to share this information to maintain the overall situation awareness.
A simple example of a COP can be seen in figure 4. In this example the objects
that occur are represented with symbols. The text in the figure is given just for
explaining the types of objects, though it is generally not present in a COP-system
unless the user requests this. The example is taken from a scenario simulated in a
simulation framework developed at FOI. The scenario is run in the simulator to
demonstrate how the different services can be used for building up an actual COP.
Likewise it illustrates how the dynamic processes that are carried out in the
scenario reflect the changes that occur over time. The selected objects in the COP
are mainly generated from a query language for multiple sensor data sources and
correspond to the result of different queries.
Fig. 4

7
3. Data integration, visualisation and dissemination
Three-dimensional (3D-) visualisation of virtual landscapes has undergone
quantum leaps over the last years concerning performance and quality. This is
particularly true for real-time processing. This development today allows for
integrating huge data sets such as very high spatial resolution (VHSR) satellite
imagery and DEMs into 3-D landscape models that reveal a very high degree of
spatial detail. Even specific landscape elements like single trees, buildings,
ground patterns, or infrastructure items can be integrated into these kinds of
models. These elements significantly increase the degree of realism and the
quality of visualisation. Visualisation techniques in general can be used to convey
a (pseudo-) realistic impression of the setting under concern or a part of it, without
actually being in place. This may be of critical advantage during crisis situations,
because relief units can familiarise themselves with the situation at place even
before going there. For this purpose we can also freely adapt the visualised
situation, as soon as new data become available. Finally, we are able to simulate
situations, which might occur.
The following section 3.1 briefly describes the relevant steps of a workflow which
comprises both the processing and the visualisation of geo-information. This
workflow is considered a production chain for the visualisation process, by which
the products of mapping and subsequent analyses are delivered adequately and in
time. Section 3.2 shows possibilities for web-based visualizations for information
dissemination, including online map presentations and real-time 3D
visualizations. In section 3.3 we provide a tabular summary of 3D visualisation
tools as being tested and used within the GMOSS network. Specifications are
given in bullets form.
3.1 Fast and automatic scene generation – rapid visualization
Fast generation of realistic landscape models and scenes is the key to the usability
of simulation techniques and remotely sensed data in security applications. Since
traditional methods for generating realistic models are likewise time and work
intensive, a way for an automated generation of fine-scaled landscape models is
presented here. It includes data integration, object-based information extraction,
establishing object libraries and visualisation. The workflow as being developed

8
by Z_GIS has been applied on QuickBird data (acquired 12/2004) of the Sudanese
refugee camp Goz Amer in Eastern Chad (cf. Lang et al., 2006).
Matching and integration of various source data
The integration of data originating from different sources (like satellite data,
DEM, auxiliary vector data) requires detailed documentation about data format
and quality (spatial and thematic accuracy, timeliness and scale), map projection,
history and the like. When working in operational mode, the capacity of the
particular software package needs to be taken into consideration, including issues
of data format compatibility. Matching geo-data from different sources requires
means for geo-referencing or geometrical co-registration in general, for ortho-
rectification of aerial photographs and very high resolution satellite imagery, and
for transformation or (re-)projection on-the-fly. Services exist to provide co-
registered data in a high accurate mode, but often the importance of this profound
step is neglected when rapid action is required.
Object-based information extraction
Automated object-based information extraction starts with pre-processing steps
like pan-sharpening and edge-enhancement required for improving image content
in general. In this workflow, classifiable units are provided by segmentation (see
figure 5), but depending on the approach, these units can also be derived by other
techniques (e.g. mathematical morphology analysis). The classification itself is
performed by establishing rule-sets or other classifiers suitable for knowledge-
based classification of multispectral, optical data. Additional GIS layers, like a
DEM or road network can be included in the classification process as a source for
external information. Quantification aggregates and refines the classification
results. Finally, delivery of geo-referenced information is the main objectives of
the analytical chain of information extraction.
Fig. 5
Object libraries
Object libraries may contain all kinds of object categories for the respective
situation including for instance tree species or vegetation types, building types and

9
ground cover, land use and land cover types, dams, etc. Establishing pseudo-
realistic object libraries (see figure 6) is time-consuming, but otherwise supports
the creation of realistic 3D visualisations, virtual flights or walks. The time effort
pays off in cases and in certain areas, where object libraries do already exist.
Changes or modifications in the depicted landscape can be visualised in an
automated and rapid way. The object library, if organised in a database, allows for
combining single objects into artificial, mimicked ecosystems for representing
certain patterns or patch mosaics. As input data true 3D objects, or 2D picture
representations can be used. The latter, since saving time for rendering, are useful
for simulating vegetation types
Fig. 6
Visualisation
The object-based approach for information extraction supports a direct export of
the extracted features as georeferenced GIS layers. Their attributes may contain
information about the assigned class and additional information. Visualisation of
these objects is possible using 3D GIS applications, but also external visualisation
software provided that automatic import of the datasets is supported. A pseudo-
realistic visualisation is realised by linking 3D symbols to the footprints of the
extracted features, respectively. The quality of the visualisation is depending on
the quality of the available object library. The same applies to the extraction
process: assuming a high quality of feature extraction we can derive additional
information form the image data, like size of the objects and orientation. Using
this data, objects can be placed as in reality (see figure 7). It should be noted that
the object library needs to be tailored to the possibilities of the feature extraction.
We can only visualise rapidly, what is extracted from the image data. Existing
libraries implemented as presets in visualisation software are often not specific
enough.
Fig. 7

10
With respect to the time span required to deliver the demanded visualisation
product from the very point when the demand was raised, we can distinguish
between:
Real-time visualisation, which allows for producing geometries and
rendering 3D scenes in (near) real-time; and
Pre-processed visualisation, which supports producing highly detailed 3D
models; the production phase and presentation are time wise separated.
In general, there is no factual difference between the workflow of real-time
visualisation on the one hand and pre-processed visualisation on the other hand.
Though if it comes to rendering there may be significant differences in quality.
The pre-processed approach implies higher quality in terms of level of spatial
detail and the amount of displayable objects. And it allows interaction of the
operator who can highlight specific phenomena and control the conveyed content.
End-user interaction (e.g. free navigation), however, is limited.
3.2 Web-based visualization for information dissemination
As stated above, visualisation of geo-data plays a crucial role in information
dissemination and the online availability of maps and landscape models is
important for planning and decision tasks. In this section, implementations for
online 2D- and 3D-geo-data presentations are described in detail.
Google Earth, meanwhile widely used in both private and public domain, provides
means for fusing imagery, terrain and collateral data for quick access and
distribution to relevant users for enhanced visualisation and analysing geospatial
interrelationships. This supports data exchange and collaboration by security
teams by sharing common perspectives in a fast and efficient, yet familiar way. A
user-friendly interface allows concentrating on the specific task without the usual
restraints of software processing. Still, Google Earth as developed out of the
keyhole software is only a solution, and one that is centrally owned by one
company. So in certain situations access restrictions may apply, which makes it
less suitable for crisis applications. Also the data base of Google is available in
very high resolution the images are of different origin and represent different time
periods. This may lead to confusion as far as data may be outdated without being
marked as “old”. Additionally, it requires a well established internet connection,
which may not always be available in crisis situations. However in the context of
11
the GMOSS project, the mosaic of IKONOS data for the Zimbabwe test case was
published in the Google Earth server of EUSC and the data was accessed by the
partners of the project in a remote location by Internet. In addition, this server also
provides the standard imagery and data that is available with the free version of
Google Earth such as topographic data from SRTM. This EUSC server could be
used again for other test cases of the GMOSS project.
To provide additional views on the applications of visualization some
complementary approaches are discussed in this chapter.
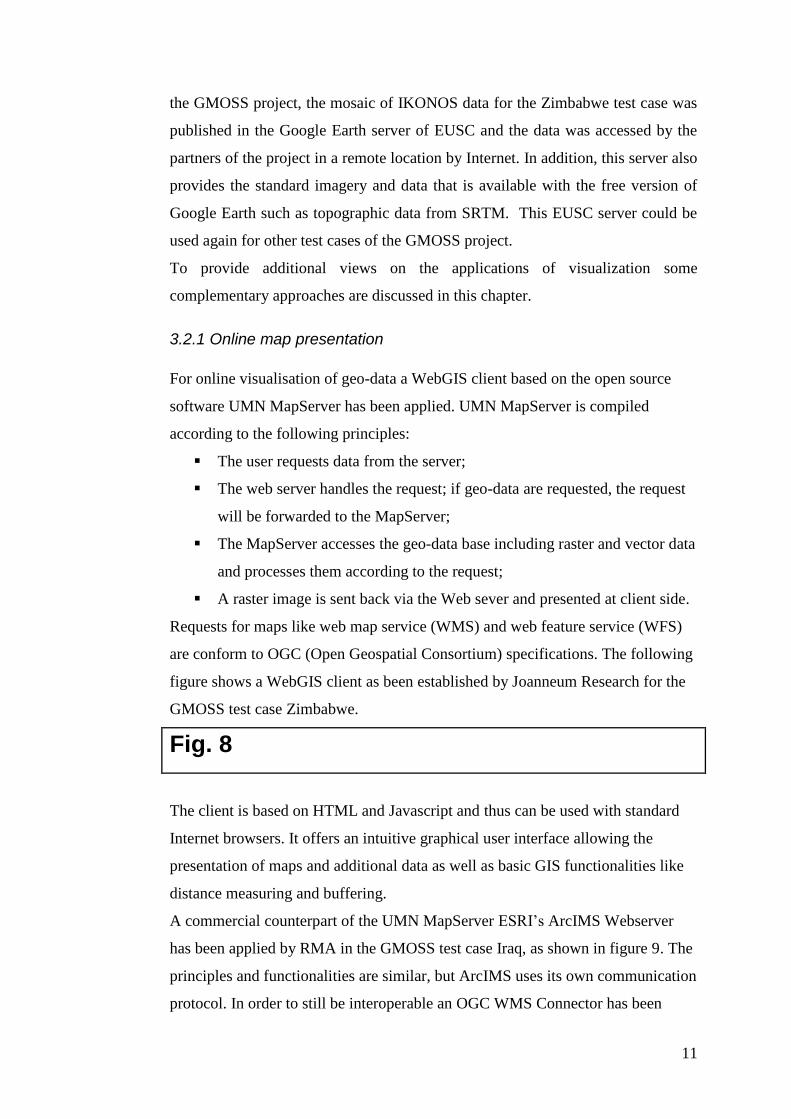
3.2.1 Online map presentation
For online visualisation of geo-data a WebGIS client based on the open source
software UMN MapServer has been applied. UMN MapServer is compiled
according to the following principles:
The user requests data from the server;
The web server handles the request; if geo-data are requested, the request
will be forwarded to the MapServer;
The MapServer accesses the geo-data base including raster and vector data
and processes them according to the request;
A raster image is sent back via the Web sever and presented at client side.
Requests for maps like web map service (WMS) and web feature service (WFS)
are conform to OGC (Open Geospatial Consortium) specifications. The following
figure shows a WebGIS client as been established by Joanneum Research for the
GMOSS test case Zimbabwe.
Fig. 8
The client is based on HTML and Javascript and thus can be used with standard
Internet browsers. It offers an intuitive graphical user interface allowing the
presentation of maps and additional data as well as basic GIS functionalities like
distance measuring and buffering.
A commercial counterpart of the UMN MapServer ESRI’s ArcIMS Webserver
has been applied by RMA in the GMOSS test case Iraq, as shown in figure 9. The
principles and functionalities are similar, but ArcIMS uses its own communication
protocol. In order to still be interoperable an OGC WMS Connector has been

12
made available. In the following figure a HTML ArcIMS Viewer with an image
of the Iraq test area is shown.
Fig. 9
In general the 2D map presentation offers a very fast and geographic oriented
access to up-to-date information, which is very important in the context of crisis
management. Geo-referenced satellite and also aerial images as well as vector
information can be visualised and allow a direct access to crucial information to
support decision processes. The 2D visualisation offers a high quality presentation
of spatial information but can not provide a real spatial impression. For specific
interpretations the visualisation of the 3rd
dimension is essential. The generation of
3D-models allows to realise a real-time 3D-visualisation which will be described
in the next paragraphs.
3.2.2 Real-time 3D-visualisation
For the 3D-presentation of geo-data a client using Macromedia Shockwave 3D
has been implemented. Macromedia Director as the development environment for
Shockwave enables an easy programming of the user interface and offers DirectX
and OpenGL support. Combining digital elevation models and textures generated
from high resolution remote sensing data, 3D-models are created and can be
viewed in real-time. In comparison to the 2D visualisation a satisfying real-time
3D-visualisation requires more processing power which is provided by specific
graphic cards. The following figure shows the 3D-viewer with a model of the
above mentioned refugee camp Goz Amer.
Additional to the 3D-landscape model also 3D-objects for the visualisation of
infrastructure are included. In this example different models for tents are used and
placed into the model based on image classification results. The 3D-model can be
navigated very easily using functions for panning, zooming, camera tilting and
rotating (see figure 10).
Fig. 10

13
The integration of an overview map and a compass enables user friendly and easy
orientation. Additional information to the presented objects is made available via
tooltips and hyperlinks.
3.3 Overview of 3D tools
This chapter provides a summarizing characterisation of 3D visualisation tools as
being tested and used within the GMOSS network. Whereas many other
categorizations could have been applied (e.g. commercial vs. non-commercial) we
differentiate between (1) 2D/3D visualization tools emerging from GIS
technology including globe viewers, and (2) virtual landscapes visualization tools
originating from computer graphics. Distinction of both groups is not sharp; there
is a transition in terms of spatial reference and spatial analysis. Thus, the latter
group is ordered in such a way, that tools offering widest GIS interoperability are
listed first. The “+” symbol indicates strengths; the “–“symbol indicates
weaknesses of the respective tool. (As being judged from a disaster management
operational view).
3.3.1 2D/3D visualization tools emerged from GIS technology including
globe viewers
ArcReader (2D Viewer and 3D Globe Viewer)
+ Freely available
+ 3D visualization possibility
+ Integration of projects from ArcGlobe
including: 3D globe view, animation files,
spatial bookmarking
+ Possibility to equip data with added value,
e.g. meaningful legend, spatial bookmarks,
notations
- External data integration is limited
- Limited baseline data available

14
ArcGlobe (ESRI 3D Analyst Extension)
+ Commercial product
+ Ability to handle large datasets (pyramid
files, intelligent data caching)
+ Support projection „on the fly“ for
automatically integrate data sets with
different projections
+ GIS Analysis capabilities e.g. watershed
calculation, surface analysis, area /length
calculations
+ Various data integration possibilities such as
vector data (2D / 3D, e.g. KML, shapefiles,
3D objects); raster data (2D / 2.5D, satellite
data / scanned maps); various formats (ESRI
grids for analysis purpose, tabular data,DEMs
in different resolutions)
+ Animation/video capabilities
- Not a web tool
- Limited baseline data available
ArcScene (ESRI 3D Analyst Extension)
+ Commercial product
+ 3D perspective tool, but no globe view
+ Support projection „on the fly“ for
automatically integrate data sets with
different projections
+ Full GIS Analysis capabilities
+ Various data integration possibilities such as
vector data (2D / 3D) e.g. kml/kmz, shapfiles,
3D objects; raster data (2D / 2.5D, satellite
data / scanned maps) ; various formats; ESRI
grids; tabular data; DEMs in different
resolutions
+ Animation/Video capabilities
- Not a web tool
- Limited baseline data available

15
ArcGIS Explorer (ESRI Globe Viewer)
+ Freely available
+ GIS Analysis capabilities to be supported
through ArcGIS Server connection
+ Support projection „on the fly“ for
automatically integrating data sets with
different projections
+ Integration of WMS and ArcIMS Services
+ Various data integration possibilities such as
vector data (2D / 3D) e.g. kml/kmz, shapfiles,
3D objects; raster data (2D / 2.5D, satellite
data / scanned maps); various formats: ESRI
grids; tabular data; DEMs
+ Web integration
+ Different base data sets available, user can
choose between “subjects”, e.g. satellite data,
thematic maps, historic maps etc.
- limited VHSR baseline data outside of the
USA
Google Earth (version 4)
+ Freely available (basic version)
+ Data integration possibilities
+ vector data (2D / 3D) e.g. kml/kmz, 3D
models via Google Sketchup (free CAD
sketch software)
+ WMS incorporation via kml
+ Georeferenced raster data limited in free
version
+ Animations via time stamps
+ A lot of recent baseline data sets available,
especially very high spatial resolution
imagery
- No projection “on the fly” supported
- No GIS analysis capabilities

16
3.3.2 3D visualization tools originating from computer graphics
Leica Virtual Explorer
+ Commercial product
+ Real-time 3D visualization tool with GIS
functionality
+ fast handling of very large datasets (pyramid
files, intelligent data caching)
+ Concurrent use/edit of scenes by distributed
groups (requires advanced client, additional
costs)
+ „on the fly“- projection
+ GIS Analysis capabilities e.g. watershed
calculation, surface analysis, area /length
calculations
+ Various data integration possibilities: vector
data (2D / 3D) e.g. shapefiles, 3D objects;
raster data (2D / 2.5D, satellite data / scanned
maps) ; various formats; Integration of DEMs
in different resolutions
+ Animation/Video capabilities
+ Free Web Client available (Active-X, limited
to MS Internet Explorer)
+ Support for VirtualGIS Projects and Flight
Paths
+ Multi-resolution morphing.
- Limited baseline data available
3D Studio Max
+ Commercial product
+ 3D Visualization software for advertising,
game design and film industry
+ photorealistic high-quality renderings
+ highly adaptable via Scripts and Plug-ins
+ Export of real-time formats via plug-ins
(additional costs)
+ distributed rendering
- No direct geo-data support (projections, GIS,
DEM)
- Focus on pre-rendered animations
- Large data support only with plug-ins
- very complex
- Integration of geo-data cumbersome
- Not a web tool

17
Shockwave 3D (with Macromedia Director)
+ Shockwave 3D is a 3D Engine free of license
costs
+ Macromedia Director is used as powerful
authoring system
+ Production of 3D animations for on- and
offline applications
+ Integration of different 3D content using the
3D Xtra (from Intel)
+ Script language Lingo for development
+ Integration of 3D content from 3ds Max,
Cinema 4D, Maya or Lightwave 3D using
theW3D-format
- No direct geo-data support (projections, GIS,
DEM)
- Limited LOD functionalities
Visual Nature Studio 2
+ Commercial product
+ 3D terrain visualization software with strong
capabilities in ecosystem depiction and pre-
rendered photorealistic animations
+ Specialized on pre-rendered animations
+ Export of various real-time formats possible
+ Provides proprietary real-time format and
free real-time viewer
+ Wide range of level of detail: from close-up
views on single plants to global views
+ „on the fly“ projection support
+ Support of large datasets (e.g. pyramid
layering, tiling, wavelet compression
support)
+ Broad range of data integration possibilities
including GIS data (2D / 3D); 3D Objects
(3Ds, DXF); broad range of image data
(various bit depths and formats); broad
range of DEM formats
+ Seamless integration into professional
visualization (e.g. 3D Studio Max)
+ Distributed rendering
- No GIS Analysis capabilities
- Focus on pre-rendered animations, therefore
real-time performance still limited
- Focus on high-quality visualization
- No WMS/WFS support
- Long render times
- Limited batch integration functionalities
- No web distribution functionality

18
4. Conclusions
The argumentation followed in this article leads to the conclusion that
visualisation within the context of crises management or, in other words, for
Global Monitoring of Security and Stability is not an end in itself. It is and is going to
be demand driven and thus it strongly builds upon GIS as a central, integrative
tool. From a technical point of view, high performance and speed is decisive for
the usability of visualization technologies in crises situations. Similarly the
availability of very high resolution satellite imagery along with digital elevation
models and other geo-data is a crucial prerequisite for establishing a fundamental
information basis. By means of information extraction and quantification of
classification results imaged information will be transformed and we arrive at an
aggregated information level relevant for decision support. Considering usability
one needs to be aware that any subsequent automated analysis builds upon the
quality of the data pre-processing and the accuracy of the classification. Effort
needs to be put into an optimization strategy of the entire workflow.
Transferability and repeatability on the other hand are fostered by establishing
rule bases which hold the knowledge base for a range of similar situations. The
described approach is considered a common interface between processing and 3D
visualisation of geo-information. Finally, in any kind of operations related to
crisis management, it is of great importance to share a common understanding and
to have an overview of the complete situation in order to make correct decisions
and to secure a good common progress. It is important to see the relations
between all those entities and to understand what is actually happening. This will
then contribute to improved situation awareness.
The visualisation process, as we saw, can be automated meaning that appealing
results can be generated on demand almost without human interaction. It is
important to emphasize that once the basic elements for the visualisation have
been prepared, any reported change can be considered and depicted. By this,
disaster management is given a valuable tool for assessing and characterising the
current situation.
19
References:
Almer A., Schnabel T., Schardt M., Stelzl H., 2004: Real-Time Visualization of Geo-Information
Focusing on Tourism Applications. International Workshop on "Processing and Visualization
using High-Resolution Images". ISPRS WG V/6 - Visualization and Animation. 18-20
November 2004, Pitsanulok, Thailand.
Appleton, K., Lovett, A., 2003, GIS-based visualisation of rural landscapes: defining ‘sufficient’
realism for environmental decision-making. Landscape and Urban Planning 65, 117-131.
Blaschke, T., R. Meisner, A. Almer, H. Stelzl, N. Sparwasser, D. Tiede & S. Lang, 2006:
Kartographie „on demand“: Generierung virtueller Landschaften aus Fernerkundungs- und
GIS-Daten. In: Deutsche Gesellschaft für Kartographie (ed.): Kartographische Schriften, Bd
10: Aktuelle Entwicklungen in Geoinformation und Visualisierung, pp 27-36
Brännström, M., Lennartsson, R.K., Lauberts, A., Habberstad, H., Jungert, E. and Holmberg, M.,
2004: Distributed Data Fusion in a Ground Sensor Network, Proceedings of The 7th
International Conference on Information Fusion, Stockholm, Sweden, June 28 – July 1, 2004.
Lang, S., D., Tiede and F., Hofer 2006: Modeling ephemeral settlements using VHSR image data
and 3D visualisation – the example of Goz Amer refugee camp in Chad. In: PFG -
Photogrammetrie, Fernerkundung, Geoinformatik, Special Issue: Urban Remote Sensing,
4/2006, 327-337.
Sheppard, S.R., 2000. Visualisation software: bringing GIS applications to life. GEOEurope 2000,
28–30.
Sheppard, S.R., 2001. Guidance for crystal ball gazers: developing a code of ethics for landscape
visualisation. Landscape and Urban Planning 54, 183–199.
Silvervarg, K., Jungert, E., A scenario driven decision support system, 12th
Conference on
Distributed Multi-media Systems (DMS’05), Grand Canyon City, Arizona, August 30-
September 1, 2006.
Tiede, D. and Blaschke, T., 2005: Bringing CAD and GIS together: A workflow for integrating
CAD, 3D visualization and spatial analysis in a GIS environment. In: Buhmann, E., Paar, P.,
Bishop, I, Lange, E. (eds.): Trends in Real-time Visualization and Partizipation. Wichmann-
Verlag, Heidelberg, 77-87.
Tress, B., Tress, G., 2003. Scenario visualisation for participatory landscape planning. A study
from Denmark. Landscape and Urban Planning 64, 161–178.
Tyskeng, M. 2003. MOSART - Instructions for use, FOI-R--1098-SE, dec 2003.
Ulander, L. M. H., Flood, B., Follo, P., Frölind, P., Gustavsson, A., Jonsson, t., Larsson, B.,
Lundberg M., Stenström, CARABAS-II Campaign Vidsel 2002 - Flight Report, FOI, FOI-R-
1002-SE, 2003.
Acknowledgements
The work reported on in this article has been conducted in the framework of the
EU Network of Excellence GMOSS (http://gmoss.jrc.it/index.asp). We highly
appreciate fruitful discussions and knowledge transfer among participating
partners.
Figure 1: Conflicting goals for visualisation. At present, a high level of automation and a high
level of detail are still negatively correlated.
Figure 2: Objects (here: cars) hidden under canopy in a forest seen by CARABAS.
Figure 3: Principle of an unattended ground sensor network.
Figure 4: An illustration of a mapped common operational picture (see text for further
explanations)

20
Figure 5: Object-based information extraction. The process includes processing, classifying and
quantifying imaged data.
Figure 6: 3D objects of an object library (tents and huts of a refugee camp).
Figure 7: 3D objects visualisation of a refugee camp (Goz Amer, Chad) applying a workflow for
information extraction and visualisation using 3D objects.
Figure 8: WebGIS client for the test case Zimbabwe showing the city of Harare (background:
Quickbird image, pan-sharpened image with 0.6 meter ground resolution)
Figure 9: ArcIMS Viewer showing QuickBird imagery from Bagdad, Iraq.
Figure 10: Real-time 3D-presentation of Goz Amer based on a Quickbird satellite image
Related Documents