i

Welcome message from author
This document is posted to help you gain knowledge. Please leave a comment to let me know what you think about it! Share it to your friends and learn new things together.
Transcript

i
iv
Remote Sensing Applications
Chapter # Title/Authors Page No.
1 Agriculture 1Sesha Sai MVR, Ramana KV & Hebbar R
2 Land use and Land cover Analysis 21Sudhakar S & Kameshwara Rao SVC
3 Forest and Vegetation 49Murthy MSR & Jha CS
4 Soils and Land Degradation 81Ravishankar T & Sreenivas K
5 Urban and Regional Planning 109Venugopala Rao K, Ramesh B, Bhavani SVL & Kamini J
6 Water Resources Management 133Rao VV & Raju PV
7 Geosciences 165Vinod Kumar K & Arindam Guha
8 Groundwater 203Subramanian SK & Seshadri K
9 Oceans 217 Ali MM, Rao KH , Rao MV & Sridhar PN
10 Atmosphere 251Badrinath KVS
11 Cyclones 273 Ali MM
12 Flood Disaster Management 283Bhanumurthy V , Manjusree P & Srinivasa Rao G
13 Agricultural Drought Monitoring and Assessment 303Murthy CS & Sesha Sai MVR
14 Landslides 331Vinod Kumar K & Tapas RM
15 Earthquake and Active Faults 339Vinod Kumar K
16 Forest Fire Monitoring 351Biswadip Gharai, Badrinath KVS & Murthy MSR
351
Forest Fire Monitoring
16.1. Introduction
Vegetation fires have been acknowledged as an environmental process of global scale, which affects the chemicalcomposition of the troposphere, and has profound ecological and climatic impacts. However, considerableuncertainty remains, especially concerning intra and inter-annual variability of fire incidence.
Within the total global vegetation, forests constitute a large part of earth’s renewable natural resources, whichplays a pivotal role in maintaining a near ideal environmental condition for life sustenance, besides serving asan important source of food, fuel wood, fodder, timber etc. Global Forest Resources Assessment 2000 (FRA2000) concluded that the world’s forest cover as of 2000 was about 3.9 billion hectares, or about 0.6 ha percapita. The regional distribution of global forests showed that Europe (including the Russian Federation) has 27percent of the forests; South America, 23 percent; Africa, 17 percent; North and Central America, 14 percent;Asia, 14 percent; and Oceania, 5 percent.
FRA 2000 also conducted a remote sensing survey of tropical forests to assess forest change. This surveyused sampling techniques with satellite imagery. The results indicated that the world’s tropical forests were lostat a rate of about 8.6 million ha annually in the 1990s, compared to a rate of around 9.2 million ha per yearduring the previous decade. During the same period, the annual rate of loss of closed forests decreased from8.0 million ha in the 1980’s to 7.1 million ha in the 1990s. While the reduction in deforestation rates between thetwo decades was likely not significant in itself, the change estimate for the 1990s coincided well with the countryspecific findings.
Forest ecosystems are subjected to a variety of environmental threats of which fire is a potentially serioushazard. Fire depending on where, when and why it occurs, can be either an essential factor or otherwise, in theecological cycle of the forested landscape and the survival of associated plants and animals it is merely adestructive unnatural threat. In tropical deciduous forests, fire is a natural phenomenon due to higher levels ofwater stress during summer. Traditional land use practices and changes in the weather pattern have affectedthe incidence of fires. Fire being a good servant and a poor master, has been responsible for causing immensedamage to both forest fauna and flora, including the soil inhabitants. Forest fires can have large impacts onboth, ecosystems and economy.
The ecological role of fire is to influence several factors such as plant community development, soil nutrientavailability and biological diversity. Forest and wild land fire are considered vital natural processes initiatingnatural exercises of vegetation succession. However, uncontrolled and misuse of fire can cause tremendousadverse impacts on the environment and the human society.
Continued high annual rate of loss of tropical forest cover and outbreak of major wildfires over the past decade,in contrast to increased plantation development, successes in sustainable forest management and increases inprotected areas show a complex picture of the past and possible future of the world’s forests and mankind’sinteraction with them.
During the last decade, increased availability of time series of satellite data has contributed to improve ourunderstanding of fire as a global environmental process. Dwyer et al. (2000a, b), used one year of the AdvancedVery High Resolution Radiometer (AVHRR) fire data to characterise global patterns of fire seasonality and theirrelationships with climate. More recently, a new generation of satellites sensors brought further advances throughenhanced fire monitoring capabilities, resulting in the production of various burned area andfire hotspots datasets at regional or global scales (Arino et al., 2005; Giglio et al., 2003; Giglio et al., 2006;Carmona-Moreno et al., 2005; Ria˜no et al., 2007).
In spite of these studies, considerable uncertainties remain, especially regarding the spatial and temporal variabilityof global vegetation burning and its relationship with climate dynamics. The Global Climate Observing System(GCOS, 2006) considered fire disturbance an “Essential Climate Variable” and highlighted the need for long datatime series to quantify the links between climate and fire (Le Page, 2007).
16.1.1. Causes of fire
Intentional : Forest fires are mostly anthropogenic in nature and caused intentionally. These may occur due to thefollowing reasons (Negi, 1986).

352
• Forest floor is often burnt by villagers to get a good growth of grass in the following season or for a goodgrowth of mushrooms
• Wild grass or undergrowth is burnt to search for animals
• Firing by miscreants
• Attempt to destroy stumps of illicit fallings
Unintentional :These fires are caused due to man’s carelessness i.e., without intention to set fire. Such firesmay be due to the following reasons:
• Un-extinguished campfires of trekkers, laborers, camp of roadside charcoal panniers etc.
• Spark of fire from railway engines
• Careless throwing of fire after honey collection
• Un-extinguished bidis, cigarette butts, matchsticks etc., by grazers, travelers, picnickers or even forestlaborers
• Burning of agricultural fields adjacent to forested areas. Such fires is left unattended may spread to forestareas
• Careless handling of acid by resin tapers
• During controlled burning by the department, firemay spread to the forest due to negligence of thestaff
Natural: Natural causes of fires include:
• Fires caused by lighting
• Fires caused by rolling stones
• Fires may be caused by volcanic eruptions
In our country there was no report forest fire due to naturalcause.
16.1.2. Classification of forest fire
According to a classification of forest fires by type andcauses, three major types of forest fires are prevalent (PS Roy, 2003);
Ground fires: Ground fires occur in the humus and peatylayers beneath the litter of undecomposed portion offorest floor with intense heat but practically no flame.Such fires are relatively rare and have been recorded
occasionally at high altitudes in Himalayan fir and spruceforests (Figure 16.1)
Surface fires: Surface fires occurring on or near theground in the litter, ground cover, scrub and regeneration,are the most common type in all fire-prone forests of thecountry (Figure 16. 2)
Figure 16.1: Ground fire
Figure 16.2: Surface Fire
Figure 16.3: Crown Fire

353
Crown fires: Crown fires, occurring in the crowns of trees, consuming foliage and usually killing the trees, are metmost frequently in low level coniferous forests in the Siwaliks and Himalayas (NCA Report, 1976) as shown infigure 16.3.
16.1.3. Global and National Issues, Scenario and Developments
Forest fire is a major cause of degradation of India’s forests. While statistical data on fire loss are weak, it isestimated that the proportion of forest areas prone to forest fires annually ranges from 33% in some states toover 90% in others. About 90% of the forest fires in India are started by humans (Roy, 2003). Forest fires causewide ranging adverse ecological, economic and social impacts. In a nutshell, fires cause: indirect effect onagricultural production; and loss of livelihood for the tribals as approximately 65 million people are classified astribals who directly depend upon collection of non-timber forest products from the forest areas for their livelihood.
A combination of edaphic, climatic and human activities account for the majority of wild land fires. High terrainsteepness along with high summer temperature supplemented with high wind velocity and the availability ofhigh flammable material in the forest floor accounts for the major damage and wide wild spread of the forestfire. The vast majority of wild fires are intentional for timber harvesting, land conversion, slash – and- burnagriculture, and socio-economic conflicts over question of property and landuse rights. In recent years extendeddroughts (prolonged dry weather), together with rapidly expanding exploitation of tropical forest and the demandfor conversion of forest to other land uses, have resulted in significant increase in wild fire size, frequency andrelated environmental impacts.
Past wild fires have an immense impact in Indonesia, Brazil, Mexico, Canada, USA, France, Turkey, Greece,India and Italy. Large-scale fires and fire hazards were also reported in eastern parts of the Russian Federationand in China northeastern Mongolia autonomous region. There has been a continuous increase of applicationof fire in landuse system in forest of South East Asian region. This has resulted in severe environmental problemsand impacts on society. Wild fires often escape from landuse fire and take unprecedented shape causingproblems of transboundary pollution. Author (Roy, 2003) analyzes the forest and wild land fires issues withparticular reference to South East Asia and emphasizes on development of national and regional fire managementplans considering the complexity and diversity of fire.
Impact of the Forest Fire on the Global Environment: Forest fires controlled or uncontrolled have profoundimpacts on the physical environment including land cover, land use, biodiversity, climate change and forestecosystem. They also have enormous implication on human health and on the socio-economic system ofaffected countries. Economic cost is hard to quantify but an estimate by the economy and environment can beprovided. The fire incidence problem for South East Asia put the cost of damages stemming from the SoutheastAsian fires (all causes) at more than $4 billion. Health impacts are often serious. As per one estimate 20 millionpeople are in danger of respiratory problems from fire in Southeast Asia. Most pronounced consequence offorest fires causes their potential effects on climate change. Only in the past decade researchers have realizedthe important contribution of biomass burning to the global budgets of many radiatively and chemically activegases such as carbon dioxide, carbon monoxide, methane, nitric oxide, tropospheric ozone, methyl chlorideand elemental carbon particulate. Biomass burning is recognized as a significant global source of emissioncontributing as much as 40% of gross Carbon dioxide and 30% of tropospheric ozone.
There is a strong need for a comprehensive international set of comparable data on forest fires and otherwildland fires, as a tool for policy makers, and for operational planning (for both prevention and suppression),as an essential part of improving understanding of climate change and the factors influencing it, and as a partof an effort to monitor the state of the world’s forests.
In recent years the scientific community has shown renewed interest in forest (vegetation) fires, notably becauseof their significant role in climate change, and new methods of collecting information using remote sensingtechniques are being developed. Furthermore, the research community needs global geo-referenced data(although not necessarily at a very fine degree of resolution).
To collect the Fire Statistics in the Countries of the United Nations Economic Commission for Europe (UNECE)has the following commitment.
The Resolution S3 of the Ministerial Conference at Strasbourg committed the signatories (including the EU) tocreating a decentralised data base on forest fires. Since then a data base, with fire-by-fire information, hasbeen built up, in those countries/regions of the European Union with a particularly severe forest fire problem. In
354
this system, for each fire, information is collected on first alert and extinction times, location, area, cause, etc.,according to a “common core” of parameters. 19 countries of the 27 signatories of Resolution S3 expressedtheir willingness to adhere to a data base network based on the common core system adopted by EU members,considering it a good, feasible starting point of collecting data on a common base at the pan-European level.
FAO Silva Mediterranea, like the Working Party a subsidiary body of the European Forestry Commission (EFC),covers a region where forest fires are one the most serious dangers to sustainable forest management, andhas also stated its interest in moving towards a fire-by-fire information system, based on the EU system.
At the global level, FAO has collected data on forest fires, using the FAO/ECE conceptual framework anddefinitions, as part of its monitoring of the state of the world’s forests within the context of the Global ForestResource Assessment.
International Forest Fire News (IFFN), prepared by JG Goldammer, leader of the ECE/FAO. Team of Specialists onForest Fires, contains both technical and statistical information on forest fires world wide. Goldammer is also developing a Global Vegetation Fire Inventory (GVFI), collecting information by a network ofcorrespondents. GVFI is an activity of the International Global Atmospheric Chemistry (IGAC) project, a coreproject of the International Geosphere-Biosphere Programme (IGBP).
16.2. Review of Literatures
During last two decade especially in last decade, much work has been carried in the field of forest fire detection,assessment, risk management and other related study considering the global acknowledgment of environmentaldegradation and direct consequences in climatic change.
16.2.1. Fire Detection
Traditionally, forest fires have been detected using fire lookout towers located at high points in a forested area.A fire lookout tower houses a person whose duty is to look for fires using binocular or other sophisticatedequipment such as Osborne fire finder (Fleming and Robertson, 2003). Osborne fire finder is comprised of atopographic map printed on a disk with graduated rim. A pointer aimed at the fire determines the location andthe direction of the fire. Once the fire location is determined, the fire lookout alerts fire-fighting crew. Fire lookouttowers are still in use around the world with simple binocular or other related sophisticated equipment
Unreliability of human observations in addition to the difficult life conditions for fire lookout personnel have ledto the development of automatic video surveillance systems (Fire Watch Web Page ; Breejen et al., 1998; Khrt etal., 2001). Most systems use Charge-Coupled Device (CCD) cameras and Infrared (IR) detectors installed on topof towers. CCD cameras use image sensors, which contain an array of light sensitive capacitors or photodiodes.In case of fire or smoke activity, the system alerts local fire departments, residents, and industries. Currentautomatic video surveillance systems used in Germany, Canada, and Russia are capable of scanning a circularrange of 10 km in less than 8 minutes. (Fire Watch Web Page ). The accuracy of these systems is largely affectedby weather conditions such as clouds, light reflection, and smoke from industrial activities. Automatic videosurveillance systems cannot be applied to large forest fields easily and cost effectively, thus for large forest areaseither aeroplanes or Unmanned Aerial Vehicles (UAV) are used to monitor forests. Aeroplanes fly over forests andthe pilot alerts the base station in case of fire or smoke activity. UAVs, on the other hand, carry both video andinfrared cameras and transmit the collected data to a base station on the ground that could be up to 50 km away.UAVs can stay atop for several hours and are commanded by programming or joystick controls (Aerovision WebPage) .
More advanced forest fire detection systems are based on satellite imagery. Advanced Very High ResolutionRadiometer (AVHRR), Moderate Resolution Imaging Spectroradiometer (MODIS), Indian Remote SensingSatellite-Advanced Wide Field Sensor (IRS AWiFS) are being used for active forest fire detection. Currentsatellite-based forest fire detection systems use data from these instruments for forest fire surveillance. Theaccuracy and reliability of satellite-based systems are also (unlike ground surveillance) largely impacted byweather conditions. Clouds and rain absorb parts of the frequency spectrum and reduce spectral resolution ofsatellite imagery, which consequently affects the detection accuracy. Although satellite-based systems canmonitor a large area, relatively low resolution of satellite imagery means a fire can be detected only after it hasgrown large. More importantly, the long scan period—which can be as long as 2 days—indicates that suchsystems cannot provide timely detection.
355
There are many existing techniques used for detection of forest fires. One of the most important is described byBoyd M, Harden et al., (1973). Their paper outlines a model, which can be readily adapted for analysis of anyforest, and has actually been used to examine various fire detection strategies for the Footner Forest in NorthernAlberta. Some research is based on image processing techniques, capturing camera segments and processingand classifying these images for fire detection. Using image processing methods, Roy and UNEP have used asatellite for capturing images from forests and, have detected whether there is a fire possibility or not. Anothersatellite application in forest fires detection is by Lafarge et al., (2007). They present a fully automated method offorest fire detection from TIR satellite images based on the random field theory where preprocessing is used tomodel the image as a realization of a Gaussian field. This study shows some interesting properties because thefire areas considered to be in the minority are considered as anomalies of that field. Nakau et al., (2006) developeda fire detection information system from receiving AVHRR satellite to output fire detection map and validated theearly detection algorithm using AVHRR satellite imagery.
Another study is computer vision based forest fire detection and monitoring system where fixed cameras are used(Toreyin et al., 2007). Furthermore, there is a great many forest fire detection studies and systems available(Fujiwara et al., 2002, Casanova et al., 2004, Ertena et al., 2002 and Filizzola et al., 2007). Ollero et al., 1998.have studied a scheme using multi-sensorial integrated systems for early detection of forest fires. Severalinformation and data sources in Olleros’s study were used, including infrared images, visual images, data fromsensors, maps and models, Casanova et al., 2004. present the MSGSEVIRI sensor’s ability to detect forest firesand subsequent fire monitoring. There are a number of similar studies on fire detection using sensors.
Justice et al., 2002 and Giglio et al., 2003 developed a multi-year daily active fire product from the ModerateResolution Imaging Spectroradiometer (MODIS). This product has a good detection rate, due to its 4 dailyoverpasses. This method is the most popular all over the world but is only available since 15 November 2000.Hence, for global fire mapping is being done since year 2000 only.
The authors (Doolin and Sitar 2005), in their study shown the feasibility of wireless sensor networks for forestfire monitoring. Experimental results are reported from two controlled fires in San Francisco, California. Thesystem is composed of 10 GPS-enabled MICA motes (Crossbow Inc. Web Page) collecting temperature, humidity,and barometric pressure data. The data is communicated to a base station which records it in a database andprovides services for different applications. The experiments show that most of the motes in the burned areawere capable of reporting the passage of the flame before being burned. In contrast to this system whichreports raw weather data, Mohamed H et al., 2007 design processes weather conditions based on the FireWeather Index System (Canadian Forest Fire Danger Rating System (CFFDRS) Web Page) and reports moreuseful, summarized, fire indexes. His study addresses the Fire Weather Index (FWI) System, which notes thatdifferent components can be used in designing efficient fire detection systems FWI. He has presented thedesign of a wireless sensor network for early detection of forest fires. Their design is based on the Fire WeatherIndex (FWI) System, which is backed by decades of forestry research. The FWI System is comprised of sixcomponents: three fuel codes and three fire indexes. The three fuel codes represent the moisture content of theorganic soil layers of forest floor, whereas the three fire indexes describe the behavior of fire. By analyzing datacollected from forestry research, they showed how the FWI System can be used to meet the two goals of awireless sensor network designed for forest fires: (i) provide early warning of a potential forest fire, and (ii)estimate the scale and intensity of the fire if it materializes. To achieve these goals, they have designed theirsensor network based on two main components of the FWI System: the Fine Fuel Moisture Code (FFMC), andthe Fire Weather Index (FWI). The FFMC code is used to achieve the first goal and the FWI index is used toachieve the second.
Using animals for disaster detection is not a new idea but it has been limited to a few of disaster types such asearthquake. Yeung, 2007 describes an example of observing animals’ behavior for early earthquake alert, butthe author gives no guaranty that his study works correctly for every earthquake. Kahn, 2007 suggested an ideathat the best and the cheapest biosensors are already distributed globally but generally ignored: They’re calledanimals. Kahn’s idea leads the scientists to start new investigations to be made on animals. Lee et al., 2007, intheir study, they offered a Bio-adhoc sensors network for early forest fire warning system for mountain areas,and they used animals as wireless adhoc nodes.
However, the proposal presented by Yasar, 2007, is based on the usage of many access points explicitlyconstructed in the forests instead of an adhoc network structure. Although it may not seem to be feasible toinstall sufficient number of access points to cover whole forests, some critical points which are highly under the
356
risk of fire, can be selected for the access point locations. Moreover, the usage of the access points would removethe risk of interruption of communication (network failure) that usually occurs in adhoc networks, if animals areused as wireless nodes. Furthermore, Lee et al., in their study focused on the usage of animals’ behavior only fordetection of fire possibilities. This paper, however, focuses on using both animal behavior classification and thermaldetection methods. In this paper (Yasar, 2007), a proposal for a fire detection system combining methods fromboth animal tracking and current fire detection systems is presented. The system proposed does not claim todetect every possible fire, and can readily be used to augment others.
The main idea presented in this paper is to utilize animals with sensors as Mobile Biological Sensors (MBS). Thedevices used in this system are animals which are native animals living in forests, sensors (thermo and radiationsensors with GPS features) that measure the temperature and transmit the location of the MBS, access points forwireless communication and a central computer system which classifies of animal actions. The system offers twodifferent methods, firstly: access points continuously receive data about animals’ location using GPS at certaintime intervals and the gathered data is then classified and checked to see if there is a sudden movement (panic)of the animal groups: this method is called animal behavior classification (ABC). The second method can bedefined as thermal detection (TD): the access points get the temperature values from the MBS devices and sendthe data to a central computer to check for instant changes in the temperatures. The proposed system, additionally,has a classifier which built-in measures to use animal action (panic) to signal a fire alarm in situations wherethermal sensors usage is inappropriate. Furthermore, this system may assist in preventing poaching, monitoringanimals’ death, and understanding animals’ group behavior.
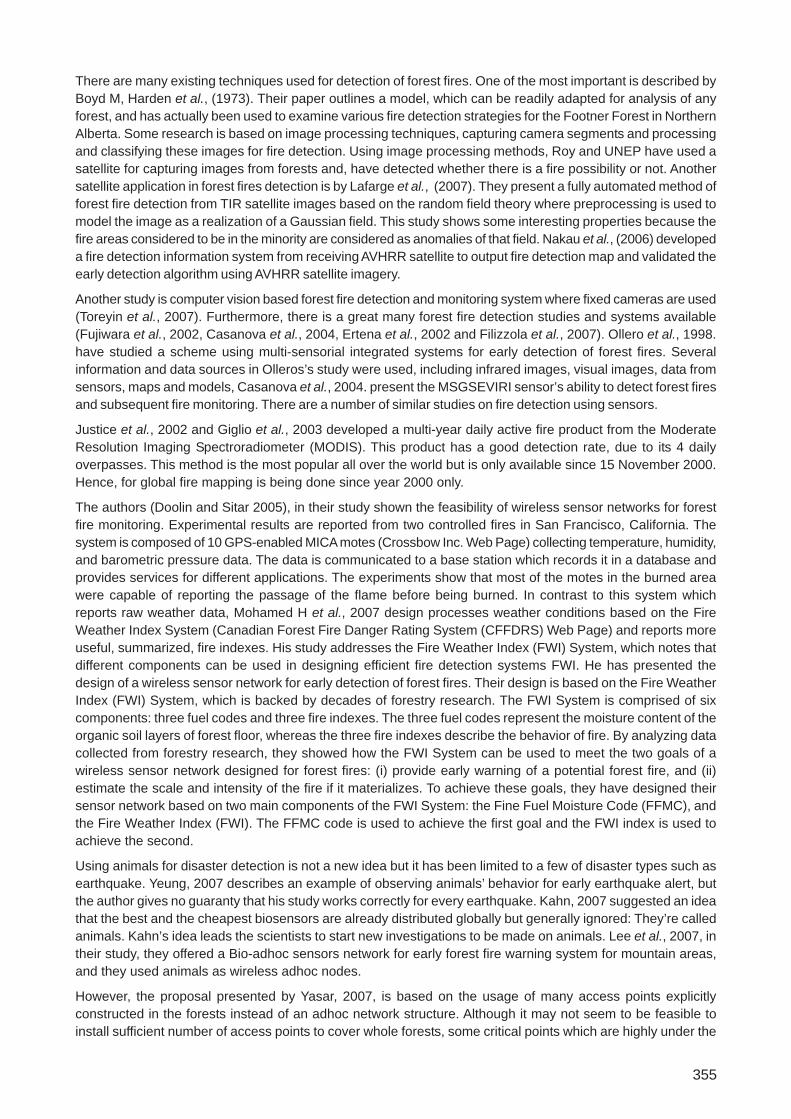
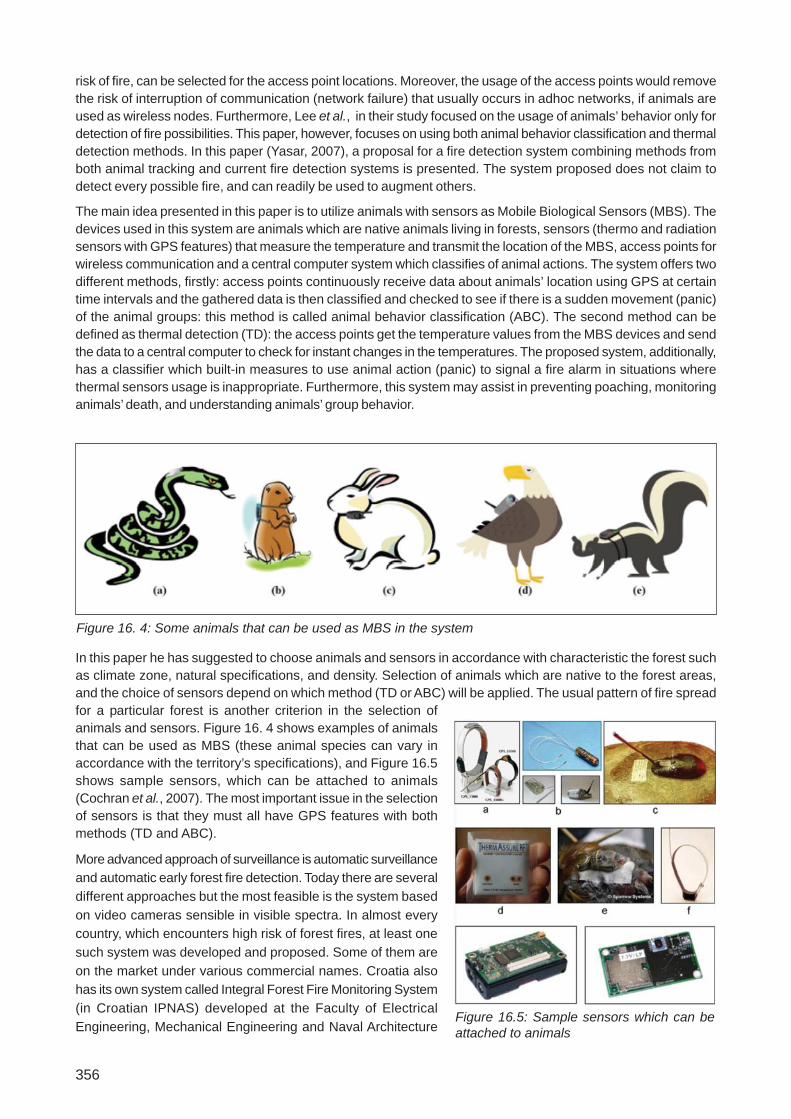
In this paper he has suggested to choose animals and sensors in accordance with characteristic the forest suchas climate zone, natural specifications, and density. Selection of animals which are native to the forest areas,and the choice of sensors depend on which method (TD or ABC) will be applied. The usual pattern of fire spreadfor a particular forest is another criterion in the selection ofanimals and sensors. Figure 16. 4 shows examples of animalsthat can be used as MBS (these animal species can vary inaccordance with the territory’s specifications), and Figure 16.5shows sample sensors, which can be attached to animals(Cochran et al., 2007). The most important issue in the selectionof sensors is that they must all have GPS features with bothmethods (TD and ABC).
More advanced approach of surveillance is automatic surveillanceand automatic early forest fire detection. Today there are severaldifferent approaches but the most feasible is the system basedon video cameras sensible in visible spectra. In almost everycountry, which encounters high risk of forest fires, at least onesuch system was developed and proposed. Some of them areon the market under various commercial names. Croatia alsohas its own system called Integral Forest Fire Monitoring System(in Croatian IPNAS) developed at the Faculty of ElectricalEngineering, Mechanical Engineering and Naval Architecture
Figure 16. 4: Some animals that can be used as MBS in the system
Figure 16.5: Sample sensors which can beattached to animals

357
University of Split. The system wasexperimentally tested during 2005 and2006 fire seasons on three locationsbut it is also in everyday use in NationalPark Paklenica from June 2006.
IPNAS structure is shown in Figure16.6. The system is based on field unitsand a central processing unit. The fieldunit is conceived of pan/tilt/zoomcontrolled video cameras and a minimeteorological station connected byWireless LAN to a central processingunit where all analysis, calculation,presentation, image and data archivingis done. The system is Web basedbecause the user interface is displayedin a standard Web browser, and theuser can reach any system modulethrough tunnelled SSL (Secure SocketLayer) VPN (Virtual Private Network).Multiple level of authentication stop thepotential intruders.
IPNAS is based on three types of data
• Real-time video data – Digital video signal is used both in automatic and manual mode. In automatic modeit is a source of images for automatic forest fire detection and in manual mode it is used for distant videopresence and distant monitoring using pan/tilt control and powerful zoom
• Real time metrological data –The meteorological data is today used in a postprocessing unit for false alarmreduction, and tomorrow will be useful for local fire risk index calculation in prevention phase and fire spreadestimation in fire fighting phase
• GIS (GeographicalInformation System)database – storesinformation on puregeographical data(elevations, road locations,water resources, etc.), andall other relevant informationrelated to a geographicposition, like fire history,rain-water resourcelocations, land cover – landuse, soil characteristics,local forest corridor map,tourist routes and similar.This data tomorrow will bequite useful for firemanagement activities andtoday it is used for user-friendly camera pan/tiltcontrol.
Figure 16.6: Structure of Croatian Integral Forest Fire Monitoring Sys-tem (IPNAS) (Source :http://www.fesb.hr/~ljiljana/radovi/279548)
Figure 16.7 (a): IPNAS user interface is a dynamic and interactive Webpage with the all real-time data and a user friendly interface for cameracontrol in manual mode(Source :http://www.fesb.hr/~ljiljana/radovi/279548)

358
The user interface is a dynamic andinteractive Web page where realtime video and meteorological datais shown together with GIS dataand user friendly interface forcamera pan/tilt/zoom control inmanual mode. Figure 16.7 showsthe main user interface page forexperimental monitoring unit.
During this experimental periodthey have acquired a bigcollection of false alarms that helpthem to improve the fire detectionalgorithm and functionality of thewhole system. New improvedversion of Integral Forest FireMonitoring System was releasedduring 2006.
B. Zhukov et al., have investigatedthe effect of the resolution on the
recognition of fire fronts and on the estimation of their characteristics, as well as on the estimation of the total fireradiative power (FRP) emitted from a fire scene. Data of the spectroradiometers MODIS on the Terra and Aquasatellites, which are obtained on a global scale 4 times a day, are widely used for global and regional monitoringof active fires. A disadvantage of MODIS is a relatively low resolution of 1 km. For this purpose, they comparedimages of fire scenes in Siberia, Portugal and Australia that were obtained nearly simultaneously by MODIS andby the dedicated small satellite BIRD, which provides a resolution of 370 m in its infrared channels and allows thedetection of fires with an area a factor of 7 smaller than MODIS. The results show that BIRD allows the recognitionof fire fronts and the estimation of their characteristics, while in the MODIS data fire fronts are usually not clearlydistinguished. On the other hand, MODIS proves to be a marginally adequate sensor for the estimation of the totalFRP in fire scenes, which is related to the rates of biomass burning and of gas and aerosol emissions. Only incases of fires with a relatively small front depth, which is typical for bush fires in Australia, MODIS may significantlyunderestimate the FRP by a factor of 1.8 compared to the BIRD-based FRP estimates.
The results of this study show that the MODIS sensor, with a spatial resolution of 1 km, is marginally adequate forthe estimation of the radiative power of forest fires. FRP can be related to the rates of biomass burning and of gasand aerosol emissions. Though MODIS may miss a significant portion of small fires in comparison to BIRD, itunderestimated the total FRP of the fire scenes in Siberia only by ~4%. The reason is that in these scenes themajor part of FRP (and consequently of the fire pollutant emissions) are produced by large fires that are reliablydetectable by MODIS. In cases of fires with a relatively small front depth, which is typical for the bush fires inAustralia, MODIS may significantly underestimated the FRP by nearly 50% compared to the BIRD-based FRPestimates. As a conclusion, it is recommended to combine the data of wide swath sensors, such as MODIS andof high-resolution instruments of the BIRD type for effective fire monitoring from space.
Young Gi Byun et al., 2005 proposed a graph-based forest fire detection algorithm which is based on spatial outlierdetection methods. Spatial outliers in remotely sensed imageries represent observed quantities showing unusualvalues compared to their neighbor pixel values. There have been various methods to detect the spatial outliersbased on spatial autocorrelations in statistics and data mining. These methods may be applied in detecting forestfire pixels in the MODIS imageries from NASA’s AQUA satellite. This is because the forest fire detection can bereferred to as finding spatial outliers using spatial variation of brightness temperature. Authors have tested theproposed algorithm to evaluate its applicability. For this the ordinary scatter plot and Moran’s scatter plot wereused. In order to evaluate the proposed algorithm, the results were compared with the MODIS fire product providedby the NASA MODIS Science Team, which showed the possibility of the proposed algorithm in detecting the firepixels.
Figure 16.7 (b): IPNAS user screen in automatic mode. Detection algo-rithms has few parameters which could be adjusted in real time to decreasethe false alarm rate(Source :http://www.fesb.hr/~ljiljana/radovi/279548)
359
16.2.2. Fire burnt Area Assessment
Devastating fires affected Greece in the summer 2007, with the loss of more than 60 human lives, the destructionof more than 100 villages and hundreds of square kilometers of forest burned. Luigi boschetti et al., have mappedthe extent burned and the approximate day of burning in Greece using MODIS burned area product for 22 June to30 August 2007. Their mapping is independent that of European Forest Fires Information Service (EFFIS). Thecharacteristics of the two datasets, and an evaluation of the areas burned comparing the MODIS and EFFIS datafor the same temporal interval are analysed.
The MODIS burned area product (MCD45) mapped 292657 ha as burned from 22 June to 30 August 2007 acrossthe whole of Greece (including the islands), and the EFFIS reported 272163 ha burned for the same period. Ofthese 242 900 ha were identified as burned by both products, corresponding to approximately 2% of Greece.Differences between the two products occur primarily along the borders of EFFIS mapped polygons, in agriculturalregions which are not considered by EFFIS, and for small burned areas that were mapped by EFFIS but not byMCD45.
GeoSpatial Experts’ GPS-Photo Link software has been deployed by U.S. Forest Service in the Cleveland NationalForest to speed the creation of soil burn severity maps following the devastating California wildfires in October2007. The software enabled Forest Service personnel to complete the damage assessment more rapidly thanwould have otherwise been possible, so that plans could quickly be made to protect surviving infrastructure fromflooding, landslides and debris flows. The GPS-Photo Link software maps digital photographs to their correctgeoreferenced locations in geospatial map layers. Requiring only a standard digital camera and handheld GPSdevice, the software links the photographic images with GPS location data and then accurately integrates theminto a geospatial data set along with important attribute data, such as the time, date, and location coordinates ofeach photo. The software enables users to display their photo locations as icons in digital mapping environment,including GIS and Google Earth map layers.
Roy et al., 2008, have analyzed NASA MODIS Collection 5 burned area product. Total annual and monthly areaburned statistics and missing data statistics are reported at global and continental scale and with respect todifferent land cover classes. Globally the total area burned labeled by the MODIS burned area product is3.66×106 sq.km for July 2001 to June 2002 while the MODIS active fire product detected for the same period atotal of 2.78×10⁶ sq.km, i.e., 24% less than the area labeled by the burned area product. A spatio-temporalcorrelation analysis of the two MODIS fire products stratified globally for pre-fire leaf area index (LAI) andpercent tree cover ranges indicate that for low percent tree cover and LAI, the MODIS burned area productdefines a greater proportion of the landscape as burned than the active fire product; and with increasing treecover (>60%) and LAI (>5) the MODIS active fire product defines a relatively greater proportion. This pattern isgenerally observed in product comparisons stratified with respect to land cover.
The reasons for the observed product differences are complex, and require further research and independentvalidation data. The demonstrated complementary nature of the MODIS burned area and active fire productsimply that with further research their synergistic use may provide improved burned area estimates. The MODISburned area product has been recently implemented in the MODIS land production system to systematicallymap burned areas globally for the 6 year MODIS observation record. Collection 5 is underway, reprocessingthe Terra data record starting in 2000 to present.
16.2.3. Fire Risk Assessment
Forest fires can cause substantial damage to natural resources and human lives regardless of whether it iscaused by natural forces or human activities. To minimize threat from wildfires, fire managers must be able toplan protection strategies that are appropriate for individual local areas. A prerequisite for the planning is theability to assess and map forest fire risk zones across both broad areas and local sites. Forest fire risk zonesare locations where a fire is likely to start, and from where it can easily spread to other areas.
People studied forest fire risk zones (FFRZ) with a variety of mapping methods. Most of them mapped forestfire risk zones by directly using remote sensing and geographic information systems (GIS) that contain topography,vegetation, land use, population, and settlement information (Chuvieco and Congalton 1989; Chuvieco andSalas 1996). A common practice was that forest fire risk zones were delineated by assigning subjective weightsto the classes of all the layers according to their sensitivity to fire or their fire-inducing capability.
360
XU Dong et al., 2005, have developed a RS & GIS based methodology to map forest fire risk zones (Baihe forestrybureau, Jilin, China) to minimize the frequency of fires, avert damage, etc. Satellite images were interpreted andclassified to generate vegetation type layer and land use layers (roads, settlements and farmlands). Topographiclayers (slope, aspect and altitude) were derived from DEM. The thematic and topographic information was analyzedby using ARC/INFO GIS software. Forest fire risk zones were delineated by assigning subjective weights to theclasses of all the layers (vegetation type, slope, aspect, altitude and distance from roads, farmlands and settlements)according to their sensitivity to fire or their fire-inducing capability. Five categories of forest fire risk ranging fromvery high to very low were derived automatically. The mapping result of the study area was found to be in strongagreement with actual fire-affected sites.
Patah et al., have developed a model using the integration of remote sensing and GIS to produce Fire Risk Index(FRI) maps which could be modified interactively with changing weather conditions. The model resided on threesub-indices - (i) Topographic danger index (TDI), (ii) Weather Danger Index (WDI) and (iii) Fuel Danger Index (FDI).The TDI was computed based on two parameters – slope, aspect and elevation which were generated from a DEM.The WDI was calculated from the ratio of mean maximum air temperature to mean maximum air relative humidity.In the development of the FDI the research has adopted the integration of digital classification product of theTasselled Cap Transformed (TCT) datasets and the Forest Canopy Density (FCD) Map which gave a significantlymore accurate fuel type map of the study area.
16.2.4. Fire Ecology
Fire ecology is a branch of ecology that concentrates on the origins, cycles, and future stages of fire. It probes therelationship of fire with living organisms and their environment. Following concepts provide the basis for fire ecology.
Fire Dependence: This concept applies to species of plants that rely on the effects of fire to make the environmentmore hospitable for their regeneration and growth. (2) Fire History: This concept describes how often firesoccur in a geographical area. Fire scars, or a layer of charcoal remaining on a living tree as it adds a layer ofcells annually, provide a record that can be used to determine when in history a fire occurred. (3) Fire Regime:Fire regime is a generalized way of integrating various fire characteristics, such as the fire intensity, severity,frequency, and vegetative community. (4) Fire Adaptation: This concept applies to species of plants that haveevolved with special traits contributing to successful abilities to survive fires at various stages in their life cycles.
One major effect of fire is a change in soil nutrients and soil temperature. Fire may be a chief factor maintainingproductivity in colder soils where the lack of nutrients is a major factor limiting plant growth. Fires releasenitrogen and other nutrients from woody vegetation back into the soil in the form of mineral-rich ash, whichmakes them readily available for new plant growth. Plant regeneration begins almost immediately following afire. At any given location, vegetation develops over time in orderly stages called succession. Each successivestage is determined by climate, soil conditions, available sunlight, and natural disturbances such as wildlandfire. Although fire may destroy individual trees and understory plants, the species themselves are well adaptedto survive. In many cases, this is accomplished through a high regeneration capacity.
The effects of fire on habitat- an animal’s surroundings or home- are generally more significant than the effectson animals themselves. Forests of different ages support different kinds of wildlife. Different types of birds andmammals seeking food and shelter are attracted to different types of forest types. All of these animals need avariety of resources to provide shelter, food, water, and space. These resources are often found on the bordersof two or more plant communities, such as meadow/black spruce or birch/shrubland. These “edges” are createdby fires and other disturbances and are beneficial to maintaining a healthy wildlife habitat. Small fires that occurin an area create more “edges” than one large burn. In fact a majority of species generally do best in forests thatprovide a combination of habitats.
Many wildlife species thrive on the occurrence of fire. The grasses, seedling shrub, and trees that reestablishburned areas provide an ideal environment for many small seed-eating mammals and birds, such as sparrows.Burned trees provide sites for cavity nesting birds like flickers, kestrels, and chickadees, while woodpeckersthrive on the insects that inhabit fire-killed trees.
Although the common conception is that fire is a destroyer of the natural environment, the opposite is actuallytrue, where a carefully planned prescribed burning program can be beneficial and even enhance the health ofan ecosystem. Prescribed fires can reduce the amount of combustible fuel buildup that can cause larger moredestructive fires. Other benefits of prescribed fire include: insect pest control, removal of undesirable plantscompeting for nutrients, addition of nutrients from ash, and removal of sunlight inhibiting brushy undergrowth.

361
However, incorrectly managed prescribed fires can have very adverse effects causing excessive soil heating, lossof nutrients, and removal of woody debris needed to protect seedlings. Wildfires are suppressed in developed andhigh-fuel areas where intense fire could destroy a plant community or human built structures. Modern fire policypermits the burning of some natural fires and recognizes the use of prescribed fire as a management tool.
16.2.5. Agricultural burning
Agriculture and climate are inextricable related. Dependence of agriculture to climate change has only beenestablished over the last few decades. Agricultural activities including clearing of forests, burning plant matter,cultivating rice, raising livestock and using fertilizers, leads to increased concentration of greenhouse gases inthe atmosphere. Present agricultural practices contribute towards 17% of the global warning.
Badrinath et al., have studied the agriculture crop residue burning in Punjab during wheat and rice crop growingperiods. Indian Remote Sensing Satellite (IRS-P6) Advanced Wide Field Sensor (AWiFS) data during May andOctober 2005 have been analysed for estimating the extent of burnt areas and thereby greenhouse gas (GHG)emissions from crop residue burning. Emission factors available in the literature (Jun Wang et al., 2003, Dennisa,et al., 2002 and Reddy et al., 2003) were integrated with satellite remote sensing data for estimating theemissions. Results suggested that emissions from wheat crop residues in Punjab are relatively low compared tothose from paddy fields. It is inferred that incorporation of agricultural residues into the soil in rice–wheat systemsis highly sustainable and eco-friendly, rather than burning the crop residues.
16.2.6. Biomass burning
Land clearing, an agriculture related activity, has made significant contribution to the greenhouse gas build-ups.When land is cleared, carbon dioxide is released through the burning or decomposition of plant matter and theoxidation of organic matter in the soil. Clearing forestlands for agricultural purpose results in increased carbonemission, because forest ecosystem store 20-100 times more carbon per unit area than cropland. Moreoverburning of biomass for agriculture and pasture farming result in significant carbon dioxide emissions.
Biomass burning, in a broad sense, encompasses different burning practices, including open and confinedburnings, and different types of vegetation. Emission factors of gaseous or particulate trace compounds aredirectly dependent both on the fuel type and the combustion process. Emission factors are generally calculatedusing the carbon mass balance method, applied either to combustion chamber experiments or to field experimentsbased on ground-level measurements or aircraft sampling in smoke plumes. There have been a number ofexperimental studies to investigate wildfires in tropical, temperate, or boreal regions. Delmas et al., 1995, presentedin their article, an overview of measurement methods and experimental data on emission factors of reactive orradiatively active trace compounds, including trace gases and particles. It focuses on fires in tropical regions, thatis, forest and savanna fires, agricultural burns, charcoal production, use of fuelwood, and charcoal combustion.
The MOPITT (Measurement Of Pollution In The Troposphere) aboard the NASA Earth Observing System (EOS)Terra satellite is a thermal and near IR gas correlation radiometer designed specifically to measure CO profiles andtotal column CH
4. The resolution is 22 km horizontal resolution, though the refresh is 3 days. Pinpointing the
sources of airborne chemical species is an important role for MOPITT. Although it cannot distinguish betweenindividual industrial sources in the same city, it can map different points of origin that cover a few hundred squaremiles. This is accurate enough to differentiate air pollution from a major metropolitan area, for example, from amajor fire in a national forest. In addition to being a pollutant, CO gas is a useful tracer for other pollutants, suchas ozone at or near ground level. CO can also be used to calculate the level of pollutant-cleansing chemicals in theatmosphere, such as the hydroxyl radical. When CO levels are high, the level of the hydroxyl radical is usuallylower and fewer pollutants are removed from the atmosphere. Generally radiative transfer model is being used todetermine the amount of CO required to agree with MOPITT observations of elevated CO in conjunction withbiomass burning.
MODIS data are also used to predict and monitor emissions from forest fires. This data are used to monitor arearecently burned using two methods: a preliminary near-IR spectral test being developed at NASA and theconvex hull of the cumulative active fire pixel centers (hot spots) when thick smoke obscures the burn scar.Emission factors from previous studies are used to estimate fire emissions from the MODIS observations. Theemission estimates are used by a NOAA model to predict the dispersion of the emissions at three-hour intervalsover several days (Wei Min Hao et al.).
362
A new instrument in orbit aboard NASA’s ICESat satellite—the Geoscience Laser Altimeter System (GLAS)—reveals another dimension of the California wildfires. By transmitting a green beam of laser light downward at theEarth and then precisely measuring how much of that light is backscattered back up into space, GLAS candetermine the vertical structure of clouds, pollution, or smoke plumes in the atmosphere.
Streets et al., 2006 have studied biomass burning and associated atmospheric emission for Asian country. Theyestimated that 730 Tg of biomass are burned in Asia in a typical year from both anthropogenic and natural causes.Forest burning comprises 45% (330 Tg) of the total; the burning of crop residues in the field comprises 34% (250Tg), and 20% (150Tg) comes from the burning of grassland and savanna. China contributes 25% of the total, India18%, Indonesia 13%, and Myanmar 8%. Regionally, forest burning in Southeast Asia dominates. In their studyNational annual totals are converted to daily and monthly estimates at 1
0 × 1
0 grid resolution using distributions
based on AVHRR fire counts for 1999-2000. Several adjustment schemes are applied to correct for the deficienciesof AVHRR data, including the use of moving averages, normalization, TOMS Aerosol Index, and masks for dust,clouds, landcover, and other fire sources.
To calculate emissions from biomass burning, the mass of dry matter burned of each type (forest, savannagrassland, or crop residues) is multiplied by an appropriate emission factor from Andreae and Merlet [2001],using the equation
E = M * Fwhere, E = total emissions of the source type;
M = mass of dry matter burned; andF = source-specific emission factor
Biomass burning amounts are converted (using the above equation) to atmospheric emissions, yielding thefollowing estimates: 0.37 Tg of SO2, 2.8 Tg of NOx, 1100 Tg of CO2, 67 Tg of CO, 3.1 Tg of CH4, 12 Tg of NMVOC,0.45 Tg of BC, 3.3 Tg of OC, and 0.92 Tg of NH3. Uncertainties in the emission estimates, measured as 95%confidence intervals, range from a low of ±65% for CO2 emissions in Japan to a high of ±700% for BC emissionsin India.
Annual emissions inventories, although necessary, are notoriously inaccurate, especially when emission factorsfrom developed countries are applied (Guttikunda et al., 2008) to developing countries.
16.2.7. Forest Fire Management System
Reliable up-to date information is critical for effective and efficient prevention and suppression of fires. Hence forestfire information system is a driving force for improved communication with the user department. Presently there aremany number of forest fire information systems available globally/country level viz., Canadian wild land fire informationsystem (http://cwfis.cfs.nrcan.gc.ca/en/index_e.php), European forest fire information system (http://ies.jrc.cec.eu.int/94.html), Web fire mapper (http://maps.geog.umd.edu/). Indian Forest Fire Response andAssessment System (INFFRAS).
Fire Information for Resource Management System (FIRMS) is a transitioning from a Research to an OperationalSystem with an Emphasis on Protected Areas. This project integrates Remote Sensing and GIS technologies toprovide Global fire information in easy to use formats for decision making, with an emphasis on supplying ProtectedArea managers. This work builds on Web Fire Mapper, a decision support tool built by researchers in the Departmentof Geography using NASA research and observations. The project will refine Web Fire Mapper - expanding theprototype into an operational system called the Fire Information for Resource Management System (FIRMS). Thisoperational system will ultimately be housed at the United Nations (FAO and UNEP) to ensure data continuity andaid the UN in meeting its mandate to assist developing countries in protecting biodiversity. FIRMS will consist ofa WebGIS with interactive maps, near-real time NASA imagery and email and text message alerts warning of firesin or around Protected Areas. FIRMS is likely to be integrated with INFFRAS soon.
Although fire is an established ecosystem process, and has an important role in conservation areas, frequent anduncontrolled fires can be detrimental. Uncontrolled fires can damage natural resources, diminish the range anddiversity of species and erode fragmented forest edges. To be able to manage fires, natural resource managersneed timely information both on fires occurring within their area of jurisdiction and within its immediate surroundings.Obtaining fire information in a user-friendly format and in time to use it for operational fire management has notbeen easy for park managers in remote locations and with limited access to the internet. FIRMS will provideresource managers with a system that delivers fire products with the minimum possible file size and using adelivery system that anyone with Internet connectivity can access.

363
16.3. Forest Fire Study under Decision Support Centre (DSC), Disaster ManagementSupport Programme (DMSP) at National Remote Sensing Centre (NRSC), India
16.3.1. Indian Forest Fire Response and Management System (INFFRAS)
The Decision Support Center (DSC) at the National Remote Sensing Centre is an integral part of the NationalDisaster Management Support Program (DMSP) activities of Department of Space. The Indian Forest FireResponse and Assessment System (INFFRAS) have been established under the DSC to facilitate forest firemanagement. INFFRAS integrates multi sensor satellite data with GIS databases to address forest firemanagement at following levels
• Pre fire: Preparatory planning for fire control;
• During fire: Near real time active fire detection and monitoring;
• Post fire: Damage and recovery assessment and mitigation planning
Website of INFFRAS is available at NRSC home page as shown in Figure 16.8.
With the advent of series of satellite onboard, it is possible to detect active fires to a minimum of 4 times in a day(viz. MODIS-Terra/Aqua, NOAA-17/ 18, IRS P6) and at least 2 times during nighttime by DMSP-OLS (F15 & F16).In an integrated approach,daytime fire signals usingMODIS Terra/Aqua andnighttime fire signalsusing DMSP-OLS aredisseminated to the user(State ForestDepartment), throughINFFRAS. Different spatial& temporal satellite dataviz. IRS 1D/P6, MODISare analysed for firemonitoring and burnt areaassessment on the basisof daily fire alert or basedon special request fromany user and are madeavailable at INFFRAS forthe users. In addition tothe above, RemoteSensing & GIS basedinputs for recovery/mitigation planning also been provided to the user through INFFRAS. All the activities done under INFFRAS aredescribed in the following sections.
16.3.1.1. Active fire detection using Moderate Resolution Imaging Spectroradiometer (MODIS) Terra/Aqua data
16.3.1.1.1. Introduction
Coarse resolution (1 Km.) satellite data of sensors like MODIS, AATSR and NOAA detect active fires based on thebrightness temperature levels recorded in short wave and thermal IR wavelength bands. Detection of active fires asa function of the pixel brightness temperature above that of background depends on fire temperature and size (areaunder burning) relative to the ground resolution of the sensor, fire and smoldering intensity levels, vegetation typeand background land cover and atmospheric interferences.
Active fire locations detected using MODIS satellite data are placed on WEB on daily basis for the entire globe.Based on our initial studies conducted using these databases, it was found that a lot of improvement is requiredin terms of positional accuracy, detection of small fires and reduction of false alarms. The methods availableglobally need to be fine tuned while applying them over tropical regions like India by taking into account small
Figure 16.8: INFFRAS web site
364
extent of fires, different vegetation types and forest boundaries to exclude false alarms. This calls for developmentof region specific algorithms for detection of fires with improved accuracy.
Experience with the previous few years of high quality data from the (MODIS) through quality control and validationhas suggested several improvements to the original MODIS active fire detection algorithm described by Kaufmanet al.,1998. An improved active fire detection algorithm was developed which offers increased sensitivity to smaller,cooler fires as well as a significant lower false alarm rate. (Kaufman et al., 2003). The improved algorithm candetect fires roughly half the minimum size that could be detected with the original algorithm while having an overallfalse alarm rate 10-100 times smaller.
The original fire detection algorithm suffered from persistent false detections in deserts and other sparsely vegetatedland surfaces. As an example over Pakistan version -3 algorithm yielded nearly 4800 false fire pixels. These pixelswere deemed false based on an examination of MODIS 250 m, 500 m, and 1 km imagery and the fact that thelarge cluster persisted over long periods of time (e.g., weeks). All fire pixels were located in areas of sparselyvegetated soil, and none of the fire pixels have sufficiently high 4 µm brightness temperatures to definitivelysuggest that true fires might be present. In addition, the top-of-atmosphere visible channel reflectances reveal acomplete absence of smoke. This suggests that the majority (if not the entirety) of the fire pixels within a mosaicland cover of vegetative and non-vegetative surface are indeed false alarms. These studies stress a need for fine-tuning the fire detection algorithm on a continuous mode with region specific thresholds especially for sparselyvegetated forest areas in India.
In view of this, present study is proposed with the following objectives:
• To fine tune region specific forest fire detection algorithms using MODIS –Terra/Aqua satellite data
• To provide active fire locations along with forest infrastructure boundaries (if available) on daily basis for entirethe country
16.3.1.1.2. Methodology for detection of active fire locations using MODIS Terra/Aqua data
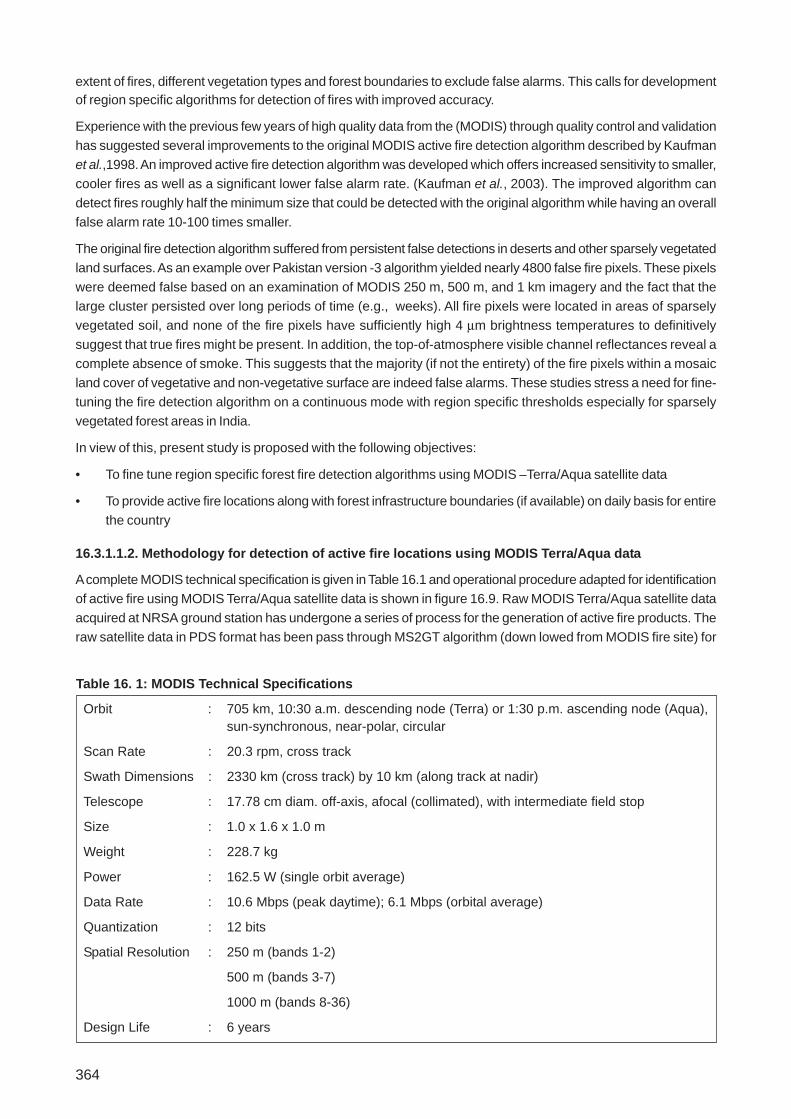
A complete MODIS technical specification is given in Table 16.1 and operational procedure adapted for identificationof active fire using MODIS Terra/Aqua satellite data is shown in figure 16.9. Raw MODIS Terra/Aqua satellite dataacquired at NRSA ground station has undergone a series of process for the generation of active fire products. Theraw satellite data in PDS format has been pass through MS2GT algorithm (down lowed from MODIS fire site) for
Table 16. 1: MODIS Technical Specifications
Orbit : 705 km, 10:30 a.m. descending node (Terra) or 1:30 p.m. ascending node (Aqua),sun-synchronous, near-polar, circular
Scan Rate : 20.3 rpm, cross track
Swath Dimensions : 2330 km (cross track) by 10 km (along track at nadir)
Telescope : 17.78 cm diam. off-axis, afocal (collimated), with intermediate field stop
Size : 1.0 x 1.6 x 1.0 m
Weight : 228.7 kg
Power : 162.5 W (single orbit average)
Data Rate : 10.6 Mbps (peak daytime); 6.1 Mbps (orbital average)
Quantization : 12 bits
Spatial Resolution : 250 m (bands 1-2)
500 m (bands 3-7)
1000 m (bands 8-36)
Design Life : 6 years

365
Primary Use Channel Bandwidth 1 Spectral RequiredRadiance 2 SNR3
Land/Cloud/Aerosols 1 620 - 670 21.8 128Boundaries 2 841 - 876 24.7 201
Land/Cloud/Aerosols 3 459 - 479 35.3 243Properties 4 545 - 565 29 228
5 1230 - 1250 5.4 74
6 1628 - 1652 7.3 275
7 2105 - 2155 1 110
Ocean Color/ 8 405 - 420 44.9 880
Phytoplankton 9 438 - 448 41.9 838
Biogeochemistry 10 483 - 493 32.1 802
11 526 - 536 27.9 754
12 546 - 556 21 750
13 662 - 672 9.5 910
14 673 - 683 8.7 1087
15 743 - 753 10.2 586
16 862 - 877 6.2 516
Atmospheric 17 890 - 920 10 167
Water Vapor 18 931 - 941 3.6 57
19 915 - 965 15 250
Surface/Cloud 20 3.660 - 3.840 0.45(300K) 0.05
Temperature 21 3.929 - 3.989 2.38(335K) 2
22 3.929 - 3.989 0.67(300K) 0.07
23 4.020 - 4.080 0.79(300K) 0.07
Atmospheric 24 4.433 - 4.498 0.17(250K) 0.25
Temperature 25 4.482 - 4.549 0.59(275K) 0.25
Cirrus Clouds 26 1.360 - 1.390 6 150(SNR)
Water Vapor 27 6.535 - 6.895 1.16(240K) 0.25
28 7.175 - 7.475 2.18(250K) 0.25
Cloud Properties 29 8.400 - 8.700 9.58(300K) 0.05
Ozone 30 9.580 - 9.880 3.69(250K) 0.25
Surface/Cloud 31 10.780 - 11.280 9.55(300K) 0.05
Temperature 32 11.770 - 12.270 8.94(300K) 0.05
Cloud Top 33 13.185 - 13.485 4.52(260K) 0.25
Altitude 34 13.485 - 13.785 3.76(250K) 0.25
35 13.785 - 14.085 3.11(240K) 0.25
36 14.085 - 14.385 2.08(220K) 0.35
1 Bands 1 to 19 are in nm; Bands 20 to 36 are in µm2 Spectral Radiance values are (W/m2 - µm-sr)3 SNR = Signal-to-noise ratio4 NE(delta)T = Noise-equivalent temperature differenceNote: Performance goal is 30-40% better than required
the production of bow tie and geo-corrected satellite data. Geo-corrected satellite data is used as the input to therevised fire algorithm to produce value added fire products.
NRSC followed Version 4 contextual algorithm (Louis Giglio et al., 2003), which is based upon the original MODISfire detection algorithm (Kaufman, Justice et al., for the generation of fire maps. The above algorithmis modified with region specific needs. The algorithm uses brightness temperatures derived from MODIS 4µm and11µm channels, denoted by T
4 and T
11 respectively. Thermal channels 21 and 22 ranging from 3.929 µm to 3.989µm

366
of MODIS wereconsidered for thepresent study. Channel21 saturates at nearly500 K and channel 22saturates at 331 K.Since the low–saturationchannel (22) is lessnoisy and has lessquantization error; T4 isderived from channel 22.Brightness temperatureT
11 was derived from
channel 31, whichsaturates approximatelyat 400K. Brightnesstemperatures derivedfrom channel 32 isdenoted by T
12 and is
used in cloud masking.
The 250 m resolution Red and Infrared channels (1 and 2) were aggregated to 1km and were used to reject falsealarms and in masking clouds and water bodies. Reflectance of these channels (R,NIR) are denoted by r
0.65 and
r0.86
respectively. The details of the adopted algorithm are as follows
16.3.1.1.3. Cloud and water masking
Day time pixels are considered as clouds and obscured if following conditions are satisfied
(ρ 0.65 + ρ0.86 > 0.5) or (T12 < 295 K) for small clouds and
(ρ0.65 + ρ0.86 <. 15) or (T12 < 298 K) for larger clouds.
16.3.1.1.4. Identification of potential fire pixels
A preliminary classification is used to eliminate obvious non-fire pixels. Remaining pixels are considered insubsequent tests. A daytime pixels are identified as potential fire pixels
if T4 > 290 K, ∆T > 3K and ρρρρρ0.86 < 0.185, where ∆T = T4 - T11
16.3.1.1.5. Absolute threshold test
The 4 and 11 µm channels in MODIS are designed to be sensitive to temperatures reaching 500 K and 400 Krespectively. Therefore except for large wild fires (less possible events in India) these MODIS channels withresolution 1 km at nadir are not expected to saturate. According to Weins displacement law, shorter the wavelength(4 µm), the stronger the sensitivity to the higher temperature region. Moreover 4 µm channel is not affected bywater vapor absorption and weakly affected by other gaseous absorption.
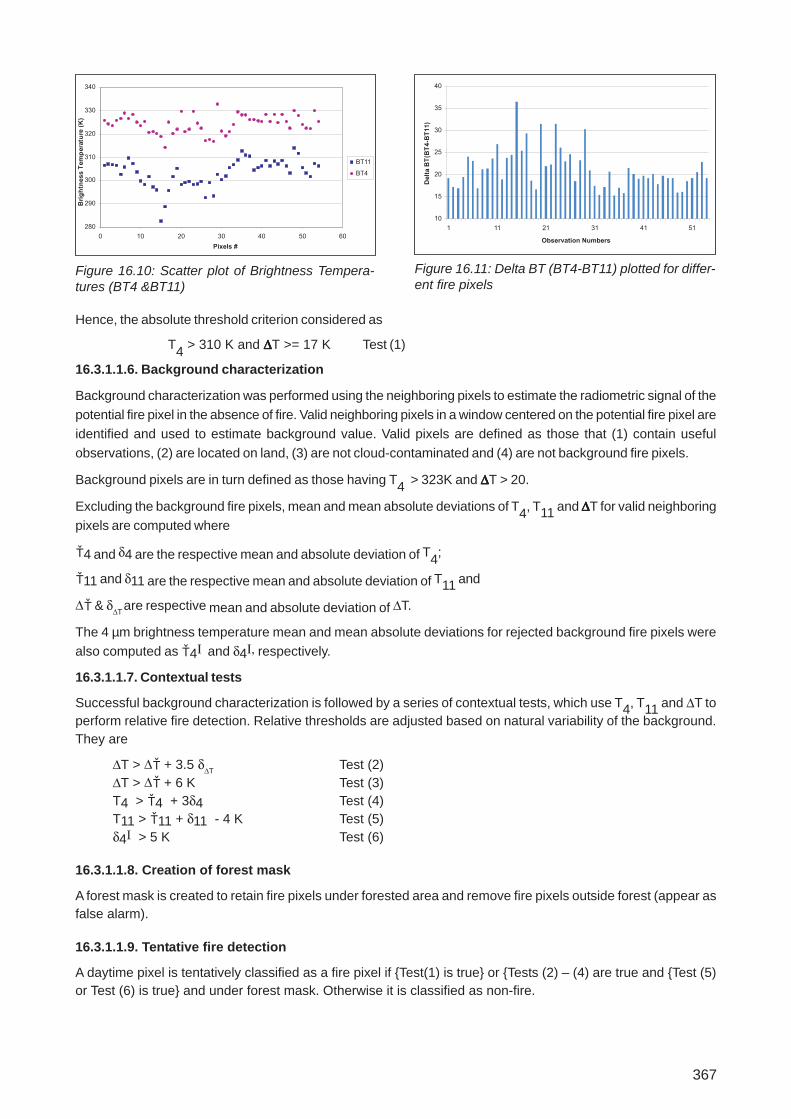
Fire pixels are detected based on certain criterion. These are (1) The 4 µm channel brightness temperature to beelevated above a set threshold indicating a fire. (2) The difference between the 4 and 11 µm temperatures must beat least some specific value to avoid hot exposed soils, and the (3) used the 11 µm temperature to eliminate falsedetections from cool clouds, with small drop size, that are highly reflective in the 4 µm band. Based on the aboveconsiderations brightness temperatures for 4 and 11 µm channels were examined. Scatter plot of brightnesstemperatures of fire pixels represented by 4 and 11 µm channels is shown in Figure 16.10. It has been observedfrom brightness temperature received by 4 µm channel is always showing greater than 310 K. Hence, for absolutetemperature threshold, a brightness temperature of 310 K is identified for picking up fire pixel. Similarly thedifference of temperature received by 4 and 11 µm channels are plotted in Figure 16.11 wherein it is clear that deltaBT is always higher than 17 K for fire pixels.
Figure 16.9: Operational procedure of Active fire detection
367
Hence, the absolute threshold criterion considered as
T4 > 310 K and ∆∆∆∆∆T >= 17 K Test (1)
16.3.1.1.6. Background characterization
Background characterization was performed using the neighboring pixels to estimate the radiometric signal of thepotential fire pixel in the absence of fire. Valid neighboring pixels in a window centered on the potential fire pixel areidentified and used to estimate background value. Valid pixels are defined as those that (1) contain usefulobservations, (2) are located on land, (3) are not cloud-contaminated and (4) are not background fire pixels.
Background pixels are in turn defined as those having T4 > 323K and ∆∆∆∆∆T > 20.
Excluding the background fire pixels, mean and mean absolute deviations of T4, T11 and ∆∆∆∆∆T for valid neighboringpixels are computed where
4 and δ4 are the respective mean and absolute deviation of T4;
11 and δ11 are the respective mean and absolute deviation of T11 and
∆ & δ∆T are respective mean and absolute deviation of ∆T.
The 4 µm brightness temperature mean and mean absolute deviations for rejected background fire pixels werealso computed as 4Ι and δ4Ι, respectively.
16.3.1.1.7. Contextual tests
Successful background characterization is followed by a series of contextual tests, which use T4, T11 and ∆T toperform relative fire detection. Relative thresholds are adjusted based on natural variability of the background.They are
∆T > ∆ + 3.5 δ∆TTest (2)
∆T > ∆ + 6 K Test (3)T4 > 4 + 3δ4 Test (4)T11 > 11 + δ11 - 4 K Test (5)δ4I > 5 K Test (6)
16.3.1.1.8. Creation of forest mask
A forest mask is created to retain fire pixels under forested area and remove fire pixels outside forest (appear asfalse alarm).
16.3.1.1.9. Tentative fire detection
A daytime pixel is tentatively classified as a fire pixel if {Test(1) is true} or {Tests (2) – (4) are true and {Test (5)or Test (6) is true} and under forest mask. Otherwise it is classified as non-fire.
Figure 16.10: Scatter plot of Brightness Tempera-tures (BT4 &BT11)
Figure 16.11: Delta BT (BT4-BT11) plotted for differ-ent fire pixels
368
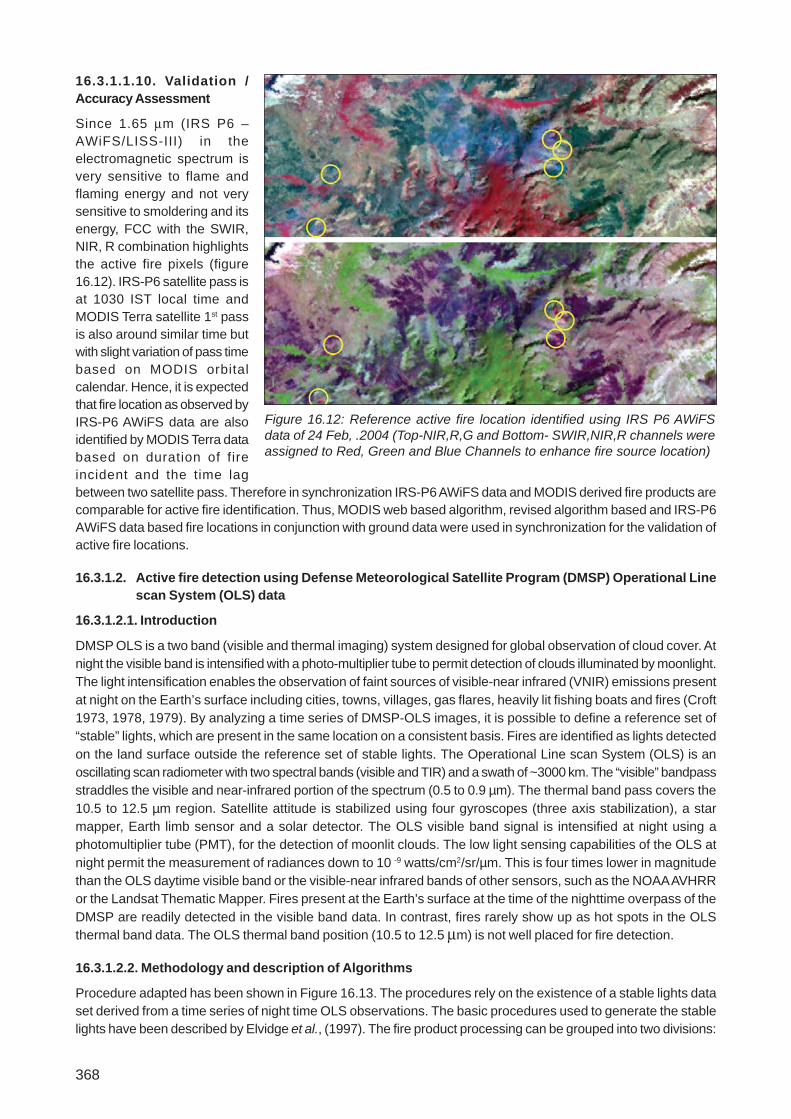
16.3.1.1.10. Validation /Accuracy Assessment
Since 1.65 µm (IRS P6 –AWiFS/LISS-III) in theelectromagnetic spectrum isvery sensitive to flame andflaming energy and not verysensitive to smoldering and itsenergy, FCC with the SWIR,NIR, R combination highlightsthe active fire pixels (figure16.12). IRS-P6 satellite pass isat 1030 IST local time andMODIS Terra satellite 1st passis also around similar time butwith slight variation of pass timebased on MODIS orbitalcalendar. Hence, it is expectedthat fire location as observed byIRS-P6 AWiFS data are alsoidentified by MODIS Terra databased on duration of fireincident and the time lagbetween two satellite pass. Therefore in synchronization IRS-P6 AWiFS data and MODIS derived fire products arecomparable for active fire identification. Thus, MODIS web based algorithm, revised algorithm based and IRS-P6AWiFS data based fire locations in conjunction with ground data were used in synchronization for the validation ofactive fire locations.
16.3.1.2. Active fire detection using Defense Meteorological Satellite Program (DMSP) Operational Linescan System (OLS) data
16.3.1.2.1. Introduction
DMSP OLS is a two band (visible and thermal imaging) system designed for global observation of cloud cover. Atnight the visible band is intensified with a photo-multiplier tube to permit detection of clouds illuminated by moonlight.The light intensification enables the observation of faint sources of visible-near infrared (VNIR) emissions presentat night on the Earth’s surface including cities, towns, villages, gas flares, heavily lit fishing boats and fires (Croft1973, 1978, 1979). By analyzing a time series of DMSP-OLS images, it is possible to define a reference set of“stable” lights, which are present in the same location on a consistent basis. Fires are identified as lights detectedon the land surface outside the reference set of stable lights. The Operational Line scan System (OLS) is anoscillating scan radiometer with two spectral bands (visible and TIR) and a swath of ~3000 km. The “visible” bandpassstraddles the visible and near-infrared portion of the spectrum (0.5 to 0.9 µm). The thermal band pass covers the10.5 to 12.5 µm region. Satellite attitude is stabilized using four gyroscopes (three axis stabilization), a starmapper, Earth limb sensor and a solar detector. The OLS visible band signal is intensified at night using aphotomultiplier tube (PMT), for the detection of moonlit clouds. The low light sensing capabilities of the OLS atnight permit the measurement of radiances down to 10 -9 watts/cm2/sr/µm. This is four times lower in magnitudethan the OLS daytime visible band or the visible-near infrared bands of other sensors, such as the NOAA AVHRRor the Landsat Thematic Mapper. Fires present at the Earth’s surface at the time of the nighttime overpass of theDMSP are readily detected in the visible band data. In contrast, fires rarely show up as hot spots in the OLSthermal band data. The OLS thermal band position (10.5 to 12.5 µm) is not well placed for fire detection.
16.3.1.2.2. Methodology and description of Algorithms
Procedure adapted has been shown in Figure 16.13. The procedures rely on the existence of a stable lights dataset derived from a time series of night time OLS observations. The basic procedures used to generate the stablelights have been described by Elvidge et al., (1997). The fire product processing can be grouped into two divisions:
Figure 16.12: Reference active fire location identified using IRS P6 AWiFSdata of 24 Feb, .2004 (Top-NIR,R,G and Bottom- SWIR,NIR,R channels wereassigned to Red, Green and Blue Channels to enhance fire source location)

369
processing done on raw OLS data and processing done on geo-referenced OLS data. Certain steps are logically applied whilethe data are in their raw scan line format. In addition, the rawdata has less data volume, which allows the processing to runfaster. Processing steps applied to the raw data include: orbitassembly and sub orbiting, cloud identification, light detection,geo-location and girding. Following the light detection there areoptions for the removal of single pixel light detections and lightdetections that coincide with clouds on heavily moonlit nights.Pixels identities (e.g., lights, clouds, clouds with lights, missingscan lines) are marked in a flag file which overlays the OLSimage data. Steps performed on the geo-referenced data includethe removal of lights associated with stable lights, lights overwater surfaces, and final editing by an image analyst.
16.3.1.2.3. Factors influencing DMSP fire detection
There are a number of factors or conditions, which will impedethe detection of fires with DMSP-OLS data, including: high levelsof lunar illumination, cloud cover, and solar glare, moonlit clouds,incomplete stable light set used etc. Thus it is important thatthe stable lights database be kept up to date and that it isconstructed with sufficient numbers of cloud-free observationsto ensure that all stable lights are included. Because of themanner in which the stable lights are removed, fires that areadjacent to stable lights can not be readily detected (errors ofomission). As final steps in generating a DMSP fire product areperformed on 30 arc second grids instead of OLS pixels. Sincea single OLS pixel usually occupies nine 30 arc second gridcells, a simple estimate of the number of OLS fire pixels can bemade by dividing the total number of 30 arc second cells taggedas fire by nine. Day and Night time operational forest fire productsare shown in figure 16.14.
16.3.1.3. Burnt Area Assessment
16.3.1.3.1. Introduction
Currently burnt area reportingin the country is done byindividual State ForestDepartment by integrating theground reports. The ground-based assessment is verylaborious and time taking. Asthe fires occur simultaneouslyat several places betweenJanuary to June many of thecases might also goundetected. The burnt areaassessment assumesimportance in terms of local andNational relevance. The nearreal time damage assessmentcan only be achieved throughsatellite based burnt area
Figure 16.13: DMSP fire detection procedure
Figure 16.14: MODIS and DMSP-OLS active fire product
370
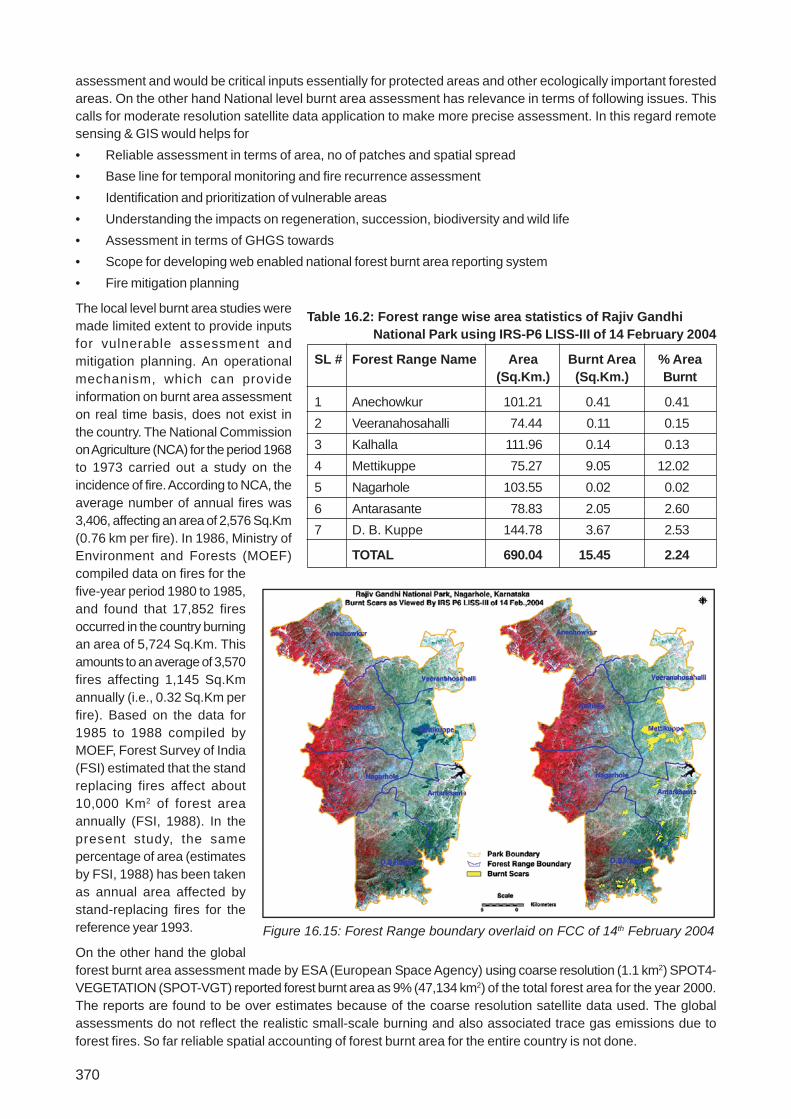
Table 16.2: Forest range wise area statistics of Rajiv Gandhi National Park using IRS-P6 LISS-III of 14 February 2004
SL # Forest Range Name Area Burnt Area % Area(Sq.Km.) (Sq.Km.) Burnt
1 Anechowkur 101.21 0.41 0.41
2 Veeranahosahalli 74.44 0.11 0.15
3 Kalhalla 111.96 0.14 0.13
4 Mettikuppe 75.27 9.05 12.02
5 Nagarhole 103.55 0.02 0.02
6 Antarasante 78.83 2.05 2.60
7 D. B. Kuppe 144.78 3.67 2.53
TOTAL 690.04 15.45 2.24
assessment and would be critical inputs essentially for protected areas and other ecologically important forestedareas. On the other hand National level burnt area assessment has relevance in terms of following issues. Thiscalls for moderate resolution satellite data application to make more precise assessment. In this regard remotesensing & GIS would helps for
• Reliable assessment in terms of area, no of patches and spatial spread
• Base line for temporal monitoring and fire recurrence assessment
• Identification and prioritization of vulnerable areas
• Understanding the impacts on regeneration, succession, biodiversity and wild life
• Assessment in terms of GHGS towards
• Scope for developing web enabled national forest burnt area reporting system
• Fire mitigation planning
The local level burnt area studies weremade limited extent to provide inputsfor vulnerable assessment andmitigation planning. An operationalmechanism, which can provideinformation on burnt area assessmenton real time basis, does not exist inthe country. The National Commissionon Agriculture (NCA) for the period 1968to 1973 carried out a study on theincidence of fire. According to NCA, theaverage number of annual fires was3,406, affecting an area of 2,576 Sq.Km(0.76 km per fire). In 1986, Ministry ofEnvironment and Forests (MOEF)compiled data on fires for thefive-year period 1980 to 1985,and found that 17,852 firesoccurred in the country burningan area of 5,724 Sq.Km. Thisamounts to an average of 3,570fires affecting 1,145 Sq.Kmannually (i.e., 0.32 Sq.Km perfire). Based on the data for1985 to 1988 compiled byMOEF, Forest Survey of India(FSI) estimated that the standreplacing fires affect about10,000 Km2 of forest areaannually (FSI, 1988). In thepresent study, the samepercentage of area (estimatesby FSI, 1988) has been takenas annual area affected bystand-replacing fires for thereference year 1993.
On the other hand the globalforest burnt area assessment made by ESA (European Space Agency) using coarse resolution (1.1 km2) SPOT4-VEGETATION (SPOT-VGT) reported forest burnt area as 9% (47,134 km2) of the total forest area for the year 2000.The reports are found to be over estimates because of the coarse resolution satellite data used. The globalassessments do not reflect the realistic small-scale burning and also associated trace gas emissions due toforest fires. So far reliable spatial accounting of forest burnt area for the entire country is not done.
Figure 16.15: Forest Range boundary overlaid on FCC of 14th February 2004
371
In view of this, an effort is initiated to undertake burnt area assessment on a regular basis on the following lines.
• Based on trigger from fire watch report
• Response from user departments against the announcement of DSC
• Direct request from user departments
• Internal DSC studies to develop data base
16.3.1.3.2. Burnt area assessment for Rajiv Gandhi National Park
Burnt area assessment for Rajiv Gandhi National Park has been done using IRS P6 LISS-III data of 14 February2004 as shown in Figure 16.15 and corresponding Forest Range wise burnt area statistics are given in Table16.2.
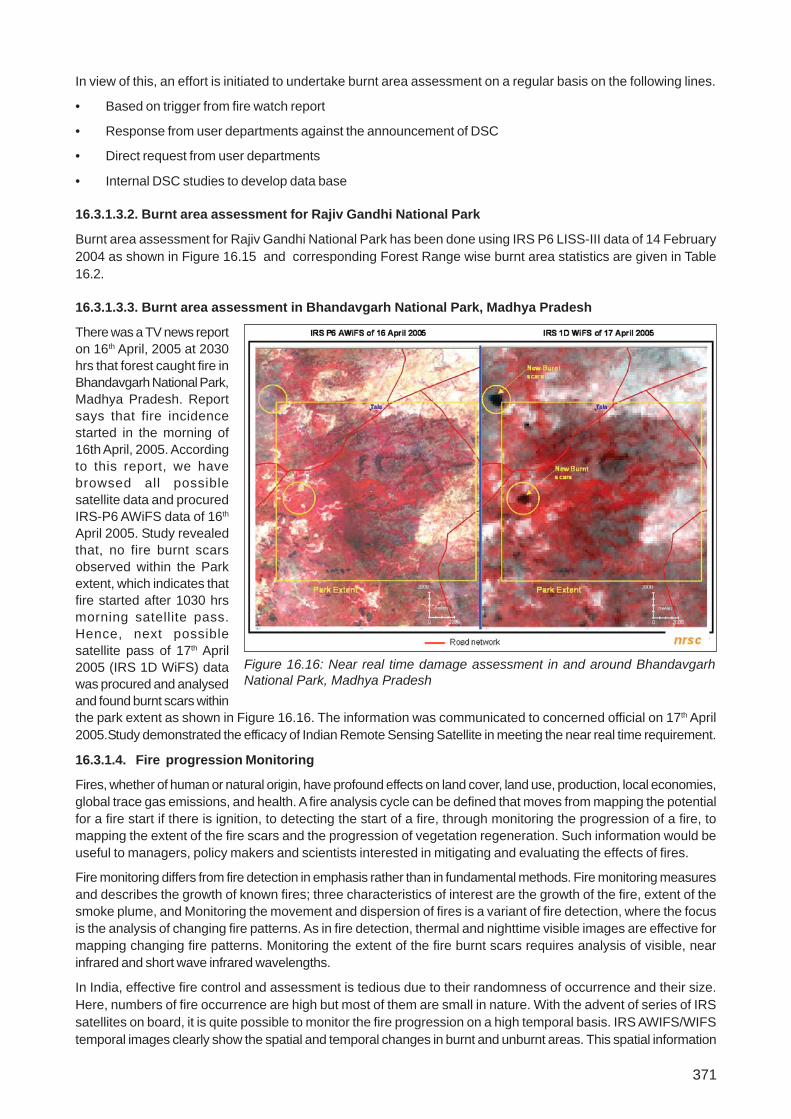
16.3.1.3.3. Burnt area assessment in Bhandavgarh National Park, Madhya Pradesh
There was a TV news reporton 16th April, 2005 at 2030hrs that forest caught fire inBhandavgarh National Park,Madhya Pradesh. Reportsays that fire incidencestarted in the morning of16th April, 2005. Accordingto this report, we havebrowsed all possiblesatellite data and procuredIRS-P6 AWiFS data of 16th
April 2005. Study revealedthat, no fire burnt scarsobserved within the Parkextent, which indicates thatfire started after 1030 hrsmorning satellite pass.Hence, next possiblesatellite pass of 17th April2005 (IRS 1D WiFS) datawas procured and analysedand found burnt scars withinthe park extent as shown in Figure 16.16. The information was communicated to concerned official on 17th April2005.Study demonstrated the efficacy of Indian Remote Sensing Satellite in meeting the near real time requirement.
16.3.1.4. Fire progression Monitoring
Fires, whether of human or natural origin, have profound effects on land cover, land use, production, local economies,global trace gas emissions, and health. A fire analysis cycle can be defined that moves from mapping the potentialfor a fire start if there is ignition, to detecting the start of a fire, through monitoring the progression of a fire, tomapping the extent of the fire scars and the progression of vegetation regeneration. Such information would beuseful to managers, policy makers and scientists interested in mitigating and evaluating the effects of fires.
Fire monitoring differs from fire detection in emphasis rather than in fundamental methods. Fire monitoring measuresand describes the growth of known fires; three characteristics of interest are the growth of the fire, extent of thesmoke plume, and Monitoring the movement and dispersion of fires is a variant of fire detection, where the focusis the analysis of changing fire patterns. As in fire detection, thermal and nighttime visible images are effective formapping changing fire patterns. Monitoring the extent of the fire burnt scars requires analysis of visible, nearinfrared and short wave infrared wavelengths.
In India, effective fire control and assessment is tedious due to their randomness of occurrence and their size.Here, numbers of fire occurrence are high but most of them are small in nature. With the advent of series of IRSsatellites on board, it is quite possible to monitor the fire progression on a high temporal basis. IRS AWIFS/WIFStemporal images clearly show the spatial and temporal changes in burnt and unburnt areas. This spatial information
Figure 16.16: Near real time damage assessment in and around BhandavgarhNational Park, Madhya Pradesh
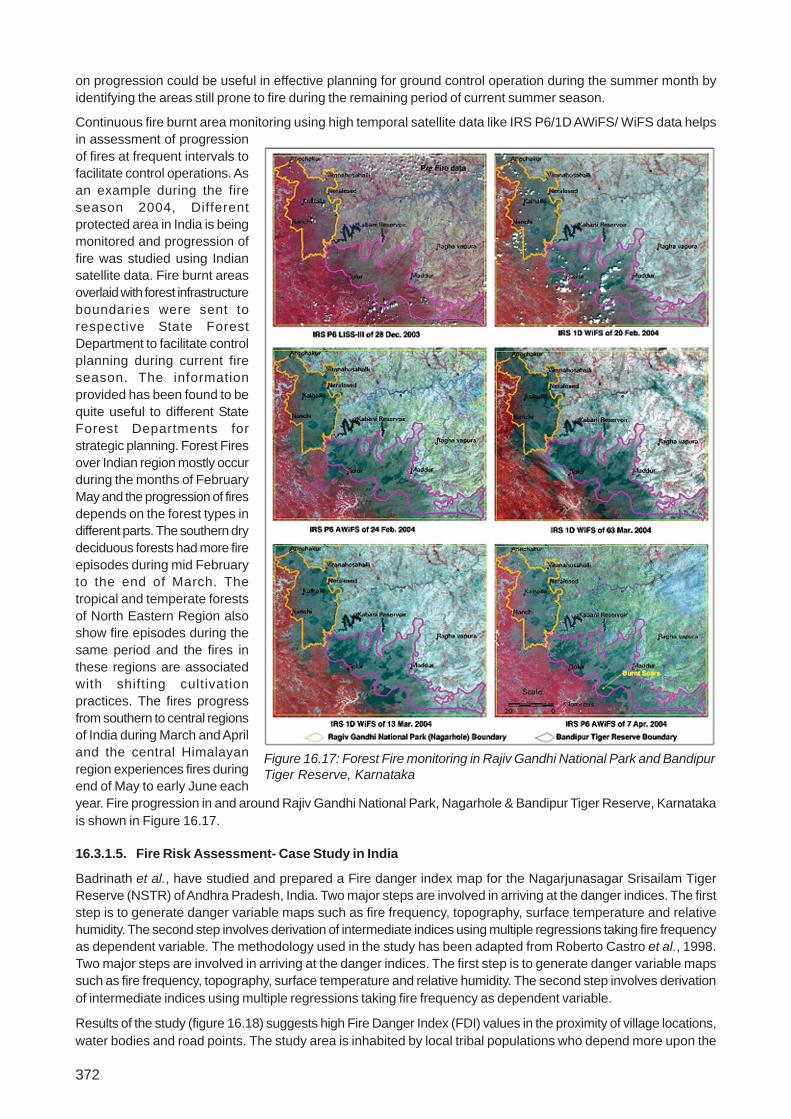
372
on progression could be useful in effective planning for ground control operation during the summer month byidentifying the areas still prone to fire during the remaining period of current summer season.
Continuous fire burnt area monitoring using high temporal satellite data like IRS P6/1D AWiFS/ WiFS data helpsin assessment of progressionof fires at frequent intervals tofacilitate control operations. Asan example during the fireseason 2004, Differentprotected area in India is beingmonitored and progression offire was studied using Indiansatellite data. Fire burnt areasoverlaid with forest infrastructureboundaries were sent torespective State ForestDepartment to facilitate controlplanning during current fireseason. The informationprovided has been found to bequite useful to different StateForest Departments forstrategic planning. Forest Firesover Indian region mostly occurduring the months of FebruaryMay and the progression of firesdepends on the forest types indifferent parts. The southern drydeciduous forests had more fireepisodes during mid Februaryto the end of March. Thetropical and temperate forestsof North Eastern Region alsoshow fire episodes during thesame period and the fires inthese regions are associatedwith shifting cultivationpractices. The fires progressfrom southern to central regionsof India during March and Apriland the central Himalayanregion experiences fires duringend of May to early June eachyear. Fire progression in and around Rajiv Gandhi National Park, Nagarhole & Bandipur Tiger Reserve, Karnatakais shown in Figure 16.17.
16.3.1.5. Fire Risk Assessment- Case Study in India
Badrinath et al., have studied and prepared a Fire danger index map for the Nagarjunasagar Srisailam TigerReserve (NSTR) of Andhra Pradesh, India. Two major steps are involved in arriving at the danger indices. The firststep is to generate danger variable maps such as fire frequency, topography, surface temperature and relativehumidity. The second step involves derivation of intermediate indices using multiple regressions taking fire frequencyas dependent variable. The methodology used in the study has been adapted from Roberto Castro et al., 1998.Two major steps are involved in arriving at the danger indices. The first step is to generate danger variable mapssuch as fire frequency, topography, surface temperature and relative humidity. The second step involves derivationof intermediate indices using multiple regressions taking fire frequency as dependent variable.
Results of the study (figure 16.18) suggests high Fire Danger Index (FDI) values in the proximity of village locations,water bodies and road points. The study area is inhabited by local tribal populations who depend more upon the
Figure 16.17: Forest Fire monitoring in Rajiv Gandhi National Park and BandipurTiger Reserve, Karnataka

373
forest for fuel wood. They cutthe grasses and burn the baseso as to facilitate the re-growthof the grasses by the on settingof monsoon. Traditionalpractices such as theseaccount for most of the fireepisodes. More over, the studyarea also being a pilgrim placeis more subjected to visitors allround the year. Lighting ofcigarettes and cookingpractices of these pilgrims havetheir contribution in forest firesalong highways and roadpoints. This suggests that firesin the study area are more ofanthropogenic activities thandue to natural episodes.Although the proportionalweights between variablesmight be applied to other areasor periods, the specificcoefficients are restricted to thearea and interval in which fire statistics were collected. The approximations on danger variable calculations suchas fuel types, relative humidity are some of the limitations of the study which can be overcome by more groundknowledge and detailed measurements.
16.3.1.6. Recovery / Mitigation Planning
As part of recovery / mitigation plan during fire season, a study was conducted to identify the recurrence fire zonemap of Rajiv Gandhi National park using satellite data. The study also investigates about, whether the existingwatchtowers are adequate for their mitigation planning or not? Towards this, forest fire recurrence and visibilityanalysis were done and are shown in Figure 16.19 & 20, respectively.
The study has identified the necessity of an additional fire watch tower and its location for monitoring the recurrentfire areas. New locations were suggested based on visibility range identified using canopy heights, terrain heightsand forest canopy density.
16.4. Conclusion and Future Aspect
The only effective way to minimize damage caused by forest fires is their early detection and fast reaction, apartfrom preventive measures. Great efforts are therefore made to achieve early forest fire detection, which is traditionallybased on human surveillance. Technically more advanced forest fire surveillance systems is based on videocamera monitoring units mounted on monitoring spots and distant monitoring from operation center in conjunctionwith satellite monitoring. Infrared and laser-based systems are more sensitive and they generate less false alarms,but their price is quite high in comparison to video (CCD) cameras sensitive in visible spectra. For example theprice of one typical high quality outdoor pan/tilt CCD camera is 3.000 EUR, and the price of one typical IR thermalimaging camera is 25,000 EUR. Additional feature of CCD video cameras which are today on the market is theirdual sensitivity. They are color cameras sensitive in visible spectra during the day, and black and white camerassensitive in near IR spectra during the night.
The terrestrial systems based on CCD video cameras sensitive in visible and near IR spectra are today the bestand the most effective solution for realizing automatic surveillance and automatic forest fire detection systems. Inalmost every country, which encounters high risk of forest fires, at least one such system are developed orproposed. Some of them are on the market under various commercial names like FireWatch (Germany), FireHawk(South Africa), ForestWatch (Canada), FireVu (England), UraFire (France) etc. In all those systems automaticforest fire detection is based on smoke recognition during the day and flame recognition during the night.
Figure 16.18: Final Fire Danger Index map of Nagarjunasagar SrisailamTiger Reserve

374
With the advent of series of satellites onboard, it is possible to monitor the fires to a minimum of 5 times in a day,facilitating to monitor large episodic fires. In India, with the current capabilities of data processing and datadissemination, it is possible to generate fire signals within one hour of satellite pass. Presently INFFRAS provideone day time (MODIS-Terra/Aqua) and one night time (DMSP-OLS) fire alarm to all the State Forest Departmentthrough electronic mail (available in NRSC web site also). In our country, fire watching from ground has also tobe strengthened and equipped with sophisticated instrument/system so that mitigation will be done in moreeffective way.
A new Geostationary Meteorological Satellite INSAT-3D is being designed by ISRO with the capability for firedetection/characterization. Preliminary plans include fire product generation and distribution (GOFC-GOLDReport No 32, October 2007). It will have a six channel advanced imager and a nineteen channel sounder. Inaddition to satellite imageries in six channels, several new derived products useful in NWP and in day-to-dayweather forecasting will be available in the new system. Vertical profiles of atmospheric temperature, moistureand ozone will be available for the first time from an Indian Satellite.
Since, on orbit no of satellites with different sensors are available, it is very important that data pre-processingsteps need to be fully characterized. Data fusion of different products types (e.g., burned area and active fire)and between different sensors (polar orbiting and geostationary) needs to be explored.
The quality and consistency of the different geostationary imagers with regard to fire detection and fire characterizationneeds to be examined. We need to improve communication between data providers and product developers,especially in light of the new instruments becoming operational. Image generation processes should be clearlydocumented and accessible to product developers, and ideally the applications of active fire detection andcharacterization should be taken into account when developing new generation sensors (e.g., in terms of dynamicrange) and pre-processing procedures (e.g., geolocation and re-gridding).
Figure 16.19: Forest fire recurrent analysis Figure 16.20: Existing watch towers visibility map

375
References
Andreae MO, Fishman J, Garstang M, Goldammer JG, Justice CO, Levine JS, Scholes RJ, Stocks BJ and Thompson AM,1994, Biomass burning in the global environment: first results from the IGAC/BIBEX Field Campaign STARE/TRACE-A/SAFARI-92, Global Atmospheric-Biospheric Chemistry, Ed. Prinn R, Plenum Press, New York, 83-101.
Andreae MO and P Merlet, 2001 ,Emissions of trace gases and aerosols from biomass burning, Global Biogeochem.Cycles, 15, 955-966, 2001 aperture radars, Proceedings of Institution of Electrical Engineers F, 139: 147-159.
Arino O, Plummer S and Defrenne D, 2005, Fire disturbance: the ten years time series of the ATSR world fire atlas, H.Lacoste, Proceedings of the MERIS (A)ATSR Workshop 2005 (ESA SP-597).
Badrinath KVS, Kiran Chand TR and Krishna Prasad V, 2006, Agriculture crop residue burning in the Indo-gangetic plains– A study using IRS P6 AWiFS satellite data, Current Science, 91(8): 1085-1089.
Bjorn Larsen, Guy Hutton and Neha Khanna, 2008, Copenhagen Consensus 2008 Challenge Paper on Air Pollution,Copenhagen.
Boyd M, Harnden P, Michael Maher and Gregory AM, 1973, Forest Fire Detection Systems Design Management Science.Application Series, Part 2, Management Science in Canada, 20(4): 617-628.
Breejen E, breuers M, Cremer F, Kemp R, Roos M, Schutte K and Vries J, 1998, Autonomous forest fire detection. In Proc.of Third International Conference on Forest Fire Research and Fourteenth Conference on Fire and ForestMeteorology, Luso, Portugal, 2003–2012.
Carmona-Moreno C, Belward A, Malingreau JP, Hartley A, Garcia-Alegre M, Antonovskiy M, Buchshtaber V and PivovarovV,2005, Characterizing interannual variations in global fire calendar using data from Earth observing satellites,Global Change Biology, 11: 1537–1555.
Casanova JL, Calle A, Romo A, Sanz J, 2004, Forest Fire Detection and Monitoring By Menas of an Integrated MODIS-MSG SYSTEM, Satellite-based fire monitoring network in Northern Eurasia: Methods, Data Products, Applications.Moscow, Space Research Institute, 409-415.
Castro R and Chuveico E, 1998, Modeling Forest Fire Danger from Geographic Information Systems, GeocartoInternational, 13(1): 15-23.
Chuvieco E and Congalton RG, 1989, Application of remote sensing and geographic information systems to forest firehazard mapping, Remote Sensing of Environment, 29: 147-159.
Cochran J, 2007, Sparrow Systems, Automated radio telemetry system initiative, Retrieved from: http://www.princeton.edu/~wikelski/research/physiology.htm, Accessed on Oct, 20th 2007.
Croft TA, 1973, Burning waste gas in oil fields. Nature, 245: 375-376.
Croft TA, 1978, Night time images of the earth from space, Scientific American, 239: 68-79.
Croft TA 1979, The brightness of lights on Earth at night, digitally recorded by DMSP satellite. Stanford Research InstituteFinal report prepared for the US Geological Suevey , p 57.
Crossbow INC. Web page. http://www.xbow.com/.
Delmas R, Lacaux JP and Brocard D, 1995, Determination of biomass burning emission factors: Methods and results,Environmental Monitoring and Assessment, 38: 181-204.
Dennisa A, Fraserb M, Andersonc S and Allena D, 2002, Air pollutant emissions associated with forest, grassland, andagricultural burning in Texas, Atmospheric Environment, 36: 3779–3792.
Doolin DM and Sitar N, 2005, Wireless sensors for wildfire monitoring, In Proc. of SPIE Symposium on Smart Structuresand Materials. San Diego, CA, 477–484.
Dwyer E, Pereira JMC, Gregoire JM and DaCamara CC, 200a, Characterization of the spatio-temporal patterns of globalfire activity using satellite imagery for the period April 1992 to March 1993, Journal of Biogeography, 27: 57–69.
Dwyer E, Pinnock S, Gregoire JM and Pereira JMC, 200b, Global spatial and temporal distribution of vegetation fire asdetermined from satellite observations, International Journal of Remote Sensing, 21: 1289–1302.
Ertena E, Kurgunb V and Musaoglu N, 2002, Forest Fire Risk Zone Mapping From Satellite Imagery And GIS: A CaseStudy, International Journal of Applied Earth Observation and Geoinformation, 4: 1-10.
Evidencia, ThermAssure RF,2007, Retrieved from: http://www.evidencia.biz/products/ prototemp_pr.htm/ThermAssureRF.htm, accessed on 20th 2007.

376
Filizzola C, Marchese F, Mazzeo G, Pergola N and Tramutoli V, 2007, Robust satellite techniques (RST) for forest fireDetection Geophysical Research Abstracts, 9, 06506.
Fleming J and robertson RG, 2003, FireManagement Tech Tips: The Osborne Fire Finder, Tech. Rep. 0351 1311-SDTDC,USDA Forest Service, October.
Forest Survey of India (FSI), 1988, State Forest Report –Ministry of Environment and Forests, Dehradun.
Fornaro R, Coblentz D, Hawkins D, Lewis J and Noffsinger B, 2005, NEAT-Networks for Endangered Animal Tracking,Computer Society International Design Competition, Final Report.
Fujiwara K, Kushida K, Fukuda M and Kudoh J, 2002, Forest fire detection in far east Russian region with NOAA AVHRRimages, Geosciences and Remote Sensing Symposium, 2002, IGARSS ’02. 2002, IEEE International, 4: 2054-2056.
GCOS-107, 2006, Systematic Observation Requirements for Satellite-based Products for Climate – Supplemental detailsto the satellite-based component of the Implementation Plan for the Global Observing System for Climate inSupport of the UNFCCC, prog/gcos/Publications/gcos-107.pdf, Accessed on 14 September 2007.
Giglio L, Descloitres J, Justice CO and Kaufman YJ, 2003, An enhanced contextual fire detection algorithm for MODIS,Remote Sensing Environment, 87: 273–282.
Giglio L, van der Werf GR, Randerson JT, Collatz GJ and Kasibhatla P, 2006, Global estimation of burned area usingMODIS active fire observations, Atmospheric Chemestry & Physics, 6: 957–974.
Guttikunda S, Wells GJ, Johnson TM, Artaxo P, Bond TC, Russell AG, Watson JG and West J, 2008, Source apportionmentof urban particulate matter for air quality management: Review of techniques and applications in developingcountries. Prepared by World Bank, Washington DC.
Hefeeda M, 2007, Forest Fire Modeling and Early Detection using Wireless Sensor Networks, Technical Report TR 2007-08, School of Computing Science, Simon Fraser University.
International Forest Fire News (IFFN), 2004, 31:140 - 141.
Jun Wang and Christopher SA, 2003, Intercomparison between satellite- derived aerosol optical thickness and PM2.5mass: Implications for air quality studies, Geophysical Research Letter, 30 (21): doi:10.1029/2003GL018174.
Justice CO, Giglio L, Korontzi S, Owens J, Morisette JT, Roy D, Descloitres J, Alleaume S, Petitcolin F and Kaufman Y,2002, The MODIS fire products, Remote Sensing of Environment, 83: 244–262.
Kahn LH, 2007, Animals: The world’s best (and cheapest) biosensors, The Bulletin Online 14 March 2007, Retrievedfrom : http://www.thebulletin.org/columns/laura-kahn/20070314.html, Accessed on Nov, 13, 2007.
Kaufman YJ, Ichoku C, Giglio L, Korntzi S, Chu DA, Hao WM, LiR R and Justice CO, 2003, Fire and smoke observed fromEarth Observing System MODIS instrument products, validation and operational use, International Journal OfRemote Sensing, 24 (8): 1765-81.
Khrt E, knollenberg J and Mertens V, 2001, An automatic early warning system for forest fires, Annals of Burns and FireDisasters, 14, 3.
Lafarge F, Descombes X, Zerubia J, 2007, Forest Fire Detection based on Gaussian field analysis, Proc. EuropeanSignal Processing Conference (EUSIPCO), Poznan, Poland.
Le Page Y, Pereira JMC, Trigo R, da Camara C, Oom D, and Mota B, Global fire activity patterns (1996–2006) and climaticinfluence: an analysis using the World Fire Atlas, Atmospheric Chemistry & Physics Discussion, 7: 17299–17338,2007.
Lee GY, Lee DE, Jeong CK, 2007, Bio-adhoc sensor networks for early disaster warning, IEICE Transaction OnCommunications, 5: 1241-1244.
Lotek Corp, 2002, Retrieved from http://www.lotek.com, Accessed on Nov, 13th 2007.
Luigi Boschetti, David Roy, Paulo Barbosa, Roberto Boca and Chris Justice, 2008, A MODIS assessment of the summer2007 extent burned in Greece, International Journal of Remote Sensing, 29(8): 2433–2436.
Nakau K, Fukuda M, Kushida K, Hayasaka H, Kimura K, Tani H, 2006, Forest fire detection based on MODIS satelliteimagery, and Comparison of NOAA satellite imagery with fire fighters’ Information, IARC/JAXA Terrestrial TeamWorkshop, 18-23.
Negi SS, 1986, A handbook of Forestry, International Book Distributors, Dehradun, India.
Ollero A, 1998, Martinez-De Dios, J-R.; ARRÚE, B.C. Integrated Systems For Early Forest-Fire Detection. III International

377
Conference on Forest Fire Research 14th Conference on Fire and Forest Meteorology, Luso, 16/20 November1998, VOL II, 1977-1988.
Patah NA, Mansor S and Mispan MR, An application of remote sensing and geographic information system for forest firerisk mapping, Malaysian Centre for Remote Sensing (MACRES).
Reddy BVS, Reddy SP, Bidinger F and Blummel M, 2003, Crop management factors influencing yield and quality of cropresidues, Fields Crop Research, 84 : 57–77.
Ria˜no D, Ruiz JAM, Isidoro D and Ustin SL, 2007, Global spatial patterns and temporal trends of burned area between1981 and 2000 using NOAA-NASA Pathfinder, Glob. Change Biol., 13, 40–50, 2007.
Roberto Castro and Chuvieco E, 1998, Modeling forest fire danger from geographic information systems, GeocartoInternational, 13(1) :15-23.
Rodriguez E and Martin JM, 1992, Theory and design of interferometric synthetic. Proceedings of IKE, 139(2): 147-159.
Roy DP, Boschetti L, Justice CO, Ju J, 2008, The collection 5 MODIS burned area product — Global evaluation bycomparison with the MODIS active fire product. Remote Sensing of Environment, 112 :3690–3707.
Roy PS, 2003, Forest fire and degradation assessment using satellite remote sensing and Geographic InformationSystem, Satellite Remote Sensing and GIS Applications in Agricultural Meteorology, Proceedings of a TrainingWorkshop, Dehra Dun, India, 361-400.
Stipanièev D, Vuko T, Krstiniæ D, Štula M and Bodro•iæ L, 2006, Forest Fire Protection by Advanced Video DetectionSystem - Croatian Experiences, Third TIEMS Workshop - Improvement of Disaster Management System, Trogir.
Streets DG, Yarber KF, Woo JH and Carmichael GR, 2003, Biomass burning in Asia: annual and seasonal estimates andatmospheric emissions.Global Biogeochemical Cycles, 17(4), doi:10.1029/2003GB002040.
Toreyin BU, Dedeoglu Y, Cetin AN, 2007,Computer vision based forest fire detection and monitoring system, 4thInternational Wildland Fire Conference, Seville.
UNEP, 2007, UNEP Assists ASEAN Countries to Combat Forest Fires, Retrieved from : http://www.rrcap.unep.org/projects/forestfires.cfm, Accessed on 20th October, 2007.
Wei Min Hao J, Meghan Salmon and Bryce Nordgren, 2003. Development of A Forest Fire Smoke Emission and Dispersion
Model Using Real-time MODIS Data USFS Rocky Mountain Research Station, Missoula Fire Sciences Laboratory.Paper presented at the workshop on “ innovatrive methods for emission inventory development & evaluation”
held at Pickle Research Centre, University of Texas, Austin, TX, USA.
XU Dong , DAI Li-min, SHAO Guo-fan, TANG Lei, WANG Hui:, ~2005, Forest fire risk zone mapping from satellite imagesand GIS for Baihe Forestry Bureau, Jilin, China, Journal of Forestry Research, 16(3): 169-174.
Yasar Guneri Sahin, 2007, Animals as Mobile Biological Sensors for Forest Fire Detection, Sensors, 7: 3084-3099.
Yeung J, 2007, Animals to be used as quake sensors (China Daily), Retrieved from : http://english.peopledaily.com.cn/200705/22/eng20070522_376760.html, Accessed on Oct, 20th, 2007.
Young Gi Byun, Yong Huh, Kiyun Yu and Yong Il Kim, 2005, Evaluation of Graph-based Analysis for Forest Fire DetectionsProceedings of world academy of science, engineering and technology,10 .
Zhukov B, Oertel D, Lorenz E, Ziman Ya and I Csiszar - Comparison of fire detection and quantitative Characterisation byMODIS and BIRD.
http://www.nofc.forestry.ca/fire,Canadian Forest Fire Danger Rating System (Cffdrs) Web Page
http://www.aerovision-uav.com., Aerovision Web page.
http://www.cccturtle.org/satellitetracking.php? page=satintro, Accessed on Nov, 13th 2007,Caribbean ConservationCorporation & Sea Turtle Survival League, How Tracking Sea Turtles by Satellite Works, Retrieved from
http://www.fire-watch.de/.Fire watch web page.
http://www.fesb.hr/~ljiljana/radovi/279548, TIEMS-Stipanicev_i_ostali.pdf, Forest Fire Protection by Advanced Video
Detection System, Croatian Experiences, Darko Stipaniev, Tomislav Vuko, Damir Krstini, Maja Štula, Ljiljana Bodro
Related Documents