STATS RE/MAX is #1 in U.S. market share. Nobody sells more real estate than RE/MAX. ©2013 RE/MAX, LLC. Each RE/MAX office independently owned and operated. Except as noted, Coldwell Banker, Century 21, ERA, Sotheby’s and Better Homes and Gardens data is as reported by Realogy Corporation on SEC Form 10-K, Annual Report for 2012; Keller Williams and Prudential data is from information available at kw.com and prudentialrealestate.com, respectively. 1 Full-year 2012. 2 Experian Marketing Services Hitwise data, full-year 2012. 3 Full-year 2012 U.S. national-media ad spend, as a percentage of spend of all national real estate franchises, as reported by Nielsen Ad Views. Others: 5.7%. 4 As of year-end 2012 unless noted. 5 Based on lists of countries claimed at each franchisor website as of March 2013, excluding claimed locations that are not independent countries (i.e. territories, etc.). 6 Based on agent roster count at kw.com as of 2/13/13. 130229 RE/MAX vs. the industry 2013 U.S. RESIDENTIAL TRANSACTION SIDES 1 TOTAL U.S. WEBSITE VISITS 2 (Millions) U.S. NATIONAL ADVERTISING 3 COUNTRIES 4 OFFICES WORLDWIDE 4 AGENTS WORLDWIDE 4 828,960 52.47 32.8% 89 6,331 89,008 663,826 28.23 24.0% 44 5 3,100 82,200 390,391 41.07 20.1% 61 5 7,060 100,300 107,775 2.42 0.2% 33 5 2,322 31,000 64,515 2.57 6.5% 35 5 659 12,900 40,810 2.44 2.0% 2 5 252 8,300 Not released 23.55 1.8% 5 700 76,662 6 Not released 5.57 6.8% 3 1,500 50,000

Welcome message from author
This document is posted to help you gain knowledge. Please leave a comment to let me know what you think about it! Share it to your friends and learn new things together.
Transcript
STA
TS
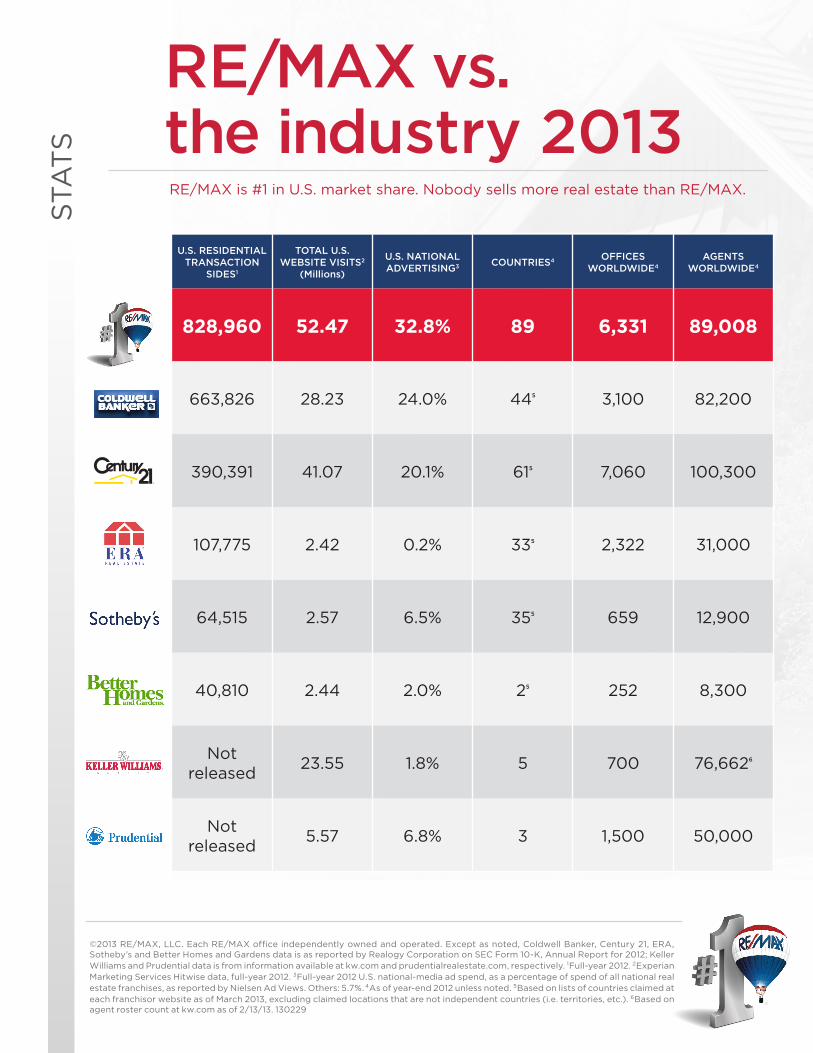
RE/MAX is #1 in U.S. market share. Nobody sells more real estate than RE/MAX.
©2013 RE/MAX, LLC. Each RE/MAX office independently owned and operated. Except as noted, Coldwell Banker, Century 21, ERA, Sotheby’s and Better Homes and Gardens data is as reported by Realogy Corporation on SEC Form 10-K, Annual Report for 2012; Keller Williams and Prudential data is from information available at kw.com and prudentialrealestate.com, respectively. 1Full-year 2012. 2Experian Marketing Services Hitwise data, full-year 2012. 3Full-year 2012 U.S. national-media ad spend, as a percentage of spend of all national real estate franchises, as reported by Nielsen Ad Views. Others: 5.7%. 4As of year-end 2012 unless noted. 5Based on lists of countries claimed at each franchisor website as of March 2013, excluding claimed locations that are not independent countries (i.e. territories, etc.). 6Based on agent roster count at kw.com as of 2/13/13. 130229
RE/MAX vs. the industry 2013
U.S. RESIDENTIAL TRANSACTION
SIDES1
TOTAL U.S. WEBSITE VISITS2
(Millions)
U.S. NATIONAL ADVERTISING3 COUNTRIES4 OFFICES
WORLDWIDE4
AGENTSWORLDWIDE4
828,960 52.47 32.8% 89 6,331 89,008
663,826 28.23 24.0% 445 3,100 82,200
390,391 41.07 20.1% 615 7,060 100,300
107,775 2.42 0.2% 335 2,322 31,000
64,515 2.57 6.5% 355 659 12,900
40,810 2.44 2.0% 25 252 8,300
Not released
23.55 1.8% 5 700 76,6626
Not released
5.57 6.8% 3 1,500 50,000
Related Documents