REmap 2030: 2016 edition DRAFT RESULTS Abu Dhabi, 17 January, 2016

Welcome message from author
This document is posted to help you gain knowledge. Please leave a comment to let me know what you think about it! Share it to your friends and learn new things together.
Transcript

REmap 2030: 2016 edition
DRAFT RESULTS
Abu Dhabi, 17 January, 2016
Three sections:
• Discuss the role of renewables within the larger context of
energy and climate issues, summarize progress 2013-2015
• Investigate the gap towards a doubling; summarize new
findings to 2030 country, sector, technology outlook
• Formulate concrete new recommendations how to
accelerate RE deployment for a doubling (12 Solutions)
Discuss consequences of the findings for global and
IRENA RE agenda for the coming years
2
Content and objectives of this report

• Recognize there is no single scenario/solution, and
uncertainties should be elaborated further
• Model for insights, not for numbers: highlight
underestimated technology options, and importance of
sector and system thinking
• Need for general policy guidelines that are directly
applicable on a country level, practical recommendations
• Focus REmap more on innovation and technology
• Include an outlook to 2050
• Strengthen the climate angle
3
Country feedback
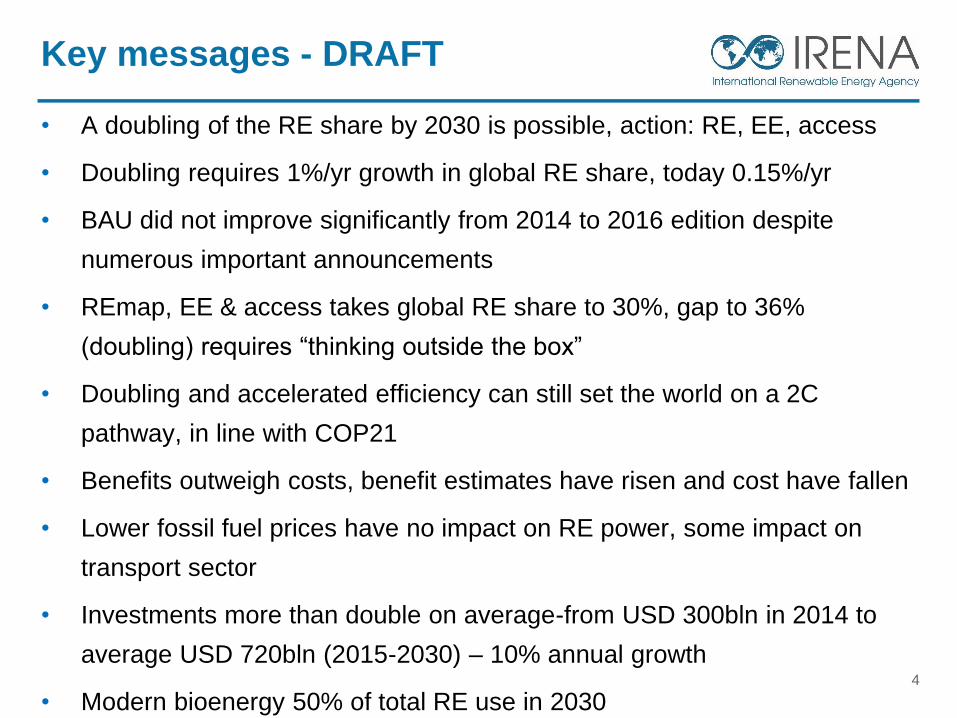
• A doubling of the RE share by 2030 is possible, action: RE, EE, access
• Doubling requires 1%/yr growth in global RE share, today 0.15%/yr
• BAU did not improve significantly from 2014 to 2016 edition despite
numerous important announcements
• REmap, EE & access takes global RE share to 30%, gap to 36%
(doubling) requires “thinking outside the box”
• Doubling and accelerated efficiency can still set the world on a 2C
pathway, in line with COP21
• Benefits outweigh costs, benefit estimates have risen and cost have fallen
• Lower fossil fuel prices have no impact on RE power, some impact on
transport sector
• Investments more than double on average-from USD 300bln in 2014 to
average USD 720bln (2015-2030) – 10% annual growth
• Modern bioenergy 50% of total RE use in 20304
Key messages - DRAFT
5
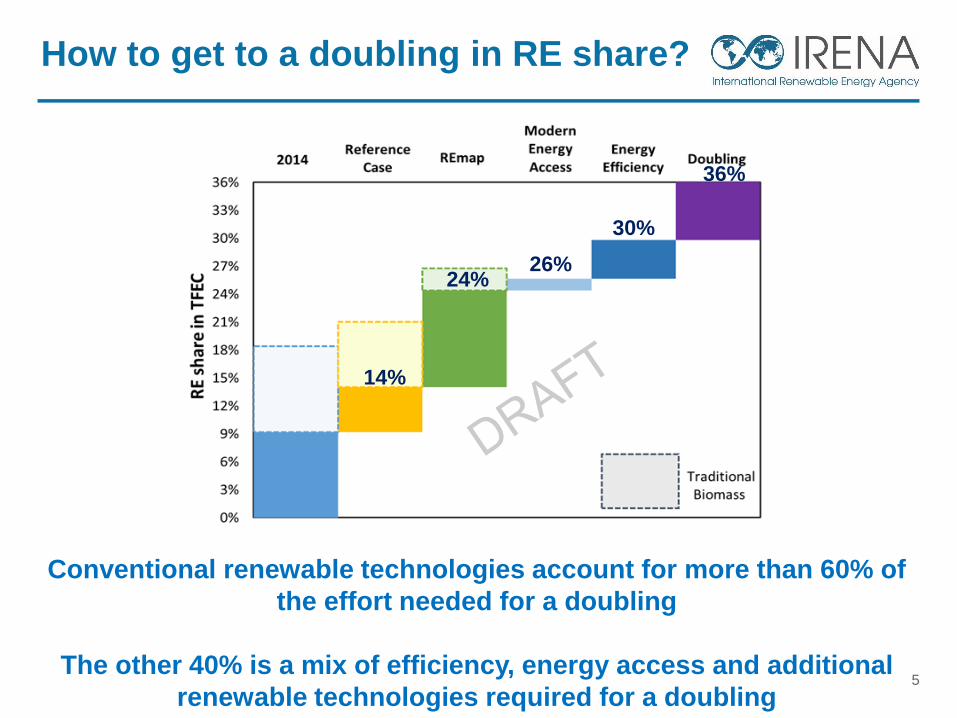
How to get to a doubling in RE share?
Conventional renewable technologies account for more than 60% of
the effort needed for a doubling
The other 40% is a mix of efficiency, energy access and additional
renewable technologies required for a doubling
14%
24%26%
30%
36%
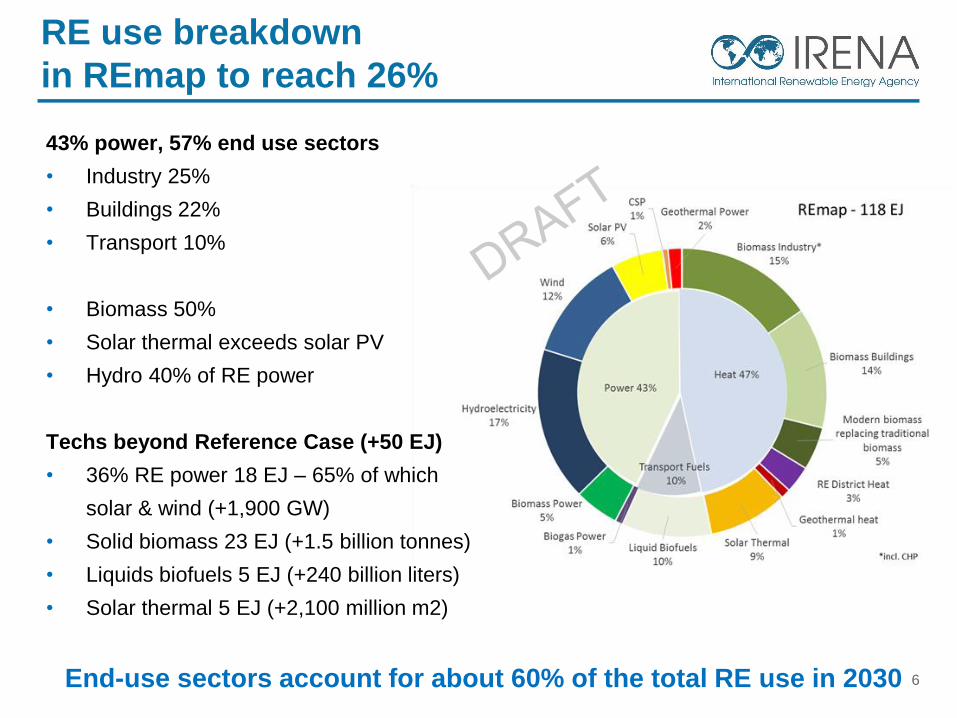
43% power, 57% end use sectors
• Industry 25%
• Buildings 22%
• Transport 10%
• Biomass 50%
• Solar thermal exceeds solar PV
• Hydro 40% of RE power
Techs beyond Reference Case (+50 EJ)
• 36% RE power 18 EJ – 65% of which
solar & wind (+1,900 GW)
• Solid biomass 23 EJ (+1.5 billion tonnes)
• Liquids biofuels 5 EJ (+240 billion liters)
• Solar thermal 5 EJ (+2,100 million m2)
6
RE use breakdown
in REmap to reach 26%
End-use sectors account for about 60% of the total RE use in 2030
7
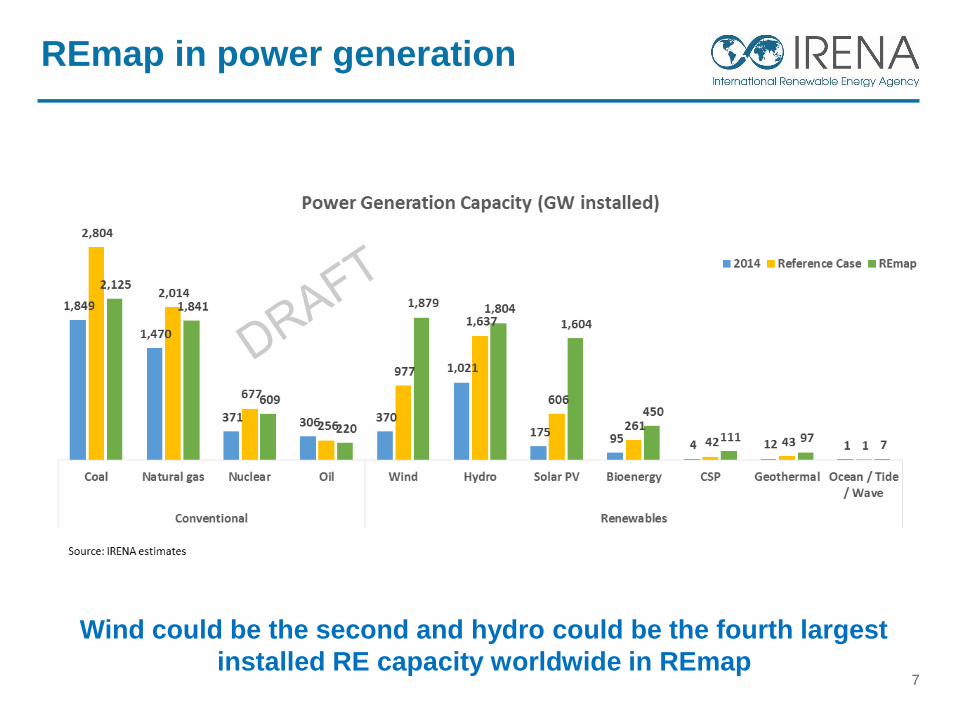
REmap in power generation
Wind could be the second and hydro could be the fourth largest
installed RE capacity worldwide in REmap
8
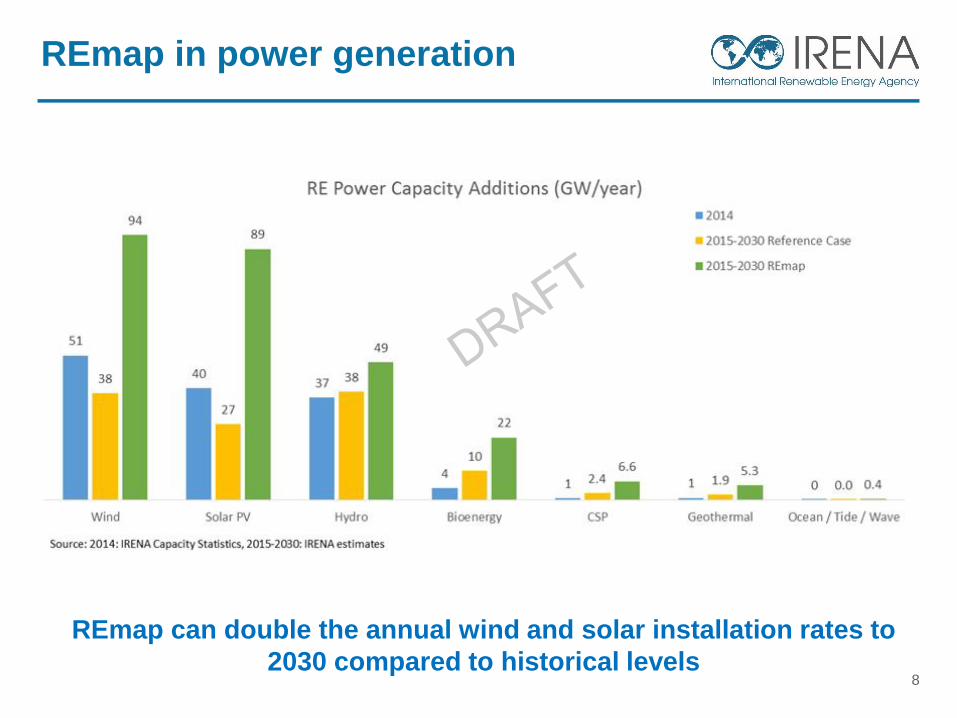
REmap can double the annual wind and solar installation rates to
2030 compared to historical levels
REmap in power generation
9
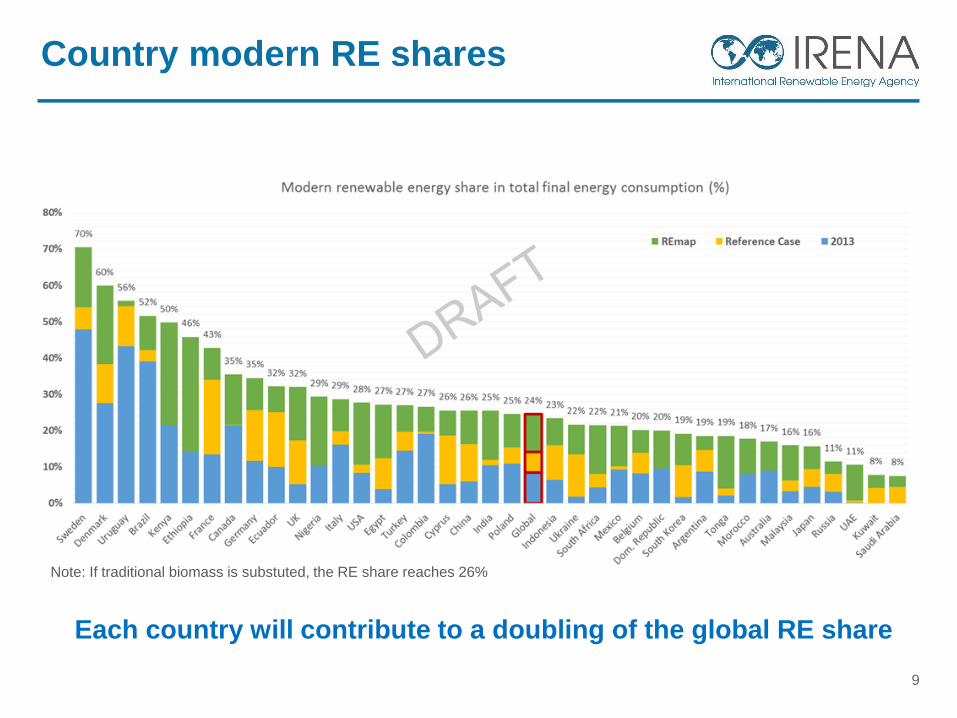
Country modern RE shares
Each country will contribute to a doubling of the global RE share
Note: If traditional biomass is substuted, the RE share reaches 26%
10
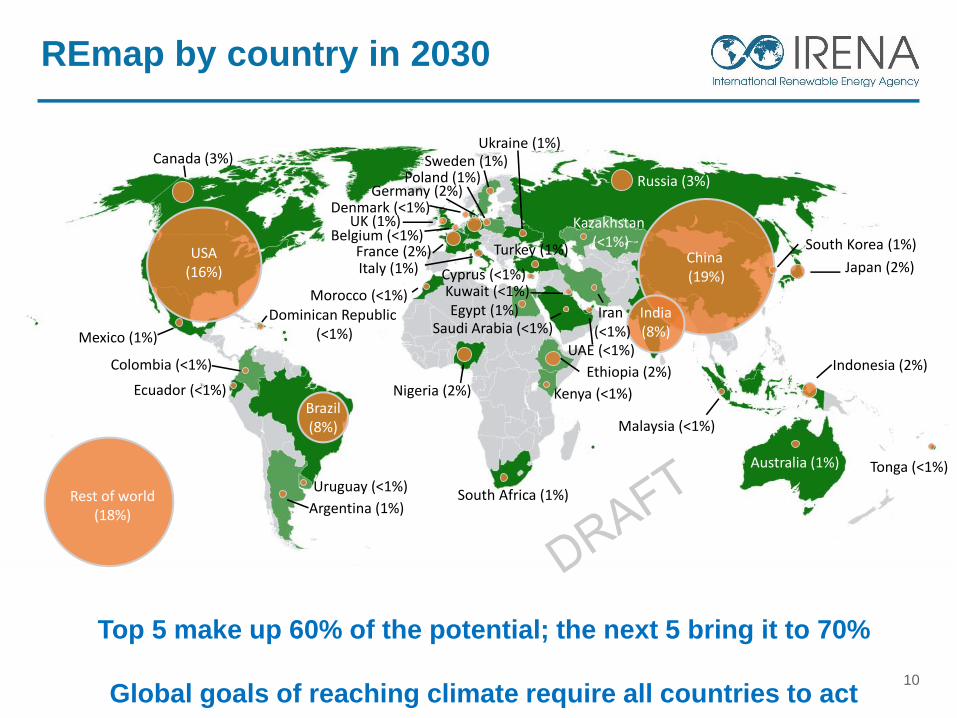
REmap by country in 2030
Top 5 make up 60% of the potential; the next 5 bring it to 70%
Global goals of reaching climate require all countries to act
UK (1%)
China (19%)
USA(16%)
India(8%)
Brazil(8%)
Canada (3%)
Russia (3%)Germany (2%)
Indonesia (2%)
Nigeria (2%)Ethiopia (2%)
France (2%)Japan (2%)
Turkey (1%)
Mexico (1%)
Italy (1%)
South Korea (1%)
South Africa (1%)
Sweden (1%)
Australia (1%)
Ukraine (1%)
Argentina (1%)
Poland (1%)
Egypt (1%)
Malaysia (<1%)
Saudi Arabia (<1%)
Colombia (<1%)
Denmark (<1%)
UAE (<1%)
Belgium (<1%)
Kenya (<1%)
Tonga (<1%)
Dominican Republic (<1%)
Kuwait (<1%)
Uruguay (<1%)
Morocco (<1%)
Ecuador (<1%)
Kazakhstan (<1%)
Iran (<1%)
Rest of world(18%)
Cyprus (<1%)
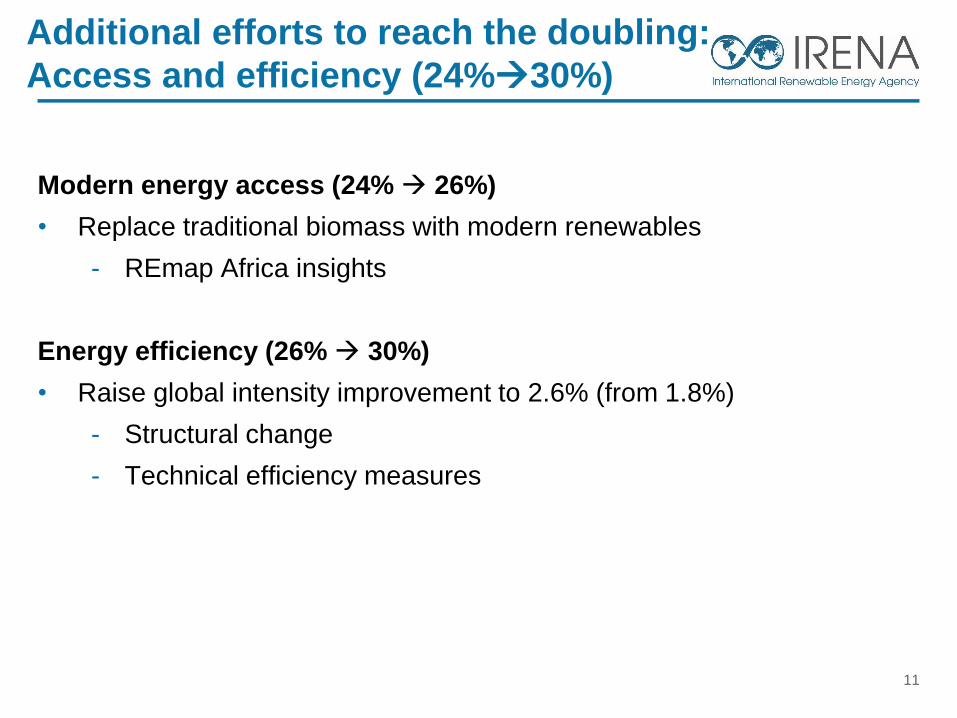
Modern energy access (24% 26%)
• Replace traditional biomass with modern renewables
- REmap Africa insights
Energy efficiency (26% 30%)
• Raise global intensity improvement to 2.6% (from 1.8%)
- Structural change
- Technical efficiency measures
11
Additional efforts to reach the doubling:
Access and efficiency (24%30%)
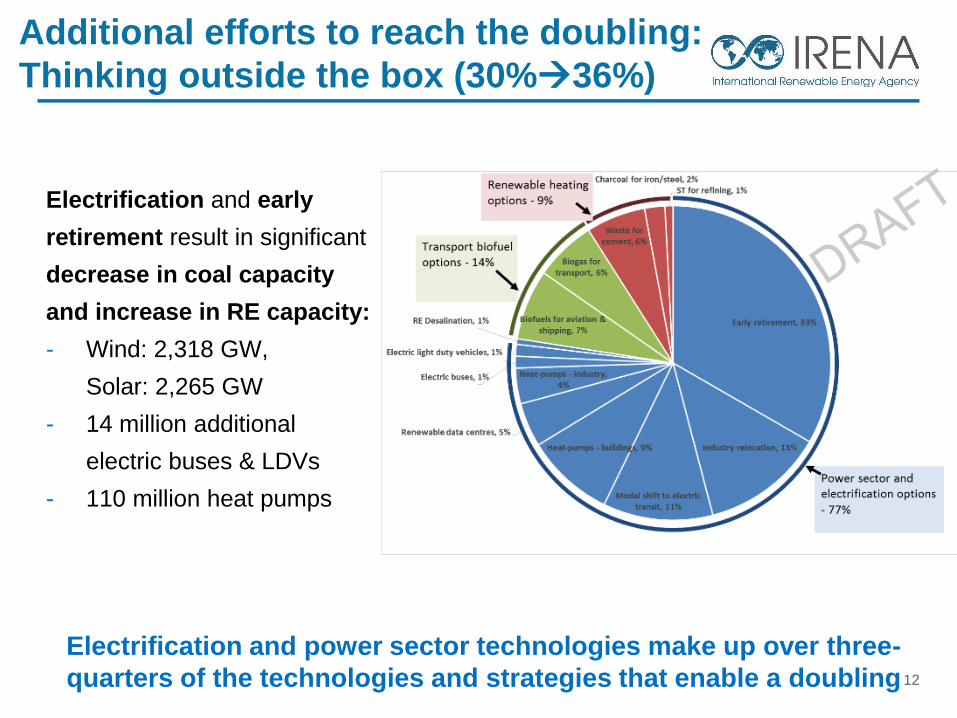
12
Electrification and power sector technologies make up over three-
quarters of the technologies and strategies that enable a doubling
Electrification and early
retirement result in significant
decrease in coal capacity
and increase in RE capacity:
- Wind: 2,318 GW,
Solar: 2,265 GW
- 14 million additional
electric buses & LDVs
- 110 million heat pumps
Additional efforts to reach the doubling:
Thinking outside the box (30%36%)
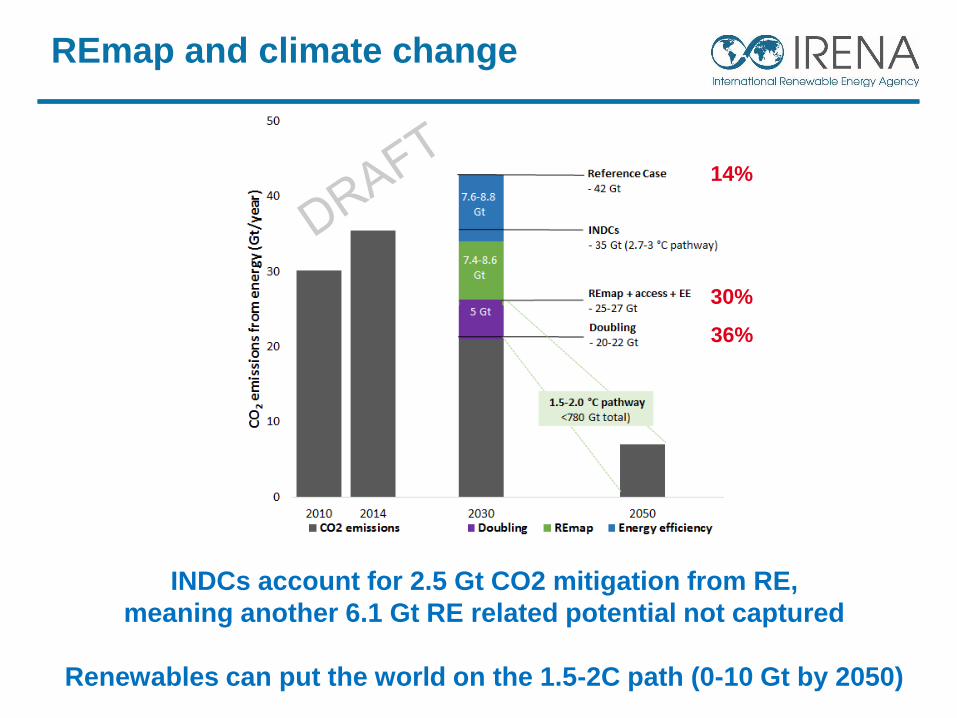
REmap and climate change
INDCs account for 2.5 Gt CO2 mitigation from RE,
meaning another 6.1 Gt RE related potential not captured
Renewables can put the world on the 1.5-2C path (0-10 Gt by 2050)
14%
30%
36%
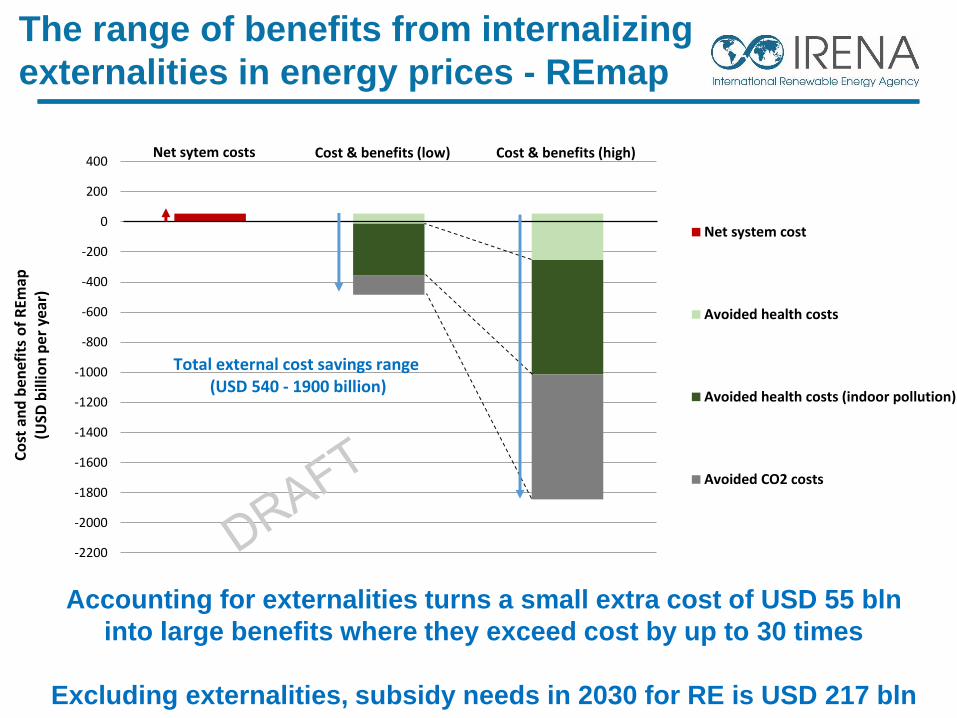
The range of benefits from internalizing
externalities in energy prices - REmap
Accounting for externalities turns a small extra cost of USD 55 bln
into large benefits where they exceed cost by up to 30 times
Excluding externalities, subsidy needs in 2030 for RE is USD 217 bln
-2200
-2000
-1800
-1600
-1400
-1200
-1000
-800
-600
-400
-200
0
200
400
Co
st a
nd
be
nef
its
of
REm
ap
(USD
bill
ion
pe
r ye
ar)
Net system cost
Avoided health costs
Avoided health costs (indoor pollution)
Avoided CO2 costs
Net sytem costs Cost & benefits (low)
Total external cost savings range (USD 540 - 1900 billion)
Cost & benefits (high)
Low
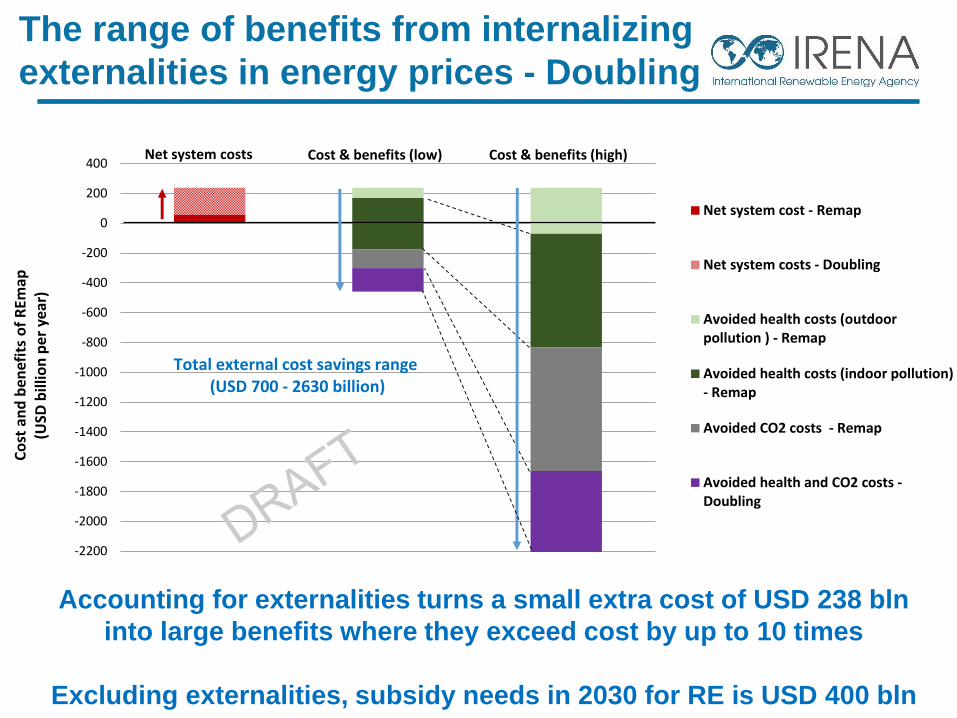
The range of benefits from internalizing
externalities in energy prices - Doubling
Accounting for externalities turns a small extra cost of USD 238 bln
into large benefits where they exceed cost by up to 10 times
Excluding externalities, subsidy needs in 2030 for RE is USD 400 bln
-2200
-2000
-1800
-1600
-1400
-1200
-1000
-800
-600
-400
-200
0
200
400
Co
st a
nd
be
nef
its
of
REm
ap
(USD
bill
ion
pe
r ye
ar)
Net system cost - Remap
Net system costs - Doubling
Avoided health costs (outdoorpollution ) - Remap
Avoided health costs (indoor pollution)- Remap
Avoided CO2 costs - Remap
Avoided health and CO2 costs -Doubling
Net system costs Cost & benefits (low)
Total external cost savings range (USD 700 - 2630 billion)
Cost & benefits (high)
Low
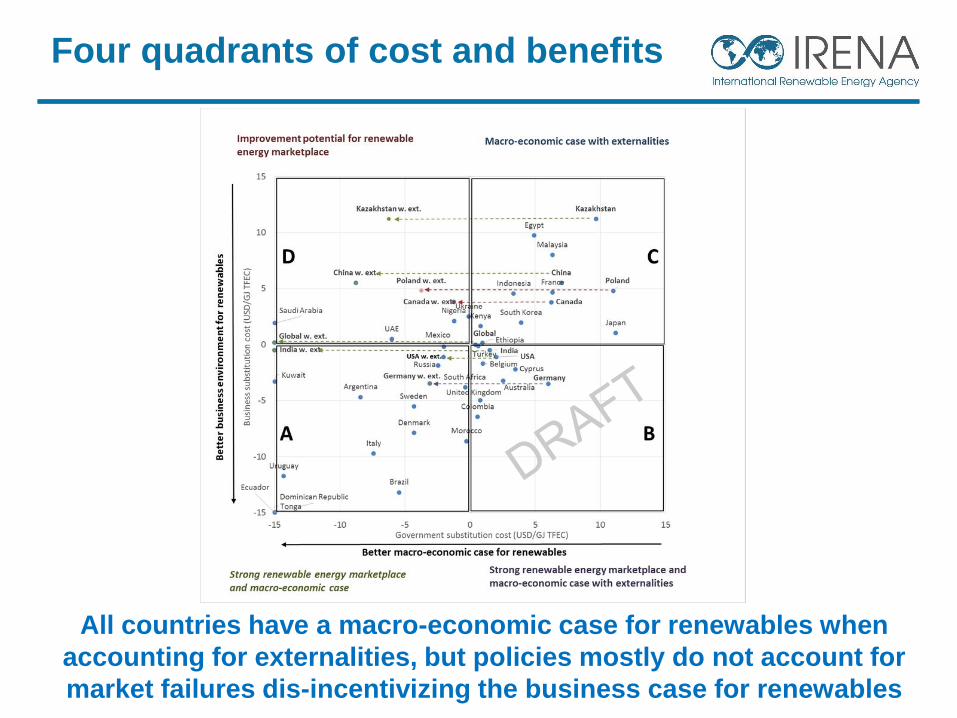
Four quadrants of cost and benefits
All countries have a macro-economic case for renewables when
accounting for externalities, but policies mostly do not account for
market failures dis-incentivizing the business case for renewables
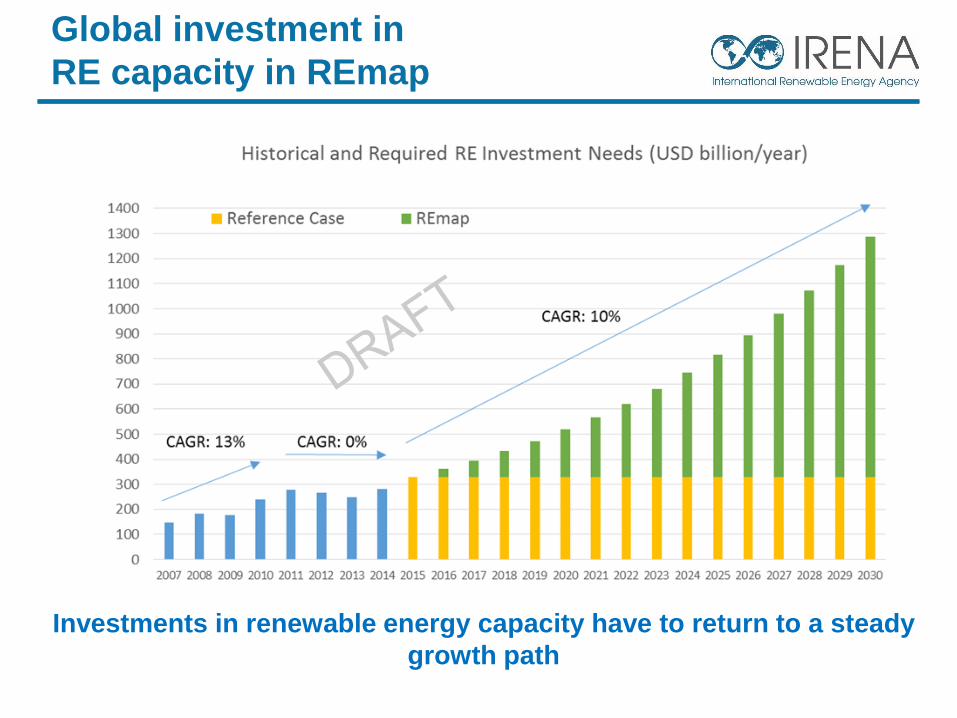
Global investment in
RE capacity in REmap
Investments in renewable energy capacity have to return to a steady
growth path

18
12 technology and innovation solutions
• Do the key findings miss any important issue, or any finding
that should be expanded upon / further clarified?
• Is the gap sufficiently presented, are the major technology
findings and benefits clear?
• 12 technology and innovation solutions are identified. Are
there other areas that need further attention from policy-
makers?
• Any general comments to the report presentation, findings,
figures, etc?
19
Questions for discussion
• 8 January, first-order draft for country review
• 17 January, final REmap country meeting in Abu Dhabi
• 21 January, feedback from countries received and
finalization of country analyses
• 25 January, new draft circulated for final review
• 17-18 March, launch at Berlin Energy Transition
Dialogue
• April-Summer, Multiple-country launches and other
events
Suggestions for outreach in your countries?20
Next steps and timeline for
completion and roll-out
Thank You
21
Related Documents