978-1-4577-0351-5/11/$26.00 c 2011 IEEE Relieving the Wireless Infrastructure: When Opportunistic Networks Meet Guaranteed Delays John Whitbeck 1,2 , Yoann Lopez 1 , J´ er´ emie Leguay 1 , Vania Conan 1 , and Marcelo Dias de Amorim 2 1 Thales Communications 2 CNRS and UPMC Sorbonne Universit´ es Abstract—Major wireless operators are nowadays facing net- work capacity issues in striving to meet the growing demands of mobile users. At the same time, 3G-enabled devices increasingly benefit from ad hoc radio connectivity (e.g., Wi-Fi). In this context of hybrid connectivity, we propose Push-and-track, a content dissemination framework that harnesses ad hoc communication opportunities to minimize the load on the wireless infrastructure while guaranteeing tight delivery delays. It achieves this through a control loop that collects user-sent acknowledgements to deter- mine if new copies need to be reinjected into the network through the 3G interface. Push-and-Track includes multiple strategies to determine how many copies of the content should be injected, when, and to whom. The short delay-tolerance of common content, such as news or road traffic updates, make them suitable for such a system. Based on a realistic large-scale vehicular dataset from the city of Bologna composed of more than 10,000 vehicles, we demonstrate that Push-and-Track consistently meets its delivery objectives while reducing the use of the 3G network by over 90%. I. I NTRODUCTION In December 2009, mobile data traffic surpassed voice on a global basis, and is expected to continue to double annually for the next five years [1], [2]. Every day, thousands of mobile devices – phones, tablets, cars, etc. – use the wireless infrastructure to retrieve content from Internet-based sources, creating immense demand on the limited spectrum of infrastructure networks, and therefore leading to deteriorating wireless quality for all subscribers as operators struggle to keep up [3]. In order to cool this surging demand, several US and European network operators have either announced or are considering the end of their unlimited 3G data plans [4], [5]. There are limits however to how much can be achieved by increasing infrastructure capacity or designing better client incentives. Solving the problem of excessive load on infras- tructure networks will require paradigm-altering approaches. In particular, when many users are interested in the same content, how can one leverage the multiple ad hoc networking interfaces (e.g., Wi-Fi or Bluetooth) ubiquitous on today’s mobile devices in order to assist the infrastructure in disseminating the content? Subscribers may either form a significant subset of all users, comprising for example all those interested in the digital edition of a particular newspaper, or may include all users in a given area, for example vehicles receiving periodic traffic updates in a city. In this paper, we address the following question: how can one relieve the wireless infrastructure using opportunistic networks while guaranteeing 100% delivery ratio under tight delay 3G 3G (a) (b) ack Fig. 1. Combining multiple strategies for full data dissemination. Left figure (a) shows the infrastructure-only mode, where the 3G interface is used to send copies of the data to all nodes. In (b), we show the Push-and-Track approach, where opportunistic ad hoc communication is preferred whenever possible. Although acknowledgments are required to keep the loop closed, the global infrastructure load will be significantly reduced. constraints? In particular, we seek to minimize the infrastructure load while massively distributing content within a short time to a large number of subscribers. We propose Push-and-Track, a framework that harnesses both wide-area radios (e.g., 3G or WiMax) and local-area radios (e.g., Bluetooth or Wi-Fi) in order to achieve guaranteed delivery in an opportunistic network while relieving the infrastructure. Our approach is detailed in Fig. 1. A subset of users will receive the content from the infrastructure and start propagating it epidemically; upon receiving the content, nodes send acknowledgments back to the source thus allowing it to keep track of the delivered content and assess the opportunity of reinjecting copies. The main feature of Push-and-Track is the closed control loop that supervises the reinjection of copies of the content via the infrastructure whenever it estimates that the ad hoc mode alone will fail to achieve full dissemination within some target delay. To the best of our knowledge, our work is the first to explore this idea. Unlike accessing an operator’s wireless infrastructure, op- portunistic forwarding, using short-range ad hoc radio, is essentially free and costs little more than expended battery life. This may not even be a concern in certain circumstances (e.g., vehicular). Unfortunately, it does not provide any guarantees as it depends entirely on the uncontrolled mobility of users. To this end, we evaluate several reinjection strategies. Push- and-Track splits the problem into how many copies of the content should be injected into the network, when, and to arXiv:1007.5459v3 [cs.NI] 30 May 2011

Welcome message from author
This document is posted to help you gain knowledge. Please leave a comment to let me know what you think about it! Share it to your friends and learn new things together.
Transcript

978-1-4577-0351-5/11/$26.00 c©2011 IEEE
Relieving the Wireless Infrastructure: WhenOpportunistic Networks Meet Guaranteed Delays
John Whitbeck1,2, Yoann Lopez1, Jeremie Leguay1, Vania Conan1, and Marcelo Dias de Amorim2
1 Thales Communications 2 CNRS and UPMC Sorbonne Universites
Abstract—Major wireless operators are nowadays facing net-work capacity issues in striving to meet the growing demands ofmobile users. At the same time, 3G-enabled devices increasinglybenefit from ad hoc radio connectivity (e.g., Wi-Fi). In this contextof hybrid connectivity, we propose Push-and-track, a contentdissemination framework that harnesses ad hoc communicationopportunities to minimize the load on the wireless infrastructurewhile guaranteeing tight delivery delays. It achieves this througha control loop that collects user-sent acknowledgements to deter-mine if new copies need to be reinjected into the network throughthe 3G interface. Push-and-Track includes multiple strategies todetermine how many copies of the content should be injected,when, and to whom. The short delay-tolerance of common content,such as news or road traffic updates, make them suitable for sucha system. Based on a realistic large-scale vehicular dataset fromthe city of Bologna composed of more than 10,000 vehicles, wedemonstrate that Push-and-Track consistently meets its deliveryobjectives while reducing the use of the 3G network by over 90%.
I. INTRODUCTION
In December 2009, mobile data traffic surpassed voiceon a global basis, and is expected to continue to doubleannually for the next five years [1], [2]. Every day, thousandsof mobile devices – phones, tablets, cars, etc. – use thewireless infrastructure to retrieve content from Internet-basedsources, creating immense demand on the limited spectrum ofinfrastructure networks, and therefore leading to deterioratingwireless quality for all subscribers as operators struggle tokeep up [3]. In order to cool this surging demand, several USand European network operators have either announced or areconsidering the end of their unlimited 3G data plans [4], [5].
There are limits however to how much can be achievedby increasing infrastructure capacity or designing better clientincentives. Solving the problem of excessive load on infras-tructure networks will require paradigm-altering approaches. Inparticular, when many users are interested in the same content,how can one leverage the multiple ad hoc networking interfaces(e.g., Wi-Fi or Bluetooth) ubiquitous on today’s mobile devicesin order to assist the infrastructure in disseminating the content?Subscribers may either form a significant subset of all users,comprising for example all those interested in the digital editionof a particular newspaper, or may include all users in a givenarea, for example vehicles receiving periodic traffic updates ina city.
In this paper, we address the following question: how can onerelieve the wireless infrastructure using opportunistic networkswhile guaranteeing 100% delivery ratio under tight delay
3G3G
(a) (b)
ack
Fig. 1. Combining multiple strategies for full data dissemination. Left figure(a) shows the infrastructure-only mode, where the 3G interface is used to sendcopies of the data to all nodes. In (b), we show the Push-and-Track approach,where opportunistic ad hoc communication is preferred whenever possible.Although acknowledgments are required to keep the loop closed, the globalinfrastructure load will be significantly reduced.
constraints? In particular, we seek to minimize the infrastructureload while massively distributing content within a short timeto a large number of subscribers.
We propose Push-and-Track, a framework that harnessesboth wide-area radios (e.g., 3G or WiMax) and local-arearadios (e.g., Bluetooth or Wi-Fi) in order to achieve guaranteeddelivery in an opportunistic network while relieving theinfrastructure. Our approach is detailed in Fig. 1. A subset ofusers will receive the content from the infrastructure and startpropagating it epidemically; upon receiving the content, nodessend acknowledgments back to the source thus allowing it tokeep track of the delivered content and assess the opportunityof reinjecting copies. The main feature of Push-and-Track isthe closed control loop that supervises the reinjection of copiesof the content via the infrastructure whenever it estimates thatthe ad hoc mode alone will fail to achieve full disseminationwithin some target delay. To the best of our knowledge, ourwork is the first to explore this idea.
Unlike accessing an operator’s wireless infrastructure, op-portunistic forwarding, using short-range ad hoc radio, isessentially free and costs little more than expended battery life.This may not even be a concern in certain circumstances (e.g.,vehicular). Unfortunately, it does not provide any guaranteesas it depends entirely on the uncontrolled mobility of users.
To this end, we evaluate several reinjection strategies. Push-and-Track splits the problem into how many copies of thecontent should be injected into the network, when, and to
arX
iv:1
007.
5459
v3 [
cs.N
I] 3
0 M
ay 2
011
whom. To decide the number of copies to be injected, wedefine different objective functions of different aggressivenesslevels (slow start or fast start). If the dissemination evolutionis under the objective, more copies need to be injected throughthe infrastructure; otherwise, the system remains in ad hocmode only. For deciding to whom inject copies, we considerrandomized, sojourn time, location-based, and connectivity-based strategies.
We thoroughly evaluate all combinations of the proposedstrategies by comparing them with both pure infrastructure andpure ad hoc approaches, as well as a near-optimum centralizedsolution, on a highly realistic large-scale vehicular simulationderived from fine-grained traffic measurements in the city ofBologna. This vehicular dataset is composed of more than10,000 vehicles covering 20.6 km2 and 191 km of roads.
Our results reveal the following findings:• Push-and-Track reduces the infrastructure load by over
90% when distributing periodic content to all vehicles inthe city of Bologna during peak hour traffic while stillachieving 100% on time delivery ratio.
• Choosing random recipients for pushing content is astraightforward and efficient strategy.
• While always important, reinjection decisions have signif-icantly more impact early in a message’s lifetime.
II. MASSIVE DISSEMINATION OF MOBILE CONTENT WITHPUSH-AND-TRACK
We consider the problem of distributing dynamic content toa variable set of mobile devices, all equipped with wirelessbroadband connectivity (3G) and also able to communicate inad hoc mode. This content is distributed from a point inside theaccess network infrastructure and can be of any size. Mobilenodes may subscribe to this content based on interest (e.g.news feeds or video podcasts) or for geographical reasons (e.g.,road traffic information in my home town). In any case, weassume that the subscriber base is significant enough that adhoc communication is feasible. We leave the question of usersforwarding content they are not interested in open for futurework. Furthermore, in this paper, unless specified, we are notconcerned with any specific radio technology and will simplyrefer to infrastructure vs. ad hoc radios.
Services that are sensitive to jitter, such as VoIP, will ofcourse remain infrastructure-only. Only content that can toleratesome delay in the delivery process (e.g., messages or filetransfers) can take advantage of short range communicationopportunities. Indeed, they do not have to be downloaded atthe instant they are used, and can be smoothly pre-fetched intomobile devices. Most content has an expiration date, either interms of usefulness for a user (e.g., road traffic informationbefore entering an area), or in terms of validity when updated(e.g., daily news). This expiration date sets the delay-tolerancelimit that any dissemination scheme should respect.
Push-and-Track does not rely on any restricted hypothesis oncontact statistics. Indeed, many opportunistic routing schemesrequire a learning or bootstrapping phase during which nodesaggregate statistics about meeting probabilities [6]. In particular,
a lot of attention has been focused on pairwise contact and inter-contact time distributions. These may be relevant in certain veryspecific circumstances, such as a conference, in which peopleregularly meet and separate, but are much less relevant in anurban vehicular context for example, where nodes typicallymeet only once. Furthermore, in a real system, users expectto be able to access the content immediately, not after somelearning period. Any general realistic opportunistic contentdissemination scheme which aims at guaranteeing delays cannottherefore rely only on statistical knowledge of node mobilityand behavior.
Push-and-Track is a mobility-agnostic framework for mas-sively disseminating content to mobiles nodes while meetingguaranteed delays and minimizing the load on the wirelessinfrastructure. It consists of a control system which pushesperiodical content to mobiles nodes and keeps track of its oppor-tunistic dissemination. It uses a closed-loop controller to decideat each time step ∆t which nodes should receive the contentfrom the infrastructure (push operation) to ensure a smooth andeffective dissemination using epidemic routing. Upon receivingthe content, each node sends an acknowledgement back to thecontrol system using the infrastructure network. This allowsthe controller to keep track of the remaining nodes to serve. Bydesigning the system in a way that this feedback informationis much smaller than the content itself, we expect to obtainsignificant reduction of the traffic flowing through the 3Ginfrastructure.
III. REDUCING INFRASTRUCTURE LOAD: STRATEGIES
The content is propagating among the mobile subscribers,acknowledgments are coming in, the deadline is approaching:should copies be reinjected into the network? If so, howmany and to whom? Guaranteeing 100% delivery ratio whileminimizing the load on the infrastructure is the heart of Push-and-Track. Each reinjection strategy therefore consists of twoparts. At every time step, it will first determine how many, ifany, copies must be reinjected, and then determine for eachnew copy whom to push it to.
A. Assumptions
A content is issued at time ti and must be delivered toall target nodes within a period of T seconds. Nodes mayenter in the system in the middle of a period but they shouldreceive the message before its expiration. Push-and-Track slotsperiod T into time steps of ∆t seconds that correspond tothe instants the feedback loop controlling the disseminationprocess decides whether or not to reinject new copies of thecontent. The dissemination process operates by pushing contentto a subset of non infected nodes.
B. Reference strategies
The strategies developed in this section will be comparedto the following upper and lower limits on achievable perfor-mance:
Infrastructure only: All content is pushed exclusively throughthe infrastructure. No ad hoc communications are allowed. This
0
0.1
0.2
0.3
0.4
0.5
0.6
0.7
0.8
0.9
1
0 0.1 0.2 0.3 0.4 0.5 0.6 0.7 0.8 0.9 1
Target
infectionratio
x
Infrastructure only
Ten Copies
Single Copy
Linear
SquareRoot
Quadratic
Fastlinear
Slowline
ar
“Panic”zo
ne
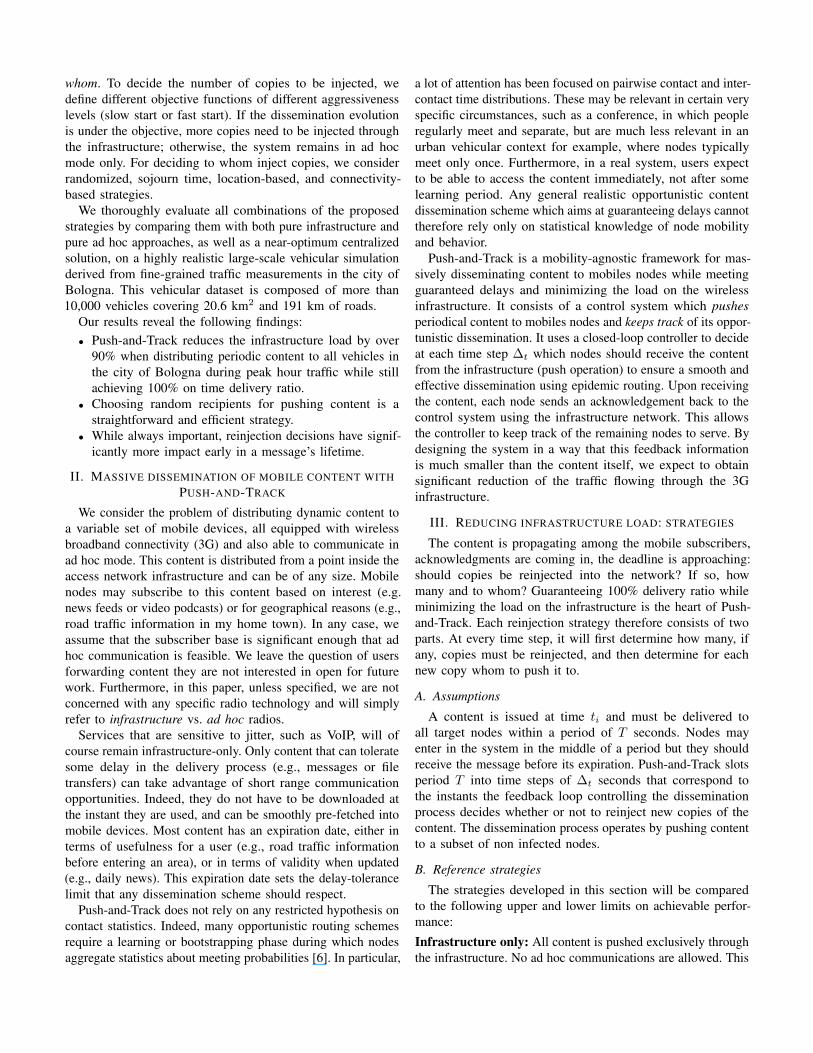
Fig. 2. Infection rate objective functions. x is the fraction of time elapsedbetween a message’s creation and expiration dates. x = 1 is the deadline forachieving 100% infection.
represents the baseline cost of massive content distributionusing present-day deployments.
Dominating set oracle: All content is pushed to a smallnumber of precalculated nodes. For each message, we definea directed graph, in which each vertex is connected to allthe vertices to which there exists a space-time forwardingpath during the message’s lifetime. The infrastructure thenpushes the content to a dominating set for this graph.1 This isanalogous to the well known problem of choosing multipointrelays for broadcasting in a wireless network [7]. Finding aminimal dominating set is NP-complete but a simple greedyalgorithm provides a dominating set whose cardinality is atmost logK times larger than the optimal set, where K is themaximum degree of a node in the aforementioned graph [7].Results obtained by pushing content exclusively to nodes inthis dominating set constitute our performance target.
C. When to push
Is it better to inject a small number of initial copies, andrun the risk of having to push large numbers of copies as thedeadline approaches, or jump-start the epidemic disseminationwith many initial copies, despite the fact that some of thosemay turn out to be redundant? How about keeping a steadyreinjection rate over the course of a message’s lifetime?The strategies outlined in this section, hereafter called when-strategies, cover all these questions.
Let x be the fraction of time elapsed between a message’screation and expiration dates. Each strategy is defined byan objective function (see Fig. 2), which indicates for every0 ≤ x ≤ 1 what the current infection ratio should be (i.e.,the fraction of the number of subscribing nodes that havethe content). Note that the infection ratio can go down ifnodes unsubscribe. If, at any time, the measured infection ratio,obtained from the acknowledgments, is below the current targetinfection ratio, then the strategy returns the minimal numberof additional copies that need to be reinjected in order to meet
1Here, a dominating set is a set of nodes in the directed graph such thateach node is either in the dominating set or has an inbound edge from a nodein the dominating set.
that target. Furthermore, when the time left before the deadlineis equal to the time required to push the message directlythrough the infrastructure, the control system enters a “paniczone” (Fig. 2) in which the infrastructure pushes the contentto all nodes that have not yet received it.
The when-strategies may broadly be divided into threecategories:Slow start: This includes two very simple “push-and-wait” (inopposition to Push-and-Track) strategies that push an initialnumber of copies and then do nothing until the panic zone:the Single Copy and Ten Copies strategies which respectivelyinject one and ten initial copies. The objective function forthe Quadratic, or “very slow start”, strategy is x2. The SlowLinear strategy starts with a x
2 linear objective for the first halfof the message’s lifetime, and finishes with a 3
2x−12 objective.
Fast start: The objective function for the Square Root, or“very fast start”, strategy is
√x. The Fast Linear strategy starts
with a 32x linear objective for the first half of the message’s
lifetime, and finishes with a x2 + 1
2 objective.Steady: This is the Linear strategy which ensures an infectionration strictly proportional to x.
D. To whomOnce the number of copies to reinject has been decided, the
next question is whom to push it to. In this paper we test thefollowing whom-strategies:Random: Push to a random node chosen uniformly amongthose that have not yet acknowledged reception.Entry time: If content subscription is localization-based, theneach node’s entry time (i.e., subscription time) is correlatedto its position in the area. For example, pushing to those thathave the most recent (Entry-Newest) or oldest (Entry-Oldest)entry times should target nodes close to the edge of the area,whereas pushing to those that are closest to the average entrytime (Entry-Average) should target the middle of the area.GPS-based: On top of the existing control messages, each nodemay also periodically inform the control system of its currentlocation. From this information, the space encompassing allnodes is recursively partitioned according to the Barnes-Hutmethod [8]. The idea is to keep on dividing each rectangulararea into four sub-areas until either an area has only onenode in it, or a maximum recursion level has been reached.This allows efficient computations of node density and force-based algorithms. In this paper, two GPS-based strategies wereconsidered. In order to ensure rapid replication, GPS-Densitypushes the content to an uninfected node within the highestdensity area. In GPS-Potential, each infected node i appliesto every other node j a Coulomb potential equal to 1
dij(dij
is the distance between i and j). Each side of the space alsocreates a potential equal to that of a single infected node. Inorder to spread the copies as well as possible over the entirespace, GPS-Potential pushes the content to the node with thelowest potential.Connectivity-based: Ad hoc routing protocols try to provideeach node with a good enough picture of the global network
topology to make intelligent routing decisions. On the otherhand, opportunistic routing protocols only assume knowledgeof the current neighbors. However, nodes can periodically com-municate to the control system a list of their current neighbors.Even though each node will still perform opportunistic store-and-forwarding, the control system will have a good slightlyout of sync, picture of the global connectivity graph. The CC(Connected Components) strategy uses this information to pushcontent to a randomly chosen node within the largest uninfectedconnected component. If all connected components have atleast one infected node, then it pushes to a node within theone with the most uninfected nodes. The idea is to push onlyone copy per connected component thereby getting close tothe optimal number of pushed copies.
E. Control loop operation
The control loop is the core of the decision system. Theinfrastructure must be aware of the dissemination status atall times to decide or not to inject new copies of the datain the network. To this end, the following control messagesare mandatory. In the vehicular scenario described in the nextSection, each vehicle sends an ENTER message (i.e., subscribe)upon entering the simulation area and a LEAVE message (i.e.,unsubscribe) upon leaving. As soon as a vehicle receives thedata, it sends an ACK message (i.e., acknowledgment) back tothe control system.
IV. BOLOGNA VEHICULAR DATASET
Many existing datasets were considered for evaluating Push-and-Track, in particular the Bluetooth contact traces obtainedin a conference [9], on a campus [10], or during a rollerbladingtour [11]. Unfortunately, these all have a small fixed set ofparticipants (roughly 100) and the underlying social affinitiesand dynamics translate into specific inter-contact patterns thathave a crucial impact on data dissemination. For our purposes,we wanted a realistic dataset with a large variable number ofusers and a high turnover rate among the users to simulatesubscription and unsubscription. Furthermore, as in real-life,we expect those users to be mostly strangers to each other,and therefore wished to keep social dynamics to a minimum.The Bologna vehicular dataset described in this section has allthese features.
A. Dataset construction
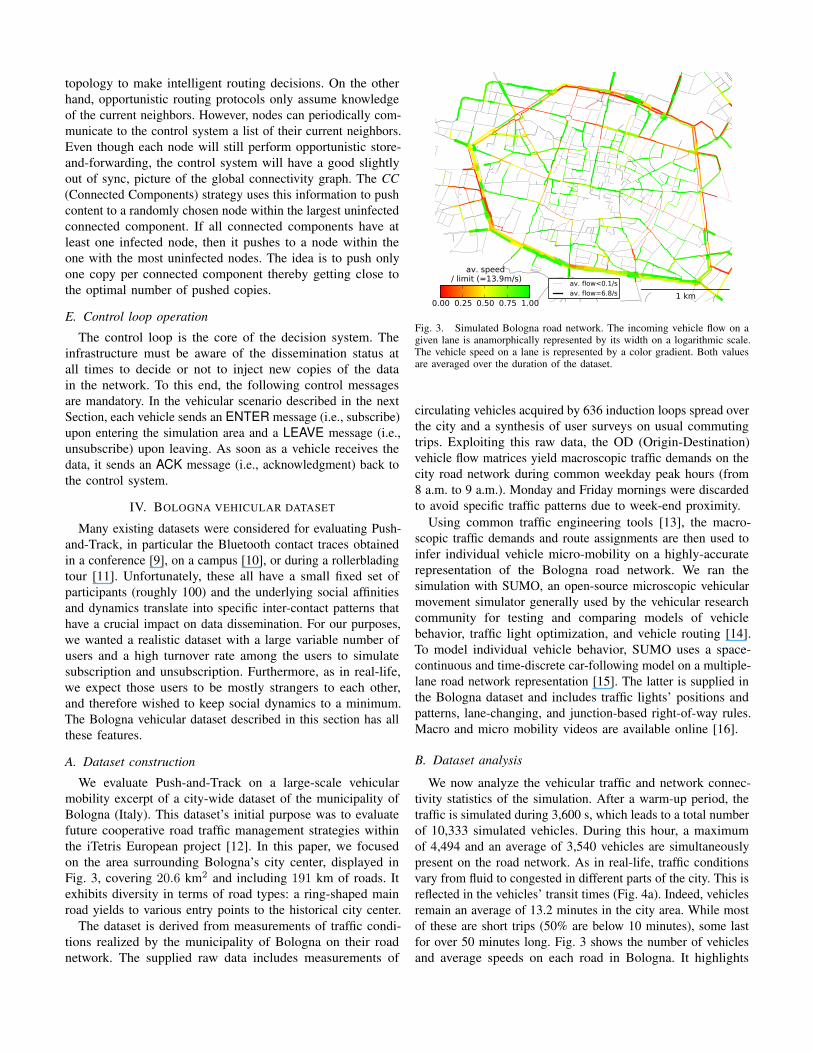
We evaluate Push-and-Track on a large-scale vehicularmobility excerpt of a city-wide dataset of the municipality ofBologna (Italy). This dataset’s initial purpose was to evaluatefuture cooperative road traffic management strategies withinthe iTetris European project [12]. In this paper, we focusedon the area surrounding Bologna’s city center, displayed inFig. 3, covering 20.6 km2 and including 191 km of roads. Itexhibits diversity in terms of road types: a ring-shaped mainroad yields to various entry points to the historical city center.
The dataset is derived from measurements of traffic condi-tions realized by the municipality of Bologna on their roadnetwork. The supplied raw data includes measurements of
1 km
av. flow<0.1/s
av. flow=6.8/s
0.00 0.25 0.50 0.75 1.00
av. speed / limit (=13.9m/s)
Fig. 3. Simulated Bologna road network. The incoming vehicle flow on agiven lane is anamorphically represented by its width on a logarithmic scale.The vehicle speed on a lane is represented by a color gradient. Both valuesare averaged over the duration of the dataset.
circulating vehicles acquired by 636 induction loops spread overthe city and a synthesis of user surveys on usual commutingtrips. Exploiting this raw data, the OD (Origin-Destination)vehicle flow matrices yield macroscopic traffic demands on thecity road network during common weekday peak hours (from8 a.m. to 9 a.m.). Monday and Friday mornings were discardedto avoid specific traffic patterns due to week-end proximity.
Using common traffic engineering tools [13], the macro-scopic traffic demands and route assignments are then used toinfer individual vehicle micro-mobility on a highly-accuraterepresentation of the Bologna road network. We ran thesimulation with SUMO, an open-source microscopic vehicularmovement simulator generally used by the vehicular researchcommunity for testing and comparing models of vehiclebehavior, traffic light optimization, and vehicle routing [14].To model individual vehicle behavior, SUMO uses a space-continuous and time-discrete car-following model on a multiple-lane road network representation [15]. The latter is supplied inthe Bologna dataset and includes traffic lights’ positions andpatterns, lane-changing, and junction-based right-of-way rules.Macro and micro mobility videos are available online [16].
B. Dataset analysis
We now analyze the vehicular traffic and network connec-tivity statistics of the simulation. After a warm-up period, thetraffic is simulated during 3,600 s, which leads to a total numberof 10,333 simulated vehicles. During this hour, a maximumof 4,494 and an average of 3,540 vehicles are simultaneouslypresent on the road network. As in real-life, traffic conditionsvary from fluid to congested in different parts of the city. This isreflected in the vehicles’ transit times (Fig. 4a). Indeed, vehiclesremain an average of 13.2 minutes in the city area. While mostof these are short trips (50% are below 10 minutes), some lastfor over 50 minutes long. Fig. 3 shows the number of vehiclesand average speeds on each road in Bologna. It highlights
10−5
10−4
10−3
10−2
10−1
100
0.01 0.1 1 10 100
P[X
>x]
Time (min)
Contacts
Transits
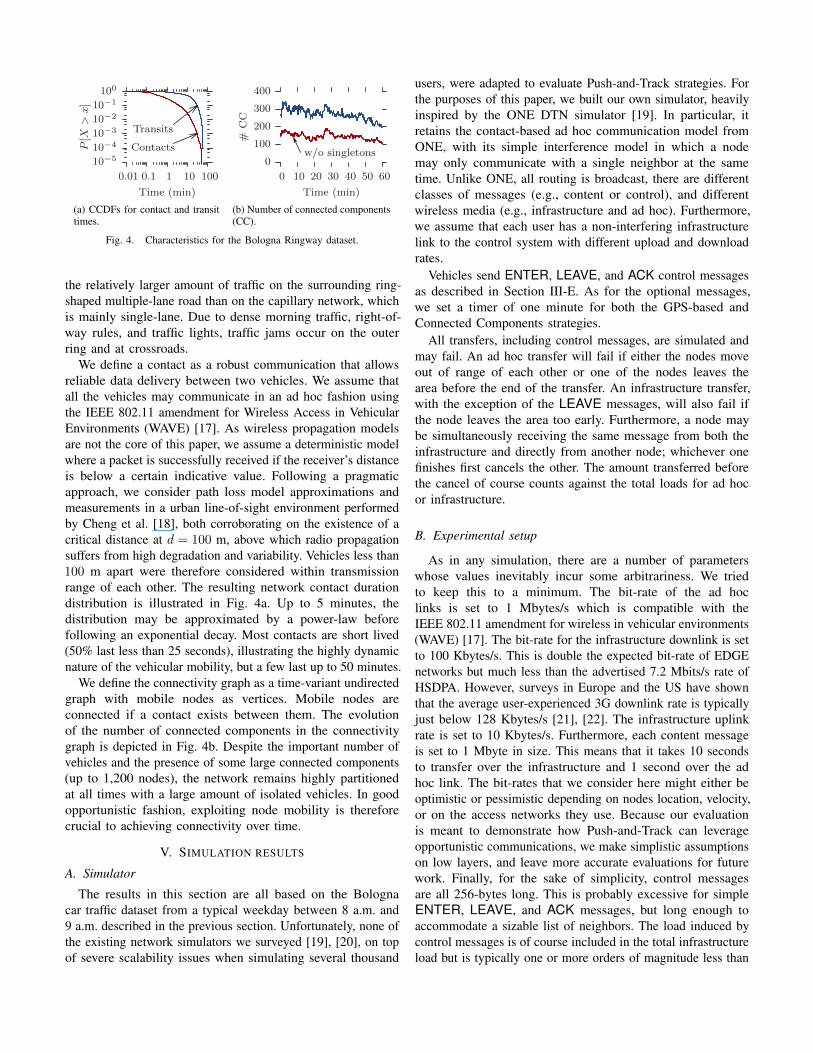
(a) CCDFs for contact and transittimes.
0
100
200
300
400
0 10 20 30 40 50 60
#CC
Time (min)
w/o singletons
(b) Number of connected components(CC).
Fig. 4. Characteristics for the Bologna Ringway dataset.
the relatively larger amount of traffic on the surrounding ring-shaped multiple-lane road than on the capillary network, whichis mainly single-lane. Due to dense morning traffic, right-of-way rules, and traffic lights, traffic jams occur on the outerring and at crossroads.
We define a contact as a robust communication that allowsreliable data delivery between two vehicles. We assume thatall the vehicles may communicate in an ad hoc fashion usingthe IEEE 802.11 amendment for Wireless Access in VehicularEnvironments (WAVE) [17]. As wireless propagation modelsare not the core of this paper, we assume a deterministic modelwhere a packet is successfully received if the receiver’s distanceis below a certain indicative value. Following a pragmaticapproach, we consider path loss model approximations andmeasurements in a urban line-of-sight environment performedby Cheng et al. [18], both corroborating on the existence of acritical distance at d = 100 m, above which radio propagationsuffers from high degradation and variability. Vehicles less than100 m apart were therefore considered within transmissionrange of each other. The resulting network contact durationdistribution is illustrated in Fig. 4a. Up to 5 minutes, thedistribution may be approximated by a power-law beforefollowing an exponential decay. Most contacts are short lived(50% last less than 25 seconds), illustrating the highly dynamicnature of the vehicular mobility, but a few last up to 50 minutes.
We define the connectivity graph as a time-variant undirectedgraph with mobile nodes as vertices. Mobile nodes areconnected if a contact exists between them. The evolutionof the number of connected components in the connectivitygraph is depicted in Fig. 4b. Despite the important number ofvehicles and the presence of some large connected components(up to 1,200 nodes), the network remains highly partitionedat all times with a large amount of isolated vehicles. In goodopportunistic fashion, exploiting node mobility is thereforecrucial to achieving connectivity over time.
V. SIMULATION RESULTS
A. Simulator
The results in this section are all based on the Bolognacar traffic dataset from a typical weekday between 8 a.m. and9 a.m. described in the previous section. Unfortunately, none ofthe existing network simulators we surveyed [19], [20], on topof severe scalability issues when simulating several thousand
users, were adapted to evaluate Push-and-Track strategies. Forthe purposes of this paper, we built our own simulator, heavilyinspired by the ONE DTN simulator [19]. In particular, itretains the contact-based ad hoc communication model fromONE, with its simple interference model in which a nodemay only communicate with a single neighbor at the sametime. Unlike ONE, all routing is broadcast, there are differentclasses of messages (e.g., content or control), and differentwireless media (e.g., infrastructure and ad hoc). Furthermore,we assume that each user has a non-interfering infrastructurelink to the control system with different upload and downloadrates.
Vehicles send ENTER, LEAVE, and ACK control messagesas described in Section III-E. As for the optional messages,we set a timer of one minute for both the GPS-based andConnected Components strategies.
All transfers, including control messages, are simulated andmay fail. An ad hoc transfer will fail if either the nodes moveout of range of each other or one of the nodes leaves thearea before the end of the transfer. An infrastructure transfer,with the exception of the LEAVE messages, will also fail ifthe node leaves the area too early. Furthermore, a node maybe simultaneously receiving the same message from both theinfrastructure and directly from another node; whichever onefinishes first cancels the other. The amount transferred beforethe cancel of course counts against the total loads for ad hocor infrastructure.
B. Experimental setup
As in any simulation, there are a number of parameterswhose values inevitably incur some arbitrariness. We triedto keep this to a minimum. The bit-rate of the ad hoclinks is set to 1 Mbytes/s which is compatible with theIEEE 802.11 amendment for wireless in vehicular environments(WAVE) [17]. The bit-rate for the infrastructure downlink is setto 100 Kbytes/s. This is double the expected bit-rate of EDGEnetworks but much less than the advertised 7.2 Mbits/s rate ofHSDPA. However, surveys in Europe and the US have shownthat the average user-experienced 3G downlink rate is typicallyjust below 128 Kbytes/s [21], [22]. The infrastructure uplinkrate is set to 10 Kbytes/s. Furthermore, each content messageis set to 1 Mbyte in size. This means that it takes 10 secondsto transfer over the infrastructure and 1 second over the adhoc link. The bit-rates that we consider here might either beoptimistic or pessimistic depending on nodes location, velocity,or on the access networks they use. Because our evaluationis meant to demonstrate how Push-and-Track can leverageopportunistic communications, we make simplistic assumptionson low layers, and leave more accurate evaluations for futurework. Finally, for the sake of simplicity, control messagesare all 256-bytes long. This is probably excessive for simpleENTER, LEAVE, and ACK messages, but long enough toaccommodate a sizable list of neighbors. The load induced bycontrol messages is of course included in the total infrastructureload but is typically one or more orders of magnitude less than
0
1000
2000
3000
4000
5000
6000
7000
8000
Infra PnTOracle Infra PnTOracle
Loadper
Message(M
B)
InfrastructureAd Hoc
10 min delay
1 min delay
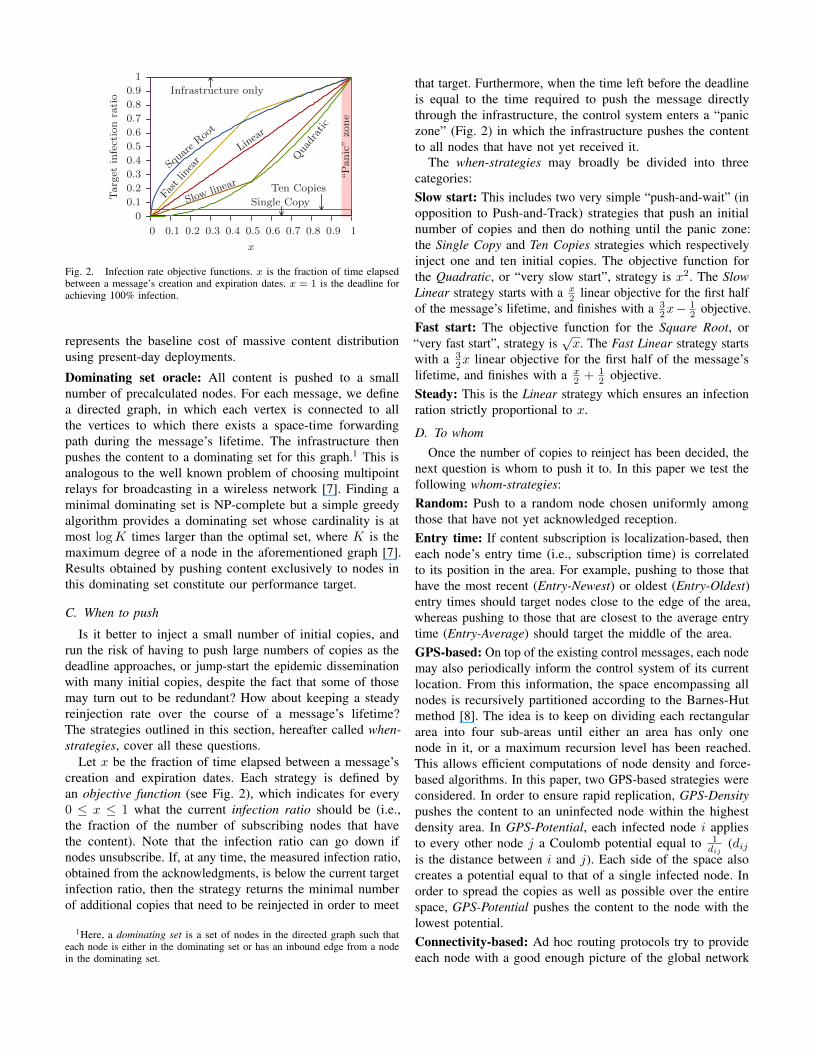
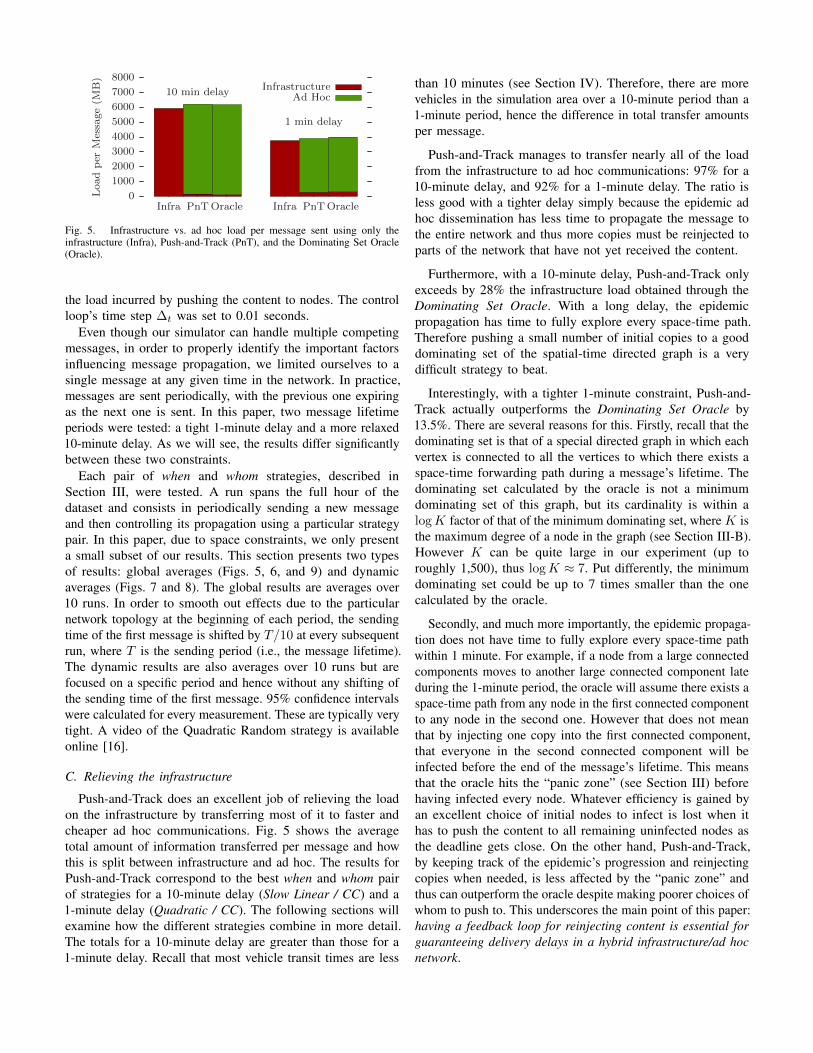
Fig. 5. Infrastructure vs. ad hoc load per message sent using only theinfrastructure (Infra), Push-and-Track (PnT), and the Dominating Set Oracle(Oracle).
the load incurred by pushing the content to nodes. The controlloop’s time step ∆t was set to 0.01 seconds.
Even though our simulator can handle multiple competingmessages, in order to properly identify the important factorsinfluencing message propagation, we limited ourselves to asingle message at any given time in the network. In practice,messages are sent periodically, with the previous one expiringas the next one is sent. In this paper, two message lifetimeperiods were tested: a tight 1-minute delay and a more relaxed10-minute delay. As we will see, the results differ significantlybetween these two constraints.
Each pair of when and whom strategies, described inSection III, were tested. A run spans the full hour of thedataset and consists in periodically sending a new messageand then controlling its propagation using a particular strategypair. In this paper, due to space constraints, we only presenta small subset of our results. This section presents two typesof results: global averages (Figs. 5, 6, and 9) and dynamicaverages (Figs. 7 and 8). The global results are averages over10 runs. In order to smooth out effects due to the particularnetwork topology at the beginning of each period, the sendingtime of the first message is shifted by T/10 at every subsequentrun, where T is the sending period (i.e., the message lifetime).The dynamic results are also averages over 10 runs but arefocused on a specific period and hence without any shifting ofthe sending time of the first message. 95% confidence intervalswere calculated for every measurement. These are typically verytight. A video of the Quadratic Random strategy is availableonline [16].
C. Relieving the infrastructure
Push-and-Track does an excellent job of relieving the loadon the infrastructure by transferring most of it to faster andcheaper ad hoc communications. Fig. 5 shows the averagetotal amount of information transferred per message and howthis is split between infrastructure and ad hoc. The results forPush-and-Track correspond to the best when and whom pairof strategies for a 10-minute delay (Slow Linear / CC) and a1-minute delay (Quadratic / CC). The following sections willexamine how the different strategies combine in more detail.The totals for a 10-minute delay are greater than those for a1-minute delay. Recall that most vehicle transit times are less
than 10 minutes (see Section IV). Therefore, there are morevehicles in the simulation area over a 10-minute period than a1-minute period, hence the difference in total transfer amountsper message.
Push-and-Track manages to transfer nearly all of the loadfrom the infrastructure to ad hoc communications: 97% for a10-minute delay, and 92% for a 1-minute delay. The ratio isless good with a tighter delay simply because the epidemic adhoc dissemination has less time to propagate the message tothe entire network and thus more copies must be reinjected toparts of the network that have not yet received the content.
Furthermore, with a 10-minute delay, Push-and-Track onlyexceeds by 28% the infrastructure load obtained through theDominating Set Oracle. With a long delay, the epidemicpropagation has time to fully explore every space-time path.Therefore pushing a small number of initial copies to a gooddominating set of the spatial-time directed graph is a verydifficult strategy to beat.
Interestingly, with a tighter 1-minute constraint, Push-and-Track actually outperforms the Dominating Set Oracle by13.5%. There are several reasons for this. Firstly, recall that thedominating set is that of a special directed graph in which eachvertex is connected to all the vertices to which there exists aspace-time forwarding path during a message’s lifetime. Thedominating set calculated by the oracle is not a minimumdominating set of this graph, but its cardinality is within alogK factor of that of the minimum dominating set, where K isthe maximum degree of a node in the graph (see Section III-B).However K can be quite large in our experiment (up toroughly 1,500), thus logK ≈ 7. Put differently, the minimumdominating set could be up to 7 times smaller than the onecalculated by the oracle.
Secondly, and much more importantly, the epidemic propaga-tion does not have time to fully explore every space-time pathwithin 1 minute. For example, if a node from a large connectedcomponents moves to another large connected component lateduring the 1-minute period, the oracle will assume there exists aspace-time path from any node in the first connected componentto any node in the second one. However that does not meanthat by injecting one copy into the first connected component,that everyone in the second connected component will beinfected before the end of the message’s lifetime. This meansthat the oracle hits the “panic zone” (see Section III) beforehaving infected every node. Whatever efficiency is gained byan excellent choice of initial nodes to infect is lost when ithas to push the content to all remaining uninfected nodes asthe deadline gets close. On the other hand, Push-and-Track,by keeping track of the epidemic’s progression and reinjectingcopies when needed, is less affected by the “panic zone” andthus can outperform the oracle despite making poorer choices ofwhom to push to. This underscores the main point of this paper:having a feedback loop for reinjecting content is essential forguaranteeing delivery delays in a hybrid infrastructure/ad hocnetwork.
0200400600800
10001200
Oracle
Random
CC
GPS-D
ensity
GPS-P
otential
Entry-A
verage
Entry-O
ldest
Entry-N
ewest
Oracle
Random
CC
GPS-D
ensity
GPS-P
otential
Entry-A
verage
Entry-O
ldest
Entry-N
ewest
Loadper
Message(M
B)
10 min delay
1 min delay
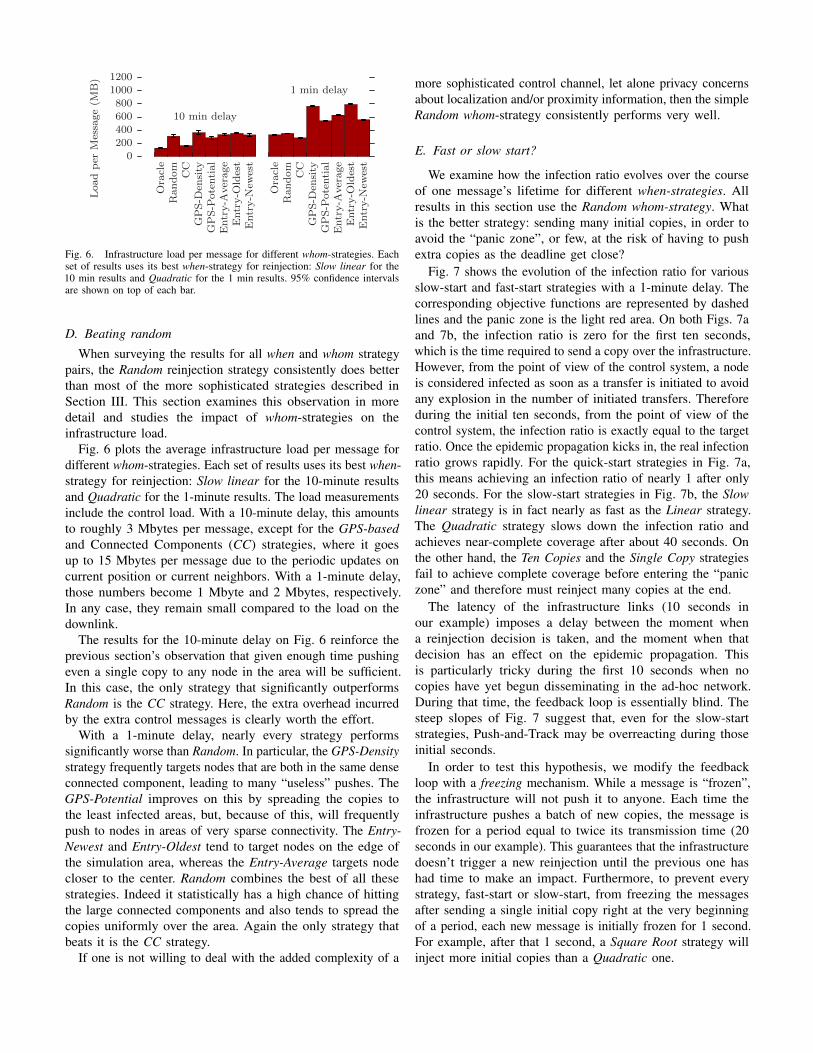
Fig. 6. Infrastructure load per message for different whom-strategies. Eachset of results uses its best when-strategy for reinjection: Slow linear for the10 min results and Quadratic for the 1 min results. 95% confidence intervalsare shown on top of each bar.
D. Beating random
When surveying the results for all when and whom strategypairs, the Random reinjection strategy consistently does betterthan most of the more sophisticated strategies described inSection III. This section examines this observation in moredetail and studies the impact of whom-strategies on theinfrastructure load.
Fig. 6 plots the average infrastructure load per message fordifferent whom-strategies. Each set of results uses its best when-strategy for reinjection: Slow linear for the 10-minute resultsand Quadratic for the 1-minute results. The load measurementsinclude the control load. With a 10-minute delay, this amountsto roughly 3 Mbytes per message, except for the GPS-basedand Connected Components (CC) strategies, where it goesup to 15 Mbytes per message due to the periodic updates oncurrent position or current neighbors. With a 1-minute delay,those numbers become 1 Mbyte and 2 Mbytes, respectively.In any case, they remain small compared to the load on thedownlink.
The results for the 10-minute delay on Fig. 6 reinforce theprevious section’s observation that given enough time pushingeven a single copy to any node in the area will be sufficient.In this case, the only strategy that significantly outperformsRandom is the CC strategy. Here, the extra overhead incurredby the extra control messages is clearly worth the effort.
With a 1-minute delay, nearly every strategy performssignificantly worse than Random. In particular, the GPS-Densitystrategy frequently targets nodes that are both in the same denseconnected component, leading to many “useless” pushes. TheGPS-Potential improves on this by spreading the copies tothe least infected areas, but, because of this, will frequentlypush to nodes in areas of very sparse connectivity. The Entry-Newest and Entry-Oldest tend to target nodes on the edge ofthe simulation area, whereas the Entry-Average targets nodecloser to the center. Random combines the best of all thesestrategies. Indeed it statistically has a high chance of hittingthe large connected components and also tends to spread thecopies uniformly over the area. Again the only strategy thatbeats it is the CC strategy.
If one is not willing to deal with the added complexity of a
more sophisticated control channel, let alone privacy concernsabout localization and/or proximity information, then the simpleRandom whom-strategy consistently performs very well.
E. Fast or slow start?
We examine how the infection ratio evolves over the courseof one message’s lifetime for different when-strategies. Allresults in this section use the Random whom-strategy. Whatis the better strategy: sending many initial copies, in order toavoid the “panic zone”, or few, at the risk of having to pushextra copies as the deadline get close?
Fig. 7 shows the evolution of the infection ratio for variousslow-start and fast-start strategies with a 1-minute delay. Thecorresponding objective functions are represented by dashedlines and the panic zone is the light red area. On both Figs. 7aand 7b, the infection ratio is zero for the first ten seconds,which is the time required to send a copy over the infrastructure.However, from the point of view of the control system, a nodeis considered infected as soon as a transfer is initiated to avoidany explosion in the number of initiated transfers. Thereforeduring the initial ten seconds, from the point of view of thecontrol system, the infection ratio is exactly equal to the targetratio. Once the epidemic propagation kicks in, the real infectionratio grows rapidly. For the quick-start strategies in Fig. 7a,this means achieving an infection ratio of nearly 1 after only20 seconds. For the slow-start strategies in Fig. 7b, the Slowlinear strategy is in fact nearly as fast as the Linear strategy.The Quadratic strategy slows down the infection ratio andachieves near-complete coverage after about 40 seconds. Onthe other hand, the Ten Copies and the Single Copy strategiesfail to achieve complete coverage before entering the “paniczone” and therefore must reinject many copies at the end.
The latency of the infrastructure links (10 seconds inour example) imposes a delay between the moment whena reinjection decision is taken, and the moment when thatdecision has an effect on the epidemic propagation. Thisis particularly tricky during the first 10 seconds when nocopies have yet begun disseminating in the ad-hoc network.During that time, the feedback loop is essentially blind. Thesteep slopes of Fig. 7 suggest that, even for the slow-startstrategies, Push-and-Track may be overreacting during thoseinitial seconds.
In order to test this hypothesis, we modify the feedbackloop with a freezing mechanism. While a message is “frozen”,the infrastructure will not push it to anyone. Each time theinfrastructure pushes a batch of new copies, the message isfrozen for a period equal to twice its transmission time (20seconds in our example). This guarantees that the infrastructuredoesn’t trigger a new reinjection until the previous one hashad time to make an impact. Furthermore, to prevent everystrategy, fast-start or slow-start, from freezing the messagesafter sending a single initial copy right at the very beginningof a period, each new message is initially frozen for 1 second.For example, after that 1 second, a Square Root strategy willinject more initial copies than a Quadratic one.
0
0.2
0.4
0.6
0.8
1
0 10 20 30 40 50 60
InfectionRatio
Time (s)
1
2
3
(a) Fast start: (1) Square root, (2)Fast linear, (3) Linear.
0
0.2
0.4
0.6
0.8
1
0 10 20 30 40 50 60
InfectionRatio
Time (s)
345
6
7
(b) Slow start: (3) Linear, (4) Slowlinear, (5) Quadratic, (6) Ten copies,(7) Single copy.
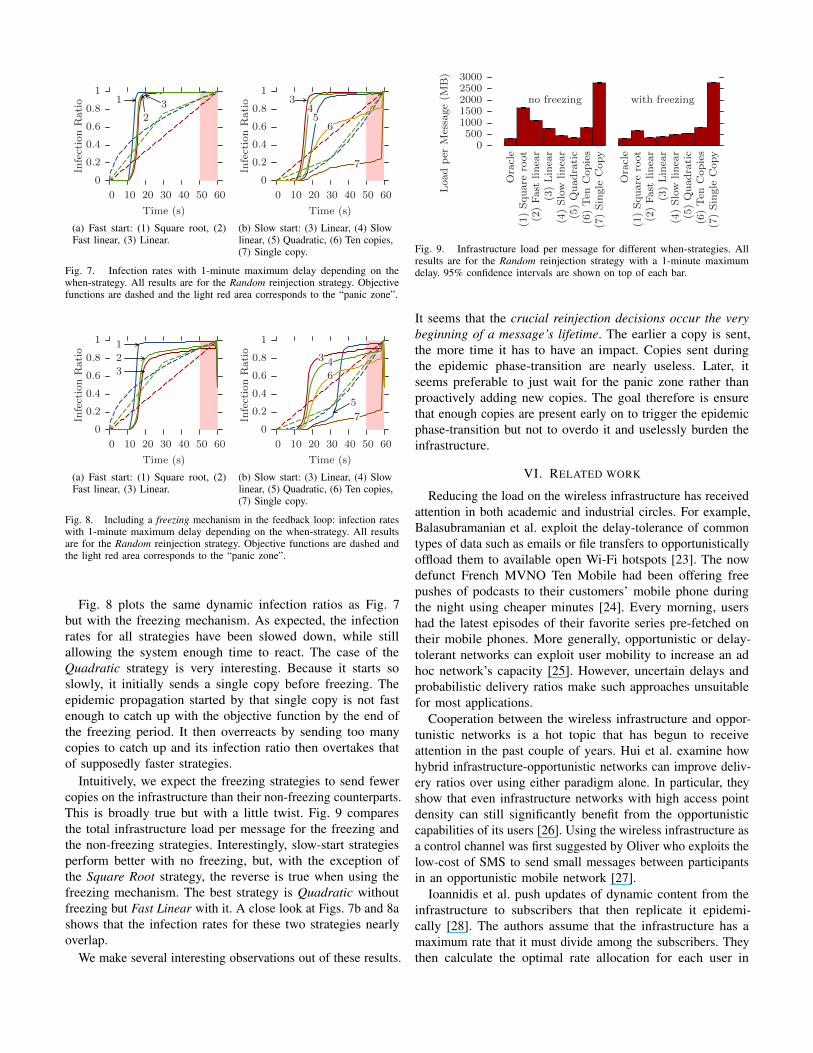
Fig. 7. Infection rates with 1-minute maximum delay depending on thewhen-strategy. All results are for the Random reinjection strategy. Objectivefunctions are dashed and the light red area corresponds to the “panic zone”.
0
0.2
0.4
0.6
0.8
1
0 10 20 30 40 50 60
InfectionRatio
Time (s)
1
2
3
(a) Fast start: (1) Square root, (2)Fast linear, (3) Linear.
0
0.2
0.4
0.6
0.8
1
0 10 20 30 40 50 60
InfectionRatio
Time (s)
3 4
5
6
7
(b) Slow start: (3) Linear, (4) Slowlinear, (5) Quadratic, (6) Ten copies,(7) Single copy.
Fig. 8. Including a freezing mechanism in the feedback loop: infection rateswith 1-minute maximum delay depending on the when-strategy. All resultsare for the Random reinjection strategy. Objective functions are dashed andthe light red area corresponds to the “panic zone”.
Fig. 8 plots the same dynamic infection ratios as Fig. 7but with the freezing mechanism. As expected, the infectionrates for all strategies have been slowed down, while stillallowing the system enough time to react. The case of theQuadratic strategy is very interesting. Because it starts soslowly, it initially sends a single copy before freezing. Theepidemic propagation started by that single copy is not fastenough to catch up with the objective function by the end ofthe freezing period. It then overreacts by sending too manycopies to catch up and its infection ratio then overtakes thatof supposedly faster strategies.
Intuitively, we expect the freezing strategies to send fewercopies on the infrastructure than their non-freezing counterparts.This is broadly true but with a little twist. Fig. 9 comparesthe total infrastructure load per message for the freezing andthe non-freezing strategies. Interestingly, slow-start strategiesperform better with no freezing, but, with the exception ofthe Square Root strategy, the reverse is true when using thefreezing mechanism. The best strategy is Quadratic withoutfreezing but Fast Linear with it. A close look at Figs. 7b and 8ashows that the infection rates for these two strategies nearlyoverlap.
We make several interesting observations out of these results.
0500
10001500200025003000
Oracle
(1)Square
root
(2)Fast
linea
r(3)Linea
r(4)Slow
linea
r(5)Quadratic
(6)Ten
Copies
(7)Single
Copy
Oracle
(1)Square
root
(2)Fast
linea
r(3)Linea
r(4)Slow
linea
r(5)Quadratic
(6)Ten
Copies
(7)Single
Copy
Loadper
Message(M
B)
no freezing with freezing
Fig. 9. Infrastructure load per message for different when-strategies. Allresults are for the Random reinjection strategy with a 1-minute maximumdelay. 95% confidence intervals are shown on top of each bar.
It seems that the crucial reinjection decisions occur the verybeginning of a message’s lifetime. The earlier a copy is sent,the more time it has to have an impact. Copies sent duringthe epidemic phase-transition are nearly useless. Later, itseems preferable to just wait for the panic zone rather thanproactively adding new copies. The goal therefore is ensurethat enough copies are present early on to trigger the epidemicphase-transition but not to overdo it and uselessly burden theinfrastructure.
VI. RELATED WORK
Reducing the load on the wireless infrastructure has receivedattention in both academic and industrial circles. For example,Balasubramanian et al. exploit the delay-tolerance of commontypes of data such as emails or file transfers to opportunisticallyoffload them to available open Wi-Fi hotspots [23]. The nowdefunct French MVNO Ten Mobile had been offering freepushes of podcasts to their customers’ mobile phone duringthe night using cheaper minutes [24]. Every morning, usershad the latest episodes of their favorite series pre-fetched ontheir mobile phones. More generally, opportunistic or delay-tolerant networks can exploit user mobility to increase an adhoc network’s capacity [25]. However, uncertain delays andprobabilistic delivery ratios make such approaches unsuitablefor most applications.
Cooperation between the wireless infrastructure and oppor-tunistic networks is a hot topic that has begun to receiveattention in the past couple of years. Hui et al. examine howhybrid infrastructure-opportunistic networks can improve deliv-ery ratios over using either paradigm alone. In particular, theyshow that even infrastructure networks with high access pointdensity can still significantly benefit from the opportunisticcapabilities of its users [26]. Using the wireless infrastructure asa control channel was first suggested by Oliver who exploits thelow-cost of SMS to send small messages between participantsin an opportunistic mobile network [27].
Ioannidis et al. push updates of dynamic content from theinfrastructure to subscribers that then replicate it epidemi-cally [28]. The authors assume that the infrastructure has amaximum rate that it must divide among the subscribers. Theythen calculate the optimal rate allocation for each user in

order to maximize the average freshness of content among allsubscribers. Han et al. investigate different strategies to findthe subset of opportunistic users that will lead to the greatestinfection ratio by the end of a message’s lifetime. Therefore,pushing the content trough the cellular infrastructure to thatoptimal subset minimizes the load on the infrastucture [29].These two papers are close to ours but differ in the followingways. Firstly, they do not have a feedback loop and cannotquickly react to changes in network dynamics or the arrival ofnew nodes. Secondly, the methods developped in both papersassume preexisting knowledge of pairwise contact probabilities.
VII. CONCLUSIONS
Push-and-Track is a framework for massively disseminatingcontent with guaranteed delays to mobile users while mini-mizing the load on the wireless infrastructure. It leverages adhoc communication opportunities, tracks the content spreadthrough user-sent acknowledgments, and, if necessary, reinjectscopies to nodes that have not yet received the content. Testson the large-scale Bologna vehicular dataset reveal that Push-and-Track manages to reduce the infrastructure load by over90% while achieving 100% delivery. Furthermore, sendingsmall numbers of initial copies lightens the infrastructure loadeven under tight delay constraints. Finally, pushing contentto random nodes works well as it manages to both hit thelarge connectivity clusters with high probability and spread thepushes uniformly around the city.
Our work will continue in the following directions. Firstly,the feedback loop could be improved, perhaps equipped with apredictive epidemic propagation model. Perhaps the feedbackloop could also take into account propagation measurement ofprevious messages to adjust its strategy for subsequent ones.Secondly, the impact of intermittent infrastructure connectivitymust also be explored. Thirdly, any real-life deployement willnecessarily be partial and progressive. How does Push-and-Track fare when only a fraction of all users participate? Finally,this paper dealt with the case where all users were interestedin the same content. However, the Push-and-Track frameworkis flexible and can be extended to a more realistic settingin which overlapping subsets of users concurrently requestdifferent content.
ACKNOWLEDGMENTS
We would like to especially thank the iTETRIS partners that havemade available and built the vehicular dataset. For this, we especiallythank Fabio Cartolano, Carlo Michelacci, and Antonio Pio Morrafrom the Municipality of Bologna, as well as Daniel Krajzewiczfrom the German Aerospace Center. We also thank Javier Gozalvez,Ramon Bauza, Clemence Magnien, and Matthieu Latapy for theircomments. This work has been partly funded by the European projectiTETRIS (No. FP7 224644) and the French ANR CROWD projectunder contract ANR-08-VERS-006.
REFERENCES
[1] “Global Mobile Data Traffic Forecast Update, 2009-2014,”http://www.cisco.com/en/US/solutions/collateral/ns341/ns525/ns537/ns705/ns827/white paper c11-520862.html.
[2] “Mobile data traffic surpasses voice. 2010.” http://www.ericsson.com/thecompany/press/releases/2010/03/1396928.
[3] “Customers Angered as iPhones Overload AT&T. 2009.” http://www.nytimes.com/2009/09/03/technology/companies/03att.html.
[4] “Wireless Data: The End of All-You-Can-Eat?. 2010.” http://www.businessweek.com/magazine/content/10 28/b4186034470110.htm.
[5] “Forfaits 3G : Orange siffle la fin de l’internetmobile illimite,” http://www.zdnet.fr/actualites/forfaits-3g-orange-siffle-la-fin-de-l-internet-mobile-illimite-39756186.htm.
[6] A. Lindgren, A. Doria, and O. Schelen, “Probabilistic routing inintermittently connected networks,” in Proc. SAPIR, 2004.
[7] A. Laouiti, A. Qayyum, and L. Viennot, “Multipoint relaying: Aneffecient technique for flooding in mobile wireless networks,” in Proc.IEEE HICCS, 2001.
[8] J. Barnes and P. Hut, “A hierarchical force-calculation algorithm,” Nature,vol. 324, no. 12, pp. 446–449, 1986.
[9] A. Chaintreau, P. Hui, J. Crowcroft, C. Diot, R. Gass, and J. Scott,“Impact of human mobility on the design of opportunistic forwardingalgorithms,” in Proc. IEEE INFOCOM, 2006.
[10] N. Eagle and A. Pentland, “Reality mining: Sensing complex socialsystems,” Personal and Ubiquitous Computing, 2005.
[11] P.-U. Tournoux, J. Leguay, F. Benbadis, V. Conan, M. D. de Amorim, andJ. Whitbeck, “The accordion phenomenon: Analysis, characterization,and impact on DTN routing,” in Proc. IEEE INFOCOM, 2009.
[12] “European FP7 iTETRIS project: An Integrated Wireless and TrafficPlatform for Real-Time Road Traffic Management Solutions,” http://www.ict-itetris.eu.
[13] “VISSIM,” http://www.vissim.de.[14] D. Krajzewicz, G. Hertkorn, C. Rossel, and P. Wagner, “SUMO
(Simulation of Urban MObility); An open-source traffic simulation,”in Proc. MESM, 2002.
[15] S. Krauß, “Microscopic modeling of traffic flow: Investigation of collisionfree vehicle dynamics,” Ph.D. dissertation, 1998.
[16] “Push-and-track supplementary material,” http://www-npa.lip6.fr/∼whitbeck/pnt.html.
[17] “IEEE Draft Standard for Amendment to Standard [for] InformationTechnology-Telecommunications and information exchange betweensystems-local and metropolitan networks-specific requirements-part ii:Wireless lan medium access control (mac) and physical layer (phy)specifications-amendment 6: Wireless access in vehicular environments,”IEEE Std P802.11p/D11.0 April 2010.
[18] L. Cheng, B. Henty, D. Stancil, F. Bai, and P. Mudalige, “Mobile vehicle-to-vehicle narrow-band channel measurement and characterization of the5.9 GHz dedicated short range communication (DSRC) frequency band,”IEEE Journal on Selected Areas in Communications, vol. 25, no. 8, pp.1501–1516, 2007.
[19] A. Keranen, J. Ott, and T. Karkkainen, “The ONE Simulator for DTNProtocol Evaluation,” in Proc. SIMUTools, 2009.
[20] “Network simulator 3,” http://www.nsnam.org.[21] “Wired.com’s iPhone 3G Survey Reveals Network Weaknesses,” http:
//www.wired.com/gadgetlab/2008/08/global-iphone-3/, 2008.[22] “L’UFC Que Choisir etrille la qualite de service des offres
3G (French). 2010.” http://www.businessmobile.fr/actualites/l-ufc-que-choisir-etrille-la-qualite-de-service-des-offres-3g-39752847.htm.
[23] A. Balasubramanian, R. Mahajan, and A. Venkataramani, “Augmentingmobile 3G using WiFi,” in Proc. MobiSys, 2010.
[24] “Ten Mobile : Web et podcast TV illimitesgratuits (French). 2007.” http://www.clubic.com/actualite-69747-ten-mobile-web-podcast-illimites-gratuits.html.
[25] M. Grossglauser and D. Tse, “Mobility increases the capacity of ad-hoc wireless networks,” Transactions on Networking, vol. 10, no. 4, pp.477–486, August 2002.
[26] P. Hui, A. Lindgren, and J. Crowcroft, “Empirical evaluation of hybridopportunistic networks,” in Proc. COMSNETS, 2009.
[27] E. Oliver, “Exploiting the short message service as a control channel inchallenged network environments,” in Proc. ACM CHANTS, 2008.
[28] S. Ioannidis, A. Chaintreau, and L. Massoulie, “Optimal and scalabledistribution of content updates over a mobile social network,” in Proc.IEEE INFOCOM, 2009.
[29] B. Han, P. Hui, V. A. Kumar, M. V. Marathe, G. Pei, and A. Srinivasan,“Cellular traffic offloading through opportunistic communications: a casestudy,” in Proc. CHANTS, 2010.
Related Documents