Reliance Capital Builder Fund II – Series C (A Close Ended Equity Oriented Scheme) Offer for Sale of Units at Rs.10/- per unit during the new fund offer period Tenure – 3 years from the date of allotment of units NFO Opens – March 9, 2015 NFO Closes – March 23, 2015

Reliance capital builder fund ii series c - presentation
Jul 18, 2015
Welcome message from author
This document is posted to help you gain knowledge. Please leave a comment to let me know what you think about it! Share it to your friends and learn new things together.
Transcript
Reliance Capital Builder Fund II – Series C (A Close Ended Equity Oriented Scheme) Offer for Sale of Units at Rs.10/- per unit during the new fund offer period
Tenure – 3 years from the date of allotment of units
NFO Opens – March 9, 2015
NFO Closes – March 23, 2015
Slide 2
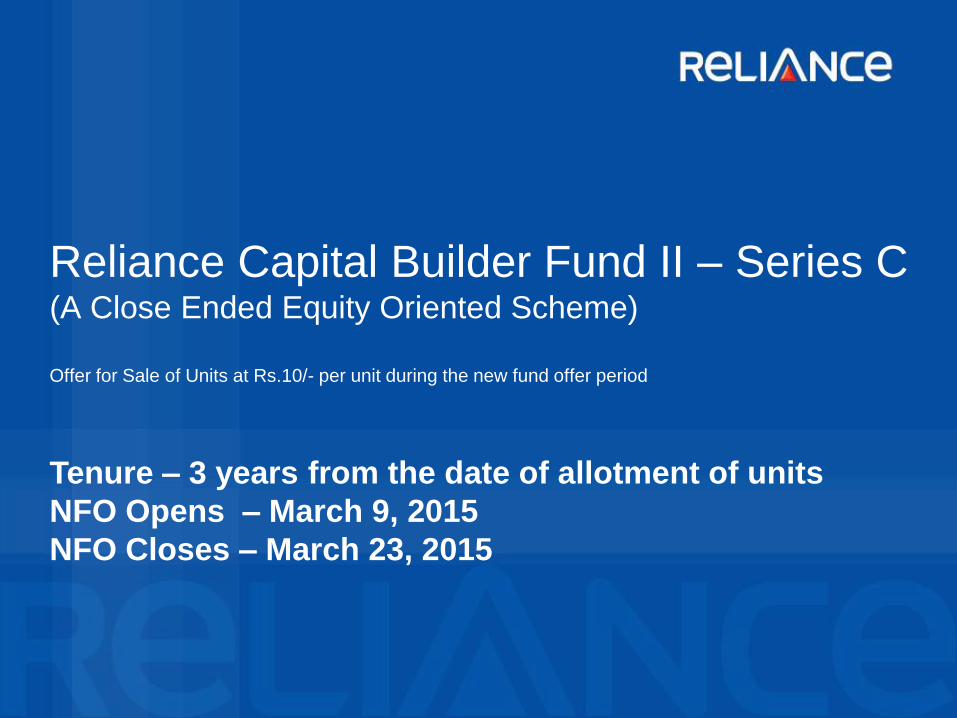
Reliance Capital Builder Fund II – Series C is suitable for investors who are seeking*:
· Long term capital growth
· Investment in diversified portfolio of equity & equity related instruments with small exposure to fixed income
securities
· High risk. (BROWN)
*Investors should consult their financial advisers if in doubt about whether the product is suitable for them.
Note: Risk is represented as:
(BLUE) investors understand
that their principal will be at
low risk
(YELLOW) investors
understand that their principal
will be at medium risk
(BROWN) investors
understand that their principal
will be at high risk

Slide
Market Outlook
3
Slide
Can growth surprise..!!!
4
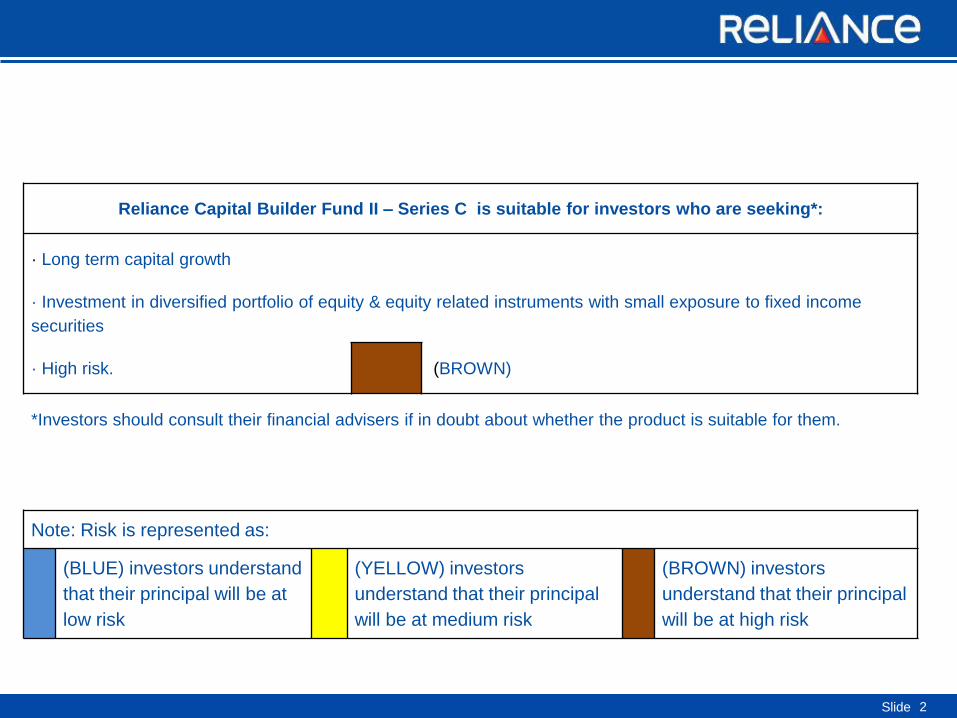
In the previous growth cycle, Earnings became ~3 times in less than 6
years….. Sensex grew 6 times.
Source: Bloomberg, BSE
Previous
Growth Cycle 31st March 2003 8th Jan 2008 Times(x) CAGR
S&P BSE Sensex
EPS 272 833 3.1x 26%
S&P BSE Sensex
Index Level 3,049 20,600 6.7x 49%
Today India is at the cusp of the biggest transformation it’ll
undergo…can growth surprise !!
Current S&P BSE Sensex EPS S&P BSE Sensex Index Level
February 25,
2015 1,467 29,007
Past performance may or may not be sustained in future

Slide
Macro economic trends continue to be positive
5
Source: Bloomberg. ^Data as on Jan 2015. *Data for FY 13-14 & Est for FY 14-15. PMI refers to HSBC/Markit manufacturing purchasing managers'
index.
Crude Oil ($/bbl) 108 61
THEN
(2014)
NOW
(2015)
WPI Inflation 6.2% -0.39%
GDP Growth 4.7% 5.3%
Foreign Reserves
(USD billion) 265 330
Fiscal Deficit* 4.6% 4.1%
PMI 51 53

Slide
Non-Linear shifts underway already…
6
Source: Bloomberg,
Sharp reduction in
import bills Decline in international prices of Crude Oil, Coal & Edible Oils.
Subsidy rationalization -
Fuel Price Deregulation
Diesel prices fully deregulated
LPG subsidy provided by Direct Transfer
FDI Liberalization Defense, Railways, Insurance (Pending parliament approval)
Infrastructure impetus Easy finance norms for banks to finance infra projects via 5/25 structure
PPP model made viable in sync with changing times
Project Monitoring Group
Fast-tracking / clearing several large projects
Project clearances doubled from $40bn in Feb’14 to over $100bn in
Nov’14
Power Sector Reforms E-auctions of Coal blocks - to be completed by March 2015
$50bn investments over next 5 years to reduce T &D losses
Manufacturing Revival ‘Make in India’ initiative to revive manufacturing & curtail Trade Deficit
Agriculture reforms Amendment of APMC Act & other initiatives, leading to inflation control.

Slide 7
Current Account moving from Deficit to Surplus
Source: CEIC, Morgan Stanley Research, Morgan Stanley Research Estimate

Slide
Manufacturing Activity Picking up
8
Full Momentum expected to pick up

Slide 9
On the ground activity picking up
Slide
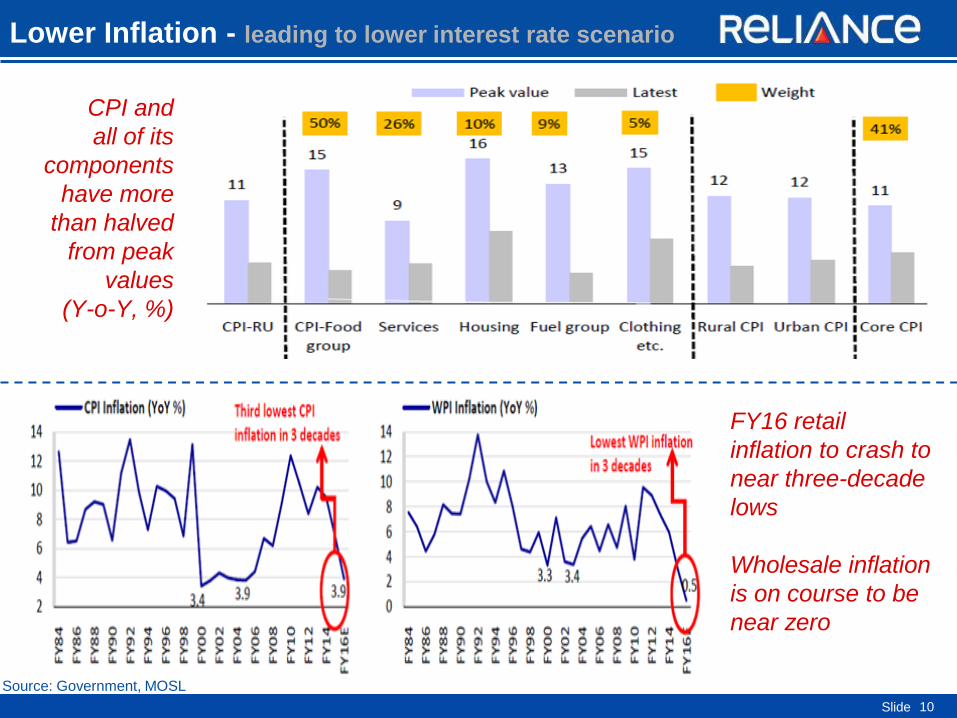
Lower Inflation - leading to lower interest rate scenario
10
CPI and
all of its
components
have more
than halved
from peak
values
(Y-o-Y, %)
Source: Government, MOSL
FY16 retail
inflation to crash to
near three-decade
lows
Wholesale inflation
is on course to be
near zero
Slide 11
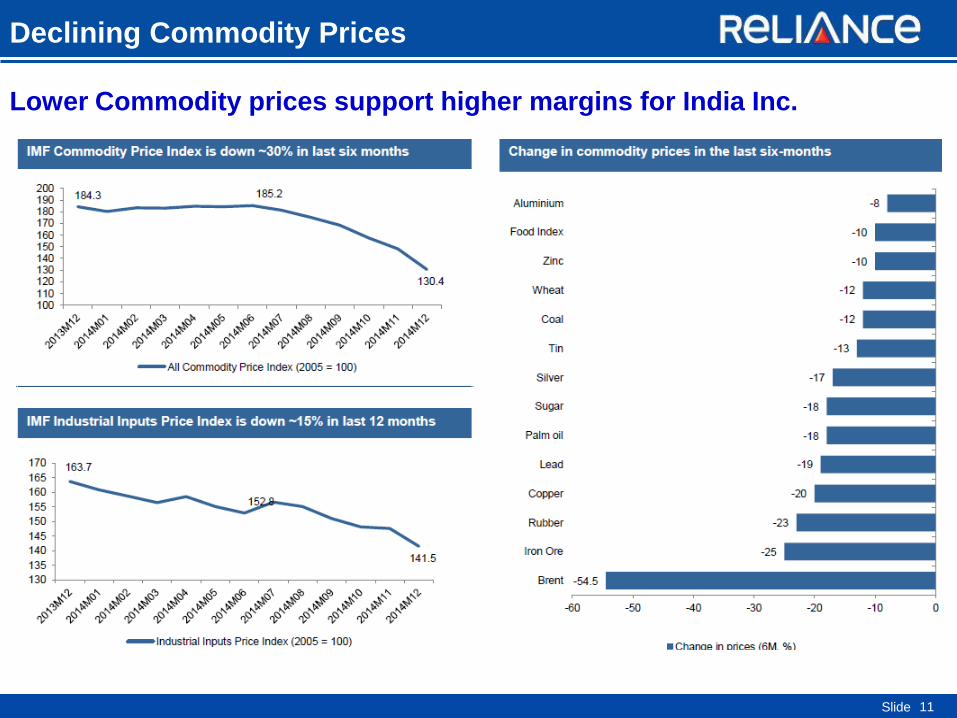
Declining Commodity Prices
Lower Commodity prices support higher margins for India Inc.

Slide
Earnings Trajectory
12
In 6yr, EPS 3x
Source : MOSL
Earnings expected to rebound
Source : MOSL

Slide
Valuations Remain Reasonable at ~16.4x 1yr Fwd & ~13.7x 2yr Fwd PE ( Valuations still tad above long-term average on cyclical low earnings )
13
SENSEX – 29,007 ( As on 25-Feb-15 )
FY 15 FY 16 FY 17
Sensex EPS 1,469 1,761 2,112
Sensex P/E ( Long-term avg. of fwd
multiples - ~15x )
19.7x 16.4x 13.7x
Source : MOSL Estimates.
Slide
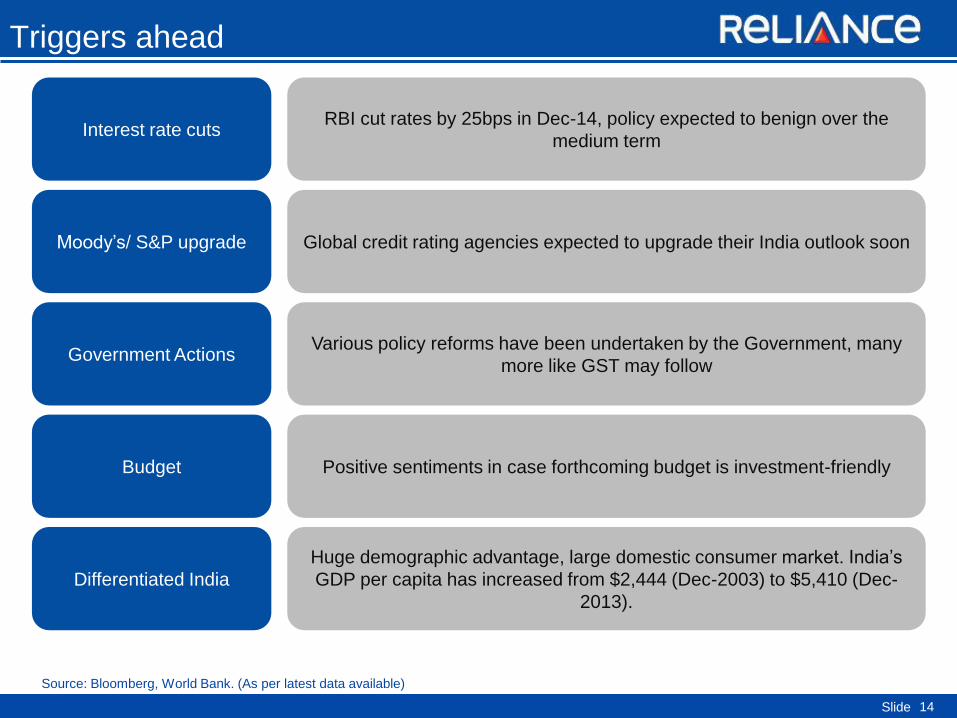
Triggers ahead
14
Source: Bloomberg, World Bank. (As per latest data available)
Interest rate cuts RBI cut rates by 25bps in Dec-14, policy expected to benign over the
medium term
Moody’s/ S&P upgrade Global credit rating agencies expected to upgrade their India outlook soon
Government Actions Various policy reforms have been undertaken by the Government, many
more like GST may follow
Budget Positive sentiments in case forthcoming budget is investment-friendly
Differentiated India
Huge demographic advantage, large domestic consumer market. India’s
GDP per capita has increased from $2,444 (Dec-2003) to $5,410 (Dec-
2013).

Slide
Investment Philosophy
15

Slide
Portfolio Philosophy
16
Triple benefits:
Alpha Generation through Active Fund Management
Higher Market Participation through Long Call Options
Put Options with an attempt to limit the downside risk of a portion of the
portfolio
Note: The current fund philosophy may change in future depending on market conditions or fund manager’s views.
Focus on High Quality Stocks
Strong track record of creating
alpha over benchmark for the
last 3 years
Call Options - provides
Higher Market Participation
Put Options – attempts to
limit the Downside Risk of a
portion of the portfolio
Direct Equity (80%) Options (20%)
Strategy
Slide
RMF Fund Management Expertise
17
Slide
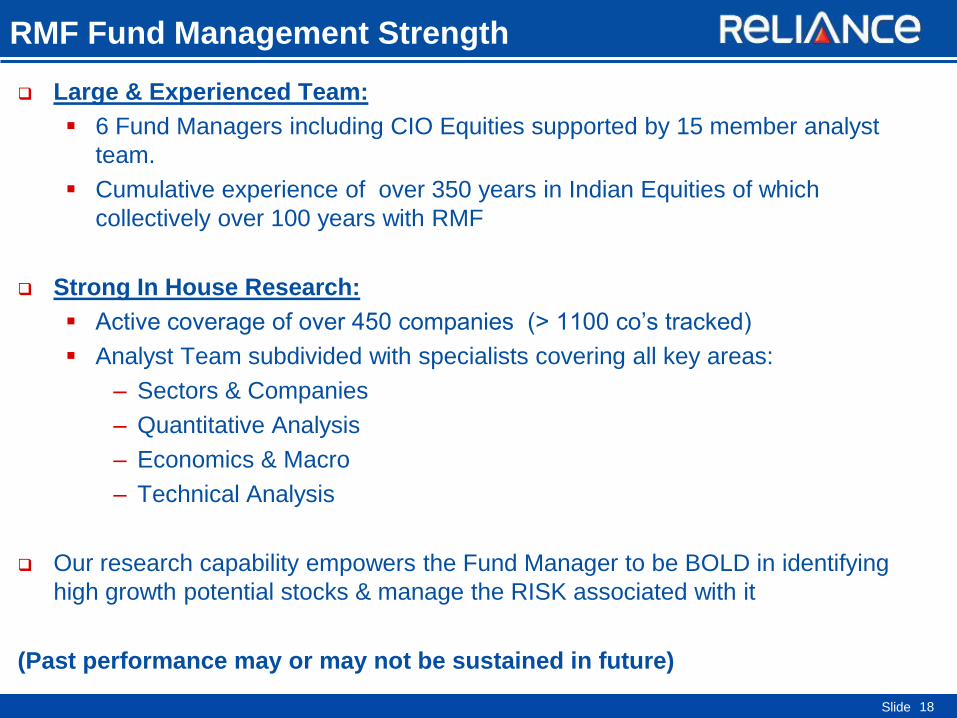
RMF Fund Management Strength
Large & Experienced Team:
6 Fund Managers including CIO Equities supported by 15 member analyst
team.
Cumulative experience of over 350 years in Indian Equities of which
collectively over 100 years with RMF
Strong In House Research:
Active coverage of over 450 companies (> 1100 co’s tracked)
Analyst Team subdivided with specialists covering all key areas:
– Sectors & Companies
– Quantitative Analysis
– Economics & Macro
– Technical Analysis
Our research capability empowers the Fund Manager to be BOLD in identifying
high growth potential stocks & manage the RISK associated with it
(Past performance may or may not be sustained in future)
18

Slide
Summary
19
Significant improvement in macro parameters
Stable government intent on bringing about reforms and taking pro-growth
measures positive
Earnings growth and PE rerating could lead to robust market
Unique Strategy to capture the growth momentum
Large & experienced team, with a track record of creating alpha

Slide
Scheme Facts
20

Slide
Scheme Features
21
Investment
Objective
Plans & Options
Minimum
Application
Amount
The investment objective of the scheme is to provide capital appreciation to the
investors, which will be in line with their long term savings goal, by investing in a
diversified portfolio of equity & equity related instruments with small exposure to
fixed income securities. Although, the objective of the Fund is to generate optimal
returns, the objective may or may not be achieved.
Growth & Dividend Payout Option
Direct Plan – Growth & Dividend Payout Option
Rs 5,000 and in multiples of Re 1 thereafter
Benchmark S&P BSE 200 Index
Asset Allocation Diversified Equity & Equity Related Instruments: 80%-100%
Debt & Money Market Instruments: 0%-20%
Load Structure
Entry Load - Nil.
Exit Load: Nil Since the scheme shall be listed on BSE or any other recognised
Stock Exchange, Exit load shall not be applicable.
Fund Manager Samir Rachh & Jahnvee Shah (Overseas Investments)
Slide
Scheme Specific Risk Factors: Trading volumes and settlement periods may restrict liquidity in equity and debt investments.
Investment in Debt is subject to price, credit, and interest rate risk. The NAV of the Scheme may be affected, inter alia, by changes in
the market conditions, interest rates, trading volumes, settlement periods and transfer procedures. The NAV may also be subjected to
risk associated with investment in derivatives, foreign securities or script lending as may be permissible by the Scheme Information
Document.
BSE Disclaimer: It is to be distinctly understood that the permission given by BSE Ltd. should not in any ways be deemed or
construed that the SID has been cleared or approved by BSE Ltd. nor does it certify the correctness or completeness of any of the
contents of the SID. The investors are advised to refer to the SID for the full text of the Disclaimer clause of the BSE Ltd.
Disclaimers
The information herein is meant only for general reading purposes and the views being expressed only constitute opinions and
therefore cannot be considered as guidelines, recommendations or as a professional guide for the readers. Certain factual and
statistical information (historical as well as projected) pertaining to Industry and markets have been obtained from independent third-
party sources, which are deemed to be reliable. It may be noted that since RCAM has not independently verified the accuracy or
authenticity of such information or data, or for that matter the reasonableness of the assumptions upon which such data and
information has been processed or arrived at; RCAM does not in any manner assures the accuracy or authenticity of such data and
information. Some of the statements & assertions contained in these materials may reflect RCAM’s views or opinions, which in turn
may have been formed on the basis of such data or information.
Before making any investments, the readers are advised to seek independent professional advice, verify the contents in order to arrive
at an informed investment decision. None of the Sponsor, the Investment Manager, the Trustee, their respective directors, employees,
affiliates or representatives shall be liable in any way for any direct, indirect, special, incidental, consequential, punitive or exemplary
damages, including on account of lost profits arising from the information contained in this material.
Mutual Fund investments are subject to market risks, read all scheme related documents carefully.
22

Thank you
Related Documents