Reliability in pavement design Paola Dalla Valle 1, a , Nick Thom 2 1 Arup, Solihull, United Kingdom 2 NTEC, University of Nottingham, Nottingham, United Kingdom a [email protected] Digital Object Identifier (DOI): dx.doi.org/10.14311/EE.2016.033 ABSTRACT This research presents a methodology that accounts for variability of the main pavement design input variables (asphalt modulus and thickness, subgrade modulus) and uncertainties due to lack-of-fit of the design models and assesses effects on pavement performance. Variability is described by statistical terms such as mean and standard deviation and by its probability density distribution. The subject of reliability in pavement design has pushed many highway organisations around the world to review their design methodologies, mainly empirical, to move towards mechanistic-empirical (M-E) analysis and design which provide the tools for the designer to evaluate the effect of variations in materials on pavement performance. This research has reinforced this need for considering the variability of design parameters in the design procedure and to conceive a pavement system in a probabilistic way. This study only considered flexible pavements. The sites considered for the analysis, all in the UK, were mainly motorways or major trunk roads. Pavement survey data analysed were for Lane 1, the most heavily trafficked lane. Sections 1km long were considered wherever possible. Statistical characterisation of the variation of layer thickness, asphalt stiffness and subgrade stiffness is addressed. A model is then proposed which represents an improvement on the Method of Equivalent Thickness for the rapid and repeated calculation of performance life for flexible pavements. The output is a statistical assessment of the estimated pavement performance. Rather than the single deterministic result that would be derived by considering average values of input variables, a range of values and probabilities is found for any particular outcome. The proposed model to calculate the fatigue and deformation lives is very fast and simple, can be included in a spreadsheet, and is well suited to use in a pavement management system where stresses and strains must be calculated millions of times. The research shows that the probability distributions of the performance lives follow a lognormal distribution. The coefficient of variation of all sites considered varies from a minimum of 45% to a maximum of 227% for the fatigue life and from a minimum of 39% to a maximum of 315% for the deformation life. Keywords: Design of pavement E&E Congress 2016 | 6th Eurasphalt & Eurobitume Congress | 1-3 June 2016 | Prague, Czech Republic

Welcome message from author
This document is posted to help you gain knowledge. Please leave a comment to let me know what you think about it! Share it to your friends and learn new things together.
Transcript
Reliability in pavement design
Paola Dalla Valle1, a, Nick Thom2
1 Arup, Solihull, United Kingdom2 NTEC, University of Nottingham, Nottingham, United Kingdom
Digital Object Identifier (DOI): dx.doi.org/10.14311/EE.2016.033
ABSTRACTThis research presents a methodology that accounts for variability of the main pavement design input variables (asphalt modulusand thickness, subgrade modulus) and uncertainties due to lack-of-fit of the design models and assesses effects on pavementperformance. Variability is described by statistical terms such as mean and standard deviation and by its probability densitydistribution.The subject of reliability in pavement design has pushed many highway organisations around the world to review their designmethodologies, mainly empirical, to move towards mechanistic-empirical (M-E) analysis and design which provide the tools forthe designer to evaluate the effect of variations in materials on pavement performance. This research has reinforced this need forconsidering the variability of design parameters in the design procedure and to conceive a pavement system in a probabilisticway.This study only considered flexible pavements. The sites considered for the analysis, all in the UK, were mainly motorways ormajor trunk roads. Pavement survey data analysed were for Lane 1, the most heavily trafficked lane. Sections 1km long wereconsidered wherever possible.Statistical characterisation of the variation of layer thickness, asphalt stiffness and subgrade stiffness is addressed. A model isthen proposed which represents an improvement on the Method of Equivalent Thickness for the rapid and repeated calculationof performance life for flexible pavements. The output is a statistical assessment of the estimated pavement performance. Ratherthan the single deterministic result that would be derived by considering average values of input variables, a range of values andprobabilities is found for any particular outcome. The proposed model to calculate the fatigue and deformation lives is very fastand simple, can be included in a spreadsheet, and is well suited to use in a pavement management system where stresses andstrains must be calculated millions of times.The research shows that the probability distributions of the performance lives follow a lognormal distribution. The coefficient ofvariation of all sites considered varies from a minimum of 45% to a maximum of 227% for the fatigue life and from a minimum of39% to a maximum of 315% for the deformation life.
Keywords:Design of pavement
E&E Congress 2016 | 6th Eurasphalt & Eurobitume Congress | 1-3 June 2016 | Prague, Czech Republic
Abstract
This research presents a methodology that accounts for variability of the main pavement design input variables
(asphalt modulus and thickness, subgrade modulus) and uncertainties due to lack-of-fit of the design models and
assesses effects on pavement performance. Variability is described by statistical terms such as mean and standard
deviation and by its probability density distribution.
The subject of reliability in pavement design has pushed many highway organisations around the world to review
their design methodologies, mainly empirical, to move towards mechanistic-empirical (M-E) analysis and design
which provide the tools for the designer to evaluate the effect of variations in materials on pavement performance.
This research has reinforced this need for considering the variability of design parameters in the design procedure
and to conceive a pavement system in a probabilistic way.
This study only considered flexible pavements. The sites considered for the analysis, all in the UK, were mainly
motorways or major trunk roads. Pavement survey data analysed were for Lane 1, the most heavily trafficked
lane. Sections 1km long were considered wherever possible.
Statistical characterisation of the variation of layer thickness, asphalt stiffness and subgrade stiffness is addressed.
A model is then proposed which represents an improvement on the Method of Equivalent Thickness for the rapid
and repeated calculation of performance life for flexible pavements. The output is a statistical assessment of the
estimated pavement performance. Rather than the single deterministic result that would be derived by considering
average values of input variables, a range of values and probabilities is found for any particular outcome. The
proposed model to calculate the fatigue and deformation lives is very fast and simple, can be included in a
spreadsheet, and is well suited to use in a pavement management system where stresses and strains must be
calculated millions of times.
The research shows that the probability distributions of the performance lives follow a lognormal distribution.
The coefficient of variation of all sites considered varies from a minimum of 45% to a maximum of 227% for the
fatigue life and from a minimum of 39% to a maximum of 315% for the deformation life.
E&E Congress 2016 | 6th Eurasphalt & Eurobitume Congress | 1-3 June 2016 | Prague, Czech Republic
1 INTRODUCTION
Most pavement engineers know that pavement materials, environment, loading and construction affect the
performance of a pavement and the variability observed in each of these parameters introduces a certain level of
risk. The recognised need to account for these variabilities in the design process is pushing many highway
authorities in the world to move from a traditional deterministic approach, based on a single input/output value,
towards a probabilistic design, which includes a mean, variance and probability distribution. The probabilistic
approach offers a way of incorporating risk assessment considerations which are vital for whole-life cycle
economic analysis and decisions.
This paper presents the results of a research study on the variability of the most important factors involved in the
pavement design, namely the layer thickness, asphalt stiffness and subgrade stiffness. Of course it is
acknowledged that many other factors (notably fatigue resistance) affect pavement life in reality; however,
stiffness modulus and layer thickness are the variables generally considered in analytical pavement design.
Variability is described by statistical terms such as mean and standard deviation and by its probability density
distribution. A model is then proposed which represents an improvement on the Method of Equivalent Thickness
(MET) for the calculation of fatigue life for flexible pavements. An alternative model is also proposed for the
calculation of deformation life, which accepts a ‘relaxation’ in one of the MET conditions. The models provide
a simple and efficient method for practical purposes, for example in Pavement Management Systems or in
simulation of pavement deterioration, where stresses and strains must be calculated a large number of times.
The scope of the study is to consider flexible pavements only and to consider thickness data from non-destructive
radar surveys. The sites considered for the analysis, all in the UK (including Northern Ireland), are mainly
motorways or major trunk roads. The focus of the analysis remains on Lane 1, the most heavily trafficked lane,
and sections 1km long were considered wherever possible. A total of eight sites were considered in the research.
A Monte Carlo Simulation technique was employed to estimate the variability of the fatigue and deformation life
of all considered pavement structures to account for uncertainty of the input variables.
1.1 Definition of failure
A pavement is designed to withstand the design traffic during its design life. A pavement failure is characterised
by the development of a particular type of distress (such as fatigue cracking and rutting on flexible pavements) of
sufficient severity and extent at different points within a pavement section. Despite a pavement section being
designed and constructed the same way, random variations in material properties and as-built characteristics cause
localised deficiencies.
1.1.1 Stress calculation
A number of different analytical models can be used to predict the stress, strain and deformation in a pavement
under simulated wheel and environmental loading conditions. The main models are based on multilayer elastic
theory and Finite Element analysis.
In this research, Odemark’s Method of Equivalent Thicknesses (MET) (Ullidtz, 1987) and Shell’s specialist
software “BISAR” were used to calculate the stresses and strains for various pavement structures.
1.1.2 Transfer functions
Transfer functions are relationships developed to relate the state of stress or strain in a pavement to its overall
performance. In current M-E design procedures for flexible pavements – despite the multitude of relationships
available – the primary transfer functions are those that relate 1) wheel load tensile strain at the bottom of the
asphalt layers to eventual fatigue cracking and 2) wheel load compressive strain (or stress) at the top of the
subgrade to permanent deformation.
The performance prediction models used in the UK and adopted in this paper are (Powell et al., 1984):
Structural cracking: the number of traffic loads to fatigue failure (Nf) of asphalt layers is determined on the
basis of horizontal tensile strain at the bottom of the asphalt layer (r):
𝑙𝑜𝑔𝑁𝑓 = −9.38 − 4.16 ∗ 𝑙𝑜𝑔𝜀𝑟 (1)
Structural deformation: the number of traffic loads to deformation (rutting) failure (Nd) is determined on the
basis of vertical compressive strain at the top of the subgrade (z):
𝑙𝑜𝑔𝑁𝑑 = −7.21 − 3.95 ∗ 𝑙𝑜𝑔𝜀𝑧 (2)
E&E Congress 2016 | 6th Eurasphalt & Eurobitume Congress | 1-3 June 2016 | Prague, Czech Republic
2 IMPACT OF VARIABILITY ON PAVEMENT PERFORMANCE
Many pavement design procedures are based around single values of the pavement and traffic characteristics
which represent average conditions – average values, sometimes with a margin of safety, that do not account for
variability in the pavement and traffic loads. Variability exists in pavements due to construction practices, quality
control, environmental conditions, material characteristics and traffic conditions and this variability has been
known for quite a while (Darter et al., 1973). Therefore, the major design input parameters for pavement design
such as moduli of layers, thickness of layers, traffic volume etc. should each be defined as a random variable with
its mean and standard deviation (assuming a normal distribution) or its complete probability distribution. The
pavement performance function can subsequently also be characterised in statistical terms. In other words,
because the values used to calculate the performance life of a pavement structure (e.g. fatigue life Nf) are not exact
values but are distributed over a range, for each pavement there is an expected value of Nf and associated variance
that describes the distribution Nf will follow. George and Husain (1986) and later Prozzi and Guo (2007) have
supported previous significant experimental evidence that the distribution of fatigue lives at a particular stress
level is lognormal. Quantifying and analysing variability of pavement materials and design inputs are, therefore,
fundamental in developing a probabilistic-based design that evaluates reliability. Material variability can be
described by statistical terms such as mean and standard deviation together with its probability density
distribution. A useful dimensionless way of expressing the variability of a material’s property is to use the ratio
of the standard deviation over the mean, known as coefficient of variation (COV). Knowledge of the coefficient
of variation of each design input is extremely important to more accurately estimate their influence on the
predicted pavement life.
2.1 Summary of variability of design input parameters
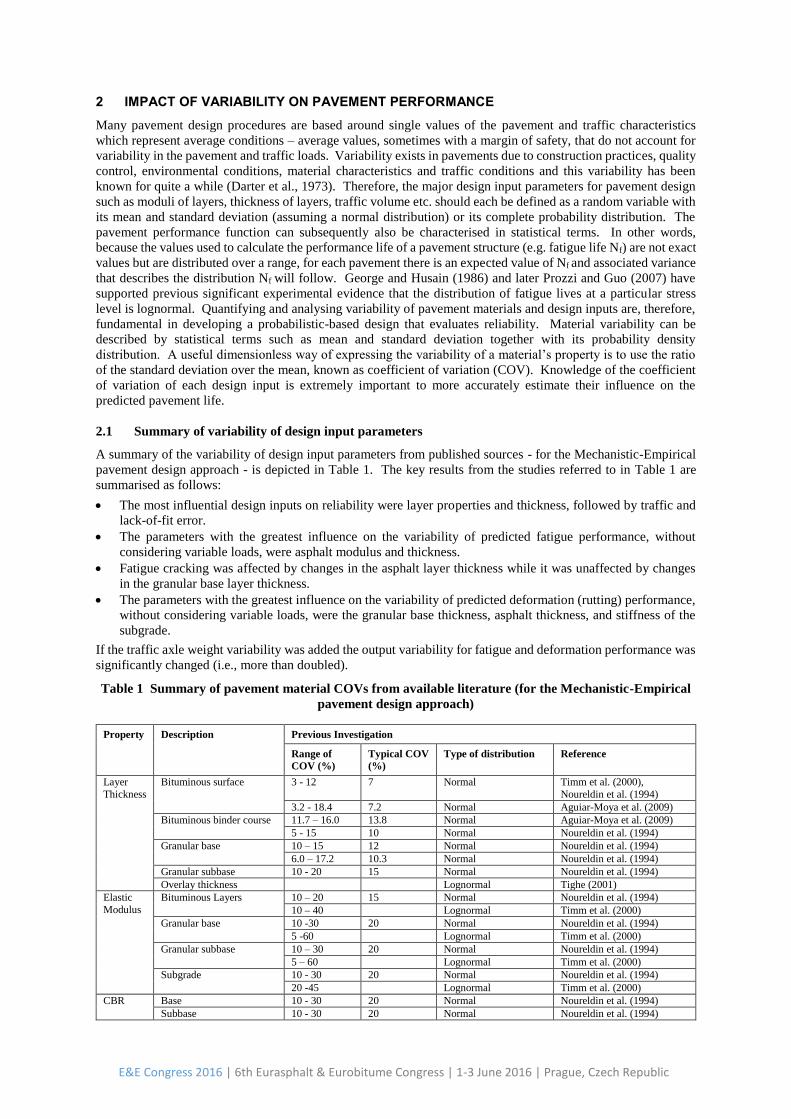
A summary of the variability of design input parameters from published sources - for the Mechanistic-Empirical
pavement design approach - is depicted in Table 1. The key results from the studies referred to in Table 1 are
summarised as follows:
The most influential design inputs on reliability were layer properties and thickness, followed by traffic and
lack-of-fit error.
The parameters with the greatest influence on the variability of predicted fatigue performance, without
considering variable loads, were asphalt modulus and thickness.
Fatigue cracking was affected by changes in the asphalt layer thickness while it was unaffected by changes
in the granular base layer thickness.
The parameters with the greatest influence on the variability of predicted deformation (rutting) performance,
without considering variable loads, were the granular base thickness, asphalt thickness, and stiffness of the
subgrade.
If the traffic axle weight variability was added the output variability for fatigue and deformation performance was
significantly changed (i.e., more than doubled).
Table 1 Summary of pavement material COVs from available literature (for the Mechanistic-Empirical
pavement design approach)
Property Description Previous Investigation
Range of
COV (%)
Typical COV
(%)
Type of distribution Reference
Layer
Thickness
Bituminous surface 3 - 12 7 Normal Timm et al. (2000),
Noureldin et al. (1994)
3.2 - 18.4 7.2 Normal Aguiar-Moya et al. (2009)
Bituminous binder course 11.7 – 16.0 13.8 Normal Aguiar-Moya et al. (2009)
5 - 15 10 Normal Noureldin et al. (1994)
Granular base 10 – 15 12 Normal Noureldin et al. (1994)
6.0 – 17.2 10.3 Normal Noureldin et al. (1994)
Granular subbase 10 - 20 15 Normal Noureldin et al. (1994)
Overlay thickness Lognormal Tighe (2001)
Elastic
Modulus
Bituminous Layers 10 – 20 15 Normal Noureldin et al. (1994)
10 – 40 Lognormal Timm et al. (2000)
Granular base 10 -30 20 Normal Noureldin et al. (1994)
5 -60 Lognormal Timm et al. (2000)
Granular subbase 10 – 30 20 Normal Noureldin et al. (1994)
5 – 60 Lognormal Timm et al. (2000)
Subgrade 10 - 30 20 Normal Noureldin et al. (1994)
20 -45 Lognormal Timm et al. (2000)
CBR Base 10 - 30 20 Normal Noureldin et al. (1994)
Subbase 10 - 30 20 Normal Noureldin et al. (1994)
E&E Congress 2016 | 6th Eurasphalt & Eurobitume Congress | 1-3 June 2016 | Prague, Czech Republic
Property Description Previous Investigation
Range of
COV (%)
Typical COV
(%)
Type of distribution Reference
Subgrade 10 - 30 20 Normal Noureldin et al. (1994)
Traffic - Extreme Value Type I Timm et al. (2000)
- Normal, Lognormal
and Poisson
Zollinger and McCullough
(1994)
3 RESEARCH METHODOLOGY INTO STATISTICAL CHARACTERISATION OF THE MAIN PAVEMENT DESIG INPUT VARIABLES
The sites used in the research were eight in total. M01 to M06 were motorways (asphalt thickness ranging from
0.260m to 0.480m), with two further sites being of a thinner pavement construction (M07 and M08). All sites
had a fully flexible construction. The survey data available for these sites were: GPR (Ground Penetrating Radar),
cores, FWD (Falling Weight Deflectometer), DCP (Dynamic Cone Penetrometer), ITSM (Indirect Tensile
Stiffness Modulus) and traffic data. The survey data referred to lane 1, the most heavily trafficked lane. The
length of each site varied but, wherever possible, a length of 1km was used. Specialist software packages were
used, including BISAR (Version 3.0, Shell, UK) for calculation of stresses and strains in the pavement structure
and MODULUS-HA (Version 5.1, Highways Agency, UK) for FWD back-analysis. The following sections
summarise the results of the statistical characterisation of the main pavement design input variables, namely
asphalt modulus and thickness, and subgrade modulus.
3.1 Statistical characterisation of layer thickness variability
The pavement performance can vary significantly due to the variability in pavement layer thickness, which is
mainly due to the construction process and quality control procedures in place. Therefore, even though a unique
design thickness is specified for a road section, the actual (as-built) thickness is not constant. The pavement layer
thickness is expected to have a certain probability distribution with a higher density around the mean target
thickness. Layer thickness information, obtained GPR surveys, has been calibrated by means of cores.
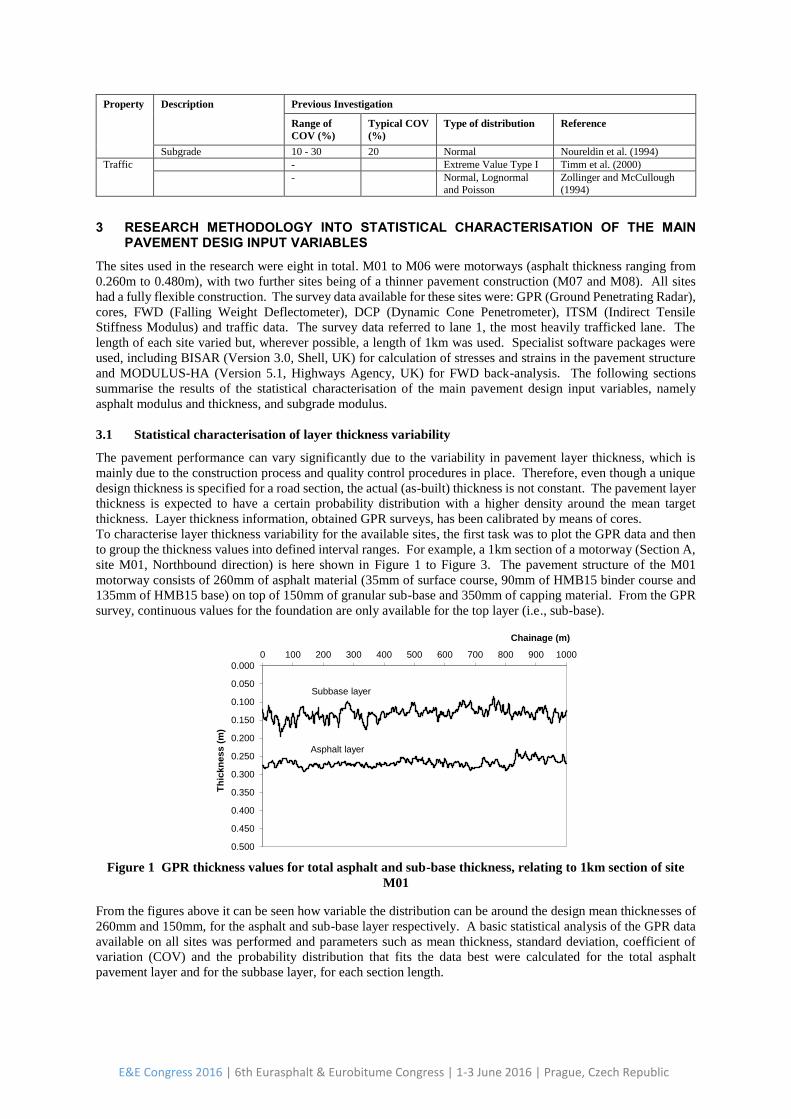
To characterise layer thickness variability for the available sites, the first task was to plot the GPR data and then
to group the thickness values into defined interval ranges. For example, a 1km section of a motorway (Section A,
site M01, Northbound direction) is here shown in Figure 1 to Figure 3. The pavement structure of the M01
motorway consists of 260mm of asphalt material (35mm of surface course, 90mm of HMB15 binder course and
135mm of HMB15 base) on top of 150mm of granular sub-base and 350mm of capping material. From the GPR
survey, continuous values for the foundation are only available for the top layer (i.e., sub-base).
Figure 1 GPR thickness values for total asphalt and sub-base thickness, relating to 1km section of site
M01
From the figures above it can be seen how variable the distribution can be around the design mean thicknesses of
260mm and 150mm, for the asphalt and sub-base layer respectively. A basic statistical analysis of the GPR data
available on all sites was performed and parameters such as mean thickness, standard deviation, coefficient of
variation (COV) and the probability distribution that fits the data best were calculated for the total asphalt
pavement layer and for the subbase layer, for each section length.
0.000
0.050
0.100
0.150
0.200
0.250
0.300
0.350
0.400
0.450
0.500
0 100 200 300 400 500 600 700 800 900 1000
Th
ickn
ess (
m)
Chainage (m)
M01 Lane 1 Northbound - Section APavement layer thicknesses (GPR)
Asphalt layer
Subbase layer
E&E Congress 2016 | 6th Eurasphalt & Eurobitume Congress | 1-3 June 2016 | Prague, Czech Republic
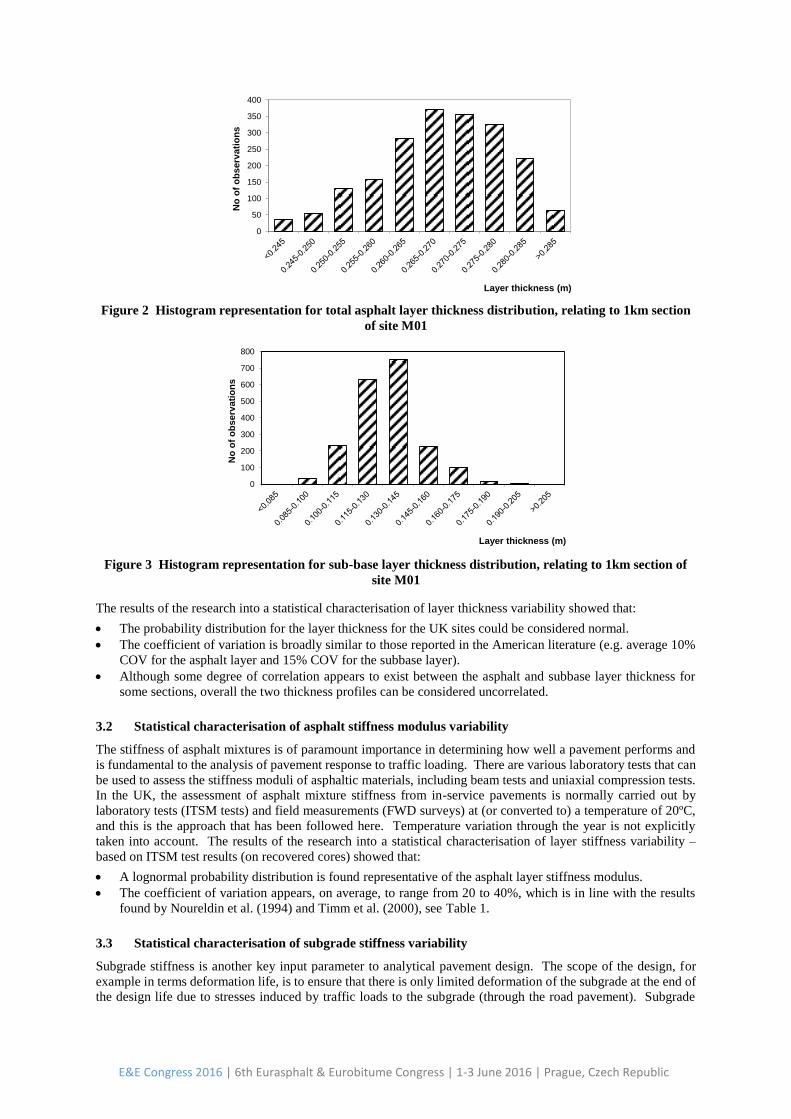
Figure 2 Histogram representation for total asphalt layer thickness distribution, relating to 1km section
of site M01
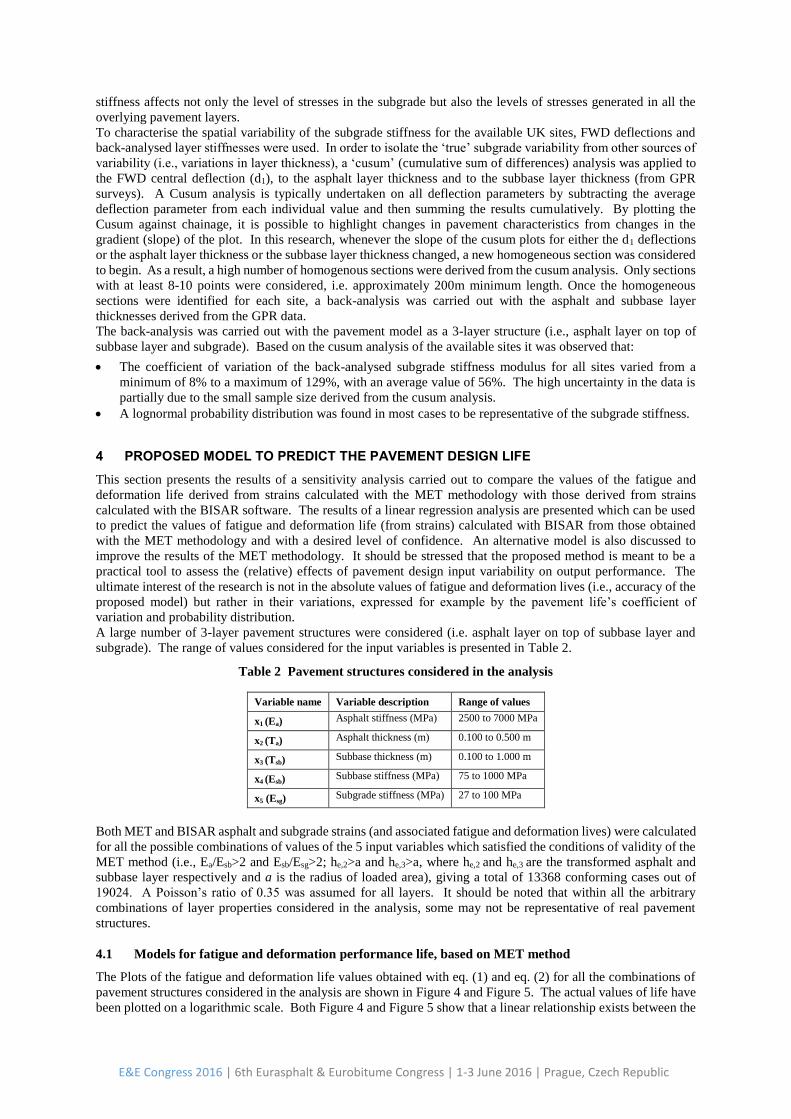
Figure 3 Histogram representation for sub-base layer thickness distribution, relating to 1km section of
site M01
The results of the research into a statistical characterisation of layer thickness variability showed that:
The probability distribution for the layer thickness for the UK sites could be considered normal.
The coefficient of variation is broadly similar to those reported in the American literature (e.g. average 10%
COV for the asphalt layer and 15% COV for the subbase layer).
Although some degree of correlation appears to exist between the asphalt and subbase layer thickness for
some sections, overall the two thickness profiles can be considered uncorrelated.
3.2 Statistical characterisation of asphalt stiffness modulus variability
The stiffness of asphalt mixtures is of paramount importance in determining how well a pavement performs and
is fundamental to the analysis of pavement response to traffic loading. There are various laboratory tests that can
be used to assess the stiffness moduli of asphaltic materials, including beam tests and uniaxial compression tests.
In the UK, the assessment of asphalt mixture stiffness from in-service pavements is normally carried out by
laboratory tests (ITSM tests) and field measurements (FWD surveys) at (or converted to) a temperature of 20ºC,
and this is the approach that has been followed here. Temperature variation through the year is not explicitly
taken into account. The results of the research into a statistical characterisation of layer stiffness variability –
based on ITSM test results (on recovered cores) showed that:
A lognormal probability distribution is found representative of the asphalt layer stiffness modulus.
The coefficient of variation appears, on average, to range from 20 to 40%, which is in line with the results
found by Noureldin et al. (1994) and Timm et al. (2000), see Table 1.
3.3 Statistical characterisation of subgrade stiffness variability
Subgrade stiffness is another key input parameter to analytical pavement design. The scope of the design, for
example in terms deformation life, is to ensure that there is only limited deformation of the subgrade at the end of
the design life due to stresses induced by traffic loads to the subgrade (through the road pavement). Subgrade
0
50
100
150
200
250
300
350
400
No
of
ob
serv
ati
on
s
Layer thickness (m)
Total Asphalt Thickness - M01 Northbound Lane1 Section A
0
100
200
300
400
500
600
700
800
No
of
ob
serv
ati
on
s
Layer thickness (m)
Sub-base Thickness- M01 Northbound Lane 1 Section A
E&E Congress 2016 | 6th Eurasphalt & Eurobitume Congress | 1-3 June 2016 | Prague, Czech Republic
stiffness affects not only the level of stresses in the subgrade but also the levels of stresses generated in all the
overlying pavement layers.
To characterise the spatial variability of the subgrade stiffness for the available UK sites, FWD deflections and
back-analysed layer stiffnesses were used. In order to isolate the ‘true’ subgrade variability from other sources of
variability (i.e., variations in layer thickness), a ‘cusum’ (cumulative sum of differences) analysis was applied to
the FWD central deflection (d1), to the asphalt layer thickness and to the subbase layer thickness (from GPR
surveys). A Cusum analysis is typically undertaken on all deflection parameters by subtracting the average
deflection parameter from each individual value and then summing the results cumulatively. By plotting the
Cusum against chainage, it is possible to highlight changes in pavement characteristics from changes in the
gradient (slope) of the plot. In this research, whenever the slope of the cusum plots for either the d1 deflections
or the asphalt layer thickness or the subbase layer thickness changed, a new homogeneous section was considered
to begin. As a result, a high number of homogenous sections were derived from the cusum analysis. Only sections
with at least 8-10 points were considered, i.e. approximately 200m minimum length. Once the homogeneous
sections were identified for each site, a back-analysis was carried out with the asphalt and subbase layer
thicknesses derived from the GPR data.
The back-analysis was carried out with the pavement model as a 3-layer structure (i.e., asphalt layer on top of
subbase layer and subgrade). Based on the cusum analysis of the available sites it was observed that:
The coefficient of variation of the back-analysed subgrade stiffness modulus for all sites varied from a
minimum of 8% to a maximum of 129%, with an average value of 56%. The high uncertainty in the data is
partially due to the small sample size derived from the cusum analysis.
A lognormal probability distribution was found in most cases to be representative of the subgrade stiffness.
4 PROPOSED MODEL TO PREDICT THE PAVEMENT DESIGN LIFE
This section presents the results of a sensitivity analysis carried out to compare the values of the fatigue and
deformation life derived from strains calculated with the MET methodology with those derived from strains
calculated with the BISAR software. The results of a linear regression analysis are presented which can be used
to predict the values of fatigue and deformation life (from strains) calculated with BISAR from those obtained
with the MET methodology and with a desired level of confidence. An alternative model is also discussed to
improve the results of the MET methodology. It should be stressed that the proposed method is meant to be a
practical tool to assess the (relative) effects of pavement design input variability on output performance. The
ultimate interest of the research is not in the absolute values of fatigue and deformation lives (i.e., accuracy of the
proposed model) but rather in their variations, expressed for example by the pavement life’s coefficient of
variation and probability distribution.
A large number of 3-layer pavement structures were considered (i.e. asphalt layer on top of subbase layer and
subgrade). The range of values considered for the input variables is presented in Table 2.
Table 2 Pavement structures considered in the analysis
Variable name Variable description Range of values
x1 (Ea) Asphalt stiffness (MPa) 2500 to 7000 MPa
x2 (Ta) Asphalt thickness (m) 0.100 to 0.500 m
x3 (Tsb) Subbase thickness (m) 0.100 to 1.000 m
x4 (Esb) Subbase stiffness (MPa) 75 to 1000 MPa
x5 (Esg) Subgrade stiffness (MPa) 27 to 100 MPa
Both MET and BISAR asphalt and subgrade strains (and associated fatigue and deformation lives) were calculated
for all the possible combinations of values of the 5 input variables which satisfied the conditions of validity of the
MET method (i.e., Ea/Esb>2 and Esb/Esg>2; he,2>a and he,3>a, where he,2 and he,3 are the transformed asphalt and
subbase layer respectively and a is the radius of loaded area), giving a total of 13368 conforming cases out of
19024. A Poisson’s ratio of 0.35 was assumed for all layers. It should be noted that within all the arbitrary
combinations of layer properties considered in the analysis, some may not be representative of real pavement
structures.
4.1 Models for fatigue and deformation performance life, based on MET method
The Plots of the fatigue and deformation life values obtained with eq. (1) and eq. (2) for all the combinations of
pavement structures considered in the analysis are shown in Figure 4 and Figure 5. The actual values of life have
been plotted on a logarithmic scale. Both Figure 4 and Figure 5 show that a linear relationship exists between the
E&E Congress 2016 | 6th Eurasphalt & Eurobitume Congress | 1-3 June 2016 | Prague, Czech Republic
logarithms of life values derived by strains calculated with the MET method and those derived by strains
calculated with the BISAR software; 95% prediction limits and the line of best fit are also shown. Despite a
positive correlation between the two methods and an excellent agreement for deformation life, the prediction
interval is quite wide for the fatigue life. The width of the prediction interval gives an indication of the error of
the fitted model.
4.2 Regression analysis for alternative fatigue model – 2-layer pavement structure
An alternative model is proposed that represents an improvement to the Method of Equivalent Thickness for the
calculation of fatigue life for flexible pavements. The aim of the proposed analysis was to reduce the differences
between the two methods (i.e., BISAR and MET). The proposed method transforms a 3-layer pavement structure
(i.e. asphalt + subbase + subgrade) into a 2-layer structure (i.e. asphalt + Equivalent Foundation Modulus, EFM),
see Figure 6, to which structure the MET method is applied for the calculation of the asphalt strain.
A reasonable model was found for the Equivalent Foundation Modulus that together with the overlaying asphalt
layer would give the same asphalt strain, under the same wheel load, as that of the original 3-layer pavement
structure calculated with BISAR. Through the help of the DataFit curve fitting (nonlinear regression) software
developed by Oakdale Engineering, the following empirical equation was found to give satisfactory results for
the calculation of the Equivalent Foundation Modulus:
1
22
22
1
2
1
***x
xfxe
x
dxc
x
baEFM (MPa)
(3)
where x1 is the asphalt stiffness Ea (MPa), and x2 is a relationship used to combine the foundation layers of the
original 3-layer pavement structure into an Equivalent Foundation Modulus of the derived 2-layer pavement
structure:
subbasea
subgradeasubbasesubbase
ha
EaEhx
2
(MPa)
(4)
where h is the layer thickness (m), E is the layer stiffness (MPa) and the coefficient aa was taken as being equal
to the asphalt layer thickness Ta (m). The coefficients a, b, c, d, e, and f are expressed as functions of the asphalt
layer thickness Ta (m). Once again, through the help of the DataFit software, the following empirical equation
was found to give satisfactory results:
𝑅𝑒𝑔𝑟𝑒𝑠𝑠𝑖𝑜𝑛 𝑐𝑜𝑒𝑓𝑓𝑖𝑐𝑖𝑒𝑛𝑡(𝑒. 𝑔. , 𝑎) = 𝐴 +𝐵
𝑥+
𝐶
𝑥2+
𝐷
𝑥3+
𝐸
𝑥4
(5)
Where x is the asphalt layer thickness (Ta in m) and the coefficients A to E have the values shown in Table 3.
Table 3 Regression coefficients of eq. (3)
Reg.
Coef
Model; x = asphalt
thickness (Ta) A B C D E
a a = A+B/x+C/x2+D/x3+E/x4 26.606967401 129.912891954 -49.319548592 7.301332943 -0.345622247
b b = A+B/x+C/x2+D/x3+E/x4 -87667.529214 -535073.852860 213149.524856 -32034.952778 1521.194882
c c = A+B/x+C/x2+D/x3+E/x4 0.1691763061 -0.7465396808 0.3210524112 -0.0378270353 0.0014378311
d d = A+B/x+C/x2+D/x3+E/x4 201197630.36 361553695.08 -176829148.36 30981138.47 -1588370.81
e e = A+B/x+C/x2+D/x3+E/x4 0.000715335 0.000284491 -0.000112130 0.000010891 -0.000000320
f f = A+B/x+C/x2+D/x3+E/x4 668.2107947 1779.5723425 -634.9457631 71.8146871 -2.6928747
4.3 Alternative model for fatigue performance prediction
In order to implement the proposed model for the calculation of asphalt strains and fatigue life, the original 3-
layer pavement structure must first be transformed into a 2-layer pavement structure by applying eq. (3), (4) and
(5). The MET method is then applied to the derived 2-layer pavement structure to calculate the strain at the bottom
of the asphalt layer. After applying the conditions of validity of the MET method to the transformed 2-layer
structure (i.e., Ea/EFM>2 and he,2>a) a total of 18597 out of the original 19024 combinations conformed. The
fatigue life was calculated for the asphalt strains derived using the alternative model. The plot of the fatigue life
derived from asphalt tensile strains calculated with the MET method on the simplified 2-layer pavement structure
versus the fatigue life derived from asphalt tensile strains calculated with the BISAR software on the original 3-
layer pavement structure is illustrated in Figure 7. It can be seen that the proposed model offers a much better
estimate of the mean asphalt fatigue life when compared to the traditional 3-layer pavement structure model in
Figure 4. The width of the prediction interval is also greatly reduced.
E&E Congress 2016 | 6th Eurasphalt & Eurobitume Congress | 1-3 June 2016 | Prague, Czech Republic
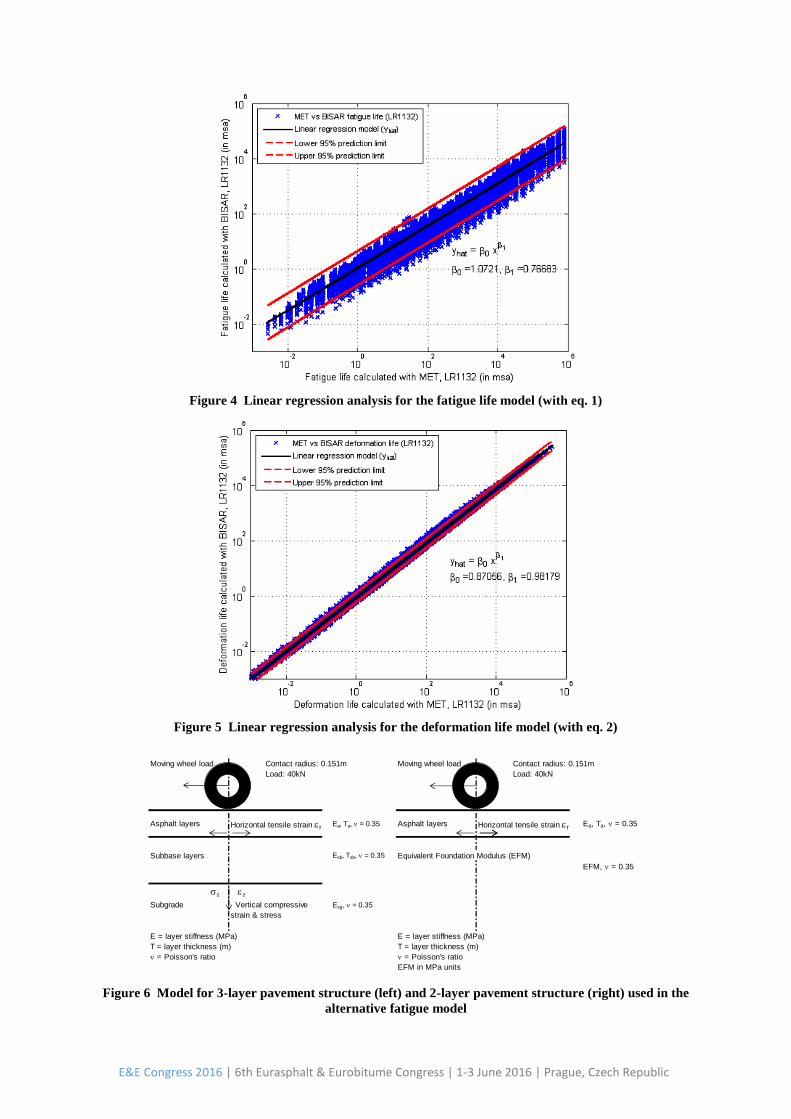
Figure 4 Linear regression analysis for the fatigue life model (with eq. 1)
Figure 5 Linear regression analysis for the deformation life model (with eq. 2)
Figure 6 Model for 3-layer pavement structure (left) and 2-layer pavement structure (right) used in the
alternative fatigue model
Contact radius: 0.151m Contact radius: 0.151m
Load: 40kN Load: 40kN
Asphalt layers Horizontal tensile strain r Ea, Ta, n = 0.35 Asphalt layers Horizontal tensile strain r Ea, Ta, n = 0.35
Subbase layers Esb, Tsb, n = 0.35 Equivalent Foundation Modulus (EFM)
EFM, n = 0.35
sz z
Subgrade Esg, n = 0.35
E = layer stiffness (MPa) E = layer stiffness (MPa)
T = layer thickness (m) T = layer thickness (m)
n = Poisson's ratio n = Poisson's ratio
EFM in MPa units
Moving wheel load Moving wheel load
Vertical compressive
strain & stress
E&E Congress 2016 | 6th Eurasphalt & Eurobitume Congress | 1-3 June 2016 | Prague, Czech Republic
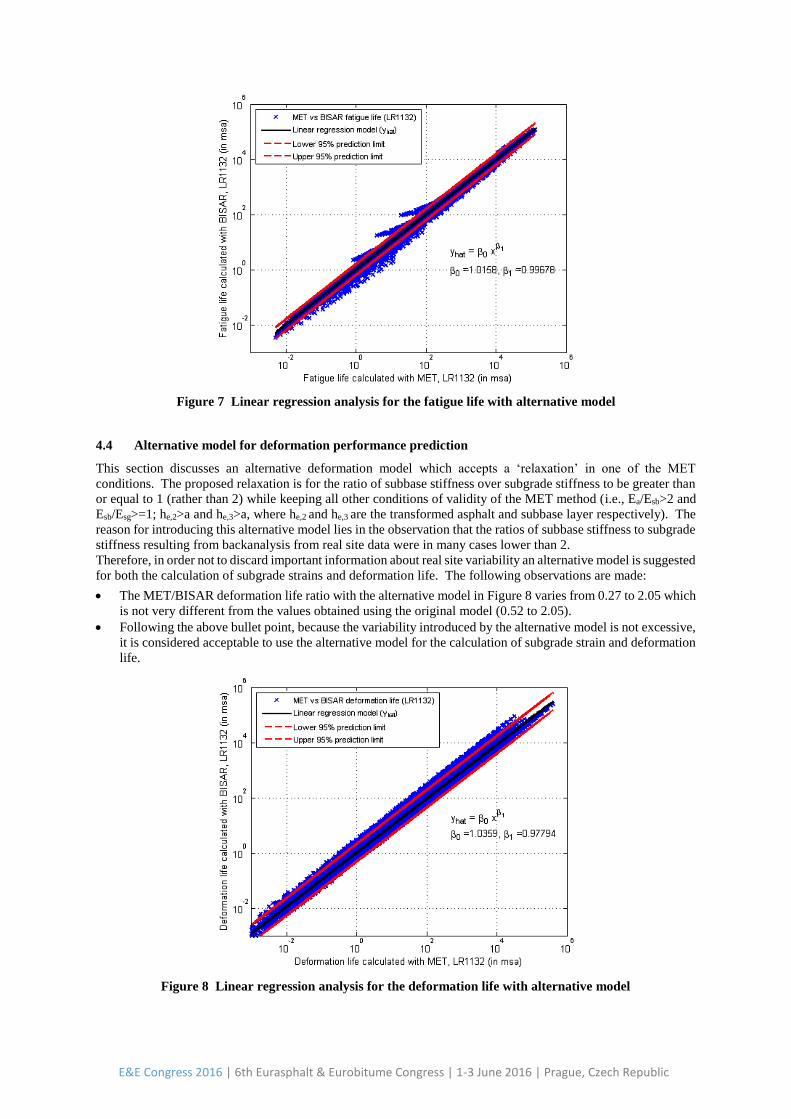
Figure 7 Linear regression analysis for the fatigue life with alternative model
4.4 Alternative model for deformation performance prediction
This section discusses an alternative deformation model which accepts a ‘relaxation’ in one of the MET
conditions. The proposed relaxation is for the ratio of subbase stiffness over subgrade stiffness to be greater than
or equal to 1 (rather than 2) while keeping all other conditions of validity of the MET method (i.e., Ea/Esb>2 and
Esb/Esg>=1; he,2>a and he,3>a, where he,2 and he,3 are the transformed asphalt and subbase layer respectively). The
reason for introducing this alternative model lies in the observation that the ratios of subbase stiffness to subgrade
stiffness resulting from backanalysis from real site data were in many cases lower than 2.
Therefore, in order not to discard important information about real site variability an alternative model is suggested
for both the calculation of subgrade strains and deformation life. The following observations are made:
The MET/BISAR deformation life ratio with the alternative model in Figure 8 varies from 0.27 to 2.05 which
is not very different from the values obtained using the original model (0.52 to 2.05).
Following the above bullet point, because the variability introduced by the alternative model is not excessive,
it is considered acceptable to use the alternative model for the calculation of subgrade strain and deformation
life.
Figure 8 Linear regression analysis for the deformation life with alternative model
E&E Congress 2016 | 6th Eurasphalt & Eurobitume Congress | 1-3 June 2016 | Prague, Czech Republic
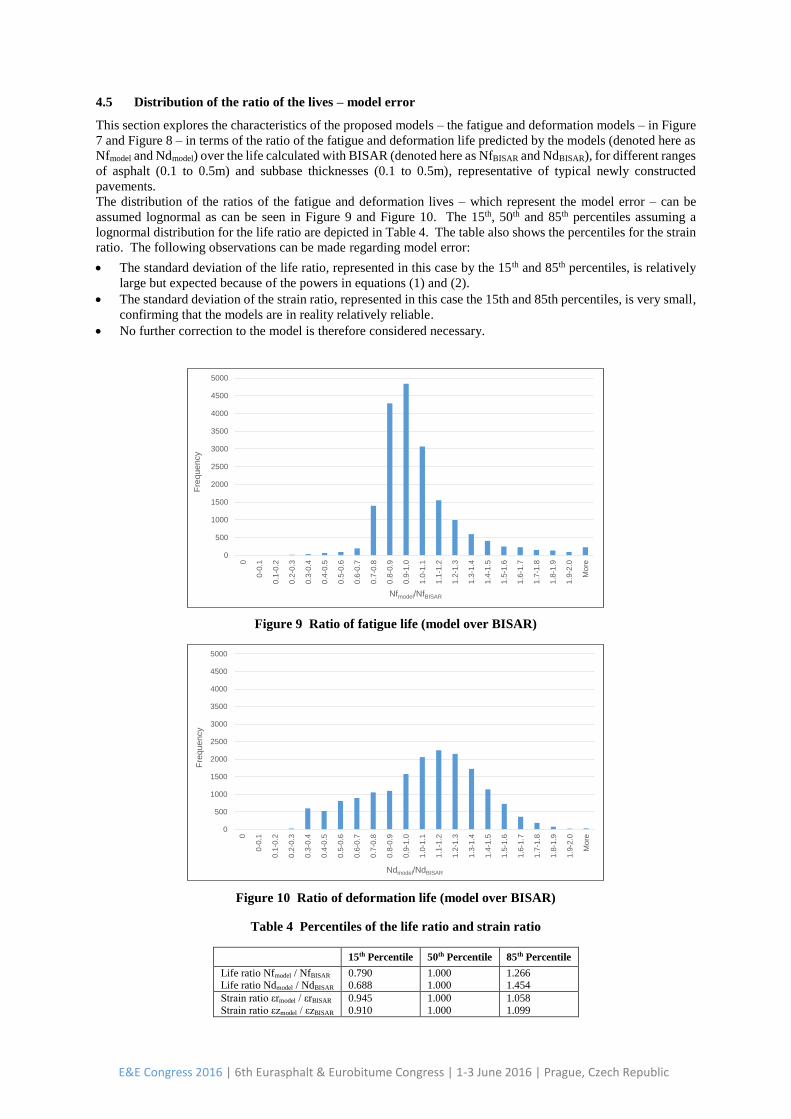
4.5 Distribution of the ratio of the lives – model error
This section explores the characteristics of the proposed models – the fatigue and deformation models – in Figure
7 and Figure 8 – in terms of the ratio of the fatigue and deformation life predicted by the models (denoted here as
Nfmodel and Ndmodel) over the life calculated with BISAR (denoted here as NfBISAR and NdBISAR), for different ranges
of asphalt (0.1 to 0.5m) and subbase thicknesses (0.1 to 0.5m), representative of typical newly constructed
pavements.
The distribution of the ratios of the fatigue and deformation lives – which represent the model error – can be
assumed lognormal as can be seen in Figure 9 and Figure 10. The 15th, 50th and 85th percentiles assuming a
lognormal distribution for the life ratio are depicted in Table 4. The table also shows the percentiles for the strain
ratio. The following observations can be made regarding model error:
The standard deviation of the life ratio, represented in this case by the 15th and 85th percentiles, is relatively
large but expected because of the powers in equations (1) and (2).
The standard deviation of the strain ratio, represented in this case the 15th and 85th percentiles, is very small,
confirming that the models are in reality relatively reliable.
No further correction to the model is therefore considered necessary.
Figure 9 Ratio of fatigue life (model over BISAR)
Figure 10 Ratio of deformation life (model over BISAR)
Table 4 Percentiles of the life ratio and strain ratio
15th Percentile 50th Percentile 85th Percentile
Life ratio Nfmodel / NfBISAR
Life ratio Ndmodel / NdBISAR 0.790 0.688
1.000 1.000
1.266 1.454
Strain ratio εrmodel / εrBISAR
Strain ratio εzmodel / εzBISAR
0.945
0.910
1.000
1.000
1.058
1.099
0
500
1000
1500
2000
2500
3000
3500
4000
4500
5000
0
0-0
.1
0.1
-0.2
0.2
-0.3
0.3
-0.4
0.4
-0.5
0.5
-0.6
0.6
-0.7
0.7
-0.8
0.8
-0.9
0.9
-1.0
1.0
-1.1
1.1
-1.2
1.2
-1.3
1.3
-1.4
1.4
-1.5
1.5
-1.6
1.6
-1.7
1.7
-1.8
1.8
-1.9
1.9
-2.0
Mo
re
Fre
quency
Nfmodel/NfBISAR
0
500
1000
1500
2000
2500
3000
3500
4000
4500
5000
0
0-0
.1
0.1
-0.2
0.2
-0.3
0.3
-0.4
0.4
-0.5
0.5
-0.6
0.6
-0.7
0.7
-0.8
0.8
-0.9
0.9
-1.0
1.0
-1.1
1.1
-1.2
1.2
-1.3
1.3
-1.4
1.4
-1.5
1.5
-1.6
1.6
-1.7
1.7
-1.8
1.8
-1.9
1.9
-2.0
Mo
re
Fre
quen
cy
Ndmodel/NdBISAR
E&E Congress 2016 | 6th Eurasphalt & Eurobitume Congress | 1-3 June 2016 | Prague, Czech Republic
5 MONTE CARLO SIMULATION AND DESIGN LIFE PROBABILITY DISTRIBUTIONS
The purpose of this section is to show how the Monte Carlo Simulation (MCS) technique could be used to predict
output distributions of both fatigue and deformation performance, by treating data input of pavement design
parameters as random variables. The following steps/assumptions were followed:
1. Input pavement structure and input variables
The input pavement structure is a 3-layer model. The input variables are: asphalt thickness (Ta), granular subbase
thickness (Tsb), asphalt stiffness modulus (Ea), stiffness of the subbase (Esb), and the stiffness of the subgrade (Esg).
Poisson’s ratio for all layers is assumed to be 0.35. Variables are characterised by mean and standard deviation.
2. Assign input probability distribution
A normal probability distribution is selected for layer thickness (Ta and Tsb) while a lognormal probability
distribution is selected for layer stiffness (Ea, Esb, and Esg). The chosen probability distribution for each input is
based on the findings of this research and is supported by the literature review.
3. Generate random input variables
A sample of random inputs is generated (i.e., N random numbers for each of the random variables will give N sets
of random numbers, each set representing a realisation of the problem). A sample N of 1000 points from
probability distributions of the inputs has been considered. The generation of random numbers for layer stiffness
is easily performed in Matlab. Also with a routine in Matlab – based on the Fourier Analysis technique – random
asphalt and sub-base thickness profiles are generated which have similar frequency characteristics to the real case
study profiles (i.e., same mean, standard deviation and probability distribution).
4. Calculate response variables (fatigue and deformation life)
The improved Method of Equivalent Thickness model, discussed in this paper, is used to estimate the fatigue and
deformation life for each generated pavement structure. This involves first the calculation of an Equivalent
Foundation Modulus (EFM), then the linear regression model is used to predict values of fatigue and deformation
life calculated with BISAR from those obtained with the MET methodology.
5. Generate output probability distribution
The model is processed for the sample size of N points generating N values for fatigue and deformation life. The
results of the model (the fatigue and deformation life) for each run are computed and stored away for statistical
analysis (mean, percentiles etc). The expectation or mean value represents the average value of the results while
the standard deviation of these results is then a measure of the spread of the results around the mean value.
5.1 Results of MCS
The mean, standard deviation and coefficient of variation values of the key design input variables for the Monte
Carlo Simulation for all of the sites considered in the research are summarised in Table 5. The results of the
simulation, in terms of 15th and 85th percentiles (as percentages of the mean) of the fatigue and deformation lives,
are shown in Figure 11 and Figure 12. To illustrate the typical distribution of fatigue and deformation lives, those
for section 3 of site M01 are shown in Figure 13. The following observations can be made on the resulting
variability of performance life values:
The MCS simulation results for the probability distribution of both the fatigue and deformation life show that
a lognormal distribution can be fitted.
The (average) coefficient of variation (COV) for fatigue life of all sites resulting from MCS varies from a
minimum of 45% to a maximum of 227%. The (average) coefficient of variation for deformation life of all
sites resulting from MCS varies from a minimum of 39% to a maximum of 315%.
The range of 15th and 85th percentiles as percentages of the mean is 21% to 475% for the fatigue life and 16%
to 645% for the deformation life.
In comparison the percentile range due to model error reported above is much smaller, suggesting that the
model is ‘fit for purpose’.
Dalla Valle & Thom (2015) assessed the effect of variability for each individual input variable as well as their
combined effect on the pavement life. Their research confirmed that the parameters with the greatest influence
on the variability of predicted fatigue performance are the asphalt stiffness modulus and thickness. The parameters
with the greatest influence on the variability of predicted deformation performance are the granular subbase
thickness, the asphalt thickness and the subgrade stiffness.
E&E Congress 2016 | 6th Eurasphalt & Eurobitume Congress | 1-3 June 2016 | Prague, Czech Republic
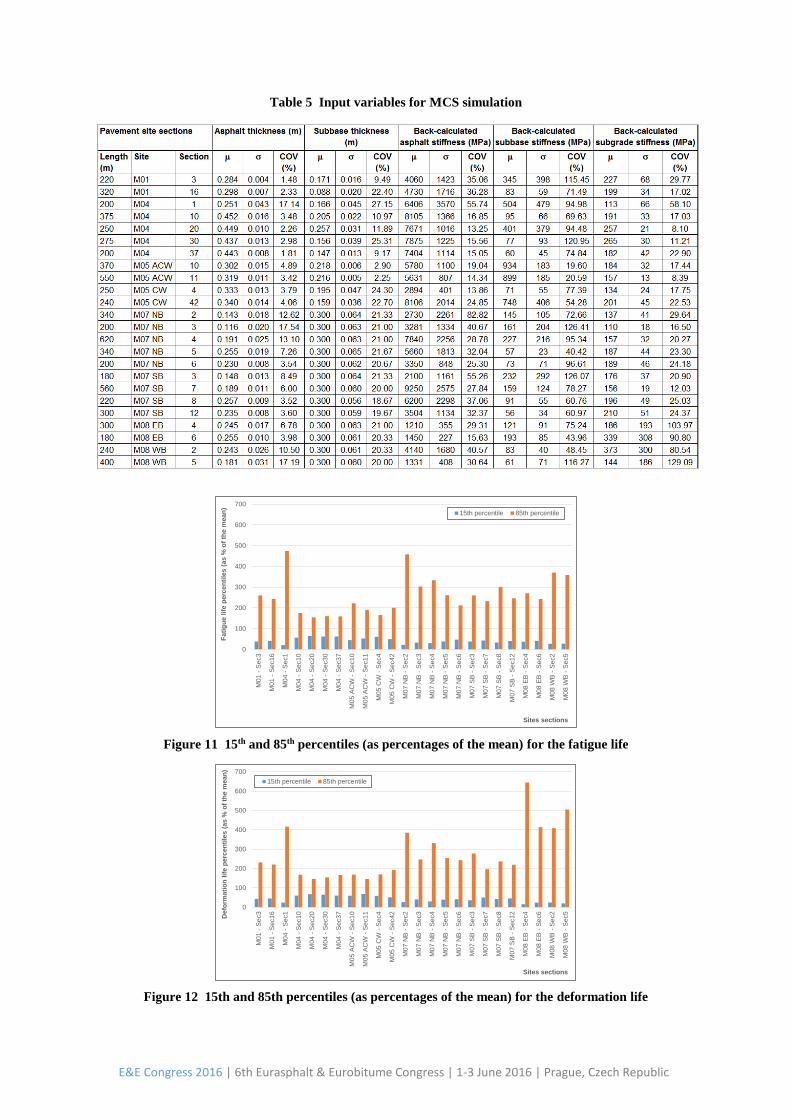
Table 5 Input variables for MCS simulation
Figure 11 15th and 85th percentiles (as percentages of the mean) for the fatigue life
Figure 12 15th and 85th percentiles (as percentages of the mean) for the deformation life
0
100
200
300
400
500
600
700
M0
1 -
Sec3
M0
1 -
Sec16
M0
4 -
Sec1
M0
4 -
Sec10
M0
4 -
Sec20
M0
4 -
Sec30
M0
4 -
Sec37
M0
5 A
CW
- S
ec1
0
M0
5 A
CW
- S
ec1
1
M0
5 C
W -
Sec4
M0
5 C
W -
Sec42
M0
7 N
B -
Sec2
M0
7 N
B -
Sec3
M0
7 N
B -
Sec4
M0
7 N
B -
Sec5
M0
7 N
B -
Sec6
M0
7 S
B -
Sec3
M0
7 S
B -
Sec7
M0
7 S
B -
Sec8
M0
7 S
B -
Sec12
M0
8 E
B -
Sec4
M0
8 E
B -
Sec6
M0
8 W
B -
Se
c2
M0
8 W
B -
Se
c5
Fati
gu
e lif
e p
erc
en
tile
s (
as %
of
the m
ean
)
Sites sections
15th percentile 85th percentile
0
100
200
300
400
500
600
700
M0
1 -
Sec3
M0
1 -
Sec16
M0
4 -
Sec1
M0
4 -
Sec10
M0
4 -
Sec20
M0
4 -
Sec30
M0
4 -
Sec37
M0
5 A
CW
- S
ec1
0
M0
5 A
CW
- S
ec1
1
M0
5 C
W -
Sec4
M0
5 C
W -
Sec42
M0
7 N
B -
Sec2
M0
7 N
B -
Sec3
M0
7 N
B -
Sec4
M0
7 N
B -
Sec5
M0
7 N
B -
Sec6
M0
7 S
B -
Sec3
M0
7 S
B -
Sec7
M0
7 S
B -
Sec8
M0
7 S
B -
Sec12
M0
8 E
B -
Sec4
M0
8 E
B -
Sec6
M0
8 W
B -
Se
c2
M0
8 W
B -
Se
c5
Defo
rmati
on
lif
e p
erc
en
tile
s (
as %
of
the m
ean
)
Sites sections
15th percentile 85th percentile
E&E Congress 2016 | 6th Eurasphalt & Eurobitume Congress | 1-3 June 2016 | Prague, Czech Republic
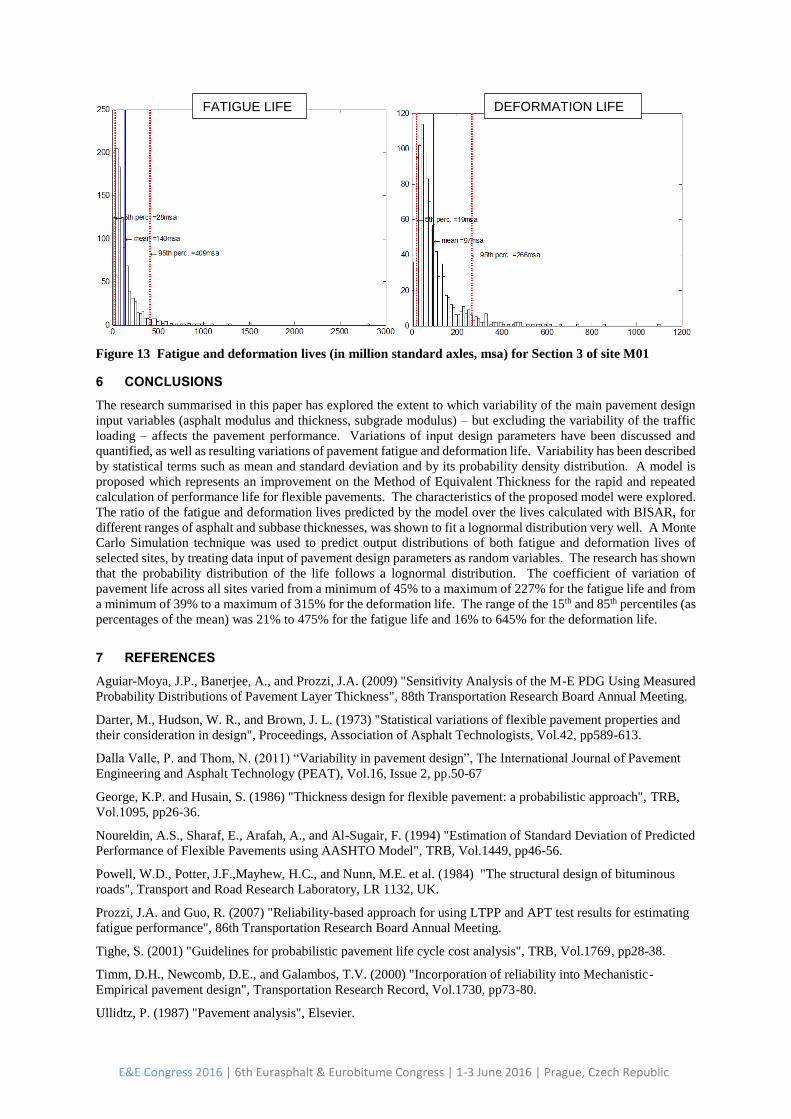
Figure 13 Fatigue and deformation lives (in million standard axles, msa) for Section 3 of site M01
6 CONCLUSIONS
The research summarised in this paper has explored the extent to which variability of the main pavement design
input variables (asphalt modulus and thickness, subgrade modulus) – but excluding the variability of the traffic
loading – affects the pavement performance. Variations of input design parameters have been discussed and
quantified, as well as resulting variations of pavement fatigue and deformation life. Variability has been described
by statistical terms such as mean and standard deviation and by its probability density distribution. A model is
proposed which represents an improvement on the Method of Equivalent Thickness for the rapid and repeated
calculation of performance life for flexible pavements. The characteristics of the proposed model were explored.
The ratio of the fatigue and deformation lives predicted by the model over the lives calculated with BISAR, for
different ranges of asphalt and subbase thicknesses, was shown to fit a lognormal distribution very well. A Monte
Carlo Simulation technique was used to predict output distributions of both fatigue and deformation lives of
selected sites, by treating data input of pavement design parameters as random variables. The research has shown
that the probability distribution of the life follows a lognormal distribution. The coefficient of variation of
pavement life across all sites varied from a minimum of 45% to a maximum of 227% for the fatigue life and from
a minimum of 39% to a maximum of 315% for the deformation life. The range of the 15th and 85th percentiles (as
percentages of the mean) was 21% to 475% for the fatigue life and 16% to 645% for the deformation life.
7 REFERENCES
Aguiar-Moya, J.P., Banerjee, A., and Prozzi, J.A. (2009) "Sensitivity Analysis of the M-E PDG Using Measured
Probability Distributions of Pavement Layer Thickness", 88th Transportation Research Board Annual Meeting.
Darter, M., Hudson, W. R., and Brown, J. L. (1973) "Statistical variations of flexible pavement properties and
their consideration in design", Proceedings, Association of Asphalt Technologists, Vol.42, pp589-613.
Dalla Valle, P. and Thom, N. (2011) “Variability in pavement design”, The International Journal of Pavement
Engineering and Asphalt Technology (PEAT), Vol.16, Issue 2, pp.50-67
George, K.P. and Husain, S. (1986) "Thickness design for flexible pavement: a probabilistic approach", TRB,
Vol.1095, pp26-36.
Noureldin, A.S., Sharaf, E., Arafah, A., and Al-Sugair, F. (1994) "Estimation of Standard Deviation of Predicted
Performance of Flexible Pavements using AASHTO Model", TRB, Vol.1449, pp46-56.
Powell, W.D., Potter, J.F.,Mayhew, H.C., and Nunn, M.E. et al. (1984) "The structural design of bituminous
roads", Transport and Road Research Laboratory, LR 1132, UK.
Prozzi, J.A. and Guo, R. (2007) "Reliability-based approach for using LTPP and APT test results for estimating
fatigue performance", 86th Transportation Research Board Annual Meeting.
Tighe, S. (2001) "Guidelines for probabilistic pavement life cycle cost analysis", TRB, Vol.1769, pp28-38.
Timm, D.H., Newcomb, D.E., and Galambos, T.V. (2000) "Incorporation of reliability into Mechanistic-
Empirical pavement design", Transportation Research Record, Vol.1730, pp73-80.
Ullidtz, P. (1987) "Pavement analysis", Elsevier.
FATIGUE LIFE DEFORMATION LIFE
E&E Congress 2016 | 6th Eurasphalt & Eurobitume Congress | 1-3 June 2016 | Prague, Czech Republic

Zollinger, D.G. and McCullough, B.F. (1994) "Development of Weibull Reliability factors and analysis for
calibration of pavement Design Models Using Filed Data", TRB, Vol.1449, pp18-25.
E&E Congress 2016 | 6th Eurasphalt & Eurobitume Congress | 1-3 June 2016 | Prague, Czech Republic
Related Documents