1 ABSTRACT Intensity Analytics has developed an authentication system for computer users based on the natural consistency of typing. Drs. Gantz and Miller have been engaged by Intensity Analytics (IA) to analyze test data from their system and measure system performance. We describe the landscape of related technologies and their strengths and weaknesses. We then proceed to calculate true and false acceptance and rejection rates as well as to construct ROC curves for the TickStream.KeyID output. The system now has the ability to severely limit the false acceptance of imposters, and we feel that with further study, the performance can be improved even more, while maintaining the low false acceptance rate. Keywords: Intensity Analytics, TickStream.KeyID, Authentication, Keystroke, Biometrics, Behavior, Multifactor I. INTRODUCTION TickStream.KeyID is a commercial software product developed by Intensity Analytics Corporation for authenticating users by analyzing habitual finger movements when entering familiar credentials, primarily for access control. It is part of a suite of technologies offered by them to provide security and information assurance. Drs. Gantz and Miller were engaged to validate the reliability and performance of the TickStream.KeyID engine. This engine models the physical characteristics of typing by a user. 1 This study was supported by Intensity Analytics Corporation, PO Box 491 Warrenton, VA 20188 (http://intensityanalytics.com). 2 Donald T Gantz is a Professor of Statistics and the Chair of the Department of Applied Information Technology in the Volgenau School of Engineering, and Director of the Document Forensics Laboratory at George Mason University, 4400 University Drive, MS 1G8, Fairfax, Virginia 22030 (e-mail: [email protected]). 3 John J. Miller is an Associate Professor in the Department of Applied and Engineering Statistics at George Mason University, 4400 University Drive, MS 4A7, Fairfax, Virginia 22030 (email: [email protected]). 4 Thomas E. Ketcham is former student and Research Assistant at George Mason University, and currently CIO/EVP of Intensity Analytics, PO Box 491, Warrenton, Virginia 20188. He contributed to the background on the product and related technologies, and programming services for the data collection, but did not participate in the analysis, results or conclusion. (e-mail: [email protected]). The measurement of various physical characteristics yields a feature vector associated with a user’s typing effort. Some repetitions of a user’s typing efforts are required to build a model suitable to authenticate the user. The output of the decision rule for an actual typing effort is either acceptance or rejection, along with a set of detailed metrics. IA uses a model training set for the modeling step, and then applies the model to a separate testing set of typing efforts to measure the performance of the model. Their proprietary algorithms distill the feature vector into two score variables, called Fidelity and Confidence, which drive the acceptance decision. We have evaluated the modeling and testing results in order to report on overall system performance. Under various acceptance protocols, we have calculated both true and false acceptance and rejection rates for both identified impostors and genuine users. From our experience in developing an automated, language- independent analysis system for handwriting identification which exploits the involuntary neuromuscular nature of handwriting [1, pp. 197-209], we are not surprised that Intensity Analytics authentication engine performs with a high degree of accuracy. II. OVERVIEW OF TICKSTREAM.KEYID For well over a century, researchers have suggested that individuals can be identified by the pattern of how they use an electronic key device. As early as 1897, studies on telegraph operators claimed that “after hearing four or five words, he [the operator] can readily recognize the sender” [2, pp. 27-53]. With the relatively few elements available in Morse code, they demonstrated that the human mind was identifying repeatable, unique patterns that could be associated with individuals. In the more recent past, with the dawn of computer keyboard devices, it was proposed by Spillane in 1975 [3] that keystroke behavior analysis might yield results, with the first serious work done by Gaines at RAND Corporation in 1980 [4]. Even with a very small test population of just seven professional typists, the conclusions were optimistic. However, most of these early efforts, and even through recent years, have struggled with performance and reliability. In a general review Reliability and Performance of Intensity Analytics’ TickStream.KeyID User Authentication Software Engine 1 Dr. Donald T. Gantz 2 , Dr. John J. Miller 3 , and Mr. Thomas E. Ketcham 4

Welcome message from author
This document is posted to help you gain knowledge. Please leave a comment to let me know what you think about it! Share it to your friends and learn new things together.
Transcript
1
ABSTRACT
Intensity Analytics has developed an authentication system for
computer users based on the natural consistency of typing.
Drs. Gantz and Miller have been engaged by Intensity
Analytics (IA) to analyze test data from their system and
measure system performance. We describe the landscape of
related technologies and their strengths and weaknesses. We
then proceed to calculate true and false acceptance and
rejection rates as well as to construct ROC curves for the
TickStream.KeyID output. The system now has the ability to
severely limit the false acceptance of imposters, and we feel
that with further study, the performance can be improved even
more, while maintaining the low false acceptance rate.
Keywords: Intensity Analytics, TickStream.KeyID,
Authentication, Keystroke, Biometrics, Behavior, Multifactor
I. INTRODUCTION
TickStream.KeyID is a commercial software product
developed by Intensity Analytics Corporation for
authenticating users by analyzing habitual finger movements
when entering familiar credentials, primarily for access
control. It is part of a suite of technologies offered by them to
provide security and information assurance.
Drs. Gantz and Miller were engaged to validate the reliability
and performance of the TickStream.KeyID engine. This
engine models the physical characteristics of typing by a user.
1 This study was supported by Intensity Analytics Corporation, PO Box
491 Warrenton, VA 20188 (http://intensityanalytics.com). 2 Donald T Gantz is a Professor of Statistics and the Chair of the
Department of Applied Information Technology in the Volgenau School of Engineering, and Director of the Document Forensics Laboratory at George
Mason University, 4400 University Drive, MS 1G8, Fairfax, Virginia 22030
(e-mail: [email protected]). 3 John J. Miller is an Associate Professor in the Department of Applied and
Engineering Statistics at George Mason University, 4400 University Drive,
MS 4A7, Fairfax, Virginia 22030 (email: [email protected]). 4 Thomas E. Ketcham is former student and Research Assistant at George
Mason University, and currently CIO/EVP of Intensity Analytics, PO Box
491, Warrenton, Virginia 20188. He contributed to the background on the product and related technologies, and programming services for the data
collection, but did not participate in the analysis, results or conclusion.
(e-mail: [email protected]).
The measurement of various physical characteristics yields a
feature vector associated with a user’s typing effort. Some
repetitions of a user’s typing efforts are required to build a
model suitable to authenticate the user. The output of the
decision rule for an actual typing effort is either acceptance or
rejection, along with a set of detailed metrics. IA uses a model
training set for the modeling step, and then applies the model
to a separate testing set of typing efforts to measure the
performance of the model. Their proprietary algorithms distill
the feature vector into two score variables, called Fidelity and
Confidence, which drive the acceptance decision. We have
evaluated the modeling and testing results in order to report on
overall system performance. Under various acceptance
protocols, we have calculated both true and false acceptance
and rejection rates for both identified impostors and genuine
users.
From our experience in developing an automated, language-
independent analysis system for handwriting identification
which exploits the involuntary neuromuscular nature of
handwriting [1, pp. 197-209], we are not surprised that
Intensity Analytics authentication engine performs with a high
degree of accuracy.
II. OVERVIEW OF TICKSTREAM.KEYID
For well over a century, researchers have suggested that
individuals can be identified by the pattern of how they use an
electronic key device. As early as 1897, studies on telegraph
operators claimed that “after hearing four or five words, he
[the operator] can readily recognize the sender” [2, pp. 27-53].
With the relatively few elements available in Morse code, they
demonstrated that the human mind was identifying repeatable,
unique patterns that could be associated with individuals. In
the more recent past, with the dawn of computer keyboard
devices, it was proposed by Spillane in 1975 [3] that keystroke
behavior analysis might yield results, with the first serious
work done by Gaines at RAND Corporation in 1980 [4]. Even
with a very small test population of just seven professional
typists, the conclusions were optimistic. However, most of
these early efforts, and even through recent years, have
struggled with performance and reliability. In a general review
Reliability and Performance of
Intensity Analytics’ TickStream.KeyID
User Authentication Software Engine1
Dr. Donald T. Gantz2, Dr. John J. Miller3, and Mr. Thomas E. Ketcham4
2
of the literature, it seems most of these efforts have
constructed their solutions around standard machine learning
approaches, such as neural networks and Bayesian classifiers.
TickStream.KeyID offers a fresh and promising approach,
based on some novel methods we reviewed. It is one of the
two products in the TickStream suite that provide keystroke
analysis. The other, called TickStream.CV, is focused on
unconstrained text for continuous validation, etc., and uses a
different engine (this other product is not part of the current
study). The TickStream.KeyID software package is available
for both Microsoft Windows desktop deployments, and web
deployments across any JavaScript-enabled browser. To
support the tests for this study, components from each of these
were used: JavaScript libraries and web services from the web
deployment package for the Study App5, and a Microsoft
.NET DLL from the desktop deployment package to generate
the detailed engine output for statistical processing.
III. OVERVIEW OF RELATED TECHNOLOGIES
Information security is among the most important discussions
in technology today. As ever more information is connected
online, and the relative value of that information increases, we
have seen a parallel growth in “cybercrimes”, as the malicious
exploits of such systems has become known. Not just the act
of lone hackers, these breaches are increasingly the work of
transnational organized crime, state actors, and hacktivists6,
who seek to make a statement or incite terror [5]. This has led
to a rapidly expanding industry working to develop solutions
for improved security. Some are focused on server and
database safeguards and some are focused on network-level
defense, but there are also many focused on the single biggest
security threat to any electronic system: the human user, and
how best to authenticate those legitimate, genuine users, while
repelling the impostors.
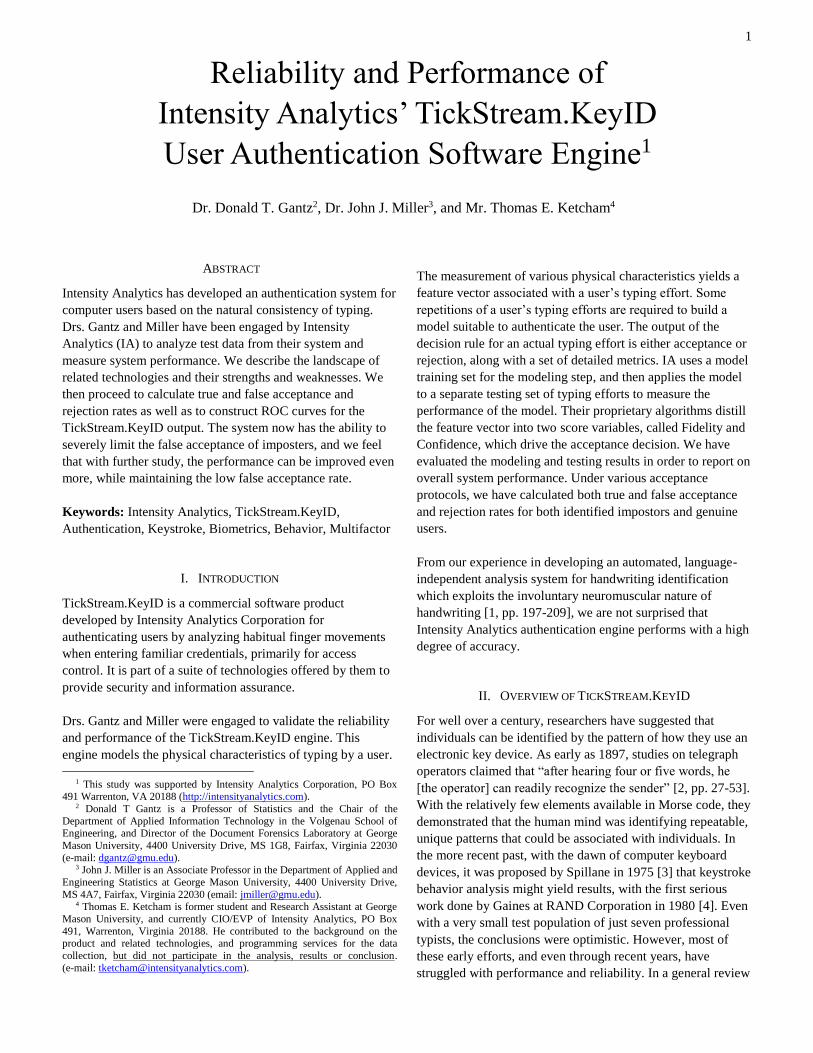
The following chart groups an array of authentication
methodologies into four generally-recognized areas. We
briefly discuss each of these types in order to put our
observations about the utility and performance of keystrokes-
based authentication, and specifically the TickStream.KeyID
product, into perspective.
5 As described in Section IV, Methodology. 6 Hacktivism (hacktivist defining a participant) is a relatively modern term,
used commonly in the information security industry, formed by combining the
words hack and activism. It is used to describe affiliated groups of individuals
who are bound together by some kind of ideology, and they engage in coordinated efforts to attack computer networks and servers. The goals of
these groups range widely from civil disobedience and political protest, to
undefined anarchy, to cyberterrorism. For more information, see http://en.wikipedia.org/wiki/hacktivism.
Figure 1. An overview of common authentication methods
A. Behavioral Biometrics for User Authentication
Behavioral biometrics, sometimes called
behaviometrics, measure the traits or habits of
individuals for authentication. Unlike traditional
biometrics, these are learned expressions of
individuality that vary constantly and require
performance, so they are more resistant to the kinds
of imposture, replay, or “man-in-the-middle” attacks
that stymie those other biometric modalities.
1) Gait Analysis
Gait is defined as a particular way or manner of
moving on foot. Twenty-four components of human
gait have been identified, and the measurement of
these components yields a composite which is unique
for each person. Collection of gait metrics can be
performed by cameras (“machine vision”), by floor
sensors, and by wearable sensors. Camera-based
systems have reported a success rate 90%. The use of
floor sensors adds additional features such as stride
length, stride cadence, and the time on toe/time on
heel ratio. Wearable sensors can incorporate
accelerometers, gyro sensors, force sensors and more.
Gait analysis offers the advantages of being non-
invasive, capable of continuous validation, and
comparatively unobtrusive, particularly in the case of
Authentication Methods
Behavioral
Gait
Keystrokes
Voice
Mouse Movement
Physical
Fingerprint
Hand Print/Morphology
Retinal/Iris
Ear Print
DNA
Facial
Possession
Smartcard
Token
PKICertificate
SIM Card
USB Key
SMS Message
Knowledge
Username
Password
PIN
3
camera or floor-sensors. Recognition rates as high as
95% have been accomplished by camera-based gait
recognition systems [6] [7]. For floor sensor-based
systems, as much as a 93% correct recognition rate
has been achieved [8]. In a small study group of 36
subjects wearing sensors on their waists to measure
waist acceleration, an EER of 6.4% was reported [9].
However, there are many significant challenges to
gait analysis, including external factors such as
lighting conditions, weather conditions, footwear
types, carrying of objects and variations in viewing
angles, and internal factors, such as the condition of
the subject such as tight footwear, pregnancy, back
injury or other physiological changes could adversely
affect recognition rates [10].
2) Voice Analysis
Automatic Speaker Verification (ASV), sometimes
referred to as voice identification, is a non-invasive
biometric used to identify a person by analyzing the
characteristics of their speech. Voice samples can be
collected using microphones found in some
computers, external devices, and telephones. Usually,
this technology is employed for the identification of
an unknown speaker’s identity from a closed-set of
previously enrolled speaker models. The unknown
speaker’s voice characteristics are compared with the
reference samples of a claimed identity, as well as
with and all other speakers recorded in the database.
The ratio of the two measurements are then evaluated
against a threshold and scored as true or false.
The most promising recognition rates have come
from Gaussian Mixture Model-based systems under
clean conditions, but in practical usage, noise
distortion results in degraded performance, dropping
to 74.2% from 94.5% in mildly noisy conditions [11,
pp. 23-61]. State-of-the-art systems may use a
combination of GMM and SVM (support vector
machines) [12, pp. 161-164]. However, it is widely
acknowledged that speaker verification systems are
vulnerable to imposture. Since automatic speaker
verification is often deployed in distributed,
unattended applications such as US/Canada border
crossings [13] and in telephony, it may be more
prone to spoofing attacks than other biometric
systems where human supervision supplements the
use of the biometric. Spoofing attacks can be as
simple as adapting one’s voice to sound like that of
the authorized individual [14, pp. 145-148].
Impersonation of this type has been shown to
increase FAR rates from near zero% to 10%-60%,
without respect for the use of professional or amateur
imposters [15, pp. 15-21]. A slightly more
sophisticated spoof involves replaying recorded
speech of the authorized speaker, which has been
shown to increase the EER from 1% to nearly 70%
[16, pp. 131-134]. In addition, error rates can be
increased when the known speaker is affected by
stress, disease, temperature, and other physical
changes [17, pp. 176-178].
3) Mouse Gestures
For applications requiring little text (keyboard) input,
recent work in mouse gesture analysis shows that
users might be identified by their mouse movements.
In a very limited study, conducted using a nine button
grid, the average FAR was .593 and FRR was 3.074
[18, pp. 45-48]. Much of the work in this area has
been around tightly-defined interaction with the user,
and not applied to general use, where the error rates
might be considerably higher.
B. Physical Biometrics for User Authentication
Human physical characteristics are naturally used for
identification and authentication, as we recognize each other
based on what we see, hear, and discern. Friends separated for
many years may instantly recognize each other in spite of
dramatic changes in their physical appearance. However, the
inherent weakness of physical biometrics is that they can be
observed independently from the biometric capture system.
For instance, one may ‘lift” a fingerprint from a soda can as
well as from a fingerprint scanner, or copy a facial image from
a photograph, making them susceptible to forgery or
imposture. Further, if a physical biometric record is
compromised, there is no process to change your physical
characteristics, your physical properties are what they are [19,
pp. 57-73].
1) Retinal Scan
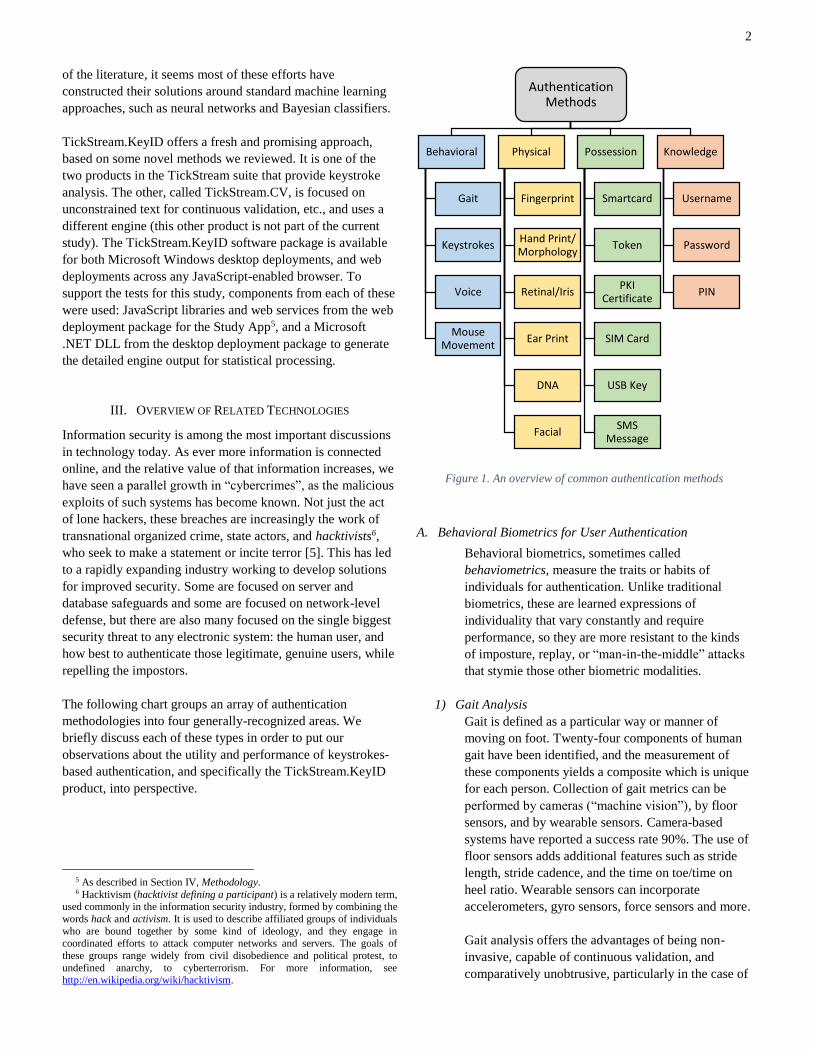
In 1939, Dr. Carleton Simon, a criminologist and
psychiatrist by profession, together with Dr. Isadore
Goldstein, an ophthalmologist at Mount Sinai
Hospital, demonstrated a method of identifying
people by photographing the pattern of blood vessels
in the subject’s retina, on the understanding that the
pattern of blood vessels could not be altered, while
fingerprints could be disfigured through intentional
or accidental means. Forty years later, the first patent
for a retinal scanner was issued to Robert Hill (US
Patent 41092377). The structure of the capillaries
supplying blood to the retina is so complex that
identical twins do not have the same pattern. The
process of retinal scanning involves shining a beam
of infrared light into the subject’s eye as they look
into the eyepiece of the camera. Some objections to
7 http://www.google.com/patents/US4109237
4
retinal scanning are related to the potential for
damage to the eye over a long period of repeated
exposure to the machinery, or to a malfunctioning
machine. Other objections are related to the medical
information that can be gathered from retinal
scanning, which includes the detection of AIDS,
syphilis, malaria, chicken pox, leukemia, lymphoma,
and sickle cell anemia. Chronic conditions such as
congestive heart failure, atherosclerosis and
cholesterol issues can first appear in the eyes.
Pregnancy also affects the eyes. The potential for
obtaining information on medical conditions while
scanning for identification is a huge privacy issue
[20, pp. 251-265].
Figure 2. Dr. Carleton Simon, from Popular Science, 1939.
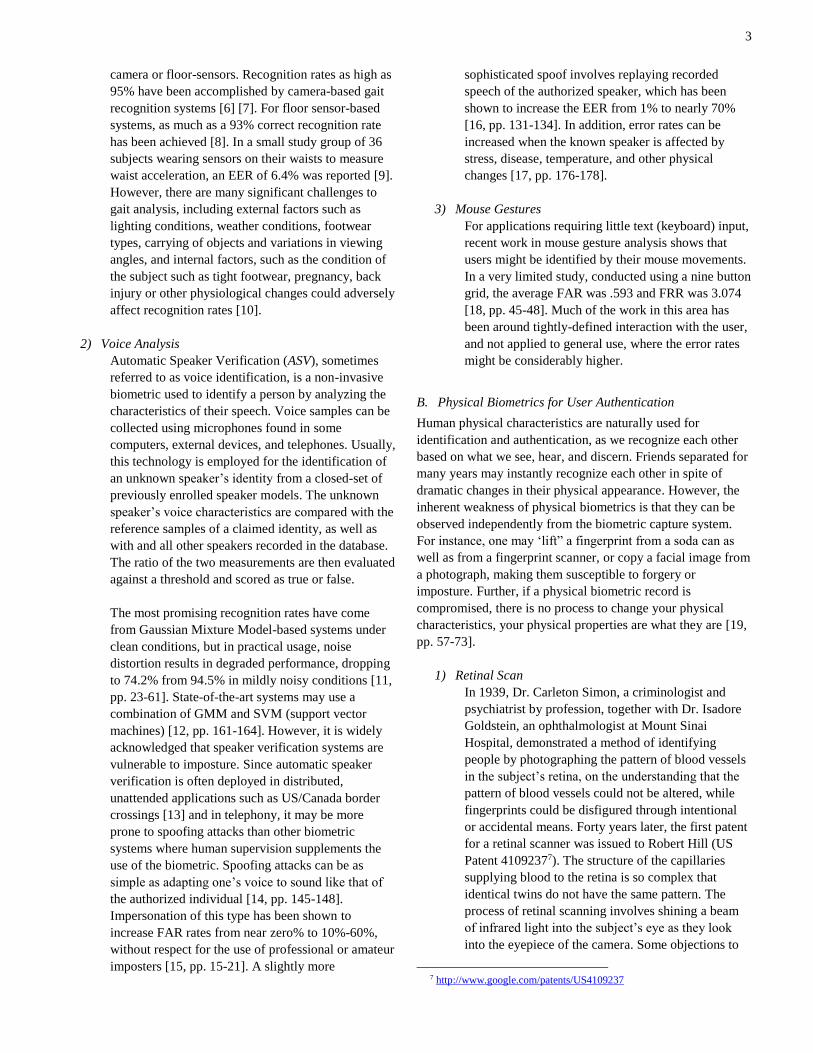
2) Iris Recognition
Iris recognition uses an infrared camera to acquire
images of the structures of the iris. Analysis of the
templates created from these structures are used to
identify an individual. By comparison, the camera
used to capture the iris image is far less intrusive than
the retina scanner, since it can operate at a distance
from the subject’s eye.
Although the condition of the iris was believed to be
stable throughout a person’s life, a four-year study at
the University of Notre Dame found that there was a
statistically significant distance between two images
of an iris taken just four years apart [21, pp. 1170-
1179]. In addition, FRR increased by 75% for
comparison of long-time-lapse. Even so, iris
recognition is one of the most accurate biometrics,
with the accuracy of some very high-end systems
reported as high as 99.9% [22, pp. 76-81]. Of course,
these systems are very expensive, and can be difficult
to deploy.
Figure 3. The human iris, once thought stable, can
actually change in just a couple of years.
3) Handprint and Hand Morphology
Human palms contain unique patterns of ridges,
valleys, lines, and minutia. The larger area of the
palm affords more data for analysis, offering
improved recognition rates, at the cost of requiring a
larger capture surface. Handprints can offer a
reasonable performance, at a 4.5% FAR, but by
design, require a cumbersome device.
Hand morphology is a related approach, using the
geometric features of the hand: the size and shape of
the fingers, the location and angle of the joints, the
relative area of the palm, etc. Similar to handprints, it
returns a respectable 5.3% FAR.
To gain performance, some solutions have proposed
a combination of these methods [23, pp. 668-678].
However, the size and cost of the specialized capture
hardware required still makes this impractical in large
scale.
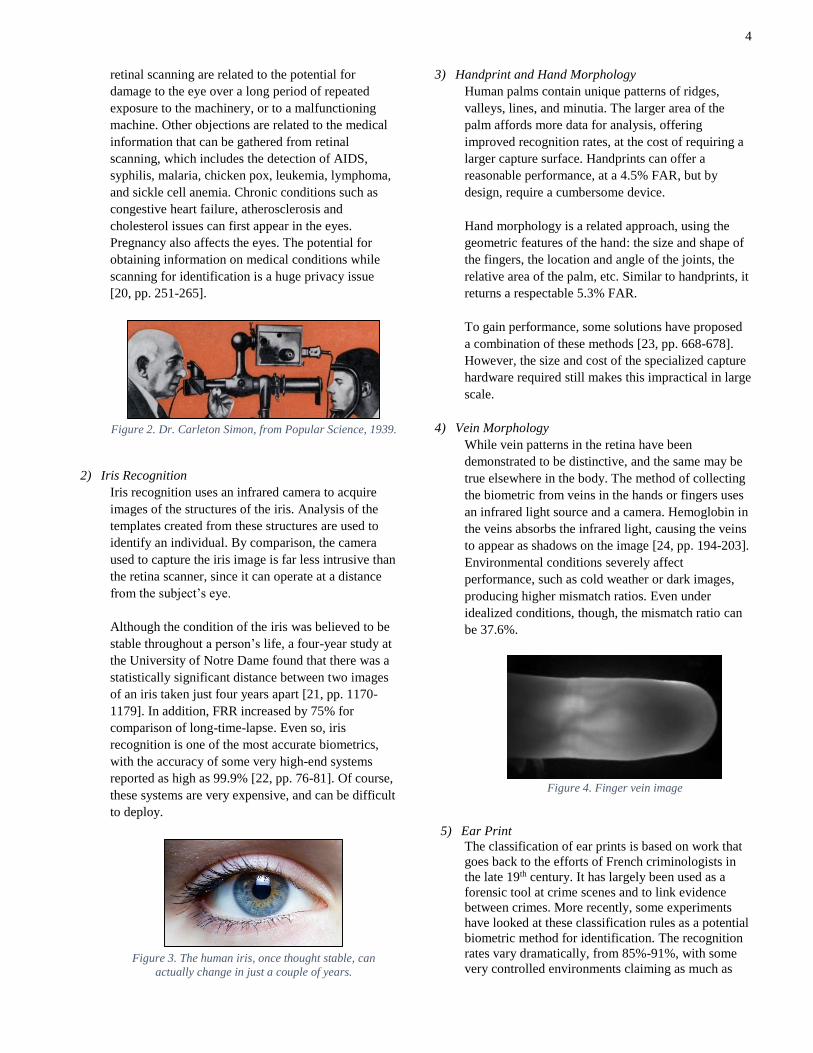
4) Vein Morphology
While vein patterns in the retina have been
demonstrated to be distinctive, and the same may be
true elsewhere in the body. The method of collecting
the biometric from veins in the hands or fingers uses
an infrared light source and a camera. Hemoglobin in
the veins absorbs the infrared light, causing the veins
to appear as shadows on the image [24, pp. 194-203].
Environmental conditions severely affect
performance, such as cold weather or dark images,
producing higher mismatch ratios. Even under
idealized conditions, though, the mismatch ratio can
be 37.6%.
Figure 4. Finger vein image
5) Ear Print
The classification of ear prints is based on work that
goes back to the efforts of French criminologists in
the late 19th century. It has largely been used as a
forensic tool at crime scenes and to link evidence
between crimes. More recently, some experiments
have looked at these classification rules as a potential
biometric method for identification. The recognition
rates vary dramatically, from 85%-91%, with some
very controlled environments claiming as much as
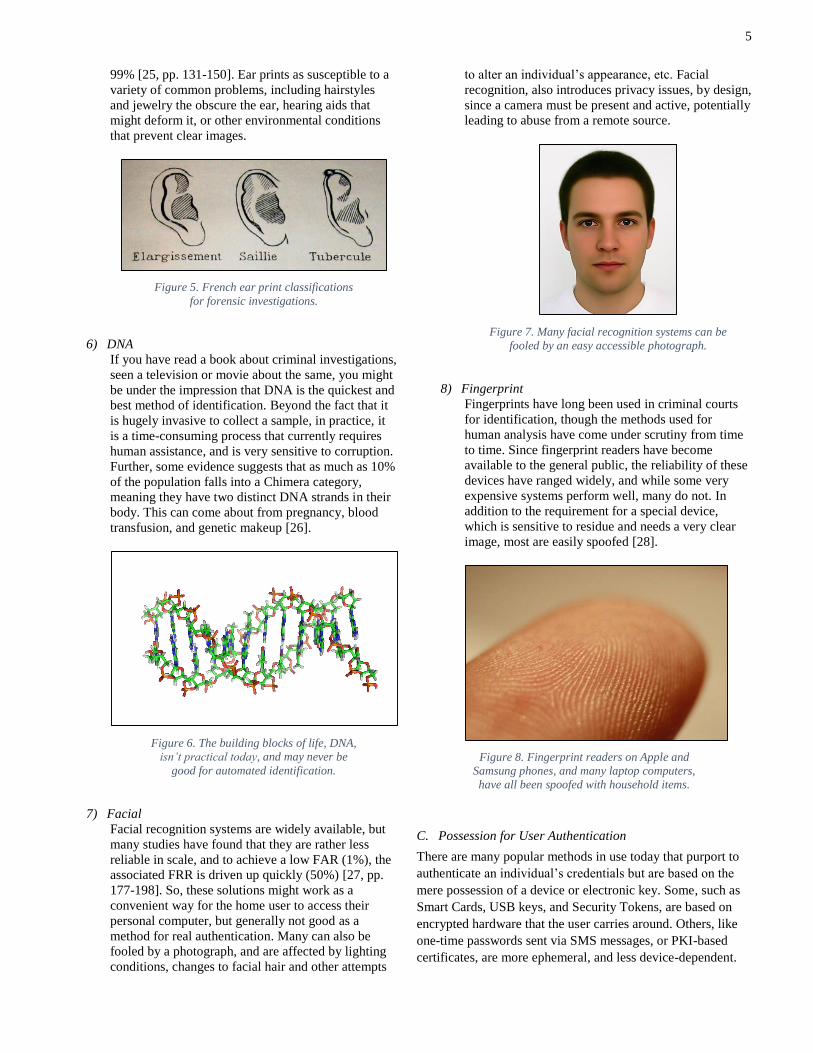
5
99% [25, pp. 131-150]. Ear prints as susceptible to a
variety of common problems, including hairstyles
and jewelry the obscure the ear, hearing aids that
might deform it, or other environmental conditions
that prevent clear images.
Figure 5. French ear print classifications
for forensic investigations.
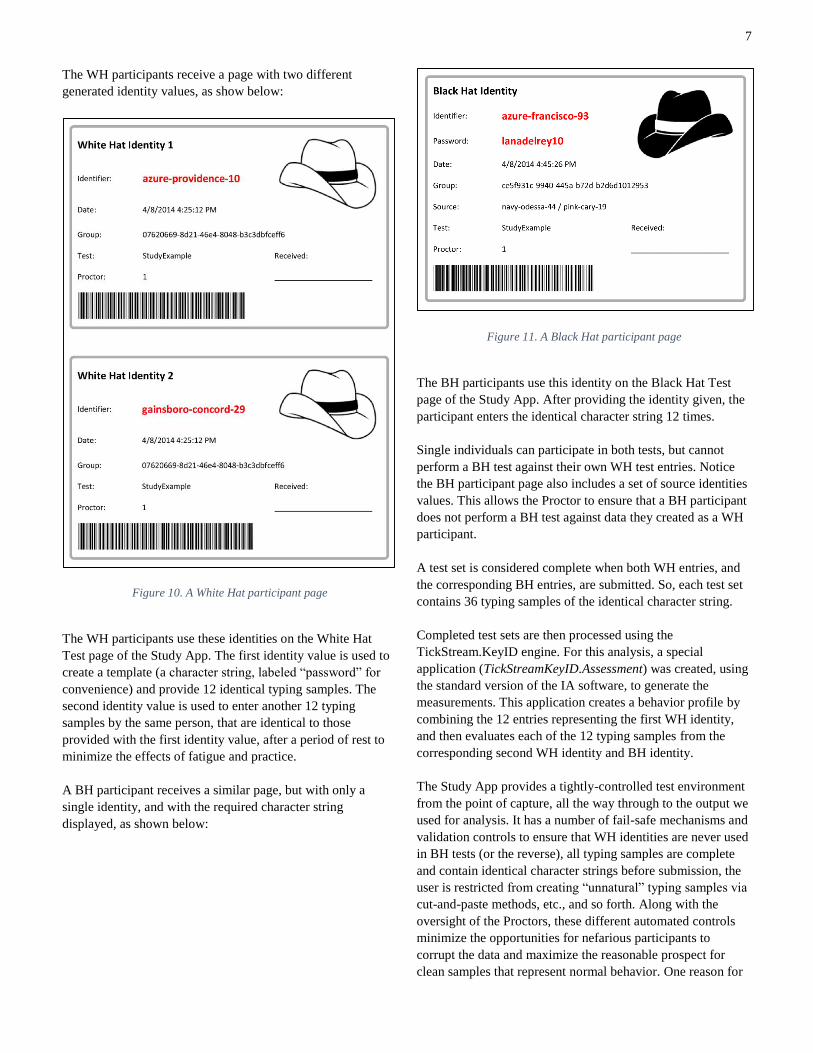
6) DNA
If you have read a book about criminal investigations,
seen a television or movie about the same, you might
be under the impression that DNA is the quickest and
best method of identification. Beyond the fact that it
is hugely invasive to collect a sample, in practice, it
is a time-consuming process that currently requires
human assistance, and is very sensitive to corruption.
Further, some evidence suggests that as much as 10%
of the population falls into a Chimera category,
meaning they have two distinct DNA strands in their
body. This can come about from pregnancy, blood
transfusion, and genetic makeup [26].
Figure 6. The building blocks of life, DNA,
isn’t practical today, and may never be
good for automated identification.
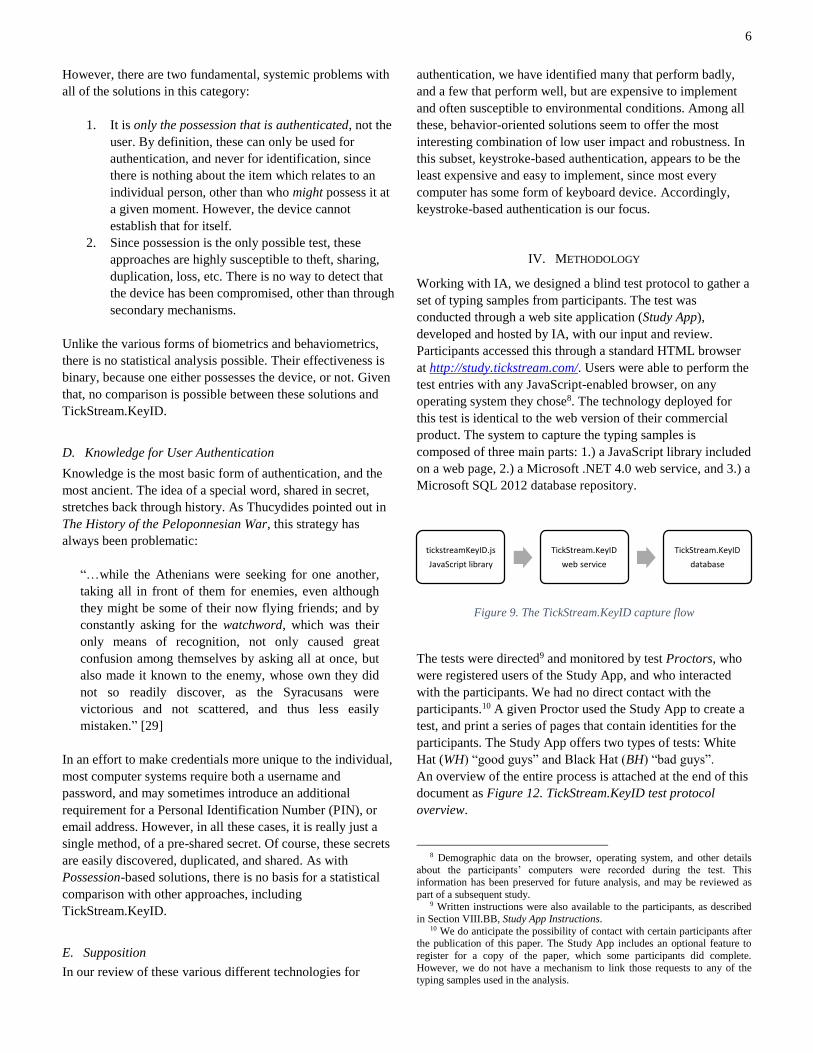
7) Facial
Facial recognition systems are widely available, but
many studies have found that they are rather less
reliable in scale, and to achieve a low FAR (1%), the
associated FRR is driven up quickly (50%) [27, pp.
177-198]. So, these solutions might work as a
convenient way for the home user to access their
personal computer, but generally not good as a
method for real authentication. Many can also be
fooled by a photograph, and are affected by lighting
conditions, changes to facial hair and other attempts
to alter an individual’s appearance, etc. Facial
recognition, also introduces privacy issues, by design,
since a camera must be present and active, potentially
leading to abuse from a remote source.
Figure 7. Many facial recognition systems can be
fooled by an easy accessible photograph.
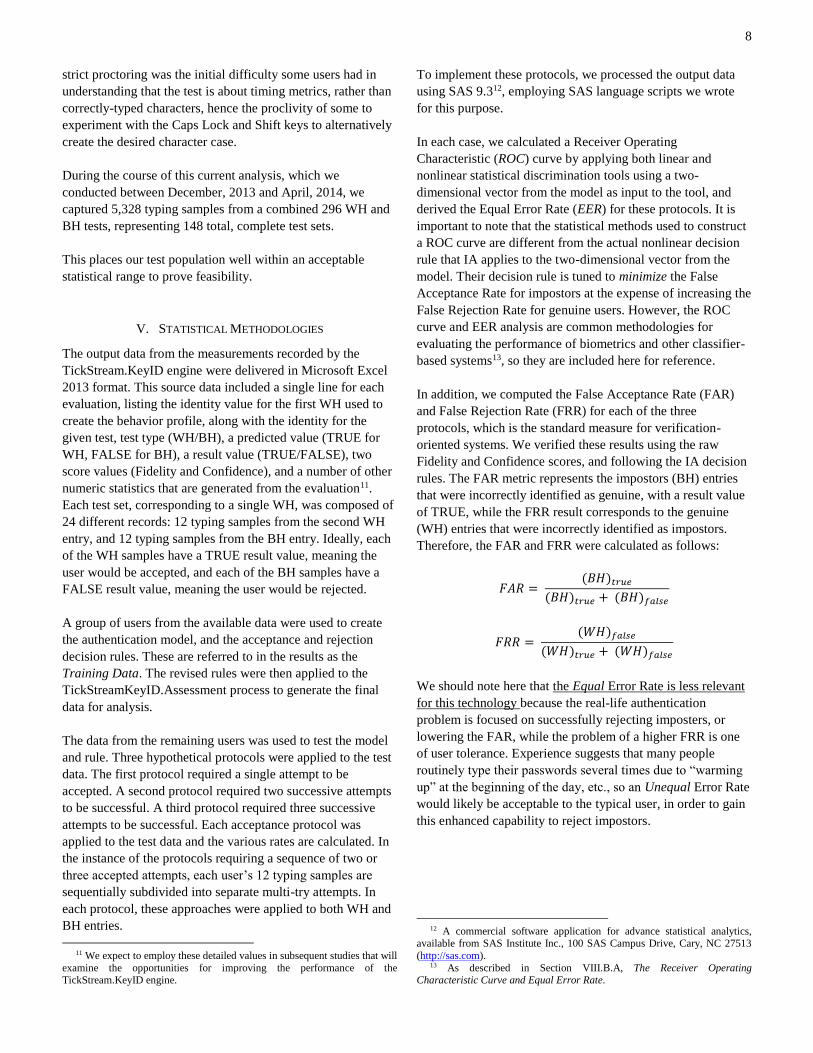
8) Fingerprint
Fingerprints have long been used in criminal courts
for identification, though the methods used for
human analysis have come under scrutiny from time
to time. Since fingerprint readers have become
available to the general public, the reliability of these
devices have ranged widely, and while some very
expensive systems perform well, many do not. In
addition to the requirement for a special device,
which is sensitive to residue and needs a very clear
image, most are easily spoofed [28].
Figure 8. Fingerprint readers on Apple and
Samsung phones, and many laptop computers,
have all been spoofed with household items.
C. Possession for User Authentication
There are many popular methods in use today that purport to
authenticate an individual’s credentials but are based on the
mere possession of a device or electronic key. Some, such as
Smart Cards, USB keys, and Security Tokens, are based on
encrypted hardware that the user carries around. Others, like
one-time passwords sent via SMS messages, or PKI-based
certificates, are more ephemeral, and less device-dependent.
6
However, there are two fundamental, systemic problems with
all of the solutions in this category:
1. It is only the possession that is authenticated, not the
user. By definition, these can only be used for
authentication, and never for identification, since
there is nothing about the item which relates to an
individual person, other than who might possess it at
a given moment. However, the device cannot
establish that for itself.
2. Since possession is the only possible test, these
approaches are highly susceptible to theft, sharing,
duplication, loss, etc. There is no way to detect that
the device has been compromised, other than through
secondary mechanisms.
Unlike the various forms of biometrics and behaviometrics,
there is no statistical analysis possible. Their effectiveness is
binary, because one either possesses the device, or not. Given
that, no comparison is possible between these solutions and
TickStream.KeyID.
D. Knowledge for User Authentication
Knowledge is the most basic form of authentication, and the
most ancient. The idea of a special word, shared in secret,
stretches back through history. As Thucydides pointed out in
The History of the Peloponnesian War, this strategy has
always been problematic:
“…while the Athenians were seeking for one another,
taking all in front of them for enemies, even although
they might be some of their now flying friends; and by
constantly asking for the watchword, which was their
only means of recognition, not only caused great
confusion among themselves by asking all at once, but
also made it known to the enemy, whose own they did
not so readily discover, as the Syracusans were
victorious and not scattered, and thus less easily
mistaken.” [29]
In an effort to make credentials more unique to the individual,
most computer systems require both a username and
password, and may sometimes introduce an additional
requirement for a Personal Identification Number (PIN), or
email address. However, in all these cases, it is really just a
single method, of a pre-shared secret. Of course, these secrets
are easily discovered, duplicated, and shared. As with
Possession-based solutions, there is no basis for a statistical
comparison with other approaches, including
TickStream.KeyID.
E. Supposition
In our review of these various different technologies for
authentication, we have identified many that perform badly,
and a few that perform well, but are expensive to implement
and often susceptible to environmental conditions. Among all
these, behavior-oriented solutions seem to offer the most
interesting combination of low user impact and robustness. In
this subset, keystroke-based authentication, appears to be the
least expensive and easy to implement, since most every
computer has some form of keyboard device. Accordingly,
keystroke-based authentication is our focus.
IV. METHODOLOGY
Working with IA, we designed a blind test protocol to gather a
set of typing samples from participants. The test was
conducted through a web site application (Study App),
developed and hosted by IA, with our input and review.
Participants accessed this through a standard HTML browser
at http://study.tickstream.com/. Users were able to perform the
test entries with any JavaScript-enabled browser, on any
operating system they chose8. The technology deployed for
this test is identical to the web version of their commercial
product. The system to capture the typing samples is
composed of three main parts: 1.) a JavaScript library included
on a web page, 2.) a Microsoft .NET 4.0 web service, and 3.) a
Microsoft SQL 2012 database repository.
Figure 9. The TickStream.KeyID capture flow
The tests were directed9 and monitored by test Proctors, who
were registered users of the Study App, and who interacted
with the participants. We had no direct contact with the
participants.10 A given Proctor used the Study App to create a
test, and print a series of pages that contain identities for the
participants. The Study App offers two types of tests: White
Hat (WH) “good guys” and Black Hat (BH) “bad guys”.
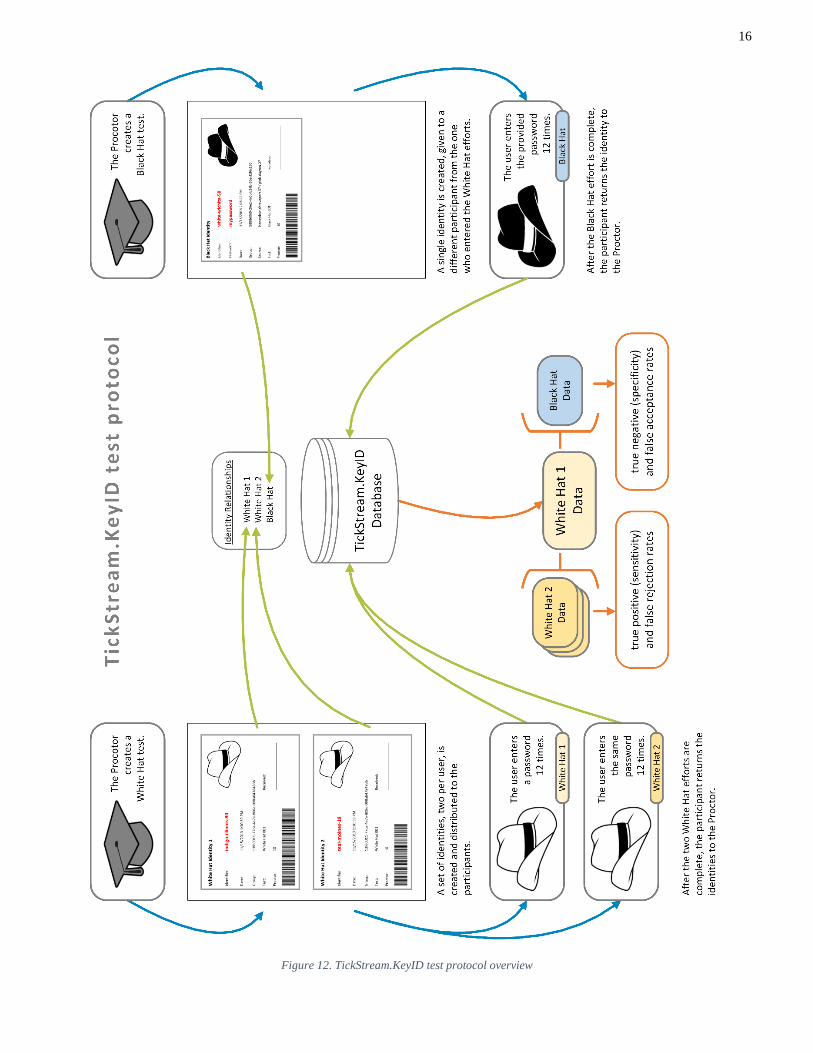
An overview of the entire process is attached at the end of this
document as Figure 12. TickStream.KeyID test protocol
overview.
8 Demographic data on the browser, operating system, and other details
about the participants’ computers were recorded during the test. This
information has been preserved for future analysis, and may be reviewed as
part of a subsequent study. 9 Written instructions were also available to the participants, as described
in Section VIII.BB, Study App Instructions. 10 We do anticipate the possibility of contact with certain participants after
the publication of this paper. The Study App includes an optional feature to
register for a copy of the paper, which some participants did complete.
However, we do not have a mechanism to link those requests to any of the typing samples used in the analysis.
tickstreamKeyID.js
JavaScript library
TickStream.KeyID
web service
TickStream.KeyID
database
7
The WH participants receive a page with two different
generated identity values, as show below:
Figure 10. A White Hat participant page
The WH participants use these identities on the White Hat
Test page of the Study App. The first identity value is used to
create a template (a character string, labeled “password” for
convenience) and provide 12 identical typing samples. The
second identity value is used to enter another 12 typing
samples by the same person, that are identical to those
provided with the first identity value, after a period of rest to
minimize the effects of fatigue and practice.
A BH participant receives a similar page, but with only a
single identity, and with the required character string
displayed, as shown below:
Figure 11. A Black Hat participant page
The BH participants use this identity on the Black Hat Test
page of the Study App. After providing the identity given, the
participant enters the identical character string 12 times.
Single individuals can participate in both tests, but cannot
perform a BH test against their own WH test entries. Notice
the BH participant page also includes a set of source identities
values. This allows the Proctor to ensure that a BH participant
does not perform a BH test against data they created as a WH
participant.
A test set is considered complete when both WH entries, and
the corresponding BH entries, are submitted. So, each test set
contains 36 typing samples of the identical character string.
Completed test sets are then processed using the
TickStream.KeyID engine. For this analysis, a special
application (TickStreamKeyID.Assessment) was created, using
the standard version of the IA software, to generate the
measurements. This application creates a behavior profile by
combining the 12 entries representing the first WH identity,
and then evaluates each of the 12 typing samples from the
corresponding second WH identity and BH identity.
The Study App provides a tightly-controlled test environment
from the point of capture, all the way through to the output we
used for analysis. It has a number of fail-safe mechanisms and
validation controls to ensure that WH identities are never used
in BH tests (or the reverse), all typing samples are complete
and contain identical character strings before submission, the
user is restricted from creating “unnatural” typing samples via
cut-and-paste methods, etc., and so forth. Along with the
oversight of the Proctors, these different automated controls
minimize the opportunities for nefarious participants to
corrupt the data and maximize the reasonable prospect for
clean samples that represent normal behavior. One reason for
8
strict proctoring was the initial difficulty some users had in
understanding that the test is about timing metrics, rather than
correctly-typed characters, hence the proclivity of some to
experiment with the Caps Lock and Shift keys to alternatively
create the desired character case.
During the course of this current analysis, which we
conducted between December, 2013 and April, 2014, we
captured 5,328 typing samples from a combined 296 WH and
BH tests, representing 148 total, complete test sets.
This places our test population well within an acceptable
statistical range to prove feasibility.
V. STATISTICAL METHODOLOGIES
The output data from the measurements recorded by the
TickStream.KeyID engine were delivered in Microsoft Excel
2013 format. This source data included a single line for each
evaluation, listing the identity value for the first WH used to
create the behavior profile, along with the identity for the
given test, test type (WH/BH), a predicted value (TRUE for
WH, FALSE for BH), a result value (TRUE/FALSE), two
score values (Fidelity and Confidence), and a number of other
numeric statistics that are generated from the evaluation11.
Each test set, corresponding to a single WH, was composed of
24 different records: 12 typing samples from the second WH
entry, and 12 typing samples from the BH entry. Ideally, each
of the WH samples have a TRUE result value, meaning the
user would be accepted, and each of the BH samples have a
FALSE result value, meaning the user would be rejected.
A group of users from the available data were used to create
the authentication model, and the acceptance and rejection
decision rules. These are referred to in the results as the
Training Data. The revised rules were then applied to the
TickStreamKeyID.Assessment process to generate the final
data for analysis.
The data from the remaining users was used to test the model
and rule. Three hypothetical protocols were applied to the test
data. The first protocol required a single attempt to be
accepted. A second protocol required two successive attempts
to be successful. A third protocol required three successive
attempts to be successful. Each acceptance protocol was
applied to the test data and the various rates are calculated. In
the instance of the protocols requiring a sequence of two or
three accepted attempts, each user’s 12 typing samples are
sequentially subdivided into separate multi-try attempts. In
each protocol, these approaches were applied to both WH and
BH entries.
11 We expect to employ these detailed values in subsequent studies that will
examine the opportunities for improving the performance of the TickStream.KeyID engine.
To implement these protocols, we processed the output data
using SAS 9.312, employing SAS language scripts we wrote
for this purpose.
In each case, we calculated a Receiver Operating
Characteristic (ROC) curve by applying both linear and
nonlinear statistical discrimination tools using a two-
dimensional vector from the model as input to the tool, and
derived the Equal Error Rate (EER) for these protocols. It is
important to note that the statistical methods used to construct
a ROC curve are different from the actual nonlinear decision
rule that IA applies to the two-dimensional vector from the
model. Their decision rule is tuned to minimize the False
Acceptance Rate for impostors at the expense of increasing the
False Rejection Rate for genuine users. However, the ROC
curve and EER analysis are common methodologies for
evaluating the performance of biometrics and other classifier-
based systems13, so they are included here for reference.
In addition, we computed the False Acceptance Rate (FAR)
and False Rejection Rate (FRR) for each of the three
protocols, which is the standard measure for verification-
oriented systems. We verified these results using the raw
Fidelity and Confidence scores, and following the IA decision
rules. The FAR metric represents the impostors (BH) entries
that were incorrectly identified as genuine, with a result value
of TRUE, while the FRR result corresponds to the genuine
(WH) entries that were incorrectly identified as impostors.
Therefore, the FAR and FRR were calculated as follows:
𝐹𝐴𝑅 = (𝐵𝐻)𝑡𝑟𝑢𝑒
(𝐵𝐻)𝑡𝑟𝑢𝑒 + (𝐵𝐻)𝑓𝑎𝑙𝑠𝑒
𝐹𝑅𝑅 = (𝑊𝐻)𝑓𝑎𝑙𝑠𝑒
(𝑊𝐻)𝑡𝑟𝑢𝑒 + (𝑊𝐻)𝑓𝑎𝑙𝑠𝑒
We should note here that the Equal Error Rate is less relevant
for this technology because the real-life authentication
problem is focused on successfully rejecting imposters, or
lowering the FAR, while the problem of a higher FRR is one
of user tolerance. Experience suggests that many people
routinely type their passwords several times due to “warming
up” at the beginning of the day, etc., so an Unequal Error Rate
would likely be acceptable to the typical user, in order to gain
this enhanced capability to reject impostors.
12 A commercial software application for advance statistical analytics,
available from SAS Institute Inc., 100 SAS Campus Drive, Cary, NC 27513
(http://sas.com). 13 As described in Section VIII.B.A, The Receiver Operating
Characteristic Curve and Equal Error Rate.
9
VI. RESULTS
The results are divided into two sections. The first section uses
the two basic score variables, Fidelity and Confidence, and
creates a single variable using quadratic discrimination
analysis. This single variable can then be ordered and a ROC
curve can be created from the ordered data.
These ROC curves are called “approximate” because they use
a single variable computed from the two basic score variables
and not using the actual IA decision rule, which, by plan, is
highly nonlinear and is created to minimize the FAR. They
still, however, give an indication of the strength of the
methodology. There are three ROC curves given here, each
one based on a different set of data: the training data, the non-
training data, and the pooled (both training and non-training)
data. We are presenting all three because the training data has
worse performance in some tests. This may reflect the
selection of the training data from the earliest efforts, which
may correspond to Proctor training issues, or some other
anomaly. We expect to recommend improvements to the
process of building the training and reference data set in future
studies.
We also compute the equal error rate (EER) for each of the
three data sets. The EER is the value where the FAR derived
from the BH samples equals the FRR derived from the WH
samples in the test data.
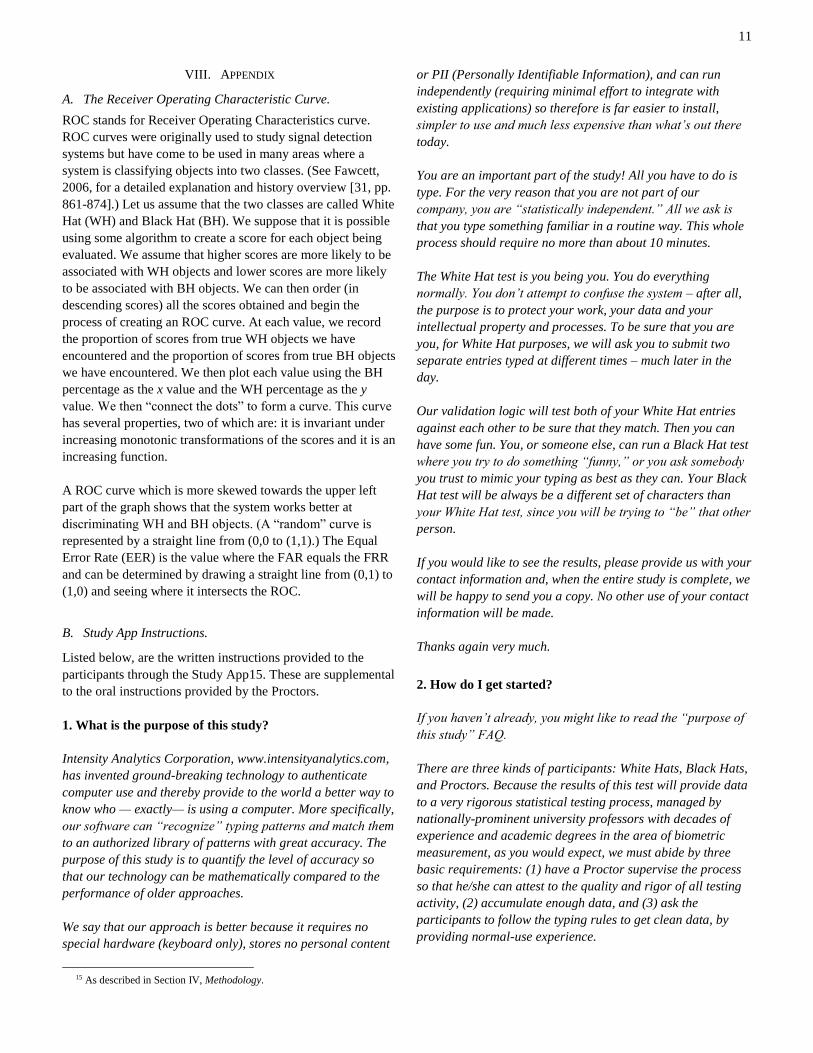
Here is the ROC curve for the training data. It yields an EER
of 0.0795.
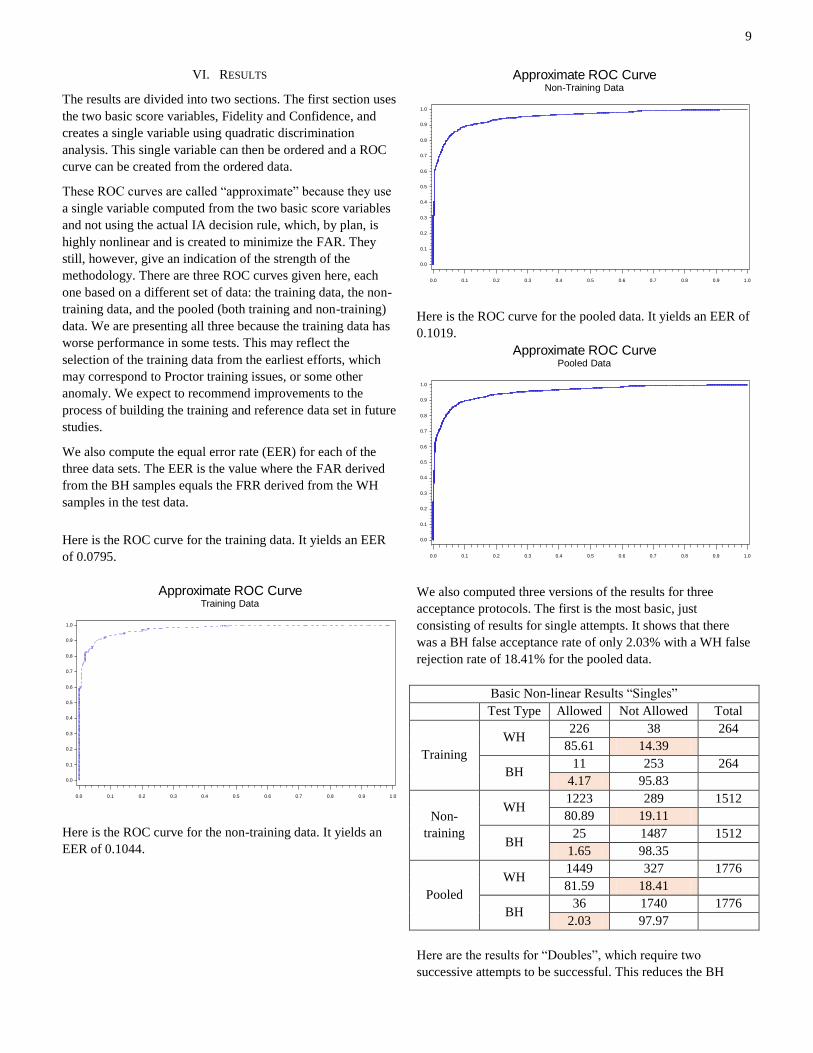
Here is the ROC curve for the non-training data. It yields an
EER of 0.1044.
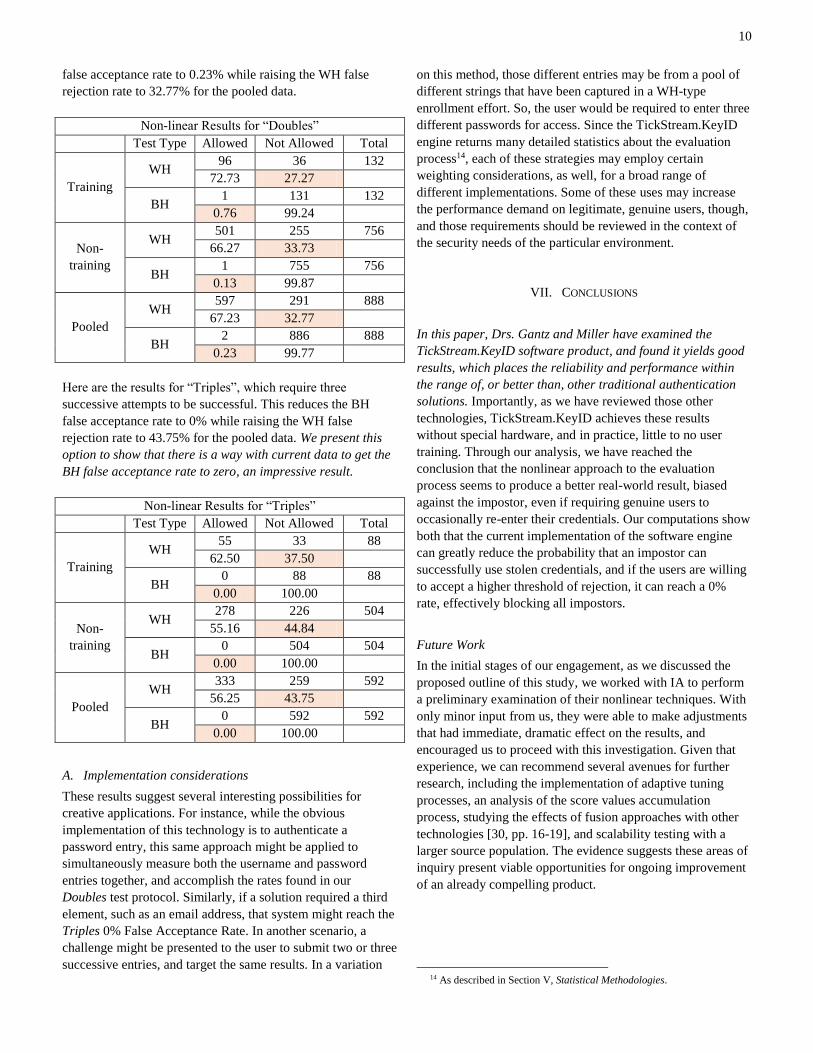
Here is the ROC curve for the pooled data. It yields an EER of
0.1019.
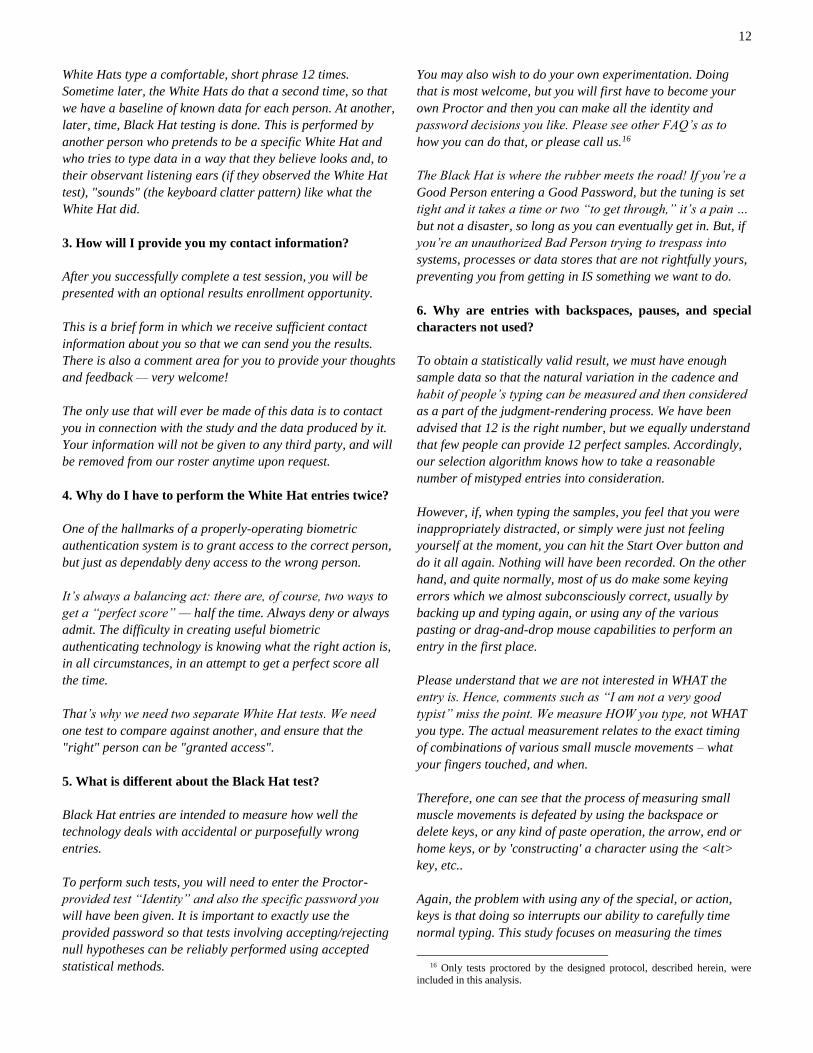
We also computed three versions of the results for three
acceptance protocols. The first is the most basic, just
consisting of results for single attempts. It shows that there
was a BH false acceptance rate of only 2.03% with a WH false
rejection rate of 18.41% for the pooled data.
Basic Non-linear Results “Singles”
Test Type Allowed Not Allowed Total
Training
WH 226 38 264
85.61 14.39
BH 11 253 264
4.17 95.83
Non-
training
WH 1223 289 1512
80.89 19.11
BH 25 1487 1512
1.65 98.35
Pooled
WH 1449 327 1776
81.59 18.41
BH 36 1740 1776
2.03 97.97
Here are the results for “Doubles”, which require two
successive attempts to be successful. This reduces the BH
0.0
0.1
0.2
0.3
0.4
0.5
0.6
0.7
0.8
0.9
1.0
0.0 0.1 0.2 0.3 0.4 0.5 0.6 0.7 0.8 0.9 1.0
Approximate ROC CurveTraining Data
0.0
0.1
0.2
0.3
0.4
0.5
0.6
0.7
0.8
0.9
1.0
0.0 0.1 0.2 0.3 0.4 0.5 0.6 0.7 0.8 0.9 1.0
Approximate ROC CurveNon-Training Data
0.0
0.1
0.2
0.3
0.4
0.5
0.6
0.7
0.8
0.9
1.0
0.0 0.1 0.2 0.3 0.4 0.5 0.6 0.7 0.8 0.9 1.0
Approximate ROC CurvePooled Data
10
false acceptance rate to 0.23% while raising the WH false
rejection rate to 32.77% for the pooled data.
Non-linear Results for “Doubles”
Test Type Allowed Not Allowed Total
Training
WH 96 36 132
72.73 27.27
BH 1 131 132
0.76 99.24
Non-
training
WH 501 255 756
66.27 33.73
BH 1 755 756
0.13 99.87
Pooled
WH 597 291 888
67.23 32.77
BH 2 886 888
0.23 99.77
Here are the results for “Triples”, which require three
successive attempts to be successful. This reduces the BH
false acceptance rate to 0% while raising the WH false
rejection rate to 43.75% for the pooled data. We present this
option to show that there is a way with current data to get the
BH false acceptance rate to zero, an impressive result.
Non-linear Results for “Triples”
Test Type Allowed Not Allowed Total
Training
WH 55 33 88
62.50 37.50
BH 0 88 88
0.00 100.00
Non-
training
WH 278 226 504
55.16 44.84
BH 0 504 504
0.00 100.00
Pooled
WH 333 259 592
56.25 43.75
BH 0 592 592
0.00 100.00
A. Implementation considerations
These results suggest several interesting possibilities for
creative applications. For instance, while the obvious
implementation of this technology is to authenticate a
password entry, this same approach might be applied to
simultaneously measure both the username and password
entries together, and accomplish the rates found in our
Doubles test protocol. Similarly, if a solution required a third
element, such as an email address, that system might reach the
Triples 0% False Acceptance Rate. In another scenario, a
challenge might be presented to the user to submit two or three
successive entries, and target the same results. In a variation
on this method, those different entries may be from a pool of
different strings that have been captured in a WH-type
enrollment effort. So, the user would be required to enter three
different passwords for access. Since the TickStream.KeyID
engine returns many detailed statistics about the evaluation
process14, each of these strategies may employ certain
weighting considerations, as well, for a broad range of
different implementations. Some of these uses may increase
the performance demand on legitimate, genuine users, though,
and those requirements should be reviewed in the context of
the security needs of the particular environment.
VII. CONCLUSIONS
In this paper, Drs. Gantz and Miller have examined the
TickStream.KeyID software product, and found it yields good
results, which places the reliability and performance within
the range of, or better than, other traditional authentication
solutions. Importantly, as we have reviewed those other
technologies, TickStream.KeyID achieves these results
without special hardware, and in practice, little to no user
training. Through our analysis, we have reached the
conclusion that the nonlinear approach to the evaluation
process seems to produce a better real-world result, biased
against the impostor, even if requiring genuine users to
occasionally re-enter their credentials. Our computations show
both that the current implementation of the software engine
can greatly reduce the probability that an impostor can
successfully use stolen credentials, and if the users are willing
to accept a higher threshold of rejection, it can reach a 0%
rate, effectively blocking all impostors.
Future Work
In the initial stages of our engagement, as we discussed the
proposed outline of this study, we worked with IA to perform
a preliminary examination of their nonlinear techniques. With
only minor input from us, they were able to make adjustments
that had immediate, dramatic effect on the results, and
encouraged us to proceed with this investigation. Given that
experience, we can recommend several avenues for further
research, including the implementation of adaptive tuning
processes, an analysis of the score values accumulation
process, studying the effects of fusion approaches with other
technologies [30, pp. 16-19], and scalability testing with a
larger source population. The evidence suggests these areas of
inquiry present viable opportunities for ongoing improvement
of an already compelling product.
14 As described in Section V, Statistical Methodologies.
11
VIII. APPENDIX
A. The Receiver Operating Characteristic Curve.
ROC stands for Receiver Operating Characteristics curve.
ROC curves were originally used to study signal detection
systems but have come to be used in many areas where a
system is classifying objects into two classes. (See Fawcett,
2006, for a detailed explanation and history overview [31, pp.
861-874].) Let us assume that the two classes are called White
Hat (WH) and Black Hat (BH). We suppose that it is possible
using some algorithm to create a score for each object being
evaluated. We assume that higher scores are more likely to be
associated with WH objects and lower scores are more likely
to be associated with BH objects. We can then order (in
descending scores) all the scores obtained and begin the
process of creating an ROC curve. At each value, we record
the proportion of scores from true WH objects we have
encountered and the proportion of scores from true BH objects
we have encountered. We then plot each value using the BH
percentage as the x value and the WH percentage as the y
value. We then “connect the dots” to form a curve. This curve
has several properties, two of which are: it is invariant under
increasing monotonic transformations of the scores and it is an
increasing function.
A ROC curve which is more skewed towards the upper left
part of the graph shows that the system works better at
discriminating WH and BH objects. (A “random” curve is
represented by a straight line from (0,0 to (1,1).) The Equal
Error Rate (EER) is the value where the FAR equals the FRR
and can be determined by drawing a straight line from (0,1) to
(1,0) and seeing where it intersects the ROC.
B. Study App Instructions.
Listed below, are the written instructions provided to the
participants through the Study App15. These are supplemental
to the oral instructions provided by the Proctors.
1. What is the purpose of this study?
Intensity Analytics Corporation, www.intensityanalytics.com,
has invented ground-breaking technology to authenticate
computer use and thereby provide to the world a better way to
know who — exactly— is using a computer. More specifically,
our software can “recognize” typing patterns and match them
to an authorized library of patterns with great accuracy. The
purpose of this study is to quantify the level of accuracy so
that our technology can be mathematically compared to the
performance of older approaches.
We say that our approach is better because it requires no
special hardware (keyboard only), stores no personal content
15 As described in Section IV, Methodology.
or PII (Personally Identifiable Information), and can run
independently (requiring minimal effort to integrate with
existing applications) so therefore is far easier to install,
simpler to use and much less expensive than what’s out there
today.
You are an important part of the study! All you have to do is
type. For the very reason that you are not part of our
company, you are “statistically independent.” All we ask is
that you type something familiar in a routine way. This whole
process should require no more than about 10 minutes.
The White Hat test is you being you. You do everything
normally. You don’t attempt to confuse the system – after all,
the purpose is to protect your work, your data and your
intellectual property and processes. To be sure that you are
you, for White Hat purposes, we will ask you to submit two
separate entries typed at different times – much later in the
day.
Our validation logic will test both of your White Hat entries
against each other to be sure that they match. Then you can
have some fun. You, or someone else, can run a Black Hat test
where you try to do something “funny,” or you ask somebody
you trust to mimic your typing as best as they can. Your Black
Hat test will be always be a different set of characters than
your White Hat test, since you will be trying to “be” that other
person.
If you would like to see the results, please provide us with your
contact information and, when the entire study is complete, we
will be happy to send you a copy. No other use of your contact
information will be made.
Thanks again very much.
2. How do I get started?
If you haven’t already, you might like to read the “purpose of
this study” FAQ.
There are three kinds of participants: White Hats, Black Hats,
and Proctors. Because the results of this test will provide data
to a very rigorous statistical testing process, managed by
nationally-prominent university professors with decades of
experience and academic degrees in the area of biometric
measurement, as you would expect, we must abide by three
basic requirements: (1) have a Proctor supervise the process
so that he/she can attest to the quality and rigor of all testing
activity, (2) accumulate enough data, and (3) ask the
participants to follow the typing rules to get clean data, by
providing normal-use experience.
12
White Hats type a comfortable, short phrase 12 times.
Sometime later, the White Hats do that a second time, so that
we have a baseline of known data for each person. At another,
later, time, Black Hat testing is done. This is performed by
another person who pretends to be a specific White Hat and
who tries to type data in a way that they believe looks and, to
their observant listening ears (if they observed the White Hat
test), "sounds" (the keyboard clatter pattern) like what the
White Hat did.
3. How will I provide you my contact information?
After you successfully complete a test session, you will be
presented with an optional results enrollment opportunity.
This is a brief form in which we receive sufficient contact
information about you so that we can send you the results.
There is also a comment area for you to provide your thoughts
and feedback — very welcome!
The only use that will ever be made of this data is to contact
you in connection with the study and the data produced by it.
Your information will not be given to any third party, and will
be removed from our roster anytime upon request.
4. Why do I have to perform the White Hat entries twice?
One of the hallmarks of a properly-operating biometric
authentication system is to grant access to the correct person,
but just as dependably deny access to the wrong person.
It’s always a balancing act: there are, of course, two ways to
get a “perfect score” — half the time. Always deny or always
admit. The difficulty in creating useful biometric
authenticating technology is knowing what the right action is,
in all circumstances, in an attempt to get a perfect score all
the time.
That’s why we need two separate White Hat tests. We need
one test to compare against another, and ensure that the
"right" person can be "granted access".
5. What is different about the Black Hat test?
Black Hat entries are intended to measure how well the
technology deals with accidental or purposefully wrong
entries.
To perform such tests, you will need to enter the Proctor-
provided test “Identity” and also the specific password you
will have been given. It is important to exactly use the
provided password so that tests involving accepting/rejecting
null hypotheses can be reliably performed using accepted
statistical methods.
You may also wish to do your own experimentation. Doing
that is most welcome, but you will first have to become your
own Proctor and then you can make all the identity and
password decisions you like. Please see other FAQ’s as to
how you can do that, or please call us.16
The Black Hat is where the rubber meets the road! If you’re a
Good Person entering a Good Password, but the tuning is set
tight and it takes a time or two “to get through,” it’s a pain …
but not a disaster, so long as you can eventually get in. But, if
you’re an unauthorized Bad Person trying to trespass into
systems, processes or data stores that are not rightfully yours,
preventing you from getting in IS something we want to do.
6. Why are entries with backspaces, pauses, and special
characters not used?
To obtain a statistically valid result, we must have enough
sample data so that the natural variation in the cadence and
habit of people’s typing can be measured and then considered
as a part of the judgment-rendering process. We have been
advised that 12 is the right number, but we equally understand
that few people can provide 12 perfect samples. Accordingly,
our selection algorithm knows how to take a reasonable
number of mistyped entries into consideration.
However, if, when typing the samples, you feel that you were
inappropriately distracted, or simply were just not feeling
yourself at the moment, you can hit the Start Over button and
do it all again. Nothing will have been recorded. On the other
hand, and quite normally, most of us do make some keying
errors which we almost subconsciously correct, usually by
backing up and typing again, or using any of the various
pasting or drag-and-drop mouse capabilities to perform an
entry in the first place.
Please understand that we are not interested in WHAT the
entry is. Hence, comments such as “I am not a very good
typist” miss the point. We measure HOW you type, not WHAT
you type. The actual measurement relates to the exact timing
of combinations of various small muscle movements – what
your fingers touched, and when.
Therefore, one can see that the process of measuring small
muscle movements is defeated by using the backspace or
delete keys, or any kind of paste operation, the arrow, end or
home keys, or by 'constructing' a character using the <alt>
key, etc..
Again, the problem with using any of the special, or action,
keys is that doing so interrupts our ability to carefully time
normal typing. This study focuses on measuring the times
16 Only tests proctored by the designed protocol, described herein, were
included in this analysis.
13
involved in correct, predictable, typing and not the process of
typing a string that results in producing the desired
characters. If typing "cat" is what's being measured, should
you happen to type cart, you can see that the timing is
radically different than just typing "cat" cleanly. If the system
detects the use of an action key (e.g., arrow, etc.) it will simply
disallow that entry -- so please just retype it.
This is the reason we disallow that kind of typing in this study.
7. Creating a White Hat Entry
Enter a password in the template box, repeating the same
word (exactly matching the template) in all 12 boxes below.
Use the Tab key or the mouse to move between entries. DO
NOT USE A REAL PASSWORD. Use any familiar word or
phrase with 10-35 characters, that you can type smoothly,
easily, and regularly without thinking about the spelling, such
as the name of a street or a company name. Entries using
backspacing, pasting, pauses, or specially-constructed
characters with the <alt> key will disqualify that entry for a
good reason.
8. How do you become a Proctor?
We are happy you asked!
Intensity Analytics Corporation is actively seeking Study
Proctors in order that we might be able to run as many
different tests as possible, in different locations,
circumstances, applications/markets and with differing
collections of participants.
Training to be a Proctor can be done over the phone and
requires 15-30 minutes, most of which are spent reviewing the
purpose of the study, testing rules and protocols for
conducting tests which produce useful results.
Please give us a call at (540) 300-2400 or write
We hope you’ll join and contribute to the roll-out of a truly
revolutionary technology.
Thank you very much!
9. What does a Proctor do?
To render an accurate opinion, professional statisticians need
to be certain that the data collection process is as pure as
possible. This means no surprises and no accidents (e.g. a test
taker's accidentally entering the wrong identification).
Also, certain minimum data quantities, test-taking
times/durations, as well as the availability of a qualified
instructor to answer on-the-spot questions, are all vitally
important factors which contribute to the overall success of
the study.
Our experience indicates that having a trained Proctor on-
site, providing guidance and monitoring all activities,
minimizes the possibility of inadvertent practices which might
provide corrupt data and misleading results.
IX. ACKNOWLEDGMENTS
The authors wish to acknowledge the following for their
assistance:
John Fox, COO
SWAT Solutions, Inc.
5100 Gamble Dr., Suite 503
St. Louis Park, MN 55416
Matthew Chartrand, Lead Privacy & Security Engineer
RedBrick Health Corporation
920 2nd Avenue South, Suite 1000
Minneapolis, MN 55402
Brian Isle, Senior Fellow
Adventium Labs
111 Third Ave South, Suite 100
Minneapolis, MN 55401
Erin Warhol, IT Supervisor
University of Minnesota Law School
229 19th Ave S, Room 260
Minneapolis, MN 55455
John Rome, CEO
Thomas Ketcham, CIO & EVP
Intensity Analytics Corporation
PO Box 491
Warrenton, VA 20106
X. REFERENCES
[1] D. T. Gantz, J. J. Miller and M. Walch, "Multi-language
Handwriting Derived Biometric Identification," in
Proceedings 2005 Symposium on Document Image
Understanding Technology, College Park, MD, 2005.
[2] W. L. Bryan and N. Harter, "Studies in the Physiology
and Psychology of the Telegraphic Language,"
Psychological Review, vol. 4, no. 1, pp. 27-53, 1897.
[3] R. Spillane, "Keyboard Apparatus for Personal
Identification," IBM Technical Disclosure Bulletin, vol.
14
17, no. 3346, 1975.
[4] R. S. Gaines, S. J. P. William Lisowski and N. Shapiro,
"Authentication by Keystroke Timing: Some Preliminary
Results (No. RAND-R-2526-NSF)," Santa Monica, CA,
1980.
[5] National Security Staff , "Strategy to Combat
Transnational Organized Crime," The White House,
Washington, D.C., 2011.
[6] Z. Liu and S. Sarkar, "Improved Gait Recognition by
Gait Dynamics Normalization," IEEE Transactions on
Pattern Analysis and Machine Intelligence, vol. 28, no. 6,
pp. 863-876, 2006.
[7] J. Han and B. Bhanu, "Individual Recognition Using Gait
Energy Image," IEEE Transactions on Pattern Analysis
and Machine Intelligence, vol. 28, no. 2, pp. 312-322,
2006.
[8] R. J. Orr and G. D. Abowd, "The Smart Floor: A
Mechanism for Natural User Identification and
Tracking," in Proceedings of the Conference on Human
Factors in Computing Systems, The Hague, The
Netherlands, 2000.
[9] H. J. Ailisto, M. Lindholm, J. Mantyjarvi, E.
Vildjiounaite and S. Makela, "Identifying People from
Gait Pattern with Accelerometers," Defense and Security,
pp. 7-14, 2005.
[10] S. Sarkar, P. Phillips, Z. Liu, I. Vega, P. Grother and K.
Bowyer, "The HumanID Gait Challenge Problem: Data
Sets, Performance, and Analysis," IEEE Transactions on
Pattern Analysis and Machine Intelligence, vol. 27, no. 2,
pp. 162-177, 2005.
[11] R. Togneri and D. Pullella, "An Overview of Speaker
Identification: Accuracy and Robustness Issues," IEEE
Circuits and Systems Magazine, vol. 11, no. 2, pp. 23-61,
2011.
[12] W. Campbell, "Generalized Linear Discriminant
Sequence Kernels for Speaker Recognition," in
Proceedings of ICASSP, Orlando, FL, 2002.
[13] D. O. Gorodnichy, M. Thieme, D. Bissessar, J. Chung, E.
Dubrofsky and J. Lee, "C-BET Evaluation of Voice
Biometrics," in SPIE Defence, Security & Sensing
Conference, Special Track on Biometric Technology for
Human Identification VIII (DS108), Orlando, FL, 2011.
[14] Y. Lau, M. Wagner and D. Tran, "Vulnerability of
speaker verification to voice mimicking," in Proceedings
of the International Symposium on Intelligent
Multimedia, Video and Speech Processing, Hong Kong,
2004.
[15] Y. W. Lau, D. Tran and M. Wagner, "Testing Voice
Mimcry with the YOHO Speaker Verification Corpus,"
Springer Berlin Heidelberg, Canberra, AUS, 2005.
[16] J. Villalba and E. Lleida, "Speaker Verification
Performance Degradation Against Spoofing and
Tampering Attacks," in FALA Workshop, Vigo, Spain,
2010.
[17] R. Newman, Security and Access Control Using
Biometric Technologies, Independence, KY: Cengage
Learning, 2009, pp. 176-178.
[18] S. Singh and K. V. Arya, "Mouse Interaction based
Authentication System by Classifying the Distance
Travelled by the Mouse," International Journal of
Computer Applications , vol. 12, no. 1, pp. 45-48, 2011.
[19] I. Van der Ploeg, "Biometrics and the Body as
Information," in Surveillance as Social Sorting: Privacy,
Risk, and Digital Discrimination, London, UK,
Routledge, 2003, pp. 57-73.
[20] "Airport Security Technology: Is the Use of Biometric
Identification Technology Valid Under the Fourth
Amendment," Temple Environmental Law and
Technology Journal, vol. 20, no. 2, pp. 251-265, 2001.
[21] S. Baker, K. Bowyer and P. Flynn, "Empirical Evidence
for Correct Iris Match Score Degradation with Increased
Time-Lapse Between Gallery and Probe Matches,"
University of Notre Dame, South Bend, IN, 2009.
[22] U. Tiwari, D. Kelkar and A. Tiwari, "Study of Different
IRIS Recognition Methods," International Journal of
Computer Technology and Electronics Engineering, vol.
2, pp. 76-81.
[23] A. Kumar, D. C. Wong, H. C. Shen and A. K. Jain,
"Personal Verification using Palmprint and Hand
Geometry Biometric," in Audio- and Video-Based
Biometric Person Authentication Lecture Notes in
Computer Science, Guildford, UK, 2003.
[24] N. Miura, A. Nagasaka and T. Miyatake, "Feature
Extraction of Finger-Vein Patterns Based on Repeated
Line Tracking and its Application to Personal
Identification," Machine Vision and Applications , vol.
15, no. 4, pp. 194-203, 2004.
[25] D. J. Hurley, B. Arbab-Zavar and M. S. Nixon, "The Ear
as a Biometric," Handbook of Biometrics, pp. 131-150,
2008.
[26] K. Makin, "The Dark Side of DNA," The Globe and
Mail, 23 August 2012.
[27] L. D. Introna and D. Wood, "Picturing Algorithmic
Surveillance: the Politics of Facial Recognition Systems,"
Surveillance & Society, vol. 2, no. 2/3, pp. 177-198,
2004.
[28] Security Research Labs GmbH,
"https://srlabs.de/spoofing-fingerprints/," [Online].
Available: https://srlabs.de/spoofing-fingerprints/.
[Accessed 15 4 2014].
[29] Thucydides and R. Crawley, The History of the
Peloponnesian War, New York: E.P. Dutton, 1910.
[30] D. T. Meva and C. K. Kumbharana, "Comparative Study
of Different Fusion Techniques in Multimodal Biometric
Authentication," International Journal of Computer
Applications, vol. 66, no. 19, pp. 16-19, 2013.
[31] T. Fawcett, "An Introduction to ROC Analysis," Pattern
recognition letters , vol. 27, no. 8, pp. 861-874, 2006.
[32] C. Wilson, "Biometric Accuracy Standards," National
Institute of Standards and Technology, Information
Access Division (IAD), 2003.
15
XI. AUTHORS
Donald T. Gantz, PhD is a Professor of Statistics and the
Chair of the Department of Applied Information Technology
in the Volgenau School of Engineering at George Mason
University; he has been a professor at the school since 1974.
Dr. Gantz has developed cutting edge methodologies for the
quantification and analysis of handwriting and has applied
these methodologies to multi-language document exploitation
and biometric identification. He has developed matching
software and scoring algorithms for fingerprint identification.
He has used statistical and geographic information system
methods to analyze the relationship between TB incidence and
socioeconomic factors. He has lectured on statistical methods
for surveillance systems to detect levels of infection due to a
natural epidemic or bioterrorism threat. He has been a
researcher and practitioner in the application of geographic
information systems, modeling systems and decision support
systems to transportation demand management and traffic
mitigation. He has done considerable work, research, and
lecturing in computer performance evaluation and capacity
planning. He has worked on the application of estimation and
control methods to the analysis of flight test data.
John J. Miller, PhD is an Associate Professor in the
Department of Applied and Engineering Statistics at George
Mason University, teaching graduate and undergraduate
courses including introductory statistics, probability, analysis
of variance, regression analysis, multivariate statistics,
biostatistics, categorical data analysis, theory of statistics, and
linear algebra. Dr. Miller also has several research interests,
including applied statistics, linear models, multivariate
methods, biometrics, and computational statistics, especially
in the specialized areas of injection of current statistical
methodology into established applications, improving
statistical methods used in litigation, and developing
techniques for classification of handwriting. He has served as
a referee for journals such as the Journal of the American
Statistical Association and the Annals of Statistics, and is a
sought-after consultant and expert witness on such varied
subjects as: handwriting biometrics, efficiency of pollution
control devices, clinical trials of pharmaceuticals, risk
management in government contracts, computational
algorithms for target tracking, calibration of medical
laboratory equipment, surveys of ocean fishing, dust hazards
in coal mines.
Thomas E. Ketcham is the CIO & EVP of Intensity Analytics
Corporation. Tom has been a serial entrepreneur for more than
twenty years, helping manage and guide businesses from the
start-up phase to over 500 employees. As Systems
Engineering undergraduate at George Mason University, he
co-founded a GIS/urban-planning laboratory that led to his
first commercial venture. He was among the early pioneers on
the web in 1993, developing one the first online content
management systems, and has designed countless solutions
which have ranged from novel data capture routines and
visualization components, to half-million line technology
suites forming the basis for high-end, critical information
management solutions, to patent-pending behavioral analytics
platforms. He is a noted inventor of many key software
technologies now found in the offerings of companies like
Fujitsu, EMC, and others. Tom has consulted with entities like
Microsoft, Johnson & Johnson, Capital One, IHS Global
Insight, the US House of Representatives, and the US Navy, in
areas such as orchestrating the flow and security of
information through state-of-the-art systems, many of which
he created. He is an accomplished speaker and panelist, as
well as a published photographer.
16
Figure 12. TickStream.KeyID test protocol overview
Related Documents


