Relevance, Benefits, and Problems of Software Modelling and Model Driven Techniques - A Survey in the Italian Industry Marco Torchiano a,* , Federico Tomassetti a , Filippo Ricca b , Alessandro Tiso b , Gianna Reggio b a Dip. Automatica e Informatica, Politecnico di Torino, Italy b DIBRIS, Universit` a di Genova, Italy Abstract Context: Claimed benefits of software modelling and Model Driven techniques are improvements in productivity, portability, maintainability and interoperability. However, little effort has been devoted at collecting evidence to evaluate their actual relevance, benefits and usage complications. Goal: The main goals of this paper are: (1) assess the diffusion and relevance of software modelling and MD techniques in the Italian industry, (2) understand the expected and achieved benefits, and (3) identify which problems limit/prevent their diffusion. Method: We conducted an exploratory personal opinion survey with a sample of 155 Italian software professionals by means of a web-based questionnaire on-line from February to April 2011. Results: Software modelling and MD techniques are very relevant in the Italian industry. The adoption of sim- ple modelling brings common benefits (better design support, documentation improvement, better maintenance, and higher software quality), while MD techniques make it easier to achieve: improved standardization, higher produc- tivity, and platform independence. We identified problems, some hindering adoption (too much effort required and limited usefulness) others preventing it (lack of competencies and supporting tools). Conclusions: The relevance represents an important objective motivation for researchers in this area. The relation- ship between techniques and attainable benefits represents an instrument for practitioners planning the adoption of such techniques. In addition the findings may provide hints for companies and universities. Keywords: Model Driven techniques, Software modelling, Personal Opinion Survey, Relevance, Benefits, Problems. 1. Introduction Usually, model-based techniques use models to de- scribe the architecture and design of a system and/or the behaviour of software artefacts generally through a raise in the level of abstraction [11]. Models can also be used for other purposes, e.g., to describe business workflows or development processes. They can be used in different phases of the develop- ment process as communication artefacts, as points of references against which subsequent implementations are verified, or as the basis for further development. In * Correspondig author: Marco Torchiano Dip. Automatica e Informatica, Politecnico di Torino, C.so Duca degli Abruzzi 24, 10129 Torino, Italy Phone: +39 011 564 7088, Fax: +39 011 564 7099 Email: [email protected] the latter case, they may become the key elements in the process, from which other artefacts (most notably code) are generated. The term “model” is very general; it is difficult to pro- vide a comprehensive yet precise definition of a model. For us, a model is an artefact realized with the goal to capture and transfer information in a form as pure as possible limiting the syntax noise. Examples of mod- els include UML design models [35], process models defined through BPMN [34], Web application models defined through WebML [5] as well as textual Domain Specific Language (DSL) models [10]. Given that models are so heterogeneous and the pro- cesses involving them so varied, it is actually difficult to define the exact boundaries for modelling. More- over, models can be used practically in different ways and with different levels of maturity [40]. While in the- ory we have a set of best practices, in practice we only Preprint submitted to Elsevier March 15, 2013

Welcome message from author
This document is posted to help you gain knowledge. Please leave a comment to let me know what you think about it! Share it to your friends and learn new things together.
Transcript

Relevance, Benefits, and Problems of Software Modelling and Model DrivenTechniques - A Survey in the Italian Industry
Marco Torchianoa,∗, Federico Tomassettia, Filippo Riccab, Alessandro Tisob, Gianna Reggiob
aDip. Automatica e Informatica, Politecnico di Torino, ItalybDIBRIS, Universita di Genova, Italy
Abstract
Context: Claimed benefits of software modelling and Model Driven techniques are improvements in productivity,portability, maintainability and interoperability. However, little effort has been devoted at collecting evidence toevaluate their actual relevance, benefits and usage complications.
Goal: The main goals of this paper are: (1) assess the diffusion and relevance of software modelling and MDtechniques in the Italian industry, (2) understand the expected and achieved benefits, and (3) identify which problemslimit/prevent their diffusion.
Method: We conducted an exploratory personal opinion survey with a sample of 155 Italian software professionalsby means of a web-based questionnaire on-line from February to April 2011.
Results: Software modelling and MD techniques are very relevant in the Italian industry. The adoption of sim-ple modelling brings common benefits (better design support, documentation improvement, better maintenance, andhigher software quality), while MD techniques make it easier to achieve: improved standardization, higher produc-tivity, and platform independence. We identified problems, some hindering adoption (too much effort required andlimited usefulness) others preventing it (lack of competencies and supporting tools).
Conclusions: The relevance represents an important objective motivation for researchers in this area. The relation-ship between techniques and attainable benefits represents an instrument for practitioners planning the adoption ofsuch techniques. In addition the findings may provide hints for companies and universities.
Keywords:Model Driven techniques, Software modelling, Personal Opinion Survey, Relevance, Benefits, Problems.
1. Introduction
Usually, model-based techniques use models to de-scribe the architecture and design of a system and/or thebehaviour of software artefacts generally through a raisein the level of abstraction [11]. Models can also be usedfor other purposes, e.g., to describe business workflowsor development processes.
They can be used in different phases of the develop-ment process as communication artefacts, as points ofreferences against which subsequent implementationsare verified, or as the basis for further development. In
∗Correspondig author:Marco TorchianoDip. Automatica e Informatica, Politecnico di Torino,C.so Duca degli Abruzzi 24, 10129 Torino, ItalyPhone: +39 011 564 7088, Fax: +39 011 564 7099Email: [email protected]
the latter case, they may become the key elements in theprocess, from which other artefacts (most notably code)are generated.
The term “model” is very general; it is difficult to pro-vide a comprehensive yet precise definition of a model.For us, a model is an artefact realized with the goal tocapture and transfer information in a form as pure aspossible limiting the syntax noise. Examples of mod-els include UML design models [35], process modelsdefined through BPMN [34], Web application modelsdefined through WebML [5] as well as textual DomainSpecific Language (DSL) models [10].
Given that models are so heterogeneous and the pro-cesses involving them so varied, it is actually difficultto define the exact boundaries for modelling. More-over, models can be used practically in different waysand with different levels of maturity [40]. While in the-ory we have a set of best practices, in practice we only
Preprint submitted to Elsevier March 15, 2013
found mixed, half baked, and personalized solutions. Asa consequence, the different uses of modelling are com-plex and difficult to classify precisely.
When models constitute a crucial and operational in-gredient of software development then the process iscalled model driven. There are different model driventechniques: Model Driven Engineering (MDE) [37],Model Driven Development (MDD) [28] and ModelDriven Architecture (MDA) [22]. MDE is the broad-est one; it is a software methodology that focuses oncreating and exploiting models, which are typicallygiven as abstract representations using a modelling lan-guage (e.g., UML but also BPMN or a home-grownDSL [10]). Instead, MDD is a development approachthat uses models as the main artefacts of the devel-opment process. In MDD, models at higher-level ofabstraction are (progressively) transformed into mod-els at lower-level of abstraction until the models areexecutable using either code generation or model in-terpretation. In this latter case, executable models aredirectly executed/interpreted by means of specific en-vironments [27]. The main difference between MDEand MDD is that MDE goes beyond the pure develop-ment activities and encompasses also other software en-gineering tasks (e.g., models evolution and reverse engi-neering of legacy systems). Finally, MDA is a registeredtrademark of Object Management Group (OMG) rec-ommending the usage of OMG standards (e.g., UML).MDA is more specific than MDD and defines the systemfunctionality using the notions of platform-independentmodel (PIM) and platform-specific model (PSM). Weare interested in no specific model driven technique,therefore, in the following, taking inspiration from [43],we will address all these related technologies collec-tively with the abbreviation MD*.
Although a lot of work has been done in the MD*context and, a wide number of studies have been re-ported in literature (e.g., [17, 18, 31]), and many com-mercial or free MD* tools are also available (e.g., Uni-Mod [13], WebRatio [1] and BridgePoint1), there is alack of evidence about the relevance of MD* in industry,and we need indication whether (or not) MD* satisfiestoday’s industry needs [29].
For those reasons, two Italian universities, Politec-nico di Torino and Universita di Genova, started a com-mon project concerning software modelling and MD*.The first step of the project aimed at achieving an ac-curate picture of the state-of-the-practice of modellingand MD* in the Italian industry by means of a survey
1http://www.mentor.com/products/sm/model development/bridgepoint/
of the Italian ICT industry. We opted for a personalopinion survey2 [12, 21] performed through the Inter-net, because this is generally the most cost effective in-terview method [44] even if it presents well-known lim-itations/problems [39].
This work is based on the same data previously an-alyzed in [40, 42] but extends our earlier work in dif-ferent ways and focuses on different aspects, not yet ex-plored, of the modelling/MD* phenomenon. In partic-ular, in the short paper [42] we gave some preliminaryfindings about our survey, considering which processes,languages and tools are used in the modelling/MD* con-text. On the contrary, the main goal of [40] was inves-tigating the level of maturity in the usage of softwaremodels and MD* in the Italian industry. Instead, here,we focus our interest on three key aspects: (1) relevanceof modelling/MD* measured using their real diffusion,(2) benefits of using modelling/MD* and, (3) problemshindering or preventing modelling/MD*.
The evidence we collected about modelling andMD*, by means of this survey, holds a value “per se” asnew assets in the software engineering body of knowl-edge. In addition, it brings important implications inthe practice of both software development and educa-tion/training. We think that, on the basis of the resultsof this broad survey, more specific studies could be con-ducted to confirm and clarify the most controversial ordifficult understandable findings.
The paper is structured as follows. Section 2 presentsthe relevant aspects of the conducted survey such as:goals, research questions, questionnaire design, sampleidentification, survey preparation/execution and anal-ysis methodology. Section 3 presents the findingsabout relevance, benefits and problems of modellingand MD*. Section 4 discusses the obtained results andSection 5 examines the unavoidable threats to validity.Section 6 is about related works and, finally, Section 7concludes the paper and presents ideas for future work.
2. Study definition
The instrument we selected to take a snapshot of thestate of the practice concerning industrial MD* adop-tion is that of a survey [12]. In the design phase of thesurvey we drew inspiration from previous surveys (i.e.,[20, 23, 41]) and we followed as much as possible theguidelines provided in [21].
2The purpose of a personal opinion survey is to produce statistics,that is, quantitative or numerical descriptions of some aspects of thestudy population.
2
The survey has been conducted through the follow-ing six steps [21]: (1) the objectives (or goals) selec-tion, (2) goals’ transformation into research questions(section 2.1), (3) questionnaire design, (4) sampling andevaluation of the questionnaire by means of pilot execu-tions, (5) survey execution and, (6) analysis of resultsand packaging.
We conceived and designed the survey with the goalsof understanding:
G1 the actual relevance of software modelling andMD* in the Italian industry,
G2 the way software modelling and MD* are applied(i.e., which processes, languages and tools areused), and
G3 the motivations either leading to the adoption (ex-pected benefits) or preventing it (experienced orperceived problems).
The above three goals cover quite a wide spectrum; inthis work, we mainly focus on the goals G1 and G3. Asfar as goal G2 is concerned, some preliminary findingscan be found in [42] and a brief summary is provided inSection 3.2.
2.1. Research Questions
Within the scope of this work, we aim at address-ing three main research questions (with relative sub-questions), one (RQ1) is related to goal G1 and the othertwo (RQ2 and RQ3) are related to goal G3:
RQ1: What is the diffusion and relevance of modellingand MD* in the Italian industry?
Finding out the proportion of IT professionals ac-tually adopting modelling and MD* should allowus to understand how important such developmenttechniques are. Knowing whether they representniche, commonly used, or mainstream methodolo-gies has a dramatic impact on the conclusions wecan draw.
RQ1.1: What is the adoption ratio of individualMD* techniques?Since MD* is typically applied with diverseblends of basic techniques, we want to ex-amine which techniques are used (e.g., codegeneration or model execution) and which arethe most relevant.
RQ1.2: What is the diffusion by company sizecategory?
Some authors (e.g., Selic [38]) believe MD*is mostly intended for large projects carriedon by large companies; is it true? An empiri-cal validation of such a claim requires break-ing down the prevalence figures by companysize.
RQ2: What are the benefits of using modelling andMD*?
From a technology transfer perspective it is impor-tant to motivate the adoption of a new technique bypresenting the benefits that it could bring. There-fore, we are interested in understanding which spe-cific technique (e.g., code generation) increases thelikelihood of a given benefit.
RQ2.1: Do individual MD* techniques affect theachievement ratio of specific benefits?
RQ2.1: Which benefits are most common in eachcompany size category?
RQ3: What issues hinder/prevent the adoption of mod-elling and MD*?
The reasons that hinder/prevent the adoption ofmodelling and MD* are as important as the po-tential benefits. In some cases these motivationsmay exclude such techniques from the whole com-pany, in other cases the preclusion may be on a per-project basis.
2.2. Population and sampling strategy
The first step to conduct a survey consists in defininga target population. In our study the target populationis formed by software development teams or businessunits. To get information about the target populationwe defined a framing population consisting of Italiansoftware professionals – i.e., project managers, softwarearchitects, developers – whom we asked to answer ourquestions (about the target items).
To sample the population we applied both probabilis-tic (random sampling) and non-probabilistic (conve-nience sampling) methods [21]. More in detail, the sam-pling was performed in five ways: (i) randomly select-ing contacts from the the Commerce Chamber database,(ii) selecting contacts from the industrial contact net-works of the two research units involved (Torino andGenova), (iii) sending invitation messages to mailinglists concerning programming and software engineer-ing, (iv) publishing an advertisement in an on-line mag-azine for developers (programmazione.it) and, and (v)
3
placing and advertisement on the web portal of a largeItalian developers’ conference (CodeMotion 2011).
We decided to collect data through an on-line ques-tionnaire created by means of the LimeSurvey surveytool3. Web-based questionnaires, compared to paper-based questionnaires or email-based questionnaires, al-low an easier data entry from the respondent perspec-tive, a simpler data collection from the researcher per-spective and are less error prone [36]. In general, it hasbeen observed that Web-based questionnaires guaranteehigh return rates [20].
2.3. Survey Preparation and Execution
The procedure followed to prepare, administer, andcollect the questionnaire data is made up of the follow-ing five main steps.
Preparation and design of the questionnaire. Wefirst prepared a preliminary version of the questionnaire.Then, we conducted three different pilots with softwareprofessionals to identify any problems with the ques-tionnaire itself [21], before putting on-line the final ver-sion. According to the feedback obtained, we made afew changes to the questionnaire to improve the validityof the instrument.
On-line deployment. Once finalized, the question-naire was uploaded to the LimeSurvey server to enablethe automatic collection of data.
Invitation to participate. Organizations were sam-pled as detailed above (Section 2.2). For the contactsthat we selected directly, once the contact persons wereidentified, we invited them, via email, to register withthe survey server and to complete the on-line question-naire. We also broadcast invitation on selected mailinglists and on-line magazines/conferences including in themessage a link (“click here to take the survey”) to aregistration form where the participants could registerthemselves and fill in the questionnaire. The question-naire was introduced by a brief description page sum-marizing goals and motivation of this study and it wasaccompanied by a cover letter briefly introducing ourresearch project. In the cover letter we tried to sum-marize: the purpose of the study, the relevance to theparticipants and, why each individual participation wasimportant [21]. Great care was taken to ensure that eth-ical requirements and privacy rules imposed by the Ital-ian regulations were met4. For example, they requireconfidentiality but give the possibility of publishing theresults in aggregated form. We decided to avoid any
3http://www.limesurvey.org/4privacy Italian law: “D.lgs. n.196/2003”.
form of material incentives for participation. However,to motivate professionals, we promised to provide a re-port containing the analyses and the obtained results toall participants.
Monitoring. During the data collection phase, wemonitored the progress of the questionnaire submission.This allowed us to send selective reminders to contactswho did not respond or did not completed the ques-tionnaire yet. Some people reported some difficultiesabout the questions, either due of internal policies of thecompany or because involved in very different projectswith different companies at the same time; they askedus some clarifications about the questions.
Data analysis and Packaging. After data collectionwas concluded, we performed analyses as described insection 2.5 and we packaged instruments, data, and re-sults in a replication package.
2.4. Questionnaire Design
The questionnaire was developed to directly addressthe goals of the study. To harvest as many responsesas possible, we designed the questionnaire to limit asmuch as possible the time necessary to complete it, hav-ing in mind that long questionnaires get less responsethan short ones [44]5.
The questionnaire contains a total of thirty-one items,both open and multiple-choice expressed in Italian lan-guage. However, the actual number of items adminis-tered to any individual respondent depends on her adop-tion of MD* and modelling (e.g., respondents not adopt-ing modelling in their software process were required toanswer eight questions only).
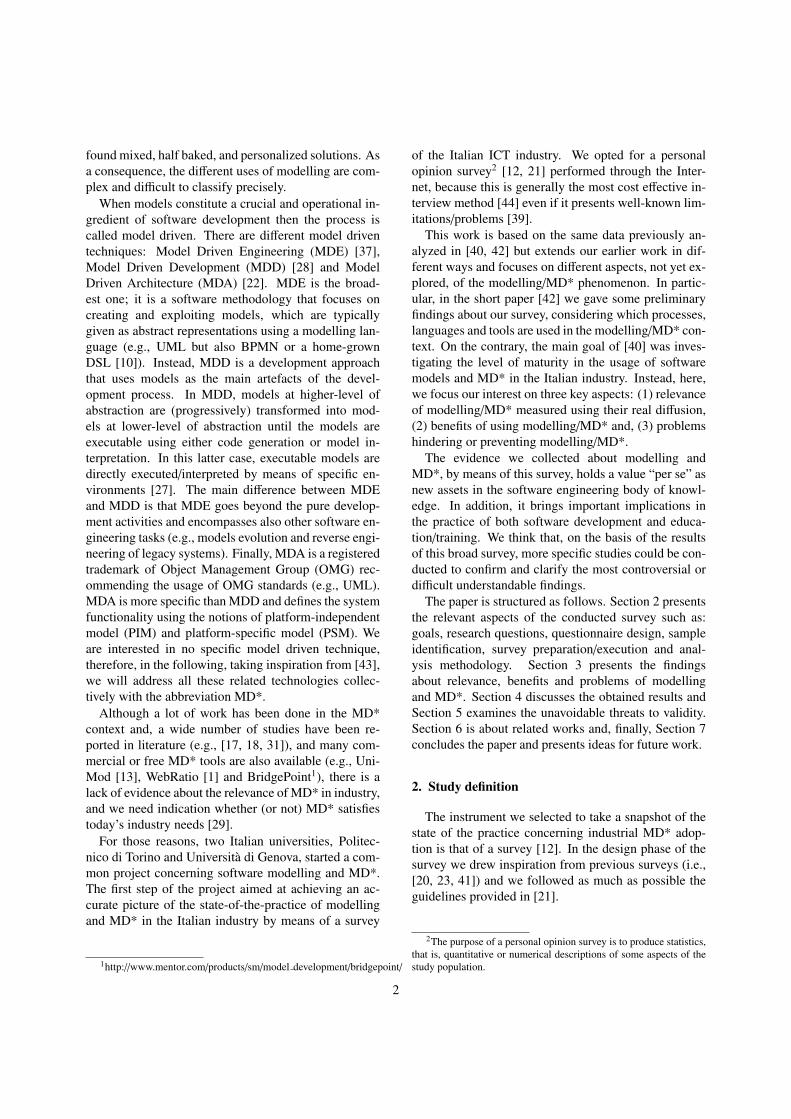
The structure and possible paths through the ques-tionnaire are described in Figure 1. The questionnaireconsists of four sections; each session is identified bya three characters identifier (Sub, Dev, Mod, and Lan)and is described below. The individual items are namedusing the section identifier followed by a two digits pro-gressive number (e.g., Sub04 is the fourth item in thequestionnaire and appears in the Sub section).
Sub (subject’s demographics): this is the first sectionand is administered to all respondents; its goal isto characterize the respondents and their organi-zation. In particular, it collects: business domain,organization size, respondent’s group/business unitsize and experience of unit members. For example,freelance or individual companies are asked only
5It turned out the actual time for completing the questionnaire wason average less than six minutes.
4

Sub02
Dev08
Mod14
Lan28
Lan25
Mod19a
Sub04 Sub03
Sub05, Dev06, Dev07
Dev09 Dev09
Dev10, Dev11, Mod12a, Mod12b, Mod13
Mod15
Mod16, Mod17, Mod18
Mod19b
Mod20, .. Mod24
Lan27
Lan29b
Lan29a
Lan29b
Legal kind of the firm?
Are models used?
Percentage of code generated from models?
Have editors of other supporting tools been developed?
Is UML used?
Are any Domain Specific Languages used?
[else]
[freelance or Individual firm]
[Sometimes]
[Always] [Never]
[ >0 ]
[else]
[else]
[yes]
[yes] [else]
[textual]
[textual/graphical]
[else]
Sub03
Lan26 [yes]
[else]
Lan29a
[graphical]
Figure 1: Questionnaire structure.
three distinct questions of this kind (Sub02, Sub03and Sub05), as we may observe from Figure 1.
Dev (development process): the second section col-lects information concerning the kind of projectsconducted, their average duration, whether therespondent uses models, and the expected andachieved benefits. The respondents that do not usemodelling systematically (i.e., answering never orsometimes at question Dev08) are asked about theproblems preventing or limiting to use models (seequestion Dev09 in Table 1 and Figure 1). Respon-dents never using modelling terminate the ques-tionnaire with this section.
Mod (modelling details): the items in this section areadministered to respondents that use modelling atleast sometimes. The section collects informationconcerning the adoption of processes, techniquesand tools.
Lan (languages and notations): contains items measur-ing use of UML, UML profiles and domain specificlanguages (DSLs).
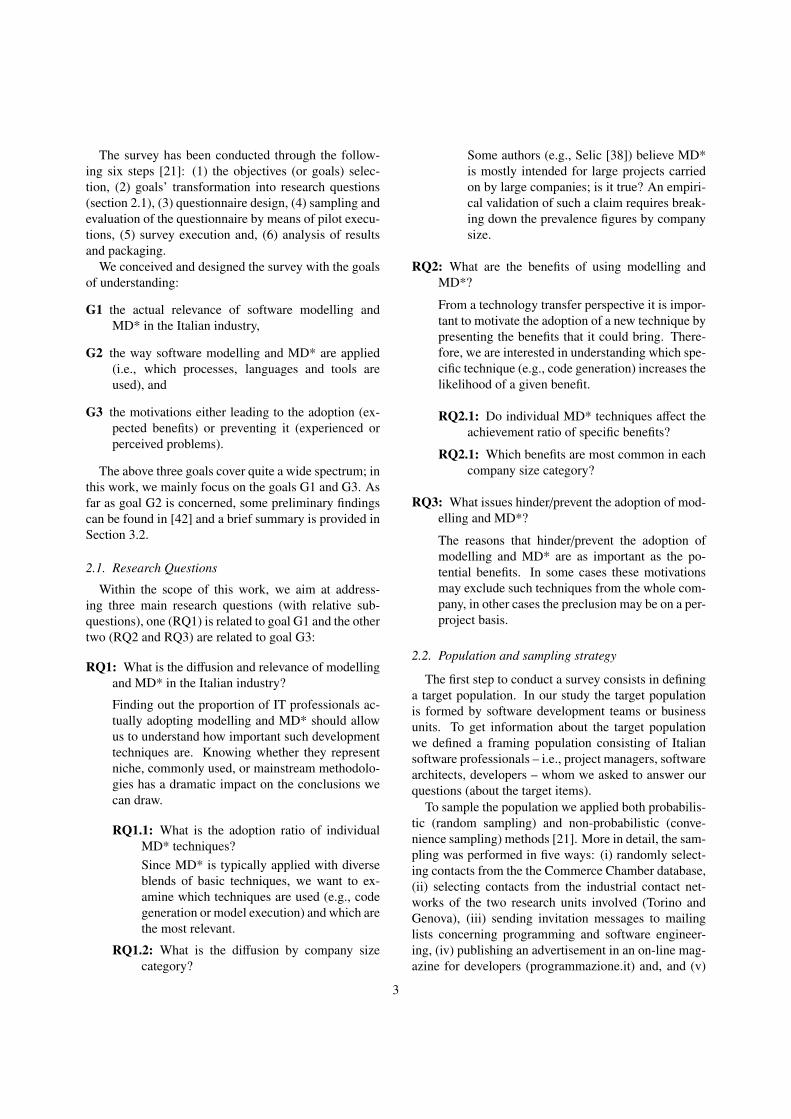
Table 1 reports the subset of the items in the ques-tionnaire that are relevant to the research questions con-sidered in this paper. For each question the table reports
the identifier, the question (translated into English fromItalian), the type of measure, and the RQ it is relevantto. The complete questionnaire (in Italian) is availablefor downloading on the web6.
A few items in the questionnaire are particularly im-portant for the purpose of this paper and deserve moreattention.
In section Dev, the most important item is Dev08that corresponds to the following question: “Are modelsused for software development in your organization?”By model we mean both diagrams and text artefacts cre-ated using either general purpose modelling languages(e.g., UML) or Domain Specific Languages (DSLs)7.Dev08 is a closed question that allows three valid an-swers: always, sometimes and never. Depending on theDev08 answer, three distinct paths were followed (seequestionnaire structure in Figure 1):
• respondents that always use modelling were askedabout the benefits (Dev11),
• those using modelling only sometimes were askedabout the benefits (Dev11) and also about the prob-lems preventing the use of modelling (Dev09), and
6http://softeng.polito.it/tomassetti/MDQuestionnaire.pdf7This was clarified in the questionnaire given to the participants.
5
ID Question Type RQsSub02 What legal entity/kind does your company fit?
Valid answers: Freelance/individual firm; Firm/company; Public institution; Other
Nominal RQ1,RQ3
Sub03 What is the main business activity of your company?Valid answers: [Manufacturing; IT; Public Administration; Service Provider; Transport; Telecom; Other]
Nominal RQ1,RQ3
Sub04 How many persons does your company count, including part-time, full-time staff andconsultants?
Ordinal RQ1,RQ3
Sub05 Provide the experience (in years) of the business unit’s members Interval RQ1,RQ3
Dev08 Are models used for software development in your organization? (for model we meanboth diagrams, e.g., UML, and text according to any DSL)Valid answers: Always; Sometimes; Never
Nominal RQ1,RQ3
Dev09 What are the problems preventing modelling and MD*? Nominal RQ3Dev11 What are the benefits expected and verified from using modelling and MD*? Nominal RQ2
Mod14 What is the percentage of code generated from models? Interval RQ1Mod14* Is code generated? Derived measure: Mod14∗ = Mod14 > 0 Yes/No RQ1Mod16 Are models executed (interpreted) at run-time? Yes/No RQ1Mod18 Are transformation languages (e.g., ATL) used? Yes/No RQ1Mod19a Have modelling support tools and editors been developed? Yes/No RQ2MD USAGE Is any MD* technique used?
Derived measure: MD US AGE = Mod14 ∗ ∨Mod16 ∨ Mod18Yes/No RQ1
Lan25 Is UML used? Yes/No RQ2Lan26 Are UML profiles used? Yes/No RQ2Lan28 Are Domain Specific Languages used?
Valid answers: No; Yes, textual; Yes, graphical; Yes, both graphical and textual
Nominal RQ2
Table 1: Subset of relevant questionnaire items (translated from Italian to English). Questions are condensed in respect to the administered survey.
• respondents never using modelling were askedonly about the potential problems (Dev09).
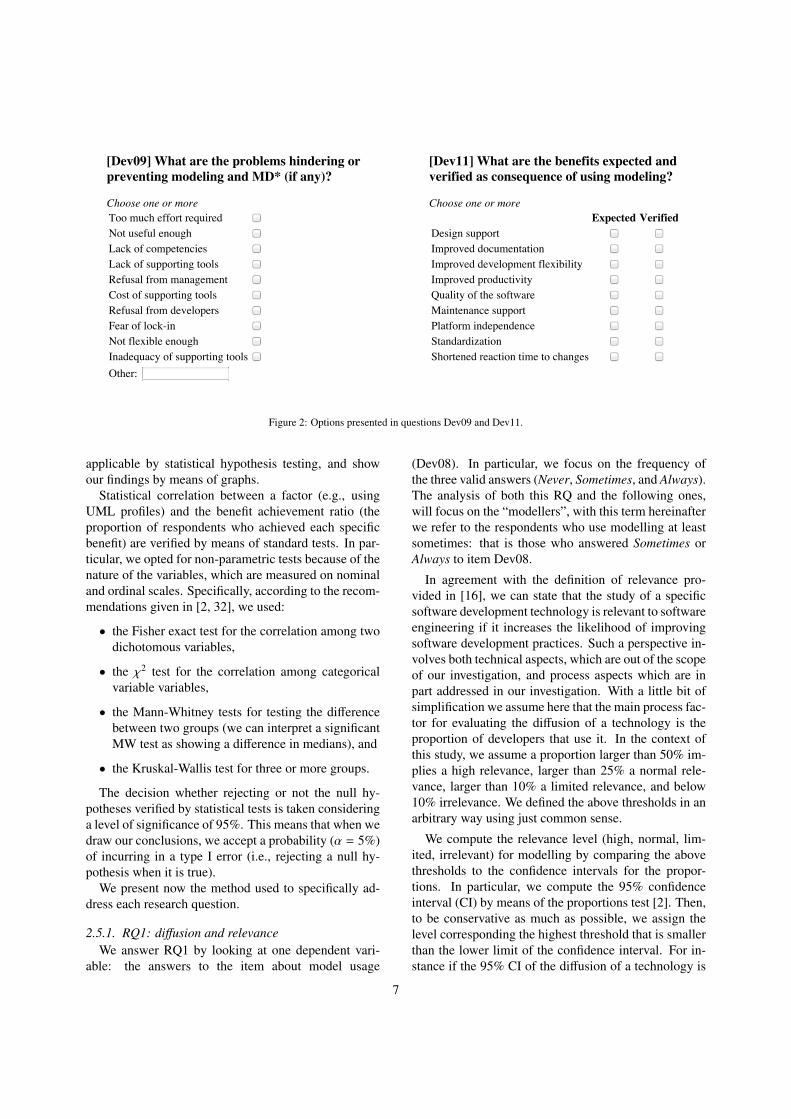
Given their importance, we evaluated accurately thepossible answers presented for questions Dev09 andDev11 in the design phase of the questionnaire. More-over, we fine-tuned them based on the outcomes of thepilots. The values we chose are reported in Figure 2.
Since we were not sure about the range of possibleproblems preventing the usage of models and MD*, wedesigned item Dev09 as a multiple answers questionwith a set of predefined options plus an additional openoption.
Conversely, after the feedback from the pilots, wewere confident we identified all the significant benefits,therefore item Dev11 was designed as a closed answerwith multiple choices. The question Dev11 asks whichbenefits among the ones presented were expected by therespondents and which ones were actually verified. Foreach benefit the respondent had the possibility to markseparately if the benefit was expected or verified. In thisway four combinations are possible for each single ben-efit: it could have been expected and verified (positiveconfirm), expected and not verified (negative surprise),
not expected and verified (positive surprise) or not ex-pected and not verified (negative confirm).
In the questionnaire there are three items concern-ing MD*-specific practices: code generation (Mod14),model interpretation (Mod16), and model transforma-tions (Mod18). We plan to handle the three practicecategories in an homogeneous way; since Mod14 mea-sures the percentage of code generated from models,while the other two (Mod16 and Mod18) just measurethe adoption as a boolean value, we introduced a de-rived variable (Mod14*) with boolean type whose valueis true when some code is generated and false otherwise,i.e., Mod14∗ = Mod14 > 0.
We assume that using at least one of the three tech-niques means adopting MD*, therefore, we defined aderived item (MOD USAGE see Table 1) that is definedon the basis of the three technique oriented items, i.e.,MD US AGE = Mod14∗ ∨ Mod16 ∨ Mod18.
2.5. Analysis methodology
We address the three research questions delineated inSection 2.1 by means of descriptive statistics and where
6
[Dev09] What are the problems hindering orpreventing modeling and MD* (if any)?
Choose one or moreToo much effort requiredNot useful enoughLack of competenciesLack of supporting toolsRefusal from managementCost of supporting toolsRefusal from developersFear of lock-inNot flexible enoughInadequacy of supporting toolsOther:
[Dev11] What are the benefits expected andverified as consequence of using modeling?
Choose one or moreExpected Verified
Design supportImproved documentationImproved development flexibilityImproved productivityQuality of the softwareMaintenance supportPlatform independenceStandardizationShortened reaction time to changes
Figure 2: Options presented in questions Dev09 and Dev11.
applicable by statistical hypothesis testing, and showour findings by means of graphs.
Statistical correlation between a factor (e.g., usingUML profiles) and the benefit achievement ratio (theproportion of respondents who achieved each specificbenefit) are verified by means of standard tests. In par-ticular, we opted for non-parametric tests because of thenature of the variables, which are measured on nominaland ordinal scales. Specifically, according to the recom-mendations given in [2, 32], we used:
• the Fisher exact test for the correlation among twodichotomous variables,
• the χ2 test for the correlation among categoricalvariable variables,
• the Mann-Whitney tests for testing the differencebetween two groups (we can interpret a significantMW test as showing a difference in medians), and
• the Kruskal-Wallis test for three or more groups.
The decision whether rejecting or not the null hy-potheses verified by statistical tests is taken consideringa level of significance of 95%. This means that when wedraw our conclusions, we accept a probability (α = 5%)of incurring in a type I error (i.e., rejecting a null hy-pothesis when it is true).
We present now the method used to specifically ad-dress each research question.
2.5.1. RQ1: diffusion and relevanceWe answer RQ1 by looking at one dependent vari-
able: the answers to the item about model usage
(Dev08). In particular, we focus on the frequency ofthe three valid answers (Never, Sometimes, and Always).The analysis of both this RQ and the following ones,will focus on the “modellers”, with this term hereinafterwe refer to the respondents who use modelling at leastsometimes: that is those who answered Sometimes orAlways to item Dev08.
In agreement with the definition of relevance pro-vided in [16], we can state that the study of a specificsoftware development technology is relevant to softwareengineering if it increases the likelihood of improvingsoftware development practices. Such a perspective in-volves both technical aspects, which are out of the scopeof our investigation, and process aspects which are inpart addressed in our investigation. With a little bit ofsimplification we assume here that the main process fac-tor for evaluating the diffusion of a technology is theproportion of developers that use it. In the context ofthis study, we assume a proportion larger than 50% im-plies a high relevance, larger than 25% a normal rele-vance, larger than 10% a limited relevance, and below10% irrelevance. We defined the above thresholds in anarbitrary way using just common sense.
We compute the relevance level (high, normal, lim-ited, irrelevant) for modelling by comparing the abovethresholds to the confidence intervals for the propor-tions. In particular, we compute the 95% confidenceinterval (CI) by means of the proportions test [2]. Then,to be conservative as much as possible, we assign thelevel corresponding the highest threshold that is smallerthan the lower limit of the confidence interval. For in-stance if the 95% CI of the diffusion of a technology is
7

[35% , 65%] we assign the “normal relevance” categorysince the corresponding threshold (25%) is the highestone smaller than the lower limit (35%).
Then, we analyse the relevance and diffusion indica-tors with respect to the company size (Sub04). In partic-ular, we check for the existence of a correlation betweenthe adoption ratio of modelling and the company sizecategories. To this end, we build a 2 × 5 contingency ta-ble of modelling adoption (sometimes or always) vsnomodelling on one side and company size categories onthe other side (we considered five company size cate-gories, see Table 2). We apply the χ2 test to reject thenull hypothesis that no correlation exists. In addition weevaluate the relevance for each company size category
Moreover, we focus on the adoption of the MD*specific practices: code generation (Mod14*), modelinterpretation (Mod16), and model transformations(Mod18). In particular, we assume that respondents us-ing at least one of the above cited techniques is adoptingMD* 8
For both the general MD* adoption and each specifictechnique we perform the same analyses as above: firstwe classify the relevance and then we analyze it in rela-tion to company size.
2.5.2. RQ2: benefitsQuestion RQ2 is addressed by analysing the answers
to a composite item (Dev11) which listed several poten-tial benefits and asked which were expected and whichwere achieved (see Figure 2). For this question we fo-cus on the actually achieved advantages. In particularwe adopt as metric the benefit achievement ratio: theproportion of respondents who achieved each specificbenefit.
As a preliminary step, we investigate the cross cor-relation among the different benefits, since the adoptionis a dichotomous variable, we selected the Pearson’s φas a strength of correlation measure. The statistical sig-nificance of the correlation is verified by means of theFisher exact test.
We first report the benefit achievement ratio amongall modellers, with the intention of classifying the bene-fits in terms of their likelihood. In particular we assumethat above a 50% frequency a benefit can be consideredas Very Likely, above 25% as Likely, above 10% as sim-ply Probable, and below that threshold as Unlikely. Asfor the relevance categories of RQ1, we compute the95% confidence interval of the proportion using a pro-
8With respect to our previous paper [42], here we use a differentdefinition for MD* adopter.
portion test and compare the lower limit with the abovethresholds.
Then, we report the proportion of respondents whoachieved each specific benefit making a distinction be-tween adopters of simple modelling and adopters ofMD*. We investigate whether a significant difference inbenefit achievement ratio between the two groups existsand for any such case we will perform a further clas-sification of the relative likelihood. For the purpose ofidentifying the difference we observe the odds ratio9 ofbenefits achievement for the two groups and test the sig-nificance by means of the Fisher exact test.
After that, we focus on the three key MD* tech-niques (i.e., code generation, model transformation andmodel interpretation). In particular, we check whetherthe adoption of a single technique induces a significantdifference in terms of benefit achievement ratio. As forthe previous step, we focus on odds ratios and we usethe Fisher exact test to identify significant differences.
Then, we check for the existence of a correlation be-tween the achievement ratio of each individual benefitand the company size categories. Similarly to the pro-cedure adopted for RQ1, for each benefit, we build a 2 ×5 contingency table of achievement vs. not achievementof a benefit on one side and company size categories onthe other side. We apply the χ2 test to reject the nullhypothesis that no correlation exists.
Eventually, as a last step concerning RQ2, we observethe relationship between benefit achievement and otherfactors, namely toolsmithing, adoption of UML, UMLprofiles, and DSLs. In particular we observe how theodds of achieving a benefit change when each individualtechnique is employed. The Fisher exact test is used totest the null hypothesis that no significance differenceexists.
2.5.3. RQ3: problemsTo answer RQ3, we consider the composite item
Dev09 which reports for each participant a list of prob-lems (s)he found prevented her/him from adopt mod-elling (see Figure 2). The respondents to this item in-clude those who never use modelling and those who use
9The odds ratio is a measure of effect size that can be used for di-chotomous categorical data. An odds indicates how likely it is that anevent will occur as opposed to it not occurring. Odds ratio is definedas the ratio of the odds of an event occurring in one group to the oddsof it occurring in another group. An odds ratio of 1 indicates that thecondition or event under study is equally likely in both groups. Anodds ratio greater than 1 indicates that the condition or event is morelikely in the first group. Finally, an odds ratio less than 1 indicates thatthe condition or event is less likely in the first group.
8

Interval Group Frequency1 Individual 242-10 Micro 2511-50 Small 2651-250 Medium 26251+ Large 54
Table 2: Frequency of respondents for different company sizes.
CodeGeneration # # # #
ModelInterpretation # # # #
ModelTransformation # # # #
Freq 55 30 3 0 6 3 1 752% 28% 3% 0% 6% 3% 1% 7%
Table 3: Combined diffusion of MD* techniques ( : technique used,#: technique not used).
it sometimes: for the former the problems prevent alto-gether modelling, while for the latter the problems justcurb it.
We adopt a similar approach as for RQ2, therefore wefirst verify cross correlation among problems, then wereport the problem occurrence ratio among modellers,with the intention of classifying them in terms of rele-vance. For this purpose we adopt the same criteria usedin RQ1.
In analogy with the procedure adopted for RQ2, weeventually divide the respondents into two groups –those who never adopted modelling and those who usedit sometimes – and we analyse the problems consideringtheir relationship with company size.
3. Findings
First of all we present the characteristics of the pop-ulation sample, then we present the results concerningthe three research questions.
3.1. The sampleThe survey was put on-line from the 1st of Febru-
ary 2011 until the 15th of April 2011 (two and a halfmonths).
In total, we collected 155 complete responses to oursurvey, thus the context of our survey consists of a sam-ple of 155 Italian software professionals. Due to thesampling methods used, it is not possible to estimatehow many people have been reached by our invitationmessages and/or advertisements; as a consequence it isnot possible to compute the response rate. This limi-tation appears to be a common problem for large scaleonline surveys (see, e.g., [24]).
As far as the type of company is concerned, mostrespondents in our sample – 122 out of 155 (78.71%)
– work in commercial companies; there are also 24independent professionals (15.48%), six from publicorganizations (3.87%) and three from other organiza-tions. Concerning the domain, the most represented sec-tor is obviously IT (67%) followed by Services (9%),Telecommunications (6%) and Manufacturing (4%); theremaining sectors all together account for circa 14% ofthe sample.
The respondents to our survey belong to companiesof different size; the detailed distribution for each cate-gory class is reported in Table 2. We adopted the head-count classes defined in the European Union recommen-dation 2003/361/EC10.
It is important to emphasize that in our sample thecorrespondence between respondents and companies isnot strictly one-to-one. In some cases we had more thanone response from employees of the same company: insuch cases we verified that they worked in distinct busi-ness units. This is obvious when consider that the tar-get population consists of development teams and com-panies, especially the large ones, typically host severalbusiness units and work groups, each possibly workingin different settings.
3.2. RQ1: relevance and diffusion
We first consider relevance of modelling in general,then we summarize languages and notations used by oursample [42]. Finally, we examine the diffusion of eachspecific MD* techniques.
3.2.1. Relevance of modelling in generalAmong the 155 complete questionnaires, we
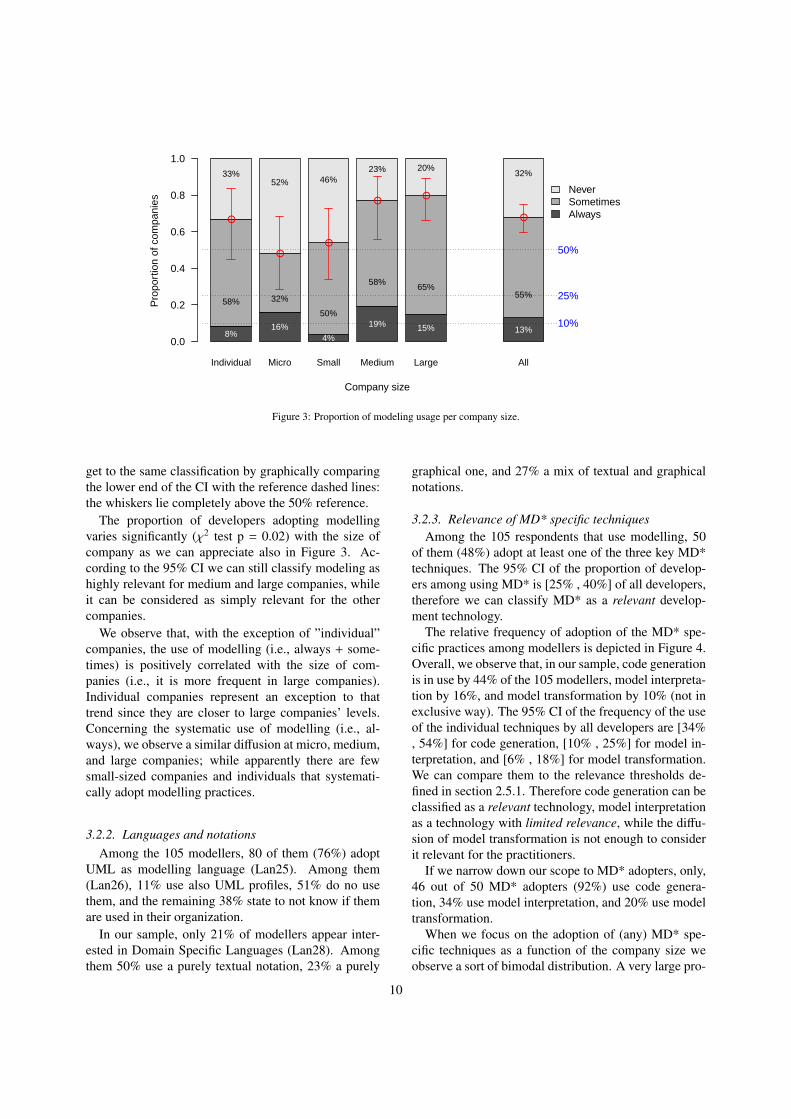
recorded 20 respondents (13%) always using modeling,85 (55%) using it sometimes, and 50 (32%) who neveruse it. The first two groups represent what we called”modellers”. These figures are reported in the right-most bar of Figure 3. The circle represents the estimateproportion of modellers in the sample (68%) and thewhiskers represents the 95% confidence interval (CI) ofthe same proportion.
We can classify the relevance of modelling by com-paring such CI with the thresholds defined in Section2.5.1 (50%, 25%, and 10%), which are represented bythe horizontal dashed lines. The 95% CI of the pro-portion of modellers is [60%, 75%], the lower bound islarger than the 50% threshold, therefore modeling canbe classified as a highly relevant technology. We can
10http://eur-lex.europa.eu/LexUriServ/LexUriServ.do?uri=OJ:L:2003:124:0036:0041:EN:PDF. Note that in our previouswork [42] we used a slightly different division.
9
Individual Micro Small Medium Large All
NeverSometimesAlways
Company size
Pro
port
ion
of c
ompa
nies
0.0
0.2
0.4
0.6
0.8
1.0
●
●
●
●●
●
10%
25%
50%
33%52% 46%
23% 20%32%
58% 32%
50%
58%65%
55%
8%16%
4%
19% 15% 13%
Figure 3: Proportion of modeling usage per company size.
get to the same classification by graphically comparingthe lower end of the CI with the reference dashed lines:the whiskers lie completely above the 50% reference.
The proportion of developers adopting modellingvaries significantly (χ2 test p = 0.02) with the size ofcompany as we can appreciate also in Figure 3. Ac-cording to the 95% CI we can still classify modeling ashighly relevant for medium and large companies, whileit can be considered as simply relevant for the othercompanies.
We observe that, with the exception of ”individual”companies, the use of modelling (i.e., always + some-times) is positively correlated with the size of com-panies (i.e., it is more frequent in large companies).Individual companies represent an exception to thattrend since they are closer to large companies’ levels.Concerning the systematic use of modelling (i.e., al-ways), we observe a similar diffusion at micro, medium,and large companies; while apparently there are fewsmall-sized companies and individuals that systemati-cally adopt modelling practices.
3.2.2. Languages and notationsAmong the 105 modellers, 80 of them (76%) adopt
UML as modelling language (Lan25). Among them(Lan26), 11% use also UML profiles, 51% do no usethem, and the remaining 38% state to not know if themare used in their organization.
In our sample, only 21% of modellers appear inter-ested in Domain Specific Languages (Lan28). Amongthem 50% use a purely textual notation, 23% a purely
graphical one, and 27% a mix of textual and graphicalnotations.
3.2.3. Relevance of MD* specific techniquesAmong the 105 respondents that use modelling, 50
of them (48%) adopt at least one of the three key MD*techniques. The 95% CI of the proportion of develop-ers among using MD* is [25% , 40%] of all developers,therefore we can classify MD* as a relevant develop-ment technology.
The relative frequency of adoption of the MD* spe-cific practices among modellers is depicted in Figure 4.Overall, we observe that, in our sample, code generationis in use by 44% of the 105 modellers, model interpreta-tion by 16%, and model transformation by 10% (not inexclusive way). The 95% CI of the frequency of the useof the individual techniques by all developers are [34%, 54%] for code generation, [10% , 25%] for model in-terpretation, and [6% , 18%] for model transformation.We can compare them to the relevance thresholds de-fined in section 2.5.1. Therefore code generation can beclassified as a relevant technology, model interpretationas a technology with limited relevance, while the diffu-sion of model transformation is not enough to considerit relevant for the practitioners.
If we narrow down our scope to MD* adopters, only,46 out of 50 MD* adopters (92%) use code genera-tion, 34% use model interpretation, and 20% use modeltransformation.
When we focus on the adoption of (any) MD* spe-cific techniques as a function of the company size weobserve a sort of bimodal distribution. A very large pro-
10

All
Large
Medium
Small
Micro
Individual
Any MD* Technique
48%
51%
50%
14%
67%
50%
20% 40% 60% 80%
Com
pany
size
●
●
●
●
●
●
Code Generation
44%
47%
40%
14%
67%
50%
20% 40% 60% 80%
●
●
●
●
●
●
Model Interpretation
16%
14%
15%
7%
50%
6%
20% 40% 60% 80%
●
●
●
●
●
●
Model Transformation
10%
12%
5%
0%
42%
0%
20% 40% 60% 80%
●
●
●
●
●
●
Figure 4: Diffusion of MD* techniques among modellers per company size.
MD* vs. Code Model ModelAchievement ratio Basic modeling generation interpretation transformation
Benefit Freq. Estimate 95% CI Likelihood OR p OR p OR p OR pDesign 71 68% 58% .. 76% Very likely 1.23 0.68 1.0 1.00 2.5 0.26 1.3 1.00
Documentation 65 62% 52% .. 71% Very likely 0.62 0.31 0.6 0.22 0.9 0.79 0.5 0.33
Maintenance 43 41% 32% .. 51% Likely 1.49 0.33 1.2 0.69 1.8 0.29 2.8 0.12Quality 42 40% 31% .. 50% Likely 2.22 0.07 1.8 0.16 1.9 0.28 2.9 0.11
Standardization 39 37% 28% .. 47% Likely 2.44 0.04 2.2 0.07 1.6 0.42 1.5 0.53
Flexibility 24 23% 15% .. 32% Possible 2.17 0.11 1.4 0.49 3.9 0.02 2.1 0.27Productivity 23 22% 15% .. 31% Possible 5.53 < 0.01 3.9 0.01 4.2 0.01 8.3 <0.01
Reactivity 20 19% 12% .. 28% Possible 1.84 0.32 1.1 1.00 4.0 0.02 2.7 0.21to changes
Platformindependence 15 14% 8% .. 23% Unlikely 5.39 0.01 3.0 0.09 4.7 0.02 4.2 0.05
Table 4: Benefits achieved by modelling users (OR=Odds Ratio, p=Fisher test p-value).
portion (67%) of the micro companies adopt MD* tech-niques, medium and large companies have an adoptionratio of circa 50%. This trend is completed by a suddendrop in adoption for small companies where just 14%adopt such techniques (see Figure 4 leftmost plot).
Considering each technique alone, we observe a sim-ilar shape for the distribution but with some notable dif-ferences. The adoption of code generation is very sim-ilar to the adoption of MD* techniques: this is obvioussince it is by far the most widespread among the threetechniques. As far as model interpretation and modeltransformation are concerned, micro companies are theonly significant adopter, large companies adopt themvery marginally and still small sized companies exhibitlittle or no interest in them.
The above picture can be drawn considering the adop-tion of the techniques as separate; in practice specific
techniques are adopted both individually (2/3 of thecases) and in combination with each other (1/3 of thecases). Table 3 reports the relative frequency of the dif-ferent combination of techniques (indicated in the tablewith black circles) that were found in use among therespondents. We observe that the most common tool-box consists of code generation alone (28% of model-ers), the next most frequent sets are the combination allthe three techniques (7%) and the use of code genera-tion together with code model interpretation (6%). Theother options are adopted by a few respondents. No-tably, model transformation techniques are never usedalone but only together with other techniques (that ispretty obvious).
11

Toolsmithing UML UML Profile DSLBenefit OR p.value OR p.value OR p.value OR p.valueDesign 1.2 1.00 2.4 0.09 4.1 0.25 1.3 0.62
Documentation 0.5 0.18 2.6 0.06 1.1 1.00 0.9 0.81
Maintenance 2.4 0.11 2.1 0.16 1.9 0.46 1.0 1.00Quality 1.9 0.28 1.2 0.82 1.1 1.00 1.3 0.63
Standardization 3.9 0.01 1.7 0.35 4.7 0.05 0.7 0.63
Flexibility 3.9 0.02 0.9 1.00 1.0 1.00 3.1 0.04Productivity 4.2 0.01 1.2 1.00 1.2 1.00 3.4 0.02
Reactivity to changes 5.5 < 0.01 0.9 1.00 1.0 1.00 2.5 0.12
Platform independence 9.9 < 0.01 0.8 0.75 3.5 0.22 4.3 0.01
Table 5: Effects of additional factors on benefit achievement rate.
3.3. RQ2: benefits achievementAs a preliminary step we evaluate the cross corre-
lations among different benefits. Table A.7 (in ap-pendix) reports the correlation (in terms of Pearson’sφ) among the different benefit achievements; in boldthe statistically significant correlations. We observedone strong correlation (between Flexibility and Reac-tivity to changes), 11 moderate correlations, 18 small,and 6 negligible. The strong correlation is a clue indi-cating a possible common shared underlying construct,as discussed later in section 5.
In order to address RQ 2, first of all we look at whichbenefits are concretely achieved by using models, thenwe look into the factors affecting the verification ofthose benefits: basic modelling vs. MD*, individual keyMD* techniques, and additional co-factors.
3.3.1. OverallTable 4 (in the first six columns) reports the frequency
of achieved advantages among the 105 modelling users.The table also reports the estimated benefit achievementratio and the relative 95% CI, as percentages. The ben-efits are sorted from the most likely (Design) to the lessone (Platform independence). According to the likeli-hood categories defined in section 2.5.2 we can clas-sify two benefits as very likely: usefulness for designassessment (Design support) and documentation im-provement (Documentation). In addition, we found thatimproved comprehension during maintenance (Mainte-nance), higher product quality (Quality), and improvedstandard compliance (Standardization) are likely bene-fits. In the Possible category fall Flexibility, Produc-tivity, and Reactivity to changes. Eventually, Platformindependence can be considered as Unlikely.
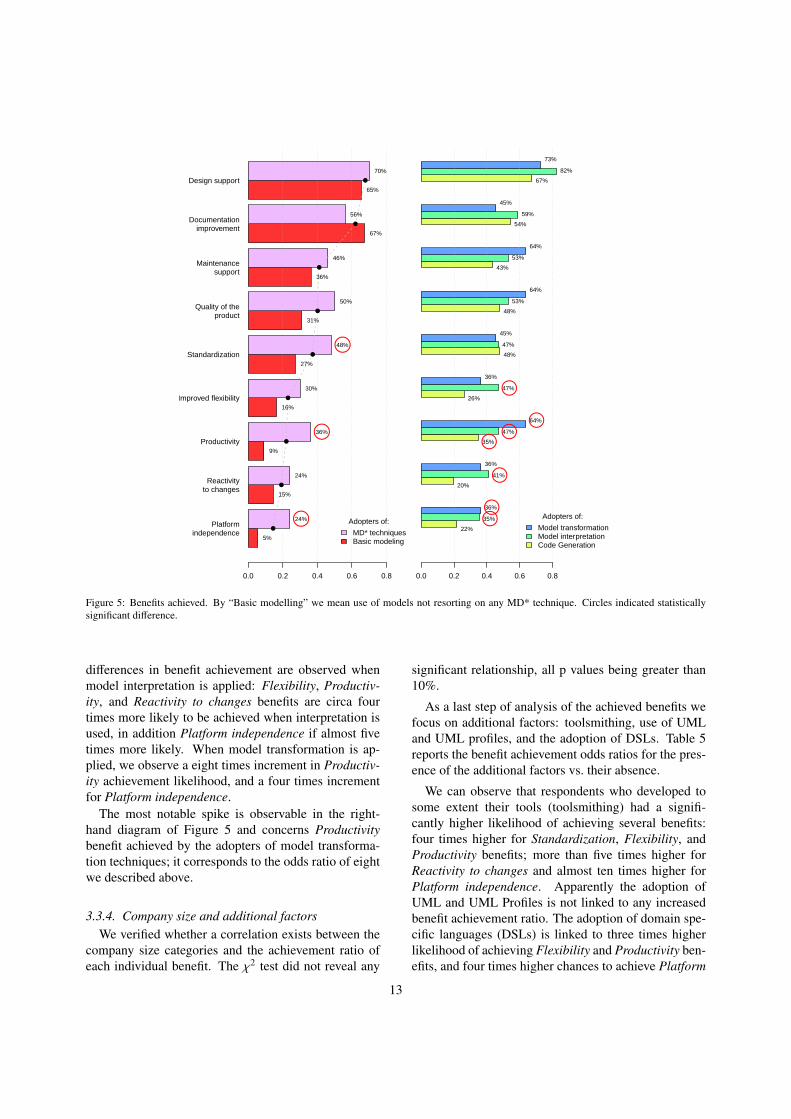
3.3.2. MD* adopters vs. Basic ModellersOn the left-hand side of Figure 5, we report the bene-
fit achievement ratio separately for users of MD* tech-niques and those of basic modelling. From the diagram
we can appreciate that for most benefits the differencebetween more advance users (MD*) and basic users (ba-sic modelling) is limited. The odds ratios of the achieve-ment ratios are reported in the sixth column of table4 aside the p value of the Fisher test. The odds ratiosare almost all greater than 1, indicating an improvementof the achievement ratio for MD* adopters, the excep-tion being documentation benefits that appear to be lesslikely achieved among MD* adopters.
From the test results we can infer that a significantdifference exists only for three benefits: Standardiza-tion, Productivity, and Platform independence (they aremarked with a circle in Figure 5). MD* adopters aretwo and half times more likely to achieve standardiza-tion benefits compared to basic modelling users, fiveand half times more likely to achieve productivity ben-efits, and five times more likely to achieve platform in-dependence. We observe that the above differences areconsistent with the different intended purposes of mod-elling and MD*: communication the former and codegeneration or execution the latter. For these three ben-efits, we classified the likelihood of benefits for MD*adopters; the only benefit that could be classified in adifferent category was Platform independence: consid-ering all modellers it was considered Unlikely, while re-stricting to MD* adopters it becomes Possible.
3.3.3. Key MD* techniquesMore in detail, on the right-hand side of Figure 5, we
can observe the achieved benefits divided by adopters ofcode generation, model interpretation, and model trans-formation, respectively.
Table 4 reports (six rightmost columns) the odds ra-tios of achieving benefit for adopters of specific MD*key techniques vs. non adopters. Code generation in-duces one significant difference, concerning Productiv-ity which is 3.9 times more likely to be achieved as abenefit when the technique is adopted. Most significant
12
Platformindependence
Reactivityto changes
Productivity
Improved flexibility
Standardization
Quality of theproduct
Maintenancesupport
Documentationimprovement
Design support
0.0 0.2 0.4 0.6 0.8
Adopters of:
MD* techniquesBasic modeling
●
●
●
●
●
●
●
●
●
●
●
●
●
●
●
●
●
●
5%
15%
9%
16%
27%
31%
36%
67%
65%
24%
24%
36%
30%
48%
50%
46%
56%
70%
●
●
●
0.0 0.2 0.4 0.6 0.8
Adopters of:
Model transformationModel interpretationCode Generation
22%
20%
35%
26%
48%
48%
43%
54%
67%
35%
41%
47%
47%
47%
53%
53%
59%
82%
36%
36%
64%
36%
45%
64%
64%
45%
73%
●
●
●
●
●
●
●
Figure 5: Benefits achieved. By “Basic modelling” we mean use of models not resorting on any MD* technique. Circles indicated statisticallysignificant difference.
differences in benefit achievement are observed whenmodel interpretation is applied: Flexibility, Productiv-ity, and Reactivity to changes benefits are circa fourtimes more likely to be achieved when interpretation isused, in addition Platform independence if almost fivetimes more likely. When model transformation is ap-plied, we observe a eight times increment in Productiv-ity achievement likelihood, and a four times incrementfor Platform independence.
The most notable spike is observable in the right-hand diagram of Figure 5 and concerns Productivitybenefit achieved by the adopters of model transforma-tion techniques; it corresponds to the odds ratio of eightwe described above.
3.3.4. Company size and additional factorsWe verified whether a correlation exists between the
company size categories and the achievement ratio ofeach individual benefit. The χ2 test did not reveal any
significant relationship, all p values being greater than10%.
As a last step of analysis of the achieved benefits wefocus on additional factors: toolsmithing, use of UMLand UML profiles, and the adoption of DSLs. Table 5reports the benefit achievement odds ratios for the pres-ence of the additional factors vs. their absence.
We can observe that respondents who developed tosome extent their tools (toolsmithing) had a signifi-cantly higher likelihood of achieving several benefits:four times higher for Standardization, Flexibility, andProductivity benefits; more than five times higher forReactivity to changes and almost ten times higher forPlatform independence. Apparently the adoption ofUML and UML Profiles is not linked to any increasedbenefit achievement ratio. The adoption of domain spe-cific languages (DSLs) is linked to three times higherlikelihood of achieving Flexibility and Productivity ben-efits, and four times higher chances to achieve Platform
13

Occurrence ratio Basic MD* MD* vs. BasicFreq Ratio 95% CI Relevance Num Prop. Num Prop. OR p
Too much effort required 67 50% 41% .. 58% Relevant 23 46% 21 60% 1.75 0.27Not useful enough 64 47% 39% .. 56% Relevant 26 52% 15 42% 0.70 0.51
Lack of competencies 46 34% 26% .. 43% Relevant 16 32% 10 28% 0.85 0.81
Refusal from management 33 24% 18% .. 33% Moderately Relevant 14 28% 9 25% 0.89 1.00Lack of supporting tools 23 17% 11% .. 25% Moderately Relevant 9 18% 3 8% 0.43 0.34
Refusal from developers 19 14% 9% .. 21% Scarcely Relevant 9 18% 6 17% 0.94 1.00Inadequacy of supporting tools 14 10% 6% .. 17% Scarcely Relevant 4 8% 8 22% 3.36 0.06
Cost of supporting tools 14 10% 6% .. 17% Scarcely Relevant 6 12% 4 11% 0.95 1.00Fear of lock in 13 10% 5% .. 16% Scarcely Relevant 2 4% 7 20% 5.87 0.03
Not flexible enough 10 7% 4% .. 14% Scarcely Relevant 4 8% 3 8% 1.08 1.00
Table 6: Problems encountered preventing adoption of MD*.
independence.
3.4. RQ3: problems
As a preliminary step we assess the cross correla-tion among the different problems. Table A.8 reportsthe correlation coefficients (Pearson’s φ) for each pairof problems; in bold are reported the statistically sig-nificant correlations. We observe no strong correlation,three moderate ones, and 14 small ones. Most of thecorrelations (28) are negligible.
3.4.1. OverallTable 6 reports the frequency of each problem and the
corresponding occurrence ratio. According to the 95%confidence interval (columns 4 and 5) we can assign arelevance category conforming to the thresholds definedin section 2.5. We observe three relevant potential prob-lems: Too much effort required, Not enough expectedusefulness, and Lack of competencies.
3.4.2. Sometimes vs. NeverFigure 6 reports the frequency of problems prevent-
ing the adoption of models (as reported by respondentsnever using modelling) or hindering it (respondents us-ing modelling just sometimes) is reported. We remindthat participants that use models always were not askedthis question.
We looked at the odds ratios of problem occurrencefor respondent that never adopt modelling vs. those whosometimes adopt, all the values are close to 1 – between0.65 and 1.71 – except for Refusal from developers andInadequacy of supporting tools having with odds ratio0.41 and 0.26 respectively. Indicating they are the mostlikely reasons for not adopting modelling.
We could not observe any statistically significant dif-ference between the problem occurrence ratio of mod-ellers vs. non modellers.
3.4.3. Basic Modellers vs. MD* adoptersTable 6 also reports the frequency and occurrence ra-
tio of each problem among basic modelling adoptersvs. MD* technique users. In addition (rightmost twocolumns) the odds ratio of incurring in a problem forMD* vs. basic modellers is reported together with therelative statistical significance, computed by means ofthe Fisher test. The only statistically significant differ-ence concerns the Fear of lock-in, which appears almostsix times more frequent among the MD* techniquesadopters. Next to this difference, though not significant,is the one about the Inadequacy of supporting tools.
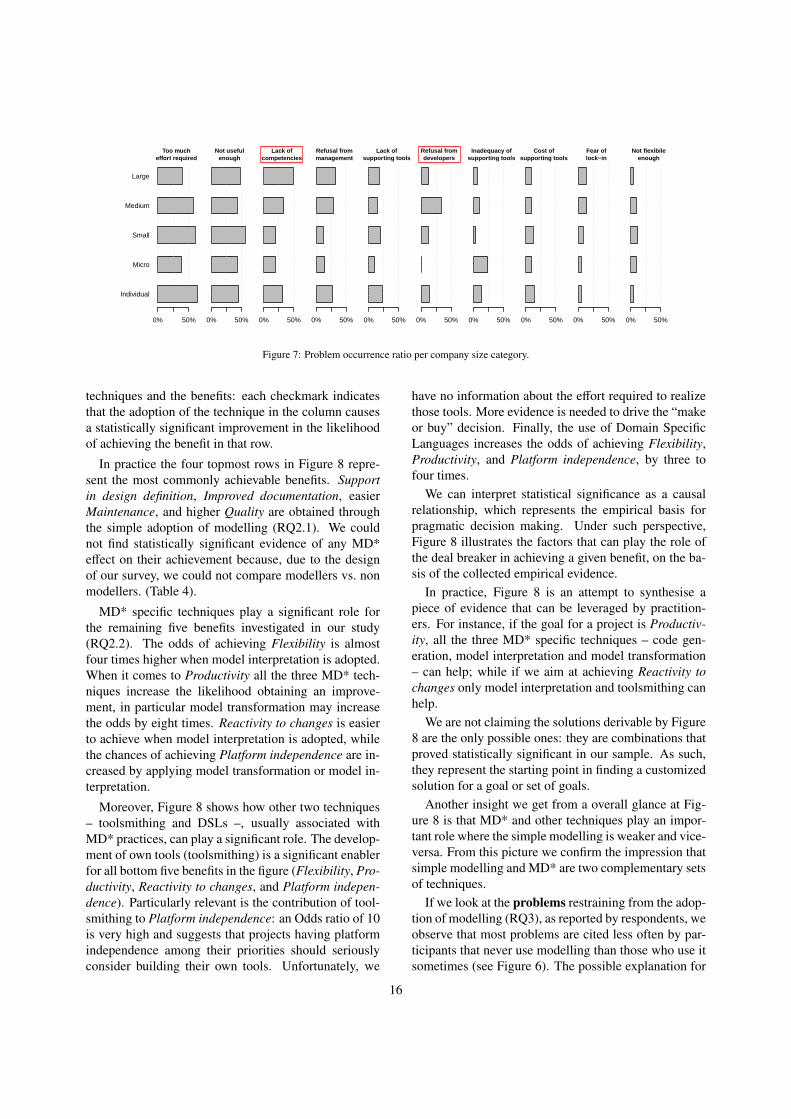
3.4.4. Company sizeFigure 7 reports the distribution of problems occur-
rence ratio by company size. We can observe a sub-stantially uniform distribution among the different sizeclasses, with the exception of a few cases. Accordingto the χ2 test, we identified two problems whose occur-rence is significantly related to the company size: Lackof competencies and Refusal from developers. Concern-ing the former, small and micro companies are surpris-ingly reporting this problem less than medium, large,and individual companies. Refusal from developers isinstead mostly reported in medium sized companies.
4. Discussion
The three research questions pinpoint three aspectsthat we wish to recap here: diffusion/relevance, advan-tages, and problems of modelling and MD*.
The first result (RQ1.1) we obtained from the surveyis that of a large diffusion of modelling practices (68%of respondents) and a relatively ample diffusion of MD*techniques (48% of the adopters of modeling and 32%of the entire valid sample). Considering our plain rel-evance criteria, we can classify modeling as a highlyrelevant technique in the industrial context; while MD*
14

Not flexibileenough
Fear oflock−in
Cost ofsupporting tools
Inadequacy ofsupporting tools
Refusal fromdevelopers
Lack ofsupporting tools
Refusal frommanagement
Lack ofcompetencies
Not usefulenough
Too mucheffort required
0.0 0.1 0.2 0.3 0.4 0.5 0.6
Used models:
neversome
8%
11%
12%
14%
18%
14%
27%
31%
48%
52%
6%
8%
8%
4%
8%
22%
20%
40%
46%
46%
Figure 6: Prevalence of problems limiting adoption of modeling.
can be considered as relevant. This information is im-portant per-se for us researchers: it means that researchconducted in this context has the potential to yield a sig-nificant impact on practitioners.
When looking at how the adoption is distributed withrespect to company size (RQ1.2), we observe a bimodalshape both for modelling (see Figure 3) and MD* (Fig-ure 4): medium-large companies are more keen to adoptmodelling and MD*, small companies are less prone tothese practices, and micro and individual companies aresimilar to large ones in this respect.
As far as key MD* techniques are concerned, al-most all adopters of MD* do apply code generation,one third apply model interpretation, and one fifth usemodel transformations. The adoption rate of code gen-eration (Figure 4) by micro companies11 is significantlyhigher than other companies while the two latter tech-niques are largely adopted by micro companies only.The large diffusion of those techniques in micro com-panies is in stark contrast to the very low adoption insmall companies.
Our explanation for the above facts is that modelinterpretation and transformation are relatively novel
112 ≤ size ≤ 10
techniques, at least more advanced than code genera-tion which is well-known and more used in the industry.As a consequence, their adoption brings risks: appar-ently only micro companies, and to a much lesser ex-tent medium-large ones, are willing to take them. Mi-cro companies are possibly driven by the competition tostay in the market, medium-large ones perhaps believein the advanced techniques as competitive advantages.Moreover, micro companies can afford to adopt, moreeasily, not fully mature solutions — nowadays, providedin the market for Model transformation and interpreta-tion — which are not easily accepted in larger compa-nies. In addition, the “micro” size allows them moreflexibility in using new technologies and processes (onepossible co-cause for that could be the larger freedomdevelopers have in micro companies). Finally, probably,in large companies there is more resistance, by devel-opers, to the introduction of novel techniques and pro-cesses than in smaller ones.
Another important finding concerns the likelihood ofbenefits achievement (RQ2). The adoption of mod-elling makes improved design and documentation bene-fits very likely to be achieved (see Table 4), while main-tenance, quality, and standardization are simply likely.
Figure 8 shows the the relationship between MD*
15
Individual
Micro
Small
Medium
Large
Too mucheffort required
0% 50%
Not usefulenough
0% 50%
Lack ofcompetencies
0% 50%
Refusal frommanagement
0% 50%
Lack ofsupporting tools
0% 50%
Refusal fromdevelopers
0% 50%
Inadequacy ofsupporting tools
0% 50%
Cost ofsupporting tools
0% 50%
Fear oflock−in
0% 50%
Not flexibileenough
0% 50%
Figure 7: Problem occurrence ratio per company size category.
techniques and the benefits: each checkmark indicatesthat the adoption of the technique in the column causesa statistically significant improvement in the likelihoodof achieving the benefit in that row.
In practice the four topmost rows in Figure 8 repre-sent the most commonly achievable benefits. Supportin design definition, Improved documentation, easierMaintenance, and higher Quality are obtained throughthe simple adoption of modelling (RQ2.1). We couldnot find statistically significant evidence of any MD*effect on their achievement because, due to the designof our survey, we could not compare modellers vs. nonmodellers. (Table 4).
MD* specific techniques play a significant role forthe remaining five benefits investigated in our study(RQ2.2). The odds of achieving Flexibility is almostfour times higher when model interpretation is adopted.When it comes to Productivity all the three MD* tech-niques increase the likelihood obtaining an improve-ment, in particular model transformation may increasethe odds by eight times. Reactivity to changes is easierto achieve when model interpretation is adopted, whilethe chances of achieving Platform independence are in-creased by applying model transformation or model in-terpretation.
Moreover, Figure 8 shows how other two techniques– toolsmithing and DSLs –, usually associated withMD* practices, can play a significant role. The develop-ment of own tools (toolsmithing) is a significant enablerfor all bottom five benefits in the figure (Flexibility, Pro-ductivity, Reactivity to changes, and Platform indepen-dence). Particularly relevant is the contribution of tool-smithing to Platform independence: an Odds ratio of 10is very high and suggests that projects having platformindependence among their priorities should seriouslyconsider building their own tools. Unfortunately, we
have no information about the effort required to realizethose tools. More evidence is needed to drive the “makeor buy” decision. Finally, the use of Domain SpecificLanguages increases the odds of achieving Flexibility,Productivity, and Platform independence, by three tofour times.
We can interpret statistical significance as a causalrelationship, which represents the empirical basis forpragmatic decision making. Under such perspective,Figure 8 illustrates the factors that can play the role ofthe deal breaker in achieving a given benefit, on the ba-sis of the collected empirical evidence.
In practice, Figure 8 is an attempt to synthesise apiece of evidence that can be leveraged by practition-ers. For instance, if the goal for a project is Productiv-ity, all the three MD* specific techniques – code gen-eration, model interpretation and model transformation– can help; while if we aim at achieving Reactivity tochanges only model interpretation and toolsmithing canhelp.
We are not claiming the solutions derivable by Figure8 are the only possible ones: they are combinations thatproved statistically significant in our sample. As such,they represent the starting point in finding a customizedsolution for a goal or set of goals.
Another insight we get from a overall glance at Fig-ure 8 is that MD* and other techniques play an impor-tant role where the simple modelling is weaker and vice-versa. From this picture we confirm the impression thatsimple modelling and MD* are two complementary setsof techniques.
If we look at the problems restraining from the adop-tion of modelling (RQ3), as reported by respondents, weobserve that most problems are cited less often by par-ticipants that never use modelling than those who use itsometimes (see Figure 6). The possible explanation for
16

Bene
fit achievemen
t likelihoo
d du
e to
simple mod
elling
Observed significant likelihood increment due to
Design
Key MD* techniques
Toolsm
ithing
Mod
el
transforma@
on
Mod
el
interpreta@o
n
Code
gene
ra@o
n
DSL
Very likely
Very likely Documenta@on
Likely Quality
Likely Maintenance
Likely Standardiza@on
Possible ✔ ✔ ✔ Flexibility
Possible ✔ ✔ ✔ ✔ ✔ Produc@vity
Possible ✔ ✔ Reac@vity to changes
Unlikely ✔ ✔ ✔ ✔ PlaLorm independence
Figure 8: Achievable benefits with Modelling and MD* techniques adoption effects.
this difference is that potential problems and risks areconsidered more often when development teams has torepeatedly balance pros and cons for using modelling orMD*.
The notable exception to the above trend is repre-sent by the Lack of competencies and Lack of support-ing tools. Such problems appear to be the main show-stoppers preventing altogether the adoption of mod-elling and MD*.
The Fear of lock-in is a problem which seem to affecta lot more MD* practitioners than adopters of simplemodelling. This could derive from the lack of affirmedstandards in MD* while in modelling UML seems to bewidely used. This lack results into both poor options forreplacing tools by equivalent alternatives and problemsin building heterogenous tool-chains.
We believe that the findings of our survey, and in par-ticular, these two above problems (Lack of competenciesand Lack of supporting tools) deserve attention fromItalian industries and universities. The former shouldinvest more in research, tools building (software mod-elling and MD* tools are needed) and training (expertsin MD* are needed), and the latter should produce moreexperts in modeling and model driven techniques. Thisstrongly suggests to improve university curricula withspecific courses dealing with topics related to softwaremodelling, and more specifically with code generation,model execution, and model transformation. Most of
the times, students are trained to build new systemsusing traditional processes and only in the better casethe foundation of MD* are explained in software en-gineering courses (e.g., this is the case in the Univer-sita di Genova — Italy). While it is our opinion thatthey should focus more on modelling and model driventechniques (in particular in automatic code generation,given that, it is the most used in the industry). On theuniversity side, the Lack of supporting tools and dissat-isfaction about them (Figure 6) should be a prompt toproduce new prototypes and experiment more in this di-rection. On the industrial side, we can infer a huge mar-ket opportunity for modeling and MD* tools. Moreover,investments in this market could obtain large returns es-pecially for large companies. And possibly, companiesand universities should collaborate to make better tools.
5. Threats to validity
We analyse the potential threats to the validity of ourstudy according to the four categories suggested in [45].In general on-line surveys are considered to have lowerinternal validity and stronger external validity in re-spect to other means of empirical investigations as case-studies or experiments [36].
Construct validity threats concern the relationshipbetween theory and observation. They are mainly re-lated to the measurements performed in the study. In
17
particular there are two distinct issues: (i) whether wemeasured the usage of techniques in the right way (mea-surement instrument and process) and, (ii), whether weselected the right attributes to represent the construct oftechnology usage (measured attribute).
Concerning the measurement instrument – a personalopinion survey – the items definitions and the scalesused to code the answers are key factors, and they canpotentially influence our results because of the diffi-culty respondents could have encountered in either un-derstanding or (mis)interpreting the items. We paid par-ticular attention to mitigate such threats:
• The questionnaire was designed using a standardapproach, trying to avoid as much as possible am-biguous questions [21].
• We strived to formulate the items in a simple andstraightforward style (see Table 1)
• We inserted the meaning of relevant terms (e.g.,model, model execution, MD*) in the question-naire (directly in the questions or as footnotes).
• We guaranteed assistance by phone and e-mail torespondents, to support them in case of unclearquestions.
• We conducted a pre-test of the instrument, bymeans of three pilot studies with industrial pro-fessionals, to check that the questions were under-standable, before putting on-line the questionnaire.
• In particular the lists of advantages (questionDev11) and problems (question Dev09) proposedto the respondents could have been incomplete. Inthe first case, we opted for a closed question (seeFigure 2) on the basis of the expert practitionersjudgement in the pilot. On the contrary, in the sec-ond case, since the range of problems is potentiallyvery large, we opted for a semi-open question: weprovided a set of predefined options but let the re-spondent free to add others (see Figure 2). Con-sidering the answers of Dev9, we can confirm thatthe list of proposed problems was quite complete,since respondents sparingly used the “free” option.
As far as the measured attributes are concerned, weidentified the MD* usage construct with the adoptionof three key techniques: code generation, model trans-formation, and model interpretation. We are confidentthat they represent the main features of MD*, or at leasta largely shared view of MD*, although we cannot ex-clude there exists some community with a different per-spective on MD*.
In addition from the correlation analysis, we founda strong correlation between Reactivity to changes andFlexibility; this may indicate the possibility of a singleconstruct underlying the two measures. We explored thepossibility of removing one of the two, but eventuallywe preferred to retain all the information and keep bothat the expense of a small additional complexity of thestudy. We believe that this decision does not invalidatethe conclusions of our study.
Internal validity threats concern confounding fac-tors that may affect the outcome of our results. In gen-eral, it is hard to control these factors. It is well-knownthat, a survey being an unsupervised study, the level ofcontrol is very low.
Internal validity is mainly threatened by coverage is-sues:
• We incurred in a possible selection bias due tothe self-exclusion of participants not interested inmodelling. Self-exclusion is a well-known prob-lem especially in Internet surveys advertised bymeans of mailing lists and groups. The possiblethreat consists in an over estimation of the pro-portion of respondents who declared interest inmodelling and therefore of the overall relevance ofmodelling and MD* in the Italian industry. Themain impact of this issue would be on the answerto RQ1, the findings relative to the other researchquestions should not be significantly affected.
We tried to mitigate this threat by presenting the re-quest as a study on software development withoutemphasizing the modelling aspect and addressingit to a varied population. Though we cannot defi-nitely rule out the threat, there are two aspects inthe collected data that make us at least confidentthat the magnitude of the threat is limited. First, asignificant number of valid respondents never usedmodeling therefore a portion of the sampled pop-ulation although not interested in modelling didfilled in the survey anyway. Second, among theincomplete answers – respondents who started thequestionnaire but did not complete it and were thusdiscarded from analysis – (26 occurrences), 10 re-spondents did anyway provide a response to ques-tion DEV08: all of them affirmed to use modelssometimes (8 respondents) or always (2 respon-dents); if in a conservative move we ascribe the re-maining 16 to the group of respondents never usingmodelling, the picture we obtain considering allthe 181 (155 complete + 26 incomplete) responsesis not significantly different than the complete re-sponses alone.
18
• Another threat derives from the possible “foreignunits” in the sample: the target population of ourstudy consisted of development teams, it is pos-sible that the questions were answered by a re-sponded without the required knowledge (e.g., thesecretary of the IT manager). We addressed thisconcern in the protocol: we explicitly required thequestionnaire to be filled in by technical personnelinvolved in the development. Even in the case of aknowledgeable respondent, (s)he could be unawareof some details; this is more likely if the team isvery large [21].
• Finally, the sampling procedure made possible toselect duplicate units: two different members of thesame development team could have answered ourquestionnaire. We addressed this threat by meansof a post-survey validation: we found that the re-spondents from the same company actually workedin distinct business units and belonged to distinctteams.
Conclusion validity threats concern the possibility toderive illegitimate conclusions from the observations.When hypothesis testing was used to compare twoor more populations, we adopted non-parametric tests(Kruskal-Wallis, Fisher exact test and Mann-Whitney),that can be used without specific assumptions (e.g.,without checking data normality). Similarly, we usedthe proportion test to determine the confidence intervalfor relevance of modelling in general.
External validity threats concern the extent to whichour findings can be generalized. For our survey, we usedthe Commerce Chamber database to render our sampleas representative as possible. Had we used only thissampling source, we could have performed a stratifiedsampling, using strata based on company size as wasperformed e.g. in [8]. However, we decided to integratthat sample using a non-probabilistic sampling schema(the same was done in [33]). As a result, the solutionwe selected is cost-effective and allowed us to obtaina sample large enough to achieve a reasonable numberof adopters of all the techniques. This should be con-sidered interpreting the results we obtained: even if thedemographics of our sample is quite diverse, the gener-alization of our results to the entire population may notbe appropriate. Moreover, given the sampling strategywe adopted, we cannot calculate the response rate (thisproblem is common in software engineering surveys[21]). We are also aware that the size of our sample isnot large enough for generalization purposes (of course,further data points will be highly desired to better gen-eralize our findings). However, that size is similar to
other industrial surveys conducted on different softwareengineering subjects (e.g., [14, 19, 20, 25, 41]).
6. Related work
Literature reports some anecdotal evidence collectedthrough case-studies (e.g., [26]), while rigorous empiri-cal studies evaluating software modelling and MD* arequite rare. Carver et al. [4] performed a literature re-view considering the most common venues where ar-ticles related to MD* are published. They noted thatthe 73% of the papers they considered didn’t containany form of validation, consequently they affirm that therigor of empirically validated research in software mod-eling is rather weak and the community need to focusmore on this aspect. In particular, as stated in [29], thereare a few reports on the advantages of applying MDEin industry, thus more empirical studies are needed tostrengthen the evidence. Also van Deursen et al. [7] re-port on the importance of having more empirical stud-ies, in particular about the improvements produced byMD* adoption on maintainability costs.
In the rest of this section, we focus on empirical stud-ies about issues, challenges and benefit of modellingand MD* adoption. Coherently with the stance adoptedin our survey, we decided to avoid a clear partitioningbetween software modelling and MD*, also given thatthe two aspects are often interwoven.
We grouped the related studies as much as possibleconsidering their category: literature reviews, surveys,case studies, and experience reports.
6.1. Literature reviews
Budgen et al. [3] conducted a systematic literature re-view on UML. Authors underline the necessity of moreempirical studies about the adoption of UML. Most ofthe empirical studies are laboratory experiments whilemore field studies are needed.
Mohagheghi and Dehlen in their work [29] introducea literature review of empirical studies (and more ingeneral of industrial experiences), from 2000 to 2007,about MDE in industry. The goal is evaluating MDEbenefits and possible limitations. They selected 25 pa-pers and their main conclusions are: (i) MDE is appliedin a wide range of domains, (ii) MDE can lead to variousbenefits (i.e., higher productivity and improved commu-nication), (iii) MDE is not considered mature enoughand there are no appropriate tool chains, and (iv) quan-titative evidence was found in one paper only, about pro-ductivity gains. Our findings are consistent with theirs,especially with items (ii) and (iii).
19
6.2. SurveysForward et al. in their work [9] analyses the results
of a survey with 113 software practitioners (about two-thirds were from Canada or the USA) on the perceptionof software modeling. They mainly investigate how,when and why software developers use (or not) mod-els and which notations and tools are adopted. In theirsample, modelling is performed at least sometimes byover 95% of participants (in our case the modellers are68%). Similarly to us, they try to answer the followingresearch question:“Why do some developers prefer notto model?” (similar to our RQ3). They report that thebiggest problem is the synchronization between modelsand code (models become out of date with code). Wedo not have evidence of this problem. Other problemsare the quality of the generated code and issues with themodelling tools (e.g., too expensive, “heavyweight” anddifficult to use). Our results are in line with this latterperception. A portion of our sample think that mod-elling tools represent a limitation for MD* and more ingeneral for software modelling. The main findings re-ported in their conclusion are: (i) developers considermodels in a broader sense (i.e., not only UML modelsbut also textual DSL models), (ii) UML is the predomi-nant modelling notation (similar to a result we reportedin a previous article [42]) but is often used informally,(iii) modelling tools are mainly used for documentation(a fact that could explain the large percentage of doc-umentation benefits reported in Figure 5), and (iv) it isuncommon that models are used for generating code.
Davies et al. in [6] report the result of a survey con-ducted in Australia on the status of conceptual mod-elling that has received 312 responses. This study aimsto determine the actual modelling practice, giving aanswer to the research question:“how do practitionersactually use conceptual modelling in practice?” thatis specified by three sub-questions: (i)“which are thetools and techniques used for conceptual modelling?”(ii)“what is the purpose of modelling?”, and (iii) “whatare the major problems and benefits specific to concep-tual modelling?” The last sub-question is similar toours RQ2 and RQ3, but from a different perspective.They have identified problems and benefits in the usageof conceptual modelling by means of textual analysisof data relative to problems and perceived key successfactors. Concerning the last sub-questions they reportwhich are the factors influencing the continued use. Themajor key factor is relative advantage/usefulness, otherfactors (in order of relative importance) are: communi-cation to/from stakeholders, internal knowledge of tech-niques, user expectations management, understandingthe model integration into the business, tool/software
deficiencies. The first factor corresponds to our find-ing of a commonly achieved benefit (documentation im-provement), the last factor corresponds to one of theproblem we found limiting adoption of modelling (in-adequacy of supporting tools).
Hutchinson et al. in [18] report the results of an em-pirical study on the assessment of MDE in industry.Their work has two goals: identify the reasons of suc-cess or failure of MDE and understand how MDE is ac-tually applied in industry. They employed three formsof investigation: questionnaires, interviews, and on siteobservations, having as target practitioners, MDE pro-fessionals and companies practising MDE respectively.The questionnaire has received over 250 responses fromprofessionals (the most of them are working in Europe).Some of the reported findings are: (i) about two-thirdsof the respondents believe that using MDE is advanta-geous in terms of productivity, maintability and porta-bility, (ii) the majority of respondents use UML as mod-elling language, and a good number use in-house devel-oped DSLs, (iii) almost three quarters of respondentsthink that an extra training is necessary to use MDE,(iv) the majority of respondents agree that code gener-ation is an important aspect of MDE productivity gain,and (v) a little less than half of the respondents thinkthat MDE tools are too expensive. We observed similarperceptions in our survey except for the issue of extra-training which was not considered in our survey, how-ever we observed that the lack of competencies is oneof the problems most frequently reported by companies.Differently from the results of their survey, the cost ofsupporting tools is seen as a problem only by a smallproportion of respondents in our sample.
Nugroho and Chaudron in their work [33] analysesthe results of a survey about the UML usage and its per-ceived impact on quality and productivity with 80 pro-fessional software engineers. The findings reveals that:(1) the majority of the respondents agreed that a modelshould describe parts of a system that are more criticaland complex, instead of specifying all parts of a systemequally; (2) incompleteness in UML models is associ-ated to implementation problems (it brings to deviationsin the implementation) and, (3) using UML impacts pro-ductivity in analysis, design and implementation but notin maintenance. This last finding seems partially in con-trast with our results where easier maintenance is one ofthe benefits associated with modelling. Similarly to oursurvey, their findings reveal problems associated to theusage of tools: the features in current UML CASE toolsthat should help maintaining aligned code and design,e.g., reverse engineering and round-trip engineering, arenot yet mature.
20
6.3. Case studies
The work of Hutchinson, Rouncefield and Whittle[17] focuses on the deployment of MDE in indus-try. It illustrates three industrial case studies in threedifferent business contexts (printer, car manufacturingand telecommunication companies) and identifies somelessons learned. In particular, the importance of com-plex organizational, managerial and social factors in thesuccess or failure of the MDE deployment. The au-thors report some organizational factors that can affectthe success or the failure of MDE deployment. The fac-tors that can affect it positively are: (i) a progressive anditerative approach, (ii) user motivation in the MDE ap-proach, (iii) an organizational willingness in integratingMDE in the whole organization, and (iv) having a clearbusiness focus (where MDE is adopted as a solution fornew projects). Instead, factors that can affect it nega-tively are: (i) the decision of adopting MDE being takenby IT managers, in top-down fashion and implemented“all at once”, (ii) MDE being imposed on the develop-ers, and (iii) an inflexible organization with a lack ofintegration of MDE in previous processes. The onlycommon aspect with the work proposed in [17] con-cerns the motivation of developers. The correspondingfinding lies in the problems reported in Figure 6 (refusalfrom developers and refusal from management).
Mohagheghi et al. [31] interviewed – using conve-nience sampling – developers from four companies in-volved in an initiative called MODELPLEX. They ex-amined the factors affecting adoption of MDE. Regard-ing usefulness they found uncertain results: most par-ticipants recognize the usefulness of models but theyare not sure about the impact on the quality of the fi-nal product or the effects on productivity. MDE is per-ceived as not simple: its complexity makes it viable forengineers but not for non technical people. This find-ing is confirmed by our results reported in [42, 40].They show that only in a few cases business experts areinvolved during modelling tasks. Regarding compati-bility with the existing development process the com-panies complained about the lack of standards and theconsequent lock-in effect. All interviewed companiesreported some problems in integrating their existing ap-proaches with MDE. Tools could have been part oftheir problems, them being not considered satisfyingby a part of the sample. In particular, some partici-pants expressed several concerns about the scalabilityof the MDE approach to large projects. Advantages re-ported are limited to the usefulness for documentationand communication purposes. Major reasons prevent-ing adoption of MDE are the immaturity of tools and
processes as well as the lack of competencies. Such lat-ter conclusions are largely consistent with our findings.
6.4. Experience reportsHeijstek et al. [15] study the impact of MDD on a
large scale industrial project and the main features ofa large scale industrial MDD project. They producedan experience report using, as sources of information,data from the Subversion repository and semi-structuredinterviews with team members. About the impact ofMDD, the conclusions are that: almost two-thirds of thetotal effort is spent on developing models and that theteam members report an increase in productivity, be-sides a perception of improvement of the overall qualityand a reduction of complexity. The authors confirmedthe increase of quality by counting the average numberof defects w.r.t. the average number of defects found insimilarly sized projects in which MDD was not used.Their findings – including the improvement of the finalproduct – have been observed also in our survey. Whilewe do not have data about the effort spent on realizingthe models, many participants considered that effort tobe too big and therefore affecting their decision to adoptmodelling. They identified two typical features of largescale MDD projects: (i) high average complexity per di-agram, (ii) activity diagrams and class diagrams are themore used UML diagrams.
Mohagheghi et al. [30] report a list of challenges andsuccess criteria of MDE adoption. They, summarizethem after having conducted two real projects in largeorganizations. The most important challenge is the defi-nition of a MDE environment, that require the company:(i) to develop a communication language for technicaland domain experts by means of UML profiles and/ormeta-models and (ii) to select and integrate tools forbuilding, transforming, storing, reusing and composingmodels. This last point is particularly difficult to reachdue to the lack of such a tool-chain on the market. Suchfinding is consistent with our results. They also reportthat training is a major challenge (same problem statedin [18]). In addition, they see advantages in the gradualintroduction of MDE in the industry and in the creationof expert teams to support and create tools.
7. Conclusions and future work
In this paper we presented some results from a surveyperformed to investigate: (1) what is the relevance ofsoftware modelling and MD* in the Italian industry, (2)what are the attainable benefits from such techniques,and (3) which are the problems impeding the adoptionof modelling and MD*.
21
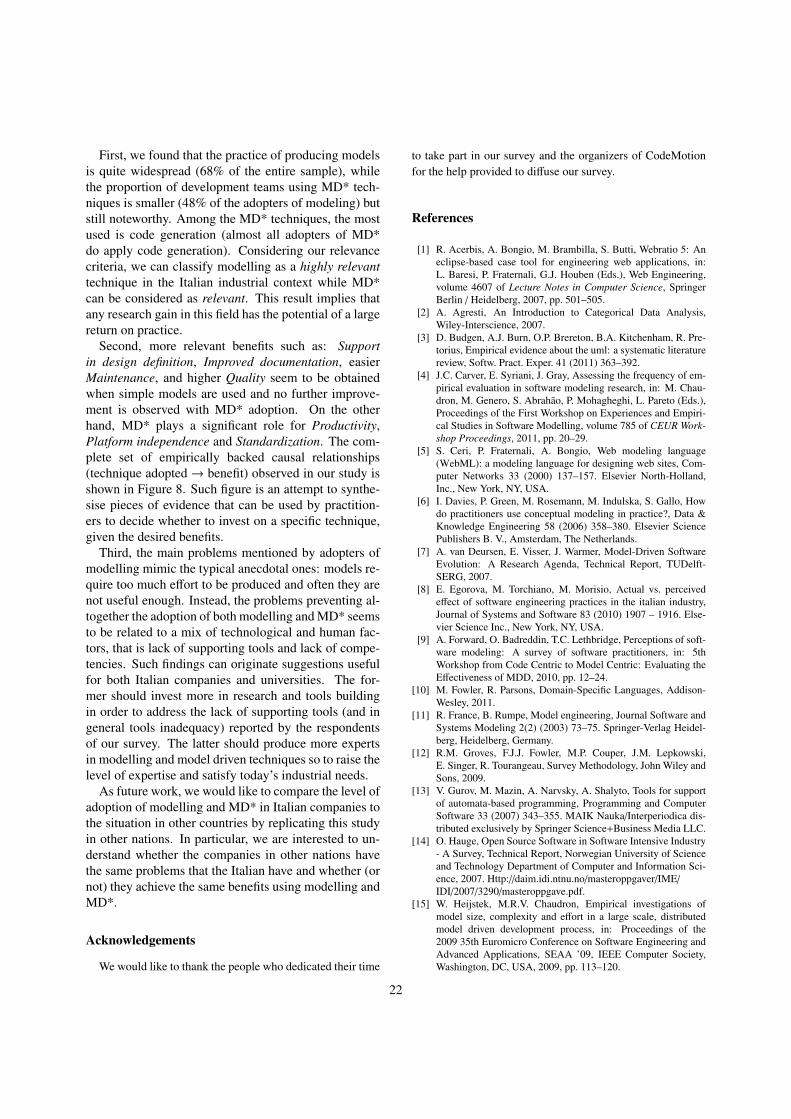
First, we found that the practice of producing modelsis quite widespread (68% of the entire sample), whilethe proportion of development teams using MD* tech-niques is smaller (48% of the adopters of modeling) butstill noteworthy. Among the MD* techniques, the mostused is code generation (almost all adopters of MD*do apply code generation). Considering our relevancecriteria, we can classify modelling as a highly relevanttechnique in the Italian industrial context while MD*can be considered as relevant. This result implies thatany research gain in this field has the potential of a largereturn on practice.
Second, more relevant benefits such as: Supportin design definition, Improved documentation, easierMaintenance, and higher Quality seem to be obtainedwhen simple models are used and no further improve-ment is observed with MD* adoption. On the otherhand, MD* plays a significant role for Productivity,Platform independence and Standardization. The com-plete set of empirically backed causal relationships(technique adopted→ benefit) observed in our study isshown in Figure 8. Such figure is an attempt to synthe-sise pieces of evidence that can be used by practition-ers to decide whether to invest on a specific technique,given the desired benefits.
Third, the main problems mentioned by adopters ofmodelling mimic the typical anecdotal ones: models re-quire too much effort to be produced and often they arenot useful enough. Instead, the problems preventing al-together the adoption of both modelling and MD* seemsto be related to a mix of technological and human fac-tors, that is lack of supporting tools and lack of compe-tencies. Such findings can originate suggestions usefulfor both Italian companies and universities. The for-mer should invest more in research and tools buildingin order to address the lack of supporting tools (and ingeneral tools inadequacy) reported by the respondentsof our survey. The latter should produce more expertsin modelling and model driven techniques so to raise thelevel of expertise and satisfy today’s industrial needs.
As future work, we would like to compare the level ofadoption of modelling and MD* in Italian companies tothe situation in other countries by replicating this studyin other nations. In particular, we are interested to un-derstand whether the companies in other nations havethe same problems that the Italian have and whether (ornot) they achieve the same benefits using modelling andMD*.
Acknowledgements
We would like to thank the people who dedicated their time
to take part in our survey and the organizers of CodeMotionfor the help provided to diffuse our survey.
References
[1] R. Acerbis, A. Bongio, M. Brambilla, S. Butti, Webratio 5: Aneclipse-based case tool for engineering web applications, in:L. Baresi, P. Fraternali, G.J. Houben (Eds.), Web Engineering,volume 4607 of Lecture Notes in Computer Science, SpringerBerlin / Heidelberg, 2007, pp. 501–505.
[2] A. Agresti, An Introduction to Categorical Data Analysis,Wiley-Interscience, 2007.
[3] D. Budgen, A.J. Burn, O.P. Brereton, B.A. Kitchenham, R. Pre-torius, Empirical evidence about the uml: a systematic literaturereview, Softw. Pract. Exper. 41 (2011) 363–392.
[4] J.C. Carver, E. Syriani, J. Gray, Assessing the frequency of em-pirical evaluation in software modeling research, in: M. Chau-dron, M. Genero, S. Abrahao, P. Mohagheghi, L. Pareto (Eds.),Proceedings of the First Workshop on Experiences and Empiri-cal Studies in Software Modelling, volume 785 of CEUR Work-shop Proceedings, 2011, pp. 20–29.
[5] S. Ceri, P. Fraternali, A. Bongio, Web modeling language(WebML): a modeling language for designing web sites, Com-puter Networks 33 (2000) 137–157. Elsevier North-Holland,Inc., New York, NY, USA.
[6] I. Davies, P. Green, M. Rosemann, M. Indulska, S. Gallo, Howdo practitioners use conceptual modeling in practice?, Data &Knowledge Engineering 58 (2006) 358–380. Elsevier SciencePublishers B. V., Amsterdam, The Netherlands.
[7] A. van Deursen, E. Visser, J. Warmer, Model-Driven SoftwareEvolution: A Research Agenda, Technical Report, TUDelft-SERG, 2007.
[8] E. Egorova, M. Torchiano, M. Morisio, Actual vs. perceivedeffect of software engineering practices in the italian industry,Journal of Systems and Software 83 (2010) 1907 – 1916. Else-vier Science Inc., New York, NY, USA.
[9] A. Forward, O. Badreddin, T.C. Lethbridge, Perceptions of soft-ware modeling: A survey of software practitioners, in: 5thWorkshop from Code Centric to Model Centric: Evaluating theEffectiveness of MDD, 2010, pp. 12–24.
[10] M. Fowler, R. Parsons, Domain-Specific Languages, Addison-Wesley, 2011.
[11] R. France, B. Rumpe, Model engineering, Journal Software andSystems Modeling 2(2) (2003) 73–75. Springer-Verlag Heidel-berg, Heidelberg, Germany.
[12] R.M. Groves, F.J.J. Fowler, M.P. Couper, J.M. Lepkowski,E. Singer, R. Tourangeau, Survey Methodology, John Wiley andSons, 2009.
[13] V. Gurov, M. Mazin, A. Narvsky, A. Shalyto, Tools for supportof automata-based programming, Programming and ComputerSoftware 33 (2007) 343–355. MAIK Nauka/Interperiodica dis-tributed exclusively by Springer Science+Business Media LLC.
[14] O. Hauge, Open Source Software in Software Intensive Industry- A Survey, Technical Report, Norwegian University of Scienceand Technology Department of Computer and Information Sci-ence, 2007. Http://daim.idi.ntnu.no/masteroppgaver/IME/
IDI/2007/3290/masteroppgave.pdf.[15] W. Heijstek, M.R.V. Chaudron, Empirical investigations of
model size, complexity and effort in a large scale, distributedmodel driven development process, in: Proceedings of the2009 35th Euromicro Conference on Software Engineering andAdvanced Applications, SEAA ’09, IEEE Computer Society,Washington, DC, USA, 2009, pp. 113–120.
22

[16] B. Hjørland, F. Sejer Christensen, Work tasks and socio-cognitive relevance: a specific example, Journal of the Amer-ican Society for Information Science and Technology 53 (2002)960–965.
[17] J. Hutchinson, M. Rouncefield, J. Whittle, Model-driven engi-neering practices in industry, in: Proceedings of the 33rd Inter-national Conference on Software Engineering, ICSE ’11, ACM,New York, NY, USA, 2011, pp. 633–642.
[18] J. Hutchinson, J. Whittle, M. Rouncefield, S. Kristoffersen, Em-pirical assessment of MDE in industry, in: Proceedings of the33rd International Conference on Software engineering, ICSE’11, ACM, New York, NY, USA, 2011, pp. 471–480.
[19] J. Hutchinson, J. Whittle, M. Rouncefield, S. Kristoffersen, Em-pirical assessment of mde in industry, in: Proceedings of the33rd International Conference on Software Engineering, ICSE’11, ACM, New York, NY, USA, 2011, pp. 471–480.
[20] A. Jelitshka, M. Ciolkowski, C. Denger, B. Freimut, A. Schlicht-ing, Relevant information sources for successful technologytransfer: a survey using inspections as an example, in: Proceed-ings of the International Symposium on Empirical Software En-gineering and Measurement (ESEM), IEEE, 2007, pp. 31–40.
[21] B. Kitchenham, S. Pfleeger, Personal opinion surveys, in:F. Shull, Singer (Eds.), Guide to Advanced Empirical SoftwareEngineering, Springer London, 2008, pp. 63–92.
[22] A.G. Kleppe, J. Warmer, et al., MDA Explained: The ModelDriven Architecture: Practice and Promise, Addison-WesleyLongman Publishing Co., Inc, 2003.
[23] M. Leotta, F. Ricca, M. Ribaudo, G. Reggio, E. Astesiano,T. Vernazza, An Exploratory Survey on SOA Knowledge, Adop-tion and Trend in the Italian Industry, in: Proceedings of 14thInternational Symposium on Web Systems Evolution (WSE2012), IEEE, 2012, pp. 21–30.
[24] T.C. Lethbridge, A survey of the relevance of computer scienceand software engineering education, in: Proceedings of the 11thConference on Software Engineering Education and Training,IEEE Computer Society, Washington, DC, USA, 1998, pp. 56–66.
[25] J. Li, R. Conradi, O. Petter, N. Slyngstad, M. Torchiano,M. Morisio, C. Bunse, A state-of-the-practice survey on riskmanagement in development with off-the-shelf software com-ponents, IEEE Software 34 (2008) 271–286.
[26] A. MacDonald, D. Russell, B. Atchison, Model-driven develop-ment within a legacy system: an industry experience report, in:Australian Software Engineering Conference, IEEE ComputerSociety, 2005, pp. 14–22.
[27] S. Mellor, M. Balcer, Executable UML: A foundation for model-driven architecture, Addison-Wesley, 2002.
[28] S. Mellor, A. Clark, T. Futagami, Model-driven development -guest editor’s introduction, Software, IEEE 20 (2003) 14–18.
[29] P. Mohagheghi, V. Dehlen, Where is the proof? - a reviewof experiences from applying MDE in industry, in: Proceed-ings of the 4th European conference on Model Driven Architec-ture: Foundations and Applications, ECMDA-FA ’08, Springer-Verlag, Berlin, Heidelberg, 2008, pp. 432–443.
[30] P. Mohagheghi, M. Fernandez, J. Martell, M. Fritzsche, W. Gi-lani, MDE adoption in industry : Challenges and success crite-ria, Models in Software Engineering (2009) 54–59.
[31] P. Mohagheghi, W. Gilani, A. Stefanescu, M. Fernandez, Anempirical study of the state of the practice and acceptance ofmodel-driven engineering in four industrial cases, EmpiricalSoftware Engineering (2012) 1–28.
[32] H. Motulsky, Intuitive biostatistics: a nonmathematical guide tostatistical thinking, Oxford University Press, 2010.
[33] A. Nugroho, M.R. Chaudron, A survey into the rigor of uml useand its perceived impact on quality and productivity, in: Pro-
ceedings of the ACM-IEEE international symposium on Empir-ical software engineering and measurement, ESEM ’08, ACM,New York, NY, USA, 2008, pp. 90–99.
[34] Object Management Group, Business Process Model and Nota-tion, v. 2.0, Standard, Object Management Group, 2011.
[35] Object Management Group, Unified Modeling Language, Su-perstructure, v. 2.4, Specifications, Object Management Group,2011.
[36] T. Punter, M. Ciolkowski, B. Freimut, I. John, Conducting on-line surveys in software engineering, in: Proceedings of the In-ternational Symposium on Empirical Software Engineering, (IS-ESE), 2003, pp. 80–88.
[37] D.C. Schmidt, Guest editor’s introduction: Model-driven engi-neering, Computer 39 (2006) 25–31.
[38] B. Selic, The pragmatics of model-driven development, IEEESoftware 20 (2003) 19–25.
[39] J. Singer, M. Storey, D. Damian, Selecting empirical methodsfor software engineering research, in: F. Shull, Singer (Eds.),Guide to Advanced Empirical Software Engineering, Springer,2008, pp. 285–311.
[40] F. Tomassetti, M. Torchiano, A. Tiso, F. Ricca, G. Reggio, Ma-turity of software modelling and model driven engineering: asurvey in the italian industry, IET Seminar Digests 2012 (2012)91–100.
[41] M. Torchiano, M. Di Penta, F. Ricca, A. De Lucia, F. Lanubile,Migration of information systems in the italian industry: A stateof the practice survey, Information and Software Technology 53(2011) 71–86.
[42] M. Torchiano, F. Tomassetti, F. Ricca, A. Tiso, G. Reggio, Pre-liminary findings from a survey on the MD* state of the practice,in: International Symposium on Empirical Software Engineer-ing and Measurement (ESEM), IEEE, 2011, pp. 372 –375.
[43] M. Voelter, Best practices for DSLs and model-driven de-velopment, Journal of Object Technology 8 (2009) online athttp://www.jot.fm.
[44] D.S. Walonick, Survival Statistics, StatPac, Inc., 1997.[45] C. Wohlin, P. Runeson, M. Host, M. Ohlsson, B. Regnell,
A. Wesslen, Experimentation in Software Engineering - An In-troduction, Kluwer Academic Publishers, 2000.
23

Appendix A. Cross correlations
We report here the cross correlations among the ben-efits in Table A.7 and this among the problems in TableA.8.
Design
Docum
entat
ion
Main
tenan
ce
Quality
Standa
rdiza
tion
Flexibi
lity
Produc
tivity
Reacti
vity to
chan
ges
Documentation 0.38
Maintenance 0.33 0.21
Quality 0.23 -0.08 0.35
Standardization 0.07 0.08 0.16 0.22
Flexibility 0.18 -0.13 0.24 0.39 0.14
Productivity 0.17 -0.06 0.12 0.37 0.26 0.42
Reactivity to changes 0.02 -0.12 0.24 0.35 0.28 0.60 0.39
Platform independence 0.17 0.10 0.21 0.17 0.25 0.36 0.38 0.36
Table A.7: Benefits achievement correlation.
Notus
eful e
noug
h
Toomuc
h effort
requir
ed
Lack of
supp
orting
tools
Inade
quac
y ofsu
pport
ingtoo
ls
Lack of
compe
tencie
s
Fear of
lock in
Refusal
from
deve
lopers
Refusal
from
manag
emen
t
Cost o
f supp
orting
tools
Too much effort required 0.01
Lack of supporting tools 0.04 -0.02
Inadequacy of supporting tools 0.07 0.10 0.04
Lack of competencies 0.10 -0.12 0.21 0.06
Fear of lock in 0.04 0.08 -0.15 -0.03 0.03
Refusal from developers 0.09 0.15 -0.01 0.07 0.11 0.08
Refusal from management 0.18 0.02 0.15 0.15 0.32 -0.01 0.22
Cost of supporting tools 0.02 0.15 0.04 0.36 -0.04 0.38 0.07 0.03
Not flexibile enough 0.01 0.12 0.02 0.09 -0.08 0.20 0.13 0.04 0.18
Table A.8: Correlation of potential problems.
24
Related Documents


![Additive Smoothing for Relevance-Based Language Modelling of Recommender Systems [CERI '16 Slides]](https://static.cupdf.com/doc/110x72/58a8398c1a28ab30658b4d0f/additive-smoothing-for-relevance-based-language-modelling-of-recommender-systems.jpg)