Relaxivity-Iron Calibration in Hepatic Iron Overload: Probing Underlying Biophysical Mechanisms Using a Monte Carlo Model Nilesh R. Ghugre 1,2 and John C. Wood 1,2 * Iron overload is a serious condition for patients with b-thalas- semia, transfusion-dependent sickle cell anemia, and inher- ited disorders of iron metabolism. MRI is becoming increasingly important in noninvasive quantification of tissue iron, overcoming the drawbacks of traditional techniques (liver biopsy). Effective transverse relaxation rate (1/effective transverse relaxation time) rises linearly with iron while trans- verse relaxation rate (1/T 2 ) has a curvilinear relationship in human liver. Although recent work has demonstrated clinically valid estimates of human liver iron, the calibration varies with MRI sequence, field strength, iron chelation therapy, and organ imaged, forcing recalibration in patients. To understand and correct these limitations, a thorough understanding of the underlying biophysics is of critical importance. Toward this end, a Monte Carlo-based approach, using human liver as a ‘‘model’’ tissue system, was used to determine the contribution of particle size and distribution on MRI signal relaxation. Relaxivities were determined for hepatic iron con- centrations ranging from 0.5 to 40 mg iron per gram dry tis- sue weight. Model predictions captured the linear and curvilinear relationship of effective transverse relaxation rate and transverse relaxation rate with hepatic iron concentra- tions, respectively, and were within in vivo confidence bounds; contact or chemical exchange mechanisms were not necessary. A validated and optimized model will aid under- standing and quantification of iron-mediated relaxivity in tissues where biopsy is not feasible (heart and spleen). Magn Reson Med 65:837–847, 2011. V C 2010 Wiley- Liss, Inc. Key words: iron overload; liver; Monte Carlo; relaxation; relaxivity Iron overload is a life-threatening condition for patients with b-thalassemia, transfusion-dependent sickle cell anemia, and inherited disorders of iron metabolism (1). Excess iron accumulates in liver, heart, spleen, and en- docrine organs, causing oxidative damage. Liver biopsy is the prevailing clinical standard for monitoring total body iron stores; however, it is invasive, painful (2), ex- pensive, and prone to sampling error (3) and provides only indirect information regarding other inaccessible organs. As an alternative, MRI has gained importance in noninvasive quantification of tissue iron, overcoming the drawbacks of traditional techniques. Superparamagnetic substances such as iron oxide particles (ferritin and he- mosiderin complexes) produce magnetic field disturban- ces that increase MRI relaxivities effective transverse relaxation rate (1/effective transverse relaxation time) [R* 2 (1/T* 2 )] and R 2 (1/T 2 ), indirectly reflecting tissue iron loading. Recent studies by St. Pierre et al. (4) and Wood et al. (5) have demonstrated that MRI techniques can estimate hepatic iron content as accurately as liver bi- opsy. Due to the success of these studies, MRI liver iron assessment has recently received FDA approval for clini- cal diagnosis. In spite of recent success with studies showing good intermachine and interstudy reproducibility for individ- ual pulse sequences (4,6), relaxivity-iron relationships still vary between investigators in complicated ways. Iron calibration appears to vary with acquisition method [single spin echo, multiple spin echo, or spectroscopic sequence (7–9)] as well as relaxation model [monoexpo- nential, biexponential, and nonexponential (10–12)]. Recent animal studies have also indicated that different iron chelation therapies may mobilize or redistribute intrinsic iron stores differently, affecting the calibration curves (13). The variability seen across these factors remains unresolved. As a result, any pulse sequence modification must currently be revalidated in a patient population; an expensive, tedious, and time-consuming task. Finally, with increasing popularity of 3-T scanners, there is a need to translate relaxivity-iron relationships to higher field strengths (14). It is also critical to understand incompletely explained phenomena, such as the nonlinearity of the transverse relaxation rate (R 2 )–iron curve (unlike R* 2 ) and the rele- vant iron ‘‘scales’’ imaged by R 2 and R* 2 methods. Recent studies have demonstrated that R 2 relaxivity of iron par- ticles is critically size dependent. In vivo R 2 measure- ments reveal stronger R 2 relaxivity than can be explained by dispersed ferritin particles. Aggregation of ferritin by 0.8-mm-diameter liposomes or by enzymatic aggregation dramatically steepens the R 2 –iron relationship, making it closer to in vivo values (15,16). Morphology studies of iron deposits in human liver specimens have shown that iron deposits in human liver are on that same scale (12). Most lie in the range of 0.1–3.2 mm with a mode near 1 1 Division of Cardiology, Children’s Hospital Los Angeles, Keck School of Medicine, University of Southern California, Los Angeles, California, USA. 2 Department of Radiology, Children’s Hospital Los Angeles, Keck School of Medicine, University of Southern California, Los Angeles, California, USA. Grant sponsor: General Clinical Research Center (National Institutes of Health); Grant number: RR00043-43; Grant sponsor: Department of Pediatrics at Childrens Hospital Los Angeles (CHLA); Grant sponsor: National Heart Lung and Blood Institute of the National Institutes of Health; Grant number: 1 R01 HL75592-01A1; Grant sponsors: Novartis Pharma AG; The Wright Foundation, and Saban Research Institute at CHLA. *Correspondence to: John C. Wood, M.D., Ph.D., Division of Cardiology, Children’s Hospital Los Angeles, 4650 Sunset Blvd., MS # 34, Los Angeles, CA 90027-0034. E-mail: [email protected] Received 15 June 2010; revised 26 August 2010; accepted 1 September 2010. DOI 10.1002/mrm.22657 Published online 16 November 2010 in Wiley Online Library (wileyonlinelibrary.com). Magnetic Resonance in Medicine 65:837–847 (2011) V C 2010 Wiley-Liss, Inc. 837

Welcome message from author
This document is posted to help you gain knowledge. Please leave a comment to let me know what you think about it! Share it to your friends and learn new things together.
Transcript
Relaxivity-Iron Calibration in Hepatic Iron Overload:Probing Underlying Biophysical Mechanisms Using aMonte Carlo Model
Nilesh R. Ghugre1,2 and John C. Wood1,2*
Iron overload is a serious condition for patients with b-thalas-
semia, transfusion-dependent sickle cell anemia, and inher-
ited disorders of iron metabolism. MRI is becoming
increasingly important in noninvasive quantification of tissue
iron, overcoming the drawbacks of traditional techniques
(liver biopsy). Effective transverse relaxation rate (1/effective
transverse relaxation time) rises linearly with iron while trans-
verse relaxation rate (1/T2) has a curvilinear relationship in
human liver. Although recent work has demonstrated clinically
valid estimates of human liver iron, the calibration varies with
MRI sequence, field strength, iron chelation therapy, and
organ imaged, forcing recalibration in patients. To understand
and correct these limitations, a thorough understanding of
the underlying biophysics is of critical importance. Toward
this end, a Monte Carlo-based approach, using human liver
as a ‘‘model’’ tissue system, was used to determine the
contribution of particle size and distribution on MRI signal
relaxation. Relaxivities were determined for hepatic iron con-
centrations ranging from 0.5 to 40 mg iron per gram dry tis-
sue weight. Model predictions captured the linear and
curvilinear relationship of effective transverse relaxation rate
and transverse relaxation rate with hepatic iron concentra-
tions, respectively, and were within in vivo confidence
bounds; contact or chemical exchange mechanisms were not
necessary. A validated and optimized model will aid under-
standing and quantification of iron-mediated relaxivity in
tissues where biopsy is not feasible (heart and
spleen). Magn Reson Med 65:837–847, 2011. VC 2010 Wiley-
Liss, Inc.
Key words: iron overload; liver; Monte Carlo; relaxation;relaxivity
Iron overload is a life-threatening condition for patients
with b-thalassemia, transfusion-dependent sickle cell
anemia, and inherited disorders of iron metabolism (1).
Excess iron accumulates in liver, heart, spleen, and en-
docrine organs, causing oxidative damage. Liver biopsy
is the prevailing clinical standard for monitoring total
body iron stores; however, it is invasive, painful (2), ex-
pensive, and prone to sampling error (3) and provides
only indirect information regarding other inaccessible
organs. As an alternative, MRI has gained importance in
noninvasive quantification of tissue iron, overcoming the
drawbacks of traditional techniques. Superparamagnetic
substances such as iron oxide particles (ferritin and he-
mosiderin complexes) produce magnetic field disturban-
ces that increase MRI relaxivities effective transverse
relaxation rate (1/effective transverse relaxation time)
[R*2(1/T*2)] and R2(1/T2), indirectly reflecting tissue iron
loading. Recent studies by St. Pierre et al. (4) and Wood
et al. (5) have demonstrated that MRI techniques can
estimate hepatic iron content as accurately as liver bi-
opsy. Due to the success of these studies, MRI liver iron
assessment has recently received FDA approval for clini-
cal diagnosis.
In spite of recent success with studies showing good
intermachine and interstudy reproducibility for individ-
ual pulse sequences (4,6), relaxivity-iron relationships
still vary between investigators in complicated ways.
Iron calibration appears to vary with acquisition method
[single spin echo, multiple spin echo, or spectroscopic
sequence (7–9)] as well as relaxation model [monoexpo-
nential, biexponential, and nonexponential (10–12)].
Recent animal studies have also indicated that different
iron chelation therapies may mobilize or redistribute
intrinsic iron stores differently, affecting the calibration
curves (13). The variability seen across these factors
remains unresolved. As a result, any pulse sequence
modification must currently be revalidated in a patient
population; an expensive, tedious, and time-consuming
task. Finally, with increasing popularity of 3-T scanners,
there is a need to translate relaxivity-iron relationships
to higher field strengths (14).It is also critical to understand incompletely explained
phenomena, such as the nonlinearity of the transverserelaxation rate (R2)–iron curve (unlike R*2) and the rele-vant iron ‘‘scales’’ imaged by R2 and R*2 methods. Recentstudies have demonstrated that R2 relaxivity of iron par-ticles is critically size dependent. In vivo R2 measure-ments reveal stronger R2 relaxivity than can be explainedby dispersed ferritin particles. Aggregation of ferritin by0.8-mm-diameter liposomes or by enzymatic aggregationdramatically steepens the R2–iron relationship, making itcloser to in vivo values (15,16). Morphology studies ofiron deposits in human liver specimens have shown thatiron deposits in human liver are on that same scale (12).Most lie in the range of 0.1–3.2 mm with a mode near 1
1Division of Cardiology, Children’s Hospital Los Angeles, Keck School ofMedicine, University of Southern California, Los Angeles, California, USA.2Department of Radiology, Children’s Hospital Los Angeles, Keck School ofMedicine, University of Southern California, Los Angeles, California, USA.
Grant sponsor: General Clinical Research Center (National Institutes ofHealth); Grant number: RR00043-43; Grant sponsor: Department ofPediatrics at Childrens Hospital Los Angeles (CHLA); Grant sponsor:National Heart Lung and Blood Institute of the National Institutes of Health;Grant number: 1 R01 HL75592-01A1; Grant sponsors: Novartis PharmaAG; The Wright Foundation, and Saban Research Institute at CHLA.
*Correspondence to: John C. Wood, M.D., Ph.D., Division of Cardiology,Children’s Hospital Los Angeles, 4650 Sunset Blvd., MS # 34, Los Angeles,CA 90027-0034. E-mail: [email protected]
Received 15 June 2010; revised 26 August 2010; accepted 1 September2010.
DOI 10.1002/mrm.22657Published online 16 November 2010 in Wiley Online Library(wileyonlinelibrary.com).
Magnetic Resonance in Medicine 65:837–847 (2011)
VC 2010 Wiley-Liss, Inc. 837
mm, however, the size and spacing vary with iron load-ing. Hence, it is essential to systematically evaluate thecontribution of various system parameters such as sizeand distribution of iron clusters, anatomical compart-ments, and proton mobility on iron-related tissue R2 andR*2.
Toward this end, we hypothesized that Monte Carlomodeling can predict relaxivity-iron behavior in an ironoverloaded tissue system given the knowledge of (1) ironscale and distribution, (2) intrinsic magnetic susceptibil-ity of iron particles, and (3) type of MRI experiment.Based on recently published work (17,18), realistichuman liver mimics were simulated for this purpose,allowing a sensitivity analysis for particle size, distribu-tion, and proton mobility, to identify key contributors toiron-mediated MRI relaxation. A bridge between patho-physiology and intrinsic biophysics will help explainvariability seen across the parameter-dependent calibra-tions, improving accuracy of diagnosis, management,and care of patients with iron overload syndromes.
MATERIALS AND METHODS
Monte Carlo Model Outline
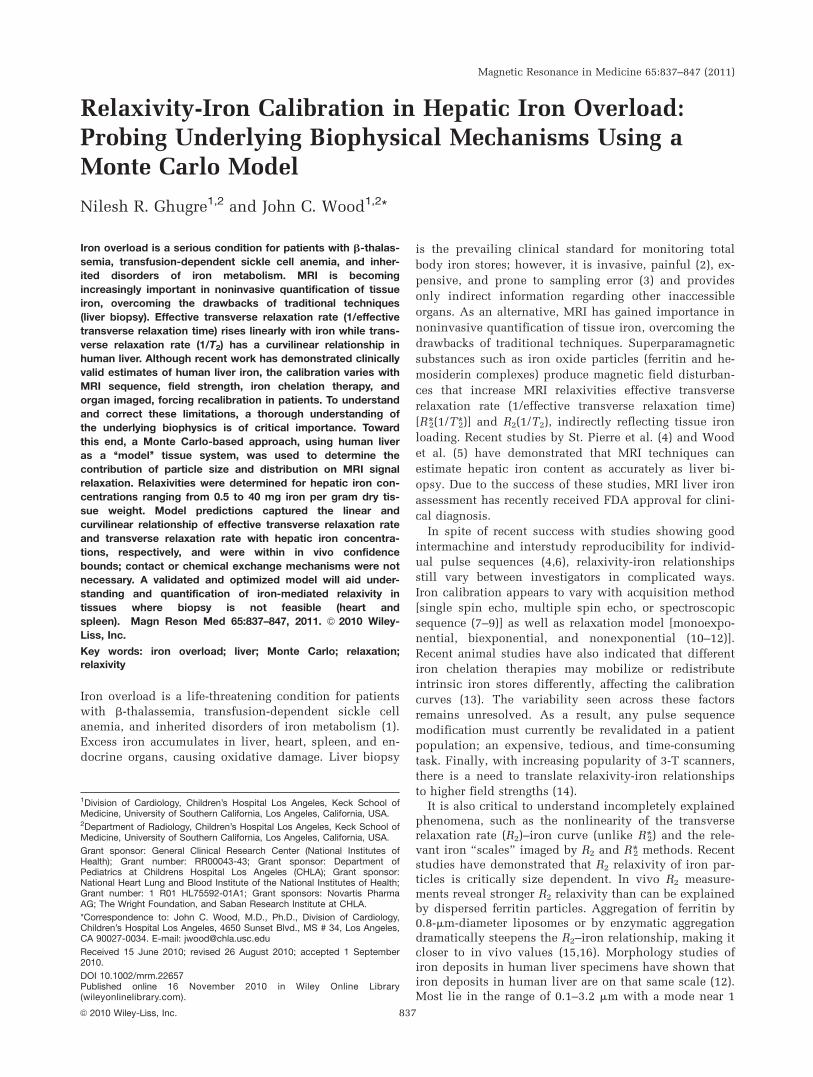
A flow diagram representing the model design is shownin Fig. 1. A virtual liver geometry was constructed basedon published statistics of hepatic iron scale and distribu-tion and its magnetic properties (ferritin and hemosid-erin). Given the hepatic iron concentration (HIC), thecorresponding magnetic field was generated. Diffusion ofprotons was freely isotropic in three dimensions but con-strained not to pass through the iron deposits. Diffusingwater protons differentially accumulated phase accord-ing to their path through the magnetic disturbances. Foreach level of iron burden, the field induction decay wasmeasured along with a single echo experiment to obtainpredicted relaxivities R*2 and R2, respectively.
Virtual Liver Model
Tissue Geometry
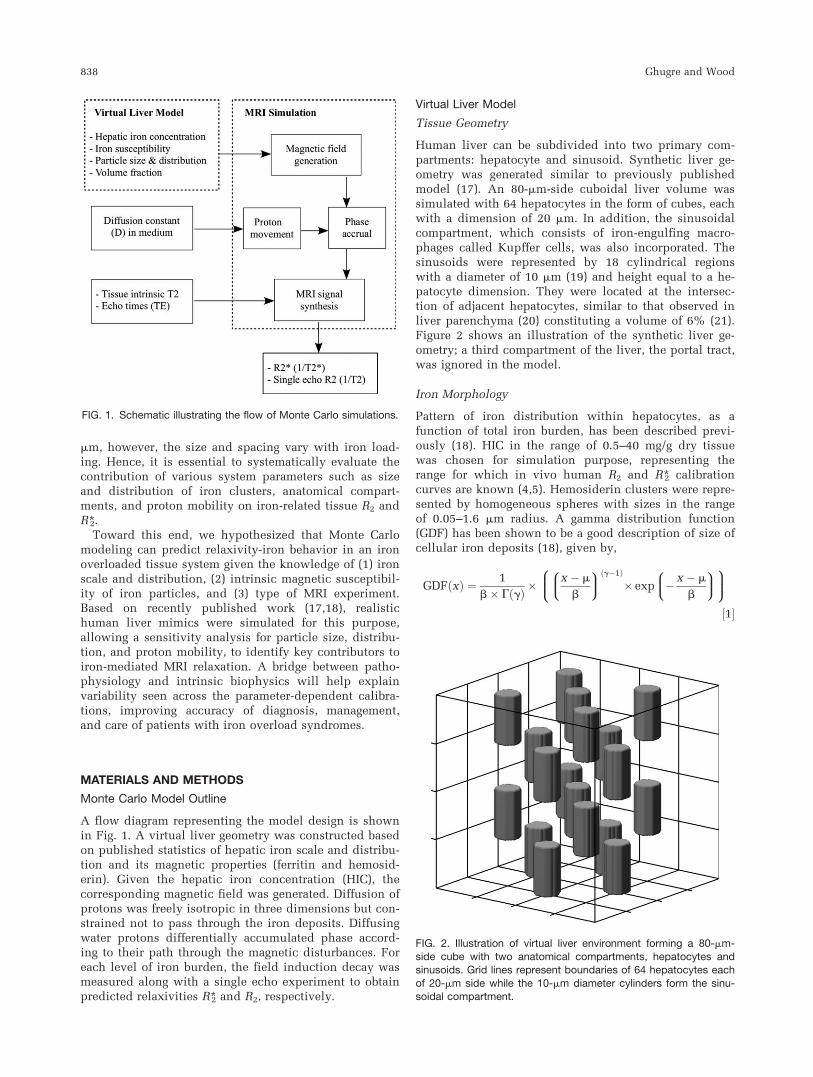
Human liver can be subdivided into two primary com-partments: hepatocyte and sinusoid. Synthetic liver ge-ometry was generated similar to previously publishedmodel (17). An 80-mm-side cuboidal liver volume wassimulated with 64 hepatocytes in the form of cubes, eachwith a dimension of 20 mm. In addition, the sinusoidalcompartment, which consists of iron-engulfing macro-phages called Kupffer cells, was also incorporated. Thesinusoids were represented by 18 cylindrical regionswith a diameter of 10 mm (19) and height equal to a he-patocyte dimension. They were located at the intersec-tion of adjacent hepatocytes, similar to that observed inliver parenchyma (20) constituting a volume of 6% (21).Figure 2 shows an illustration of the synthetic liver ge-ometry; a third compartment of the liver, the portal tract,was ignored in the model.
Iron Morphology
Pattern of iron distribution within hepatocytes, as afunction of total iron burden, has been described previ-ously (18). HIC in the range of 0.5–40 mg/g dry tissuewas chosen for simulation purpose, representing therange for which in vivo human R2 and R*2 calibrationcurves are known (4,5). Hemosiderin clusters were repre-sented by homogeneous spheres with sizes in the rangeof 0.05–1.6 mm radius. A gamma distribution function(GDF) has been shown to be a good description of size ofcellular iron deposits (18), given by,
GDFðxÞ ¼ 1
b� GðgÞ �x � m
b
8>>:9>>;
g�1ð Þ� exp � x � m
b
8>>:9>>;
8>>>:9>>>;½1�
FIG. 1. Schematic illustrating the flow of Monte Carlo simulations.
FIG. 2. Illustration of virtual liver environment forming a 80-mm-side cube with two anatomical compartments, hepatocytes andsinusoids. Grid lines represent boundaries of 64 hepatocytes each
of 20-mm side while the 10-mm diameter cylinders form the sinu-soidal compartment.
838 Ghugre and Wood
where b > 0 (scale parameter), g > 0 (shape parameter),x [ [0; 1], x � m (location parameter), and G(g) is thegamma function, given by,
GðzÞ ¼Z 1
0
tz�1e�tdt ½2�
Shape of a GDF controls the basic behavior of the func-tion, i.e., exponential, x2, or Weibull while scale altersits width. For a given HIC with a particle size range x,the corresponding GDF was computed by substitutingappropriate scale and shape values. Volume fraction(VF) of spheres was calculated as a linear function ofHIC (18), yielding a range of 0.43–5.46%. Two levels ofparticle grouping were incorporated into the model, bothof which were also characterized by GDFs (18): (1) inter-cellular iron anisotropy, i.e., different hepatocytes havedifferent amounts of iron and (2) nearest neighbor crite-ria for interparticle spacing. Table 1 summarizes theequations forming the statistical basis for the micro-scopic iron morphology of human liver. Using the equa-tions in Table 1 and Eq. 1, it was possible to generatethe GDF for any iron concentration. Note that the unitsof b were in micrometers for particle size and nearestneighbor measures while it was dimensionless for ironanisotropy.
The relative iron loading of hepatocyte and sinusoidalcompartments varies with the severity of total liver ironburden. Using quantitative histologic scoring from 70liver biopsy specimens (17), we modeled compartmentalloading by logistic functions, given by,
y ¼ C
1þAe�Bx½3�
where x and y correspond to log(HIC) and iron scores,respectively, C is the maximum value y can take, Areflects the ratio of C and y(x ¼ 0), and B represents howquickly y attains C. For a given HIC, hepatocyte ironscore was obtained by using A ¼ 5.2, B ¼ 0.57, and C ¼36 in Eq. 3. In a similar manner, using A ¼ 5.1, B ¼0.57, and C ¼ 60 gave the total iron score, i.e., the sum-mation of iron scores from all compartments. The VF ofiron spheres in the hepatocytes was thus computedusing the ratio hepatocyte iron score/total iron score. Asour Monte Carlo model neglected portal tracts, theremaining volume of spheres was assigned to sinusoids.The 18 sinusoids were filled equally with the allocatednumber of spheres.
Model Generation
For a given HIC, a target sphere VF was calculated fromthe equation given in Table 1. Spheres of different sizeswere drawn using an HIC-matched particle size histo-gram until the specified VF was attained. Each spherewas assigned a uniform iron density, ensuring conserva-tion of total iron concentration. The spheres were thendistributed throughout the simulation volume to producespecific iron distributions.
(a) Random distribution: This represented the simplestgeometry. The spheres generated were placed in anonoverlapping manner within the tissue environ-ment using a gaussian random distribution. Colli-sion was handled by placing the concerned sphereat the surface of the colliding sphere and overlapwas checked until there was no collision or aspecified number of attempts were reached. If colli-sion had not been resolved by then, a new randomposition was generated and the process wasrepeated. Here, the entire liver environment wasconsidered and hepatocyte and sinusoid compart-ments were presumed to be absent.
(b) Cellular anisotropy: In this model, particle distri-bution within hepatocytes remained gaussian, butthe amount of iron per hepatocyte followed experi-mentally determined intercellular iron GDF, pro-ducing greater fluctuations in intercellular ironconcentrations. Sinusoidal compartments were notmodeled.
(c) Cellular anisotropy with nearest neighbor: Geo-
metry was identical to (b) except that within each
hepatocyte, spheres were placed in accordance to
nearest neighbor GDFs. The first sphere was placed
randomly with every subsequent sphere being posi-
tioned at a histogram-drawn distance in relation to
the previously placed one. Collisions were checked
similar to that in (a) with modifications. If a colli-
sion could not be resolved, a new random position
was generated maintaining the same distance crite-
ria; this was repeated until there was no overlap.
Finally, to avoid a deadlock, a new distance was
generated if sphere could not be placed within 50
attempts and a new reference sphere was selected
if no placement was found in 1000 attempts. Sinu-
soids were absent in this geometry.(d) Cellular anisotropy with nearest neighbor along
with sinusoids: The geometry criteria were the
Table 1Iron Morphology Description
Characterization Equation m c RMSE R
Volume fraction VF ¼ m � HIC þ c 0.00127 (mg/g)�1 0.00368% 0.00716 0.93Size distribution b ¼ m � HIC þc 0.000296 [mm(mg/g)�1] 0.0935 mm 0.0245 0.17
g ¼ m � b þ c 2.188 mm�1 2.695 [ ] 0.0126 0.97Nearest neighbor g ¼ exp (m � log(HIC)þc) 0.476 (mg/g)�1 �0.131 [ ] 1.221 0.78
b ¼ exp (m � log(g)þc) �1.403 mm 0.740 mm 0.357 0.98
Cellular anisotropy g ¼ m � HIC þ c 0.0179 (mg/g)�1 1.025 [ ] 0.412 0.53b ¼ exp (m � log(HIC)þc) 0.375 (mg/g)�1 �3.366 [ ] 0.0296 0.76
RMSE, root mean square error; VF, volume fraction of spheres (%); [ ], dimensionless; R, correlation coefficient; HIC, hepatic iron con-
centration (mg/g dry tissue weight).
Relaxivity-Iron Calibration in Hepatic Iron Overload 839
same as in (c) with the addition of the sinusoidalcompartment. Based on the HIC, a fraction of thetotal volume of spheres was assigned to hepatocytesand the rest to sinusoids according to Eq. 3 and theconstants provided earlier. Within the two compart-ments, spheres were placed as explained in (c).
To access the sensitivity of MRI signal to perturbationsin iron size and clustering, another version of this finalmodel (d) was also generated where GDF parameters band g were allowed to randomly vary within 95% confi-dence bounds of their regression with HIC. The para-meters were assumed to be gaussian variables with‘‘mean’’ given by the equations described in Table 1 and‘‘variance’’ represented by the corresponding meansquare error. Thus, for a given iron burden, iron mor-phology was allowed to alter freely within the observablevariability in histological findings. This provides asensitivity analysis for the accuracy of the histologicalcharacterization with respect to resulting relaxivity.
MRI Simulation
MRI Signal Synthesis and Relaxation
The iron deposits were modeled as a collection ofimpenetrable spheres. The magnetic dipole field equa-tion for a sphere is given by,
DB r; uð ÞB0
¼ 1
3
8>:9>;xL
R
r
8>:9>;3
3Cos2u� 1� � ½4�
where B0 is the applied magnetic field (1.5 T), R is thesphere radius, r is the radial distance from the center,and y is azimuthal angle to the magnetic axis. xL repre-sents the particle susceptibility and is given by xL ¼(HIC/WDR)�xF/y, where y is the sphere VF, HIC is interms of dry tissue weight, and WDR is the tissue wet-to-dry weight ratio, set to 4.1 (22). xF is the intrinsic sus-ceptibility of iron deposits and was assumed to be a 4:1mixture of hemosiderin and ferritin using literature val-ues of 1.1 E �6 and 1.6 E �6 m3/kgFe (23,24) yielding acomposite estimate of 1.2 E �6 m3/kgFe. The number ofspheres distributed was given by N ¼ y�L3/(4/3�p�R3),where L is the side length of the cubic volume. Numberof protons was optimally chosen to be 5000 as this pro-duced a coefficient of variation of <2.5% for both R2 andR*2; based on test simulations, larger number of protonsonly increased simulation time without significantchange in results.
Proton mobility was modeled as isotropic gaussian dif-fusion with mean absolute displacement given by
s ¼ffiffiffiffiffiffiffiffiffi2Dd
p½5�
where D is the diffusion coefficient and d is the simula-tion time step; in 3D, the expected displacement in timet is given by E(R2) ¼ 6Dt. We used a published value ofD ¼ 0.76 mm2/msec determined for human liver (25).Proton random walk was interrogated over a time inter-val of 60 msec and constrained not to pass through theiron spheres; any proton that touched or entered asphere was put back onto the surface. Time step for pro-tons was d ¼ 0.5 msec; the expected distance traveled by
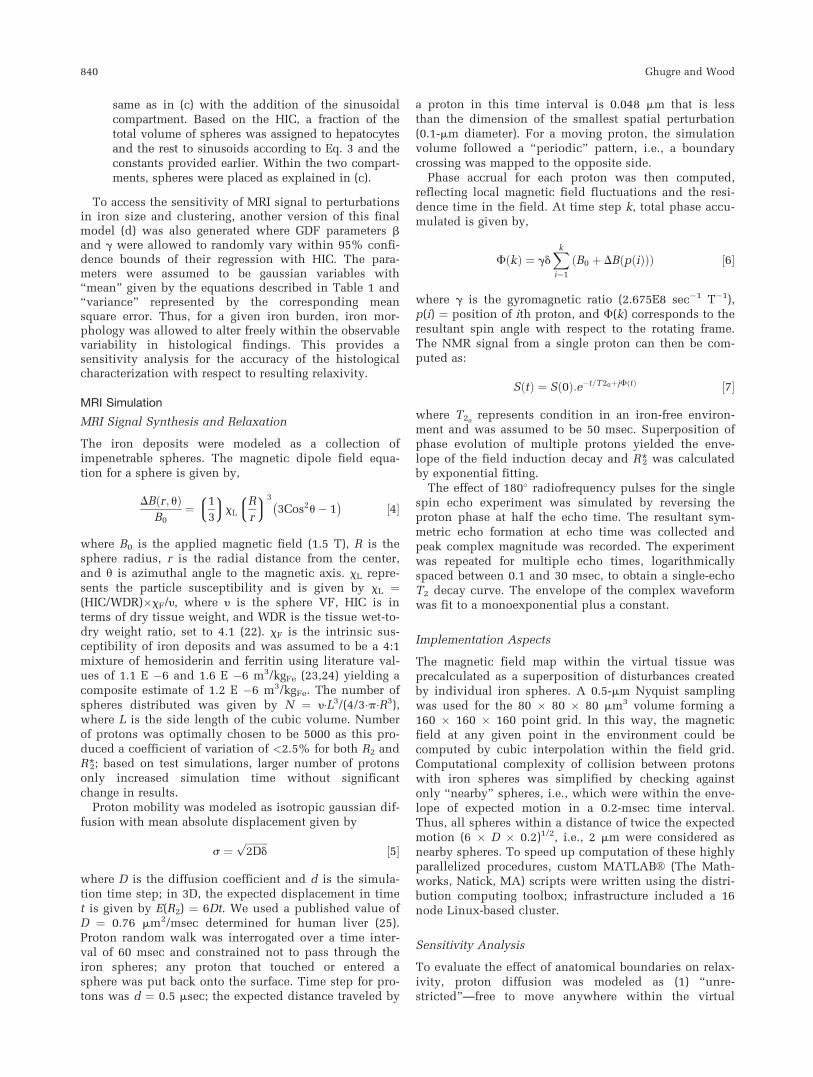
a proton in this time interval is 0.048 mm that is lessthan the dimension of the smallest spatial perturbation(0.1-mm diameter). For a moving proton, the simulationvolume followed a ‘‘periodic’’ pattern, i.e., a boundarycrossing was mapped to the opposite side.
Phase accrual for each proton was then computed,reflecting local magnetic field fluctuations and the resi-dence time in the field. At time step k, total phase accu-mulated is given by,
F kð Þ ¼ gdXki¼1
B0 þ DB p ið Þð Þð Þ ½6�
where g is the gyromagnetic ratio (2.675E8 sec�1 T�1),p(i) ¼ position of ith proton, and F(k) corresponds to theresultant spin angle with respect to the rotating frame.The NMR signal from a single proton can then be com-puted as:
SðtÞ ¼ Sð0Þ:e�t=T20þjFðtÞ ½7�
where T20represents condition in an iron-free environ-
ment and was assumed to be 50 msec. Superposition ofphase evolution of multiple protons yielded the enve-lope of the field induction decay and R*2 was calculatedby exponential fitting.
The effect of 180� radiofrequency pulses for the singlespin echo experiment was simulated by reversing theproton phase at half the echo time. The resultant sym-metric echo formation at echo time was collected andpeak complex magnitude was recorded. The experimentwas repeated for multiple echo times, logarithmicallyspaced between 0.1 and 30 msec, to obtain a single-echoT2 decay curve. The envelope of the complex waveformwas fit to a monoexponential plus a constant.
Implementation Aspects
The magnetic field map within the virtual tissue wasprecalculated as a superposition of disturbances createdby individual iron spheres. A 0.5-mm Nyquist samplingwas used for the 80 � 80 � 80 mm3 volume forming a160 � 160 � 160 point grid. In this way, the magneticfield at any given point in the environment could becomputed by cubic interpolation within the field grid.Computational complexity of collision between protonswith iron spheres was simplified by checking againstonly ‘‘nearby’’ spheres, i.e., which were within the enve-lope of expected motion in a 0.2-msec time interval.Thus, all spheres within a distance of twice the expectedmotion (6 � D � 0.2)1/2, i.e., 2 mm were considered asnearby spheres. To speed up computation of these highlyparallelized procedures, custom MATLABVR (The Math-works, Natick, MA) scripts were written using the distri-bution computing toolbox; infrastructure included a 16node Linux-based cluster.
Sensitivity Analysis
To evaluate the effect of anatomical boundaries on relax-ivity, proton diffusion was modeled as (1) ‘‘unre-stricted’’—free to move anywhere within the virtual
840 Ghugre and Wood
environment and (2) ‘‘restricted’’—constrained not topass through hepatocyte or sinusoid boundaries. Toaccess the sensitivity of relaxivity to proton mobility,simulations were repeated for D ¼ 0.19, 0.38, 1.52, and3.04 mm2/msec (octaves of nominal value of 0.76), thelast one is close to that determined for water at 37� (26).
Bland Altman Analysis
The Bland Altman (BA) statistic was used to comparethe predicted relaxivities across different model variants;BA ¼ [A1 � A2)/(average (A1 þ A2)], where A1 repre-sented the model while A2 represented the reference invivo calibration curves (4,5). The mean of the BA statis-tic reflected the offset of A1 from A2 while its standarddeviation provided the intrinsic variability.
RESULTS
Tissue Geometry and Iron Morphology
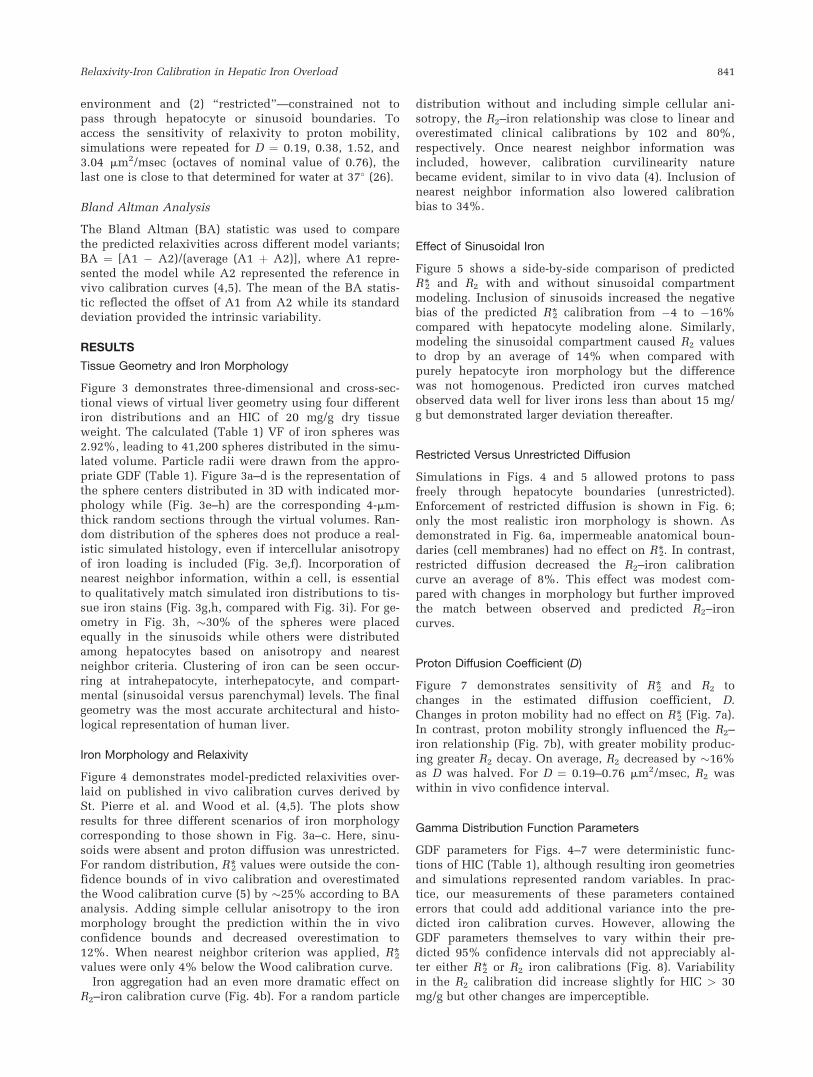
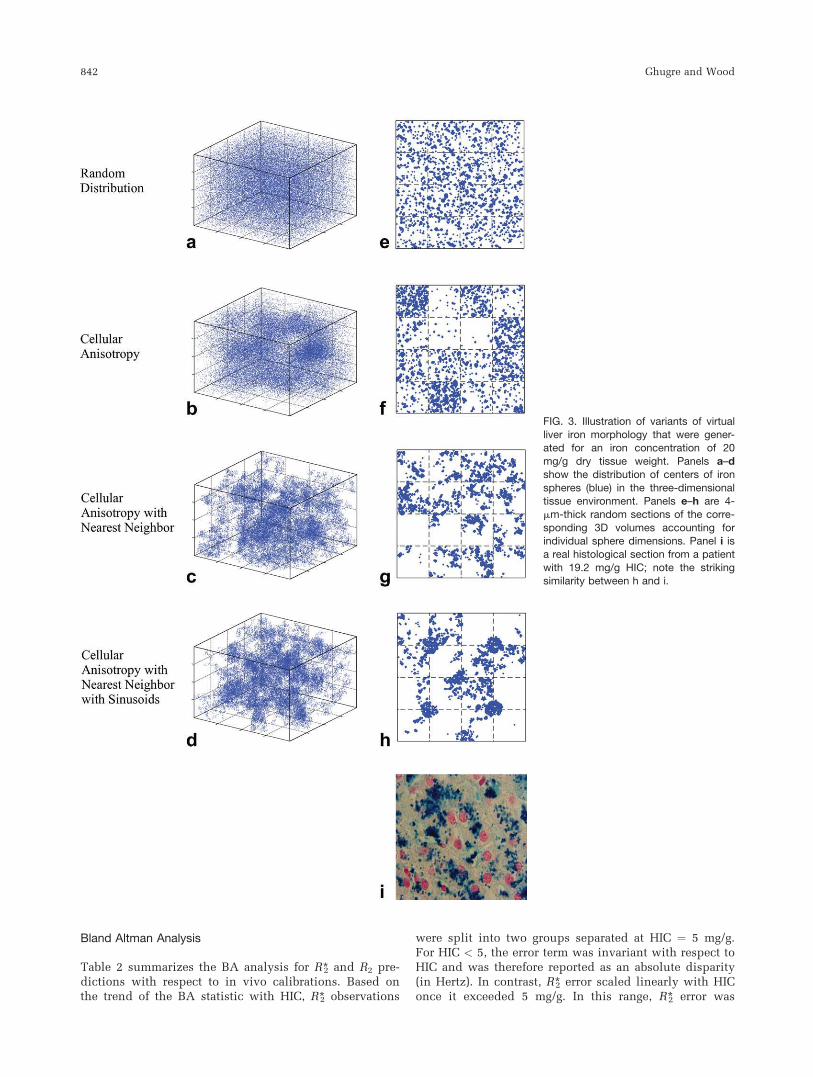
Figure 3 demonstrates three-dimensional and cross-sec-tional views of virtual liver geometry using four differentiron distributions and an HIC of 20 mg/g dry tissueweight. The calculated (Table 1) VF of iron spheres was2.92%, leading to 41,200 spheres distributed in the simu-lated volume. Particle radii were drawn from the appro-priate GDF (Table 1). Figure 3a–d is the representation ofthe sphere centers distributed in 3D with indicated mor-phology while (Fig. 3e–h) are the corresponding 4-mm-thick random sections through the virtual volumes. Ran-dom distribution of the spheres does not produce a real-istic simulated histology, even if intercellular anisotropyof iron loading is included (Fig. 3e,f). Incorporation ofnearest neighbor information, within a cell, is essentialto qualitatively match simulated iron distributions to tis-sue iron stains (Fig. 3g,h, compared with Fig. 3i). For ge-ometry in Fig. 3h, �30% of the spheres were placedequally in the sinusoids while others were distributedamong hepatocytes based on anisotropy and nearestneighbor criteria. Clustering of iron can be seen occur-ring at intrahepatocyte, interhepatocyte, and compart-mental (sinusoidal versus parenchymal) levels. The finalgeometry was the most accurate architectural and histo-logical representation of human liver.
Iron Morphology and Relaxivity
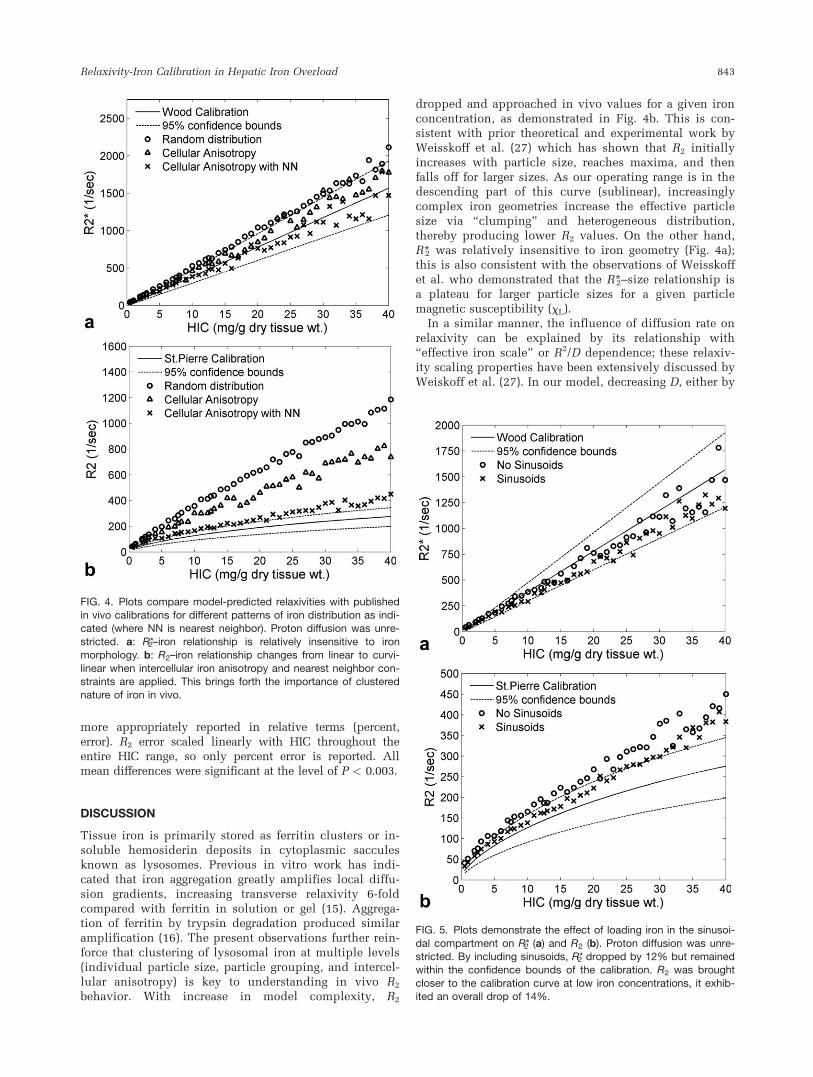
Figure 4 demonstrates model-predicted relaxivities over-laid on published in vivo calibration curves derived bySt. Pierre et al. and Wood et al. (4,5). The plots showresults for three different scenarios of iron morphologycorresponding to those shown in Fig. 3a–c. Here, sinu-soids were absent and proton diffusion was unrestricted.For random distribution, R*2 values were outside the con-fidence bounds of in vivo calibration and overestimatedthe Wood calibration curve (5) by �25% according to BAanalysis. Adding simple cellular anisotropy to the ironmorphology brought the prediction within the in vivoconfidence bounds and decreased overestimation to12%. When nearest neighbor criterion was applied, R*2values were only 4% below the Wood calibration curve.
Iron aggregation had an even more dramatic effect onR2–iron calibration curve (Fig. 4b). For a random particle
distribution without and including simple cellular ani-sotropy, the R2–iron relationship was close to linear andoverestimated clinical calibrations by 102 and 80%,respectively. Once nearest neighbor information wasincluded, however, calibration curvilinearity naturebecame evident, similar to in vivo data (4). Inclusion ofnearest neighbor information also lowered calibrationbias to 34%.
Effect of Sinusoidal Iron
Figure 5 shows a side-by-side comparison of predictedR*2 and R2 with and without sinusoidal compartmentmodeling. Inclusion of sinusoids increased the negativebias of the predicted R*2 calibration from �4 to �16%compared with hepatocyte modeling alone. Similarly,modeling the sinusoidal compartment caused R2 valuesto drop by an average of 14% when compared withpurely hepatocyte iron morphology but the differencewas not homogenous. Predicted iron curves matchedobserved data well for liver irons less than about 15 mg/g but demonstrated larger deviation thereafter.
Restricted Versus Unrestricted Diffusion
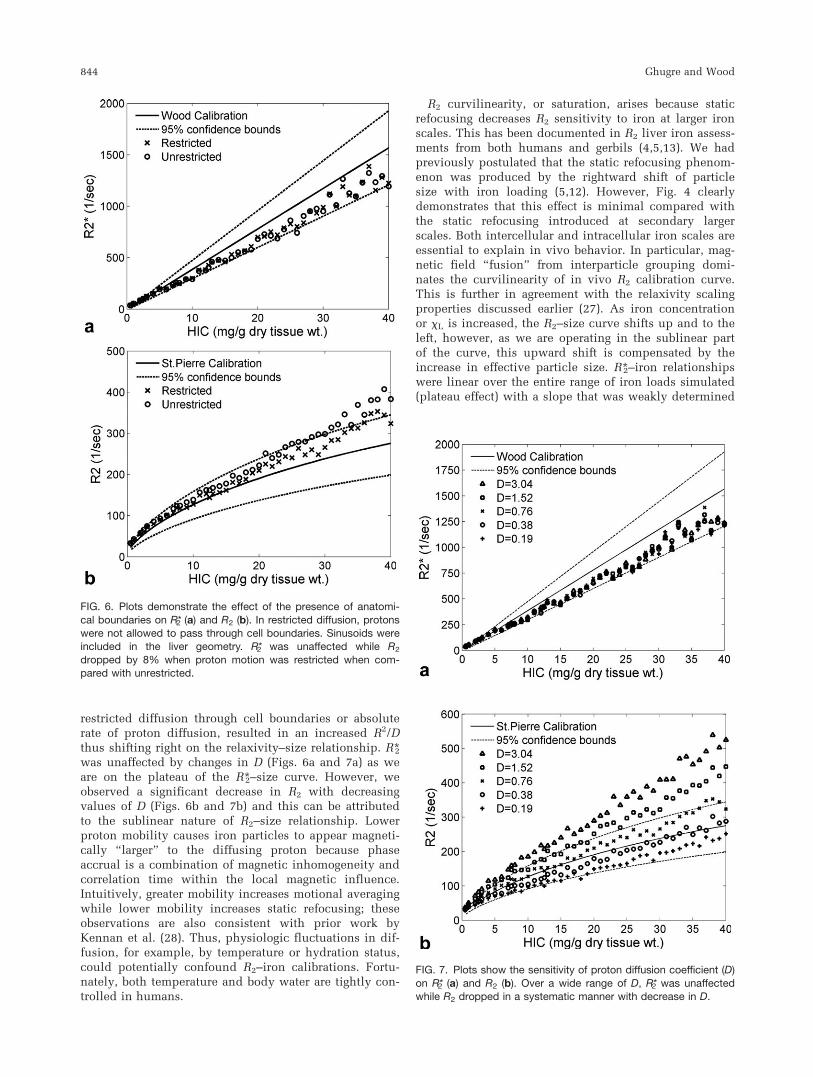
Simulations in Figs. 4 and 5 allowed protons to passfreely through hepatocyte boundaries (unrestricted).Enforcement of restricted diffusion is shown in Fig. 6;only the most realistic iron morphology is shown. Asdemonstrated in Fig. 6a, impermeable anatomical boun-daries (cell membranes) had no effect on R*2. In contrast,restricted diffusion decreased the R2–iron calibrationcurve an average of 8%. This effect was modest com-pared with changes in morphology but further improvedthe match between observed and predicted R2–ironcurves.
Proton Diffusion Coefficient (D)
Figure 7 demonstrates sensitivity of R*2 and R2 tochanges in the estimated diffusion coefficient, D.Changes in proton mobility had no effect on R*2 (Fig. 7a).In contrast, proton mobility strongly influenced the R2–iron relationship (Fig. 7b), with greater mobility produc-ing greater R2 decay. On average, R2 decreased by �16%as D was halved. For D ¼ 0.19–0.76 mm2/msec, R2 waswithin in vivo confidence interval.
Gamma Distribution Function Parameters
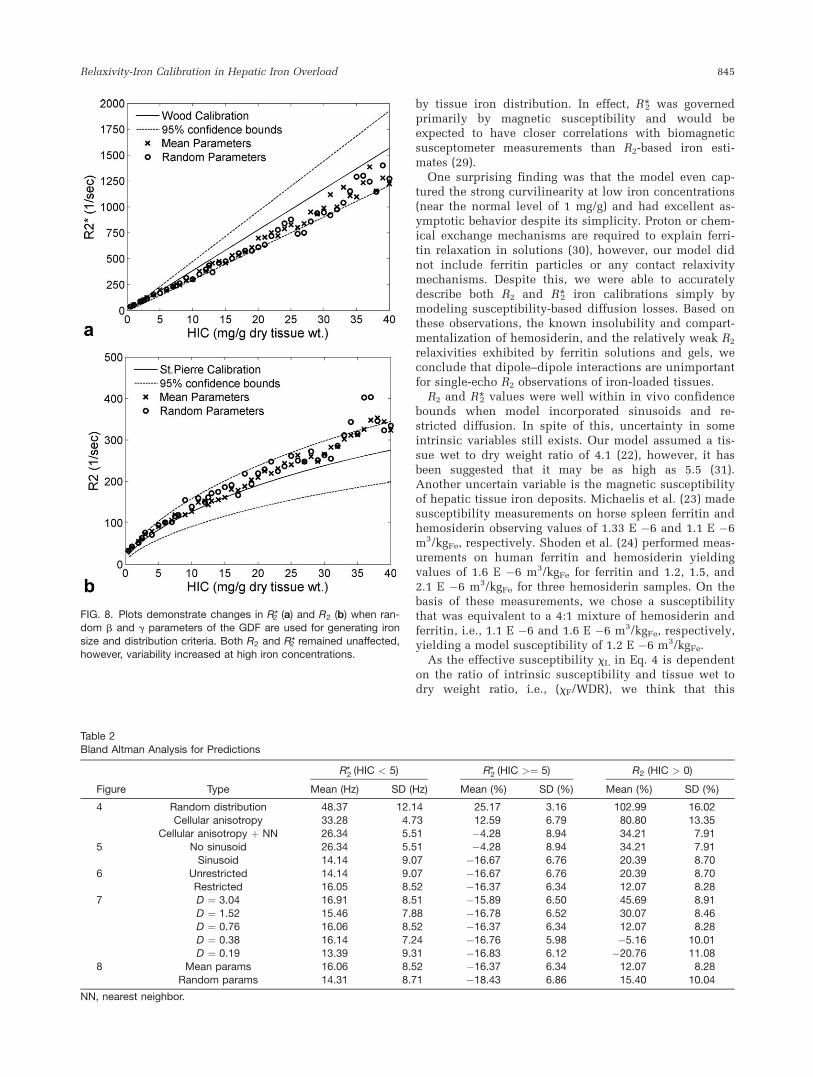
GDF parameters for Figs. 4–7 were deterministic func-tions of HIC (Table 1), although resulting iron geometriesand simulations represented random variables. In prac-tice, our measurements of these parameters containederrors that could add additional variance into the pre-dicted iron calibration curves. However, allowing theGDF parameters themselves to vary within their pre-dicted 95% confidence intervals did not appreciably al-ter either R*2 or R2 iron calibrations (Fig. 8). Variabilityin the R2 calibration did increase slightly for HIC > 30mg/g but other changes are imperceptible.
Relaxivity-Iron Calibration in Hepatic Iron Overload 841
Bland Altman Analysis
Table 2 summarizes the BA analysis for R*2 and R2 pre-dictions with respect to in vivo calibrations. Based onthe trend of the BA statistic with HIC, R*2 observations
were split into two groups separated at HIC ¼ 5 mg/g.For HIC < 5, the error term was invariant with respect toHIC and was therefore reported as an absolute disparity(in Hertz). In contrast, R*2 error scaled linearly with HIConce it exceeded 5 mg/g. In this range, R*2 error was
FIG. 3. Illustration of variants of virtualliver iron morphology that were gener-ated for an iron concentration of 20
mg/g dry tissue weight. Panels a–dshow the distribution of centers of iron
spheres (blue) in the three-dimensionaltissue environment. Panels e–h are 4-mm-thick random sections of the corre-
sponding 3D volumes accounting forindividual sphere dimensions. Panel i isa real histological section from a patient
with 19.2 mg/g HIC; note the strikingsimilarity between h and i.
842 Ghugre and Wood
more appropriately reported in relative terms (percent,error). R2 error scaled linearly with HIC throughout theentire HIC range, so only percent error is reported. Allmean differences were significant at the level of P < 0.003.
DISCUSSION
Tissue iron is primarily stored as ferritin clusters or in-soluble hemosiderin deposits in cytoplasmic sacculesknown as lysosomes. Previous in vitro work has indi-cated that iron aggregation greatly amplifies local diffu-sion gradients, increasing transverse relaxivity 6-foldcompared with ferritin in solution or gel (15). Aggrega-tion of ferritin by trypsin degradation produced similaramplification (16). The present observations further rein-force that clustering of lysosomal iron at multiple levels(individual particle size, particle grouping, and intercel-lular anisotropy) is key to understanding in vivo R2
behavior. With increase in model complexity, R2
dropped and approached in vivo values for a given ironconcentration, as demonstrated in Fig. 4b. This is con-sistent with prior theoretical and experimental work byWeisskoff et al. (27) which has shown that R2 initiallyincreases with particle size, reaches maxima, and thenfalls off for larger sizes. As our operating range is in thedescending part of this curve (sublinear), increasinglycomplex iron geometries increase the effective particlesize via ‘‘clumping’’ and heterogeneous distribution,thereby producing lower R2 values. On the other hand,R*2 was relatively insensitive to iron geometry (Fig. 4a);this is also consistent with the observations of Weisskoffet al. who demonstrated that the R*2–size relationship isa plateau for larger particle sizes for a given particlemagnetic susceptibility (xL).
In a similar manner, the influence of diffusion rate onrelaxivity can be explained by its relationship with‘‘effective iron scale’’ or R2/D dependence; these relaxiv-ity scaling properties have been extensively discussed byWeiskoff et al. (27). In our model, decreasing D, either by
FIG. 4. Plots compare model-predicted relaxivities with publishedin vivo calibrations for different patterns of iron distribution as indi-cated (where NN is nearest neighbor). Proton diffusion was unre-
stricted. a: R*2–iron relationship is relatively insensitive to ironmorphology. b: R2–iron relationship changes from linear to curvi-
linear when intercellular iron anisotropy and nearest neighbor con-straints are applied. This brings forth the importance of clusterednature of iron in vivo.
FIG. 5. Plots demonstrate the effect of loading iron in the sinusoi-
dal compartment on R*2 (a) and R2 (b). Proton diffusion was unre-stricted. By including sinusoids, R*2 dropped by 12% but remainedwithin the confidence bounds of the calibration. R2 was brought
closer to the calibration curve at low iron concentrations, it exhib-ited an overall drop of 14%.
Relaxivity-Iron Calibration in Hepatic Iron Overload 843
restricted diffusion through cell boundaries or absoluterate of proton diffusion, resulted in an increased R2/Dthus shifting right on the relaxivity–size relationship. R*2was unaffected by changes in D (Figs. 6a and 7a) as weare on the plateau of the R*2–size curve. However, weobserved a significant decrease in R2 with decreasingvalues of D (Figs. 6b and 7b) and this can be attributedto the sublinear nature of R2–size relationship. Lowerproton mobility causes iron particles to appear magneti-cally ‘‘larger’’ to the diffusing proton because phaseaccrual is a combination of magnetic inhomogeneity andcorrelation time within the local magnetic influence.Intuitively, greater mobility increases motional averagingwhile lower mobility increases static refocusing; theseobservations are also consistent with prior work byKennan et al. (28). Thus, physiologic fluctuations in dif-fusion, for example, by temperature or hydration status,could potentially confound R2–iron calibrations. Fortu-nately, both temperature and body water are tightly con-trolled in humans.
R2 curvilinearity, or saturation, arises because staticrefocusing decreases R2 sensitivity to iron at larger ironscales. This has been documented in R2 liver iron assess-ments from both humans and gerbils (4,5,13). We hadpreviously postulated that the static refocusing phenom-enon was produced by the rightward shift of particlesize with iron loading (5,12). However, Fig. 4 clearlydemonstrates that this effect is minimal compared withthe static refocusing introduced at secondary largerscales. Both intercellular and intracellular iron scales areessential to explain in vivo behavior. In particular, mag-netic field ‘‘fusion’’ from interparticle grouping domi-nates the curvilinearity of in vivo R2 calibration curve.This is further in agreement with the relaxivity scalingproperties discussed earlier (27). As iron concentrationor xL is increased, the R2–size curve shifts up and to theleft, however, as we are operating in the sublinear partof the curve, this upward shift is compensated by theincrease in effective particle size. R*2–iron relationshipswere linear over the entire range of iron loads simulated(plateau effect) with a slope that was weakly determined
FIG. 6. Plots demonstrate the effect of the presence of anatomi-
cal boundaries on R*2 (a) and R2 (b). In restricted diffusion, protonswere not allowed to pass through cell boundaries. Sinusoids wereincluded in the liver geometry. R*2 was unaffected while R2
dropped by 8% when proton motion was restricted when com-pared with unrestricted.
FIG. 7. Plots show the sensitivity of proton diffusion coefficient (D)
on R*2 (a) and R2 (b). Over a wide range of D, R*2 was unaffectedwhile R2 dropped in a systematic manner with decrease in D.
844 Ghugre and Wood
by tissue iron distribution. In effect, R*2 was governedprimarily by magnetic susceptibility and would beexpected to have closer correlations with biomagneticsusceptometer measurements than R2-based iron esti-mates (29).
One surprising finding was that the model even cap-tured the strong curvilinearity at low iron concentrations(near the normal level of 1 mg/g) and had excellent as-ymptotic behavior despite its simplicity. Proton or chem-ical exchange mechanisms are required to explain ferri-tin relaxation in solutions (30), however, our model didnot include ferritin particles or any contact relaxivitymechanisms. Despite this, we were able to accuratelydescribe both R2 and R*2 iron calibrations simply bymodeling susceptibility-based diffusion losses. Based onthese observations, the known insolubility and compart-mentalization of hemosiderin, and the relatively weak R2
relaxivities exhibited by ferritin solutions and gels, weconclude that dipole–dipole interactions are unimportantfor single-echo R2 observations of iron-loaded tissues.
R2 and R*2 values were well within in vivo confidencebounds when model incorporated sinusoids and re-stricted diffusion. In spite of this, uncertainty in someintrinsic variables still exists. Our model assumed a tis-sue wet to dry weight ratio of 4.1 (22), however, it hasbeen suggested that it may be as high as 5.5 (31).Another uncertain variable is the magnetic susceptibilityof hepatic tissue iron deposits. Michaelis et al. (23) madesusceptibility measurements on horse spleen ferritin andhemosiderin observing values of 1.33 E �6 and 1.1 E �6m3/kgFe, respectively. Shoden et al. (24) performed meas-urements on human ferritin and hemosiderin yieldingvalues of 1.6 E �6 m3/kgFe for ferritin and 1.2, 1.5, and2.1 E �6 m3/kgFe for three hemosiderin samples. On thebasis of these measurements, we chose a susceptibilitythat was equivalent to a 4:1 mixture of hemosiderin andferritin, i.e., 1.1 E �6 and 1.6 E �6 m3/kgFe, respectively,yielding a model susceptibility of 1.2 E �6 m3/kgFe.
As the effective susceptibility xL in Eq. 4 is dependenton the ratio of intrinsic susceptibility and tissue wet todry weight ratio, i.e., (xF/WDR), we think that this
FIG. 8. Plots demonstrate changes in R*2 (a) and R2 (b) when ran-dom b and g parameters of the GDF are used for generating iron
size and distribution criteria. Both R2 and R*2 remained unaffected,however, variability increased at high iron concentrations.
Table 2
Bland Altman Analysis for Predictions
Figure Type
R2* (HIC < 5) R2* (HIC >¼ 5) R2 (HIC > 0)
Mean (Hz) SD (Hz) Mean (%) SD (%) Mean (%) SD (%)
4 Random distribution 48.37 12.14 25.17 3.16 102.99 16.02Cellular anisotropy 33.28 4.73 12.59 6.79 80.80 13.35
Cellular anisotropy þ NN 26.34 5.51 �4.28 8.94 34.21 7.91
5 No sinusoid 26.34 5.51 �4.28 8.94 34.21 7.91Sinusoid 14.14 9.07 �16.67 6.76 20.39 8.70
6 Unrestricted 14.14 9.07 �16.67 6.76 20.39 8.70Restricted 16.05 8.52 �16.37 6.34 12.07 8.28
7 D ¼ 3.04 16.91 8.51 �15.89 6.50 45.69 8.91
D ¼ 1.52 15.46 7.88 �16.78 6.52 30.07 8.46D ¼ 0.76 16.06 8.52 �16.37 6.34 12.07 8.28
D ¼ 0.38 16.14 7.24 �16.76 5.98 �5.16 10.01D ¼ 0.19 13.39 9.31 �16.83 6.12 �20.76 11.08
8 Mean params 16.06 8.52 �16.37 6.34 12.07 8.28
Random params 14.31 8.71 �18.43 6.86 15.40 10.04
NN, nearest neighbor.
Relaxivity-Iron Calibration in Hepatic Iron Overload 845
combined factor is a more stable representation of thetwo. For our model, this factor was (1.2E-6/4.1) or0.2926E-6 that agreed with the values used by Fischeret al. (31) in their SQUID biosusceptometry measure-ments, (1.6E-6/5.5) or 0.2909E-6. As model-predicted R*2values were within the confidence bounds of the in vivocalibration, the assumed factor is probably very close tothe ‘‘truth.’’
Exact values for diffusion coefficient are difficult tomeasure in tissues in vivo. The only available in vivohuman measurement for water diffusion in liver is 0.76mm2/msec (25); however, the standard deviation for thismeasurement was 0.27, which defines a 95% confidenceinterval of 0.22–1.3. Furthermore, the measurement willvary depending on the time interval over which the pro-ton motion has been interrogated. As shown in Fig. 7b,‘‘effective’’ in vivo diffusion coefficient could be any-where between 0.19 and 0.76 mm2/msec. A recent studyhas also demonstrated a 4-fold decrease in the apparentdiffusion coefficient of water in injured brain tissue andthat this may be due to kinetic changes occurring in theintracellular spaces.
The calibrations predicted by the model depend onthe accurate morphologic characterization of hepatic ironstores. Practical considerations, however, limited thenumber of patients studied (N ¼ 20) (18) even thoughliver biopsy is known to have high sampling variability(3). Iron distribution histograms used in these simula-tions did not account for the stereological bias generatedwhen approximating 3D structures using 2D information(32,33). Our algorithm to match the nearest neighbor his-tograms was also imperfect as we could not easilyaccount for distance changes introduced by new par-ticles on the particles already placed. This slightlyreduced the width of the final distribution, relative tothe desired histogram, but the mode was unaltered.Finally, particle spacing within sinusoids was assumedto be similar to that in hepatocytes, however, electronmicrographs suggest that nearest neighbor distribution insinusoids is narrower (particles are closer together)although more difficult to quantify. Nevertheless, theresulting simulated histology (Fig. 3d,h) and calibrationcurves (Fig. 5) were so similar to ‘‘truth’’ that it isunlikely that these minor algorithmic imperfections wereimportant. Furthermore, allowing histogram parametersto vary over their entire stochastic range produced littledeviation from the mean behavior.
Future modifications of the model could includeincorporating contributions from portal tract endothelialcells. Biliary and vascular endothelial cells in the portalsystem contain roughly 10–16% of the total iron concen-tration (17). Our present simulations did not explicitlymodel this compartment, instead placed its correspond-ing iron share into the sinusoidal spaces. However, themagnetic scale of such fluctuations is quite long and islikely to have smaller impact. A second modificationcould be to restrict proton mobility further by introduc-ing other hepatocyte organelles such as the nucleus orinclusion bodies. The hepatic nucleus occupies �7% ofthe hepatocyte (34) and is relatively iron poor. Theseadditional objects would further restrict proton diffusionwithin the hepatocyte, creating an ‘‘effective diffusion’’
constant lower than the assumed D. Rather than treatingboundaries as absolute barriers, proton interactions withiron particles, cell nucleus, and cell boundaries (mem-branes) could be modeled as exchange times, which canbe estimated from previous studies (10,12). Given thegood agreement observed with simplified approaches,these additional complexities are unlikely to have a dra-matic influence on R*2 and single-echo R2 measurements.However, they may influence Carr-Purcell-Meiboom-Gill(CPMG) sequences that are quite sensitive to the relativebalance of proton mobility and iron scale, particularly atshorter interecho spacing.
While the present model provides important mecha-nistic insights, its real power lies in the ability to predictchanges in relaxivity-iron calibration under various sce-narios. For example, with the popularity of 3-T MRIscanners, there is a need to translate the relationships tohigher fields (14). Iron calibration curves obtained fromCPMG sequences differ from single-echo R2 measure-ments and may be echo time dependent (9,12,35). Evensingle-echo R2 calibration has only been validated forHIC < 40 mg/g. It is relatively straightforward to extrapo-late the present model to these measurement conditions.Physiologic questions can be posed as well. Hereditaryhemochromatosis types 1 and 4 load hepatocytes and si-nusoidal cells independently of one another. Similarly,certain iron chelators deplete liver iron nearly selectivelyfrom hepatocyte stores. Intuitively, one would expectcondition-specific liver iron calibration curves. All theseconditions can be objectively tested, greatly reducing theneed for rescanning patient cohorts.
Finally, these data suggest that calibration curves in bi-opsy inaccessible organs can be derived from Monte Carlosimulations. The core knowledge of iron distribution andintrinsic susceptibility can be obtained from autopsyspecimens. This knowledge is sufficient for R*2 calibra-tions. R2 calibrations require measurements or estimatesof proton mobility. This knowledge is more problematicbut techniques for in vivo estimation are improving, as isour understanding of cellular proton mobility.
In summary, a thorough understanding of the physicalinteractions occurring at the microscopic level can defi-nitely aid resolving: (1) differences in calibration, (2) dis-crepancies in MRI techniques, and (3) changes in calibra-tion with change in iron distribution. Monte Carlomodeling (27,36) excels in this regard, turning compli-cated physical systems into number of smaller and sim-pler problems that are more tractable. Using iron particlesize and scale information derived from liver biopsyspecimens, we were able to accurately predict in vivohuman R2 and R*2 iron calibration curves. Iron scale var-iations at the particle, interparticle, and intercellularlevel were critical in capturing the correct magnitudeand curvilinearity of the R2–iron relationship; changes inproton mobility were analogous to changes in particleiron scale. R*2 measurements were much more robust tochanges in iron scale and proton mobility. These dataclearly demonstrate that iron distribution, rather thaniron speciation, is the critical determinant of R2 relaxiv-ity. Further, they indicate that diffusion-mediatedsusceptibility losses dominate contrast mechanisms forclinical R2–iron determinations. Therefore, knowledge of
846 Ghugre and Wood

iron susceptibility, iron distribution, and proton mobilityis sufficient to characterize tissue iron relaxivities, atleast at high iron loads. Thus, tissue-specific models canprovide relaxation–iron calibration curves for inaccessi-ble organs (heart, spleen, and pancreas) where tissuebiopsy is not an option.
REFERENCES
1. Gordeuk VR, Bacon BR, Brittenham GM. Iron overload: causes and
consequences. Annu Rev Nutr 1987;7:485–508.
2. Janes CH, Lindor KD. Outcome of patients hospitalized for complica-
tions after outpatient liver biopsy. Ann Intern Med 1993;118:96–98.
3. Ambu R, Crisponi G, Sciot R, Van Eyken P, Parodo G, Iannelli S,
Marongiu F, Silvagni R, Nurchi V, Costa V. Uneven hepatic iron
and phosphorus distribution in beta-thalassemia. J Hepatol 1995;23:
544–549.
4. St Pierre TG, Clark PR, Chua-anusorn W, Fleming AJ, Jeffrey GP,
Olynyk JK, Pootrakul P, Robins E, Lindeman R. Noninvasive mea-
surement and imaging of liver iron concentrations using proton mag-
netic resonance. Blood 2005;105:855–861.
5. Wood JC, Enriquez C, Ghugre N, Tyzka JM, Carson S, Nelson MD,
Coates TD. MRI R2 and R*2 mapping accurately estimates hepatic iron
concentration in transfusion-dependent thalassemia and sickle cell
disease patients. Blood 2005;106:1460–1465.
6. Westwood MA, Anderson LJ, Firmin DN, Gatehouse PD, Lorenz CH,
Wonke B, Pennell DJ. Interscanner reproducibility of cardiovascular
magnetic resonance T*2 measurements of tissue iron in thalassemia.
J Magn Reson Imaging 2003;18:616–620.
7. Thomsen C, Wiggers P, Ring-Larsen H, Christiansen E, Dalhoj J, Hen-
riksen O, Christoffersen P. Identification of patients with hereditary
haemochromatosis by magnetic resonance imaging and spectroscopic
relaxation time measurements. Magn Reson Imaging 1992;10:867–879.
8. Wang ZJ, Haselgrove JC, Martin MB, Hubbard AM, Li S, Loomes K,
Moore JR, Zhao H, Cohen AR. Evaluation of iron overload by single
voxel MRS measurement of liver T2. J Magn Reson Imaging 2002;15:
395–400.
9. Bulte JW, Miller GF, Vymazal J, Brooks RA, Frank JA. Hepatic hemo-
siderosis in non-human primates: quantification of liver iron using
different field strengths. Magn Reson Med 1997;37:530–536.
10. Brooks RA, Moiny F, Gillis P. On T2-shortening by weakly magne-
tized particles: the chemical exchange model. Magn Reson Med 2001;
45:1014–1020.
11. Jensen JH, Chandra R. Theory of nonexponential NMR signal decay
in liver with iron overload or superparamagnetic iron oxide particles.
Magn Reson Med 2002;47:1131–1138.
12. Ghugre NR, Coates TD, Nelson MD, Wood JC. Mechanisms of tissue-
iron relaxivity: nuclear magnetic resonance studies of human liver
biopsy specimens. Magn Reson Med 2005;54:1185–1193.
13. Wood J, Otto-Duessel M, Aguilar M, Nick H, Nelson M, Coates T,
Pollack H, Moats R. Cardiac iron determines cardiac T*2, T2, and T1
in the gerbil model of iron cardiomyopathy. Circulation 2005;112:
535–543.
14. Storey P, Thompson AA, Carqueville CL, Wood JC, de Freitas RA,
Rigsby CK. R*2 imaging of transfusional iron burden at 3T and com-
parison with 1.5T. J Magn Reson Imaging 2007;25:540–547.
15. Wood JC, Fassler J, Meade T. Mimicking liver iron overload using
liposomal ferritin preparations. Mag Res Med 2004;51:607–611.
16. Gossuin Y, Gillis P, Muller RN, Hocq A. Relaxation by clustered fer-
ritin: a model for ferritin-induced relaxation in vivo. NMR Biomed
2007;20:749–756.
17. Ghugre NR, Gonzalez-Gomez I, Butensky E, Noetzli L, Fischer R,
Williams R, Harmatz P, Coates TD, Wood JC. Patterns of hepatic iron
distribution in patients with chronically transfused thalassemia and
sickle cell disease. Am J Hematol 2009;84:480–483.
18. Ghugre NR, Gonzalez-Gomez I, Shimada H, Coates TD, Wood JC.
Quantitative analysis and modelling of hepatic iron stores using ster-
eology and spatial statistics. J Microsc 2010;238:265–274.
19. Burt AD, Portmann BC, Ferrell LD. MacSween’s pathology of the
liver. Philadelphia: Churchill Livingstone Elsevier; 2007. 992 p.
20. Elias H, Sherrick JC. Morphology of the liver. New York: Academic
Press, Inc.; 1969. 390 p.
21. Oda M. Series introduction: hepatic sinusoidal cells in liver physiol-
ogy and pathology. Med Electron Microsc 2004;37:1–2.
22. Zuyderhoudt FM, Hengeveld P, van Gool J, Jorning GG. A method
for measurement of liver iron fractions in needle biopsy specimens
and some results in acute liver disease. Clin Chim Acta 1978;86:
313–321.
23. Michaelis J, Coryell C, Granick S. The magnetic properties of ferritin
and some other colloidal ferric compounds. J Biol Chem 1943;148:
463–480.
24. Shoden A, Sturgeon P, Hemosiderin I. A physico-chemical study.
Acta Haematol 1960;23:376–392.
25. Yamada I, Aung W, Himeno Y, Nakagawa T, Shibuya H. Diffusion
coefficients in abdominal organs and hepatic lesions: evaluation
with intravoxel incoherent motion echo-planar MR imaging. Radiol-
ogy 1999;210:617–623.
26. Sack I, Gedat E, Bernarding J, Buntkowsky G, Braun J. Magnetic reso-
nance elastography and diffusion-weighted imaging of the sol/gel
phase transition in agarose. J Magn Reson 2004;166:252–261.
27. Weisskoff RM, Zuo CS, Boxerman JL, Rosen BR. Microscopic suscep-
tibility variation and transverse relaxation: theory and experiment.
Magn Reson Med 1994;31:601–610.
28. Kennan RP, Zhong J, Gore JC. Intravascular susceptibility contrast
mechanisms in tissues. Magn Reson Med 1994;31:9–21.
29. Nielsen P, Engelhardt R, Duerken M, Janka GE, Fischer R. Using
SQUID biomagnetic liver susceptometry in the treatment of thalasse-
mia and other iron loading diseases. Transfus Sci 2000;23:257–258.
30. Gossuin Y, Roch A, Muller RN, Gillis P. Relaxation induced by ferri-
tin and ferritin-like magnetic particles: the role of proton exchange.
Magn Reson Med 2000;43:237–243.
31. Fischer R, Piga A, Harmatz P, Nielsen P. Monitoring long-term effi-
cacy of iron chelation treatment with biomagnetic liver susceptome-
try. Ann N Y Acad Sci 2005;1054:350–357.
32. Royet J-P. Stereology: a method for analyzing images. Prog Neurobiol
1991;37:433–474.
33. Benes FM, Lange N. Two-dimensional versus three-dimensional cell
counting: a practical perspective. Trends Neurosci 2001;24:11–17.
34. Rohr HP, Luthy J, Gudat F, Oberholzer M, Gysin C, Bianchi L. Ster-
eology of liver biopsies from healthy volunteers. Virchows Arch A
Pathol Anat Histol 1976;371:251–263.
35. Alexopoulou E, Stripeli F, Baras P, Seimenis I, Kattamis A, Ladis V,
Efstathopoulos E, Brountzos EN, Kelekis AD, Kelekis NL. R2 relaxom-
etry with MRI for the quantification of tissue iron overload in beta-
thalassemic patients. J Magn Reson Imaging 2006;23:163–170.
36. Hardy P, Henkelman RM. On the transverse relaxation rate enhance-
ment induced by diffusion of spins through inhomogeneous fields.
Magn Reson Med 1991;17:348–356.
Relaxivity-Iron Calibration in Hepatic Iron Overload 847
Related Documents