Relative Strength Tools in Trading and Investing April 8, 2014 Adam Grimes, CIO, Waverly Advisors

Welcome message from author
This document is posted to help you gain knowledge. Please leave a comment to let me know what you think about it! Share it to your friends and learn new things together.
Transcript

Relative Strength Tools in Trading and Investing
April 8, 2014 Adam Grimes, CIO, Waverly Advisors

Outline: – What is relative strength? – What are some ways to measure relative strength? – Ideas for applying relative strength: As a step in the screening process As a stand-alone methodology
– Ideas for further research
© 2014 by Waverly Advisors, LLC. All rights reserved. No part of this document may be reproduced or transmitted in any form or by any means without the express written consent of Waverly Advisors.
Relative Strength Comparing the relative performance of different
markets. Two questions:
– How to measure relative performance? – What markets can we compare?
© 2014 by Waverly Advisors, LLC. All rights reserved. No part of this document may be reproduced or transmitted in any form or by any means without the express written consent of Waverly Advisors.
Relative Strength Index (RSI) The relative strength index (RSI) does not measure
relative strength (and it is not an index.) This is a common problem with technical indicators:
terminology was very loosely adapted from other disciplines so names can be misleading. – Other common examples: CCI (Commodity Channel Index) is not commodity-specific. The Stochastic oscillator has nothing to do with stochastics
in mathematics.
RSI may be useful, but it is not meant to be used for relative strength trading or analysis!
© 2014 by Waverly Advisors, LLC. All rights reserved. No part of this document may be reproduced or transmitted in any form or by any means without the express written consent of Waverly Advisors.

Measuring Relative Performance Simple percent returns Performance relative to a market average Volatility-adjusted performance Composite returns over multiple time periods
© 2014 by Waverly Advisors, LLC. All rights reserved. No part of this document may be reproduced or transmitted in any form or by any means without the express written consent of Waverly Advisors.
Simple Return Measures In most software packages can use Rate of Change
(ROC), which is a simple percent change over a specified time period.
ROC = Closetoday / Closen periods ago – 1 A basic relative strength measure can be created as a
ranking of these returns.
© 2014 by Waverly Advisors, LLC. All rights reserved. No part of this document may be reproduced or transmitted in any form or by any means without the express written consent of Waverly Advisors.
Relative Strength (RS) Universe The next examples will use these markets:
– S&P 500 Cash – S&P 500 Futures, continuous contract – SPY – 30 Year Treasury Bond Futures, continuous – TLT – US Dollar Index, Cash – UUP – Gold Futures, continuous – Crude Oil Futures, continuous – USO
(This list of markets may not make sense for actual relative strength analysis, but we are illustrating a few points.)
© 2014 by Waverly Advisors, LLC. All rights reserved. No part of this document may be reproduced or transmitted in any form or by any means without the express written consent of Waverly Advisors.

Ranked by One Month Returns
© 2014 by Waverly Advisors, LLC. All rights reserved. No part of this document may be reproduced or transmitted in any form or by any means without the express written consent of Waverly Advisors.
Exchange traded products (ETPs) and their related markets show some differences.
What happens if we use another time period?
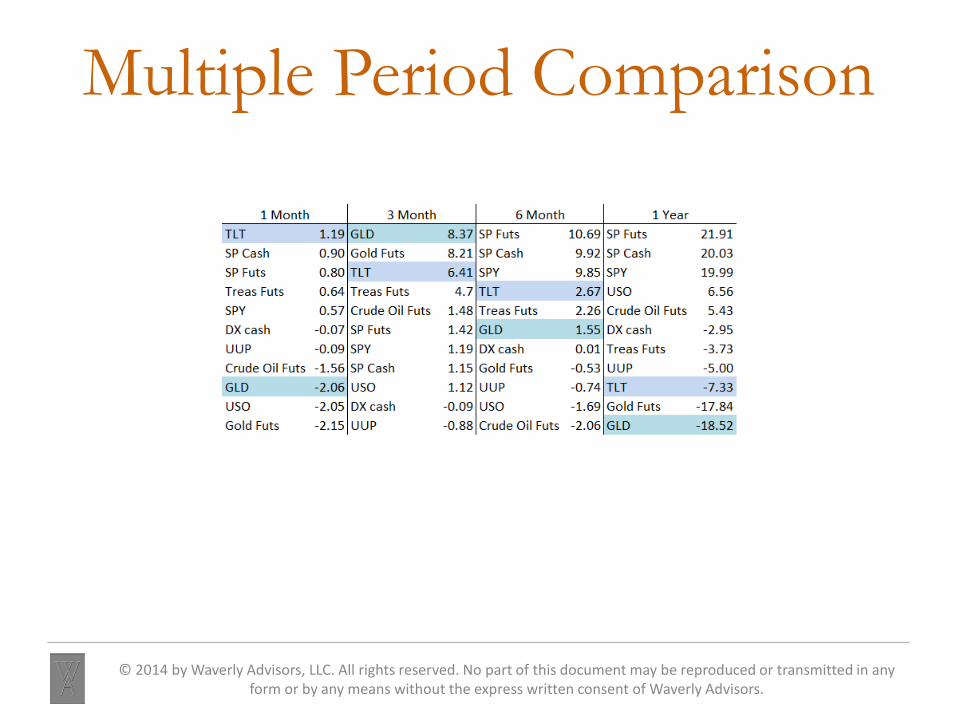
Multiple Period Comparison
© 2014 by Waverly Advisors, LLC. All rights reserved. No part of this document may be reproduced or transmitted in any form or by any means without the express written consent of Waverly Advisors.
Things to Think About Are you comparing apples to apples?
– Currency considerations.
Are you accounting for dividends, splits, and other corporate actions?
If you are using futures, do you understand the rolls? – Two methods: Differenced: Cannot use for returns or percentages. Ratio-adjusted: Can use for percentage measurements.
A return is a measurement over a specific time window. – It is sensitive to what happens on both ends of the time
window.
© 2014 by Waverly Advisors, LLC. All rights reserved. No part of this document may be reproduced or transmitted in any form or by any means without the express written consent of Waverly Advisors.

Possible Distortions
© 2014 by Waverly Advisors, LLC. All rights reserved. No part of this document may be reproduced or transmitted in any form or by any means without the express written consent of Waverly Advisors.

One Possible Solution Rather than use a simple measurement of return,
average several periods’ returns. – A good discussion can be found in O’Neil (William O’Neil:
How to Make Money in Stocks, 4th ed 2009), but many other authors use similar tools.
Many options: – Use as few as two or many more periods. – Weighted or unweighted. – Can implicitly weight by period selection: E.g., 1 week, 2 week, 1 month, 1 year is front weighted E.g., 1 month, 1 year, 1.5 year, 2 year is back weighted
© 2014 by Waverly Advisors, LLC. All rights reserved. No part of this document may be reproduced or transmitted in any form or by any means without the express written consent of Waverly Advisors.

Waverly Advisors’ Relative Strength We use a front-weighted multi-period relative
strength measure. Periods and calculation are proprietary, but there is
no secret sauce. – The measurement was crafted to be coherent with and to
support our trading style, not because it is better than any other.
We use this as an idea generation tool and as a filter for other trades.
© 2014 by Waverly Advisors, LLC. All rights reserved. No part of this document may be reproduced or transmitted in any form or by any means without the express written consent of Waverly Advisors.

Multi RS
© 2014 by Waverly Advisors, LLC. All rights reserved. No part of this document may be reproduced or transmitted in any form or by any means without the express written consent of Waverly Advisors.
Ranked RS The actual RS value may not be especially meaningful.
– This shouldn’t be surprising: relative strength!
Can simply compare a list of RS values to each other to get a RS ranking.
It is also possible to compare stocks relative to a stock universe.
We do this with a non-parametric ranking: – Create the raw RS measure for each stock in the S&P 500 – Create the raw RS measure for the test stock. – Express the test stock’s RS as a percentile of the S&P 500. Can also be outside the range of the S&P 500
© 2014 by Waverly Advisors, LLC. All rights reserved. No part of this document may be reproduced or transmitted in any form or by any means without the express written consent of Waverly Advisors.

Ranked RS in Our Research
© 2014 by Waverly Advisors, LLC. All rights reserved. No part of this document may be reproduced or transmitted in any form or by any means without the express written consent of Waverly Advisors.

In Our Research
© 2014 by Waverly Advisors, LLC. All rights reserved. No part of this document may be reproduced or transmitted in any form or by any means without the express written consent of Waverly Advisors.

Trading Relative Strength There are many academic papers on this subject, and
many of them are pretty accessible to the non-specialist.
Be aware that some of the research uses the term “momentum” in the way we understand relative strength. (Traders tend to use “momentum” differently.)
The basic concept is that the strongest markets tend to stay strong and the weakest weak.
© 2014 by Waverly Advisors, LLC. All rights reserved. No part of this document may be reproduced or transmitted in any form or by any means without the express written consent of Waverly Advisors.

Trading Relative Strength But it may not be that simple. Much research shows that naïve relative strength
strategies are not effective. – In general, academic research shows this, but whitepapers
written to support marketing of simple relative strength strategies take a more simplistic approach.
Mean reversion is the “enemy” of a relative strength strategy. – Buying the strongest and selling the weakest could leave
you exposed to mean reversion. – Several ways to compensate, but could begin by filtering
for overextension.
© 2014 by Waverly Advisors, LLC. All rights reserved. No part of this document may be reproduced or transmitted in any form or by any means without the express written consent of Waverly Advisors.

Filtering for Overextension When markets are stretched far from a moving
average, mean reversion is more likely. – Need to define “stretched far” – This tendency is different in different asset classes
Properly calibrated bands or channels are one way to quantify “stretch” from a moving average.
© 2014 by Waverly Advisors, LLC. All rights reserved. No part of this document may be reproduced or transmitted in any form or by any means without the express written consent of Waverly Advisors.
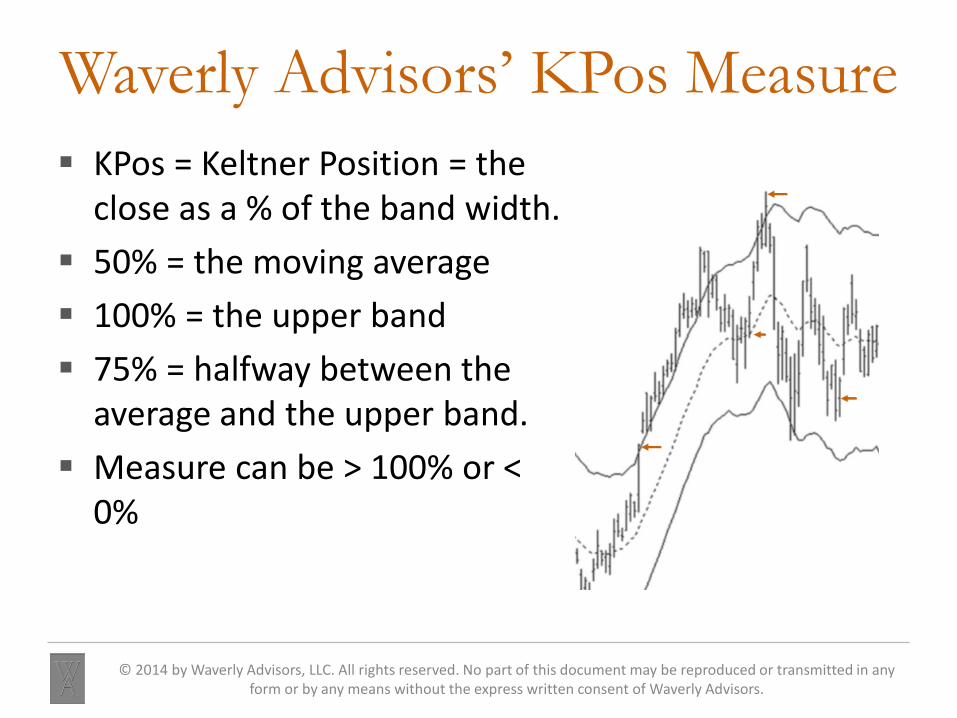
Waverly Advisors’ KPos Measure KPos = Keltner Position = the
close as a % of the band width. 50% = the moving average 100% = the upper band 75% = halfway between the
average and the upper band. Measure can be > 100% or <
0%
© 2014 by Waverly Advisors, LLC. All rights reserved. No part of this document may be reproduced or transmitted in any form or by any means without the express written consent of Waverly Advisors.

KPos in Waverly Advisors’ Research
© 2014 by Waverly Advisors, LLC. All rights reserved. No part of this document may be reproduced or transmitted in any form or by any means without the express written consent of Waverly Advisors.
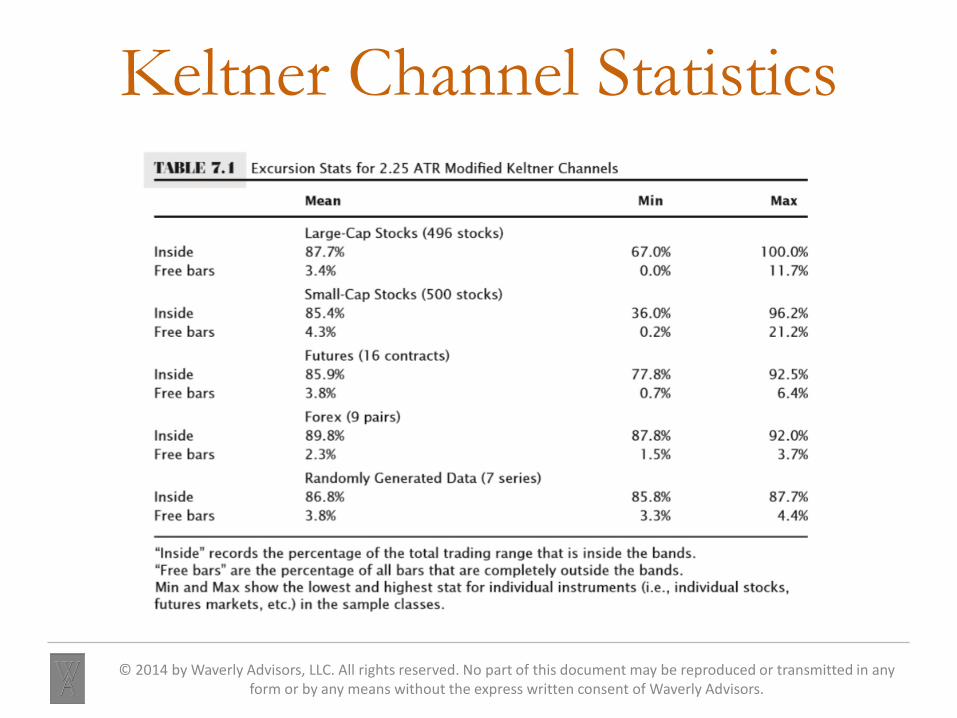
Keltner Channel Statistics
© 2014 by Waverly Advisors, LLC. All rights reserved. No part of this document may be reproduced or transmitted in any form or by any means without the express written consent of Waverly Advisors.

Keltner Excursion Stats
© 2014 by Waverly Advisors, LLC. All rights reserved. No part of this document may be reproduced or transmitted in any form or by any means without the express written consent of Waverly Advisors.

KPos as a Filter Since there is a statistical edge for mean reversion
when a market is outside the channels, one strategy would be to avoid buying or selling markets outside the bands.
This would lead to a strategy that is similar to trading pullbacks.
(Realize these tests work with a wide range of parameters. The concepts are much more important than the details.)
© 2014 by Waverly Advisors, LLC. All rights reserved. No part of this document may be reproduced or transmitted in any form or by any means without the express written consent of Waverly Advisors.
Another Way to Measure To measure the relationship of a market to an index
(or group of markets) calculate a spread. Spread = CloseSample / CloseReference
Can plot this as an “indicator” For instance, to see if a stock has out or under
performed the broad market
© 2014 by Waverly Advisors, LLC. All rights reserved. No part of this document may be reproduced or transmitted in any form or by any means without the express written consent of Waverly Advisors.

Relative Strength (to Market)
© 2014 by Waverly Advisors, LLC. All rights reserved. No part of this document may be reproduced or transmitted in any form or by any means without the express written consent of Waverly Advisors.

Relative Strength (to Market)
© 2014 by Waverly Advisors, LLC. All rights reserved. No part of this document may be reproduced or transmitted in any form or by any means without the express written consent of Waverly Advisors.

Trading a Spread Can also treat the spread measure as a synthetic
price series. Indicators can be calculated using the spread as an
input. When you analyze spreads you will see that some
mean-revert. – Until they don’t. Risk management is always key!
And some spreads trend. – Trending spreads were good relative strength trades. – How to find these in the future?
© 2014 by Waverly Advisors, LLC. All rights reserved. No part of this document may be reproduced or transmitted in any form or by any means without the express written consent of Waverly Advisors.

Consumer Disc / S&P 500
© 2014 by Waverly Advisors, LLC. All rights reserved. No part of this document may be reproduced or transmitted in any form or by any means without the express written consent of Waverly Advisors.

Perspective Matters
© 2014 by Waverly Advisors, LLC. All rights reserved. No part of this document may be reproduced or transmitted in any form or by any means without the express written consent of Waverly Advisors.

Sector RS in Waverly Advisors’ Research
© 2014 by Waverly Advisors, LLC. All rights reserved. No part of this document may be reproduced or transmitted in any form or by any means without the express written consent of Waverly Advisors.
Implementing Relative Strength Strategies
Use the information and ideas in this presentation as a departure point.
It is possible to create specific relative strength strategies. – Portfolio allocation models – Tactical trading systems
There is no magic bullet, but there are strong statistics behind these ideas. – Some of the strongest “anomalies” in published research
are relative strength/momentum-driven.
© 2014 by Waverly Advisors, LLC. All rights reserved. No part of this document may be reproduced or transmitted in any form or by any means without the express written consent of Waverly Advisors.

Using RS as a Filter “Top down” approaches identify broad markets and
then zero in on specific trading candidates. Example:
– Global stocks → Nation or region → Market cap → Sector – Then select individual names within the candidate sectors
Can use this concept with stocks, currencies, or commodities. – Make sure you understand structural issues in
commodities. E.g., some contract months represent different crops
and may have few fundamental connections.
© 2014 by Waverly Advisors, LLC. All rights reserved. No part of this document may be reproduced or transmitted in any form or by any means without the express written consent of Waverly Advisors.

Stock Screens Using RS
© 2014 by Waverly Advisors, LLC. All rights reserved. No part of this document may be reproduced or transmitted in any form or by any means without the express written consent of Waverly Advisors.

Summary Relative strength concepts are robust and are
supported by much research. There are several ways to measure RS. Understand the tradeoffs and potential issues. RS can be used as a stand-alone trading tool, or as a
filter to find trades. Though there are many ways to create these
calculations, some will serve certain purposes better than others.
© 2014 by Waverly Advisors, LLC. All rights reserved. No part of this document may be reproduced or transmitted in any form or by any means without the express written consent of Waverly Advisors.
© 2014 by Waverly Advisors, LLC. All rights reserved. No part of this document may be reproduced or transmitted in any form or by any means without the express written consent of Waverly Advisors.

Waverly Advisors’ Process Our methodology is blended quantitative / discretionary. Quantitative work was both high-level and system-
specific. – For breadth, our research went all the way back to commodity
prices in the Middle Ages. It works.
The discretionary component is the input of a trader (me!) who has spent nearly every day of the past 20 years watching markets and prices, actively managing risk for much of that time.
© 2014 by Waverly Advisors, LLC. All rights reserved. No part of this document may be reproduced or transmitted in any form or by any means without the express written consent of Waverly Advisors.

Waverly Advisors’ Research Specific systems, broad tendencies, and actionable
ideas in major liquid markets. – Futures – Currencies – Stocks (indexes and individual names)
Both trend-following and counter-trend components. Applicable to traders working on all timeframes.
– Daytraders—swing traders—investors
© 2014 by Waverly Advisors, LLC. All rights reserved. No part of this document may be reproduced or transmitted in any form or by any means without the express written consent of Waverly Advisors.

Waverly Advisors, LLC: Research Products
Tactical Playbook – Available on Interactive Brokers – Written for the active trader on the daily/weekly timeframes – Exact trade recommendations
Hybrid systematic-discretionary methodology – In-depth technical “drill down” into a set of markets. – Bigger-picture overview of all liquid asset classes.
Tactical Portfolio Outlook – Available on Interactive Brokers – Written for the longer-term manager
Addresses both the allocator and the longer-term active trader. – Emphasis on executing with ETFs in a long-only and long-short environment – Focus on Equities, Equity Sectors, and other asset classes – Macro perspective on risk factors and major economic events.
Options Market Outlook – Contact Waverly Directly – Proprietary, quantitative analysis of options market – Incorporates both volatility and directional analysis – Macro risk factors and cross-asset perspective – Actionable trade ideas
© 2014 by Waverly Advisors, LLC. All rights reserved. No part of this document may be reproduced or transmitted in any form or by any means without the express written consent of Waverly Advisors.

Contact:
© 2014 by Waverly Advisors, LLC. All rights reserved. No part of this document may be reproduced or transmitted in any form or by any means without the express written consent of Waverly Advisors.
Waverly Advisors 228 Cedar Street
Corning, NY 14830
(607) 684-5300
www.waverlyadvisors.com [email protected]
Adam Grimes CIO, Quantitative Analysis, Risk Management [email protected] Andrew Barber CEO, Macroeconomic Analysis [email protected] Chris Noye Managing Director, Head of Sales [email protected]
Related Documents