RELATIONSHIPS BETWEEN TEACHER SUPPLY AND DEMAND AND THE SIZE, SHAPE AND SUBSTANCE OF TEACHER EDUCATION IN SOUTH AFRICA Chief Directorate: Teaching and Learning Development Department of Higher Education and Training

Welcome message from author
This document is posted to help you gain knowledge. Please leave a comment to let me know what you think about it! Share it to your friends and learn new things together.
Transcript

RELATIONSHIPS BETWEEN TEACHER SUPPLY
AND DEMAND AND THE SIZE, SHAPE AND
SUBSTANCE OF TEACHER EDUCATION IN SOUTH
AFRICA
Chief Directorate: Teaching and Learning Development
Department of Higher Education and Training

2
FOREWORD
This report is the outcome of a comprehensive analysis undertaken to better understand the
current state of teacher supply and demand in South Africa, with specific reference to the role
that teacher education is playing and must play in the future to ensure a stable teacher supply-
demand environment in the country.
In particular, it is intended that the outcomes of the review will inform the plans of the
Department of Higher Education and Training to ensure that the public higher education
system is capable of producing adequate numbers of well-qualified and capable teachers, who
possess the right kind of teaching specialisations, and who are willing to teach in the range of
schools in South Africa.
The analysis uses both quantitative and qualitative data to provide a picture of teacher
education and the prevailing teacher supply-demand scenario in the country. Data are drawn
from a range of sources, and this increases the possibility of data error and in some ways
hides multiple assumptions that were made in collecting such data.
As such, the point is emphasised up front that the report is more useful in terms of the overall
patterns it illuminates rather than the actual figures it projects. It is these patterns that will be
used to shape policy and planning as we go forward.
It should also be pointed out that it is the first time that the DHET has undertaken a
comprehensive, cumulative, multivariate analysis such as this one, and there are bound to be
flaws, inconsistencies and shortcomings in the processes that have been used. This exercise
will be conducted regularly in the future, and these shortcomings will diminish as the process
becomes more and more refined, and as the data on which the process is based become more
reliable, and more easily available.
This report is not an official published report of the Department of Higher Education and
Training. Rather, it is a working document designed to inform planning discussions at the
range of teacher education planning forums in which the DHET participates. These include,
but are not limited to, the National Teacher Education and Development Committee, the
Provincial Teacher Education and Development Committees and the Education Deans
Forum. It should be noted that this document has also not been formally edited for language,
and has not been professionally laid out.
M Adendorff
B Mathebula
W Green
June 2015

3
A word of caution
The use of a wide range of data sources in this document is likely to give rise to some levelsof inaccuracy.
Likewise, the models used in this analysis have been developed by the authors, and they reston a wide range of assumptions.
The trends presented in this document should therefore be regarded as indicative rather thandefinitive.

4
TABLE OF CONTENTS
Page
List of Tables 7
List of Figures 8
Acronyms and Abbreviations 9
Introduction 11
Part 1: A brief history of South African teacher education provisioning post-
1994: waves of change
13
1.1 Proliferation and fragmentation 13
1.2 Restructuring teacher education 14
1.3 Declining teacher education enrolments 14
1.4 Renewed expansion 15
1.5 Recent growth in initial teacher education 19
Part 2: Using a multi-variate model to determine overall teacher supply and
demand patterns at the national and provincial level
21
2.1 A conceptual framework to underpin teacher supply-demand analysis 21
2.2 Applying the supply-demand model to the South African teacher supply-
demand context at a national level
24
2.2.1 Determining values for the demand-side variables 24
2.2.2 Determining values for the supply-side variables 29
2.3 Using the determined figures for the supply-demand variables in an
application of the model to determine the projected national teacher supply-
demand gap in 2020
33
2.4 Conclusion: No absolute shortage of teachers by 2020 35
2.5 An ageing educator workforce presents a problem in the near future 35
2.6 Expansion of initial teacher education 38
2.7 Increasing attrition through resignation 38
2.8 Teacher supply and demand at provincial level 38
5
Part 3: What are the shape imperatives in school teacher education? 41
3.1 National supply-demand analysis at the level of phases 41
3.1.1 Methodological challenges relating to supply-demand analysis at the
phase level
41
3.1.2 Applying a limited model to determine an indicative supply-demand
gap per school phase: replacement demand compared with new
teacher graduate supply
43
3.1.3 Mother tongue teaching in the Foundation Phase 46
3.2 National supply-demand analysis at the level of learning areas and subjects 48
3.2.1 Methodological challenges relating to supply-demand analysis at the
learning area/ subject level
48
3.2.2 Applying a limited model to determine an indicative supply-demand
gap per learning area/subject in the Senior and FET Phases:
replacement demand compared with new teacher graduate supply
51
Part 4: A focus on substance: What are the quality imperatives in school
teacher education?
59
4.1 Throughput and student success in teacher education programmes 59
4.2 The Council on Higher Education’s National Review of Academic and
Professional Programmes in Education
60
4.3 The Initial Teacher Education Research Project (ITERP) 63
4.4 Steps that have already been taken to address qualitative issues in initial
teacher education
64
Part 5: Summary of issues highlighted by this analysis that must be addressed
to improve the quality of education
66
5.1 Absolute and relative school teacher shortages 66
5.2 The age challenge 68
5.3 Accelerating resignations 68
5.4 The need for subject-based knowledge and practice standards 68
5.5 New teacher induction 69
5.6 The need to qualitatively strengthen the teaching practice and WIL 69

6
component of initial teacher education programmes
5.7 Inadequate or complete lack of focus on teachers for other education
contexts
69
5.8 The way forward 70
Bibliography 71
Appendices 77
Appendix 1: 2015 Verified Survey of former College of Education sites, per type of
current use (total 108)
77
Appendix 2: Replacement demand: National and provincial attrition data 80
Appendix 3: Replacement demand calculations (national) 81
Appendix 4: Data and calculations for Figure 5 – Serving teachers (national) by age
band
82
Appendix 5: Data and calculations for Figure 6A – Replacement demand per phase,
2012
83
Appendix 6: Data for Fig. 7 – Distribution of full-time equivalent new teacher
graduates (FTE NTGs) per school phase as percentages of total
NTGs, 2008–2012
84
Appendix 7: Estimated supply-demand gap in SP per Language as subject, 2012 85
Appendix 8: The teaching and Learning Development Capacity Improvement
Programme (TLDCIP)
86

7
LIST OF TABLES
Page
Table 1: Ring-fenced funding for new teacher education infrastructure allocated
to universities: Infrastructure and Efficiency Grant allocations, 2010 – 2015
18
Table 2:Teacher supply-demand: a multi-variate conceptual model 22
Table 3: Calculation of demand variables 25
Table 4: New teacher graduates 2013 – 2019, from public and private higher
education institutions
31
Table 5: Delayed/returning joiners, 2007 to 2012 32
Table 6: Teacher supply/demand projected to 2020 33
Table 7:Teacher supply and demand projected to 2020, restricted to more certain
supply variables
34
Table 8: The provincial teacher supply/demand situation by 2020 39
Table 9: Projected cumulative teacher supply-demand gap per province by 2020 40
Table 10: National teacher supply–demand gap per school phase, 2012 (Full-time
equivalent teachers used on both Supply and Demand sides)
44
Table 11: Supply-demand scenario based on the language distribution of the 2012
Foundation Phase ITE graduates
47
Table 12: Senior Phase learning areas (LAs): Supply-demand gap (national)
2012, based on time allocation per LA
52
Table 13: FET Phase subjects: Supply-demand gap (national) 2012, based on
estimated FET learner enrolments per subject
54
Table 14: FET subjects arranged in order of relative demand, compared with
relative size of the headcount supply (2012)
57
Table 15: Cohort analysis of 2005 Bachelor of Education (B Ed) intake in all
South African public universities: Percentage graduated
59
Table 16: Cohort analysis of 2005 Bachelor of Education (B Ed) intake in all
South African public universities: Percentage dropped out
60
Table 17: Outcomes of the CHE review of the B Ed and PGCE programmes at
universities
60

8
LIST OF FIGURES
Page
Figure 1: Structural logic that underpins the analysis and this report 11
Figure 2: Number of Funza Lushaka bursaries awarded (2007-2013) 17
Figure 3: Initial teacher education headcount enrolments and graduates from
2008 to 2013
19
Figure 4: Three largest attrition categories, 2005 – 2012: Resignation, deceased,
retirement
36
Figure 5: Retirement and non-retirement attrition in state-paid posts, projected to
2019
37
Figure 6:Serving teachers (national) by age band, 2010 – 2013 37
Figure 7: Replacement Demand vs New Teacher Graduate Supply, 2012 44
Figure 8: Distribution of full-time equivalent new teacher graduates (NTGs) per
school phase as percentages of total NTGs, 2008–2012, illustrative projections
45
Figure 9: Foundation Phase: Supply of NTGs per mother tongue (blue), and
supply-demand gap per mother tongue (red), 2012
48
Figure 10: Estimated supply-demand gap in Senior Phase per Language as
subject, 2012
53

9
ACRONYMS AND ABBREVIATIONS
ACE Advanced Certificate in Education
ADT Advanced Diploma in Teaching
ANC African National Congress
B Ed Bachelor of Education degree
CCERSA Council of College of Education Rectors, South Africa
CDE Centre for Development and Enterprise
CPTD Continuing Professional Teacher Development
DBE Department of Basic Education
DHET Department of Higher Education and Training
DoE Department of Education (National Department up to 2008)
DUT Durban University of Technology
ECD Early Childhood Education
EMIS Education Management Information System
ETDP SETA Education, Training and Development Practices Sector Education and
Training Authority
EU European Union
FET Further Education and Training
FP Foundation Phase
FTE Full-time equivalent (number of students)
HEI Higher Education Institution
HEMIS Higher Education Management Information System
ISPFTED Integrated Strategic Planning Framework for Teacher Education and
Development
IP Intermediate Phase

10
KZN KwaZulu-Natal
LER Learner : educator ratio
LoLT Language of Learning and Teaching
NPDE National Professional Diploma in Education
NPFTED National Policy Framework for Teacher Education and Development
NTG New teacher graduates
NSFAS National Student Financial Aid Scheme
PED Provincial Education Department(s)
PERSAL Personnel Salary Database
PGCE Postgraduate Certificate in Education
PMG Parliamentary Monitoring Group
PTEDC Provincial Teacher Education and Development Committee
REQV Relative Education Qualification Value
SACE South African Council for Educators
SARS South African Revenue Service
SP Senior Phase
TED Teacher Education and Development
TEI Teacher Education Institution
VC Vice Chancellor
11
INTRODUCTION
Teacher supply and demand is a key factor in ensuring quality education in the country. The
purpose of this document is to report on an analysis conducted to understand the impact
which the size, shape and substance of teacher education have on the teacher supply-demand
context in South Africa. The findings are intended to inform plans to address teacher
education and teacher supply-demand challenges in the country.
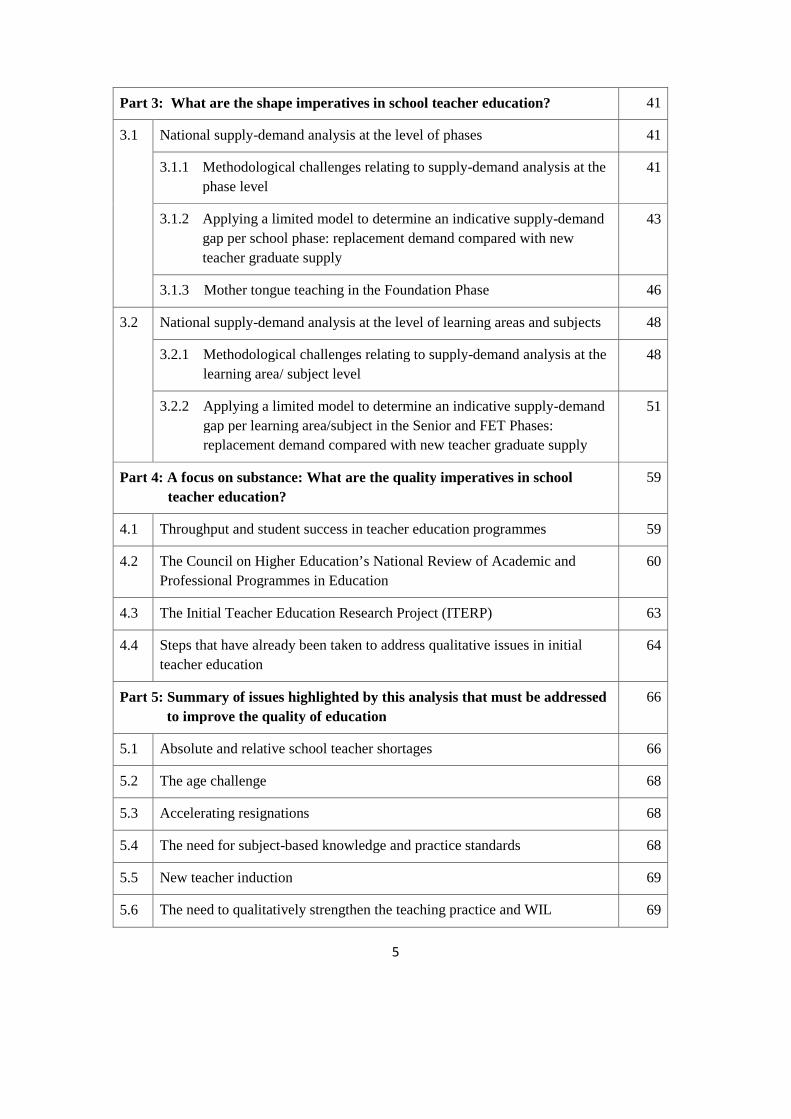
The diagram below thus represents the structural logic underpinning the analysis, this reportand the initiatives that must flow from it.
Figure 1: Structural logic that underpins the analysis and this report
An important part of the analysis involved the development and application of a multi-
variate, cumulative, predictive supply-demand model. The analysis also drew on the available
literature to identify qualitative challenges.
It is vital that any attempt to understand teacher education and teacher-supply demand issues
must consider the historical context, in particular the history of teacher education and teacher
utilisation in South Africa over the last sixty years or so. Part 1 of this document does this.
Part 2 describes the teacher supply-demand model which when applied, provides much of
the quantitative evidence on which the plan is based. Part 2 also uses the model to determine
overall teacher supply-demand patterns in the country at the national and provincial levels.
SIZE
QUALITYEDUCATION
The size of teacher education impacts on quality in the education sector.South Africa needs a teacher education system that is able to provide an
adequate number of new teachers to meet education system needs. This willprevent the need for unqualified people to be employed as teachers.
A full range of highquality teacher educationprogrammes needs to be
in place, delivered in amanner that will produceteachers who are able to
function effectively as newteachers in diverse South
African contexts.
The teacher education systemneeds to produce sufficientnumbers of teachers who areappropriately specialised interms of sector specialization,phase specialization andteaching subject specialization.This will help to preventteachers teaching in sectors,phases and subjects for whichthey are not qualified. SHAPE SUBSTANCE

12
Part 3 focuses on the shape of teacher education and the extent to which it matches the need
for teachers who are able to teach specific phases, and within these, specific subjects.
Part 4 will pull together evidence from a range of literature sources and studies that point to
the qualitative challenges regarding the substance or quality of teacher education.
Finally, Part 5 concludes by summarising the issues that the review has highlighted, issues
which will need to be attended to in order to achieve the goal of a stable teacher supply-
demand context in which there are sufficient well-qualified teachers holding phase and
subject specialisations that meet the needs of the schooling context.
13
PART 1: A BRIEF HISTORY OF SOUTH AFRICAN TEACHER EDUCATION
PROVISIONING POST-1994: WAVES OF CHANGE
It is widely accepted that effective teachers constitute the most crucial element in any attempt
to transform, improve or ensure the quality of, a schooling system. As the OECD puts it
(2005:7), “Of those variables potentially open to policy influence, factors to do with teachers
and teaching are the most important influences on student learning. In particular, the broad
consensus is that ‘teacher quality’ is the single most important variable influencing school
achievement.” Thus it is vitally important that the system in which teachers receive their
initial academic and professional post-school education is capable of producing teachers of
quality in sufficient numbers.
Any study on teacher supply and demand has to be located in the historical context of teacher
education in South Africa. A review of teacher education in South Africa over the last sixty
years highlights at least four distinct waves of change.
1.1 Proliferation and fragmentation
The introduction of apartheid education in the 1950s was accompanied over the subsequent
three decades by the establishment of over 100 teachers’ colleges in the “Bantu homelands”.
It was these, and a smaller number of earlier-established teachers’ training colleges (or
“colleges of education” as they all came to be called), which supplied the vast majority of
primary school teachers in South Africa. These were both an expression of the discriminatory
policy of separate (ethnic) “development”, and a source of prestige and political patronage for
homeland political leaders (DBE & DHET, 2011:19). Under apartheid the teacher education
sector as a whole was characterised by deep racial and regional inequality. Significant
disparities were evident among the colleges of education, between the majority of these
colleges and the more advantaged higher education institutions, and among the universities
themselves.
At the outset of the democratic era in South Africa, the governing party’s Policy Framework
for Education and Training (1994) followed the growing trend in both developed and
developing countries (Kruss, 2008:77) of seeing the higher education sector as the rightful
domain of teacher education. It also recognized that,
given the lack of uniformity and the absence of planning across the
teacher education sector, coupled with the uneven quality of inputs and
outputs, the under-utilisation of many college facilities, undemocratic
governance, and a stifling and uncritical ethos, the entire system of
teacher preparation and development needed to be reconstructed (ANC,
1994, cited in DBE/DHET, 2011a:19).
The 1995 National Teacher Education Audit found that although there were some “centres of
excellence”, the teacher education sector in general was inefficient and of poor quality,“

14
authoritarian and content-based”, and “the most expensive form of tertiary education” (to the
state), and that the failure rate was nevertheless high (Hofmeyr and Hall, 1995:52).
1.2 Restructuring teacher education
The new post-Apartheid government’s approach during its first half-decade (1994 -1999) was
characterised by a redistributional logic of restructuring, redeployment and retrenchment with
voluntary severance packages, aimed at equality and unifying the education system
(Chisholm, 2009a:xii). In terms of balancing teacher supply and demand, this approach
emphasised demand-side measures, culminating in the move to close colleges of education.
In 1996 the National Commission on Higher Education recommended that colleges of
education should be incorporated into existing higher education institutions. Following the
Education White Paper 3 on Higher Education (DoE 1997), a comprehensive technical
review of the colleges prepared the way for transferring colleges from provincial to national
jurisdiction.
The provinces had already begun rationalising, amalgamating and restructuring the colleges
of education under their administration, when, in 2000, 25 of the more than 100 colleges of
education were identified for incorporation as subdivisions of various universities and
technikons, and thus for becoming a national responsibility. However, only 14of these were
eventually taken up into higher education institutions; 45, on the other hand, have been
utilised as TVET college campuses1, now also a national responsibility under the
administration of the Department of Higher Education and Training. The remainder of the
college of education campuses were retained by the provinces, many of them becoming
schools (15) or sites for continuing professional teacher development or other education-
related delivery sites (9). A number (15) have been used to house provincial or district
education offices or other government departments.2
During the early years of the new millennium, a much larger process of merging and
restructuring took place among the 32 universities and technikons (the majority of which had
taken over responsibility for teacher education from the colleges), resulting, by 2004, in a
reduced total of 23 universities.
1.3 Declining teacher education enrolments
The first half-decade of democracy, which had seen an emphasis on redistribution and
restructuring in education, was followed by a period (1999-2004)3 in which the previous five
years’ research and policies relating to teacher supply and demand took effect. A range of
1 Many of these are branch campuses of larger TVET (formerly FET) colleges.2 Appendix 1: “Survey of former College of Education sites” contains the most recent information on the current
status of the former teacher education college sites.3 This periodisation is based on Chisholm (2009a: xii-xiii).
15
factors, including the closure of colleges of education and the transfer of teacher education to
the universities, resulted in diminishing student enrolments. By 2000, enrolment in initial
teacher education contact programmes had already declined sharply from 70 731 (in 1994) to
10 153 (Vinjevold, 2001:8, citing a CCERSA report of 2000), and this decline continued until
about 2005. When the colleges of education closed, there was hardly any overflow of
students into the higher education system (Paterson and Arends, 2008:283). Around 2005,
concern about teacher supply began to grow in the light of the dwindling enrolments in
teacher education, the effect of the HIV/AIDS pandemic on educator workforce numbers, and
teacher migration. A number of factors contributed to this declining enrolment:
Though university fees were far higher than those at the former colleges, state teacher
education bursaries ceased. Furthermore, because universities were more centralised,
they were less accessible to many young people, especially those from rural areas. The more stringent entrance requirements at universities meant that many students who
would formerly have been able to study at teacher colleges were unable to qualify for
admission to universities (Mda and Erasmus, 2008:44). Because most college of education staff remained provincial employees, the provincial
college of education salary and maintenance funding was not transferred to the
universities, which were faced with having to carry out additional functions without the
additional funds. Many college lecturers did not have the necessary qualifications to teach in higher
education. This impacted on lecturer availability, particularly for Foundation Phase and
Intermediate Phase teacher education, leading to the relative neglect of these sectors. The redistributional and rationalisation policies of the late nineties – offering severance
packages and redeploying teachers, while it was aimed at equality and at unifying the
education system, had resulted in many teachers opting for retrenchment (Chisholm,
2009a). This projected a message that the teaching profession was not a wise choice of
career for school-leavers. In addition, an increasing variety of alternative career possibilities was beginning to open
up at the time for Africans, both males and females (Paterson and Arends, 2008:286).
1.4 Renewed expansion
In the wake of teacher education becoming a higher education responsibility, projections of
teacher oversupply, and the numbers of initial teacher education students in decline,
universities began to focus more strongly on upgrading and re-skilling teachers already in
service.
Continuing professional development (CPD) programmes such as the National Professional
Diploma in Education (NPDE), the Advanced Certificate in Education (ACE) and the B Ed
(Honours) expanded rapidly across the system. As a result of this focus, the proportion of
unqualified and or under-qualified teachers in service, which had increased from 11% to 36%

16
between 1975 and 1994, dropped to 22% by 2000, to 8.3% by 2004 (Crouch and Perry, 2003;
ETDP SETA, 2005), and to 5% by 2012 (DBE, 2012b).
This focus also resulted in a teacher education system that increasingly became skewed
towards continuing teacher education enrolments over initial teacher education enrolments.
From about 2005, however, both research and state policy began to shift in a somewhat
different direction, to an emphasis on supply-side measures and expansion, and attempts to
stabilise the teacher labour market and produce more new teachers. In 2005, Peltzer et al.
reported (p 104): “Demand-side policy tools ... have been reported to be less effective than
supply-side policy tools”.
A number of research studies began warning of teacher shortages. It was pointed out that the
teacher oversupply had run its course, that the teaching profession was an ageing one, and
that South Africa was in need not only of upgraded, better-qualified teachers already in
service, but also of a supply of newly graduated teachers (Peltzer et al., 2005; Mda and
Erasmus, 2008; Paterson and Arends, 2008; Reeves, 2009).These studies paved the way for a
move beyond the redistributional thinking and policies of the earlier post-apartheid period, to
tackling expansion and supply-side problems through different means, without losing focus
on quality.
In 2005 a Ministerial Committee on Teacher Education highlighted that the universities were
finding it increasingly difficult to recruit ITE students, and losing the capacity to offer quality
ITE programmes. It also warned that an “unmanaged” situation in which the supply of
teachers was a national responsibility while “demand” was essentially a provincial matter,
made it very difficult to forecast teacher demand, or to plan for supply and utilisation.
Following the release of the National Policy Framework for Teacher Education and
Development in South Africa – with the by-line: “More teachers, better teachers” (NPFTED,
DoE, 2007) – a teacher recruitment campaign was instituted, and the full-cost national Funza
Lushaka Bursary Scheme for teacher education was established to enable academically
capable students to become teachers in priority areas of need. Full-cost, merit-based bursaries
are available to enable students to complete a teaching qualification in an area of national
priority, in return for teaching at a public school for the same number of years as they have
received the bursary (which they have to repay if they choose not to teach). They may choose
the province in which they wish to teach, but not the school. Managed by the Department of
Basic Education, the Funza Lushaka bursary programme’s allocation from National Treasury
increased from R109.7 million in 2007 to R893.9 million in 2013, which enabled 14 513
bursaries to be awarded in that year (see Fig. 2 – information supplied by DBE, 16 April
2014).

17
Figure 2: Number of Funza Lushaka bursaries awarded (2007-2013)
Source: Information supplied by DBE Initial Teacher Education Directorate
It should be noted that the Funza Lushaka bursary on average accounts for the funding of
about 25% of the students registered for an initial teaching qualification at public universities
in South Africa in any given year. Initial teacher education students are also supported
through the National Student Financial Aid Scheme (NSFAS). NSFAS disbursed over
R37million in earmarked funds to 8 509 economically disadvantaged teacher education
students in 1996, rising to R113.97 million for this purpose in 2012, and dropping to R103.58
million in 2013.
In 2011, the Integrated Strategic Planning Framework for Teacher Education and
Development in South Africa (ISPFTED) was launched, the fruit of two years of
collaboration among all the relevant stakeholders at national, provincial and local levels. This
framework currently guides the collective efforts of the Department of Basic Education
(DBE), the Department of Higher Education and Training (DHET)4, the provincial Education
Departments and the universities to address teacher education and development challenges,
including mismatches between teacher supply and demand, in certain provinces, school
phases and subjects.
Specifically, Output 4 of the ISPFTED indicates that “an expanded and accessible formal
teacher education system that both develops practising teachers and produces sufficient
numbers of new, quality teachers with the specialised and differentiated competences that are
required by the schooling system will be established.”
To this end, three strategies are identified to lead to Output 4:
4 The national Department of Education was split into the two above-named departments in 2009.
3 669
5 189
9 190
10 073
8 716
11 456
14 513
0
2000
4000
6000
8000
10000
12000
14000
16000
2007 2008 2009 2010 2011 2012 2013
18
Ensuring that the current teacher education capacity at existing universities is maximally
utilised, chiefly through the enrolment planning process. Establishing new teacher education institutions where appropriate, and supporting new
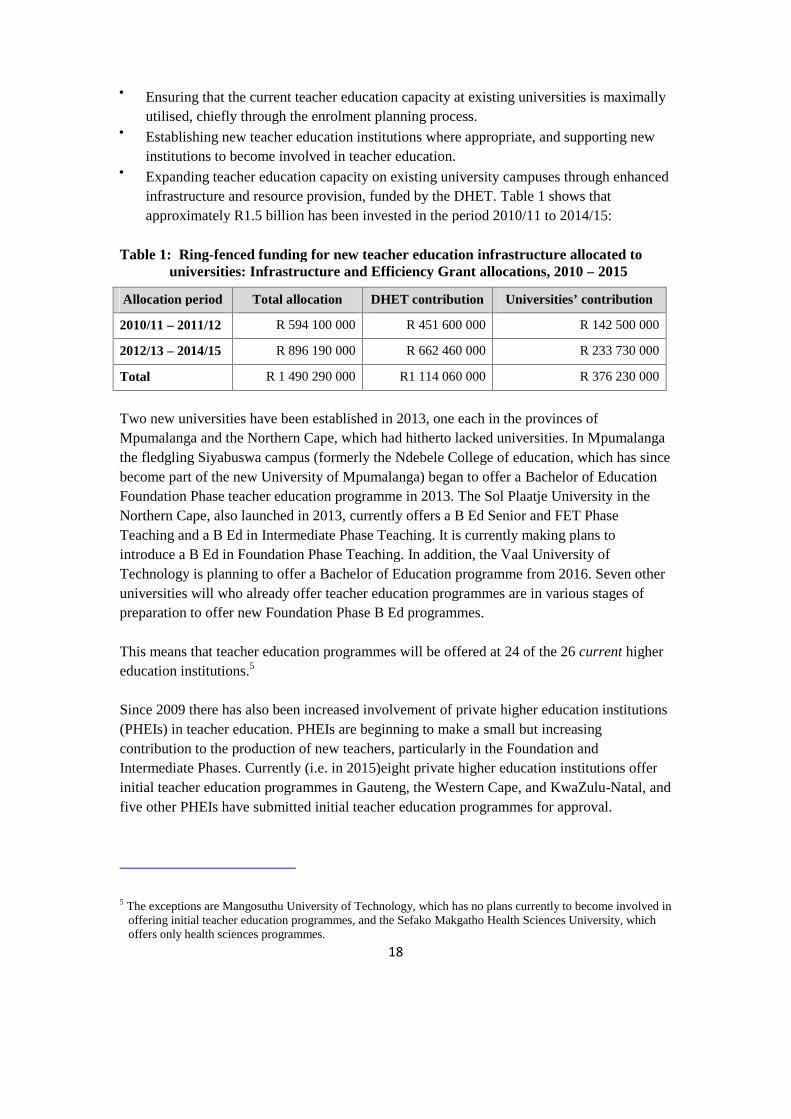
institutions to become involved in teacher education. Expanding teacher education capacity on existing university campuses through enhanced
infrastructure and resource provision, funded by the DHET. Table 1 shows that
approximately R1.5 billion has been invested in the period 2010/11 to 2014/15:
Table 1: Ring-fenced funding for new teacher education infrastructure allocated touniversities: Infrastructure and Efficiency Grant allocations, 2010 – 2015
Allocation period Total allocation DHET contribution Universities’ contribution
2010/11 – 2011/12 R 594 100 000 R 451 600 000 R 142 500 000
2012/13 – 2014/15 R 896 190 000 R 662 460 000 R 233 730 000
Total R 1 490 290 000 R1 114 060 000 R 376 230 000
Two new universities have been established in 2013, one each in the provinces of
Mpumalanga and the Northern Cape, which had hitherto lacked universities. In Mpumalanga
the fledgling Siyabuswa campus (formerly the Ndebele College of education, which has since
become part of the new University of Mpumalanga) began to offer a Bachelor of Education
Foundation Phase teacher education programme in 2013. The Sol Plaatje University in the
Northern Cape, also launched in 2013, currently offers a B Ed Senior and FET Phase
Teaching and a B Ed in Intermediate Phase Teaching. It is currently making plans to
introduce a B Ed in Foundation Phase Teaching. In addition, the Vaal University of
Technology is planning to offer a Bachelor of Education programme from 2016. Seven other
universities will who already offer teacher education programmes are in various stages of
preparation to offer new Foundation Phase B Ed programmes.
This means that teacher education programmes will be offered at 24 of the 26 current higher
education institutions.5
Since 2009 there has also been increased involvement of private higher education institutions
(PHEIs) in teacher education. PHEIs are beginning to make a small but increasing
contribution to the production of new teachers, particularly in the Foundation and
Intermediate Phases. Currently (i.e. in 2015)eight private higher education institutions offer
initial teacher education programmes in Gauteng, the Western Cape, and KwaZulu-Natal, and
five other PHEIs have submitted initial teacher education programmes for approval.
5 The exceptions are Mangosuthu University of Technology, which has no plans currently to become involved inoffering initial teacher education programmes, and the Sefako Makgatho Health Sciences University, whichoffers only health sciences programmes.

19
1.5 Recent growth in initial teacher education
The initiatives outlined in the previous section, combined with strategies linked to the
NPFTED such as the Funza Lushaka Bursary Scheme, have contributed (see Figure 3 below)
to a 280% increase in headcount enrolments in initial teacher education in the country’s
public universities(from 35 275 in 2008 to 104 000 in 2013). Likewise, the supply of new
teacher graduates from South Africa’s public universities increased from 5 939 new teachers
in 2008 to 16 555 in 2013, representing a 178% growth over the period.
Figure 3: Initial teacher education headcount enrolments and graduates from 2008 to2013
Source: DHET, Trends in Teacher Education 2008, HEMIS 2013
However, it would be over-simplifying the issue to maintain that the teacher supply/demand
question is merely a matter of matching overall teacher supply to demand nationally, or even
simply a question of numbers. As Chisholm has argued, the question of teacher shortage has
qualitative as well as quantitative dimensions (2009b:18). Indeed, empirical shortages in
terms of actual teaching vacancies often do not manifest themselves as such in practice.
Teacher utilisation issues such as the employment of unqualified and under-qualified
teachers, out-of-field teaching, unreasonably increased teaching load (teachers responsible for
very large classes or too many classes), schools offering very limited FET curriculum choices
– all these local practices in fact obscure actual teacher shortages (i.e. a hidden demand). As
Santiago points out (2002:21), somehow a way is usually found to make sure that there is a
teacher in every classroom, often referred to as ensuring a ‘warm body’ is in place, but
measures like these fail to deal with fundamental longer-term shortages, and all of them are
likely to result in a decline in quality.
35 275
45 474
59 434
79 236
94 236
104 000
5 939 6 855 7 973 10 593 13 702 16 555
0
20000
40000
60000
80000
100000
120000
2008 2009 2010 2011 2012 2013
Enrolments Graduates

20
Furthermore, there are issues of quality and substance in terms of the supply of teacher
graduates as well. It would not benefit learners in classrooms if the supply of new teachers
were boosted by allowing them to enter the profession with inadequate preparation, via
inferior programmes or other academic shortcuts. Questions have recently been raised about
some of the National Professional Diploma in Education programmes in this regard, although
these questions will need to be tested by empirical research.

21
PART 2: USING A MULTI-VARIATE MODEL TO DETERMINE OVERALL
TEACHER SUPPLY AND DEMAND PATTERNSAT THE NATIONAL AND
PROVINCIAL LEVEL
2.1 A conceptual framework to underpin teacher supply-demand analysis
A multivariate approach (Marchant and Lautenbach, 2011) is needed to understand teacher
supply-demand more accurately. All the variables that have, or could in the future have a
significant bearing on supply and demand, need to be identified, quantified as accurately as
possible, and factored into the supply-demand model. Where quantification is not possible for
specific variables, or where there may be questions about the reliability of the data, their
potential effect on supply and demand should be spelt out, and the reasons for omitting them
and the impact thereof on the analysis must be made explicit. Likewise, the assumptions that
underpin the quantification of variables need to be stated explicitly, and their impact on the
analysis explained.
A teacher supply-demand model must take account of demand variables which determine
the number of teachers needed in the system in any particular year, (conceptualised as job
openings) and supply variables which determine the number of teachers available for
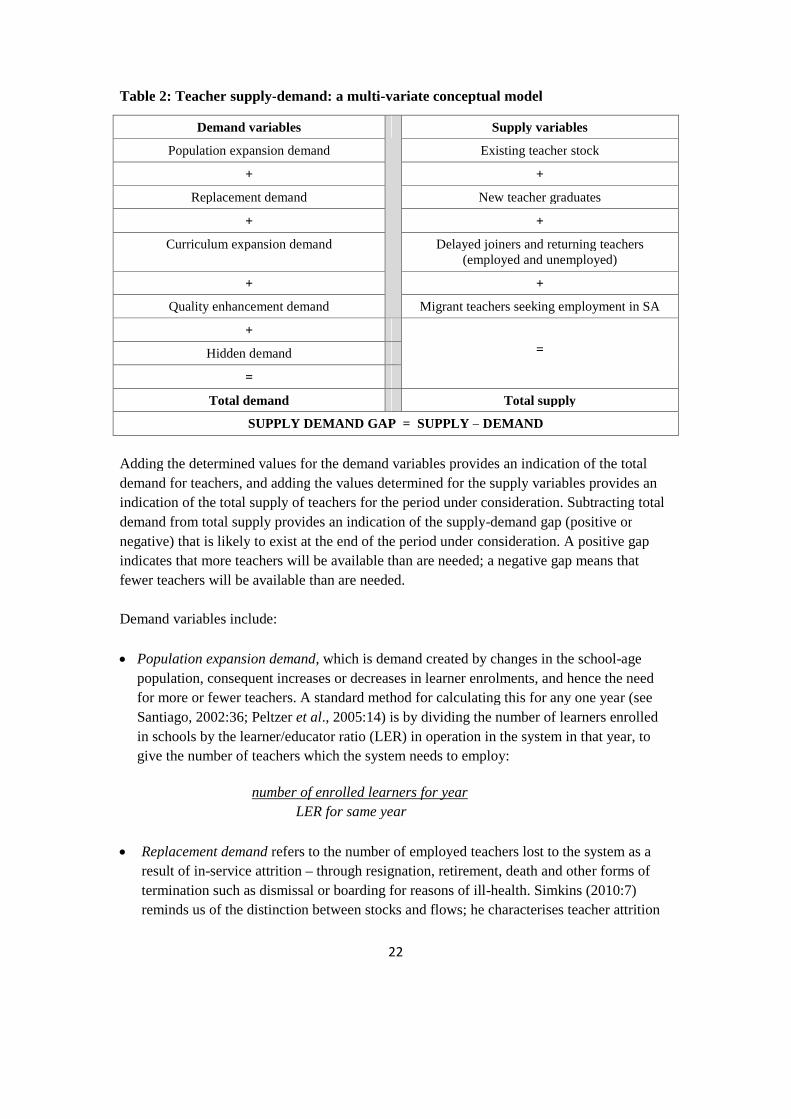
employment in the system(conceptualised as job holders and qualified job seekers). Table 2
below provides an overview of a teacher supply-demand model which takes account of a
range of supply-demand variables.
The model is:
multivariate in that it takes account of as many of the variables as possible that have
an impact on supply and demand;
predictive in that it predicts what the supply-demand gap would be at some point in
the future;
cumulative in that it considers the combined effect of the variable under consideration
over the number of years leading up to the projected year; and
able to accommodate data at various levels of disaggregation, for instance at
provincial as well as national level, and, to the extent that available data make it
possible, at the level of teachers’ school phase and subject specialisations.
22
Table 2: Teacher supply-demand: a multi-variate conceptual model
Adding the determined values for the demand variables provides an indication of the total
demand for teachers, and adding the values determined for the supply variables provides an
indication of the total supply of teachers for the period under consideration. Subtracting total
demand from total supply provides an indication of the supply-demand gap (positive or
negative) that is likely to exist at the end of the period under consideration. A positive gap
indicates that more teachers will be available than are needed; a negative gap means that
fewer teachers will be available than are needed.
Demand variables include:
Population expansion demand, which is demand created by changes in the school-age
population, consequent increases or decreases in learner enrolments, and hence the need
for more or fewer teachers. A standard method for calculating this for any one year (see
Santiago, 2002:36; Peltzer et al., 2005:14) is by dividing the number of learners enrolled
in schools by the learner/educator ratio (LER) in operation in the system in that year, to
give the number of teachers which the system needs to employ:
number of enrolled learners for year
LER for same year
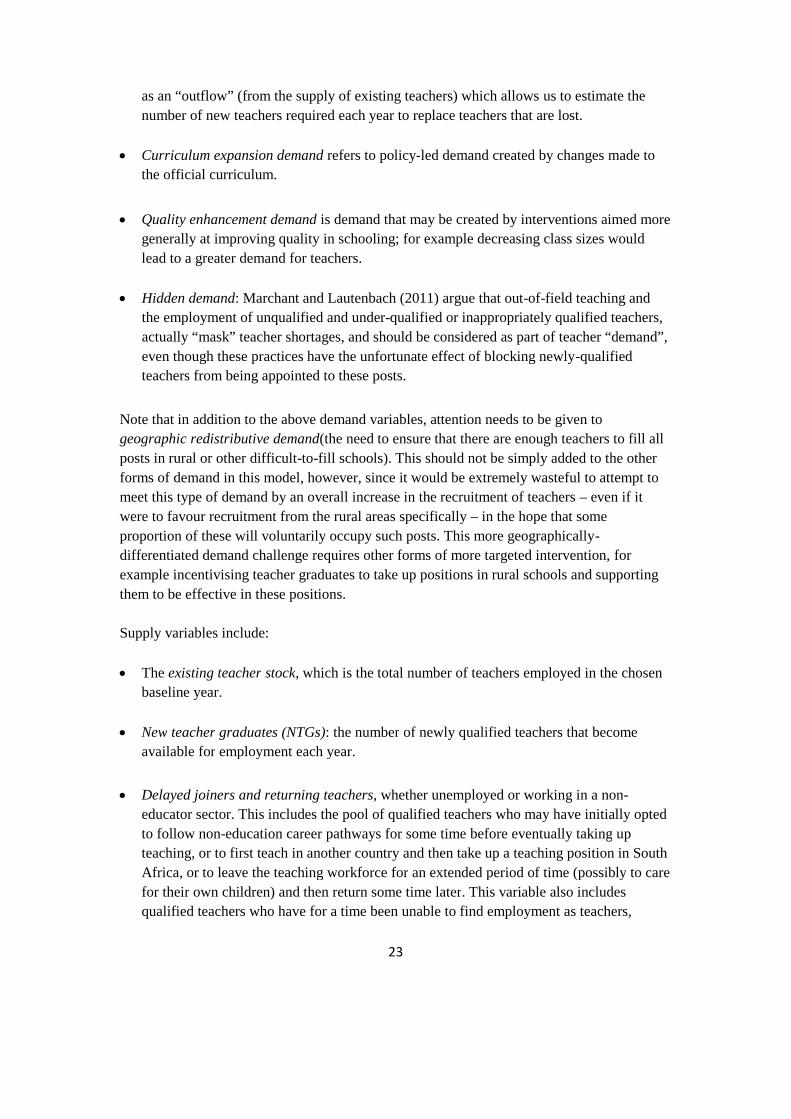
Replacement demand refers to the number of employed teachers lost to the system as a
result of in-service attrition – through resignation, retirement, death and other forms of
termination such as dismissal or boarding for reasons of ill-health. Simkins (2010:7)
reminds us of the distinction between stocks and flows; he characterises teacher attrition
Demand variables Supply variables
Population expansion demand Existing teacher stock
+ +
Replacement demand New teacher graduates
+ +
Curriculum expansion demand Delayed joiners and returning teachers(employed and unemployed)
+ +
Quality enhancement demand Migrant teachers seeking employment in SA
+
=Hidden demand
=
Total demand Total supply
SUPPLY DEMAND GAP = SUPPLY – DEMAND
23
as an “outflow” (from the supply of existing teachers) which allows us to estimate the
number of new teachers required each year to replace teachers that are lost.
Curriculum expansion demand refers to policy-led demand created by changes made to
the official curriculum.
Quality enhancement demand is demand that may be created by interventions aimed more
generally at improving quality in schooling; for example decreasing class sizes would
lead to a greater demand for teachers.
Hidden demand: Marchant and Lautenbach (2011) argue that out-of-field teaching and
the employment of unqualified and under-qualified or inappropriately qualified teachers,
actually “mask” teacher shortages, and should be considered as part of teacher “demand”,
even though these practices have the unfortunate effect of blocking newly-qualified
teachers from being appointed to these posts.
Note that in addition to the above demand variables, attention needs to be given to
geographic redistributive demand(the need to ensure that there are enough teachers to fill all
posts in rural or other difficult-to-fill schools). This should not be simply added to the other
forms of demand in this model, however, since it would be extremely wasteful to attempt to
meet this type of demand by an overall increase in the recruitment of teachers – even if it
were to favour recruitment from the rural areas specifically – in the hope that some
proportion of these will voluntarily occupy such posts. This more geographically-
differentiated demand challenge requires other forms of more targeted intervention, for
example incentivising teacher graduates to take up positions in rural schools and supporting
them to be effective in these positions.
Supply variables include:
The existing teacher stock, which is the total number of teachers employed in the chosen
baseline year.
New teacher graduates (NTGs): the number of newly qualified teachers that become
available for employment each year.
Delayed joiners and returning teachers, whether unemployed or working in a non-
educator sector. This includes the pool of qualified teachers who may have initially opted
to follow non-education career pathways for some time before eventually taking up
teaching, or to first teach in another country and then take up a teaching position in South
Africa, or to leave the teaching workforce for an extended period of time (possibly to care
for their own children) and then return some time later. This variable also includes
qualified teachers who have for a time been unable to find employment as teachers,
24
whether directly after having graduated or later in their careers following a break in
service.
Immigrant teachers are teachers from other countries who are eligible for, and who seek
employment as teachers in South Africa.
2.2 Applying the supply-demand model to the South African teacher supply-
demand context at a national level
The analysis of teacher supply and demand presented here takes into account the impact of
the range of variables for the years 2012 -2020, with 2012 taken as the baseline year, and the
supply-demand gap projected for the year 2020. The year 2012 is chosen as the baseline year
because it is the most recent year for which reliable, audited data are available for the
variables considered in the model, and 2020 is chosen as the projection year because new
teacher graduate projections have been set up to 2019 as part of the process of finalising the
Ministerial Statement on Universities Enrolment Planning 2015-2019 (DHET, 2014), and the
initial teacher education graduate targets set in this enrolment plan will be the new teachers
who will be available to fill vacant positions between 2015 and 2020.
2.2.1 Determining values for the demand-side variables
Table 3on the following page has been generated to provide display information that
illustrates how the demand side variables taken into account in the analysis were calculated.

25
Table 3: Calculation of demand variables
(A)
Year
note 2(B)
Learner
enrolments,
RSA (LE) -
projected
enrolments
from 2013
note 3(C) LER
(projected
from 2013
on last
known LER,
i.e. for 2012)
note 4(D)
Calculated
number of
teachers in
service
(LE/LER, i.e.
col. B /col. C)
note 5(E)Teachers
retired in all
ordinary schools,
adjusted for
private schools
and SGB posts -
projected to 2019
note 5 (F)Non-
retirement attrition
in all ordinary
schools, adjusted
for private schools
& SGB posts -
projected to 2019
note 5 (G) Total
attrition, adjusted
for SGB and
independent
school posts,
projected to 2019
(col. E + col. F)
(H) Attrition rate if
increasing
retirement rate is
factored in, and
allowance made for
SGB and private
sch. posts (%)
2008 12 179 213 30.5 399 318 2 865 9 584 12 449 3.12
2009 12 168 217 29.6 411 088 3 969 9 248 13 217 3.21
2010 12 203 039 29.3 416 486 4 164 8 193 12 356 2.97
2011 12 226 525 29.2 418 717 5 516 9 663 15 178 3.62
2012 12 369 632 29.2 note 6 423 618 6 909 9 920 16 830 3.97
2013 12 361 069 29.2 423 324 7 022 10 590 17 612 4.16
2014 12 404 984 29.2 424 828 7 849 11 030 18 879 4.44
2015 12 448 898 29.2 426 332 8 318 11 520 19 838 4.65
2016 12 492 813 29.2 427 836 9 081 12 000 21 081 4.93
2017 12 536 727 29.2 429 340 9 948 12 460 22 408 5.22
2018 12 580 642 29.2 430 844 10 861 12 945 23 806 5.53
2019 12 624 557 29.2 432 348 11 681 13 400 25 081 5.80
2020 12 668 471 29.2 note 7433 852
Total attrition, RSA 2013-2019 64 759 83 945 note 8148 704
26
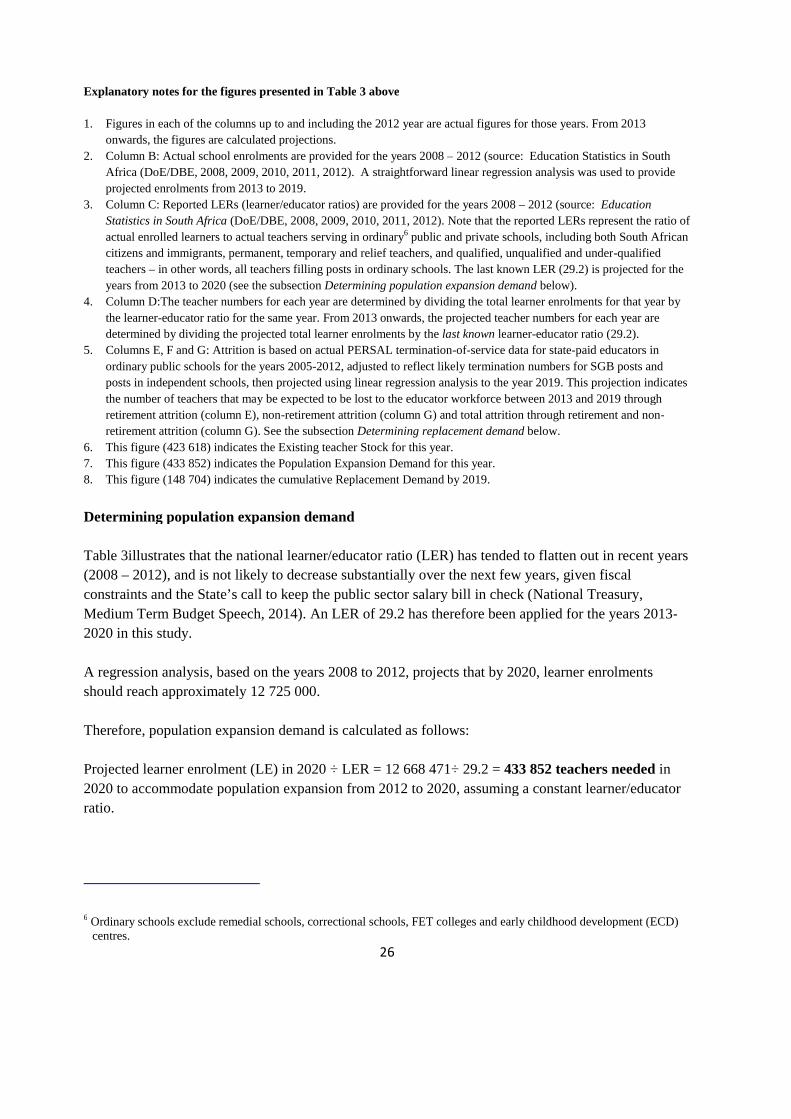
Explanatory notes for the figures presented in Table 3 above
1. Figures in each of the columns up to and including the 2012 year are actual figures for those years. From 2013
onwards, the figures are calculated projections.
2. Column B: Actual school enrolments are provided for the years 2008 – 2012 (source: Education Statistics in South
Africa (DoE/DBE, 2008, 2009, 2010, 2011, 2012). A straightforward linear regression analysis was used to provide
projected enrolments from 2013 to 2019.
3. Column C: Reported LERs (learner/educator ratios) are provided for the years 2008 – 2012 (source: Education
Statistics in South Africa (DoE/DBE, 2008, 2009, 2010, 2011, 2012). Note that the reported LERs represent the ratio of
actual enrolled learners to actual teachers serving in ordinary6 public and private schools, including both South African
citizens and immigrants, permanent, temporary and relief teachers, and qualified, unqualified and under-qualified
teachers – in other words, all teachers filling posts in ordinary schools. The last known LER (29.2) is projected for the
years from 2013 to 2020 (see the subsection Determining population expansion demand below).
4. Column D:The teacher numbers for each year are determined by dividing the total learner enrolments for that year by
the learner-educator ratio for the same year. From 2013 onwards, the projected teacher numbers for each year are
determined by dividing the projected total learner enrolments by the last known learner-educator ratio (29.2).
5. Columns E, F and G: Attrition is based on actual PERSAL termination-of-service data for state-paid educators in
ordinary public schools for the years 2005-2012, adjusted to reflect likely termination numbers for SGB posts and
posts in independent schools, then projected using linear regression analysis to the year 2019. This projection indicates
the number of teachers that may be expected to be lost to the educator workforce between 2013 and 2019 through
retirement attrition (column E), non-retirement attrition (column G) and total attrition through retirement and non-
retirement attrition (column G). See the subsection Determining replacement demand below.
6. This figure (423 618) indicates the Existing teacher Stock for this year.
7. This figure (433 852) indicates the Population Expansion Demand for this year.
8. This figure (148 704) indicates the cumulative Replacement Demand by 2019.
Determining population expansion demand
Table 3illustrates that the national learner/educator ratio (LER) has tended to flatten out in recent years
(2008 – 2012), and is not likely to decrease substantially over the next few years, given fiscal
constraints and the State’s call to keep the public sector salary bill in check (National Treasury,
Medium Term Budget Speech, 2014). An LER of 29.2 has therefore been applied for the years 2013-
2020 in this study.
A regression analysis, based on the years 2008 to 2012, projects that by 2020, learner enrolments
should reach approximately 12 725 000.
Therefore, population expansion demand is calculated as follows:
Projected learner enrolment (LE) in 2020 ÷ LER = 12 668 471÷ 29.2 = 433 852 teachers needed in
2020 to accommodate population expansion from 2012 to 2020, assuming a constant learner/educator
ratio.
6 Ordinary schools exclude remedial schools, correctional schools, FET colleges and early childhood development (ECD)centres.

27
Determining replacement demand
Annual attrition data were based on the PERSAL termination database, which is limited to state-paid
posts in public schools. The termination data were filtered to exclude non-school-based educators,
temporary teachers and relief (substitute) teachers. The contracts of the latter two categories are
subject to expiry and renewal on an ongoing basis, thus such contract expiry does not in fact constitute
attrition, since the teachers concerned are not actually exiting the system or depleting the teaching
stock. Permanent teachers who for various reasons leave the service and almost immediately re-join
were also eliminated as far as possible.
The PERSAL termination numbers were then adjusted proportionately to reflect attrition among
teachers occupying school governing body (SGB) posts and independent school posts (see Appendix 3).
Neither national nor provincial records are kept of teachers in SGB post and independent school posts
who leave the system. It is not assumed that the attrition rates in these latter categories would be the
same as those evident among teachers in state-paid posts. However, in view of the absence of any data
on teacher attrition for SGB posts and independent schools posts, there is little choice but to estimate
these on the basis of proportionate adjustments. In the case of SGB posts, the adjustment is
proportionate to the annually-varying ratio between teachers in state-paid posts and teachers in SGB
posts, both in public schools, for example 86.7:13.3 in 2012 (the ratio based on actual annual figures of
teachers in SGB posts supplied by EMIS). In the case of teachers in independent schools, the adjustment
is based on the proportion of educators in independent schools to educators in all schools, expressed as a
percentage (based on figures supplied by EMIS in Education Statistics in South Africa, 2005-2012,
Tables 1 and 2). Any distortion of overall attrition that may result will be relatively small, since slightly
under 20% of serving teachers currently occupy SGB or independent school posts.
Gustafsson’s PERSAL-based study (2009) found that the attrition rate for state-paid teachers in the
public school system between 2004 and 2007 was in the region of 3%, after taking account of recurrent
leavers-and-joiners. This trend continued from 2008 to 2012, when the PERSAL attrition rate (i.e. for
state-paid posts) averaged 2.76%. However, as Columns G and H in Table 3 earlier indicate, this
relatively constant attrition rate has begun to rise, and is projected to rise significantly towards 2019
and beyond, driven up by an accelerating retirement rate, resulting in an estimated total of 148 704
teachers lost (the cumulative replacement demand) from 2013 – 2019. The increasing retirement rate
is discussed in more detail in subsection 2.4 below.
Although figures are not included for the three demand factors discussed below (for reasons that will
be set out), it is nevertheless important for the supply-demand model to address questions that might
legitimately be raised in connection with how teacher demand might be affected by changes in the
curriculum such as the addition of new subject requirements, by raised educator qualification
requirements, and by the need to minimise the employment of under-qualified and out-of-field
teachers.
28
Determining curriculum expansion demand
The state’s policy decision to incorporate Grade R (reception year) into the formal school system is a
curriculum expansion decision which requires the employment of additional teachers to cater for the
newly-incorporated Grade R learners. The 2001 Education White Paper 5 on Early Childhood
Education introduced the goal of enrolling all learners in Grade R as policy (DoE, 2001:10), and 2019
is the target year for the complete incorporation of Grade R in schools (Samuels, 2011).
The rapid growth in Foundation Phase enrolments (0.57% in 2009, 1.44% in 2010, 2.10% in 2011 and
3.65% in 2012) are some way above the growth which Statistics South Africa has projected for the
school age group (6-18) between 2013 and 2020, i.e. 0.91%. This larger growth is most likely due to
the uptake of Grade R learners into the schooling system. The projected enrolments up to 2019 are
based on the historical trend over the years 2008-2012, which thus already takes account of the
contribution to the growth in enrolments resulting from the inclusion of Grade R, and is already
factored into the calculation of population expansion demand above.
The introduction by the Department of Basic Education of the new Incremental Introduction of African
Languages (IIAL) policy is another example of Curriculum Expansion Demand. This policy requires
all school learners to be taught a third language for conversation purposes, to be implemented
incrementally from Grade 1 in 2015 and continuing until 2026, when it should be implemented in
Grade 12 (DBE, 2013b:1). The effect on teacher demand of all learners having to take a third language
is not clear at this stage, nor is there clarity about the manner in which different staffing structures
might accommodate this demand. Furthermore, the timescale for introducing the policy is currently
under review. Therefore this factor is excluded from this analysis, and can only be fully taken account
in an analysis of this kind when the plan to implement the IIAL policy is fully developed and
communicated, including timeframes, implementation scale and an indication of how the human
resource capacity to support the implementation of the policy is to be put in place.
No figure for this variable is therefore included in the application of the model for the purposes of this
analysis.
Determining quality enhancement demand
An example of a quality demand factor would be a national or provincial plan to reduce class sizes as
one way of trying to improve education quality. As indicated earlier in this report, LERs have
decreased and then flattened out over recent years, and there is no stated intention to steer LERs to
lower figures. A figure for this demand factor is therefore not included in this analysis.
Another form of policy-led demand would be to increase the mandatory minimum qualification
requirement for all teachers to REQV 14. Currently the minimum qualification requirement for those

29
teachers who are already in service is set at REQV 137. Although the raised minimum is mandated in
terms of the 2008 Framework for the Establishment of an Occupation-Specific Dispensation for
Educators in Public Education, and underlies the Policy on Minimum Requirements for Teacher
Education, as yet no dates have been set for the full implementation of this stated policy intention with
regard to serving teachers with REQV13. In any case, teachers rendered under-qualified by such a
change would require upgrading through continuous professional teacher development (CPTD) rather
than initial teacher education.
No figure for this variable is therefore included in the application of the model for the purposes of this
analysis.
Determining hidden demand
In the South African context, the issue of unqualified, under-qualified or inappropriately qualified
teachers (teaching “out of field”) is a significant challenge. However, data on these teachers would
need to be sourced from the DBE’s Annual School Survey, and as yet the qualification information
required of educators (Question 33 on the Survey) is insufficient for reliable conclusions to be drawn
as to whether educators are adequately, or appropriately, qualified to teach the grades and subjects that
they are in fact teaching. What is clear, however, is that out-of-field teachers as well as unqualified and
under-qualified teachers in practice form part of the existing teacher stock; consequently this challenge
cannot be addressed through the employment of new teacher graduates. Rather, the development needs
of teachers who already occupy posts have to be addressed through the provision of appropriate
continuous professional development opportunities.
A figure for this demand variable is therefore not included in the application of the model for the
purposes of this analysis.
Thus the last three demand factors are treated as relevant but dormant elements in the current
application of the teacher supply-demand model in South Africa. On the other hand, the first two
demand factors, population expansion demand and replacement demand, incorporate the three major
components of teacher demand (Cooper and Alvarado, 2006:4): learner enrolment, learner-educator
ratios, and teacher in-service attrition or turnover.
2.2.2 Determining values for the supply-side variables
The teacher supply in a given year is the number of teachers available from a variety of sources who
are willing to supply their services under prevailing conditions (Santiago, 2002:54) – preferably
qualified teachers, as required by policy, but in practice not necessarily limited to these.
7 In terms of school-based teachers, there is a need to upgrade or up-skill teachers to satisfy the minimum requirements of“Matric plus four years” (M+4) or Relative Education Qualification Value (REQV) 14, according to the CollectiveAgreements Nos. 1 and 2 of 2008 in the Framework for the Establishment of an Occupation-Specific Dispensation foreducators in public education. Currently the minimum qualification requirement for qualified teachers is set at REQV 13.However, in terms of the Agreement, this norm is set to move to REQV 14 (SAQA, 2008:iii).
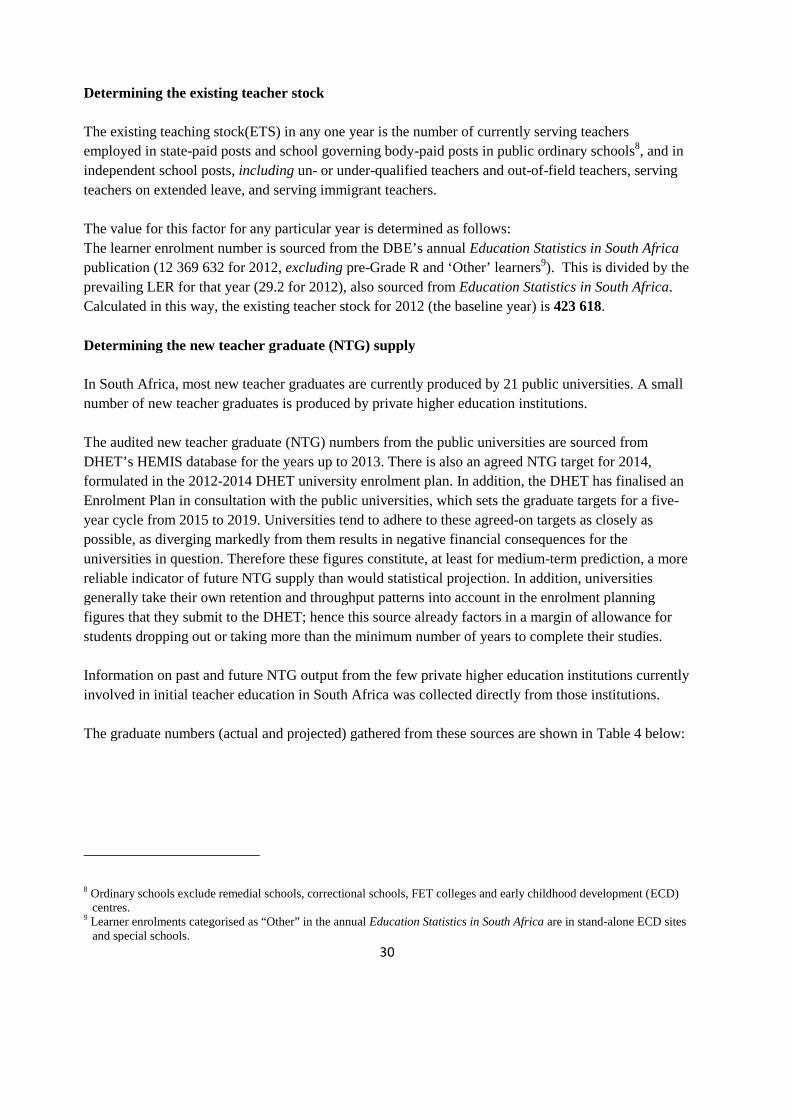
30
Determining the existing teacher stock
The existing teaching stock(ETS) in any one year is the number of currently serving teachers
employed in state-paid posts and school governing body-paid posts in public ordinary schools8, and in
independent school posts, including un- or under-qualified teachers and out-of-field teachers, serving
teachers on extended leave, and serving immigrant teachers.
The value for this factor for any particular year is determined as follows:
The learner enrolment number is sourced from the DBE’s annual Education Statistics in South Africa
publication (12 369 632 for 2012, excluding pre-Grade R and ‘Other’ learners9). This is divided by the
prevailing LER for that year (29.2 for 2012), also sourced from Education Statistics in South Africa.
Calculated in this way, the existing teacher stock for 2012 (the baseline year) is 423 618.
Determining the new teacher graduate (NTG) supply
In South Africa, most new teacher graduates are currently produced by 21 public universities. A small
number of new teacher graduates is produced by private higher education institutions.
The audited new teacher graduate (NTG) numbers from the public universities are sourced from
DHET’s HEMIS database for the years up to 2013. There is also an agreed NTG target for 2014,
formulated in the 2012-2014 DHET university enrolment plan. In addition, the DHET has finalised an
Enrolment Plan in consultation with the public universities, which sets the graduate targets for a five-
year cycle from 2015 to 2019. Universities tend to adhere to these agreed-on targets as closely as
possible, as diverging markedly from them results in negative financial consequences for the
universities in question. Therefore these figures constitute, at least for medium-term prediction, a more
reliable indicator of future NTG supply than would statistical projection. In addition, universities
generally take their own retention and throughput patterns into account in the enrolment planning
figures that they submit to the DHET; hence this source already factors in a margin of allowance for
students dropping out or taking more than the minimum number of years to complete their studies.
Information on past and future NTG output from the few private higher education institutions currently
involved in initial teacher education in South Africa was collected directly from those institutions.
The graduate numbers (actual and projected) gathered from these sources are shown in Table 4 below:
8 Ordinary schools exclude remedial schools, correctional schools, FET colleges and early childhood development (ECD)centres.
9 Learner enrolments categorised as “Other” in the annual Education Statistics in South Africa are in stand-alone ECD sitesand special schools.
31
Table 4: New teacher graduates 2013 – 2019, from public and private higher education
institutions
2013 2014 2015 2016 2017 2018 2019 Total
Public HEI output 16 043 17 545 18 315 19 403 20 745 22 031 23 511 136 337
Private HEI output 310 197 232 350 449 472 676 3 311
Total NTGs 16 353 17 742 18 547 19 753 21 194 22 503 24 187 139 648
Sources: DHET: Trends in Teacher Education 2013; DHET University Enrolment Plans 2008-2019; DHET: Data on
Private Teacher Education Institutions
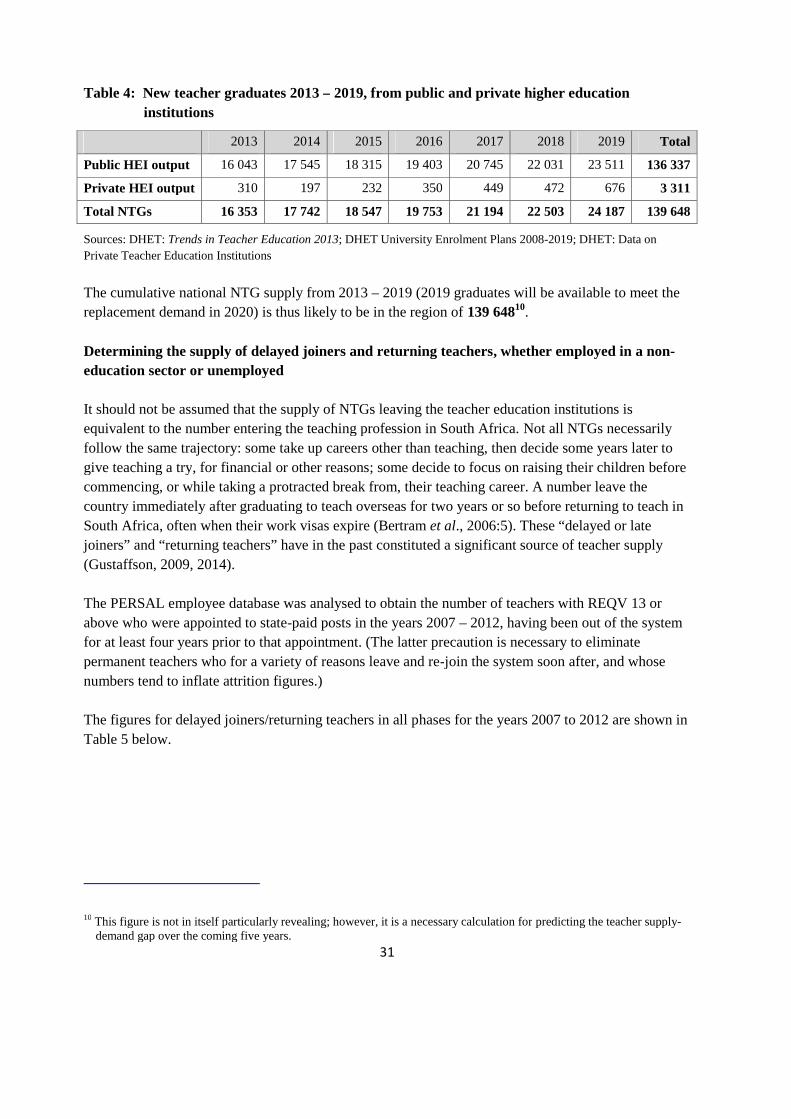
The cumulative national NTG supply from 2013 – 2019 (2019 graduates will be available to meet the
replacement demand in 2020) is thus likely to be in the region of 139 64810.
Determining the supply of delayed joiners and returning teachers, whether employed in a non-
education sector or unemployed
It should not be assumed that the supply of NTGs leaving the teacher education institutions is
equivalent to the number entering the teaching profession in South Africa. Not all NTGs necessarily
follow the same trajectory: some take up careers other than teaching, then decide some years later to
give teaching a try, for financial or other reasons; some decide to focus on raising their children before
commencing, or while taking a protracted break from, their teaching career. A number leave the
country immediately after graduating to teach overseas for two years or so before returning to teach in
South Africa, often when their work visas expire (Bertram et al., 2006:5). These “delayed or late
joiners” and “returning teachers” have in the past constituted a significant source of teacher supply
(Gustaffson, 2009, 2014).
The PERSAL employee database was analysed to obtain the number of teachers with REQV 13 or
above who were appointed to state-paid posts in the years 2007 – 2012, having been out of the system
for at least four years prior to that appointment. (The latter precaution is necessary to eliminate
permanent teachers who for a variety of reasons leave and re-join the system soon after, and whose
numbers tend to inflate attrition figures.)
The figures for delayed joiners/returning teachers in all phases for the years 2007 to 2012 are shown in
Table 5 below.
10 This figure is not in itself particularly revealing; however, it is a necessary calculation for predicting the teacher supply-demand gap over the coming five years.
32
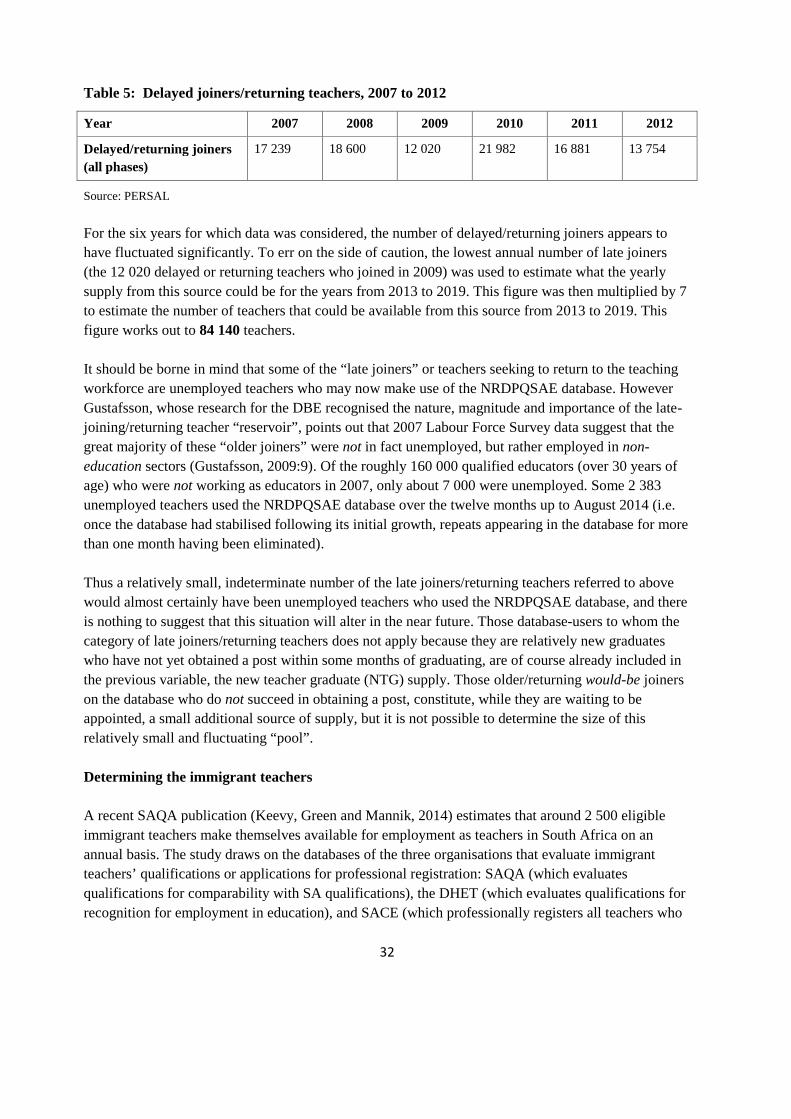
Table 5: Delayed joiners/returning teachers, 2007 to 2012
Year 2007 2008 2009 2010 2011 2012
Delayed/returning joiners
(all phases)
17 239 18 600 12 020 21 982 16 881 13 754
Source: PERSAL
For the six years for which data was considered, the number of delayed/returning joiners appears to
have fluctuated significantly. To err on the side of caution, the lowest annual number of late joiners
(the 12 020 delayed or returning teachers who joined in 2009) was used to estimate what the yearly
supply from this source could be for the years from 2013 to 2019. This figure was then multiplied by 7
to estimate the number of teachers that could be available from this source from 2013 to 2019. This
figure works out to 84 140 teachers.
It should be borne in mind that some of the “late joiners” or teachers seeking to return to the teaching
workforce are unemployed teachers who may now make use of the NRDPQSAE database. However
Gustafsson, whose research for the DBE recognised the nature, magnitude and importance of the late-
joining/returning teacher “reservoir”, points out that 2007 Labour Force Survey data suggest that the
great majority of these “older joiners” were not in fact unemployed, but rather employed in non-
education sectors (Gustafsson, 2009:9). Of the roughly 160 000 qualified educators (over 30 years of
age) who were not working as educators in 2007, only about 7 000 were unemployed. Some 2 383
unemployed teachers used the NRDPQSAE database over the twelve months up to August 2014 (i.e.
once the database had stabilised following its initial growth, repeats appearing in the database for more
than one month having been eliminated).
Thus a relatively small, indeterminate number of the late joiners/returning teachers referred to above
would almost certainly have been unemployed teachers who used the NRDPQSAE database, and there
is nothing to suggest that this situation will alter in the near future. Those database-users to whom the
category of late joiners/returning teachers does not apply because they are relatively new graduates
who have not yet obtained a post within some months of graduating, are of course already included in
the previous variable, the new teacher graduate (NTG) supply. Those older/returning would-be joiners
on the database who do not succeed in obtaining a post, constitute, while they are waiting to be
appointed, a small additional source of supply, but it is not possible to determine the size of this
relatively small and fluctuating “pool”.
Determining the immigrant teachers
A recent SAQA publication (Keevy, Green and Mannik, 2014) estimates that around 2 500 eligible
immigrant teachers make themselves available for employment as teachers in South Africa on an
annual basis. The study draws on the databases of the three organisations that evaluate immigrant
teachers’ qualifications or applications for professional registration: SAQA (which evaluates
qualifications for comparability with SA qualifications), the DHET (which evaluates qualifications for
recognition for employment in education), and SACE (which professionally registers all teachers who

33
wish to teach in South African schools). This annual estimate is multiplied by 7 (the number of years
up to 2019), to give an estimated total of 17 500 immigrant teachers over the period.
2.3 Using the determined figures for the supply-demand variables in an application of
the model to determine the projected national teacher supply-demand gap in 2020
Inserting the values for the variables determined in 2.2.1 and 2.2.2above into the model enables the
projected teacher supply-demand gap for 2020 to be determined.
Table 6: Teacher supply and demand projected to 2020
DEMAND
VARIABLES
DETERMINED
VALUE
SUPPLY
VARIABLES
DETERMINED
VALUE
Population Expansion
Demand433852
Existing teacher
stock423618
+ +
Replacement
Demand148 704
New teacher
graduates139 023
+ +
Curriculum Expansion
Demand* X
Delayed joiners and
returning teachers
(employed/unemployed)
84 140
+ +
Quality Enhancement
Demand*X
Migrant teachers
seeking employment17 500+
Hidden
Demand*X
= =
TOTAL DEMAND 582 556 TOTALSUPPLY 664 281
SUPPLY/DEMAND GAP = SUPPLY – DEMAND
= 664 281– 582 556
= 81 725
*Not taken into account for reasons discussed earlier.
Sources: DHET: Trends in Teacher Education 2013; DHET University Enrolment Plans 2008-2019;DHET: Data on
Private Teacher Education Institutions; PERSAL; DBE’s National Recruitment Database of Professionally Qualified South
African Educators (NRDPQSAE); Keevy, Green and Manik, 2014.
The model therefore projects a more-than-adequate supply of teachers for South Africa by 2020,
accumulating over the years from 2013 to 2019 to exceed demand by about 81 725, an average of
approximately 11 675 per year.

34
However, whilst there is some degree of certainty regarding the first two demand variables (population
expansion demand and replacement demand) and the first two supply variables (existing teacher stock,
new teacher graduates), there is, as we have indicated, a high degree of uncertainty and conjecture
regarding the magnitude of the other two supply-side variables (delayed joiners and returners, whether
employed or unemployed, and immigrant teachers), and the extent to which they can be depended on
to contribute to the supply of teachers in the coming years. For example, there is no way of knowing
the extent or stability of the “pool” of delayed and late joiners (employed or otherwise), and
whether/when it will run out. Estimates for two of these variables (delayed joiners and returners, and
immigrant teachers) at present unavoidably involve a number of pragmatic assumptions.
A second reservation is that both of these supply variables are far less open to state planning than the
first two variables, and are highly susceptible to the impact of macro- or micro-level economic forces
and/or political vicissitudes11, some of them emanating from beyond South Africa’s borders.
These two supply variables are therefore best regarded as together providing a relatively unpredictable
and possibly temporary “cushion” on the supply side, i.e. not as an entity to be relied on for planning
purposes. If the values for these variables are “bracketed out” of the supply-demand calculation, a
pragmatic application of the supply-demand model projects a cumulative shortage of 19 916,as
shown in Figure 6 below (an average of -2 845 per year).
Table 7: Teacher supply and demand projected to 2020, restricted to more certain supply
variables
DEMAND
VARIABLES
CALCULATED
VALUE
SUPPLY VARIABLES CALCULATED VALUE
Population Expansion
Demand433852
Existing
teacher stock423618
+ +
Replacement
Demand148 704
New teacher
graduates139 023
= =
TOTALDEMAND 582 556 TOTALSUPPLY 562 640
SUPPLY/DEMAND GAP = SUPPLY – DEMAND
= 562 640 – 582 556
= – 19 916
Sources: DHET: Trends in Teacher Education 2013; DHET: Student Enrolment Planning 2008-2019; University
submissions to DHET, 2013; DHET: Data on Private Teacher Education Institutions; PERSAL; DBE’s National
Recruitment Database of Professionally Qualified South African Educators; Keevy, Green and Manik, 2014.
11 The spate of xenophobic attacks in some parts of South Africa at the time of finalising this report are a vivid example ofthe abruptness with which prevailing circumstances may make immigration less appealing.

35
The figures from this pragmatic/restricted application of the teacher supply-demand model convey a
picture of an overall shortfall of just under 20 000in the supply of teachers by 2020, rather than the
more than adequate supply suggested by the more inclusive version. This shortfall may in all
likelihood be compensated for by the “cushion” of unemployed, immigrant, late joining and returning
teachers mentioned above.
2.4 Conclusion: No absolute shortage of teachers by 2020
What the two applications of the model do show, is that South Africa is moving into a more
comfortable teacher supply-demand scenario as we approach the year 2020. Overall, from the national
perspective, there are likely to be sufficient teachers to meet the demands of the schooling system, and
so no absolute shortage.
However, relative shortages may still exist in terms of sufficient numbers of teachers to teach
specific phases or subjects or relative shortages experienced in specific provinces, or within provinces,
in certain districts. These issues are discussed further in Part 3.
It has also become glaringly clear through this analysis that the higher education system is almost
wholly focussed on the production of school teachers. Almost all the NTGs coming out of the
universities are school teachers. The number of graduates available to teach in other sub-sectors of
education, specifically Early Childhood Education (birth-4 years), Technical and Vocational Education
and Training and Adult and Community Education and Training are minimal. Some of the capacity
within the higher education system for the production of teachers must be directed towards the
production of teachers for these sub-sectors as well, especially as we move to a situation where there is
likely to be a more-than-adequate supply of school teachers.
It is also important to note that whilst the 2020 projected teacher supply-demand scenario may be
better aligned to system needs, the phenomena of an ageing workforce and of increasing attrition
through resignations are likely to exert greater impact after 2020 and as we move towards 2030. These
issues are discussed further below.
2.5 An ageing educator workforce presents a problem in the near future
In working to determine the replacement demand resulting from attrition, the issue of an ageing
teacher workforce came to the fore. This issue requires urgent attention, as it has already begun to have
an impact on overall teacher supply and demand, and is certain to become more significant over the
coming decade.
As Figure 3 demonstrates, in 2005retirement (including early retirement) was only the third largest
category in annual teacher attrition, following resignations and death; by 2012, just seven years later,
retirement accounted for the greatest number of terminations (a growth rate of 365.5%), “overtaking”
resignations (52.2% growth) and death (9.9% growth) (PERSAL, 2014).

36
Figure 4: Three largest attrition categories in state-paid posts, 2005 – 2012: Resignation,
deceased, retirement
Source: PERSAL (see Appendix 2A)
The trajectory of teacher retirements, including early retirements12, is clearly a matter of concern, as it
indicates that a high and increasing proportion of the educator workforce is reaching, or will soon
reach, retirement age, driving up teacher attrition significantly over the next ten to fifteen years. This
trend is strikingly revealed in Figure 4, which uses trendlines to project both the retirement rate, and
the rate of all other the forms of teacher attrition combined13, to 2019. This graph again shows the
retirement rate growing by 365.5% between 2005 and 2012 (from 1 188 to 5 530), compared with the
combined rate of other forms of attrition growing by only 41.9% over the same period (from 5 597 to 7
940).
12 Early retirements are included under the retirement category. The Employment of Educator Act makes provision forearly retirement; chapter 4 states:“(3) (a) Notwithstanding the provisions of subsection (1) or (2), an educator shall have the right to retire on or after
attaining the age of 55 years.(b) Notwithstanding the absence of any reason for discharge in terms of section 11 (1), the employer may, at therequest of an educator, allow the educator to retire before attaining the age of 55 years, if the employer is of theopinion-
(i) that a sufficient reason exists therefore; and(ii) that the retirement will be to the advantage of the State.
(4) Notwithstanding the provisions of this section, an educator-(a) who was in employment immediately before 1 May 1996; and(b) who, without interruption of service, has completed a period of ten years continuous pensionable service in
terms of the pension law applicable to the educator; and(c) who has attained the age of 50 years
shall have the right to retire.”13 These statistics refer to last-time terminations among permanent teachers only, and exclude the expiry of temporary or
relief teachers’ contracts.
2,918
4,442
1,6071,766
1,188
5,530
0
1,000
2,000
3,000
4,000
5,000
6,000
2005 2006 2007 2008 2009 2010 2011 2012
Resignation or desertion Deceased Retirement, incl. early retirement
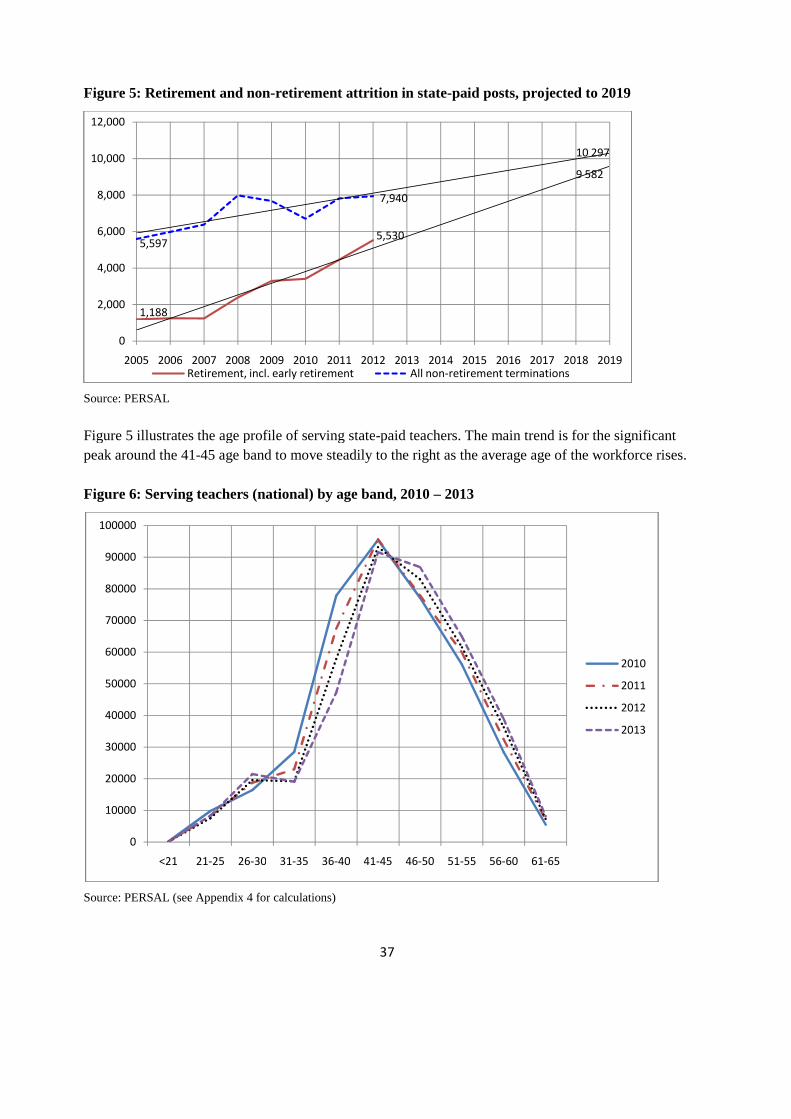
37
Figure 5: Retirement and non-retirement attrition in state-paid posts, projected to 2019
Source: PERSAL
Figure 5 illustrates the age profile of serving state-paid teachers. The main trend is for the significant
peak around the 41-45 age band to move steadily to the right as the average age of the workforce rises.
Figure 6: Serving teachers (national) by age band, 2010 – 2013
Source: PERSAL (see Appendix 4 for calculations)
1,188
9 582
5,5305,597
10 297
7,940
0
2,000
4,000
6,000
8,000
10,000
12,000
2005 2006 2007 2008 2009 2010 2011 2012 2013 2014 2015 2016 2017 2018 2019Retirement, incl. early retirement All non-retirement terminations
0
10000
20000
30000
40000
50000
60000
70000
80000
90000
100000
<21 21-25 26-30 31-35 36-40 41-45 46-50 51-55 56-60 61-65
2010
2011
2012
2013

38
The pronounced shift towards a teaching workforce that is older on average is a result of the under-
enrolled age cohort of younger teachers (aged about 24-30 at the time) who joined the educator
workforce in the years of low enrolment from about 1996 to 2005 (see 1.3 above), moving through the
system. Between 2026 and 2035, the increasing average age of the teaching workforce will result in
the significant increase in attrition mentioned above, as the bulk of teachers (currently 40 years and
over) retire.
2.6 Expansion of initial teacher education
However, given the current tendency of the majority of teachers to retire at ages between 50 and 60
(the 61-65 age band currently represents only some 2-3% of the educator workforce), most of the low
enrolment cohort dating from 1996 to 2005 will have exited the system between about 2026 and 2035.
Significantly, Figure 5 also indicates the build-up of a small “peak” in the 26-30 age band from 2011
to 2013, reflecting the recent growth in initial teacher education described in 1.4 above. This will, if it
continues as planned (see Table 4), partly offset the impact of the impending increase in the number of
retirements. Hence the increasing average age of the teaching workforce is unlikely to become a
permanent feature.
These trends raise perplexing questions about how a “retirement bubble” should be addressed, as plans
have to be put in place to do this. The central issue is the temporary nature of the teacher shortage that
such a “retirement bubble” creates. It would not, for example, be efficient to respond to such a
“bubble’ by massively expanding initial teacher infrastructure at universities, which would then need
to be dismantled or become obsolete when the “bubble” passes in the late 2030s.
2.7 Increasing attrition through resignation
In addition to the sharp rise in retirement, Figure 3 on page 31 also shows a less-steep but nevertheless
troubling rise in attrition resulting from resignations and desertions, from just under 3000 in 2010 to 4
442 in 2012 (an increase of approximately 48%). Increasing resignation rates will erode the positive
contribution that a growth in NTG supply can make, and lead to a “leaking bucket” syndrome, where
teachers are lost to the system as fast as they are being replaced.
2.8 Teacher supply and demand at provincial level
The same methodology used in the national level analysis and explained in detail in earlier parts of this
report is used to analyse teacher supply and demand at provincial level.
However, in doing this it is necessary to keep one important proviso in mind. While there is obviously
an identifiable demand for teachers in each province, universities are national rather than provincial
providers, particularly but not only in the case of the universities which offer initial teacher education
programmes at a distance to large numbers of students in provinces other than where the universities
themselves are situated. Some initial teacher education students study in a province which is not their
home province, and may opt to return home upon graduation. Some new teacher graduates take up
posts in provinces other than where they have studied, and this is in fact to be encouraged in the

39
current situation, where some provinces experience shortages that are not experienced by other
provinces. These comments are also applicable to the private institutions engaged in initial teacher
education.
Table 8 is a result of applying the same methodology and calculations as were applied to obtain the
national picture. The detailed methodology is not explained again, merely the outcomes. These reveal
that without removing the “cushion” of unemployed, late/returning or immigrant teachers, each
province except Gauteng, Mpumalanga and the Northern Cape is likely to experience a comfortable
supply of teachers overall by 2020. Until 2013 and 2014 respectively, there were no universities based
in Mpumalanga and the Northern Cape.14
Table 8: The provincial teacher supply/demand situation by 2020
However, as explained earlier, there is a high level of uncertainty and conjecture involved in factoring
in the two teacher supply variables “late joiners/returning teachers” and “immigrant teachers” into the
demand-supply model. Table 9 shows the teacher supply-demand gap in each province when these two
supply sources are removed, thus applying a restricted/pragmatic model:
14 Small numbers of initial teacher education students in Mpumalanga and the Northern Cape have been registered withuniversities based in other provinces, under the auspices of the National Institute for Higher Education (NIHE) in each ofthese provinces – these two bodies were disestablished at the end of 2014, now that universities have been established ineach province. Many MP and NC students attend universities in other provinces and take up posts back in their homeprovince.
Provinces EC FS GP KZN LP MP NC NW WC
Population expansion
demand
59 154 22 870 84 829 99 158 49 427 37 158 10 814 26 010 38 132
Replacement demand 26 472 8 939 42 032 31 150 14 306 7 720 3 008 7 153 12 234
TOTAL DEMAND
(2013-20)
85 626 31 808 126 861 130 309 63 733 44 878 13 822 33 163 50 366
Existing teacher stock 67 997 24 793 73 857 94 982 57 576 34 697 8 866 25 924 36 422
New teacher
graduates "per
province" *
13 675 11 245 27 505 46 939 8 264 2 320 523 11 151 18 025
Late joiners and
returning
teachers(employed/un
employed)
10 757 5 097 15 465 25 603 8 988 5 400 1 818 4 824 6 188
Immigrant teachers
seeking employment
4 887 118 4 919 2 272 1 543 1 007 257 975 1 511
TOTAL SUPPLY
(2013-20)
97 316 41 253 121 747 169 797 76 372 43 423 11 464 42 874 62 146
SUPPLY/ DEMAND
GAP (2020)
11 691 9 444 -5 114 39 488 12 639 -1 455 -2 358 9 711 11 780

40
Table 9: Projected cumulative teacher supply-demand gap per province by 2020, applying a
restricted/pragmatic model
Provinces EC FS GP KZN LP MP NC NW WC
SUPPLY/DEMA
ND GAP (2020) -3 954 4 230 -25 499 11 613 2 108 -7 862 -4 433 3 913 4 081
The analysis illustrates that whilst there may be a favourable 2020 teacher supply-demand projection at
a national level, regional gaps may continue to exist in some provinces. When the “pool” of
unemployed, immigrant, late joining and returning teachers is excluded from the picture, four of the
nine provinces, on present trajectories, are unlikely to have achieved a comfortable positive balance
between supply and demand. Gauteng could experience a substantial shortfall. This is, however, where
teacher migration across provinces is likely to play a part in rectifying imbalances – Gauteng has been
able to attract significant numbers of teachers who have achieved their qualifications in other
provinces, and so in reality does not actually experience a major teacher supply challenge.
The two provinces (Northern Cape and Mpumalanga Province) where universities did not exist before
are projected to continue to experience a negative teacher supply demand gap. The University of
Mpumalanga is targeting the production of 361 ITE graduates between 2017 and 2019, and Sol Plaatje
University in the Northern Cape is targeting 46in the same period. As the two new universities grow
their teacher supply capability, it will be important for these two provinces to proactively recruit new
teachers from universities located in other provinces.
The Eastern Cape is also projected to have a relatively large negative supply-demand gap in 2020,
although current barriers in the province which are preventing the effective uptake of new teacher
graduates are masking the scale of the problem. As the blockages are removed, it will be important to
increase teacher supply to the province.
The projected “balance” between supply and demand in KwaZulu-Natal, the province with the highest
demand for teachers in South Africa, is surprisingly healthy; one contributory factor here is that it is
the province in which the largest proportion of UNISA initial teacher education students resides.

41
PART 3: WHAT ARE THE SHAPE IMPERATIVES IN SCHOOL TEACHER
EDUCATION?
In reply to a Parliamentary Question (4 June 2010), the Minister of Basic Education responded: “the
existing shortage [of educators] is not in overall quantity, but in the quality and distribution of
educators. The shortage is mainly in certain phases and subject areas, and in rural and remote schools”
(Parliamentary Monitoring Group, 2010).
This section draws on available data to provide a backdrop against which this statement can be
explored further.
Universities need to supply teachers in sufficient numbers for the different phases of schooling, and for
all the subjects contained in the national curriculum. If the teacher education system is unable to do
this, there will be serious consequences for the quality of teaching and learning as a result of people
teaching subjects or in phases for which they are not qualified.
3.1 National supply-demand analysis at the level of phases
In attempting to analyse and report on supply and demand in this regard, it is important to
acknowledge certain methodological issues which arise when “drilling down” to the level of school
phases and school subjects. The basic methodology used to determine the national supply and demand
overall is applied in attempting to determine national teacher supply and demand for the four school
phases; however, a number of complexities attendant on such attempts either rule out accurate
prediction or render the results somewhat contradictory.
3.1.1 Methodological challenges relating to supply-demand analysis at the phase level
The first difficulty is that because many teachers are required to teach across more than one phase, it is
not practical to identify teachers with particular phase specialisations. Neither the EMIS nor PERSAL
databases supply educator data in phase categories. On the supply side, previous teacher education
qualifications policy (DoE, 2000) allowed dual phase specialisation, with the result that many teachers
still qualify to teach across two phases rather than just one. Statistical representation of such teachers
in terms of a simple headcount would result in double-counting; for example, a single teacher qualified
to teach, or teaching, both Intermediate and Senior Phase classes would be counted twice – once for
each phase.
For the purpose of analysing and planning teacher demand and supply, the notion of full-time
equivalent teachers (FTEs) appears to provide a practical solution. Thus for example, a teacher who
teaches Senior Phase grades for 10 teaching periods per week and FET Phase grades for 30 teaching
periods per week, will be equivalent to 0.25 of an SP teacher and 0.75 of an FET teacher.If a new
teacher graduate (NTG) has specialised to teach in the Foundation Phase only, then that graduate is 1
full-time equivalent Foundation Phase NTG. If a graduate has specialised to teach in, say, both the
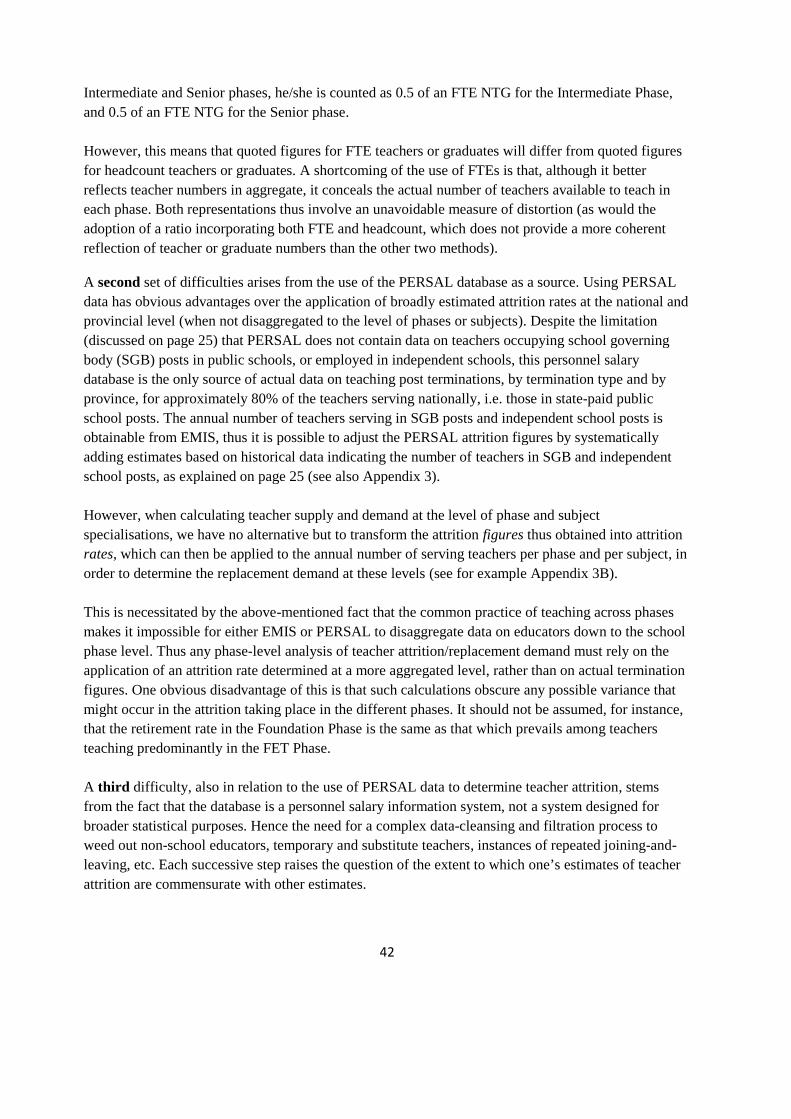
42
Intermediate and Senior phases, he/she is counted as 0.5 of an FTE NTG for the Intermediate Phase,
and 0.5 of an FTE NTG for the Senior phase.
However, this means that quoted figures for FTE teachers or graduates will differ from quoted figures
for headcount teachers or graduates. A shortcoming of the use of FTEs is that, although it better
reflects teacher numbers in aggregate, it conceals the actual number of teachers available to teach in
each phase. Both representations thus involve an unavoidable measure of distortion (as would the
adoption of a ratio incorporating both FTE and headcount, which does not provide a more coherent
reflection of teacher or graduate numbers than the other two methods).
A second set of difficulties arises from the use of the PERSAL database as a source. Using PERSAL
data has obvious advantages over the application of broadly estimated attrition rates at the national and
provincial level (when not disaggregated to the level of phases or subjects). Despite the limitation
(discussed on page 25) that PERSAL does not contain data on teachers occupying school governing
body (SGB) posts in public schools, or employed in independent schools, this personnel salary
database is the only source of actual data on teaching post terminations, by termination type and by
province, for approximately 80% of the teachers serving nationally, i.e. those in state-paid public
school posts. The annual number of teachers serving in SGB posts and independent school posts is
obtainable from EMIS, thus it is possible to adjust the PERSAL attrition figures by systematically
adding estimates based on historical data indicating the number of teachers in SGB and independent
school posts, as explained on page 25 (see also Appendix 3).
However, when calculating teacher supply and demand at the level of phase and subject
specialisations, we have no alternative but to transform the attrition figures thus obtained into attrition
rates, which can then be applied to the annual number of serving teachers per phase and per subject, in
order to determine the replacement demand at these levels (see for example Appendix 3B).
This is necessitated by the above-mentioned fact that the common practice of teaching across phases
makes it impossible for either EMIS or PERSAL to disaggregate data on educators down to the school
phase level. Thus any phase-level analysis of teacher attrition/replacement demand must rely on the
application of an attrition rate determined at a more aggregated level, rather than on actual termination
figures. One obvious disadvantage of this is that such calculations obscure any possible variance that
might occur in the attrition taking place in the different phases. It should not be assumed, for instance,
that the retirement rate in the Foundation Phase is the same as that which prevails among teachers
teaching predominantly in the FET Phase.
A third difficulty, also in relation to the use of PERSAL data to determine teacher attrition, stems
from the fact that the database is a personnel salary information system, not a system designed for
broader statistical purposes. Hence the need for a complex data-cleansing and filtration process to
weed out non-school educators, temporary and substitute teachers, instances of repeated joining-and-
leaving, etc. Each successive step raises the question of the extent to which one’s estimates of teacher
attrition are commensurate with other estimates.
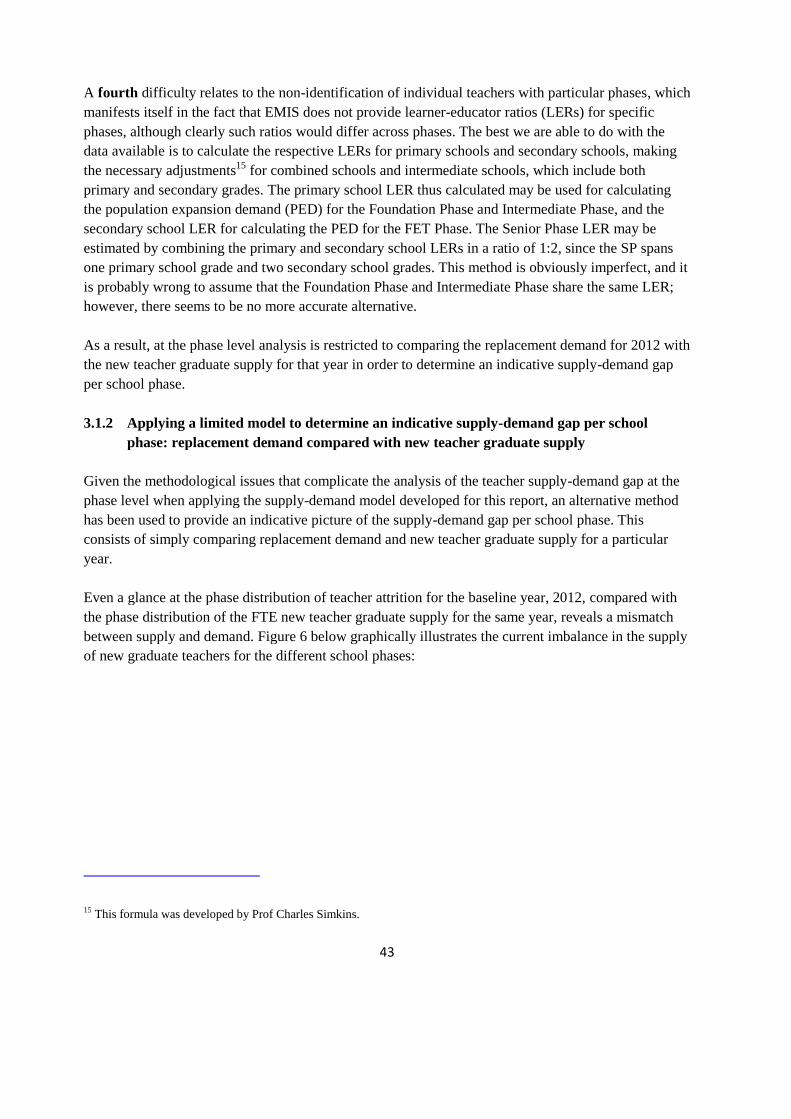
43
A fourth difficulty relates to the non-identification of individual teachers with particular phases, which
manifests itself in the fact that EMIS does not provide learner-educator ratios (LERs) for specific
phases, although clearly such ratios would differ across phases. The best we are able to do with the
data available is to calculate the respective LERs for primary schools and secondary schools, making
the necessary adjustments15 for combined schools and intermediate schools, which include both
primary and secondary grades. The primary school LER thus calculated may be used for calculating
the population expansion demand (PED) for the Foundation Phase and Intermediate Phase, and the
secondary school LER for calculating the PED for the FET Phase. The Senior Phase LER may be
estimated by combining the primary and secondary school LERs in a ratio of 1:2, since the SP spans
one primary school grade and two secondary school grades. This method is obviously imperfect, and it
is probably wrong to assume that the Foundation Phase and Intermediate Phase share the same LER;
however, there seems to be no more accurate alternative.
As a result, at the phase level analysis is restricted to comparing the replacement demand for 2012 with
the new teacher graduate supply for that year in order to determine an indicative supply-demand gap
per school phase.
3.1.2 Applying a limited model to determine an indicative supply-demand gap per school
phase: replacement demand compared with new teacher graduate supply
Given the methodological issues that complicate the analysis of the teacher supply-demand gap at the
phase level when applying the supply-demand model developed for this report, an alternative method
has been used to provide an indicative picture of the supply-demand gap per school phase. This
consists of simply comparing replacement demand and new teacher graduate supply for a particular
year.
Even a glance at the phase distribution of teacher attrition for the baseline year, 2012, compared with
the phase distribution of the FTE new teacher graduate supply for the same year, reveals a mismatch
between supply and demand. Figure 6 below graphically illustrates the current imbalance in the supply
of new graduate teachers for the different school phases:
15 This formula was developed by Prof Charles Simkins.

44
Figure 7: Replacement Demand vs New Teacher Graduate Supply, 2012
Sources: DBE EMIS, Education Statistics in South Africa 2012; Simkins, 2014; DHET, Trends in Teacher Education 2012
On the replacement demand side, no particular phase is dominant: the Foundation Phase segment is
larger than the other phases, probably because it now includes a growing Grade R component, i.e. four
grades in all, whereas the other phases consist of three grades each (see Appendix 5). On the other
hand, the supply of new teacher graduates, mainly from the public higher education institutions, is
dominated by the supply of FET phase graduates (43.8%), whereas a Foundation Phase output of only
17.2% is produced to meet the 30% FP replacement demand, and an Intermediate Phase output of only
10.5% is produced to meet the 21.2% replacement demand for that phase. The supply of new teacher
graduates from private institutions is currently mainly at the Foundation and Intermediate Phase levels.
Staying with this simplified snapshot view of the national teacher supply-demand gap for each phase
in 2012, merely in terms of the gap between replacement demand and the supply of new teacher
graduates rather than employing the complete model, Table 10 reveals the size of the shortfall in every
phase but FET, which shows a surplus:
Table 10: National teacher supply–demand gap per school phase, 2012 (Full-time equivalent
teachers used on both Supply and Demand sides)
Supply-demand gap per school phase, 2012
Foundation Phase – 2 811
Intermediate Phase – 2 213
Senior Phase – 673
FET Phase 2 073
Even allowing for the fact that the FET Phase generally requires a higher proportion of teachers than
the other phases, mainly on account of the degree of subject specialisation in that phase, it is clear that
a disproportionate supply of FET teacher graduates was produced by the universities in 2012. Equally
FP =30.0%(5 134)
IP =21.2%(3 629)
SP =26.4%(4 519)
FET =22.4%(3 836)
Estimated distribution of ReplacementDemand per phase, 2012
FP =17.2%(2 323)
IP =10.5%(1 416)
SP =28.5%(3 846)
FET =43.8%(5 909)
Distribution of FTE New Teacher GraduateSupply (public & private HEIs) per
Phase, 2012
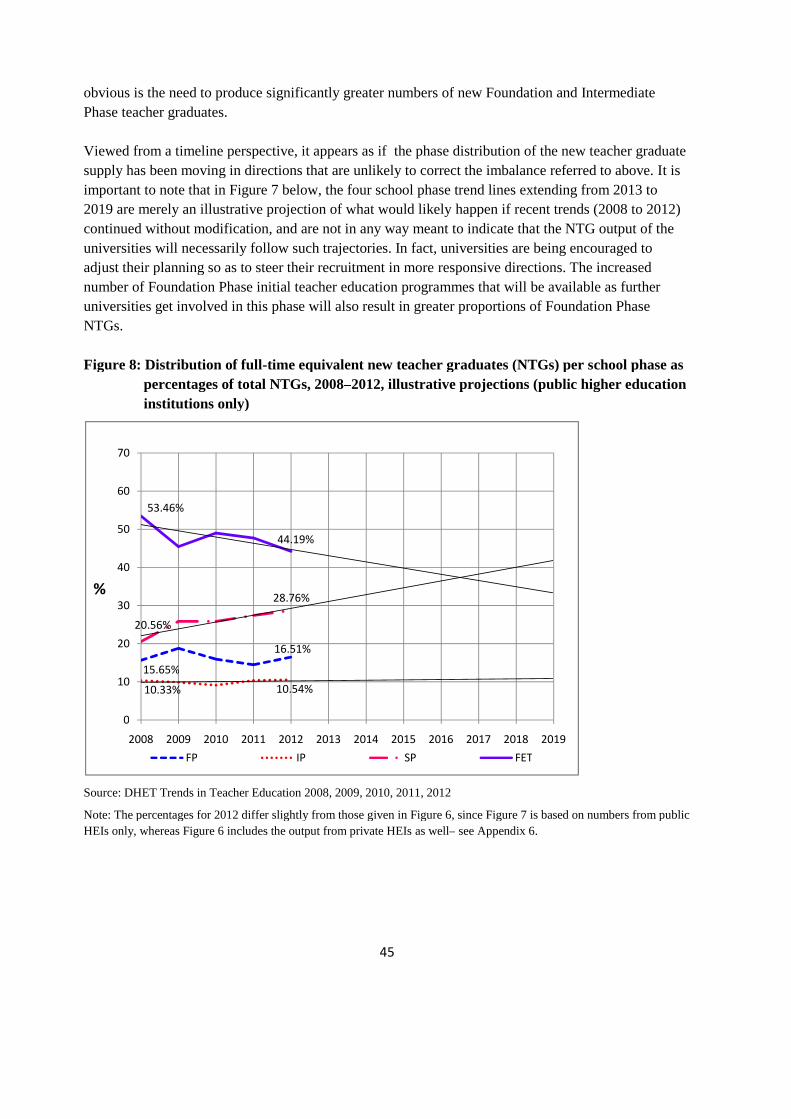
45
obvious is the need to produce significantly greater numbers of new Foundation and Intermediate
Phase teacher graduates.
Viewed from a timeline perspective, it appears as if the phase distribution of the new teacher graduate
supply has been moving in directions that are unlikely to correct the imbalance referred to above. It is
important to note that in Figure 7 below, the four school phase trend lines extending from 2013 to
2019 are merely an illustrative projection of what would likely happen if recent trends (2008 to 2012)
continued without modification, and are not in any way meant to indicate that the NTG output of the
universities will necessarily follow such trajectories. In fact, universities are being encouraged to
adjust their planning so as to steer their recruitment in more responsive directions. The increased
number of Foundation Phase initial teacher education programmes that will be available as further
universities get involved in this phase will also result in greater proportions of Foundation Phase
NTGs.
Figure 8: Distribution of full-time equivalent new teacher graduates (NTGs) per school phase as
percentages of total NTGs, 2008–2012, illustrative projections (public higher education
institutions only)
Source: DHET Trends in Teacher Education 2008, 2009, 2010, 2011, 2012
Note: The percentages for 2012 differ slightly from those given in Figure 6, since Figure 7 is based on numbers from public
HEIs only, whereas Figure 6 includes the output from private HEIs as well– see Appendix 6.
15.65%
16.51%
10.33% 10.54%
20.56%
28.76%
53.46%
44.19%
0
10
20
30
40
50
60
70
2008 2009 2010 2011 2012 2013 2014 2015 2016 2017 2018 2019
%
FP IP SP FET

46
While the proportion of FET graduates is declining, it is being overtaken by a rising output of Senior
Phase graduates16. While the proportion of Foundation Phase graduates has begun to increase from
201117, the very low output of Intermediate Phase graduates is scarcely rising at all. This projection
clearly indicates the need both to maintain the increase in the output of Foundation Phase graduates
and to boost the recruitment of students for teaching in the Intermediate Phase.
3.1.3 Mother tongue teaching in the Foundation Phase
The DBE (Department of Basic Education) strongly encourages the use of the mother tongue as the
language of learning and teaching (LoLT) in the Foundation Phase, where young learners are taught
and may converse in class through the medium of their home language (Minister of Basic Education,
oral reply to question 68, National Assembly, 2012). This is widely accepted as having profound
advantages for learners’ intellectual development, especially in the early years of schooling, without
any negative effects on children’s development in what may be their target second language – English,
for the majority of South African learners (Cummins, J. 2009).
Table 11 below illustrates a limited supply-demand analysis (replacement demand compared to NTG
supply), based on the language that the 2012 Foundation Phase new teacher graduates from South
African universities indicated was their home language18 to determine an indicative supply-demand
gap for Foundation Phase teachers in specific languages.
16 Note that many of the SP and FET graduates are in fact qualified to teach in both phases, having obtained qualifications
which combine SP and FET; the proportions presented in Figure 7 reflect full-time equivalent (FTE) graduate output
rather than headcount output.17 The Foundation Phase trendline from 2008 to 2019 is not included in Figure 7 because it would indicate a slight
downward trend, which would not reflect the recent rise in graduate numbers.18 The chief limitation of this analysis is that the graduates’ home languages are used as a proxy for the ability not only to
teach through the medium of this language, but also to teach the language as a first language to Foundation Phase
learners. Very few universities actually prepare students as teachers of African languages, thus most of these graduates
are in fact not qualified to teach an African language as a subject, and in some cases their ability to use it adequately
even as a language of learning and teaching is limited.
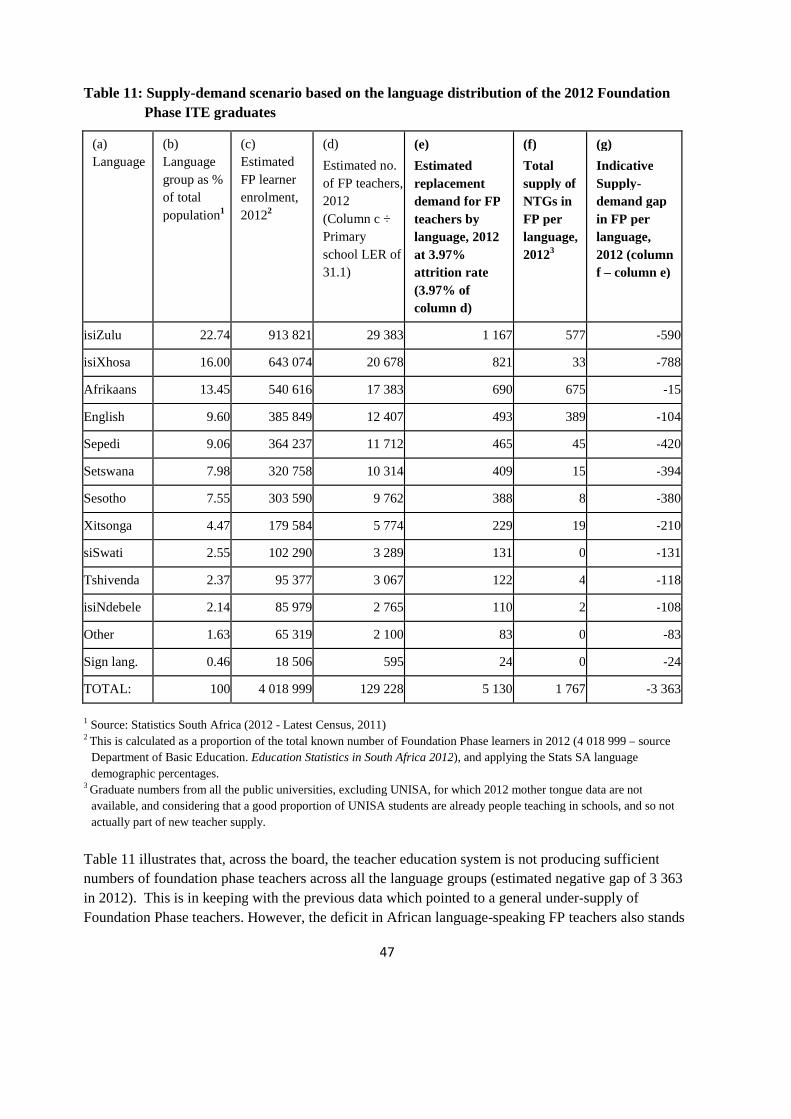
47
Table 11: Supply-demand scenario based on the language distribution of the 2012 Foundation
Phase ITE graduates
(a)
Language
(b)
Language
group as %
of total
population1
(c)
Estimated
FP learner
enrolment,
20122
(d)
Estimated no.
of FP teachers,
2012
(Column c ÷
Primary
school LER of
31.1)
(e)
Estimated
replacement
demand for FP
teachers by
language, 2012
at 3.97%
attrition rate
(3.97% of
column d)
(f)
Total
supply of
NTGs in
FP per
language,
20123
(g)
Indicative
Supply-
demand gap
in FP per
language,
2012 (column
f – column e)
isiZulu 22.74 913 821 29 383 1 167 577 -590
isiXhosa 16.00 643 074 20 678 821 33 -788
Afrikaans 13.45 540 616 17 383 690 675 -15
English 9.60 385 849 12 407 493 389 -104
Sepedi 9.06 364 237 11 712 465 45 -420
Setswana 7.98 320 758 10 314 409 15 -394
Sesotho 7.55 303 590 9 762 388 8 -380
Xitsonga 4.47 179 584 5 774 229 19 -210
siSwati 2.55 102 290 3 289 131 0 -131
Tshivenda 2.37 95 377 3 067 122 4 -118
isiNdebele 2.14 85 979 2 765 110 2 -108
Other 1.63 65 319 2 100 83 0 -83
Sign lang. 0.46 18 506 595 24 0 -24
TOTAL: 100 4 018 999 129 228 5 130 1 767 -3 363
1 Source: Statistics South Africa (2012 - Latest Census, 2011)2 This is calculated as a proportion of the total known number of Foundation Phase learners in 2012 (4 018 999 – source
Department of Basic Education. Education Statistics in South Africa 2012), and applying the Stats SA language
demographic percentages.3 Graduate numbers from all the public universities, excluding UNISA, for which 2012 mother tongue data are not
available, and considering that a good proportion of UNISA students are already people teaching in schools, and so not
actually part of new teacher supply.
Table 11 illustrates that, across the board, the teacher education system is not producing sufficient
numbers of foundation phase teachers across all the language groups (estimated negative gap of 3 363
in 2012). This is in keeping with the previous data which pointed to a general under-supply of
Foundation Phase teachers. However, the deficit in African language-speaking FP teachers also stands
48
out in Table 11, with isiXhosa being the most under-represented in terms of sheer numbers. This is
reflected more vividly in Figure 8, which shows the deficit in African language-speaking FP graduates
contrasted with the strong supply of Afrikaans and English graduates. The only African language
spoken as mother tongue by a comparably strong supply of ITE graduates is isiZulu, but despite this,
the shortfall for this language group is still the second-highest in terms of numbers.
Figure 9: Foundation Phase: Supply of NTGs per mother tongue (blue), and supply-demand gap
per mother tongue (red), 2012
Source: University submissions to DHET, 2013
The current reality is that small numbers of students who have an indigenous African language as a
home language graduate as newly qualified Foundation Phase teachers. Since very few universities
actually prepare students as teachers of African languages as subjects, most of these graduates are
actually not qualified to teach the African language, and in many cases are limited in their ability to
use it adequately as a language of learning and teaching.
3.2 National supply-demand analysis at level of learning areas and subjects
3.2.1 Methodological challenges relating to supply-demand analysis at the learning area/
subject level
Analysing teacher supply and demand at the level of learning areas (LAs) and school subjects presents
a number of quite complex difficulties, discussed below for the benefit of readers who wish to
understand the technical background to the estimates and calculations presented in the next section.
-1000
-800
-600
-400
-200
0
200
400
600
800
49
Firstly, with regard to supply, there were, at the time of finalising this report, a number of
inconsistencies in the individual graduate data furnished by some universities, both in the
categorisation of subject specialisations offered by the various universities, and in the number of
subjects in which graduates have specialised. For example, some universities categorised FET subjects
as SP subjects, or vice versa, or offered programmes bearing the names of subjects from the former
national school curriculum, i.e. subjects that are no longer taught as such. Graduates were recorded as
having qualified with one, two or three subject specialisations, which renders the use of the full-time
equivalent (FTE) device problematic (further problems with this device are discussed below).
With regard to demand on the other hand, neither the phases nor the subjects taught by teachers are
recorded in the PERSAL database, which is the only source of actual national and provincial
termination data. Usable data from the Annual School Survey (ASS) on the subjects and grades that
teachers teach were unavailable in time for this report, though in future they should help considerably
in determining both the existing teaching stock per Learning Area or subject, and in estimating the
replacement demand per Learning Area or subject. Thus at this stage replacement demand has to be
estimated on the basis of a common attrition rate for all four phases, which assumes that teacher
attrition remains constant across all the phases.
Secondly, there are obstacles in the way of predicting supply-demand gaps with regard to subject
specialisation. Since the enrolment planning targets do not specify subject or phase specialisations,
projections of the supply of NTGs with these specialisations might be based on regression analysis of
past trends. However, before 2012 universities’ reported individual data on the subject specialisations
of their ITE graduates were very uneven. As a result, this report does not attempt to predict cumulative
totals for 2020 at the subject level, but restricts itself to reporting estimates of supply and demand for
the year 2012. Even doing this presents a problem, as there are large gaps in UNISA’s 2012 subject
specialisation data, UNISA being by far the biggest supplier of new teacher graduates.
Thirdly, an analysis of teacher supply and demand with respect to Intermediate Phase learning area
specialisations is highly problematic. On the supply side this is chiefly on account of the widely-
differing number of subject specialisations required of students by the various universities for this
phase. On the demand side, the practice in schools of having “class teachers” responsible for teaching
the majority of subjects to single classes in the Intermediate Phase is widespread but not universal;
thus there is no practical common basis for calculating teachers per subject. This makes attempts to
estimate replacement demand for teachers of Grade 4-6 Social Sciences or Mathematics, for example,
somewhat meaningless.
In light of these difficulties, this analysis has employed a less-than-ideal alternative methodology.
Since 2012, the universities’ reported individual data on the subject specialisations of their Senior and
FET Phase graduates have begun to be more reliable and commensurable than in the past, hence tables
which present the 2012 teacher supply-demand gap for these two phases are provided in section 3.2.2.
However, it must be pointed out that these furnish only replacement demand estimates because of the
current unavailability of usable individual Annual School Survey data on teachers per subject. Instead,
for the Senior Phase, the National Curriculum Statement’s official time allocation per learning area is
employed as a proxy in calculating the number of serving teachers required per learning area (which in
50
turn is used to calculate the SP replacement demand per learning area). In estimating the number of
serving teachers and replacement demand per learning area in the FET Phase, the more customary
calculation based on dividing the learner enrolments (LEs) by the learner/educator ratio (LER) is used.
In this case, however, the number of candidates who wrote the National Senior Certificate (NSC)
examination at the end of Grade 12, plus pro rata calculations of the number of learners per subject in
Grades 10 and 11, is used as a proxy for learner enrolments.
However, caution must be exercised in interpreting these subject specialisation tables, especially the
FET table. For instance, the aggregate supply-demand gap in the latter indicates a hefty undersupply,
although we know that there is something of an oversupply in this phase as a whole. A large part of the
reason for this is the absence of the UNISA graduates from the equation (at 3 936, this accounts for
28.7%, and in 2013 one third, of the total output of ITE graduates from all the universities). At more or
less 2 specialisations each, this should account for about 7 872, and in 2013 11 000 more subject
specialisations in the supply.
Another important reason for caution is that much of the logic employed in developing and applying
the supply-demand model, which works well at national, provincial and even phase level, breaks down
for a number of reasons when the model is used at the subject level, which becomes unexpectedly
complex. For one thing, the method of estimating the number of serving FET teachers (and attrition)
per subject for grades 10 and 11, based on the number of NCS candidates, rests on two assumptions:
(1) that the same secondary school LER (26.2) would apply equally in all subjects – this is highly
unlikely, in fact; and (2) that the same proportions of Grade 11 and Grade 10 to Grade 12 learner
enrolments (58.4% and 99.96% respectively) would apply in all subjects.
Also, while the method just described works quite well up to a point, it inflates the number of teachers
actually needed – basing replacement demand on the number of learner enrolments per FET subject
neglects the fact that a single Physical Sciences teacher will typically teach the subject to the Grade 10,
11 and 12 classes – and possibly some other subject as well.
Another instance of the challenges in the subject specialisation terrain is the limited applicability of the
full-time equivalent (FTE) concept, however well it may work at the phase level. We have included an
FTE NTG column in both the SP and FET tables (Tables 12 and 13), but the FTE figures are not
applied in trying to capture the supply-demand gap. This is because the table is aimed at reflecting how
many new teacher graduates might fill the estimated posts per subject which have been vacated as a
result of attrition. The teachers leaving the system are represented as whole numbers of teachers who
taught History, English, or Maths etc., regardless of the fact that an indeterminate number of them
would have been teaching another subject (or subjects) as well, while some taught just one subject.
And most, but not all, FET learners take seven subjects. So the total “replacement demand”, if
calculated on the basis of FTEs, would far exceed 3.97% (the 2012 all-phase attrition rate)of the
serving FET teachers, just as the total LEs on which this calculation is based far exceed the total LEs
actually in the FET phase.
The teachers lost to attrition can, however, be replaced by “double-counted” NTGs , i.e. head-counted
NTGs, but not by FTE NTGs, who in some cases represent half a teacher, and in other cases a third or
even a fifth of a teacher – all to be thus calculated on different proportional bases. In other words, it is
51
more useful to think of replacing lost “subject specialisms” with NTG “subject specialisms”, rather
than replacing teachers lost with NTGs, since the otherwise-useful FTE concept blurs NTGs as a result
of the different universities producing different numbers of specialisations per graduate19.
Another reason for keeping FTEs out of supply-demand calculations per subject is that in calculating
the FTEs, Mathematics, Life Orientation and the Languages are each counted as single specialisations
where those universities which offer combined SP/FET programmes report them separately as both SP
and FET specialisations for the same graduate. This is logical, but it introduces a certain inconsistency
in that graduates offering, say, Natural Sciences, Life Sciences and Maths would count as having three
subjects (i.e. FTEs of ⅓ each), whereas graduates offering, say, SP Mathematics, FET Mathematics
and Physical Sciences would be reflected as having only 2 subjects (but FTEs of ½ each). If
headcounts are employed, each SP or FET “specialism” is counted, avoiding this inconsistency. Both
HC and FTE distort the picture in different ways; however a mathematical “middle ground” ratio
becomes abstract and difficult for readers to conceptualise. The headcount option is more
straightforward and workable, but readers should bear in mind its limitations when reading the tables
in sections 3.5 – 3.7.
3.2.2 Applying a limited model to determine an indicative supply-demand gap per learning
area/subject in the Senior and FET Phases: replacement demand compared with new
teacher graduate supply
As mentioned in section 3.2.1, this report does not attempt an analysis of teacher supply and demand
with respect to Intermediate Phase learning area specialisations, chiefly on account of the widely-
differing number of subject specialisations offered by the various universities for this phase which tend
to preclude meaningful supply-side calculations, but also because the practice of having “class
teachers” responsible for the majority of subjects in this phase is still widespread. The latter makes
attempts to estimate replacement demand for teachers of, for example, Grade 4-6 Social Sciences
somewhat meaningless.
This report consequently restricts its focus on learning area (LA) and subject specialisations to the
Senior and FET Phases. Table 12 below shows the estimated national supply-demand gap for the
Senior Phase (SP) in 2012.20 As pointed out above, the unavailability of reliable data on teachers per
subject at the time of finalising this report required that the number of serving teachers per SP learning
area be estimated, based on the proportionate time allocated to each learning area` in the National
Curriculum Statement. The all-phase attrition rate for 2012, 3.97%, is then applied to these numbers to
provide an estimate of the replacement demand, which is balanced against the supply of new teacher
graduates (headcount) qualified to teach each LA. Headcounts are used for the calculation of the
supply-demand gap, despite the resultant double-counting, because of the difficulties outlined in
19 As the new policy on Minimum Requirements for Teacher Education Qualifications takes effect, the number of subjectspecialisations per SP or FET programme will standardise.
20As was pointed out in 3.2.1 above, the absence of enrolment planning targets for subject or phase specialisations, and ofreliable subject specialisation data from universities prior to 2013, rule out predictive analysis at the level of learningareas and subjects.
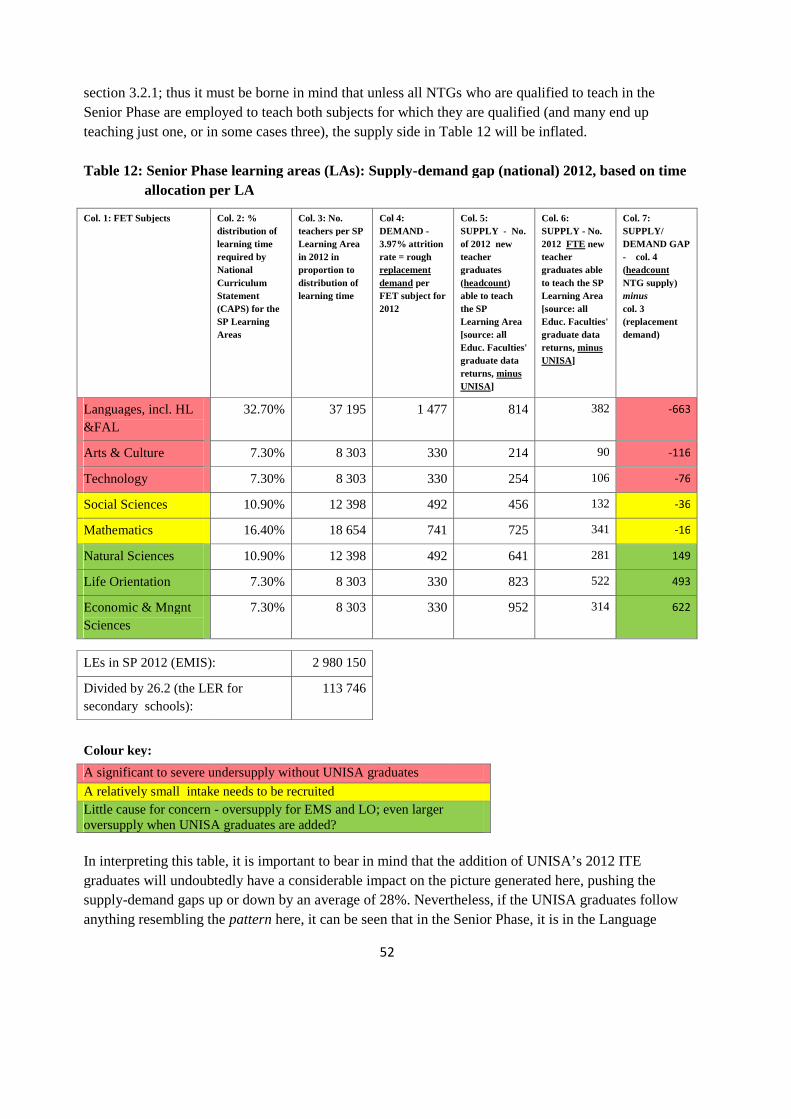
52
section 3.2.1; thus it must be borne in mind that unless all NTGs who are qualified to teach in the
Senior Phase are employed to teach both subjects for which they are qualified (and many end up
teaching just one, or in some cases three), the supply side in Table 12 will be inflated.
Table 12: Senior Phase learning areas (LAs): Supply-demand gap (national) 2012, based on time
allocation per LA
Col. 1: FET Subjects Col. 2: %
distribution of
learning time
required by
National
Curriculum
Statement
(CAPS) for the
SP Learning
Areas
Col. 3: No.
teachers per SP
Learning Area
in 2012 in
proportion to
distribution of
learning time
Col 4:
DEMAND -
3.97% attrition
rate = rough
replacement
demand per
FET subject for
2012
Col. 5:
SUPPLY - No.
of 2012 new
teacher
graduates
(headcount)
able to teach
the SP
Learning Area
[source: all
Educ. Faculties'
graduate data
returns, minus
UNISA]
Col. 6:
SUPPLY - No.
2012 FTE new
teacher
graduates able
to teach the SP
Learning Area
[source: all
Educ. Faculties'
graduate data
returns, minus
UNISA]
Col. 7:
SUPPLY/
DEMAND GAP
- col. 4
(headcount
NTG supply)
minus
col. 3
(replacement
demand)
Languages, incl. HL
&FAL
32.70% 37 195 1 477 814 382 -663
Arts & Culture 7.30% 8 303 330 214 90 -116
Technology 7.30% 8 303 330 254 106 -76
Social Sciences 10.90% 12 398 492 456 132 -36
Mathematics 16.40% 18 654 741 725 341 -16
Natural Sciences 10.90% 12 398 492 641 281 149
Life Orientation 7.30% 8 303 330 823 522 493
Economic & Mngnt
Sciences
7.30% 8 303 330 952 314 622
LEs in SP 2012 (EMIS): 2 980 150
Divided by 26.2 (the LER for
secondary schools):
113 746
Colour key:
A significant to severe undersupply without UNISA graduates
A relatively small intake needs to be recruited
Little cause for concern - oversupply for EMS and LO; even largeroversupply when UNISA graduates are added?
In interpreting this table, it is important to bear in mind that the addition of UNISA’s 2012 ITE
graduates will undoubtedly have a considerable impact on the picture generated here, pushing the
supply-demand gaps up or down by an average of 28%. Nevertheless, if the UNISA graduates follow
anything resembling the pattern here, it can be seen that in the Senior Phase, it is in the Language
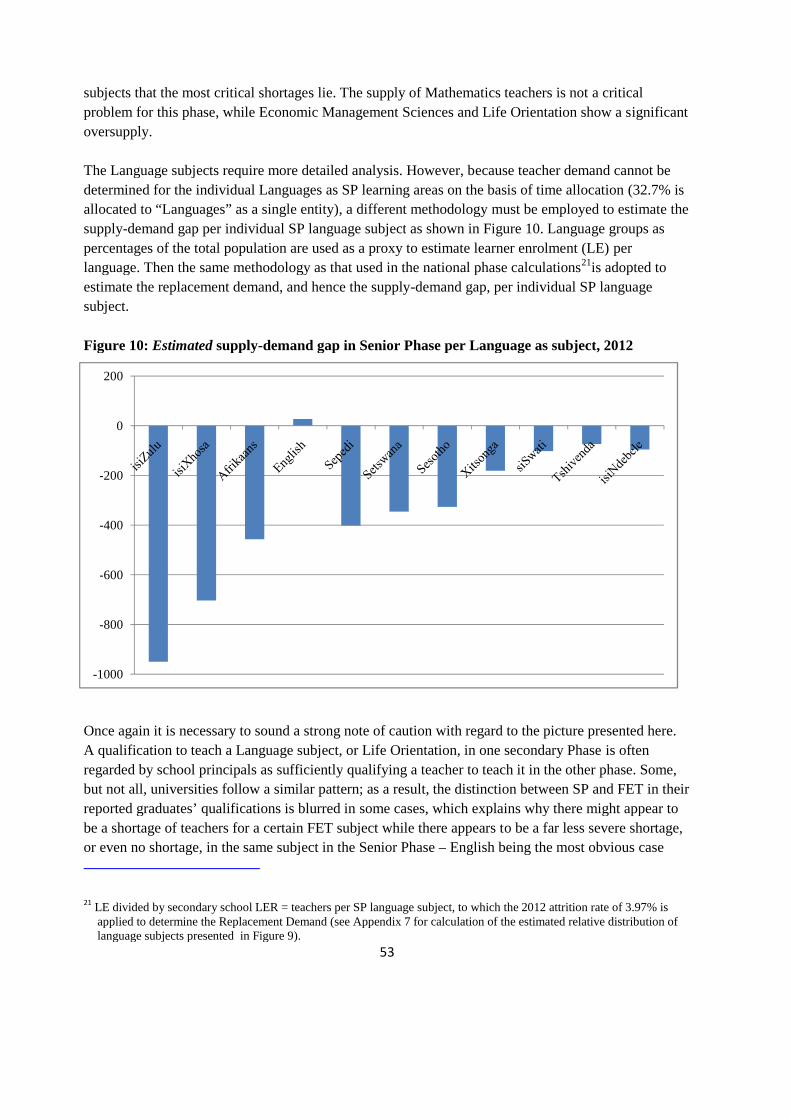
53
subjects that the most critical shortages lie. The supply of Mathematics teachers is not a critical
problem for this phase, while Economic Management Sciences and Life Orientation show a significant
oversupply.
The Language subjects require more detailed analysis. However, because teacher demand cannot be
determined for the individual Languages as SP learning areas on the basis of time allocation (32.7% is
allocated to “Languages” as a single entity), a different methodology must be employed to estimate the
supply-demand gap per individual SP language subject as shown in Figure 10. Language groups as
percentages of the total population are used as a proxy to estimate learner enrolment (LE) per
language. Then the same methodology as that used in the national phase calculations21is adopted to
estimate the replacement demand, and hence the supply-demand gap, per individual SP language
subject.
Figure 10: Estimated supply-demand gap in Senior Phase per Language as subject, 2012
Once again it is necessary to sound a strong note of caution with regard to the picture presented here.
A qualification to teach a Language subject, or Life Orientation, in one secondary Phase is often
regarded by school principals as sufficiently qualifying a teacher to teach it in the other phase. Some,
but not all, universities follow a similar pattern; as a result, the distinction between SP and FET in their
reported graduates’ qualifications is blurred in some cases, which explains why there might appear to
be a shortage of teachers for a certain FET subject while there appears to be a far less severe shortage,
or even no shortage, in the same subject in the Senior Phase – English being the most obvious case
21 LE divided by secondary school LER = teachers per SP language subject, to which the 2012 attrition rate of 3.97% isapplied to determine the Replacement Demand (see Appendix 7 for calculation of the estimated relative distribution oflanguage subjects presented in Figure 9).
-1000
-800
-600
-400
-200
0
200

54
(see Table 13 below). Coupled with the above-mentioned absence of UNISA subject specialisation
data, this source of distortion makes certain subjects appear to be experiencing more of a shortage than
is in fact the case. It is clear that the report templates sent out by the DHET, as well as compliance in
providing the data requested, will need to be improved in the future.
Table 13 shows the estimated national supply-demand gap for the FET Phase in 2012. Again,
currently unavailable data on teachers per subject necessitate proxy-based estimates of the number of
serving teachers per learning area, in this case based on the number of candidates who wrote the
National Senior Certificate (NSC) examination at the end of 2012, added to pro rata calculations of
the number of learner enrolments per subject in Grades 10 and 11. Dividing the estimated FET Phase
LEs per subject thus arrived at, by the secondary school LER for 2012 of 26.2, produces the total
estimated number of serving teachers per FET subject in Column 2. As with the SP calculations in
Table 9, the 3.97% all-phase attrition rate for 2012 is then applied to the number of serving teachers
per subject to determine the estimated replacement demand (Column 3). Once again, this is balanced
against the headcount of the new teacher graduate supply per FET subject, for the reasons given in
3.1.1.
Table 13: FET Phase subjects: Supply-demand gap (national) 2012, based on estimated FET
learner enrolments per subject
Col. 1: FET Subjects Col. 2: Total
estimated
number of
teachers per
FET subject
in Grades
10,11 and 12,
2012 2
Col 3:
DEMAND -
3.97%
Attrition
rate =
rough
replacement
demand per
FET subject
for 2012
Col. 4: SUPPLY -
No. of 2012 new
teacher
graduates
(headcount) able
to teach the FET
subject [source:
all Educ.
Faculties'
graduate data
returns, minus
UNISA]
Col. 5: SUPPLY -
No. of 2012 FTE
new teacher
graduates able to
teach the FET
subject [source: all
Educ. Faculties'
graduate data
returns, minus
UNISA]
Col. 6:
SUPPLY/
DEMAND GAP
- col. 4
(headcount
NTG supply)
minus
col. 3
(replacement
demand) 3
Life Orientation 92 222 3 661 878 409 - 2 783
English 1 92 219 3 661 936 463 - 2 725
Mathematical Literacy 52 008 2 065 127 83 - 1 938
Life Sciences 49 613 1 970 549 269 - 1 421
Geography 38 117 1 513 386 176 - 1 127
Afrikaans 1 25 369 1 007 132 63 - 875
isiZulu 1 24 947 990 184 90 - 806
Physical Sciences 31 837 1 264 549 263 - 715
Mathematics 40 210 1 596 1 004 465 - 592
Agricultural Sciences 13 978 555 37 21 - 518
Tourism 16 843 669 177 73 - 492

55
isiXhosa 1 13 538 537 153 80 - 384
Sepedi 1 10 815 429 71 36 - 358
History 16 878 670 339 137 - 331
Setswana 1 6 539 260 9 5 - 251
Business Studies 34 875 1 385 1 194 678 - 191
Consumer Studies 6 406 254 68 44 - 186
Economics 24 062 955 784 405 - 171
Xitsonga 1 3 713 147 14 7 - 133
siSwati 1 2 975 118 0 0 - 118
Sesotho 1 4 581 182 71 35 - 111
Tshivenda 1 2 398 95 0 0 - 95
Accounting 24 051 955 871 421 - 84
Engineer. Graphics & Design 4 431 176 107 45 - 69
Hospitality Studies 1 496 59 3 2 - 56
Religion Studies 752 30 4 2 - 26
isiNdebele 1 630 25 0 0 - 25
Agric. Management Practices 216 9 0 0 - 9
Civil Technology 1 547 61 56 32 - 5
Design 376 15 11 5 - 4
Agricultural Technology 118 5 3 3 - 2
Electrical Technology 887 35 42 22 7
Visual Arts 1 133 45 63 21 18
Dramatic Arts 1 215 48 67 31 19
Mechanical Technology 1 027 41 76 32 35
Information Technology 780 31 74 44 43
Music 300 12 66 33 54
Computer App. Technology 7 898 314 486 245 172
25 845 9 591
Notes:1 The totals for these Language subjects in Column2 include HL, FAL & SAL2 Note the two unavoidable assumptions inestimating these numbers on the basis of thenumber of NSC exam candidates, outlined on page
Colour key:
Would be a significant to severe
undersupply without UNISA graduates
Does not indicate that a very large intake
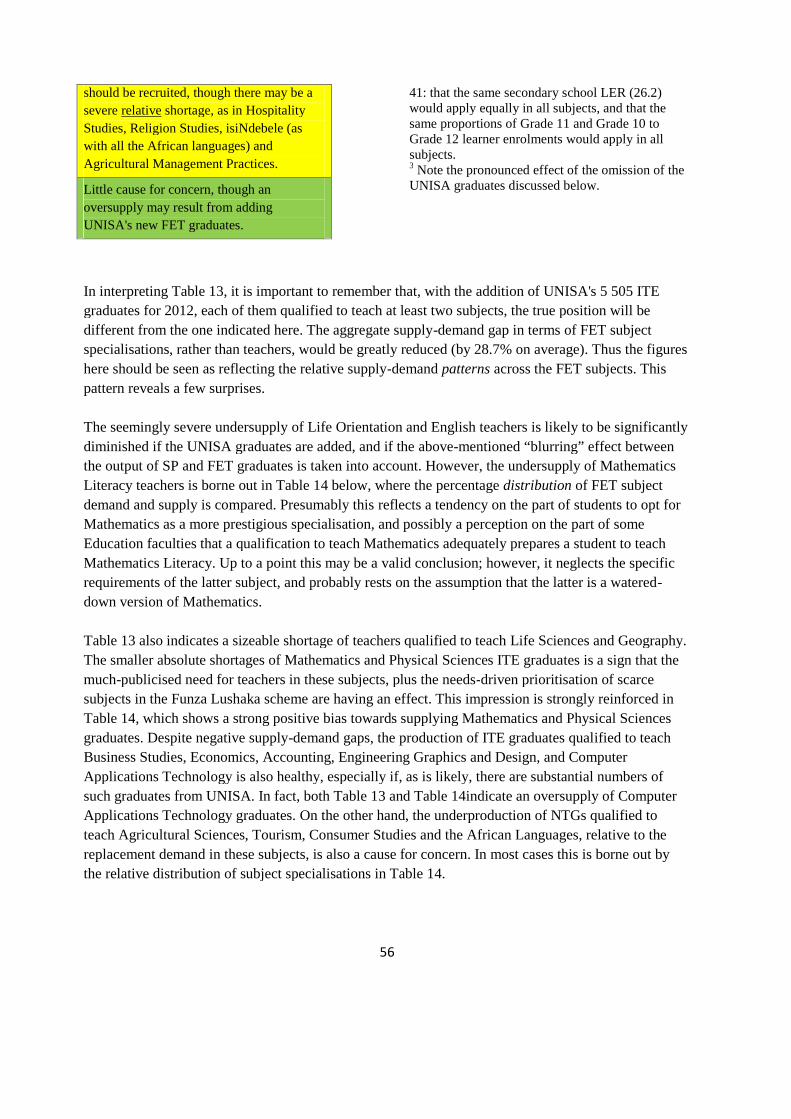
56
In interpreting Table 13, it is important to remember that, with the addition of UNISA's 5 505 ITE
graduates for 2012, each of them qualified to teach at least two subjects, the true position will be
different from the one indicated here. The aggregate supply-demand gap in terms of FET subject
specialisations, rather than teachers, would be greatly reduced (by 28.7% on average). Thus the figures
here should be seen as reflecting the relative supply-demand patterns across the FET subjects. This
pattern reveals a few surprises.
The seemingly severe undersupply of Life Orientation and English teachers is likely to be significantly
diminished if the UNISA graduates are added, and if the above-mentioned “blurring” effect between
the output of SP and FET graduates is taken into account. However, the undersupply of Mathematics
Literacy teachers is borne out in Table 14 below, where the percentage distribution of FET subject
demand and supply is compared. Presumably this reflects a tendency on the part of students to opt for
Mathematics as a more prestigious specialisation, and possibly a perception on the part of some
Education faculties that a qualification to teach Mathematics adequately prepares a student to teach
Mathematics Literacy. Up to a point this may be a valid conclusion; however, it neglects the specific
requirements of the latter subject, and probably rests on the assumption that the latter is a watered-
down version of Mathematics.
Table 13 also indicates a sizeable shortage of teachers qualified to teach Life Sciences and Geography.
The smaller absolute shortages of Mathematics and Physical Sciences ITE graduates is a sign that the
much-publicised need for teachers in these subjects, plus the needs-driven prioritisation of scarce
subjects in the Funza Lushaka scheme are having an effect. This impression is strongly reinforced in
Table 14, which shows a strong positive bias towards supplying Mathematics and Physical Sciences
graduates. Despite negative supply-demand gaps, the production of ITE graduates qualified to teach
Business Studies, Economics, Accounting, Engineering Graphics and Design, and Computer
Applications Technology is also healthy, especially if, as is likely, there are substantial numbers of
such graduates from UNISA. In fact, both Table 13 and Table 14indicate an oversupply of Computer
Applications Technology graduates. On the other hand, the underproduction of NTGs qualified to
teach Agricultural Sciences, Tourism, Consumer Studies and the African Languages, relative to the
replacement demand in these subjects, is also a cause for concern. In most cases this is borne out by
the relative distribution of subject specialisations in Table 14.
should be recruited, though there may be a
severe relative shortage, as in Hospitality
Studies, Religion Studies, isiNdebele (as
with all the African languages) and
Agricultural Management Practices.
41: that the same secondary school LER (26.2)would apply equally in all subjects, and that thesame proportions of Grade 11 and Grade 10 toGrade 12 learner enrolments would apply in allsubjects.3 Note the pronounced effect of the omission of theUNISA graduates discussed below.Little cause for concern, though an
oversupply may result from adding
UNISA's new FET graduates.

57
Table 14: FET subjects arranged in order of relative demand, compared with relative size of theheadcount supply (2012)
FET Subject DEMAND - %
distribution of
teachers lost/
required across
FET subjects in
2012
SUPPLY - %
distribution of
new teacher
graduates across
FET subjects in
2012
English* 14.17 9.76
Life Orientation 14.17 9.15
Mathematical Literacy 7.99 1.32
Life Sciences 7.62 5.72
Mathematics 6.18 10.47
Geography 5.86 4.02
Business Studies 5.36 12.45
Physical Sciences 4.89 5.72
Afrikaans* 3.90 1.38
isiZulu* 3.83 1.92
Economics 3.70 8.17
Accounting 3.69 9.08
History 2.59 3.53
Tourism 2.59 1.85
Agricultural Sciences 2.15 0.39
isiXhosa* 2.08 1.60
Sepedi* 1.66 0.74
Computer Applications Technol. 1.21 5.07
Setswana* 1.00 0.09
Consumer Studies 0.98 0.71
Sesotho* 0.70 0.74
Engineering Graphics & Design 0.68 1.12
Xitsonga* 0.57 0.15
siSwati* 0.46 0.00
Tshivenda* 0.37 0.00
Civil Technology 0.24 0.58
Hospitality Studies 0.23 0.03
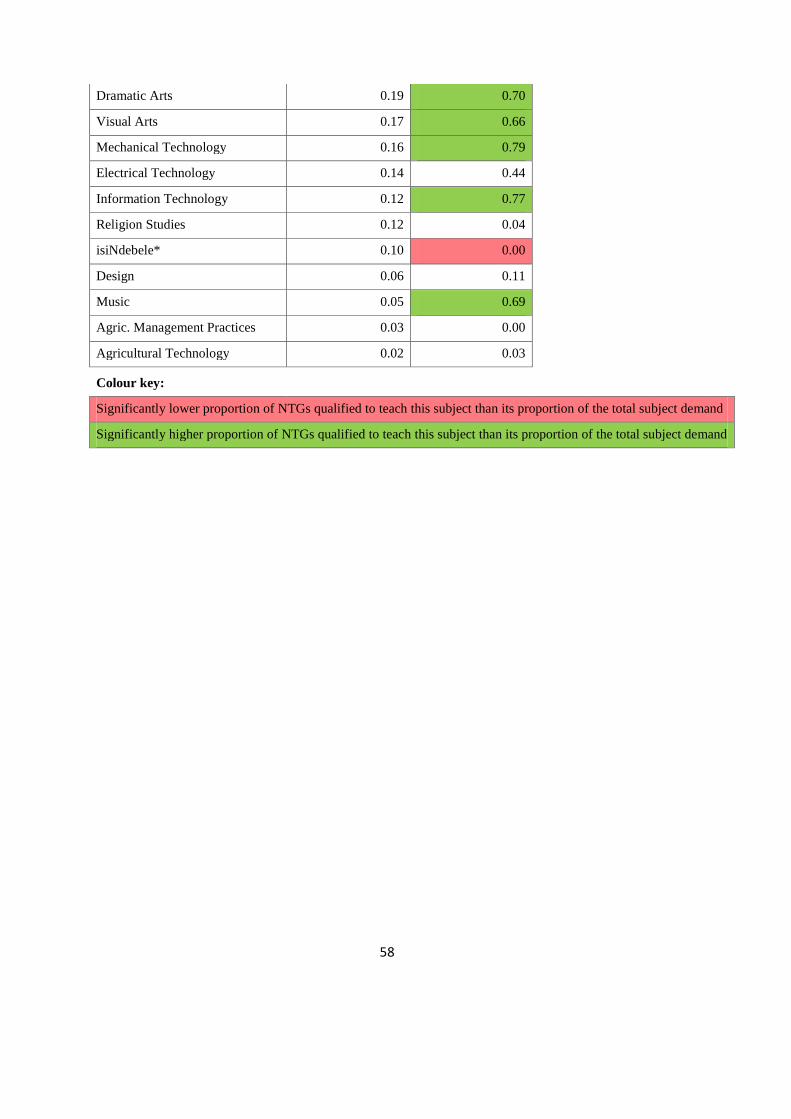
58
Dramatic Arts 0.19 0.70
Visual Arts 0.17 0.66
Mechanical Technology 0.16 0.79
Electrical Technology 0.14 0.44
Information Technology 0.12 0.77
Religion Studies 0.12 0.04
isiNdebele* 0.10 0.00
Design 0.06 0.11
Music 0.05 0.69
Agric. Management Practices 0.03 0.00
Agricultural Technology 0.02 0.03
Colour key:
Significantly lower proportion of NTGs qualified to teach this subject than its proportion of the total subject demand
Significantly higher proportion of NTGs qualified to teach this subject than its proportion of the total subject demand
59
PART 4: A FOCUS ON SUBSTANCE: WHAT ARE THE QUALITY IMPERATIVES IN
SCHOOL TEACHER EDUCATION?
Increasingly over the last few years, a range of teacher education stakeholders have raised questions
about the quality of new teacher graduates. More often than not, the questions have been anecdotal in
nature and based on personal experience of particular graduates in specific contexts. Commentators
have pointed to the inability of new teacher education graduates to cope with the practical side of
teaching. They have also pointed to possible tensions in teacher education programmes between theory
and practice, and between academic knowledge and professional knowledge. The perceived inability
of new teacher graduates to translate disciplinary learning developed in the university context to
curriculum delivery in the school context has been highlighted, as has the need to strengthen the
teaching practice component of teacher education programmes. In addition to this commentary, several
research studies and reviews have pointed to such qualitative challenges. These are discussed below.
4.1 Throughput and student success in teacher education programmes
Cohort analyses provide a more reliable indication of student success than simple pass rates or success
rates. This is because they are able to track individual students across time to determine their progress
through a qualification programme. The DHET recently conducted a cohort analysis of the 2005 intake
into the Bachelor of Education in all the public universities that offered this programme. The tables
below show the results of this analysis.
Table 15: Cohort analysis of 2005 Bachelor of Education (B Ed) intake in all South African
public universities: Percentage graduated
First-time entry
studentsGraduates from 2005 intake (%)
2005 2008 2009 2010 2011
5 847 41.6 53.1 57.3 60.3
Source: DHET cohort study
In 2005, 5847 students enrolled for a B Ed degree for the first time. In 2008, after four years of study,
41.6% of these students completed their studies. After five years of study, 53.1% students had
graduated. After seven years of study (by 2011), 60.3% of the students who had entered for a B Ed
Degree in 2005 graduated. Whilst not good enough, this is a better throughput rate than those
prevailing in most of the other undergraduate university programmes – the more so given that a
substantial number of the 2005 entrants would have been UNISA students enrolled in distance
education B Ed programmes which they are able to complete in a greater number of years than the
minimum of four that it takes to complete a full-contact B Ed.
However, while student throughput may be better in B Ed programmes, an analysis of dropout rates
indicates substantial room for improvement. The table below shows students that have dropped out of

60
the B Ed programme, i.e. in the cohort analysis they do not show up in any B Ed programme at any
public university in the country.
Table 16: Cohort analysis of 2005 Bachelor of Education (B Ed) intake in all South African
public universities: Percentage dropped out
First-time entry
studentsDropped out (%)
2005 2006 2007 2008 2009 2010 2011
5 847 16.1 22.7 25.8 29.5 30.9 31.1
Source: DHET cohort study
The table above shows that of the 5 847 students that enrolled for B Ed in 2005, by the end of the first
year of study (2006), 16.1% of them had dropped out, by the end of the 4th year of study (2009) 29.5%
of them had dropped out, and by the end of 6 years of study (2011), 31.1% of the students had dropped
out.
Clearly there is a need to undertake research to understand why B Ed students drop out of their study
programmes, and to identify additional effective mechanisms that can be put in place to ensure greater
retention. One of the underlying causes could be the inability of some of the B Ed programmes to
adequately support students.
4.2 The Council on Higher Education’s National Review of Academic and Professional
Programmes in Education
The Council on Higher Education (CHE) conducted a National Review of Academic and Professional
Programmes in Education between 2005 and 2007, and published a report in 2010. The parts of the
review report that focused on the initial teacher education programmes (PGCE and the B Ed) pointed
to a highly diverse teacher education system in which quality varies considerably across institutions
and in which there are varying conceptions of teacher education and teacher education practice. The
review evaluated programmes against 10 criteria. The areas in which programmes were rated most
poorly against minimum standards are highlighted with a cross (X).
Table 17: Outcomes of the CHE review of the B Ed and PGCE programmes at universities
Review Criteria PGCE B Ed
Criterion 1 National, Institutional and Unit Context
Criterion 2 Programme Design X X
Criterion 3 Student Recruitment, Admission and Selection
Criterion 4 Staffing
Criterion 5 Teaching and Learning X

61
Criterion 6 Programme Coordination and Work-Based Learning X X
Criterion 7 Student Assessment X X
Criterion 8 Infrastructure and Library Resources
Criterion 9 Student Retention and Throughput X
Criterion 10 Programme Review X X
The review report identifies the criteria against which programmes were rated poorly as programme
practices, further emphasizing the need to address performance in these areas. These are the criteria
that “have the most direct bearing on the quality and competence of the students who enter our schools
as fully qualified teachers”. The report concluded that “…a large proportion of the PGCE
(programmes) are not providing the basics of a good quality teacher qualification” (CHE, 2010:57).
These areas need to be the focus of interventions to improve the quality of teacher education.
The report also highlighted the varying ways in which institutions interpreted policy requirements, and
the tendency of a number of institutions and programmes to rigid compliance with policy and
regulations to the extent that such regulation actually becomes the curriculum for the programme,
while others view regulation as a “reasonably flexible framework that needs to be adapted to sound
educational theory and socio-educational context” (CHE, 2010:75). It questioned the availability of
adequate scholarship capacity in faculties and schools of education, and identified this as an area for
targeted improvement. It also questioned the ability of the “teaching community’s current ability to
establish benchmarks of quality provision with sufficient precision” (CHE, 2010:88).
The wide variation in programme design and delivery points to little interaction and collaboration
between institutions in the development and design of programmes, and little common understanding
and/or agreement across the sector about what it means to develop a teacher for the South African
context.
Regarding administration and communication issues in the delivery of the B Ed, the report
identified the following challenges:
Resource provisioning for teacher education, with many HEIs not seeing this as an internal
institutional resource priority.
Blurring of responsibility in cases where delivery of the curriculum spans faculties and schools.
The low matric entrance requirements for admission to the B Ed, and the lack of any professional
screening.
The status and prevalent perceptions of teaching as a career.
The tendency at some institutions, especially historically disadvantaged institutions (HDIs), to
admit many more students than can be accommodated by the faculty’s carrying capacity, in order
to increase or maintain subsidy income.
Homogenous student populations and under-representation of Africans.
Questions about the ability of programmes, for example the B Ed in Foundation Phase teaching, to
prepare teachers adequately to teach in, and to teach, the African languages.

62
In terms of system and management issues, the following areas of concern were highlighted by the
report:
Historical staff racial demographics.
Generally low level of qualifications of staff.
Difficulty in attracting suitably qualified and experienced staff whilst also ensuring that equity and
transformation goals are met.
Poor engagement of staff with research.
Workload allocation challenges, with excessive allocations in some cases.
The report identified a range of weaknesses regarding the work-based (teaching practice)
component of the B Ed programmes, and it indicated that “the core of the problem is inadequate
resourcing of this function within resource allocation models” (CHE, 2010:94). These weaknesses
included:
a lack of clear frameworks for the responsibilities of school-based mentors
the lack of a common understanding of mentoring and assessment rubrics
a lack of structured programmes of induction and support for school-based mentors
the limited value attached to assessment by school mentors
a lack of administrative support to manage the relationship with schools
the insufficient range of learning environments experienced by students
students expected to identify schools and arrange their own placements
inadequate evaluation of the suitability of schools
a lack of human resources to enable academic staff to visit students on teaching practice with
sufficient frequency and duration, thus inadequate professional supervision of students on teaching
experience
a lack of systems for monitoring student performance over successive years of study, with
appropriate attention to year-by-year progression in outcomes and assessment standards.
With respect to programme design problems, the report indicated that these “resulted from
institutions’ incapacity to meet minimum standards of internal coherence, alignment with purpose and
intellectual credibility in terms of the relationship between theoretical, practical and experiential
knowledge” (CHE, 2010:95).
Programme design weaknesses were evident in programmes:
that lacked a coherent conceptual framework or set of intellectual principles
that were lacking in critical enquiry and intellectual rigour
that compromised intellectual depth in favour of professional and experiential breadth
that were put in place as a technicist response to policy and regulations
that did not have effective programme co-ordination capacity and processes in place

63
that had weak or non-existent systems in place for regular review and curriculum development,
which took account of all aspects of the programme, including the school-based component
where assessment requirements did not adhere to the cognitive demand expected at the level of the
programme.
The report suggests that the “balance of theoretical, professional and experiential knowledge in the
programme design is a critical measure of the programme’s responsiveness, and the likelihood of
achieving coherence and articulation” (CHE, 2010:98).
The report makes the point a number of times that there appeared to be no sectoral benchmark for
programme quality, and also that such a benchmark is unlikely to come about through externally
imposed regulatory mechanisms. It has to arise in and from the sector itself.
4.3 The Initial Teacher Education Research Project (ITERP)
The ITERP is a longitudinal research study designed to investigate initial teacher education through
examining how new teachers are being developed at universities, and following these new teachers
into their first teaching positions to understand how well prepared they are for teaching. ITERP is a
partnership between JET Education Services, DHET, DBE and the Education Deans Forum. It was
initiated in 2011. The first phase of the project has been completed. It involved case studies of how
Bachelor of Education programmes at five universities are preparing students to become teachers of
Mathematics and English in the Intermediate Phase. The case studies were selected to provide a
representative sample of the teacher education universities. A number of interesting and important
findings regarding quality imperatives in teacher education have been made, which are described in a
range of reports emanating from the research project, and which can be obtained from www.jet.org.za.
General findings include:
The content of modules and hence of programmes varies widely amongst universities. Teaching
practice is the area with the greatest variation in terms of quantity and quality. The programmes
seem to lack a strong underlying logic and coherence (reinforcing the findings of the CHE review).
The entrance requirements for ITE education programmes also vary across institutions, are mostly
low in comparison with most other disciplines, and are only of an academic nature, i.e. there is
little or no focus on assessing commitment to a career in teaching as part of the admissions process.
In relation to the IP English courses:
The academic literacy courses offered to IP student teachers reflect, and will likely contribute to,
different constructions of what constitutes a literate teacher.
There is a lack of engagement in some of the institutions with new literacies studies.
The subject courses offered to IP English specialist student teachers reflect, and will likely lead to,
different constructions of what constitutes a good teacher of English.
A focus on children and adolescent literature is neglected or ignored at several institutions.
64
Insufficient attention appears to be paid to equipping IP student teachers to develop IP learners to
become proficient readers and producers of texts in a range of genres and modes. Insufficient
attention appears to be paid to reading pedagogics.
Human resource capacity differs markedly across institutions, impacting negatively on programme
delivery where capacity is weak or insufficient.
In relation to the IP Mathematics courses:
The number of IP student teachers specialising in mathematics is both small and highly variable
across institutions, and within institutions from one year to the next.
Lecturers report that IP student teachers come into university studies underprepared.
The admission requirement for entrance into Mathematics courses for specialist IP Mathematics
teachers varies markedly across institutions.
The Mathematics courses vary markedly across institutions.
Whilst the ITERP study is a small-sample study drawing on the practices at only five out of 23
institutions involved in ITE, and is focused largely on Intermediate Phase programmes, purposeful
sampling enables a good degree of generalisation. It is likely that the findings emerging from the
ITERP study apply across the system and are likely to be applicable to other ITE programmes as well.
4.4 Steps that have already been taken to address qualitative issues in initial
teacher education
It is important to indicate that much work has already started to qualitatively strengthen teacher
education.
A new teacher education qualifications policy
In order to generate a common set of standards at the programme level for teacher education
qualifications across the country, a new teacher education qualification policy has been put in place.
The Policy on Minimum Requirements for Teacher Education Qualifications (PMRTEQ, DHET, 2015)
replaces the Norms and Standards for Educators, setting the parameters for a new set of qualifications
which will emphasize teacher knowledge and practice as key components of teacher education
programmes.
A national Teacher Education Programme Evaluation Committee (TEPEC) has been established,
comprising of members from the Department of Higher Education and Training, Department of Basic
Education, the South African Council of Educators (SACE) and the Education, Training and
Development Practices Sector Training Authority (ETDP SETA). All new PMRTEQ programmes
have to evaluated by this committee for recognition for employment in education.

65
First steps towards strengthening teaching practice through the establishment of Teaching
Schools and Professional Practice Schools
Teaching Schools (TSs) and Professional Practice Schools (PPs) are viewed as essential components
of the national teacher education system to ensure that the practice components of teacher education
programmes are more effectively addressed. Teaching schools are schools that are directly linked to
universities, and serve as “laboratory” schools to support the development of practice, especially in the
early stages of teacher education programmes. Professional practice schools are networks of schools
that will be set up across the country to enable the further development of professional practice in
diverse contexts. The establishment of such schools will go a long way towards ensuring that new
teacher graduates are better prepared and equipped for their role as new teachers in the diverse range
of South African classroom contexts.
Two research projects that investigated what the establishment of such schools would entail, and
which had the brief to develop norms and standards for such schools have just been concluded. The
research findings and recommendations will form the basis for consultation on the establishment of
these schools, which will hopefully lead to a plan for establishing the schools.
Strengthening Foundation Phase Teacher Education
Foundation Phase teacher education has recently been singled out over the last four years for much-
needed support and development. The Strengthening Foundation Phase Teacher Education
Programme, which focused on research, programme development and material development for
Foundation Phase teacher education, has supported the development of a strong early childhood
education research community with a strong identity and increasing status within the higher education
system. Specific achievements of this programme include the following:
The number of universities involved in Foundation Phase teacher education has grown from 13 to 21 universities. The
21 universities have been involved in a range of research, programme development and material development projects
and are putting new teacher education programmes in place that will prepare FP mother tongue teachers in all SA
languages.
The headcount enrolments in initial teacher education Foundation Phase programmes has grown from 10 073 students
in 2009 to 18 260 in 2012.
28 journal articles have been published in peer-reviewed journals so far.
The programme seeded the employment of 24 new childhood education academics at universities.
Scholarship support was provided for 7 Honours students, 54 M Ed students and 40 PhD students to undertake studies
in childhood education and/or childhood teacher education.
200 African language Bachelor of Education students were supported with full cost bursaries.
The programme assisted to establish the South African Journal of Childhood Education.
The programme assisted to establish the South African Research Association for Early Childhood Education.
The programme assisted to establish the University of Mpumalanga’s Siyabuswa Teacher Education Campus and a
Centre for African Language Teaching on the Campus.
While the achievements outlined above are substantial, there are also substantial challenges still to be
met. Part 5 of this report summarises what these are, as highlighted by the analysis and review
discussed in this report.

66
PART 5: SUMMARY OF ISSUES HIGHLIGHTED BY THIS ANALYSIS THAT MUST
BE ADDRESSED TO IMPROVE THE QUALITY OF EDUCATION
The supply-demand analysis presented in this study, as well as the findings of the CHE’s national B Ed
and the PGCE review and those that have thus far emerged from the Initial Teacher Education
Research Project, point to a number of issues that must be addressed in order to strengthen initial
teacher education. This chapter summarises these issues, and points to specific actions that must be
considered in order to respond effectively to them.
5.1 Absolute and relative school teacher shortages
The analysis described in this report suggests that by 2020, there is unlikely to be an absolute
teacher supply shortage in South Africa, but there are still likely to be relative shortages. Unless
appropriate steps are taken now, there are likely to be shortages with respect to teachers who are able
to teach some phases and subjects, and surpluses with respect to other phases and subjects.
Specifically, a shape imbalance is evident which favours the production of Senior Phase and FET
phase teachers to the disadvantage of teacher production for the Foundation Phase and the Intermediate
phase. This will need to be rectified.
Required action:
The Department of Higher Education and Training must engage universities to intentionally steer
greater resources to enable increased enrolments in Foundation Phase and Intermediate Phase initial
teacher education programmes, in order to achieve an initial teacher education balance that better
reflects the shape and needs of the schooling system.
Specifically regarding the Foundation Phase, the analysis highlighted the low numbers of African
Language Foundation Phase new teacher graduates. The report also points out that although some
NTGs may be African language mother tongue speakers themselves, this does not mean that the ITE
programme has specifically developed them to teach the African language as a subject, or to use the
African language as a language of learning and teaching to teach other subjects, for example
Mathematics.
Required action:
The number of African Language-speaking new Foundation Phase teacher graduates must be
increased and ITE programmes must ensure that these NTGs are able to teach the African language as
an academic subject, and to use the African language as a language of learning and teaching to teach
other subjects.
With regard to teacher supply and demand at the level of learning areas in the Senior Phase, it is in the
Language subjects that the most critical shortages lie.
In the FET Phase, the seemingly significant undersupply of teachers in some subjects (most notably
Life Orientation, English, Mathematical Literacy, Life Sciences and Geography) indicated in Tables
67
13 and 14 above should be viewed with caution in light of the absence of reliable UNISA subject
specialisation data, since the supply/demand ratio for the phase as a whole is healthy. Efforts to boost
the supply of Mathematics and Physical Sciences teachers appear to have reduced the shortage in these
once-scarce subjects to more modest levels. he supply of teachers qualified to teach Business Studies,
Economics, Accounting, Engineering Graphics and Design, and Computer Applications Technology
also appears to be reasonably healthy, with an oversupply of Computer Applications Technology
graduates. On the other hand, the apparent underproduction of NTGs qualified to teach Agricultural
Sciences, Tourism, Consumer Studies and the African Languages, relative to the replacement demand
in these subjects, is a cause for concern, especially as the first three of these subjects are not covered in
UNISA programmes.
Required action:
As data recording improves around subject specialisation demand and supply, enrolment planning and
enrolments at universities needs to be more responsive to needs in particular areas, whilst ensuring
that there is an adequate supply of new teachers to address the needs in all phases, and for all
subjects.
Teachers in excess, and unqualified, under-qualified or inappropriately qualified teachers (i.e. teaching
“out of field”) continue to clog the system, masking real local shortages and preventing new teacher
graduates from obtaining posts in some provinces. Although solutions to these “hidden demand”
challenges mostly involve continuing professional teacher development rather than initial teacher
education, and although it is currently not possible to quantify “out of field” teaching, which is
probably the most widespread of these problems, it would be remiss of this report to overlook such
issues in this summary.
Required action:
As adequate numbers of new teacher graduates become available, provinces most affected by the
continued practice of employing under-qualified, unqualified and out-of-field teachers cease this
practice. Provinces should also recruit more creatively, and view the pool of graduates coming out of
all the universities in the country as a source of new teachers, rather than focusing on recruiting only
from universities in the province. Where large number of unqualified or under-qualified teachers have
already been employed, affected provinces should take steps to identify all such cases and the
qualifications which the teachers in question require to be appropriately equipped in order to teach
their respective grades and subjects, and support them to obtain these qualifications through
continuing professional development within a defined period, perhaps as a condition of continued
employment. Provinces, SACE and universities will need to collaborate to ensure the provision of
appropriate continuous professional development opportunities and quality programmes.
Yet another relative shortage issue is the result of many teachers’ reluctance to teach in more remote
rural schools.
Required action: Incentivise teacher graduates to take up positions in difficult-to-fill schools. Apply
the Funza Lushaka Bursary Scheme placement conditions more stringently. Conduct an investigation

68
into the measures other countries use the address this issue with a view to identifying strategies that
may usefully be applied in South Africa.
5.2 The age challenge
This analysis has highlighted the advanced age profile of teachers currently in service who will be
retiring in large numbers towards 2030 and beyond. The growth in new teacher graduates will assist in
addressing this challenge, but will not be sufficient. It will also not make sense to massively expand
the traditional initial teacher education system to address what is likely to be a temporary challenge as
a “retirement bubble” moves through the system. Other innovative ways will need to be found to
address this challenge. This could for example involve the expansion of learnership-type programmes.
Required action:
The extent to which increasing retirements will impact on teacher availability in the next two decades
must be accurately quantified, as must the extent to which teacher supply will help address the
problem. Innovative measures must be put in place to address possible shortfalls.
5.3 Accelerating resignations
The analysis highlighted that since 2010, attrition due to resignations is on the increase.
Required action:
Research into teacher resignation must be conducted to understand the factors that are driving
resignation attrition upwards, to understand the further career pathways that teachers who resign
follow, and to identify measures which may be put in place to address this problem.
5.4 The need for subject-based knowledge and practice standards
The analysis has highlighted the wide variation in how universities prepare new teachers, and the
lack of agreement on what constitutes appropriate theoretical and pedagogical models for developing
teachers who can confidently and capably teach specific subjects, for example Mathematics or English
or science subjects.
Teacher knowledge and practice to enable the teaching of specific subjects have been identified as a
key area for improvement, possibly through the development of knowledge and practice standards for
specialist teachers, with the understanding that such knowledge and practice standards should be
developed by the field of teacher education, rather than be imposed upon it.
Required action:
The establishment of subject-based teacher education communities of practice should be supported,
and these should have as one of their functions the development of knowledge and practice standards

69
for the subject, which should in turn inform teacher education curricula for developing teachers of that
subject.
5.5 New teacher induction
The absence of an effective induction programme for new teachers severely compromises the
ability of new teachers to make the transition from the teacher education context to the teaching
context. The lack of this kind of support impacts on the effectiveness of new teachers and their
potential for further development, and is likely to be a major contributing factor to early attrition of
teachers who choose to leave the profession soon after entering it.
Required action:
Relevant role-players must collaborate to put in place an effective induction programme for new
teachers.
5.6 The need to qualitatively strengthen the teaching practice and WIL component of
initial teacher education programmes
Many of the qualitative concerns about teacher education relate to the efficacy of the teaching practice
component of initial teacher education programmes, the extent to which there is integration between it
and the theoretical components of the programme, the manner in which it is delivered, and the
contribution it makes to developing practical teaching competence in initial teacher education students,
Required action:
An effective and comprehensive teaching practice platform must be established that will enable
effective delivery of this component of initial teacher education programmes, and lead to the
production of new teacher graduates that are more deeply embedded in practice, and who can more
readily adapt to the demands of full-time teaching in diverse South African classroom contexts.
5.7 Inadequate or complete lack of focus on teachers for other education contexts
The analysis presented in this report highlighted a major gap in the country’s teacher production
system, the development of teachers for education contexts other than ordinary schools. New teacher
graduate supply in South Africa is focused exclusively on the production of school teachers. Where
attempts have been made to accommodate other kinds of teachers, this mostly happens through
modification of school teacher education programmes. There is clearly very little capacity in the
system for the development of early childhood educators (birth-4 years); teachers for schools that cater
for learners with special education needs (LSEN), teachers for technical schools, lecturers for technical
and vocational education and training (TVET) colleges, and educators and lecturers for the adult and
community education and training sector.
70
Required action:
Universities must be supported to develop the capacity to offer teacher education programmes in the
areas that have received little attention thus far, including programmes for ECD educators, inclusive
and special needs teachers and TVET and CET college lecturers.
5.8 The way forward
Programmes must be put in place to address the challenges that have been highlighted through this
analysis. It is important, however, that new initiatives to strengthen teacher education and to address
issues of size, shape and substance in teacher education take full account of what has already been
done, and build on this in order to maximise potential impact.
The Department of Higher Education and Training will respond directly to the imperatives that fall
within its mandate, through developing and implementing a comprehensive and integrated programme
over the next five years, staring in 2015/16. The Teaching and Learning Development Capacity
Improvement Programme (TLDCIP) will seek to strengthen university capacity for the development of
ECD (birth-4) educators; teachers for schools that cater for learners with special education needs
(LSEN); primary school teachers, TVET College lecturers and Community Education and Training
College lecturers. See Appendix 8 for a more detailed description on the TLDCIP.
It will also be important going forward to develop capacity in the system to regularly carry out
analyses of the kind reported in this document, in increasingly more advanced and sophisticated ways
so that the outcomes of such analyses can more reliably inform quality enhancement interventions in
teacher education in the future.

71
BIBLIOGRAPHY
Arends, F. (2011).Teacher shortages? The need for more reliable information at school level. Review
of Education, Skills Development and Innovation, November 2011. Human Sciences Research
Council (HSRC).pages 1-4.
Bertram, C., Appleton, S., Muthukrishna, N. and Wedekind, V. (2006). The career plans of newly
qualified South African teachers. South African Journal of Education, 26(1):1–13.
Chisholm, L. (2009a). The debate about re-opening teacher education colleges. Focus on learning and
teaching: Journal of the Helen Suzman Foundation
Chisholm, L. (2009b). Overview of research, policy and practice in teacher supply and demand 1994-
2008. Cape Town: HSRC Press and Koninkrijk der Nederlanden.
Cooper, J. and Alvarado, A. (2006).Preparation, recruitment and retention of teachers. Paris:
UNESCO, International Academy of Education (IAE) and Brussels: International Institute for
Educational Planning *(IIEP). Education Policy Series.
Crouch, L. (2000). Turbulence or orderly change? Teacher supply and demand in South Africa –
current status, future needs and the impact of HIV/Aids. MUSTER: Multi-Site Teacher
Education Research Project Discussion Paper 26. (Edited and abridged by K. Lewin) Centre for
International Education, University of Sussex Institute of Education.
Crouch, L. and Perry, H. (2003). Educators. In A. Kraak and H. Perold (eds.) Human Resources
Development Review: Education, Employment and Skills in South Africa. Cape Town: HSRC
Press. pages 476-499.
Cummins, J. (2009). Bilingual children’s mother tongue: Why is it important for Education?
Barcelona: House of Languages Reading Room: page 4. Accessed 26 March 2015:
http://www15.gencat.net/pres_casa_llengues/uploads/articles/Bilingual%20Childrens%20Mother
%20Tongue.pdf
Deacon, R. (2010).Teacher demand, supply and quality in South Africa and in international
perspective. Report commissioned by The Centre for Development and Enterprise (CDE).
Johannesburg: CDE.
Department of Basic Education, RSA. (2010a). The SACMEQ III Project in South Africa: A study of
the conditions of schooling and the quality of education: South Africa - Country Report. Pretoria:
Government Printers.
Department of Basic Education, RSA.(2010b). Education statistics in South Africa 2009.Pretoria:
Government Printers.

72
Department of Basic Education, RSA.(2011a). Education statistics in South Africa 2010.Pretoria:
Government Printers.
Department of Basic Education, RSA. (2011b). Universal access to Grade R Policy Framework:
Pretoria: Government Printers.
Department of Basic Education, RSA.(2012a). School realities 2012.Pretoria: Government Printers.
Department of Basic Education, RSA.(2012b). Unpublished presentation to joint sitting of Basic
Education and Higher Education Portfolio Committee.
Department of Basic Education, RSA.(2013a). Education statistics in South Africa 2011.Pretoria:
Government Printers.
Department of Basic Education, RSA. (2013b). Minister Angie Motshekga’s opinion piece:
Incremental introduction of African languages in public schools: Posted 22 October 2013.
Accessed 21 January 2014:
http://www.education.gov.za/Newsroom/OpinionPieces/tabid/1062/ItemId/3835/Default.aspx
Department of Basic Education, RSA.(2014a). Education statistics in South Africa 2012.Pretoria:
Government Printers.
Department of Basic Education, RSA. (2014b). Unpublished Report on National Recruitment
Database, July 2014. Pretoria: Department of Basic Education.
Department of Basic Education and Department of Higher Education and Training, RSA. (2011a).
Integrated strategic planning framework for teacher education and development in South Africa
(ISPFTED).Full version. Pretoria: Government Printers.
Department of Basic Education and Department of Higher Education and Training, RSA. (2011b).
Integrated strategic planning framework for teacher education and development in South Africa
(ISPFTED).Technical report. Pretoria: Government Printers.
Department of Basic Education and Department of Higher Education and Training, RSA. (2014).
Integrated strategic planning framework for teacher education and development in South Africa
(ISPFTED). Review of the first three-year phase, 2011-2014.Pretoria: Government Printers.
Department of Education, RSA. (2005a). Teachers for the Future: Meeting teacher shortages to
achieve education for all. Pretoria: Government Printers.
Department of Education, RSA.(2005b). A National Framework for teacher education in South Africa
(NFTED).Report of the Ministerial Committee on Teacher Education. Pretoria: Government
Printers.
73
Department of Education, RSA. (2007). National Education Policy Act (27/1996): The National Policy
Framework for Teacher Education and Development in South Africa. Government
Gazette502(29832), 26 April 2007. Pretoria: Government Printers.
Department of Education, RSA. (2009). Educator profile report: 2004 – 2008. Pretoria: Government
Printers.
Department of Higher Education and Training, RSA. (2010). Trends in teacher education2008 – 2009:
Teacher education enrolment and graduation patterns at public universities in South Africa.
Pretoria: Department of Higher Education and Training.
Department of Higher Education and Training, RSA. (2011a). Trends in teacher education2009 –
2010: Teacher education enrolment and graduation patterns at public universities in South
Africa. Pretoria: Department of Higher Education and Training.
Department of Higher Education and Training, RSA. (2011b). Trends in teacher graduate employment
2010: Employment of 2009 initial teacher education graduates by provinces in 2010. Pretoria:
Department of Higher Education and Training.
Department of Higher Education and Training, RSA.(2012). Expansion of Teacher Education.
Unpublished addendum to discussion document on national colleges. Pretoria: Department of
Higher Education and Training.
Department of Higher Education and Training, RSA. (2013a). Trends in teacher education2011:
Teacher education enrolment and graduation patterns at public universities in South Africa.
Pretoria: Department of Higher Education and Training.
Department of Higher Education and Training, RSA. (2013b). Trends in teacher graduate employment
2011: Employment of 2010 initial teacher education graduates by provinces in 2011. Pretoria:
Department of Higher Education and Training.
Education Labour Relations Council (ELRC). (2005). Study of demand and supply of educators in
South African public schools: Results of a comprehensive survey of factors determining educator
supply and demand in South African public schools. Media brief.
Green, W., Parker, D., Deacon, R. and Hall, G. (2011). Foundation Phase teacher provision by public
higher education institutions in South Africa. South African Journal for Childhood Education,
University of Johannesburg. 1(1): 109-122.
Gustaffson, M. (2009). Teacher supply patterns in the payroll data. Unpublished Department of Basic
Education report.

74
Gustaffson, M. (2014).Inflow of new teachers into the public system. Unpublished Department of
Basic Education report.
Hall, G. (2008). Issues in planning nationally for supply of a sufficient number of newly trained
teachers. Presentation delivered at SACE Teacher Supply & Demand Seminar, November 2008.
Human Sciences Research Council (HSRC). (2005). Emerging voices: A report on education in rural
South African Communities. Cape Town: HSRC Press and Nelson Mandela Foundation.
JET Education Services. (2014). Various reports emanating from the Initial Teacher Education Research
Project, available at www.jet.org.za
Keevy, J., Green, W. and Manik, S. (2014). The status of migrant teachers in South Africa: Implications
for policy, research, practice. Pretoria: South African Qualifications Authority (SAQA).
Kruss, G. (2008). Trajectories of restructuring: The changing context for initial teacher education in
South Africa. Proceedings of the Teacher Education and Development Programme (TEP)
Concluding Conference. Cape Town: HSRC Press.
KwaZulu-Natal Department of Education. (Undated). Concept Paper: Teacher Development.
Pietermaritzburg: KwaZulu-Natal Department of Education.
Magano, L. (2011). Unpublished PhD Paper UP Teacher supply and demand in South Africa.
Unpublished PhD Paper, University of Pretoria.
Marchant, G. and Lautenbach, G. (2011). An interactive, multivariate projection model for the
alignment of teacher demand and supply for schools in the Gauteng Province of South Africa: A
disaggregated approach. Education as Change, UNISA. 15(1):143-156.
McCarthy, J. and Bernstein, A. (2011).Value in the Classroom: The quantity and quality of South
Africa’s teachers. Johannesburg: The Centre for Development and Enterprise (CDE).
Mda, T. (2009).Educators. In J Erasmus and M. Breier (eds.) Skills shortages in South Africa: Case
studies of key professions. Cape Town: HSRC Press and Department of Labour.
Mda, T. and Erasmus, J. (2008).Educators. Scarce and Critical Skills Research Project. Research
Consortium for Department of Labour, South Africa.
National Assembly, RSA. Parliamentary question to the Minister of Basic Education: WQ 339:
Current post provisioning model: Posted: 4 Nov 2013
National Education Evaluation and Development Unit (NEEDU) (2012).National Report: The State of
Literacy Teaching and Learning in the Foundation Phase. Pretoria: Government Printers.
75
Organisation for Economic Co-operation and Development (OECD). (2005). Teachers matter:Attracting, developing and retaining effective teachers. Accessed 14 January 2015:http://www.oecd.org/education/school/34990905.pdf
Parliamentary Monitoring Group (PMG).(2010). Reply by the Minister of Basic Education to Question
no.1874 in Parliament, 4 June 2010. Accessed 23 October 2013:
http://www.pmg.org.za/node/22130, 16 October 2010.
Parliamentary Monitoring Group (PMG). (2012). Briefing by the Department of Basic Education on
Teacher Supply and Demand, 21 August 2012. Accessed 27 February 2013:
http://www.pmg.org.za/report/20120821-briefing-department-basic-education-teacher-supply-
and-demand .
Paterson, A. and Arends, F. (2008). Who are we missing? Teacher graduate production in South
Africa, 1995-2006.Proceedings of the Teacher Education and Development Programme (TEP)
Concluding Conference. Cape Town: HSRC Press.
Paterson, A. and Arends, F. (2009).Teacher graduate production in South Africa. Cape Town: HSRC
Press/Koninkrijk der Nederlanden.
Peltzer, K., Shisana, O., Udjo, E. Wilson, D. (2005).Educator supply and demand in the South African
public education system: Integrated report. Cape Town: HSRC Press/ELRC.
Reeves, C. (2009).Educator Supply and Demand in W Cape. Cape Town: Cape Higher Education
Consortium, for the Western Cape Education Department.
South African Qualifications Authority (SAQA) and Department of Education, RSA.(2010).
Proceedings of the Colloquium on Recognition of Prior Learning (RPL) for the upgrading and
up-skilling of teachers in South Africa, December 2008. Waterkloof: SAQA/Department of
Education, RSA.
Santiago, P. (2002). Teacher demand and Supply: Improving teaching quality and addressing teacher
shortages. Paris: OECD.
Simkins.C. (2010). Demand for and supply of teachers: 2010 to 2050. Paper commissioned by The
Centre for Development and Enterprise (CDE). Johannesburg: CDE.
Teacher Development Summit. (2009). Perfecting the art of teaching: The Teacher Development
Summit Report.
Teacher Education Taskforce, South Australia. (2012). Teacher supply and demand in South Australia:
Beyond 2010. Accessed 23 May 2013:
http://www.decd.sa.gov.au/hrdevelopment/files/links/Monograph_2.pdf .
76
Vinjevold, P. and Associates. (2001). Initial and in-service teacher education: Skills training in relation
to national needs and interests. Report commissioned by ETDP SETA. HSRC/Joint Education
Services.
Wolhuter, C.C. (2006) Teacher training in South Africa: Past, present and future. Education Research
and Perspectives, 33(2):124-139.

77
APPENDICES
Appendix 1: 2015 Verified Survey of former College of Education sites, per type of
current use (total 105)
Former Colleges of Education that became TVET College sites or primarily used as such (48); hostels ofone further former CoE site (Mamokgalake Chuene, Limpopo) also used by a TVET college
Prov. Former Colleges ofEducation
Location (Town/Municipality)
Current use/users of site
1 EC Algoa Port Elizabeth Port Elizabeth TVET Col2 EC Butterworth Butterworth King Hintsa TVET Col3 EC Cicira Mthatha King Sabata Dalindyebo TVET Col4 EC Dower Port Elizabeth Port Elizabeth TVET Col
5 EC Lovedale Alice Lovedale TVET Col6 EC Maluti Matatiele Ingwe TVET Col7 FS Bloemfontein Bloemfontein Motheo TVET Col8 FS Boitjhorisong In-service
Tr CentrePhuthaditjhaba Maluti TVET Col
9 FS Bonamelo Phuthaditjhaba Maluti TVET Col10 FS Kagisanong Bloemfontein Motheo TVET Col11 FS Lere La Tshepe Phuthaditjhaba Maluti TVET Col12 FS Mphohadi Koonstad Flavius Mareka TVET Col13 FS Sefikeng Witsieshoek Maluti TVET Col
14 FS Thaba' Nchu Thaba'Nchu Motheo TVET Col
15 FS Tshiya Phuthaditjhaba Maluti TVET Col16 GP East Rand Springs Ekurhuleni East TVET Col
17 GP Rand Langlaagte, Jhb Central Johannesburg TVET Col18 KZN Appelsbosch Ozwatini Coastal TVET Col19 KZN Clydesdale Umzimkulu (formerly
EC)Esayidi TVET Col
20 KZN Eshowe Eshowe Umfolozi TVET Col
21 KZN Esikhawini Richards Bay Umfolozi TVET Col22 KZN Ezakheni Ladysmith Mnabithi TVET Col23 KZN Gamalakhe nr Port Shepstone Esayidi TVET Col24 KZN KwaGqikazi Nongoma Mthashana TVET Col25 KZN Madadeni Madadeni nr Ladismith Majuba TET Col26 KZN Mpumalanga Hammarsdale Elangeni TVET Col
27 KZN Ntuzuma Kwamashu Elangeni TVET Col28 KZN Springfield Durban Thekwini TVET Col29 KZN Umbumbulu Amanzimtoti Coastal TVET Col30 KZN Umzimkulu Umzimkulu (formerly
EC)Esayidi TVET Co
31 LP Bochum nr Zebedela Capricorn TVET Col32 LP Dr NC Phatudi Burgersfort Sekhukune TVET Col33 LP Mokopane Mahwelereng,
WaterbergWaterberg TVET Col (satellite campus)
34 LP Naphuno Lenyenye Letaba TVET Col35 LP Shikwane Matlala nr Seshego Seshego TVET Col
36 LP Thabamopo Thabamopo Sekhukhune TVET Col campus
37 LP Tshisimani Tshakuma, Venda Partly TVET campus (Vhembe?), partly

78
circuit offices
38 MP Middelburg Middelburg Nkangala TVET: Middelburg Campus?
39 MP Mapulaneng Acornhoek Ehlanzeni TVET Col40 NWP Lehurutshe Mahikeng Taletso TVET Col41 NWP Mankwe Mogwase Orbit TVETCol42 NWP Potchefstroom Potchefstroom Vuselela TVET Col43 NWP Taung Pudimoe Vuselela TVET Col44 NWP Tlhabane Tlhabane Orbit TVET Col45 WC Denneoord Stellenbosch Boland TVET: Stellenbosch Woman's
Residence46 WC Good Hope Khayelitsha False Bay TVET Col47 WC Hewat Crawford/Athlone College of Cape Town TVET Col48 WC Sohnge Worcester Boland TVET Col
Former Colleges of Education incorporated into universities/technikons (14)
1 EC Masibulele Whittlesea Walter Sisulu University Campus2 EC Transkei In-service Col
(TRINSET)Mthatha Walter Sisulu University Cammpus
3 GP Goudstad Johannesburg University of Johannesburg Bunting RdCampus
4 GP Johannesburg Johannesburg WITS Education Faculty Campus5 GP Onderwyskollege Pretoria Goenkloof, Pretoria University of Pretoria Campus6 GP SACTE Pretoria UNISA Campus7 GP Transvaal (2) Soshanguve Tshwane University of Technology8 KZN Edgewood Pinetown University of KwaZulu Natal Campus9 KZN Indumiso Pietermartizburg Durban University of Technology
Campus10 KZN South African College of
Open Leaning (SACOL)Pietermartizburg UNISA Campus
11 MP Ndebele Siyabuswa University of Mpumalanga Campus
12 NC Phatsimang Kimberley Students, admin being absorbed into SolPlaatje University, 2015. Future ofcampus ??
13 WC Boland Wellington Cape Peninsula Univ of Tech Campus14 WC Cape Town Mowbray, Cape Town Cape Peninsula Univ of Tech Campus
Former Colleges of Education used as schools (17)
1 EC Arthur Tsengiwe Cala High School2 EC Clarkebury Ngcobo High school3 EC Lumko Lady Frere High School4 EC Shawbury Qumbu High school5 EC Mfundisweni Flagstaff High school6 EC Mount Arthur Lady Frere High school7 EC Sigcau nr Flagstaff High school8 GP Daveyton Daveyton East Rand School of Arts9 GP PROMAT Rissik St, Pretoria Private primary school and Learner
support NGO10 GP Transvaal (1) Fordsburg School11 KZN Adams Amanzimtoti Adams College12 KZN Bechet Greyville, Durban School13 LP Mamokgalake Chuene Groblersdal Primarily a school and circuit office;
hostels used by Sekhukhune TVET
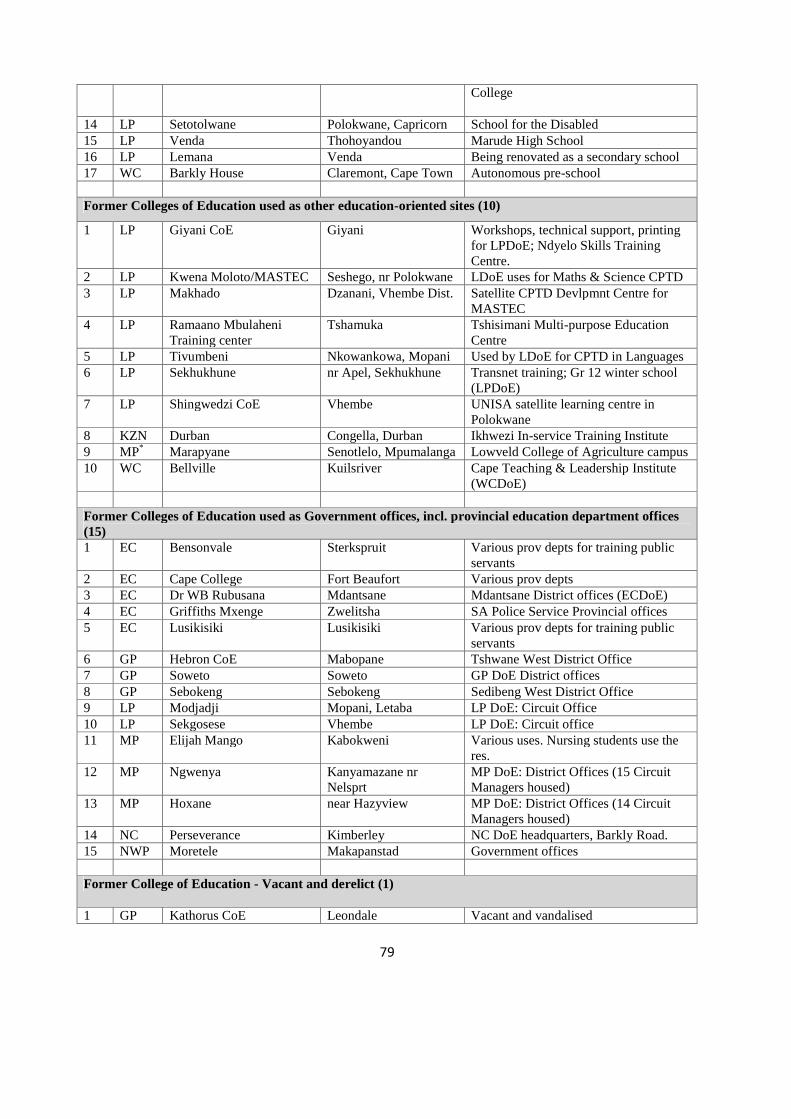
79
College
14 LP Setotolwane Polokwane, Capricorn School for the Disabled15 LP Venda Thohoyandou Marude High School16 LP Lemana Venda Being renovated as a secondary school17 WC Barkly House Claremont, Cape Town Autonomous pre-school
Former Colleges of Education used as other education-oriented sites (10)
1 LP Giyani CoE Giyani Workshops, technical support, printingfor LPDoE; Ndyelo Skills TrainingCentre.
2 LP Kwena Moloto/MASTEC Seshego, nr Polokwane LDoE uses for Maths & Science CPTD3 LP Makhado Dzanani, Vhembe Dist. Satellite CPTD Devlpmnt Centre for
MASTEC4 LP Ramaano Mbulaheni
Training centerTshamuka Tshisimani Multi-purpose Education
Centre5 LP Tivumbeni Nkowankowa, Mopani Used by LDoE for CPTD in Languages6 LP Sekhukhune nr Apel, Sekhukhune Transnet training; Gr 12 winter school
(LPDoE)7 LP Shingwedzi CoE Vhembe UNISA satellite learning centre in
Polokwane8 KZN Durban Congella, Durban Ikhwezi In-service Training Institute9 MP* Marapyane Senotlelo, Mpumalanga Lowveld College of Agriculture campus10 WC Bellville Kuilsriver Cape Teaching & Leadership Institute
(WCDoE)
Former Colleges of Education used as Government offices, incl. provincial education department offices(15)1 EC Bensonvale Sterkspruit Various prov depts for training public
servants2 EC Cape College Fort Beaufort Various prov depts3 EC Dr WB Rubusana Mdantsane Mdantsane District offices (ECDoE)4 EC Griffiths Mxenge Zwelitsha SA Police Service Provincial offices5 EC Lusikisiki Lusikisiki Various prov depts for training public
servants6 GP Hebron CoE Mabopane Tshwane West District Office7 GP Soweto Soweto GP DoE District offices8 GP Sebokeng Sebokeng Sedibeng West District Office9 LP Modjadji Mopani, Letaba LP DoE: Circuit Office10 LP Sekgosese Vhembe LP DoE: Circuit office11 MP Elijah Mango Kabokweni Various uses. Nursing students use the
res.12 MP Ngwenya Kanyamazane nr
NelsprtMP DoE: District Offices (15 CircuitManagers housed)
13 MP Hoxane near Hazyview MP DoE: District Offices (14 CircuitManagers housed)
14 NC Perseverance Kimberley NC DoE headquarters, Barkly Road.15 NWP Moretele Makapanstad Government offices
Former College of Education - Vacant and derelict (1)
1 GP Kathorus CoE Leondale Vacant and vandalised

80
Appendix 2: Replacement demand: National and provincial attrition data
A: National teacher attrition data per termination type, 2005 – 2012permanent, school-based
teachers in state-paid posts only (i.e. excl. SGB posts and independent schools)
Category 2005 2006 2007 2008 2009 2010 2011 2012 Total
Change in nature ofappointment 23 19 31 42 26 15 13 10 179
Deceased 1 607 1 746 1 777 2 109 2 060 1 951 1 941 1 766 14 957
Employer-initiatedtermination 452 619 745 1 765 1 795 1 558 1 878 1 303 10 115
Ill health retirement 572 487 210 259 383 255 228 387 2 781
Retirement, incl.early retirement 1 188 1 248 1 243 2 388 3 296 3 409 4 465 5 530 22 767
Resignation 2 918 3 088 3 601 3 776 3 394 2 912 3 738 4 442 27 869
Transfer 11 15 10 26 14 8 11 5 100
Unknown 14 7 8 10 8 9 13 27 96
Total 6 785 7 229 7 625 10 375 10 976 10 117 12 287 13 470 78 864
All non-retirementterminations 5 597 5 981 6 382 7 987 7 680 6 708 7 822 7 940 56 097
Source: PERSAL
Note that retirement, which was only the third-highest termination category up to 2007, became the second-highest in 2008and the highest from 2010 - a growth from 2005-2012 of 362%.
B: Teacher overall attrition data per province, 2005 – 2012:permanent, school-based teachers in state-paid posts
only (i.e. excl. SGB posts and independent schools)
Province 2005 2006 2007 2008 2009 2010 2011 2012 Total
EASTERNCAPE
1 262 1 151 1 200 1 648 2 072 1 934 2 374 2 500 14 141
FREESTATE
447 516 544 714 805 713 814 871 5 424
GAUTENG 1 299 1 415 1 690 2 181 2 026 2 088 2 553 2 710 15 962
KWAZULU/NATAL
1 419 1 558 1 548 2 171 2 283 2 134 2 644 2 980 16 737
LIMPOPOPROVINCE
634 684 668 876 1 174 1 050 1 245 1 423 7 754
MPUMALANGA 338 440 499 680 697 558 728 731 4 671
NORTH-WEST
486 600 552 661 659 644 709 817 5 128
NORTHERNCAPE
148 159 172 253 247 193 309 376 1 857
WESTERNCAPE
752 706 752 1 191 1 013 803 911 1 062 7 190
Total 6 785 7 229 7 625 10 375 10 976 10 117 12 287 13 470 78 864

81
Appendix 3: Replacement demand calculations (national)
A: Step 1: Replacement demand, based on actual attrition in state-paid posts (PERSAL data)
A. Year Attrition resulting from retirement Non-retirement attrition
B. Numberof t’s
retiredfrom state-paid posts
(fromPERSAL)
C.Estimatedretired t'sin publicschools,incl. SGBposts1
D.Estimatedretired t'sin allordinaryschools,incl. privateschools &SGB posts2
E. Number of non-retirementattrition in state-paid posts (fromPERSAL)
F. Estimated non-retirement attrition inpublic schools, incl.SGB posts1
G.Estimated
non-retirementattrition inall ordinaryschools, incl.
privateschools &
SGB posts2
2005 1 188 1 330 1 402 5 597 6 268 6 6042006 1 248 1 396 1 473 5 981 6 688 7 059
2007 1 243 1 399 1 481 6 382 7 183 7 605
2008 2 388 2 702 2 865 7 987 9 036 9 584
2009 3 296 3 726 3 969 7 680 8 683 9 248
2010 3 409 3 877 4 164 6 708 7 630 8 193
2011 4 465 5 115 5 516 7 822 8 961 9 663
2012 5 530 6 381 6 909 7 940 9 162 9 920
2013 5 733 6 664 7 022 8 420 9 788 10 590
2014 6 374 7 436 7 849 8 733 10 187 11 030
2015 7 016 7 856 8 318 9 045 10 129 11 520
2016 7 657 8 562 9 081 9 358 10 464 12 000
2017 8 299 9 340 9 948 9 671 10 885 12 460
2018 8 940 10 114 10 861 9 984 11 295 12 945
2019 9 582 10 833 11 681 10 297 11 641 13 400
Total estimated retired teachers: 64 759 Total estimated non-retirement attrition 83 945
1. Source EMIS (SGB data, 2005-2014). Proportion based on number in Column B + number in Column B multiplied byx/y, where x = number of teachers in SGB posts in public schools, and y = number of teachers in state-paid posts inpublic schools. (see page 27).
2. Source ESiSA, 2005-2012, Tables 1 and 2. Proportion based on number in Column C + z % of number in Column C,where z = number of teachers in independent schools ÷ number of teachers in all schools x 100 (see page 27).
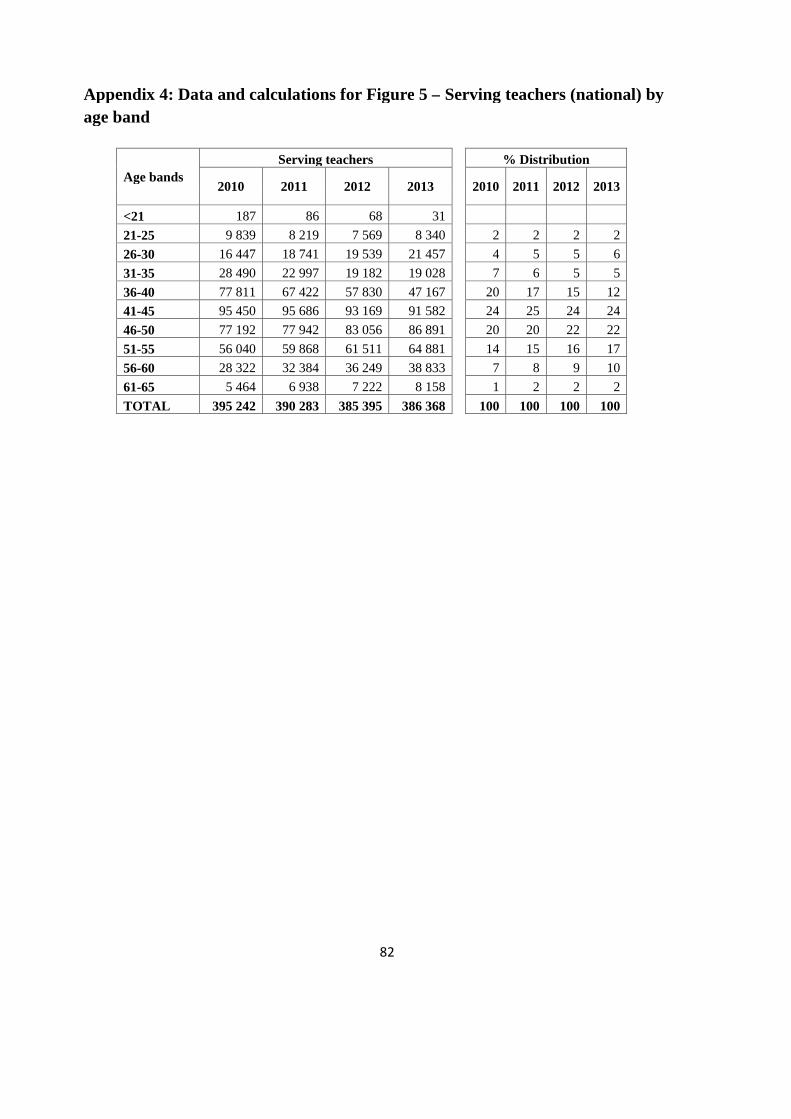
82
Appendix 4: Data and calculations for Figure 5 – Serving teachers (national) by
age band
Age bands
Serving teachers % Distribution
2010 2011 2012 2013 2010 2011 2012 2013
<21 187 86 68 31
21-25 9 839 8 219 7 569 8 340 2 2 2 2
26-30 16 447 18 741 19 539 21 457 4 5 5 6
31-35 28 490 22 997 19 182 19 028 7 6 5 5
36-40 77 811 67 422 57 830 47 167 20 17 15 12
41-45 95 450 95 686 93 169 91 582 24 25 24 24
46-50 77 192 77 942 83 056 86 891 20 20 22 22
51-55 56 040 59 868 61 511 64 881 14 15 16 17
56-60 28 322 32 384 36 249 38 833 7 8 9 10
61-65 5 464 6 938 7 222 8 158 1 2 2 2
TOTAL 395 242 390 283 385 395 386 368 100 100 100 100

83
Appendix 5: Data and calculations for Figure 6A – Replacement demand per
phase, 2012
(A) Year (B) Learnerenrolmentsin FP
(C) Learner-Educator Ratio(LER) – Prof. C.Simkins’sprimary sch.calculations
(D)CalculatedNumber of FPteachers inservice(column B /column C)
(E) Total all-phase attritionrate (percentage)applied toparticular phase
(F) Attrition:teachers lostto system,projected to2019
(G) %distributionof Phases
Foundation Phase:
2009 3 736 536 31.4 118 998 3.22 3 826
2010 3 791 180 31.2 121 512 2.97 3 605
2011 3 872 305 31.0 124 913 3.62 4 528
2012 4 018 999 31.1 129 228 3.97 5 134 30.0
Intermediate Phase:
2009 3 041 875 31.4 96 875 3.22 3 115
2010 2 959 644 31.2 94 860 2.97 2 814
2011 2 878 490 31.0 92 855 3.62 3 366
2012 2 840 820 31.1 91 345 3.97 3 629 21.2
Senior Phase:
2009 2 888 526 26.5 109 001 3.22 3 505
2010 2 991 254 26.2 114 170 2.97 3 387
2011 2 999 305 26.3 114 042 3.62 4 134
2012 2 980 150 26.2 113 746 3.97 4 519 26.4
FET Phase:
2009 2 501 280 26.5 94 388 3.22 3 035
2010 2 460 961 26.2 93 930 2.97 2 787
2011 2 476 425 26.3 94 161 3.62 3 413
2012 2 529 663 26.2 96 552 3.97 3 836 22.4Total: 17 118 100

84
Appendix 6: Data for Fig. 7 – Distribution of full-time equivalent new teacher
graduates (FTE NTGs) per school phase as percentages of total NTGs, 2008–2012
FTE NTGs per phase as proportions of total NTGs
Phase 2008 2009 2010 2011 2012
FP 15.65 18.80 15.97 14.50 16.51
IP 10.33 9.87 9.15 10.38 10.54
SP 20.56 25.88 25.87 27.40 28.76
FET 53.46 45.46 49.01 47.73 44.19
Total 100 100 100 100 100
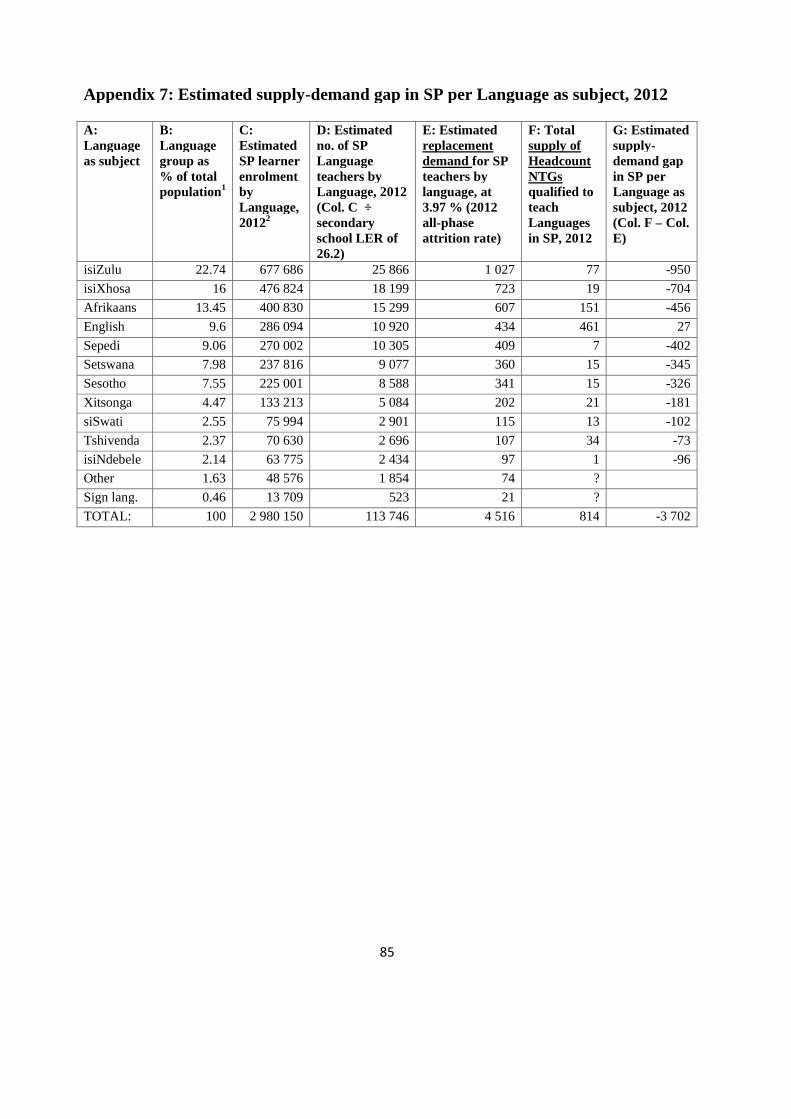
85
Appendix 7: Estimated supply-demand gap in SP per Language as subject, 2012
A:Languageas subject
B:Languagegroup as% of totalpopulation1
C:EstimatedSP learnerenrolmentbyLanguage,20122
D: Estimatedno. of SPLanguageteachers byLanguage, 2012(Col. C ÷secondaryschool LER of26.2)
E: Estimatedreplacementdemand for SPteachers bylanguage, at3.97 % (2012all-phaseattrition rate)
F: Totalsupply ofHeadcountNTGsqualified toteachLanguagesin SP, 2012
G: Estimatedsupply-demand gapin SP perLanguage assubject, 2012(Col. F – Col.E)
isiZulu 22.74 677 686 25 866 1 027 77 -950
isiXhosa 16 476 824 18 199 723 19 -704
Afrikaans 13.45 400 830 15 299 607 151 -456
English 9.6 286 094 10 920 434 461 27
Sepedi 9.06 270 002 10 305 409 7 -402
Setswana 7.98 237 816 9 077 360 15 -345
Sesotho 7.55 225 001 8 588 341 15 -326
Xitsonga 4.47 133 213 5 084 202 21 -181
siSwati 2.55 75 994 2 901 115 13 -102
Tshivenda 2.37 70 630 2 696 107 34 -73
isiNdebele 2.14 63 775 2 434 97 1 -96
Other 1.63 48 576 1 854 74 ?
Sign lang. 0.46 13 709 523 21 ?
TOTAL: 100 2 980 150 113 746 4 516 814 -3 702

86
Appendix 8: The teaching and Learning Development Capacity ImprovementProgramme (TLDCIP)
The Teaching and Learning Development Capacity Improvement Programme (TLDCIP) is a 5 yearintervention programme to strengthen university capacity for the development of teachers for alleducation sub-sectors. It is a partnership between the DHET and the European Union (EU).
The TLDCIP responds to teacher education imperatives that relate to the size, shape and substance ofteacher education. All efforts, activities and initiatives to address imperatives regarding the size, shapeand substance of teacher education must be towards improving quality in teacher education. Thediagram below thus represents the broad scope of the TLDCIP; and the quality goals it will seek tomake a contribution to.
Figure 1: Structural logic that underpins the Teaching and Learning Development CapacityImprovement Programme.
Principles that underpin the TLDCIP which inform the nature of projects and activities implementedwithin it include the following:
Teacher education focused: The programme, its projects and activities must be focused onstrengthening and improving the quality of teacher education in universities.
Holistic: The TLDCIP takes the view that teacher education includes the education anddevelopment of teachers for all education sub-systems, including the preparation of pre-school
SIZE
SHAPE SUBSTANCE
QUALITY ATTHE HEARTOF TEACHEREDUCATION
Quality Goal 1: A university systemthat is able to provide adequate numbersof new teachers/academics to teach inSouth Africa is in place.
Quality Goal 3: A fullrange of high qualityteacher educationprogrammes are in place atuniversities and aredelivered in a manner thatproduces teachers who areable to function effectivelyas new teachers/academicsin diverse South Africancontexts.
Quality Goal 2: Auniversity system is inplace that producessufficient numbers ofquality teachers/lecturers/academics forthe pre-school, school,TVET College andCommunity Collegeeducation anduniversity educationsub-sectors and whohold phase and/orteaching subjectspecialisations/disciplines that arealigned to the needs ineach sub-system.
87
teachers (ECD birth-4 years), school teachers, TVET college lecturers, community education andtraining college lecturers and university academics.
Strategic: Projects and activities that are implemented as part of the TLDCIP must potentiallyhave a systemic impact and contribute to improving the national university-based system of teachereducation.
1
Responsive and Evidence-Based: Projects and activities within the TLDCIP will respond to sizeand/or shape and/or substance imperatives in teacher education that have been highlighted throughresearch and other evidence-gathering mechanisms.
Collaborative: As much as possible, projects and activities within the TLDCIP will involvecollaboration between universities, where the nature of the project /activity suits by this, and wherecollaboration will lead to greater impact.
2
Targeted: Projects and activities within the TLDCIP should contribute to the objectives, goals andkey performance indicators defined for achievement through the Teaching and LearningDevelopment Capacity Improvement Programme.
Structure of the Teaching and Learning Development Capacity Improvement Programme
The Specific Objective of the TLDCIP is to enhance, within the Teacher Education and Developmentsystem, the quantity and quality of teachers for all education sub-systems.
Key Result Areas of the TLDCIP are as follows:
KRA 1: Capabilities of universities to do research for, to design and offer professional qualificationsfor the education and development of Early Childhood Education educators andpractitioners, primary school teachers, teachers of learners with special education needs(LSEN) and TVET and Community Education and Training (CET) colleges arestrengthened.
KRA 2: College lecturer development is supported via open and distance education, including atuniversity level.
KRA 3: Information and knowledge systems to enable and support enhanced planning in the TVETsector are improved.
KRA 4: Partnerships between DHET, Universities, TVET Colleges, CET Colleges and relevant CivilSociety Organisations are enhanced.
The TLDCIP has 9 Key Performance Indicators, and for each, specific targets to be achieved eachyear from 2014/15 to 2019/20.

90
Table 1: Key Performance Indicators for the TLDCIP
Indicator Target for2014/15
Target for2015/16
Target for2016/17
Target for2017/18
Target for2018/19
Target for2019/20
1. Enhancedinstitutionalcapacity atuniversities forECD (0-4)educatordevelopment.
Finalised concept note on aprofessional qualificationspolicy for ECD educators.
Draft Policy onProfessionalQualifications forECD educatorsgazetted for publiccomment.
Finalised Policy onProfessionalqualifications for ECDEducators published inGovernment Gazette.
At least 10 universitieshave signedagreements in placewith the DHET todevelop and offerprofessionalqualifications for ECDeducators.
The universities (atleast 10) havesubmitted satisfactoryreports to the DHETon progress made withdevelopingprofessionalqualifications for ECDeducators.
10 universities havereceived PQMapproval to offerprofessionalqualifications for ECDeducators.
2. Number of newprimary school(FP and IP)teachergraduatesincreased.
At least 4% increase on thenumber of primary schoolteacher graduates whocompleted in 2013, ascompared to 2012.
At least 4% increaseon the number ofprimary school teachergraduates whocompleted in 2014, ascompared to 2013.
At least 4% increaseon the number ofprimary school teachergraduates whocompleted in 2015, ascompared to 2014.
At least 4% increaseon the number ofprimary school teachergraduates whocompleted in 2016, ascompared to 2015.
At least 4% increaseon the number ofprimary school teachergraduates whocompleted in 2017, ascompared to 2016.
At least 4% increaseon the number ofprimary schoolteacher graduates whocompleted in 2018, ascompared to 2017.
3. Strengthenedcapacity inhighereducation forthe developmentof specialistteachers oflearners withspecialeducation needs.
Expressions of interest tobecome a national centre forthe development andoffering of professionalqualifications for specialneeds teachers have beenreceived from at least 3universities.
At least 3 universitieshave signedagreements in placewith the DHET toestablish a nationalcentre for thedevelopment andoffering ofprofessionalqualifications forspecial needs teachers.
The universities (atleast 3) have submittedsatisfactory reports tothe DHET on progressmade with developingprofessionalqualifications forspecial needs teachers.
The universities (atleast 3) have receivedPQM clearance tooffer professionalqualifications forspecial needs teachers.
The universities (atleast 3) have submittedsatisfactory reports tothe DHET on progressmade with developingprofessionalqualifications forspecial needs teachers.
The universities (atleast 3) are offeringprofessionalqualifications forspecial needs teachers,each with a focus on adifferent area inspecial needseducation.
4. Enhancedinstitutionalcapacity atuniversities forTVET Collegelecturereducation.
By 31st March 2014, at least10 universities havesubmitted an expression ofinterest to the DHET todevelop and offerprofessional qualificationsfor TVET college lecturers.
At least 10 universitieshave signedagreements in placewith the DHET todevelop and offerprofessionalqualifications forTVET lecturers.
The universities (atleast 10) havesubmitted satisfactoryreports to the DHETon progress made withdevelopingprofessionalqualifications for
At least 10 universitieshave submitted PQMapplications to offerprofessionalqualifications forTVET collegelecturers.
The universities (atleast 10) havesubmitted satisfactoryreports to the DHETon progress made withdevelopingprofessionalqualifications for
At least 10universities areoffering professionalqualifications forTVET collegelecturers.

91
TVET lecturers. TVET lecturers.5. Enhanced
institutionalcapacity atuniversities forcommunitycollege lecturereducation.
Finalised Policy onProfessional qualificationsfor community collegelecturers published inGovernment Gazette.
At least 10 universitieshave signedagreements in placewith the DHET todevelop and offerprofessionalqualifications forcommunity collegelecturers.
The universities (atleast 10) havesubmitted satisfactoryreports to the DHETon progress made withdevelopingprofessionalqualificationscommunity collegelecturers.
10 universities havereceived PQMapproval to offerprofessionalqualifications forcommunity collegelecturers.
The universities (atleast 10) havesubmitted satisfactoryreports to the DHETon progress made withdevelopingprofessionalqualifications forcommunity collegelecturers.
At least 10universities areoffering professionalqualifications forcommunity collegelecturers.
6. Enhancedcapacity inresearch ineducationthroughscholarshipawards (75% toyoung, blackand/or womenscholars)
- At least 15 universitieshave signedagreements in placewith the DHET toconduct specificresearch projects inpost-school educationand training.
Scholarships areawarded to 35 Mastersstudents and 35Doctoral students,75% of whom areyoung, black and/orwomen.
The universities havesubmitted satisfactoryresearch progressreports to the DHETwhich includesdetailed report on eachscholar’s progress.
The universities havesubmitted satisfactoryresearch progressreports to the DHETwhich includesdetailed report on eachscholar’s progress.
At least30 Mastersscholars havegraduated, and at least30 of the PhD scholarsare close tocompleting (writingup) or have done so.
7. Enhancedresearch outputon research onpost-schooleducation andtraining,includingteacher/ lecturereducation.
- At least 15 universitieshave signedagreements in placewith the DHET toconduct specificresearch projects inpost-school educationand training.
The universities havesubmitted satisfactoryresearch progressreports to the DHET.
At least 10 articlesemanating from /based on the researchhave been submitted toaccredited journal.
At least 15 articlesemanating from /based on the researchhave been published inaccredited journal.
At least 30 articlesemanating from /based on the researchhave been publishedin accredited journal.
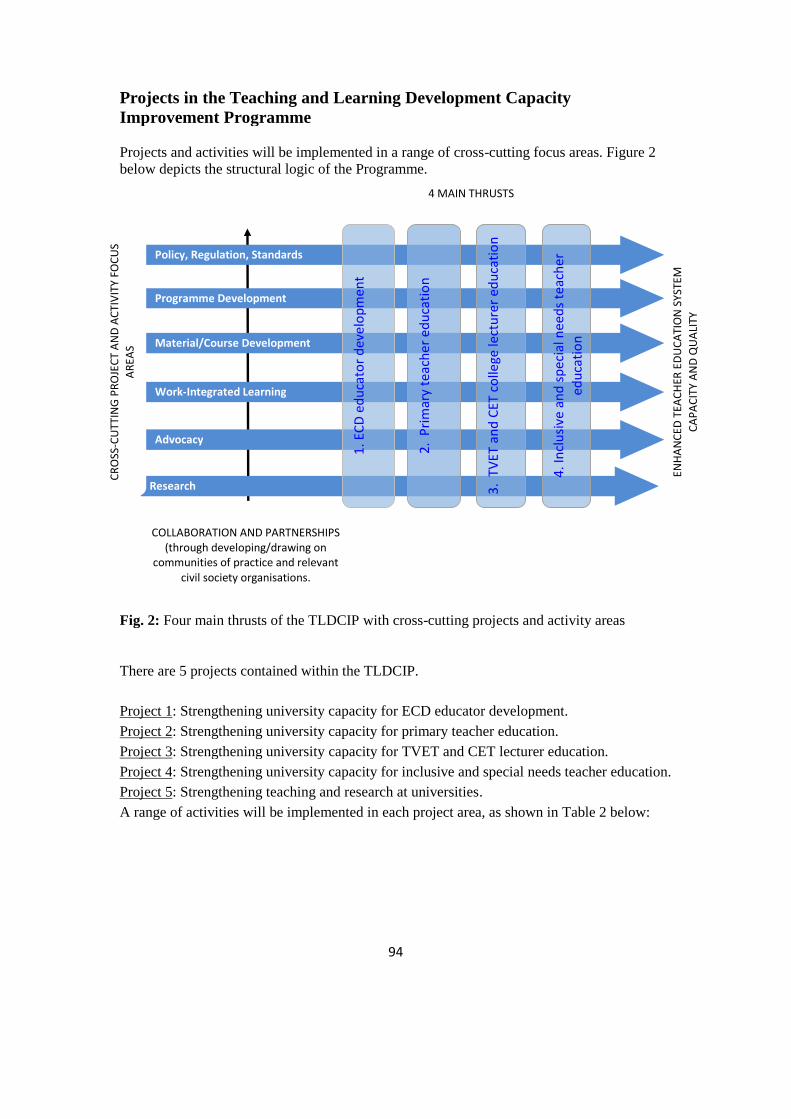
94
Projects in the Teaching and Learning Development CapacityImprovement Programme
Projects and activities will be implemented in a range of cross-cutting focus areas. Figure 2below depicts the structural logic of the Programme.
Fig. 2: Four main thrusts of the TLDCIP with cross-cutting projects and activity areas
There are 5 projects contained within the TLDCIP.
Project 1: Strengthening university capacity for ECD educator development.
Project 2: Strengthening university capacity for primary teacher education.
Project 3: Strengthening university capacity for TVET and CET lecturer education.
Project 4: Strengthening university capacity for inclusive and special needs teacher education.
Project 5: Strengthening teaching and research at universities.
A range of activities will be implemented in each project area, as shown in Table 2 below:
Research
4 MAIN THRUSTS
CR
OSS
-CU
TTIN
GP
RO
JEC
TA
ND
AC
TIV
ITY
FOC
US
AR
EAS
ENH
AN
CED
TEA
CH
ERED
UC
ATI
ON
SYST
EM
CA
PA
CIT
YA
ND
QU
ALI
TY
Advocacy
Work-Integrated Learning
Material/Course Development
Programme Development
Policy, Regulation, Standards
COLLABORATION AND PARTNERSHIPS(through developing/drawing on
communities of practice and relevantcivil society organisations.
1.E
CD
ed
uca
tor
dev
elo
pm
en
t
2.
Pri
mar
yte
ach
er
ed
uca
tio
n
3.
TVET
and
CET
colle
gele
ctu
rer
ed
uca
tio
n
4.I
ncl
usi
vean
dsp
eci
aln
ee
ds
teac
he
r
ed
uca
tio
n

95
Table 2: TLDCIP indicative activities to strengthen teacher education at universities
Projects / Components Indicative22 Activities in project
1. Strengthening university
capacity for ECD
educator development.
1.1 Gazette a policy on professional qualifications for ECD (birth-4 years)
educators.
1.2 Support universities to develop and offer qualification programmes for
ECD (birth-4 years) educators.
1.3 Organise national dialogue events focussed on ECD educator development.
2. Strengthening university
capacity for primary
teacher education.
2.1 Support the establishment of academic communities of practice (COP)
focused on achieving greater convergence, coherence and rigour in primary
teacher education curricula for the development of mathematics teachers,
science and technology teachers and language and literacy teachers, and which
can take responsibility for:
Encouraging maximum participation in the COP;
Assisting to organise regular dialogues for/between participants in the
COP;
Putting in place knowledge and practice standards for the field;
Initiate and drive collaborative research projects that can inform practice
in the field;
Coordinate the development of curriculum frameworks, course and
module materials that can be utilised widely and effectively in the field.
2.2 Seed the establishment of new primary initial teacher education
programmes at universities where these are not yet offered.
2.3 Finalise norms and standards for professional practice schools and teaching
schools and mechanisms for their establishment, including a guide/manual on
their establishment and supporting universities to develop business plans for
the establishment of teaching schools.
2.4 Develop a national programme/course and course materials to support the
professional development of school teachers that act as tutors and mentors to
initial teacher education students, which can be delivered in a blended mode,
with a significant online component.
2.5 Support the development of a teaching practice platform for initial teacher
education programmes.
3. Strengthening university
capacity for TVET and
ACET lecturer education.
3.1 Conduct an annual survey to determine the qualification status of lecturers
in public TVET colleges and develop an analytical report.
3.2 Support universities to develop and offer professional qualifications for
TVET and ACET college lecturers, and to develop high quality teacher
education materials where appropriate through regional partnerships between
suitable comprehensive universities/ universities of technology/ TVET
colleges.
3.3 Develop an online platform to support the industry-based work-integrated
learning component of lecturer education programmes.
3.4 Support the development of new academics focussed on TVET and ACET
education at universities.
22 This kind of programme is necessarily evolutionary in nature, as it strives to be responsive to imperatives thatemerge, and opportunities that present themselves. The activities listed are therefore indicative activities, andothers may be added, if approval for them is obtained from the Director-General.
96
3.5 Organise national dialogue events focussed on TVET and ACET lecturer
education.
3.6 Seed the development of an academic journal focussed on teaching and
learning in the Post-School Education and Training sector.
4. Strengthening university
capacity for inclusive and
special needs teacher
education
4.1 Support the establishment of an inclusive education teacher educator
community of practice (COP) that will develop an effective approach/model
for developing inclusive education competence through teacher education
programmes, and that will take responsibility for:
Encouraging maximum participation in the COP;
Assisting to organise regular dialogues for/between participants in the
COP;
Putting in place knowledge and practice standards for the field;
Initiate and drive collaborative research projects that can inform practice
in the field;
Coordinate the development of curriculum frameworks, course and
module materials that can be utilised widely and effectively in the field.
4.2 Support the establishment of three university-based centres of excellence,
one each with a focus on education for the visually impaired, education for the
hearing impaired, and education for the intellectually impaired, that will have
the function of training specialist teachers who work/ will work in special
schools, special schools resource centres and full-service schools and of
leading research in these areas in order to inform policy and practice.
5. Strengthening teaching
and research at
universities
5.1 Award masters or doctoral scholarships to scholars who will be part of the
new generation of academics for South Africa’s universities.
5.2 Support selected universities to conduct relevant research on aspects of
post-school education and training, including teacher, lecturer and practitioner
education that are national priorities and that will lead to published articles in
accredited journals.
96
The importance of research as a cross-cutting activity area
Teacher education planning, policies and interventions must be informed by evidence from,and knowledge of the system. The TLDCIP will thus support a range of nationally relevantresearch projects that are deemed to be critical for informing work to improve teachereducation quality and to inform teacher education policy, planning and actions at the nationaland local levels.
The following key areas of research have been identified:
Table 3: Research areas that are of national and systemic importanceResearch areas Some Outputs
Educator supply, demand and utilisation including a
focus on:
Pathways into Practice: New teacher graduate
employment.
Match between graduate specialisations and system
needs.
Movement patterns of South African teachers in the
country.
The phenomenon of late joiners and returning teachers
Impact of ageing profession and retirement bulges
Leaking bucket syndrome – teacher retention
With a view to understanding patterns, contributory
factors, future trajectories, policy implications etc.
Strategies to improve placement rate and retention
of new teachers.
An ICT-based predictive, multi-variate educator
supply-demand model.
Recommendations on graduate teaching subject
combinations that would most suit the
requirements of schools.
A teacher education recruitment and enrolment
plan (2020-2030) that is responsive to size and
shape needs of the education system and that is
disaggregated to the teaching subject level.
Strategies to address teacher attrition challenges.
Teacher education practices including a focus on:
Selection of students into initial teacher education
programmes;
Effective Teaching Practice and Work-Integrated
Learning modalities;
Initial Teacher Education delivery modalities
B Ed and PGCE;
Education faculty based B Eds and multiple
faculty based B Eds;
Distance and contact ITE programmes
School based (learnership) and university based
modalities;
public and private teacher education offerings;
Student success and throughput in initial teacher
education programmes;
New teacher graduate attributes: what’s in place and
what are the gaps? (with a specific emphasis on
teacher graduate attributes for 21st century world)
Curriculum coherence, depth, breadth and
responsiveness in teacher education programmes for
the development of specialist teachers (e.g. of
language, mathematics, for inclusive education, for
special needs teachers)
Effective selection modalities for the South
African context that ensure minimum quality
standards in selection and admission to initial
teacher education programmes.
Teaching practice (WIL) platform and resources
that can be used widely across the system.
Recommendations on improving the effectiveness
of the range of ITE delivery modalities where this
may be needed.
General and institution-specific strategies for
improving student throughput where this is a
challenge.
Related Documents