Relationships between soil properties and slope position in a lowland rain forest of southern Taiwan Chun-Chih Tsui a , Zueng-Sang Chen a, * , Chang-Fu Hsieh b a Department of Agricultural Chemistry, National Taiwan University, Taipei 106-17, Taiwan b Institute of Ecology and Revolutionary Biology, National Taiwan University, Taipei 106-17, Taiwan Received 1 May 2003; received in revised form 24 November 2003; accepted 28 January 2004 Available online 8 March 2004 Abstract The aspect and slope can control the movement of water and material in a hillslope and contribute to the spatial differences of soil properties. In a forest ecosystem, soil properties are also influenced by vegetation composition. The objectives of this study are to examine the characteristics and spatial differences of soil properties in a lowland evergreen broad-leaved rain forest in southern Taiwan, and to clarify the relationships between soil properties and the landscape. A total of 565 soil samples were taken at 0–5 and 5–15 cm in 74 contiguous 10 10-m quadrates along an altitudinal transect ranging from 300 to 480 m. The study transect was divided in three slope positions: summit, backslope and footslope positions, each with a different floristic composition and structure. Our study showed that organic carbon, available N, available K, extractable Fe and exchangeable Na were highest on the summit, while pH, available P, exchangeable Ca and Mg were significantly higher on the footslope at 0 –5- cm soils. Similar patterns were observed at subsurface 5 – 15-cm depth soils. The OC increased with increasing altitude, probably due to the quality of litterfall and lower rate of decomposition in the summit forest. The results of redundancy analysis (RDA) also revealed clear separation of soil properties among slope positions. These results confirmed that slope factor involved in the transport and accumulation of solutes resulted in higher pH, exchangeable Ca and Mg, lower organic carbon, available N and K, extractable Zn in the depositional areas of footslope. Although the soil properties associated with landscape have been better understood, further studies are required to clarify the relationships between soil nutrient status and plants in Taiwan. D 2004 Elsevier B.V. All rights reserved. Keywords: Soil properties; Vegetation; Altitudinal transect; Slope; Redundancy analysis 1. Introduction The spatial variation of soil properties is signifi- cantly influenced by some environmental factors such as climate, topography, parent materials, vegetation, and disturbance due to human activity (Jenny, 1941; Chen et al., 1997; Chaplot et al., 2001; McKenzie and Ryan, 1999; Ollinger et al., 2002). Some studies have indicated that soil properties are related to topographic positions in different forest ecosystems (Malo et al., 1974; Nizeyimana and Bicki, 1992; Stolt et al., 1993; Chen et al., 1997; De Bruin and Stein, 1998; King et al., 1999; Bohlen et al., 2001; Venterea et al., 2003). Soil moisture content is affected by the slope and aspect in the landscape (Franzmeier et al., 1969; Butler et al., 1986; Daniels et al., 1987). Temperature and precipitation varying with elevation have influ- ence on the pedogenic processes as well. Forest soils 0016-7061/$ - see front matter D 2004 Elsevier B.V. All rights reserved. doi:10.1016/j.geoderma.2004.01.031 * Corresponding author. Tel.: +886-2-2369-8349; fax: +886-2- 2392-4335. E-mail address: [email protected] (Z.-S. Chen). www.elsevier.com/locate/geoderma Geoderma 123 (2004) 131 – 142

Welcome message from author
This document is posted to help you gain knowledge. Please leave a comment to let me know what you think about it! Share it to your friends and learn new things together.
Transcript

www.elsevier.com/locate/geoderma
Geoderma 123 (2004) 131–142
Relationships between soil properties and slope position
in a lowland rain forest of southern Taiwan
Chun-Chih Tsuia, Zueng-Sang Chena,*, Chang-Fu Hsiehb
aDepartment of Agricultural Chemistry, National Taiwan University, Taipei 106-17, Taiwanb Institute of Ecology and Revolutionary Biology, National Taiwan University, Taipei 106-17, Taiwan
Received 1 May 2003; received in revised form 24 November 2003; accepted 28 January 2004
Available online 8 March 2004
Abstract
The aspect and slope can control the movement of water and material in a hillslope and contribute to the spatial differences of
soil properties. In a forest ecosystem, soil properties are also influenced by vegetation composition. The objectives of this study
are to examine the characteristics and spatial differences of soil properties in a lowland evergreen broad-leaved rain forest in
southern Taiwan, and to clarify the relationships between soil properties and the landscape. A total of 565 soil samples were
taken at 0–5 and 5–15 cm in 74 contiguous 10�10-m quadrates along an altitudinal transect ranging from 300 to 480 m. The
study transect was divided in three slope positions: summit, backslope and footslope positions, each with a different floristic
composition and structure. Our study showed that organic carbon, available N, available K, extractable Fe and exchangeable Na
were highest on the summit, while pH, available P, exchangeable Ca and Mg were significantly higher on the footslope at 0–5-
cm soils. Similar patterns were observed at subsurface 5–15-cm depth soils. The OC increased with increasing altitude,
probably due to the quality of litterfall and lower rate of decomposition in the summit forest. The results of redundancy analysis
(RDA) also revealed clear separation of soil properties among slope positions. These results confirmed that slope factor involved
in the transport and accumulation of solutes resulted in higher pH, exchangeable Ca and Mg, lower organic carbon, available N
and K, extractable Zn in the depositional areas of footslope. Although the soil properties associated with landscape have been
better understood, further studies are required to clarify the relationships between soil nutrient status and plants in Taiwan.
D 2004 Elsevier B.V. All rights reserved.
Keywords: Soil properties; Vegetation; Altitudinal transect; Slope; Redundancy analysis
1. Introduction Ryan, 1999; Ollinger et al., 2002). Some studies have
indicated that soil properties are related to topographic
The spatial variation of soil properties is signifi-
cantly influenced by some environmental factors such
as climate, topography, parent materials, vegetation,
and disturbance due to human activity (Jenny, 1941;
Chen et al., 1997; Chaplot et al., 2001; McKenzie and
0016-7061/$ - see front matter D 2004 Elsevier B.V. All rights reserved.
doi:10.1016/j.geoderma.2004.01.031
* Corresponding author. Tel.: +886-2-2369-8349; fax: +886-2-
2392-4335.
E-mail address: [email protected] (Z.-S. Chen).
positions in different forest ecosystems (Malo et al.,
1974; Nizeyimana and Bicki, 1992; Stolt et al., 1993;
Chen et al., 1997; De Bruin and Stein, 1998; King et
al., 1999; Bohlen et al., 2001; Venterea et al., 2003).
Soil moisture content is affected by the slope and
aspect in the landscape (Franzmeier et al., 1969;
Butler et al., 1986; Daniels et al., 1987). Temperature
and precipitation varying with elevation have influ-
ence on the pedogenic processes as well. Forest soils
C.-C. Tsui et al. / Geoderma 123 (2004) 131–142132
are important sources of nutrients for vegetation,
including N, P, S, K, Na, Ca, Mg, and some micro-
nutrients. In some cases, soil properties (for example,
soil acidity and nutrient availability) also affect the
vegetation types (Finzi et al., 1998a; Van Breemen et
al., 1997; Van Breemen and Finzi, 1998), and the
growth condition and distribution of vegetation types
in different slope positions are controlled by the
bioavailability of soil nutrients (Kubota et al., 1998).
On the other hand, the nutrients in falling litter from
different types of vegetation can return to the soils
through microbial decomposition, soil mineralization,
and nutrient recycling in the forest ecosystem. Such
recycling processes also determine the spatial varia-
tion of soil nutrients in the forest (Finzi et al., 1998b).
The Nanjenshan Nature Reserve Site of Kenting
National Park in southernmost Taiwan includes 2400
ha of subtropical and tropical lowland rain forests.
This site was selected for a study of the effects of
topographic position and vegetation type on soil
properties because of its landscape diversity, varying
vegetation patterns and free from human activities.
Within the short range of 200–400 m in elevation,
forest composes varieties of tropical, subtropical and
temperate species, and the high biodiversity of vege-
tation indicates a phenomenon of vegetation compres-
sion (Liao, 1995). Few studies have been made of
soil –vegetation and soil– landscape relationships
along an elevation gradient in tropical or subtropical
regions (Marrs et al., 1988; Grieve et al., 1990), and
there has been no detailed investigation in Taiwan.
The study reported here was conducted to characterize
the distribution of soil chemical properties in a tran-
sect on Mt. Nanjenshan and to better understand the
relationships between the soil properties and the
variations of topographic position and vegetation.
2. Materials and methods
2.1. Study area
The study was carried out along a transect
(22j03V37N, 120j51V10E) chosen in 1994 on the
northwestern ridge of Mt. Nanjenshan (Liao, 1995).
The transect is 450 m long and 40 m wide, and
elevation ranges from 295 m at the valley site to 480
m on the summit of Mt. Nanjenshan. Slope angle varies
between 17% and 89%, and with a 70% average. The
underlying bedrock within the study area consists
primarily of sandstone and shale of Miocene age. Soils
located on the summit with an argillic horizon are
classified as Typic Paleudult resulted from strong
leaching and illuvial processes. The soils located on
the unstable backslope associated with steep slopes are
classified as Typic Dystrudept resulted from weak
leaching processes (Soil Survey Staff, 1999; Hseu et
al., 2001). Two meteorological observatories were set
at the altitude of 260 and 470 m to collect the data of
rainfall, moisture, temperature, light, wind velocity and
the wind direction (Lee, 1999). The collected data
appeared no obvious differences in temperature and
precipitation at these two elevations. Climatic data
collected from October 1995 to March 2001 showed
that the annual rainfall varied from 3250 to 3820 mm
and was evenly distributed through the year. The mean
annual air temperature was 22.7 jC and the mean
monthly air temperature varied from 18.0 jC in Janu-
ary to 28.1 jC in July. It indicates that the study site has
a hyperthermic soil temperature regime and an udic soil
moisture regime (Soil Survey Staff, 1999).
A total of 139 free-standing woody species in 91
genera and 49 families was recorded along the tran-
sect (Liao, 1995). Owing to strong northeasterly
monsoon winds in the winter, both forest structure
and species composition change dramatically with
exposure and elevation (Liao, 1994; Sun et al.,
1998). Detrended correspondence analysis (DCA) of
the vegetation data revealed three distinct forest types
along the transect (see Appendix A) (Liao, 1995).
Families found mainly in the tropics are dominant in
the footslope forest. Conversely, families showing
definite evidence of northern and eastern Asia affin-
ities are better represented in the summit forest.
Compared with those on the footslope and summit,
the forest on the backslope represents a transition in
structure, floristic composition and habitat. The litter-
fall patterns of three vegetation types are similar;
production of total litterfall and wood litterfall on
the footslope are higher than on the summit, but there
is no difference in the leaf litter production among
vegetation types (Chang, 1998). Chen (1998) reported
that there was no clear difference in the decomposi-
tion rate of the widespread species along the altitudi-
nal transect, but the nutrient flux on the footslope
seems to be higher than on the summit.

derma 123 (2004) 131–142 133
2.2. Soil sampling
Soil sampling was performed from February to
August 1999. The transect was divided into 74
10�10-m quadrates using transits, taps, and staid
rods. A topographic map was constructed from aspect
and slope data measured at corners of each quadrate.
Within each quadrate, vegetation species were identi-
fied and the diameter at breast height (dbh) was
measured for all woody stems having a dbh z1 cm.
The species were named according to the Flora of
Taiwan (Huang, 1993–2000).
Each 10�10-m quadrate was further divided into
four 5�5-m subquadrates. Within each subquadrate,
three soil samples were sampled by an auger with a
diameter of 8 cm, at two soil depths, 0–5 cm (layer 1)
and 5–15 cm (layer 2). These samples were then
mixed to obtain a representative bulk sample for each
subquadrate. A total of 565 soil samples were collect-
ed from 74 quadrates. These samples were then air
dried and passed through a 2-mm sieve.
2.3. Chemical analysis
The soil properties were obtained according to the
methods of USDA-NRCS (Soil Survey Laboratory
Staff, 1996). The pH measurements were made on
soil–water and soil–KCl solution mixtures in a ratio
of 1:1. Organic C was determined by the modified
Walkley-Black method. Exchangeable K, Na, Ca and
Mg were extracted using 1 M ammonium acetate (pH
7.0). Available Fe, Mn, Cu and Zn were extracted
using DTPA-TEA solution (pH 5.3). The concentra-
tions of K, Na, Ca, Mg, Fe, Mn, Cu, and Zn were
measured by atomic absorption spectroscopy (Hitachi,
180–30 type). The soil-available N, after incubation
at 40 jC for 7 days, was extracted using 4M KCl and
was then measured with a Kjwltec Autosampler
System 1035 Analyzer. Available P and K were
measured by the Bray No. 1 method and the Mehlich
No. 1 method, respectively.
2.4. Statistical analysis
In order to obtain a display of the soil– landscape
relationship, redundancy analysis (RDA, program
CANOCO) (ter Braak, 1990) was applied to soil data
with elevation, slope and vegetation type as external
C.-C. Tsui et al. / Geo
variables. A Monte Carlo permutation test was per-
formed to determine the relative importance of each
variable in explaining the soil variation. One-way
analysis of variance was used to test whether there
were significant differences in soil properties between
different slope positions (SAS Institute, 1990).
3. Results and discussion
3.1. Spatial differences of soil properties along the
landscape
There is no clear difference of climate along the
study transect, however, floristic composition changes
dramatically along this altitudinal gradient. Whether
plant species distribution is controlled by the soil
nutrient condition or not, detailed investigation of soil
properties is helpful for further study subsequently.
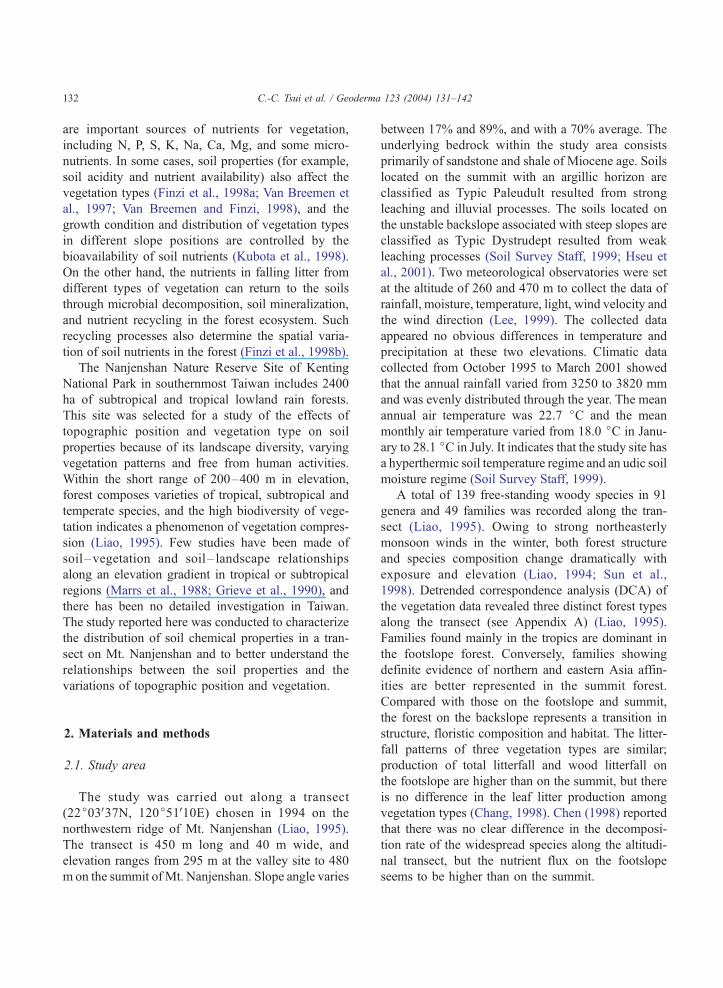
Results for redundancy analysis of soil data in the
0–5- and 5–15-cm depths show clear separation of
groups, illustrating distinct differences between soils
of each study site (Fig. 2). The Monte Carlo test
indicated that the soil variation was significantly
related to each of the external variables supplied
( p<0.001). The first axis, can account for 70.6%
and 80.9% of the total variance for each depth. The
elevation (or slope position) is the major determinant
of the first axis and also significantly correlated with
vegetation. The second axis, expressing the remaining
17.9% and 14.4% of the total variance, is highly
correlated with slope.
Significant differences among slope positions were
observed for most soil properties. Soil pH, available P,
exchangeable Ca, K and DTPA-extractable Mn usu-
ally increased in a downslope direction, while organic
carbon, available K, exchangeable Na and DTPA-
extractable Fe tended to decrease (Table 1). The
concentration of exchangeable Mg was highest on
the footslope position than elsewhere. Values of soil
properties were generally lower at 5–15-depth as
compared with those in the upper 5 cm, however,
similar trends were found for most soil properties
among slope positions (Table 1).
Hseu et al. (2001) selected three representative soil
pedons on the summit, backslope and footslope posi-
tions of the study site, to describe soil micromorpho-
logical characteristics and to interpret the pedogenic

Table 1
Comparisons of soil properties at different landscape positions of the study site
Landscape Elevation Sample pHwater pHKCI Available N Mineralizable N Available P Available K OC#
position (m) number (n)mg/kg
(g/kg)
0–5 cm soil
Summit 470–480 20 4.8b+ 3.4c 152a 127a 10.7b 41.1a 29.6a
Upper backslope 400–470 13 4.9b 3.4c 131b 126a 8.55b 38.0ab 26.7b
Lower backslope 330–400 27 5.0b 3.6b 123b 112a 10.6b 30.9c 22.5c
Footslope <330 14 5.3a 4.1a 127b 123a 15.2a 34.6bc 14.9d
5–15 cm soil
Summit 470–480 20 4.8b 3.3c 99.9a 83.5a 9.68b 23.5ab 24.0a
Upper backslope 400–470 13 4.7b 3.3c 90.0b 71.3a 7.03c 25.2a 21.5b
Lower backslope 330–400 27 4.8b 3.5b 90.4b 79.8a 8.92bc 20.6b 19.0c
Footslope <330 14 5.0a 3.7a 92.2ab 85.5a 12.1a 20.4b 11.6d
Landscape Elevation Sample Exchangeable bases (mg/kg) DTPA extractable (mg/kg)
position (m) number (n)Ca Mg K Na Fe Mn Zn Cu
0–5 cm soil
Summit 470–480 20 20.1b+ 5.96b 17.4a 4.34a 28.6a 4.51c 0.31a ND++
Upper backslpoe 400–470 13 18.1b 5.91b 15.8ab 3.73b 21.6a 4.17c 0.22b ND
Lower backslpoe 330–400 27 20.0b 5.88b 14.2b 2.69c 23.4b 5.95b 0.27a ND
Footslope <330 14 24.2a 6.10a 16.4a 3.09c 13.8c 11.1a 0.27a ND
5–15 cm soil
Summit 470–480 20 10.7c 5.29b 9.69ab 3.16a 25.2a 1.80c 0.17a ND
Upper backslpoe 400–470 13 9.76c 5.16b 9.31b 2.77ab 20.8b 1.85c 0.13b ND
Lower backslope 330–400 27 14.1b 5.37b 9.96ab 2.13c 20.7b 4.32b 0.19a ND
Footslope <330 14 19.4a 5.81a 10.8a 2.37bc 12.9c 9.40a 0.20a ND
# Organic carbon.+ There is no significant difference with the same letter in a row at the p=0.05 level.++ Not detectable.
C.-C. Tsui et al. / Geoderma 123 (2004) 131–142134
processes. Soils at the summit are classified as Paleu-
dult with deeper soil, stronger leaching and stronger
clay illuviation than other soils. The soils of the
backslope and footslope are classified as Dystrudept,
with relatively weaker pedogenic and leaching pro-
cesses and relatively greater surface erosion than on
the summit position (Chen, 1998; Hseu et al., 2001).
Soil properties on different slope positions were
significantly affected by the degree of soil develop-
ment and the leaching processes. Soils on summit
position contain less exchangeable Ca and Mg, due to
stronger leaching. Soils can significantly accumulate
these soluble ions such as Ca, Mg, K, and Na from the
summit and deposit on the footslope position where
leaching is weaker and soil enrichment is stronger
( p<0.05) (Table 3).
The distribution of exchangeable Na among slope
positions was the reverse of exchangeable Ca and
Mg. It seems that proximity of the Pacific Ocean and
strong northeasterly monsoon winds may have been
responsible for the variation in Na concentrations
across the study site. The canopy trees on the ridges
may intercept air-borne Na which is then leached into
the soils via throughfall and stemflow, resulting in
the relatively higher Na concentration of the summit
soil.
The amount of DTPA-extractable Mn on the foot-
slope was also significantly higher than that on the
summit and backslope ( p<0.05) (Table 1). Mn is more
easily reduced and is more soluble than Fe in the soil
solution. Consequently, Mn is more mobile in this
landscape system and accumulates on the lower foot-
slope. The topography can affect the patterns of water
flow within the soil system (Fig. 1b and c), and also
strongly influences the movement and distribution of
Mn (McDaniel et al., 1992). Soils on the footslope

Fig. 1. (a) Geographical situation of Nanjenshan long-term ecological research site in Taiwan. (b) The Geomorphic profile of the study site (n:
numbers of the 10�10-m sampling plots on slope positions with different elevations). (c) Topography of the study area.
C.-C. Tsui et al. / Geoderma 123 (2004) 131–142 135

C.-C. Tsui et al. / Geoderma 123 (2004) 131–142136
had a significantly higher pH than those on other
slope positions due to the accumulation of soluble
cations on the footslope ( p<0.05) (Table 1). The
footslope can be regarded as a concave position in
the landscape. Such a type of slope reduces the
movement of soil water and accumulates some soluble
cations from upper slope positions. These results
agree with those of Huggett (1975).
Organic C content increased monotonically from
14.9 g/kg on the footslope to 29.6 g/kg on the summit
(Table 1). Differences in the amount of organic C are
probably due to the differences of litter decomposition
rate. Previous studies (Liao, 1995; Chen, 1998; Lee,
1999) showed that the transition from footslope forest
through backslope forest to summit forest is correlated
with slightly decreasing decomposition quotients (lit-
Table 2
Pearson correlation coefficients between soil properties in 0–5-cm depth
Slope pHwater pHKCl Available OC
N P K
Slope 1.00
pHwater 0.33** 1.00
pHKCl 0.27* 0.89*** 1.00
Avail.
N
�0.44*** 0.06 0.04 1.00
Avail.
P
�0.22 0.16 0.35** 0.09 1.00
Avail.
K
�0.35** 0.15 0.06 0.54*** �0.06 1.00
O.C �0.40*** �0.48*** �0.59*** 0.55*** �0.24* 0.40*** 1
Exch.
K
�0.26* 0.34** 0.27* 0.60*** 0.04 0.87*** 0
Exch.
Na
�0.13 0.17 0.03 0.47*** �0.22 0.47*** 0
Exch.
Ca
�0.09 0.73*** 0.75*** 0.43*** 0.31** 0.33** �0
Exch.
Mg
�0.02 0.73*** 0.64*** 0.49*** 0.15 0.47*** �0
DTPA
extr.
Fe
�0.31** 0.63*** 0.58*** 0.61*** 0.16 0.69*** 0
DTPA
extr.
Mn
0.19 0.71*** 0.68*** 0.55*** 0.21 0.51*** �0
DTPA
extr.
Zn
�0.53*** 0.72*** 0.71*** 0.51*** 0.26* 0.47*** �0
* p<0.05.
** p<0.01.
*** p<0.001.
terfall content/litter layer), and markedly lower rates
of decomposition as measured using litter bags. The
lower rates of leaf litter decomposition in the summit
forest may be a result of two important factors
including the different leaf characteristics and lower
temperature on the summit. The summit forest is
mainly dominated by the species of Fagaceae, Laur-
aceae, Aqufoliaceae and Myrtaceae. Leaf structure
data (Lin, 1998) indicated that significant differences
between summit and footslope are smaller leaves with
thicker outer epidermal wall and cuticle, and higher
specific leaf weight, the characters that may reduce
mineral leaching and are not favorable to decomposi-
tion (Sugden, 1985). Increased organic C on the
summit relative to the linear slope could also result
from deposition process. The gradient of the slope on
and slope
Exchangeable bases DTPA extractable
K Na Ca Mg Fe Mn Zn
.00
.25* 1.00
.42*** 0.54*** 1.00
.19** 0.49*** 0.18 1.00
.09 0.63*** 0.41*** 0.85*** 1.00
.07 0.86*** 0.53*** 0.85*** 0.88*** 1.00
.03 0.68*** 0.46*** 0.95*** 0.90*** 0.96*** 1.00
.10 0.64*** 0.33** 0.98*** 0.90*** 0.94*** 0.99*** 1.00
Fig. 2. Ordination diagram based on redundancy analysis of soil data in the 0–5 cm (a) and 5–15 cm (b) depths. Arrows represent the directions
of maximum variation of soil and external variables. Soil samples designated by symbols representing the three slope positions (E footslope, obackslope, . summit, n centroids of vegetation types). pHw=pHwater; pHk=pHKCl; N, P, K=available N, P and K, respectively; OC=organic
carbon; exK=exchangeable K; Na, Ca, Mg=exchangeable Na, Ca, Mg, respectively; Fe, Mn, Zn=DTPA-extractable Fe, Mn, Zn, respectively.
C.-C. Tsui et al. / Geoderma 123 (2004) 131–142 137

C.-C. Tsui et al. / Geoderma 123 (2004) 131–142138
the summit is moderate (Fig. 1b). This landscape
minimizes soil erosion and may explain the higher
organic C content on the forest floors of summit than
the backslope, where the slope is steeper.
The available N and available K contents were
highest in the summit soils as well as organic C
(Table 1); however, there was less regular for the
available K and no difference for the available N
among other slope positions. In the case of avail-
able P, the most marked difference is between the
footslope site and all the others (Table 1). This
variation remains unexplained and is possibly relat-
ed with floristic composition. Here many tree-fall
gaps occurred with abundant tropical pioneer spe-
cies (Chan, 1994). There is evidence that soil in
sites dominated by pioneer trees contains greater
Table 3
Pearson correlation coefficients between soil properties in 5–15-cm depth
Slope pHwater pHKCl Available OC
N P K
Slope 1.00
pHwater 0.22 1.00
pHKCl 0.32** 0.78*** 1.00
Avail.
N
�0.32** 0.31** 0.15 1.00
Avail.
P
�0.31** �0.02 0.13** 0.18 1.00
Avail.
K
�0.08 0.20 0.005 0.31** �0.04 1.00
O.C �0.36** �0.35** �0.60*** 0.34** �0.14 0.26* 1.0
Exch.
K
0.14 0.44*** 0.46*** 0.39*** �0.02 0.56*** �0.1
Exch.
Na
�0.001 0.35** 0.06 0.36** �0.23* 0.30** 0.2
Exch.
Ca
0.18 0.70*** 0.81*** 0.30** 0.24* �0.02 �0.5
Exch.
Mg
0.14 0.73*** 0.64*** 0.32** 0.02 0.13 �0.4
DTPA
extr.
Fe
�0.32** 0.74*** 0.78*** 0.40*** 0.14 0.20 �0.4
DTPA
extr.
Mn
0.29* 0.76*** 0.80*** 0.37** 0.17 0.08 �0.5
DTPA
extr.
Zn
�0.17 0.72*** 0.71*** 0.51*** 0.26* 0.47*** �0.1
* p<0.05.
** p<0.01.
*** p<0.001.
concentration of phosphorus than that obtained
under the other types of vegetation studied (Kell-
man, 1969). Further studies on the distribution of
nutrients in the above-ground materials and litterfall
of major tree species are needed.
3.2. Correlations among soil properties
The correlation matrices for soils in the 0–5- and
5–15-cm depths show several sets of significant
relationships (Tables 2 and 3). The amount of organic
carbon in the 5–15-cm depth was negatively corre-
lated with most selected soil properties, such as soil
pH, exchangeable Ca, Mg, and DTPA-extractable Fe
and Mn. In contrast, exchangeable Na, available N
and K were positively related to organic carbon. In the
and slope
Exchangeable bases DTPA extractable
K Na Ca Mg Fe Mn Zn
0
2 1.00
8** 0.28** 1.00
9*** 0.50*** 0.003 1.00
2*** 0.55*** 0.31** 0.78*** 1.00
6*** 0.74*** 0.25* 0.94*** 0.85*** 1.00
1*** 0.60*** 0.21 0.97*** 0.85*** 0.98*** 1.00
0 0.58*** 0.11 0.99*** 0.83*** 0.97*** 0.99*** 1.00
C.-C. Tsui et al. / Geoderma 123 (2004) 131–142 139
upper 5-cm soil, however, no such significant relation-
ships were found for exchangeable Mg and all DTPA-
extractable nutrients.
The highest positive correlations with soil pH in the
upper 5 cm of soil were found, in descending order, for
exchangeable Ca, Mg, and DTPA extractable Zn, Mn,
Fe and exchanged K, which were all intercorrelated. A
similar result was observed at 5–15-cm depth, al-
though in different order. These findings follow the
general principle that the concentration of basic cations
should increase with increasing soil pH (Bohn et al.,
1985). Available N and K are of course directly
correlated with organic carbon, and therefore, their
levels drop sharply below the upper 5 cm of organic
enriched soil (Table 1). It thus appears that the amount
of nutrients such as available N andK is associated with
the accumulation of organic carbon which is in turn
related to the quantity of litter falling on the forest floor.
3.3. The effect of slope on soil properties
Slope has been regarded as one of the most impor-
tant abiotic factors that control the pedogenic process
on a local scale (McDaniel et al., 1992; Buol et al.,
1997). Steeper slopes contribute to greater runoff, as
well as to greater translocation of surface materials
downslope through surface erosion and movement of
the soil mass (Hall, 1983). The study area was on a
long, linear sideslope of Nanjenshan. While slope
position has significant effect on the majority of soil
properties, there were a number of soil properties which
have also been found to be strongly correlated with the
steepness of slope. In the redundancy analysis ordina-
tion diagrams, slope is the major determinant of axis 2
(Fig. 2a and b). The soil samples from both footslope
and summit run roughly parallel to the slope arrow
indicate a generality of soil response to slope for a
given landscape. For surface soils of the upper 5 cm, the
highest negative correlations with slope were found, in
descending order, for extractable Zn, available N,
organic carbon, available K, extractable Fe and ex-
changeable K (Table 2). The highest positive correla-
tion was found for pH. Similar trends are exhibited at a
depth of 5–15 cm for organic carbon, available N,
available P, extractable Fe, extractable Mn, and pH
(Table 3).
The influence of slope on soil properties has been
related to concave and convex sloped surfaces that
control the distribution of water and soluble materials
from a higher to a lower elevation (Huggett, 1975;
Pennock et al., 1987; Nizeyimana and Bicki, 1992).
The accumulation of organic matter and soluble
materials along the altitudinal transect could also be
attributed to the pedogenic processes including tree
throw, wind throw, and bioturbation that usually
resulted in pits and mounds and created zone of litter
and water accumulation. The role of these processes
has been recognized by other studies (Schaetzl, 1990;
Liechty et al., 1997; Johnson et al., 2000).
4. Conclusions
Slope and slope position significantly affected the
movement and accumulation of soil solution, leading
to a variation of soil properties along the transect in
this study area. Significant differences among slope
positions were found for most soil properties stud-
ied. The contents of available P, exchangeable Ca
and Mg, DTPA-extractable Mn, and pH value were
highest on the footslope position. However, the
contents of organic carbon, available N and K,
exchangeable Na and DTPA-extractable Fe were
generally higher on the summit than those of back-
slope and footslope. As a result, redundancy analysis
showed clear separation of soil groups, illustrating
distinct differences between soils of each slope
position. Differences in soil properties along the
transect, including organic carbon, available N and
extractable Fe that decreased from gentle slope to
very steep slope, were also attributable to slope
processes. Further studies on the distribution of
nutrients in the above-ground materials and litterfall
of major tree species are needed to more fully
understand the interactive relationships among land-
scape, vegetation and soil properties.
Acknowledgements
The authors would like to thank the National
Science Council of the Republic of China for
financially supporting this research under Contract
No. NSC-89-2621-B002-020. Mr. S. B. Wu, Ms. C.
C. Wu and Ms. H. M. Chen are appreciated for their
assistance in soil sampling and analyses.

C.-C. Tsui et al. / Geoderma 123 (2004) 131–142140
Appendix A. Vegetation zones along the altitudinal gradient in the study site
Region I II, III IV
Elevation 250–330 m 330–470 m 470–480 m
Plant
density
1524/ha 6660/ha 8131/ha
Mean
base
area
15.3 m2/1000 plant 7.58 m2/1000 plant 5.95 m2/1000 plant
Number of
species
71 72 100
Major Moraceae Lauraceae Lauraceae
Genera Rubiaceae Euphorbiaceae Fagaceae
Euphorbiaceae Aquifoliaceae Aquifoliaceae
Major
Species
(1) White fig tree
(Ficus benjamina)
(1) Leather-leaf holly
(Ilex cochinchinensis)
(1) Beautiful nerve eugenia
(Syzygium euphlebium)
(2) Hengchun pencilwood
(Dysoxylum kuskusense)
(2) Common schefflera
(Schefflera octophylla)
(2) Leather-leaf hollyc
(Ilex cochinchinensis)
(3) Common schefflera
(Schefflera octophylla)
(3) Hieransan drypetes
(Drypetes hieranensis)
(3) Narrow-leaved oak
(Cyclobalanopsis longinux)
(4) Hieransan drypetes
(Drypetes hieranensis)
(4) Three-leaved turpinia
(Turpinia ternata)
(4) Red bark slugwood
(Beilschmiedia erythrophloia)
(5) Large-leaved nanmu
(Machilus japonica var. kusanoi)
(5) Mountain longan
(Helicia formosana)
(5) Short-spine evergreen chinkapin
(Castanopsis stellato-spina)
(6) Wild coffee (Psychotria rubra) (6) Wild coffee (Psychotria rubra) (6) Chinese aucuba (Aucuba chinensis)
Special
species
(1) Poisonous wood nettle
(Laportea pterostigma)
Lienhuachih heliciamountain
longan (Helicia rengetiensis)
(1) Hongkong oak
(Cyclobalanopsis championii)
(2) White fig tree
(Ficus benjamina)
(2) Matsuda osmanthus
(Osmanthus marginatus)
(3) Autumn mapple
tree,red cedar (Bischofia janavica)
(3) Kanehira holly
(Ilex triflora var. kanehirai)
(4) Large-leaved aglaia
(Aglaia elliptifolia)
(4) Chinese aucuba
(Aucuba chinensis)
Liao, 1995.
References
Bohlen, P.J., Groffman, P.M., Driscoll, C.T., Fahey, T.J., Siccama,
T.G., 2001. Plant – soil –microbial interactions in a northern
hardwood forest. Ecology 82, 965–978.
Bohn, H.L., McNeal, B.L., O’Connor, G.A., 1985. Soil Chemistry,
2nd ed. Wiley, New York.
Buol, S.W., Hole, F.D., McCracken, R.J., Southard, R.J., 1997. Soil
Genesis and Classification, 4th edition. Iowa State Univ. Press,
Ames, IA.
Butler, J., Goetz, H., Richardson, J.L., 1986. Vegetation and soil –
landscape relationships in the north Dakota badlands. Am. Midl.
Nat. 116, 378–386.
Chan, W.H., 1994. Studies on the gap-phase regeneration of the
lowland rain forest in Nanjenshan Area. Master thesis, Graduate
Institute of Botany, National Taiwan University Taiwan (In Chi-
nese, with English abstract).
Chang, C.P., 1998. A research of litterfall in Nanjenshan lowland
rain forest. Master thesis, Graduate Institute of Botany, Na-
tional Taiwan University Taiwan (In Chinese, with English
abstract).
Chaplot, V., Bernoux, M., Watler, C., Curmi, P., Herpin, U., 2001.
Soil carbon storage prediction in temperate hydromorphic soils
using a morphologic index and digital elevation model. Soil Sci.
166, 48–60.
Chen, Y.Y., 1988. Litter decomposition in a lowland rain forest
of Nanjenshan. Master thesis, Graduate Institute of Botany,
National Taiwan University Taipei (In Chinese with English
Summary).
Chen, Z.S., Hsieh, C.F., Jiang, F.Y., Hsieh, T.H., Sun, I.F., 1997.
Relationships of soil properties to topography and vegetation in
a subtropical rain forest in southern Taiwan. Plant Ecol. 132,
229–241.
Daniels, W.L., Zelazny, L.W., Everett, C.J., 1987. Virgin hardwood
forest soil of the southern Appalachian Mountains: II. Weather-
ing, mineralogy, and chemical properties. Soil Sci. Soc. Am. J.
51, 730–738.
De Bruin, S., Stein, A., 1998. Soil– landscape modeling using fuzzy

C.-C. Tsui et al. / Geoderma 123 (2004) 131–142 141
c-means clustering of attribute data derived from a digital ele-
vation model (DEM). Geoderma 83, 17–33.
Finzi, A.C., Canham, C.D., van Breemen, N., 1998a. Canopy tree–
soil interactions within temperate forests: species effects on pH
and cations. Ecol. Appl. 8, 447–454.
Finzi, A.C., van Breemen, N., Canham, C.D., 1998b. Canopy tree–
soil interactions within temperate forests: species effects on soil
carbon and nitrogen. Ecol. Appl. 8, 440–446.
Franzmeier, D.P., Pederson, E.J., Longwell, T.J., Byrne, J.G.,
Losche, C.K., 1969. Properties of some soils of the Cumberland
Plateau as related to slope aspect and position. Proc.-Soil Sci.
Soc. Am. 33, 755–762.
Grieve, I.C., Proctor, J., Cousins, S.A., 1990. Soil variation with
altitude on Volcan Barva Costa Rica. Catena 17, 525–534.
Hall, G.F., 1983. Pedology and geomorphology. In: Wilding,
L.P., Smeck, N.E., Hall, G.F. (Eds.), Pedogenesis and Soil
Taxonomy: I. Concepts and Interactions. Elsevier, Amsterdam,
pp. 117–140.
Hseu, Z.Y., Chen, Z.S., Tsai, C.C., Tsui, C.C., 2001. Using Micro-
morphology to interpret the genesis of tropical forest soils in the
Nanjenshan area of Taiwan. Taiwan J. For. Sci. 16, 25–38 (In
Chinese with English abstract).
Huang, T.C. (Ed.), 1993–2000. Flora of Taiwan, 2nd ed., vol. 2,
pp. 1–855; vol. 3, pp. 1–1084; vol. 4, pp. 1–1217, vols. 1–5.
Department of Botany. National Taiwan University, Taipei.
Huggett, R.J., 1975. Soil landscape systems: a model of soil gen-
esis. Geoderma 13, 1–12.
Jenny, H., 1941. Factors of Soil Formation—A System of Quanti-
tative Pedology McGraw-Hill, New York.
Johnson, C.E., Ruiz-Mendez, J.J., Lawrence, G.B., 2000. Forest
soil chemistry and Terrain attributes in a Catskill watershed.
Soil Sci. Soc. Am. J. 64, 1804–1814.
Kellman, M.C., 1969. Some environmental components of shifting
cultivation in upland Mindanao. J. Trop. Geogr. 28, 40–56.
King, D., Bourennane, H., Isambert, M., Macaire, J.J., 1999. Rela-
tionship of the presence of a non-calcareous clay-loam horizon to
DEM attributes in a gently sloping area. Geoderma 89, 95–111.
Kubota, D., Masunaga, T., Hermansah, Rasyidin, A., Hotta, M.,
Shinmura, Y., Wakatsuki, T., 1998. Soil environment and tree
species diversity in tropical rain forest, West Sumatra, Indone-
sia. In: Schulte, A., Ruhiyat, D. (Eds.), Soil of Tropical Forest
Ecosystems. Springer, Heidelberg, Germany, pp. 159–167.
Lee, S.J., 1999. Physiological and growth responses to different
elevations and light environments in seedlings of six species
of Nanjenshan forest. Master thesis, Graduate Institute of Trop-
ical Agriculture, National Pingtung University Taiwan (In Chi-
nese, with English abstract).
Liao, S.H., 1994. Relationships among soil chemical properties,
topography and plant species in lower montane subtropical rain
forest by redundancy analysis. Master thesis, Graduate Institute
of Botany, National Taiwan University Taiwan (In Chinese, with
English abstract).
Liao, C.C., 1995. Altitudinal variation in composition, structure,
diversity and distribution pattern of the subtropical rain forest
in Nanjenshan. Master thesis, Graduate Institute of Botany,
National Taiwan University Taiwan (In Chinese, with English
abstract).
Liechty, H.O., Jurgensen, M.F., Mroz, G.D., Gale, M.R., 1997. Pit
and mound topography and its influence on storage of carbon,
nitrogen, and organic matter within an old-growing forest. Can.
J. For. Res. 27, 1992–1997.
Lin, C.C., 1998. Leaf structure of Nanjenshan lowland rain
forest trees. Master thesis, Graduate Institute of Botany,
National Taiwan University Taiwan (In Chinese, with En-
glish abstract).
Malo, D.D., Worcester, B.K., Cassel, D.K., Matzdorf, K.D., 1974.
Soil– landscape relationships in a closed drainage system. Proc.
-Soil Sci. Soc. Am. 38, 813–818.
Marrs, R.H., Proctor, J., Heaney, A., Mountford, M.D., 1988.
Changes in soils, nitrogen mineralization and nitrification
along an altitudinal transect in tropical rain forest in Costa Rica.
J. Ecol. 76, 466–482.
McDaniel, P.A., Bathke, G.R., Boul, S.W., Cassel, D.K., Falen,
A.L., 1992. Secondary manganese/iron ratios as pedochemical
indicators of field-scale throughflow water movement. Soil
Sci. Soc. Am. J. 56, 1211–1217.
McKenzie, N.J., Ryan, P.J., 1999. Spatial prediction of soil proper-
ties using environmental correlation. Geoderma 89, 67–94.
Nizeyimana, E., Bicki, T.J., 1992. Soil and soil – landscape relation-
ships in the north central region of Rwanda, east-central Africa.
Soil Sci. 153, 225–236.
Ollinger, S.V., Smith, M.L., Martin, M.E., Hallett, R.A., Good-
ale, C.L., Aber, J.D., 2002. Regional variation in foliar chem-
istry and N cycling among forests of diverse history and
composition. Ecology 83, 339–355.
Pennock, D.J., Zebarth, B.J., de Jone, E., 1987. Landform classifi-
cation and soil distribution in hummocky terrain Saskatchewan,
Canada. Geoderma 40, 297–315.
SAS Institute, 1990. SAS/STAT User’s Guide, Version 6, 4th edi-
tion. SAS Institute, Cary, NC.
Schaetzl, R.J., 1990. Effects of tree throw microtopography on the
characteristics and genesis of Spodosol, Michigan, USA. Catena
17, 111–126.
Soil Survey Laboratory Staff, 1996. Soil Survey Laboratory
Methods Manual. Soil Survey Investigations Report, vol.
42. National Soil Survey Center, Lincoln, NE Version 3.0.
USDA-NRCS.
Soil Survey Staff, 1999. Soil Taxonomy: A Basic System of Soil
Classification for Making and Interpreting Soil Surveys. USDA-
NRCS, 2nd ed. Agricultural Handbook, vol. 436. U. S. Gov.
Print. Office, Washington, DC.
Stolt, M.H., Baker, J.C., Simpson, T.W., 1993. Soil – landscape
relationships in Virginia: II. Reconstruction analysis and soil
genesis. Soil Sci. Soc. Am. J. 57, 422–428.
Sugden, A.M., 1985. Leaf anatomy in a Venezuelan montane forest.
Bot. J. Linn. Soc. 90, 231–241.
Sun, I.F., Hsieh, C.F., Hubbell, S.P., 1998. The structure and
species composition of a subtropical monsoon forest in south-
ern Taiwan on a steep wind-stress gradient. In: Dallmeier, F.,
Comiskey, J.A. (Eds.), Forest Diversity Research, Monitoring
and Modeling: Conceptual Background and Old World Case
Studies. Parthenon Publishing, Paris, pp. 565–635.
ter Braak, C.J.F., 1990. CANOCO-A FORTRAN program for ca-
nonical community ordination by [partial] [detrended] [canoni-

C.-C. Tsui et al. / Geoderma 123 (2004) 131–142142
cal] correspondence analysis, principal components analysis and
redundancy analysis (version 3.10). Agricultural mathematics
Group, Wageningen.
Van Breemen, N., Finzi, A.C., 1998. Plant– soil interactions: eco-
logical aspects and evolutionary implications. Biogeochemistry
42, 1–19.
Van Breemen, N., Finzi, A.C., Canham, C.D., 1997. Canopy tree–
soil interactions within temperate forests: effects of soil elemen-
tal composition and texture on species distributions. Can. J. For.
Res. 27, 1110–1116.
Venterea, R.T., Lovett, G.M., Groffman, P.M., Schwarz, P.A., 2003.
Landscape patterns of net nitrification in a northern hardwood-
conifer forest. Soil Sci. Soc. Am. J. 67, 527–539.
Related Documents