Relationships between lumbar inter-vertebral kinematics and paraspinal myoelectric activity during sagittal flexion: a quantitative fluoroscopy and surface electromyography study Alister John du Rose BSc (Hons), MChiro, PgCert A thesis submitted in partial fulfilment of the requirements of Bournemouth University for the degree of Doctor of Philosophy (PhD) Collaborating Establishment: Institute of Musculoskeletal Research & Clinical Implementation, Anglo-European College of Chiropractic, Bournemouth October 2016

Welcome message from author
This document is posted to help you gain knowledge. Please leave a comment to let me know what you think about it! Share it to your friends and learn new things together.
Transcript

Relationships between lumbar inter-vertebral kinematics
and paraspinal myoelectric activity during sagittal flexion:
a quantitative fluoroscopy and surface electromyography
study
Alister John du Rose BSc (Hons), MChiro, PgCert
A thesis submitted in partial fulfilment of the
requirements of Bournemouth University for the degree
of Doctor of Philosophy (PhD)
Collaborating Establishment: Institute of Musculoskeletal
Research & Clinical Implementation, Anglo-European
College of Chiropractic, Bournemouth
October 2016


i
“This copy of the thesis has been supplied on condition that anyone who consults it is
understood to recognise that its copyright rests with its author and due acknowledgement
must always be made of the use of any material contained in, or derived from, this thesis.”
ii
Abstract
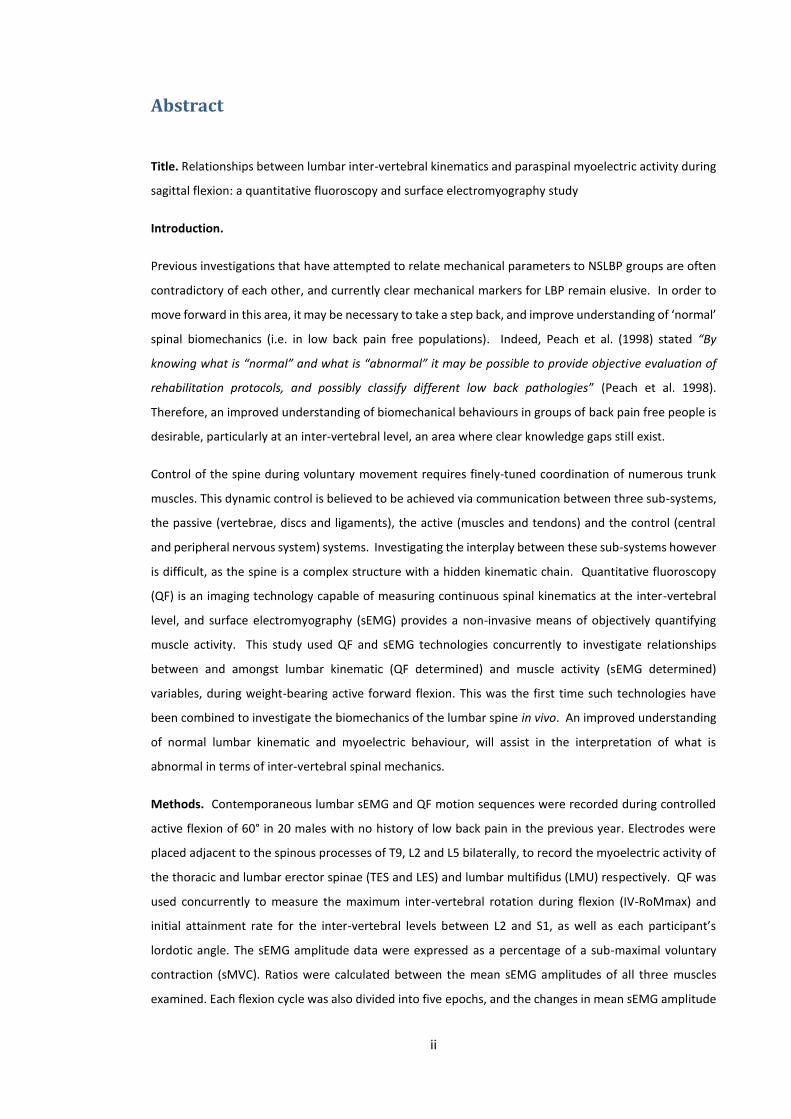
Title. Relationships between lumbar inter-vertebral kinematics and paraspinal myoelectric activity during
sagittal flexion: a quantitative fluoroscopy and surface electromyography study
Introduction.
Previous investigations that have attempted to relate mechanical parameters to NSLBP groups are often
contradictory of each other, and currently clear mechanical markers for LBP remain elusive. In order to
move forward in this area, it may be necessary to take a step back, and improve understanding of ‘normal’
spinal biomechanics (i.e. in low back pain free populations). Indeed, Peach et al. (1998) stated “By
knowing what is “normal” and what is “abnormal” it may be possible to provide objective evaluation of
rehabilitation protocols, and possibly classify different low back pathologies” (Peach et al. 1998).
Therefore, an improved understanding of biomechanical behaviours in groups of back pain free people is
desirable, particularly at an inter-vertebral level, an area where clear knowledge gaps still exist.
Control of the spine during voluntary movement requires finely-tuned coordination of numerous trunk
muscles. This dynamic control is believed to be achieved via communication between three sub-systems,
the passive (vertebrae, discs and ligaments), the active (muscles and tendons) and the control (central
and peripheral nervous system) systems. Investigating the interplay between these sub-systems however
is difficult, as the spine is a complex structure with a hidden kinematic chain. Quantitative fluoroscopy
(QF) is an imaging technology capable of measuring continuous spinal kinematics at the inter-vertebral
level, and surface electromyography (sEMG) provides a non-invasive means of objectively quantifying
muscle activity. This study used QF and sEMG technologies concurrently to investigate relationships
between and amongst lumbar kinematic (QF determined) and muscle activity (sEMG determined)
variables, during weight-bearing active forward flexion. This was the first time such technologies have
been combined to investigate the biomechanics of the lumbar spine in vivo. An improved understanding
of normal lumbar kinematic and myoelectric behaviour, will assist in the interpretation of what is
abnormal in terms of inter-vertebral spinal mechanics.
Methods. Contemporaneous lumbar sEMG and QF motion sequences were recorded during controlled
active flexion of 60° in 20 males with no history of low back pain in the previous year. Electrodes were
placed adjacent to the spinous processes of T9, L2 and L5 bilaterally, to record the myoelectric activity of
the thoracic and lumbar erector spinae (TES and LES) and lumbar multifidus (LMU) respectively. QF was
used concurrently to measure the maximum inter-vertebral rotation during flexion (IV-RoMmax) and
initial attainment rate for the inter-vertebral levels between L2 and S1, as well as each participant’s
lordotic angle. The sEMG amplitude data were expressed as a percentage of a sub-maximal voluntary
contraction (sMVC). Ratios were calculated between the mean sEMG amplitudes of all three muscles
examined. Each flexion cycle was also divided into five epochs, and the changes in mean sEMG amplitude
iii
between epochs were calculated. This was repeated to determine changes between all epochs for each
muscle group. Relationships between IV-RoMmax and all other kinematic, morphological (i.e. lordosis)
and muscle activity variables were determined using correlation coefficients, and simple linear regression
was used to determine the effects of any significant relationships. The reliability and agreement of the IV-
RoMmax, initial attainment rate, and normalised RMS sEMG measurements were also assessed.
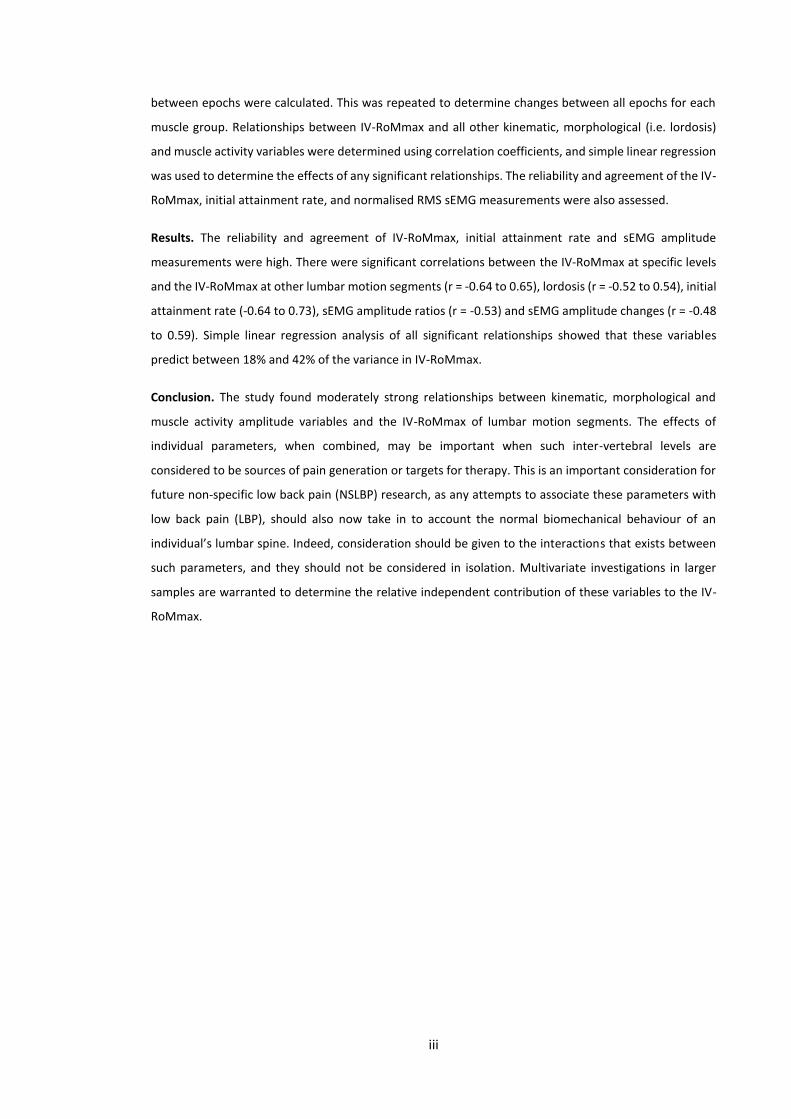
Results. The reliability and agreement of IV-RoMmax, initial attainment rate and sEMG amplitude
measurements were high. There were significant correlations between the IV-RoMmax at specific levels
and the IV-RoMmax at other lumbar motion segments (r = -0.64 to 0.65), lordosis (r = -0.52 to 0.54), initial
attainment rate (-0.64 to 0.73), sEMG amplitude ratios (r = -0.53) and sEMG amplitude changes (r = -0.48
to 0.59). Simple linear regression analysis of all significant relationships showed that these variables
predict between 18% and 42% of the variance in IV-RoMmax.
Conclusion. The study found moderately strong relationships between kinematic, morphological and
muscle activity amplitude variables and the IV-RoMmax of lumbar motion segments. The effects of
individual parameters, when combined, may be important when such inter-vertebral levels are
considered to be sources of pain generation or targets for therapy. This is an important consideration for
future non-specific low back pain (NSLBP) research, as any attempts to associate these parameters with
low back pain (LBP), should also now take in to account the normal biomechanical behaviour of an
individual’s lumbar spine. Indeed, consideration should be given to the interactions that exists between
such parameters, and they should not be considered in isolation. Multivariate investigations in larger
samples are warranted to determine the relative independent contribution of these variables to the IV-
RoMmax.

iv
Contents Abstract .......................................................................................................................................... ii
List of Figures ............................................................................................................................. xvii
List of Tables ................................................................................................................................ xx
Acknowledgements .................................................................................................................... xxii
Author’s declaration ................................................................................................................. xxiii
Chapter 1: Background .................................................................................................................. 1
1.1 Introduction ........................................................................................................................ 1
1.2 A requirement for enhanced functional assessment? ........................................................ 1
1.3 Investigating spinal control ................................................................................................. 3
1.4 Contemporaneous monitoring of inter-vertebral passive and active control systems ...... 4
1.5 Thesis overview ................................................................................................................... 5
Chapter 2: Literature review .......................................................................................................... 7
Introduction .............................................................................................................................. 7
Section 1: Anatomy and function of the lumbar spine ......................................................... 7
Section 2: Addressing the problem of NSLBP ....................................................................... 7
Section 3: Spinal stability and control mechanisms .............................................................. 7
Section 4: Sagittal lumbar curvature and interactions within the passive system ............... 7
Section 5: Measuring lumbar spine kinematics and muscle activity .................................... 8
Section 6: Dynamic task standardisation .............................................................................. 8
Section 7: Summary and conclusions .................................................................................... 8
Method of literature review ..................................................................................................... 8
Section 1 .................................................................................................................................... 9
2.1 Anatomy and function of the lumbar spine ........................................................................ 9
2.1.1 Passive elements .......................................................................................................... 9
2.1.1.1 Facet joints (Zygapophysial joints) ............................................................................ 9
2.1.1.2 Lumbar spinal ligaments ......................................................................................... 10
2.1.1.3 The inter-vertebral disc ........................................................................................... 11
2.1.2 Active elements.......................................................................................................... 12
2.1.2.1 The lumbar paraspinal muscles .............................................................................. 12
2.1.2.2 The interspinales and intertransversarii mediales .................................................. 13
2.1.2.3 Lumbar multifidus (LMU) ........................................................................................ 13
2.1.2.4 Longissimus thoracis pars thoracis (Thoracic erector spinae (TES)) ....................... 14
2.1.2.5 Longissimus thoracis pars lumborum (Lumbar erector spinae (LES)) ..................... 15
v
2.1.2.6 Iliocostalis lumborum (IL) ........................................................................................ 16
2.1.2.7 The thoracolumbar fascia (TLF) .............................................................................. 16
2.1.2.8 The principal muscles of the abdomen ................................................................... 17
2.1.2.9 Transversus abdominis (TrA) .................................................................................. 17
2.1.2.10 Rectus abdominis, internal and external obliques ............................................... 18
2.1.2.11 Muscles of the lower extremity, psoas major and quadratus lumborum (QL) .... 18
2.1.2.12 Psoas major ........................................................................................................... 19
2.1.2.13 Quadratus lumborum (QL) .................................................................................... 19
2.1.2.14 Gluteus maximus .................................................................................................. 20
2.1.2.15 The hamstrings ...................................................................................................... 20
2.1.2.16 The quadriceps ...................................................................................................... 21
2.1.3 The pelvis ................................................................................................................... 22
Section 2 .................................................................................................................................. 24
2.2 Addressing the problem of NSLBP .................................................................................... 24
2.2.1 The ‘biomechanical’ components of low back pain ................................................... 24
2.2.2 The importance of ‘normal’ (the study of low back pain free participants) .............. 25
2.2.3 Is it time for a fresh approach? ...................................................................................... 27
Section 3 .................................................................................................................................. 29
2.3 Spinal stability and control mechanisms .......................................................................... 29
2.3.1 Spinal stability ............................................................................................................ 29
2.3.2 Maintaining the equilibrium of the lumbar spine during forward bending .............. 32
2.3.3 Spinal feedback mechanisms ..................................................................................... 34
2.3.4 Muscle recruitment strategies ................................................................................... 36
2.3.5 Locally and globally acting muscles (stability) ........................................................... 37
2.3.6 Muscle deactivation and the flexion relaxation phenomenon (FRP) ........................ 40
2.3.7 Selecting muscles for investigation ............................................................................ 42
2.3.8 The other abdominal muscles .................................................................................... 45
Section 4 .................................................................................................................................. 45
2.4 Sagittal lumbar curvature and interactions within the passive spinal system ................. 45
2.4.1 Lordosis ...................................................................................................................... 45
2.4.2 Sagittal Balance .......................................................................................................... 46
2.4.3 Regions within the lumbar spine ............................................................................... 47
2.4.4 Sub-groups ................................................................................................................. 47
2.4.5 Inter-segmental interactions ..................................................................................... 48

vi
2.4.6 Should researchers persist with the investigation of IV-RoM? .................................. 50
2.4.7 Neutral zone, initial attainment rate and spinal RoM ............................................... 51
2.4.8 Force deformation ......................................................................................................... 54
2.4.9 Spinal modelling: reductionist and systems approaches ........................................... 55
Section 5 .................................................................................................................................. 56
2.5 Measuring lumbar spine kinematics and muscle activity ................................................. 56
2.5.1 Surface measures ....................................................................................................... 56
2.5.2 Inter-vertebral measures ........................................................................................... 56
2.5.3 Strengths and weaknesses of lumbar kinematic measures .................................. 58
2.5.4 Agreement, reliability and accuracy of spinal movement measurements .......... 58
2.5.5 Electromyography (EMG) ............................................................................................ 60
2.5.5.1 EMG amplitude ...................................................................................................... 60
2.5.5.2 EMG signal frequency ........................................................................................... 60
2.5.5.3 Temporal activation patterns: EMG signal onset and offset .............................. 61
2.5.6 EMG methodology design considerations .................................................................. 61
2.5.6.1 Surface or fine wire intra-muscular electrodes? ................................................ 62
2.5.6.2 Electrode positioning .............................................................................................. 63
2.5.6.3 Electrode positioning for the paraspinal muscles ................................................... 64
2.5.6.4 Spinal Level Identification ....................................................................................... 65
2.5.6.5 Filtering ................................................................................................................... 66
2.5.6.6 The problem of ECG ................................................................................................ 66
2.5.6.7 Normalisation .......................................................................................................... 67
2.5.6.8 Reference Contractions .......................................................................................... 68
2.5.6.9 Normalising to the peak .......................................................................................... 69
2.5.6.10 EMG amplitude measurement reliability .............................................................. 69
2.5.6.11 Fear of movement ................................................................................................. 70
Section 6 .................................................................................................................................. 70
2.6 Dynamic task standardisation ........................................................................................... 70
2.6.1 A case for standardisation and the use of pelvic restraint ........................................ 70
2.6.2 Rate of movement and gross measurements ............................................................ 73
Section 7 .................................................................................................................................. 76
2.7 Systematic Review ............................................................................................................ 76
2.7.1 Introduction ................................................................................................................... 76
2.7.2 Literature search strategy .............................................................................................. 78

vii
2.7.3 Inclusion and exclusion criteria ...................................................................................... 78
2.7.4 PRISMA (Preferred Reporting Items for Systematic reviews and Meta-Analyses) ........ 79
2.7.5 Study quality assessment ............................................................................................... 79
2.7.5.1 Overall quality assessment (Abboud et al. 2017) ................................................... 80
2.7.5.2 Specific EMG quality assessment ............................................................................ 80
2.7.6 Results ............................................................................................................................ 81
2.7.6.1 Overall and EMG quality assessment ...................................................................... 81
2.7.6.2 Study characteristics ............................................................................................... 85
2.7.6.3 General characteristics of the reviewed studies ..................................................... 90
2.7.6.4 Comparing healthy control and low back pain groups ........................................... 91
2.7.6.5 Flexion relaxation studies ....................................................................................... 92
2.7.6.6 Models .................................................................................................................... 93
2.7.7 Discussion....................................................................................................................... 93
2.7.7.1 Quality assessment ................................................................................................. 93
2.7.7.2 Spinal stability and sub-system interaction ............................................................ 94
2.7.7.3 Can the information aquired by combining lumbar kinematic and muscle activity
measurements during functional movements assist in distinguishing between groups of
healthy controls and those with low back pain? ................................................................ 97
2.7.8 Conclusions .................................................................................................................... 98
Section 8 ................................................................................................................................ 100
2.8.1 Summary and conclusions ........................................................................................... 100
2.8.2 Study hypotheses, aims, research question and objectives ........................................ 101
2.8.2.1 Hypothesis ............................................................................................................. 101
2.8.2.2 Sub hypotheses ..................................................................................................... 101
2.8.2.3 Aim ........................................................................................................................ 102
2.8.2.4 Secondary aims ..................................................................................................... 102
2.8.2.5 Research question ................................................................................................. 102
2.8.2.6 Objectives.............................................................................................................. 102
Chapter 3: Preliminary studies ................................................................................................... 104
3.1 Choosing an appropriate plane of motion ...................................................................... 104
3.1.1. Introduction ............................................................................................................ 104
3.1.2 Method .................................................................................................................... 104
3.1.3 Data Analysis ............................................................................................................ 105
3.1.4 Results ...................................................................................................................... 105

viii
3.1.5 Discussion ................................................................................................................. 109
3.1.5.1 Planes of investigation .......................................................................................... 109
3.1.5.2 Visual analysis of the motion graphs .................................................................... 110
3.1.5.3 The pros and cons of investigating the coronal plane .......................................... 111
3.1.5.4 Muscle activity onset and offset parameters ....................................................... 111
3.1.5.5 The influence of kinematic behaviours during sagittal weight-bearing on sEMG
recording site positioning decisions.................................................................................. 112
3.1.6 Conclusion ................................................................................................................ 113
3.2 An exploration into the relationships between the degree of lordosis and lumbar IV-
RoMmax during weight-bearing sagittal flexion, and a visual analysis of the order and
magnitude of inter-vertebral movements. ........................................................................... 114
3.2.1 Introduction ............................................................................................................. 114
3.2.2 Methods ................................................................................................................... 114
3.2.3 Data analysis ............................................................................................................ 114
3.2.4 Results ...................................................................................................................... 115
3.2.5 Discussion ................................................................................................................. 118
3.2.6 Conclusion ................................................................................................................ 119
3.3 Electrode Displacement Study ........................................................................................ 120
3.3.1 Introduction ............................................................................................................. 120
3.3.2 Method .................................................................................................................... 120
3.3.3 Data analysis ............................................................................................................ 121
3.3.4 Results ...................................................................................................................... 121
3.3.5 Discussion ................................................................................................................. 122
3.3.6 Conclusion ................................................................................................................ 122
3.4 Summary ..................................................................................................................... 123
Chapter 4: Methodology ............................................................................................................ 124
4.1 Introduction .................................................................................................................... 124
4.1.1 Section 1: Variables selected for investigation ............................................................ 124
4.1.1.1 Main outcome variable: IV-RoMmax .................................................................... 124
4.1.1.2 Other QF variables ................................................................................................ 124
4.1.1.3 sEMG variables ...................................................................................................... 124
4.2 Section 2: Main study methodology ............................................................................... 125
4.2.1 Study design ............................................................................................................. 125
4.2.2 Sample size ............................................................................................................... 125
4.2.3 Eligibility and recruitment ........................................................................................ 126
ix
4.2.3.1 Inclusion and exclusion criteria ............................................................................. 126
4.2.3.2 Rationalisation of the inclusion and exclusion criteria ......................................... 126
4.2.4 Recruitment ............................................................................................................. 128
4.2.5 Data collection ......................................................................................................... 128
4.2.5.1 Study environment ............................................................................................... 128
4.2.6 The quantitative fluoroscopy technology ................................................................ 128
4.2.7 QF equipment .......................................................................................................... 131
4.2.8 The QF image acquisition protocol .......................................................................... 131
4.2.9 Analysis of QF data ................................................................................................... 133
4.2.10 Radiation exposure ................................................................................................ 133
4.2.11 Incidental findings .................................................................................................. 134
4.2.12 Surface electromyography ......................................................................................... 134
4.2.13 The sEMG equipment ............................................................................................ 134
4.2.14 The sEMG recording protocol ................................................................................ 134
4.2.15 Electrode application accuracy .............................................................................. 136
4.2.16 Reference contraction for the purpose of normalisation ...................................... 137
4.2.17 Checking for signal contamination......................................................................... 138
4.2.18 Analysis of sEMG data ............................................................................................ 138
4.2.19 Risks associated with sEMG ................................................................................... 138
4.2.20 Synchronisation of technologies ................................................................................ 139
4.2.20.1 Synchronisation of QF and the onset of motion frame movement .................... 139
4.2.20.2 Synchronisation of sEMG and motion frame movement ................................... 139
4.2.21 Ethics ...................................................................................................................... 139
4.2.22 Public and patient involvement (PPI) ..................................................................... 140
4.2.23 Summary ................................................................................................................ 140
Chapter 5: Accuracy, agreement and reliability ........................................................................ 141
5.1 Part one: Intra- and inter-marker agreement and reliability of IV-RoMmax and initial
attainment rate measurements in the sagittal plane QF protocol. ...................................... 141
5.1.1 Introduction ............................................................................................................. 141
5.1.2 Accuracy ................................................................................................................... 142
5.1.3 Agreement and reliability ........................................................................................ 143
5.1.4 Why is it necessary to investigate agreement and reliability of measurements using
both the recumbent and weight-bearing QF protocols? .................................................. 144
Objective: .......................................................................................................................... 145
x
5.1.5 Methods ................................................................................................................... 145
5.1.6 Data analysis ............................................................................................................ 146
5.1.6.1 Rationale statistical method ................................................................................. 146
5.1.6.2 ICC Selection ......................................................................................................... 147
5.1.6.3 Agreement ............................................................................................................ 149
5.1.7 Results ...................................................................................................................... 149
5.1.7.1 IV-RoMmax: Reliability .......................................................................................... 149
5.1.7.2 IV-RoMmax: Agreement ....................................................................................... 150
5.1.7.3 Initial attainment rate ........................................................................................... 151
5.1.8 Discussion ................................................................................................................. 152
5.1.8.1 IV-RoM .................................................................................................................. 152
5.1.8.2 Initial attainment rate ........................................................................................... 155
5.1.8.3 Summary ............................................................................................................... 156
5.1.9 Conclusion ................................................................................................................ 157
5.2 Part 2: Surface electromyography (sEMG) of the lumbar and thoracic paravertebral
muscles during the weight-bearing sagittal plane QF protocol: An Intra- and inter-session
sEMG agreement and reliability study. ................................................................................. 158
5.2.1 Introduction ............................................................................................................. 158
Objectives.......................................................................................................................... 158
5.2.2 Methods ................................................................................................................... 159
5.2.3 Ethical Approval ....................................................................................................... 160
5.2.4 Data analysis ............................................................................................................ 160
5.2.5 Results ...................................................................................................................... 161
5.2.6 Discussion ................................................................................................................. 163
5.2.6.1 Comparing muscle activity between sides ............................................................ 163
5.2.6.2 Reliability ............................................................................................................... 164
5.2.6.3 Agreement ............................................................................................................ 165
5.2.6.4 Summary ............................................................................................................... 166
5.2.7 Conclusion ................................................................................................................ 166
Chapter 6 .................................................................................................................................... 167
6.1 Relationships between lumbar inter-vertebral motion and lordosis in adult males: a cross
sectional cohort study................................................................................................................ 167
6.1.1 Introduction ................................................................................................................. 167
6.1.2 Background .................................................................................................................. 167
6.1.3 Methods ....................................................................................................................... 169

xi
6.1.3.1 Study design .......................................................................................................... 169
6.1.3.2 Participants ........................................................................................................... 169
6.1.3.3 Data collection and processing ............................................................................. 170
6.1.3.4 Data analysis ......................................................................................................... 174
6.1.4 Results .......................................................................................................................... 174
6.1.4.1 Correlations ........................................................................................................... 177
6.1.4.2 Simple linear regression analysis .......................................................................... 178
6.1.5 Discussion..................................................................................................................... 183
6.1.5.1 Lordosis vs IV-RoMmax ......................................................................................... 183
6.1.5.2 Implications for stabilisation surgery .................................................................... 185
6.1.5.3 Inter-segmental versus regional motion studies .................................................. 186
6.1.5.4 IV-RoMmax vs IV-RoMmax ................................................................................... 188
6.1.5.5 Initial attainment rate (laxity) and IV-RoMmax .................................................... 189
6.1.5.6 An intra-operative comparison ............................................................................. 190
6.1.5.7 Compensation by adjacent segments ................................................................... 191
6.1.6 Limitations.................................................................................................................... 192
6.1.7 Conclusions .................................................................................................................. 192
Chapter 7 .................................................................................................................................... 194
7.1 Relationships between paraspinal muscle activity and lumbar inter-vertebral range of
motion ........................................................................................................................................ 194
7.1.1 Introduction ................................................................................................................. 194
7.1.2 Background .................................................................................................................. 194
7.1.2.1 Contemporaneous monitoring of inter-vertebral passive and motor control
systems ............................................................................................................................. 195
7.1.2.2 Variable selection .................................................................................................. 195
7.1.2.3 Enhanced functional assessment .......................................................................... 196
7.1.3 Aim of the study ........................................................................................................... 196
7.1.3.1 Specific objectives ................................................................................................. 196
7.1.4 Methods ....................................................................................................................... 197
7.1.4.1 Electromyography ................................................................................................. 197
7.1.4.2 Electrode positioning accuracy ............................................................................. 198
7.1.4.3 The sEMG equipment set-up and signal processing ............................................. 199
7.1.4.4 The reference contraction .................................................................................... 199
7.1.4.5 Synchronisation ..................................................................................................... 200

xii
7.1.4.6 Fear of movement ................................................................................................. 200
7.1.5 Data analysis ................................................................................................................ 200
7.1.6 Results .......................................................................................................................... 201
7.1.6.1 A general description of sEMG activation patterns for LMU, LES and TES during the
forward bending cycle....................................................................................................... 202
7.1.6.2 Correlations between mean muscle activity and IV-RoMmax .............................. 210
7.1.6.3 Correlations between Muscle Activity Changes and IV-RoMmax ........................ 210
7.1.6.4 Correlations between sEMG Ratios and IV-RoMmax ........................................... 212
Table 30: Correlations between muscle activity ratios and IV-RoMmax at all inter-
vertebral levels (n = 18) .................................................................................................... 213
7.1.7 Discussion..................................................................................................................... 214
7.1.7.1 Relationships between mean muscle activity amplitudes over the entire flexion
cycle and IV-RoMmax........................................................................................................ 215
Sub hypothesis .................................................................................................................. 215
7.1.7.2 Relationships between muscle activity ratios and IV-RoMmax ............................ 216
Sub hypothesis .................................................................................................................. 216
7.1.7.3 Fibre types and sizes ............................................................................................. 218
7.1.7.4 The exploration of other muscle activity ratios .................................................... 218
7.1.7.5 The importance of consistent electrode positioning ............................................ 219
7.1.7.6 Relationships between muscle activity amplitude changes and IV-RoMmax ...... 220
Sub-hypothesis .................................................................................................................. 220
7.1.7.7 Motor control and segmental interaction ............................................................ 223
7.1.7.8 A stabilisation strategy of the healthy lumbar spine ............................................ 224
7.1.7.9 LMU control of L5-S1 IV-RoMmax......................................................................... 225
7.1.7.10 Could the thoracolumbar fascia (TLF) have a role in sensory feedback? ........... 226
7.1.7.11 Is LMU’s primary role to restrain forward flexion? ............................................. 226
7.1.7.12 Understanding of the roles that TES, LES and LMU have in terms of lumbar
stabilisation, can be enhanced by collecting concurrent inter-vertebral and multiple
muscle data ....................................................................................................................... 227
7.1.8 Conclusions .................................................................................................................. 228
Chapter 8: Contributions to knowledge..................................................................................... 229
8.1 Introduction .................................................................................................................... 229
8.1.1: Contemporaneous QF and sEMG analysis .............................................................. 229
8.1.2: Observer repeatability of QF weight-bearing IV-RoMmax and initial attainment rate
measurements .................................................................................................................. 229
xiii
8.1.3: Intra-subject repeatability of RMS sEMG amplitude measurements (highlighting a
benefit of the standardised study protocol) ..................................................................... 229
8.1.4: Relationships between lordosis and the IV-RoMmax ............................................. 230
8.1.5: Inter-level relationships in terms of IV-RoMmax .................................................... 230
8.1.6: Relationships between initial attainment rate and IV-RoMmax ............................ 231
8.1.7: A relationship between the ratio of LES/TES muscle activity and the IV-RoMmax of
L4-L5 .................................................................................................................................. 231
8.1.8: Relationships between muscle activity changes during the flexion cycle and the IV-
RoMmax of the lower lumbar motion segments (i.e. L4-L5 and L5-S1). .......................... 231
8.1.8.1 TES and LES ........................................................................................................... 231
8.1.8.2 LMU ....................................................................................................................... 232
8.1.9: Relationships between initial attainment rate and muscle activity changes ......... 232
8.1.10: A relationship between lordosis and the initial attainment rate of L4-L5 ............ 233
8.2 Summary ......................................................................................................................... 233
Chapter 9: Discussion ................................................................................................................. 234
9.1 Introduction .................................................................................................................... 234
9.2 Lumbar biomechanics and back pain: cause or effect? .............................................. 234
9.3 Muscle activity patterns and pain predisposition ....................................................... 235
9.4 A focus on forward flexion .......................................................................................... 236
9.5 Sub-grouping populations ........................................................................................... 237
9.6 Spinal surgery .............................................................................................................. 238
9.7 Segmental biomechanics and individualised care ...................................................... 239
9.8 Spinal modelling .......................................................................................................... 241
9.9 An emphasis on kinematic parameters ...................................................................... 241
9.10 Further data analysis ..................................................................................................... 242
9.10.1 Lordosis versus initial attainment rate .................................................................. 242
9.10.2 Muscle activity changes versus initial attainment rate ......................................... 244
9.11 Limitations of this work ................................................................................................ 245
9.11.1 The size of the QF image field ................................................................................ 245
9.11.2 Securing the Pelvis ................................................................................................. 246
9.11.3 Pelvic restraint versus free bending....................................................................... 246
9.11.4 The use of sEMG technology in isolation ............................................................... 248
9.11.5 The determination of lordosis ............................................................................... 248
9.11.6 Pre-examination activity ........................................................................................ 249
Chapter 10 .................................................................................................................................. 250
xiv
10.1 Conclusion .......................................................................................................................... 250
10.2 Future Work .................................................................................................................. 251
10.2.1 Sample size ............................................................................................................. 251
10.2.2 Exploring the influence of other mechanical variables on IV-RoMmax ................. 251
10.2.2.1 Translation .......................................................................................................... 251
10.2.2.2 Disc degeneration ............................................................................................... 252
10.2.2.3 Motion sharing variability (MSV) ........................................................................ 253
10.2.3 Other future research possibilities ........................................................................ 253
10.2.3.1 Reference ranges ................................................................................................ 253
10.2.3.2 Pain developer groups and sub-grouping ........................................................... 254
10.2.3.3 Plane of investigation.......................................................................................... 255
10.2.3.4 Removing the contamination of gravity and loading.......................................... 255
10.2.3.5 Maximising sEMG data collection ....................................................................... 256
10.2.3.6 Investigating other muscles ................................................................................ 256
10.2.3.7 Further exploration of the Flexion relaxation Phenomenon (FRP) ..................... 257
References ................................................................................................................................. 258
Appendices ................................................................................................................................. 288
Appendix A: Research Dissemination ................................................................................... 289
Publications ....................................................................................................................... 289
Oral presentations ............................................................................................................ 289
Poster presentations ......................................................................................................... 290
Appendix B: Anatomical planes of movement ..................................................................... 291
Figure 70: Anatomical planes of movement ..................................................................... 291
Figure 71: Sagittal and coronal plane vertebral rotations ................................................ 291
Appendix C: Participant information sheets ......................................................................... 292
Information sheet for the sEMG reliability and agreement study .................................... 292
Information sheet for the main study ............................................................................... 295
Appendix D: Participant consent form for preliminary sEMG studies .................................. 303
Appendix E: Copies of ethical approval letters ..................................................................... 304
Appendix F: Summary of outcomes from PPI group meetings ............................................. 307
Appendix G: Checklist for sEMG and QF studies................................................................... 309
Appendix H: Cross sections of the spine at the levels of T9, L2 and L5 ................................ 310
Figure 72: Cross section of the spine at the level of T9; image taken from www.anatomy.tv
(04/06/2015) ..................................................................................................................... 310

xv
Figure 73: Cross section of the spine at the level of L2; image taken from
www.anatomy.tv. (04/06/2015) ....................................................................................... 310
Figure 74: Cross section of the spine at the level of L5; image taken from
www.anatomy.tv. (04/06/2015) ....................................................................................... 311
Appendix I ............................................................................................................................. 312
Tables of raw data for main study .................................................................................... 312
Table 31: LMU sEMG amplitude changes throughout the flexion cycle ........................... 312
Table 32: LES sEMG amplitude changes throughout the flexion cycle ............................. 313
Table 33: TES sEMG amplitude changes throughout the flexion cycle ............................. 314
Table 34: Mean sEMG amplitudes over the entire cycle .................................................. 315
Table 35: Mean sEMG amplitudes during the flexion phase of the cycle ........................ 316
Table 36: Mean sEMG amplitudes during the return phase of the cycle ......................... 317
Table 37: sEMG ratio data for LMU/TES, LMU/LES and LES/TES ...................................... 318
Table 38: IV-RoMmax data ................................................................................................ 319
Table 39: Initial attainment rate data ............................................................................... 320
Table 40: Lordotic angle data ............................................................................................ 321
Table 41: Normality test data (Shapiro-Wilk test) ............................................................ 322
Appendix J: Scatter plots for sEMG variables vs IV-RoMmax ............................................... 323
Figure 75: LES epoch 1-2 (%MVC) vs L4-L5 IV-RoMmax (°) ............................................... 323
Figure 76: LMU epoch 4-5 (%MVC) vs L5-S1 IV-RoMmax (°) ............................................ 323
Figure 77: LES epoch 2-3 (%MVC) vs L5-S1 IV-RoMmax (°) ............................................... 324
Figure 78: TES epoch 2-3 (%MVC) vs L5-S1 IV-RoMmax (°) .............................................. 324
Figure 79: LES/TES ratio during flexion phase vs L4-L5 IV-RoMmax (°) ............................ 325
Figure 80: LES/TES ratio during flexion phase vs L2-L3 IV-RoMmax (°) ............................ 325
Appendix K: Preliminary study raw data ............................................................................... 326
Table 42: Raw data for Preliminary Study 1 ...................................................................... 326
Appendix L: sEMG graphs for each participant during the entire flexion and return cycle . 327
Appendix M: IV-RoM graphs for each participant during the entire flexion and return cycle
.............................................................................................................................................. 333
Appendix N: QAREL Checklist for IV-RoMmax and initial attainment rate repeatability studies
.............................................................................................................................................. 339
Appendix O: QAREL Checklist for RMS sEMG amplitude repeatability study ....................... 340
Appendix P: Strobe checklist ................................................................................................. 341
Appendix Q: Publication A .................................................................................................... 345
Appendix R: Publication B ..................................................................................................... 353

xvi
Appendix S: Systematic review reporting checklist (Moher et al. 2009) .............................. 369
Appendix T: Justification of sample size for reliability studies ............................................. 371
Glossary ...................................................................................................................................... 373
xvii
List of Figures Figure 1A and 1B: Lateral and posterior views of a lumbar motion segment. Images taken from
www.anatomy.tv (04/03/2016) .................................................................................................... 9
Figure 2: Lateral view of a lumbar motion segment with the key ligamentous structures
attached. Image taken from www.anatomy.tv (04/06/2015) ................................................... 10
Figure 3: Superior view of a lumbar inter-vertebral disc. Image taken from www.anatomy.tv
(04/03/2016) ............................................................................................................................... 12
Figure 4: The lumbar interspinales and intertransversarii muscles (Posterior oblique view).
Image taken from www.anatomy.tv (04/06/2016) .................................................................... 13
Figure 5: The lumbar multifidus muscle and other local structures (Posterior view). Image
taken from www.anatomy.tv (04/06/2015) ............................................................................... 14
Figure 6: The longissimus thoracis muscle of the lumbar erector spinae and other local
structures (Posterior view). Images taken from www.anatomy.tv (04/06/2015) ..................... 16
Figure 7: The thoracolumbar fascia (Posterior view). Images taken from www.anatomy.tv
(04/03/2016) ............................................................................................................................... 17
Figure 8: The principal muscles of the abdomen (Anterior oblique view). Images taken from
www.anatomy.tv (04/03/2016) .................................................................................................. 18
Figure 9: The psoas major and quadratus lumborum muscles (Anterior view). Images taken
from www.anatomy.tv (04/03/2016) ......................................................................................... 19
Figure 10: The gluteus maximus muscle (posterior view). Images taken from www.anatomy.tv
(04/03/2016) ............................................................................................................................... 20
Figure 11: The hamstrings (Posterior view). Images taken from www.anatomy.tv (04/03/2016)
.................................................................................................................................................... 21
Figure 12: The quadriceps (Anterior view). Images taken from www.anatomy.tv (04/03/2016)
.................................................................................................................................................... 22
Figure 13: The ligaments of the pelvis (Anterior view). Images taken from www.anatomy.tv
(04/03/2016) ............................................................................................................................... 23
Figure 14: The concept of unstable and stable systems using the analogy of a ball on a surface.
Used with permission from Professor Peter Reeves (29/03/2016) ............................................ 30
Figure 15: The concept of robustness in response to perturbation using the analogy of a ball on
a surface. Used with permission from Professor Peter Reeves (29/03/2016) ........................... 31
Figure 16: The concept of robustness in response to changes in system parameters using the
analogy of a ball on a surface. Used with permission from Professor Peter Reeves (29/03/2016)
.................................................................................................................................................... 31
Figure 17: A typical lumbar paraspinal muscle EMG trace during sagittal flexion and return ... 33
Figure 18: A simple spinal system viewed in the sagittal plane taken from Bergmark (1989) .. 37
Figure 19: Panjabi’s Neutral Zone (NZ) adapted from Panjabi et al. (1994) ............................... 52
Figure 20: Loading of a crane (analogous to the loading of a spine) (adapted from Hodges et al.
2013) ........................................................................................................................................... 53
Figure 21A and 21B: Manual marking versus radiographic measurement methods (taken from
Kim et al. 2007) ........................................................................................................................... 65
Figure 22: An example of ECG contamination of a baseline recording from the erector spinae
(in a state of relaxation). The sEMG electrodes were located 5cm lateral to the T9 spinous
process ........................................................................................................................................ 66
Figure 23: Pelvic stabilisation for a QF sagittal flexion protocol ................................................. 71
xviii
Figure 24: Prisma flowchart ........................................................................................................ 79
Figure 25: A sagittal plane recumbent (flexion and return) motion graph .............................. 105
Figure 26: A sagittal plane weight-bearing (flexion and return) motion graph ........................ 106
Figure 27: A coronal plane recumbent (bending to the left) motion graph ............................. 106
Figure 28: A coronal plane weight-bearing (bending to the left) motion graph ...................... 107
Figure 29: Box and whisker plot comparing IV-RoMmax between recumbent and weight-
bearing groups during sagittal flexion and return .................................................................... 107
Figure 30: Box and whisker plot comparing the percentage of motion share between
recumbent and weight-bearing groups during sagittal flexion and return .............................. 108
Figure 31: Box and whisker plot comparing initial attainment rate between recumbent and
weight-bearing groups during sagittal flexion and return ........................................................ 109
Figure 32: Mean angular range of inter-vertebral levels during sagittal weight-bearing flexion
and return when the starting lordosis angle is divided into 3 groups ...................................... 116
Figure 33: Electrode positions for the electrode displacement study ...................................... 121
Figure 34: The effect of electrode displacement on signal amplitude during weight-bearing
sagittal flexion and return ......................................................................................................... 122
Figure 35: Templates placed around the lumbar vertebrae (L2-S1) on the first frame of the x-
ray video sequence ................................................................................................................... 129
Figure 36: Weight-bearing sagittal plane motion graph produced by the bespoke software
package from flexion and return movement data .................................................................... 130
Figure 37: A simplification of the graph shown in figure 36 (representing a single inter-
vertebral level) highlighting the stages of forward bending that correlate to different sections
of the plot ................................................................................................................................. 130
Figure 38: QF acquisition during a recumbent sagittal plane flexion and return protocol ...... 132
Figure 39: QF acquisition during a weight-bearing sagittal plane flexion and return protocol 132
Figure 40: Graphical user interface (GUI) from which angular range and initial attainment rate
values are taken ........................................................................................................................ 133
Figure 41: The bilateral sEMG electrode placements for TES, LES and LMU (Posterior view of
thoracic and lumbar spinous processes)................................................................................... 135
Figure 42: An electrode placed over the spinous process of L3 ............................................... 136
Figure 43: Flow chart outlining the key stages of the study protocol ...................................... 137
Figure 44: Electronic diagram of the microswitch circuitry built for the synchronisation of the
sEMG software and the motion table ....................................................................................... 139
Figure 45: Motion frame apparatus and foot positioning ........................................................ 160
Figure 46: Fluoroscope and weight-bearing motion frame ...................................................... 171
Figure 47: Weight-bearing motion frame during flexion including pelvic restraint mechanism
and lead protection ................................................................................................................... 171
Figure 48: Fluoroscopic image of the lumbar spine. Templates placed around the lumbar
vertebrae (L2-S1) on the first frame of the QF sequence ......................................................... 172
Figure 49: Frobin method to measure the change in inter-vertebral angle. Rotation is
calculated as the angle between the two mid-plane lines ....................................................... 173
Figure 50: Calculation of the maximum angular range reached during flexion (IV-RoMmax) . 173
Figure 51: Calculation of initial attainment rate ....................................................................... 174
Figure 52A - 52H: Scatter plots and linear regression values for all significant correlations ... 179
Figure 53: A participant with a lordosis of 67°. Movement initiates at L2-L3 .......................... 184

xix
Figure 54: A participant with a lordosis of 34°. Movement initiates at L4-L5 .......................... 184
Figure 55: The position of L4 vertebral body in different 4 different types of curvature ........ 185
Figure 56: Electrode positioning sites. (Note: T9 spinous refers to the spinous process of the
ninth thoracic vertebra, L2 to the second lumbar vertebra and L5 to the fifth lumbar vertebra.)
.................................................................................................................................................. 198
Figure 57: An electrode placed over the spinous process of L3 (duplication of figure 42) ...... 199
Figure 58: Synchronisation of the motion frame movement and sEMG recordings ................ 200
Figures 59A and 59B: Examples of raw (Figure 59A) and rectified and filtered (Figure 59B) LES
sEMG signal recorded during entire flexion and return cycle .................................................. 206
Figures 60A and 60B: Examples of raw (Figure 60A) and rectified and filtered (Figure 60B) LMU
sEMG signal recorded during flexion ........................................................................................ 207
Figures 61A and 61B: Examples of raw (Figure 61A) and rectified and filtered (Figure 61B) LES
sEMG signal recorded during flexion ........................................................................................ 208
Figures 62A and 62B: Examples of raw (Figure 62A) and rectified and filtered (Figure 62B) TES
sEMG signal recorded during flexion ........................................................................................ 209
Figure 63: The relationship between the LES/TES ratio and the IV-RoMmax at L4-5 .............. 214
Figure 64: An example of LMU activity and lumbar IV-RoM during sagittal flexion ................. 221
Figure 65: An example of LES and TES activity and L5-S1 IV-RoM during sagittal flexion (An
example of a greater IV-RoMmax). Please note that the scales of the Y-axis are slightly
different to those seen in Figure 66.......................................................................................... 222
Figure 66: An example of LES and TES activity and L5-S1 IV-RoM during sagittal flexion (An
example of a smaller IV-RoMmax) ............................................................................................ 222
Figure 67: The influence of the investigated parameters on the IV-RoMmax at different lumbar
levels ......................................................................................................................................... 237
Figure 68: Diagram of the possible influences of lordosis, segmental kinematics and sEMG
patterns on a surgically stabilised L4-L5 motion segment ........................................................ 238
Figure 69: A loading and unloading curve for an L4-5 lumbar disc during sagittal bending
(Image adapted from Adams et al. 1994) ................................................................................. 243
Figure 70: Anatomical planes of movement ............................................................................. 291
Figure 71: Sagittal and coronal plane vertebral rotations ........................................................ 291
Figure 72: Cross section of the spine at the level of T9; image taken from www.anatomy.tv
(04/06/2015) ............................................................................................................................. 310
Figure 73: Cross section of the spine at the level of L2; image taken from www.anatomy.tv.
(04/06/2015) ............................................................................................................................. 310
Figure 74: Cross section of the spine at the level of L5; image taken from www.anatomy.tv.
(04/06/2015) ............................................................................................................................. 311
Figure 75: LES epoch 1-2 (%MVC) vs L4-L5 IV-RoMmax (°) ....................................................... 323
Figure 76: LMU epoch 4-5 (%MVC) vs L5-S1 IV-RoMmax (°) .................................................... 323
Figure 77: LES epoch 2-3 (%MVC) vs L5-S1 IV-RoMmax (°)....................................................... 324
Figure 78: TES epoch 2-3 (%MVC) vs L5-S1 IV-RoMmax (°) ...................................................... 324
Figure 79: LES/TES ratio during flexion phase vs L4-L5 IV-RoMmax (°) .................................... 325
Figure 80: LES/TES ratio during flexion phase vs L2-L3 IV-RoMmax (°) .................................... 325
xx
List of Tables Table 1: Contrasting findings of studies attempting to determine biomechanical variables that
differentiate between LBP patients and healthy controls .......................................................... 26
Table 2: Methodological differences between well-known FRP studies .................................... 75
Table 3: Quality index assessment scores (*Studies that did not compare healthy controls to a
low back pain group were rated using a 9 point scale instead of 10) ........................................ 82
Table 4: EMG quality assessment scores (*Studies that did not require normalisation were
rated using a 3 point scale instead of 4) as per Abboud et al. 2017 ........................................... 83
Table 5: Combined quality index and EMG quality scores .......................................................... 84
Table 6: Study characteristics (N = 21) ........................................................................................ 85
Table 7: IV-RoMmax for each inter-vertebral level and lordosis groups .................................. 115
Table 8: Ranking of inter-vertebral levels in order of largest IV-RoMmax ............................... 117
Table 9: Ranking of inter-vertebral levels in order of movement initiation sequence ............. 117
Table 10: Inclusion and exclusion criteria for study participants ............................................. 126
Table 11: Means of radiation factors (kV and mA) in recumbent and weight-bearing QF flexion
and extension sequences combined ......................................................................................... 145
Table 12: Intra- and inter-marker reliability and agreement for IV-RoMmax recumbent and
weight-bearing n=10 .............................................................................................................. 151
Table 13: Intra- and inter-marker reliability and agreement for initial attainment rate weight-
bearing n=10 ........................................................................................................................... 152
Table 14: t-tests comparing the mean normalised sEMG amplitudes (% of sMVC) of left and
right sides n=10 ......................................................................................................................... 161
Table 15: Left and Right normalised amplitudes (% of sMVC) cycles averaged from the baseline
group n=10 .............................................................................................................................. 162
Table 16: Intra- and inter-session reliability and agreement for sEMG normalised amplitudes
during weight-bearing plane QF protocol n=10 ...................................................................... 162
Table 17: Eligibility criteria (duplication of the information in table 10) .................................. 170
Table 18: Angular range (IV-RoMmax) data ............................................................................. 175
Table 19: Initial attainment rate data ....................................................................................... 176
Table 20: Lordosis data ............................................................................................................. 177
Table 21: Correlations between kinematic variables and IV-RoMmax at all inter-vertebral levels
n = 18 (Significant relationships are highlighted in bold) .......................................................... 178
Table 22: Mean normalised sEMG amplitude during entire flexion phase of cycle ................. 201
Table 23: LMU sEMG amplitude changes throughout the flexion cycle ................................... 203
Table 24: LES sEMG amplitude changes throughout the flexion cycle ..................................... 204
Table 25: TES sEMG amplitude changes throughout the flexion cycle ..................................... 205
Table 26: Correlations between mean normalised sEMG (% of sMVC) across the entire flexion
cycle and IV-RoMmax at all inter-vertebral levels (n = 18) ....................................................... 210
Table 27: Correlations* between muscle activity changes (three groups, five epochs) and IV-
RoMmax at all inter-vertebral levels (n = 18) ........................................................................... 211
Table 28: Simple linear regression analysis: significant correlations ........................................ 212
Table 29: sEMG ratio data for LMU/TES, LMU/LES and LES/TES during flexion phase of cycle 213
Table 30: Correlations between muscle activity ratios and IV-RoMmax at all inter-vertebral
levels (n = 18) ............................................................................................................................ 213
Table 31: LMU sEMG amplitude changes throughout the flexion cycle ................................... 312
xxi
Table 32: LES sEMG amplitude changes throughout the flexion cycle ..................................... 313
Table 33: TES sEMG amplitude changes throughout the flexion cycle ..................................... 314
Table 34: Mean sEMG amplitudes over the entire cycle .......................................................... 315
Table 35: Mean sEMG amplitudes during the flexion phase of the cycle ................................ 316
Table 36: Mean sEMG amplitudes during the return phase of the cycle ................................. 317
Table 37: sEMG ratio data for LMU/TES, LMU/LES and LES/TES .............................................. 318
Table 38: IV-RoMmax data ........................................................................................................ 319
Table 39: Initial attainment rate data ....................................................................................... 320
Table 40: Lordotic angle data.................................................................................................... 321
Table 41: Normality test data (Shapiro-Wilk test) .................................................................... 322
Table 42: Raw data for Preliminary Study 1 .............................................................................. 326

xxii
Acknowledgements
I wish to offer my sincere thanks to the following people:
First and foremost, I would like to thank my lead supervisor Professor Alan Breen. Your energy,
enthusiasm and often bewildering knowledge can only be admired. I feel very fortunate to have
been guided through this process by someone with such rare qualities. Your work ethic is second
to none, and you are someone I aspire to.
My sincere thanks also go to Professor Ian Swain and Dr Mihai Dupac. Our regular discussions
and your critique have been invaluable.
I would also like to thank Professors Jacek Cholewicki, Peter Reeves and Lieven Danneels. Your
critique and feedback at the latter stages of this project really helped to highlight some of its key
strengths and limitations. It has been a real privilege to have been allowed so much of your
valuable time.
I thank the Institute for Musculoskeletal Research and Clinical Implementation (IMRCI) team.
Linda Bruce, I thank you for all your administrative support. Alex Breen, I thank you for your
technical assistance (and source of competition). Dr Jonny Branney, I thank you for your general
advice and for being a stimulus in my decision to follow this path. Dr Fiona Mellor, thank you
for your general support and guidance, and also for operating the fluoroscope in my study.
I also wish to recognise the contribution of the study participants. Your willingness to participate
has helped ensure the timely completion of this document, and by doing so, you have each
played a small role in the discovery of new knowledge.
My gratitude must also go to the European Academy of Chiropractic (EAC) European
Chiropractors Union Research Fund, and the Anglo-European College of Chiropractic (AECC)
Treatment-a-Month Club.
I wish to acknowledge the help of my family, particularly my Mother and Mother in Law. Mum
you have provided unwavering support throughout this process, and Lyn without you forgoing
your retirement to look after Imogen, this PhD would not have been possible.
I reserve my greatest thanks for my wife Claire, who has always had to bear the brunt of my
endeavours. You are truly a uniquely special person. The financial backer, the single parent, the
rock on which the foundations of our lives are built. There are no words that can adequately
express how grateful I am, and always will be.

xxiii
Last but by no means least; I want to thank my daughter Imogen. You are a constant source of
inspiration and joy. I can only apologise for my absence over the last 4 years, and hope that the
sacrifices we have all had to make will be somehow worthwhile.
Author’s declaration This study was integrated into another ongoing study (Section 4.2.1). Therefore certain
elements of the data collection process were conducted by others. The collection of data
required the concurrent operation of a fluoroscope (Dr Fiona Mellor), a motion table (Professor
Alan Breen) and the muscle activity recording equipment (Author). The study design, image
analysis, data processing, statistical analysis and manuscript were the responsibility of
theoauthor. It should also be noted that material from this thesis has been published in open
access journals (Appendices Q and R).
1
Chapter 1: Background
1.1 Introduction A recent systematic review estimated the global lifetime prevalence of low back pain (LBP) to
be approximately 39% (Hoy et al. 2012). According to Waddell (2005), around 85-95% of LBP
falls into the non-specific category, meaning the majority of cases have no known cause
(Waddell 2005), but numerous possible ones (Deyo et al. 2014; Kent 2004). In acknowledgement
of the multifactorial nature of the problem, over the last few decades LBP researchers and
clinicians have widely adopted Waddell’s biopsychosocial model (Waddell 1987), which
considers both biological and psychosocial components of the problem. Perhaps due to a
perceived lack of progress in linking NSLBP to biological causes, recent years have seen an
apparent emphasis placed on the latter, raising concerns that the potential importance of
biological elements may be being neglected (Hancock et al. 2011). The biological component is
itself multifactorial, and has been proposed to comprise of mechanical, chemical and central
sensitisation constituents (Breen 2013). A challenge therefore is how to define, disaggregate
and objectively differentiate those biological factors that generate and sustain non-specific LBP
(NSLBP) in order to use them to facilitate clinical decision making in the care of patients. For
physical therapists such as physiotherapists, osteopaths and chiropractors, there is an aspiration
to determine mechanical causes of LBP, and this is reflected in their research efforts (O'sullivan
2005; Sahrmann 2002; Van Dillen et al. 2003).
1.2 A requirement for enhanced functional assessment? Even with a focus on mechanical causes, due to the large number of biomechanical factors that
are co-ordinated to perform a given task, identifying the main parameters that discriminate
mechanical LBP patients from healthy controls is challenging (Todorov and Jordan 2002), a task
further complicated by the inherent heterogeneity in NSLBP populations, and methods of data
collection (Leboeuf-Yde and Manniche 2001). This is perhaps a reason why many contradictions
can be found in the literature, with mechanical factors such as spinal range of motion (ROM)
(Brownhill 2010; Dankaerts 2009; Iguchi 2004; Kanemura 2009; McGregor et al. 1995, 1997;
Taghipour-Darzi et al. 2012; Teyhen 2007; Triano 1987), muscle activity (Ahern et al. 1988;
Alexiev 1994; Arena et al. 1991; Cassisi et al. 1993; Cram and Engstrom 1986; Dankaerts 2006,
2009; Kravitz et al. 1981; Lariviere et al. 2000; Sanchez-Zuriaga et al. 2015) muscle activity ratios
(Reeves et al. 2006; Van Dieen 2003) and lordosis (Been and Kalichman 2014; Sarikaya et al.
2
2007; Tuzun et al. 1999) all being shown to exhibit either no association or contradictory
relationships with LBP. The majority of these studies take a reductionist approach, in which
emphasis is placed on specific components of the spinal system. This type of approach often
fails to demonstrate how changes in specific factors affect the behaviour of the system as a
whole, leading Reeves and Cholewicki (2010) to suggest that there is a “need to move away from
documenting “differences” (between LBP groups and healthy controls) to “understanding” the
effect these differences have on the spine” (Reeves and Cholewicki 2010). There is a perceived
requirement therefore for further understanding of the integration of different components
within the spinal control system. For example, Sanchez-Zuriaga et al. (2015) suggest that there
are only subtle differences between mechanical NSLBP groups and healthy controls in terms of
paraspinal muscle activity and regional lumbar movement (Sanchez-Zuriaga et al. 2015). This
could mean that either muscle activation strategies have no effect on the motion, or that the
motion differences are at individual inter-vertebral levels and remain undetected. If there is an
increase in paraspinal muscle activity in recurrent LBP patient groups during a movement such
as sagittal flexion, but no difference in global range of motion (RoM), then the proportional
share of RoM may have shifted between levels, with the observed motor control strategy
primarily influencing particular motion segments.
The primary role of the paraspinal muscles during flexion is to resist forces applied to the inter-
vertebral linkage, with local and global groups activating synergistically to provide control
(Bergmark 1989; Bogduk 2012). If restraint mechanisms are such that motion is restricted at a
specific inter-vertebral level, it is likely that the reduced movement will be compensated for
elsewhere, be this at other lumbar levels (Lee and Langrana 1984), or in the thoracic spine or
hips and pelvis (McGregor 2002; Mehta et al. 2012; Rothenfluh et al. 2015). It would be
beneficial therefore, when attempting to understand the relationships between functional
impairments and LBP that multiple inter-vertebral levels are assessed both in terms of
kinematics and associated muscle activity. This has generally not been possible for LBP
clinicians, however aspirations to attribute mechanical NSLBP to symptomatic spinal segments
remain (Kulig et al. 2007), leading to the development of systems that classify LBP groups in
terms of motor control impairments (Dankaerts 2007; O'sullivan 2005). These approaches
subgroup LBP patients based on criteria associated with the primary direction of pain
provocation (e.g. pain reproduced during flexion or extension activities), without knowledge of
its nociceptive source, a strategy that perhaps suffers from ambiguity of cause and effect. There
3
is therefore a compelling argument for wanting to know more about the factors that influence
restraint at a segmental level.
If mechanical problems are thought to be a major contributing factor to LBP, then better in vivo
objective measures are needed, to help target specific anatomy and biomechanics in
management. To make progress in this area, studies should advance understanding of segment
specific biomechanics. To do this, they will need to record multi-segmental biomechanical
information.
1.3 Investigating spinal control Optimal control of the lumbar spine during voluntary trunk bending requires the co-ordination
of a number of muscles (Reeves 2007), and the co-ordinated participation of multiple vertebral
motion segments, whose contributions are a function of their own mechanical properties
(Sahrmann 2002). This dynamic control is believed to be modulated by interactions between
three sub-systems, the passive (vertebrae, discs, and ligaments), the active (muscles and
tendons), and the control (central nervous system and nerves) systems (Panjabi 1992a, 1992b).
It is theorised that a dysfunction in any subsystem may lead to a response from another to
compensate. Therefore the ability to study the contemporaneous performance of these
subsystems would be of value. Investigating the interplay between sub-systems however is
difficult, as the living spine is a complex structure; and a hidden kinematic chain. Several
different technologies are therefore typically applied, each with its own limitations.
In order to directly investigate the passive and active sub-systems of the spine, there have been
many efforts to concurrently measure spinal kinematics and muscle activity (Burnett 2004; Claus
et al. 2009; Hashemirad et al. 2009; Kaigle 1998; Kim et al. 2013; Peach et al. 1998; Sanchez-
Zuriaga et al. 2015). The majority of these studies have used surface electromyography
combined with skin surface kinematic measurement techniques such as 3-Space Fastrak,
Polhemus inc. (Burnett et al. 2004; Dankaerts et al. 2009), Isotrak, Polhemus inc. (McGill et al.
1997; Peach et al. 1998), or cameras (Sanchez-Zuriaga et al. 2015; Kim et al. 2013; Hashemirad
et al. 2009). Whilst skin surface markers can be used to measure inter-vertebral motion, such
measurements do not typically have good reliability due to skin movement artifacts (Cerveri et
al. 2005; Zhang 2003), and are therefore generally limited to the investigation of gross spinal
motion. To include segmental data therefore usually requires more invasive techniques such as
x-rays (Ogston 1986a; Pearcy 1984b) or fluoroscopy (Ahmadi et al. 2009; Breen A.C. et al. 2012;
Du Rose and Breen 2016a; Du Rose and Breen 2016b; Mellor 2014; Teyhen et al. 2007; Wong
4
2006), or the surgical insertion of intra-osseous pins (Kaigle et al. 1998). In this way Kaigle et al.
(1998) investigated the reduction in lumbar muscular activity at the point of full flexion (Flexion
Relaxation Phenomenon (FRP)) along with spine kinematics at an inter-vertebral level (Kaigle et
al. 1998). However, only single motion segments were considered, and the angular ranges at
different inter-vertebral levels were pooled. Electromyography (EMG) was also only recorded
from one level (e.g., lumbar longissimus thoracis). Therefore, although inter-segmental
kinematic data were recorded, no discriminative insight was obtained regarding multi-level
interactions.
Advances in automated image motion analysis, radiation dose reduction, and digital imaging
however, now enable the use of fluoroscopy to measure multi-level spine motion (Breen A.C. et
al. 2012), which has been demonstrated to be an accurate and reliable 2D method (Mellor et al.
2014, Teyhen et al. 2007, Yeager et al. 2014). Whilst recent technological advances do enable
the acquisition of 3D kinematic data (Aiyangar et al. 2014), it has been shown that there is only
minimal axial rotation and lateral bending associated with movements in the sagittal plane
(Ellingson and Nuckey 2015; Harvey et al. 2015; Harvey 1998; Pearcy 1985), and therefore no
significant advantage would be gained by using technologies capable of 3D measurements,
when recording movements in this plane.
1.4 Contemporaneous monitoring of inter-vertebral passive and active
control systems In order to investigate interactions between and amongst the relevant muscle, joint and osseous
components, suitable variables must be identified, and a method for integrating them
developed. While motor control responses to perturbation around the neutral position
(Cholewicki and Van Vliet Iv 2002; Hodges et al. 2009; Macdonald 2009; Macdonald et al. 2010;
Radebold et al. 2000), and the flexion relaxation phenomenon (FRP) at the limits of sagittal
flexion have been widely investigated (Kaigle 1998; Kippers and Parker 1984; Luhring et al. 2015;
McGorry and Lin 2012; Watson 1997), no studies have addressed these interactions throughout
the entire cycle of a functional task. During a voluntary movement such as forward bending
there is a continual requirement to maintain spinal integrity, and so the measurement of
variables that reflect control at points between the end-ranges of movement (mid-range
variables) are of value (D’hooge et al. 2013). The measurement of contemporaneous multi-level
kinematic and electromyographic information throughout the motion requires synchronised
recordings from two different systems. Multi-level surface electromyography fulfils these
5
requirements for motor control (D'hooge et al. 2013; Wolf et al. 1979) and quantitative
fluoroscopy measures a range of continuous inter-vertebral motion variables (Breen A.C. et al.
2012; Breen et al. 2015; Du Rose and Breen 2016b; Mellor et al. 2014). Contemporaneous
recording of these measures therefore allows an integrated assessment of the interactions
between the passive and active systems of the spine.
In order to control complexity and to limit possible confounders, the study was restricted to
weight-bearing flexion in the sagittal plane, in a population of young adult males using a protocol
that restrained the pelvis to avoid the effects of hip flexion. The heterogeneity of IV-RoM in
healthy populations (Deitz 2011), lends it to the exploration of relationships with other variables,
and it also represents the function of each motion segment in terms of restraint. The amplitude
of rotation for a specific motion segment is dictated by the moments exerted on the vertebrae,
and the nature of its restraining structures. These moments are produced by the position and
weight of the torso and head during movement, and to a smaller degree by the action of the
agonist muscles (Bogduk 1995). In the lumbar spine (when adopting a protocol that restrains
the pelvis), resistance to these moments is primarily provided by the activity of the antagonist
muscles (paraspinals), the lumbar disc and capsular ligaments, and to a lesser extent the
longitudinally orientated spinal ligaments (Adams et al. 1980). Changes in IV-RoMmax will
therefore relate to changes in the factors that restrain rotation. These will include the activation
strategies of the antagonist muscles, the capacity of inter-segmental passive elements to resist
rotation and the shape of the spine itself, mechanisms that are further complicated by the
interactions between these factors across multiple levels of the spine. This thesis investigated
these interactions and relationships in healthy controls, thus demonstrating how such
mechanical parameters can affect inter-vertebral angular rotation in the absence of pain.
1.5 Thesis overview The following literature review (Chapter 2) explores in more detail the problem of NSLBP, and
builds a case for the development of a protocol that is capable of measuring concurrent inter-
vertebral kinematic and muscle activity information. It reviews the various technological options
currently available, and the methodological considerations associated with their use. The review
also considers how various mechanical parameters may be expected to influence IV-RoMmax,
providing an indication of the relationships that may be expected to be found, and supporting
the development of the study’s hypotheses. As a foundation to this, concepts relating to spinal

6
control and stability, and the anatomy and function of the active, passive and neural control
elements of the lumbar spine (in relation to sagittal bending) are reviewed.
Chapter three consists of three preliminary studies. The first considers the most appropriate
plane of motion for the main study (i.e. sagittal or coronal), the second is an initial investigation
into relationships between lordosis and IV-RoMmax, and the third examines how the sEMG
signal may be influenced by sEMG electrode placement accuracy. The methodology chapter
(Chapter 4) outlines the QF and EMG parameters selected for use in the study, and describes
the study protocol.
Chapter five determines the reliability and agreement of the study’s primary parameter
measurements. The chapter is divided into two parts. The first details an investigation into the
agreement and reliability of the QF measurements that are utilised in the main study (i.e. IV-
RoMmax and initial attainment rate), and the second determines the agreement and reliability
of the selected sEMG parameter (i.e. normalised RMS sEMG amplitude).
The main investigations of the thesis are outlined in two separate chapters. The first investigates
the relationships between kinematic parameters, lordosis and IV-RoMmax during forward
bending (Chapter 6) and the second introduces sEMG, to investigate the relationships between
paraspinal muscle activity and IV-RoMmax during the same movement (Chapter 7). Chapter
eight outlines the contributions to new knowledge that have been made, and the discussion
chapter that follows (Chapter 9) provides an overview and expansion of the work in light of the
broader field of spinal biomechanics. This chapter also explores the possible clinical significance
of the study’s findings, its limitations and some additional data analysis.
The final chapter offers an overall conclusion of the study’s findings in relation to its aims and
objectives, and considers some possibilities for future work (Chapter 10).

7
Chapter 2: Literature review
Introduction The in vivo investigation of relationships between and amongst the passive and active
controlling elements of the lumbar spine at an inter-vertebral level, has been limited due to the
technical difficulties associated with doing so. This literature review follows on from the
introduction to re-iterate why such investigations are desirable, considers the methodological
options available, and outlines the study’s hypotheses, aims, research question and objectives.
The review is divided into seven main sections.
Section 1: Anatomy and function of the lumbar spine
This section provides a comprehensive overview of the active and passive elements of the
lumbar spine and relevant surrounding structures. The review focusses on the role of such
elements in terms of sagittal forward flexion of the spine1.
Section 2: Addressing the problem of NSLBP
This section reviews the problem of chronic non-specific low back pain (CNSLBP) and the
perceived current lack of research into possible biomechanical causes. It is well documented
that the heterogeneity that exists in CNSLBP populations makes linking biomechanical
parameters to the condition very difficult. In those studies that do claim to be able to
differentiate between LBP and healthy control groups using biomechanical parameters,
contradictory findings are usually found elsewhere in the literature. This section therefore
reviews these studies, and explores why further investigations into the relationships between
the active, passive and neural control subsystems in healthy controls would be of value.
Section 3: Spinal stability and control mechanisms
This section reviews the concept of spinal stability, and describes the active, passive and neural
control elements that combine to stabilise the lumbar spine, with a focus on the structures and
control required to perform forward bending in the sagittal plane.
Section 4: Sagittal lumbar curvature and interactions within the passive system
This section reviews previous research, and explores the current ideas relating to spinal system
interactions. The review provides an indication as to what relationships may be found when
concurrently investigating kinematic and muscle activity variables at an inter-vertebral level, and
1 Note: This study focusses on inter-vertebral movement in the sagittal plane. The reasons why this was chosen over other planes (e.g. coronal) are discussed in detail in a preliminary study (Chapter 3, section 3.1).
8
leads to the development of the study hypotheses outlined in section seven. The reasons why
this study focusses on the kinematic and not kinetic strains of biomechanics are also outlined.
Section 5: Measuring lumbar spine kinematics and muscle activity
This section reviews spinal kinematic measurement techniques, provides an overview of
electromyography, and reviews the methodological design considerations associated with their
use.
Section 6: Dynamic task standardisation
This section addresses the pros and cons of methodological standardisation.
Section 7: Summary and conclusions
Finally, a summary of the literature review is provided including a focussed systematic review of
the literature. The study’s hypotheses, aims, research question and objectives are also outlined.
Method of literature review Biomedical databases were searched in order to find literature in the areas of lumbar spine
biomechanics, kinematic measurement, electromyography, spinal stability, and CNSLBP
diagnosis and management.
The data bases used included PubMed, Ovid, Science direct, Elsevier, CINAHL, COCHRANE,
Google Scholar and a private database held at the Institute for Musculoskeletal Research and
Clinical Implementation (IMRCI). Examples of specific key word searches included “lumbar AND
“kinematics” OR “biomechanics”, “lumbar” AND “electromyography” OR “muscle”, and
“lumbar” AND “kinematics” and “reliability”.
The searches produced hundreds of articles which were subsequently reviewed for their
relevance, and reference lists were checked to make sure no additional pertinent papers were
missed. In an attempt to keep up to date with the most current literature, citation alerts were
added using the aforementioned keywords, and further papers were found using the “related
citations” option for articles relating to the most relevant research.

9
Section 1
2.1 Anatomy and function of the lumbar spine The various components of the lumbar spine can be divided into passive (vertebrae, discs and
ligaments) active (muscles and tendons) and neural control elements, and all have a role in
stabilising the lumbar spine during movement. Passive structures include the spinal ligaments,
the capsules of facet joints, and the inter-vertebral discs, whilst the active tissues comprise of
numerous muscles of the trunk, pelvis and hips. The motor control these muscles provide is
regulated by inputs from various sources such as spinal stretch reflexes, cortical input and
central control (i.e. adjustments based on vestibular and visual feedback). The following section
provides an overview of the basic anatomy of these components of the spine, and introduces
some of their functions in terms of spinal movement.
2.1.1 Passive elements
The passive elements are the spinal column’s primary stabilising and load bearing structures
(Chamoli et al. 2015). A functional spinal unit (FSU) or motion segment, is according to White
and Panjabi (1990) “the smallest physiological motion unit of the spine to exhibit biomechanical
characteristics similar to those of the entire spine” (White 1990), and consists of two adjacent
vertebrae, the inter-vertebral disc between them, and the adjoining ligaments. The osseous
structures of a FSU in the lumbar spine are shown in Figures 1A and 1B, and the key ligamentous
structures in Figure 2.
Figure 1A and 1B: Lateral and posterior views of a lumbar motion segment. Images taken from www.anatomy.tv (04/03/2016)
2.1.1.1 Facet joints (Zygapophysial joints)
The lumbar facet joints (Figure 1B) are created by the articulations between the superior and
inferior articular processes of adjacent vertebrae. The orientation of the joints determines the
extent to which they can resist the anterior displacement and angular rotation associated with
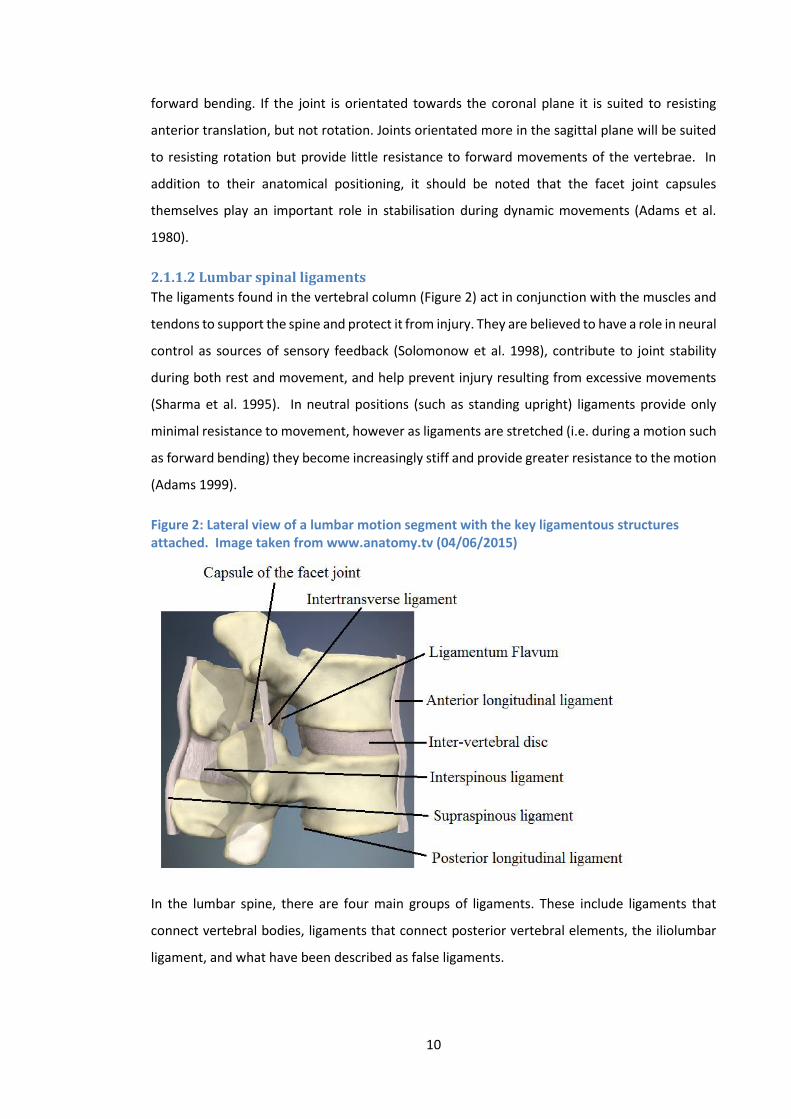
10
forward bending. If the joint is orientated towards the coronal plane it is suited to resisting
anterior translation, but not rotation. Joints orientated more in the sagittal plane will be suited
to resisting rotation but provide little resistance to forward movements of the vertebrae. In
addition to their anatomical positioning, it should be noted that the facet joint capsules
themselves play an important role in stabilisation during dynamic movements (Adams et al.
1980).
2.1.1.2 Lumbar spinal ligaments
The ligaments found in the vertebral column (Figure 2) act in conjunction with the muscles and
tendons to support the spine and protect it from injury. They are believed to have a role in neural
control as sources of sensory feedback (Solomonow et al. 1998), contribute to joint stability
during both rest and movement, and help prevent injury resulting from excessive movements
(Sharma et al. 1995). In neutral positions (such as standing upright) ligaments provide only
minimal resistance to movement, however as ligaments are stretched (i.e. during a motion such
as forward bending) they become increasingly stiff and provide greater resistance to the motion
(Adams 1999).
Figure 2: Lateral view of a lumbar motion segment with the key ligamentous structures attached. Image taken from www.anatomy.tv (04/06/2015)
In the lumbar spine, there are four main groups of ligaments. These include ligaments that
connect vertebral bodies, ligaments that connect posterior vertebral elements, the iliolumbar
ligament, and what have been described as false ligaments.
11
The anterior and posterior longitudinal ligaments are long bands that are found at the anterior
and posterior aspects of each vertebral body and intervertebral disc respectively. Their actions
are therefore closely associated with the relevant section of the annulus fibrosus. The anterior
longitudinal ligament primarily resists distraction of the anterior part of vertebral column, and
therefore acts to resist inter-vertebral extension. Acting on the opposite side, the main role of
the posterior longitudinal ligament is to resist intervertebral flexion. Both ligaments attach
caudally to the sacrum.
The ligaments of the posterior elements include the ligamentum flavum, the interspinous and
supraspinous ligaments, and in a functional sense the ligaments of the facet capsule.
Ligamentum flavum connects two adjacent vertebrae via attachments to the laminae of each
bilaterally. It is unique in that it is chiefly composed of elastin, a trait believed to assist in its role
in resisting separation of the laminae, but also as a mechanism to prevent buckling during
approximation (Bogduk 2012). The interspinous ligaments attach between adjacent spinous
processes, however they are not believed to contribute significantly to the resistance of forward
bending moments, as alignment of their predominantly collagen fibres has been shown to run
almost parallel to the spinous processes and not between them (Hukins et al. 1990). The
supraspinous ligament attaches between the posterior edges of adjacent spinous processes, and
whilst becoming thicker in the lumbar spine rarely reaches as far L4-L5 (Heylings 1978).
The Iliolumbar ligaments attach to the transverse processes of L5 to the ilium bilaterally. Its
primary role is to resist the forward translation of L5 on the sacrum, however it can also resist
axial, sagittal and coronal rotation of the vertebra (Leong et al. 1987; Yamamoto et al. 1990).
Finally, the so called ‘false ligaments’ are the intertransverse ligaments, the transforaminal
ligaments and the mamillo-accessory ligament. The false ligaments have less biomechanical
significance than those mentioned previously, and so will not be discussed in any detail.
2.1.1.3 The inter-vertebral disc
The inter-vertebral disc is found between two adjacent vertebrae (Figure 2) and consists of a
central nucleus pulposus and a peripheral annulus fibrosus (Figure 3). The nucleus pulposus is a
semi-fluid like substance, and as such can be readily deformed under pressure (Bogduk 2012).
The annulus fibrosus on the other hand consists of fibrous rings of collagen fibres forming a
tough exterior that encircles the softer inner core, and acts much like an additional spinal
ligament.
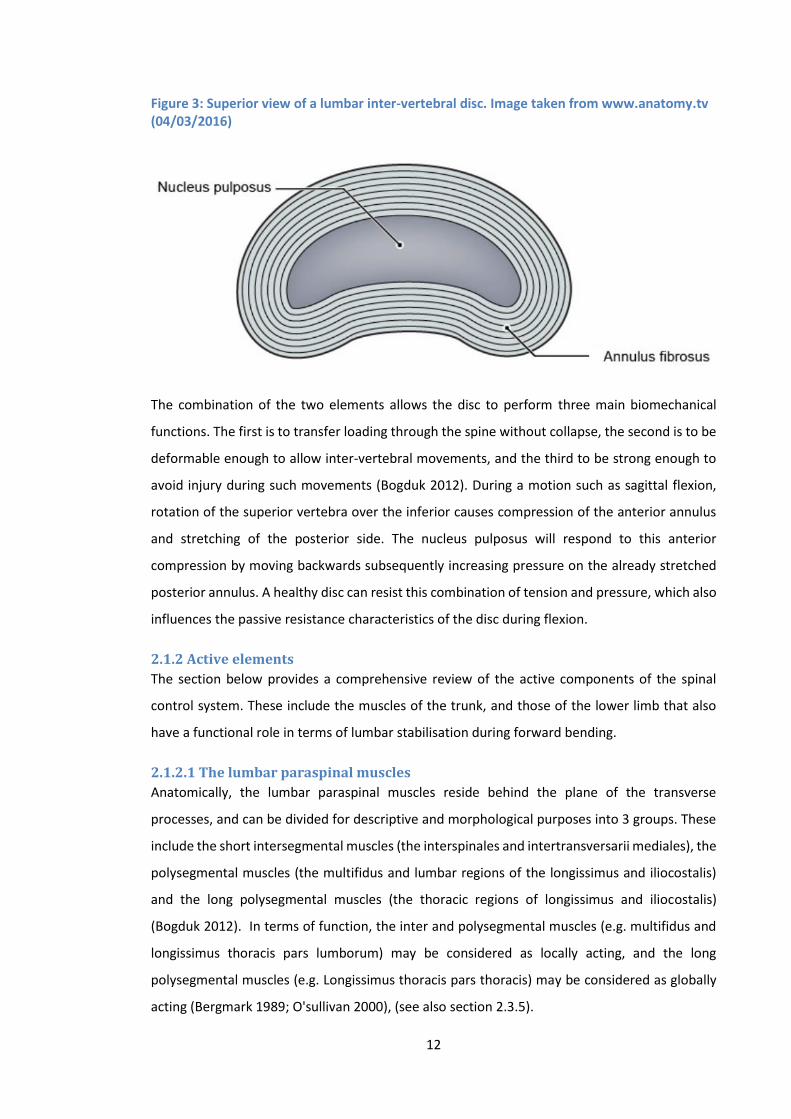
12
Figure 3: Superior view of a lumbar inter-vertebral disc. Image taken from www.anatomy.tv (04/03/2016)
The combination of the two elements allows the disc to perform three main biomechanical
functions. The first is to transfer loading through the spine without collapse, the second is to be
deformable enough to allow inter-vertebral movements, and the third to be strong enough to
avoid injury during such movements (Bogduk 2012). During a motion such as sagittal flexion,
rotation of the superior vertebra over the inferior causes compression of the anterior annulus
and stretching of the posterior side. The nucleus pulposus will respond to this anterior
compression by moving backwards subsequently increasing pressure on the already stretched
posterior annulus. A healthy disc can resist this combination of tension and pressure, which also
influences the passive resistance characteristics of the disc during flexion.
2.1.2 Active elements
The section below provides a comprehensive review of the active components of the spinal
control system. These include the muscles of the trunk, and those of the lower limb that also
have a functional role in terms of lumbar stabilisation during forward bending.
2.1.2.1 The lumbar paraspinal muscles
Anatomically, the lumbar paraspinal muscles reside behind the plane of the transverse
processes, and can be divided for descriptive and morphological purposes into 3 groups. These
include the short intersegmental muscles (the interspinales and intertransversarii mediales), the
polysegmental muscles (the multifidus and lumbar regions of the longissimus and iliocostalis)
and the long polysegmental muscles (the thoracic regions of longissimus and iliocostalis)
(Bogduk 2012). In terms of function, the inter and polysegmental muscles (e.g. multifidus and
longissimus thoracis pars lumborum) may be considered as locally acting, and the long
polysegmental muscles (e.g. Longissimus thoracis pars thoracis) may be considered as globally
acting (Bergmark 1989; O'sullivan 2000), (see also section 2.3.5).
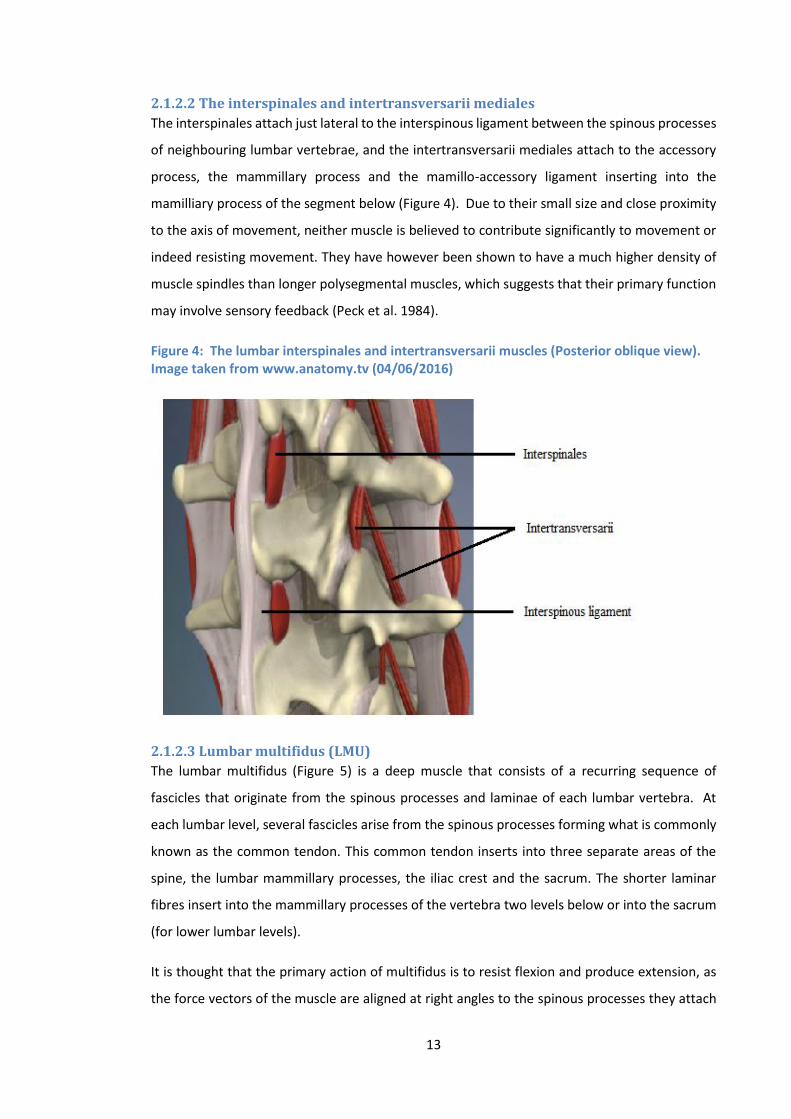
13
2.1.2.2 The interspinales and intertransversarii mediales
The interspinales attach just lateral to the interspinous ligament between the spinous processes
of neighbouring lumbar vertebrae, and the intertransversarii mediales attach to the accessory
process, the mammillary process and the mamillo-accessory ligament inserting into the
mamilliary process of the segment below (Figure 4). Due to their small size and close proximity
to the axis of movement, neither muscle is believed to contribute significantly to movement or
indeed resisting movement. They have however been shown to have a much higher density of
muscle spindles than longer polysegmental muscles, which suggests that their primary function
may involve sensory feedback (Peck et al. 1984).
Figure 4: The lumbar interspinales and intertransversarii muscles (Posterior oblique view). Image taken from www.anatomy.tv (04/06/2016)
2.1.2.3 Lumbar multifidus (LMU)
The lumbar multifidus (Figure 5) is a deep muscle that consists of a recurring sequence of
fascicles that originate from the spinous processes and laminae of each lumbar vertebra. At
each lumbar level, several fascicles arise from the spinous processes forming what is commonly
known as the common tendon. This common tendon inserts into three separate areas of the
spine, the lumbar mammillary processes, the iliac crest and the sacrum. The shorter laminar
fibres insert into the mammillary processes of the vertebra two levels below or into the sacrum
(for lower lumbar levels).
It is thought that the primary action of multifidus is to resist flexion and produce extension, as
the force vectors of the muscle are aligned at right angles to the spinous processes they attach
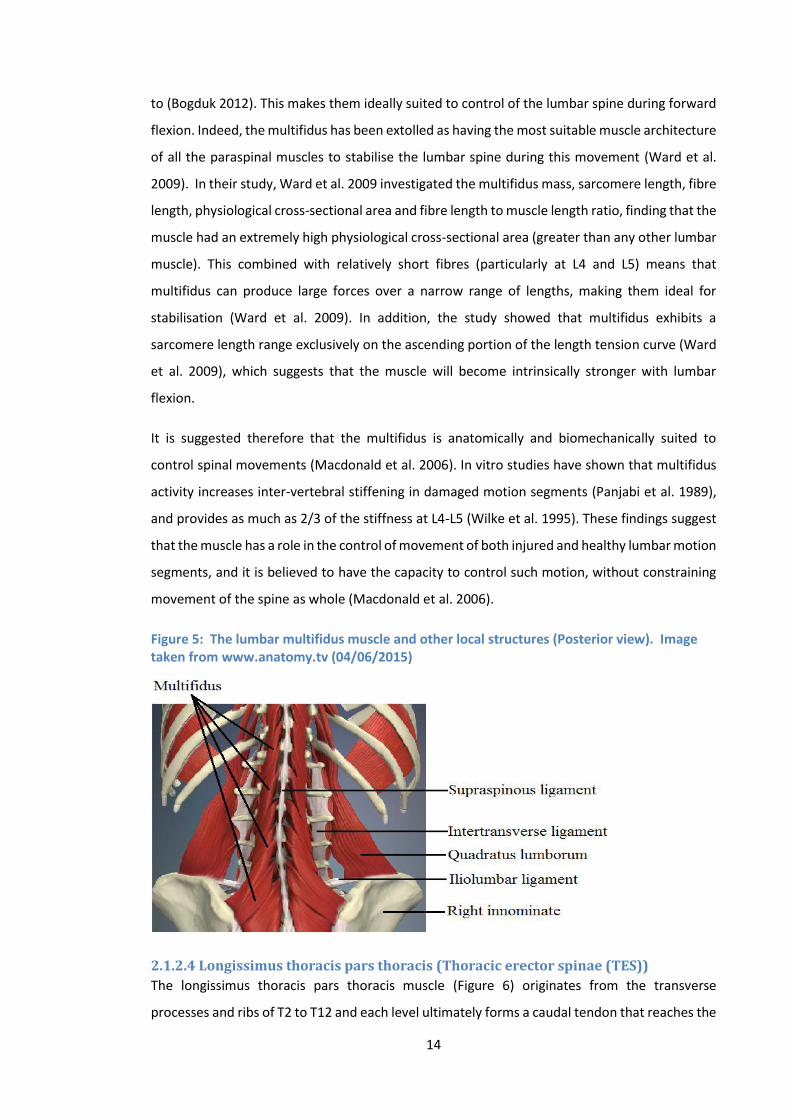
14
to (Bogduk 2012). This makes them ideally suited to control of the lumbar spine during forward
flexion. Indeed, the multifidus has been extolled as having the most suitable muscle architecture
of all the paraspinal muscles to stabilise the lumbar spine during this movement (Ward et al.
2009). In their study, Ward et al. 2009 investigated the multifidus mass, sarcomere length, fibre
length, physiological cross-sectional area and fibre length to muscle length ratio, finding that the
muscle had an extremely high physiological cross-sectional area (greater than any other lumbar
muscle). This combined with relatively short fibres (particularly at L4 and L5) means that
multifidus can produce large forces over a narrow range of lengths, making them ideal for
stabilisation (Ward et al. 2009). In addition, the study showed that multifidus exhibits a
sarcomere length range exclusively on the ascending portion of the length tension curve (Ward
et al. 2009), which suggests that the muscle will become intrinsically stronger with lumbar
flexion.
It is suggested therefore that the multifidus is anatomically and biomechanically suited to
control spinal movements (Macdonald et al. 2006). In vitro studies have shown that multifidus
activity increases inter-vertebral stiffening in damaged motion segments (Panjabi et al. 1989),
and provides as much as 2/3 of the stiffness at L4-L5 (Wilke et al. 1995). These findings suggest
that the muscle has a role in the control of movement of both injured and healthy lumbar motion
segments, and it is believed to have the capacity to control such motion, without constraining
movement of the spine as whole (Macdonald et al. 2006).
Figure 5: The lumbar multifidus muscle and other local structures (Posterior view). Image taken from www.anatomy.tv (04/06/2015)
2.1.2.4 Longissimus thoracis pars thoracis (Thoracic erector spinae (TES))
The longissimus thoracis pars thoracis muscle (Figure 6) originates from the transverse
processes and ribs of T2 to T12 and each level ultimately forms a caudal tendon that reaches the
15
lumbar region. The fascicle arising from the ribs and transverse processes of T2 insert at the L3
spinous process, T3 to L4 and T5 to L5 and so on. The fascicles arising from T8 to T12 however,
attach to the sacrum between the spinous process of S3 and the posterior superior iliac spine.
The caudal tendons of this muscle form the erector spinae aponeurosis. These fibres overlay
those of the lumbar longissimus, but do not have any attachment to them.
The fascicles originating between T6 and T12 traverse the whole lumbar region, and therefore
through the erector spinae aponeurosis are able to influence the biomechanics of the area. The
literature suggests that as this muscle spans from the ribs to the sacrum, it may be considered
as “globally acting” (see section 2.3.5). The thoracic fascicles of the longissimus muscle group
have been shown to contribute significantly to the extensor moment exerted on the lumbar
spine (Bogduk et al. 1992), and as such they are regularly included in investigations of lumbar
spinal control (Cholewicki and VanVliet 2002; Nelson Wong et al. 2010; Peach et al. 1998,
Radebold et al. 2000; Van Dieen 2003).
2.1.2.5 Longissimus thoracis pars lumborum (Lumbar erector spinae (LES))
The longissimus thoracis pars lumborum muscle is composed of five fascicles, which originate
from the accessory and transverse processes of the lumbar vertebrae. In the case of the lowest
fascicle (L5), the fibres insert directly into the posterior iliac spine, however the remaining
lumbar fascicles form tendons which converge to form the lumbar intermuscular aponeurosis.
This aponeurosis attaches to the ilium lateral to the insertion of the L5 fibres. The role of this
muscle is believed to differ between lumbar segmental levels due to the changes in the
dominant force vectors generated by the fascicle orientations at each level. The upper lumbar
spine fascicles are better suited to extending the lumbar spine, whereas the lower fascicles are
more capable of resisting forward translation (Bogduk 2012).
This, combined with the fact that upper lumbar fascicles are more superficial (The more cephalic
the lumbar level, the more superficial the muscle (Bogduk 2012)), is of potential importance
when considering EMG recording techniques (see also section 2.5.6.1), as surface electrodes will
predominantly pick up activity from the most superficial underlying muscles.
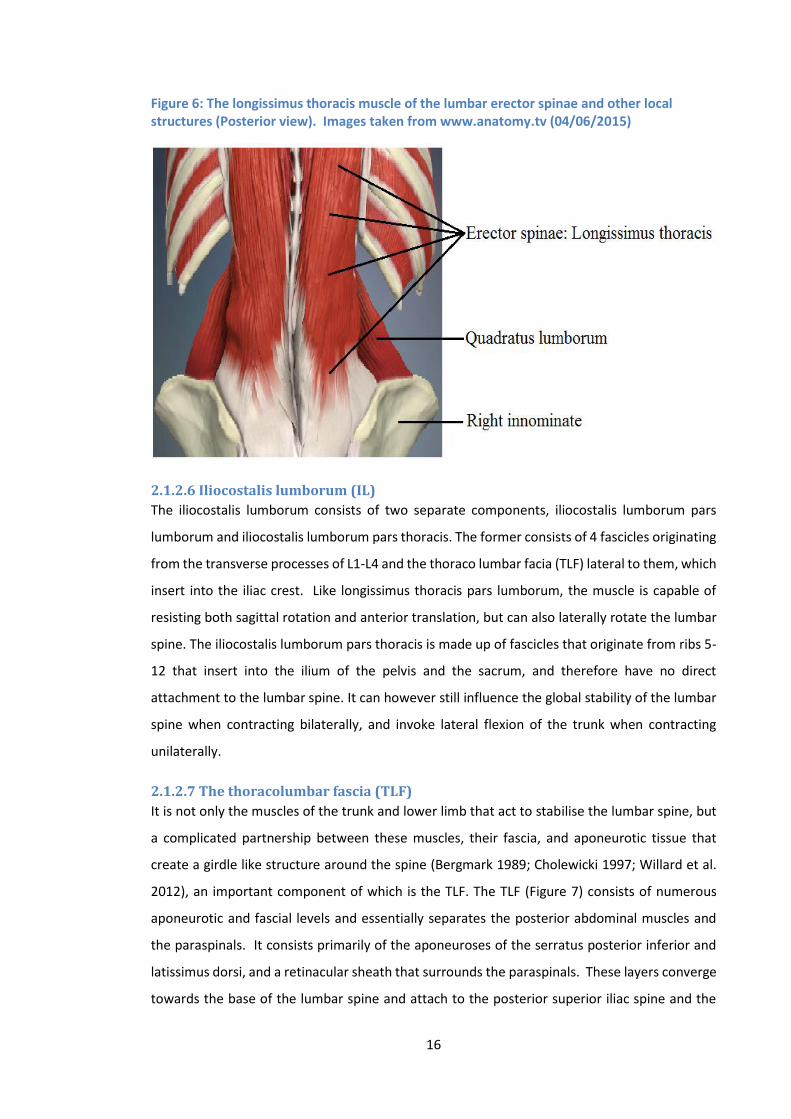
16
Figure 6: The longissimus thoracis muscle of the lumbar erector spinae and other local structures (Posterior view). Images taken from www.anatomy.tv (04/06/2015)
2.1.2.6 Iliocostalis lumborum (IL)
The iliocostalis lumborum consists of two separate components, iliocostalis lumborum pars
lumborum and iliocostalis lumborum pars thoracis. The former consists of 4 fascicles originating
from the transverse processes of L1-L4 and the thoraco lumbar facia (TLF) lateral to them, which
insert into the iliac crest. Like longissimus thoracis pars lumborum, the muscle is capable of
resisting both sagittal rotation and anterior translation, but can also laterally rotate the lumbar
spine. The iliocostalis lumborum pars thoracis is made up of fascicles that originate from ribs 5-
12 that insert into the ilium of the pelvis and the sacrum, and therefore have no direct
attachment to the lumbar spine. It can however still influence the global stability of the lumbar
spine when contracting bilaterally, and invoke lateral flexion of the trunk when contracting
unilaterally.
2.1.2.7 The thoracolumbar fascia (TLF)
It is not only the muscles of the trunk and lower limb that act to stabilise the lumbar spine, but
a complicated partnership between these muscles, their fascia, and aponeurotic tissue that
create a girdle like structure around the spine (Bergmark 1989; Cholewicki 1997; Willard et al.
2012), an important component of which is the TLF. The TLF (Figure 7) consists of numerous
aponeurotic and fascial levels and essentially separates the posterior abdominal muscles and
the paraspinals. It consists primarily of the aponeuroses of the serratus posterior inferior and
latissimus dorsi, and a retinacular sheath that surrounds the paraspinals. These layers converge
towards the base of the lumbar spine and attach to the posterior superior iliac spine and the
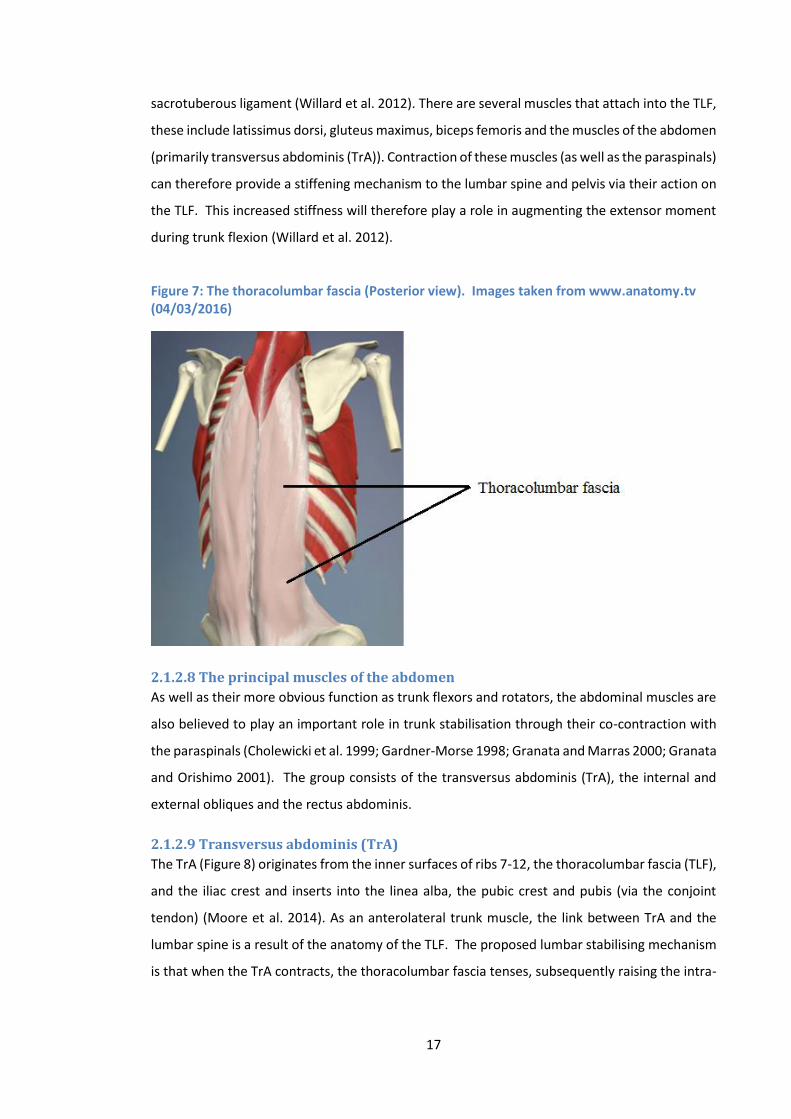
17
sacrotuberous ligament (Willard et al. 2012). There are several muscles that attach into the TLF,
these include latissimus dorsi, gluteus maximus, biceps femoris and the muscles of the abdomen
(primarily transversus abdominis (TrA)). Contraction of these muscles (as well as the paraspinals)
can therefore provide a stiffening mechanism to the lumbar spine and pelvis via their action on
the TLF. This increased stiffness will therefore play a role in augmenting the extensor moment
during trunk flexion (Willard et al. 2012).
Figure 7: The thoracolumbar fascia (Posterior view). Images taken from www.anatomy.tv (04/03/2016)
2.1.2.8 The principal muscles of the abdomen
As well as their more obvious function as trunk flexors and rotators, the abdominal muscles are
also believed to play an important role in trunk stabilisation through their co-contraction with
the paraspinals (Cholewicki et al. 1999; Gardner-Morse 1998; Granata and Marras 2000; Granata
and Orishimo 2001). The group consists of the transversus abdominis (TrA), the internal and
external obliques and the rectus abdominis.
2.1.2.9 Transversus abdominis (TrA)
The TrA (Figure 8) originates from the inner surfaces of ribs 7-12, the thoracolumbar fascia (TLF),
and the iliac crest and inserts into the linea alba, the pubic crest and pubis (via the conjoint
tendon) (Moore et al. 2014). As an anterolateral trunk muscle, the link between TrA and the
lumbar spine is a result of the anatomy of the TLF. The proposed lumbar stabilising mechanism
is that when the TrA contracts, the thoracolumbar fascia tenses, subsequently raising the intra-
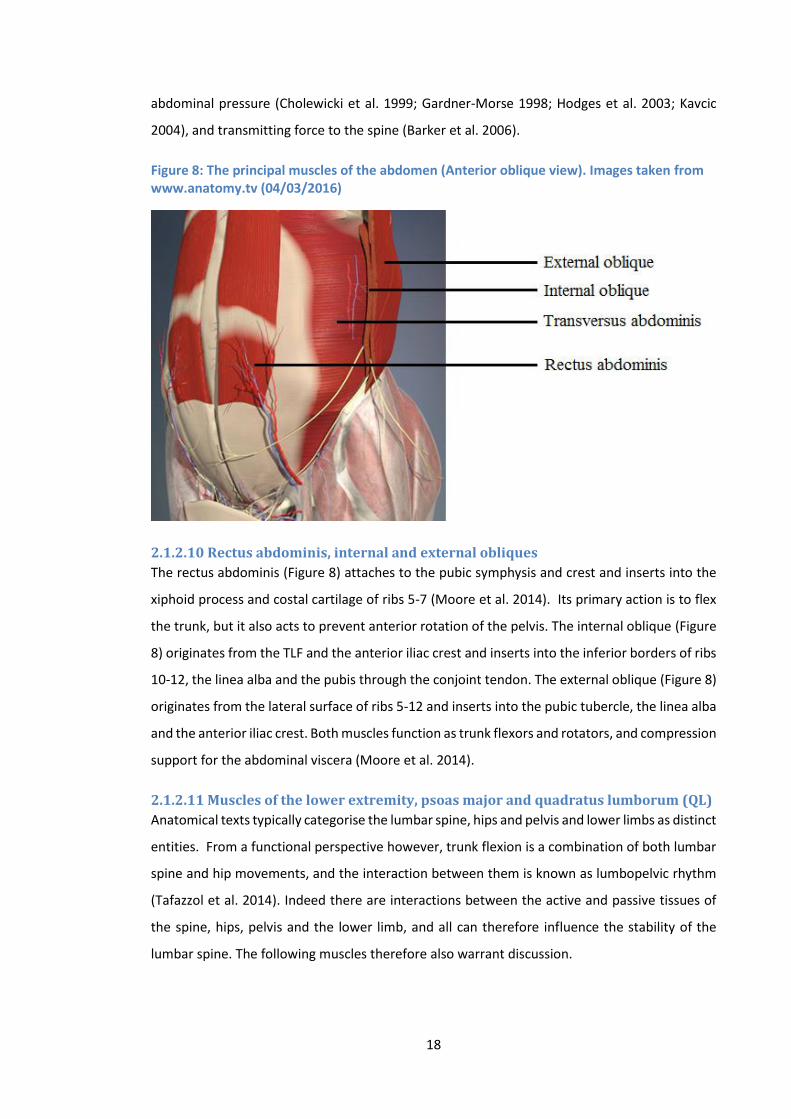
18
abdominal pressure (Cholewicki et al. 1999; Gardner-Morse 1998; Hodges et al. 2003; Kavcic
2004), and transmitting force to the spine (Barker et al. 2006).
Figure 8: The principal muscles of the abdomen (Anterior oblique view). Images taken from www.anatomy.tv (04/03/2016)
2.1.2.10 Rectus abdominis, internal and external obliques
The rectus abdominis (Figure 8) attaches to the pubic symphysis and crest and inserts into the
xiphoid process and costal cartilage of ribs 5-7 (Moore et al. 2014). Its primary action is to flex
the trunk, but it also acts to prevent anterior rotation of the pelvis. The internal oblique (Figure
8) originates from the TLF and the anterior iliac crest and inserts into the inferior borders of ribs
10-12, the linea alba and the pubis through the conjoint tendon. The external oblique (Figure 8)
originates from the lateral surface of ribs 5-12 and inserts into the pubic tubercle, the linea alba
and the anterior iliac crest. Both muscles function as trunk flexors and rotators, and compression
support for the abdominal viscera (Moore et al. 2014).
2.1.2.11 Muscles of the lower extremity, psoas major and quadratus lumborum (QL)
Anatomical texts typically categorise the lumbar spine, hips and pelvis and lower limbs as distinct
entities. From a functional perspective however, trunk flexion is a combination of both lumbar
spine and hip movements, and the interaction between them is known as lumbopelvic rhythm
(Tafazzol et al. 2014). Indeed there are interactions between the active and passive tissues of
the spine, hips, pelvis and the lower limb, and all can therefore influence the stability of the
lumbar spine. The following muscles therefore also warrant discussion.
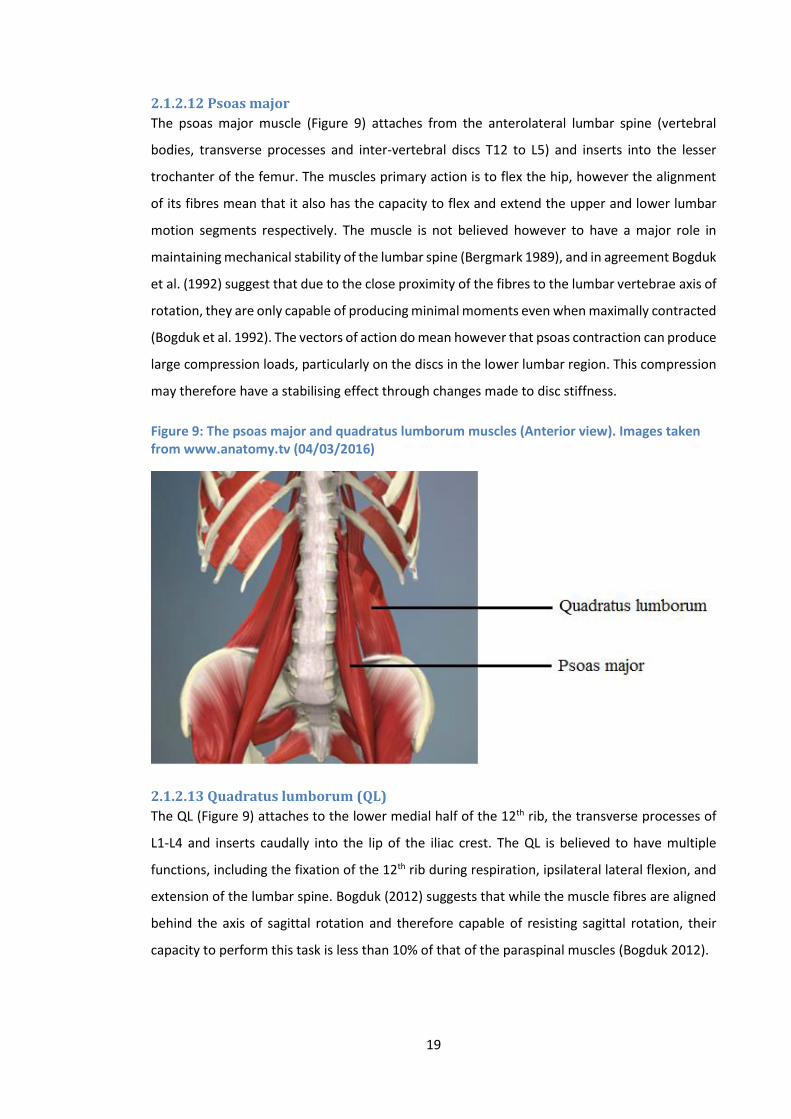
19
2.1.2.12 Psoas major
The psoas major muscle (Figure 9) attaches from the anterolateral lumbar spine (vertebral
bodies, transverse processes and inter-vertebral discs T12 to L5) and inserts into the lesser
trochanter of the femur. The muscles primary action is to flex the hip, however the alignment
of its fibres mean that it also has the capacity to flex and extend the upper and lower lumbar
motion segments respectively. The muscle is not believed however to have a major role in
maintaining mechanical stability of the lumbar spine (Bergmark 1989), and in agreement Bogduk
et al. (1992) suggest that due to the close proximity of the fibres to the lumbar vertebrae axis of
rotation, they are only capable of producing minimal moments even when maximally contracted
(Bogduk et al. 1992). The vectors of action do mean however that psoas contraction can produce
large compression loads, particularly on the discs in the lower lumbar region. This compression
may therefore have a stabilising effect through changes made to disc stiffness.
Figure 9: The psoas major and quadratus lumborum muscles (Anterior view). Images taken from www.anatomy.tv (04/03/2016)
2.1.2.13 Quadratus lumborum (QL)
The QL (Figure 9) attaches to the lower medial half of the 12th rib, the transverse processes of
L1-L4 and inserts caudally into the lip of the iliac crest. The QL is believed to have multiple
functions, including the fixation of the 12th rib during respiration, ipsilateral lateral flexion, and
extension of the lumbar spine. Bogduk (2012) suggests that while the muscle fibres are aligned
behind the axis of sagittal rotation and therefore capable of resisting sagittal rotation, their
capacity to perform this task is less than 10% of that of the paraspinal muscles (Bogduk 2012).
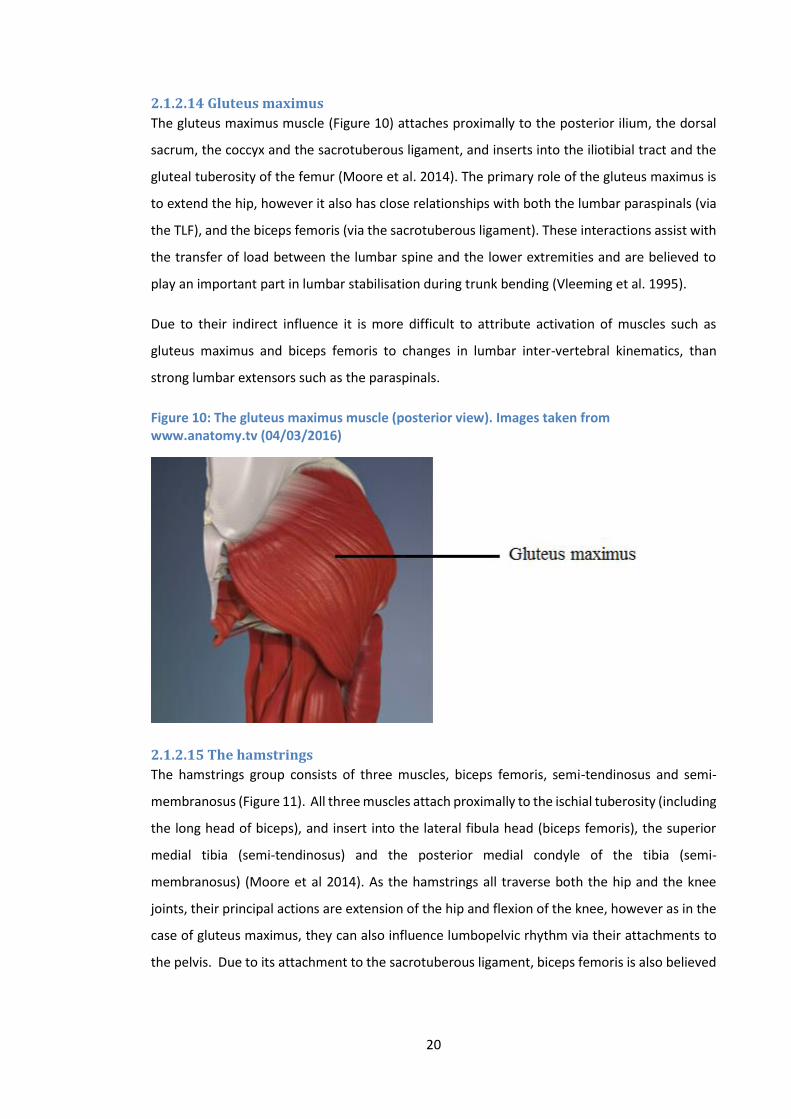
20
2.1.2.14 Gluteus maximus
The gluteus maximus muscle (Figure 10) attaches proximally to the posterior ilium, the dorsal
sacrum, the coccyx and the sacrotuberous ligament, and inserts into the iliotibial tract and the
gluteal tuberosity of the femur (Moore et al. 2014). The primary role of the gluteus maximus is
to extend the hip, however it also has close relationships with both the lumbar paraspinals (via
the TLF), and the biceps femoris (via the sacrotuberous ligament). These interactions assist with
the transfer of load between the lumbar spine and the lower extremities and are believed to
play an important part in lumbar stabilisation during trunk bending (Vleeming et al. 1995).
Due to their indirect influence it is more difficult to attribute activation of muscles such as
gluteus maximus and biceps femoris to changes in lumbar inter-vertebral kinematics, than
strong lumbar extensors such as the paraspinals.
Figure 10: The gluteus maximus muscle (posterior view). Images taken from www.anatomy.tv (04/03/2016)
2.1.2.15 The hamstrings
The hamstrings group consists of three muscles, biceps femoris, semi-tendinosus and semi-
membranosus (Figure 11). All three muscles attach proximally to the ischial tuberosity (including
the long head of biceps), and insert into the lateral fibula head (biceps femoris), the superior
medial tibia (semi-tendinosus) and the posterior medial condyle of the tibia (semi-
membranosus) (Moore et al 2014). As the hamstrings all traverse both the hip and the knee
joints, their principal actions are extension of the hip and flexion of the knee, however as in the
case of gluteus maximus, they can also influence lumbopelvic rhythm via their attachments to
the pelvis. Due to its attachment to the sacrotuberous ligament, biceps femoris is also believed
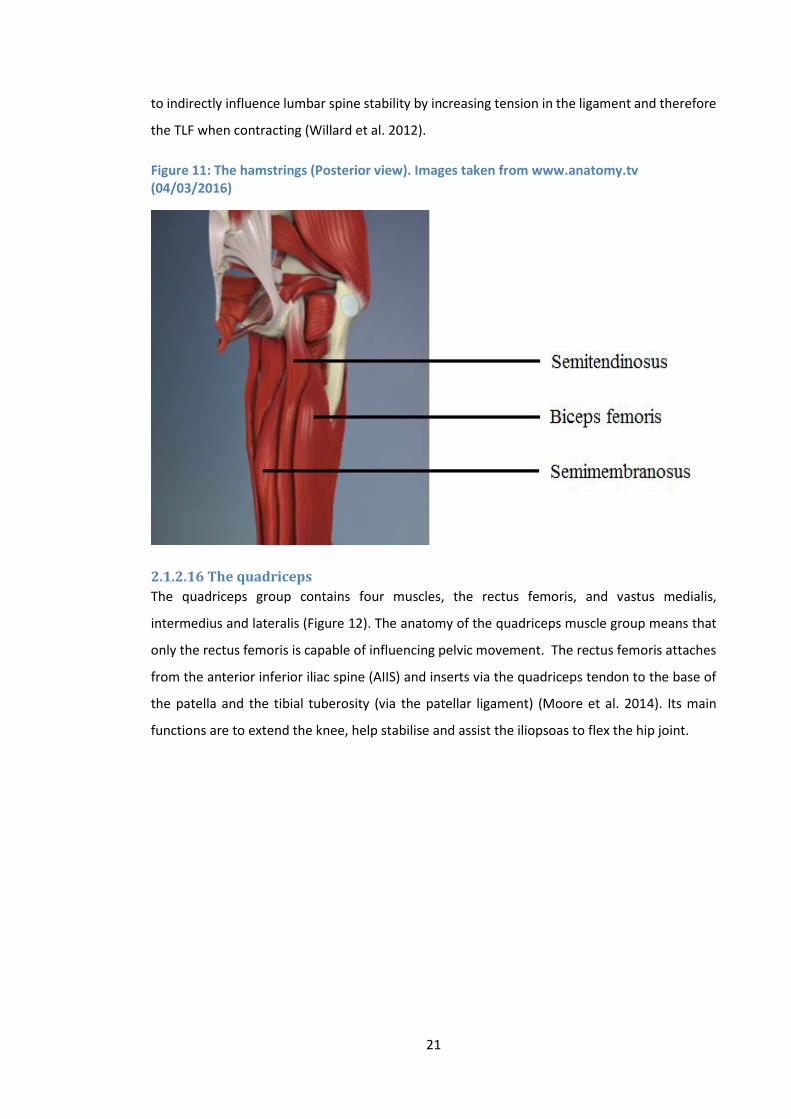
21
to indirectly influence lumbar spine stability by increasing tension in the ligament and therefore
the TLF when contracting (Willard et al. 2012).
Figure 11: The hamstrings (Posterior view). Images taken from www.anatomy.tv (04/03/2016)
2.1.2.16 The quadriceps
The quadriceps group contains four muscles, the rectus femoris, and vastus medialis,
intermedius and lateralis (Figure 12). The anatomy of the quadriceps muscle group means that
only the rectus femoris is capable of influencing pelvic movement. The rectus femoris attaches
from the anterior inferior iliac spine (AIIS) and inserts via the quadriceps tendon to the base of
the patella and the tibial tuberosity (via the patellar ligament) (Moore et al. 2014). Its main
functions are to extend the knee, help stabilise and assist the iliopsoas to flex the hip joint.

22
Figure 12: The quadriceps (Anterior view). Images taken from www.anatomy.tv (04/03/2016)
2.1.3 The pelvis
The pelvis consists of the two innominate bones, the sacrum and the coccyx. The ilium forms
joints with the sacrum bilaterally called sacroiliac joints. This joint is stabilised by 5 main
ligaments, the anterior, posterior and interosseous sacroiliac iliac ligaments, the sacrotuberous
ligaments and the sacrospinous ligament (Figure 13). The pelvis’s key functions in terms of
biomechanics are to transfer load between the axial skeleton and the lower limbs (especially
during movements), and to act as a point of attachment for the various muscles and ligaments
required to perform/control such movements. In the case of forward flexion, reduced forward
rotation at the pelvis may increase the requirement from the lumbar spine in order to reach a
designated degree of trunk flexion.
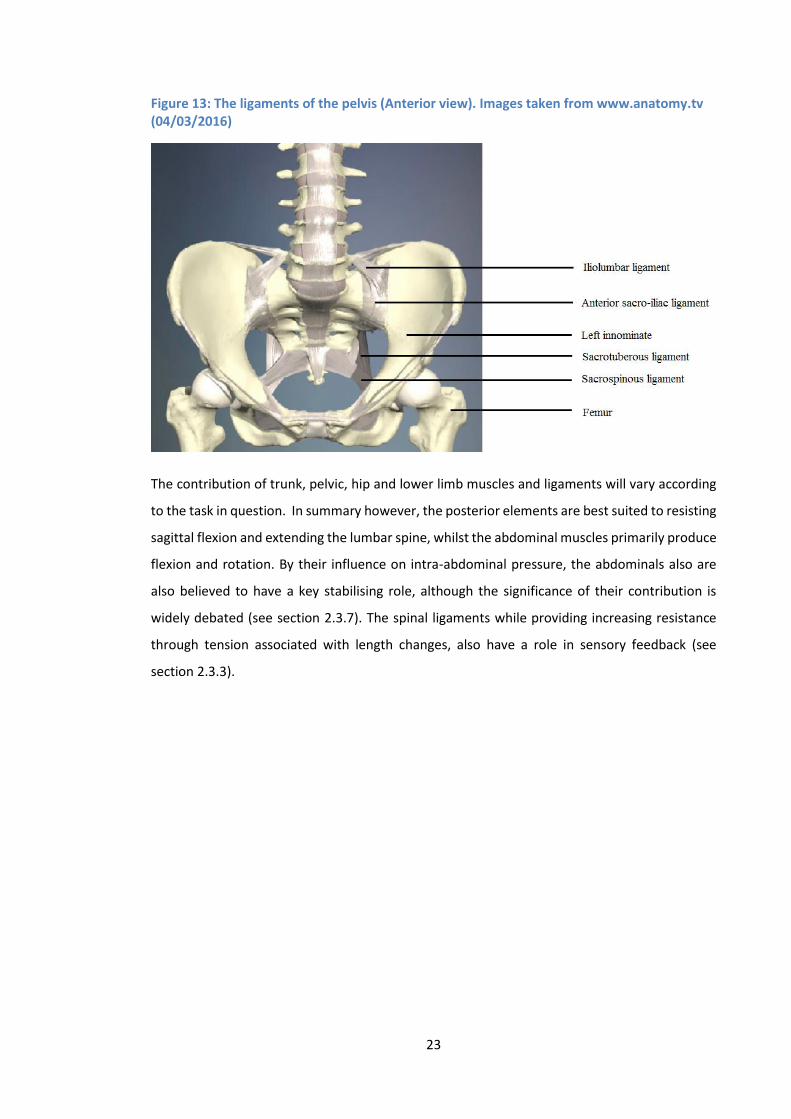
23
Figure 13: The ligaments of the pelvis (Anterior view). Images taken from www.anatomy.tv (04/03/2016)
The contribution of trunk, pelvic, hip and lower limb muscles and ligaments will vary according
to the task in question. In summary however, the posterior elements are best suited to resisting
sagittal flexion and extending the lumbar spine, whilst the abdominal muscles primarily produce
flexion and rotation. By their influence on intra-abdominal pressure, the abdominals also are
also believed to have a key stabilising role, although the significance of their contribution is
widely debated (see section 2.3.7). The spinal ligaments while providing increasing resistance
through tension associated with length changes, also have a role in sensory feedback (see
section 2.3.3).
24
Section 2
2.2 Addressing the problem of NSLBP
2.2.1 The ‘biomechanical’ components of low back pain
The diagnosis and management of NSLBP is clinically challenging, and the condition places a
large socioeconomic burden on society (Bronfort et al. 2008). Prior to the emergence of the
biopsychosocial model of low back pain (Waddell 1987), investigations into possible causes had
predominantly focussed on the physical aspects of back pain, and there was a perceived neglect
of the psychological and social components. The last 30 years however, has seen a notable
divergence from a conceptual model of pathoanatomically grounded disease within the
biomedical model, to a contextually grounded theory of illness within the biopsychosocial
model (Weiner 2008). It is now widely recognised that low back pain is influenced by both
biological and psychosocial factors, yet the balance of research over the last few decades has
been largely focussed on the latter (Hancock et al. 2011). It remains unclear how effective
treatments based on the biopsychosocial model actually are, and there is a perceived need for
more high quality studies in the field (Chiarotto et al. 2015; Deyo et al. 2014; Karjalainen et al.
2001). In a systematic review, Guzman (2001) concluded that although intensive
multidisciplinary biopsychosocial rehabilitation helps to reduce pain and improve function in low
back pain patients, there were concerns over the expense and high frequency of the treatments
required to do so (Guzman 2001). The concerns over cost have also been raised by Dufour et al.
(2010), who when comparing multidisciplinary biopsychosocial rehabilitation to a back
strengthening program found no difference in outcome between groups (Dufour et al. 2010).
The effectiveness of a stratified management approach that included psychologically informed
physiotherapy has also been demonstrated, however the comparative benefit compared to
current best practice (physiotherapy) appeared to be only short term (Hill et al. 2011). A recent
stream of research investigated structural and functional changes within the CNS
(neuroplasticity) in people with a chronification of pain (Hashmi et al. 2013), but whilst a
deepened knowledge of neural changes provides a novel and valuable new approach to the
problem, especially in the area of NSLBP when clear signs of damaged musculoskeletal
structures are rarely evident (Pelletier et al. 2015a, 2015b), it focusses on changes that are
typically secondary to some kind of peripheral stimulus and it could therefore be argued that it
is not addressing the root of the problem.
25
The dilemma therefore is how to differentiate the different causes of NSLBP to facilitate clinical
decision making in the assessment and treatment of these patients. Various attempts to
determine the components that would facilitate better NSLBP diagnosis and outcomes (clinical
prediction rules (CPRs)), and to establish methods that distinguish subgroups of LBP from each
other have been made (Childs and Cleland 2006; O'sullivan 2005; Sahrmann 2002). Although
promising, current evidence suggests that CPRs are not yet ready for direct clinical application
(Haskins 2012; May 2009), and the value of sub-grouping methods remains widely unproven
(Fritz et al. 2007; Hebert et al. 2011). There is therefore large scope for improved understanding,
and a perceived requirement for further investigation into the role of biological components,
including those of mechanical origin.
It is clear that low back pain remains a multi-factorial problem; however as discussed, a greater
emphasis could be placed on research that considers its mechanical components. Historically
the limitation of models such as the Disease Model (Virchow 1858) has been the inability to
identify a causative structural lesion. In the lumbar spine for example, the visualisation of
continuous inter-vertebral motion has until recently not been feasible (Weiner 2008), leaving
the potential to miss potentially important biomechanical changes2 that occur throughout or at
specific points during the entire spinal range of movement. If the concern then is that current
low back pain research neglects the biological components (Hancock et al. 2011), technological
advances that provide new ways of measuring such elements, may provide a way forward for
an area of research that requires a renewed focus.
2.2.2 The importance of ‘normal’ (the study of low back pain free participants)
The background (section 1.2) highlighted the difficulty in determining factors that can reliably
distinguish CNSLBP groups from healthy controls, and that much contradiction exists between
the findings of studies that investigate the same biomechanical variables. Table 1 compares a
number of studies that attempt to determine mechanical links with LBP groups, and
demonstrates that the findings of such investigations are sometimes contradictory to each
other. The nature of NSLBP means that within a low back pain group (and low back pain free
control groups for that matter), different structural, chemical and neuromuscular changes may
be found (Ross et al. 2015). The array of potential dysfunctions within each sample makes it
2 Note: Although biomechanical influences include those of a ‘chemical’ origin, the consideration of such factors are
beyond the scope of this thesis.
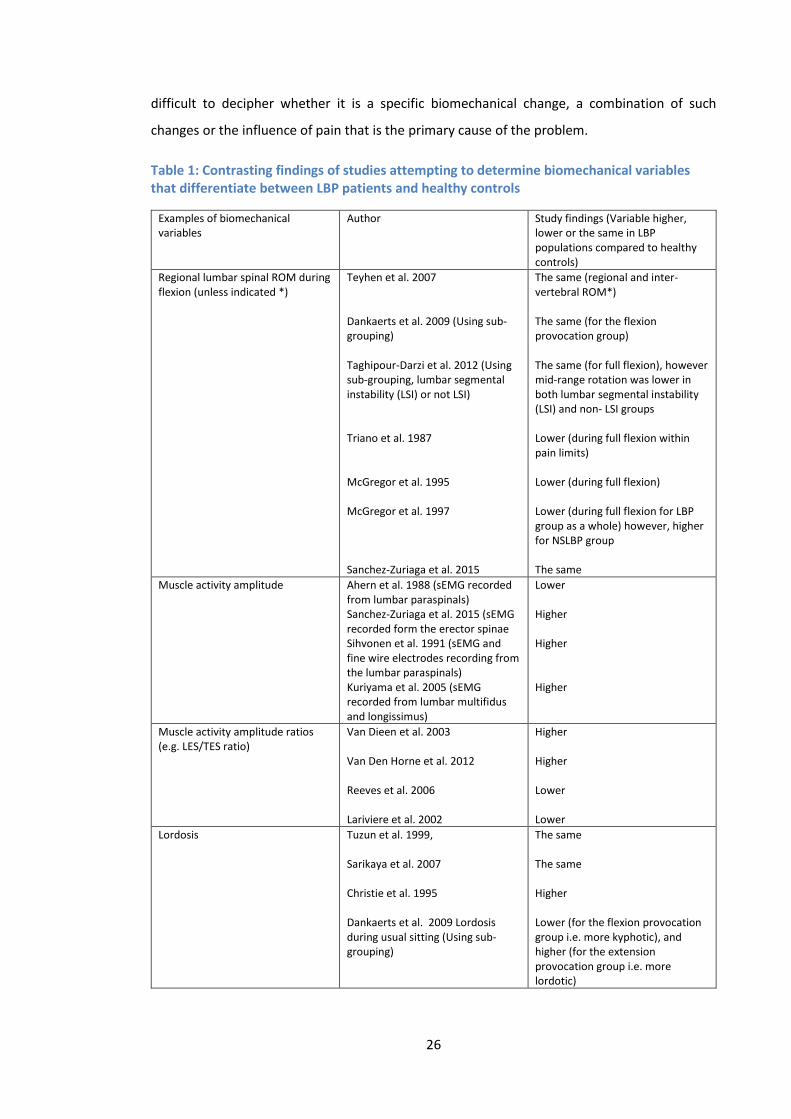
26
difficult to decipher whether it is a specific biomechanical change, a combination of such
changes or the influence of pain that is the primary cause of the problem.
Table 1: Contrasting findings of studies attempting to determine biomechanical variables that differentiate between LBP patients and healthy controls
Examples of biomechanical variables
Author Study findings (Variable higher, lower or the same in LBP populations compared to healthy controls)
Regional lumbar spinal ROM during flexion (unless indicated *)
Teyhen et al. 2007 Dankaerts et al. 2009 (Using sub-grouping) Taghipour-Darzi et al. 2012 (Using sub-grouping, lumbar segmental instability (LSI) or not LSI) Triano et al. 1987 McGregor et al. 1995 McGregor et al. 1997 Sanchez-Zuriaga et al. 2015
The same (regional and inter-vertebral ROM*) The same (for the flexion provocation group) The same (for full flexion), however mid-range rotation was lower in both lumbar segmental instability (LSI) and non- LSI groups Lower (during full flexion within pain limits) Lower (during full flexion) Lower (during full flexion for LBP group as a whole) however, higher for NSLBP group The same
Muscle activity amplitude Ahern et al. 1988 (sEMG recorded from lumbar paraspinals) Sanchez-Zuriaga et al. 2015 (sEMG recorded form the erector spinae Sihvonen et al. 1991 (sEMG and fine wire electrodes recording from the lumbar paraspinals) Kuriyama et al. 2005 (sEMG recorded from lumbar multifidus and longissimus)
Lower Higher Higher Higher
Muscle activity amplitude ratios (e.g. LES/TES ratio)
Van Dieen et al. 2003 Van Den Horne et al. 2012 Reeves et al. 2006 Lariviere et al. 2002
Higher Higher Lower Lower
Lordosis Tuzun et al. 1999, Sarikaya et al. 2007 Christie et al. 1995 Dankaerts et al. 2009 Lordosis during usual sitting (Using sub-grouping)
The same The same Higher Lower (for the flexion provocation group i.e. more kyphotic), and higher (for the extension provocation group i.e. more lordotic)
27
An additional confounder is LBP itself, as there is ongoing debate as to whether LBP (if involved
at all) is actually the cause or the consequence of such biomechanical changes (Hodges et al.
2013). This lack of clarity means that investigations into possible links between LBP and
mechanical factors need to consider the potential influence of pain, and indeed the fear of pain
in participants, as both can affect mechanical behaviours (Asmundson et al. 1997). In an attempt
to address the problem of pain (as a possible confounder), studies have investigated chronic low
back pain groups in pain free periods (Sanchez-Zuriaga et al. 2015), however the problem of
multiple potentially unaddressed influences remains. This has been a problem for all studies in
this field, leading to the development of different strategies designed to help better distinguish
between LBP and healthy control groups. Such approaches usually try to somehow narrow the
focus of investigation, and include attempts to sub-group the NSLBP group in terms of
movement provocation (Dankaerts 2009; Hemming et al. 2015), divide the lumbar spine into
regions (Hemming et al. 2015; Pavlova et al. 2015), and investigate changes in parameters such
as muscle activity (Dankaerts et al. 2009, D’hooge et al. 2013), or kinematics (Taghipour-Darzi et
al. 2012) in sections throughout the motion cycle and not just at the end ranges which has been
more typical (Miyasaka 2000).
Despite this, in every case, if NSLBP groups are analysed whilst in pain or if the variable under
consideration is investigated in isolation, then it is not possible to say that the presumed
correlated biomechanical parameter(s) are not simply variations of normal biomechanical
behaviour. If we use the example of paraspinal muscle activity as a variable (Table 1), it has
been suggested that activity imbalances between segmental levels, may be markers that
distinguish between CNLBP patients and healthy controls (Van Dieen et al. 2003, Van Den Hoorn
et al. 2012). These studies report that a relative increase in lumbar erector spinae (LES) activity
compared to the thoracic erector spinae (TES) is a stabilisation strategy adopted by the LBP
groups to enhance spinal stability (Van Dieen et al. 2003). Such findings are contradictory to
other studies however, which have shown the complete opposite (Lariviere 2002; Reeves et al.
2006). Although these differences may partly be explained by differences in methodology, it is
likely that optimal muscle recruitment strategies will vary due to the biomechanical
requirements of each individual. It is not known whether such variations in strategy exist within
a spectrum of normal biomechanical behaviour.
2.2.3 Is it time for a fresh approach?
The development of protocols that investigate spinal biomechanics at an inter-vertebral level in
people without LBP, including the interactions that exist between such levels, may help to
further understand what is normal. Indeed, in terms of kinematic and EMG variables, Peach et
28
al. (1998) suggested that by knowing what is ‘normal’ we may be able to objectively evaluate
rehabilitation protocols, and classify different low back pathologies (Peach et al. 1998). This view
was shared by Wong et al. (2004) who proposed that pathologic spinal motion can only be
identified if ‘normal’ spinal motion is defined (Wong 2004), and by Teyhen (2007) who described
the need to determine what ‘normal’ is, as a precondition to progressing the use of altered
kinematics as a parameter (Teyhen et al. 2007).
Using the example of ROM, it has been suggested that traditional measurements such as total
spinal ROM, in isolation, have limited clinical usefulness when attempting to distinguish LBP and
healthy controls, due to inherent heterogeneity in both groups (McGregor et al. 1997). There is
therefore a growing belief that research needs to move away from conventional end of range
measurements, towards using mid-range (Taghipour-Darzi et al. 2012) or higher order variables
such as displacement, acceleration and velocity (Lehman 2004), and that consideration should
be given to the spine as a whole (i.e. a group of interacting segments) as opposed to motion
segments viewed in isolation. Indeed, in a recent fluoroscopy study analysing recumbent
bending, Mellor et al. (2014) claimed to be the first to demonstrate measurable biomechanical
differences between NSLBP patients and healthy controls, using what they termed “combined
proportional range variance (CPRV)” (Mellor et al. 2014). They found that the variation in
proportional motion between lumbar vertebrae was significantly greater in NSLBP patients than
in healthy controls, providing evidence that the interaction between segments may be of greater
importance than inter-vertebral motion in isolation.
The present study investigates the normal biomechanics of the lumbar spine using
measurements of both spinal kinematics and associated muscle activity. An improved
understanding of the normal interactions that exist in healthy participants, should enhance our
understanding of what is truly ‘normal’ and provide a basis for identifying what is ‘abnormal’.
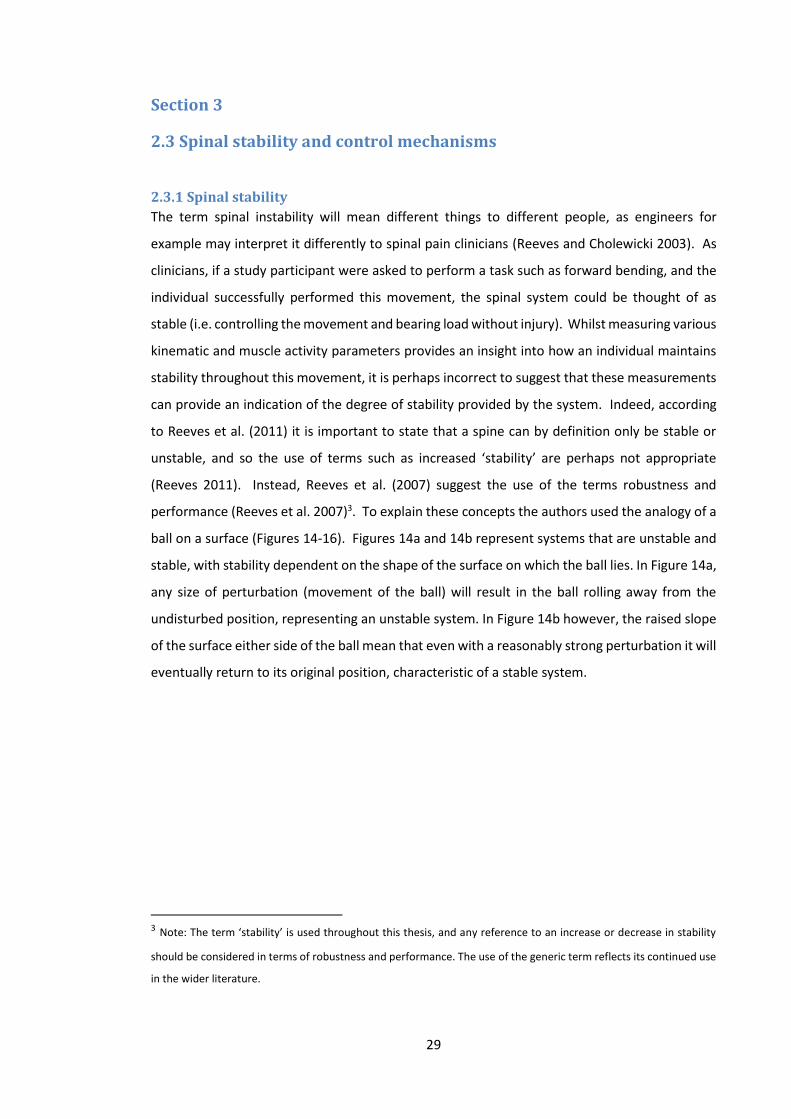
29
Section 3
2.3 Spinal stability and control mechanisms
2.3.1 Spinal stability
The term spinal instability will mean different things to different people, as engineers for
example may interpret it differently to spinal pain clinicians (Reeves and Cholewicki 2003). As
clinicians, if a study participant were asked to perform a task such as forward bending, and the
individual successfully performed this movement, the spinal system could be thought of as
stable (i.e. controlling the movement and bearing load without injury). Whilst measuring various
kinematic and muscle activity parameters provides an insight into how an individual maintains
stability throughout this movement, it is perhaps incorrect to suggest that these measurements
can provide an indication of the degree of stability provided by the system. Indeed, according
to Reeves et al. (2011) it is important to state that a spine can by definition only be stable or
unstable, and so the use of terms such as increased ‘stability’ are perhaps not appropriate
(Reeves 2011). Instead, Reeves et al. (2007) suggest the use of the terms robustness and
performance (Reeves et al. 2007)3. To explain these concepts the authors used the analogy of a
ball on a surface (Figures 14-16). Figures 14a and 14b represent systems that are unstable and
stable, with stability dependent on the shape of the surface on which the ball lies. In Figure 14a,
any size of perturbation (movement of the ball) will result in the ball rolling away from the
undisturbed position, representing an unstable system. In Figure 14b however, the raised slope
of the surface either side of the ball mean that even with a reasonably strong perturbation it will
eventually return to its original position, characteristic of a stable system.
3 Note: The term ‘stability’ is used throughout this thesis, and any reference to an increase or decrease in stability
should be considered in terms of robustness and performance. The use of the generic term reflects its continued use
in the wider literature.
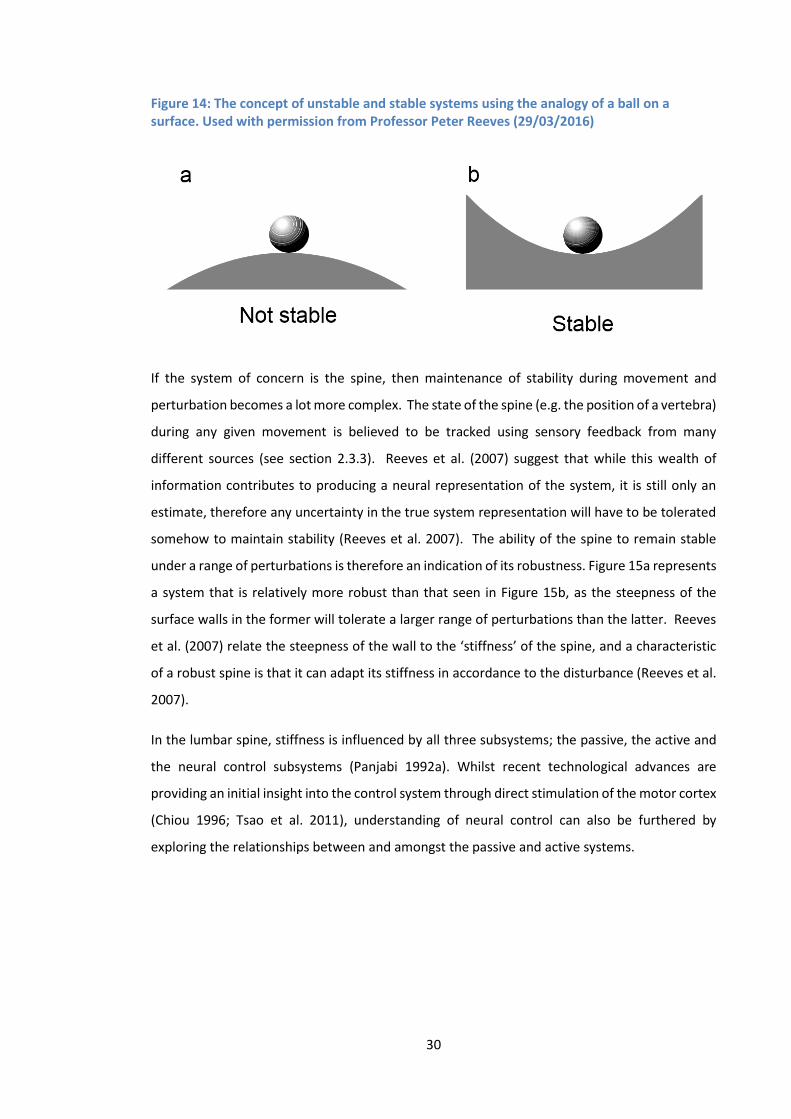
30
Figure 14: The concept of unstable and stable systems using the analogy of a ball on a surface. Used with permission from Professor Peter Reeves (29/03/2016)
If the system of concern is the spine, then maintenance of stability during movement and
perturbation becomes a lot more complex. The state of the spine (e.g. the position of a vertebra)
during any given movement is believed to be tracked using sensory feedback from many
different sources (see section 2.3.3). Reeves et al. (2007) suggest that while this wealth of
information contributes to producing a neural representation of the system, it is still only an
estimate, therefore any uncertainty in the true system representation will have to be tolerated
somehow to maintain stability (Reeves et al. 2007). The ability of the spine to remain stable
under a range of perturbations is therefore an indication of its robustness. Figure 15a represents
a system that is relatively more robust than that seen in Figure 15b, as the steepness of the
surface walls in the former will tolerate a larger range of perturbations than the latter. Reeves
et al. (2007) relate the steepness of the wall to the ‘stiffness’ of the spine, and a characteristic
of a robust spine is that it can adapt its stiffness in accordance to the disturbance (Reeves et al.
2007).
In the lumbar spine, stiffness is influenced by all three subsystems; the passive, the active and
the neural control subsystems (Panjabi 1992a). Whilst recent technological advances are
providing an initial insight into the control system through direct stimulation of the motor cortex
(Chiou 1996; Tsao et al. 2011), understanding of neural control can also be furthered by
exploring the relationships between and amongst the passive and active systems.
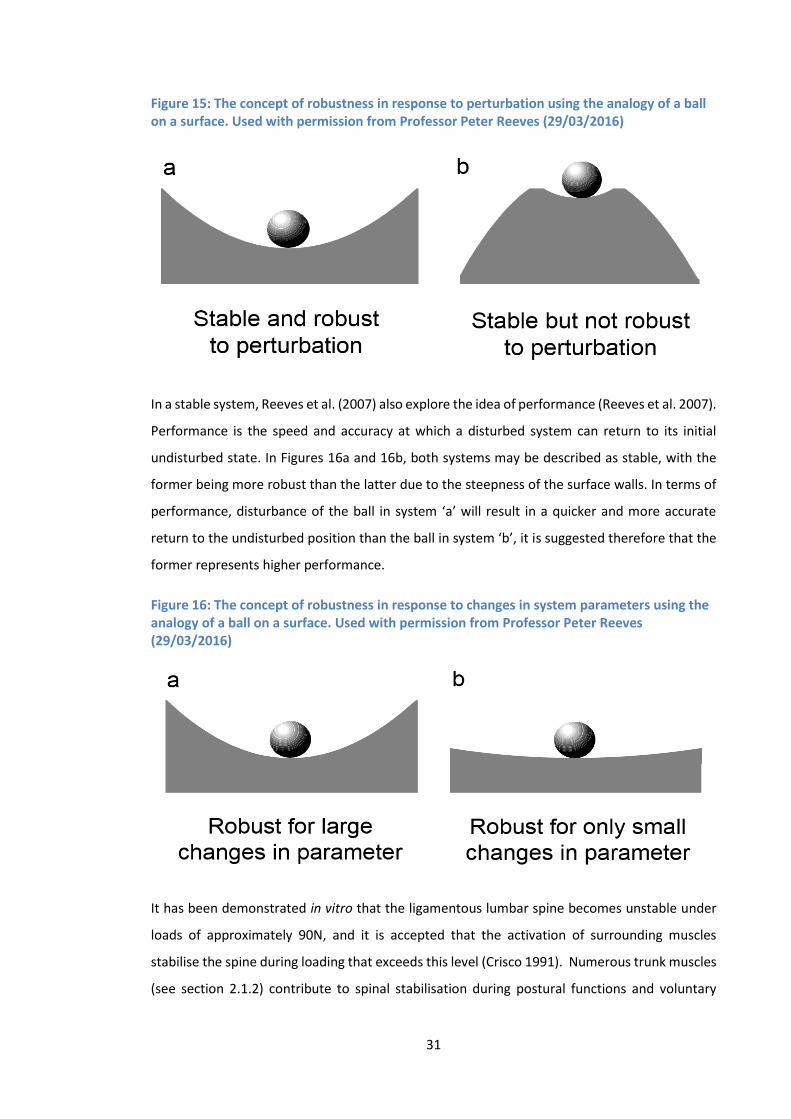
31
Figure 15: The concept of robustness in response to perturbation using the analogy of a ball on a surface. Used with permission from Professor Peter Reeves (29/03/2016)
In a stable system, Reeves et al. (2007) also explore the idea of performance (Reeves et al. 2007).
Performance is the speed and accuracy at which a disturbed system can return to its initial
undisturbed state. In Figures 16a and 16b, both systems may be described as stable, with the
former being more robust than the latter due to the steepness of the surface walls. In terms of
performance, disturbance of the ball in system ‘a’ will result in a quicker and more accurate
return to the undisturbed position than the ball in system ‘b’, it is suggested therefore that the
former represents higher performance.
Figure 16: The concept of robustness in response to changes in system parameters using the analogy of a ball on a surface. Used with permission from Professor Peter Reeves (29/03/2016)
It has been demonstrated in vitro that the ligamentous lumbar spine becomes unstable under
loads of approximately 90N, and it is accepted that the activation of surrounding muscles
stabilise the spine during loading that exceeds this level (Crisco 1991). Numerous trunk muscles
(see section 2.1.2) contribute to spinal stabilisation during postural functions and voluntary
32
movements; and as such they can be considered as important components of the spinal control
mechanism, due to their influence over the robustness and performance of the system (Reeves
et al. 2007). Generally speaking, motor control strategies are employed to optimise the
movement in terms of energy cost to the system and to protect the spine from any movement
that could result in injury or pain (Cholewicki and McGill 1996; Granata and Marras 2000). In
order to achieve these aims, muscle activity can change between and within muscles, and inputs
may come from local and global levels of the motor control system (Bergmark 1989). These
changes can have a direct impact on the mechanical behaviour of the spine, influencing spinal
stiffness and modifying movement patterns.
Returning to the example of a study participant performing a forward bending and return task,
where they primarily bend from the lumbar spine, it can be assumed that the participant’s spine
was stable, if they completed the movement without injury to any spinal tissues and without
having to compensate for movement by making adjustments to body position beyond the spine
to maintain balance. The way in which the various active, passive and control elements combine
through the neural control system to achieve stability during these movements is therefore of
interest, especially as so little is currently known about such interactions at an inter-vertebral
level. Investigations into spinal biomechanics at this localised level will provide a deeper insight
into how interactions at an inter-vertebral level contribute to the control mechanisms of the
spine.
2.3.2 Maintaining the equilibrium of the lumbar spine during forward bending
The bulk of recent research into spinal control mechanisms has concentrated on comparisons
between LBP and healthy groups, and differences in muscle activity recruitment strategies
related to perturbations from neutral spine positions (Cholewicki and Van Vliet 2002;
Macdonald et al. 2009; 2010; Radebold et al. 2000). The findings of these studies suggest that
delayed and decreased activity of the deeper paraspinal muscles and increased activation of the
superficial muscles are the strategies adopted to restore or maintain the equilibrium about the
neutral position, while maintenance of spinal integrity is also required during voluntary
movements of the trunk through pre-determined trajectories (D’hooge et al. 2013). Using the
example of sagittal flexion and return, a study by Peach et al. (1998) using Fastrak and sEMG
described the general muscle activation patterns during these movements (Figure 17). Bursts in
signal amplitude correlated with the onset of forward flexion, and the beginning of the return
phase. Between the two bursts around the point of full flexion, there is a period of significantly
reduced activity known as the flexion relaxation phenomenon (FRP) (Peach et al. 1998). Whilst
many studies have investigated muscle activation patterns during trunk flexion, the majority
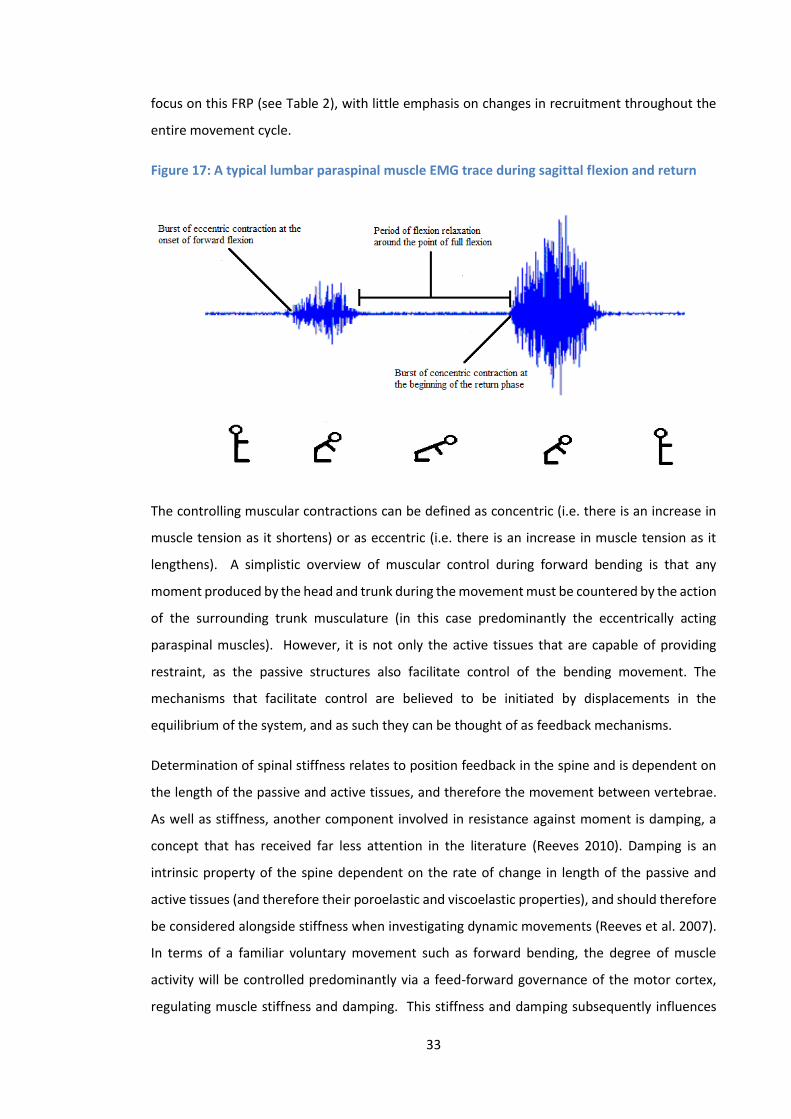
33
focus on this FRP (see Table 2), with little emphasis on changes in recruitment throughout the
entire movement cycle.
Figure 17: A typical lumbar paraspinal muscle EMG trace during sagittal flexion and return
The controlling muscular contractions can be defined as concentric (i.e. there is an increase in
muscle tension as it shortens) or as eccentric (i.e. there is an increase in muscle tension as it
lengthens). A simplistic overview of muscular control during forward bending is that any
moment produced by the head and trunk during the movement must be countered by the action
of the surrounding trunk musculature (in this case predominantly the eccentrically acting
paraspinal muscles). However, it is not only the active tissues that are capable of providing
restraint, as the passive structures also facilitate control of the bending movement. The
mechanisms that facilitate control are believed to be initiated by displacements in the
equilibrium of the system, and as such they can be thought of as feedback mechanisms.
Determination of spinal stiffness relates to position feedback in the spine and is dependent on
the length of the passive and active tissues, and therefore the movement between vertebrae.
As well as stiffness, another component involved in resistance against moment is damping, a
concept that has received far less attention in the literature (Reeves 2010). Damping is an
intrinsic property of the spine dependent on the rate of change in length of the passive and
active tissues (and therefore their poroelastic and viscoelastic properties), and should therefore
be considered alongside stiffness when investigating dynamic movements (Reeves et al. 2007).
In terms of a familiar voluntary movement such as forward bending, the degree of muscle
activity will be controlled predominantly via a feed-forward governance of the motor cortex,
regulating muscle stiffness and damping. This stiffness and damping subsequently influences
34
the restraint characteristics of the passive structures, both of which affect their control on the
movements of the spine without any time delay.
A common misconception is that there is a clear distinction between open-loop control (with no
sensory feedback) and closed loop control (with sensory feedback) in terms of the control of
voluntary movements (Nielsen 2004). Despite voluntary bending being a well-practised
movement, additional stiffness and damping will also be provided to the system via reflex
muscle activity in response to any unexpected changes in the length and rate of elongation in
the passive and active tissues, which can be considered a reflection of changes to the intended
inter-vertebral movements (spinal feedback). This reflexive influence over control comes with a
small time delay, as does the other significant contributor to control, input from visual and
vestibular (supraspinal) feedback systems.
2.3.3 Spinal feedback mechanisms
Feedback mechanisms contributing to spinal control come from sensors that communicate
information about the status of the whole system (Reeves et al. 2007), in particular passive and
active systems are believed to interact providing a feedback control mechanism (Solomonow et
al. 2010; Vleeming and Willard 2010), a synergistic relationship that provides stability and
stiffness to the spine during movement (Stubbs et al. 1998). At an inter-vertebral level, these
sensors provide information regarding the position and velocity of vertebral movements, and
are located in both the muscles and the passive structures associated with the inter-vertebral
joint. In terms of the active tissues, this information is believed to be provided by muscle
spindles and Golgi tendon organs. The relative density of muscle spindles has been shown to
correlate with the capacity of the muscle to provide proprioceptive feedback (Buxton and Peck
1989), and Golgi tendon organs, which are located in the muscle tendons, are believed to sense
changes in muscular tension and prevent overexertion via inhibition feedback mechanisms
(Brooks 1986; Windhorst 2007). In the passive tissues of the lumbar spine, mechanoreceptors
are located within the ligaments, facet capsules and discs (Indahl 1997; Kiter et al. 2010; Ozaktay
1991; Roberts 1995; Yahia et al. 1992). Types of mechanoreceptor include Golgi and Rufini
endings (Roberts 1995), which are believed to respond to excessive deformation of ligaments
and joint capsules (Clark and Brugess 1975), and provide information regarding changes in
velocity, the position, and pressure within a joint (Johansson et al. 1991). Information from
sensors throughout the active and passive systems therefore can give continuous feedback via
neural control, creating a system with the capacity to adapt muscle recruitment in accordance
to the task.
35
Paraspinal muscle activity during sagittal flexion in healthy spines can typically be separated into
two stages. The first is muscle activation, and can be partially explained by the concept of
ligamento-muscular synergism. This theory suggests that stress and strain in the passive tissues
is monitored by mechanoreceptors, which relay information to the CNS which subsequently
initiates muscle activation associated with the motion segment (Solomonow et al. 1998). This
mechanism is believed to control movement of the bones and protect the passive structures
from injury. Feline and porcine studies have demonstrated a direct association between
ligament stimulation and EMG activity in the paraspinals, with muscle excitation being shown to
be strongest either at the level of stimulation (Solomonow et al. 2002), or the motion segment
below (Stubbs et al. 1998). In both cases, paraspinal activity was recorded as far as 2 levels above
or below the level of stimulation, which suggests a stiffening strategy that goes beyond single
motion segments, but means that the precise levels at which the ligamento-muscular reflex acts
remains unclear. Indeed, it is suggested that EMG discharge is often not graded with joint
movement (Grigg 2001), and as studies typically only stimulate one level, therefore excluding
the input and resulting interactions from other levels, the mechanism requires further
clarification.
The role of stretch receptors in lumbar muscles has received somewhat less attention.
Solomonow et al. (2002) suggest that stretch receptors in the paraspinal muscles do not
participate in the EMG activation reflex described previously (Solomonow et al. 2002), however
relationships have been shown between lumbar paraspinal muscle spindle discharge and
longissimus and multifidus lengthening (Cao et al. 2009), which alludes to an important role in
spinal control. Indeed Kang et al. (2002) suggest that stimuli from the medial paraspinal tissues
may influence efferent activity to adjacent motion segments, and therefore directly contribute
to biomechanical behaviour (Kang et al. 2002). They acknowledge however that the function of
such inter-segmental reflex pathways again requires further clarification (Kang 2002).
The second stage that normally occurs during forward bending is a myoelectrical deactivation
of the erector spinae, a muscle activity decrease that goes on until the start of the relaxation
phase (i.e. the onset of the FRP) (Sanchez-Zuriaga et al. 2015), associated with a shift of moment
from the active to the passive structures (Floyd and Silver 1955). This transferral is also likely to
be linked with a redistribution of muscle activity to muscles less frequently recorded, (e.g.
Quadratus lumborum, and deep erector spinae) (Andersson et al. 1996), and elastic resistance
from the myoelectrically silent erectors (Watson et al. 1997). The mechanism for silencing these
muscles during flexion is also believed to be the result of stretch receptor stimulation in the
36
posterior passive tissues, serving to reflexogenically inhibit paraspinal muscle activity (Kippers
and Parker 1984).
2.3.4 Muscle recruitment strategies
Investigations into the function of trunk muscles have commonly used surface
electromyography (sEMG) amplitude measurements to compare LBP subjects with healthy
controls (Dankaerts et al. 2006). However, as described in Chapter 1, there are often
contradictions in study findings, with examples of LBP groups demonstrating increased,
decreased or indeed similar activity when compared to controls (Dankaerts et al. 2009; Arena et
al. 1991; Alexiev et al. 1994; Cram and Engrstom 1986; Ahern et al. 1988; Cassisi et al. 1993;
Kravitz et al. 1981; Cohen et al. 1986; Dankaerts et al. 2006; Sanchez-Zuriaga et al. 2015). These
contradictory results are postulated to result from the heterogeneity of NSLBP groups, which is
proposed to conceal subgroups (Dankaerts et al. 2006). In those that do find an objective
difference, conclusions are typically based on an assumed lumbar stabilisation strategy in the
LBP group. For example, Sanchez-Zuriaga et al. (2015) investigated normalised sEMG amplitudes
of the erector spinae, and showed that activity during flexion was greater in the LBP group,
suggesting a stabilisation strategy compensating for deficient generation of extensor moment
by impaired lumbar structures (Sanchez-Zuriaga et al. 2015). The study found no difference
between groups in gross lumbar ROM however, which suggests that if such activity is related to
kinematics, then regional kinematic measurements are not adequate to highlight their
relevance.
The type of strategy employed by the neural control system to maintain stability of the spine
will depend on the task. If large perturbations are expected, then a strategy such as muscle co-
contraction can be employed to maximise stability (Gardner-Morse 1998; Granata and Marras
2000; Oomen et al. 2015), however it can be costly both in terms of the energy required, and
mechanically (Marras and Mirka 1990). Co-contraction involves the activation of both agonist
and antagonist muscle groups, it has been shown to increase inter-vertebral stiffness (Stokes
2002), and is typically pre-emptive therefore reducing the likelihood of the need for reflexive
inputs (Reeves et al. 2007). Tasks requiring a finer control however, may be better suited to a
strategy more reliant on reflex pathways, as it may be more efficient in terms of stabilising
during that specific task (Reeves et al. 2007). The movement of forward bending is likely to
involve a mixture of strategies, although it has been demonstrated that there is little
requirement for the activation of trunk agonists during the flexion phase without external
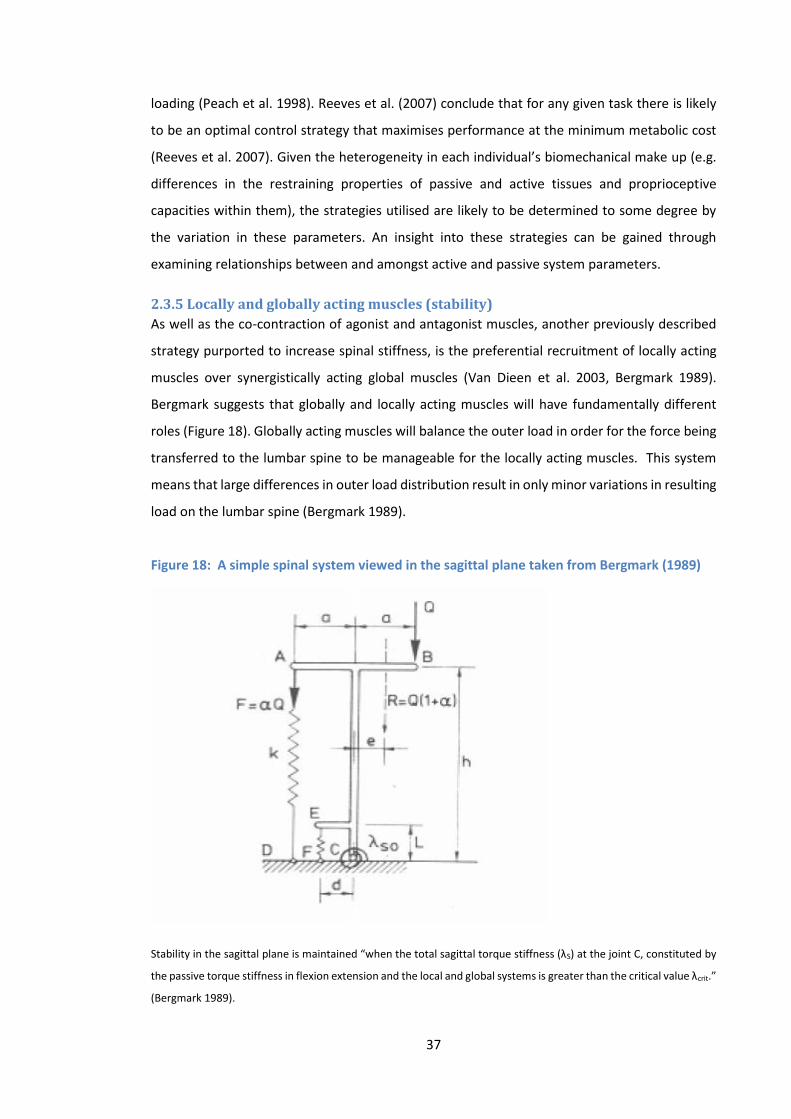
37
loading (Peach et al. 1998). Reeves et al. (2007) conclude that for any given task there is likely
to be an optimal control strategy that maximises performance at the minimum metabolic cost
(Reeves et al. 2007). Given the heterogeneity in each individual’s biomechanical make up (e.g.
differences in the restraining properties of passive and active tissues and proprioceptive
capacities within them), the strategies utilised are likely to be determined to some degree by
the variation in these parameters. An insight into these strategies can be gained through
examining relationships between and amongst active and passive system parameters.
2.3.5 Locally and globally acting muscles (stability)
As well as the co-contraction of agonist and antagonist muscles, another previously described
strategy purported to increase spinal stiffness, is the preferential recruitment of locally acting
muscles over synergistically acting global muscles (Van Dieen et al. 2003, Bergmark 1989).
Bergmark suggests that globally and locally acting muscles will have fundamentally different
roles (Figure 18). Globally acting muscles will balance the outer load in order for the force being
transferred to the lumbar spine to be manageable for the locally acting muscles. This system
means that large differences in outer load distribution result in only minor variations in resulting
load on the lumbar spine (Bergmark 1989).
Figure 18: A simple spinal system viewed in the sagittal plane taken from Bergmark (1989)
Stability in the sagittal plane is maintained “when the total sagittal torque stiffness (λS) at the joint C, constituted by
the passive torque stiffness in flexion extension and the local and global systems is greater than the critical value λcrit.”
(Bergmark 1989).
38
They go on to suggest that the locally acting control system is effectively dependent on the size
of the outer load and the curvature of the spine. In the lumbar spine therefore the degree of
lordosis is likely to be a key component (see section 2.4.1).
Bergmark’s definition of locally and globally acting muscles is broadly similar to that of Bogduk
(section 2.1.2.1). Any muscles (with the exception of psoas) with their origin or insertion at the
vertebrae are defined as locally acting, and those that span between the thoracic cage and the
pelvis as globally acting. Of the muscles described (section 2.1.2), the longissimus thoracis pars
thoracis and iliocostalis group traverse the entire back and may be considered to act globally, as
can the internal and external obliques, the rectus abdominis and the lateral quadratus
lumborum. The longissimus thoracis pars lumborum traverses the lumbar spine, with upper
lumbar region fibres that are particularly suited to extending the spine (or resisting flexion), and
along with the lumbar multifidus that can also resist flexion and produce extension, may be
considered to act at a (local) inter-segmental level.
An investigation into the relative effects of eccentric versus concentric contractions on the
function of lumbar paraspinals, showed that repeated eccentric contractions (moving from 10°
of extension to 40° of sagittal flexion) results in a higher level of multifidus activity required to
produce a given level of torque production, suggesting that the multifidus become less efficient
with repetitive loading (Herman and Barnes 2001). This was not the case for the Iliocostalis
lumborum muscle that appeared to be unaffected by the task. The reasons for such different
characteristics between these muscles are of interest, as they provide an insight into the roles
of each in terms of the task. Skeletal muscle consists of varying proportions of three fibre types.
Type I fibres (also known as ‘slow twitch’, type IIA (also known as ‘fast twitch oxidative’) and
type IIX (also known as ‘fast twitch glycolytic’) (Mannion 1999b). Generally speaking, type I fibres
are more resistant to fatigue and are believed to be suited to postural functions, whilst types IIA
and IIX being more prone to fatigue are better suited to fast, strong contractions. Whilst it has
been suggested that muscle fibre type is unlikely to be the primary reason for the differences in
muscle characteristics described above (Thorstensson and Carlson 1987), the inter-subject
variation in paraspinal fibre type composition (Mannion 1999b) means that the extent of its
influence cannot be fully known. As previously described the two muscles are believed to have
different functional roles, multifidus as a local segmentally acting stabiliser, and iliocostalis
acting more globally. Herman and Barnes (2001) suggest that the multifidus therefore may have
to work harder and undergo relatively greater excursion than iliocostalis during the eccentric
contraction required to bend through a relatively small range (Herman and Barnes 2001).
39
The sensory mechanisms outlined previously (section 2.3.3) afford an internal representation of
the outside world, providing the information necessary to guide the movement. To an onlooker,
the movement of bending forward appears to be a relatively straight forward task, which is also
reflected in the relatively small size of the motor cortex believed to be involved in the control of
the trunk musculature (Penfield and Rasmussen 1950). Movement control mechanisms are
however to the contrary extremely complex, and using the example of bending forward, control
of the spine involves numerous independently contracting muscles that insert on to vertebrae
at multiple levels, with the capability of adjusting the moments produced at each. In view of the
fact that several different muscle fascicles attach to each vertebra, it would seem logical that
each fascicle may have the capacity to affect control at specific levels. A recent investigation
using transcranial magnetic stimulation investigated the changes in motor cortical
representation of different lumbar paraspinal muscle fascicles in people with LBP (Tsao et al.
2011). The study showed that in healthy controls there was a discrete cortical organisation of
inputs to the LES and LMU muscles, which was lost in participants with LBP. In healthy
individuals therefore, it is likely that the control system can utilise different muscle fascicles to
optimise stability dependent on the conditions. The degree to which this can occur remains
unclear however, as although individual fascicles can function independently of each other in a
purely mechanical sense, connections that exist with extramuscular connective tissues, and
indeed other muscles, shroud the relative contributions of each to the control system (Huijing
2003).
In terms of spinal motor control mechanisms, at an inter-vertebral level, current understanding
is lacking. In a recent update to a text concerning musculoskeletal rehabilitation (Magee et al.
2015), state that locally acting muscles (e.g. multifidus) play an essential role in spinal control
at an inter-vertebral level. To back up this statement they refer to an in vitro study that
investigated the influence of different muscles on L4-L5 motion during flexion/extension (Wilke
et al. 1995), and an in vivo cross-sectional study investigating deep and superficial multifidus
activity during arm movements (Moseley et al. 2002). The former has limitations as an in vitro
study, and the investigation concerned only a single inter-vertebral level. The latter study
however, did not include the measurement of spinal movement at any level, and so any
conclusions made regarding the role of multifidus in terms of inter-segmental control remain
theoretical. Therefore, based on these studies, the suggestion that locally acting muscles are of
key importance to control at an inter-vertebral level is so far unfounded. Further in vivo
information is therefore required, and a capacity to collect concurrent inter-vertebral and multi-
muscle data would be of value.
40
2.3.6 Muscle deactivation and the flexion relaxation phenomenon (FRP)
The flexion relaxation phenomenon is a temporal deactivation pattern that has received a great
deal of attention in the literature (Dickey 2003; Kaigle 1998; Kippers and Parker 1984; Mathieu
and Fortin 2000; McGill and Kippers 1994; McGorry et al. 2001; McGorry and Lin 2012; Neblett
2003; O'sullivan et al. 2006c; Olson et al. 2004; Sarti et al. 2001; Sihvonen et al. 1991; Steventon
and Ng 1995). During sagittal flexion from a neutral standing position, the activity of the
eccentrically contracting paraspinal muscles will increase in order to match the increasing
moment arm of the head and torso. In the majority of healthy (back pain free) participants, it is
believed that this muscle activity will increase until a point is reached at which an adequate
extensor moment can be provided by the passive elements (Floyd and Silver 1955; Sihvonen et
al. 1991), by other synergistically acting muscles (Andersson et al. 1996), and passive resistance
from myoelectrically silent stretched muscles (Adams et al. 1980). This deactivation of
paraspinal muscles is thought to be invoked by a stretch inhibition reflex (Kippers and Parker
1984), and in a review of spinal muscle activity literature, Demoulin et al. (2007) reported that
sEMG in chronic LBP patients often shows an abolition of the FRP (Demoulin et al. 2007).
Persistent muscle activation may therefore be a mechanism that the neuromuscular control
system employs to protect diseased or damaged structures from reaching a point that would
cause pain or further damage. As such, it has also been suggested that assessment of the FRP
can be used as a clinical tool to assist in the diagnosis and treatment of LBP patients (Colloca and
Hinrichs 2005). This theorised protection mechanism (i.e. persistent muscle activation) is also
an indication that the function of paraspinal muscle activation in healthy individuals is primarily
to restrain inter-vertebral movement.
The FRP has been shown to occur less frequently at more cephalad muscle sites. For example
many studies analysing EMG recorded from sites lateral to T9 have shown that the FRP is absent
in a large proportion of participants (Dolan and Adams 1993; McGill and Kippers 1994; McGorry
et al. 2001; Toussaint 1995). A criticism of all of these studies is that they all measure gross
kinematics (i.e. lumbar ROM) well below the level of EMG recording (i.e. around T9 spinous
process), and so no insight into why this absence may arise (especially in terms of stretch reflex
inhibition) can be found within them. Whilst the FRP is well researched, the synergistic activation
timings (i.e onset) of paraspinals from different levels of the spine (i.e caudal to cephalid) are
not so well described in the literature. This is likely due to the fact that a degree of underlying
muscle activity acts as a postural control mechanism during standing (O'sullivan et al. 2002), and
so calculations of onset times can be difficult.

41
A general criticism of all FRP studies that use gross lumbar measurements and record from a
single electrode site, is that the results cannot account for inter-participant differences in terms
of individual inter-segmental kinematics within the lumbar spine. At this point little is known
about the capacity of muscles acting over multiple levels to control inter-vertebral movement
at specific levels throughout the lumbar spine, and it is likely that for this reason the majority of
studies choose an electrode location lateral to L3 (i.e. in the middle of the lumbar spine) as a site
most likely to provide the broadest representation of activity (Sarti et al. 2001; Steventon and
Ng 1995). The fact remains however that some individuals may bend differently to others (i.e.
predominance of upper or lower lumbars or of specific inter-vertebral levels), and such
movement patterns are likely to relate to the concurrent motor control patterns. To gain further
insight, an approach incorporating multiple muscles and at an inter-segmental level is required.
There is much debate over the order of inter-vertebral movement during forward bending. In a
small study (n = 8) using cineradiography, Kanayama et al. (1996) demonstrated that segmental
motion was sequential, beginning in the upper levels and exhibiting a phase lag (a delay in
movement) before the movement of the segment below (Kanayama et al. 1996). If this cascade
of movement is representative of a larger population, then it is logical to assume that upper
lumbar segments will complete rotation earlier than the lower levels and that motor control
patterns will mirror such changes. Indeed, McGorry et al. (2001) showed that muscle activity at
sites around L5 ended (i.e. FRP began) later than at sites around L2 and T12 (McGorry et al.
2001). In one of the very few studies to investigate FRP at an inter-segmental level, Kaigle et al.
(1998) concluded that muscle deactivation occurs concurrently with the completion of
segmental rotation (Kaigle et al. 1998), a finding that would appear to explain McGorry’s finding
if a cascading movement pattern is assumed. There is however much debate over how the spine
moves during bending and a great deal of natural heterogeneity is likely, therefore no consensus
has yet been reached.
There is also some confusion in the literature regarding the true definition of FRP. The majority
consider FRP to be a pre-defined level of relative myoelectrical silence (MS) (Kippers and Parker
1984; Sarti et al. 2001; Dickey et al. 2003; Descarreaux et al. 2010), whereas some relate the
phenomenon to the point at which deactivation begins (i.e. after which muscle activity declines
towards total shut-off), and refer to this as the critical point (CP) (Kaigle et al. 1998; Sarti et al.
2001; Steventon and Ng 1995). O’Sullivan et al. 2006 reviewed the common ways by which FRP
is determined. These included visual inspection (Kippers and Parker 1984), and a drop in the
MVIC by a specified percentage (McGill and Kippers 1994). The obvious advantage of using
42
deactivation onset times (CP) as a variable, is that a methodology involving full sagittal flexion is
not necessarily required. Kaigle et al. (1998) for example simply use the peak RMS EMG during
the flexion phase of the cycle as the point after which RMS EMG will be in decline, and is
therefore representative of the CP (Kaigle et al. 1998).
Kaigle et al’s study concludes that the onset of muscle deactivation occurs when segmental
rotation reaches 80% of its full rotation. Unfortunately due to the limited sample size, the multi-
level inter-vertebral data were combined and so no conclusions regarding specific levels can be
made. This is an important limitation, as combining the data effectively means that the study
was not insightful about inter-vertebral relationships. Indeed to combine the levels is perhaps a
major weakness, as the proportion of motion segment movement relative to total ROM is not
known. FRP studies focus on the point at which deactivation begins or completes, but they do
not provide any information about the relative size of deactivation. Although the most widely
held view is that lumbar paraspinal deactivation begins at a point when most sagittal rotation
has been completed, there are many gaps in the literature in terms of inter-segmental
information, the feedback mechanisms involved and the specific muscles that become
deactivated. Indeed the literature would also seem to suggest that as the paraspinal muscles
primarily act as extensors, their principal role is to restrict sagittal rotation during bending, which
would indicate that deactivation would have to occur before or concurrently with vertebral
motion. If this were the case, then the size of the deactivation could feasibly be linked to the
subsequent range of the movement. Bergmark’s (1989) theories concerning the distinct roles of
local and global muscles, provide a possible mechanism in terms of shared responsibility
between muscle groups (Bergmark 1989), but a lack of current multi-level, multi-muscle
information, warrants further investigation (McGill and Cholewicki 2001).
2.3.7 Selecting muscles for investigation
Due to methodological limitations (e.g. availability of specialist EMG equipment and expertise),
investigations into spinal control mechanisms are typically restricted in terms of the number of
muscles that can be analysed. Selecting the most appropriate muscles as a focus for study is not
straight forward however, as motor control of the lumbar spine is accomplished through the co-
activation of many different muscles, each with their own force capacities, geometries, and lines
of action (Crommert et al. 2011). The action of muscles is task specific, and so the decision to
investigate movement in the sagittal plane evidently affects the choice of recording sites. The
paraspinals are an obvious choice due to their established role in the control of forward bending,
and are included in the majority of studies investigating motor activity during this movement
43
(D’Hooge et al. 2013; Hashemirad et al. 2009; McGorry et al. 2001; Neblett et al. 2003; Reeves
et al. 2006, Van Dieen et al. 2003), however other groups also warrant consideration.
The TrA for example has received special attention in the literature, due to its perceived role in
spinal stabilisation (Barker et al. 2006; Crommert et al. 2011; Hodges et al. 2003). It has been
shown to have an influence over the control of sagittal rotation during flexion (Barker et al. 2006;
Hodges et al. 2003; Tesh 1987), with Barker et al. (2006) showing that it contributes to the size
of the neutral zone, by increasing neutral zone stiffness during flexion (Barker et al. 2006). It is
also believed to have a degree of direct control over trunk movements, being most active during
flexion period, but demonstrating no sharp changes between flexion and extension phases
(Cresswell et al. 1992).
Two of the aforementioned studies (Barker et al. 2006; Tesh 1987) were in vitro investigations,
and control mechanisms provided by other muscles and passive tissues, combined with the
effects of gravity and loading may well result in different findings in vivo. Hodges (2003) used
sedated domestic pigs to electrically stimulate the TrA and provided the first in vivo evidence
that TrA activity increases inter-vertebral stiffness (in combination with raised intra-abdominal
pressure and diaphragm activity) (Hodges et al. 2003), however it has been shown that during
full sagittal flexion intra-abdominal pressure is in fact zero (Hutton et al. 1979 the compressive
strength of lumbar vertebrae). Bartelink (1957) suggested that intra-abdominal pressure could
aid resistance to flexion moments via a “intra-abdominal balloon mechanism” (Bartelink 1957),
but this idea has received criticism as the pressure required would likely exceed the capabilities
of the abdominal muscles, be so high it would actually obstruct the aorta, and the required
contractions would be so strong, they would actually increase the flexion moment due to the
anatomical position of the muscles (Bogduk 1997). The potential for relationships between TrA
and lumbar spine kinematics should therefore be recognised, but both practically and in
consideration of more recent literature, its inclusion warrants careful deliberation.
Firstly, whilst being a muscle of potential relevance to lumbar spinal control, the TrA is the
deepest abdominal muscle, and its assessment typically requires the use of fine wire intra-
muscle electrodes (Crommert et al. 2011; Hodges 1998; Hodges and Richardson 1999). The
typical insertion of the electrodes is also through the anterolateral trunk, (guided into place by
real time ultrasound) creating additional time, ethical, training and equipment considerations.
Secondly, attention should also be given to the size and relative importance of the muscle. As
the smallest of all the abdominal wall muscles, its relative contribution to the stabilisation of the

44
spine compared to that of the paraspinals and the obliques is minimal (Kavcic et al. 2004). The
perceived importance of the muscle to researchers and clinicians alike has a foundation in
studies reporting a delay in its activation during perturbation tasks in low back pain groups
(Hodges et al. 1996), making it a potentially useful pathology marker and a target for
rehabilitation. However since Hodges small study (n = 15) was conducted, a larger investigation
(n = 96) using a similar methodology (i.e. rapid shoulder flexion) failed to demonstrate a
significant delay in either control or LBP populations (Gubler et al. 2010), raising questions over
conclusions regarding TrA’s importance in lumbar spine stabilisation. Indeed in another similar
study design, Silfies et al. (2009) reported on numerous trunk muscles and showed that the LBP
group as a whole had delays in the activation of multifidus, erector spinae and external oblique,
but not in the TrA. When subgrouping the LBP group into stable or non-stable (decided by an
orthopaedic spine surgeon using discography and degeneration criteria consistent with
segmental hypermobility), delays occurred most frequently in the non-stable group (Silfies et al.
2009). What these studies have in common is that they demonstrate that not all LBP patients
demonstrate a delay in muscle activation in response to perturbation, and that the specific
muscles showing a delay, may vary between individuals.
Perturbation methods such as exposure to rapid raising of limbs (Gubler et al. 2010; Hodges
1996; Silfies et al. 2009) or sudden loading (Cholewicki and Van Vliet 2002) have a valuable place
in stability research, but they are not ordinarily exercises performed in everyday life. The notion
that groups of individuals with and without low back pain both demonstrate varying degrees of
muscle activation delay and in a number of different muscles, raises questions over the
importance of their role (at least in isolation) in maintaining stability. Differences in muscle
activation patterns between individuals are also going be evident throughout contraction
periods, and it could be argued that muscle activity changes that are more readily observable,
and measurable during more common everyday tasks (such as forward bending) may also be of
importance, especially if the accompanying inter-vertebral kinematics can be adequately
recorded.
When there is discrepancy between the results of different study populations, there are two
main possibilities for differences. The first is that the methodology is different producing distinct
results (e.g. subtle differences in electrode application sites), and the second that there are
additional differences between the populations studied, so that individuals in both LBP and
control groups may respond uniquely as an individual, irrespective of their symptomatic group.
It is feasible therefore that for many individuals experiencing LBP, the pain mechanism may not
45
be the main influence on their biomechanical behaviour during tasks. To understand other
possible mechanisms better, it is first necessary to consider normal biomechanical interactions
in the absence of pain.
2.3.8 The other abdominal muscles
While the abdominal muscles are believed to be co-activated in extension, lateral flexion and
axial rotation movements (Thelen et al. 1995), they are not believed to have an important
function in terms of producing sagittal flexion from a standing position (Olson et al. 2006). In
fact the abdominal muscles have been shown to remain relatively inactive during the majority
of the flexion phase, and would not be expected to demonstrate significant activity during
flexion and return (Peach et al. 1998). Indeed Peach et al. (1998) demonstrated that Rectus
abdominus, and the external and internal obliques produce less than 10% MVC during the
flexion and return cycle (Peach et al. 1998). During a controlled bending task that does not reach
full flexion therefore, it is unlikely that these muscles would demonstrate any significant activity,
and subsequently would be less likely to be associated strongly with kinematic changes. Muscle
selection also depends on the methodology chosen. In studies that restrain the pelvis for
example, the recording of other potentially important controlling musculature such as the
gluteus and hamstring groups (Nelson-Wong and Callaghan 2010) becomes less desirable, as
their natural function is inhibited (see also section 9.11.3).
Section 4
2.4 Sagittal lumbar curvature and interactions within the passive
spinal system
2.4.1 Lordosis
The curvature of the lumbar spine is designed to help maintain a stable posture with minimal
energy cost, absorb spinal load and augment the efficiency of the surrounding musculature (Kim
et al. 2006). It has been suggested that the shape and orientation of the lumbar vertebrae are
intimately related, and can therefore influence the behaviour of those adjacent to them (Kim et
al. 2006), and that the intrinsic shape of the lumbar spine can physically change throughout
activities such as forward flexion (Pavlova et al. 2014).
In individuals with and without low back pain, there is much variation in the degree of lordotic
curvature, which would suggest that biomechanical behaviour will also vary in accordance.
Meakin and Aspden (2012) suggest that forces required to yield a follower load (i.e. “a
46
compressive load applied along a path that approximates the tangent to the curve of the
column”) are increased as the lordosis increases and becomes more evenly distributed (Meakin
and Aspden 2012), and is controlled by the local segmentally acting musculature (Patwardhan
et al. 1999). Patwardhan et al. also suggest that in a normal spine, this follower load protects
the spine from damaging fluctuations in curvature, and provides an increased capacity for load
bearing (Patwardhan et al. 1999). The degree of initial lordosis will therefore influence
subsequent biomechanical behaviours during forward bending, which will require different
control mechanisms to optimise the movement. It seems logical therefore that biomechanical
adaptation to variations in curvature may sometimes be sub-optimal and relate in some way to
LBP. In a study analysing radiological parameters including lumbar lordosis in LBP patients and
healthy controls, Tuzun et al. (1999) found no significant difference in lumbar lordosis between
the groups (Tuzun et al. 1999). This was in agreement with Sarikaya et al. 2007 who when
investigating the incidence of LBP in coal minors, similarly did not find any significant
relationship (Sarikaya et al. 2007). Current understanding of the potential mechanisms involved
is limited, and evidence for any direct association between LBP and lordosis remains inconclusive
and the ideal lordotic range unknown (Been and Kalichman 2014). Its implications for inter-
vertebral loading are intuitively powerful however, and its accessibility to measurement makes
it attractive for inclusion in biomechanical studies4.
2.4.2 Sagittal Balance
The normal spine has lordotic curves in the cervical and lumbar regions and a kyphotic thoracic
curve in between, allowing for the even distribution of forces throughout the spine (Roussouly
and Nnadi 2010). Disruption to this state of equilibrium is referred to as sagittal imbalance, and
has been widely linked with LBP. There are numerous causes of sagittal imbalance, however it
is commonly associated with a loss of lumbar lordosis (Glassman et al. 2005; Jackson 1994; Le
Huec et al. 2015), indeed, some believe that a loss of lordosis is the initial morphological change
that leads to the development of sagittal imbalance (Le Huec et al. 2011). Normal sagittal
alignment is typically taken as a plumb line descending from the centre of the C7 vertebral body
to the posterosuperior corner of S1 (Jackson et al. 1994). In a retrospective review of LBP
patients with adult spinal deformity , Glassman et al. (2005) found that a positive sagittal balance
(i.e. anterior deviation of the C7 plumb line) was directly associated the severity of symptoms,
4 Note: In order to gain an initial insight into the influence of lordosis on segmental movement and to support the
development of one of the study hypotheses (section 2.7.2.2), a preliminary study was conducted (Chapter 3, section
3.2).
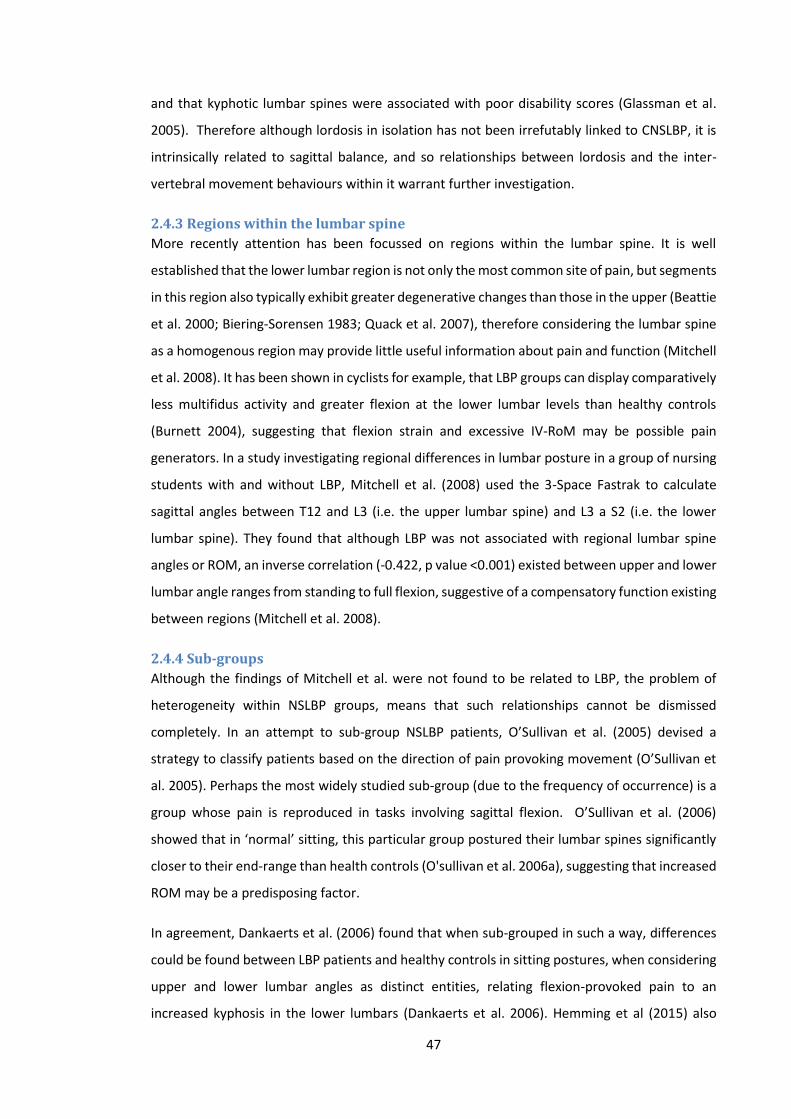
47
and that kyphotic lumbar spines were associated with poor disability scores (Glassman et al.
2005). Therefore although lordosis in isolation has not been irrefutably linked to CNSLBP, it is
intrinsically related to sagittal balance, and so relationships between lordosis and the inter-
vertebral movement behaviours within it warrant further investigation.
2.4.3 Regions within the lumbar spine
More recently attention has been focussed on regions within the lumbar spine. It is well
established that the lower lumbar region is not only the most common site of pain, but segments
in this region also typically exhibit greater degenerative changes than those in the upper (Beattie
et al. 2000; Biering-Sorensen 1983; Quack et al. 2007), therefore considering the lumbar spine
as a homogenous region may provide little useful information about pain and function (Mitchell
et al. 2008). It has been shown in cyclists for example, that LBP groups can display comparatively
less multifidus activity and greater flexion at the lower lumbar levels than healthy controls
(Burnett 2004), suggesting that flexion strain and excessive IV-RoM may be possible pain
generators. In a study investigating regional differences in lumbar posture in a group of nursing
students with and without LBP, Mitchell et al. (2008) used the 3-Space Fastrak to calculate
sagittal angles between T12 and L3 (i.e. the upper lumbar spine) and L3 a S2 (i.e. the lower
lumbar spine). They found that although LBP was not associated with regional lumbar spine
angles or ROM, an inverse correlation (-0.422, p value <0.001) existed between upper and lower
lumbar angle ranges from standing to full flexion, suggestive of a compensatory function existing
between regions (Mitchell et al. 2008).
2.4.4 Sub-groups
Although the findings of Mitchell et al. were not found to be related to LBP, the problem of
heterogeneity within NSLBP groups, means that such relationships cannot be dismissed
completely. In an attempt to sub-group NSLBP patients, O’Sullivan et al. (2005) devised a
strategy to classify patients based on the direction of pain provoking movement (O’Sullivan et
al. 2005). Perhaps the most widely studied sub-group (due to the frequency of occurrence) is a
group whose pain is reproduced in tasks involving sagittal flexion. O’Sullivan et al. (2006)
showed that in ‘normal’ sitting, this particular group postured their lumbar spines significantly
closer to their end-range than health controls (O'sullivan et al. 2006a), suggesting that increased
ROM may be a predisposing factor.
In agreement, Dankaerts et al. (2006) found that when sub-grouped in such a way, differences
could be found between LBP patients and healthy controls in sitting postures, when considering
upper and lower lumbar angles as distinct entities, relating flexion-provoked pain to an
increased kyphosis in the lower lumbars (Dankaerts et al. 2006). Hemming et al (2015) also
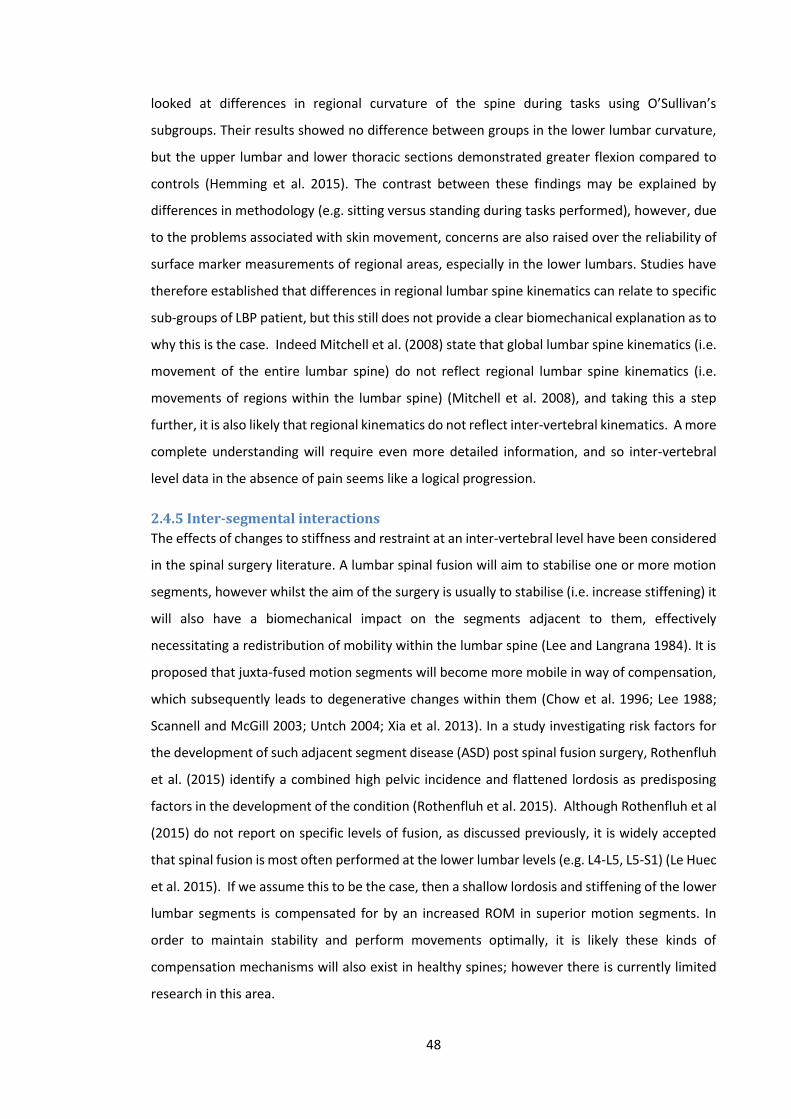
48
looked at differences in regional curvature of the spine during tasks using O’Sullivan’s
subgroups. Their results showed no difference between groups in the lower lumbar curvature,
but the upper lumbar and lower thoracic sections demonstrated greater flexion compared to
controls (Hemming et al. 2015). The contrast between these findings may be explained by
differences in methodology (e.g. sitting versus standing during tasks performed), however, due
to the problems associated with skin movement, concerns are also raised over the reliability of
surface marker measurements of regional areas, especially in the lower lumbars. Studies have
therefore established that differences in regional lumbar spine kinematics can relate to specific
sub-groups of LBP patient, but this still does not provide a clear biomechanical explanation as to
why this is the case. Indeed Mitchell et al. (2008) state that global lumbar spine kinematics (i.e.
movement of the entire lumbar spine) do not reflect regional lumbar spine kinematics (i.e.
movements of regions within the lumbar spine) (Mitchell et al. 2008), and taking this a step
further, it is also likely that regional kinematics do not reflect inter-vertebral kinematics. A more
complete understanding will require even more detailed information, and so inter-vertebral
level data in the absence of pain seems like a logical progression.
2.4.5 Inter-segmental interactions
The effects of changes to stiffness and restraint at an inter-vertebral level have been considered
in the spinal surgery literature. A lumbar spinal fusion will aim to stabilise one or more motion
segments, however whilst the aim of the surgery is usually to stabilise (i.e. increase stiffening) it
will also have a biomechanical impact on the segments adjacent to them, effectively
necessitating a redistribution of mobility within the lumbar spine (Lee and Langrana 1984). It is
proposed that juxta-fused motion segments will become more mobile in way of compensation,
which subsequently leads to degenerative changes within them (Chow et al. 1996; Lee 1988;
Scannell and McGill 2003; Untch 2004; Xia et al. 2013). In a study investigating risk factors for
the development of such adjacent segment disease (ASD) post spinal fusion surgery, Rothenfluh
et al. (2015) identify a combined high pelvic incidence and flattened lordosis as predisposing
factors in the development of the condition (Rothenfluh et al. 2015). Although Rothenfluh et al
(2015) do not report on specific levels of fusion, as discussed previously, it is widely accepted
that spinal fusion is most often performed at the lower lumbar levels (e.g. L4-L5, L5-S1) (Le Huec
et al. 2015). If we assume this to be the case, then a shallow lordosis and stiffening of the lower
lumbar segments is compensated for by an increased ROM in superior motion segments. In
order to maintain stability and perform movements optimally, it is likely these kinds of
compensation mechanisms will also exist in healthy spines; however there is currently limited
research in this area.
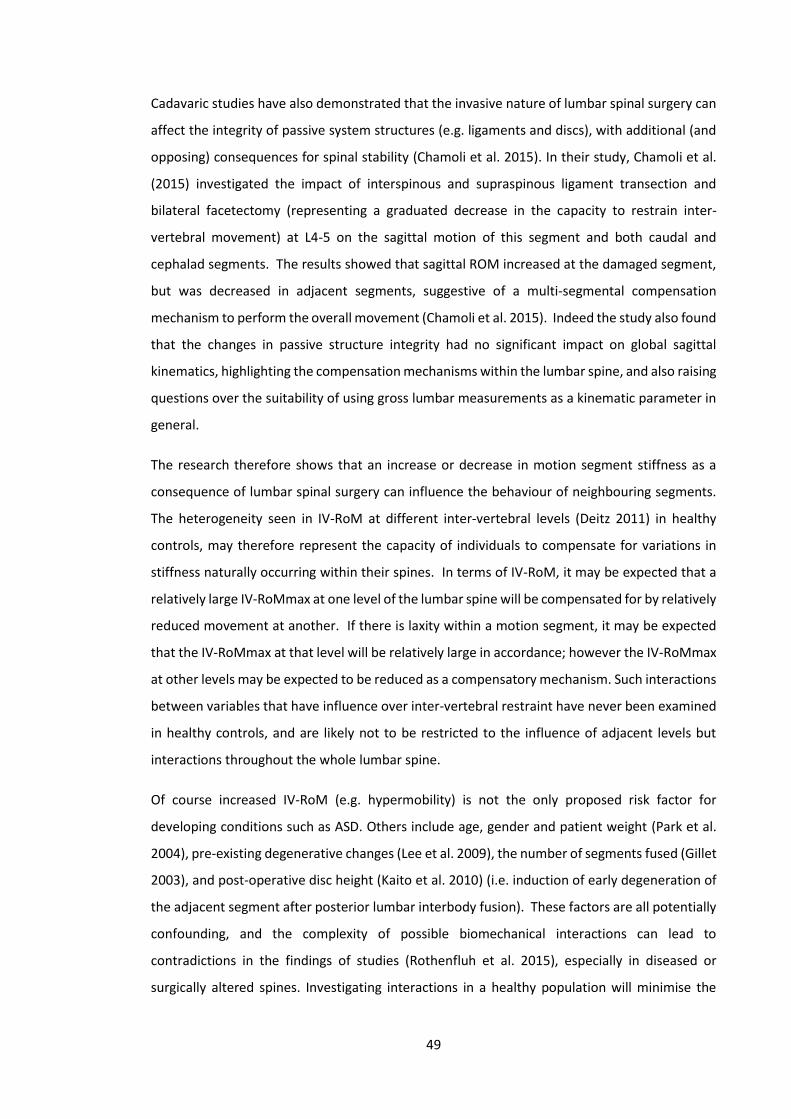
49
Cadavaric studies have also demonstrated that the invasive nature of lumbar spinal surgery can
affect the integrity of passive system structures (e.g. ligaments and discs), with additional (and
opposing) consequences for spinal stability (Chamoli et al. 2015). In their study, Chamoli et al.
(2015) investigated the impact of interspinous and supraspinous ligament transection and
bilateral facetectomy (representing a graduated decrease in the capacity to restrain inter-
vertebral movement) at L4-5 on the sagittal motion of this segment and both caudal and
cephalad segments. The results showed that sagittal ROM increased at the damaged segment,
but was decreased in adjacent segments, suggestive of a multi-segmental compensation
mechanism to perform the overall movement (Chamoli et al. 2015). Indeed the study also found
that the changes in passive structure integrity had no significant impact on global sagittal
kinematics, highlighting the compensation mechanisms within the lumbar spine, and also raising
questions over the suitability of using gross lumbar measurements as a kinematic parameter in
general.
The research therefore shows that an increase or decrease in motion segment stiffness as a
consequence of lumbar spinal surgery can influence the behaviour of neighbouring segments.
The heterogeneity seen in IV-RoM at different inter-vertebral levels (Deitz 2011) in healthy
controls, may therefore represent the capacity of individuals to compensate for variations in
stiffness naturally occurring within their spines. In terms of IV-RoM, it may be expected that a
relatively large IV-RoMmax at one level of the lumbar spine will be compensated for by relatively
reduced movement at another. If there is laxity within a motion segment, it may be expected
that the IV-RoMmax at that level will be relatively large in accordance; however the IV-RoMmax
at other levels may be expected to be reduced as a compensatory mechanism. Such interactions
between variables that have influence over inter-vertebral restraint have never been examined
in healthy controls, and are likely not to be restricted to the influence of adjacent levels but
interactions throughout the whole lumbar spine.
Of course increased IV-RoM (e.g. hypermobility) is not the only proposed risk factor for
developing conditions such as ASD. Others include age, gender and patient weight (Park et al.
2004), pre-existing degenerative changes (Lee et al. 2009), the number of segments fused (Gillet
2003), and post-operative disc height (Kaito et al. 2010) (i.e. induction of early degeneration of
the adjacent segment after posterior lumbar interbody fusion). These factors are all potentially
confounding, and the complexity of possible biomechanical interactions can lead to
contradictions in the findings of studies (Rothenfluh et al. 2015), especially in diseased or
surgically altered spines. Investigating interactions in a healthy population will minimise the

50
impact of many of these variables, and provide a clearer insight into underlying interactions with
IV-RoMmax.
2.4.6 Should researchers persist with the investigation of IV-RoM?
How best to determine abnormal motion or instability is a subject of continuing debate, with a
deficiency of evidence for methods that profess how to do so (Hicks et al. 2003; Steiger et al.
2014). However, intuitively, increases in IV-RoM and translation should relate to instability,
leading to attempts to determine abnormal limits in these parameters, typically with the use of
functional radiographs (Abbott et al. 2006; Boden 1990; Bridwell et al. 1993; Dvorak 1991; Hayes
1989; Wood 1994). Bridwell et al. (1993) for example defined instability as a difference of ≥3mm
translation or >10° angle difference between flexion and extension radiographs (Bridwell 1993).
The usefulness of such diagnostic criteria can be questioned however due to the significant
heterogeneity that exists in populations without LBP (Hayes 1989; Panjabi 1994), and have led
to recommendations to explore characteristics such as motor control and the neutral zone, as
alternative indicators of instability (Hicks et al. 2003).
Perhaps unsurprisingly therefore, the value of ranges of spinal motion as a means of
differentiating between the kinematics of healthy controls and LBP patients has also been
questioned (Lehman et al. 2004; McGregor et al. 1997), its limited capacity to differentiate, again
at least explained in part, by the large inter-and intra-subject variation found in such groups. A
large range of normal population values does however make ROM appealing in terms of the
investigation of normal lumbar biomechanics, as interactions and relationships are likely to be
clearer when there is greater variation in the outcome measure. If we use the example of ROM
and muscle activity during sagittal flexion, eccentric contraction of the paraspinals will provide
much of the extension moment required to control forward momentum. At an inter-vertebral
level, as ROM increases it is logical that concurrent muscle activity will decrease in order for the
inter-vertebral rotation to occur. The opposite may be the case for a decrease in ROM as muscle
activity increases in association with the relative lack of movement (Kuriyama and Ito 2005).
This knowledge regarding control mechanisms of particular muscle groups, compensation
mechanisms between muscles and the influence of activity at specific inter-vertebral levels is
lacking in normal populations.
ROM is frequently used as an outcome measure in biomechanical studies, and as a value for
direct comparison between groups. What is not typically investigated are numerous factors that
are associated with angular range, that themselves may be useful indicators of dysfunction. To
date, there have been relatively few attempts to investigate these links, which needs to be done

51
first in healthy controls. ROM’s perceived lack of objective use, has however lead researchers to
consider the use of other variables. Mieritz et al. (2012), suggests that measuring parameters of
higher order kinematic motion (e.g. acceleration and velocity) may be relevant (Mieritz et al.
2012). In order to do so, continuous measurement techniques are typically required, and so
technologies such fluoroscopy are increasingly being used, and so called higher order
parameters are being developed (Breen et al. 2015; Mellor et al. 2014; Teyhen et al. 2005; Wong
et al. 2006).
2.4.7 Neutral zone, initial attainment rate and spinal RoM
It has been proposed that total IV-ROM comprises of a neutral zone (Figure 19) and an elastic
zone (Panjabi 1992a; Panjabi 1992b). The neutral zone is purported as the flexible section of
total ROM, where there is minimal resistance to motion provided by the passive structures, and
the elastic zone is believed to be a section closer to the end of total ROM, where there is
significant resistance provided by the passive structures (Hicks et al. 2003). In terms of spinal
stability therefore, decreased motion segment stiffness may lead to relatively larger angular
ranges, and increased stiffness may result in reduced rotation required for given moments
(Hodges et al. 2013). This idea is supported by research that examines the effect of spinal
degeneration on spinal stiffness. Kirkaldy-Willis and Farfan (1982) divide the spectrum of lumbar
spinal degenerative change into three stages, (1) temporary dysfuntion, (2) unstable phase and
(3) stabilisation (Kirkaldy-Willis and Farfan 1982). In the unstable phase it is assumed that
damage to the structures of the passive system (i.e. discs, ligaments and facet capsules) will
result in a decrease in inter-vertebral stiffness. This is supported by the work of Panjabi et al.
(1984) who demonstrated that by purposely injuring discs, IV-RoM was increased for a given
moment (Panjabi et al. 1984), and by investigations into biological disc degeneration, that in
addition to increased IV-RoM, also demonstrated a decreased stiffness and an increased neutral
zone associated with the progression of degeneration (Gay et al. 2008; Muriuki et al. 2016).
However McGregor et al. (1997), analysing the relationship between degenerative disc disease
(DDD) and lumbar motion characteristics, found that LBP patients with signs of DDD, actually
showed a reduction in lumbar ROM of motion compared to controls (McGregor et al. 1997). This
study used regional measurements however, and the level of disc degeneration was not
described. It may be therefore that specific levels of hypermobility were compensated for by
increased restraint at other levels within the lumbar spine, or that the DDD was in a late stage
in the majority of participants (i.e. stabilisation stage (Kirwaldy-Willis and Farfan 1982)), which
would also explain such movement behaviours.

52
Figure 19: Panjabi’s Neutral Zone (NZ) adapted from Panjabi et al. (1994)
Panjabi showed that motion segments exhibit non-linear load displacement curves. This suggests that there is a
changing relationship between the applied load and the displacements produced.
It has been suggested that most likely an approximate motor control strategy (i.e. the exact
vertebral positions are not vitally important as the system can account for substantial margins)
of spinal equilibrium is used (Cholewicki and McGill 1996; Kingma et al. 2007), and therefore
decreased stiffness at a particular inter-vertebral joint will result in increased angular rotation
before equilibrium is reached (Hodges et al. 2013). In a degenerative spine this could lead to
disproportionate rotation and what could be termed instability, and in a healthy spine, this could
equally lead to relatively larger IV-RoMs at a particular segment (Mahato 2013), complicating
optimal spinal control strategies. Indeed approximate control may deal with homogenous
change (changes in stiffness throughout the lumbar spine) quite well, however heterogenous
changes (i.e. decreased stiffness at a particular level) may lead to further increases in range, as
bending moments would be focussed at that level (Hodges et al. 2013) (Figure 20). This relates
to the previously described theories regarding lordosis and follower load, as if the force vector
established by the follower load alters from its optimum course, then the local motor control
strategy will have to adapt to maintain stability (Preuss et al. 2005).

53
Figure 20: Loading of a crane (analogous to the loading of a spine) (adapted from Hodges et al. 2013)
Loading of a crane is analogous to lumbar sagittal bending. The black arrow represents loading as a result of gravity.
The red arrow represents the muscle activity force required to maintain equilibrium around the centre of rotation
(i.e. the circle). The cranes beam is loaded by a bending moment resulting in a bend to the right. If there is an area in
the beam with reduced stiffness, it will buckle (B). The bending moment of the structure will be greatest at the point
of buckling, and subsequently buckling will tend to increase further at this point.
Attainment rate, defined as the ratio of the gradient of the motion segment over 10° increments
(using the change in lordosis as the global ROM) (Teyhen et al. 2007), and initial attainment rate,
defined as ‘the ratio of the initial gradient of the segment over the first 10° of rotation’ (Mellor
2014) have been investigated in vivo, and are suggested to represent laxity within the motion
segment. Indeed, initial attainment rate has been shown in frontal plane movements to be
representative of the neutral zone (Breen et al. 2015). Although the calculation of initial
attainment rate has been used in recumbent protocols (Mellor 2014), it cannot be interpreted
the same way in a weight-bearing protocol due to the addition of muscle activity and load
bearing. Muscle activity will be present from the onset of flexion during weight-bearing
protocols, and the only previous study to describe attainment rate doing so, failed to consider
the likely influence of muscle activity on this variable in their discussion (Teyen et al. 2007).
Indeed, the neutral zone is a concept traditionally associated with the in vitro spine (i.e. with no
contribution of muscle control) where details of forces and loading can be identified.
Investigations into spinal movement during weight bearing tasks, may however consider initial
attainment rate as an indication of laxity in the presence of muscle activity. In terms of stability,
it can be considered a representation of damping at an inter-vertebral level. As such, an

54
increased initial attainment rate would relate to increased damping in both the active and
passive subsystems, which may have a positive influence on inter-vertebral stiffness. This is
counterintuitive however as discussed previously, a relatively large neutral zone is believed to
relate to instability and LBP. Some authors suggest that this can be managed through trunk
muscle training (Suni et al. 2006), which in itself suggests that damping has only a negligible
effect on the overall restraint properties of the spine. However, in their study, Suni et al. (2006)
used an RCT to examine the effectiveness of a training programme (designed to control the
lumbar neutral zone) on LBP outcomes, but they did not physically measure the neutral zone
(Suni et al. 2006). Their conclusions therefore are based on the theoretical impact of their
exercise, which feasibly could also influence factors such as IV-RoM. That said, the neutral zone
(Panjabi 2003) and attainment rate (Teyhen et al. 2007) have both been shown to be more
sensitive than IV-RoM as indicators of LBP, and the neutral zone is purported to be more
sensitive in terms of stability (O'sullivan 2000; Oxland 1992). At this time, there do not appear
to be any studies that have looked directly at how a change in such laxity parameters may
influence IV-ROM either amongst or between levels. If such interactions can be found, they
would provide new insight into the possible importance of both factors (i.e. laxity and IV-RoM).
A simple hypothesis would be that the greater the laxity the larger the IV-RoM at the associated
motion segment, with extremes compensated for by variations in laxity and IV-RoM elsewhere.
The true value of IV-ROM and its associations with other mechanical parameters has yet to be
fully examined, in order to measure ROM and other parameters associated with it, numerous
technologies can be used. Section 2.5 provides an overview of the techniques currently
available.
2.4.8 Force deformation
Forces acting on the spine generally derive from muscle contraction and gravity. According to
Newton’s third law, such forces will be opposed by equal and opposite forces, which in the case
of the spine, are provided by its active and passive elements. These loads and the resulting
displacements within the spine can be thought of as the stress (defined as force per unit area)
and strain (defined as the percentage change in length of a material relative to its original length)
of the system respectively (Chang et al. 2011). These force deformation characteristics are
however difficult to measure in vivo (Shirazi-Adl 1986), and therefore investigations typical rely
on either in vitro studies (Panjabi et al. 1989), or estimations from computer based modelling
(Shirazi-Adl et al. 2005; Wong et al. 2011; Zander et al. 2001). This means that studies
investigating spinal biomechanics in vivo are typically limited in terms of kinetic data, and will
tend to focus on kinematics. This type of information is still of value however, and initial
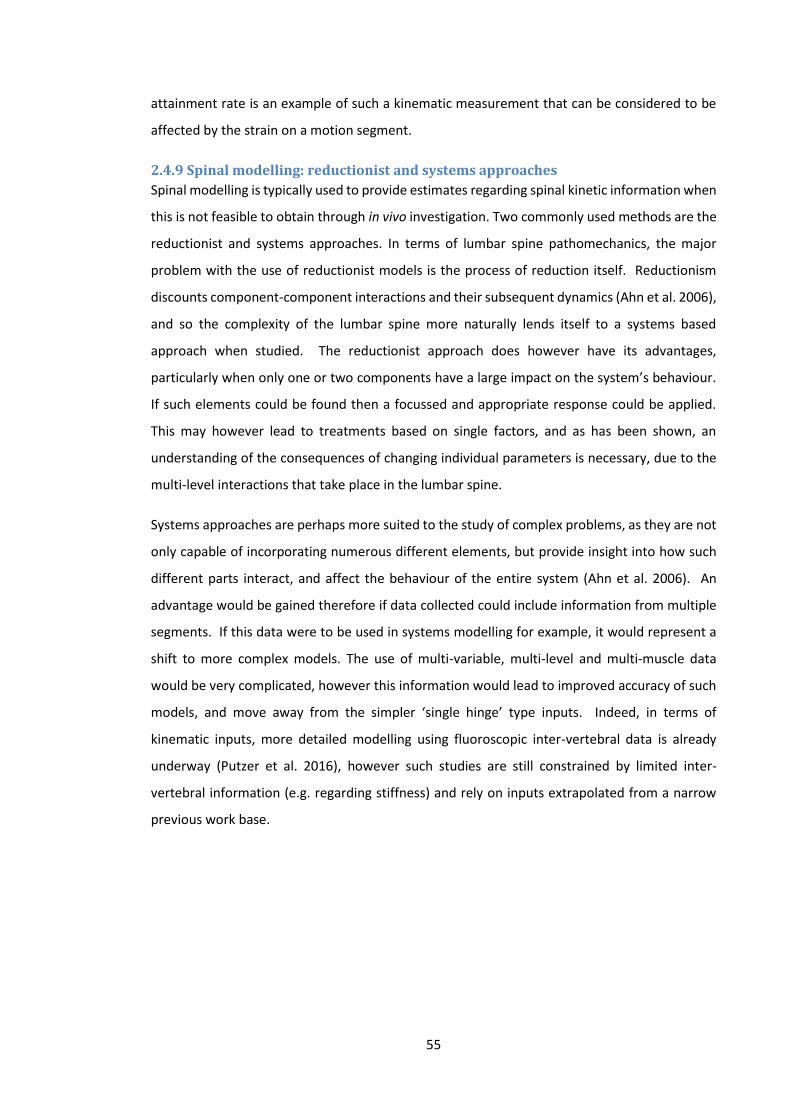
55
attainment rate is an example of such a kinematic measurement that can be considered to be
affected by the strain on a motion segment.
2.4.9 Spinal modelling: reductionist and systems approaches
Spinal modelling is typically used to provide estimates regarding spinal kinetic information when
this is not feasible to obtain through in vivo investigation. Two commonly used methods are the
reductionist and systems approaches. In terms of lumbar spine pathomechanics, the major
problem with the use of reductionist models is the process of reduction itself. Reductionism
discounts component-component interactions and their subsequent dynamics (Ahn et al. 2006),
and so the complexity of the lumbar spine more naturally lends itself to a systems based
approach when studied. The reductionist approach does however have its advantages,
particularly when only one or two components have a large impact on the system’s behaviour.
If such elements could be found then a focussed and appropriate response could be applied.
This may however lead to treatments based on single factors, and as has been shown, an
understanding of the consequences of changing individual parameters is necessary, due to the
multi-level interactions that take place in the lumbar spine.
Systems approaches are perhaps more suited to the study of complex problems, as they are not
only capable of incorporating numerous different elements, but provide insight into how such
different parts interact, and affect the behaviour of the entire system (Ahn et al. 2006). An
advantage would be gained therefore if data collected could include information from multiple
segments. If this data were to be used in systems modelling for example, it would represent a
shift to more complex models. The use of multi-variable, multi-level and multi-muscle data
would be very complicated, however this information would lead to improved accuracy of such
models, and move away from the simpler ‘single hinge’ type inputs. Indeed, in terms of
kinematic inputs, more detailed modelling using fluoroscopic inter-vertebral data is already
underway (Putzer et al. 2016), however such studies are still constrained by limited inter-
vertebral information (e.g. regarding stiffness) and rely on inputs extrapolated from a narrow
previous work base.
56
Section 5
2.5 Measuring lumbar spine kinematics and muscle activity
2.5.1 Surface measures
There are many different methods available to measure the kinematics of the lumbar spine. The
least invasive techniques usually involve apparatus applied to the skin surface, including the use
of flexible rulers (Stokes 1987), goniometers (Boocock 1994; Nattrass 1999) and reflective
markers with photography (Straker et al. 2009). Technological advances have seen the
introduction of motion analysis systems that enable the assessment of all three planes such as
Fastrak (Abdoli-E and Stevenson 2008; Burnett 2004), Flock of birds (Bull and McGregor 2000;
Butler et al. 2009; Hsu et al. 2008), Optotrak (Nelson-Wong et al. 2012; O'shaughnessy et al.
2013), and multi-camera systems (Buchecker et al. 2013; Preuss and Fung 2008). These along
with novel methods including strain gauges (O'sullivan et al. 2012; Van Hoof et al. 2012) and
inertial sensors (Williams et al. 2013a), all measure movement over a region of the spine, but
have limitations when investigating segmental inter-vertebral motion. Even low-tech clinical
measurements such as Schober’s test can be used to assess lumbar range of motion (Steele et
al. 2013), but their correlation has been shown to be poor when compared to radiographical
analysis (Rezvani et al. 2012).
2.5.2 Inter-vertebral measures
An ability to measure inter-vertebral motion provides an essential means of furthering our
understanding of spinal biomechanics both in terms of IV-RoM but also higher order kinematic
variables such as attainment rate (Lehman et al. 2004). Historically, the more accurate the
required measurement, the more invasive the technique. The use of radiographs in healthy
participants has been approved in the past (Ogston 1986b), but are limited due to the associated
radiation dose exposure, and typically only provide data from particular sections of the motion
sequence such as neutral, full flexion or full extension (Pieper et al. 2013). Uni-planar continuous
radiographic techniques have also been used (Ahmadi et al. 2009; Harada 2000; Kanayama 1998;
Okawa 1998; Wong 2006), but are typically limited by the same issue. Bi-planar techniques have
been used to retrieve kinematic data from all 3 planes of movement (Appendix B) (Li 2009;
Passias 2011; Pearcy 1984a), and whilst early techniques were associated with high
measurement error, a technique called Roentgen Stereophotogrammetry that required the
insertion of tiny metal spheres into the vertebrae, reported precision of <3° in all planes (Olsson
1977). Recent advances using dynamic stereo x-ray imaging are showing considerable promise
(Aiyangar et al. 2014; Anderst et al. 2008; Wu et al. 2014), especially when investigating planes
of motion where significant out of plane or coupled movements are anticipated. The highly
57
invasive surgical insertion of intraosseous pins into a participant’s spinous processes (Kaigle
1998; Steffen 1997) whilst providing a solution, is ethically questionable and never likely to be
widely incorporated. Computed tomography (CT) and magnetic resonance imaging (MRI) have
also been used to measure lumbar spinal kinematics (McGregor et al. 2002; Ochia 2006; Xia
2009). CT scans can only currently be taken in the recumbent position and require an even
greater radiation dose than traditional radiographic techniques. They therefore have limited
use in terms of measuring large sagittal or coronal plane movements, however they are
particularly useful when detailed information about axial rotation is required (Ochia 2006;
Rogers 2005; Singer 1989; Zuhlke 2009). MRI has also traditionally been limited to recumbent
imaging and is therefore well suited to axial plane measurements, however the increasing
availability of open MRI scanners means that weight-bearing studies are becoming more
common in other planes (Beneck et al. 2005; McGregor et al. 2002; Rodriguez-Soto et al. 2013).
These studies are all still limited in terms of cost however and are still too slow to provide
continuous images, and therefore are also restricted to pre-determined sections of a motion
sequence or movement. Advanced MRI techniques have demonstrated that image acquisition
times can be reduced to fractions of a second (Uecker 2010), but these are unlikely to be widely
available in the foreseeable future. The use of ultrasound as a measurement tool has been
investigated (Chleboun et al. 2012), but whilst providing a relatively inexpensive and widely
available alternative, it again does not provide continuous data throughout the motion
sequence.
Quantitative fluoroscopy (QF) is a technique using x-rays to obtain continuous moving images,
and is therefore well suited to the investigation of spinal motion (Du Rose and Breen 2016a; Du
Rose and Breen 2016b; Harvey et al. 2015; Mellor 2009; Mellor F.E. et al. 2014; Teyhen 2005;
Teyhen et al. 2007; Wong 2006). Fluoroscopy has traditionally been hindered by high radiation
levels. Advances in image intensification, digital magnification, automatic dose control and
pulsing of the beam in synchrony with the camera, have however all contributed to reducing
radiation dose levels to the extent that a complete motion sequence of the lumbar spine now
requires less radiation than a single traditional radiograph (Mellor et al. 2014). Improvements in
QF have also been made by addressing common sources of error such as subject positioning,
the digitisation process, image distortion and movement coupling. The standardisation of many
of these elements has been outlined (Breen A.C. et al. 2012).

58
2.5.3 Strengths and weaknesses of lumbar kinematic measures
Each technique has its own limitations, be it cost, invasiveness, complexity of methodology or
analysis, not providing continuous data, or providing global and not segmental information. In
order to improve understanding of spinal biomechanics at a segmental level, numerous methods
are currently used as research tools. The array of techniques causes a problem when comparing
values between them. This problem was identified by Mannion (1999), who suggested that a
comparison of values with a ‘gold standard’ is required in order to see which device best reflects
true vertebral movement (Mannion 1999a). Whilst there are currently questions regarding how
well QF represents true movement (as the protocol restrains the pelvis), it is feasible that this
modality could meet this requirement. QF is relatively low cost, low radiation dose and provides
an ability to analyse continual inter-vertebral movement, and therefore able to extract
information from the mid-range (Taghipour-Darzi et al. 2012), the end range, and higher order
variables (Lehman 2004), satisfying the requirements outlines previously. QF has never been
used concurrently with sEMG before, and the combination of the two would provide unique
insights into the relationships between the lumbar spine’s kinematics and muscular activity.
2.5.4 Agreement, reliability and accuracy of spinal movement measurements
The development of computer assisted inter-vertebral measurement has led to the
improvement in reliability of such measurements when compared to manual techniques
(Pearson et al. 2011). However, although many modern kinematic (and EMG for that matter)
measurements do now utilise computer software programmes, the processing cannot be
considered error free, especially when there are human controlled inputs. It is therefore
important to assess the agreement and reliability of such measurements, terms which have
historically, and incorrectly, been used interchangeably (De Vet 2006). This confusion was
addressed by Kottner and Streiner (2011) who defined agreement as whether measurements
are identical or similar, or the degree to which they differ, and reliability as the ratio of variability
between measurements in the same subjects, to the total variability of all measurements in the
sample (Kottner and Streiner 2011). Reliability coefficients give an indication of how well
individuals can be differentiated from each other, while incorporating the measurement error
in their calculation.
RoM is a commonly investigated variable and has been tested for its reliability when measured
by many different modalities. Mieritz et al. (2014) for example examined the reliability of
regional lumbar sagittal movements using the CA6000 spine motion analyser (i.e. skin surface
measurements) and despite finding reasonable reliability (ICC 1,1 = 0.51-0.70), the limits of
agreement (LOA) were considered too large for the comparison of individuals (Mieritz et al.
59
2014). The problem with using instruments attached to the skin is that variation may arise from
the measurement device itself, the participant, the examiner and the interface between the
instrument and the participant (Mayer 1997). Despite this, the majority of studies report good
accuracy and precision (McGregor et al. 1995; Schuit 1997; Troke 1996), however there are also
examples where poor accuracy has been reported (Christensen 1999). Schuit et al (1997),
demonstrated that intra-examiner reliability of regional lumbar flexion measurements was
excellent (ICC 2,1 = 0.875-0.966), and despite agreement being poor (SEM = 3.7°) concluded that
the measurement method had acceptable validity when compared to a radiographic technique
(Schuit 1997). Such large errors may be acceptable when comparing regional measurements,
but they are not be adequate when investigating inter-vertebral ranges. Indeed, whilst it has
been suggested that the use of skin surface markers for inter-vertebral measurements provide
a reasonable reflection of lumbar inter-vertebral motion (Gracovetsky 1995), others disagree
and suggest that such measurements are significantly different to methods that can measure
internal vertebral kinematics (Zhang 2003). Indeed, it has been shown that in terms of inter-
vertebral measurements, skin surface devices have comparably lower reliability (Mannion et al.
2004).
Fluoroscopy has been demonstrated as an accurate and reliable technique to measure
continuous lumbar inter-vertebral motion (i.e. IV-RoM) (Ahmadi et al. 2009; Breen et al. 2006;
Mellor F.E. et al. 2014; Teyhen 2005; Yeager et al. 2014). There are however areas where
reliability has yet to be shown. For example, studies that have previously investigated
agreement and reliability of these measurements have either pooled inter-segmental levels
(Yeager et al. 2014), have not included all the lumbar inter-segmental levels (Mellor F.E. et al.
2014; Teyhen 2005), have not used continuous data to find the IV-RoMmax (Ahmadi et al. 2009;
Teyhen 2005) or have not conducted inter-examiner studies (Ahmadi et al. 2009; Teyhen 2005).
This information is also lacking for mid-range variables such as attainment rate. Indeed, the
agreement and reliability of lumbar weight-bearing initial attainment rate measurements has
never been investigated. Initial attainment rate agreement and reliability has been investigated
previously in the cervical spine (Branney 2014), and in the recumbent lumbar spine (Mellor
2009), but never at the level of L5-S1.
60
2.5.5 Electromyography (EMG)
"Electromyography (EMG) is a technique concerned with the development, recording and
analysis of myoelectric signals. Myoelectric signals are formed by physiological variations in the
state of muscle fibre membranes." (Basmajian and De Luca 1985)
The degree of electrical excitation is believed to be highly correlated with the size of the muscle
contraction (Merletti et al. 1992), and can therefore be used to interpret muscle activity and
fatigue. As such electromyography can be used to investigate the role of active tissues in lumbar
function, through examination of the various myoelectric signal components. These can be
separated into amplitude (Butler et al. 2009; De Nooij et al. 2009; Van Dieen 2003), frequency
(Abboud et al. 2016; Lariviere et al. 2001; Mannion and Dolan 1994) and timing related
parameters (Hodges and Bui 1996; Kuriki et al. 2011; Williams et al. 2013b).
2.5.5.1 EMG amplitude
The EMG signal is most commonly analysed using amplitude parameters (Kollmitzer et al. 1999).
Due to the bipolar nature of raw EMG signal data, raw EMG has a mean value of zero, and in
order for the amplitude of a signal to be interpreted, a process of rectification is required that
converts all negative amplitudes to positive. This is a precondition to EMG amplitude parameter
calculations, which include mean, peak, area and slope. As described above, EMG amplitude
relates to the force a muscle generates and therefore provides a quantifiable insight into muscle
function. Of the amplitude parameters, the mean amplitude value is widely regarded as the
most useful, as it is less sensitive to duration differences in analysis periods. It also provides the
most reliable reflection of muscle activity for a given task, and is recommended for use when
comparisons between individuals are required (Konrad 2006).
When a muscle activates, motor unit action potentials will superimpose in an arbitrary manner,
and so no two bursts of EMG will ever be the same. As a solution to this problem, smoothing
algorithms that outline the mean trend of signal development can be applied (Konrad 2006),
and of all the options available, root mean square (RMS) EMG has been demonstrated to be the
most reliable (Basmajian and De Luca 1985).
2.5.5.2 EMG signal frequency
Modern EMG analysis software also makes it possible to analyse the frequency content of a
signal (Lariviere et al. 2000). Fast fourier transformations (FFT) can be used to analyse the
frequency content of EMG signals (Konrad 2006), changes in the distribution of which can be
61
helpful when evaluating the level of fatigue developed during muscle contraction (Abboud et al.
2016; Mannion and Dolan 1994). Generally speaking, a fatiguing muscle will correlate with EMG
signal recordings that have shifted towards lower frequencies (Merletti et al. 1992). The most
commonly used frequency parameters are known as the mean and median frequency, which
represent the mathematical mean of the spectrum curve and the division of Total Power (the
integral under the spectrum curve) area into two uniform sections (Konrad 2006).
2.5.5.3 Temporal activation patterns: EMG signal onset and offset
It is also possible to determine temporal parameters such as the point of signal onset and offset
(Hodges and Bui 1996). There is much debate over how best to determine precise muscle
activation onset and offset times, but it can be important if dealing with narrow time differences
when comparing muscles, subjects or subject groups. In the majority of early studies evaluating
temporal parameters of EMG there was usually no description of how EMG onset/offset was
determined, and when the method was described it was usually performed by a visual
evaluation of the EMG trace with no mention of the criteria by which this decision was made
(Hodges and Bui 1996). Typically a threshold value will be determined e.g. 1, 2, or 3, standard
deviations above the mean baseline activity, or 15-20% of the peak EMG, often associated with
a minimum time duration during which the signal must remain over the threshold (Hug 2011).
Leinonen et al. (2000) for example defined onset as the minimum of a +10µv deviation from the
baseline (Leinonen et al. 2000). Another simple method was demonstrated by Li and Caldwell
(1998) who used a threshold of 25% of maximum amplitude during a cycle to indicate muscle
onset (Li and Caldwell 1998). The ‘correct’ threshold to be employed however remains an area
of contention amongst investigators (Hodges and Bui 1996). It should be acknowledged however
that with a sufficiently clean sEMG signal, traditional approaches can achieve comparable results
to the more complex (Zhang and Zhou 2012). In such an environment it is possible to determine
the onset and termination of muscle activity by using the on/off methodology by visual
interpretation (Sanchez-Zuriaga et al. 2010; Worsley et al. 2013). In terms of muscle activation
during flexion from standing, detecting paraspinal muscle activity onset can be problematic due
to the background firing of these muscles during neutral standing. Signal offset can be classed
as complete myoelectrical silence (MS) using a method as described previously, or the point at
which deactivation begins (i.e. EMG amplitude peak), described in the literature as critical point
(CP) (Kaigle 1998; Sarti et al. 2001; Steventon and Ng 1995).
2.5.6 EMG methodology design considerations Methodological differences between studies that investigate both spinal kinematics and muscle
activity can make it difficult to compare and interpret their findings. Whilst QF protocols have
62
already been subject to extensive standardisation (Breen A.C. et al. 2012), the wider and less
regulated use of sEMG makes this difficult, and so consideration is required in terms of the
protocols’s sEMG components. The sEMG signal can be influenced by various decisions relating
to electrode placement, normalisation techniques, and signal processing. The following section
reviews the key sEMG considerations in relation to the development of an appropriate data
collection protocol.
2.5.6.1 Surface or fine wire intra-muscular electrodes?
EMG can be recorded using surface electrodes or intra-muscular needles; the former is a non-
invasive technique referred to as surface electromyography (sEMG), and is typically used for
analysis of more superficially located muscles. The latter involves the placement of fine wire
needles directly into the muscle, and therefore suited for investigations of the deeper
musculature. There are advantages and disadvantages associated with both electrode types. In
terms of reliability, studies that have compared EMG data collected simultaneously with fine
wire and surface electrodes have demonstrated greater reliability with the surface electrodes
(Soderberg 2000). This finding supports Basmajian and De Luca (1985), who showed that intra-
subject variability of the signal was greater when detected with intra-muscular, rather than
surface electrodes (Basmajian and De Luca 1985). Poor repeatability (i.e. inter-session
reliability) of fine wire EMG is often highlighted as a methodolological weakness by manuscript
reviewers (Chapman et al. 2010), a problem likely due to difficulties associated with re-inserting
wire electrodes into precisely the same position on re-examination. Considering an sEMG signal
is more likely to be contaminated by activity from nearby muscles (Solomonow et al. 1994) than
fine wire needles, intuitively sEMG recordings may be expected to be less reliable, however this
is not apparent.
The use of fine wire electrodes is perhaps most appropriate therefore, when there is a
requirement to measure EMG signals from deeper muscle fibres. There is a belief for example
that the deep fibres of multifidus have a different functional role to the more superficial
multifidus fibres and the erector spinae, with the former more involved in localised stabilisation
and the latter as extensors or rotators of the lumbar spine (Richardson and Jull 1995), and
considering such different roles the investigation of both superficial and deep multifidus (Tsao
et al. 2010) would assist in any exploration of multifidus function. There is evidence to suggest
however; that superficial multifidus and the erector spinae can also play an important function
is stabilisation (Macdonald et al. 2006), and it has been suggested that the activation of
superficial multifidus may be more closely aligned to that of the lumbar longissimus than of the
63
deep multifidus (Stokes et al. 2003). It could be argued therefore that investigations into
multifidus activity would benefit from the use of both sEMG and fine wire needle techniques
(Macdonald et al. 2006).
Despite this, there are cases in the literature where multifidus activity is measured using surface
electrodes (Hodges 1996; Kim et al. 2015), those that use fine wires to record specifically from
the deeper fibres (D'hooge et al. 2013; Macdonald 2009), and those that do both (Tsao et al.
2010). Another consideration with fine wire needling is their association with induced pain
(Jonsson et al. 1968; Walker et al. 2001), and as pain is known to influence muscle activity
patterns (Geisser et al. 2004) and spinal movement (Thomas and France 2008), this should be
avoided when possible during the collection of normative data.
The choice between surface electrodes and fine wire needles therefore, involves consideration
of requirements to measure muscle activity from deep or superficial muscles, the availability of
technology and the expertise to use them, whether experimental repetitions involve the
removal and replacement of the electrodes, and if the avoidance of pain is an absolute necessity.
Fine wire electrodes would also require more stringent ethical approval and the use of imaging
technology to help accurately guide electrode placement, which comes with additional costs in
terms of time, funding and expertise.
2.5.6.2 Electrode positioning
The following discussion refers to sEMG unless stated. To help improve the standardisation of
sEMG measurements, guidelines for the positioning of electrodes based on palpation of bony
landmarks have been developed (Hermens et al. 1999). Hermens and Vollenbroek-Hutten
(2004) discuss the high sensitivity of RMS sEMG to electrode placements, and suggest that whilst
normalisation (see section 2.5.6.7) reduces sensitivity, it does not decrease variability to such an
extent that RMS sEMG could be judged reliable (Hermens and Vollenbroek-Hutten 2004). A
review by Geisser et al (2005) however suggests that EMG amplitude parameters can be used
to compare individuals, but their characteristically large intra and inter-subject variability in
amplitude behaviour should be considered (Geisser et al. 2005), a characteristic that has
traditionally made such comparisons difficult (De Nooij et al. 2009; Lehman and Mcgill 1999).
Indeed, the positioning of sEMG electrodes can contribute significantly to variations in the
recorded signal (De Nooij et al. 2009), and therefore electrode application accuracy is an
important aspect of study design.
The position of electrodes relative to the muscles’ innervation zones (IZ) is also a consideration.
The further the electrode from the IZ, the longer the natural delay between onset of actual

64
myoelectrical activity and the onset of the recorded EMG (Hug 2011). According to Farina and
Merletti (2004) the average conduction velocity of a muscle action potential is approximately
4m/s, therefore if the electrode were positioned 4cm away from the IZ there would be a 10ms
delay in the detection of EMG onset (Farina and Merletti 2004). When using temporal muscle
activation variables the consistency of electrode positioning is therefore particularly important,
and to improve the reproducibility of electrode placement Sanchez-Zuriaga et al (2010) utilised
an ‘anatomic map’ documenting the distance of various markings from the 7th cervical
vertebrae with the subject stood upright (Sanchez-Zuriaga et al. 2010).
It has been suggested that a general rule of good practice should be to avoid placing electrodes
over innervation zones (IZ’s), and that inter electrode distances should be small with respect to
IZ to tendon distance, however Shiraishi et al. (1995) concluded that it is not even possible to
detect the location of the innervation zones for the ES muscles (Shiraishi et al. 1995). There
appears therefore to be no current consensus regarding the optimal location of electrodes, and
a recent review concluded that further research is still required (Swinnen et al. 2012).
The SENIAM project (Surface ElectroMyoGraphy for the Non-Invasive Assessment of Muscles)
was an attempt to standardise EMG methodology within the European Union, and
recommended specific electrode positions for numerous lumbar muscles (Hermens et al. 1999).
These guidelines are currently the gold standard, and so the electrode positions used in this
study, are based primarily on SENIAM recommendations.
2.5.6.3 Electrode positioning for the paraspinal muscles
The SENIAM guidelines for electrode positioning to record from the superficial multifidus (LMU)
state that “electrodes need to be placed on and aligned with a line from caudal tip posterior
spina iliaca superior to the interspace between L1 and L2 interspace at the level of L5 spinous
process (i.e. about 2 - 3 cm from the midline)” in alignment with the multifidus muscle fibres
(Hermens et al. 1999) and in accordance with (Kim et al. 2015). In terms of longissimus, the
literature suggests that due to intra-subject variation and minimal research in the field, there is
no consensus on the alignment of the longissimus muscle fibres (Bogduk 1980; De Foa et al.
1989; Macintosh et al. 1993), and that fibre direction changes during forward bending (McGill
2000). Despite this, the SENIAM guidelines state that for longissimus “the electrodes need to be
placed at 2 fingers width lateral from the spinous process of L1” and should be orientated
vertically, parallel to the spine (Hermens et al. 1999).
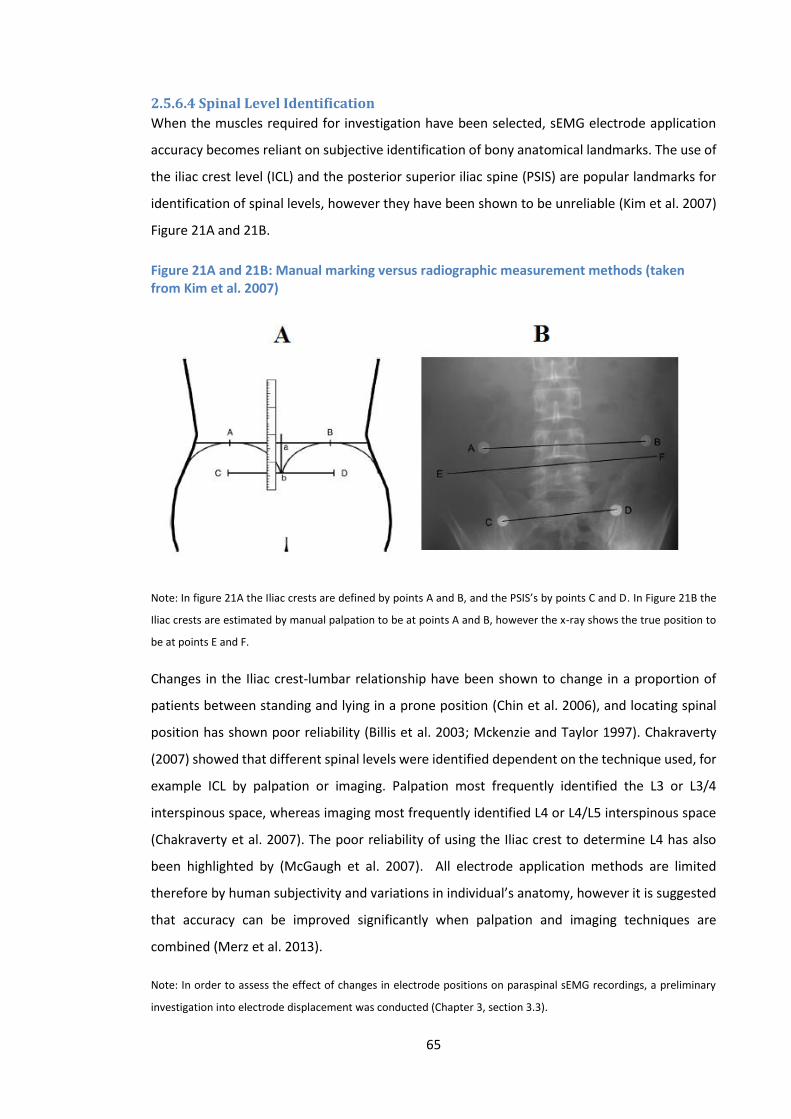
65
2.5.6.4 Spinal Level Identification
When the muscles required for investigation have been selected, sEMG electrode application
accuracy becomes reliant on subjective identification of bony anatomical landmarks. The use of
the iliac crest level (ICL) and the posterior superior iliac spine (PSIS) are popular landmarks for
identification of spinal levels, however they have been shown to be unreliable (Kim et al. 2007)
Figure 21A and 21B.
Figure 21A and 21B: Manual marking versus radiographic measurement methods (taken from Kim et al. 2007)
Note: In figure 21A the Iliac crests are defined by points A and B, and the PSIS’s by points C and D. In Figure 21B the
Iliac crests are estimated by manual palpation to be at points A and B, however the x-ray shows the true position to
be at points E and F.
Changes in the Iliac crest-lumbar relationship have been shown to change in a proportion of
patients between standing and lying in a prone position (Chin et al. 2006), and locating spinal
position has shown poor reliability (Billis et al. 2003; Mckenzie and Taylor 1997). Chakraverty
(2007) showed that different spinal levels were identified dependent on the technique used, for
example ICL by palpation or imaging. Palpation most frequently identified the L3 or L3/4
interspinous space, whereas imaging most frequently identified L4 or L4/L5 interspinous space
(Chakraverty et al. 2007). The poor reliability of using the Iliac crest to determine L4 has also
been highlighted by (McGaugh et al. 2007). All electrode application methods are limited
therefore by human subjectivity and variations in individual’s anatomy, however it is suggested
that accuracy can be improved significantly when palpation and imaging techniques are
combined (Merz et al. 2013).
Note: In order to assess the effect of changes in electrode positions on paraspinal sEMG recordings, a preliminary
investigation into electrode displacement was conducted (Chapter 3, section 3.3).
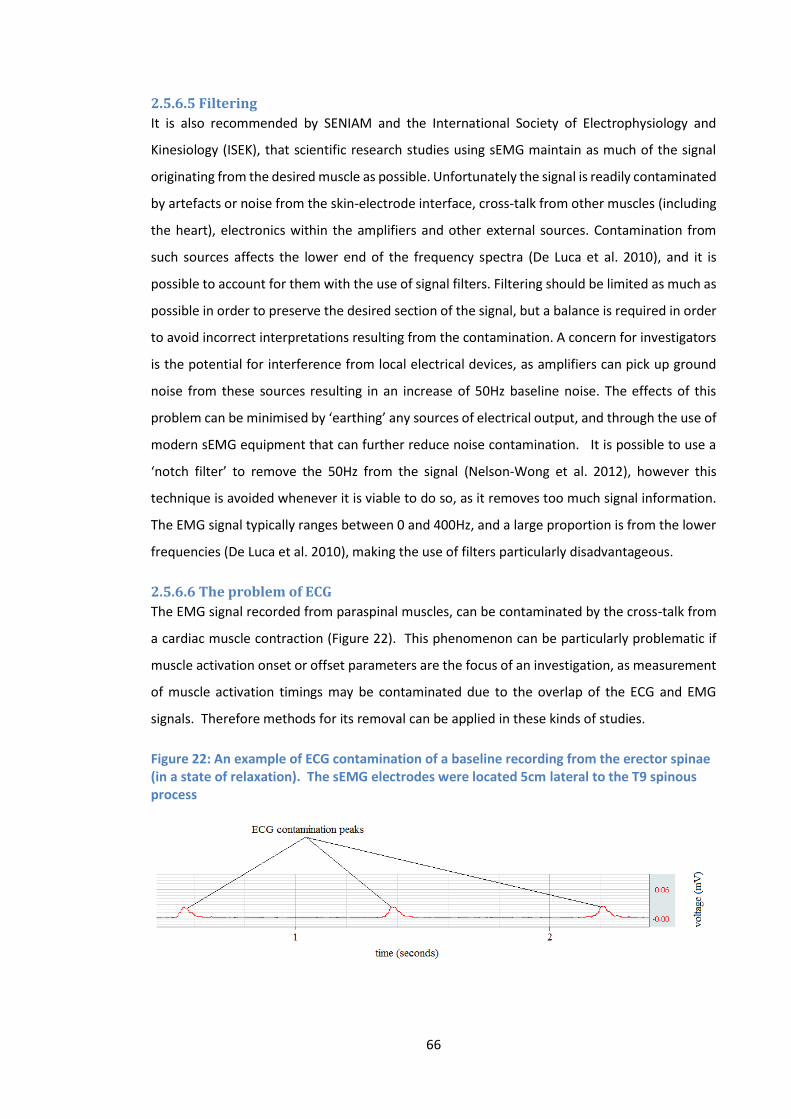
66
2.5.6.5 Filtering
It is also recommended by SENIAM and the International Society of Electrophysiology and
Kinesiology (ISEK), that scientific research studies using sEMG maintain as much of the signal
originating from the desired muscle as possible. Unfortunately the signal is readily contaminated
by artefacts or noise from the skin-electrode interface, cross-talk from other muscles (including
the heart), electronics within the amplifiers and other external sources. Contamination from
such sources affects the lower end of the frequency spectra (De Luca et al. 2010), and it is
possible to account for them with the use of signal filters. Filtering should be limited as much as
possible in order to preserve the desired section of the signal, but a balance is required in order
to avoid incorrect interpretations resulting from the contamination. A concern for investigators
is the potential for interference from local electrical devices, as amplifiers can pick up ground
noise from these sources resulting in an increase of 50Hz baseline noise. The effects of this
problem can be minimised by ‘earthing’ any sources of electrical output, and through the use of
modern sEMG equipment that can further reduce noise contamination. It is possible to use a
‘notch filter’ to remove the 50Hz from the signal (Nelson-Wong et al. 2012), however this
technique is avoided whenever it is viable to do so, as it removes too much signal information.
The EMG signal typically ranges between 0 and 400Hz, and a large proportion is from the lower
frequencies (De Luca et al. 2010), making the use of filters particularly disadvantageous.
2.5.6.6 The problem of ECG
The EMG signal recorded from paraspinal muscles, can be contaminated by the cross-talk from
a cardiac muscle contraction (Figure 22). This phenomenon can be particularly problematic if
muscle activation onset or offset parameters are the focus of an investigation, as measurement
of muscle activation timings may be contaminated due to the overlap of the ECG and EMG
signals. Therefore methods for its removal can be applied in these kinds of studies.
Figure 22: An example of ECG contamination of a baseline recording from the erector spinae (in a state of relaxation). The sEMG electrodes were located 5cm lateral to the T9 spinous process
67
In an investigation into the effect of ECG contamination on the sEMG assessment of back
muscles, Hu (2009) used an Independent Component Analysis (ICA) technique to remove the
ECG from the signal, and concluded that RMS EMG was reduced after its removal (Hu 2009).
They also suggested however that ECG contamination was more prominent in static postures
than during dynamic tasks. In a recent study, Coxon (2011) further investigated the effect of
removing ECG on RMS EMG, and in agreement with (Hu 2009) concluded that typically RMS EMG
was reduced, but that the change was very consistent throughout the signal (Coxon 2011).
The simplest and most widely available method to address ECG contamination is through the
use of EMG software filters. It has been suggested that an optimum for ECG removal may be a
filter that removes any signal component below 30Hz (D'hooge et al. 2013), however this
technique still removes large portions of potentially important lower frequency signal
information. The ability to remove ECG peaks is therefore obviously of importance, especially
when muscle activity onset or offset are being considered as variables, however their use
warrants careful consideration.
2.5.6.7 Normalisation
Normalisation is a process where the raw EMG signal is converted to a scale relative to a known
and repeatable value. Due to the inherent variability of the EMG signal, Lehman and McGill
(1999) concluded that normalisation is required for interpretation and comparison between
bilateral muscles, between the same muscle on different days and between different subjects
(Lehman and McGill 1999). The most appropriate and reliable method of normalisation however
is an area of disagreement (Norcross et al. 2010). Controlled reference voluntary contractions
(RVC’s) are useful for clinical populations that cannot achieve a maximal voluntary contraction
(MVC) (Hu et al. 2010; Olson et al. 2004), but the two most widely used normalisation techniques
utilise either a (MVC) or a sub-maximal voluntary contraction (sMVC).
If signal data is to be interpreted using ratios, there is contention in the literature about whether
or not that data should still require normalisation, or if indeed the use of ratios is a normalisation
process in itself (Lariviere and Arsenault 2008). The problem with using raw signal data, is that
it does not account for variations in participant soft tissue thickness (STT), and so it may be
inaccurate to consider that EMG ratios completely circumvent the requirement for EMG
normalisation (Lariviere and Arsenault 2008). Lariviere and Arsenault recommend the use of a
submaximal normalisation task that loads each of the paraspinal muscles equally as the most
appropriate solution, and suggest a modified Sorensen test (In a prone position, the participants

68
lower body is fixed to a bench, whilst the upper body is unsupported in the horizontal plane
(Demoulin et al. 2006)), as a possible method (Lariviere and Arsenault 2008).
2.5.6.8 Reference Contractions
An adapted Sorensen method was used by Claus et al. (2009) in order to recruit paraspinal
muscles throughout the length of the lower thoracics to lower lumbars (Claus et al. 2009), and
is evidence of how an extension contraction can be used to normalise activity recorded during
a flexion based examination. An extension maximal contraction was also used by Peach et al
(1998), for EMG normalisation during sagittal bending (Peach et al. 1998). The choice of
reference contraction should also be considerate of population under study, as if at any point
protocols are intended for use with LBP groups, then a sMVC is perhaps more appropriate than
a MVC to minimise the risk of injury, or contamination through fear of the movement (Section
2.5.6.11).
The Sorensen test (Demoulin et al. 2006) requires only a submaximal contraction, perhaps
making it more appropriate than maximal contractions for low back pain patients, with
contractions found to be no greater than 40-52% of the (MVC) (Mannion and Dolan 1994; Muller
et al. 2010). Indeed the use of sMVC’s are perhaps more common in a clinical setting for this
reason (Dankaerts et al. 2006; Dankaerts et al. 2004). There are varied interpretations of what
constitutes an MVC or a sMVC in the literature. Dankaerts et al. (2004) consider the Sorensen
test with resistance as a test of MVC, and used the ‘prone lying double leg raise’ as a sMVC
(Dankaerts et al. 2004). This involved having the subject lying prone with knees bent to 90
degrees and both knees lifted 5cm off the ground for 3 seconds. They concluded that a sMVC is
more appropriate for the normalisation of trunk muscle EMG when a between days repeated
measures study design is employed, which is a consideration for methodologies designed for
clinical outcome studies.
There is therefore still much debate over the most appropriate normalisation technique
(Soderberg 2000). In terms of reliability, within day reliability was found to be good for both
MVC’s and sMVC’s (Dankaerts et al. 2004). Knutson et al (1994) however, found that
measurements were most reliable when normalised to a MVC as opposed to mean or peak
dynamic EMG data (Knutson et al. 1994), and Soderberg (2000) suggests that although sMVC,
peak and mean dynamic provide reasonable alternatives, they recommend MVC use until
further clarification (Soderberg 2000). A review of recent research by Burden (2010) however
suggests that the use of isometric sMVC methods provides outputs that have equally good
reliability (Burden 2010).
69
A common sampling interval for reference contractions is 3 seconds with 1 second either side
to allow time to achieve peak amplitude (Claus et al. 2009), and although no studies examine
the appropriateness of this time period, the general consensus in the literature is to use this
time frame (Soderberg 2000). One of the main reasons for a short time sample is to avoid
fatigue, which may have its own effect on the signal (Mannion 1997). The number of repetitions
for standardisation is also an area of contention, with no scientific basis for any particular
number (Soderberg 2000), however Yang (1985) found that the reliability of MVCs and sMVCs
increased proportionately with the number of trials (Yang 1985).
2.5.6.9 Normalising to the peak
An alternative method to the sMVC and MVC normalisation techniques discussed, is to use the
maximum recorded sEMG obtained during the examination cycle (peak sEMG). Although
normalising to a peak value during a dynamic exercise has been demonstrated to decrease the
variability between individuals (Chapman et al. 2010), it does not account for the difference
between individuals in terms of motor control strategies to produce the same movement. This
may result in different activation patterns during the reference contraction of a given muscle
between individuals, making comparisons of different individuals and muscles invalid (Naik
2012). This reduction in variability between individuals through normalising to a peak, may also
be costly in terms of the loss of valuable biological variation, such as the strength difference
between individuals (Knutson et al. 1994). It has also been shown that normalising to peak
amplitude during an activity is less reliable between days in the same individual especially in
comparison to MVC’s (Knutson et al. 1994), and may therefore be of less value if a protocol is
intended for use in longitudinal studies.
2.5.6.10 EMG amplitude measurement reliability
Paraspinal muscle amplitude measurements have been shown to have acceptable reliability
(Ahern et al. 1986; Daneels et al. 2001), however the number of potential influencing factors
associated with EMG recording and analysis warrant a more detailed exploration. In any study
combining two technologies, the reliability of different measurements becomes complex and
arguably more important due to the possible cumulative effect of poor reliability in multiple
parameters. These could include the kinematic measurements as discussed, however EMG
elements such as electrode placement, normalisation technique, the choice of electrode and
how the electrode position was determined in terms of bony landmarks, can all affect the overall
reliability and agreement of EMG measurements.
Note: The reliability and agreement of the mean normalised sEMG amplitude during weight-bearing sagittal flexion
is investigated in Chapter 5, section 5.2.
70
2.5.6.11 Fear of movement
It is possible that sEMG measurements may be influenced by psychosocial factors, such as fear
of movement and re-injury (Geisser et al. 2005; Vlaeyen 1999), and whilst less likely in a healthy
population group, still required consideration in the study design. It has been suggested by
Geisser et al. (2004) that pain related fear is responsible for reduced lumbar flexion, and
increased sEMG activity in full flexion (Geisser et al. 2004). Indeed, Karayannis et al. (2013) also
demonstrated that a fear of movement is associated with increased trunk stiffness (Karayannis
et al. 2013), and Thomas and France (2008) showed that lumbar motion was inversely related
to pain, suggesting that pain related fear limits or reduces lumbar spinal movements (Thomas
and France 2008). A fear of pain has also been associated with changes in MVC’s (Geisser et al.
2004; Lindstroem et al. 2012), and Flexion Relaxation Ratio (FRR) (Geisser et al. 2004; Geisser et
al. 2005; Watson 1997), and therefore has the potential to influence sEMG data recorded during
flexion based protocols. Even in studies that control the participant’s movement range (i.e. not
reaching full flexion), pain at any point of the examination needs to be a consideration. Whilst
questionnaires such as the Tampa Scale for Kinesiophobia (TSK) have been developed to
measure fear of movement (Roelofs 2007; Swinkels-Meewisse 2003; Swinkels-Meewisse 2006),
a fear of movement is not anticipated in populations of healthy volunteers.
Section 6
2.6 Dynamic task standardisation
2.6.1 A case for standardisation and the use of pelvic restraint
A key methodological difference between previous investigations that have measured spinal
kinematics during a forward bending task, is whether the movement is one of free bending
(Ahmadi et al. 2009; Wong 2004) or if the pelvis is somehow stabilised to restrict or prevent its
motion (Ahern et al. 1988; Du Rose and Breen 2016a; Du Rose and Breen 2016b; Kingma et al.
2007; Oddsson and De Luca 2003; Peach et al. 1998). There are limitations associated with both
techniques. During free bending, participants whilst performing an arguably more natural
movement, do so at their own pace and over a comfortable range for the individual. Some
studies do attempt to exert a moderate degree of control over these factors using pre-set
bending instructions and metronomes for consistent timing (Ross et al. 2015), but adherence to
such measures is always likely to be influenced by individual interpretation and motivation.
Recently, continuous inter-vertebral measurements have most frequently relied on x-ray or
fluoroscopic imaging which are currently limited by a requirement to keep the spinal area of
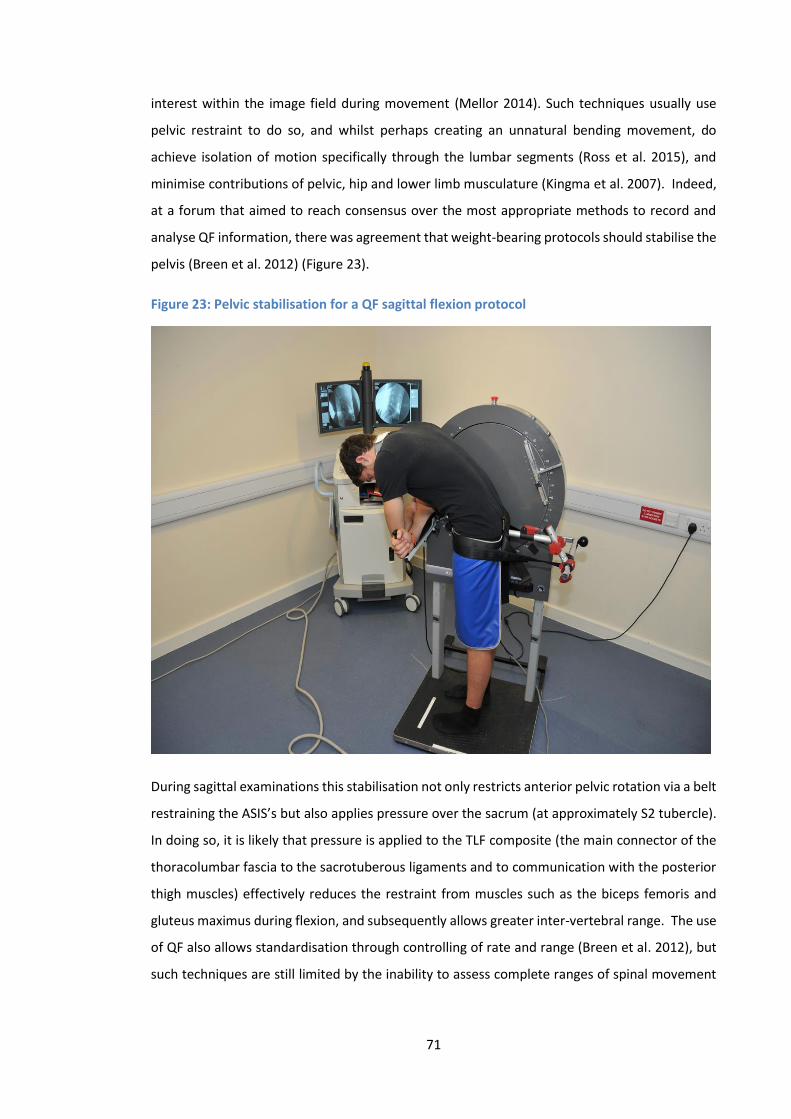
71
interest within the image field during movement (Mellor 2014). Such techniques usually use
pelvic restraint to do so, and whilst perhaps creating an unnatural bending movement, do
achieve isolation of motion specifically through the lumbar segments (Ross et al. 2015), and
minimise contributions of pelvic, hip and lower limb musculature (Kingma et al. 2007). Indeed,
at a forum that aimed to reach consensus over the most appropriate methods to record and
analyse QF information, there was agreement that weight-bearing protocols should stabilise the
pelvis (Breen et al. 2012) (Figure 23).
Figure 23: Pelvic stabilisation for a QF sagittal flexion protocol
During sagittal examinations this stabilisation not only restricts anterior pelvic rotation via a belt
restraining the ASIS’s but also applies pressure over the sacrum (at approximately S2 tubercle).
In doing so, it is likely that pressure is applied to the TLF composite (the main connector of the
thoracolumbar fascia to the sacrotuberous ligaments and to communication with the posterior
thigh muscles) effectively reduces the restraint from muscles such as the biceps femoris and
gluteus maximus during flexion, and subsequently allows greater inter-vertebral range. The use
of QF also allows standardisation through controlling of rate and range (Breen et al. 2012), but
such techniques are still limited by the inability to assess complete ranges of spinal movement
72
(e.g. full sagittal flexion), and a capacity to only measure narrow regions of the spine (i.e. lumbar
region, but not pelvis or thoracics).
The simultaneous rhythm between the lumbar spine and the pelvis is well documented in the
literature, with the lumbar spine being shown to contribute more to sagittal trunk rotation
during the early stages of flexion, and the pelvis during the latter (Paquet et al. 1994; Tafazzol
et al. 2014). The spine, pelvis and lower limbs therefore have fundamental links during
movements such a sagittal flexion, relationships which many believe are integral when
considering spinal stability (Leinonen et al. 2000; McGregor and Hukins 2009). McGregor and
Hukins (2009) for example use the analogy of an inverted pencil balanced on a fingertip. When
the pencil begins to fall, relocation of the finger can restore stability by repositioning its centre
of gravity. They argue that if the spine is analogous to the pencil, then the pelvis and lower limbs
may be considered the fingertip (base), capable of stabilising the spine in the sagittal plane via
movement of the hip, knee and ankle joints (McGregor and Hukins 2009). Indeed during sagittal
flexion, it has been shown that alongside lumbar extensor muscles there is concurrent activation
of other muscle groups including the hamstrings and gluteals (Kim et al. 2013; Leinonen et al.
2000; Nelson-Wong et al. 2012; Sihvonen et al. 1991), and a holistic understanding of control
throughout the kinematic chain is obviously desirable. A criticism however of studies that
investigate spinal control during movement, is that currently it is simply not possible to analyse
every muscle that may be contributing to the control mechanism. If a truly systems level
perspective of spinal control is to be taken, then all muscles with the potential to provide control
should be included for investigation. The system is arguably too complex to investigate in this
way. By stabilising the pelvis, there will be an obvious alteration to normal movement patterns,
but doing so will also focus movement above the pelvis and minimise the influence of the
associated musculature.
In addition, if the spine and the pelvis are studied concurrently, then it is difficult to determine
how each functions independently of the other. For example, natural spine function would be
unlikely to be seen in an individual with compromised hip function and vice versa. Therefore if
the goal of a study is to investigate the contribution to control of the lumbar spine elements
specifically, then every effort should be made to remove as many confounders/influences over
this control as possible.
McGregor et al. (2002) investigated spinal and pelvic mobility in groups of elite rowers with and
without LBP using MRI (McGregor et al. 2002). They found that the healthy control group had
more movement in their lower lumbar spines and relatively less pelvic rotation. In participants
73
with a current or prior history of LBP however, this trend was reversed with less movement of
the spine and increased pelvic rotation. Their findings suggest that stiffening of the lumbar spine
in LBP individuals is compensated for by increased movement of the pelvis or the thoracic spine.
Due to the limitations of MRI acquisition speeds, the data was taken from static postures
however, and it is unclear how dynamic movements may have influenced the findings. There
was also no analysis of motion sharing within the lumbar spine, which may have revealed more
localised compensation mechanisms.
There are studies that have attempted to quantify inter-segmental contributions to global
lumbar ROM, however the patterns demonstrated have been somewhat inconsistent (Aiyangar
et al. 2015). There are those that report a relatively increased share of motion apportioned to
the cephalic segments (Li 2009; Wong 2006; Wong 2004), and others that describe an increased
contribution from the caudal (Boden 1990), whilst other recent studies have suggested that
there is actually no significant difference between levels (Aiyangar et al. 2014; Wu et al. 2014).
This inconsistency may be due to population variations in relatively small samples, but again
may also be attributable to differences in experimental set-ups.
Wu et al (2014) discuss other possible reasons for discrepancies such as active, passive, static or
dynamic motions, participants who have or do not have a history of low back pain, and whether
the testing was in vivo or in vitro (Wu et al. 2014). Their study concludes that more
standardisation of the experimental set-up is required so that more meaningful comparisons
between subject groups and studies can be made, an issue addressed at a forum of researchers
using QF to measure spinal biomechanics, and has led to the development of standardised QF
protocols (Breen A.C. et al. 2012). This collective agreement regarding QF standardisation was
possible due to the relatively small number of QF research groups and a shared willingness to
produce comparable data. Perhaps due to its much wider use, common consensus regarding the
most appropriate EMG recording methodologies, signal processing and analysis techniques has
not been reached.
2.6.2 Rate of movement and gross measurements
A review of the literature evaluating the effects of motion on the biomechanics of the trunk,
considered studies that controlled the speed of the movement to be of higher quality than those
relying on subjective measures of velocity (Davis and Marras 2000). As discussed previously, the
moment of the trunk during a task such as forward bending needs to be offset, and this is
achieved primarily through eccentric activation of the vertebral and hip extensor musculature
(Sihvonen et al. 1991). The greater the moment the more muscle activation required to
74
compensate, with the subsequent effect of additional loading on the spine. If an individual
chooses to bend forward at a high velocity and stop suddenly at the end of the movement, the
reaction of the trunk muscles will be different to that of a slowly decelerating movement
strategy (Marras and Mirka 1990). The strategy selection may also relate to pain and
dysfunction in the low back itself, as it has been shown that flexion in LBP groups is actually
generally performed at a decreased velocity when compared to healthy controls (Marras and
Wongsam 1986; Mayer 1984; McGregor et al. 1997).
It seems logical then that velocity will have effect on motor control strategy, and Shirado et al.
(1995) speculated that FRP would be affected by the rate of movement (Shirado et al. 1995). In
a study investigating the effect of trunk velocity on FRP, Sarti et al. (2001) demonstrated that
increasing trunk velocity delayed the onset of FRP to larger angles of trunk flexion (Sarti et al.
2001). The proposed mechanism was a difference in the elastic force produced between groups,
which was subsequently reflected in the feedback provided by mechanoreceptors involved. This
was in disagreement with Steventon and Ng (1995), who found no difference in FRP onset
between groups, and so methodological discrepancies may again be limiting. Indeed, in the case
of studies investigating FRP specifically, there has been little consistency regarding the control
of movement velocity in the literature (Table 2), making comparisons between studies difficult.
There is evidence however, that differences in velocity can possibly affect motor control
strategies, limiting the value of comparisons between individuals. Controlling movements in a
standardised way can reduce the variation in velocity, providing a way to minimise the
confounding effect of this variation on these types of studies. It should be noted however that
whilst temporal activation parameters have been shown to alter with velocity of movement, the
level of activity (i.e. mean (RMS)) has been shown not to be sensitive (Sihvonen 1988). Such
conclusions should be viewed with caution however, due to the limited research in the area, and
the intuitive relationship between high velocity movements and the muscle activity required to
control them.
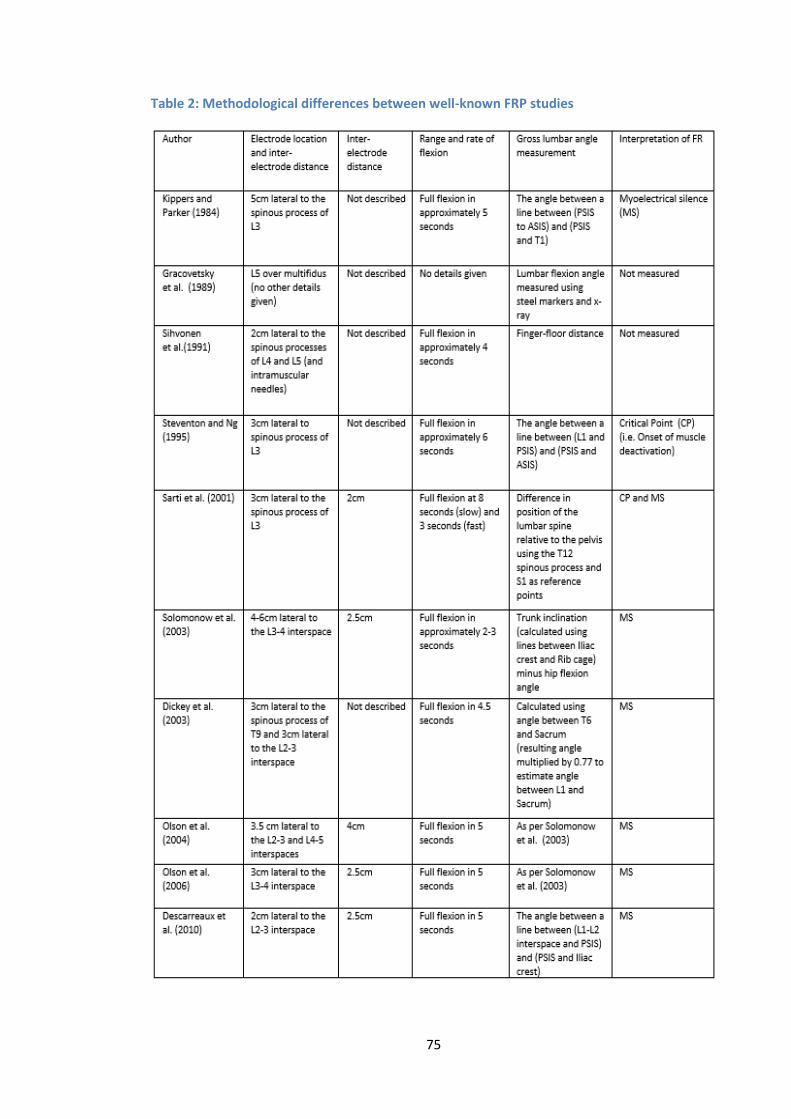
75
Table 2: Methodological differences between well-known FRP studies
76
Differences in methods are a general problem when trying to interpret study findings, and
variations make comparisons between studies difficult. Using examples such as gross lumbar
angle measurements and electrode positioning, table 2 highlights the differences that can exist
between studies. The lumbar angle measurements are so different in some cases that it would
certainly not be possible to compare studies, and although electrode positions are typically
placed to record generically from the erector spinae, even slight differences in positioning have
been shown to dramatically influence EMG amplitudes (De Nooij et al. 2009), and so even subtle
differences require careful interpretation.
Section 7
2.7 Systematic Review
2.7.1 Introduction As previously described, spinal stability was interpreted by Panjabi (1992) to be dependent on
the highly co-ordinated and optimised interactions between three sub-systems, the passive
(ligaments, discs, fascia and bones), the active (muscles and tendons) and the neural control
systems. If there is dysfunction within a specific system, compensation may be provided by
adaptations in the other systems (Panjabi 1992). As an example, Panjabi suggested that
abnormally increased muscle activation is a stabilisation mechanism compensating for a loss of
spinal stability (Panjabi 1992), a theory repeatedly supported in the subsequent literature (Olson
et al. 2004; Shin et al: 2010; Van Dieen et al. 2003). Such adaptations have also been proposed
as possible precipitators of LBP, a theory that is difficult to investigate given the inherent
heterogenity of EMG signal data (Lariviere et al. 2000).
In order to improve understanding of the complex interactions between sub-systems, it is
necessary to take an approach that incorporates the measurement of both lumbar kinematic
and trunk muscle activation data (Dankaerts et al. 2009). A popular method has been to
investigate adaptions within the spinal system in response to pertubation (Silfies et al. 2009),
and how such responses are influenced by paraspinal muscle fatigue (Granata et al. 2001;
Sanchez-Zuriaga et al. 2010; Abboud et al. 2016) and spinal creep deformation (Hendershot et
al. 2011; Sanchez-Zuriaga et al. 2010; Abboud et al. 2016), however a recent systematic review
suggests that although the literature provides some insight into possible spinal stability
mechanisms, the high methodological heterogeneity between studies means that the current
evidence is inconclusive (Abboud et al. 2017).
77
In terms of the investigation of dynamic movement, the study of the FRP (Floyd and Silver 1955)
is a possible way in which insight into sub-system interaction can be gained. The deactivation
of paraspinal muscle activity during the final stages of forward flexion has been interpreted as
the transfer of moment between the active and passive sub-systems (Mcgill and Kippers 1994),
and feasibly provides an insight into sub-system interaction. It has therefore been extensively
studied (Luhring et al. 2015; O’Sullivan et al. 2006; Sarti et al. 2001; Descarreaux et al. 2008),
however the majority of studies only incorporate the measurement of regional kinematics, and
therefore do not provide any insight from the level of the motion segment (Kaigle et al. 1998).
It could be argued that investigations at the spinal level are important, as inter-system feedback
mechanisms are believed to act at this level (Solomonow et al. 1998).
It has also been common for studies to focus on individual systems in isolation, in an attempt to
relate changes within each system to conditions such as LBP. Indeed, in terms of the active
system, LBP has been associated with changes in paraspinal muscle cross sectional size (Fortin
et al. 2013), activation timings (Williams et al. 2013; Nelson-Wong et al. 2012) and muscle
activation amplitudes (Van Dieen et al. 2003; Reeves et al. 2006; Sanchez-Zuriaga et al. 2015;
Ahern et al. 1988; Kuriyama et al. 2015). Focus on the passive system has shown potential links
between LBP and lumbar ROM (Dankaerts et al. 2009; Taghipour-Darzi et al. 2012; McGregor et
al. 1997; Abbott et al. 2006; Kulig et al. 2007; Teyhen et al. 2007; Mellor et al. 2014), and sagittal
balance/postural (Mehta et al. 2012) parameters, however such investigations, by considering
only one spinal control element, can only speculate as to how such changes may relate to
adapatations in the other sub-systems.
In addition, many of these studies have produced conflicting results, and there is therefore an
argument that attempts should first be made to improve understanding of normal, so as to
better understand what is abnormal (Peach et al. 1998). In their study, Peach et al. whilst
considering both kinematics and muscle activity to develop a database of normal movement and
activation patterns, did not relate their findings in any detail to mechanisms of spinal
stabilisation. Investigations of the kinematics of normal controls has shown how changes in
regions of the spine may be associated with changes in another (Mitchell et al. 2008; Hemming
et al. 2016), however again, such adaptations again cannot be explained in terms of sub-system
adaptation, as only a single system was considered.
The complexity and inaccessability of investigating spinal control mechanisms makes the
interpretation of study findings difficult. A key problem is that sub-system interaction is
dynamic, and therefore the study of two or more systems concurrently in living humans requires
78
instrumentation that can do so dynamically. Physical activities involving sagittal bending are
commonplace activities of daily living (Colloca and Hinrichs 2005), and so an improved
knowledge of sub-system interaction during lumbar flexion would be of clinical interest. To the
author’s knowledge, there is currently no review of studies that have investigated dynamic
flexion movements using a combination of EMG and lumbar kinematic measurements. As such
it is not clear how understanding of Panjabi’s spinal stability concepts has advanced with regards
to this functional movement of the spine.
This review addressed two fundamental questions. 1) Can the information acquired by
combining lumbar kinematic and muscle activity measurements during functional movements
(i.e. forward bending) assist in distinguishing between groups of healthy controls and those with
low back pain? 2) How have such studies conducted since Panjabi’s seminal 1992 paper
improved understanding of lumbar spinal stability mechanisms (i.e. sub-system interactions)?
2.7.2 Literature search strategy Pubmed and Cochrane databases were searched in March and April 2017. The systematic search
was performed using combinations of the following keywords: (Electromyography OR EMG or
Flexion Relaxation OR FRP AND Kinematics OR Range of Motion OR ROM AND Low Back Pain OR
Lumbar Spine AND Flexion OR Bending AND Stability OR Stabilization). Article screening was
conducted by the author, and was restricted to English publications.
2.7.3 Inclusion and exclusion criteria Articles were included for review if they met the following inclusion and exclusion criteria.
Inclusion criteria consist of 1) studies must be in vivo using adult participants 2) dynamic weight-
bearing movement in the sagittal plane including forward flexion 3) Include both EMG (including
the lumbar paraspinal muscles) and lumbar kinematic measurements 4) Relate study findings to
stability theories or spinal stabilisation. Exclusion criteria included 1) Pertubation studies (as the
articles of interest were to include active movement 2) Studies measuring creep or fatigue (as
single cycles of dynamic tasks will unlikely result in either 3) Studies not investigating the lumbar
spine specifically (i.e cervical, thoracic or shoulder) 4) Studies investigating lateral flexion, axial
rotation or gait (i.e. not including sagittal flexion) 5) Non-human studies (e.g. feline studies) 6)
Repeatability trials. A flowchart outlining the citation selection process is shown in figure 24.
Other reasons for study exclusion included manipulation by design (e.g. investigations into the
effects of noxious stimuli, high heels, taping, exercise etc.).
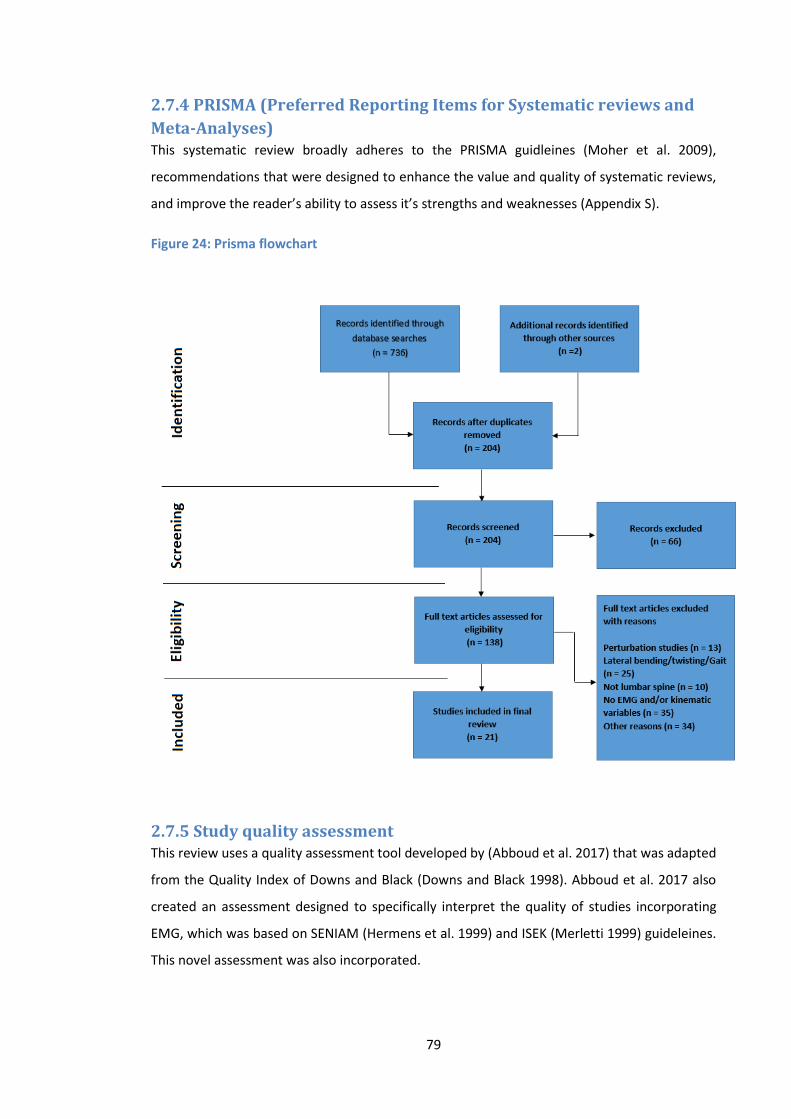
79
2.7.4 PRISMA (Preferred Reporting Items for Systematic reviews and
Meta-Analyses) This systematic review broadly adheres to the PRISMA guidleines (Moher et al. 2009),
recommendations that were designed to enhance the value and quality of systematic reviews,
and improve the reader’s ability to assess it’s strengths and weaknesses (Appendix S).
Figure 24: Prisma flowchart
2.7.5 Study quality assessment This review uses a quality assessment tool developed by (Abboud et al. 2017) that was adapted
from the Quality Index of Downs and Black (Downs and Black 1998). Abboud et al. 2017 also
created an assessment designed to specifically interpret the quality of studies incorporating
EMG, which was based on SENIAM (Hermens et al. 1999) and ISEK (Merletti 1999) guideleines.
This novel assessment was also incorporated.
80
2.7.5.1 Overall quality assessment (Abboud et al. 2017)
The original quality index developed by Downs and Black (1998) has been shown to have good
test-retest (r = 0.88) and inter-rater observability (r= 0.75) (Abboud et al. 2017). The adapted
tool consists of 10 items that were deemed appropriate for the purpose of this review. The items
included the following questions 1) Is the hypothesis/aim/objective of the study clearly
described? 2) Are the main outcomes to be measured clearly described in the Introduction or
Methods section? 3) Are the characteristics of the patients included in the study clearly
described? 4) Are the interventions of interest clearly described? 5) Are the main findings of the
study clearly described? 6) Does the study provide estimates of the random variability in the
data for the main outcomes? 7) Have actual probability values been reported (e.g. 0.035 rather
than <0.05) for the main outcomes except where the probability value is less than 0.001? 8)
Were those subjects who were prepared to participate representative of the entire population
from which they were recruited? 9) If any of the results of the study were based on “data
dredging”, was this made clear? 10) Were the statistical tests used to assess the main outcomes
appropriate? All items were scored either 0 or 1. This produced a total quality score out of 10
for each study, with the exception of those articles that did not require population comparison,
and so were scored out of 9 (Table 3). Final scores were converted into percentages and
combined with the EMG quality scores, providing an overall impression of study quality (Table
5).
2.7.5.2 Specific EMG quality assessment
The checklist developed by Abboud et al. 2017 consists of 12 items divided into 4 sections (Table
4). The first section considers the use of sEMG electrodes and comprises a score for inter-
electrode distance, electrode material and construction (i.e. bipolar). The second section
considers participant skin preparation, the use of reference electrodes and electrode placement
and fixation. The third section considers signal processing and includes items regarding the use
of filters, rectification methodology, sampling and processing. The final section considers the
appropriate use of normalisation. Each item was scored 0 or 1, and a score of 1 was attributed
to a section if the item totals reached 2 or more. This produced an EMG quality score out of 4
for each study, with the exception of those articles where normalisation was not deemed
necessary, and so were scored out of 3. These scores were also converted into percentages and
combined with the study quality assessment scores above (Table 5).
81
2.7.6 Results Out of a total of 736 articles identified through the literature search only 21 satisfied the
inclusion/exclusion criteria. The screening process is outlined in the PRISMA flowchart (Figure
24).
2.7.6.1 Overall and EMG quality assessment
The overall quality assessment scores ranged from 44-100% with a mean total score of 80%
(Table 3). All of the selected studies scored a 1 for their descriptions of methodology and study
findings. The studies also performed well in terms of the quality of hypothesis and outcome
descriptions (19/21 and 20/21 respectively), and their use of appropriate statistics and absence
of data dredging (both 20/21). Areas in which the studies generally scored poorly included the
description of participant characteristics (9/21) and the reporting of actual probability values
(7/21). The EMG quality assessment showed scores ranging from 25-100% with a mean total
score of 73% (Table 4). The assessment showed that the majority of EMG studies adequately
reported the normalisation and signal processing elements, however it also highlighted a
mixture of study quality when considering the detail of electrode use. The combined overall and
EMG quality index scores ranged from 47-100% with a mean total score of 77% (Table 5).

82
Table 3: Quality index assessment scores (*Studies that did not compare healthy controls to a low back pain group were rated using a 9 point scale instead of 10)
Quality check
Authors (year)
1 2 3 4 5 6 7 8 9 10 Score (/9* or /10)
Score (%)
Arjmand et al. 2010
0 1 0 1 1 0 0 N/A
1 0 4* 44
Burnett et al. 2004
1 1 0 1 1 1 1 1 1 1 9 90
Callaghan and Dunk 2002
1 0 0 1 1 0 1 N/A
1 1 6* 67
Cholewicki et al. 1997
1 1 0 1 1 1 0 N/A
1 1 7* 78
Dankaerts et al. 2009
1 1 1 1 1 1 1 1 1 1 10 100
Hashemirad et al. 2009
1 1 0 1 1 1 0 N/A
1 1 7* 78
Hay et al. 2016 0 1 0 1 1 0 0 1 1 1 6 60 Kaigle et al. 1998
1 1 1 1 1 1 0 0 1 1 8 80
kienbacher et al. 2016
1 1 1 1 1 1 1 1 1 1 10 100
Lariviere et al. 2000
1 1 1 1 1 1 1 0 1 1 9 90
Liu et al. 2011 1 1 0 1 1 1 0 0 1 1 7 70 Luhring et al. 2015
1 1 1 1 1 1 0 N/A
1 1 8* 89
Mayer et al. 2009
1 1 0 1 1 1 0 1 0 1 7 70
McGill and Kippers 1994
1 1 0 1 1 1 0 N/A
1 1 7* 78
Nairn et al. 2013
1 1 0 1 1 0 1 N/A
1 1 7* 78
Neblett et al. 2003
1 1 1 1 1 1 0 N/A
1 1 8* 89
Ning et al. 2012
1 1 0 1 1 0 0 N/A
1 1 6* 67
O'Sullivan et al. 2006
1 1 1 1 1 1 1 N/A
1 1 9* 100
Paquet et al. 1994
1 1 1 1 1 1 0 1 1 1 9 90
Peach et al. 1998
1 1 0 1 1 1 0 N/A
1 1 7* 78
Sanchez-Zuriaga et al. 2015
1 1 1 1 1 1 0 1 1 1 9 90
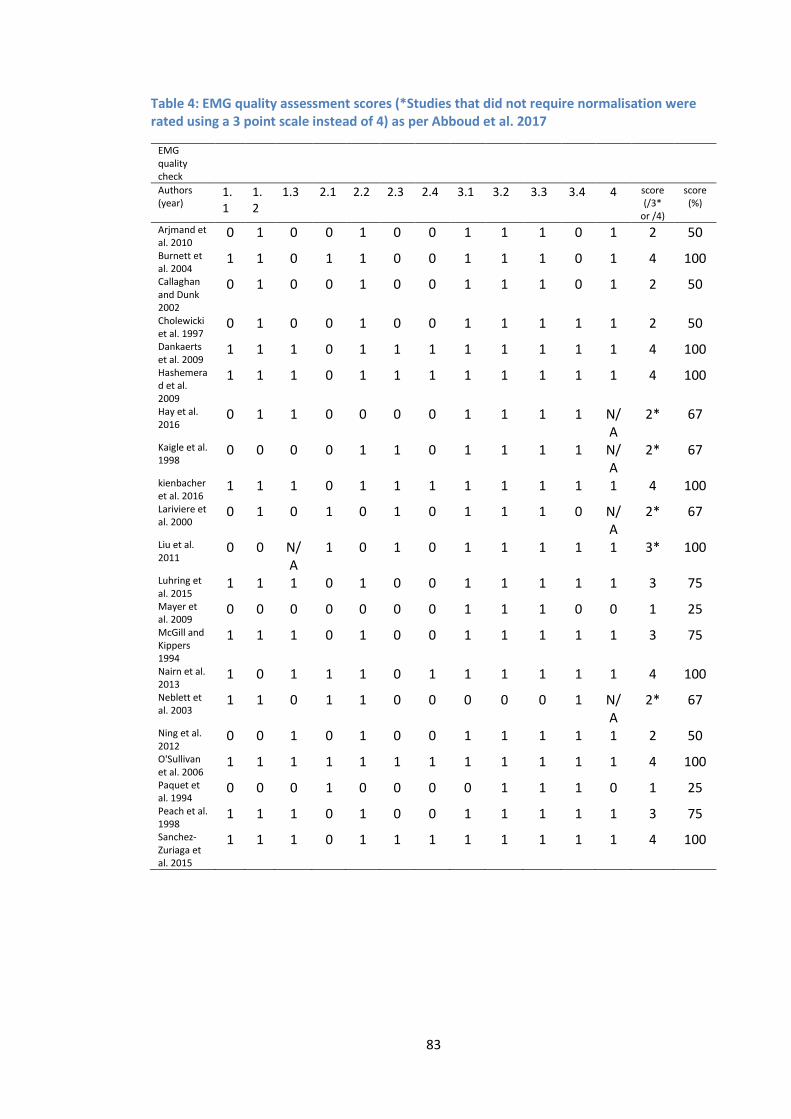
83
Table 4: EMG quality assessment scores (*Studies that did not require normalisation were rated using a 3 point scale instead of 4) as per Abboud et al. 2017
EMG quality check
Authors (year)
1.1
1.2
1.3 2.1 2.2 2.3 2.4 3.1 3.2 3.3 3.4 4 score (/3*
or /4)
score (%)
Arjmand et al. 2010
0 1 0 0 1 0 0 1 1 1 0 1 2 50
Burnett et al. 2004
1 1 0 1 1 0 0 1 1 1 0 1 4 100
Callaghan and Dunk 2002
0 1 0 0 1 0 0 1 1 1 0 1 2 50
Cholewicki et al. 1997
0 1 0 0 1 0 0 1 1 1 1 1 2 50
Dankaerts et al. 2009
1 1 1 0 1 1 1 1 1 1 1 1 4 100
Hashemerad et al. 2009
1 1 1 0 1 1 1 1 1 1 1 1 4 100
Hay et al. 2016
0 1 1 0 0 0 0 1 1 1 1 N/A
2* 67
Kaigle et al. 1998
0 0 0 0 1 1 0 1 1 1 1 N/A
2* 67
kienbacher et al. 2016
1 1 1 0 1 1 1 1 1 1 1 1 4 100
Lariviere et al. 2000
0 1 0 1 0 1 0 1 1 1 0 N/A
2* 67
Liu et al. 2011
0 0 N/A
1 0 1 0 1 1 1 1 1 3* 100
Luhring et al. 2015
1 1 1 0 1 0 0 1 1 1 1 1 3 75
Mayer et al. 2009
0 0 0 0 0 0 0 1 1 1 0 0 1 25
McGill and Kippers 1994
1 1 1 0 1 0 0 1 1 1 1 1 3 75
Nairn et al. 2013
1 0 1 1 1 0 1 1 1 1 1 1 4 100
Neblett et al. 2003
1 1 0 1 1 0 0 0 0 0 1 N/A
2* 67
Ning et al. 2012
0 0 1 0 1 0 0 1 1 1 1 1 2 50
O'Sullivan et al. 2006
1 1 1 1 1 1 1 1 1 1 1 1 4 100
Paquet et al. 1994
0 0 0 1 0 0 0 0 1 1 1 0 1 25
Peach et al. 1998
1 1 1 0 1 0 0 1 1 1 1 1 3 75
Sanchez-Zuriaga et al. 2015
1 1 1 0 1 1 1 1 1 1 1 1 4 100
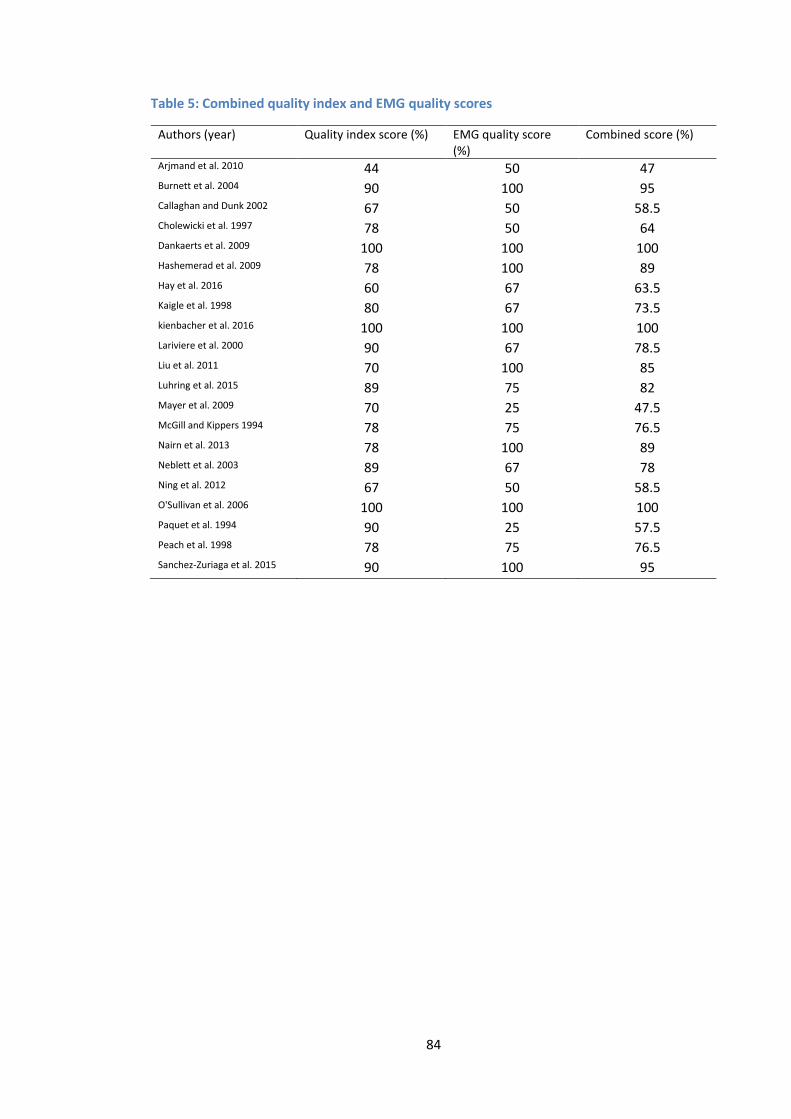
84
Table 5: Combined quality index and EMG quality scores
Authors (year) Quality index score (%) EMG quality score (%)
Combined score (%)
Arjmand et al. 2010 44 50 47 Burnett et al. 2004 90 100 95 Callaghan and Dunk 2002 67 50 58.5 Cholewicki et al. 1997 78 50 64 Dankaerts et al. 2009 100 100 100 Hashemerad et al. 2009 78 100 89 Hay et al. 2016 60 67 63.5 Kaigle et al. 1998 80 67 73.5 kienbacher et al. 2016 100 100 100 Lariviere et al. 2000 90 67 78.5 Liu et al. 2011 70 100 85 Luhring et al. 2015 89 75 82 Mayer et al. 2009 70 25 47.5 McGill and Kippers 1994 78 75 76.5 Nairn et al. 2013 78 100 89 Neblett et al. 2003 89 67 78 Ning et al. 2012 67 50 58.5 O'Sullivan et al. 2006 100 100 100 Paquet et al. 1994 90 25 57.5 Peach et al. 1998 78 75 76.5 Sanchez-Zuriaga et al. 2015 90 100 95
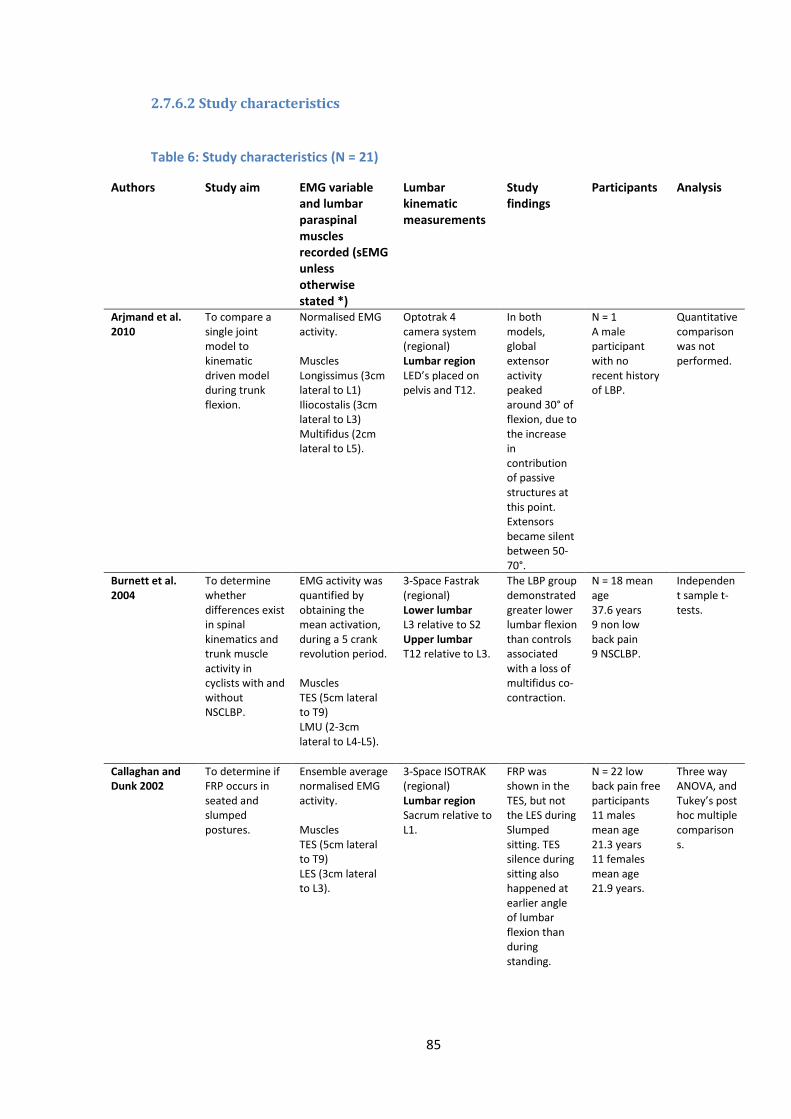
85
2.7.6.2 Study characteristics
Table 6: Study characteristics (N = 21)
Authors Study aim EMG variable and lumbar paraspinal muscles recorded (sEMG unless otherwise stated *)
Lumbar kinematic measurements
Study findings
Participants Analysis
Arjmand et al. 2010
To compare a single joint model to kinematic driven model during trunk flexion.
Normalised EMG activity. Muscles Longissimus (3cm lateral to L1) Iliocostalis (3cm lateral to L3) Multifidus (2cm lateral to L5).
Optotrak 4 camera system (regional) Lumbar region LED’s placed on pelvis and T12.
In both models, global extensor activity peaked around 30° of flexion, due to the increase in contribution of passive structures at this point. Extensors became silent between 50-70°.
N = 1 A male participant with no recent history of LBP.
Quantitative comparison was not performed.
Burnett et al. 2004
To determine whether differences exist in spinal kinematics and trunk muscle activity in cyclists with and without NSCLBP.
EMG activity was quantified by obtaining the mean activation, during a 5 crank revolution period. Muscles TES (5cm lateral to T9) LMU (2-3cm lateral to L4-L5).
3-Space Fastrak (regional) Lower lumbar L3 relative to S2 Upper lumbar T12 relative to L3.
The LBP group demonstrated greater lower lumbar flexion than controls associated with a loss of multifidus co-contraction.
N = 18 mean age 37.6 years 9 non low back pain 9 NSCLBP.
Independent sample t-tests.
Callaghan and Dunk 2002
To determine if FRP occurs in seated and slumped postures.
Ensemble average normalised EMG activity. Muscles TES (5cm lateral to T9) LES (3cm lateral to L3).
3-Space ISOTRAK (regional) Lumbar region Sacrum relative to L1.
FRP was shown in the TES, but not the LES during Slumped sitting. TES silence during sitting also happened at earlier angle of lumbar flexion than during standing.
N = 22 low back pain free participants 11 males mean age 21.3 years 11 females mean age 21.9 years.
Three way ANOVA, and Tukey’s post hoc multiple comparisons.
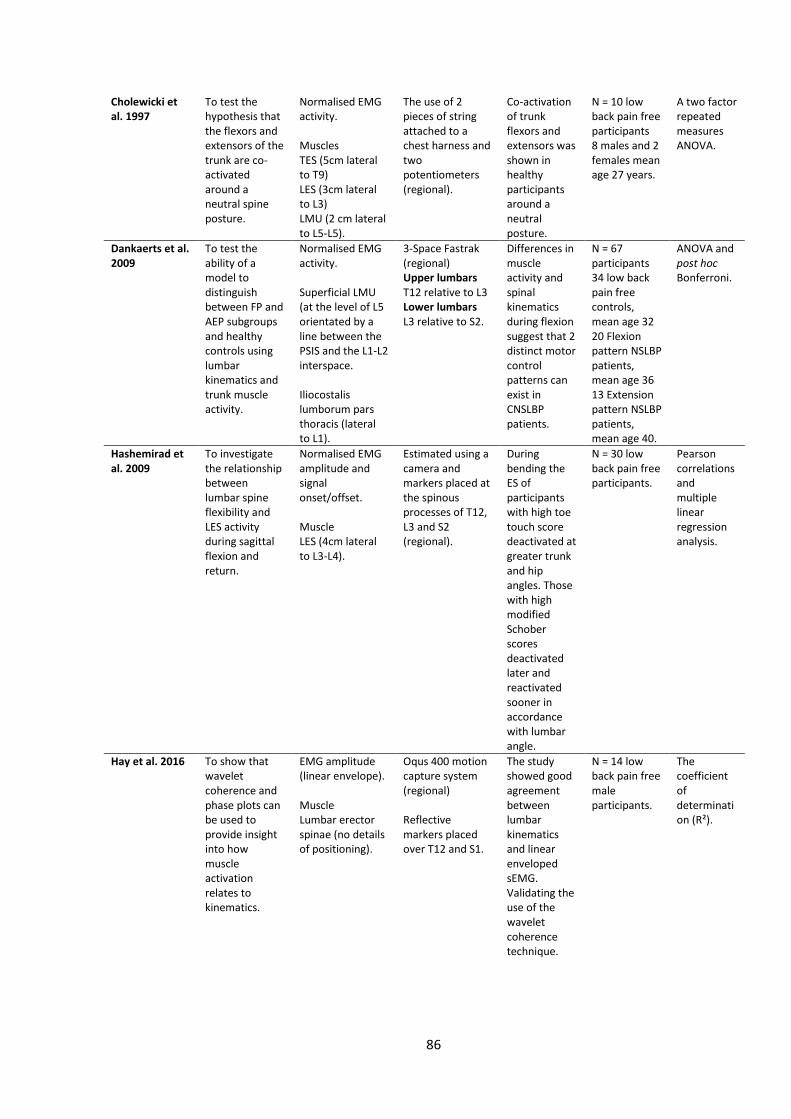
86
Cholewicki et al. 1997
To test the hypothesis that the flexors and extensors of the trunk are co-activated around a neutral spine posture.
Normalised EMG activity. Muscles TES (5cm lateral to T9) LES (3cm lateral to L3) LMU (2 cm lateral to L5-L5).
The use of 2 pieces of string attached to a chest harness and two potentiometers (regional).
Co-activation of trunk flexors and extensors was shown in healthy participants around a neutral posture.
N = 10 low back pain free participants 8 males and 2 females mean age 27 years.
A two factor repeated measures ANOVA.
Dankaerts et al. 2009
To test the ability of a model to distinguish between FP and AEP subgroups and healthy controls using lumbar kinematics and trunk muscle activity.
Normalised EMG activity. Superficial LMU (at the level of L5 orientated by a line between the PSIS and the L1-L2 interspace. Iliocostalis lumborum pars thoracis (lateral to L1).
3-Space Fastrak (regional) Upper lumbars T12 relative to L3 Lower lumbars L3 relative to S2.
Differences in muscle activity and spinal kinematics during flexion suggest that 2 distinct motor control patterns can exist in CNSLBP patients.
N = 67 participants 34 low back pain free controls, mean age 32 20 Flexion pattern NSLBP patients, mean age 36 13 Extension pattern NSLBP patients, mean age 40.
ANOVA and post hoc Bonferroni.
Hashemirad et al. 2009
To investigate the relationship between lumbar spine flexibility and LES activity during sagittal flexion and return.
Normalised EMG amplitude and signal onset/offset. Muscle LES (4cm lateral to L3-L4).
Estimated using a camera and markers placed at the spinous processes of T12, L3 and S2 (regional).
During bending the ES of participants with high toe touch score deactivated at greater trunk and hip angles. Those with high modified Schober scores deactivated later and reactivated sooner in accordance with lumbar angle.
N = 30 low back pain free participants.
Pearson correlations and multiple linear regression analysis.
Hay et al. 2016 To show that wavelet coherence and phase plots can be used to provide insight into how muscle activation relates to kinematics.
EMG amplitude (linear envelope). Muscle Lumbar erector spinae (no details of positioning).
Oqus 400 motion capture system (regional) Reflective markers placed over T12 and S1.
The study showed good agreement between lumbar kinematics and linear enveloped sEMG. Validating the use of the wavelet coherence technique.
N = 14 low back pain free male participants.
The coefficient of determination (R²).
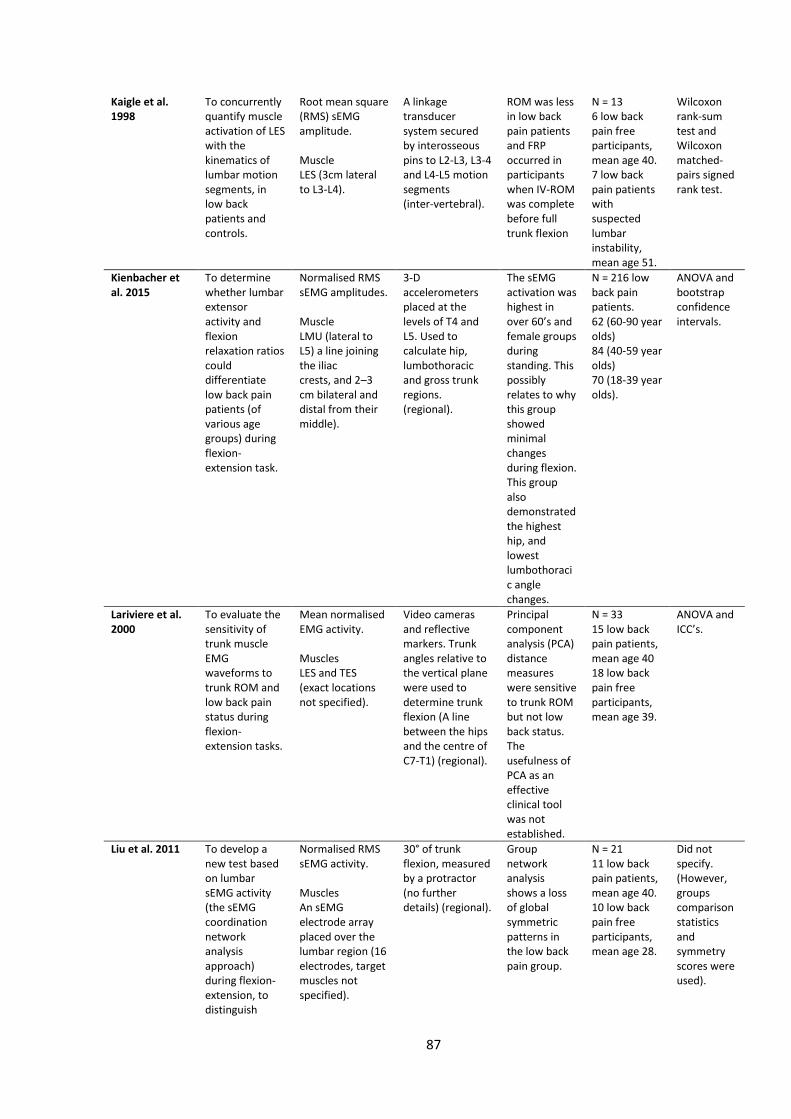
87
Kaigle et al. 1998
To concurrently quantify muscle activation of LES with the kinematics of lumbar motion segments, in low back patients and controls.
Root mean square (RMS) sEMG amplitude. Muscle LES (3cm lateral to L3-L4).
A linkage transducer system secured by interosseous pins to L2-L3, L3-4 and L4-L5 motion segments (inter-vertebral).
ROM was less in low back pain patients and FRP occurred in participants when IV-ROM was complete before full trunk flexion
N = 13 6 low back pain free participants, mean age 40. 7 low back pain patients with suspected lumbar instability, mean age 51.
Wilcoxon rank-sum test and Wilcoxon matched-pairs signed rank test.
Kienbacher et al. 2015
To determine whether lumbar extensor activity and flexion relaxation ratios could differentiate low back pain patients (of various age groups) during flexion-extension task.
Normalised RMS sEMG amplitudes. Muscle LMU (lateral to L5) a line joining the iliac crests, and 2–3 cm bilateral and distal from their middle).
3-D accelerometers placed at the levels of T4 and L5. Used to calculate hip, lumbothoracic and gross trunk regions. (regional).
The sEMG activation was highest in over 60’s and female groups during standing. This possibly relates to why this group showed minimal changes during flexion. This group also demonstrated the highest hip, and lowest lumbothoracic angle changes.
N = 216 low back pain patients. 62 (60-90 year olds) 84 (40-59 year olds) 70 (18-39 year olds).
ANOVA and bootstrap confidence intervals.
Lariviere et al. 2000
To evaluate the sensitivity of trunk muscle EMG waveforms to trunk ROM and low back pain status during flexion-extension tasks.
Mean normalised EMG activity. Muscles LES and TES (exact locations not specified).
Video cameras and reflective markers. Trunk angles relative to the vertical plane were used to determine trunk flexion (A line between the hips and the centre of C7-T1) (regional).
Principal component analysis (PCA) distance measures were sensitive to trunk ROM but not low back status. The usefulness of PCA as an effective clinical tool was not established.
N = 33 15 low back pain patients, mean age 40 18 low back pain free participants, mean age 39.
ANOVA and ICC’s.
Liu et al. 2011 To develop a new test based on lumbar sEMG activity (the sEMG coordination network analysis approach) during flexion-extension, to distinguish
Normalised RMS sEMG activity. Muscles An sEMG electrode array placed over the lumbar region (16 electrodes, target muscles not specified).
30° of trunk flexion, measured by a protractor (no further details) (regional).
Group network analysis shows a loss of global symmetric patterns in the low back pain group.
N = 21 11 low back pain patients, mean age 40. 10 low back pain free participants, mean age 28.
Did not specify. (However, groups comparison statistics and symmetry scores were used).
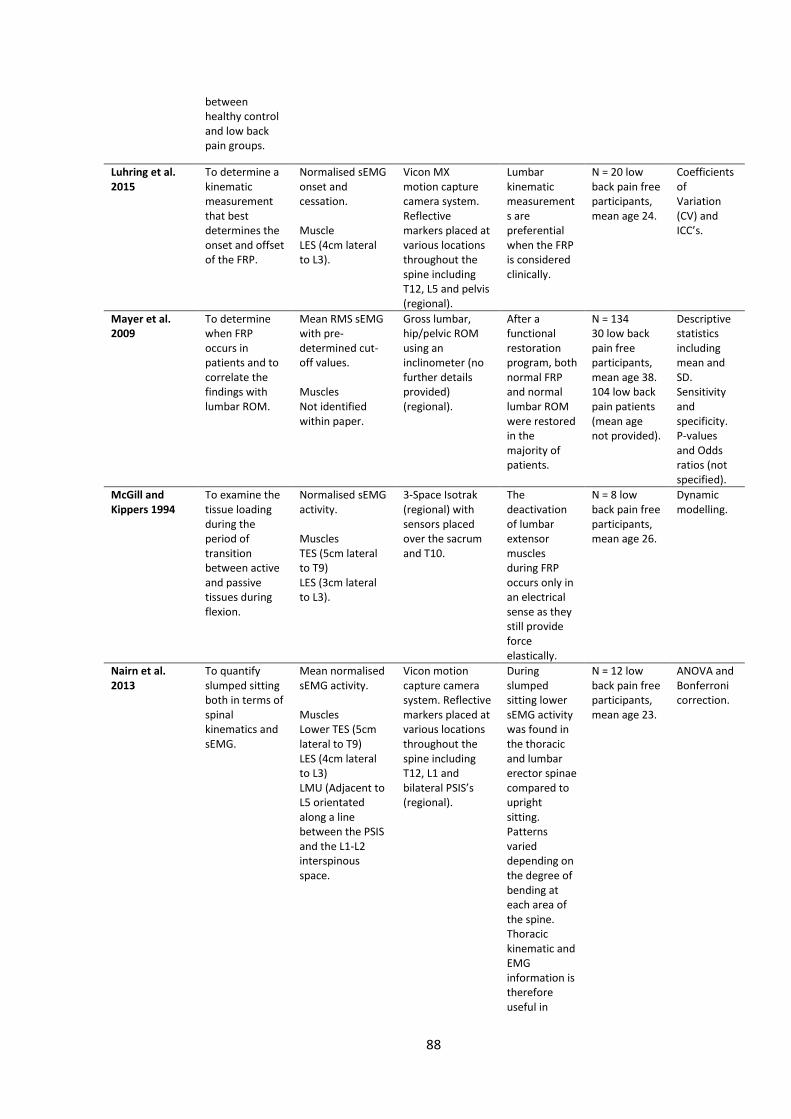
88
between healthy control and low back pain groups.
Luhring et al. 2015
To determine a kinematic measurement that best determines the onset and offset of the FRP.
Normalised sEMG onset and cessation. Muscle LES (4cm lateral to L3).
Vicon MX motion capture camera system. Reflective markers placed at various locations throughout the spine including T12, L5 and pelvis (regional).
Lumbar kinematic measurements are preferential when the FRP is considered clinically.
N = 20 low back pain free participants, mean age 24.
Coefficients of Variation (CV) and ICC’s.
Mayer et al. 2009
To determine when FRP occurs in patients and to correlate the findings with lumbar ROM.
Mean RMS sEMG with pre-determined cut-off values. Muscles Not identified within paper.
Gross lumbar, hip/pelvic ROM using an inclinometer (no further details provided) (regional).
After a functional restoration program, both normal FRP and normal lumbar ROM were restored in the majority of patients.
N = 134 30 low back pain free participants, mean age 38. 104 low back pain patients (mean age not provided).
Descriptive statistics including mean and SD. Sensitivity and specificity. P-values and Odds ratios (not specified).
McGill and Kippers 1994
To examine the tissue loading during the period of transition between active and passive tissues during flexion.
Normalised sEMG activity. Muscles TES (5cm lateral to T9) LES (3cm lateral to L3).
3-Space Isotrak (regional) with sensors placed over the sacrum and T10.
The deactivation of lumbar extensor muscles during FRP occurs only in an electrical sense as they still provide force elastically.
N = 8 low back pain free participants, mean age 26.
Dynamic modelling.
Nairn et al. 2013
To quantify slumped sitting both in terms of spinal kinematics and sEMG.
Mean normalised sEMG activity. Muscles Lower TES (5cm lateral to T9) LES (4cm lateral to L3) LMU (Adjacent to L5 orientated along a line between the PSIS and the L1-L2 interspinous space.
Vicon motion capture camera system. Reflective markers placed at various locations throughout the spine including T12, L1 and bilateral PSIS’s (regional).
During slumped sitting lower sEMG activity was found in the thoracic and lumbar erector spinae compared to upright sitting. Patterns varied depending on the degree of bending at each area of the spine. Thoracic kinematic and EMG information is therefore useful in
N = 12 low back pain free participants, mean age 23.
ANOVA and Bonferroni correction.
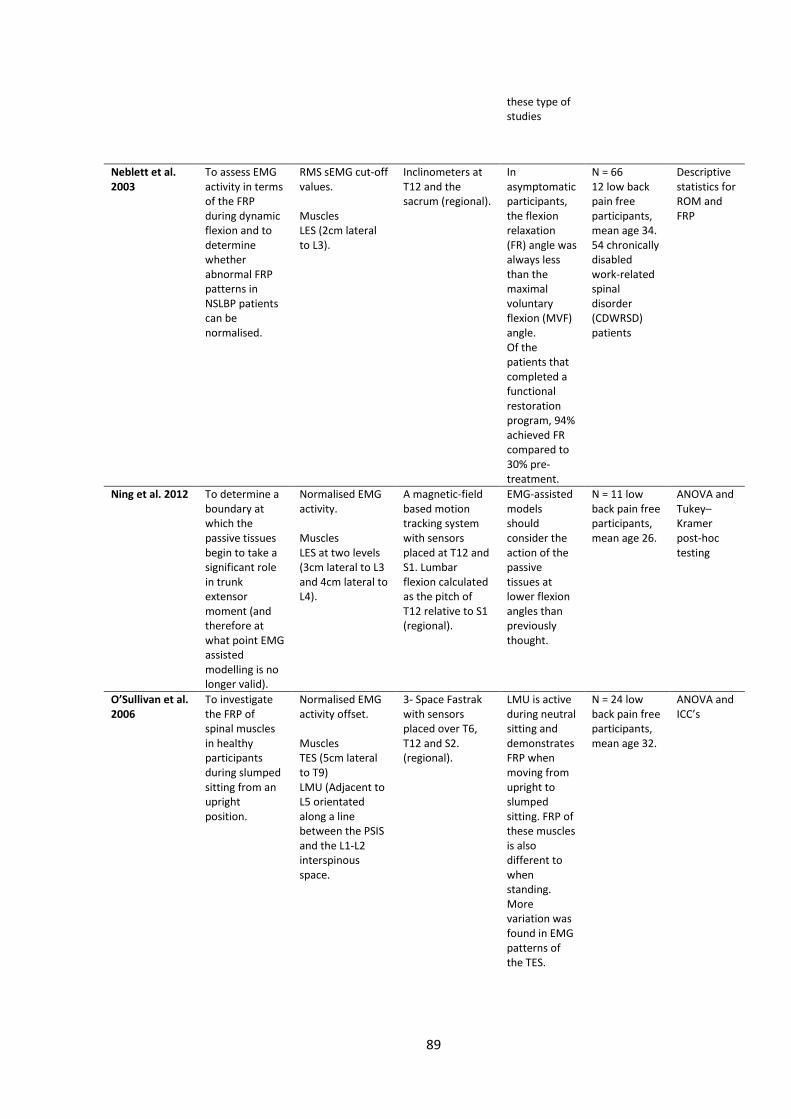
89
these type of studies
Neblett et al. 2003
To assess EMG activity in terms of the FRP during dynamic flexion and to determine whether abnormal FRP patterns in NSLBP patients can be normalised.
RMS sEMG cut-off values. Muscles LES (2cm lateral to L3).
Inclinometers at T12 and the sacrum (regional).
In asymptomatic participants, the flexion relaxation (FR) angle was always less than the maximal voluntary flexion (MVF) angle. Of the patients that completed a functional restoration program, 94% achieved FR compared to 30% pre-treatment.
N = 66 12 low back pain free participants, mean age 34. 54 chronically disabled work-related spinal disorder (CDWRSD) patients
Descriptive statistics for ROM and FRP
Ning et al. 2012 To determine a boundary at which the passive tissues begin to take a significant role in trunk extensor moment (and therefore at what point EMG assisted modelling is no longer valid).
Normalised EMG activity. Muscles LES at two levels (3cm lateral to L3 and 4cm lateral to L4).
A magnetic-field based motion tracking system with sensors placed at T12 and S1. Lumbar flexion calculated as the pitch of T12 relative to S1 (regional).
EMG-assisted models should consider the action of the passive tissues at lower flexion angles than previously thought.
N = 11 low back pain free participants, mean age 26.
ANOVA and Tukey–Kramer post-hoc testing
O’Sullivan et al. 2006
To investigate the FRP of spinal muscles in healthy participants during slumped sitting from an upright position.
Normalised EMG activity offset. Muscles TES (5cm lateral to T9) LMU (Adjacent to L5 orientated along a line between the PSIS and the L1-L2 interspinous space.
3- Space Fastrak with sensors placed over T6, T12 and S2. (regional).
LMU is active during neutral sitting and demonstrates FRP when moving from upright to slumped sitting. FRP of these muscles is also different to when standing. More variation was found in EMG patterns of the TES.
N = 24 low back pain free participants, mean age 32.
ANOVA and ICC’s
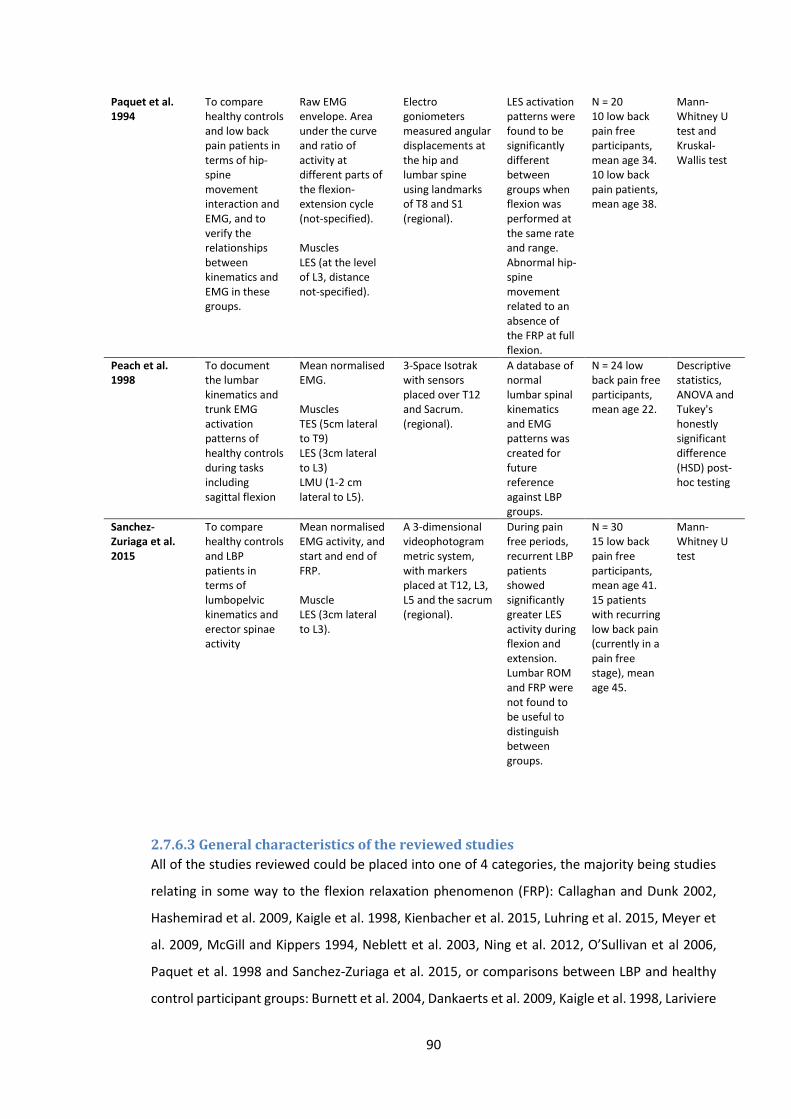
90
Paquet et al. 1994
To compare healthy controls and low back pain patients in terms of hip-spine movement interaction and EMG, and to verify the relationships between kinematics and EMG in these groups.
Raw EMG envelope. Area under the curve and ratio of activity at different parts of the flexion-extension cycle (not-specified). Muscles LES (at the level of L3, distance not-specified).
Electro goniometers measured angular displacements at the hip and lumbar spine using landmarks of T8 and S1 (regional).
LES activation patterns were found to be significantly different between groups when flexion was performed at the same rate and range. Abnormal hip-spine movement related to an absence of the FRP at full flexion.
N = 20 10 low back pain free participants, mean age 34. 10 low back pain patients, mean age 38.
Mann-Whitney U test and Kruskal-Wallis test
Peach et al. 1998
To document the lumbar kinematics and trunk EMG activation patterns of healthy controls during tasks including sagittal flexion
Mean normalised EMG. Muscles TES (5cm lateral to T9) LES (3cm lateral to L3) LMU (1-2 cm lateral to L5).
3-Space Isotrak with sensors placed over T12 and Sacrum. (regional).
A database of normal lumbar spinal kinematics and EMG patterns was created for future reference against LBP groups.
N = 24 low back pain free participants, mean age 22.
Descriptive statistics, ANOVA and Tukey's honestly significant difference (HSD) post-hoc testing
Sanchez-Zuriaga et al. 2015
To compare healthy controls and LBP patients in terms of lumbopelvic kinematics and erector spinae activity
Mean normalised EMG activity, and start and end of FRP. Muscle LES (3cm lateral to L3).
A 3-dimensional videophotogrammetric system, with markers placed at T12, L3, L5 and the sacrum (regional).
During pain free periods, recurrent LBP patients showed significantly greater LES activity during flexion and extension. Lumbar ROM and FRP were not found to be useful to distinguish between groups.
N = 30 15 low back pain free participants, mean age 41. 15 patients with recurring low back pain (currently in a pain free stage), mean age 45.
Mann-Whitney U test
2.7.6.3 General characteristics of the reviewed studies
All of the studies reviewed could be placed into one of 4 categories, the majority being studies
relating in some way to the flexion relaxation phenomenon (FRP): Callaghan and Dunk 2002,
Hashemirad et al. 2009, Kaigle et al. 1998, Kienbacher et al. 2015, Luhring et al. 2015, Meyer et
al. 2009, McGill and Kippers 1994, Neblett et al. 2003, Ning et al. 2012, O’Sullivan et al 2006,
Paquet et al. 1998 and Sanchez-Zuriaga et al. 2015, or comparisons between LBP and healthy
control participant groups: Burnett et al. 2004, Dankaerts et al. 2009, Kaigle et al. 1998, Lariviere
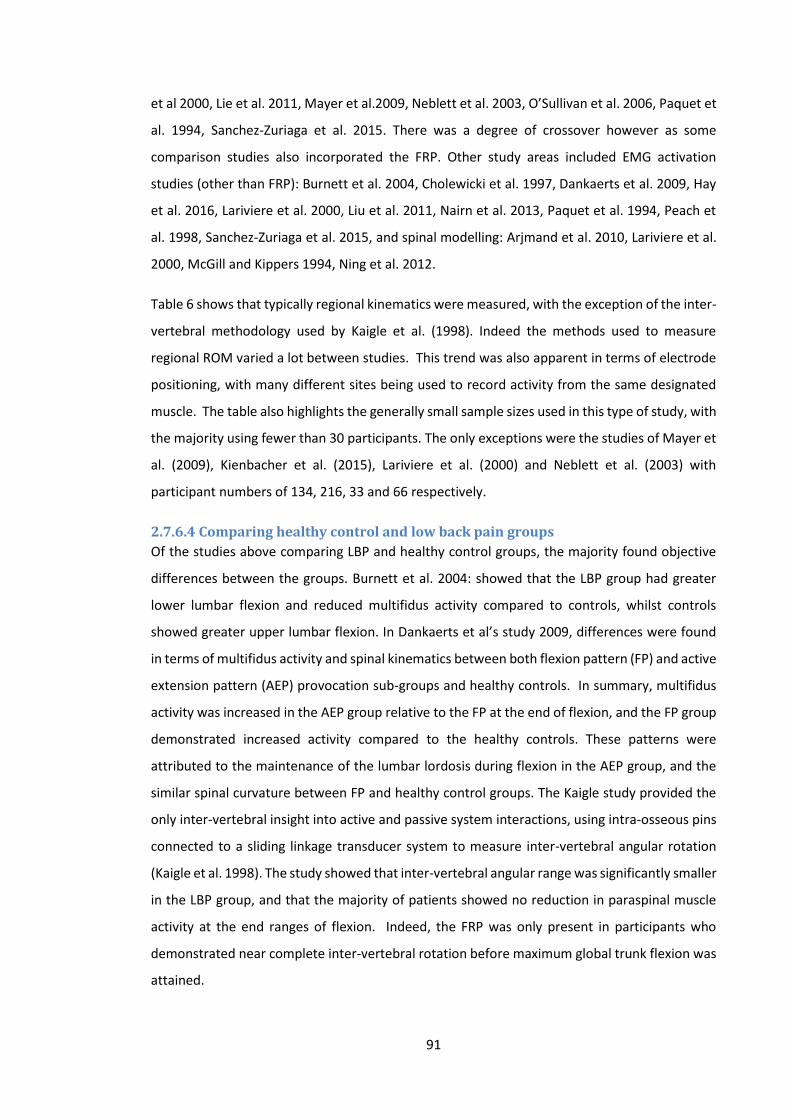
91
et al 2000, Lie et al. 2011, Mayer et al.2009, Neblett et al. 2003, O’Sullivan et al. 2006, Paquet et
al. 1994, Sanchez-Zuriaga et al. 2015. There was a degree of crossover however as some
comparison studies also incorporated the FRP. Other study areas included EMG activation
studies (other than FRP): Burnett et al. 2004, Cholewicki et al. 1997, Dankaerts et al. 2009, Hay
et al. 2016, Lariviere et al. 2000, Liu et al. 2011, Nairn et al. 2013, Paquet et al. 1994, Peach et
al. 1998, Sanchez-Zuriaga et al. 2015, and spinal modelling: Arjmand et al. 2010, Lariviere et al.
2000, McGill and Kippers 1994, Ning et al. 2012.
Table 6 shows that typically regional kinematics were measured, with the exception of the inter-
vertebral methodology used by Kaigle et al. (1998). Indeed the methods used to measure
regional ROM varied a lot between studies. This trend was also apparent in terms of electrode
positioning, with many different sites being used to record activity from the same designated
muscle. The table also highlights the generally small sample sizes used in this type of study, with
the majority using fewer than 30 participants. The only exceptions were the studies of Mayer et
al. (2009), Kienbacher et al. (2015), Lariviere et al. (2000) and Neblett et al. (2003) with
participant numbers of 134, 216, 33 and 66 respectively.
2.7.6.4 Comparing healthy control and low back pain groups
Of the studies above comparing LBP and healthy control groups, the majority found objective
differences between the groups. Burnett et al. 2004: showed that the LBP group had greater
lower lumbar flexion and reduced multifidus activity compared to controls, whilst controls
showed greater upper lumbar flexion. In Dankaerts et al’s study 2009, differences were found
in terms of multifidus activity and spinal kinematics between both flexion pattern (FP) and active
extension pattern (AEP) provocation sub-groups and healthy controls. In summary, multifidus
activity was increased in the AEP group relative to the FP at the end of flexion, and the FP group
demonstrated increased activity compared to the healthy controls. These patterns were
attributed to the maintenance of the lumbar lordosis during flexion in the AEP group, and the
similar spinal curvature between FP and healthy control groups. The Kaigle study provided the
only inter-vertebral insight into active and passive system interactions, using intra-osseous pins
connected to a sliding linkage transducer system to measure inter-vertebral angular rotation
(Kaigle et al. 1998). The study showed that inter-vertebral angular range was significantly smaller
in the LBP group, and that the majority of patients showed no reduction in paraspinal muscle
activity at the end ranges of flexion. Indeed, the FRP was only present in participants who
demonstrated near complete inter-vertebral rotation before maximum global trunk flexion was
attained.
92
Two of the studies were linked and provided similar conclusions. Neblett et al. 2003 showed that
in terms of the FRP and patients, all LBP patients that underwent a rehabilitation program
achieved normal ROM, and subsequently demonstrated the FRP, whilst Mayer et al. 2009
likewise concluded that normal lumbar ROM appears to correlate with the FRP, and was
therefore absent in many LBP participants. However, both FRP and ROM measurements
responded well after a generic rehabilitation program.
Using a network modelling and analysis approach Liu et al. 2011 claimed to be able to clearly
distinguish LBP and healthy control participants using symmetric patterns and network features,
and Paquet et al. 1994 showed that when flexion was performed over the same rate and range,
LES activity was significantly greater in the LBP group. Participants in the study with an absent
FRP also demonstrated increased ROM of the hip around full flexion.
Not all studies demonstrated an ability to differentiate between LBP and control groups
however. Lariviere et al. (2000) for example used a novel principal component analysis (PCA)
technique to investigate whether EMG and kinematics could distinguish between the two. Their
PCA analysis consisted of two steps. Firstly using EMG activity envelopes from control subjects,
a reference model was developed (i.e. a criteria for normal). Secondly ‘distance measures’ were
calculated relative to the reference model. The EMG waveform of a participant was labelled as
abnormal if the ‘distance value’ was outside a 95% confidence interval calculated from the
control subjects. Whilst being sensitive to trunk ROM, the distance measures were not sensitive
to low back pain status. The authors argued that this was likely due to the relatively small sample
size, and therefore inadequate considering the large heterogeneity control populations. In
conclusion it was considered that the tool developed was not useful in terms of distinguishing
between LBP patients and controls. Sanchez-Zuriaga et al. 2015 also demonstrated contrasting
results, as the authors found no significant difference between LBP and healthy groups, in either
FRP or lumbar ROM. The study did however show significantly greater LES activity in LBP
participants during the flexion-extension task, and the LBP patients were participating during a
pain free period.
2.7.6.5 Flexion relaxation studies
The results of some of the FRP studies have already been mentioned (Kaigle et al. 1998; Paquet
et al. 1994; Mayer et al. 2009; Neblett et al. 2003; McGill and Kippers 1994). Callaghan and Dunk
(2002) showed that during slumped sitting the TES exhibited the FRP, but the LES did not. The
authors also demonstrated that this deactivation occurred earlier (i.e. at a smaller lumbar flexion
angle) than LES deactivation during flexion from standing (Callghan and Dunk 2002). In contrast
93
to these findings, O’Sullivan et al. showed that although LMU activity decreased (i.e. FRP was
present) when going from a neutral to a slumped seated position, there were varying patterns
in TES activity, as approximately half the participants showed an increase in activity and half a
decrease (O’Sullivan et al. 2006). Hashemirad et al. showed that trunk flexibility can influence
FRP, with greater flexibility relating to FRP onset at larger flexion angles (Hashemirad et al.
2009), and Luhring et al. (2015) chose to address the problem of using different methodologies
to measure regional kinematics in FRP studies (by acknowledging a wide range of normalised
and un-normalised FRP onset angles), investigated whether lumbar (i.e. T12-L5) or trunk (i.e.
shoulders and hips) angles were more consistent in terms of EMG cessation and onset. The
study found that lumbar kinematic measurements were more consistent.
Finally, the study conducted by Ning et al. (2012) suggested that passive tissues can produce
significant loads at earlier trunk flexion angle than previously believed i.e. those suggested by
kaigle et al. (1998) where erector spinae deactivation was shown to begin at between 71° and
77° of grouped inter-vertebral level flexion, or Peach et al. (1998) where FRP was shown to occur
between 60° and 70°.
2.7.6.6 Models
Arjmand et al. (2010) compared EMG-driven (EMGAO) and multi-joint Kinematics-driven (KD)
models in terms of muscle force and spinal load estimation. During a flexion task the KD model
predicted greater paraspinal muscle activity compared to the EMGAO model and therefore
shear and compression forces were also higher. Predictions made using the EMGAO model were
also found to be level specific (i.e. L5-S1), and could not be an accurate representation of other
lumbar levels (Arjmand et al. 2010). Ning et al. 2012 as discussed above, determined at what
trunk flexion angle the passive tissues were able to generate a significant extensor moment
during forward bending (Ning et al. 2012), and McGill and Kippers 1994 showed that although
paraspinal muscles are electrically silent at the end range of forward flexion, these muscle
continue to provide elastic resistance via passive stretching.
2.7.7 Discussion
2.7.7.1 Quality assessment
The mean of the combined quality check and EMG scores was 77%, suggesting that the overall
quality of the studies reviewed was generally good. Of particular note were the studies of
Dankaerts et al. 2009, Kienbacher et al. 2016 and O’Sullivan et al. 2006, which all scored 100%.
The majority of studies used muscle activity amplitude as their key EMG parameter, and it was
94
apparent that the majority also reported the relevant normalisation technique. The high
percentage of good scores in this area, therefore makes it easier to compare amplitude results
between studies. Other areas of apparent good quality reporting included the descriptions of
the hypothesis, aims, and objectives of the studies, the main outcomes to be measured, the
interventions of interest and the main findings. In terms of EMG quality, relevant signal
processing information was also usually well reported.
This high standard of reporting was not evident throughout the review however, and trends in
areas that were weaker emerged. In terms of the Quality Index assessment scores, the reporting
of participant characteristics (including inclusion and exclusion criteria) and actual probability
values was poor, with over half of all studies included scoring zero for these categories.
Regarding the EMG quality assessment scores there was notably poor reporting of skin
preparation techniques, the placement and fixation of electrodes and details regarding the use
of reference electrodes, information that would be important if these studies were to be
replicated. Sample sizes were also generally small, with 17/21 studies using samples of <30
participants. This potentially weakens the statistical power of these studies, and increases the
chance of Type II errors.
2.7.7.2 Spinal stability and sub-system interaction
None of the studies included in this review had the specific objective to investigate sub-system
interaction (Table 6). The findings therefore can only loosely related to spinal control
mechanisms, with only studies providing inter-vertebral information discussing possible
mechanisms at the motion segment level. Indeed the objectives were so varied that making
comparisons between studies was difficult. That said, the majority of studies do consider
stabilisation, at least in a broad sense, and the following insights were provided.
McGill and Kippers (1994) suggested that an insight into interaction between sub-systems can
be found by examining the transfer of moment from active to passive tissues at the limits of
forward bending. Their investigation concluded that although electrically silent during full
flexion, paraspinal muscles continue to provide elastic resistance via passive stretching. They
suggest that this silence is an indication of the cessation of input from the central nervous
system, likely as a result of some sort of active or passive tissue feedback. As the study was
based on regional spinal measurements, nothing more than generalised theories could be
extrapolated. In agreement with McGill and Kippers and again highlighting a requirement for
inter-vertebral data, Arjmand et al. (2010) showed that in both models increased abdominal
95
coactivity was predicted at the end of forward flexion. This mechanism is proposed by both
studies to counterbalance moments in addition to the contributions of paraspinal muscles
(passive) and spinal ligaments.
In agreement with these studies, Paquet et al. (1994) suggested that increased paraspinal
activity permits the transmission of forces via these muscles, and is a mechanism to protect
damaged passive structures. It was proposed that the alteration in hip-spine movement pattern
in those with an absent FRP, may be a strategy to protect the lumbar spine near its maximum
range (i.e. near its peak bending moment). This raises the importance of being able to measure
kinematics in different regions of a chain (i.e. not just the lumbar region). Callaghan and Dunk
2002 found that FRP was not present in the TES muscle during bending. As the study did not
measure thoracic angular ROM however, and it is logical that considering the normal cascade of
spinal flexion, some thoracic movement will have been expected to occur before the onset of
movement in the lumbar region, it is difficult to comment on deactivation mechanisms.
However, the results do support the common conclusion in FRP studies that as passives tissues
are stretched, they eventually reach a point at which they can counter the moment produced
by bending the lower back. In this case, as flexion moment may be expected to be less during
slumped sitting than standing flexion, the passive tissues are able to support the moment
produced at a smaller lumbar angle. This is as much detail as the authors provided, and so it was
not possible to relate their findings to interactions between systems or feedback mechanisms.
The study of Hashemirad et al. (2009) was based on the idea that flexibility is linked to
characteristics of the active and passive tissues. The authors suggested that in agreement with
Panjabi’s hypotheses, when the CNS contends with increased flexibility in the passive tissues, it
responds by increasing the contribution of the active system. This mechanism is represented in
the study by the increased paraspinal activity associated with increased participant flexibility.
The authors go on to suggest that such a mechanism is likely a spinal stabilisation strategy,
however without inter-vertebral information this claim is difficult to support, and the reliability
of the flexibility tests used could also be questioned.
Generally speaking therefore, increased muscle activity is proposed as a mechanism that
increases spinal stability, the review did however provide some contrasting opinions. Peach et
al. (1998) investigating healthy controls, found a lack of co-contraction of abdominal and
paraspinal muscles during flexion. This therefore raises interesting questions concerning the
purpose of co-contraction in LBP patients, and optimally efficient strategies employed by
healthy spines. In this case no speculation was provided regarding subsystem interactions. This
96
is in contrast to the findings of Cholewicki et al. (1997) who showed that trunk flexor and
extensor co-activation was present during dynamic sagittal movement. The study however only
considered approximately 20° of flexion (i.e. around the neutral position) and cannot be
compared directly with studies such as Peach et al. (1998) where full flexion was performed. The
authors again conclude that the co-activation is a neuromuscular activation strategy to increase
stability of the lumbar spine. As a regional kinematic study, it was not possible to extrapolate
insights into system interactions, however the results do support Panjabi’s theory that any loss
of spinal stiffness as a result of passive tissue damage, can be compensated by an overall
increase in trunk muscle activation. As such muscle activity may be useful as a clinical indicator.
Further work was suggested which would benefit from investigations at the inter-vertebral level.
The findings of Sanchez-Zuriaga et al. (2015) question commonly held beliefs regarding spinal
feedback mechanisms. Their results suggested that paraspinal activity was increased
irrespective of the lumbar range of flexion achieved, and may therefore indicate that
deactivation mechanisms are not purely related to mechanoreceptor thresholds as suggested
elsewhere. Burnett et al. (2004) suggested that the LBP group in their study may have an
underlying motor control dysfunction, either as a response to, or predisposing factor to a lumbar
strain associated with the increased lower lumbar flexion and decreased local stabiliser activity.
This is of course in direct contrast to the results of FRP studies considered in this review, which
suggest that LBP is reflexively related to the increased activity of the paraspinals (i.e. the absence
of the FRP). The authors also suggest that examining regions of the lumbar spine is more
revealing than global, given the contrast in kinematic behaviours found between groups in terms
of lumbar regions. In agreement Dankaerts et al. 2009 concluded that their results (found in
both FP and AEP groups) likely represent maladaptive motor control strategies that potentially
act as catalysts for ongoing strain and pain production, increase spinal load and result in
impeded recovery. Yet again, no detail about the proposed mechanisms are provided, however
the value of further dividing kinematic regions (i.e. upper and lower lumbar spine) was shown.
The study by Kaigle et al. (1998) was unique in that it was the only study reviewed with the
capacity to comment on subsystem interactions at a motion segment level. In agreement with
the theory that ligaments stretched in full flexion provide afferent impulses that then inhibit
paraspinal muscles (Floyd and Silver 11955), the authors conclude that as the patient group
showed comparatively reduced inter-vertebral movement, the ligamentous mechanoreceptors
were not sufficiently stimulated to provoke muscular inhibition. Unfortunately, due to a small

97
sample size, the inter-vertebral data was pooled between levels, and so even this study did not
provide a truly inter-vertebral insight, something that is arguably required to advance
understanding in this area. Indeed, whilst the study of Arjmand was only small (n= 1), one of
the author’s key conclusions was that multi-joint kinematics combined with paraspinal EMG
recordings would improve modelling accuracy.
Taking a slightly different slant on stabilisation mechanisms, O’Sullivan et al. (2006) discussed
their findings in relation to global and local paraspinal activity (Bergmark 1989). The study
showed that TES activity was extremely variable in participants during bending, a finding the
authors suggested may be as a result of its role as a global muscle. As a globally acting muscle,
it was argued to have more potential for variation in motor pattern, as it is was not directly
responsible for local stabilisation as is the case for LMU. It may also be that the increase in TES
activity is a strategy to maintain stability when LMU activity decreases, a mechanism perhaps
employed to avoid excessive loading as a result of contraction (Granata and Marras 2000), or as
additional resistance to the moment of flexion provided by the passive structures. In addition,
Lariviere et al. (2000) showed that TES muscles likely compensate for LES muscles when less
active (such as during FRP). The authors suggest therefore it is likely that TES muscles have an
important role to play in LBP patient motor control strategies, and so consideration of thoracic
muscle activity should perhaps be given, even when investigations are focussed on dynamic
movement within the lumbar spine.
2.7.7.3 Can the information aquired by combining lumbar kinematic and muscle
activity measurements during functional movements assist in distinguishing
between groups of healthy controls and those with low back pain?
The review would suggest that there are many studies that have found distinguishing features
in LBP populations, however, generally the study populations were small, and the large
variations in methodology (particularly EMG placement and kinematic recordings) makes
further analysis (including meta-analysis) difficult. There were also studies however that
showed contrasting findings, or that were not able to distinguish between the two groups. The
wide range of methodological approaches makes it difficult to generalise such findings beyond
the specific populations involved, which is a major limitation of research in this field. Table 6,
shows that in no two studies were the EMG electrode locations the same, and likewise all
kinematic measurements differered in some way. This lack of standardisation makes the
interpretation of results and contrasting study results very difficult, and so relationships
between kinematic and EMG parameters and LBP are difficult to substantiate beyond the
individual studies. The review does however highlight the potential of some variables for this
98
purpose. As an example, Kienbacher et al. (2015) using root mean square EMG amplitude, and
regional measurements, showed that neuromuscular activation and kinematics can distinguish
between CNSLBP patients with impaired or unimpaired muscle activation strategies. They
suggest that the aging process is a stronger facilitator of this neuromuscular activity (i.e.
increased paraspinal activity) than the pain associated with the condition. This the authors
attribute to a likely increased excitability of the motor neurone pool associated with increased
age. The overall increase in activity is again associated with a stabilisation strategy for all low
back pain age groups.
This raises an important point, as it is unclear how pain can influence EMG and kinematic
measurements, should studies focus on healthy participants, or perhaps LBP groups that are
currently pain free, in order to account for the influence of pain? In the O’Sullivan et al. (2006)
and Callaghan and Dunk (2002) studies, both investigated low back pain free populations, and
therefore the disagreement in their results is most likely explained by methodological
differences. The authors also suggest however that as TES activity is highly variable between
individuals, this could possible represent inherently different motor control strategies. In
addition to O’Sullivan’s findings (where no thoracic kinematic data was available), Nairn et al.
(2013) measured thoracic movement, and showed that the deactivation of the TES during
slumped sitting was related to increased angles of the thoracic segment movement. This
supports the view that the decrease in activity is somehow related to stretch feedback of the
ligaments, and the authors concluded that regional information was therefore important. In
agreement, Luhring et al. (2015) argued that the global approach (i.e. global trunk angle) was
less preferable to the local approach (i.e. lumbar angle) as the mechanism of FRP is proposed to
be dependent on local lumbar structures. This is a logical conclusion to make, and in
continuation it is likely preferable still to obtain inter-vertebral information that relates directly
to the lumbar structures involved.
2.7.8 Conclusions Many studies found differences in kinematic or EMG variables capable of distinguishing between
LBP and healthy control groups, however the differences in methodology between studies mean
that no broad generalisations can be made.
No one study set out with the explicit objective to explore sub-system interaction, however
many did attempt to relate their findings to such mechanisms. A common weakness in study
design was that studies used regional kinematic measurements, which can only ever at best,

99
provide a broad interpretation of sub-system interaction. It was therefore unsurprising that
conclusions relating to system interaction were limited. The studies that did were arguably
those that took a closer look using regions divided or inter-vertebral kinematic measurements
(Dankaerts et al. 2009; Kaigle et al. 1998), and even these did not use truly inter-vertebral data,
as the data was pooled from several inter-vertebral levels.
There is an apparent unmet need to better understand spinal stability and Panjabi’s 1992
assertion that the passive, active and motor control systems need to act in concert for function
to be optimal. If there are changes in one sub-system it is assumed that there will be changes in
the other sub-systems to compensate. It would appear however that since Panjabi’s seminal
spinal control papers, not much has been learnt. This is perhaps partially due to the fact that
studies either focus on sub-systems individually or that it has not been possible to study their
interactions during dynamic tasks.
It has been shown that although it is possible to measure numerous variables relating to spinal
function, until one can measure in vivo inter-vertebral dynamic kinematics and relate it to one
of the other sub-systems in detail, it will not be possible to make significant progress in this area.
This lack of progression was reflected in this review, and highlights the requirement for new
approaches to research that incorporate these elements. Future studies should consider
technologies that enable inter-vertebral measurements, not just in the lumbar spine but ideally
throughout the thoracic, pelvic, hip and cervical regions too. It has been shown that stabilisation
during forward bending can be influenced by the paraspinal muscle activity of both flexors and
extensors, and abdominals, and that the TES may play an important role in lumbar stabilisation
(Reeves et al. 2006; Van Dieen et al. 2003). These muscles should therefore be included in
studies whenever possible. Standardisation of investigation methodologies is also
recommended, as the current heterogeneity in approaches, makes any comparison between
studies difficult.

100
Section 8
2.8.1 Summary and conclusions It is believed that passive, active and neural control systems combine and interact in order to
stabilise the lumbar spine during dynamic movements, and that the moments and reaction
forces produced by the active and passive tissues provide equilibrium (Willard 2012). Previous
studies’ attempts to identify biomechanical factors associated with CNSLBP however, frequently
demonstrate contradictions in their findings. This may be partially explained by the large array
of potentially influential biomechanical factors, by the use of different methodologies, and the
unknown biomechanical influence of pain. Therefore, in order to better determine
biomechanical links with CNSLBP, it is first necessary to improve understanding of normal spinal
biomechanics5.
Investigations into normal spinal biomechanics at an inter-vertebral level will provide a deeper
insight into how interactions at this level contribute to the control mechanisms of the spine. In
order to investigate the inter-play between the active, passive and neural control systems
(Panjabi 1992a) during sagittal flexion, a method that combines continuous kinematic and EMG
information is required, however the selection of an appropriate technique requires the
consideration of many factors.
As a capacity to measure continuous inter-vertebral kinematic information is the principal
methodological requirement, the options available are limited, and all have their own
advantages and disadvantages. The use of skin surface markers is non-invasive, allows normal
free-bending, and is not restricted in terms of range; however its ability to accurately and reliably
measure inter-vertebral movement is inferior to other techniques. The use of imaging modalities
such as x-ray, QF and MRI are therefore preferable in this regard.
There are exceptions (Olsson 1976), but typically the use of x-ray and MRI are limited by an
inability to measure spinal movements continuously throughout their range, and cannot be used
to acquire higher order variables such as initial attainment rate, or IV-RoMmax. These
requirements can be met with the use of fluoroscopy however, and QF is a fluoroscopic
measurement technique that has also undergone much standardisation (Breen et al. 2012).
The standardisation of QF (i.e. regulating movement rate and range using a motion frame and
pelvic stabilisation) minimises the effects of behavioural variations in terms of the rate and range
5 For the purpose of this thesis, all references to normal biomechanics refers to populations who were free from low back pain (stating an absence of any historical low back pain) at the time of investigation.

101
of movement. Also, by restraining the pelvis, the technique effectively isolates movement to
the lumbar spine, which is arguably essential if outcome measures are to be compared between
individuals; however it is also associated with methodological disadvantages. The QF technique
is currently confined to the measurement of a single spinal region (i.e. lumbar spine only), and
can therefore not accommodate influences from the thoracic spine, pelvis or lower limbs. The
restriction of range also means that if QF were combined with EMG, muscle activity information
between the range limit and full sagittal flexion would be excluded, and the use of a pelvic
restraint will reduce the influence of pelvic and lower limb musculature (although it could be
argued that such activity is actually confounding).
Whilst desirable, there have been very few previous attempts to obtain concurrent inter-
vertebral motion and EMG measurements (Kaigle et al. 1998), which is reflective of the historic
technological limitations associated with doing so, and the ethical considerations linked with
more invasive techniques. The development of QF means that if combined with EMG, the
technology now exists that can provide a solution to these problems, and their concurrent use
would be the first time these technologies have been combined in order to examine the
biomechanics of the lumbar spine in vivo.
In this study therefore, a protocol was developed to investigate the relationships between inter-
vertebral kinematics and muscle activity, whilst addressing many of the limitations associated
with previous study designs. Whilst the study combines two pre-established technologies, this
has not been done previously, and therefore merging two existing technologies in order to
create new knowledge is novel. The reliability and agreement of the kinematic and EMG
amplitude measures used in this study will also be determined.
IV-RoMmax was selected as the primary variable, and in consideration of the literature review
and some preliminary research (Chapter 3), the following hypotheses, aims, research questions
and objectives were developed.
2.8.2 Study hypotheses, aims, research question and objectives
2.8.2.1 Hypothesis
Relationships will be found between lordosis, kinematic (i.e. IV-RoMmax and initial
attainment rate) and muscle activity variables and the IV-RoMmax of inter-vertebral
levels between L2 and S1 during standardised weight-bearing sagittal flexion
2.8.2.2 Sub hypotheses
There will be an inverse relationship between muscle activity and the IV-RoMmax

102
There will be an inverse relationship between the LES/TES ratio and IV-RoMmax
There will be a direct relationship between the size of muscle deactivation and IV-
RoMmax
There will be a direct relationship between the size of lordosis and IV-RoMmax in the
upper lumbar segments, and vice versa
There will be a direct relationship between initial attainment rate and IV-RoMmax at the
same level
There will be an inverse relationship between IV-RoMmax in the upper and IV-RoMmax
in the lower lumbar segments
2.8.2.3 Aim
The aim of this thesis is to investigate the relationships that exist between lumbar inter-
vertebral motion and lumbar spinal muscle electrical activity in healthy adults during
standardised weight-bearing forward bending
2.8.2.4 Secondary aims
To investigate the relationships that exist between lumbar inter-vertebral motion and
other lumbar kinematic variables (including lordosis) in healthy adults during
standardised weight-bearing forward bending
2.8.2.5 Research question
Do any of the morphological (i.e. lordosis), kinematic or muscle activity parameters investigated
demonstrate significant relationships with IV-RoMmax?
2.8.2.6 Objectives
Develop a protocol that combines QF and sEMG technologies in order to address the
study’s hypotheses
Determine the reliability and agreement of QF IV-RoMmax and initial attainment rate,
and (sEMG) RMS amplitude measurements recorded during a standardised weight-
bearing sagittal flexion protocol
Determine the relationships between lordosis and the IV-RoMmax achieved during a
standardised weight-bearing sagittal flexion protocol
Determine the relationships between initial attainment rate and the IV-RoMmax
achieved during a standardised weight-bearing sagittal flexion protocol
Determine the relationships between IV-RoMmax at other inter-vertebral levels and the
IV-RoMmax at a specific lumbar level achieved during a standardised weight-bearing
sagittal flexion protocol
103
Determine the relationships between mean sEMG muscle activity ratios and the IV-
RoMmax achieved during a standardised weight-bearing sagittal flexion protocol
Determine the relationships between sEMG inter-level muscle activity ratios and the IV-
RoMmax achieved during a standardised weight-bearing sagittal flexion protocol
Determine the relationships between sEMG amplitude changes and the IV-RoMmax
achieved during a standardised weight-bearing sagittal flexion protocol
In order to address these objectives, an appropriate study protocol was developed, which forms
the basis of chapter 4. Prior to this however, and in addition to the literature review, the
following chapter outlines the preliminary works that were conducted to inform various aspects
of the study’s design. These include investigations into, 1. The most appropriate plane of motion
for study, 2. The relationships between lordosis and lumbar IV-RoMmax, and 3. The effect of
electrode displacement on sEMG signal amplitude.
104
Chapter 3: Preliminary studies
The following preliminary studies were conducted to inform the design of the main study. The
initial proposal for the project funding of this study outlined the investigation of the
biomechanics of the lumbar spine in lateral bending. As supported by the literature review
however, the sagittal plane is most frequently investigated, and so an exploration of the benefits
and drawbacks of investigations into both sagittal and coronal planes was required. The first
preliminary study therefore considered which of the two planes would be most suitable to
investigate, by examining recumbent and weight-bearing, coronal and sagittal flexion motion
data. The second study investigated the relationship between lordosis and IV-RoMmax. This
was an area where gaps in the literature were apparent, and the study was therefore required
to support the development of a study hypothesis relating to these parameters (section 2.7.2.2).
Finally the third study investigated the effect of electrode displacement on sEMG signal
amplitude, providing an indication of how important electrode placement accuracy would be in
the main study.
3.1 Choosing an appropriate plane of motion
3.1.1. Introduction
The purpose of this preliminary study was to compare lumbar spinal kinematics (measured using
QF) between coronal and sagittal planes in both recumbent and weight-bearing protocols, in
order to gain an insight into which plane may be best suited for further investigation. As the
muscle activity during recumbent examinations may be considered negligible (Mellor 2009), it
was hypothesised that any difference in the kinematic behaviour found during weight-bearing
may be partially attributable to the associated muscle activity. An investigation incorporating
both recumbent and weight bearing data was therefore carried out to determine the feasibility
of the coronal and sagittal planes in the context of this study.
3.1.2 Method
Coronal images from five participants and sagittal images from ten participants were selected
from an on-going normative database study (Section 4.2.1) to be marked-up and analysed.
Coronal image sequences of participants’ left and right lateral flexion whilst recumbent and
weight bearing at baseline and follow up at six weeks (40 motion graphs in total) were analysed.
Sagittal image sequences of participants’ flexion and return whilst recumbent and weight-
bearing, were analysed at baseline only (20 motion graphs in total). Details of the marking-up
process and protocol can be found elsewhere (Section 4.2.6). IV-RoMmax, motion share

105
(calculated as each motion segments proportional contribution to overall L2-S1 angular range)
and initial attainment rate values were read off the Graphical User Interface (GUI) (Figure 40)
for ten participants in both the sagittal recumbent and weight bearing examinations.
3.1.3 Data Analysis
Graphs from both planes (e.g. Figures 25-28) were analysed visually for patterns and coronal
and sagittal plane graphs were compared. Box and whisker plots were produced from the
sagittal plane data. The normality of each data set was tested using the Shapiro-Wilk test. IV-
RoMmax, motion share and initial attainment rate during sagittal recumbent and weight-
bearing sagittal examinations were compared using the Wilcoxon signed rank test for non-
parametric data, and the paired t-test for parametric data. All statistical tests were performed
using IBM SPSS (Version 21). Tables of raw data can be viewed (Appendix K).
3.1.4 Results
Figures (25-28) are examples of the inter-vertebral range of motion (IV-ROM) graphs produced
for each plane in one participant. The x-axis represents image number6, and the y-axis motion
segment angular rotation in degrees. The coloured key shows the individual inter-vertebral
levels.
Figure 25: A sagittal plane recumbent (flexion and return) motion graph
6 Image number can also be considered a surrogate for time (e.g. the entire sagittal plane flexion and return sequence (Figure 25)) represents approximately 20 seconds.
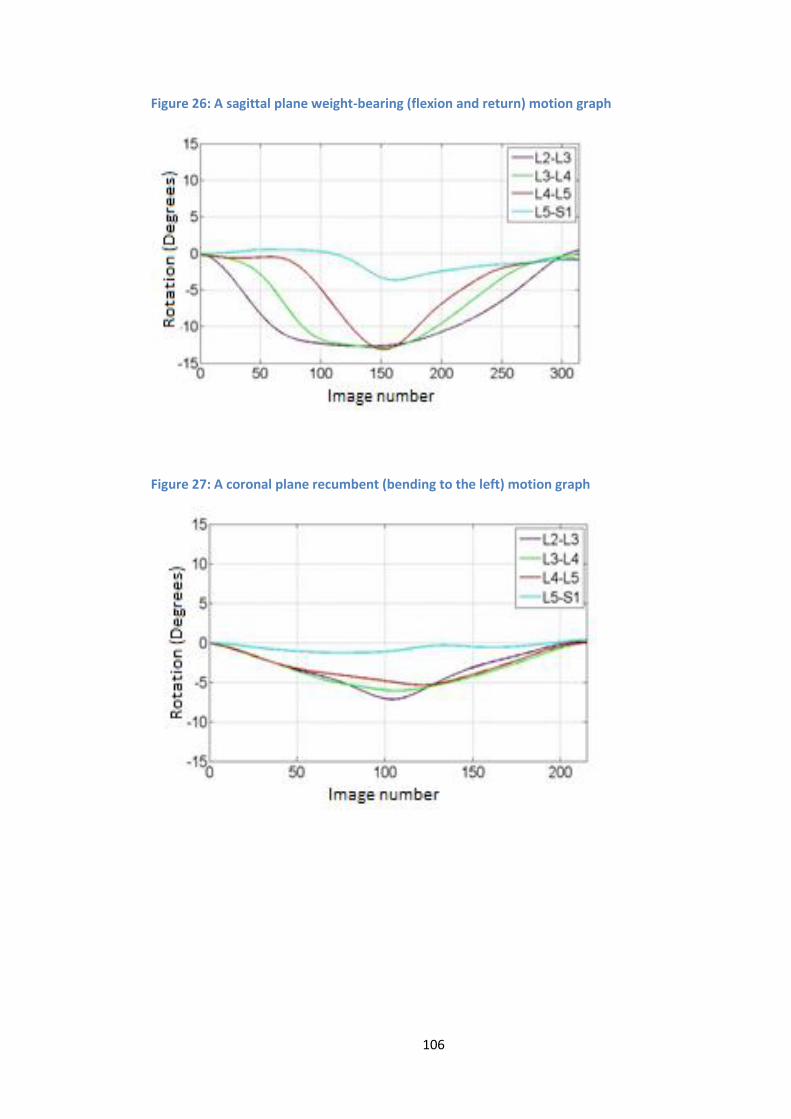
106
Figure 26: A sagittal plane weight-bearing (flexion and return) motion graph
Figure 27: A coronal plane recumbent (bending to the left) motion graph

107
Figure 28: A coronal plane weight-bearing (bending to the left) motion graph
Note: The coronal plane weight-bearing motion graph includes an additional inter-vertebral level (L1-L2) represented
by the dark blue line. This highlights the fact that if the L1 vertebra is visible in the x-ray image throughout the cycle,
then it can be included. This is not possible in the majority of cases when L5-S1 is also required.
In the comparison of sagittal plane recumbent and weight-bearing data, a statistically significant
difference between groups was taken as a two tailed p-value of < 0.05. Significant differences
were found in IV-ROMmax at inter-vertebral levels L2-L3, L3-L4 and L4-L5 (Figure 29), motion
share at L2-L3 and L5-S1 (Figure 30), and initial attainment rate at L2-L3 (Figure 31).
Figure 29: Box and whisker plot comparing IV-RoMmax between recumbent and weight-bearing groups during sagittal flexion and return
Note: The black horizontal line within each box represents the mean of the data. The top and bottom whiskers
represent the maximum and minimum data values. The top and bottom sides of each box represent the upper and
lower quartiles of each data set. Statistically significant differences (< 0.05) between recumbent and weight-bearing
measurements at each inter-vertebral level are represented by *.
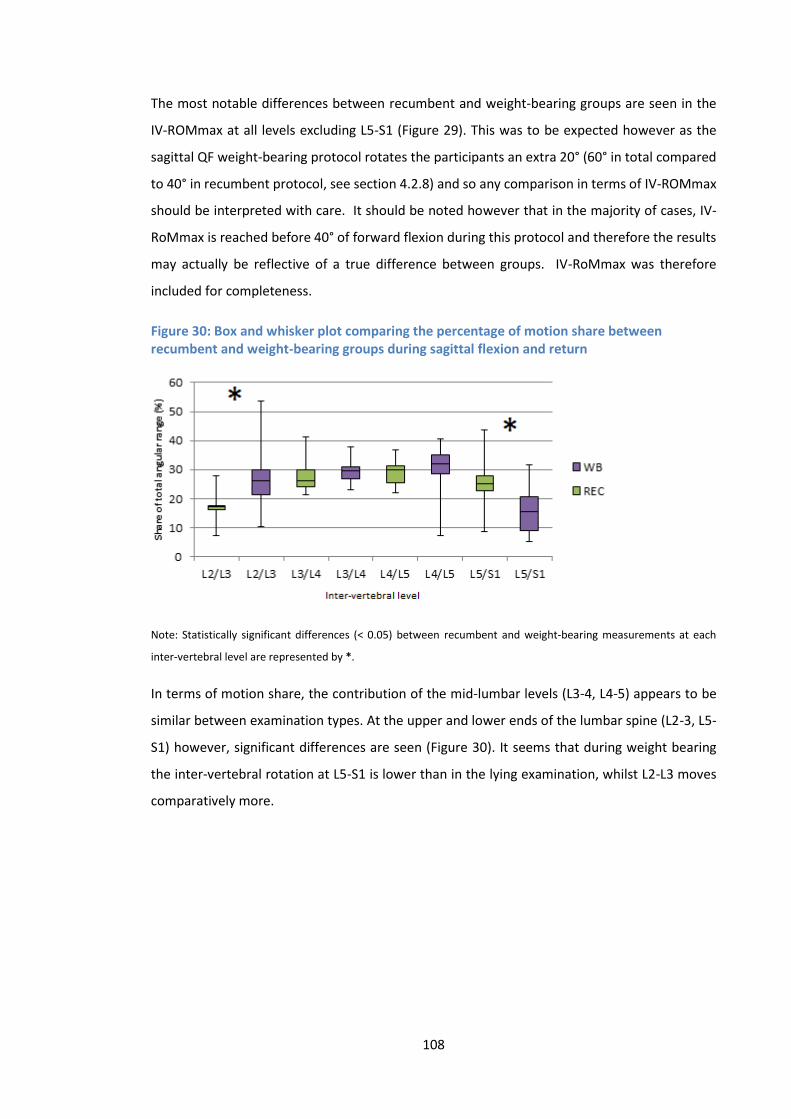
108
The most notable differences between recumbent and weight-bearing groups are seen in the
IV-ROMmax at all levels excluding L5-S1 (Figure 29). This was to be expected however as the
sagittal QF weight-bearing protocol rotates the participants an extra 20° (60° in total compared
to 40° in recumbent protocol, see section 4.2.8) and so any comparison in terms of IV-ROMmax
should be interpreted with care. It should be noted however that in the majority of cases, IV-
RoMmax is reached before 40° of forward flexion during this protocol and therefore the results
may actually be reflective of a true difference between groups. IV-RoMmax was therefore
included for completeness.
Figure 30: Box and whisker plot comparing the percentage of motion share between recumbent and weight-bearing groups during sagittal flexion and return
Note: Statistically significant differences (< 0.05) between recumbent and weight-bearing measurements at each
inter-vertebral level are represented by *.
In terms of motion share, the contribution of the mid-lumbar levels (L3-4, L4-5) appears to be
similar between examination types. At the upper and lower ends of the lumbar spine (L2-3, L5-
S1) however, significant differences are seen (Figure 30). It seems that during weight bearing
the inter-vertebral rotation at L5-S1 is lower than in the lying examination, whilst L2-L3 moves
comparatively more.
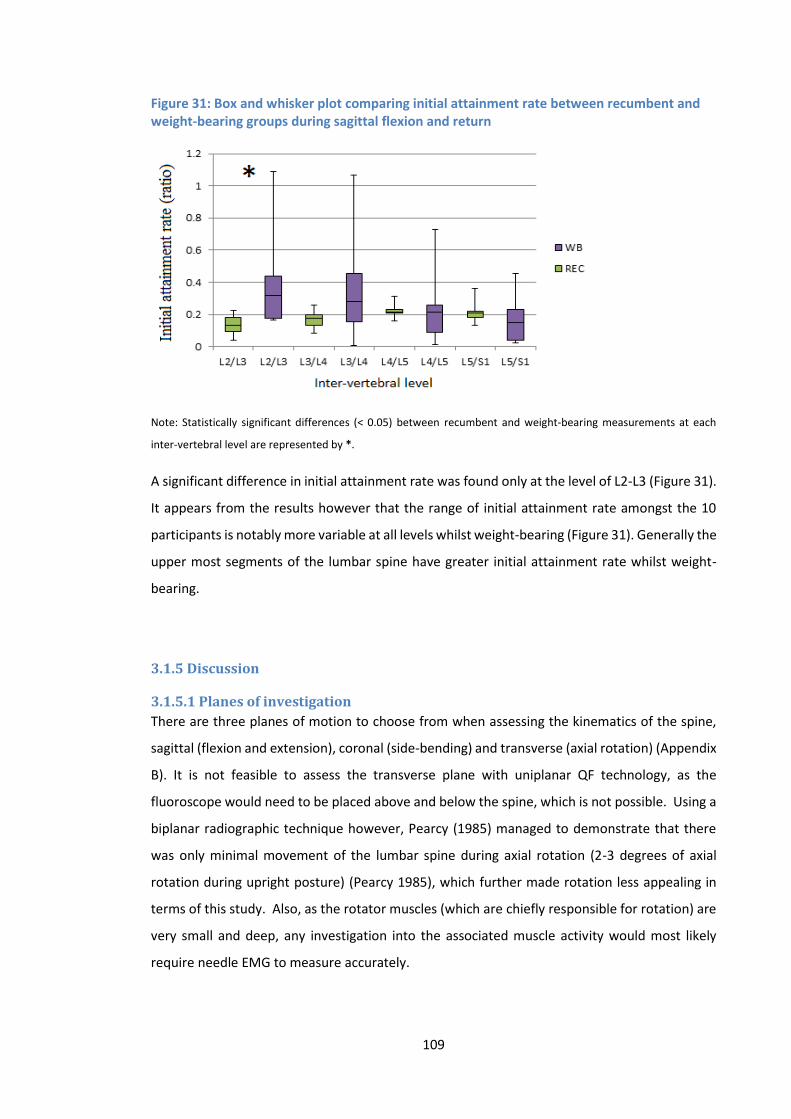
109
Figure 31: Box and whisker plot comparing initial attainment rate between recumbent and weight-bearing groups during sagittal flexion and return
Note: Statistically significant differences (< 0.05) between recumbent and weight-bearing measurements at each
inter-vertebral level are represented by *.
A significant difference in initial attainment rate was found only at the level of L2-L3 (Figure 31).
It appears from the results however that the range of initial attainment rate amongst the 10
participants is notably more variable at all levels whilst weight-bearing (Figure 31). Generally the
upper most segments of the lumbar spine have greater initial attainment rate whilst weight-
bearing.
3.1.5 Discussion
3.1.5.1 Planes of investigation
There are three planes of motion to choose from when assessing the kinematics of the spine,
sagittal (flexion and extension), coronal (side-bending) and transverse (axial rotation) (Appendix
B). It is not feasible to assess the transverse plane with uniplanar QF technology, as the
fluoroscope would need to be placed above and below the spine, which is not possible. Using a
biplanar radiographic technique however, Pearcy (1985) managed to demonstrate that there
was only minimal movement of the lumbar spine during axial rotation (2-3 degrees of axial
rotation during upright posture) (Pearcy 1985), which further made rotation less appealing in
terms of this study. Also, as the rotator muscles (which are chiefly responsible for rotation) are
very small and deep, any investigation into the associated muscle activity would most likely
require needle EMG to measure accurately.
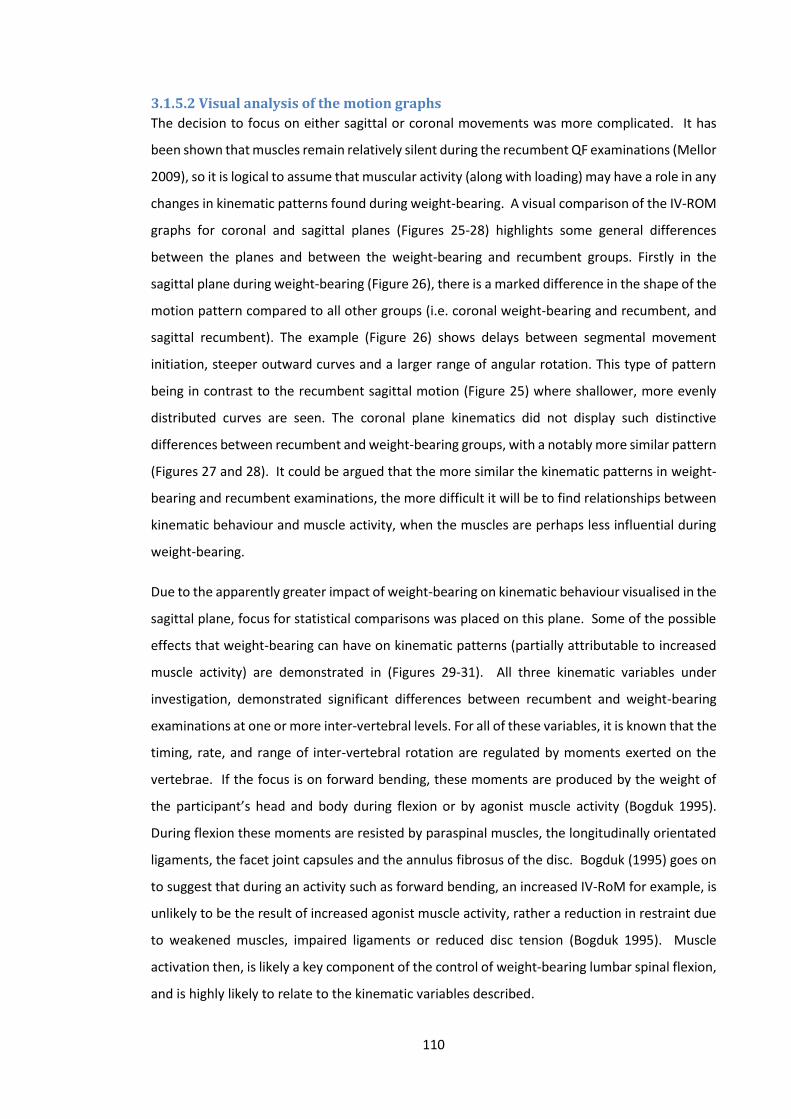
110
3.1.5.2 Visual analysis of the motion graphs
The decision to focus on either sagittal or coronal movements was more complicated. It has
been shown that muscles remain relatively silent during the recumbent QF examinations (Mellor
2009), so it is logical to assume that muscular activity (along with loading) may have a role in any
changes in kinematic patterns found during weight-bearing. A visual comparison of the IV-ROM
graphs for coronal and sagittal planes (Figures 25-28) highlights some general differences
between the planes and between the weight-bearing and recumbent groups. Firstly in the
sagittal plane during weight-bearing (Figure 26), there is a marked difference in the shape of the
motion pattern compared to all other groups (i.e. coronal weight-bearing and recumbent, and
sagittal recumbent). The example (Figure 26) shows delays between segmental movement
initiation, steeper outward curves and a larger range of angular rotation. This type of pattern
being in contrast to the recumbent sagittal motion (Figure 25) where shallower, more evenly
distributed curves are seen. The coronal plane kinematics did not display such distinctive
differences between recumbent and weight-bearing groups, with a notably more similar pattern
(Figures 27 and 28). It could be argued that the more similar the kinematic patterns in weight-
bearing and recumbent examinations, the more difficult it will be to find relationships between
kinematic behaviour and muscle activity, when the muscles are perhaps less influential during
weight-bearing.
Due to the apparently greater impact of weight-bearing on kinematic behaviour visualised in the
sagittal plane, focus for statistical comparisons was placed on this plane. Some of the possible
effects that weight-bearing can have on kinematic patterns (partially attributable to increased
muscle activity) are demonstrated in (Figures 29-31). All three kinematic variables under
investigation, demonstrated significant differences between recumbent and weight-bearing
examinations at one or more inter-vertebral levels. For all of these variables, it is known that the
timing, rate, and range of inter-vertebral rotation are regulated by moments exerted on the
vertebrae. If the focus is on forward bending, these moments are produced by the weight of
the participant’s head and body during flexion or by agonist muscle activity (Bogduk 1995).
During flexion these moments are resisted by paraspinal muscles, the longitudinally orientated
ligaments, the facet joint capsules and the annulus fibrosus of the disc. Bogduk (1995) goes on
to suggest that during an activity such as forward bending, an increased IV-RoM for example, is
unlikely to be the result of increased agonist muscle activity, rather a reduction in restraint due
to weakened muscles, impaired ligaments or reduced disc tension (Bogduk 1995). Muscle
activation then, is likely a key component of the control of weight-bearing lumbar spinal flexion,
and is highly likely to relate to the kinematic variables described.
111
3.1.5.3 The pros and cons of investigating the coronal plane
A major benefit of investigating the coronal plane is that in terms of muscular activity there is a
very clear relationship between the agonist paraspinal activity and the movement of lateral
bending (i.e. in order for an individual to bend to the right, the right erector spinae will activate,
and typically the left erector spinae will relax), yet according to Lariviere et al. (2000) the most
commonly studied plane is the sagittal (Lariviere et al. 2000). There are many possible reasons
for this apparent preference in the research, especially when considering the use of EMG. For
example, there are potential issues when using the coronal plane in terms of additional sources
of EMG signal contamination. There is an increased risk of creasing of the skin during side-
bending manoeuvres which can contaminate the signal, and due to the close proximity of
electrodes required to record from multiple levels of the lumbar musculature simultaneously,
side-bending can result in electrodes touching, a problem less likely to be seen during flexion
where a small separation is seen.
Kasman (1997) states that “EMG findings on the sagittal plane are more discriminate between
subjects who are healthy and those with chronic dysfunction and that side-bending manoeuvres
are subsequently of subsidiary interest” (Kasman et al. 1997). It has also been shown that
differences in sEMG measurements are much more pronounced in the sagittal plane compared
to the coronal (Van Dieen et al. 2003), a beneficial quality when determining patterns from the
recorded data. The relatively smaller changes observed during side-bending could be
problematic, as activity patterns are less distinctive, and with only a small difference between
active recordings and those at baseline (during rest), the interpretation of true muscle activity
becomes more difficult.
In terms of the kinematic measurements, Pearcy (1985) also demonstrated that while there is
only minimal axial rotation and lateral bending accompanying flexion and extension movements,
lateral bending was associated with a substantial amount of concurrent axial rotation (Pearcy
1985). Although a previous QF based study concluded that up to 10° of out of plane motion
does not significantly affect inter-vertebral angle measurement accuracy (Breen et al. 2006), this
lack of coupled movement, combined with the relatively larger segmental motion in the sagittal
plane, perhaps make it preferable to the coronal in terms of kinematic assessment (Edwards et
al. 1987; Keessen 1984).
3.1.5.4 Muscle activity onset and offset parameters
One of the sEMG variables considered for use in the main study was signal onset and offset. If
relationships were to be found between muscle activity onset or offset and patterns of spinal
movement, they were most likely if temporal patterns also existed within the spinal segmental
112
movement. The results show that the only configuration that regularly demonstrated such phase
lag, was sagittal weight-bearing (Figure 26), and was therefore arguably the most suitable option
if signal onset or offset parameters were to be used.
Given the evidence of a ‘phase lag’ in terms of inter-vertebral movement onset observed in the
weight-bearing sagittal plane motion graphs, it was hypothesised that such delays may be
related to the surrounding musculature preventing the initialisation of the movement, and then
subsequently allowing the motion to occur (via deactivation) later in the flexion phase. The
potential link between phase lag and muscle activity onset and offset was therefore considered
to be of interest.
Note: During the sEMG reliability and agreement studies (Section 5.2) it became clear that determining muscle activity
onset was not possible using the current weight-bearing protocol. In simple terms, it was difficult to obtain relaxation
at all three muscle levels at the same time, at the forward bending starting position (i.e. neutral upright standing
position). It has been suggested that during neutral standing, participants will have a tendency to fall forwards or
backwards depending on their centre of gravity (Floyd and Silver 1955), and that males in particular tend to stand in
a posture of slight flexion (Norton 2004). As the sagittal alignment of the majority of participants was apparently
anterior to the L5-S1 disc, there was generally an intermittent or constant activity in one or more of the paraspinal
levels whilst standing, hence the naming of the erector spinae muscle group, as they maintain the spine in the erect
position, or return it to this position after movement (Kippers and Parker 1984). In terms of signal offset, the sEMG
repeatability studies also highlighted the fact that the range of forward flexion (60°) performed by participants during
the weight-bearing protocol was not sufficient to initiate the FRP phenomenon. Therefore whilst deactivation of
muscle activity may have begun, complete electrical silence will typically not occur.
3.1.5.5 The influence of kinematic behaviours during sagittal weight-bearing on
sEMG recording site positioning decisions
The IV-RoMmax, motion share, initial attainment rate and phase lag variables were all
demonstrated to be viable options for use in the main study, and the significant differences in
these variables observed between weight-bearing and recumbent sagittal groups influenced
decisions regarding sEMG electrode positioning decisions. The upper and lower sections of the
lumbar spine were of particular interest, as the L2-3 level for example demonstrated significant
differences for all variables measured, as did L5-S1 in terms of motion share. Significant
differences were less frequently observed in the mid-lumbar spine (although phase lag was
regularly observed at these levels). The lumbar lordosis was also a consideration, as it was
believed that muscle activity would vary dependent on spinal curvature, and so it was decided
on balance that the upper and lower ends of the lumbar spine would be the most appropriate
sites for sEMG recordings. In order to examine potential relationships between kinematic
behaviour and the more globally acting paraspinal musculature, sEMG recording from an
additional thoracic level was also incorporated into the study design (Section 4.2.15).

113
3.1.6 Conclusion
It has been shown that lumbar spinal kinematics in the sagittal plane demonstrate more
variation in inter-vertebral phase lag, greater initial motion curve steepness, and greater
variation in angular range than those exhibited during lateral bending. When examining the
sagittal plane further, significant differences in all kinematic variables were found between
weight-bearing and recumbent groups. It is proposed that these differences will partially be due
to the muscular activity associated with the weight-bearing examination, which lends weight to
the argument that relationships could most readily be found between lumbar kinematics and
muscle activity during a weight-bearing sagittal plane protocol. The ease of collection,
heterogeneity (between participants) and the relative size of variables achievable in the sagittal
plane, also better lend themselves to the detection of patterns within them. In light of these
conclusions, and in addition to the findings of the literature review, the sagittal plane was
selected as the plane of investigation for the main study.
Note: It cannot be assumed that the activity of muscles is entirely responsible for the differences in
kinematic behaviour observed between recumbent and weight-bearing participants, as passive influences
such as the discs, ligaments, bony anatomy and sagittal alignment may also change when weight-bearing.
For example, it has been suggested that lordosis during neutral standing is comparable to that of a patient
in supine position, with legs straight (Been and Kalichman 2014), the recumbent protocol used in the
normative study (section 4.2.1) however requires side-lying and bent legs, which results in a different
resting lordosis to the weight-bearing cycle, and may therefore have affected the movement patterns.
The possible relationships between lordosis and lumbar spinal kinematics (i.e. IV-RoMmax) are explored
in the next section.
114
3.2 An exploration into the relationships between the degree of
lordosis and lumbar IV-RoMmax during weight-bearing sagittal flexion,
and a visual analysis of the order and magnitude of inter-vertebral
movements.
3.2.1 Introduction
The literature review was unable to provide a clear idea as to how IV-RoMmax may change in
relation to changes in lordosis. It was therefore necessary to conduct the following study to help
inform the development of a study sub-hypothesis (Section 2.7.2.2). This preliminary study
therefore had two main aims. As the degree of lumbar lordosis is thought to influence the
kinematics of the lumbar spine (Keorochana 2011), the first aim was to explore how the degree
of lordosis relates to lumbar IV-RoMmax. The second aim was to determine the order of
segmental movement initiation and the magnitude of inter-vertebral movements. Information
regarding the order of movement initiation and the angular range achieved at different inter-
vertebral levels may provide an insight into the likely associated spinal muscle activity.
3.2.2 Methods
The data retrieved from the 10 weight-bearing sagittal plane images taken from the 10
participants used in Preliminary Study 1 (Section 3.1.2), were re-used in this study. The mean
angular ranges of each inter-vertebral level during weight-bearing sagittal plane flexion and
return were compared when the starting lordosis angle was divided into 3 groups within its total
range, group A = 30-45°, B = 46-60° and C=61-75°. The angle of lordosis was calculated as the
sum of all absolute inter-vertebral angles (L2-L3 – L5-S1) taken from the first QF image. For
interpretation purposes, group A was taken as the lower range, group B as the mid-range, and
Group C as the higher range of normal lumbar lordosis. Motion graphs were also visually ranked
according to angular range (Table 8) and in the order of segmental onset (Table 9). The data
were tabulated and colour coded in order for patterns to be easily distinguished. (The splitting
of the lordotic angle into 3 groups was done arbitrarily, and may not be representative of normal
ranges in other populations).
3.2.3 Data analysis
The results were analysed using visual interpretation of the graph (Figure 32) and tables (Tables
7,8 and 9).
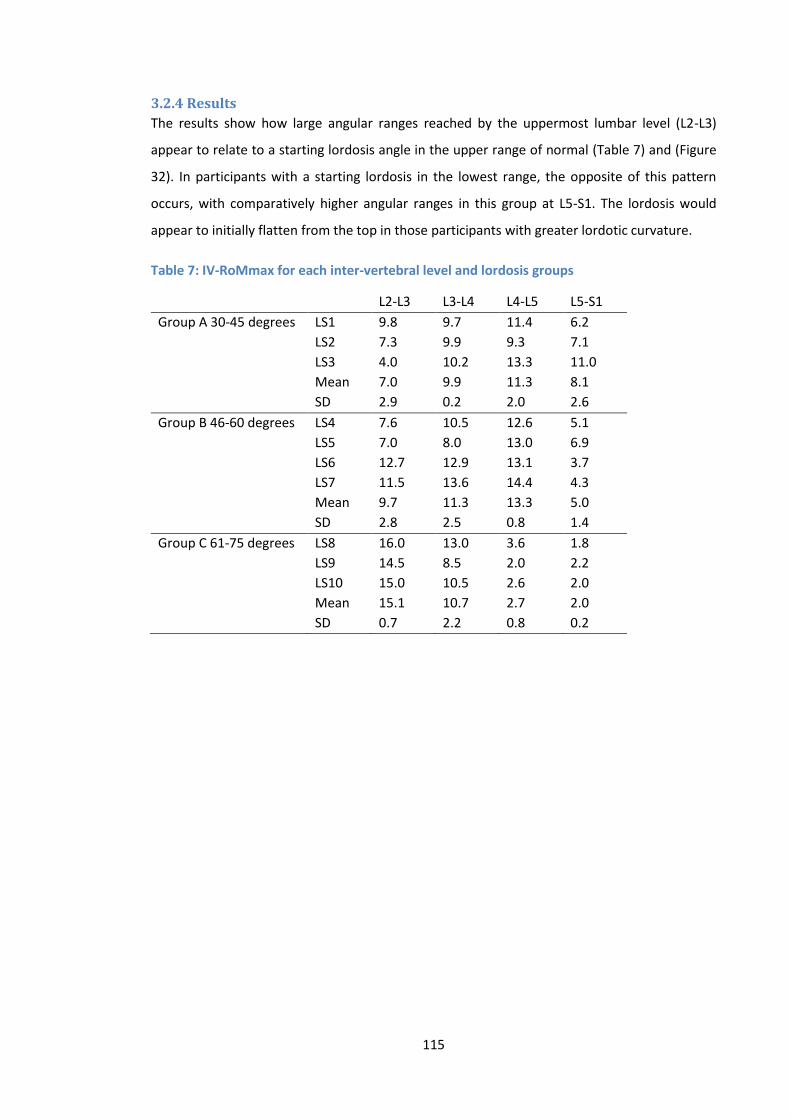
115
3.2.4 Results
The results show how large angular ranges reached by the uppermost lumbar level (L2-L3)
appear to relate to a starting lordosis angle in the upper range of normal (Table 7) and (Figure
32). In participants with a starting lordosis in the lowest range, the opposite of this pattern
occurs, with comparatively higher angular ranges in this group at L5-S1. The lordosis would
appear to initially flatten from the top in those participants with greater lordotic curvature.
Table 7: IV-RoMmax for each inter-vertebral level and lordosis groups
L2-L3 L3-L4 L4-L5 L5-S1
Group A 30-45 degrees LS1 9.8 9.7 11.4 6.2 LS2 7.3 9.9 9.3 7.1 LS3 4.0 10.2 13.3 11.0 Mean 7.0 9.9 11.3 8.1 SD 2.9 0.2 2.0 2.6
Group B 46-60 degrees LS4 7.6 10.5 12.6 5.1 LS5 7.0 8.0 13.0 6.9 LS6 12.7 12.9 13.1 3.7 LS7 11.5 13.6 14.4 4.3 Mean 9.7 11.3 13.3 5.0 SD 2.8 2.5 0.8 1.4
Group C 61-75 degrees LS8 16.0 13.0 3.6 1.8 LS9 14.5 8.5 2.0 2.2 LS10 15.0 10.5 2.6 2.0 Mean 15.1 10.7 2.7 2.0 SD 0.7 2.2 0.8 0.2
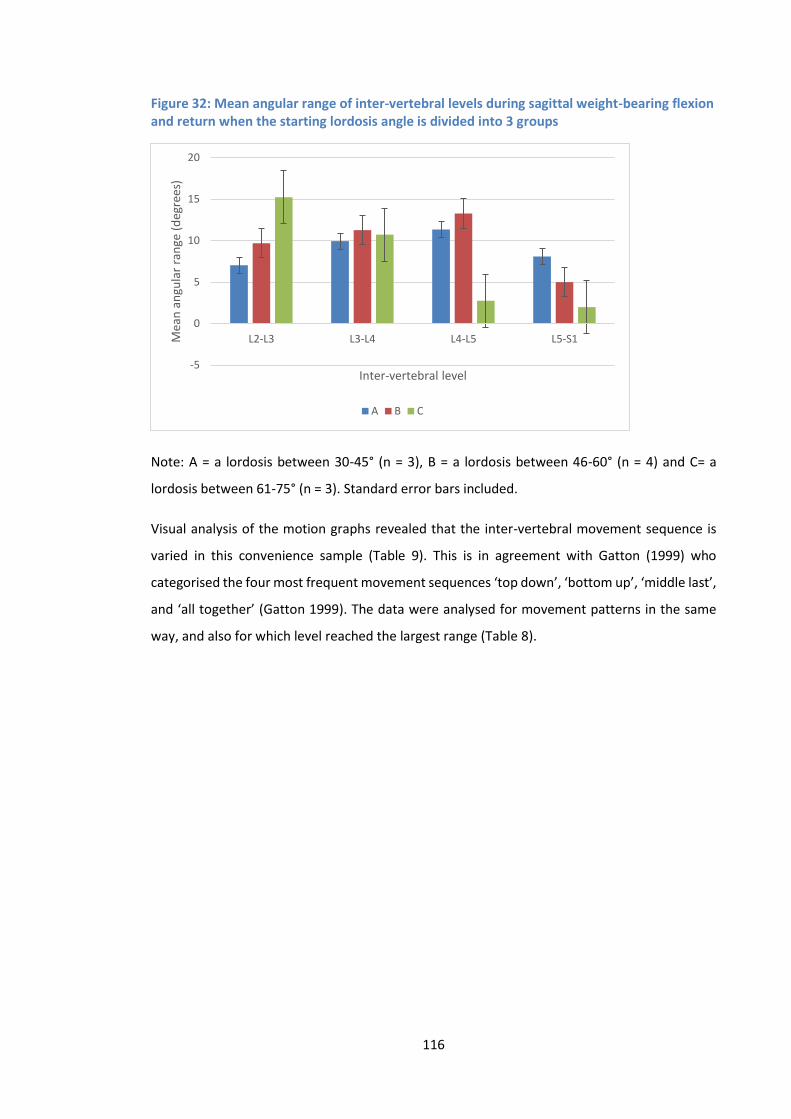
116
Figure 32: Mean angular range of inter-vertebral levels during sagittal weight-bearing flexion and return when the starting lordosis angle is divided into 3 groups
Note: A = a lordosis between 30-45° (n = 3), B = a lordosis between 46-60° (n = 4) and C= a
lordosis between 61-75° (n = 3). Standard error bars included.
Visual analysis of the motion graphs revealed that the inter-vertebral movement sequence is
varied in this convenience sample (Table 9). This is in agreement with Gatton (1999) who
categorised the four most frequent movement sequences ‘top down’, ‘bottom up’, ‘middle last’,
and ‘all together’ (Gatton 1999). The data were analysed for movement patterns in the same
way, and also for which level reached the largest range (Table 8).
-5
0
5
10
15
20
L2-L3 L3-L4 L4-L5 L5-S1Mea
n a
ngu
lar
ran
ge (
deg
rees
)
Inter-vertebral level
A B C
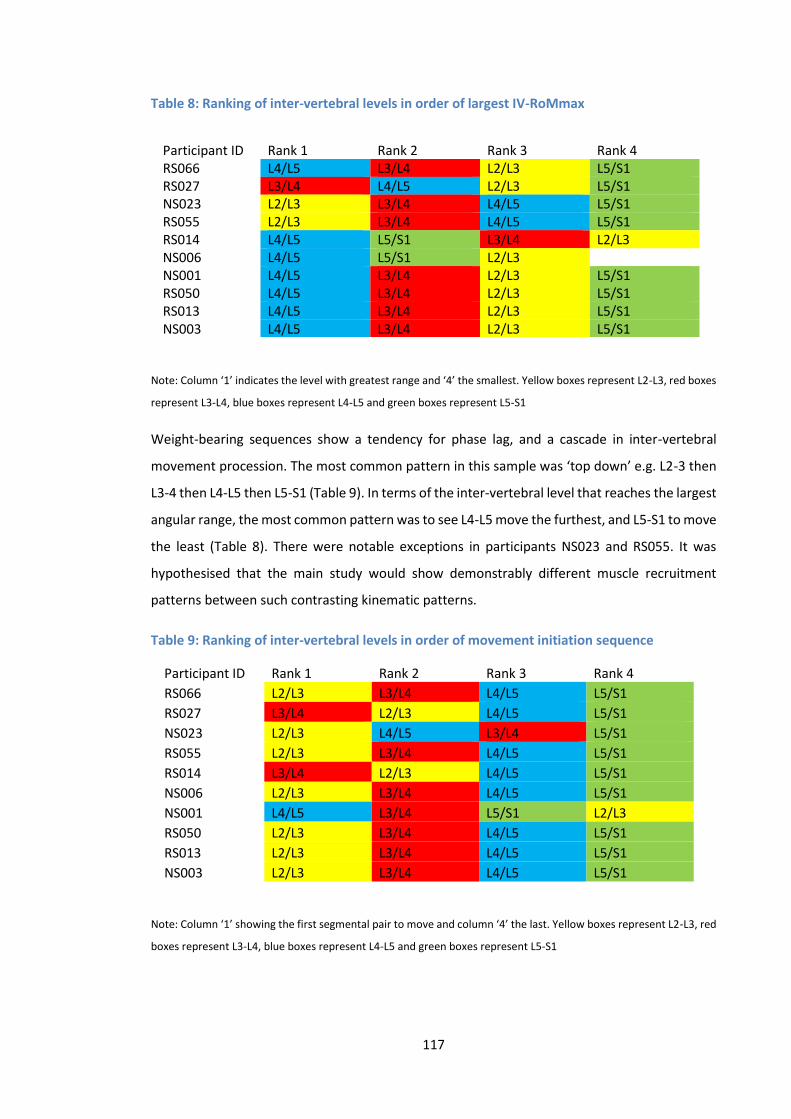
117
Table 8: Ranking of inter-vertebral levels in order of largest IV-RoMmax
Note: Column ‘1’ indicates the level with greatest range and ‘4’ the smallest. Yellow boxes represent L2-L3, red boxes
represent L3-L4, blue boxes represent L4-L5 and green boxes represent L5-S1
Weight-bearing sequences show a tendency for phase lag, and a cascade in inter-vertebral
movement procession. The most common pattern in this sample was ‘top down’ e.g. L2-3 then
L3-4 then L4-L5 then L5-S1 (Table 9). In terms of the inter-vertebral level that reaches the largest
angular range, the most common pattern was to see L4-L5 move the furthest, and L5-S1 to move
the least (Table 8). There were notable exceptions in participants NS023 and RS055. It was
hypothesised that the main study would show demonstrably different muscle recruitment
patterns between such contrasting kinematic patterns.
Table 9: Ranking of inter-vertebral levels in order of movement initiation sequence
Participant ID Rank 1 Rank 2 Rank 3 Rank 4
RS066 L2/L3 L3/L4 L4/L5 L5/S1
RS027 L3/L4 L2/L3 L4/L5 L5/S1
NS023 L2/L3 L4/L5 L3/L4 L5/S1
RS055 L2/L3 L3/L4 L4/L5 L5/S1
RS014 L3/L4 L2/L3 L4/L5 L5/S1
NS006 L2/L3 L3/L4 L4/L5 L5/S1
NS001 L4/L5 L3/L4 L5/S1 L2/L3
RS050 L2/L3 L3/L4 L4/L5 L5/S1
RS013 L2/L3 L3/L4 L4/L5 L5/S1
NS003 L2/L3 L3/L4 L4/L5 L5/S1
Note: Column ‘1’ showing the first segmental pair to move and column ‘4’ the last. Yellow boxes represent L2-L3, red
boxes represent L3-L4, blue boxes represent L4-L5 and green boxes represent L5-S1
Participant ID Rank 1 Rank 2 Rank 3 Rank 4 RS066 L4/L5 L3/L4 L2/L3 L5/S1 RS027 L3/L4 L4/L5 L2/L3 L5/S1 NS023 L2/L3 L3/L4 L4/L5 L5/S1 RS055 L2/L3 L3/L4 L4/L5 L5/S1 RS014 L4/L5 L5/S1 L3/L4 L2/L3 NS006 L4/L5 L5/S1 L2/L3 NS001 L4/L5 L3/L4 L2/L3 L5/S1 RS050 L4/L5 L3/L4 L2/L3 L5/S1 RS013 L4/L5 L3/L4 L2/L3 L5/S1 NS003 L4/L5 L3/L4 L2/L3 L5/S1
118
3.2.5 Discussion
Lumbar lordosis increases when the spine is in the standing position (Fernand 1985). A study of
300 asymptomatic participants by Vialle et al. (2005) measured standing lordosis as the angle
between the superior endplate of L1 and the inferior endplate of L5 (Vialle et al. 2005). They
found that the mean lordosis in this population was 43° (SD 11.2) (Range 13.6-69°). No direct
comparison can be made due to differences in measurement method and sample size, but our
small study mean was 52° (SD 11.1) (Range 36.8-69.5°).
In a review of methods that evaluate sagittal plane curvature in 2D images, Vrtovec et al (2009)
commented on the limitations of the widely used ‘modified Cobb method’, suggesting that
although the technique reflects endplate tilt, it is not revealing regarding regional changes in the
curve (Vrtovec et al. 2009). The method used in the current study accounted for variation
between the caudal and cephalic measurement point, by taking the sum of all lumbar inter-
vertebral angles. It would appear that the lumbar lordosis flattens predominantly from the top
in those with a greater curvature. These results agree with Keorochana (2011) who concluded
that differences in lumbar lordosis may be associated with such differences in the lumbar spine
kinematics (Keorochana 2011).
The spinal kinematic patterns produced during sagittal flexion (Tables 3 and 4) indicate a degree
of variation between individuals. The literature is conflicting, and is undecided as to whether
lumbar segments begin their movement simultaneously (Ahmadi et al. 2009; Lee 2002; Wong
2006; Wong 2004), sequentially (Kanayama 1996) or a mixture of the two (Okawa 1998;
Takayanagi 2001). This led Ahmadi et al (2009) to comment that a ‘normal’ movement pattern
of the lumbar spine during flexion is yet to be determined (Ahmadi et al. 2009). This study has
shown a mixed range of movement patterns, with evidence of a lag between initiations of
movement between levels frequently apparent in the weight-bearing group. This is in
agreement with the findings of (Gatton 1999), however this study using QF has the advantage
of analysing true segmental motion, which must be a consideration when compared to such
investigations (e.g. Gatton (1999)) that used skin mounted sensors.
The order and magnitude of segmental movement are variables that can provide an indication
as to the possible concurrent muscle activation patterns. It may be hypothesised for example
that greater paraspinal muscle activity (larger sEMG amplitudes) will be recorded at levels
demonstrating the smaller angular ranges relative to those levels with more rotation, and that
decreased activity may also be found in the upper lumbar region in participants with a relatively
greater lordosis. It may also be expected that sEMG signal offset will relate to the order of
119
segmental motion, for example in the most frequently observed ‘top down’ cascade we may see
a delay in activity deactivation between L2 and L5, a pattern that may be reversed in segmental
sequences that initiate from lower segments.
The results suggest that lordosis may have an influence over both kinematic and muscle activity
behaviours during weight-bearing sagittal flexion.
3.2.6 Conclusion
The angle of lordosis taken from the first QF image appears to affect the subsequent kinematic
patterns. This supports the inclusion of Lordosis for analysis in the main study. It is also logical
to suggest that participants demonstrating different kinematic movement patterns such as
movement initiation from the upper lumbars compared to those with initiation from the lower
lumbars, may also have corresponding differences in the controlling muscle activity. This
supports the recording of sEMG from both upper and lower sections of the lumbar spine (e.g.
LES and LMU).
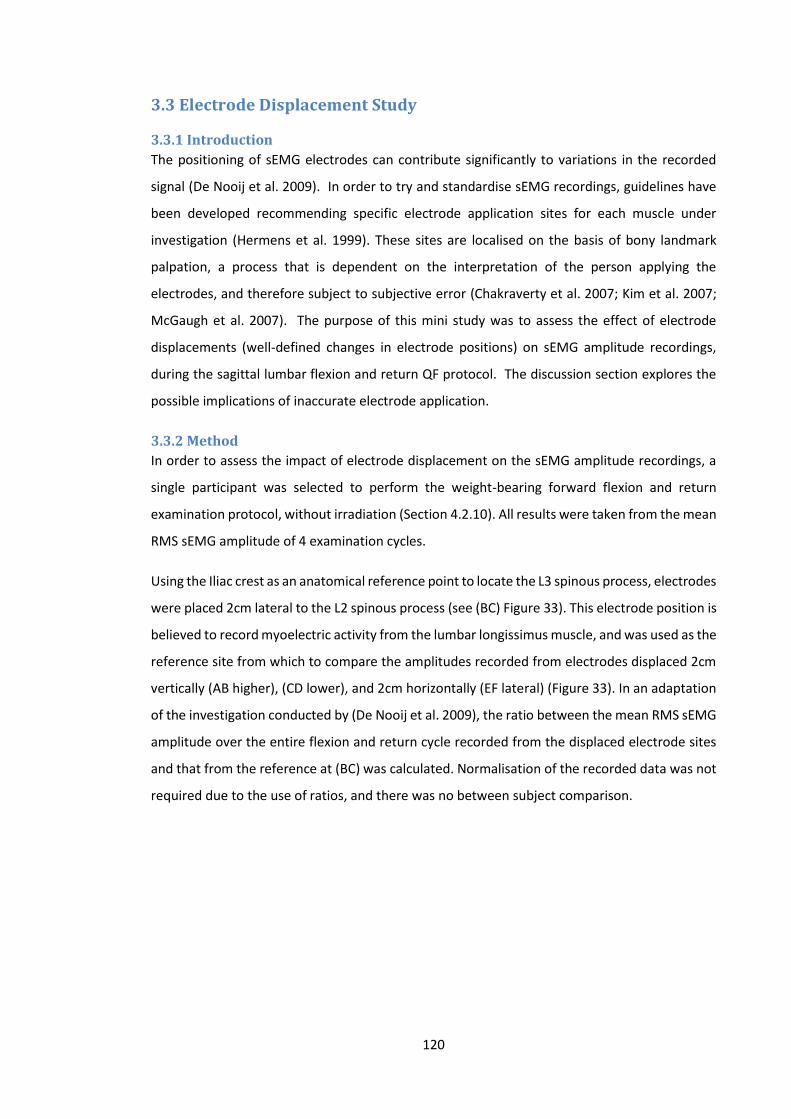
120
3.3 Electrode Displacement Study
3.3.1 Introduction
The positioning of sEMG electrodes can contribute significantly to variations in the recorded
signal (De Nooij et al. 2009). In order to try and standardise sEMG recordings, guidelines have
been developed recommending specific electrode application sites for each muscle under
investigation (Hermens et al. 1999). These sites are localised on the basis of bony landmark
palpation, a process that is dependent on the interpretation of the person applying the
electrodes, and therefore subject to subjective error (Chakraverty et al. 2007; Kim et al. 2007;
McGaugh et al. 2007). The purpose of this mini study was to assess the effect of electrode
displacements (well-defined changes in electrode positions) on sEMG amplitude recordings,
during the sagittal lumbar flexion and return QF protocol. The discussion section explores the
possible implications of inaccurate electrode application.
3.3.2 Method
In order to assess the impact of electrode displacement on the sEMG amplitude recordings, a
single participant was selected to perform the weight-bearing forward flexion and return
examination protocol, without irradiation (Section 4.2.10). All results were taken from the mean
RMS sEMG amplitude of 4 examination cycles.
Using the Iliac crest as an anatomical reference point to locate the L3 spinous process, electrodes
were placed 2cm lateral to the L2 spinous process (see (BC) Figure 33). This electrode position is
believed to record myoelectric activity from the lumbar longissimus muscle, and was used as the
reference site from which to compare the amplitudes recorded from electrodes displaced 2cm
vertically (AB higher), (CD lower), and 2cm horizontally (EF lateral) (Figure 33). In an adaptation
of the investigation conducted by (De Nooij et al. 2009), the ratio between the mean RMS sEMG
amplitude over the entire flexion and return cycle recorded from the displaced electrode sites
and that from the reference at (BC) was calculated. Normalisation of the recorded data was not
required due to the use of ratios, and there was no between subject comparison.
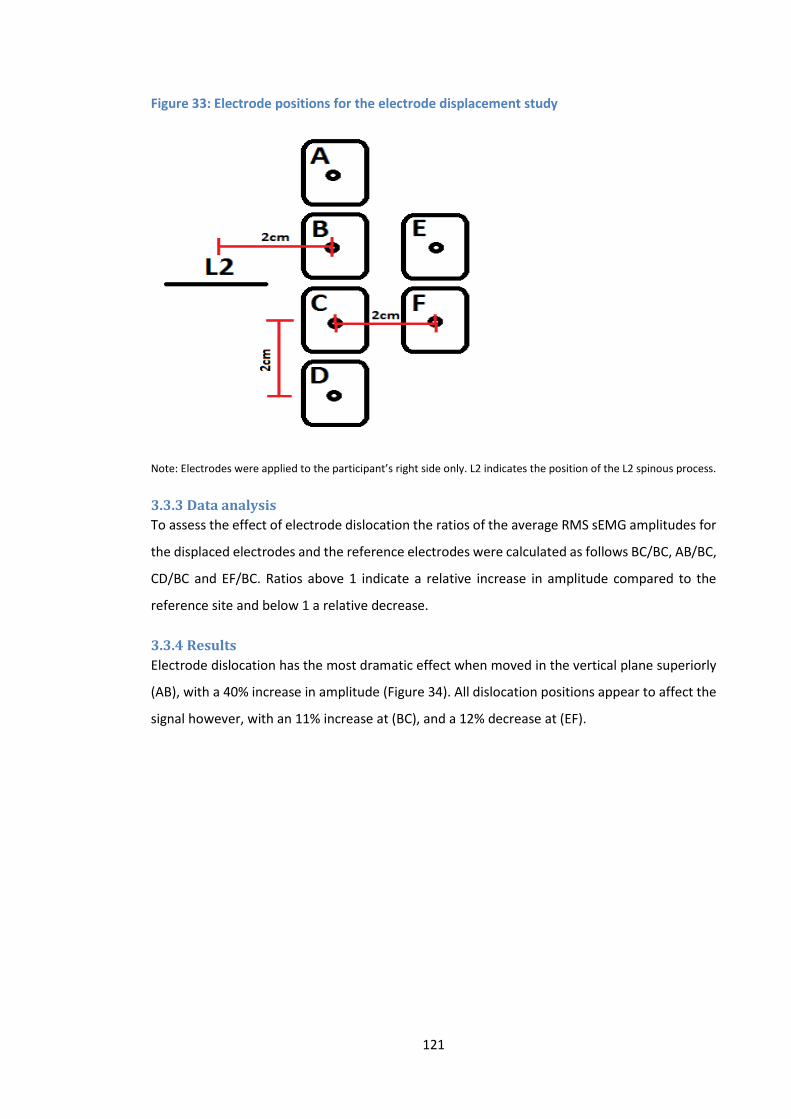
121
Figure 33: Electrode positions for the electrode displacement study
Note: Electrodes were applied to the participant’s right side only. L2 indicates the position of the L2 spinous process.
3.3.3 Data analysis
To assess the effect of electrode dislocation the ratios of the average RMS sEMG amplitudes for
the displaced electrodes and the reference electrodes were calculated as follows BC/BC, AB/BC,
CD/BC and EF/BC. Ratios above 1 indicate a relative increase in amplitude compared to the
reference site and below 1 a relative decrease.
3.3.4 Results
Electrode dislocation has the most dramatic effect when moved in the vertical plane superiorly
(AB), with a 40% increase in amplitude (Figure 34). All dislocation positions appear to affect the
signal however, with an 11% increase at (BC), and a 12% decrease at (EF).
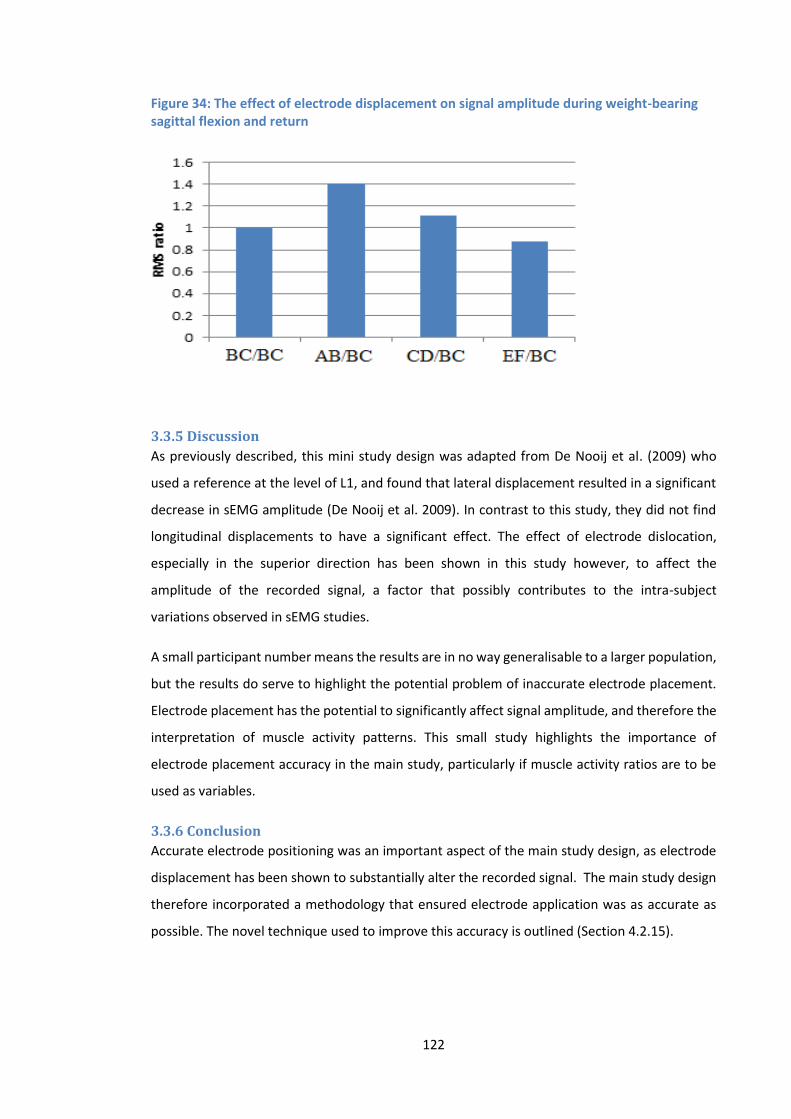
122
Figure 34: The effect of electrode displacement on signal amplitude during weight-bearing sagittal flexion and return
3.3.5 Discussion
As previously described, this mini study design was adapted from De Nooij et al. (2009) who
used a reference at the level of L1, and found that lateral displacement resulted in a significant
decrease in sEMG amplitude (De Nooij et al. 2009). In contrast to this study, they did not find
longitudinal displacements to have a significant effect. The effect of electrode dislocation,
especially in the superior direction has been shown in this study however, to affect the
amplitude of the recorded signal, a factor that possibly contributes to the intra-subject
variations observed in sEMG studies.
A small participant number means the results are in no way generalisable to a larger population,
but the results do serve to highlight the potential problem of inaccurate electrode placement.
Electrode placement has the potential to significantly affect signal amplitude, and therefore the
interpretation of muscle activity patterns. This small study highlights the importance of
electrode placement accuracy in the main study, particularly if muscle activity ratios are to be
used as variables.
3.3.6 Conclusion
Accurate electrode positioning was an important aspect of the main study design, as electrode
displacement has been shown to substantially alter the recorded signal. The main study design
therefore incorporated a methodology that ensured electrode application was as accurate as
possible. The novel technique used to improve this accuracy is outlined (Section 4.2.15).
123
3.4 Summary
These preliminary investigations helped to inform the design of the main study. They assisted
in the decision to focus on the sagittal plane, and highlighted some of the benefits and
drawbacks of the different kinematic variables available. It was concluded that IV-RoMmax,
initial attainment rate, and lordosis had potential for use as parameters in the main study.
Motion share was also considered to be of potential value, but in order to limit the complexity
of analysis, it was decided that this variable would not be investigated further at this time. The
importance of accurate sEMG electrode application was also highlighted.
The following chapter describes the QF and sEMG variables selected for investigation, and
outlines the main study protocol.
124
Chapter 4: Methodology
4.1 Introduction In Chapter 2 it was determined that QF and sEMG were the most appropriate techniques to
provide concurrent information regarding inter-vertebral movement and myoelectric activity
during sagittal forward bending of the lumbar spine. This chapter outlines the combined QF and
sEMG methodology designed to address the study’s aims and objectives, and describes the
variables selected. The chapter consists of two sections. Section 1: describes the kinematic,
morphological and sEMG variables selected for inclusion in the study, and section 2: outlines the
main study methodology.
4.1.1 Section 1: Variables selected for investigation The following section outlines the parameters that were selected for investigation in the main
study. Their suitability for inclusion was based on the previous section and the literature review.
4.1.1.1 Main outcome variable: IV-RoMmax
As the primary aim of the study was to investigate biomechanical relationships, it was important
to select an outcome variable that would likely demonstrate associations with other variables.
IV-RoMmax can be considered as an indication of the resistance to inter-vertebral rotation
during bending, and will therefore relate to other parameters representative of active and
passive tissue function. These include the longitudinally orientated paraspinal muscles
(characterised by sEMG amplitude measurements), as they are ideally positioned to resist
sagittal flexion (Bogduk 2012), and the discs and ligaments (characterised by the initial
attainment rate (Mellor F.E. et al. 2014)). IV-RoM is also a variable that is easily understood,
that can be measured with precision (Breen et al. 2006), and demonstrates a high degree of
heterogeneity (Deitz 2011), a characteristic that increased the probability of finding
relationships between IV-RoMmax and other mechanical parameters.
4.1.1.2 Other QF variables
Lumbar lordosis
Initial attainment rate
4.1.1.3 sEMG variables
The mean RMS sEMG amplitude (normalised to a sMVC) of TES, LES and LMU over the
flexion phase of the cycle
RMS sEMG amplitude ratios normalised to a sMVC (e.g. LMU/TES, LMU/LES and
LES/TES)
125
Changes in RMS sEMG amplitude normalised to a sMVC between 5 consecutive epochs
over the flexion phase of the cycle7
4.2 Section 2: Main study methodology
4.2.1 Study design
This was an exploratory cross-sectional pilot study of healthy volunteers. All participants
received a lumbar flexion QF examination in the sagittal plane with the concurrent sEMG
recording of their lumbar paraspinal muscle activity.
This study was incorporated into an ongoing normative database study entitled: Characteristics
of lumbar spine inter-vertebral kinematics in healthy adults and their reproducibility over time:
A standardised reference and reliability study for future explanatory trials of mechanical
interventions for non-specific back pain. The purpose of that ongoing work is to establish a
database of the normal mechanics of the lumbar spine in people without low back pain, to which
the kinematic data collected during this study, will contribute. By recruiting subjects that were
eligible to participate in both studies, it was possible to avoid the unnecessary irradiation of
additional participants.
4.2.2 Sample size
This study was the first of its kind, and there is no prior information from which to base a sample
size on. It may therefore be considered an exploratory pilot trial, for which there is a minimum
suggested sample size requirement of 12 participants (Julious 2005). The justifications for this
sample size were based on feasibility, precision about the mean and variance, and regulatory
considerations (Julious 2005). Previous studies using the QF technology acknowledge that a 20%
loss due to technical issues, template tracking failures or drop outs should be anticipated
(Branney and Breen 2014).
Due to the concurrent use of QF and sEMG technology, there was an increased risk that some
component of the sEMG recording may also fail, resulting in unusable data for that participant.
It was therefore decided that a minimum of 20 participants would be required to allow for a
potential 40% combined data loss. The sample size was also limited due to time restraints,
labour and equipment costs, and as the study was a sub-study of the above normative database
7 Note: To the author’s knowledge, the change in RMS sEMG amplitude at different stages of the flexion cycle is a
parameter that has not been reported elsewhere in the literature. As such the use of this parameter represents an
innovation in the analysis of sEMG signal.
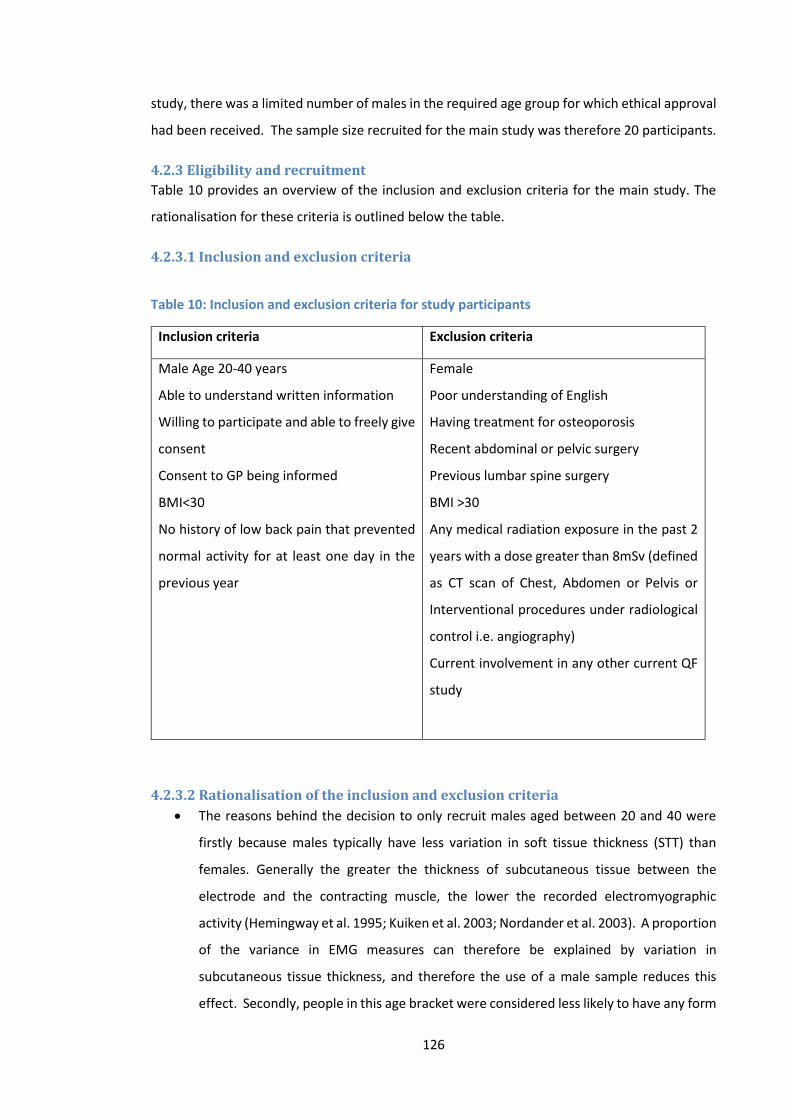
126
study, there was a limited number of males in the required age group for which ethical approval
had been received. The sample size recruited for the main study was therefore 20 participants.
4.2.3 Eligibility and recruitment
Table 10 provides an overview of the inclusion and exclusion criteria for the main study. The
rationalisation for these criteria is outlined below the table.
4.2.3.1 Inclusion and exclusion criteria
Table 10: Inclusion and exclusion criteria for study participants
Inclusion criteria Exclusion criteria
Male Age 20-40 years
Able to understand written information
Willing to participate and able to freely give
consent
Consent to GP being informed
BMI<30
No history of low back pain that prevented
normal activity for at least one day in the
previous year
Female
Poor understanding of English
Having treatment for osteoporosis
Recent abdominal or pelvic surgery
Previous lumbar spine surgery
BMI >30
Any medical radiation exposure in the past 2
years with a dose greater than 8mSv (defined
as CT scan of Chest, Abdomen or Pelvis or
Interventional procedures under radiological
control i.e. angiography)
Current involvement in any other current QF
study
4.2.3.2 Rationalisation of the inclusion and exclusion criteria
The reasons behind the decision to only recruit males aged between 20 and 40 were
firstly because males typically have less variation in soft tissue thickness (STT) than
females. Generally the greater the thickness of subcutaneous tissue between the
electrode and the contracting muscle, the lower the recorded electromyographic
activity (Hemingway et al. 1995; Kuiken et al. 2003; Nordander et al. 2003). A proportion
of the variance in EMG measures can therefore be explained by variation in
subcutaneous tissue thickness, and therefore the use of a male sample reduces this
effect. Secondly, people in this age bracket were considered less likely to have any form

127
of spinal degeneration, which has been shown to influence kinematic variables such as
IV-RoM (Deitz 2011). It has also been shown that range of motion can be affected by
age and gender, with larger ranges typically observed for sagittal flexion in young adult
males (McGregor et al. 1995).
An ability to understand the written information is a pre-requisite for informed consent,
as each participant should fully understand the procedures and risks involved.
Permission to inform the participant’s GP is a recommendation of the National Research
Ethic Service (NRES), and would only be done in the event of an adverse reaction to any
of the study procedures or as a result of an incidental finding needing onward referral.
The requirement for participants to have a BMI of less than 30 was put in place for
several reasons. Firstly, in terms of the fluoroscopic image quality, generally the higher
the BMI beyond the normal range, the greater the chance of degradation of the digital
image. It is also likely that a higher radiation dose would be required to produce the
image in the first instance (Mellor et al. 2014). Secondly, in terms of minimising the
impact of confounding variables such as STT, it was thought that a BMI of less than 30
would increase the likelihood of recruiting participants with comparable subcutaneous
tissue thickness, as for the selection of male participants only.
The final inclusion requirement relates to the fact that the study is investigating so called
‘normal’ spinal biomechanics. A study investigating the prevalence of LBP in adults in
the UK suggests that sufferers should be included if they had LBP over the previous 12
months (Mason 1994). It was taken from this that individuals that had no activity
limiting LBP over the previous year could therefore be considered as healthy
participants (i.e. ‘normal’).
The exclusion criteria were designed to protect participants and to prevent the
collection of potentially poor quality data. Although the radiation dose from a QF
protocol is relatively small (Table 11, section 5.1.4), those that have taken part in other
studies or been exposed to medical radiation over the last 2 years were excluded to
avoid a cumulative effect. Images taken of participants with osteoporotic spines are
more likely to be of sufficiently poor image quality that template tracking is not possible
(Section 4.2.6), and those that have undergone previous lumbar/pelvis surgery were
considered likely to have what could be considered as abnormal spinal biomechanics.
128
4.2.4 Recruitment
Participants were recruited from the male student population at the Anglo-European College of
Chiropractic (AECC), and from visitors to the college. In order to advertise for volunteers, the
author talked to students during lectures, sent e-mails to student cohorts groups and discussed
the study directly with individuals working in the AECC teaching clinic.
4.2.5 Data collection
4.2.5.1 Study environment
All examinations were conducted at the same time of the day8 (in the mornings between 9.00am
and 11.00am), at the AECC clinic x-ray room. The room temperature was set at 19°C, and all
electrical equipment in the room was earthed.
4.2.6 The quantitative fluoroscopy technology
QF is a system that uses commercially available fluoroscopy imaging devices in order to measure
continuous inter-vertebral movements in both the lumbar and cervical spines. The recumbent
protocol uses a lying motion table (Figure 38), whilst the weight-bearing protocol uses a standing
motion frame (Figure 39). These motion devices assist (guide in the case of the standing motion
frame) study participants in the performance of standardised (pre-determined rate and range)
spinal movements. The fluoroscope collects image data that are subsequently evaluated using
image processing software that is able to identify each vertebra, and track it during the spinal
movements. This QF technique has been previously validated (Breen et al. 2006).
In order to process the digital images from the fluoroscope, the software program obtains
geometric and positional data for each vertebral body as it appears in image sequences of the
lumbar or cervical spines. Each fluoroscopic sequence can include hundreds of individual digital
images, effectively providing a continuous x-ray image. Participants are imaged whilst they
perform controlled, standardised spinal movements (such as forward flexion and the return to
upright). To enable the software to track the vertebrae during movement, only low resolution
images are required. This allows for a relatively low dose imaging protocol compared to
standard x-ray sequences. All images produced are anonymised and transferred to a secure
computer for further processing.
8 Diurnal variations can influence the stress on the lumbar spine. It has been shown that creep loading of the disc throughout the day may gradually decrease the spines resistance to bending (Adams et al. 1987). Their results showed that the range of lumbar spinal motion (using electronic inclinometers) increased on average by 5 degrees over the course of the day. The time of day when the protocol takes place therefore needs to remain consistent.
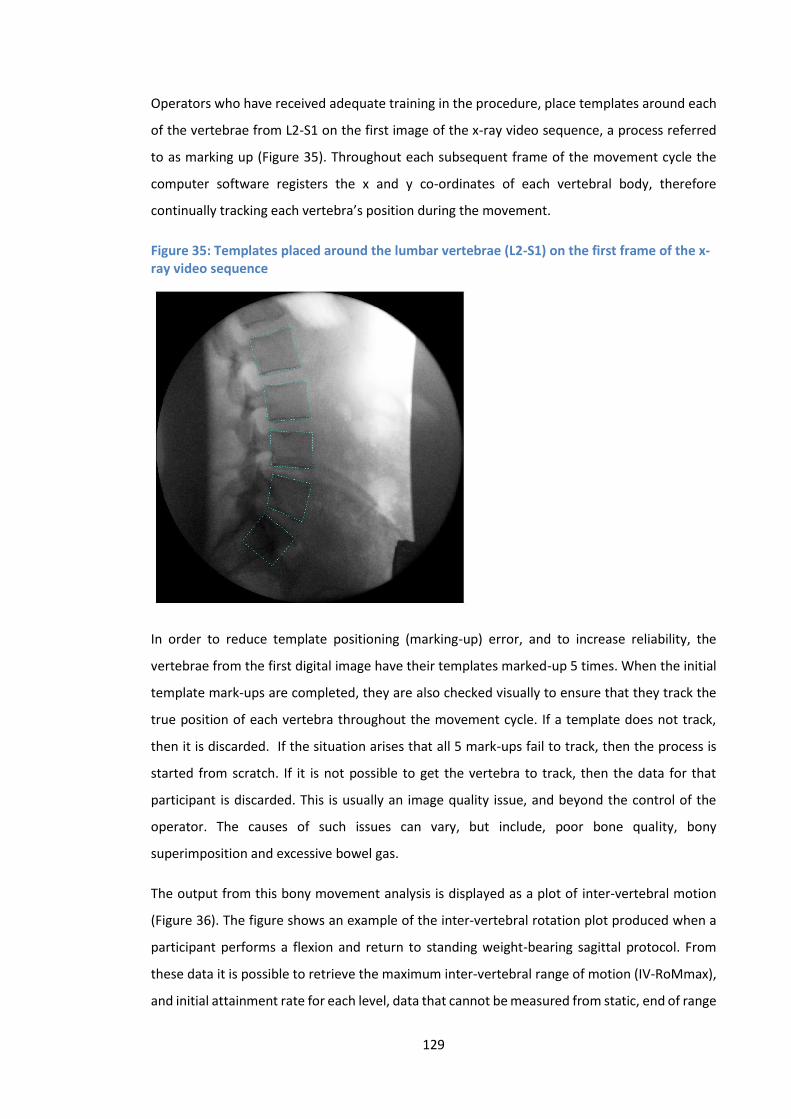
129
Operators who have received adequate training in the procedure, place templates around each
of the vertebrae from L2-S1 on the first image of the x-ray video sequence, a process referred
to as marking up (Figure 35). Throughout each subsequent frame of the movement cycle the
computer software registers the x and y co-ordinates of each vertebral body, therefore
continually tracking each vertebra’s position during the movement.
Figure 35: Templates placed around the lumbar vertebrae (L2-S1) on the first frame of the x-ray video sequence
In order to reduce template positioning (marking-up) error, and to increase reliability, the
vertebrae from the first digital image have their templates marked-up 5 times. When the initial
template mark-ups are completed, they are also checked visually to ensure that they track the
true position of each vertebra throughout the movement cycle. If a template does not track,
then it is discarded. If the situation arises that all 5 mark-ups fail to track, then the process is
started from scratch. If it is not possible to get the vertebra to track, then the data for that
participant is discarded. This is usually an image quality issue, and beyond the control of the
operator. The causes of such issues can vary, but include, poor bone quality, bony
superimposition and excessive bowel gas.
The output from this bony movement analysis is displayed as a plot of inter-vertebral motion
(Figure 36). The figure shows an example of the inter-vertebral rotation plot produced when a
participant performs a flexion and return to standing weight-bearing sagittal protocol. From
these data it is possible to retrieve the maximum inter-vertebral range of motion (IV-RoMmax),
and initial attainment rate for each level, data that cannot be measured from static, end of range
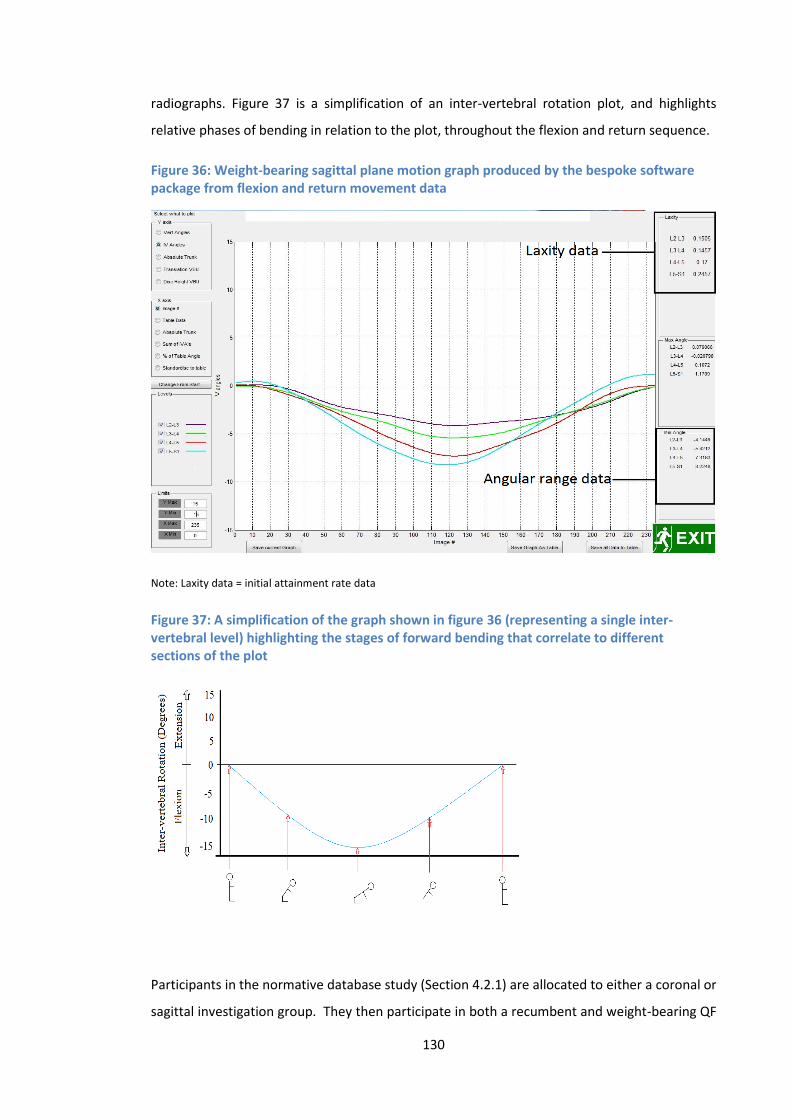
130
radiographs. Figure 37 is a simplification of an inter-vertebral rotation plot, and highlights
relative phases of bending in relation to the plot, throughout the flexion and return sequence.
Figure 36: Weight-bearing sagittal plane motion graph produced by the bespoke software package from flexion and return movement data
Note: Laxity data = initial attainment rate data
Figure 37: A simplification of the graph shown in figure 36 (representing a single inter-vertebral level) highlighting the stages of forward bending that correlate to different sections of the plot
Participants in the normative database study (Section 4.2.1) are allocated to either a coronal or
sagittal investigation group. They then participate in both a recumbent and weight-bearing QF

131
protocol conducted in that plane of motion. The participant group for this study consists of 20
of those who were allocated to the sagittal plane of motion, and who also consented to
participate in the additional sEMG investigations.
4.2.7 QF equipment
The QF data were collected using the Siemens Arcadis Avantic VC10A (CE0123) (Figures 38 and
39). The motion tables are manufactured by Atlas Clinical ltd (declared conformity under
MDD93/42/EEC). The digital image analysis software is a bespoke program written to work with
‘Matlab’ (the Mathworks, Cambridge). This software has been developed and refined by the
IMRCI in collaboration with a company called Orthokinematics Inc., who are commercial
partners with the AECC.
4.2.8 The QF image acquisition protocol
Prior to any data collection, informed consent was collected by the author. As previously
described, the participants in this study were a sub-group of those who were also participating
in the normative database study (Section 4.2.1). As such, all participants performed a
recumbent sagittal protocol prior to the application of any sEMG equipment and the subsequent
weight-bearing sequence. This allowed the opportunity to improve sEMG electrode positioning
accuracy, with the application of a bony landmark reference electrode that could be seen in the
recumbent images (Figure 42). The reference electrode was placed when the participant first
assumed the recumbent imaging position as described below.
For the recumbent sequence, participants were asked to lie on their right hand side, with their
knees slightly bent, in order to flatten the lumbar lordosis (helping to avoid vertebral endplate
overlap in the images). The bony landmark reference electrode was then applied to the spinous
process of the third lumbar vertebra, and lead shielding was placed over the participant. Prior
to any irradiation, participants were taken through the full range of motion (40° for the
recumbent sequence) in 10° increments. This process assured that the participant could tolerate
the overall range, and familiarised them to the required movements (It has been demonstrated
that even pre-surgical low back pain patients can usually tolerate this degree of motion (Breen
2006)). When participants confirmed that they were able to tolerate the movement range and
rate, the fluoroscopic imaging commenced with exposure beginning simultaneously with the
onset of the table movement.
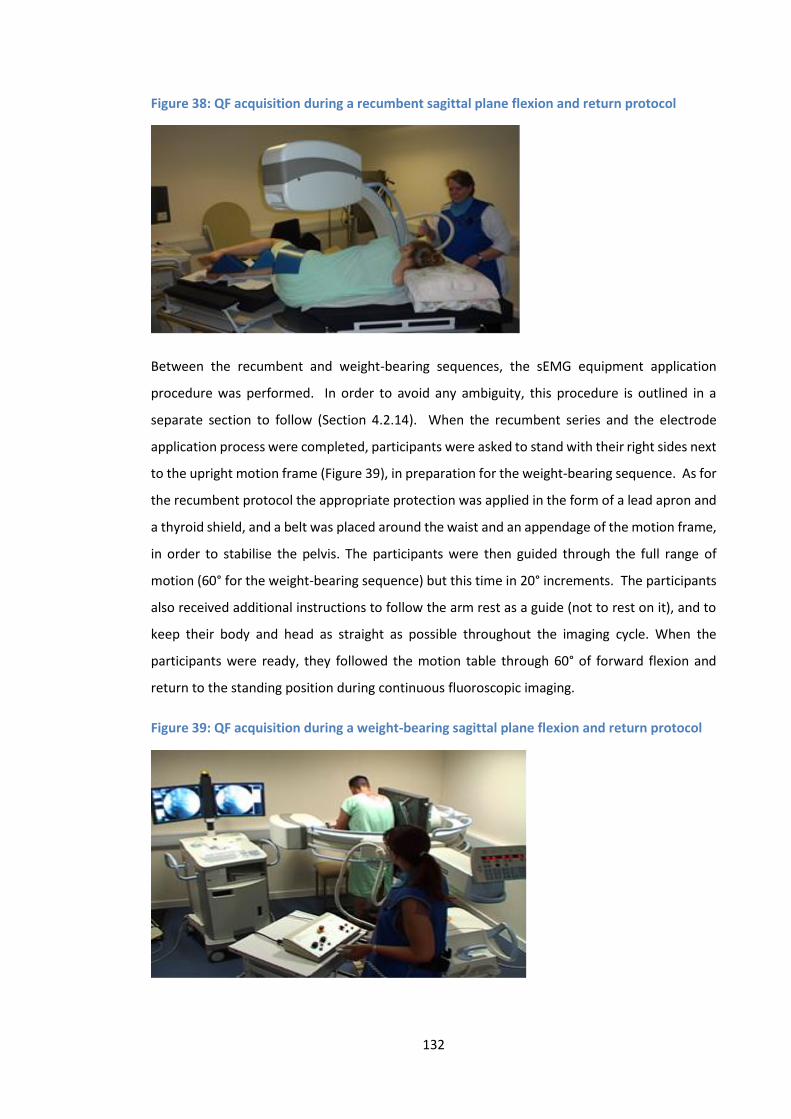
132
Figure 38: QF acquisition during a recumbent sagittal plane flexion and return protocol
Between the recumbent and weight-bearing sequences, the sEMG equipment application
procedure was performed. In order to avoid any ambiguity, this procedure is outlined in a
separate section to follow (Section 4.2.14). When the recumbent series and the electrode
application process were completed, participants were asked to stand with their right sides next
to the upright motion frame (Figure 39), in preparation for the weight-bearing sequence. As for
the recumbent protocol the appropriate protection was applied in the form of a lead apron and
a thyroid shield, and a belt was placed around the waist and an appendage of the motion frame,
in order to stabilise the pelvis. The participants were then guided through the full range of
motion (60° for the weight-bearing sequence) but this time in 20° increments. The participants
also received additional instructions to follow the arm rest as a guide (not to rest on it), and to
keep their body and head as straight as possible throughout the imaging cycle. When the
participants were ready, they followed the motion table through 60° of forward flexion and
return to the standing position during continuous fluoroscopic imaging.
Figure 39: QF acquisition during a weight-bearing sagittal plane flexion and return protocol
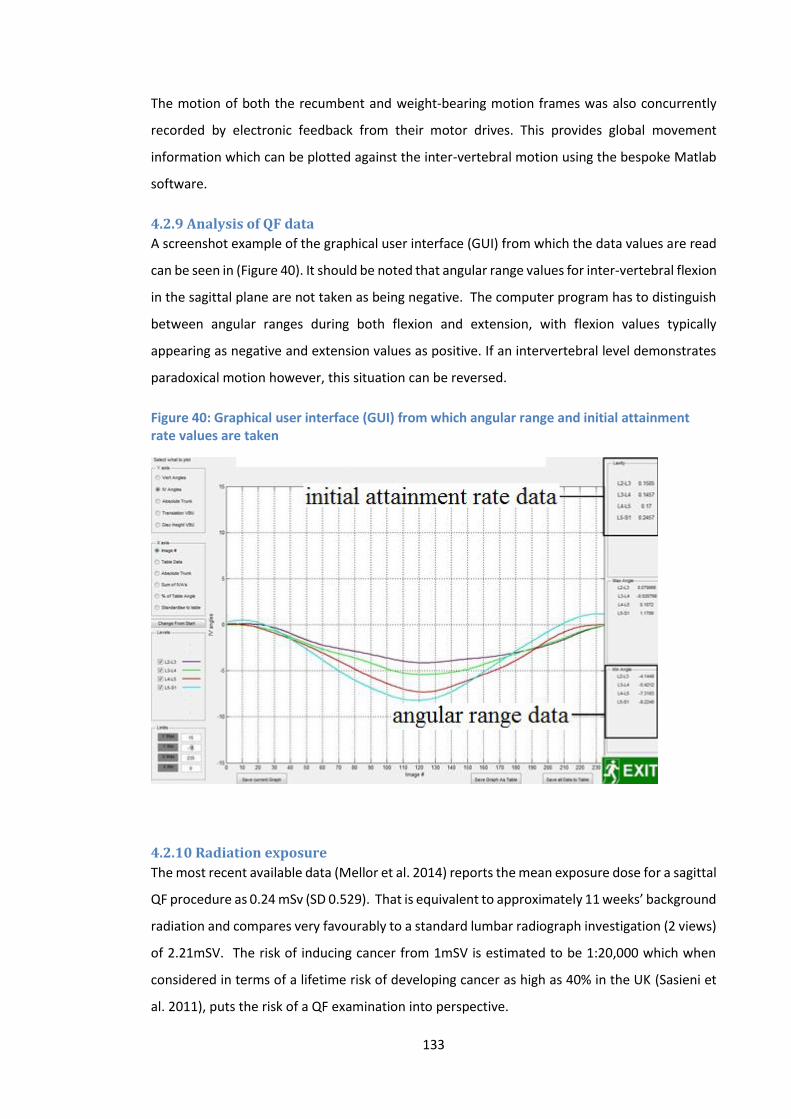
133
The motion of both the recumbent and weight-bearing motion frames was also concurrently
recorded by electronic feedback from their motor drives. This provides global movement
information which can be plotted against the inter-vertebral motion using the bespoke Matlab
software.
4.2.9 Analysis of QF data
A screenshot example of the graphical user interface (GUI) from which the data values are read
can be seen in (Figure 40). It should be noted that angular range values for inter-vertebral flexion
in the sagittal plane are not taken as being negative. The computer program has to distinguish
between angular ranges during both flexion and extension, with flexion values typically
appearing as negative and extension values as positive. If an intervertebral level demonstrates
paradoxical motion however, this situation can be reversed.
Figure 40: Graphical user interface (GUI) from which angular range and initial attainment rate values are taken
4.2.10 Radiation exposure
The most recent available data (Mellor et al. 2014) reports the mean exposure dose for a sagittal
QF procedure as 0.24 mSv (SD 0.529). That is equivalent to approximately 11 weeks’ background
radiation and compares very favourably to a standard lumbar radiograph investigation (2 views)
of 2.21mSV. The risk of inducing cancer from 1mSV is estimated to be 1:20,000 which when
considered in terms of a lifetime risk of developing cancer as high as 40% in the UK (Sasieni et
al. 2011), puts the risk of a QF examination into perspective.
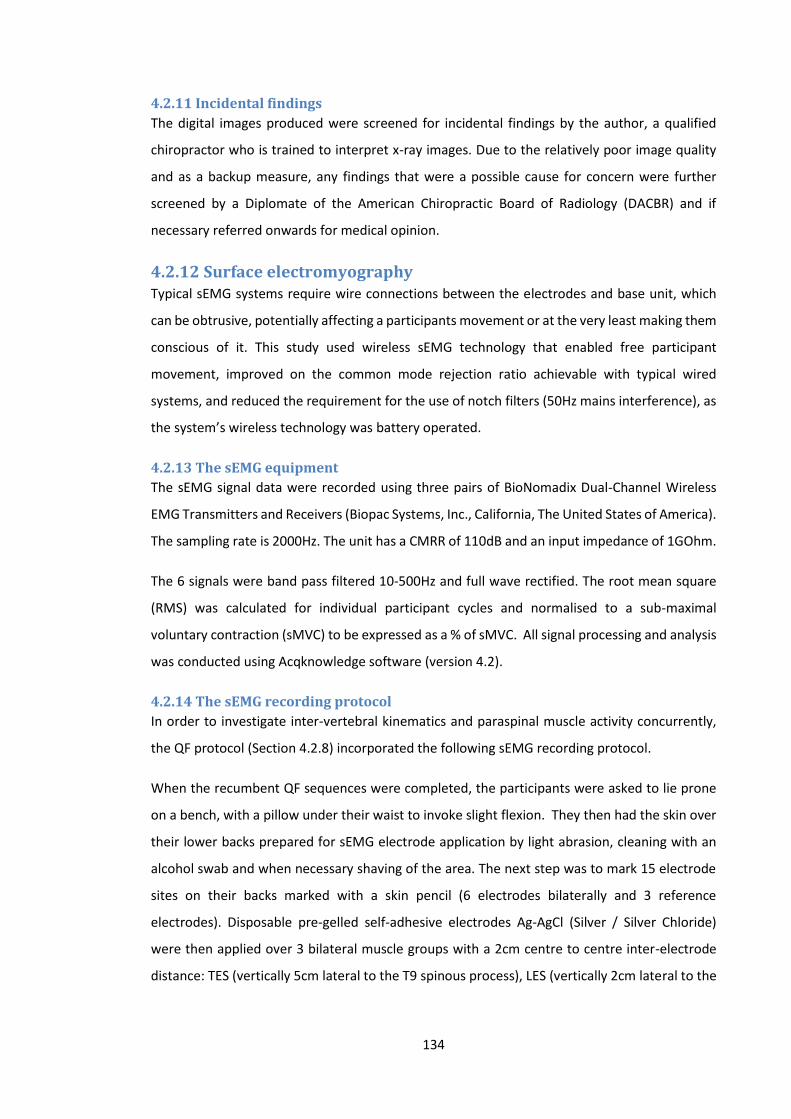
134
4.2.11 Incidental findings
The digital images produced were screened for incidental findings by the author, a qualified
chiropractor who is trained to interpret x-ray images. Due to the relatively poor image quality
and as a backup measure, any findings that were a possible cause for concern were further
screened by a Diplomate of the American Chiropractic Board of Radiology (DACBR) and if
necessary referred onwards for medical opinion.
4.2.12 Surface electromyography Typical sEMG systems require wire connections between the electrodes and base unit, which
can be obtrusive, potentially affecting a participants movement or at the very least making them
conscious of it. This study used wireless sEMG technology that enabled free participant
movement, improved on the common mode rejection ratio achievable with typical wired
systems, and reduced the requirement for the use of notch filters (50Hz mains interference), as
the system’s wireless technology was battery operated.
4.2.13 The sEMG equipment
The sEMG signal data were recorded using three pairs of BioNomadix Dual-Channel Wireless
EMG Transmitters and Receivers (Biopac Systems, Inc., California, The United States of America).
The sampling rate is 2000Hz. The unit has a CMRR of 110dB and an input impedance of 1GOhm.
The 6 signals were band pass filtered 10-500Hz and full wave rectified. The root mean square
(RMS) was calculated for individual participant cycles and normalised to a sub-maximal
voluntary contraction (sMVC) to be expressed as a % of sMVC. All signal processing and analysis
was conducted using Acqknowledge software (version 4.2).
4.2.14 The sEMG recording protocol
In order to investigate inter-vertebral kinematics and paraspinal muscle activity concurrently,
the QF protocol (Section 4.2.8) incorporated the following sEMG recording protocol.
When the recumbent QF sequences were completed, the participants were asked to lie prone
on a bench, with a pillow under their waist to invoke slight flexion. They then had the skin over
their lower backs prepared for sEMG electrode application by light abrasion, cleaning with an
alcohol swab and when necessary shaving of the area. The next step was to mark 15 electrode
sites on their backs marked with a skin pencil (6 electrodes bilaterally and 3 reference
electrodes). Disposable pre-gelled self-adhesive electrodes Ag-AgCl (Silver / Silver Chloride)
were then applied over 3 bilateral muscle groups with a 2cm centre to centre inter-electrode
distance: TES (vertically 5cm lateral to the T9 spinous process), LES (vertically 2cm lateral to the
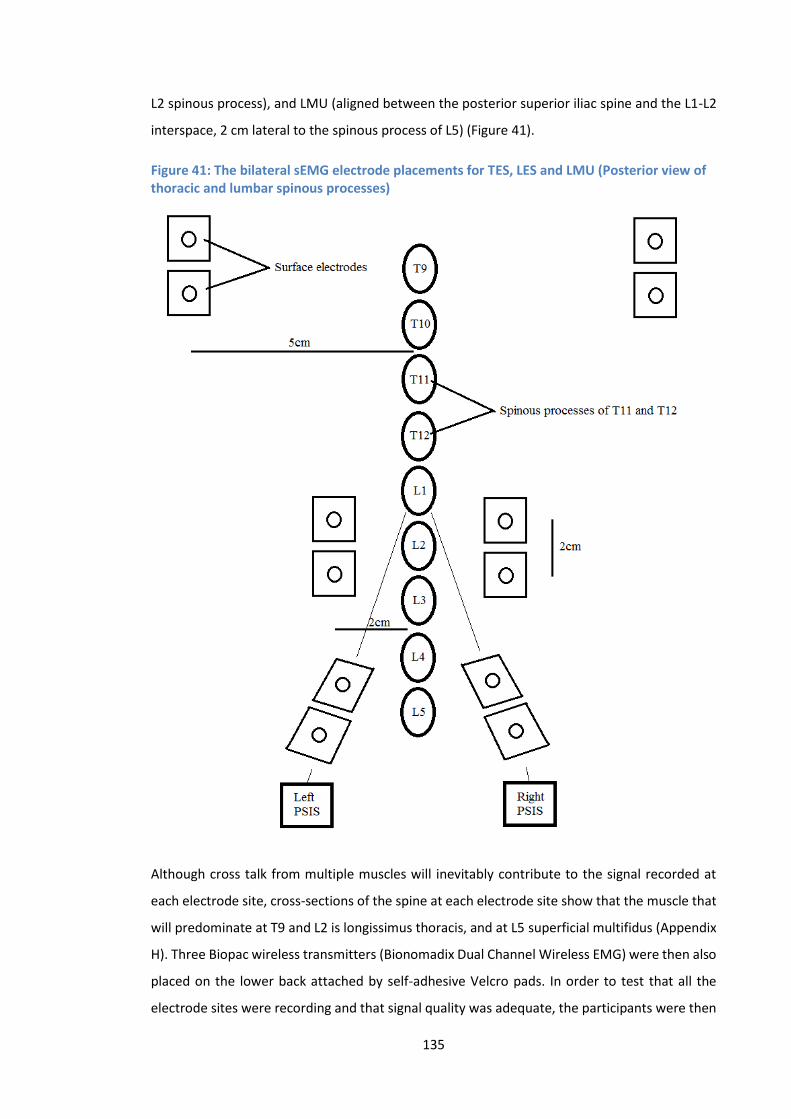
135
L2 spinous process), and LMU (aligned between the posterior superior iliac spine and the L1-L2
interspace, 2 cm lateral to the spinous process of L5) (Figure 41).
Figure 41: The bilateral sEMG electrode placements for TES, LES and LMU (Posterior view of thoracic and lumbar spinous processes)
Although cross talk from multiple muscles will inevitably contribute to the signal recorded at
each electrode site, cross-sections of the spine at each electrode site show that the muscle that
will predominate at T9 and L2 is longissimus thoracis, and at L5 superficial multifidus (Appendix
H). Three Biopac wireless transmitters (Bionomadix Dual Channel Wireless EMG) were then also
placed on the lower back attached by self-adhesive Velcro pads. In order to test that all the
electrode sites were recording and that signal quality was adequate, the participants were then

136
required to perform a single bend into forward flexion within their own comfort level. If all 6
channels were recording sufficiently clean signals, then the weight-bearing stage of the protocol
could begin. The participants stand with their right side against the upright motion frame, with
their forearms placed on the arm rest appendage (Figure 39). They then proceeded as normal
with the weight-bearing sagittal plane image acquisition and sEMG signal data was synchronised
with the beginning of the motion table movement using a simple electrical switch (Section
4.2.20.2). Participants have access to an emergency stop button, which halts the motion frame
at any time if they so wish.
4.2.15 Electrode application accuracy
Electrode application accuracy is dependent on the subjective identification of bony anatomical
landmarks. It has been shown that application techniques, are therefore limited by human error
and variations in individual’s anatomy (Kim et al. 2007, Chin et al. 2006, Billis et al. 2003,
Chakraverty et al. 2007). It has been suggested however that accuracy can be improved
significantly when techniques are combined (Merz et al. 2013). As this investigation was
combined with a normative database study (Section 4.2.1), recumbent QF imaging was
conducted before the weight-bearing imaging commenced. Therefore in order to improve
electrode positioning accuracy, an electrode was placed over the spinous process of L3 during
the recumbent protocol (Figure 42). This allowed the comparison between the true position of
L3 spinous process and the position of L3 spinous process based on the use of the iliac crests as
a bony landmark reference point. If there was disagreement, then the perceived location of the
L3 spinous process was adjusted accordingly to improve electrode application accuracy.
Figure 42: An electrode placed over the spinous process of L3
137
4.2.16 Reference contraction for the purpose of normalisation
In order to provide a reference contraction (a sMVC), when all image acquisitions were
completed, participants were asked to lie prone on a padded bench with their hands behind
their head. They were then instructed to raise their upper body off the couch and hold this
position for 5 seconds whilst their legs and pelvis were supported (in a modification of the
Sorensen test (Demoulin et al. 2006)). The participants were asked to repeat this procedure 3
times. Lastly each participant was asked a single question related to any fear of pain they may
have had, prior or during either the weight-bearing forward bending and return sequences or
the reference contraction. The electrodes were then removed, and the participant’s skin was
cleaned.
The combined recumbent, weight-bearing and sEMG aspects of the study protocol are outlined
in (Figure 43).
Figure 43: Flow chart outlining the key stages of the study protocol
Due to the complex nature of the protocol and the multiple considerations involved, a safety
check list was devised to be completed at every examination. The check list can be found in the
appendices (Appendix G).
Participant reads and signs the consent form
The format of the examination is explained, and the participant is afforded an opportunity to ask
questions
Participant instructed to lay on their right side on the recumbent motion
table
Electrode applied over the spinous process of L3. After initial image
screen grabs, the accuracy of this electrode application is discussed between the radiography and the
PGR
Recumbent QF protocol
Participant instructed to lie prone in slight flexion (pillow placed under pelvis), and their skin is prepared
for electrode application (abrasion and alcohol).
Spinous levels at T9, L2 and L5 are marked with a skin pencil, and
finally electrodes and transmitters are applied to the participant’s skin
Participant performs a single bend forward and return in order for the PGR to confirm that the electrodes are all recording, and that artefacts
are at a minimum
Weight-bearing QF protocol with concurrent sEMG recording
Participant instructed to perform a sMVC (repeated 3 times)
Participant asked the question “Were you fearful of the forward
bending and return phases causing you low back pain?”
Electrodes and transmitters removed, and participant’s skin
cleaned
138
4.2.17 Checking for signal contamination
As described above as part of the sEMG protocol, after each participant had performed a
voluntary forward bend, the signals from each of the 6 muscle sites were checked for
contaminants. This quality assurance procedure involved a visual check of each signal,
verification that baseline voltage readings were at an acceptable level (i.e. 3-5µV), and that a
signal frequency analysis revealed no 50Hz mains interference.
4.2.18 Analysis of sEMG data
All data were recorded and analysed using Acqknowledge software (version 4.2). The software
was used to process the signal into root mean square (RMS) sEMG, which is a representation of
the mean power of the signal and is a common and preferable method of smoothing (Basmajian
and De Luca 1985; Soderberg 2000). RMS EMG is based on the root mean square calculation,
and is basically a process of squaring each value within the signal, generating an average, and
then calculating the square root (Soderberg 2000). The RMS sEMG was then normalised to a
sMVC (Section 4.2.16), and expressed as a % of the sMVC. The sEMG ratios (Reeves et al. 2006;
Van Dieen 2003) were calculated from the mean left-right normalised RMS sEMG amplitudes
during the flexion phase only as follows, LMU/LES, LES/TES and LMU/TES. In order to calculate
sEMG changes at different stages of the flexion cycle, the forward bending phase was divided
into 5 epochs for each participant (D'hooge et al. 2013). The change in mean RMS sEMG between
epochs was then calculated e.g. the change during the early stage of flexion was calculated as
(epoch 1 – epoch 2) for each TES, LES and LMU. This was repeated to determine changes
between all epochs at all levels.
The standardised rate and range of the weight-bearing protocol motion frame guided each
participant to 60° of flexion in approximately 10 seconds. This rate can change fractionally
between participants, and so epoch lengths were calculated on an individual basis but were
typically of 2 seconds duration.
4.2.19 Risks associated with sEMG
There are no significant risks associated with sEMG. Participants may however experience minor
discomfort as a result of skin preparation prior to electrode attachment, or as a result of
electrode removal, either of which could possibly result in transient minor red marks on the skin
surface. There was also a very slight risk of allergy or irritation caused by the adhesive on the
electrodes, although non-allergenic gels were used to minimise this risk.
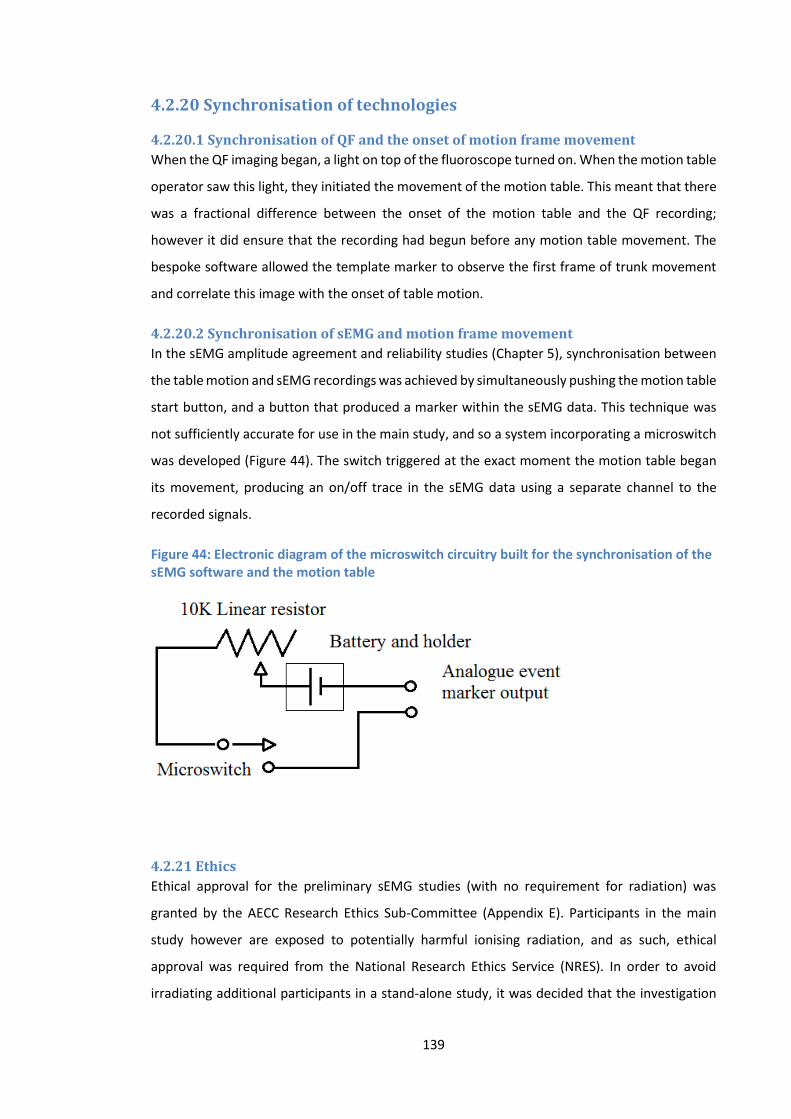
139
4.2.20 Synchronisation of technologies
4.2.20.1 Synchronisation of QF and the onset of motion frame movement
When the QF imaging began, a light on top of the fluoroscope turned on. When the motion table
operator saw this light, they initiated the movement of the motion table. This meant that there
was a fractional difference between the onset of the motion table and the QF recording;
however it did ensure that the recording had begun before any motion table movement. The
bespoke software allowed the template marker to observe the first frame of trunk movement
and correlate this image with the onset of table motion.
4.2.20.2 Synchronisation of sEMG and motion frame movement
In the sEMG amplitude agreement and reliability studies (Chapter 5), synchronisation between
the table motion and sEMG recordings was achieved by simultaneously pushing the motion table
start button, and a button that produced a marker within the sEMG data. This technique was
not sufficiently accurate for use in the main study, and so a system incorporating a microswitch
was developed (Figure 44). The switch triggered at the exact moment the motion table began
its movement, producing an on/off trace in the sEMG data using a separate channel to the
recorded signals.
Figure 44: Electronic diagram of the microswitch circuitry built for the synchronisation of the sEMG software and the motion table
4.2.21 Ethics
Ethical approval for the preliminary sEMG studies (with no requirement for radiation) was
granted by the AECC Research Ethics Sub-Committee (Appendix E). Participants in the main
study however are exposed to potentially harmful ionising radiation, and as such, ethical
approval was required from the National Research Ethics Service (NRES). In order to avoid
irradiating additional participants in a stand-alone study, it was decided that the investigation

140
could be incorporated into a pre-existing study through a ‘substantial amendment’ to its own
ethical approval. The substantial amendment was approved (Appendix E).
4.2.22 Public and patient involvement (PPI)
The participation of members of the public in health research is central to the research policy of
the UK (Boote et al. 2010). It is defined by its national advisory group INVOLVE as “doing
research with or by the public, rather than to, about or for the public”. The last 20 years has
seen publication patterns demonstrate an increased use of PPI by researchers (Boote et al.
2015), and a systematic review of PPI in research recommends that studies should include in
sufficient detail the process of involvement, and how it affected the study (Brett et al. 2010). A
PPI group was therefore created from former/current patients of the AECC teaching clinic. The
group met on two occasions with the author and 1st supervisor9. The first meeting outlined the
purpose and role of a PPI group and established their willingness to participate. The second
meeting was a live demonstration of the study protocol (excluding x-ray exposures), followed
by an opportunity for the group to comment on any aspect of the protocol, participant
information sheet or concerns that had arisen. The feedback was very useful, and amendments
to the study protocol were made as a result. A summary of the main outcomes of the meetings
can be found in (Appendix F).
4.2.23 Summary
The methodology that has been outlined represents the first attempt to combine QF and sEMG
technologies in order to investigate the biomechanics of the human lumbar spine in vivo. Data
that were collected in the main studies (Chapters 6 and 7) used the described methodology. Any
deviations from this methodology (such as in the reliability and agreement studies described in
Chapter 5) are documented accordingly.
9 Professor Alan Breen
141
Chapter 5: Accuracy, agreement and reliability
5.1 Part one: Intra- and inter-marker agreement and reliability of IV-
RoMmax and initial attainment rate measurements in the sagittal plane
QF protocol.
5.1.1 Introduction
When spinal kinematic variables such as IV-RoM are measured repeatedly under standardised
conditions, differences between the measurements will typically be found, due to natural
biological variation in individual participants, errors in the measurement process, or both
(Mieritz et al. 2012). When possible to do so therefore, the accuracy, agreement and reliability
of study variables should be determined before their inclusion for use. In terms of spinal motion
measurements, there are numerous techniques available, each with their own advantages and
limitations (Section 2.5). The spine is a relatively inaccessible area of the body, which means
that manual assessment techniques can be crude and are typically influenced by their subjective
nature. A review of the reliability of manual evaluations of inter-vertebral motion
(posteroanterior pressure over spinal segments) concluded that they were unreliable, and that
a participant’s pain response was a more useful indicator of inter-vertebral mobility (Lee 1995).
A solution to this problem has been the development of instrumentation to objectively quantify
segmental movements. Non-invasive skin surface devices have been created, and have been
shown to be generally reliable for measuring spinal movements (Essendrop et al. 2002; Mannion
1999a); however there will always be inaccuracies in these methods due to landmark
identification problems, skin movements over vertebrae, and the attachment of such devices to
the skin (Mannion et al. 2004). These methods also typically assess regional ranges of motion
and not localised inter-segmental movements (Mieritz et al. 2012). In a study comparing QF
measurement to digitisation of X-rays at maximum voluntary bending angles (MVBA), and
measurement of X-rays at MVBA by ruler and protractor, Breen et al. (2012) reported
‘substantially’ larger errors in the latter 2 methods (Breen A.C. et al. 2012). Despite the radiation
considerations therefore, QF techniques have been shown to be the most precise when
assessing spinal ranges of motion, and recent QF studies have demonstrated acceptable
reliability (Ahmadi et al. 2009; Branney and Breen 2014; Mellor F.E. et al. 2014; Teyhen 2005;
Yeager et al. 2014). The agreement and reliability of sagittal plane weight-bearing
measurements using the IMRCI QF protocol however, is yet to be investigated. Template
142
marking is a learned skill, and as such the author’s capacity to register templates on weight-
bearing images to an acceptable standard also requires assessment.
The following section reviews the accuracy of IV-RoM measurements using QF when compared
to other reference standards, and investigates the agreement and reliability of both IV-RoMmax
and initial attainment rate variables when measured using the QF weight-bearing protocol
(Section 4.2.8). Acceptable agreement and reliability of these measurements are important
prerequisites to their inclusion in the main study. As the template marking and editing processes
are the most likely sources of error, the studies are referred to as intra- and inter-marker (as
opposed to intra-observer/examiner).
5.1.2 Accuracy
The accuracy of QF measurements of IV-RoMmax have been investigated previously, and have
been shown to be accurate to less than one degree in both the lumbar and cervical spines
(Branney and Breen 2014; Breen et al. 2006). In both studies, the accuracy of IV-RoM
measurements was determined using calibration models consisting of a pair of dry vertebrae,
fitted with protractors and joined by an inter-vertebral universal joint that allowed for rotation
in the sagittal plane. In the lumbar spine, Breen et al. (2006) calculated the root mean squares
of difference between the reference and computed inter-vertebral angles through 7 settings
from -10° to +20° during sagittal flexion-extension, in both optimal (x-ray beam centred on the
universal joint) and degraded (model axially rotated 10° out of plane, and beam inclined
inferiorly 10°) conditions (Breen et al. 2006). The RMS error was 0.52° and 1.03° for optimal and
degraded conditions respectively (Breen et al. 2006). Using a similar protocol in the cervical
spine, Branney (2014) showed accuracy of 0.21° (optimal) and 0.50° (degraded) during flexion
(Branney and Breen 2014), indicating comparatively reduced error in cervical segment
measurements, and reflecting a similar doubling in error under degraded conditions. This
underlines the importance of patient positioning protocols, and the skill of the radiographer.
In a more recent QF accuracy study of lumbar IV-RoM measurements, Breen et al. refer to a
2011 FDA study (Orthokinematics 2011) which reports an error of less than 0.70° (Breen et al.
2012). Validation of a different QF system, the Dual Fluoroscopy Imaging System (DFIS)
evaluated accuracy by comparing vertebral orientations using DFIS to the RSA method (a beads
position matching technique that the author refers to as the gold standard) (Wu et al. 2014).
This study found sagittal rotational accuracy to be within 0.63° from 5 tested positions along a
flexion-extension path, mirroring the findings of the FDA study. There was no testing of out of
plane accuracy however, and so it is likely that accuracy would reduce in vivo.
143
These modern QF based techniques, including QF, appear to represent an improvement over
traditional methods. Pearcy and Whittle undertook a validation study of biplane radiography,
and reported accuracy of < 1.5° (Pearcy 1982). It has therefore been shown that the QF sagittal
lumbar protocol demonstrates acceptable accuracy for use in the main study.
5.1.3 Agreement and reliability
As discussed, semi-automated techniques such as those employed in this study, have been
shown to improve the accuracy of measurements. As another example, Pearson et al compared
the agreement and reliability of a manual digitized with a semi-automated technique and
demonstrated greater precision in the latter (Pearson et al. 2011). The QF protocol is however,
still subject to tracking failures and human error, particularly with regard to the manual vertebral
template marking process. Barlett and Frost (2008) state that the objective of an agreement and
reliability study is to quantify the reliability and agreement of the measurement, thus
determining the appropriateness of its use (Barlett and Frost 2008). If agreement and reliability
are poor, then any conclusions based on such measurements would be open to questioning.
De Vet (2006) reviewed the parameters for quantifying agreement and reliability (De Vet 2006).
They concluded that the standard error of measurement (SEM) is the most frequently used
parameter of agreement, whilst intraclass correlation coefficients (ICC’s) are most appropriate
for repeated measurements on a continuous scale (De Vet 2006). The criteria used to report the
reliability and agreement findings in this study, are based on the guidelines produced by Kottner
et al. 2011 (Knottner J. et al. 2011). These guidelines were produced with the aim of improving
the quality of reliability and agreement reports, and so outline the information that should be
included in order for the results to be correctly interpreted.
The reliability and agreement of several QF inter-vertebral motion measurement techniques
have already been investigated (Ahmadi et al. 2009; Mellor F.E. et al. 2014; Teyhen 2005; Yeager
et al. 2014). However, gaps remain in the literature in terms of the inter-vertebral levels included
in each study, and the focus on recumbent or weight-bearing images. The methodology
designed for the main study data collection, requires acceptable agreement and reliability of
measurements from L2-S1 during weight-bearing flexion in the sagittal plane. Mellor (2014)
investigated the agreement and reliability of a recumbent QF protocol measuring IV-RoMmax
from L2-L5, but excluded L5-S1 due to anticipated difficulties with image registration, as a
consequence of superimposition of the iliac crests at this level (Mellor F.E. et al. 2014). In terms
of weight-bearing, Teyhen et al. focussed on the levels of L3-S1, excluding inter-vertebral levels

144
of the upper lumbar spine (Teyhen 2005), and their methodology did not incorporate continuous
data (using only upright and full flexion images). Most recently Yeager et al. assessed the whole
lumbar spine (L1-S1), but reported reliability of lumbar measurements that combined vertebral
levels, and did not analyse them individually (Yeager et al. 2014). All of these studies have
demonstrated acceptable measurements of IV-RoMmax using QF technologies (i.e. ICC’s > 0.9).
However, knowledge of inter-segmental measurement agreement and reliability at all required
levels, during sagittal weight-bearing, whilst incorporating continuous data, remains
incomplete.
5.1.4 Why is it necessary to investigate agreement and reliability of measurements
using both the recumbent and weight-bearing QF protocols?
It is intuitive that the better the quality of the images, the more accurate and consistent
measurements made using them will be, and in a study assessing the effect of roentgenogram
quality on the accuracy and consistency of sagittal plane measurements, Shaffer et al. (1990)
concluded that higher quality images are more accurately evaluated than those of lower quality
(Shaffer 1990). In a more recent study involving digital radiograph measurements, Aubin et al.
(2011) showed that improved image quality also positively influences inter-observer reliability
(Aubin et al. 2011).
In terms of weight-bearing versus recumbent images, generally recumbent images will be of
better quality. There are changes in soft tissue locations between weight-bearing (standing) and
recumbent (lying on the participant’s side) positions, which alter the behaviour of x-ray beams
as they pass through the abdomen. When a participant is weight-bearing, the soft tissues around
the lumbar spine are brought together due to gravity. When the lower abdomen bulges under
gravity, there is a crowding together of organs, which consequently causes an increase in the
density of the soft tissues. This means that the attenuation of x-radiation is greater in weight-
bearing images of the lumbar spine. This increase in ‘Compton scatter’ therefore results in
degraded image quality. When participants are recumbent, the organs disperse and reduce the
thickness of the tissues the x-rays are interacting with, resulting in comparatively superior image
quality.
The radiation factors from the main study show this to be the case for kV, but surprisingly show
that comparatively less mA were required in weight-bearing (Table 11). It was anticipated that
more x-rays (higher mA) would be required during weight-bearing, because there is more of the
abdomen to travel through. This was not the case for the study sample, which may be a
limitation of its size. There was evidence to suggest however that the x-rays needed to travel
faster (increased kV) in order to pass through the abdomen during weight-bearing. The
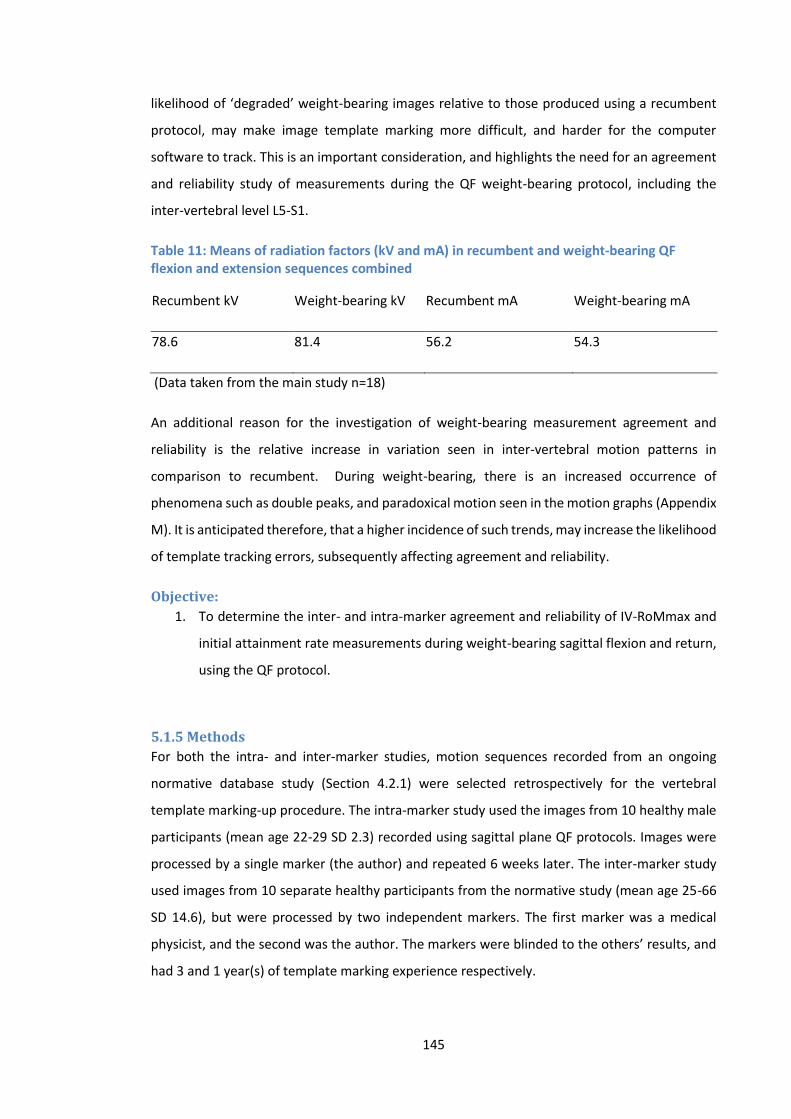
145
likelihood of ‘degraded’ weight-bearing images relative to those produced using a recumbent
protocol, may make image template marking more difficult, and harder for the computer
software to track. This is an important consideration, and highlights the need for an agreement
and reliability study of measurements during the QF weight-bearing protocol, including the
inter-vertebral level L5-S1.
Table 11: Means of radiation factors (kV and mA) in recumbent and weight-bearing QF flexion and extension sequences combined
Recumbent kV Weight-bearing kV Recumbent mA Weight-bearing mA
78.6 81.4 56.2 54.3
(Data taken from the main study n=18)
An additional reason for the investigation of weight-bearing measurement agreement and
reliability is the relative increase in variation seen in inter-vertebral motion patterns in
comparison to recumbent. During weight-bearing, there is an increased occurrence of
phenomena such as double peaks, and paradoxical motion seen in the motion graphs (Appendix
M). It is anticipated therefore, that a higher incidence of such trends, may increase the likelihood
of template tracking errors, subsequently affecting agreement and reliability.
Objective:
1. To determine the inter- and intra-marker agreement and reliability of IV-RoMmax and
initial attainment rate measurements during weight-bearing sagittal flexion and return,
using the QF protocol.
5.1.5 Methods
For both the intra- and inter-marker studies, motion sequences recorded from an ongoing
normative database study (Section 4.2.1) were selected retrospectively for the vertebral
template marking-up procedure. The intra-marker study used the images from 10 healthy male
participants (mean age 22-29 SD 2.3) recorded using sagittal plane QF protocols. Images were
processed by a single marker (the author) and repeated 6 weeks later. The inter-marker study
used images from 10 separate healthy participants from the normative study (mean age 25-66
SD 14.6), but were processed by two independent markers. The first marker was a medical
physicist, and the second was the author. The markers were blinded to the others’ results, and
had 3 and 1 year(s) of template marking experience respectively.
146
A typical sagittal plane motion sequence produces over three hundred images (acquisition rate
of 15Hz over approximately 20 seconds). The lumbar vertebrae from levels L2 to S1 were
marked-up manually on the first image from this sequence. This creates a template around each
vertebra, and the process was repeated 5 times. A computerised tracking algorithm then
identifies the position of each template for all images, continuously tracking each segment’s
movement throughout the flexion and return phases (Section 4.2.8). The IV-RoMmax and initial
attainment rate data were then extracted from the output and analysed. Data from all 20
sequences went forward for analysis, as they all satisfied the study’s image quality control
standards.
5.1.6 Data analysis
5.1.6.1 Rationale statistical method
There are many different statistical methods that can be used when analysing intra- and inter-
rater reliability and agreement. Commonly, reliability analysis will include Kappa statistics or
intraclass correlation coefficients. Agreement measures may include proportions of agreement,
standard errors of measurement, coefficients of variation or limits of agreement (Bland-Altman
method). The decision to use one statistic over another is based on assumptions regarding the
treatment of random and systematic error, the sampling, and the type of data i.e. nominal,
ordinal or continuous (Knottner J. et al. 2011). In the literature, the type of statistic used is often
incorrect and sometimes unreported. In a study investigating the reliability of lumbar range of
motion measurements using an inclinometer, Mayer et al. (2004) reported excellent intra- and
inter-rater reliability using the Pearson’s r correlation (Mayer 2004). Although their results
showed r values >0.95, the Pearson’s r does not account for systematic intra- or inter-rater bias,
and so an intraclass correlation coefficient may have been more suitable. The ICC takes into
account such sources of error and relates it to the variability between participants. If the
measurement error is small relative to the participant variation, then the ICC will approach 1,
however if the error is relatively large, then the ICC will be smaller (De Vet 2006). This also means
that the ICC as a parameter can be heavily influenced by the heterogeneity of the participant
population.
As discussed previously, the measurements made in this study are on a continuous scale, and
are therefore most suitable for analysis with ICC’s (De Vet 2006). If the data were either nominal
or ordinal however, then a Kappa coefficient would have been more appropriate (Sim 2005).
Kappa statistics can provide valuable information about categorical data, but like the ICC, many
different types are available, and so careful selection is required to avoid the misinterpretation
of results (Knottner et al. 2011). The limits of agreement were proposed by Bland and Altman,
147
and were designed to assess the agreement between two separate measurement methods
(Bland 1986). The calculation requires the mean difference between two measurements, and
the standard deviation of these differences. It is suggested that approximately 95% of these
differences will lie between the mean differences ± 1.96 standard deviations (Bland 1986).
Costa-Santos et al. (2012) compared the interpretation of limits of agreement to the ICC when
analysing neonatal outcome variables (Costa-Santos et al. 2011). They found that the two
statistics provided inconsistent results, and therefore recommend that each be interpreted with
their limitations in mind. In a QF agreement and reliability study investigating lumbar inter-
vertebral translation, Van Loon et al. (2012) used both limits of agreement and ICC’s to analyse
their results (Van Loon et al. 2012). As Costa-Santos et al. (2012) discuss, the main limitation of
limits of agreement is the subjective nature of their interpretation (Costa-Santos et al. 2012),
which is highlighted in this example. Van Loon refers to the limits of agreement as ‘best
agreement’ (smallest range) and ‘least agreement’ (largest range), but there is no mention of
the relevance of either. Limits of agreement therefore can be a useful parameter, but only when
understanding of the ranges is sufficient to interpret their meaning. In conclusion however,
according to Myles (2001), the limits of agreement were originally developed for two sets of
independent data and are not suitable for repeated measures data (Myles 2001). They were
therefore not used in the current study’s analysis.
In this study the agreement and reliability of measurements will be quantified by reliability (ICC)
and agreement (SEM) as recommended by Barlett and Frost (2008) (Barlett and Frost 2008). The
selection process for each of these statistics is outlined below.
5.1.6.2 ICC Selection
Selecting an appropriate ICC is an important part of method design, as the type of ICC used will
affect the ways in which it can be interpreted. In order to justify the ICC choices made for the
study, the selection procedure has been outlined.
If the structure of the data is considered as rows and columns, the participants (n = 10) are the
rows and the columns represent the different measurements made, for example, for the intra-
marker study, 1st and 2nd mark-ups, and for the inter-marker study, 1st and 2nd markers. The row
data were considered a source of systematic variance, as it is expected that there will be
differences amongst the participants. In this study, the column data is also considered a source
of systematic variance, as there is variability in the skill levels of the independent markers.
Therefore, as there are two sources of systematic variability, a two-way ANOVA model was
required.

148
When a two-way model is selected, another important consideration is whether the column
variable represents a random or fixed effect (McGraw 1996). This decision does not affect the
ICC calculation, but does alter its interpretation. For both intra- and inter-marker studies fixed
column variables were chosen, as the population of available markers varied in experience and
skill level, any change in marker would likely have an effect.
The difference in marker skill level also helps determine the choice between ‘consistency’ and
‘absolute agreement’ measures. If the systematic variability due to the difference in marker skill
level is not considered relevant, then consistency measures are used. However if the difference
in marker skill level is considered relevant, then absolute measures are most appropriate. In the
case of the intra-marker study, it is the author’s belief that experience gained from the marking-
up of images for the first time would influence their ability to mark-up on the second occasion.
Similarly, the inter-marker study was conducted by an experienced marker, and a relative
novice. Therefore in both situations, the difference in marker skill would most likely influence
systematic variability, and so absolute agreement measures were considered the most
appropriate.
The following formulae show the difference between absolute agreement and consistency
measures.
denotes variance in the participants under study, denotes variance in the markers, and
denotes measurement error (Ailliet et al. 2015; De Vet 2006).
When marker variability is considered relevant, it is included in the denominator of the
estimated ICC (ICC agreement). If it is considered irrelevant, it is simply not included (ICC
consistency).
The final stage of the selection process is to decide whether the ICC should apply to single or
average measurements. In this study the data produced represents the participant’s individual
149
IV-RoMmax or initial attainment rate measurements, and are therefore considered single
measurements. Although the computer software uses the average of 5 templates to process
each individual measurement (Section 4.2.8), average measurements would only be appropriate
if the results were an average taken from more than one marker.
The ICC selected for both intra- and inter-marker studies was ICCabsolute agreement (3, 1). In SPSS this
is represented as a two-way mixed, single measure. Statistical analysis was performed using IBM
SPSS (Version 21).
5.1.6.3 Agreement
The formula used to derive the SEM is calculated by dividing the standard deviation of the mean
differences between the two measurements (SDdiff) by √2 (De Vet 2006). It is suggested by De
Vet et al., that the factor √2 is included as it concerns the difference between two
measurements, and that errors can occur in both. The formula used is shown below.
SEM = SDdiff/√2
5.1.7 Results
5.1.7.1 IV-RoMmax: Reliability
A total of 20 image sets were obtained from the ongoing normative database study (Section
4.2.1). Convenience samples of 10 participants were used for both the intra-marker and inter-
marker studies. Two different sets were used, as initially only an intra-marker study was
planned, and therefore the subsequent inter-marker study was conducted using the author as
the second marker. These images were taken from participants who had their template marking
done previously, and so two separate groups were required. The intra-marker group were aged
22-29 years (mean 26, SD 2.3). The inter-marker group were aged 25-66 years (mean 47, SD
14.6). There were no tracking failures in either group, and so results were produced for all levels
(L2-S1) in both.
The ICC’s (reliability) and SEM’s (agreement) for both intra- and inter-marker IV-RoMmax studies
are shown in table 12. The results show acceptable reliability with the smallest ICC being 0.93
and 0.83 for the intra- and inter-marker studies respectively. When comparing Intra- and inter-
marker groups, it was expected that the intra-marker would demonstrate better reliability and
agreement (Mellor F.E. et al. 2014; Yeager et al. 2014). This trend was observed in the
recumbent group for all inter-vertebral levels apart from L4-L5, which showed marginally better
reliability in the inter-marker group. In the weight-bearing group however, ICC’s were the same

150
or slightly better in the inter-marker group at 2 out of the 4 inter-vertebral levels. It should be
noted however that the differences between these groups is small, and that all ICC’s represent
excellent reliability.
When taking the 95% confidence intervals into account however, a clearer difference between
intra- and inter-marker groups is seen. In both recumbent and weight-bearing orientations, the
inter-marker study demonstrates a larger range (with the exception of L5-S1 weight-bearing).
The recumbent group demonstrated the lowest level of reliability in terms of the confidence
intervals, with a lower limit of 0.45 at L5-S1 in the inter-marker group. In an attempt to
categorise the ICC, Shrout suggests that this result would be considered ‘fair’, however the ICC’s
at all other levels and groups would be either ‘moderate’, or predominantly ‘substantial’ (Shrout
1998). When comparing the ICC’s of recumbent and weight-bearing groups, for both intra- and
inter-marker studies, it is notable that reliability is comparatively better at all levels for weight-
bearing.
5.1.7.2 IV-RoMmax: Agreement
Agreement was found to be better than 1° at all levels, for both intra- and inter-marker studies
and in both recumbent and weight-bearing groups (Table 12). In the recumbent group intra- and
inter-marker SEM’s were very similar, but there was a more marked difference in weight-
bearing, which demonstrated comparatively increased error at all inter-vertebral levels in the
inter-marker study. Recumbent and weight-bearing groups demonstrated no clear differences,
with the exception of L2-L3 in the inter-marker study (recumbent SEM 0.31°, weight-bearing
SEM 0.76°). The smallest SEM was 0.17° at the level of L3-L4 in the recumbent intra-marker
study. The largest SEM, as previously mentioned was 0.76° at the level of L2-L3 in the weight-
bearing inter-marker study. This result aside, in terms of comparing inter-vertebral levels,
generally L5-S1 most consistently demonstrated the greatest disagreement, ranging from an
SEM of 0.54° in the intra-marker weight-bearing group, to 0.69° in inter-marker recumbent.
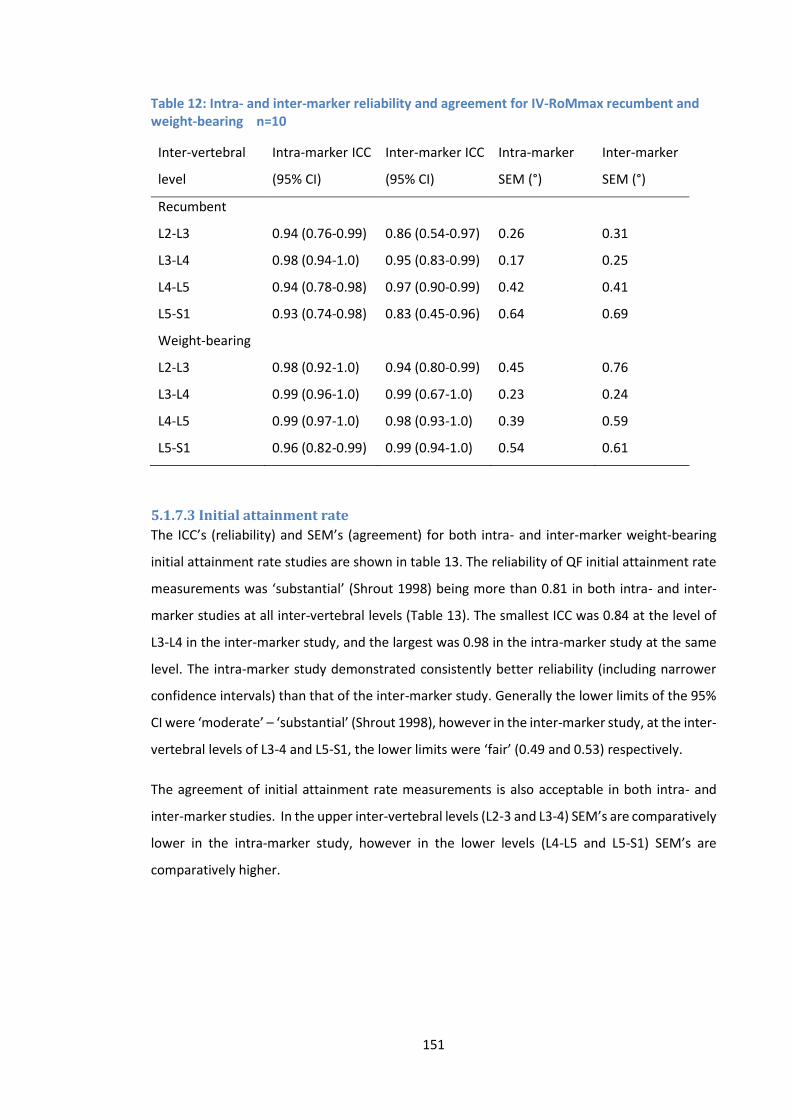
151
Table 12: Intra- and inter-marker reliability and agreement for IV-RoMmax recumbent and weight-bearing n=10
Inter-vertebral
level
Intra-marker ICC
(95% CI)
Inter-marker ICC
(95% CI)
Intra-marker
SEM (°)
Inter-marker
SEM (°)
Recumbent
L2-L3 0.94 (0.76-0.99) 0.86 (0.54-0.97) 0.26 0.31
L3-L4 0.98 (0.94-1.0) 0.95 (0.83-0.99) 0.17 0.25
L4-L5 0.94 (0.78-0.98) 0.97 (0.90-0.99) 0.42 0.41
L5-S1 0.93 (0.74-0.98) 0.83 (0.45-0.96) 0.64 0.69
Weight-bearing
L2-L3 0.98 (0.92-1.0) 0.94 (0.80-0.99) 0.45 0.76
L3-L4 0.99 (0.96-1.0) 0.99 (0.67-1.0) 0.23 0.24
L4-L5 0.99 (0.97-1.0) 0.98 (0.93-1.0) 0.39 0.59
L5-S1 0.96 (0.82-0.99) 0.99 (0.94-1.0) 0.54 0.61
5.1.7.3 Initial attainment rate
The ICC’s (reliability) and SEM’s (agreement) for both intra- and inter-marker weight-bearing
initial attainment rate studies are shown in table 13. The reliability of QF initial attainment rate
measurements was ‘substantial’ (Shrout 1998) being more than 0.81 in both intra- and inter-
marker studies at all inter-vertebral levels (Table 13). The smallest ICC was 0.84 at the level of
L3-L4 in the inter-marker study, and the largest was 0.98 in the intra-marker study at the same
level. The intra-marker study demonstrated consistently better reliability (including narrower
confidence intervals) than that of the inter-marker study. Generally the lower limits of the 95%
CI were ‘moderate’ – ‘substantial’ (Shrout 1998), however in the inter-marker study, at the inter-
vertebral levels of L3-4 and L5-S1, the lower limits were ‘fair’ (0.49 and 0.53) respectively.
The agreement of initial attainment rate measurements is also acceptable in both intra- and
inter-marker studies. In the upper inter-vertebral levels (L2-3 and L3-4) SEM’s are comparatively
lower in the intra-marker study, however in the lower levels (L4-L5 and L5-S1) SEM’s are
comparatively higher.

152
Table 13: Intra- and inter-marker reliability and agreement for initial attainment rate weight-bearing n=10
Inter-vertebral
level
Intra-marker ICC
(95% CI)
Inter-marker ICC
(95% CI)
Intra-marker
SEMratio
Inter-marker
SEMratio
L2-L3 0.95 (0.78-0.99) 0.95 (0.80-0.99) 0.026 0.036
L3-L4 0.98 (0.92-1.0) 0.84 (0.49-0.96) 0.020 0.033
L4-L5 0.92 (0.71-0.98) 0.91 (0.70-0.98) 0.032 0.018
L5-S1 0.95 (0.81-0.99) 0.88 (0.53-0.97) 0.023 0.019
5.1.8 Discussion
5.1.8.1 IV-RoM
The widely used ICC statistic has no standard values for acceptable reliability (Mieritz et al.
2012); however there have been many attempts to quantify its meaning in the literature. The
ICC is expressed as a value between 0 and 1, and a value of >0.7 is generally accepted as reliable;
however there remains no definite consensus (Ailliet et al. 2015). For example, it has been
suggested that values above 0.75 are indicative of good reliability (Portney and Watkins 2009),
but Aaronson et al (2002) recommend coefficients of >0.70 for group comparisons, and >0.90
for individual measurements as a minimal standard (Aaronson et al. 2002). The interpretation
of the ICC is therefore somewhat subjective in terms of what is acceptable or not. Shrout (1998),
attempts to address this problem by providing adjectives that describe the different ranges of
reliability values (Shrout 1998).
(0.00-0.10) - virtually none;
(0.11-0.40) - slight;
(0.41-0.60) - fair;
(0.61-0.80) - moderate;
(0.81-1.0) - substantial.
This has been adopted by a previous QF weight-bearing study in the cervical spine (Branney
2014) and serves as a reference point for the results in this chapter.
The interpretation of QF agreement and reliability studies is also made difficult by the use of
different ICC types. For example Teyhen and Mellor use an ICC (2,1) (Teyhen et al. 2005, Mellor
F.E. et al. 2014), whereas Yeager et al (2014) and Branney and Breen (2014) use an ICC (3,1) with
153
in some cases only brief explanations of the ICC selection process (Branney and Breen 2014;
Yeager et al. 2014).
The agreement and reliability of IV-RoM and initial attainment rate measurements using QF
have previously been assessed in recumbent participants (Mellor F.E. et al. 2014). As anticipated,
the reliability and agreement of IV-RoM measurements during recumbent sagittal flexion were
found to be similar to those found in the current work, with ‘substantial’ reliability (Shrout 1998),
and acceptable error (i.e. <1°) demonstrated at all levels for both intra- and inter-marker studies.
It has been demonstrated that reliability and agreement are typically decreased in the inter-
marker group (Mellor F.E. et al. 2014, Yeager et al. 2014), however these differences were shown
to be minimal in the current study, and there were notable exceptions to the trend (Table 12).
Although ICC’s were very similar between intra- and inter-marker groups, generally the width of
the CI’s and the SEM’s were larger in the latter. It appears that whilst errors arising from the use
of different markers do have a small impact, inter-marker agreement and reliability is still
acceptable.
Inter-marker agreement and reliability was assessed using two independent markers. At this
stage the only examiners of interest are those with expertise of using the technology and of
image marking. If the QF protocol were ever incorporated on a larger scale (within the NHS for
example), then further agreement and reliability studies using 3 or more markers may be
advisable, as a larger population of template markers would require assessment.
Interestingly, when comparing the findings of Mellor et al. (2014) to the current study, 95%
confidence intervals are generally wider in both for recumbent inter-marker results at the level
of L2-L3 (0.037-0.891) (Mellor F.E. et al. 2014) and (0.54-0.97) respectively. Mellor et al. did not
include L5-S1 in their study and so no comparison can be made, however as demonstrated, the
current study mirrored this finding at L2-L3 and also showed comparatively wider confidence
levels at L5-S1 (Table 12). It would appear therefore, that there is a marginal decrease in
reliability of measurements at inter-vertebral levels closer to the edge of the image field (i.e. L2-
3 and L5-S1). The anticipated difficulty (due to superimposition) in template marking/tracking of
L5-S1 was the reason cited by Mellor et al for its exclusion (Mellor et al. 2014), and it makes
sense that tracking problems are more likely to occur in templates that partially leave the image
field i.e. L2-3 and L5-S1). The current study’s results have shown however, that reliability (using
the criteria of Shrout 1998) and agreement of QF measurements at all levels, including L2-L3 and
L5-S1, can be achieved in both recumbent and weight-bearing protocols, at an acceptable level.
The sample size was restricted to 10 due to time and resource constraints, however many other
154
studies have also used this number (Branney and Breen 2014; McGregor et al. 1995; Mellor F.E.
et al. 2014). If a larger sample was possible, narrower CI’s would be expected. A more detailed
justification for the sample size chosen can be found elsewhere (Appendix T).
For the weight-bearing group’s intra-marker results, the closest comparisons can be made with
the work of (Teyhen et al. 2005). Reliability was similar to the current study with ICC’s >0.96 at
all inter-vertebral levels, however the IMRCI QF protocol for IV-RoMmax measurement appears
to show a modest improvement. Intra-marker agreement was marginally better in the current
study, with comparative SEM ranges of (0.4°-0.7° and 0.23°-0.54°). Teyhen did not conduct an
inter-marker study, and so no direct comparisons can be made with this group. In terms of
participant numbers, Teyhen et al. (2005) recruited double the number of the current study (n
= 20) and so it may be expected that there would be narrower confidence intervals,
unfortunately these were not reported (Teyhen et al. 2005). Interestingly, the current study
demonstrated larger ICC’s in the weight-bearing groups than those found in the recumbent.
These results confirm the agreement and reliability of measurements made using the weight-
bearing protocol, however it should be noted that SEM’s were generally larger in this group.
An advantage of the QF methodology is the analysis of continuous data, therefore if IV-RoMmax
occurs before or after full flexion, it will not be missed. Other QF protocols simply use images at
pre-designated points of the flexion cycle. Teyhen et al., used the single upright and fully flexed
image, and Ahmadi et al used sample points at 0, 25, 50, 75 and 100% of the cycle ROM (Ahmadi
et al. 2009, Teyhen et al. 2005). It is possible that both methods will therefore have missed the
true measurement of IV-RoMmax.
The current study does not include ICC’s and SEM’s for pooled inter-level data. It was decided
that pooling all participants at all levels may give an incorrect impression of results from 40
participants and not 10. To do so, would also conflate the ‘between subject variation’ and the
‘between inter-vertebral level variation’, thus obscuring the relevance of the ICCs. A possible
solution would be to calculate the ICC using the sum of all inter-vertebral values for each
participant, effectively reverting the participant number back to 10. This however was also
deemed inappropriate, as there would be an accumulation of the individual errors from each
inter-vertebral level. The concept of cumulative errors occurring in studies that do not report
individual inter-segmental levels is a possible criticism of Yeager et al, who base their conclusions
on overall ICC’s (Yeager et al. 2014).
155
The results have shown that the agreement and reliability of IV-RoMmax measurements made
using the weight-bearing sagittal plane QF protocol are acceptable at all inter-segmental levels,
including L2-3 and L5-S1. The concern that weight-bearing images may be of inferior quality, and
subsequently adversely affect the agreement and reliability of measurements was unfounded.
ICC’s between intra- and inter-marker groups were broadly similar; however there were typically
wider CI’s and larger SEM’s in the inter-marker group.
5.1.8.2 Initial attainment rate
This is the first time initial attainment rate has been reported using image data from the QF
lumbar sagittal weight-bearing protocol, and so the agreement and reliability of measurements
is thought never to have been investigated. Testing of the accuracy of the parameter is not
currently feasible, as it is a novel concept; there are no existing reference standards to compare
it to. Initial attainment rate as described using the QF protocol is an idea that is being developed
by the IMRCI group, and the advancement of its use as a research parameter is in the early
stages. In a recent study however, Breen et al. (2015), demonstrate how the variable can be
viewed as analogous to the neutral zone in lateral flexion (Breen et al. 2015).
Initial attainment rate measurements were highly repeatable with ICC’s ranging from (0.84-0.98)
and SEM’s from (0.018-0.036). An unexpected result was the relative decrease in measurement
error shown in the lower levels (L4-L5 and L5-S1) in the inter-marker study when compared to
the intra-marker. There is no obvious explanation for this result; however as template marking
experience increased, a shift in technique that increased the alignment between 1st and 2nd
markers may have occurred.
Two previous QF studies have reported results using initial attainment rate data from sagittal
plane (also referred to as attainment rate), and their findings are broadly similar to those of this
study. Mellor (2014), showed in the lumbar spine (L2-L5) that like IV-RoM, initial attainment
rate measurements were also repeatable using a recumbent protocol, however the results
demonstrated particularly good intra-marker agreement and reliability, with the largest CI for
ICC being (0.766-0.982 at L3-L4), and their largest SEMratio being (0.009) at the same level (Mellor
2014). These results represent an improvement over those seen in the current study, although
comparisons between recumbent and weight-bearing were broadly similar. The improved intra-
marker results seen in Mellor’s study may be a reflection of their greater template-marking
experience at the time of the investigation (Mellor 2014). If the templates are unlikely to change
between the first and second mark-ups, then intra-marker agreement and reliability will
increase.
156
The agreement and reliability of initial attainment rate measurements was shown to be
comparatively reduced in the upper most and lowest inter-vertebral segments (L2-3 and L5-S1,
mirroring the trend seen in the IV-RoMmax study. Branney (2014) demonstrated the agreement
and reliability of QF initial attainment rate measurements in the cervical spine (Branney 2014).
Their results also demonstrated comparable initial attainment rate measurements to those
found in the current study, and again the widest CI’s were shown to be at the inter-vertebral
levels at the edge of the image field (i.e. C1-C2 and C5-C6). This highlights the impact of human
error when templates are marked at these levels. Both the Branney and Mellor studies also
analysed 10 participants, which makes their results directly comparable to those reported in this
study.
5.1.8.3 Summary
An investigation into the agreement and reliability of weight-bearing IV-ROM and initial
attainment rate measurements was required for the following reasons.
• To assess the competency and skill of the author with regards the marking-up of
image templates.
• To date, only recumbent image data has been published using the QF measurement
system, and have excluded the level of L5-S1. Weight-bearing measurements have
never been analysed using the IMRCI QF system, and the QF studies that have
previously investigated agreement and reliability of these measurements have
either not been conducted at an inter-segmental level (Yeager et al. 2014), have not
included all the inter-segmental levels required for use in this study (Mellor F.E. et
al. 2014; Teyhen 2005), have not used continuous data to find the IV-RoMmax
(Ahmadi et al. 2009; Teyhen 2005) or not conducted an inter-marker study (Ahmadi
et al. 2009; Teyhen 2005).
• The preliminary studies (Chapter 3) demonstrated that IV-RoM motion patterns are
more variable during weight-bearing protocols than recumbent. The associated
occurrences of phenomena such as double peaks, and paradoxical motion, may
affect the determination of kinematic variable measurements.
• Weight-bearing protocols typically require a greater radiation dose to achieve the
same image quality as those obtained with recumbent examinations. If radiation
exposure is kept to a minimum, weight-bearing images are characteristically poorer,
which can subsequently affect image quality. Analysis of weight-bearing
measurements was therefore particularly important as agreement and reliability
157
could be compromised when compared to measurements processed from
recumbent protocols.
• Superimposition of bony structures (e.g. iliac crest, L5 vertebral body) at the base of
the lumbar spine, make marking-up and tracking of the L5-S1 level more difficult
than the others (L2-L5). As the measurements of IV-RoM and initial attainment rate
at L5-S1 are required in this study, and that it is hypothesised that there may be a
higher incidence of marking-up and tracking difficulties at this level, L5-S1
measurement agreement and reliability required assessment.
• The agreement and reliability of lumbar weight-bearing initial attainment rate
measurements has never been investigated. Initial attainment rate agreement and
reliability has been determined in the cervical spine (Branney 2014), and in the
recumbent lumbar spine (Mellor 2009), but never at the level of L5-S1.
Given the highly repeatable IV-RoMmax and initial attainment rate measurement results, the
author’s marking ability was of an adequate standard. Weight-bearing measurements of both
parameters were achieved with acceptable agreement and reliability at all levels, including
those nearest the edge of the image field (L2-3 and L5-S1). Superimposition problems at the
level of L5-S1, increased occurrences of paradoxical motion and double peaks, and image quality
issues associated with weight-bearing images, did not markedly affect agreement and reliability.
5.1.9 Conclusion
IV-RoMmax and initial attainment rate measurements made using the weight-bearing sagittal
plane QF protocol demonstrated acceptable agreement and reliability. In chapter 6 relationships
between these parameters during weight-bearing sagittal flexion are explored. IV-RoMmax is
also used in chapter 7 where correlations between maximum angular range and muscle activity
variables are investigated.
Note: All of the agreement and reliability investigations described above were conducted by the
author as a direct part of their PhD research. The results may however be incorporated into the
ongoing normative database study (4.2.1) in the future. Due to resource and ethical constraints,
weight bearing flexion test–retest reliability studies were not conducted. This has since been
investigated by the IMRCI group however, showing the inter-session (i.e. 6 weeks apart) ICC for
weight bearing flexion IV-RoMmax as 0.82 (0.73-0.88). All other directions (i.e. extension, right
and left lateral flexion) were also reported as above 0.7. At this point this data is unpublished.
158
5.2 Part 2: Surface electromyography (sEMG) of the lumbar and thoracic
paravertebral muscles during the weight-bearing sagittal plane QF
protocol: An Intra- and inter-session sEMG agreement and reliability
study.
5.2.1 Introduction
The weight-bearing sagittal plane QF protocol has never before been combined with sEMG, and
the agreement and reliability of sEMG parameters during the examination has not been
assessed. When measurements of muscle activity are made for research purposes, the methods
used must be both reliable and repeatable, as inaccurate measurements can result in error being
greater than the changes occurring in the muscle (Stokes 1985). The present study protocol was
designed to reduce the effects of biological and systematic variations as much as possible,
however its impact on the agreement and reliability of sEMG amplitude measurements remains
unknown. Another important question in terms of methodological design was the decision to
use the sEMG data from left and right sides individually, or whether to combine them, and use
an average of both for each spinal level T9 (TES), L2 (LES) and L5 (LMU).
Historically, the literature has placed little emphasis on the reliability of sEMG amplitude
parameters (Daneels et al. 2001), and in terms of the paraspinal muscles, the evidence suggests
that agreement and reliability can be poorer than in other muscle groups (Ahern et al. 1986;
Stokes et al. 1988). Therefore if meaningful relationships are to be found between sEMG
amplitudes and intervertebral kinematic variables, their validity will depend heavily on the
agreement and reliability of both sEMG and QF parameters, and so the different paraspinal
muscles of interest (i.e. TES, LES and LMU) require assessment. This is especially important as
EMG reliability has been shown to vary between different paraspinal muscles (Biederman et al.
1990). Biederman et al. (1990) also investigated the reliability of the RMS parameter during
weight holding tasks, and showed it to be more reliable for the multifidus than over more
cephalad muscles such as iliocostalis lumborum par thoracis (Biedermann et al. 1990). It was
proposed that the difference may have been the result of the arms being raised during the test,
and as the QF protocol also requires participants to have raised arms, the reliability of all muscle
levels should be tested.
Objectives
• To determine whether there are significant differences in the mean normalised sEMG
amplitudes between left and right sides.
• To determine the inter- and intra-session agreement and reliability of normalised sEMG
amplitudes during the weight-bearing sagittal flexion and return QF protocol.
159
5.2.2 Methods
10 healthy males (mean age SD) were recruited to participate in the lumbar weight-bearing
sagittal plane sEMG protocol. The details of the method have been outlined previously (Sections
4.2.8 and 4.2.14), however the following modifications were incorporated for the agreement
and reliability study.
1. Participants received no radiation during the procedure, however lead shielding was
worn to recreate QF test conditions.
2. The sEMG protocol was carried out twice by a single examiner. All follow up recordings
took place within 1 week of the baseline, with a minimum of 2 days separation.
3. The acquisition cycle was repeated 4 times (several minutes apart) at baseline and
follow up. Intra-session results compared cycles 1 and 2 (of the 4), whereas inter-session
results were calculated as an average of the 4 mean normalised amplitudes recorded
over the cycle duration.
4. In an attempt to ensure that the electrodes were re-applied in the same position at
follow-up, the baseline electrode positions were recorded using an indelible ink tracing
around each of their borders, and by using a transparent electrode positioning map.
5. In order to replicate the baseline participant positioning at follow-up, foot positioning
was recorded by tracing around each participant’s feet on A3 paper at baseline, and
motion-frame apparatus positions were recorded (Figure 45).
6. The sMVC was determined once only for each participant at baseline (the same sMVC
was used at follow-up).
7. The initiation of the movement of the motion frame and the beginning of sEMG
recordings were synchronised by pressing 2 start buttons simultaneously. (This system
was replaced by an automated switch in the main study) (Section 4.2.20).
The sEMG tracing was recorded for approximately 20 seconds during each cycle. The mean
normalised amplitudes over this period were used for analysis.
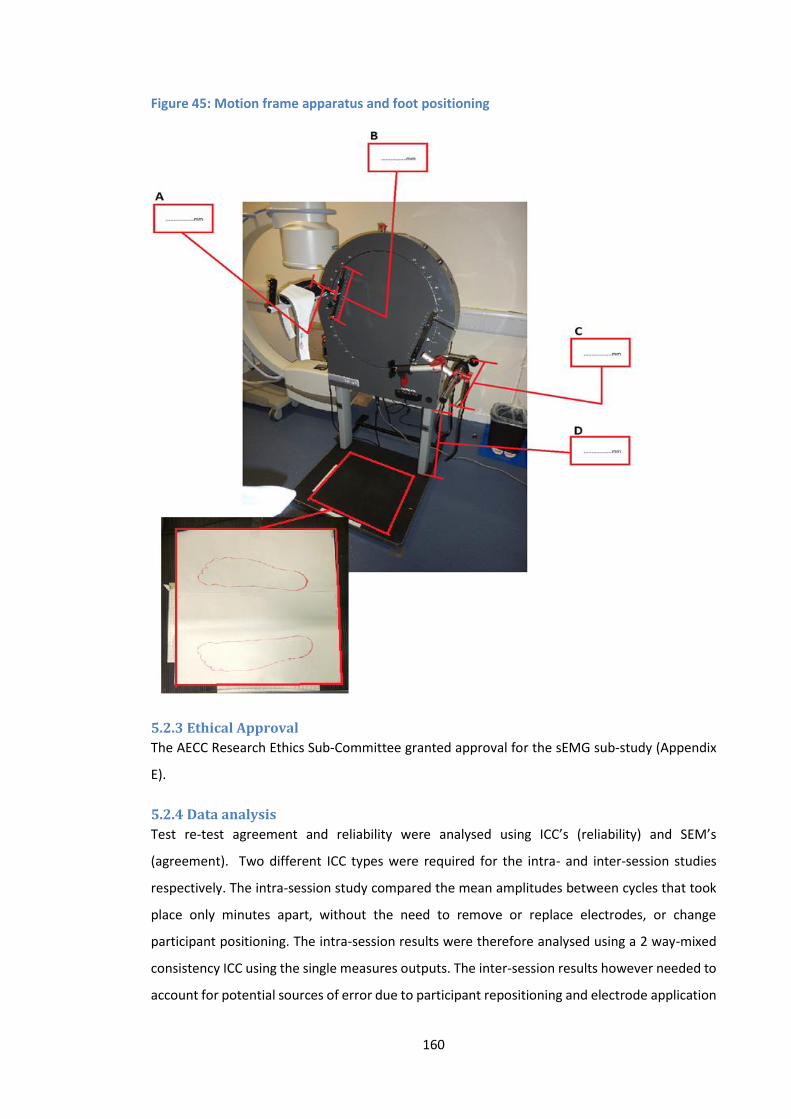
160
Figure 45: Motion frame apparatus and foot positioning
5.2.3 Ethical Approval
The AECC Research Ethics Sub-Committee granted approval for the sEMG sub-study (Appendix
E).
5.2.4 Data analysis
Test re-test agreement and reliability were analysed using ICC’s (reliability) and SEM’s
(agreement). Two different ICC types were required for the intra- and inter-session studies
respectively. The intra-session study compared the mean amplitudes between cycles that took
place only minutes apart, without the need to remove or replace electrodes, or change
participant positioning. The intra-session results were therefore analysed using a 2 way-mixed
consistency ICC using the single measures outputs. The inter-session results however needed to
account for potential sources of error due to participant repositioning and electrode application
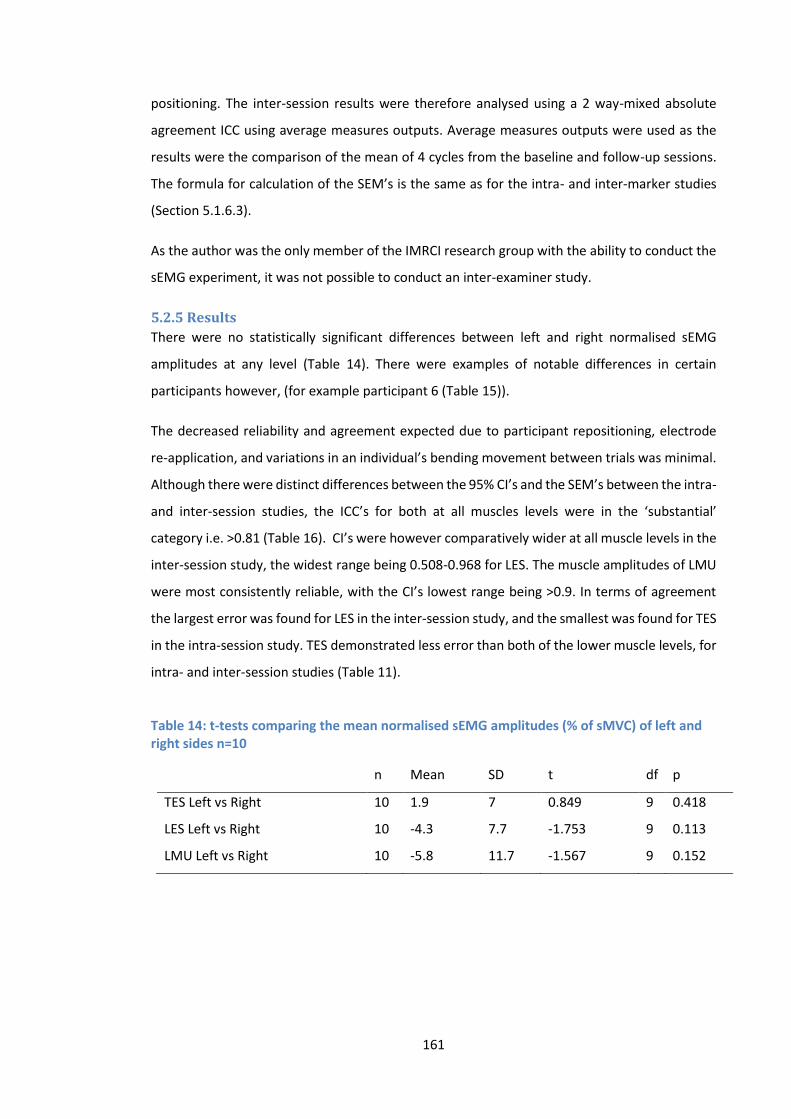
161
positioning. The inter-session results were therefore analysed using a 2 way-mixed absolute
agreement ICC using average measures outputs. Average measures outputs were used as the
results were the comparison of the mean of 4 cycles from the baseline and follow-up sessions.
The formula for calculation of the SEM’s is the same as for the intra- and inter-marker studies
(Section 5.1.6.3).
As the author was the only member of the IMRCI research group with the ability to conduct the
sEMG experiment, it was not possible to conduct an inter-examiner study.
5.2.5 Results
There were no statistically significant differences between left and right normalised sEMG
amplitudes at any level (Table 14). There were examples of notable differences in certain
participants however, (for example participant 6 (Table 15)).
The decreased reliability and agreement expected due to participant repositioning, electrode
re-application, and variations in an individual’s bending movement between trials was minimal.
Although there were distinct differences between the 95% CI’s and the SEM’s between the intra-
and inter-session studies, the ICC’s for both at all muscles levels were in the ‘substantial’
category i.e. >0.81 (Table 16). CI’s were however comparatively wider at all muscle levels in the
inter-session study, the widest range being 0.508-0.968 for LES. The muscle amplitudes of LMU
were most consistently reliable, with the CI’s lowest range being >0.9. In terms of agreement
the largest error was found for LES in the inter-session study, and the smallest was found for TES
in the intra-session study. TES demonstrated less error than both of the lower muscle levels, for
intra- and inter-session studies (Table 11).
Table 14: t-tests comparing the mean normalised sEMG amplitudes (% of sMVC) of left and right sides n=10
n Mean SD t df p
TES Left vs Right 10 1.9 7 0.849 9 0.418
LES Left vs Right 10 -4.3 7.7 -1.753 9 0.113
LMU Left vs Right 10 -5.8 11.7 -1.567 9 0.152
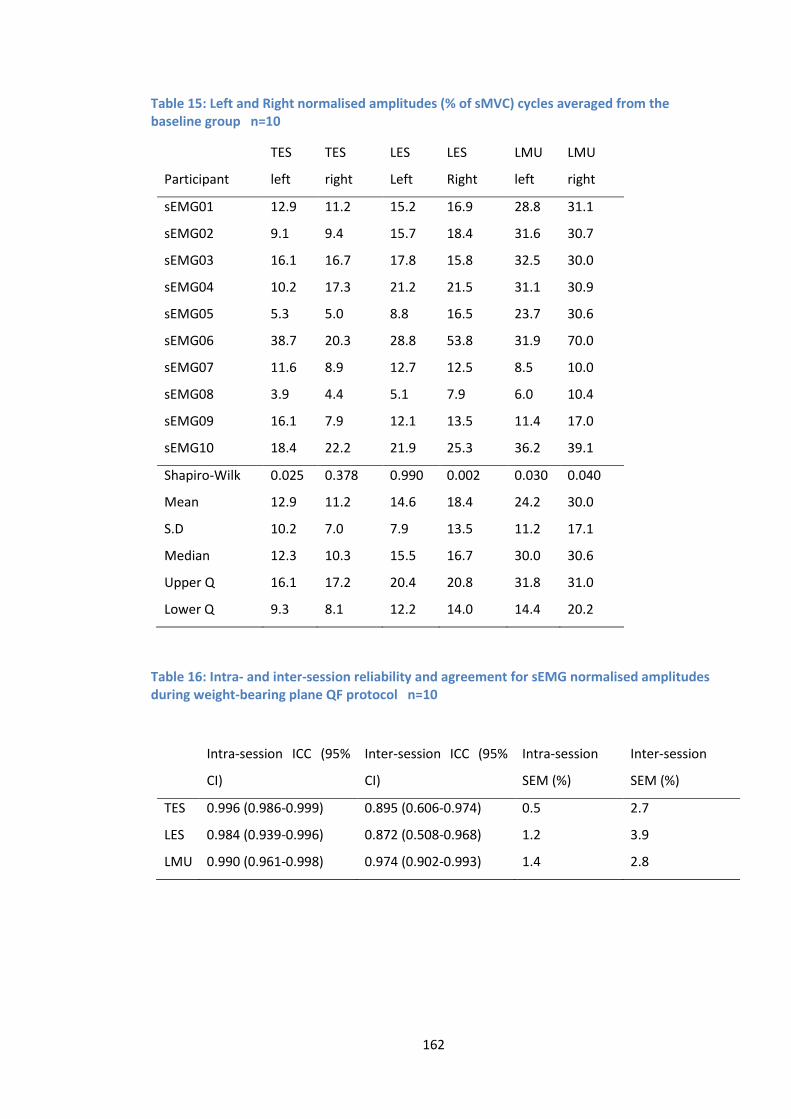
162
Table 15: Left and Right normalised amplitudes (% of sMVC) cycles averaged from the baseline group n=10
Participant
TES
left
TES
right
LES
Left
LES
Right
LMU
left
LMU
right
sEMG01 12.9 11.2 15.2 16.9 28.8 31.1
sEMG02 9.1 9.4 15.7 18.4 31.6 30.7
sEMG03 16.1 16.7 17.8 15.8 32.5 30.0
sEMG04 10.2 17.3 21.2 21.5 31.1 30.9
sEMG05 5.3 5.0 8.8 16.5 23.7 30.6
sEMG06 38.7 20.3 28.8 53.8 31.9 70.0
sEMG07 11.6 8.9 12.7 12.5 8.5 10.0
sEMG08 3.9 4.4 5.1 7.9 6.0 10.4
sEMG09 16.1 7.9 12.1 13.5 11.4 17.0
sEMG10 18.4 22.2 21.9 25.3 36.2 39.1
Shapiro-Wilk 0.025 0.378 0.990 0.002 0.030 0.040
Mean 12.9 11.2 14.6 18.4 24.2 30.0
S.D 10.2 7.0 7.9 13.5 11.2 17.1
Median 12.3 10.3 15.5 16.7 30.0 30.6
Upper Q 16.1 17.2 20.4 20.8 31.8 31.0
Lower Q 9.3 8.1 12.2 14.0 14.4 20.2
Table 16: Intra- and inter-session reliability and agreement for sEMG normalised amplitudes during weight-bearing plane QF protocol n=10
Intra-session ICC (95%
CI)
Inter-session ICC (95%
CI)
Intra-session
SEM (%)
Inter-session
SEM (%)
TES 0.996 (0.986-0.999) 0.895 (0.606-0.974) 0.5 2.7
LES 0.984 (0.939-0.996) 0.872 (0.508-0.968) 1.2 3.9
LMU 0.990 (0.961-0.998) 0.974 (0.902-0.993) 1.4 2.8
163
5.2.6 Discussion
5.2.6.1 Comparing muscle activity between sides
The comparison between mean normalised sEMG amplitudes recorded from TES, LES and LMU,
revealed no significant differences between left and right sides (Table 14). When comparing
ipsilateral to contralateral, previous studies (Ahern et al. 1988; Lariviere et al. 2005; Lariviere et
al. 2000; Oddsson and De Luca 2003) all report significant differences between left and right side
paraspinal activity during dynamic movements. These studies investigated both LBP patients and
healthy controls, whereas this study population consisted of only healthy controls, which may
partially explain why a closer similarity between sides was achieved, although Reeves et al
(2006), demonstrated no significant difference in the imbalance in sides between participants
with a history of low back pain, and those without (Reeves et al. 2006).
There were however individual examples of clear differences between sides, such as in
participant 6 (Table 15). These results will have increased the overall difference between left
and right, although not to a significant level for the sample as a whole. It would seem therefore
that a difference from side to side may be normal in a population of healthy participants. With
this in mind, the decision to use the mean of both sides combined (as utilised by Reeves et al.
2006) for main study analysis was taken.
The standardisation of the QF protocol results in each participant bending at the same rate and
over the same range. Even without the standardised motion, the sagittal plane is perhaps most
suitable for kinematic assessments of the spine, as relative to the frontal plane, there are a lack
of coupled movement patterns (Keessen 1984).
In order to avoid excessive deviation from the sagittal plane, other safeguards were put in place.
In a recent lumbar spine kinematics study, Tafazoll et al. described how they instructed
participants to remain in the sagittal plane (Tafazzol et al. 2014). As much like common sense as
this may sound, the instruction to remain facing forwards (avoiding unnecessary rotation) was
also given to this study’s participants. The radiographer was also able to visually and
radiographically assess each participant’s movement. During the range of motion tolerance
trials, the radiographer advised the participants against any excessive rotation of the head and
shoulders, and also recorded a single frame at the end of each practice range (e.g. 60°). This
allowed the visual assessment of any rotation that had occurred in the lumbar vertebrae, and
participants were instructed to alter their movement pattern if required. These safeguards may
164
have contributed to a more equal share of muscle activity between sides, and the overall high
agreement and reliability seen between sessions.
Lariviere et al. (2009) demonstrated that providing visual feedback of all out of plane exertions,
could reduce unwanted out of plane moments, and significantly alter activation amplitudes
(Lariviere et al. 2009). This was found to be the case particularly in the frontal and transverse
planes, but feedback had less of an effect in the sagittal plane. In a follow up study however,
they also demonstrated that the use of a 3-D visual feedback system did not actually decrease
the within-subject variability, and that learning how to use the system (over three assessment
days) had negligible effects on both coupled moments and EMG variables (Lariviere et al. 2014).
Therefore no additions to existing safeguards were thought necessary for the main study data
collection of this project.
5.2.6.2 Reliability
It is recommended that any procedures to be used in EMG studies should undergo reliability
testing (Soderberg 2000). A common problem with sEMG studies is the great variability in their
findings (Geisser et al. 2005; Van Dieen et al. 2003), and so the high reliability shown in this study
is reassuring.
It is usual for a proportion of variability to be attributed to a lack of standardisation, and the
method by which EMG variables are normalised (Lariviere and Arsenault 2008). The results
however show ‘substantial’ reliability for both intra-day and inter-day sessions, indicating that
the standardisation of movement range, speed and direction provided by the QF protocol may
have played an important role in reducing the impact of variability resulting from these causes.
It is difficult to compare reliability with other studies as the protocols are invariably very
different (Thuresson et al. 2005), however this study produced comparable intra-session results
to two similar investigations. Daneels et al (2001) showed the reliability of amplitude (averaged
EMG) of lumbar multifidus and iliocostalis lumborum pars thoracis during flexion and return to
be ‘moderate’ to ‘substantial’ (ICC>0.75) (Daneels et al. 2001), as did Lariviere et al. (2000), when
they investigated EMG amplitude reliability of the TES and LES muscles during a flexion and
extension task (Lariviere et al. 2000). All intra- and inter-session results showed ICC’s >0.85, an
improvement on these previous studies (Daneels et al. 2001; Lariviere et al. 2000), suggesting
that the standardisation of the QF protocol may increase reliability when compared to sagittal
flexion in an uncontrolled environment.
165
There is a clear comparative decrease in reliability in the inter-session group, most markedly
seen in the wider CI’s (Table 16), yet reliability as a whole remains high. Other studies show a
distinctly lower inter-session reliability compared to intra-session groups, especially for
amplitude components (Daneels et al. 2001; Jobson et al. 2013; Kollmitzer et al. 1999). The
‘substantial’ reliability (ICC’s >0.81) seen in the current study’s inter-session group, may be an
indication therefore that the procedures and standardisations put in place to recreate test
conditions between sessions worked well. EMG remains however a very sensitive parameter
(Daneels et al. 2001), and it has been shown that even small changes in electrode position can
have a significant effect on recorded sEMG amplitudes (De Nooij et al. 2009) also see (Section
3.3). The attention to accurate participant re-positioning (Figure 45) and electrode re-
application (Figure 42) may therefore be important factors in keeping the influence of these
sources of error to a minimum.
As with the kinematic reliability studies, a common problem encountered when critiquing the
literature is that the authors often fail to provide enough detail about the statistical tests they
employ. Williams et al. (2013) for example, show that highly reliable peak magnitude is
achievable, with intra-session ICC’s of 0.97 and 0.96 for acute and chronic low back pain groups
respectively (Williams et al. 2013b). However, the authors do not refer to the type of ICC test
used, so evaluation of these results is difficult. The Williams et al. (2013) study also includes no
reference to agreement, a common omission in the sEMG agreement and reliability literature
making comparisons within individuals problematic (De Vet 2006).
5.2.6.3 Agreement
As referred to above, it is difficult to compare sEMG amplitude agreement with other studies as
it is not typically mentioned (Daneels et al. 2001; Lariviere et al. 2000; Williams et al. 2013b),
and the methods and normalisation techniques vary between studies. The sEMG amplitude
agreement in this study is acceptable with the largest intra- and inter-session error being <1.5%
and <4% respectively (Table 16). As seen in the inter-vertebral kinematic IV-RoM results, the
inter-session group demonstrated typically greater error than the intra-session group, and
agreement was also consistently the best for TES. These seem therefore to be linked. In a study
that did attempt to quantify the measurement error of surface EMG, Thuresson et al. (2005),
included the standard error of measurement, which was calculated as the within-subject
standard deviation (Thuresson et al. 2005).
166
5.2.6.4 Summary
All intra- and inter-session preparation and testing were conducted by the author, and the
consistency this provided is reflected in the high agreement and reliability found in both groups,
but particularly in the intra-session study. The method represents a more regulated forward
flexion and return protocol than that seen elsewhere in the literature, and produces highly
repeatable sEMG amplitude measurements. The intra-session agreement and reliability was
found to be better than the inter-session, most likely because there was no requirement to
remove and re-apply electrodes between cycles. Despite this requirement for the inter-session
study, agreement and reliability was still found to be ‘substantial’ (Shrout 1998).
The standardisation of the rate, range and direction of movement, keeping testing periods to
the same time of day, keeping the environment at the same temperature, and using accurate
electrode mapping techniques, are all factors that may have contributed to the high agreement
and reliability of the results. These results can only be applied to the specified population;
however the sample is reflective of the age group and gender of those recruited into the main
study.
5.2.7 Conclusion
There was no significant difference in mean normalised sEMG amplitude over the flexion and
return cycle between left and right sides, and therefore the mean of left and right sides will be
used in the main study. The results also indicate that normalised sEMG RMS amplitudes are a
repeatable measure of muscular activity during the weight-bearing QF sagittal forward bending
and return protocol, and as such are suitable for use in the main study. The stability of sEMG
amplitude measurements demonstrated by both the intra- and inter-session results, suggest
that the methods are suitable for both cross-sectional and longitudinal studies conducted over
a similar time-frame. Relationships between sEMG and kinematic parameters (IV-RoMmax) are
investigated in chapter 7.
Note: The agreement and reliability results from sections 5.1 and 5.2 have been published in
peer reviewed journals (Du Rose and Breen 2016a, Du Rose and Breen 2016b) (Appendices Q
and R. In addition, the above studies conform to the Quality Appraisal of Reliability (QAREL)
Checklist (Lucas 2010) (Appendices N and O).
167
Chapter 6
6.1 Relationships between lumbar inter-vertebral motion and
lordosis in adult males: a cross sectional cohort study
6.1.1 Introduction The bulk of the following chapter is a peer reviewed paper published in BMC Musculoskeletal
Disorders (Du Rose and Breen 2016b) by the author and this study’s lead supervisor10, and
conforms to the Strengthening the Reporting of Observational Studies in Epidemiology (STROBE)
guidelines (Von Elm et al. 2008). The paper is not presented in its entirety as the agreement and
reliability findings were presented in the previous chapter. In the general discussion section
however there have been substantial additions, and there are some methodological details that
replicate previous aspects of the thesis. The paper addresses the study’s secondary aims
(Section 2.7.2.4) by exploring the relationships between IV-RoMmax and lordosis, initial
attainment rate and the IV-RoMmax at other lumbar levels.
6.1.2 Background Movement of the lumbar spine requires the participation of multiple motion segments and the
relative contributions of these segments are a function of their own mechanical properties
(Sahrmann 2002). Aberrant spinal movement patterns are widely thought to be related to
musculoskeletal pain and dysfunction (Iguchi 2004; Kanemura 2009; Spinelli et al. 2015), and as
such they are used to inform surgical and conservative clinical decision making (Fritz et al. 2007;
O'sullivan 2005; Sahrmann 2002; Steiger et al. 2014), and as indicators of spinal stability (Fritz et
al. 1998; Kanemura 2009; Panjabi 1992a, 1992b). As a consequence of their wide variation in
both low back pain and healthy populations however, the clinical importance of factors such as
inter-vertebral range of motion (IV-RoM) remains unclear (McGregor et al. 1997), and the
identification of biomechanical factors that may contribute to low back pain, remains a
challenge (Mellor et al. 2014). Information about how IV-RoM may interact with other
biomechanical factors may therefore help provide a better understanding of how variations in
lumbar inter-vertebral kinematics may affect prognosis and treatment outcomes.
The starting point for this should be the collection of detailed normative quantitative data with
respect to in vivo inter-vertebral motion and morphologic parameters (Li 2009). Quantitative
10 Professor Alan Breen

168
fluoroscopy (QF) has been shown to be an accurate and reliable 2D method of doing this (Mellor
et al. 2014, Teyhen et al. 2005, Yeager et al. 2014). Recent technological advances have enabled
the acquisition of 3D lumbar kinematic data in vivo (Aiyangar et al. 2014, Harvey et al. 2015),
however it has been demonstrated that there is only minimal axial rotation and lateral bending
associated with movements in the sagittal plane (Ellingson and Nuckey 2015; Harvey 1998;
Pearcy 1985), and in terms of QF inter-vertebral measurements, out of plane motion of up to
10° does not significantly affect accuracy (Breen et al. 2006). Therefore, the greater expense
and dose associated with current 3D techniques weighted against the potentially negligible
clinical and research benefits, justify the use of 2D QF technology, particularly in the sagittal
plane. Indeed, the investigation of spinal mechanical behaviour has been outlined as a priority
for future QF research (Breen et al. 2012), which begins with the relationships between IV-RoM
and other kinematic variables in healthy, pain–free control populations. Such normative
information should provide insights into the possible biomechanical consequences of changes
within each.
Previous dynamic studies using fluoroscopy have highlighted contrasting ranges and patterns of
angular rotation between the upper and lower lumbar motion segments (Ahmadi et al. 2009;
Kanayama 1996; Lee 2002; Li 2009; Okawa 1998; Wong 2006; Wong 2004; Wu et al. 2014; Xia
2009), which make different contributions to movements such as sagittal flexion. There is also
evidence to suggest that lordosis may relate to an individual’s spinal flexibility (Been and
Kalichman 2014). Indeed, a recent MRI study that investigated the intrinsic shape of the lumbar
spine concluded that lumbar spinal shapes may be related to an individual’s risk of injury
(Pavlova et al. 2014).
IV-RoM is the most commonly reported measure of inter-vertebral motion (Mellor 2014;
Pearson et al. 2011; Teyhen 2005) and attainment rate (defined as the velocity with which IV-
RoM is reached), has been identified as a reflection of intervertebral restraint (Mellor et al. 2014,
Teyhen et al. 2007, Wong et al. 2004). Initial attainment rate is a refinement of this which
measures the slackness of an inter-vertebral motion segment in its initial phase of rotation
(Breen et al. 2012, Mellor et al. 2009, Mellor et al. 2014). This parameter has been shown to
correlate with the dynamic neutral zone (Breen et al. 2015), and is therefore also believed to be
of importance when considering the stability of motion segments. Relationships between these
and other kinematic and morphologic variables have not been investigated previously. This
study examined the relationships between IV-RoMmax at lumbar inter-vertebral levels from L2
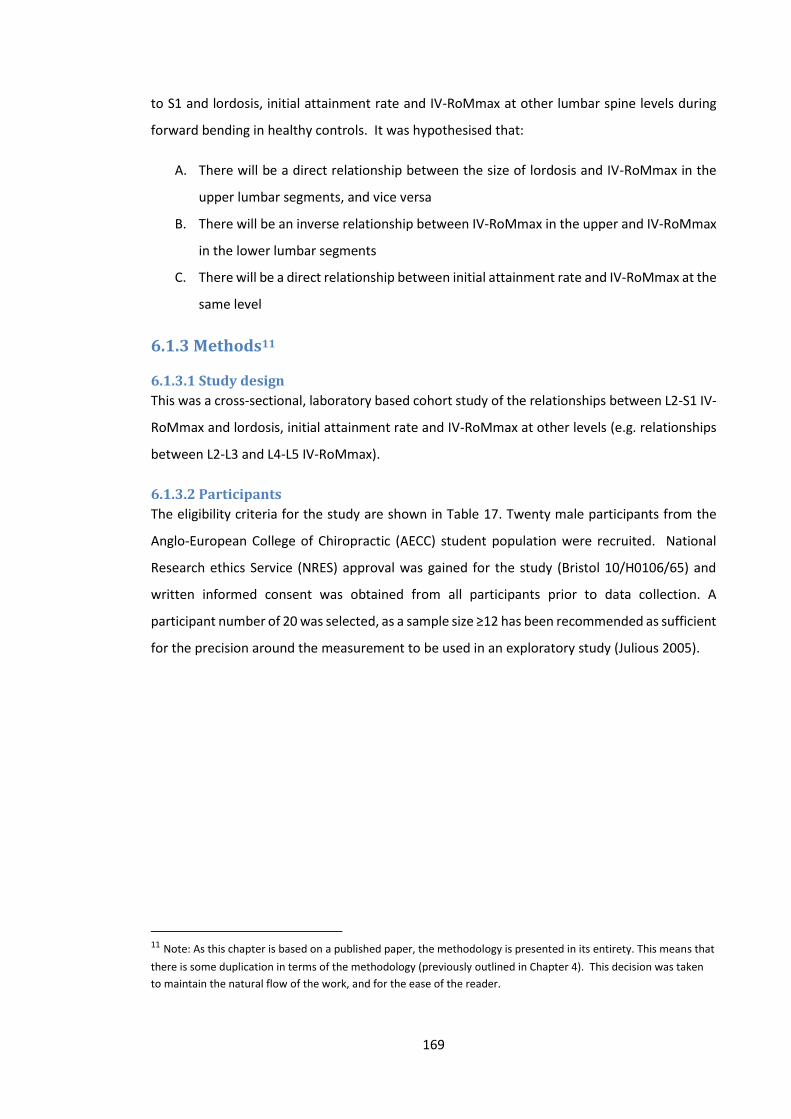
169
to S1 and lordosis, initial attainment rate and IV-RoMmax at other lumbar spine levels during
forward bending in healthy controls. It was hypothesised that:
A. There will be a direct relationship between the size of lordosis and IV-RoMmax in the
upper lumbar segments, and vice versa
B. There will be an inverse relationship between IV-RoMmax in the upper and IV-RoMmax
in the lower lumbar segments
C. There will be a direct relationship between initial attainment rate and IV-RoMmax at the
same level
6.1.3 Methods11
6.1.3.1 Study design
This was a cross-sectional, laboratory based cohort study of the relationships between L2-S1 IV-
RoMmax and lordosis, initial attainment rate and IV-RoMmax at other levels (e.g. relationships
between L2-L3 and L4-L5 IV-RoMmax).
6.1.3.2 Participants
The eligibility criteria for the study are shown in Table 17. Twenty male participants from the
Anglo-European College of Chiropractic (AECC) student population were recruited. National
Research ethics Service (NRES) approval was gained for the study (Bristol 10/H0106/65) and
written informed consent was obtained from all participants prior to data collection. A
participant number of 20 was selected, as a sample size ≥12 has been recommended as sufficient
for the precision around the measurement to be used in an exploratory study (Julious 2005).
11 Note: As this chapter is based on a published paper, the methodology is presented in its entirety. This means that
there is some duplication in terms of the methodology (previously outlined in Chapter 4). This decision was taken
to maintain the natural flow of the work, and for the ease of the reader.
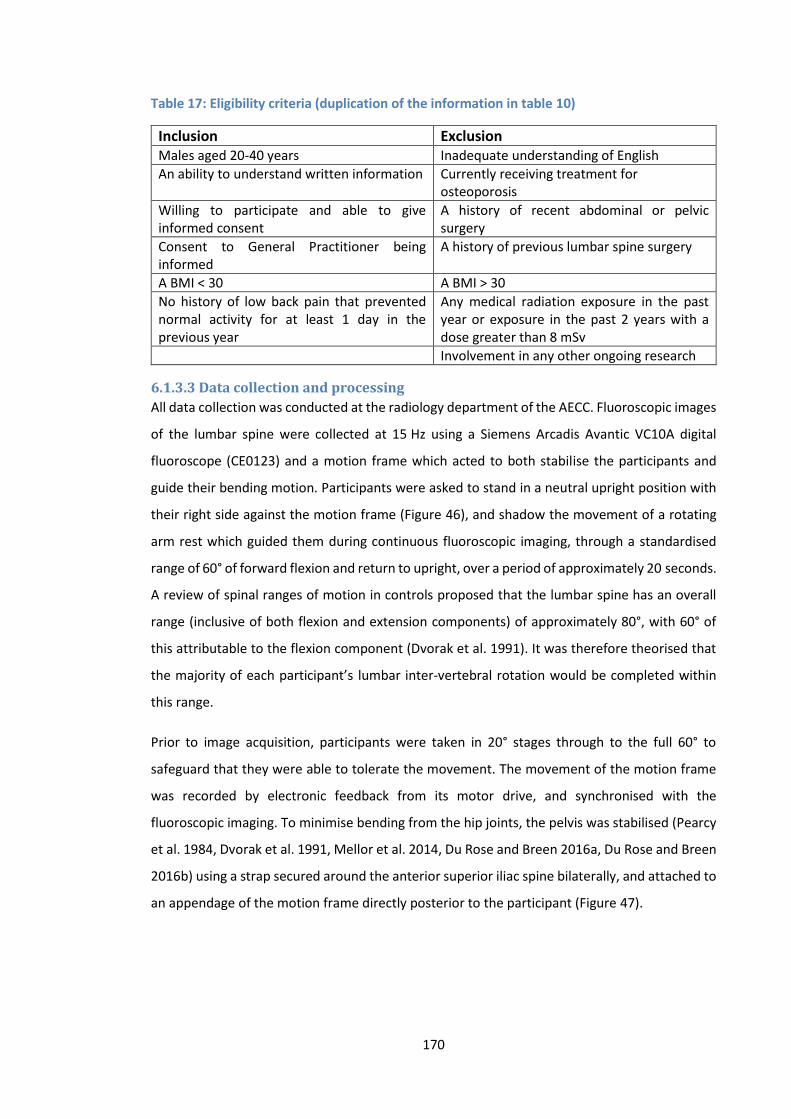
170
Table 17: Eligibility criteria (duplication of the information in table 10)
Inclusion Exclusion Males aged 20-40 years Inadequate understanding of English
An ability to understand written information Currently receiving treatment for osteoporosis
Willing to participate and able to give informed consent
A history of recent abdominal or pelvic surgery
Consent to General Practitioner being informed
A history of previous lumbar spine surgery
A BMI < 30 A BMI > 30
No history of low back pain that prevented normal activity for at least 1 day in the previous year
Any medical radiation exposure in the past year or exposure in the past 2 years with a dose greater than 8 mSv
Involvement in any other ongoing research
6.1.3.3 Data collection and processing
All data collection was conducted at the radiology department of the AECC. Fluoroscopic images
of the lumbar spine were collected at 15 Hz using a Siemens Arcadis Avantic VC10A digital
fluoroscope (CE0123) and a motion frame which acted to both stabilise the participants and
guide their bending motion. Participants were asked to stand in a neutral upright position with
their right side against the motion frame (Figure 46), and shadow the movement of a rotating
arm rest which guided them during continuous fluoroscopic imaging, through a standardised
range of 60° of forward flexion and return to upright, over a period of approximately 20 seconds.
A review of spinal ranges of motion in controls proposed that the lumbar spine has an overall
range (inclusive of both flexion and extension components) of approximately 80°, with 60° of
this attributable to the flexion component (Dvorak et al. 1991). It was therefore theorised that
the majority of each participant’s lumbar inter-vertebral rotation would be completed within
this range.
Prior to image acquisition, participants were taken in 20° stages through to the full 60° to
safeguard that they were able to tolerate the movement. The movement of the motion frame
was recorded by electronic feedback from its motor drive, and synchronised with the
fluoroscopic imaging. To minimise bending from the hip joints, the pelvis was stabilised (Pearcy
et al. 1984, Dvorak et al. 1991, Mellor et al. 2014, Du Rose and Breen 2016a, Du Rose and Breen
2016b) using a strap secured around the anterior superior iliac spine bilaterally, and attached to
an appendage of the motion frame directly posterior to the participant (Figure 47).
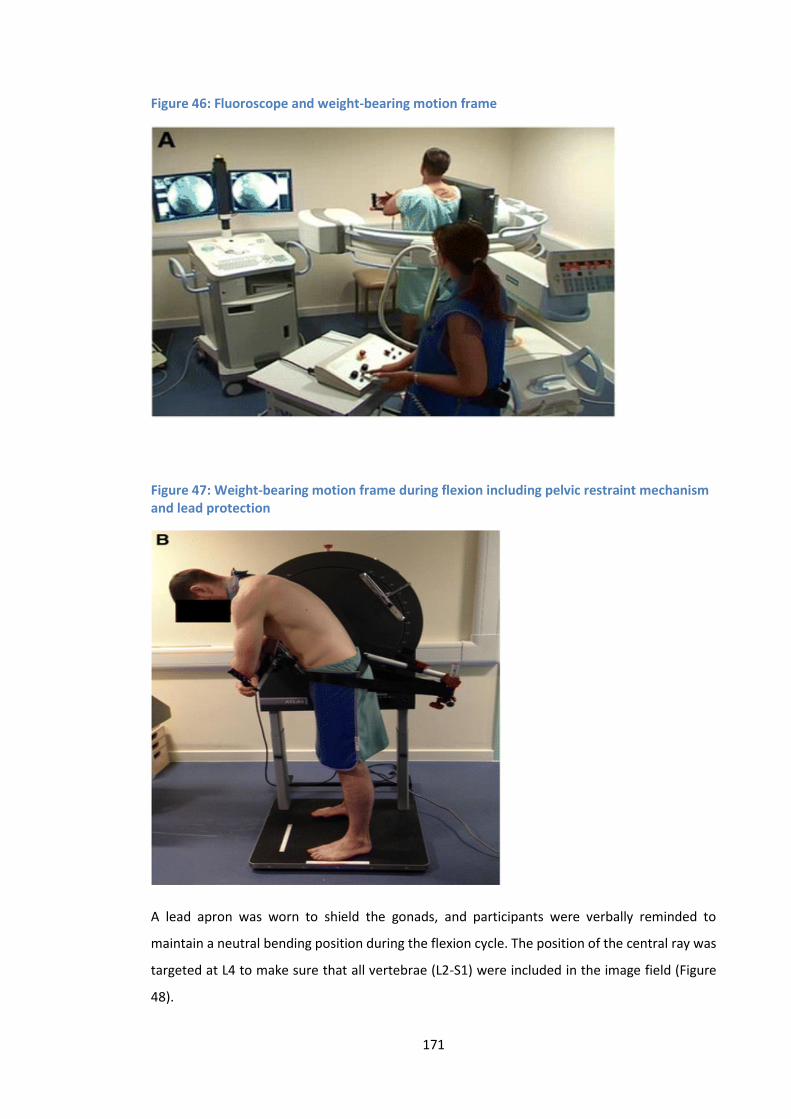
171
Figure 46: Fluoroscope and weight-bearing motion frame
Figure 47: Weight-bearing motion frame during flexion including pelvic restraint mechanism and lead protection
A lead apron was worn to shield the gonads, and participants were verbally reminded to
maintain a neutral bending position during the flexion cycle. The position of the central ray was
targeted at L4 to make sure that all vertebrae (L2-S1) were included in the image field (Figure
48).
172
Figure 48: Fluoroscopic image of the lumbar spine. Templates placed around the lumbar vertebrae (L2-S1) on the first frame of the QF sequence
The fluoroscopic sequences were then transferred to a desk top computer for analysis using
bespoke image processing codes written in Matlab (The Mathworks, Cambridge). Using the
screen cursor, the outlines of each vertebra from L2-S1 in the first image of each sequence were
marked-up manually with an electronic template. In order to increase precision, this process
was replicated five times for each sequence and the results were averaged. In all subsequent
image frames the software tracked each vertebra automatically, creating a continuous
measurement of its movement throughout the flexion and return bending sequence. To ensure
that template tracking was maintained throughout the sequence, visual checks were made using
video playback.
The data collected comprised of range of motion (IV-RoM), initial attainment rate, and lordosis
and the reliability and agreement of the first two of these were assessed as part of the study (De
Vet 2006) (see chapter 5). The technique used to measure changes in inter-vertebral angle was
established elsewhere (Frobin 1996), and is shown in figure 49.
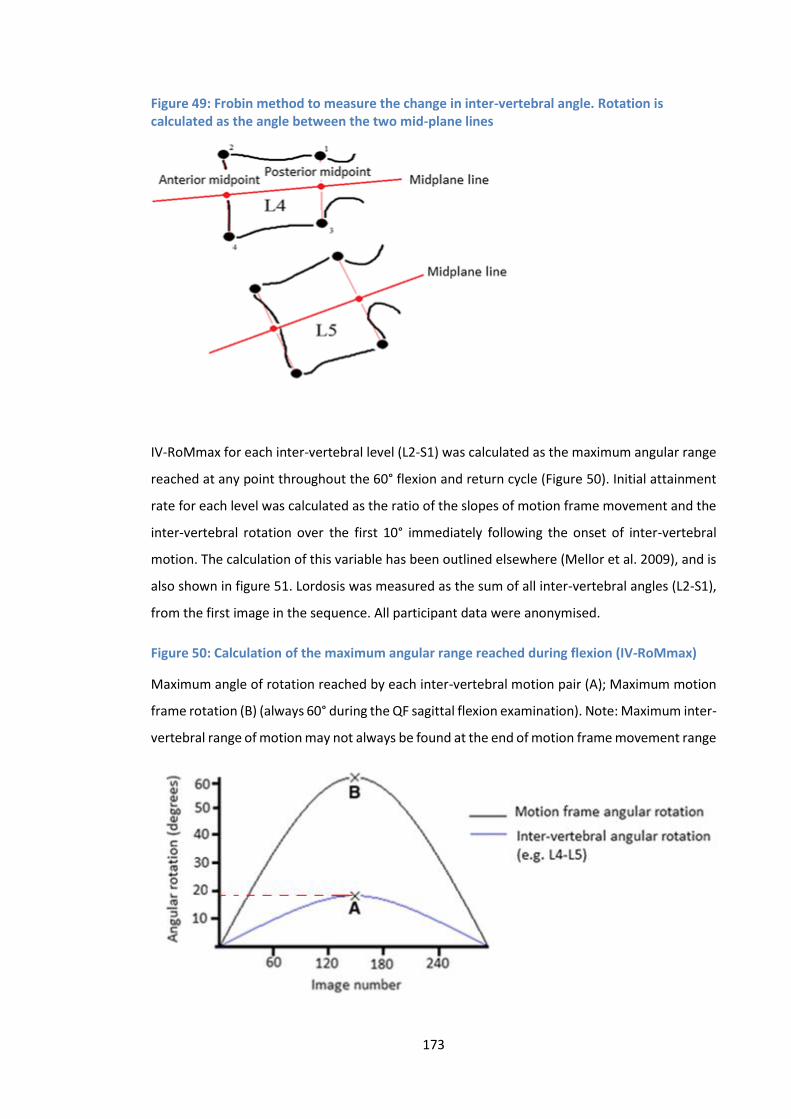
173
Figure 49: Frobin method to measure the change in inter-vertebral angle. Rotation is calculated as the angle between the two mid-plane lines
IV-RoMmax for each inter-vertebral level (L2-S1) was calculated as the maximum angular range
reached at any point throughout the 60° flexion and return cycle (Figure 50). Initial attainment
rate for each level was calculated as the ratio of the slopes of motion frame movement and the
inter-vertebral rotation over the first 10° immediately following the onset of inter-vertebral
motion. The calculation of this variable has been outlined elsewhere (Mellor et al. 2009), and is
also shown in figure 51. Lordosis was measured as the sum of all inter-vertebral angles (L2-S1),
from the first image in the sequence. All participant data were anonymised.
Figure 50: Calculation of the maximum angular range reached during flexion (IV-RoMmax)
Maximum angle of rotation reached by each inter-vertebral motion pair (A); Maximum motion
frame rotation (B) (always 60° during the QF sagittal flexion examination). Note: Maximum inter-
vertebral range of motion may not always be found at the end of motion frame movement range
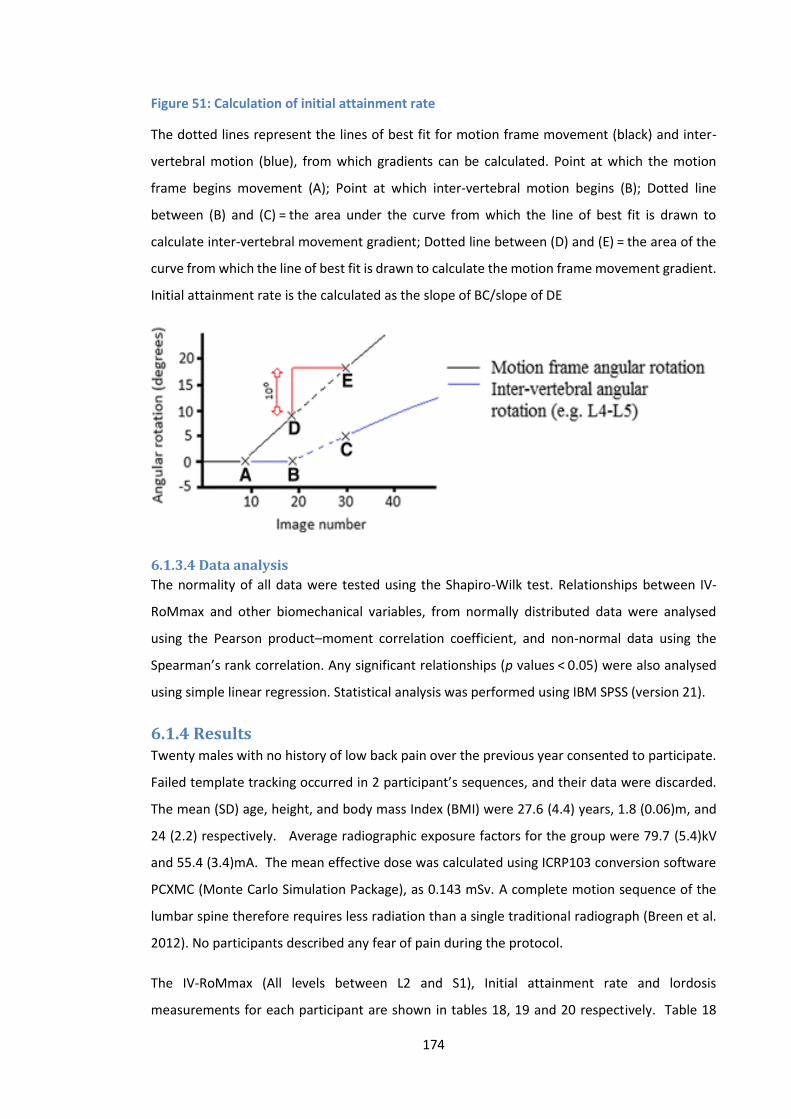
174
Figure 51: Calculation of initial attainment rate
The dotted lines represent the lines of best fit for motion frame movement (black) and inter-
vertebral motion (blue), from which gradients can be calculated. Point at which the motion
frame begins movement (A); Point at which inter-vertebral motion begins (B); Dotted line
between (B) and (C) = the area under the curve from which the line of best fit is drawn to
calculate inter-vertebral movement gradient; Dotted line between (D) and (E) = the area of the
curve from which the line of best fit is drawn to calculate the motion frame movement gradient.
Initial attainment rate is the calculated as the slope of BC/slope of DE
6.1.3.4 Data analysis
The normality of all data were tested using the Shapiro-Wilk test. Relationships between IV-
RoMmax and other biomechanical variables, from normally distributed data were analysed
using the Pearson product–moment correlation coefficient, and non-normal data using the
Spearman’s rank correlation. Any significant relationships (p values < 0.05) were also analysed
using simple linear regression. Statistical analysis was performed using IBM SPSS (version 21).
6.1.4 Results Twenty males with no history of low back pain over the previous year consented to participate.
Failed template tracking occurred in 2 participant’s sequences, and their data were discarded.
The mean (SD) age, height, and body mass Index (BMI) were 27.6 (4.4) years, 1.8 (0.06)m, and
24 (2.2) respectively. Average radiographic exposure factors for the group were 79.7 (5.4)kV
and 55.4 (3.4)mA. The mean effective dose was calculated using ICRP103 conversion software
PCXMC (Monte Carlo Simulation Package), as 0.143 mSv. A complete motion sequence of the
lumbar spine therefore requires less radiation than a single traditional radiograph (Breen et al.
2012). No participants described any fear of pain during the protocol.
The IV-RoMmax (All levels between L2 and S1), Initial attainment rate and lordosis
measurements for each participant are shown in tables 18, 19 and 20 respectively. Table 18
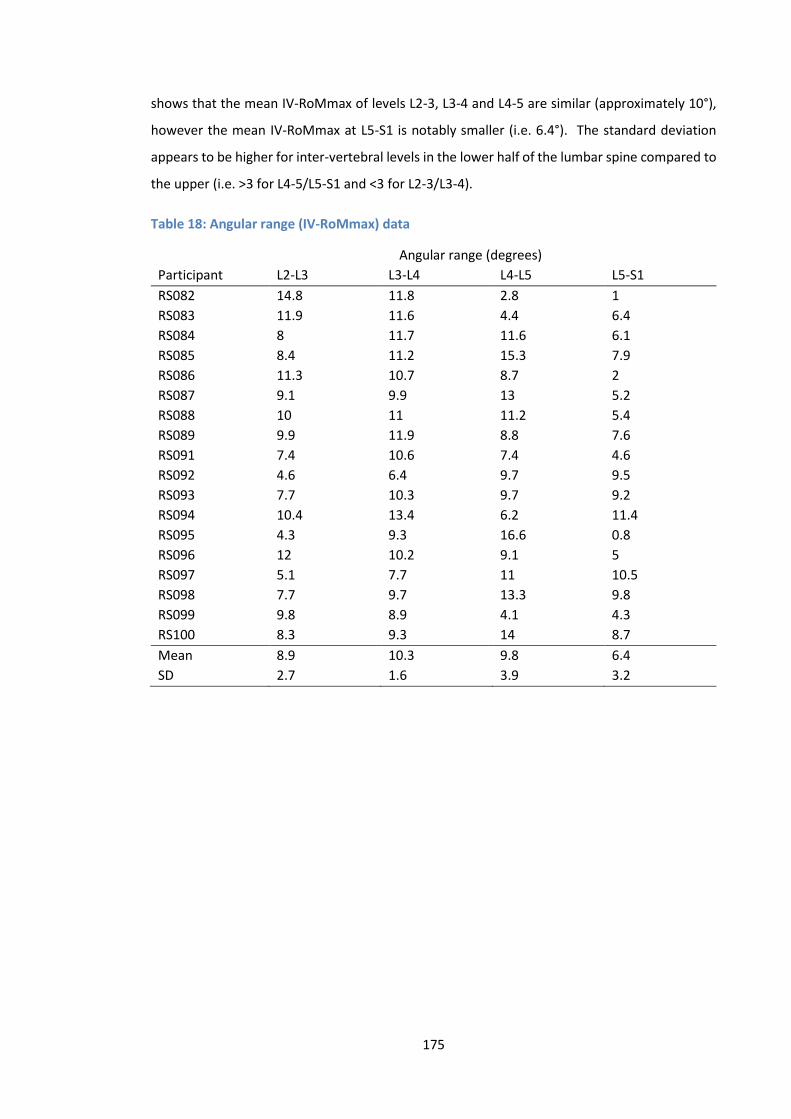
175
shows that the mean IV-RoMmax of levels L2-3, L3-4 and L4-5 are similar (approximately 10°),
however the mean IV-RoMmax at L5-S1 is notably smaller (i.e. 6.4°). The standard deviation
appears to be higher for inter-vertebral levels in the lower half of the lumbar spine compared to
the upper (i.e. >3 for L4-5/L5-S1 and <3 for L2-3/L3-4).
Table 18: Angular range (IV-RoMmax) data
Angular range (degrees)
Participant L2-L3 L3-L4 L4-L5 L5-S1
RS082 14.8 11.8 2.8 1
RS083 11.9 11.6 4.4 6.4
RS084 8 11.7 11.6 6.1
RS085 8.4 11.2 15.3 7.9
RS086 11.3 10.7 8.7 2
RS087 9.1 9.9 13 5.2
RS088 10 11 11.2 5.4
RS089 9.9 11.9 8.8 7.6
RS091 7.4 10.6 7.4 4.6
RS092 4.6 6.4 9.7 9.5
RS093 7.7 10.3 9.7 9.2
RS094 10.4 13.4 6.2 11.4
RS095 4.3 9.3 16.6 0.8
RS096 12 10.2 9.1 5
RS097 5.1 7.7 11 10.5
RS098 7.7 9.7 13.3 9.8
RS099 9.8 8.9 4.1 4.3
RS100 8.3 9.3 14 8.7
Mean 8.9 10.3 9.8 6.4
SD 2.7 1.6 3.9 3.2

176
Mean initial attainment rate was highest at the level of L2-3, and lowest at L4-5 (Table 19).
Standard deviation was highest for measurements at the level of L5-S1.
Table 19: Initial attainment rate data
Initial attainment rate (ratio)
Participant L2-L3 L3-L4 L4-L5 L5-S1
RS082 0.2168 0.0076 0.0425 0.0202
RS083 0.2954 0.2883 0.008 0.1006
RS084 0.3595 0.1779 0.0526 0.0505
RS085 0.1765 0.1304 0.0748 0.0697
RS086 0.1916 0.0429 0.0179 0.1373
RS087 0.2069 0.074 0.132 0.0211
RS088 0.1074 0.0476 0.0444 0.2587
RS089 0.2149 0.0873 0.0163 0.1441
RS091 0.1155 0.0875 0.0797 0.1161
RS092 0.1926 0.2004 0.1565 0.0843
RS093 0.3544 0.1143 0.039 0.0727
RS094 0.1238 0.1768 0.026 0.094
RS095 0.07 0.0344 0.1507 0.0077
RS096 0.2658 0.1519 0.1193 0.1015
RS097 0.1945 0.2239 0.0791 0.13
RS098 0.1675 0.1118 0.0699 0.641
RS099 0.1087 0.0428 0.0404 0.0453
RS100 0.237 0.4892 0.1776 0.3293
Mean 0.1999 0.1382 0.0737 0.1346
SD 0.0815 0.1150 0.0524 0.1498
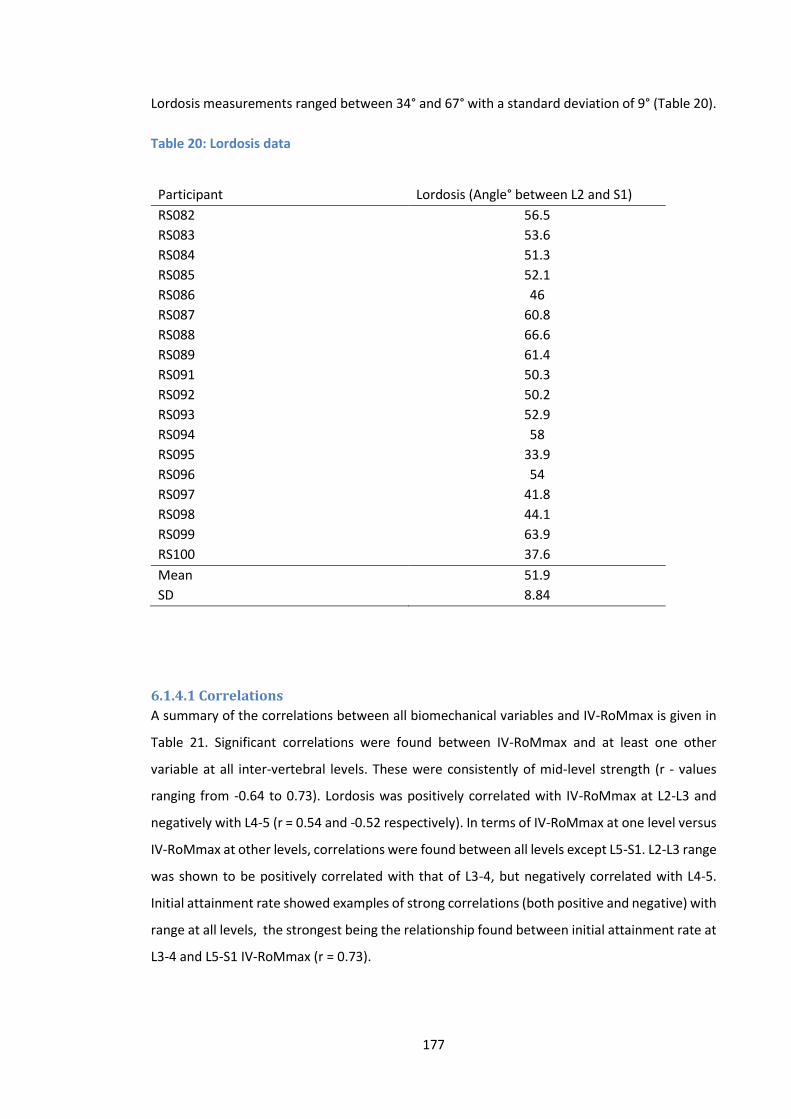
177
Lordosis measurements ranged between 34° and 67° with a standard deviation of 9° (Table 20).
Table 20: Lordosis data
Participant Lordosis (Angle° between L2 and S1)
RS082 56.5
RS083 53.6
RS084 51.3
RS085 52.1
RS086 46
RS087 60.8
RS088 66.6
RS089 61.4
RS091 50.3
RS092 50.2
RS093 52.9
RS094 58
RS095 33.9
RS096 54
RS097 41.8
RS098 44.1
RS099 63.9
RS100 37.6
Mean 51.9
SD 8.84
6.1.4.1 Correlations
A summary of the correlations between all biomechanical variables and IV-RoMmax is given in
Table 21. Significant correlations were found between IV-RoMmax and at least one other
variable at all inter-vertebral levels. These were consistently of mid-level strength (r - values
ranging from -0.64 to 0.73). Lordosis was positively correlated with IV-RoMmax at L2-L3 and
negatively with L4-5 (r = 0.54 and -0.52 respectively). In terms of IV-RoMmax at one level versus
IV-RoMmax at other levels, correlations were found between all levels except L5-S1. L2-L3 range
was shown to be positively correlated with that of L3-4, but negatively correlated with L4-5.
Initial attainment rate showed examples of strong correlations (both positive and negative) with
range at all levels, the strongest being the relationship found between initial attainment rate at
L3-4 and L5-S1 IV-RoMmax (r = 0.73).
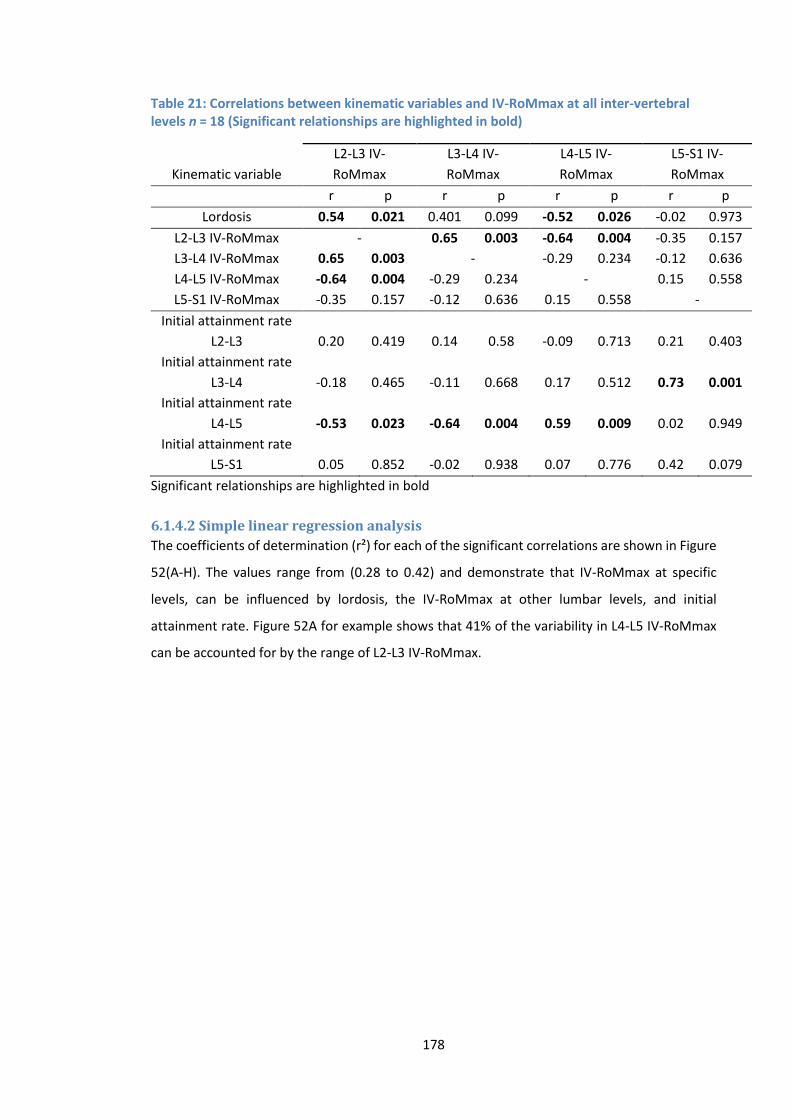
178
Table 21: Correlations between kinematic variables and IV-RoMmax at all inter-vertebral levels n = 18 (Significant relationships are highlighted in bold)
Kinematic variable
L2-L3 IV-
RoMmax
L3-L4 IV-
RoMmax
L4-L5 IV-
RoMmax
L5-S1 IV-
RoMmax
r p r p r p r p
Lordosis 0.54 0.021 0.401 0.099 -0.52 0.026 -0.02 0.973
L2-L3 IV-RoMmax - 0.65 0.003 -0.64 0.004 -0.35 0.157
L3-L4 IV-RoMmax 0.65 0.003 - -0.29 0.234 -0.12 0.636
L4-L5 IV-RoMmax -0.64 0.004 -0.29 0.234 - 0.15 0.558
L5-S1 IV-RoMmax -0.35 0.157 -0.12 0.636 0.15 0.558 -
Initial attainment rate
L2-L3 0.20 0.419 0.14 0.58 -0.09 0.713 0.21 0.403
Initial attainment rate
L3-L4 -0.18 0.465 -0.11 0.668 0.17 0.512 0.73 0.001
Initial attainment rate
L4-L5 -0.53 0.023 -0.64 0.004 0.59 0.009 0.02 0.949
Initial attainment rate
L5-S1 0.05 0.852 -0.02 0.938 0.07 0.776 0.42 0.079
Significant relationships are highlighted in bold
6.1.4.2 Simple linear regression analysis
The coefficients of determination (r²) for each of the significant correlations are shown in Figure
52(A-H). The values range from (0.28 to 0.42) and demonstrate that IV-RoMmax at specific
levels, can be influenced by lordosis, the IV-RoMmax at other lumbar levels, and initial
attainment rate. Figure 52A for example shows that 41% of the variability in L4-L5 IV-RoMmax
can be accounted for by the range of L2-L3 IV-RoMmax.
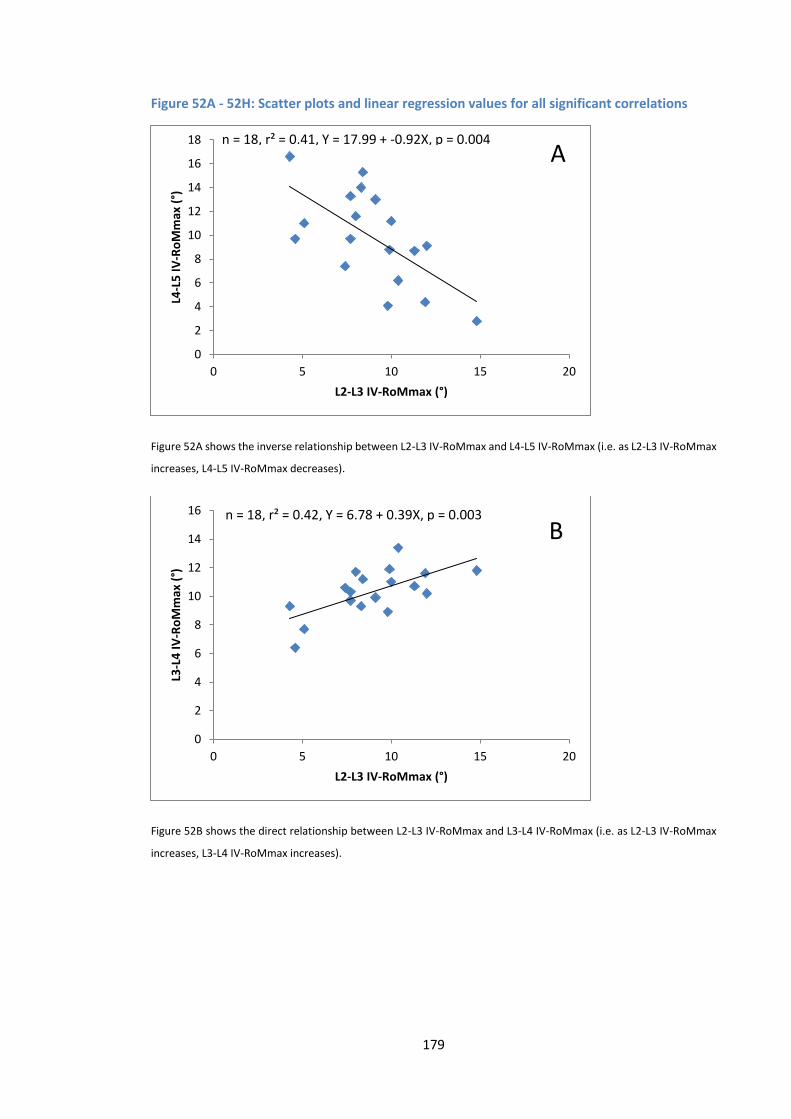
179
Figure 52A - 52H: Scatter plots and linear regression values for all significant correlations
Figure 52A shows the inverse relationship between L2-L3 IV-RoMmax and L4-L5 IV-RoMmax (i.e. as L2-L3 IV-RoMmax
increases, L4-L5 IV-RoMmax decreases).
Figure 52B shows the direct relationship between L2-L3 IV-RoMmax and L3-L4 IV-RoMmax (i.e. as L2-L3 IV-RoMmax
increases, L3-L4 IV-RoMmax increases).
0
2
4
6
8
10
12
14
16
18
0 5 10 15 20
L4-L
5 I
V-R
oM
max
(°)
L2-L3 IV-RoMmax (°)
n = 18, r² = 0.41, Y = 17.99 + -0.92X, p = 0.004A
0
2
4
6
8
10
12
14
16
0 5 10 15 20
L3-L
4 I
V-R
oM
max
(°)
L2-L3 IV-RoMmax (°)
n = 18, r² = 0.42, Y = 6.78 + 0.39X, p = 0.003
B
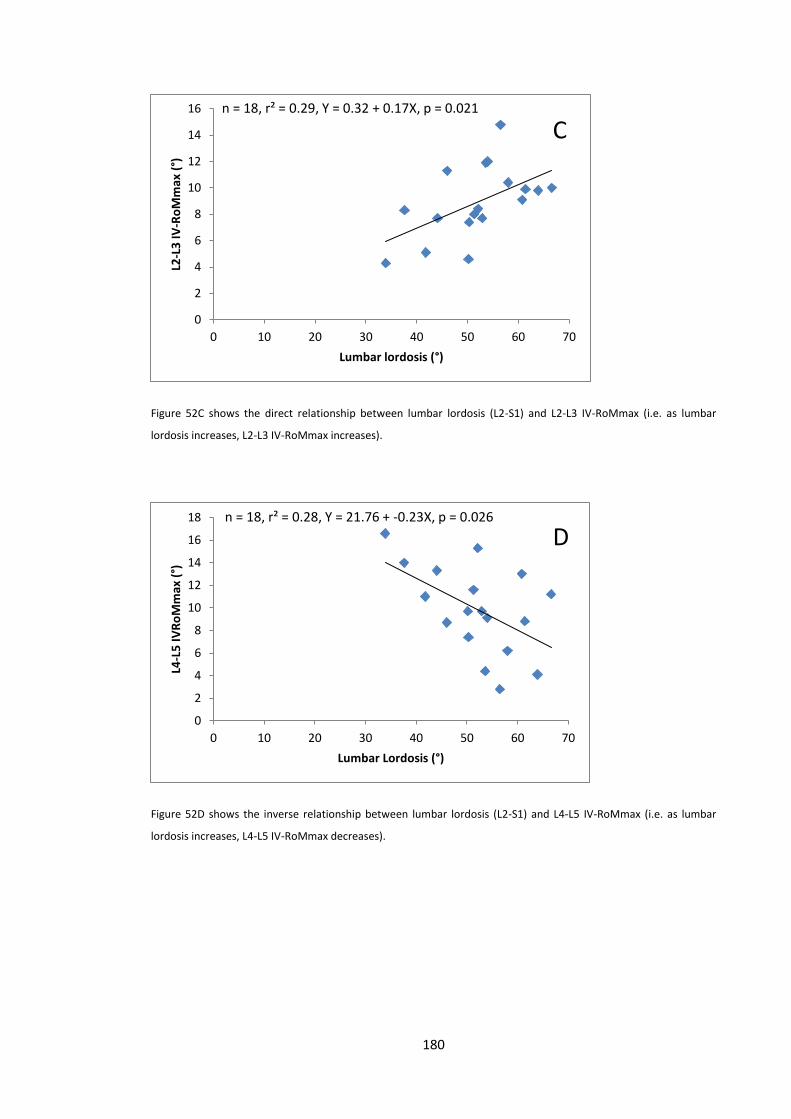
180
Figure 52C shows the direct relationship between lumbar lordosis (L2-S1) and L2-L3 IV-RoMmax (i.e. as lumbar
lordosis increases, L2-L3 IV-RoMmax increases).
Figure 52D shows the inverse relationship between lumbar lordosis (L2-S1) and L4-L5 IV-RoMmax (i.e. as lumbar
lordosis increases, L4-L5 IV-RoMmax decreases).
0
2
4
6
8
10
12
14
16
0 10 20 30 40 50 60 70
L2-L
3 I
V-R
oM
max
(°)
Lumbar lordosis (°)
n = 18, r² = 0.29, Y = 0.32 + 0.17X, p = 0.021
C
0
2
4
6
8
10
12
14
16
18
0 10 20 30 40 50 60 70
L4-L
5 I
VR
oM
max
(°)
Lumbar Lordosis (°)
n = 18, r² = 0.28, Y = 21.76 + -0.23X, p = 0.026
D
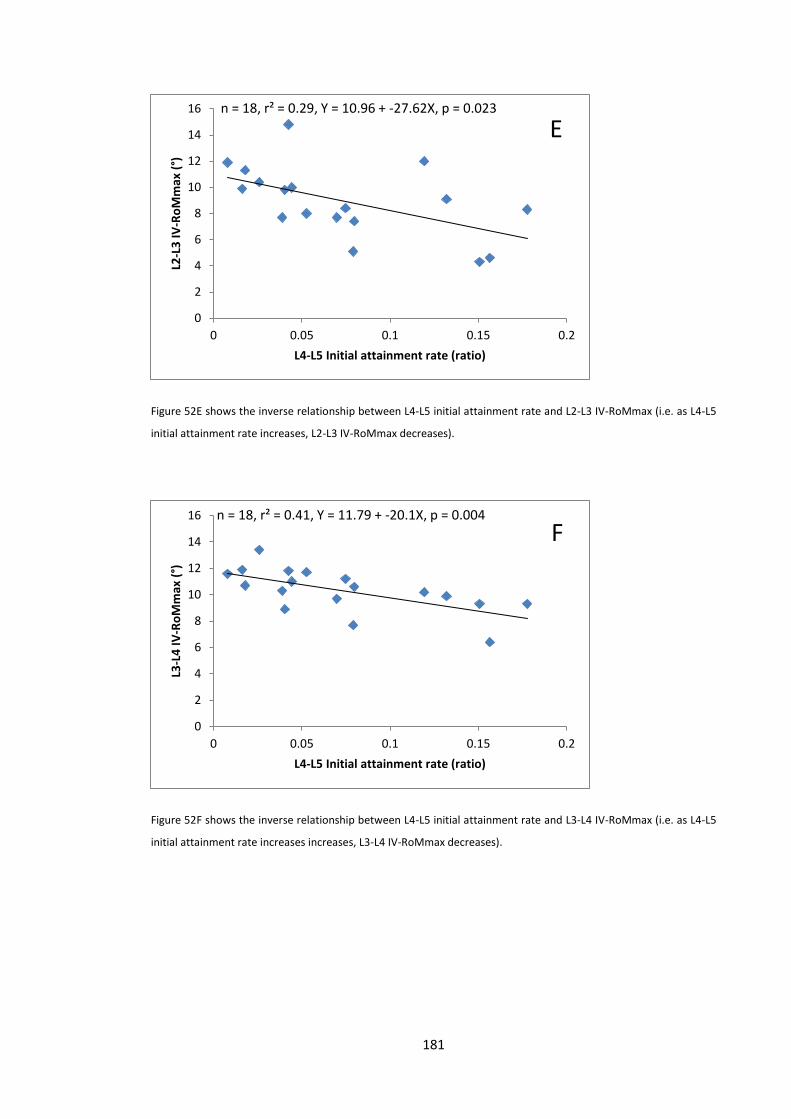
181
Figure 52E shows the inverse relationship between L4-L5 initial attainment rate and L2-L3 IV-RoMmax (i.e. as L4-L5
initial attainment rate increases, L2-L3 IV-RoMmax decreases).
Figure 52F shows the inverse relationship between L4-L5 initial attainment rate and L3-L4 IV-RoMmax (i.e. as L4-L5
initial attainment rate increases increases, L3-L4 IV-RoMmax decreases).
0
2
4
6
8
10
12
14
16
0 0.05 0.1 0.15 0.2
L2-L
3 I
V-R
oM
max
(°)
L4-L5 Initial attainment rate (ratio)
n = 18, r² = 0.29, Y = 10.96 + -27.62X, p = 0.023
E
0
2
4
6
8
10
12
14
16
0 0.05 0.1 0.15 0.2
L3-L
4 I
V-R
oM
max
(°)
L4-L5 Initial attainment rate (ratio)
n = 18, r² = 0.41, Y = 11.79 + -20.1X, p = 0.004
F
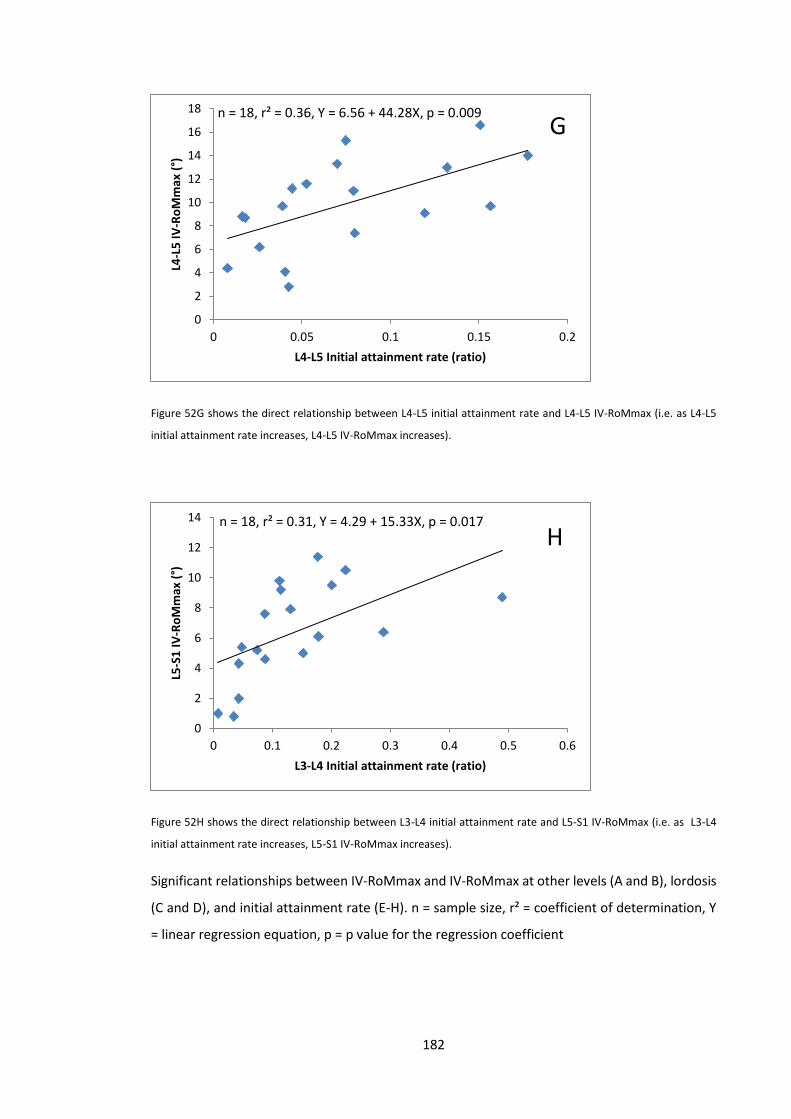
182
Figure 52G shows the direct relationship between L4-L5 initial attainment rate and L4-L5 IV-RoMmax (i.e. as L4-L5
initial attainment rate increases, L4-L5 IV-RoMmax increases).
Figure 52H shows the direct relationship between L3-L4 initial attainment rate and L5-S1 IV-RoMmax (i.e. as L3-L4
initial attainment rate increases, L5-S1 IV-RoMmax increases).
Significant relationships between IV-RoMmax and IV-RoMmax at other levels (A and B), lordosis
(C and D), and initial attainment rate (E-H). n = sample size, r² = coefficient of determination, Y
= linear regression equation, p = p value for the regression coefficient
0
2
4
6
8
10
12
14
16
18
0 0.05 0.1 0.15 0.2
L4-L
5 I
V-R
oM
max
(°)
L4-L5 Initial attainment rate (ratio)
n = 18, r² = 0.36, Y = 6.56 + 44.28X, p = 0.009G
0
2
4
6
8
10
12
14
0 0.1 0.2 0.3 0.4 0.5 0.6
L5-S
1 I
V-R
oM
max
(°)
L3-L4 Initial attainment rate (ratio)
n = 18, r² = 0.31, Y = 4.29 + 15.33X, p = 0.017
H
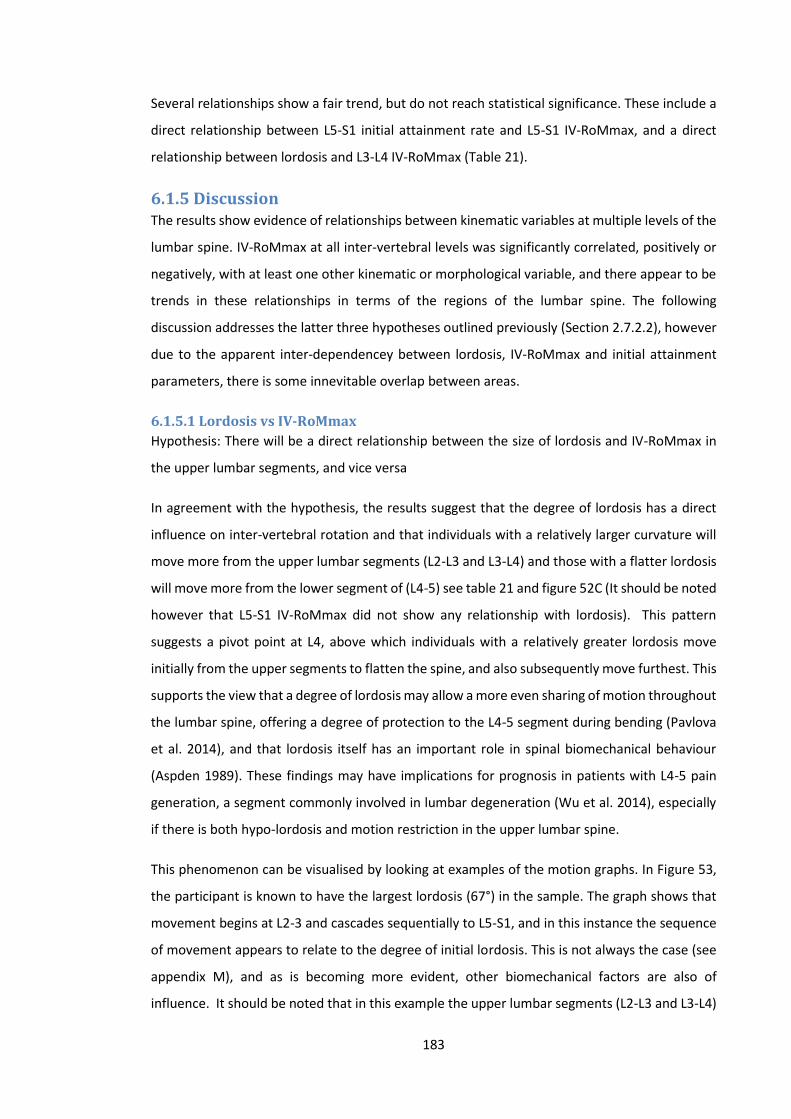
183
Several relationships show a fair trend, but do not reach statistical significance. These include a
direct relationship between L5-S1 initial attainment rate and L5-S1 IV-RoMmax, and a direct
relationship between lordosis and L3-L4 IV-RoMmax (Table 21).
6.1.5 Discussion The results show evidence of relationships between kinematic variables at multiple levels of the
lumbar spine. IV-RoMmax at all inter-vertebral levels was significantly correlated, positively or
negatively, with at least one other kinematic or morphological variable, and there appear to be
trends in these relationships in terms of the regions of the lumbar spine. The following
discussion addresses the latter three hypotheses outlined previously (Section 2.7.2.2), however
due to the apparent inter-dependencey between lordosis, IV-RoMmax and initial attainment
parameters, there is some innevitable overlap between areas.
6.1.5.1 Lordosis vs IV-RoMmax
Hypothesis: There will be a direct relationship between the size of lordosis and IV-RoMmax in
the upper lumbar segments, and vice versa
In agreement with the hypothesis, the results suggest that the degree of lordosis has a direct
influence on inter-vertebral rotation and that individuals with a relatively larger curvature will
move more from the upper lumbar segments (L2-L3 and L3-L4) and those with a flatter lordosis
will move more from the lower segment of (L4-5) see table 21 and figure 52C (It should be noted
however that L5-S1 IV-RoMmax did not show any relationship with lordosis). This pattern
suggests a pivot point at L4, above which individuals with a relatively greater lordosis move
initially from the upper segments to flatten the spine, and also subsequently move furthest. This
supports the view that a degree of lordosis may allow a more even sharing of motion throughout
the lumbar spine, offering a degree of protection to the L4-5 segment during bending (Pavlova
et al. 2014), and that lordosis itself has an important role in spinal biomechanical behaviour
(Aspden 1989). These findings may have implications for prognosis in patients with L4-5 pain
generation, a segment commonly involved in lumbar degeneration (Wu et al. 2014), especially
if there is both hypo-lordosis and motion restriction in the upper lumbar spine.
This phenomenon can be visualised by looking at examples of the motion graphs. In Figure 53,
the participant is known to have the largest lordosis (67°) in the sample. The graph shows that
movement begins at L2-3 and cascades sequentially to L5-S1, and in this instance the sequence
of movement appears to relate to the degree of initial lordosis. This is not always the case (see
appendix M), and as is becoming more evident, other biomechanical factors are also of
influence. It should be noted that in this example the upper lumbar segments (L2-L3 and L3-L4)
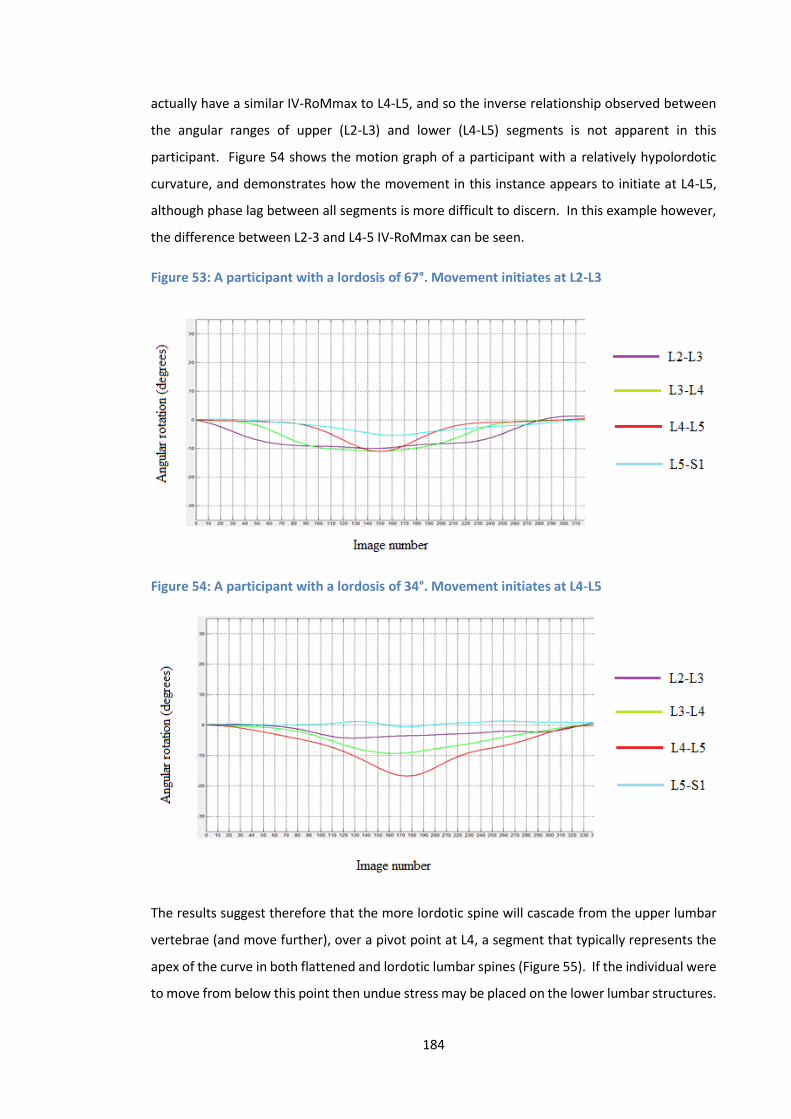
184
actually have a similar IV-RoMmax to L4-L5, and so the inverse relationship observed between
the angular ranges of upper (L2-L3) and lower (L4-L5) segments is not apparent in this
participant. Figure 54 shows the motion graph of a participant with a relatively hypolordotic
curvature, and demonstrates how the movement in this instance appears to initiate at L4-L5,
although phase lag between all segments is more difficult to discern. In this example however,
the difference between L2-3 and L4-5 IV-RoMmax can be seen.
Figure 53: A participant with a lordosis of 67°. Movement initiates at L2-L3
Figure 54: A participant with a lordosis of 34°. Movement initiates at L4-L5
The results suggest therefore that the more lordotic spine will cascade from the upper lumbar
vertebrae (and move further), over a pivot point at L4, a segment that typically represents the
apex of the curve in both flattened and lordotic lumbar spines (Figure 55). If the individual were
to move from below this point then undue stress may be placed on the lower lumbar structures.
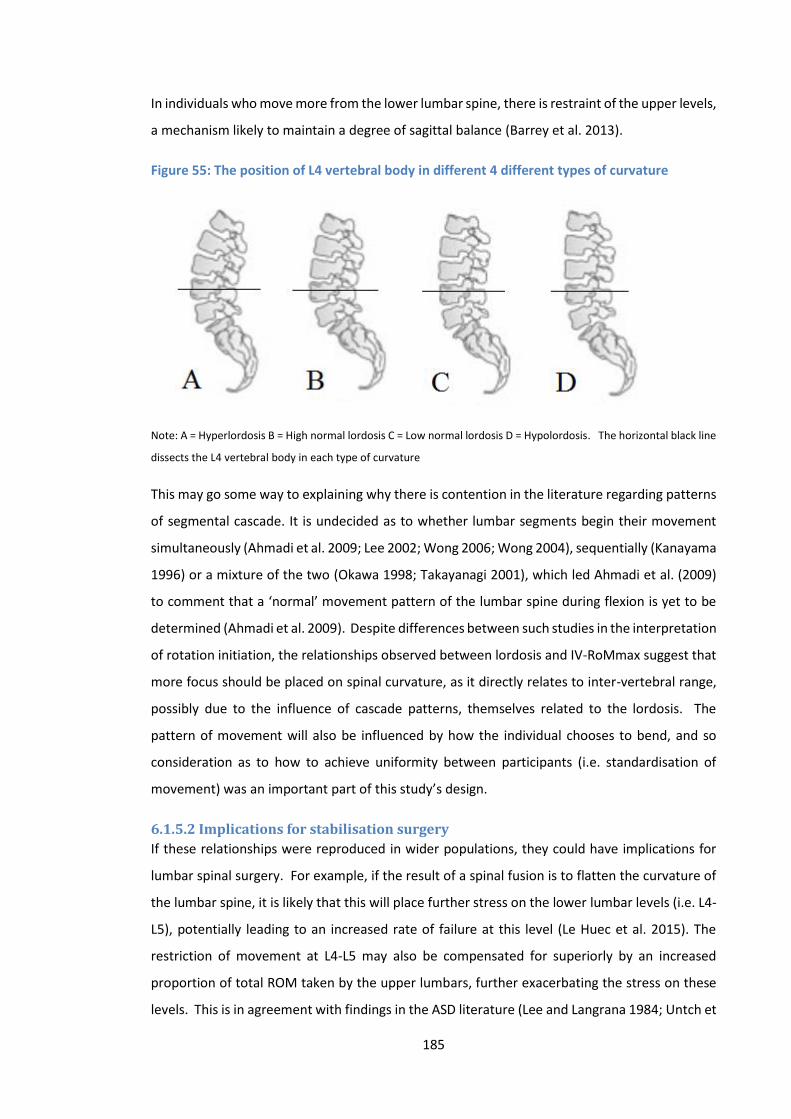
185
In individuals who move more from the lower lumbar spine, there is restraint of the upper levels,
a mechanism likely to maintain a degree of sagittal balance (Barrey et al. 2013).
Figure 55: The position of L4 vertebral body in different 4 different types of curvature
Note: A = Hyperlordosis B = High normal lordosis C = Low normal lordosis D = Hypolordosis. The horizontal black line
dissects the L4 vertebral body in each type of curvature
This may go some way to explaining why there is contention in the literature regarding patterns
of segmental cascade. It is undecided as to whether lumbar segments begin their movement
simultaneously (Ahmadi et al. 2009; Lee 2002; Wong 2006; Wong 2004), sequentially (Kanayama
1996) or a mixture of the two (Okawa 1998; Takayanagi 2001), which led Ahmadi et al. (2009)
to comment that a ‘normal’ movement pattern of the lumbar spine during flexion is yet to be
determined (Ahmadi et al. 2009). Despite differences between such studies in the interpretation
of rotation initiation, the relationships observed between lordosis and IV-RoMmax suggest that
more focus should be placed on spinal curvature, as it directly relates to inter-vertebral range,
possibly due to the influence of cascade patterns, themselves related to the lordosis. The
pattern of movement will also be influenced by how the individual chooses to bend, and so
consideration as to how to achieve uniformity between participants (i.e. standardisation of
movement) was an important part of this study’s design.
6.1.5.2 Implications for stabilisation surgery
If these relationships were reproduced in wider populations, they could have implications for
lumbar spinal surgery. For example, if the result of a spinal fusion is to flatten the curvature of
the lumbar spine, it is likely that this will place further stress on the lower lumbar levels (i.e. L4-
L5), potentially leading to an increased rate of failure at this level (Le Huec et al. 2015). The
restriction of movement at L4-L5 may also be compensated for superiorly by an increased
proportion of total ROM taken by the upper lumbars, further exacerbating the stress on these
levels. This is in agreement with findings in the ASD literature (Lee and Langrana 1984; Untch et
186
al. 2004; Lee et al. 1988; Xia et al. 2013; Chow et al. 1996; Scannell and McGill 2003), and
provides a possible biomechanical explanation for studies that conclude that a diminished
lordosis increases the risk of ASD (Rothenfluh et al. 2015). In patients with previous spinal
fusions, Rothenfluh et al. (2015) showed that a combination of a high pelvic incidence (pelvic
incidence calculated as “the angle between the line perpendicular to the sacral plate at its
midpoint and the line connecting this point to the femoral heads axis” (Boulay et al. 2006), and
a diminished lordosis, are predisposing factors for the development of ASD (Rothenfluh et al.
2015). If the normal relationships shown in this study are an indication of how behaviours may
change with an imposed mechanism of restraint such as a segmental fusion, then it is logical
that more stress will be placed on L4-L5 itself, but also the upper lumbars post surgical fusion of
L4-L5.
The present study could not investigate pelvic incidence due to an inability to include the
femoral head in the x-ray image field, which may be considered a limitation of study design.
Future studies may therefore wish to adapt the protocol to incorporate this measurement, and
also consider measurements beyond the lumbar spine (i.e. thoracic kinematics) (Claus et al.
2009; Hemming et al. 2015).
6.1.5.3 Inter-segmental versus regional motion studies
The results also suggest that studies that divide the lumbar spine into regions (Dankaerts et al.
2006; Hemming et al. 2015) should consider the normal kinematic behaviour of specific
segments. Indeed, whilst L2-L3 and L3-L4 behave in a similar way (Du Rose and Breen 2016b;
Kozanek 2009), L4-5 and L5-S1 perhaps need to be considered separately in such studies, or at
least use the effective pivot point of L4 as a point of division. This is in agreement with Roussouly
et al. (2005), who divided the lumbar lordosis into two arches separated at L4, suggesting that
the majority of total lordosis resides between L4-S1, and that the size of this angle influences
the segments above (Roussouly et al. 2005). Even this may not be adequate however, as in the
example of the participant in Figure 54, L5-S1 shows negligible movement, but L4-5 rotates
almost 20 degrees. If these angles are combined as a region it represents a modest contribution
from both levels effectively cancelling each other out.
In this study, L5-S1 typically moved the least (mean 6.4° SD 3.2°) and so may be considered as
the most restrained segment, perhaps due to specific anatomical adaptations (i.e. the Iliolumbar
ligaments, facet orientation etc., or as a result of the pelvic restraint protocol) (see also sections
9.11.2 and 9.11.3), and it has been shown that in terms of IV-RoMmax, L4-L5 has an inverse
relationship with the levels above. These findings should therefore be considered in studies that
187
investigate regional lordosis kinematics in relation to LBP. Hemming et al. (2015), used the sub-
grouping criteria developed by O’Sullivan et al. (2005) to investigate differences in regional
spinal kinematics between flexion pattern (pain provoked during flexion), extension pattern
(pain provoked during extension) and healthy controls during functional tasks, including forward
bending. Their results showed significant differences between all groups during the forward
bending task in upper lumbar and lower thoracic curvature, but this was not the case for the
lower lumbar spine (Hemming et al. 2015). Considering the inter-vertebral kinematic findings of
the present study, the way in which the spine is divided into regions for such studies may again
be of importance. Hemming et al. divided the lumbar spine using the level of L3 as the cut off
between upper and lower regions, which may have influenced results as it has been shown that
L2-L3 and L3-L4 and are directly related to each other, and inversely related to L4-L5 in terms of
their angular range. It is feasible therefore that although only one segmental level away, the
movements of L3-L4 and L4-L5 may effectively counteract each other. This is perhaps a reason
why no differences were found between groups in relation to lower lumbar curvature (Hemming
et al. 2015). It is also possible that the differences associated with the upper lumbar spine may
be altered if lumbar spinal regions were defined differently (i.e. using L4 and not L3 as a point of
division). In another example, in partial agreement with the results of this study, Pavlova et al.
(2015) showed that “curvier” individuals (i.e. larger lordosis) tend to have more movement in
their upper lumbar regions, but did not find that more kyphotic lumbar spines had greater
movement in the lower lumbars (Pavlova et al. 2015). This may again be partly due to the
method, as skin markers were used to measure movement of L1-L3 and L3-L5, and so did not
specifically include L4-L5.
In contrast to these findings, Dankaerts et al. (2006) who used the same lumbar division system
as described by Hemming et al. 2015, found that patients classified into flexion and extension
pain provocation groups (O’Sullivan et al. 2005), had respectively kyphotic and lordotic lower
lumbar curvatures when measured during sitting (Dankaerts et al. 2006). Therefore, attempts
to determine relationships between the kinematics and curvature of regions of the lumbar spine
and LBP are of interest, some contradictions have been shown in their outcomes. It could be
argued that moving from a sitting based protocol (e.g. Dankaerts et al. 2006) could prevent
normal pelvic movement and decrease the influence of the lower limb musculature on lumbar
stabilisation, or that biomechanical differences exist between the study groups. It is clear
however, that these are areas of research where inter-vertebral information would be valuable,
and so should be a consideration for future investigations.
188
A current limitation of QF inter-vertebral measurements are their restriction to spinal regions
such as the lumbar (Durose A and Breen 2016, Du Rose and Breen 2016b, Mellor et al. 2014) and
cervical spines (Branney et al. 2015). Whilst typically used to measure regional kinematics,
surface marker systems can provide kinematic information from a wider area (e.g. include the
thoracic and lumbar regions) (Hemming et al. 2015). The absence of kinematic data collection
beyond the lumbar spine is therefore a limitation of this work, and the combined use of QF and
surface marker technologies should be considered for future studies.
6.1.5.4 IV-RoMmax vs IV-RoMmax
Hypothesis: There will be an inverse relationship between IV-RoMmax in the upper and IV-
RoMmax in the lower lumbar segments
The hypothesis was accepted as L2-L3 and L3-L4 IV-RoMmax were both inversely correlated with
the IV-RoMmax of L4-5, however no significant relationships were found between L5-S1 and the
upper lumbar segments.
This is the first time that an inverse relationship between the IV-RoMmax of L2-L3 and the IV-
RoMmax at L4-5 has been shown, and it suggests a direct compensation mechanism occurring
between the two regions. The results also show that the IV-RoMmax of L2-3 and L3-4 were
strongly positively correlated, suggesting that they tend to work in tandem. This was in
agreement with Kozanek et al. (2009), who showed that the behaviour (in terms of IV-RoM) of
L2-3 and L3-4 were similar, and that this was different to that of the lower lumbar spine
(specifically L4-L5), however they attributed these movement patterns to facet orientation
(Kozanek 2009), which provides a feasible structural explanation for the patterns observed. The
combined effect of increased upper lumbar rotation is most pronounced in more lordotic lumbar
spines, and will be reflected in the motor control of these segments, i.e. a strategy that allows
movement in the upper lumbars, but restricts movement at L4-L5.
If it is accepted that instability results from reduced restraint, then it may be suggested that
reduced motion at these upper levels could promote relative L4-5 instability as a consequence
of motion stress transfer. The reverse of this pattern has been shown in spinal surgery patients,
as when stiffness is induced in the lower segments via fusion, there is increased mobility in
superior segments (Lee and Langrana 1984, Untch et al. 2004, Lee et al. 1988, Xia et al. 2013,
Chow et al. 1996, Scannell and McGill 2003). However, this has never been shown to be an
adaptive mechanism in healthy controls. This suggests that individuals with specific
biomechanical features may be pre-disposed to increased stresses through the lower lumbar
segments (especially L4-L5). The results suggest that the L4-L5 motion segment behaves

189
differently during flexion than the rest of the lumbar spine, and is consequently an important
segment for further research. It has also been shown however, that relationships exist between
L4-L5 IV-RoMmax and kinematic parameters at other spinal levels, and so L4-L5 should perhaps
not be considered in isolation.
Taghipour-Darzi et al. (2012) suggest that inter-vertebral rotation information, particularly end
of range information does not typically provide useful information regarding diagnosis of
instability. They do however suggest that mid-range kinematic measurements may be important
(Taghipour-Darzi et al. 2012). Indeed their study reports that when using the criteria developed
by Hicks et al. (2005) to determine sub-groups of NSLBP patients with instability (Hicks 2005),
the L4-5 motion segment in this group was actually hypomobile during mid-range flexion in their
segmental instability group relative to the same level in healthy controls. This finding appears
contradictory to what should be expected in a lumbar segmental instability (LSI) group, and the
authors suggest that the hypomobility may be due to a restriction mechanism caused by a
muscular reflex adaptation to the patient’s pain (Panjabi et al. 1994). However, given the
findings in the present study, it is also feasible that the lack of motion at this level may in fact be
a compensation mechanism for relative hypermobility at segments elsewhere in the lumbar
spine, or a relatively high mean lordotic curvature within the sample (Du Rose and Breen 2016b).
Indeed, the Hicks (2005) criteria are somewhat generic, in that the positive prone instability test
used is not level specific, and therefore hypermobility may actually have been expected to be
found at levels other than L4-L5. In addition, although the Taghipour et al. (2012) protocol does
measure mid-range rotation, it does not take continuous measurements throughout the cycle,
and if some form of vertebral cascade is assumed (Kanayama 1996) (which would be expected
in a group with large lordosis), it is possible that the true maximum angular range will be missed,
as they are reached at different stages of the bend. It is also a consideration therefore, that the
population diagnosed with LSI, have pre-existing biomechanical behaviours that predispose
them to less movement at L4-5. As discovered in this study, these may include those with a
larger lordosis, those that have increased relative movement in the upper lumbars (i.e. L2-L3),
and those with minimal laxity at the L4-L5 segment. This highlights an example of where
replicating a previous study (e.g. Taghipour-Darzi et al. 2012) using continuous inter-vertebral
data measurements would be of interest.
6.1.5.5 Initial attainment rate (laxity) and IV-RoMmax
Hypothesis: There will be a direct relationship between initial attainment rate and IV-RoMmax
at the same level
190
This relationship was not found throughout every level of the lumbar spine, however a moderate
and significant direct relationship was found between the initial attainment rate and the IV-
RoMmax of L4-L5 (Table 21), and so the hypothesis was accepted.
Hodges et al. (2013) suggested that a lax segment will be associated with a relative increase in
IV-RoM at the same level (Hodges et al. 2013). Despite this being the case for L4-5, it was not
the case for other levels, although there was also a strong positive relationship between L3-L4
initial attainment rate and L5-S1 IV-RoMmax. The reasons for this relationship are not clear,
however as no other parameters (i.e. lordosis or IV-RoMmax) were significantly correlated with
L5-S1 IV-RoMmax, in this case muscle activity may be more directly influential. It has been
shown that L2-3 and L3-4 behave in a similar way in terms of angular range, and therefore in
terms of overall stability, muscular control strategies may be required to counteract the
combined effect of increased laxity and the associated increased range occurring simultaneously
at two levels. This, left unchecked, would result in excessive movement in the upper lumbar
region, and may therefore be prevented by other mechanisms (see chapter 9 further analysis:
Initial attainment rate versus muscle activity changes). It is possible that laxity at L3-4 relating
to an increase in IV-RoM at L5-S1 is a compensation mechanism for a lack of movement at L4-5,
however this cannot be substantiated. Indeed, it is difficult to find research that supports or
opposes these speculations, as there are few in vivo inter-vertebral kinematic studies in healthy
controls to compare with.
6.1.5.6 An intra-operative comparison
The relationship between the IV-RoM at L4-5 and the initial attainment rate at L4-5 suggests
that increased range relates to an increased segmental laxity, and therefore decreased stiffness.
In a novel study that used an intra-operative system to determine stiffness and neutral zone
measurements from load deformation data, Hasegewa et al. (2009) showed that unstable
segments (i.e. segments with degenerative spondylolisthesis) have reduced stiffness and larger
neutral zones compared to healthy motion segments (Hasegewa et al. 2009). The study did not
however find a significant relationship between IV-RoM and stiffness or the neutral zone (r² =
0.021 P = 0.336 and r² = 0.000 P = 0.988) respectively. A criticism of Hasegawa’s study, is that it
pools data from multiple levels, which considering the present study’s results may not be
appropriate. It has been shown here that initial attainment rate (laxity) has different
relationships with IV-RoMmax dependent on the specific motion segment measured, and
therefore pooling of results from such levels may lead to inaccurate conclusions. Hasegawa et
al’s findings are in contrast to those of this study (for the level of L4-L5), and may be explained
by the lack of level specific information. It should also be noted that the degree of disc

191
degeneration within their study sample may have been confounding. According to Kirkaldy-
Willis and Farfan (1982), disc degeneration will progress from normal, to dysfunctional, to
unstable and eventually to a restabilisation phase (Kirkaldy-Willis and Farfan 1982), and
Hasegawa et al. state that the degenerative cases in their study were a mixture between those
between unstable and restabilisation phases (Kirkaldy-Willis and Farfan 1982). Assuming this to
be the case then a sample of both more and less mobile segments will counteract the influence
of each other in terms of range, perhaps making its measurement questionable in this instance.
6.1.5.7 Compensation by adjacent segments
Conversely, while attainment rate and IV-RoMmax at L4-5 were positively correlated, L4-5
attainment rate was negatively correlated with the IV-RoMmax at L2-3 and with L3-4 above
(Table 21). As both attainment rate and IV-RoMmax are expressions of intervertebral restraint,
these relationships can be regarded as compensatory, contributing to the attenuation of stress
throughout the lumbar spine linkages. Thus there are indications of interactions and effects
between kinematic and morphological variables at different levels. This is of importance in
terms of musculoskeletal modelling, as traditionally, parameter changes have been modelled in
a uniform manner throughout the lumbar spine. In a recent study, Putzer et al. (2016) modelled
the effect of changes in ligament stiffness on lumbar inter-vertebral movement, and showed
that a uniform increase in ligament stiffness throughout the lumbar spine results in increased
loading and movement in the lower lumbar segments (Putzer et al. 2016). The current study has
shown however that inter-vertebral stiffness is not uniform throughout the lumbar spine, and
that there are apparent compensation mechanisms to such parameter changes. Indeed, in
terms of the purported risk of increased lumbar ligament stiffness to lower lumbar structures
(Putzer et al. 2016), it has been shown that a healthy lumbar spine may adapt to an increase in
stiffness (i.e. decreased initial attainment rate) in the upper lumbars (i.e. L2-L3 and L3-L4), by a
decrease in stiffness at L4-L5 (Du Rose and Breen 2016b). This level of information will therefore
at some stage need to be incorporated into musculoskeletal models of the spine.
Note: Several other relationships approached significance and may therefore also be important.
L5-S1 IV-RoMmax and it’s initial attainment rate was positively correlated, suggesting that
typically, if lower lumbar segments are lax, they will move further. This was not found for the
upper segments. L3-L4 IV-RoMmax was also directly related to lordosis (i.e. the same
relationship as L2-L3 IV-RoMmax with lordosis), the lack of significance possibly due to the
typically more neutral starting position of this segment.
192
6.1.6 Limitations The study’s results are only representative of a small, young, healthy, male population and
replication with larger and more extensive populations would be required to explore the
relationships in wider age groups and in females. In light of this, any discussions relating to the
investigation and management of wider LBP populations warrant careful consideration.
Furthermore, it was also not possible to address the impact of loading on spinal behaviour,
although every effort was made to standardise the population sample and study protocol for
body mass index. In this research all measurements were made during weight-bearing, and
therefore the effect of muscle activity is also a consideration. Chapter 7 examines the
relationships between lumbar paraspinal muscle activity and the kinematic and morphological
variables described here (Du Rose and Breen 2016a). Future studies may also wish to consider
the use of dynamic stereo x-ray imaging (Aiyangar et al. 2014), especially if investigation of
rotation in the transverse or coronal planes is required, where associated out of plane
movements are more prominent.
6.1.7 Conclusions Significant correlations were found between IV-RoMmax, IV-RoMmax at different inter-
vertebral levels, lordosis and initial attainment rate, and the study demonstrated weak to
moderate effects of these variables on IV-RoMmax. There is an increasing awareness of the
importance of sagittal parameters when planning surgical strategy, correcting sagittal balance,
or when considering more conservative treatment options (Barrey and Darnis 2015; Doulgeris
et al. 2015), therefore the ability to accurately assess and measure sagittal kinematic and
morphological parameters is important, as we attempt to understand their potential clinical
utility (Mehta et al. 2012). The existence of intrinsic links between morphological variables such
as lordosis have been described before (Roussouly and Pinheiro-Franco 2011), however we are
the first to use continuous in vivo inter-vertebral motion to investigate its links with IV-RoMmax
and initial attainment rate. These results provide clues as to what may happen when kinematic
or morphological changes are imposed through conservative treatment or surgery, both as local
and regional effects. The apparent inter-dependency may assist in building rationales for
treatments, and highlights the need to account for factors such as lordosis when conducting
kinematic studies. If the results are re-affirmed by multivariate investigations in larger samples,
future longitudinal studies are recommended to investigate the effect of interventions in low
back pain populations, that have been informed by the relationships described in this study. It
should be noted however that this was an investigation into normal biomechanical behaviour,
193
and no comparisons were made with a clinical population. Therefore the study findings cannot
be translated directly into clinical practice in relation to NSLBP groups.
There is evidence to suggest that the protocol used in this study may produce kinematic patterns
that are different to what might be expected when free-bending. It should be re-iterated
however, that when comparing individuals, standardisation is an essential part of study design,
and the protocol developed within this study provides an acceptable method for doing so.
“If detailed and standardised measures of spinal posture could be applied in studies of posture behaviour, the potential to compare and combine data from multiple studies (i.e. metanalysis) would be greatly improved. Such standardisation and metanalysis would provide foundation for conclusive determination of relationships between posture and pain” (Claus et al. 2016).
The use of inter-vertebral kinematic measurements is one area where such standardisation
could feasibly be achieved. This would not only benefit kinematic research fields, but when such
standardisation is applied in combination with motor control investigations, this would progress
the field of spinal control research in general. This study has demonstrated how kinematic and
morphological parameters can influence the restraint of motion segments during forward
bending, but this has been done in the absence of information about the active control system
(Panjabi 1992a; Panjabi 1992b). Relationships between muscle activity and IV-RoMmax are
investigated in the next chapter.
194
Chapter 7
7.1 Relationships between paraspinal muscle activity and
lumbar inter-vertebral range of motion
7.1.1 Introduction As per chapter 6, the bulk of the following chapter is a peer reviewed paper, this time
published in the journal Healthcare (Du Rose and Breen 2016a) by the author and this study’s
lead supervisor12. The paper is also not presented in its entirety as the agreement and
reliability findings were also presented in the chapter 5. In the general discussion section
there have also been substantial additions, and again there are some methodological details
that replicate previous aspects of the thesis, although the majority is referenced to previous
chapters to avoid unnecessary duplication. The paper addresses the primary thesis aim
(Section 2.7.2.3) by investigating the relationships between lumbar inter-vertebral motion
and lumbar spinal muscle electrical activity in healthy adults during standardised weight-
bearing forward bending.
7.1.2 Background Optimal control of the spine during voluntary trunk bending requires fine-tuned coordination
of numerous trunk muscles (Reeves et al. 2007). This dynamic control is believed to be
modulated by communication between three sub-systems, the passive (vertebrae, discs, and
ligaments), the active (muscles and tendons), and the control (central nervous system and
nerves) systems (Panjabi 1992a; Panjabi 1992b). Investigating the interplay between sub-
systems however is difficult, as the spine is a complex structure; and a hidden kinematic
chain. Several different technologies are therefore typically required, each with their own
limitations.
In order to directly investigate the passive and active sub-systems of the spine, there have
been many efforts to concurrently measure spinal kinematics and muscle activity (Sanchez-
Zuriaga et al. 2012; Kim et al. 2013; Claus et al. 2009; Hashemirad et al. 2009; Burnett et al.
2004; McGill et al. 1997; Kaigle et al. 1998; Callaghan et al. 1998; Peach et al. 1998; Dankaerts
et al. 2009). The majority of these studies have used surface electromyography combined
with skin surface kinematic measurement techniques such as Fastrak (Burnett et al. 2004;
12 Professor Alan Breen
195
Dankaerts et al. 2009), Isotrak (McGill et al. 1997; Callaghan et al. 1998), or cameras
(Sanchez-Zuriaga et al. 2015; Kim et al. 2013; Hashemirad et al. 2009). These are typically
limited to the investigation of gross spinal motion. To include segmental data usually requires
invasive techniques such as the surgical insertion of intra-osseous pins. In this way Kaigle et
al. (1998) investigated the reduction in lumbar muscular activity during full flexion (flexion
relaxation) and spinal kinematics at an inter-vertebral level (Kaigle et al. 1998). However,
typically only single motion segments were considered, and EMG was also only recorded
from one level (e.g., lumbar longissimus thoracis) (Kaigle et al. 1998).
7.1.2.1 Contemporaneous monitoring of inter-vertebral passive and active
systems
Study of the integrated function of the joints and muscles of the spine requires
contemporaneous multi-level kinematic and electromyographic monitoring throughout the
motion. This is necessary to incorporate timing, magnitude, and segmentation in the two
systems to characterise control. Multi-level surface electromyography fulfils these
requirements for muscle activity and quantitative fluoroscopy measures a range of
continuous inter-vertebral motion variables (Breen et al. 2012). Contemporaneous recording
of these measures therefore provides an integrated assessment of the passive and active
systems of the spine, and it is proposed that this may be useful when assessing patients with
low back pain (LBP) (Sanchez-Zuriaga et al. 2015; D’hooge et al. 2013). This study therefore
deployed quantitative fluoroscopy (QF), and surface electromyography (sEMG) of the lumbar
spine together for the first time. The study investigated the biomechanics of the lumbar spine
in a healthy control population in order to potentially better understand the significance of
biomechanical changes in LBP populations.
7.1.2.2 Variable selection
In order to investigate relationships between segmental kinematics and local muscle activity,
suitable variables from each must be identified. While responses to perturbation (Hodges et
al. 2009), and the flexion relaxation phenomenon (an absence of paraspinal muscle activity
during full sagittal flexion (FRP)) have been investigated (Luhring et al. 2015; McGorry and
Lin 2012), few studies have included sEMG amplitude changes throughout the cycle, be they
increases or decreases. This study therefore addressed these parameters. QF measures
continuous intervertebral rotation and translation in the coronal and sagittal planes during
weight-bearing or recumbent motion and can also extrapolate the instant axis of rotation
(IAR) and rotational range attainment rate from this. However, the need to also compare
intervertebral range of motion (IV-RoM) with sEMG in the present studies, dictates the need

196
for continuous motion information. Therefore IAR rotation and attainment rate were not
likely to be so useful. In addition, the small ranges of translation make this measure
unsuitable for numerical comparisons, leaving maximum rotational motion as the preferred
measure.
To investigate the relationships between lumbar muscle activity and inter-vertebral restraint
during bending requires access to the maximum IV-RoM (IV-RoMmax). Continuous
intervertebral rotation data allows both temporal comparisons with other variables and the
actual maximum IV-RoM (IV-RoMmax), rather than IV-RoM at the limit of voluntary trunk
bending, to be extracted. Recording in the standing orientation allows these comparisons.
7.1.2.3 Enhanced functional assessment
Sanchez-Zuriaga et al. (2015) suggested that whilst an increase in ES EMG activity during
flexion was observed in LBP groups when compared to healthy controls, no difference was
found in gross lumbar ROM (Sanchez-Zuriaga et al. 2015). This would suggest that either
muscle activity has no effect on the range of motion, or that the detail of what is happening
at individual levels is being missed. For example it may be that when there is an increase in
paraspinal activity in LBP patients during flexion, but no difference in RoM, the share of RoM
may have shifted between levels at different stages in the motion. Indeed, the primary role
of the paraspinal muscle during flexion is to resist inter-vertebral motion (Bogduk 2012) and
so it may be that the motion is restricted at a specific level, and compensated for elsewhere,
be this at other lumbar levels, or in the thoracic spine or pelvis. In support of Bogduk (2012),
in vitro experiments have also shown that increased multifidus activity decreases the range
of inter-vertebral motion (Wilke et al. 1995), and an increase in the activity of locally acting
paraspinals relative to the globally acting (i.e. an increased LES/TES ratio) is purported as a
spinal stiffening strategy (Van Dieen et al. 2003). Further insight is however required at an
inter-vertebral level in vivo. This study therefore investigates the relationships between
paraspinal muscle activity and lumbar spinal kinematics in healthy controls.
7.1.3 Aim of the study The purpose of this study was to quantify the relationships between IV-RoMmax during
flexion of the lumbar spine and the accompanying paraspinal muscle activity.
7.1.3.1 Specific objectives
To determine whether mean lumbar paraspinal sEMG amplitudes are related to the IV-
RoMmax at lumbar inter-vertebral levels.
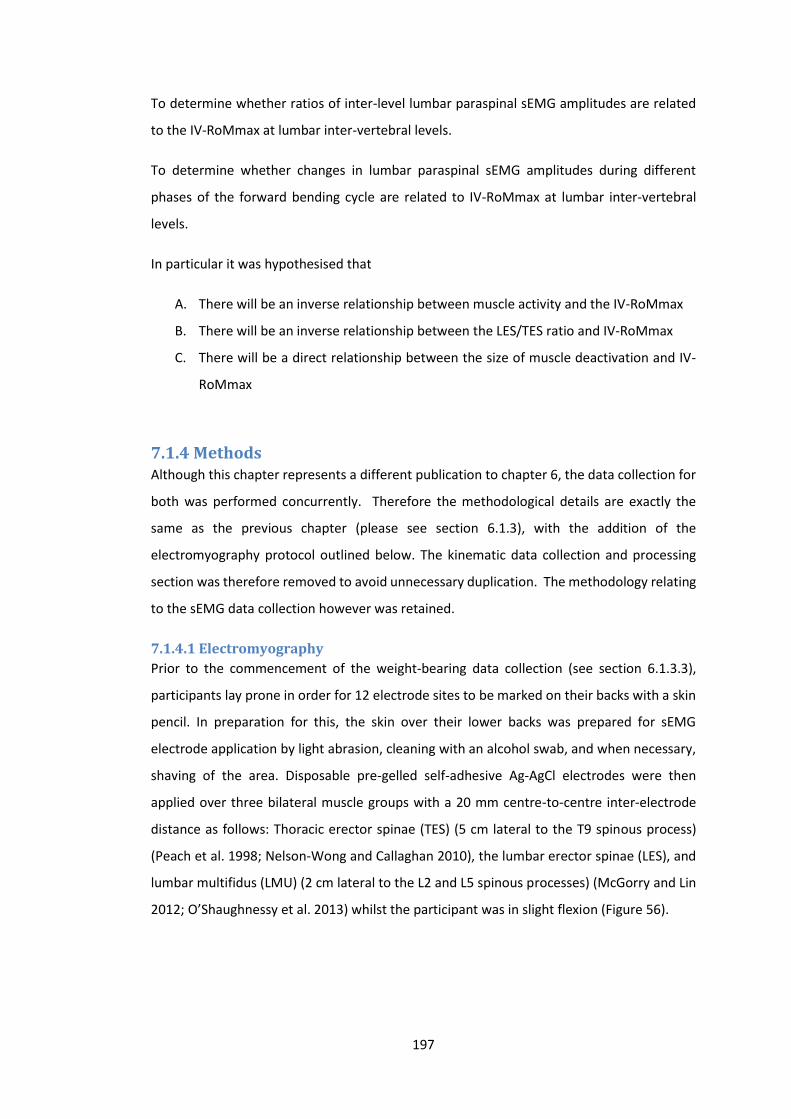
197
To determine whether ratios of inter-level lumbar paraspinal sEMG amplitudes are related
to the IV-RoMmax at lumbar inter-vertebral levels.
To determine whether changes in lumbar paraspinal sEMG amplitudes during different
phases of the forward bending cycle are related to IV-RoMmax at lumbar inter-vertebral
levels.
In particular it was hypothesised that
A. There will be an inverse relationship between muscle activity and the IV-RoMmax
B. There will be an inverse relationship between the LES/TES ratio and IV-RoMmax
C. There will be a direct relationship between the size of muscle deactivation and IV-
RoMmax
7.1.4 Methods Although this chapter represents a different publication to chapter 6, the data collection for
both was performed concurrently. Therefore the methodological details are exactly the
same as the previous chapter (please see section 6.1.3), with the addition of the
electromyography protocol outlined below. The kinematic data collection and processing
section was therefore removed to avoid unnecessary duplication. The methodology relating
to the sEMG data collection however was retained.
7.1.4.1 Electromyography
Prior to the commencement of the weight-bearing data collection (see section 6.1.3.3),
participants lay prone in order for 12 electrode sites to be marked on their backs with a skin
pencil. In preparation for this, the skin over their lower backs was prepared for sEMG
electrode application by light abrasion, cleaning with an alcohol swab, and when necessary,
shaving of the area. Disposable pre-gelled self-adhesive Ag-AgCl electrodes were then
applied over three bilateral muscle groups with a 20 mm centre-to-centre inter-electrode
distance as follows: Thoracic erector spinae (TES) (5 cm lateral to the T9 spinous process)
(Peach et al. 1998; Nelson-Wong and Callaghan 2010), the lumbar erector spinae (LES), and
lumbar multifidus (LMU) (2 cm lateral to the L2 and L5 spinous processes) (McGorry and Lin
2012; O’Shaughnessy et al. 2013) whilst the participant was in slight flexion (Figure 56).
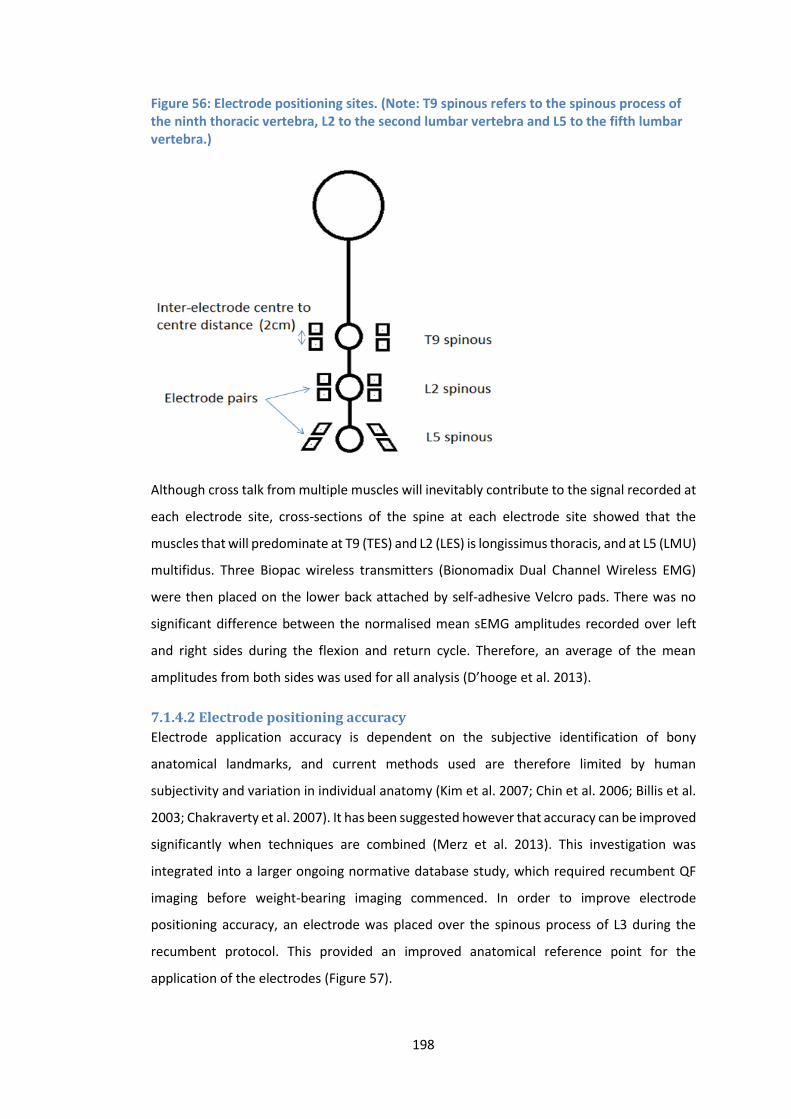
198
Figure 56: Electrode positioning sites. (Note: T9 spinous refers to the spinous process of the ninth thoracic vertebra, L2 to the second lumbar vertebra and L5 to the fifth lumbar vertebra.)
Although cross talk from multiple muscles will inevitably contribute to the signal recorded at
each electrode site, cross-sections of the spine at each electrode site showed that the
muscles that will predominate at T9 (TES) and L2 (LES) is longissimus thoracis, and at L5 (LMU)
multifidus. Three Biopac wireless transmitters (Bionomadix Dual Channel Wireless EMG)
were then placed on the lower back attached by self-adhesive Velcro pads. There was no
significant difference between the normalised mean sEMG amplitudes recorded over left
and right sides during the flexion and return cycle. Therefore, an average of the mean
amplitudes from both sides was used for all analysis (D’hooge et al. 2013).
7.1.4.2 Electrode positioning accuracy
Electrode application accuracy is dependent on the subjective identification of bony
anatomical landmarks, and current methods used are therefore limited by human
subjectivity and variation in individual anatomy (Kim et al. 2007; Chin et al. 2006; Billis et al.
2003; Chakraverty et al. 2007). It has been suggested however that accuracy can be improved
significantly when techniques are combined (Merz et al. 2013). This investigation was
integrated into a larger ongoing normative database study, which required recumbent QF
imaging before weight-bearing imaging commenced. In order to improve electrode
positioning accuracy, an electrode was placed over the spinous process of L3 during the
recumbent protocol. This provided an improved anatomical reference point for the
application of the electrodes (Figure 57).
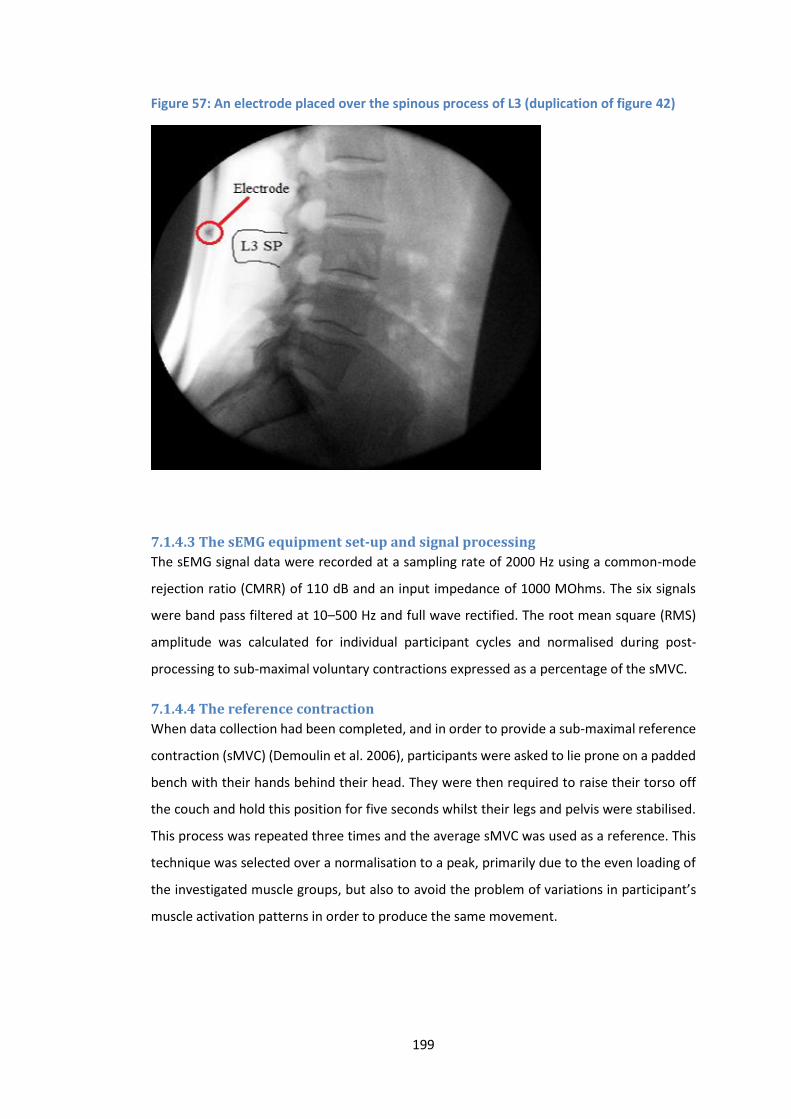
199
Figure 57: An electrode placed over the spinous process of L3 (duplication of figure 42)
7.1.4.3 The sEMG equipment set-up and signal processing
The sEMG signal data were recorded at a sampling rate of 2000 Hz using a common-mode
rejection ratio (CMRR) of 110 dB and an input impedance of 1000 MOhms. The six signals
were band pass filtered at 10–500 Hz and full wave rectified. The root mean square (RMS)
amplitude was calculated for individual participant cycles and normalised during post-
processing to sub-maximal voluntary contractions expressed as a percentage of the sMVC.
7.1.4.4 The reference contraction
When data collection had been completed, and in order to provide a sub-maximal reference
contraction (sMVC) (Demoulin et al. 2006), participants were asked to lie prone on a padded
bench with their hands behind their head. They were then required to raise their torso off
the couch and hold this position for five seconds whilst their legs and pelvis were stabilised.
This process was repeated three times and the average sMVC was used as a reference. This
technique was selected over a normalisation to a peak, primarily due to the even loading of
the investigated muscle groups, but also to avoid the problem of variations in participant’s
muscle activation patterns in order to produce the same movement.
200
7.1.4.5 Synchronisation
The QF motion frame controller recording and the sEMG data recording were co-ordinated
using a trip switch attached to the motion arm of the frame. This registered a data point on
the sEMG timeline (Figure 58).
Figure 58: Synchronisation of the motion frame movement and sEMG recordings
7.1.4.6 Fear of movement
It has been shown that sEMG measurements can be affected by psychological factors, such
as a fear of movement (kinesiophobia) and re-injury (Geisser et al. 2005; Vlaeyen 1999),
which have also been linked to reduced lumbar spinal movements (Geisser et al. 2004;
Thomas and France 2008). Whilst these were not expected to factor in a healthy population
group, they nevertheless required consideration in the study design. Therefore the final part
of the study protocol was for the participant to answer the following question “Were you
fearful of the forward bending and return phases, or the sMVC causing you low back pain?”
If any participants described a fear of pain during any of the movements required of them,
then their data would be discarded.
7.1.5 Data analysis sEMG ratios (Van Dieen et al. 2003; Reeves et al. 2006) were calculated from the mean left-
right normalised sEMG (RMS) amplitudes during the flexion phase only as follows, LMU/LES,
LES/TES and LMU/TES. In order to calculate sEMG changes at different stages of the flexion
cycle, the forward bending phase was divided into five epochs for each participant (D’Hooge
et al. 2013; Dankaerts et al. 2009). As the entire flexion cycle was approximately 10 seconds,
each epoch represented about 2 seconds of EMG signal recording and 12° of motion frame
movement. The change in mean sEMG between epochs was then calculated (e.g., the change
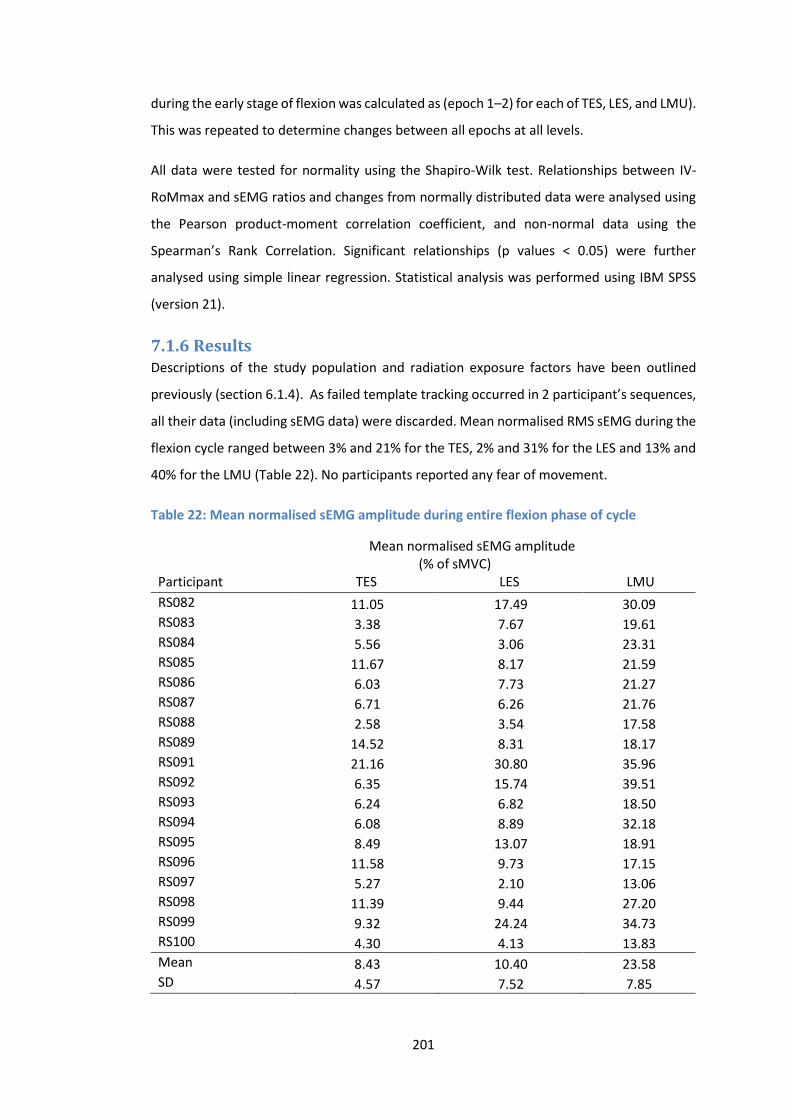
201
during the early stage of flexion was calculated as (epoch 1–2) for each of TES, LES, and LMU).
This was repeated to determine changes between all epochs at all levels.
All data were tested for normality using the Shapiro-Wilk test. Relationships between IV-
RoMmax and sEMG ratios and changes from normally distributed data were analysed using
the Pearson product-moment correlation coefficient, and non-normal data using the
Spearman’s Rank Correlation. Significant relationships (p values < 0.05) were further
analysed using simple linear regression. Statistical analysis was performed using IBM SPSS
(version 21).
7.1.6 Results Descriptions of the study population and radiation exposure factors have been outlined
previously (section 6.1.4). As failed template tracking occurred in 2 participant’s sequences,
all their data (including sEMG data) were discarded. Mean normalised RMS sEMG during the
flexion cycle ranged between 3% and 21% for the TES, 2% and 31% for the LES and 13% and
40% for the LMU (Table 22). No participants reported any fear of movement.
Table 22: Mean normalised sEMG amplitude during entire flexion phase of cycle
Mean normalised sEMG amplitude (% of sMVC)
Participant TES LES LMU
RS082 11.05 17.49 30.09 RS083 3.38 7.67 19.61 RS084 5.56 3.06 23.31 RS085 11.67 8.17 21.59 RS086 6.03 7.73 21.27 RS087 6.71 6.26 21.76 RS088 2.58 3.54 17.58 RS089 14.52 8.31 18.17 RS091 21.16 30.80 35.96 RS092 6.35 15.74 39.51 RS093 6.24 6.82 18.50 RS094 6.08 8.89 32.18 RS095 8.49 13.07 18.91 RS096 11.58 9.73 17.15 RS097 5.27 2.10 13.06 RS098 11.39 9.44 27.20 RS099 9.32 24.24 34.73 RS100 4.30 4.13 13.83
Mean 8.43 10.40 23.58 SD 4.57 7.52 7.85
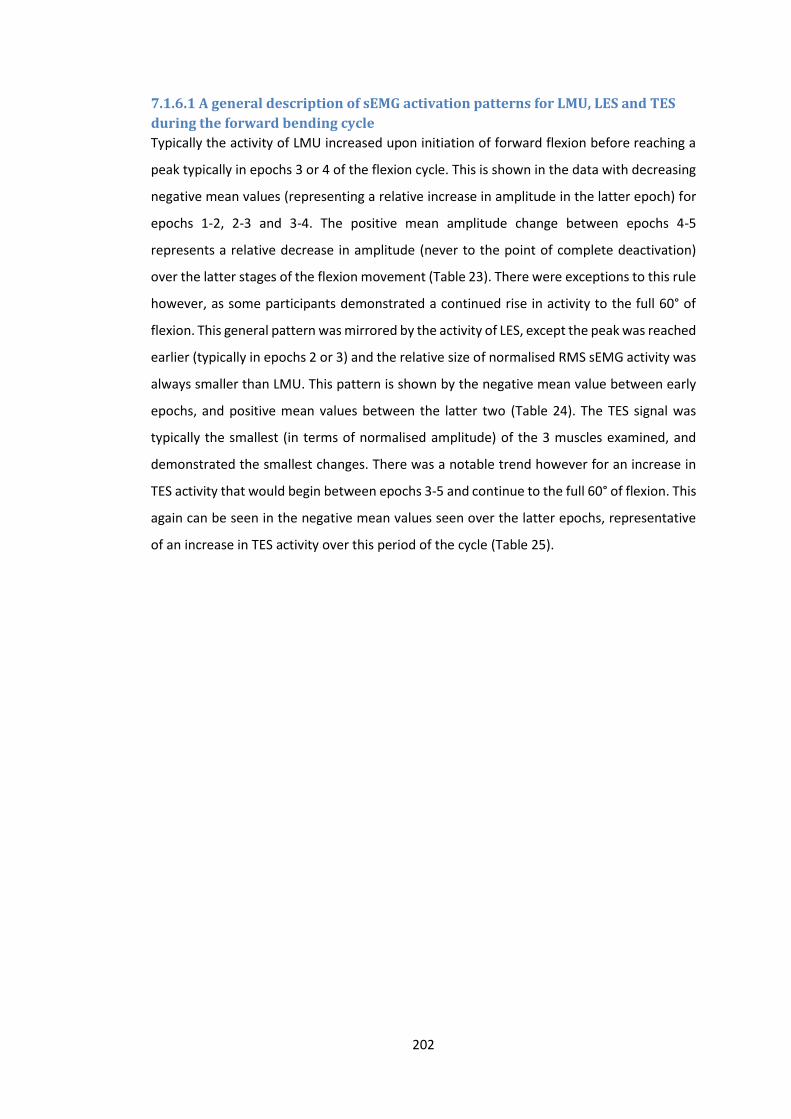
202
7.1.6.1 A general description of sEMG activation patterns for LMU, LES and TES
during the forward bending cycle
Typically the activity of LMU increased upon initiation of forward flexion before reaching a
peak typically in epochs 3 or 4 of the flexion cycle. This is shown in the data with decreasing
negative mean values (representing a relative increase in amplitude in the latter epoch) for
epochs 1-2, 2-3 and 3-4. The positive mean amplitude change between epochs 4-5
represents a relative decrease in amplitude (never to the point of complete deactivation)
over the latter stages of the flexion movement (Table 23). There were exceptions to this rule
however, as some participants demonstrated a continued rise in activity to the full 60° of
flexion. This general pattern was mirrored by the activity of LES, except the peak was reached
earlier (typically in epochs 2 or 3) and the relative size of normalised RMS sEMG activity was
always smaller than LMU. This pattern is shown by the negative mean value between early
epochs, and positive mean values between the latter two (Table 24). The TES signal was
typically the smallest (in terms of normalised amplitude) of the 3 muscles examined, and
demonstrated the smallest changes. There was a notable trend however for an increase in
TES activity that would begin between epochs 3-5 and continue to the full 60° of flexion. This
again can be seen in the negative mean values seen over the latter epochs, representative
of an increase in TES activity over this period of the cycle (Table 25).
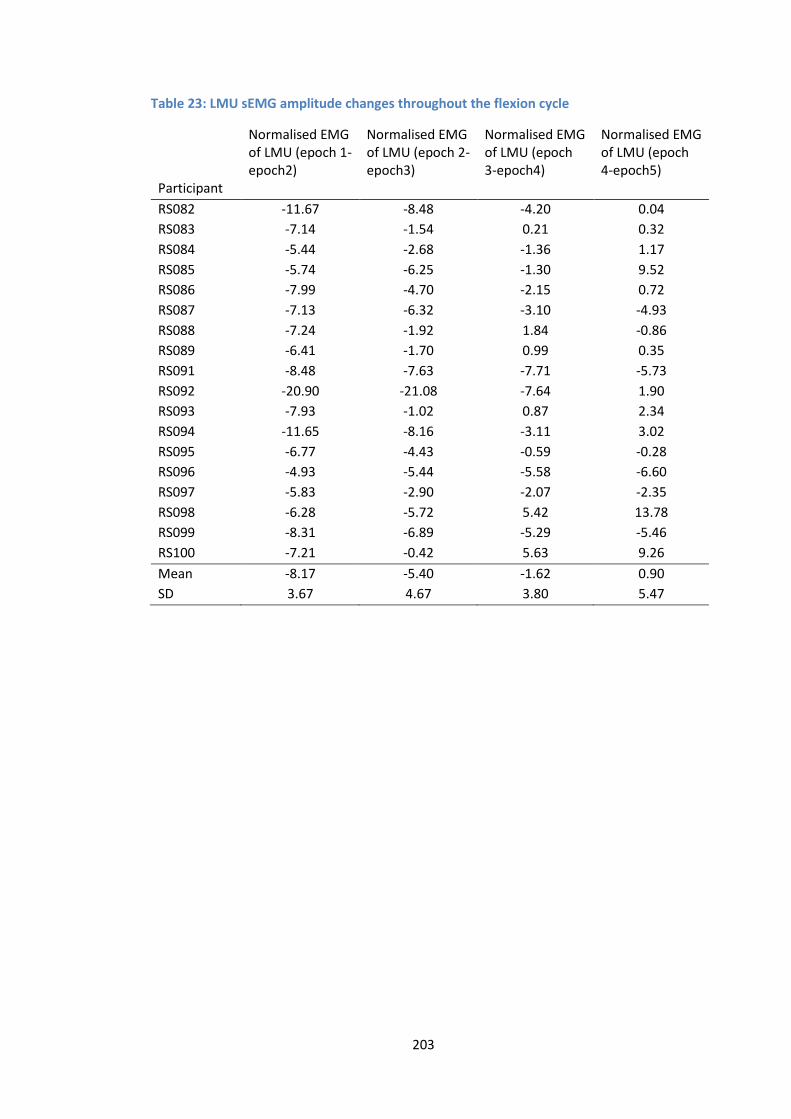
203
Table 23: LMU sEMG amplitude changes throughout the flexion cycle
Normalised EMG of LMU (epoch 1-epoch2)
Normalised EMG of LMU (epoch 2-epoch3)
Normalised EMG of LMU (epoch 3-epoch4)
Normalised EMG of LMU (epoch 4-epoch5)
Participant
RS082 -11.67 -8.48 -4.20 0.04
RS083 -7.14 -1.54 0.21 0.32
RS084 -5.44 -2.68 -1.36 1.17
RS085 -5.74 -6.25 -1.30 9.52
RS086 -7.99 -4.70 -2.15 0.72
RS087 -7.13 -6.32 -3.10 -4.93
RS088 -7.24 -1.92 1.84 -0.86
RS089 -6.41 -1.70 0.99 0.35
RS091 -8.48 -7.63 -7.71 -5.73
RS092 -20.90 -21.08 -7.64 1.90
RS093 -7.93 -1.02 0.87 2.34
RS094 -11.65 -8.16 -3.11 3.02
RS095 -6.77 -4.43 -0.59 -0.28
RS096 -4.93 -5.44 -5.58 -6.60
RS097 -5.83 -2.90 -2.07 -2.35
RS098 -6.28 -5.72 5.42 13.78
RS099 -8.31 -6.89 -5.29 -5.46
RS100 -7.21 -0.42 5.63 9.26
Mean -8.17 -5.40 -1.62 0.90
SD 3.67 4.67 3.80 5.47
204
Table 24: LES sEMG amplitude changes throughout the flexion cycle
Normalised EMG Of LES (epoch 1- epoch 2)
Normalised EMG at of LES (epoch 2- epoch 3)
Normalised EMG of LES (epoch 3- epoch 4)
Normalised EMG of LES (epoch 4- epoch 5)
Participant
RS082 -7.38 -4.16 2.35 9.36
RS083 -3.88 4.10 3.95 1.20
RS084 -0.11 -0.12 -0.24 -0.21
RS085 -3.58 2.47 6.75 1.45
RS086 -3.70 0.97 3.41 2.69
RS087 -3.31 -2.21 4.54 0.61
RS088 -0.06 2.66 0.71 -0.18
RS089 -4.27 -0.67 4.15 1.90
RS091 -6.08 -4.93 -2.44 -2.00
RS092 -15.38 -2.67 7.93 3.79
RS093 -2.49 4.08 2.12 0.27
RS094 -1.88 2.16 2.19 2.17
RS095 -2.55 -1.26 1.78 2.51
RS096 -5.17 -2.56 -1.52 0.38
RS097 -0.52 0.25 0.14 0.18
RS098 -1.04 6.09 6.12 0.58
RS099 -8.59 -4.89 -0.40 -0.35
RS100 -0.50 -0.16 0.17 0.23
Mean -3.92 -0.05 2.32 1.37
SD 3.77 3.21 2.88 2.41
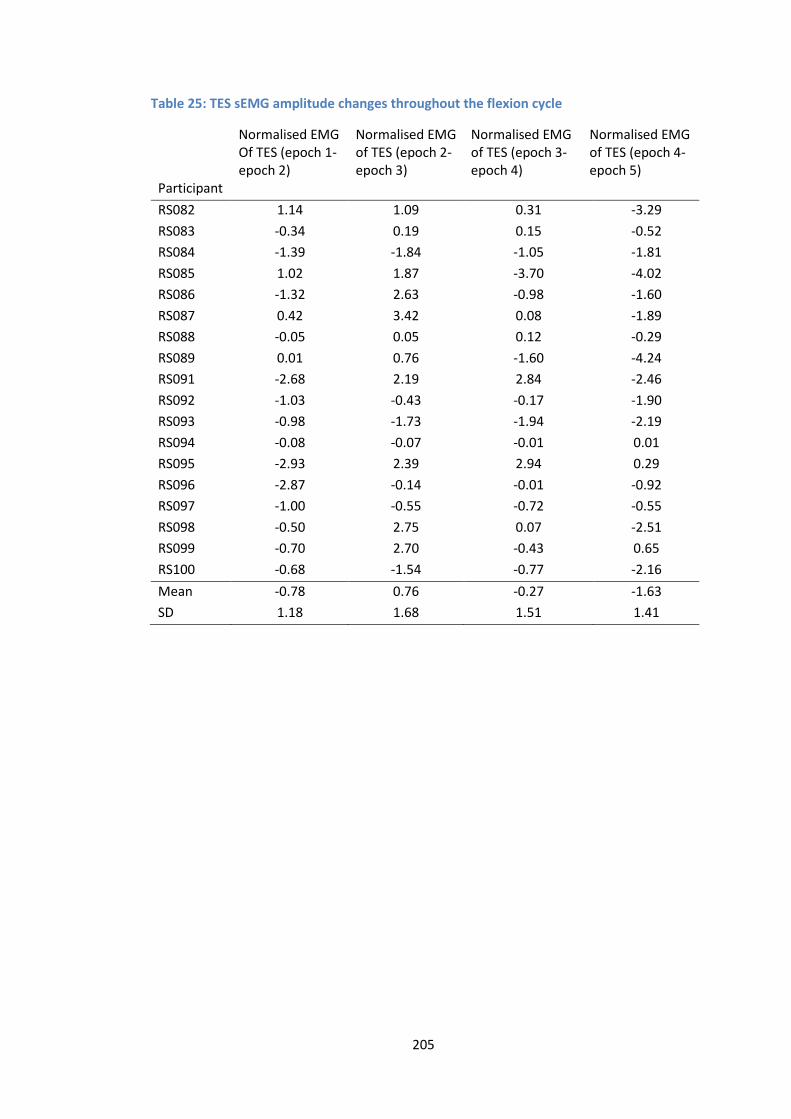
205
Table 25: TES sEMG amplitude changes throughout the flexion cycle
Normalised EMG Of TES (epoch 1- epoch 2)
Normalised EMG of TES (epoch 2- epoch 3)
Normalised EMG of TES (epoch 3- epoch 4)
Normalised EMG of TES (epoch 4- epoch 5)
Participant
RS082 1.14 1.09 0.31 -3.29
RS083 -0.34 0.19 0.15 -0.52
RS084 -1.39 -1.84 -1.05 -1.81
RS085 1.02 1.87 -3.70 -4.02
RS086 -1.32 2.63 -0.98 -1.60
RS087 0.42 3.42 0.08 -1.89
RS088 -0.05 0.05 0.12 -0.29
RS089 0.01 0.76 -1.60 -4.24
RS091 -2.68 2.19 2.84 -2.46
RS092 -1.03 -0.43 -0.17 -1.90
RS093 -0.98 -1.73 -1.94 -2.19
RS094 -0.08 -0.07 -0.01 0.01
RS095 -2.93 2.39 2.94 0.29
RS096 -2.87 -0.14 -0.01 -0.92
RS097 -1.00 -0.55 -0.72 -0.55
RS098 -0.50 2.75 0.07 -2.51
RS099 -0.70 2.70 -0.43 0.65
RS100 -0.68 -1.54 -0.77 -2.16
Mean -0.78 0.76 -0.27 -1.63
SD 1.18 1.68 1.51 1.41
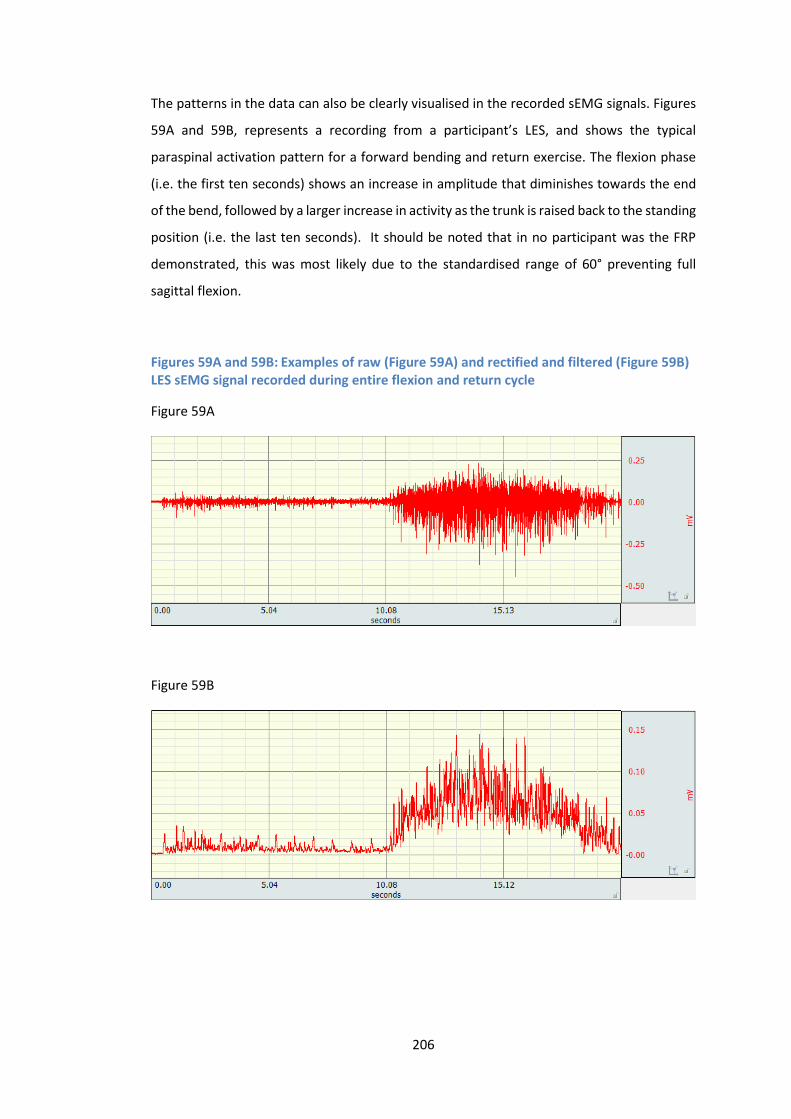
206
The patterns in the data can also be clearly visualised in the recorded sEMG signals. Figures
59A and 59B, represents a recording from a participant’s LES, and shows the typical
paraspinal activation pattern for a forward bending and return exercise. The flexion phase
(i.e. the first ten seconds) shows an increase in amplitude that diminishes towards the end
of the bend, followed by a larger increase in activity as the trunk is raised back to the standing
position (i.e. the last ten seconds). It should be noted that in no participant was the FRP
demonstrated, this was most likely due to the standardised range of 60° preventing full
sagittal flexion.
Figures 59A and 59B: Examples of raw (Figure 59A) and rectified and filtered (Figure 59B) LES sEMG signal recorded during entire flexion and return cycle
Figure 59A
Figure 59B
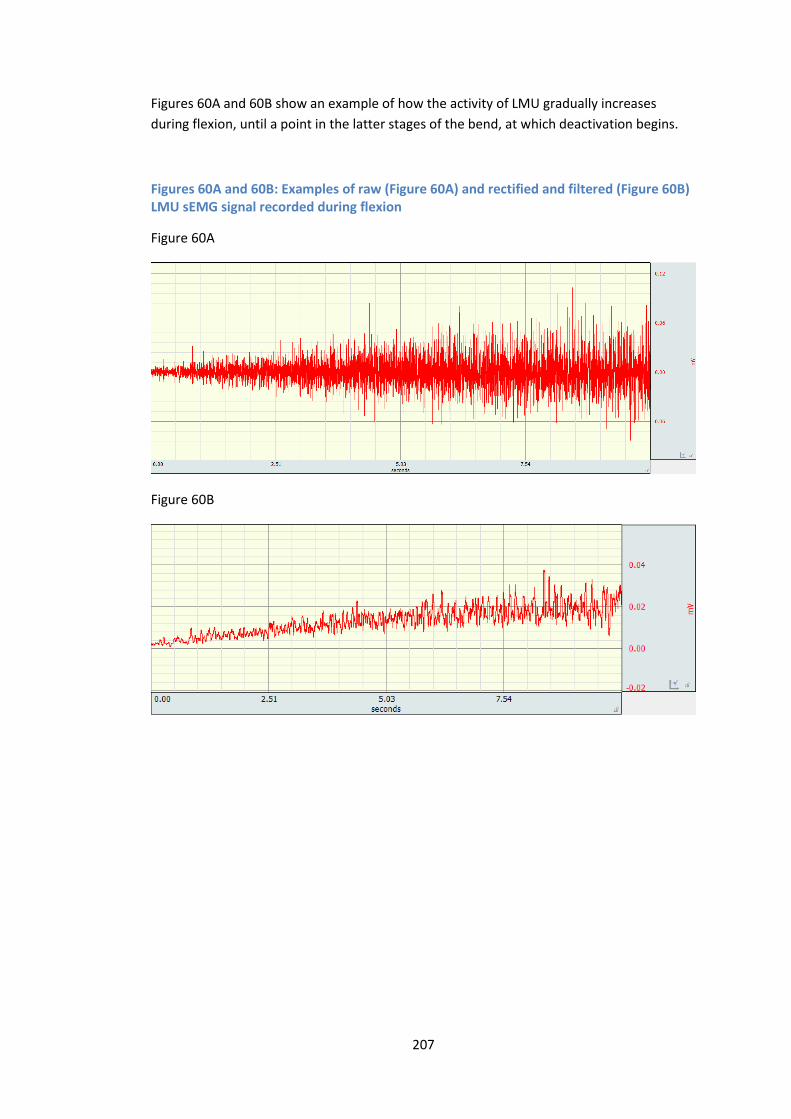
207
Figures 60A and 60B show an example of how the activity of LMU gradually increases
during flexion, until a point in the latter stages of the bend, at which deactivation begins.
Figures 60A and 60B: Examples of raw (Figure 60A) and rectified and filtered (Figure 60B) LMU sEMG signal recorded during flexion
Figure 60A
Figure 60B
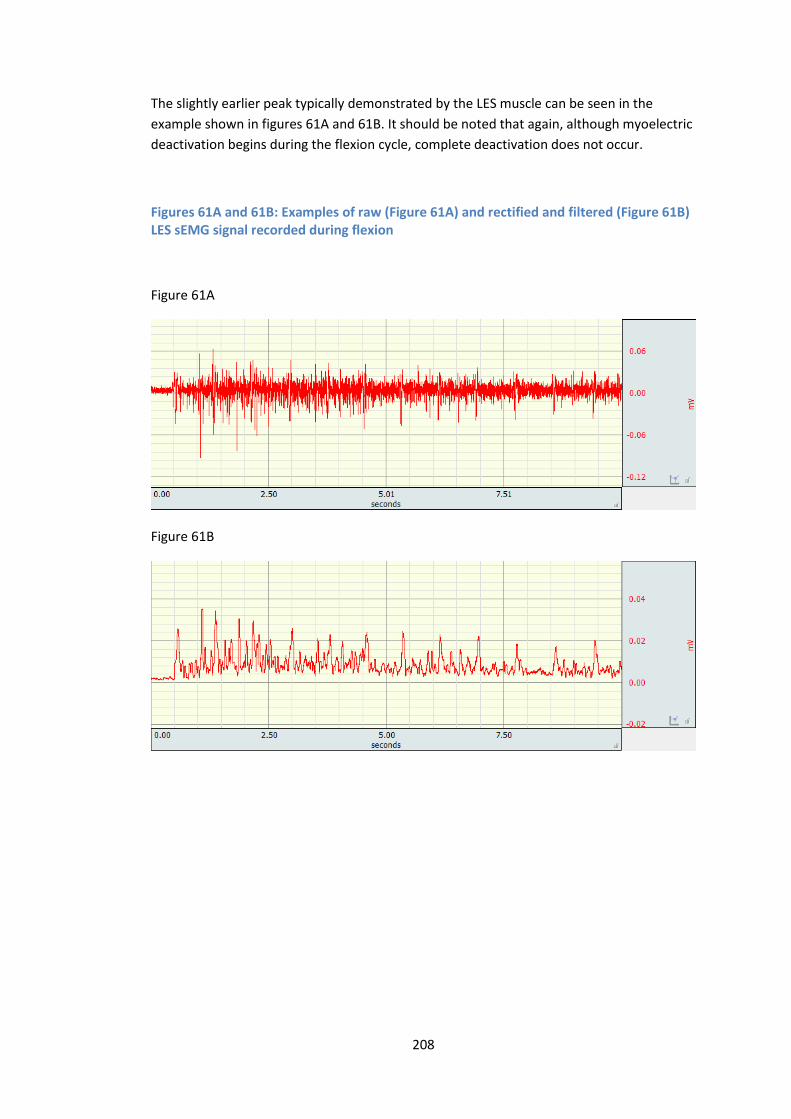
208
The slightly earlier peak typically demonstrated by the LES muscle can be seen in the
example shown in figures 61A and 61B. It should be noted that again, although myoelectric
deactivation begins during the flexion cycle, complete deactivation does not occur.
Figures 61A and 61B: Examples of raw (Figure 61A) and rectified and filtered (Figure 61B) LES sEMG signal recorded during flexion
Figure 61A
Figure 61B
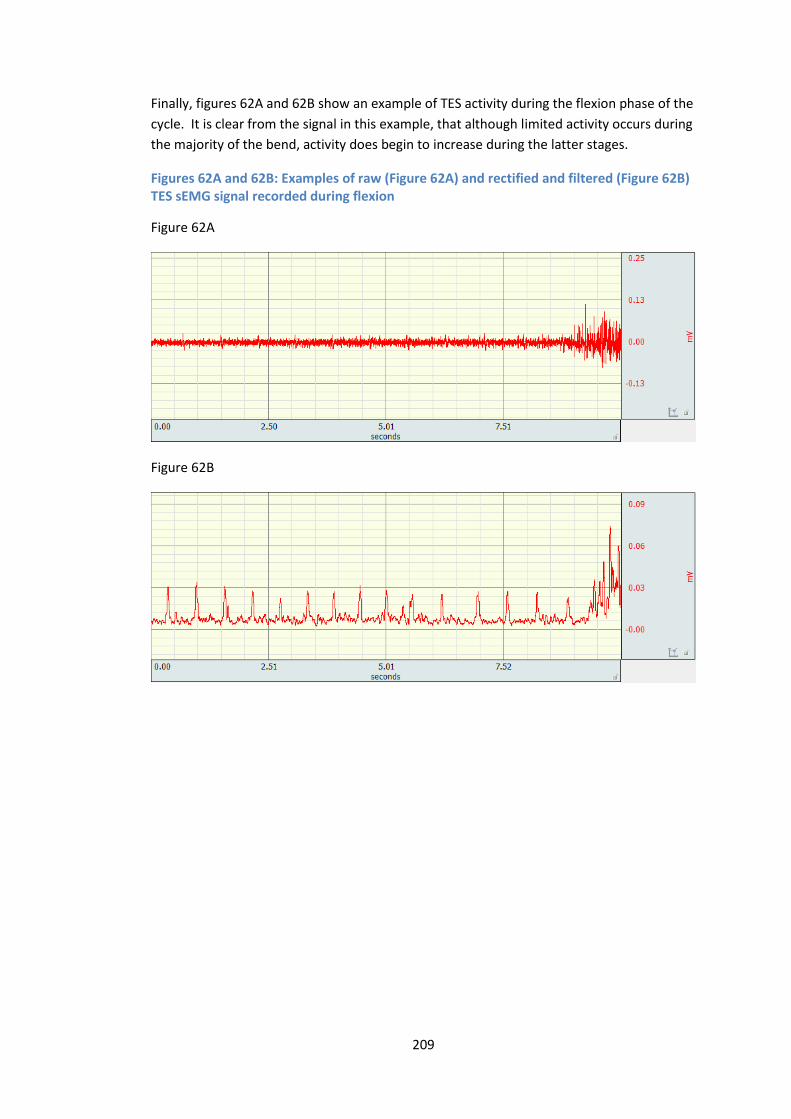
209
Finally, figures 62A and 62B show an example of TES activity during the flexion phase of the
cycle. It is clear from the signal in this example, that although limited activity occurs during
the majority of the bend, activity does begin to increase during the latter stages.
Figures 62A and 62B: Examples of raw (Figure 62A) and rectified and filtered (Figure 62B) TES sEMG signal recorded during flexion
Figure 62A
Figure 62B
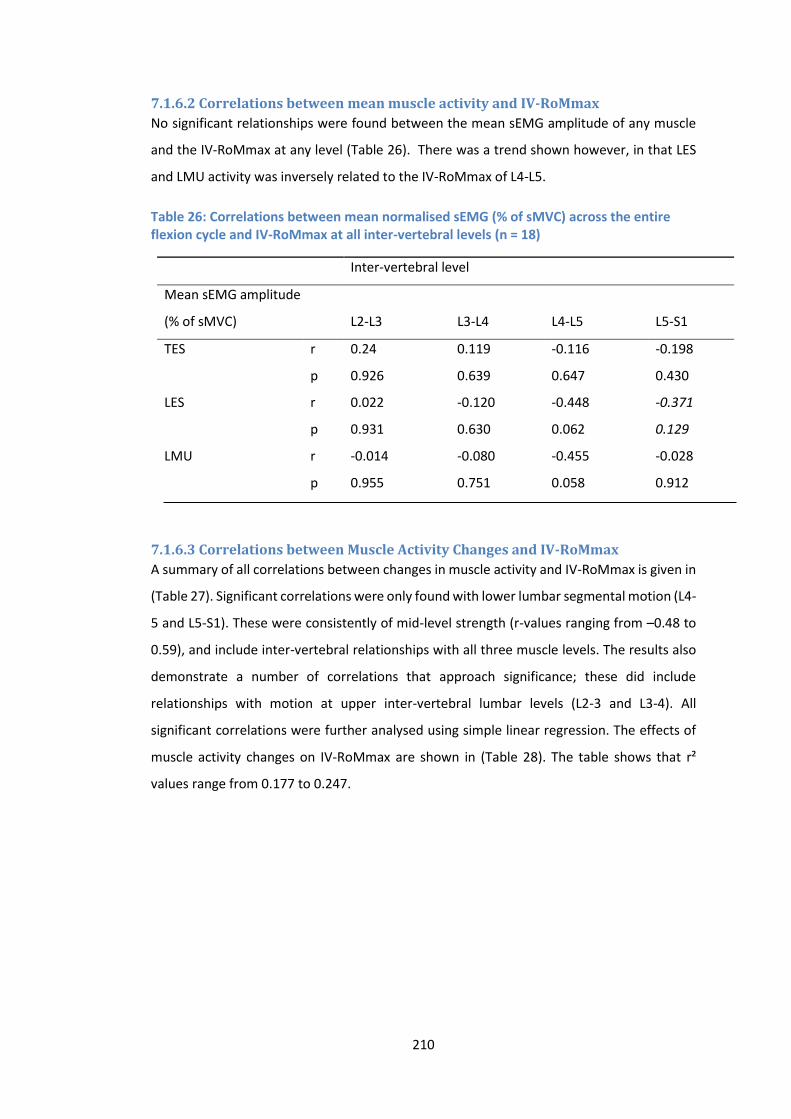
210
7.1.6.2 Correlations between mean muscle activity and IV-RoMmax
No significant relationships were found between the mean sEMG amplitude of any muscle
and the IV-RoMmax at any level (Table 26). There was a trend shown however, in that LES
and LMU activity was inversely related to the IV-RoMmax of L4-L5.
Table 26: Correlations between mean normalised sEMG (% of sMVC) across the entire flexion cycle and IV-RoMmax at all inter-vertebral levels (n = 18)
Inter-vertebral level
Mean sEMG amplitude
(% of sMVC) L2-L3 L3-L4 L4-L5 L5-S1
TES r 0.24 0.119 -0.116 -0.198
p 0.926 0.639 0.647 0.430
LES r 0.022 -0.120 -0.448 -0.371
p 0.931 0.630 0.062 0.129
LMU r -0.014 -0.080 -0.455 -0.028
p 0.955 0.751 0.058 0.912
7.1.6.3 Correlations between Muscle Activity Changes and IV-RoMmax
A summary of all correlations between changes in muscle activity and IV-RoMmax is given in
(Table 27). Significant correlations were only found with lower lumbar segmental motion (L4-
5 and L5-S1). These were consistently of mid-level strength (r-values ranging from –0.48 to
0.59), and include inter-vertebral relationships with all three muscle levels. The results also
demonstrate a number of correlations that approach significance; these did include
relationships with motion at upper inter-vertebral lumbar levels (L2-3 and L3-4). All
significant correlations were further analysed using simple linear regression. The effects of
muscle activity changes on IV-RoMmax are shown in (Table 28). The table shows that r²
values range from 0.177 to 0.247.

211
Table 27: Correlations* between muscle activity changes (three groups, five epochs) and IV-RoMmax at all inter-vertebral levels (n = 18)
Inter-vertebral level
Muscle activity change L2-L3 L3-L4 L4-L5 L5-S1
TES epoch 1-2 r 0.404 0.316 -0.164 0.224
p 0.097 0.201 0.516 0.371
TES epoch 2-3 r 0.083 -0.02 0.036 -0.477
p 0.743 0.938 0.888 0.045
TES epoch 3-4* r -0.059 -0.077 -0.171 -0.434
p 0.817 0.760 0.496 0.072
TES epoch 4-5 r -0.124 -0.194 -0.134 -0.103
p 0.625 0.441 0.596 0.683
LES epoch 1-2* r -0.203 0.070 0.595 0.391
p 0.418 0.782 0.009 0.108
LES epoch 2-3 r -0.045 0.257 0.295 0.497
p 0.86 0.303 0.234 0.036
LES epoch 3-4 r -0.117 -0.118 0.211 0.266
p 0.645 0.642 0.4 0.286
LES epoch 4-5* r 0.228 0.215 -0.088 -0.055
p 0.362 0.392 0.729 0.829
LMU epoch 1-2 r 0.14 0.334 0.314 -0.144
p 0.58 0.176 0.204 0.567
LMU epoch 2-3* r 0.021 0.062 0.317 0.139
p 0.935 0.807 0.200 0.581
LMU epoch 3-4 r -0.039 0.164 0.455 0.273
p 0.877 0.517 0.058 0.272
LMU epoch 4-5 r -0.159 0.067 0.429 0.461
p 0.53 0.793 0.076 0.027
Significant correlations are highlighted in bold italic. Correlations that approach significance are highlighted in
bold. * Indicates a row that includes non-parametric data and therefore a Spearman’s Rank Correlation was used.
All other normally distributed data was analysed using the Pearson product-moment correlation coefficient. r =
correlation co-efficient, p = p-value (95% confidence level). Note: A negative correlation relates to a relative
increase in muscle activity between epochs.
Of particular note is that changes in LMU, LES and TES at different stages of the cycle, can all
influence the IV-RoMmax of L5-S1. The significant correlations indicate that a decrease in
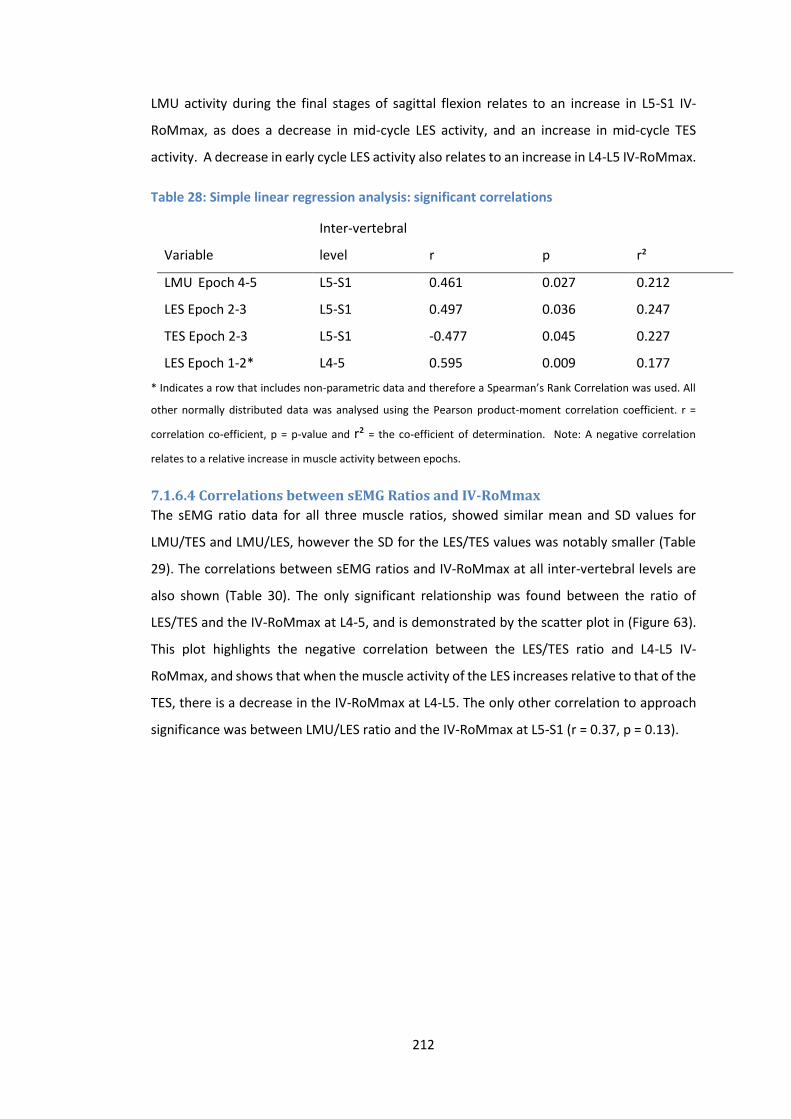
212
LMU activity during the final stages of sagittal flexion relates to an increase in L5-S1 IV-
RoMmax, as does a decrease in mid-cycle LES activity, and an increase in mid-cycle TES
activity. A decrease in early cycle LES activity also relates to an increase in L4-L5 IV-RoMmax.
Table 28: Simple linear regression analysis: significant correlations
Variable
Inter-vertebral
level r p r²
LMU Epoch 4-5 L5-S1 0.461 0.027 0.212
LES Epoch 2-3 L5-S1 0.497 0.036 0.247
TES Epoch 2-3 L5-S1 -0.477 0.045 0.227
LES Epoch 1-2* L4-5 0.595 0.009 0.177
* Indicates a row that includes non-parametric data and therefore a Spearman’s Rank Correlation was used. All
other normally distributed data was analysed using the Pearson product-moment correlation coefficient. r =
correlation co-efficient, p = p-value and r² = the co-efficient of determination. Note: A negative correlation
relates to a relative increase in muscle activity between epochs.
7.1.6.4 Correlations between sEMG Ratios and IV-RoMmax
The sEMG ratio data for all three muscle ratios, showed similar mean and SD values for
LMU/TES and LMU/LES, however the SD for the LES/TES values was notably smaller (Table
29). The correlations between sEMG ratios and IV-RoMmax at all inter-vertebral levels are
also shown (Table 30). The only significant relationship was found between the ratio of
LES/TES and the IV-RoMmax at L4-5, and is demonstrated by the scatter plot in (Figure 63).
This plot highlights the negative correlation between the LES/TES ratio and L4-L5 IV-
RoMmax, and shows that when the muscle activity of the LES increases relative to that of the
TES, there is a decrease in the IV-RoMmax at L4-L5. The only other correlation to approach
significance was between LMU/LES ratio and the IV-RoMmax at L5-S1 (r = 0.37, p = 0.13).

213
Table 29: sEMG ratio data for LMU/TES, LMU/LES and LES/TES during flexion phase of cycle
sEMG ratios
Participant LMU/TES LMU/LES LES/TES
RS082 2.72 1.72 1.58
RS083 5.81 2.56 2.27
RS084 4.19 7.61 0.55
RS085 1.85 2.64 0.70
RS086 3.53 2.75 1.28
RS087 3.24 3.47 0.93
RS088 6.82 4.96 1.37
RS089 1.25 2.19 0.57
RS091 1.70 1.17 1.46
RS092 6.22 2.51 2.48
RS093 2.96 2.71 1.09
RS094 5.30 3.62 1.46
RS095 2.23 1.45 1.54
RS096 1.48 1.76 0.84
RS097 2.48 6.23 0.40
RS098 2.39 2.88 0.83
RS099 3.72 1.43 2.60
RS100 3.21 3.35 0.96
Mean 3.39 3.06 1.27
SD 1.67 1.70 0.65
Table 30: Correlations between muscle activity ratios and IV-RoMmax at all
inter-vertebral levels (n = 18)
Inter-vertebral level
Ratio L2-L3 L3-L4 L4-L5 L5-S1
LMU/TES r 0.046 -0.013 -0.236 0.152
p 0.856 0.958 0.345 0.548
LMU/LES r -0.209 0.04 0.263 0.37
p 0.405 0.875 0.292 0.13
LES/TES r 0.095 -0.217 -0.533 -0.242
p 0.708 0.387 0.023 0.333
r = the Pearson product-moment correlation coefficient, p = p-value. Note: A negative correlation relates to a
relative increase in muscle activity ratio.
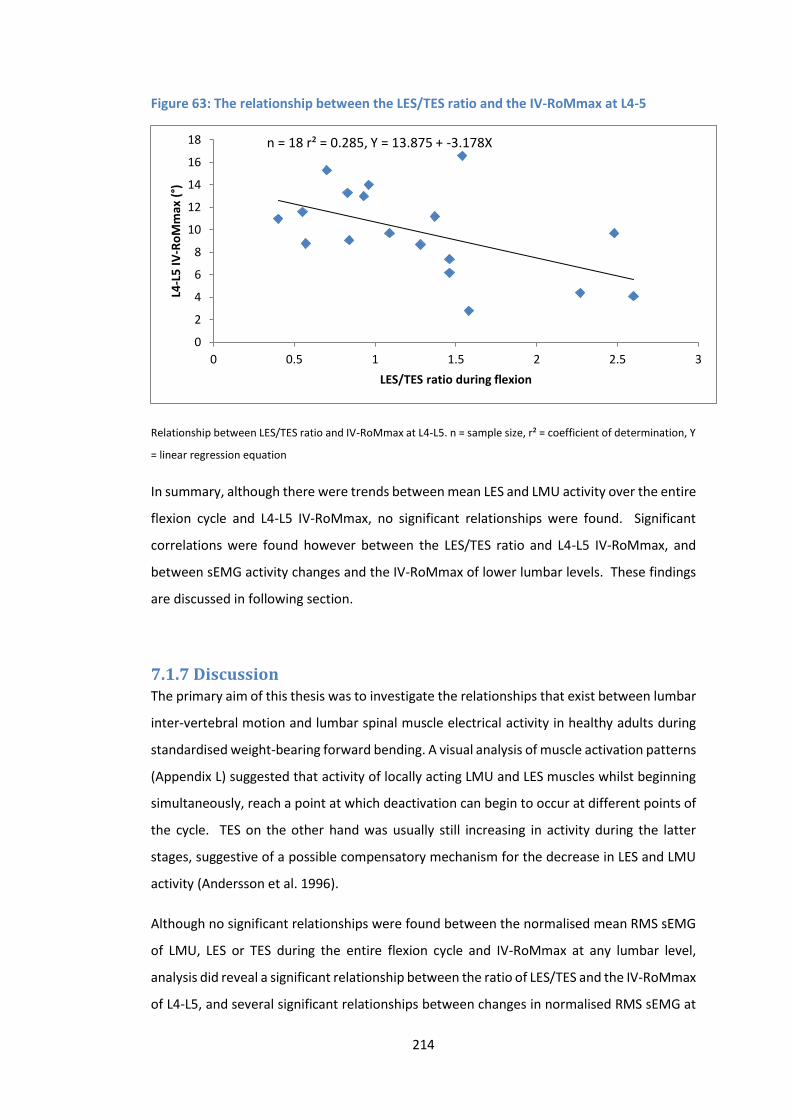
214
Figure 63: The relationship between the LES/TES ratio and the IV-RoMmax at L4-5
Relationship between LES/TES ratio and IV-RoMmax at L4-L5. n = sample size, r² = coefficient of determination, Y
= linear regression equation
In summary, although there were trends between mean LES and LMU activity over the entire
flexion cycle and L4-L5 IV-RoMmax, no significant relationships were found. Significant
correlations were found however between the LES/TES ratio and L4-L5 IV-RoMmax, and
between sEMG activity changes and the IV-RoMmax of lower lumbar levels. These findings
are discussed in following section.
7.1.7 Discussion The primary aim of this thesis was to investigate the relationships that exist between lumbar
inter-vertebral motion and lumbar spinal muscle electrical activity in healthy adults during
standardised weight-bearing forward bending. A visual analysis of muscle activation patterns
(Appendix L) suggested that activity of locally acting LMU and LES muscles whilst beginning
simultaneously, reach a point at which deactivation can begin to occur at different points of
the cycle. TES on the other hand was usually still increasing in activity during the latter
stages, suggestive of a possible compensatory mechanism for the decrease in LES and LMU
activity (Andersson et al. 1996).
Although no significant relationships were found between the normalised mean RMS sEMG
of LMU, LES or TES during the entire flexion cycle and IV-RoMmax at any lumbar level,
analysis did reveal a significant relationship between the ratio of LES/TES and the IV-RoMmax
of L4-L5, and several significant relationships between changes in normalised RMS sEMG at
0
2
4
6
8
10
12
14
16
18
0 0.5 1 1.5 2 2.5 3
L4-L
5 I
V-R
oM
max
(°)
LES/TES ratio during flexion
n = 18 r² = 0.285, Y = 13.875 + -3.178X
215
specific stages of the flexion cycle, and the IV-RoMmax of lower lumbar levels (i.e. L4-L5 and
L5-S1). These findings and their interpretation are discussed further below.
7.1.7.1 Relationships between mean muscle activity amplitudes over the entire
flexion cycle and IV-RoMmax
In a study comparing paraspinal EMG between LBP patients and healthy controls, Ahern et
al. (1988), concluded that significantly lower muscle activity observed in the LBP group was
due to the reduced degree of flexion achieved in the group (Ahern et al. 1988). This is
contrary to the conclusions of other studies which suggest that an increase in paraspinal EMG
in patients is a stabilisation strategy that effectively limits their range of movement (Sanchez-
Zuriaga et al. 2015; Sihvonen et al. 1991; Kuriyama et al. 2005). The Ahern et al. (1988) study
only recorded EMG from the local lumbar paraspinal musculature however, so their findings
could perhaps be explained by unrecorded compensatory activity of globally acting muscles,
or adaptations in movement patterns beyond the lumbar spine. On balance therefore, it was
anticipated that muscle activity (especially of muscles located anatomically close to the
motion segment involved i.e. LES and L2-L3 or LMU and L5-S1) would relate inversely to the
amount of angular rotation at these segments, and the following hypothesis was formulated.
Sub hypothesis
There will be an inverse relationship between muscle activity and the IV-RoMmax
No significant relationships were found however (Table 26), and so the hypothesis was
rejected. Therefore within the spectrum of normal physiological inter-vertebral movement
during flexion, mean TES, LES and LMU activity throughout the flexion cycle was not shown
to significantly influence angular range at any inter-vertebral level. This is in agreement with
others findings (Reeves et al. 2007), and suggests a large degree of complexity in terms of
segmental control in the lumbar region, and that the co-ordination of multiple muscles is
likely required in the control of healthy motion segments. The potential for such
relationships cannot be dismissed completely however, as only three muscle groups (all
paraspinal muscles) were investigated, and the correlations between LES and LMU activity
and L4-L5 IV-RoMmax did approach significance (Table 26). Future investigations using a
larger sample size or investigating other trunk muscles are therefore warranted. The analysis
of muscle activity ratios, and muscle activity changes during different stages (epochs) of the
flexion cycle did however reveal significant relationships, which are discussed below.

216
7.1.7.2 Relationships between muscle activity ratios and IV-RoMmax
It is suggested that in order to maintain the functional stability of the spine, there needs to
be an interplay between the local and global muscles (Hodges and Moseley 2003), and this
study’s results provides a degree of evidence to support this statement. Of particular
relevance was the ratio of LES/TES, which was shown to have a statistically significant
negative relationship with the range of motion at L4-L5 (Figure 63 and Table 30).
This ratio of lumbar erector spinae over thoracic erector spinae activity has been investigated
in several previous studies (Van Dieen et al. 2003; Reeves et al. 2006; Cholewicki and McGill
1996; Van den Hoorn et al. 2012). In a musculoskeletal trunk model based on the EMG data
collected from two healthy participants during various dynamic tasks, Cholewicki and McGill
(1996) suggested that preferential recruitment of the LES over the TES may be a strategy to
increase spinal stiffness (Cholewicki and McGill 1996). A further study comparing the muscle
recruitment patterns in healthy controls to those of LBP patients, found higher LES/TES ratios
in the latter (Van Dieen et al. 2003), which led to the conclusion that the differences found
between groups were likely to be an adaptation designed to enhance spinal stability. This
theory was further supported by Van Den Hoorn et al. (2012), who also demonstrated a
significantly higher LES/TES ratio in LBP patients during gait (Van Den Hoorn et al. 2012).
Reeves et al. (2006) also investigated this muscle activation imbalance in varsity athletes,
and while maintaining that there was indeed a relationship between muscle imbalance
between levels and LBP, also found that in some individuals with a history of LBP, TES activity
could be dominant (Reeves et al. 2006). The authors contend that this may be explained by
pathology, e.g. the CNS optimising activation to minimise compression, or by a difference in
muscle fibre types between groups in order to compensate for fatigue related pain (Reeves
et al. 2009). Interestingly, and with ramifications in terms of this study’s conclusions, they
also discuss the possibility of the reported activity patterns being the result of different types
of posture or lordosis, and that further studies may account for this effect.
On balance however, the weight of the previous literature suggested that an increase in the
LES/TES ratio acts to increase stability in the lumbar spine, and the following hypothesis was
formulated.
Sub hypothesis
There will be an inverse relationship between the LES/TES ratio and IV-RoMmax
217
Whilst the results of this study highlight that the ratio of LES/TES can vary in a population
with no long term history of low back pain, such variations would appear to relate to
differences in the inter-vertebral mechanics in such a population. A significant inverse
relationship between the LES/TES ratio and the IV-RoMmax of L4-5 was discovered, and so
the hypothesis was accepted. The relationship was not significant at other levels however,
which would suggest that the coordinated activity of local and global muscles (from the
electrodes sites selected) have an influence over L4-L5 IV-RoMmax specifically.
In a population of young and healthy adult males therefore, it has been shown that an
increase in the ratio of LES/TES provides increased restraint at the level of L4-L5. It could be
argued that L4-L5 is of particular clinical importance, as it is frequently cited as a suspected
pain generator, and a segment commonly targeted for surgical fusion (Le Huec et al. 2015).
The fact that this ratio appears to affect the stiffness of this particular segment in the absence
of pain is therefore of importance, as it provides a possible biomechanical reason for the
conflicted findings of previous studies (Van Dieen et al. 2003; Reeves et al. 2006; Lariviere et
al. 2000; Van Den Hoorn 2012), and should therefore be considered in addition to theories
of motor control responses to pain or dysfunction. For example, as discussed in the literature
review, studies that suggest that an increase in LES activity relative to TES is a strategy to
increase stiffness in LBP groups (Van Dieen et al. 2003), should also consider that individuals
with a high LES/TES ratio may either have a muscle recruitment strategy designed to stabilise
a specific segment (in this case L4-L5), or that there are a high proportion of individuals within
the sample with these normally occurring biomechanical behaviours (i.e. a smaller IV-
RoMmax at L4-L5 in association with an increased LES/TES ratio, that is not associated with
the LBP).
This study has consistently suggested that the IV-RoMmax of a single inter-vertebral segment
should not be considered in isolation, due to the demonstration of interactions with
biomechanical elements elsewhere in the lumbar spine. Therefore, whilst a high LES/TES
ratio restrains movement at L4-L5, it has also been shown that movement at this level is
inversely correlated with movement in the upper lumbars (L2-L3 and L3-L4), and so it would
be logical that a smaller LES/TES ratio (i.e. relatively more TES and less LES activity) would
relate to restricted movements in these segments. No such relationships were found
however, indicative of different stabilisation strategies relating to the upper lumbar levels.
218
7.1.7.3 Fibre types and sizes
When considering the possible roles (i.e. stabilisers, movement initiators or mechanisms for
sensory feedback) of globally (TES) and locally (LES and LMU) acting muscles, a further
consideration is the fibre type composition at these levels. In terms of both longissimus and
multifidus, it has been shown that fibres of both muscles are larger in the thoracic spine than
the lumbar (Mannion et al. 1997). This study found that TES typically contributed the least
(compared to other paraspinal levels) in terms of muscle activity during sagittal bending,
which is suggestive that either control of forward flexion is not its primary function, or that
TES is simply more efficient, possibly due to its relatively larger fibre size.
There is disagreement in the literature in terms of fibre type distribution in thoracic and
lumbar regions. Mannion et al. (1997) showed that there was no difference between regions
in terms of the 3 main fibre types (Type I, IIA and IIX), and concluded therefore that the
thoracic and lumbar regions are likely to have similar functions and act synergistically during
movements (Mannion et al. 1997). In an earlier fibre composition study however, Sirca and
Kostevc (1985) concluded that the thoracic region consists of a greater proportion of type I
fibres than the lumbar, suggesting a postural and movement stabilisation function (Sirca and
Kostevc 1985). A limitation of both studies was a relatively small population sample, and
therefore fibre type and size differences between regions remains incompletely understood.
The results from this study do suggest however that TES and LES have clearly different roles
during forward bending, which may also be reflected in their associated fibre types, as with
the findings of Sirca and Kostevc.
7.1.7.4 The exploration of other muscle activity ratios
Previous work has indicated a clear distinction between the kinematic behaviour of the
upper and lower sections of the lumbar spine (Pavlova et al. 2015; Mitchell et al. 2008), which
is in agreement with the compensatory relationship shown between the upper and lower
lumbar regions (i.e. L2-L4 IV-RoMmax inversely correlated with L4-L5 IV-RoMmax) shown in
the current study. It was anticipated therefore that there may be correlations between the
IV-RoMmax of upper and lower lumbar segments and the muscle activity ratio of LMU/LES
(LMU recorded adjacent to L5 in the lower lumbar spine, and LES adjacent to L2 in the upper).
Whilst the ratios of both LMU/LES and LMU/TES were explored, neither demonstrated any
significant relationship with IV-RoMmax at any level, and so any interactions in terms of a
synergistic stabilising function between these groups is not clear. Whilst it has been
suggested that LMU and LES have similar functional roles (Stokes et al. 2003) which would
make compensatory behaviours more likely, the current findings would suggest that LMU is
219
likely to have a fundamentally different role to the thoracic and lumbar longissimus muscles,
and functions independently to them. The fact that no significant relationships were found
is perhaps also indicative of the different control strategies required for L4-L5 and L5-S1, as
unlike L2-L3 and L3-L4, the two lower lumbar segments do not function in a uniform manner,
and so the specific role of the superficial LMU appears more closely linked to the movement
of L5-S1. Indeed, the results would suggest that LMU activity has an important role in the
segmental control of movement at L5-S1 specifically, which is discussed further in a following
section (Section 7.1.7.9). Future studies investigating the potential role of upper vs lower
lumbar muscles in inter-vertebral movement control, may therefore benefit from the use of
electrode array systems that can record from multiple adjacent muscle levels, to ensure that
significant relationships are not missed.
In addition, given that the larger the range of ratio values within a group the more likely it is
that associations will be found, ratio ranges were compared between muscle pairs. The
range in values for both LMU/TES and LMU/LES ratios were found to be greater than the
range for LES/TES, and so a relatively smaller range was not a reason for the absence of
relationships.
7.1.7.5 The importance of consistent electrode positioning
The lack of correlations between IV-RoMmax and LMU/TES may partially explain why Reeves
et al. (2006) and Van Dieen et al. (2003) showed contrasting results in terms of relating the
lumbar ES/Thoracic ES ratio to LBP. The electrode positions used by Reeves et al. (2006) were
effectively the same as this study’s LMU and TES sites, which did not reveal any significant
relationships. Van Dieen et al. on the other hand used electrode positions more similar to
the LES and TES sites used in this study, providing a possible reason for their conflicting
results. Indeed, there is disagreement in the literature over which muscles comprise local
and globally acting groups. This study has interpreted LES as a locally acting muscle in line
with Bergmark et al’s 1989 original paper, and other subsequent studies (Bradl et al. 2005;
O'sullivan 2000; Van Dieen 2003). Although the lumbar longissimus has both segmental and
regional attachments, some authors define the muscle as globally acting (Kim et al. 2015),
which will have consequences for the interpretation of these studies due to conclusions
based on groupings (i.e. muscle allocation to local or global groups) that are not consistent
throughout the literature. Differences between methodologies are especially common in
EMG based studies, and this highlights the difficulty of comparing studies that use different
protocols, and why metanalysis of study findings in this area is uncommon. Further universal
standardisation of these elements is therefore recommended.
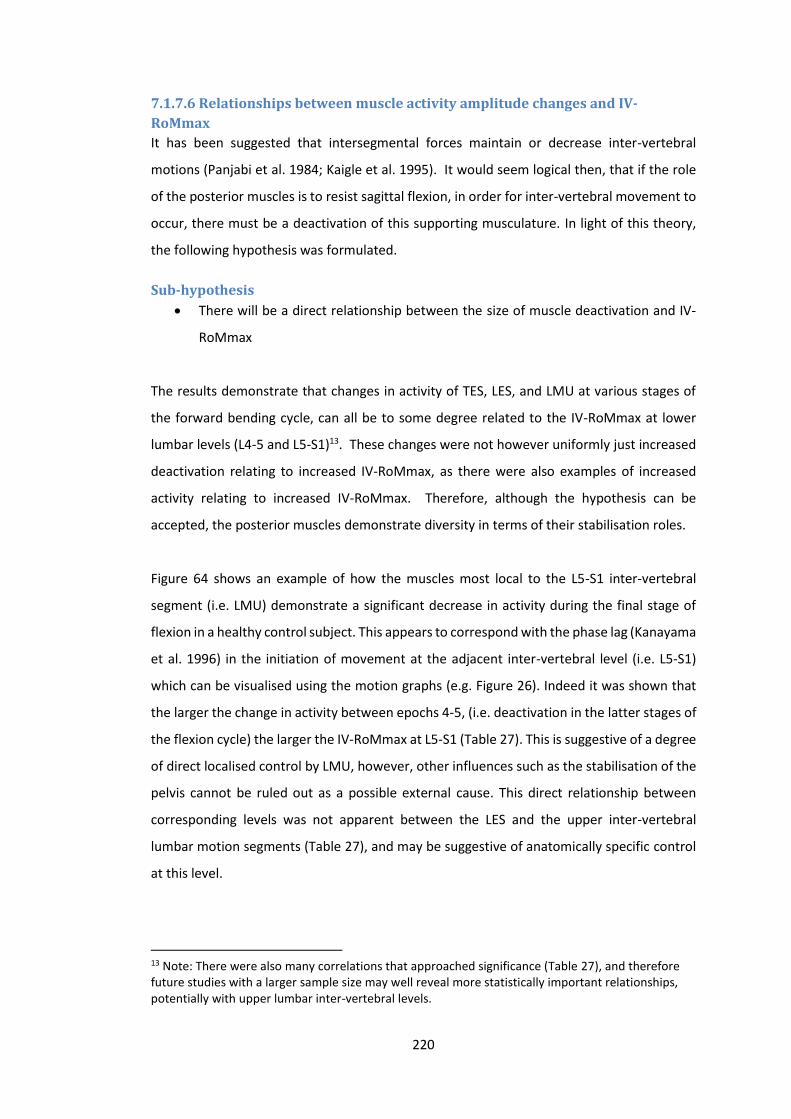
220
7.1.7.6 Relationships between muscle activity amplitude changes and IV-
RoMmax
It has been suggested that intersegmental forces maintain or decrease inter-vertebral
motions (Panjabi et al. 1984; Kaigle et al. 1995). It would seem logical then, that if the role
of the posterior muscles is to resist sagittal flexion, in order for inter-vertebral movement to
occur, there must be a deactivation of this supporting musculature. In light of this theory,
the following hypothesis was formulated.
Sub-hypothesis
There will be a direct relationship between the size of muscle deactivation and IV-
RoMmax
The results demonstrate that changes in activity of TES, LES, and LMU at various stages of
the forward bending cycle, can all be to some degree related to the IV-RoMmax at lower
lumbar levels (L4-5 and L5-S1)13. These changes were not however uniformly just increased
deactivation relating to increased IV-RoMmax, as there were also examples of increased
activity relating to increased IV-RoMmax. Therefore, although the hypothesis can be
accepted, the posterior muscles demonstrate diversity in terms of their stabilisation roles.
Figure 64 shows an example of how the muscles most local to the L5-S1 inter-vertebral
segment (i.e. LMU) demonstrate a significant decrease in activity during the final stage of
flexion in a healthy control subject. This appears to correspond with the phase lag (Kanayama
et al. 1996) in the initiation of movement at the adjacent inter-vertebral level (i.e. L5-S1)
which can be visualised using the motion graphs (e.g. Figure 26). Indeed it was shown that
the larger the change in activity between epochs 4-5, (i.e. deactivation in the latter stages of
the flexion cycle) the larger the IV-RoMmax at L5-S1 (Table 27). This is suggestive of a degree
of direct localised control by LMU, however, other influences such as the stabilisation of the
pelvis cannot be ruled out as a possible external cause. This direct relationship between
corresponding levels was not apparent between the LES and the upper inter-vertebral
lumbar motion segments (Table 27), and may be suggestive of anatomically specific control
at this level.
13 Note: There were also many correlations that approached significance (Table 27), and therefore future studies with a larger sample size may well reveal more statistically important relationships, potentially with upper lumbar inter-vertebral levels.
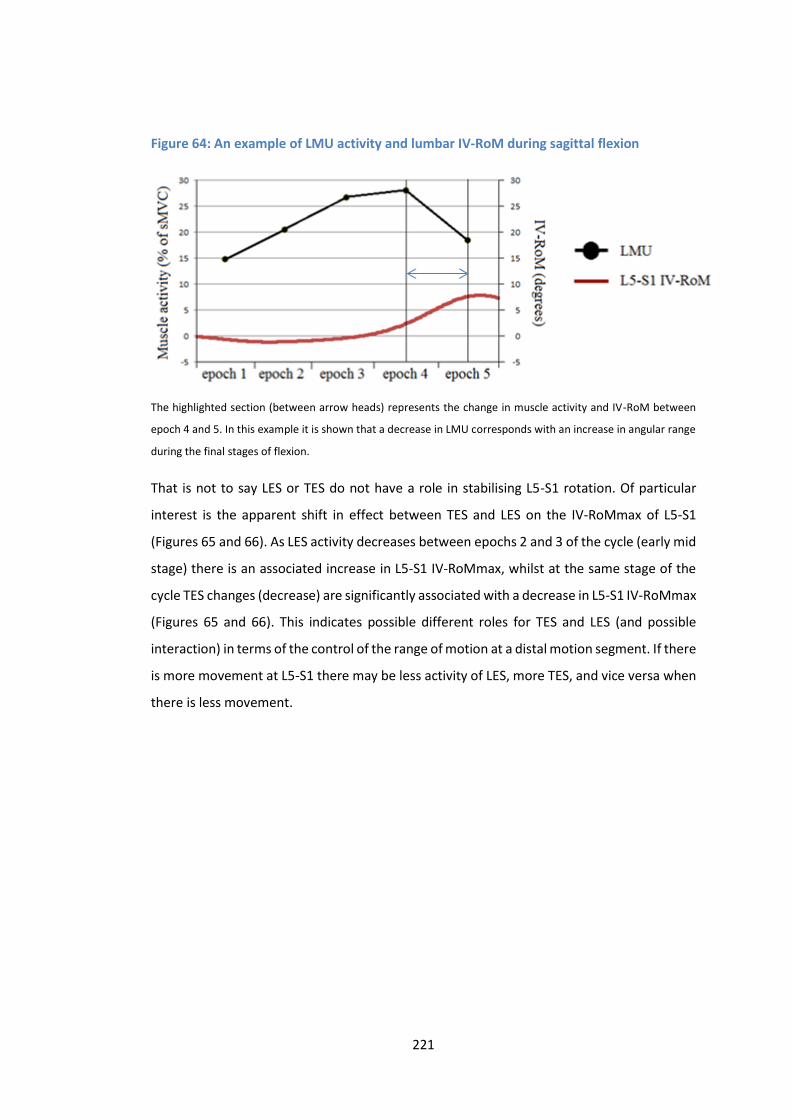
221
Figure 64: An example of LMU activity and lumbar IV-RoM during sagittal flexion
The highlighted section (between arrow heads) represents the change in muscle activity and IV-RoM between
epoch 4 and 5. In this example it is shown that a decrease in LMU corresponds with an increase in angular range
during the final stages of flexion.
That is not to say LES or TES do not have a role in stabilising L5-S1 rotation. Of particular
interest is the apparent shift in effect between TES and LES on the IV-RoMmax of L5-S1
(Figures 65 and 66). As LES activity decreases between epochs 2 and 3 of the cycle (early mid
stage) there is an associated increase in L5-S1 IV-RoMmax, whilst at the same stage of the
cycle TES changes (decrease) are significantly associated with a decrease in L5-S1 IV-RoMmax
(Figures 65 and 66). This indicates possible different roles for TES and LES (and possible
interaction) in terms of the control of the range of motion at a distal motion segment. If there
is more movement at L5-S1 there may be less activity of LES, more TES, and vice versa when
there is less movement.
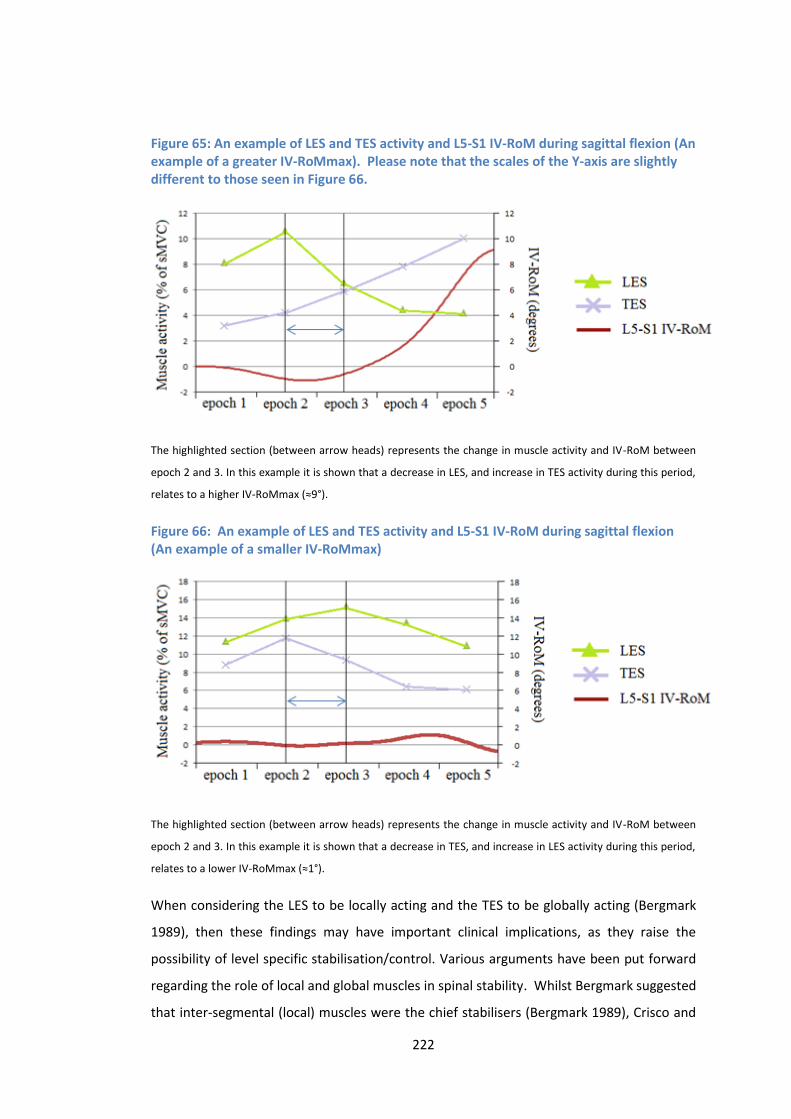
222
Figure 65: An example of LES and TES activity and L5-S1 IV-RoM during sagittal flexion (An example of a greater IV-RoMmax). Please note that the scales of the Y-axis are slightly different to those seen in Figure 66.
The highlighted section (between arrow heads) represents the change in muscle activity and IV-RoM between
epoch 2 and 3. In this example it is shown that a decrease in LES, and increase in TES activity during this period,
relates to a higher IV-RoMmax (≈9°).
Figure 66: An example of LES and TES activity and L5-S1 IV-RoM during sagittal flexion (An example of a smaller IV-RoMmax)
The highlighted section (between arrow heads) represents the change in muscle activity and IV-RoM between
epoch 2 and 3. In this example it is shown that a decrease in TES, and increase in LES activity during this period,
relates to a lower IV-RoMmax (≈1°).
When considering the LES to be locally acting and the TES to be globally acting (Bergmark
1989), then these findings may have important clinical implications, as they raise the
possibility of level specific stabilisation/control. Various arguments have been put forward
regarding the role of local and global muscles in spinal stability. Whilst Bergmark suggested
that inter-segmental (local) muscles were the chief stabilisers (Bergmark 1989), Crisco and
223
Panjabi concluded that the larger multi-segmental (global) muscles were more efficient
(Crisco and Panjabi 1991), however the exact function of each muscle group remains unclear.
Indeed, in a study investigating the relative contribution of different trunk muscles to lumbar
stability, Cholewicki and Van Vliet concluded that whilst inter-segmental and multi-
segmental paraspinals had the greatest effect on stabilisation compared to other muscles
(i.e. psoas and rectus abdominis), no distinction could be made between the two (Cholewicki
and Van Vliet 2002). The results of the current study however, have for the first time
provided evidence of not only a distinctive, but possibly integrated functions of these
muscles.
The relationship between changes in TES and LES activity between epochs 2-3 and IV-
RoMmax of L5-S1 is of particular interest (Table 27). As un-checked co-contraction is
associated with increased spinal loading (Gardner-Morse et al. 1998), it could be suggested
that in the presence of increased LES activity during epoch 2-3, the concurrent decrease in
TES is a mechanism to avoid excessive spinal loading. The activity changes in these muscles
however correlate with the movement of a distal segment (i.e. L5-S1), and such changes
occur most frequently before the onset of L5-S1 movement (Figures 65 and 66). It would
seem therefore that a strategy to control movement at the very base of the spine, is to pre-
emptively control the motion of motion segments above, or put another way, lower level
movement is partially dependent on the kinematics occurring superiorly, and so the
correlation may not relate directly to balancing compressive forces acting on L5-S1. No
relationships were found between TES and LES changes during these epochs (i.e. epochs 2-
3) and the IV-RoMmax at L4-5, which may have been expected given the relationship of this
level with the overall ratio of LES/TES during flexion, and so this correlation cannot be
explained solely in terms of epochs 2-3. Indeed, although movement onset patterns do vary
somewhat, with examples of L2-3, L3-4 and L4-5 all moving first during forward bending,
there are no examples of L5-S1 moving first, the segment typically last to begin motion
(Appendix M). This suggests that regardless of the movement strategy, L5-S1 is usually last
to move or prevented from motion until the latter stages of flexion. It would seem that this
motion segment is protected from excessive movement by two mechanisms. Activity of LES
during the early-mid stages of flexion (potentially also involved in controlling the movement
of segments above), and activity of locally acting LMU during the latter stages.
7.1.7.7 Motor control and segmental interaction
The idea that the control of superior motion segments can effectively influence the
movement of a more distal segment is demonstrated in other examples. A decrease in LES
224
activity in the early stages of flexion (i.e. between epochs 1-2) relates to an increase in L4-L5
IV-RoMmax, and a decrease in TES activity during the same stage relates to an increase in L2-
L3 IV-RoMmax (Table 27). These examples highlight the fact that muscle activity occurring
sometimes multiple levels above an inter-vertebral level of interest, can relate to its motion.
In all of the above examples, anatomically it is possible for the proximal muscles to have a
direct influence on the segment itself, however the delay between muscle activity and the
onset of vertebral movement suggests that for these muscles (LES and TES), the strategy
involves control of superior segments, or at least segments initiating movement before
them. The LMU however has been shown to have a more direct influence over the local
segment of L5-S1, as the degree of LMU deactivation is associated with L5-S1 IV-RoMmax
(Table 27), suggestive of the fact that the locally acting superficial multifidus has a different
role to both the locally and globally acting longissimus.
7.1.7.8 A stabilisation strategy of the healthy lumbar spine
“Under dynamic loading conditions, trunk muscles must be recruited in appropriate sequence and appropriate strength to support loads and maintain stability” (Cholewicki and Van Vliet 2002).
The patterns observed can be interpreted in terms of optimisation of spinal control.
Returning to the concept of co-contraction, it is a strategy that balances increased stability
at the cost of increased spinal loading (Granata and Marras 2000; 2001; Gardner Morse and
Stokes 1998), and increased shear forces (Marras 2001). The principles of co-contraction are
frequently associated with agonist and antagonist muscle groups, but can equally be applied
to other muscle synergies (e.g. different paraspinal muscles). During forward bending the
cumulative effect of a linear increase in both local and globally acting muscle activity, whilst
increasing stability, would also increase spinal loading, and be costly in terms of energy
expenditure. It is likely therefore that the motor control system adapts its strategy in terms
of local and global muscle activity, dependent on the biomechanics of the individual. The
direct interaction between the two such groups (i.e. LES and TES) has never been shown
before during a dynamic task in vivo.
If there is a system requirement to restrict movement at L5-S1 (i.e. segmental instability at
this level), then an increase in LES activity and a decrease in TES is a possible strategy.
Whether or not this is the most efficient strategy in terms of the metabolic demands placed
on the muscles (Salmons and Henriksson 1981) is not known, but it may be an important
enough requirement to justify a sub-optimal strategy, contradicting the view that specific
225
inter-vertebral motion is not important due to a likely ‘approximate’ motor control strategy
(Cholewicki and McGill 1996). This relationship shows a possible inter-play between local
and global muscles at a specific stage of dynamic activity, and is in agreement with Cholewicki
and Van Vliet (2002), who suggested that stability depends on the relative activation of
multiple trunk muscles (Cholewicki and Vliet (2002). They also suggested that no particular
muscle can be identified as a chief stabiliser, however it can be extrapolated from this study
that if restriction of angular rotation at L4-L5 or L5-S1 is the goal of a muscle activity strategy
(for example to prevent pain associated with excessive movement at these levels), then an
increased activation of LES may be of key importance during forward bending (in association
with changes in activation of other muscles). The specific muscles that are key to
stabilisation may depend directly on the requirements of specific inter-vertebral levels
during a given task. The collection of further normative data during a range of tasks is
therefore required.
7.1.7.9 LMU control of L5-S1 IV-RoMmax
Visual inspection of the EMG and motion graphs (Appendices L and M) suggested that the
deactivation of LMU in the final stages of flexion would correlate with the IV-RoMmax of L5-
S1. This was supported by the correlation found between LMU deactivation between epochs
4-5 and the IV-RoMmax at this level (Table 27). This relationship strongly supports the theory
that locally acting muscles stabilise at a segmental level (Bergmark 1989), and that the
degree of deactivation correlates with the concurrent sagittal angular rotation achieved.
This is the first time that this has been shown in vivo, and provides evidence that the degree
of LMU muscle activity change relates directly to the sagittal rotation of L5-S1. This therefore
suggests that the functional capacity of LMU would be of possible importance, if the
movement of L5-S1 were a clinical concern.
It is also clear from the combined motion graphs that LMU deactivation begins well before
maximum vertebral rotation of L5-S1 is reached (indeed it is possible that true IV-RoMmax
of L5-S1 is not even reached during the 60° of bending). This therefore raises questions over
the current theories regarding the mechanism of the FRP (Section 2.3.6), and the
methodologies used to examine it. It has been suggested that deactivation occurs when the
bending moment is countered by either sufficient tension being reached in the passive
structures (Floyd and Silver 1955), the activity of other muscle(s) (e.g. Quadratus lumborum
or the deep lateral ES) (Andersson et al. 1996), or the passive resistance of myoelectrically
silent stretched muscles (Adams et al. 1980). In the case of LMU, activation begins with the
onset forward bending, and deactivation begins prior or during the early stages of L5-S1
226
rotation, certainly before most of the rotation has been completed. Therefore questions
arise over how feedback mechanisms are involved in the initiation and deactivation of LMU
muscle activity during normal movements.
7.1.7.10 Could the thoracolumbar fascia (TLF) have a role in sensory feedback?
It appears in the case of LMU, that its activation does not fit the ligamento-muscular
synergism model (Solomonow et al. 1998), as the mechanoreceptors in passive tissues are
unlikely to be stimulated prior to movement of L5-S1 (Indahl 1997; Indahl et al. 1995;
Solomonow et al. 1998; Stubbs et al. 1998), and if they are involved, they must have a low
threshold for activation. Indeed, it has been suggested that such mechanisms are actually
most likely to be detectors of end ranges of motion (Proske and Gandevia 2009). This would
indicate that the dominant neural control strategy is either feedforward governance (Hodges
2001; Hodges et al. 2013; Hodges and Richardson 1999), or that feedback mechanisms are
initiated by the passive tissue stress in superior motion segments. An alternative theory was
proposed by Willard et al. (2012), who suggested that due to the close proximity of the
passive structures (i.e. facet capsules, ligaments and discs) to the axis of the spine, large
rotational movements would be required to stimulate the mechanoreceptors within them.
The TLF however, as a more superficial structure would require much less inter-vertebral
movement to invoke stretch stimulation, which they proposed as a possible alternative
feedback mechanism (Willard et al. 2012). This concept could explain the early activation of
both LES and LMU muscles observed during flexion in this study, although it is not yet
established whether the TLF has the proprioceptive capacity to support such a function
(Willard et al. 2012).
7.1.7.11 Is LMU’s primary role to restrain forward flexion?
The multifidus has been purported to play a primary role in lumbar spinal proprioception
(Bakker and Richmond 1982; Nitz and Peck 1986; Richmond and Bakker 1982). The
relationship between LMU deactivation and L5-S1 IV-RoMmax shown in this study however,
would suggest that the superficial LMU also plays an important physical role in restraining
inter-vertebral movement, and as such is not solely a proprioceptive structure. Indeed, the
Richmond and Bakker studies were conducted with feline specimens (Richmond and Bakker
1982, Bakker and Richmond 1982), and the Nitz and Peck (1985) study based their findings
on a small sample of 2 adult cadavars and three 36 week old foetuses (Nitz and Peck 1985),
and so their relevance could be questioned in relation to a sample of healthy males. The
potentially different roles of the superficial and deep multifidus could also be a
227
consideration, as it is not fully known how functional roles may vary between locations
(Macdonald et al. 2006).
The relationship demonstrated between LMU deactivation during epochs 4-5 and L5-S1 is
the first time that the degree of muscle deactivation has been directly correlated directly
with a concurrent increase in IV-RoMmax in vivo. This supports the theory that locally acting
muscles stabilise at a segmental level (Bergmark 1989), and suggests that the functional
capacity of LMU would be of particular importance if the movement of L5-S1 were a clinical
concern. The findings also suggest that the superficial LMU plays an important role in
restraining the inter-vertebral movement at L5-S1, and is less likely to have a significant
proprioceptive function at this level.
7.1.7.12 Understanding of the roles that TES, LES and LMU have in terms of
lumbar stabilisation, can be enhanced by collecting concurrent inter-vertebral
and multiple muscle data
In terms of paraspinal muscle deactivation, it has been suggested that sensory feedback
mechanisms initiate paraspinal muscle deactivation at approximately 80% of the range of
joint motion (Kaigle et al. 1998). In agreement, a number of other FRP based studies have
suggested that the onset of muscle deactivation corresponds with the near completion of
sagittal bending (Floyd and Silver 1951; Kippers and Parker 1984). As described above
however, this study shows that LMU deactivation begins prior to, or concurrently with L5-S1
rotation which would suggest that either the deactivation mechanism is not initiated by
changes associated with the completion of L5-S1 rotation, or that high threshold
mechanoreceptors do not have a significant role.
This highlights a common limitation of many FRP related studies, in that they use gross
measurements, which typically vary between studies, and will usually record EMG from a
single muscle, typically longissimus adjacent to L3 (Kippers and Parker 1984; Gracovetsky et
al. 1989; Steventon and Ng 1995; Sarti et al. 2001; Solomonow et al. 2003; Olson et al. 2004;
Descareaux et al. 2010) (Table 2). This means that no conclusions can be truly made about
the potential sensory feedback from inter-vertebral movements, and that no distinction is
usually made between different muscles (e.g. TES/LES/LMU). Indeed, even when inter-
vertebral information has been collected, the data were pooled from several levels (Kaigle
et al. 1998). To date, no other study has investigated the relationship between IV-RoM and
the deactivation of specific muscle groups (e.g. local or globally acting paraspinals), which is
desirable given the current need for better understanding of neural feedback control
mechanisms. It appears likely that muscle deactivation mechanisms may be different
228
between LES and LMU muscles, and an investigation into the precise timings of LES and LMU
deactivation in relation to temporal kinematic parameters (e.g. movement onset, peak laxity,
and IV-RoMmax) are warranted. This would be feasible using this study’s data set, and is
therefore an opportunity for future work.
7.1.8 Conclusions It is suggested that achieving sufficient spinal stability is a moving target, and that no single
muscle can therefore be considered the best stabiliser, as the most important muscle is
transient dependent on the task (McGill et al. 2003). The current study’s results provide a
demonstration of this concept in action during the task of forward bending. Whilst effect
sizes are small, inter-vertebral movements have been shown to be influenced by specific
muscle activity strategies. Of particular interest was the correlation between decreased LMU
and increased IV-RoMmax at L5-S1 in the latter stages of flexion, the apparent co-
dependency between LES and TES during early to mid-flexion, and the effect of the LES/TES
ratio on the IV-RoMmax at L4-L5.
In a LBP free population sample, it may be assumed that such relationships do not represent
adaptations to pain. However, that is not to say that particular activity patterns and thus
kinematic behaviours may not be risk factors for future LBP episodes. These relationships,
when combined with other influencing factors, may therefore be important when these
specific inter-vertebral levels are considered to be sources of pain generation and when
considering rehabilitative or surgical planning.
229
Chapter 8: Contributions to knowledge
8.1 Introduction The following chapter outlines in detail the areas where this body of work has made a
significant original contribution to knowledge.
8.1.1: Contemporaneous QF and sEMG analysis
This study required the development of a protocol that would allow the concurrent
investigation of lumbar inter-vertebral motion and muscle activity during movement in the
sagittal plane. The resulting protocol combined the use of QF and sEMG for the first time,
providing synchronised continuous inter-vertebral kinematic and muscle activity data, an
innovation that enabled the investigation of relationships between inter-vertebral level
parameters that has not previously been possible.
8.1.2: Observer repeatability of QF weight-bearing IV-RoMmax and initial
attainment rate measurements
The QF technique produced IV-RoMmax and initial attainment rate measurements, with
good repeatability. Fluoroscopic techniques have now been shown to be capable of
producing repeatable IV-RoM measurements during weight-bearing examinations, at all
levels of the lumbar spine (other than L1-L2). This adds to the previous body of knowledge
that has shown good repeatability during recumbent QF examinations (Mellor F.E. et al.
2014).
This was the first time that the repeatability of the initial attainment rate measurement has
ever been investigated during weight-bearing QF imaging. The results suggest that the
measurements have acceptable reliability and agreement, which support the use of this
parameter within the current study. Further investigations are required to establish whether
or not initial attainment rate is representative of the neutral zone during inter-vertebral
rotation in the sagittal plane (Breen et al. 2015), however as a parameter of in vivo motion
segment laxity, it has shown its potential for use in future biomechanical studies.
8.1.3: Intra-subject repeatability of RMS sEMG amplitude measurements
(highlighting a benefit of the standardised study protocol)
The repeatability of the sEMG amplitude measurements was also shown to be acceptable,
which is notable considering the inherent variability of EMG signal recordings (Lehman and
McGill 1999). This was the first time EMG has ever been recorded during motion using the
standardised QF motion frame apparatus, and it is suggested that the good agreement and
reliability of measurements was in part due to the standardisation of the participant’s
230
movement. The standardisation of the QF examination (Breen et al. 2012) resulted in
measurements that were less influenced by variations in how participants moved, and the
velocity and range over which they did so. It is likely that this standardisation process had a
positive influence on the repeatability of sEMG amplitude measurements, which affords
improved comparisons between and within individuals. It is therefore recommended that
standardised movement protocols are incorporated into future dynamic EMG studies.
8.1.4: Relationships between lordosis and the IV-RoMmax
This is the first time that lumbar lordosis has been shown to relate to the inter-vertebral
range of specific motion segments in healthy controls. This is a potentially important finding
as it shows how an individual’s spinal curvature in a neutral position can influence
subsequent inter-vertebral movement patterns during forward bending. The study showed
specifically that in more lordotic spines, greater inter-vertebral rotation will occur at L2-L3,
whereas in individuals with a flatter lordosis, more inter-vertebral rotation will occur at L4-
L5. This will have consequences in terms of the stress placed on specific motion segments,
which warrants further exploration, both in terms of risk factors for the development of LBP,
and as aggravating factors in existing CNLBP populations.
8.1.5: Inter-level relationships in terms of IV-RoMmax
The study demonstrates a compensation mechanism between upper and lower regions of
the lumbar spine in healthy controls. This supports the findings of Mitchell et al. (2008) who
showed an inverse relationship between upper and lower lumbar regions (Mitchell et al.
2008), however this is the first time that relationships between specific inter-vertebral levels
(i.e. the direct relationship between L2-3 and L3-4 and the inverse relationship between L2-
3 and L4-5 IV-RoMmax) have been found. These findings highlight the existence of segmental
interactions in terms of IV-ROM, which may be a mechanism of retaining an optimal sagittal
balance (Rothenfluh et al. 2015) in healthy spines. This information is of importance to future
research, when the stability of specific segments is of interest. As interactions between
levels are evident, the results again suggest that individual segments should not be
considered in isolation.
Due to the heterogeneity of IV-RoM in LBP populations, its importance as an indicator of LBP
has been questioned (Mellor 2014). However, the demonstration of interactions between
levels represents a possible new approach in terms of investigating relationships between
IV-RoM and LBP, which may be of particular use when exploring the biomechanical basis of
pre-determined CNSLBP sub-groups (O’Sullivan et al. 2005).

231
8.1.6: Relationships between initial attainment rate and IV-RoMmax
This is the first time initial attainment rate has been investigated during a dynamic weight-
bearing activity. The parameter therefore represents motion segment laxity whilst under the
influence of trunk muscle contraction. The direct relationship found between the IV-
RoMmax at L4-5 and the initial attainment rate at L4-5 is the first time this has been shown
in vivo, and suggests that increased range relates to an increased segmental laxity, and
therefore decreased stiffness. This relationship was only found at this level however and so
cannot be considered as a uniform behaviour throughout the lumbar spine. This highlights
the benefit of inter-vertebral information, as assumptions regarding uniform behaviour of
motion segments informing spinal models are not accurate (Arjmand et al. 2010).
8.1.7: A relationship between the ratio of LES/TES muscle activity and the IV-
RoMmax of L4-L5
The results show that the ratio of LES/TES can vary in a population with no history of low
back pain, and relate to variations in inter-vertebral biomechanics. In healthy males, it has
been shown that an increase in the ratio of LES/TES provides increased restraint at the level
of L4-L5 during forward bending, demonstrating for the first time how coordinated changes
in the activity of locally and globally acting paraspinal muscle groups can influence the
movement of a specific lumbar motion segment. This adds detailed inter-vertebral level
information, to the body of work that considers this ratio as a mechanism of altering the
stiffness of the lumbar spine (Van Dieen et al. 2003; Reeves et al. 2006; Van Den Hoorn et al.
2012; Lariviere et al. 2002).
8.1.8: Relationships between muscle activity changes during the flexion cycle and
the IV-RoMmax of the lower lumbar motion segments (i.e. L4-L5 and L5-S1).
8.1.8.1 TES and LES
Whilst many studies have investigated muscle activation patterns during trunk flexion, the
majority have focussed on either responses to perturbation around the neutral position, or
the FRP near the end range of movement. To date, less emphasis has been placed on
changes in recruitment throughout the entire flexion movement cycle, but the results of the
current study have shown that doing so is of value.
This study has shown that interactions between globally and locally acting muscles (i.e. TES
and LES) can influence the range of motion at a distal motion segment (i.e. L5-S1), in that
more movement at L5-S1 correlates with less activity of LES, more of TES, and vice versa. This

232
indicates different roles for TES and LES in terms of the control of a specific motion segment,
which is in agreement with some of the literature (Bergmark 1989, O’Sullivan et al. 2000).
The relationship shown may therefore represent a mechanism to optimise spinal loading
conditions (Granata and Marras 2000), as the increased LES activity during epoch 2-3
coincides with a decrease in TES activity, a strategy that avoids excessive spinal compression.
This is the first time these relationships have been demonstrated in vivo, and shows that
activity changes in superior muscles (i.e. TES at T9 and LES at L2) correlate with the IV-
RoMmax of a distal segment (i.e. L5-S1). As these changes occur before the onset of L5-S1
movement (Figures 65 and 66), it is likely that pre-emptive control of motion segments above
directly influences the movement of L5-S1.
In agreement with Cholewicki and Van Vliet (2002) who suggested that stability depends on
the relative activation of multiple trunk muscles (Cholewicki and Vliet (2002), the
relationships show the inter-play between local and global muscles at a specific stage of
dynamic activity. In disagreement with their conclusions however, the current study findings
suggest that specific muscles may be of particular importance in terms of individual inter-
vertebral level stabilisation. Indeed, a relative increased activation of LES over TES during the
flexion movement has been shown to directly affect the restraint of L4-L5, and an increase
in LES activation during mid flexion (i.e. epochs 2-3) has been shown to directly affect the
restraint of L5-S1. These examples, and the relationship between LMU and L5-S1 IV-RoMmax
(discussed below), are evidence of previously undemonstrated muscle specific inter-
vertebral control strategies. All of which have potential for further exploration.
8.1.8.2 LMU
The relationship demonstrated between LMU deactivation during epochs 4-5 and L5-S1 is
the first time that the degree of muscle deactivation has been correlated directly with a
concurrent increase in IV-RoMmax in vivo. This supports the theory that locally acting
muscles stabilise at a segmental level (Bergmark 1989), and suggests that the functional
capacity of LMU would be of particular importance if the movement of L5-S1 were a clinical
concern. The findings also suggest that the superficial LMU plays an important role in
restraining the inter-vertebral movement at L5-S1, and is less likely to have a significant
proprioceptive function at this level.
8.1.9: Relationships between initial attainment rate and muscle activity changes
Further analysis of the study data (Section 9.10) revealed significant relationships between
initial attainment rate at L2-L3 and L3-L4 and an increase in TES muscle activity during epoch

233
2-3, and that there was a trend between an increase in L4-L5 initial attainment rate and
increased LES activity during the same period. This is the first time such relationships have
been shown, and they suggest that motor control strategies during segmental laxity may be
different between the upper and lower lumbar segments.
8.1.10: A relationship between lordosis and the initial attainment rate of L4-L5
Further analysis of the study data also revealed an inverse relationship between lordosis and
L4-L5 initial attainment rate. Therefore as lordosis increases, there is either an increase in
stiffness at L4-L5, a decrease in bending moment at that level, or both. This again, is the first
time correlations have been shown between these parameters. Such relationships further
our current understanding of normal biomechanical interactions, and also warrant further
exploration in future investigations.
8.2 Summary The demonstration that weight-bearing inter-vertebral and muscle activity information can
be reliably collected concurrently in vivo, is an important advancement in spinal
biomechanics. It represents a progression from traditional region-based kinematic
measurements, which when combined with EMG recordings has provided a level of insight
into the interactions between the active, passive and neural control systems that has not
previously been achieved.
This study has also demonstrated that a spectrum of lordosis, kinematic and muscle activity
measurements exists in a population of healthy controls, and that changes in these
parameters relate to the IV-RoMmax of specific inter-vertebral levels. This is an important
consideration for future NSLBP research, as any attempts to associate these parameters with
LBP, should also now take in to account the normal biomechanical behaviour of an
individual’s lumbar spine. Indeed, consideration should also be given to the interaction that
exists between such parameters, and inter-vertebral levels should not be considered in
isolation of the behaviour of the rest of the lumbar spine.
Whilst these findings may potentially be of valuable clinical significance, further normative
studies incorporating larger sample sizes are required. The limitations and potential routes
forward for this protocol were explored, underlining the large scope for further work.
The following chapter discusses the relevance of these findings to the broader aspects of
biomechanical research.

234
Chapter 9: Discussion
9.1 Introduction The general purpose of this thesis was to investigate the relationships between kinematic
variables, muscle activity variables, lordosis and IV-RoMmax during weight-bearing sagittal
flexion. The agreement and reliability of IV-RoMmax, initial attainment rate, and muscle
activity amplitude measurements were shown to be acceptable (Chapter 5), and moderate
to strong correlations were discovered (Chapters 6 and 7), providing a valuable insight into
the normal biomechanics of the lumbar spine. It should be noted however that the results
are only generalizable to young, healthy adult males, which should be considered in their
interpretation. This chapter considers the implications of these findings to the field of spinal
biomechanics and addresses the study’s limitations.
9.2 Lumbar biomechanics and back pain: cause or effect?
The ability to directly link CNSLBP with a mechanical cause has eluded the research
community despite altered mechanics intuitively being related. As previously described, the
problem is partially due to the heterogeneity in both healthy and NSLBP populations in terms
of their inter-vertebral movement and muscle activity behaviours. Indeed, it has been
suggested that the measurements of one small group of LBP participants within a
heterogeneous LBP group can be counterbalanced by opposing results from other sub-
groups (Van Dillen et al. 2003), perpetuating an inability to uncover a clear cause and effect.
Referring back to the examples in the background section (Table 1), the contrasting results
found between studies that attempt to identify parameters associated with LBP, may be
partially explained by the normal biomechanical relationships shown in the current study.
The relationships show that specific kinematic and muscle activity variables can influence the
degree of inter-vertebral rotation in healthy participants, and so corresponding behaviours
found in the biomechanics of NSLBP groups may in some way be related to the pain
production mechanism, or can be considered as normal biomechanical variations that are
not necessarily involved. If such mechanical behaviours are associated with LBP, there are
two ways they could be involved. 1. They somehow predispose to pain, 2. They are a
consequence of pain (i.e. an adaptation to avoid pain or a mechanism to stabilise the spine).
Using muscle activation as an example, Sanchez-Zuriaga et al. 2015 when comparing muscle
activity between healthy controls and patients with recurrent LBP (during a pain free period),
suggested that an increase in ES muscle activity associated with the LBP group may be a
mechanism to increase stability. Their study recorded ES activity adjacent to L3 and not L2
235
(as in this study), however their recordings also represent activity of the lumbar longissimus,
and the authors proposed that this increase in activity may be a compensation mechanism
for damaged spinal structures in the LBP group (Sanchez-Zuriaga et al. 2015). The findings
of the current study however show that an increase in LES activity can also relate (although
the relationship did not quite reach significance) to a decrease in L4-L5 IV-RoMmax (Table
26), suggestive that either a normal motor control strategy is more common in the Sanchez-
Zuriaga et al. study LBP group, or that the activity relates to a physiological requirement for
increased restraint at L4-L5. The same can be said regarding changes in the LES/TES ratio, as
normal changes in this ratio also relate to the IV-RoMmax of L4-L5. Therefore the motor
control strategies observed by Van Dieen et al. 2003 (i.e. the LES/TES ratio increases in order
to stabilise the lumbar spines of the LBP group), could also be explained by normal
biomechanical behaviours, possibly unrelated to the LBP (i.e. the LBP group had a high
proportion of participants who did not move much at L4-L5). In both cases however, it is
possible that in the LBP groups, the stabilisation of L4-L5 is in some way related to the LBP.
If inter-vertebral measurement techniques can be applied in such studies, there is an
opportunity to investigate these kinds of level-specific mechanical relationships. Similar
arguments could also be made for the kinematic variables studied and lordosis, underlining
the potential for future inter-vertebral level based research.
9.3 Muscle activity patterns and pain predisposition
The co-dependent nature of lumbar biomechanics has been shown by this study to
accommodate certain parameter excesses through adaptations by others. These interactions
enable the healthy lumbar spine to retain function whilst performing tasks such as forward
flexion without pain, but whether these adaptations are sustainable, or may themselves
eventually lead to injury or pain cannot be extrapolated. In the current study, no participants
had LBP prior to or during the investigation, and so it may be assumed that the muscle
activity behaviours found were not influenced by pain. In a study of healthy controls, Gregory
et al. (2008) found that participants who developed pain whilst standing for extended
periods had different pre-existing muscle activation patterns to those that did not, with the
so called pain developer group demonstrating higher levels of muscle co-activation (in this
case of the gluteus medius and the trunk flexors and extensors) (Gregory et al. 2008).
Differences have also been shown in terms of muscle activation onset times. Nelson-Wong
et al. 2012 also using a method of exposing healthy controls to prolonged standing, showed
that during sagittal flexion and extension, pain developers demonstrated activation of the
lumbar extensors prior to gluteus maximus, which was reversed in those that did not develop
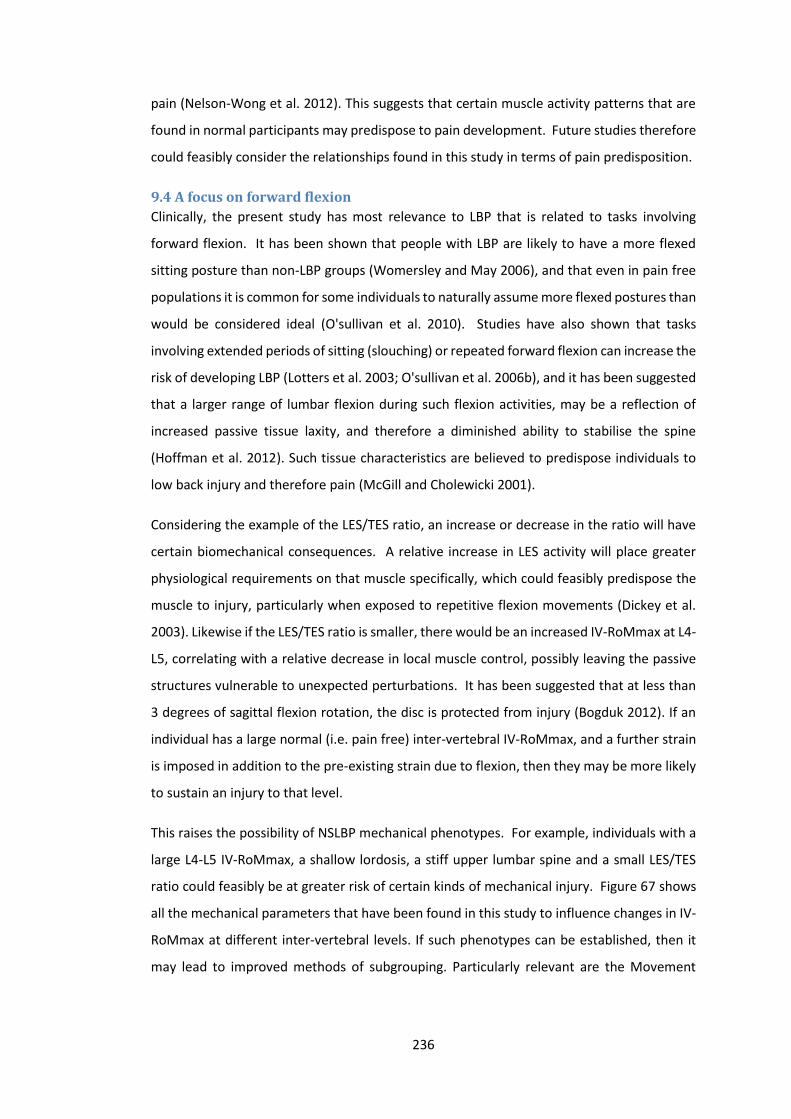
236
pain (Nelson-Wong et al. 2012). This suggests that certain muscle activity patterns that are
found in normal participants may predispose to pain development. Future studies therefore
could feasibly consider the relationships found in this study in terms of pain predisposition.
9.4 A focus on forward flexion
Clinically, the present study has most relevance to LBP that is related to tasks involving
forward flexion. It has been shown that people with LBP are likely to have a more flexed
sitting posture than non-LBP groups (Womersley and May 2006), and that even in pain free
populations it is common for some individuals to naturally assume more flexed postures than
would be considered ideal (O'sullivan et al. 2010). Studies have also shown that tasks
involving extended periods of sitting (slouching) or repeated forward flexion can increase the
risk of developing LBP (Lotters et al. 2003; O'sullivan et al. 2006b), and it has been suggested
that a larger range of lumbar flexion during such flexion activities, may be a reflection of
increased passive tissue laxity, and therefore a diminished ability to stabilise the spine
(Hoffman et al. 2012). Such tissue characteristics are believed to predispose individuals to
low back injury and therefore pain (McGill and Cholewicki 2001).
Considering the example of the LES/TES ratio, an increase or decrease in the ratio will have
certain biomechanical consequences. A relative increase in LES activity will place greater
physiological requirements on that muscle specifically, which could feasibly predispose the
muscle to injury, particularly when exposed to repetitive flexion movements (Dickey et al.
2003). Likewise if the LES/TES ratio is smaller, there would be an increased IV-RoMmax at L4-
L5, correlating with a relative decrease in local muscle control, possibly leaving the passive
structures vulnerable to unexpected perturbations. It has been suggested that at less than
3 degrees of sagittal flexion rotation, the disc is protected from injury (Bogduk 2012). If an
individual has a large normal (i.e. pain free) inter-vertebral IV-RoMmax, and a further strain
is imposed in addition to the pre-existing strain due to flexion, then they may be more likely
to sustain an injury to that level.
This raises the possibility of NSLBP mechanical phenotypes. For example, individuals with a
large L4-L5 IV-RoMmax, a shallow lordosis, a stiff upper lumbar spine and a small LES/TES
ratio could feasibly be at greater risk of certain kinds of mechanical injury. Figure 67 shows
all the mechanical parameters that have been found in this study to influence changes in IV-
RoMmax at different inter-vertebral levels. If such phenotypes can be established, then it
may lead to improved methods of subgrouping. Particularly relevant are the Movement
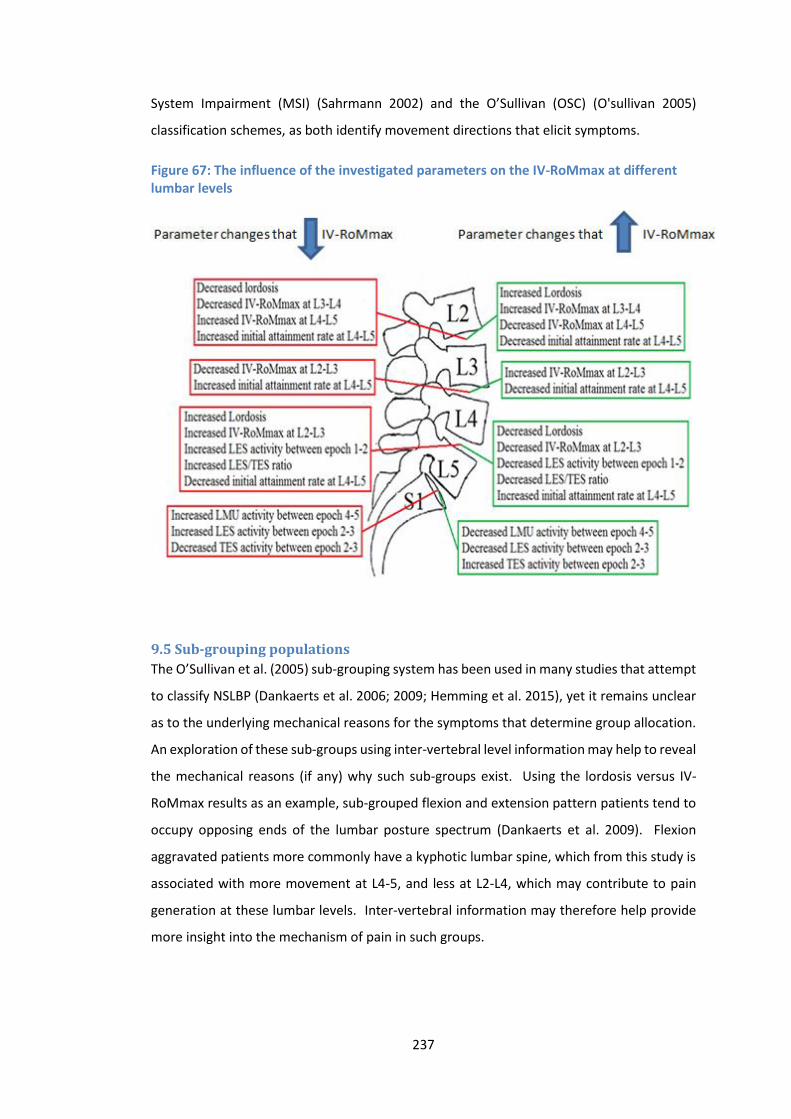
237
System Impairment (MSI) (Sahrmann 2002) and the O’Sullivan (OSC) (O'sullivan 2005)
classification schemes, as both identify movement directions that elicit symptoms.
Figure 67: The influence of the investigated parameters on the IV-RoMmax at different lumbar levels
9.5 Sub-grouping populations
The O’Sullivan et al. (2005) sub-grouping system has been used in many studies that attempt
to classify NSLBP (Dankaerts et al. 2006; 2009; Hemming et al. 2015), yet it remains unclear
as to the underlying mechanical reasons for the symptoms that determine group allocation.
An exploration of these sub-groups using inter-vertebral level information may help to reveal
the mechanical reasons (if any) why such sub-groups exist. Using the lordosis versus IV-
RoMmax results as an example, sub-grouped flexion and extension pattern patients tend to
occupy opposing ends of the lumbar posture spectrum (Dankaerts et al. 2009). Flexion
aggravated patients more commonly have a kyphotic lumbar spine, which from this study is
associated with more movement at L4-5, and less at L2-L4, which may contribute to pain
generation at these lumbar levels. Inter-vertebral information may therefore help provide
more insight into the mechanism of pain in such groups.
238
9.6 Spinal surgery
The concepts raised also have possible consequences for spinal surgery, where the effects of
spinal fusions on other areas of the spine is of obvious interest (Radcliffe et al. 2013), and
maintaining sagittal balance is believed to be an important outcome predictor (Le Huec et al.
2015). Of the spinal parameters considered in the current study, a decreased lordosis has
been linked to an anterior sagittal balance and LBP (Glassman et al. 2005; Le Huec et al. 2015;
Jackson et al. 1994), and the development of ASD (Rothenfluh et al. 2015). Using the example
of movement at L4-5, a commonly surgically fused motion segment (Le Huec et al. 2015), it
has been shown that increased movement correlates with a decrease in lordosis, which
indicates a possible association between L4-L5 movement and pain. All the biomechanical
parameters that have been shown to influence L4-L5 IV-RoMmax in this study are shown in
(Figure 68). If this segment is surgically fused therefore, it is likely that the movement will
have to be taken by other segments, and biomechanical parameters that are associated with
an increased L4-5 range may therefore be considered as associated risk factors for
pseudarthrosis (Lee et al. 2011).
Figure 68: Diagram of the possible influences of lordosis, segmental kinematics and sEMG patterns on a surgically stabilised L4-L5 motion segment
In the case of L4-5 inter-vertebral motion, surgical planning could also feasibly consider
interactions between these sEMG activity variables, the patient’s standing lordosis and the
kinematics of upper lumbar levels as possible risk factors for adjacent segment disease (ASD).
However, in vitro investigations which have now been validated using in vivo kinematics shed
little light on the actual effect of different stabilisations (e.g. fusion) on adjacent segments
(Volkheimer et al. 2015), and so any proposed effects remain intuitive.
Reduced
lumbar
lordosis
Decreased
IV-RoMmax
at upper
lumbar levels
Increased
initial
attainment
rate at L4-L5
Decreased
LES activity
relative to
TES activity
Decreased LES
activity during
the early stages
of flexion
Adjacent segment
disease (ASD) post
fusion
Increased L4-L5 IV-RoMmax

239
It must also be remembered that the present study’s results represent normal biomechanical
behaviour in healthy individuals where the movement interactions would be considered pain
free compensations. It is possible however that these parameters (e.g. Figure 68) could
predispose to LBP. Much depends on an individual’s ability to adapt, be that through changes
in muscle recruitment strategy, spinal kinematics, lordosis, pelvic incidence or thoracic
curvature, and whether these changes are adaptive or maladaptive (O’Sullivan et al. 2005).
9.7 Segmental biomechanics and individualised care
If further work confirms the normal relationships found within this study, it could provide a
foundation for more individualised diagnosis and management plans for people with NSLBP.
Much depends on the ability to identify whether the nociceptive source is a consequence of
segmental instability or restriction (i.e. associated with inter-vertebral movement).
Instability is believed to be associated with size of the neutral zone (Panjabi 1992b; Youssef
2008), and so the initial attainment rate parameter, as a surrogate indicator of the neutral
zone (Breen et al. 2015), may be of use in future instability studies. In terms of IV-RoM,
excessive movement has been described as lumbar segmental instability (LSI) (Abbott et al.
2006; Ahmadi et al. 2009; Teyhen 2004, O’Sullivan et al. 2000, Hasegawa et al. 2011) and
limited movement as lumbar segmental rigidity (LSR) (Abbott et al. 2006; Mayer et al. 2004;
Teyhen et al. 2007). However in a systematic review of tests purported to clinically diagnose
LSI, Alquarni et al. (2011) concluded that the majority of tests were inadequate for doing so
(Alqarni et al. 2011). The natural heterogeneity in terms of inter-vertebral movement makes
it difficult to assess instability in a clinical situation even with the use of spinal imaging, as
the thresholds at which motion segments are determined as either hypo or hypermobile are
not standardised and remain largely arbitrary (Abbott et al. 2006; Ahmadi et al. 2009). A
lumbar instability questionnaire has recently been developed (Macedo et al. 2014); however
this is yet to be validated. Nevertheless, aberrant spinal movement patterns are widely
believed to relate to spinal pain and dysfunction (Iguchi 2004; Kanemura 2009; Smit et al.
2011; Spinelli et al. 2015), and so the relationships demonstrated in this study may be of
importance, if the control of a specific motion segment, and a knowledge of interactions with
other levels is desirable.
The use of this information in terms of spinal rehabilitation is dependent on having baseline
inter-vertebral kinematic data. Intuitively, stabilisation will not be helpful for an already
hypomobile segment, but will be of benefit if hypermobility is assumed to be the problem,
and vice versa, in terms of mobilisation. This is consistent with an RCT conducted by Fritz et
al. 2005, who concluded that patients categorised as being either hypo or hypermobile
240
respond better to respective mobilisation or stabilisation treatment programs (Fritz et al.
2005). The current study findings showed that the motor control strategies varied between
participants, and so rehabilitation program design should account for the biomechanical
characteristics of the individual. The results suggest that the recruitment patterns of local
and global stabilisers in healthy controls influence the inter-vertebral ROM of lower lumbar
segments. Specifically, if the overall ratio of LES over TES increases, then less movement will
occur at L4-L5. Likewise, if there is a relative increase in LES activity and a decrease in TES
activity during mid-cycle, then L5-S1 range will be reduced. The movement of L5-S1 has also
been shown to relate directly to the activity of LMU.
This could have consequences for the treatment of LBP, as the benefit or detriment of
targeting specific muscles during rehabilitation exercises becomes dependent on the
biomechanics of the individual, and whether or not these biomechanics are a pain
determinant. Reeves et al. (2006) argued that preferential recruitment of the thoracic
erector spinae (i.e. a globally acting muscle) could be more appropriate than recruiting locally
acting muscles, due to the greater proportion of fatigue resistant fibres in this region (Reeves
et al. 2006), however the results of the present study would suggest that such a strategy
would place particular stress on L4-L5 during forward bending, which would be
counterproductive if this segment was unstable. Previous studies have shown that it is
possible to target specific lumbar muscles during rehabilitation. Danneels et al. (2001) for
example, showed that an increase in the size of multifidus could be achieved through a
combination of stabilisation training and dynamic static strengthening (Daneels et al. 2001).
Stevens et al. (2007) demonstrated that specific stabilisation training (bridging and 4 point-
kneeling exercises) could alter local vs global muscle activity ratios in healthy participants
(Stevens et al. 2007), and most recently, it has been shown that selective activation of LMU
over LES can be achieved (Kim et al. 2015).
A systematic review of motor control RCTs concluded that a motor control intervention
(focussed on TrA and Multifidus) is no more effective than manual therapy or other forms of
exercise in reducing LBP and disability, but is superior to minimal intervention (Macedo
2009). This conclusion can perhaps be explained by the fact that some individuals will benefit
from an increased function of multifidus, as it may relate to a specific biomechanical
problem, but some will not. Therefore, whilst Cholewicki and Van Vliet (2002) suggest that
no single muscle can be the most important in terms of lumbar spine stability (Cholewicki
and Van Vliet 2002), the present study has shown that under certain biomechanical
241
conditions, preferential isolation of specific muscles may be beneficial. Future focus for
NSLBP rehabilitation should therefore be placed on improved understanding of lumbar
kinematics on an individual basis.
9.8 Spinal modelling
A primary aim of spinal models is to predict joint reaction and muscle forces, and in order to
do so, an approach known as inverse dynamics is commonly used (Hansen et al. 2006). In
inverse dynamics, the spinal kinematics and external loads are presumed known, and the
goal of the model is to calculate internal forces (De Zee et al. 2007). One way of estimating
individual forces at a given moment is through the use of EMG recordings (Dolan et al. 2001;
Gagnon et al. 2001; McGill and Norman 1985; McGill 1992; Sparto et al. 1998). Therefore
the potential value of the present work in relation to inverse dynamics may be found in the
approach’s capacity to provide continuous kinematic data, which combined with continuous
EMG data, could lead to more sophisticated models (Hansen et al. 2006). There is a
recognised need for more sophisticated models (Galibarov et al. 2011), which may eventually
lead to more individual specific data.
Currently however, any study conclusions based on both reductionist and systems
approaches can to some degree be questioned. Due to unknown interactions we cannot be
certain that reductionist conclusions are correct, and generally speaking current systems
models are not well enough informed to incorporate all possible influences. The
combination of QF and sEMG technologies enables the investigation of numerous lumbar
biomechanical variables, from both the passive and active elements of the spine. These
variables can be measured with good agreement and reliability, and therefore represent an
opportunity for both systems and reductionist approaches. There would seem two logical
ways forward, systems models with more detailed inputs encompassing as many influencing
variables as possible (as we are now in a position to measure more of them), or a reductionist
approach that focusses on the variables that have been shown to have the greatest influence
on IV-RoM (if this is the outcome variable of interest), which would require further, more
expansive studies. It should be noted that the current study has shown no parameter to have
a particularly dominant influence over IV-RoMmax, reaffirming the fact that spinal control is
multifactorial, and that reductionist approaches may potentially miss important influences.
9.9 An emphasis on kinematic parameters
With this in mind, it should be noted that the current study’s results show an obvious
difference in the strength of relationships found between the sEMG variables, and the
kinematic variables, in terms of their influence on IV-RoMmax, sEMG variables being the
242
weaker. In terms of the relative importance of relationships, it has been suggested that the
strength of the correlation can be divided into small, medium and large (Cohen 1992). This
was adapted by Dolphens et al, who used the following criteria for the strength of r vales
(Dolphens et al. 2012).
Weak correlation (0.1 ≤ r < 0.3), Moderate (0.3 ≤ r < 0.5), Strong (r ≥0.5)
The r values from Chapter 6 all represent strong correlations, but the r values for sEMG
variables and IV-RoMmax (Chapter 7) are in the moderate category. Although an argument
can be made regarding the appropriateness of the sEMG variables selected (i.e. alternative
analytical approaches or sEMG parameters could feasibly alter the strength of the
correlations), it appears from the results, that the lordosis and kinematic parameters are
more influential over IV-RoMmax than the muscle activity parameters. The two cannot be
easily separated, however this does highlight the importance of the passive elements.
Therefore, although this study has shown that lordosis and kinematic parameters have
stronger relationships than paraspinal muscle activity with IV-RoMmax, it should also be
considered how other parameters other than IV-RoMmax at different levels interact with
each other.
9.10 Further data analysis Although the primary outcome variable for this study was IV-RoMmax, the relationships
demonstrated suggested that intuitively, correlations would also be found between other
parameters. The following section explores additional correlations that were found between
the initial attainment rate, lordosis and muscle activity parameters.
9.10.1 Lordosis versus initial attainment rate
Further analysis of the study data revealed that there was an inverse relationship between
lordosis and L4-L5 initial attainment rate during flexion (r = -.492 p = .038). Therefore as
lordosis increases, there is either an increase in stiffness at L4-L5, or a decrease in bending
moment at that level. This may help explain why when lordosis increases, IV-RoMmax at that
level decreases, and the positive relationship between L4-L5 IV-RoM max and initial
attainment rate (i.e. if the segment is lax, it moves further) (Table 21).
This finding may relate to the inter-vertebral mechanics of the disc and other passive tissues.
However, in an individual with a large lordosis, the L4-L5 disc, in a neutral standing position,
will be loaded posteriorly, and the posterior ligaments will be in a shortened state. When
the disc is compressed there is a resulting build-up of hydrostatic pressure in the nucleus
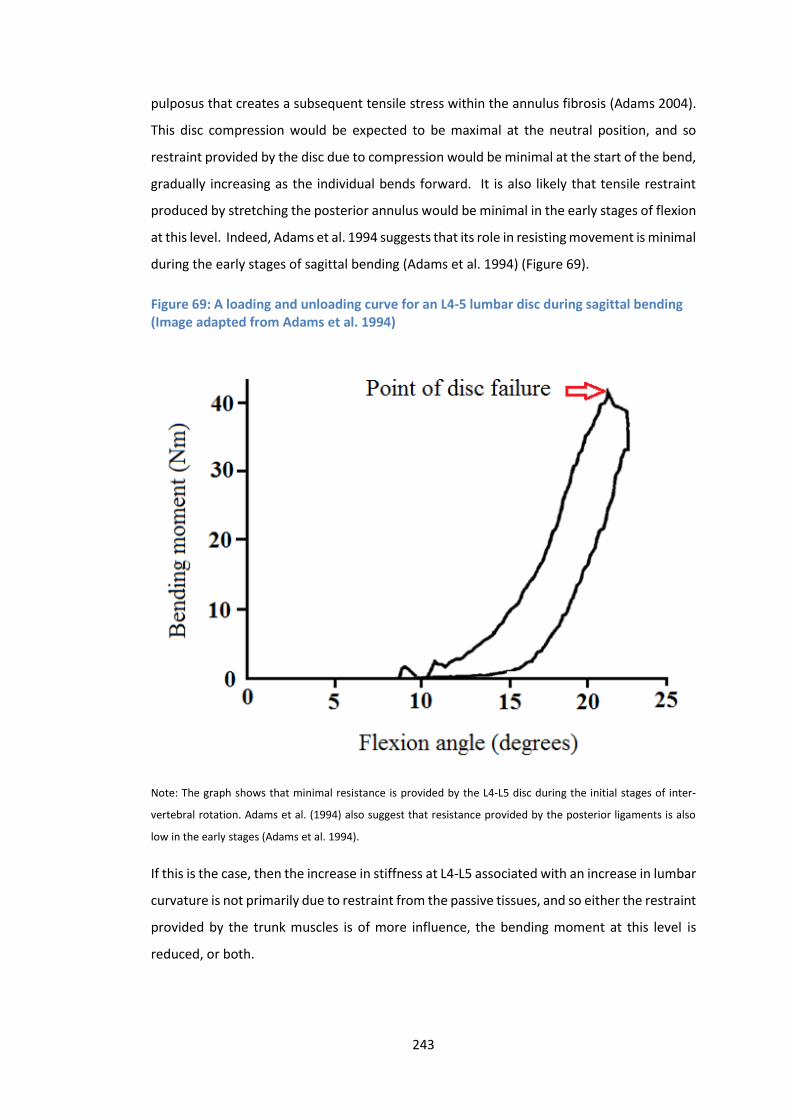
243
pulposus that creates a subsequent tensile stress within the annulus fibrosis (Adams 2004).
This disc compression would be expected to be maximal at the neutral position, and so
restraint provided by the disc due to compression would be minimal at the start of the bend,
gradually increasing as the individual bends forward. It is also likely that tensile restraint
produced by stretching the posterior annulus would be minimal in the early stages of flexion
at this level. Indeed, Adams et al. 1994 suggests that its role in resisting movement is minimal
during the early stages of sagittal bending (Adams et al. 1994) (Figure 69).
Figure 69: A loading and unloading curve for an L4-5 lumbar disc during sagittal bending (Image adapted from Adams et al. 1994)
Note: The graph shows that minimal resistance is provided by the L4-L5 disc during the initial stages of inter-
vertebral rotation. Adams et al. (1994) also suggest that resistance provided by the posterior ligaments is also
low in the early stages (Adams et al. 1994).
If this is the case, then the increase in stiffness at L4-L5 associated with an increase in lumbar
curvature is not primarily due to restraint from the passive tissues, and so either the restraint
provided by the trunk muscles is of more influence, the bending moment at this level is
reduced, or both.
244
In a flatter spine, there is an increased initial attainment rate (i.e. decreased stiffness), which
may also relate to the starting position of the L4-L5 vertebral segment. If the motion segment
begins movement from a horizontal position, the disc compression would be most uniform
initially, and resistance provided by tensioning of the posterior elements may be expected
to come about sooner. This again does not seem to fit with the idea that passive structures
are primarily responsible for the relationship between lordosis and initial attainment rate,
implying again that the active system or changes in bending moment are more influential in
the early stages of flexion. It also provides possible mechanical reasoning behind why L4-L5
is a segment commonly associated with LBP, as the morphological conditions mean that it is
in immediate demand for restraint from the moment of movement onset, and this may be
provided by the muscles, leading to an increased likelihood of compromised function and
injury over time. To the author’s knowledge there are no previous studies that have
investigated the influence of lordosis on laxity measurements, and so no comparisons can be
made.
9.10.2 Muscle activity changes versus initial attainment rate
Given the relationships found between TES and LES muscle activity and the IV-RoMmax of
lower lumbar segments, the absence of such relationships with upper lumbar segment
movement was of interest. Considering that the initiation of upper lumbar motion segment
movement typically occurred during epochs 2-3 (Appendix M), it was of additional interest
to investigate the correlations between initial attainment rate at these levels and the
associated muscle activity during this period.
Further analysis of the kinematic and muscle activity data (Chapters 6 and 7) revealed strong
positive relationships between initial attainment rate at L2-L3 and L3-L4 and TES activity
during epoch 2-3 (r = -.577 p = 0.012 and r = -.676 p = 0.002 respectively). This suggests that
these globally acting muscles may react to stabilise upper lumbar flexion when these
segments are lax, a strategy capable of controlling the combined effects of laxity increases
in two adjacent motion segments. This strategy may also partially explain the correlation
found between L3-L4 initial attainment rate and L5-S1 IV-RoMmax (Table 21), as the
increased stabilisation of upper lumbar segments by the globally acting TES, may provide a
stable enough system to allow localised movement at L5-S1.
Cholewicki and McGill (1996) suggest that the lumbar spine is vulnerable in the neutral zone
when there is minimal muscle activity (Cholewicki and McGill 1996). The results presented
here would suggest however that increased global muscle activation is a compensatory
245
recruitment strategy when there is upper lumbar laxity (i.e. less local stabilisation, allowing
local level movement, but maintaining regional stability through the action of the global
muscles). Cholewicki and McGill (1996) also suggest however, that under such conditions
(i.e. a relatively larger neutral zone) the activation of locally acting muscles is increased
(Cholewicki and McGill 1996). This is in disagreement with this study’s findings in the upper
lumbar segments; as the correlations found between L2-L3 and L3-L4 initial attainment rate
and an increase in TES activity, demonstrate a mechanism of globally acting control.
Exploring this idea further, a trend was also found between L4-L5 initial attainment rate and
LES activity during epoch 2-3 (r = -.412 p = 0.90) (although not reaching significance). This
would suggest that laxity at L4-L5 relates to increases in the locally acting LES, which is more
in agreement with Cholewicki and McGill (1996). These contrasting stabilisation mechanisms
appear to show that motor control strategies relating to inter-vertebral laxity can vary
between lumbar levels, and therefore future investigations should not presume uniform
control within the same spinal region. This further highlights the need for more research in
the field of motor control that considers inter-vertebral information.
9.11 Limitations of this work A study investigating a structure as complex as the lumbar spine, in a single plane, and using
two technologies such as QF and sEMG will inherently have limitations associated with it.
The following examples highlight some of these.
9.11.1 The size of the QF image field
It was not possible using the current equipment to measure the inter-vertebral movements
at levels above L2 (including the thoracic region), and so theories about the kinematics that
accompany muscle activity adjacent to T9 can only be speculative. Nevertheless, the
information from the globally acting muscles was thought worthy of investigation. Likewise,
the current QF equipment cannot image below S1, and so it is not possible to measure
variables such as pelvic incidence. This would be beneficial if sagittal alignment is of interest,
as the ability to adapt pelvic incidence is believed to help avoid cumulative detrimental
effects associated with changes elsewhere in the kinematic chain (Rothenfluh et al. 2015).
Although it is not currently feasible to image over a wider area, future technological advances
may make this possible. This would allow QF imaging beyond 60° and to full flexion, meaning
the FRP could be assessed in relation to inter-vertebral kinematics. Therefore, whist the
246
current protocol is also designed to standardise the bending movement in order to make
comparisons between individuals more plausible, there would be benefits to alternative
methodologies.
9.11.2 Securing the Pelvis
Securing the pelvis was a necessary part of the study protocol, primarily to standardise the
bending movement, but also to keep the lumbar spine in the image field. Restraint does
however create an arguably unnatural flexion movement pattern, as in an unconstrained
forward bending movement, there is simultaneous motion of the lumbar spine, pelvis and
hips. The majority of movement occurs in the lumbar spine during the initial stages of flexion,
but is joined by movement of the pelvis in the mid stages, eventually shifting to a pelvic
dominance when approaching full flexion (Spinelli et al. 2015). It may be feasible in future
studies to use a skin surface tracking device such as the Fastrak (Abdoli-E and Stevenson
2008), Optotrak (O’Shaughnessy et al. 2013), or Flock of birds (Hsu et al. 2008; Butler et al.
2009; Bull and McGregor 2000), to provide pelvic, and thoracic kinematic measurements that
would add important additional insight into the overall biomechanical picture. It may be
hypothesised for example that a flatter lordosis would be associated with an increased pelvic
tilt and a decreased thoracic kyphosis (Le Huec et al. 2015), which could also relate to the
activity of the globally acting TES.
9.11.3 Pelvic restraint versus free bending
The weight-bearing sagittal flexion motion graphs (Appendix M) show much variation in
terms of the IV-RoMmax reached by each inter-vertebral level, the steepness of the motion
graph curves (attainment rate) and in the presence of phase lag (i.e. the tendency for
different spinal levels to commence or end movement at different points in the trunk motion
sequence). The most frequent movement pattern is demonstrated in Figure 26, where a
cascade in movement can be seen from L2-L3 to L5-S1, however this was not always evident,
and examples of movement initiating from lower lumbar segments, or even at the same time
were seen (Appendix M). These findings reaffirm the lack of consensus in the literature
regarding normal lumbar spinal movement patterns during sagittal flexion as discussed
previously (section 6.1.5.1). Whilst differences in the methods used to interpret the initiation
of movement may partially explain such disagreement in findings, this study has shown that
there are likely many variations in normal sagittal bending movements that relate to the
unique biomechanical requirements of each individual. It is also possible however that
restraining the pelvis directly affects the kinematic pattern, and so could be considered a
limitation.
247
The mean IV-RoM at each level (L2-L3 9° SD 2.7°, L3-L4 10.3° SD 1.6°, L4-L5 9.8° SD 3.9° and
L5-S1 6.4° SD 3.2°) shows that using the current protocol, the least movement (as a
proportion of total lumbar movement L2-S1) typically occurs at L5-S1. This finding is in
agreement with Pearcy et al. (1984) who demonstrated using bi-planar radiography, similar
but slightly increased ranges relative to those shown in this study (L2-L3 10°, L3-L4 12°, L4-
L5 13°, L5-S1 9°), also showing the smallest movement at L5-S1. The Pearcy et al. study used
eleven male volunteers of a similar age range to this study (mean 29.5 years), and whilst also
restraining the pelvis (in order to keep the spine in the image field during flexion), allowed
participants to fully bend (i.e. beyond 60° of trunk flexion) (Pearcy et al. 1984). This suggests
that although the current protocol is designed to fully stress all lumbar motion segments, 60°
of standardised flexion either does not do so, or that following the motion frame somehow
minimises the movement at the base of the spine. This is difficult to interpret however, as
the sample sizes in both studies are relatively small (i.e. 11 and 18), and considering L5-S1 in
particular, a review of inter-vertebral motion studies showed this level to have the greatest
inter-subject variability (Deitz 2011). In agreement, Li et al. (2009) reported a greater
contribution to angular range from cephalic segments; however the protocol used was
markedly different (Li et al. 2009), in that there was no restraint of the pelvis, and that the
flexion movement was also limited to 45°. In this instance, if the cascade of motion was from
cephalic to caudal (Kanayama et al. 1998), then it may be that at 45° of flexion the lower
lumbar segments have not been afforded adequate opportunity to reach their maximum
angular range.
These findings are in disagreement with other studies that have measured IV-RoM without
restraining the pelvis. Boden (1990) suggested that in measurements of the overall angular
rotation using flexion and extension radiographs, mean ranges at L5-S1 were actually greater
than at other lumbar levels (Boden 1990) , and when comparing the results of Boden to those
of Pearcy et al., there is a clear difference in terms of IV-RoM reached by upper and lower
lumbar levels, which may be in part due to the use of pelvic retsraint. It seems that in free
bending the upper levels rotate less, and the lower levels comparitively more, than in the
current study or Pearcy et al’s where the pelvis is restrained. This either suggests that the
upper lumbars are stressed more, L5-S1 in particular is stressed less, or that 60 degrees is
not enough to stress the lower lumbars (e.g. L5-S1) fully. This is a possible design
consideration for future studies, as 60 degrees of flexion was used as it is believed to fully
stress the entire lumbar spine (Dvorak et al. 1991).
248
Methodological differences (i.e. pelvic restraint and limited range of movement) may
therefore influence the measurements. When the pelvis is restricted, the influence of the
gluteal and hamstring musculature on lumbar stiffness will be different to normal free
bending, as it is likely their activity will be diminished and the associated stiffening through
the TLF may be smaller. The pelvic restraint also appears to relate to relatively smaller ranges
at L5-S1 however, which may be explained by a locally acting effect of pressure produced by
the support placed over the scarum, producing a localised stiffening. Indeed, in a recent
study investigating normative values of IV-RoM using seated flexion-extension radiographs
during free bending, IV-RoM at L5-S1 was similar to other lumbar levels (mean 12.8°) (Staub
et al. 2015). In a seated position with knees flexed, there would be less tension through the
hamstrings, indicative perhaps of the important kinematic influence the use of a sacral
support may have, possibly as a result of a direct pressure on the sacro-tuberous ligament.
9.11.4 The use of sEMG technology in isolation
The use of sEMG only provided information regarding superficial paraspinal muscles. The
longissimus thoracis pars lumborum caudal inter-muscular aponeurosis attaches directly into
the ilium. The LES signal adjacent to L2, predominantly from longissimus thoracis pars
lumborum, is inevitably contaminated by cross talk from the multifidus at that level. The
multifidus fascicle from L1 originates from the spinous process and inserts into the
mammillary process of L4, and its common tendon into the mammillary process of L5, S1 and
the posterior superior iliac spine. The fascicle of L2 extends from the spinous to mammillary
of L5, and the common tendon into the mammillary process of S1, the posterior superior iliac
spine and the iliac crest (Bogduk 2012). It is therefore feasible that LMU activity deep to the
LES is also influencing the patterns. Intra-muscular needles would enable EMG recording
directly from the multifidus and the longissimus lateral to the L2 spinous process, and the
relative influence of each muscle on IV-RoMmax could then be assessed.
9.11.5 The determination of lordosis
The number of vertebrae evaluated when determining lumbar lordosis varies between
researchers, with some using T12-S1 (Kim et al. 2006), but most commonly L1-S1 (Jackson
1994; Mao et al. 2014; Rothenfluh et al. 2015). Therefore the lordosis measurement used in
this study (i.e. the angle between L2-S1) is not directly comparable with other studies, and
again highlights the problem with unstandardised methodologies. Any future advancement
in the QF protocol should therefore consider ways of expanding the image field to include
L1-L2, and if possible the femoral heads (i.e. for pelvic incidence measurements).
249
9.11.6 Pre-examination activity
In the current study, there was no requirement for the participants to avoid exercise prior to
their examination. Future participant information sheets should stipulate that they should
not attend the gym or perform any prolonged physical activity immediately prior to the study
protocol. This would reduce the possibility of muscles behaving differently due to fatigue
(Descarreaux et al. 2008), or as a result of changes in proprioceptive responses for example
from prolonged lengthening (Ge et al. 2011; Hendershot et al. 2011).
250
Chapter 10
10.1 Conclusion This thesis was embarked upon on the basis that, furthering understanding of relationships
between normal lumbar inter-vertebral kinematic and myoelectric behaviour, would assist
in revealing what is normal in terms of inter-vertebral spinal mechanics.
The present study validated a methodology for measuring inter-vertebral kinematics and
local myoelectric activity contemporaneously. The repeatability of the kinematic and muscle
activity parameters, and the agreement and reliability of intra-subject sEMG amplitude
measurements were shown to be good, and therefore supported the methodological
approach. This was partly attributed to the standardisation of the data recording protocols,
and therefore it is recommended that standardisation of participant movement also be
incorporated into future kinematic and EMG based studies.
By combining QF and sEMG technologies, it was shown that the concurrent recording of
continuous standardised lumbar inter-vertebral and muscle activity data is achievable in
vivo. In doing so, previously unknown relationships between lordosis, inter-vertebral
kinematic measures (L2-S1) and muscle activity parameters were discovered. Using L4-L5 as
an example, these included a direct relationship between L4-L5 IV-RoMmax and L4-L5 initial
attainment rate, and inverse relationships between L4-L5 IV-RoMmax and lordosis, L2-L3 IV-
RoMmax and the LES/TES ratio. These relationships and others provide a fresh insight into
mechanisms of spinal control at an inter-segmental level in pain free individuals.
The demonstration of such relationships and interactions has consequences for future LBP
biomechanical studies. The IV-RoMmax at levels throughout the lumbar spine was shown to
be influenced by a number of different mechanical variables, and therefore these should no
longer be viewed in isolation in CNSLP investigations. Although the findings of this study
were derived from a limited number of variables, they show in detail, the interactions
between lumbar inter-vertebral kinematics and myoelectric activity during forward bending.
These intrinsic interactions should therefore be a consideration in the design of future
biomechanical studies of the lumbar spine.
251
10.2 Future Work There is much scope for future investigation that builds on the work of the current study.
The following section considers some of the possibilities for future work.
10.2.1 Sample size
A next step would be to confirm the relationships discovered within this study by repeating
the investigations using a larger population. The sample would have to be sufficiently large
for multivariate analysis, in order for the relative importance (in terms of the outcome
measures variance) to be determined. The data could then also be explored using more
complex analysis techniques such as structural equation modelling (Fife-Schaw 2000), or
principal component analysis (Joliffe 2002).
The study’s results are also only representative of one small, young and healthy male
population. Future work may therefore consider a sample including female participants and
a wider age range. However, consideration would need to be given to the influence of factors
such as the increased variation in soft tissue thickness (STT) associated with females, and
musculoskeletal degeneration in elderly populations.
10.2.2 Exploring the influence of other mechanical variables on IV-RoMmax
Primarily to limit the complexity of the current study, it was decided to limit the number of
variables selected for analysis. There are however many other variables that could also
potentially influence inter-vertebral movement, and so exploring the potential for
correlations between IV-RoMmax and other such parameters could be a relatively
straightforward progression from the current research. The following sections review two
parameters that could feasibly be measured using the current QF protocol.
10.2.2.1 Translation
During sagittal flexion there is an associated anterior translation, predominantly controlled
by the action of longissimus (Bogduk 2012). In terms of spinal control therefore, the link
between this movement and muscle activity is also of interest, however the parameter was
omitted from the current study due to concerns over the limited size of measurements
expected in a healthy population. Indeed in a group of asymptomatic volunteers, Pearcy et
al. 1984, showed that translation during sagittal flexion ranged between only 1-2mm at levels
L2-S1 (Pearcy et al. 1984), which considering a measurement error of almost 1mm when
using the QF protocol (Breen et al. 2012) makes its use almost untenable. Translation has
also previously been investigated as a parameter of instability (Teyhen 2004), however there
is no general consensus regarding any link to LBP. Weiler et al. (1990) found that when
252
translation and rotation were combined as an ‘instability factor’ there was a significant
difference between participants with degenerative disc disease (DDD) and healthy controls,
however no such difference was found with a NSLBP group (Weiler 1990). McGregor et al.
(2002) compared translation measurements during flexed and extended positions between
patients with spondylolisthesis and healthy controls, and also found no significant difference
(McGregor et al. 2002). The literature would suggest therefore that whilst translation should
be not be discounted completely as a parameter for future investigations involving specific
LBP groups (e.g. patients with DDD), its use may be limited in studies that focus on NSLBP.
10.2.2.2 Disc degeneration
Disc degeneration is also believed to influence the IV-RoM of inter-vertebral motion
segments (Iatridis et al. 2013), however there is a lack of consensus regarding the effects
that increasing disc degeneration has on IV-RoM during flexion (Muriuki et al. 2016), and so
correlations between disc degeneration and IV-RoMmax would be of interest. A loss of disc
stiffness would potentially allow a vertebra greater forward rotation, and an increase would
reduce it (Bogduk 1995). This relationship will itself be multifactorial however, as under
loading, other active and passive system parameters will inevitably contribute. In the
absence of muscle activation, it has been demonstrated in porcine spines that damage to the
disc alone does not appear to have a significant effect on inter-vertebral rotation ranges, and
that other aspects of the control system such as facet joint capsules and longitudinal
ligaments may have a greater influence (Kaigle 1995), whilst other studies contend that the
ligamentum flavum, supraspinous and interspinous ligaments provide the most resistance to
flexion (Von Forell and Bowden 2014).
These conclusions all conflict at least in part, to those of Adams (1980), who conducted a
cadaveric study investigating the resistance to flexion of various lumbar joint elements
(Adams et al. 1980). Their study also highlighted the importance of passive structures in the
control of forward bending, but suggests that lumbar inter-vertebral rotation is resisted
primarily by the ligaments of the facet joint capsules and by the disc (Adams et al. 1980). To
assess the direct role of ligaments in vivo would be a challenge, however it is relatively simple
to assess the state of the disc using radiographs (Kellgren and Lawrence 1958) or MRI (Tan
2000). A future study could therefore investigate the relationship between disc
degeneration and IV-RoMmax in vivo, as this has not been investigated under the influence
of muscle activity and loading.
253
10.2.2.3 Motion sharing variability (MSV)
A kinematic variable known as motion share variability (MSV) is under development at the
IMRCI and is a representation of the evenness of segmental motion sharing during bending.
To calculate this variable the average distance between the levels that received most and
least motion during the movement is taken. The square root of the variance of these
distances is taken for every data point over the sequence is calculated providing the MSV.
The MSV has been shown to relate to CNSLBP, i.e. more uneven inter-vertebral motion
sharing is associated with CNSLBP (Breen and Breen 2017 accepted).
It was theorised that increased muscle activity may be a possible mechanism to stabilise
motion segments during forward bending, something that has never been demonstrated
before in vivo. In order to investigate this theory, the kinematic data from this thesis was
used to calculate the MSV for each participant, and correlations between MSV and the mean
normalised EMG during flexion of TES, LES and LMU were explored. EMG activity in all three
muscle groups was found to be moderately and significantly correlated with MSV. All
correlations were negative (LMU r=-0.54, p=<0.05; LES r=-0.069, p<0.01; TES r=-0.54,
p<0.05). Further nonparametric regression analysis (tau) showed a weak dependence of
MSV on sEMG activity for all three muscles groups (LMU -0.38, p<0.05, LES -0.47 P<0.01, TES
-0.34 p=0.05). These results indicate that increased muscle activity may be a stabilising
mechanism (i.e. provides increased damping) that limits irregular rotational displacements
during forward bending. Replication using a larger sample is recommended to reaffirm these
findings.
10.2.3 Other future research possibilities
10.2.3.1 Reference ranges
The determination of reference ranges for kinematic measurements such as IV-RoMmax is
already underway in the form of the creation of a normative database (Section 4.2.1).
Determining whether mechanical parameters found in LBP patient groups are within normal
reference ranges, would make associations between LBP and mechanical parameters much
clearer, enabling physicians to establish whether or not the LBP problem is likely to have
predominantly mechanical components, and therefore stratify more dependably, candidates
likely to respond to CBT based treatment programmes (Hill et al. 2011). In terms of
mechanical LBP research, one of the biggest obstacles is the heterogeneity within LBP
groups. This is especially problematic in terms of EMG measurements, although this study
254
has demonstrated that clinically useful reference ranges for EMG variables may be more
likely if standardisation of movements can sufficiently minimise participant variability. The
determination of reference ranges for sEMG amplitude parameters, is an area that therefore
warrants further exploration.
If such parameters are ever to be used as outcome measures in longitudinal studies involving
LBP populations, then normal intra-subject variation will also have to be relatively small, so
that any changes post treatment can be clearly designated as a result of the treatment itself,
and not simply as a result of the normal variation between baseline and follow up
measurements. This threshold is known as the minimum detectable change (MDC) and
estimates the intra-subject parameter change that would be found 95% of the time.
Unfortunately due to the inherently large heterogeneity in parameters such as IV-RoM and
EMG amplitude, currently MDC’s are typically so large, that changes resulting directly from
the treatment intervention would be difficult to interpret. Although it may be expected that
MDCs for both kinematic and muscle activity parameters would be too large to be of clinical
value, this needs to be confirmed by further studies.
10.2.3.2 Pain developer groups and sub-grouping
As discussed previously, it is possible that kinematic, morphological and muscle activity
parameters that are found in healthy participants, may feasibly be pre-disposing factors for
LBP development. To test this theory would require an investigation into how repeated
flexion affects individuals who demonstrated particular kinematic behaviours (e.g. large or
small IV-RoMmax at L4-L5 during sagittal flexion), a possible hypothesis being that individuals
demonstrating smaller IV-RoMmax’s at L4-L5 will have larger LES/TES ratios and develop
lumbar pain (i.e. possibly due to repetitive strain of the LES) quicker during repeated flexion
than those with larger L4-L5 ranges. It would also be of interest to investigate the inter-
vertebral biomechanics of LBP patients allocated to the O’Sullivan et al. (2005) sub-groups,
in particular those in the flexion pain provocation group. This would allow the exploration
of relationships between biomechanical parameters and LBP at a sub-grouped and inter-
vertebral level.
Collaboration with Dr Rebecca Hemming (A member of the Arthritis Research UK
Biomechanics and Bioengineering Centre at the University of Cardiff). A collaboration is
planned to use the protocol developed in this thesis to explore the kinematics and muscle
activity of CNSLBP patients that have been sub-grouped in accordance with the O’Sullivan
(2005) sub-grouping system. This approach has been used in many studies that have
255
attempted to classify NSLBP (Dankaerts et al. 2006; 2009; Hemming et al. 2015), yet it
remains unclear as to the underlying mechanical reasons for the symptoms that determine
group allocation. An exploration of these sub-groups using inter-vertebral level information
is planned to investigate the possible mechanical reasons why such sub-groups exist. Using
the lordosis versus IV-RoMmax results as an example, sub-grouped flexion and extension
pattern patients tend to occupy opposing ends of the lumbar posture spectrum (Dankaerts
et al. 2009). Flexion aggravated patients more commonly have a kyphotic lumbar spine,
which from this study is associated with more movement at L4-5, and less at L2-L4, which
may contribute to pain generation at these lumbar levels. Inter-vertebral information may
therefore help provide more insight into the mechanism of pain in such groups.
10.2.3.3 Plane of investigation
The scope of this study was limited to sagittal plane flexion and provides no information
about the return phase or sagittal extension from neutral. Future studies may possibly
include these, and also consider the coronal plane, although a preliminary study concluded
that relationships would most likely be found between kinematic and EMG parameters in
the sagittal plane (Chapter 3). Further consideration of the appropriate muscle groups to
investigate would be necessary in each case.
10.2.3.4 Removing the contamination of gravity and loading
The methodology of this study was designed to minimise possible confounding factors such
as variations in load and disc stiffness. Participants were all aged between 20 and 40, had a
BMI < 30, with no history of low back pain, and the likelihood of disc degeneration or disc
injury having an influence on the kinematic patterns was therefore reduced. However, a
limitation of this study was an inability to account for the axial loads acting on each motion
segment during bending, and so it was not possible to know how such forces may have
influenced the findings. A future study therefore, may investigate what effect muscle activity
‘alone’ has on the lumbar spinal kinematics. In order to do so, a protocol would be required
that removes the confounding influence of loading, and in an ideal testing environment
therefore, the effects of gravity and changes in both passive and active spinal properties due
to loading would be removed. One possible solution would be to conduct both a passive and
an active recumbent sequence, as any difference in the kinematic behaviour of the spine
between the two examinations, would theoretical be a result of the muscle activity alone.
This in itself is not a perfect solution, as muscles will behave differently under loading, and
there would be issues regarding friction of the motion table during the active bend. In terms
256
of the muscles under investigation, it would also not be feasible to study the paraspinals
during recumbent flexion, as an individual’s weight-bearing eccentric lowering function
would be replaced by the agonist activity of the abdominal muscles. A solution would be to
measure the activity of the extensors during the return phase from full flexion to neutral, as
in theory, passive recumbent, active recumbent and weight-bearing sequences could then
all be compared.
10.2.3.5 Maximising sEMG data collection
Traditional sEMG techniques such as those used in this study, can be limited in terms of the
number of recording sites achievable within a region of muscle, primarily due to the size of
individual electrodes. A possible solution to this problem is the use of EMG arrays (Finneran
et al. 2003; Hu et al. 2010). Such arrays are capable of producing continuous topographical
representations of the distribution of sEMG signals, and are therefore a novel way of showing
muscle contraction patterns. Their expansive nature (i.e. covering large parts of the back)
would not cause an issue for the concurrent use with QF based modalities; however it may
be problematic if required for use in combination with devices that also require attachment
to the skin. If electrode arrays were incorporated into methodologies such as those used in
this study, they could help provide a more detailed inter-vertebral level specific insight into
relationships with the lumbar paraspinal muscle activity.
10.2.3.6 Investigating other muscles
The scope of this study limited focus to the lumbar paraspinal muscles. The longissimus and
multifidus are not the only muscles involved in the control of spinal movement during
bending however, and so not all relevant muscles were investigated. The roles of other
regional muscles such as the TrA, diaphragm, psoas and QL, are all of potential importance,
and so the investigation of relationships between IV-RoMmax and such muscles would also
be of interest. It would also be beneficial to measure muscle activity from several different
groups concurrently, in order to investigate co-contraction strategies.
It has also been suggested that the lumbar spine should not be viewed in isolation from the
lower limbs due to the inter-dependence between them (McGregor and Hukins 2009). The
measurement of muscle activity in the gluteals, hamstrings, and quadriceps would also
therefore be of interest; however their inclusion would depend on an adaptation of the
current protocol to incorporate the movement of the hips and pelvis.
257
10.2.3.7 Further exploration of the Flexion relaxation Phenomenon (FRP)
As described previously, the FRP literature is typically limited due to the measurement of
regional kinematics, and the recording of EMG from single muscle sites. This level of detail
is inadequate if a better insight into the relationships between inter-segmental movement
and muscle deactivation (i.e. the mechanism of reflex muscle inhibition) is to be gained. The
combined use of EMG and fluoroscopy provides the possibility to conduct research that
considers the activation patterns of numerous muscles in relation to specific lumbar motion
segments. As the FRP has been shown to occur near the end range of forward flexion, the
QF protocols would have to be adapted to allow the participants to reach full flexion
(currently limited to 60°), which is only problematic in terms of keeping the lumbar spine
within the image field. If these problems can be addressed, the opportunity to investigate
the FRP of paraspinal musculature (including the use of needle EMG to record from the deep
multifidus) should be taken.
258
References Aaronson, N., Alonso, J., Burnam, A., Lohr, K. N., Patrick, D. L., Perrin, E., and Stein, R. E.,
2002. Assessing health status and quality-of-life instruments: Attributes and review criteria. Quality of Life Research, 11 (3), 193-205.
Abbott, J., Fritz, J., Mccane, B., Shultz, B., Herbison, P., Lyons, B., Stefanko, G., and Walsh, R., 2006. Lumbar segmental mobility disorders: Comparison of two methods of defining abnormal displacement kinematics in a cohort of patients with non-specific mechanical low back pain. BMC Musculoskeletal Disorders, 7 (1), 45.
Abboud, J., Lardon, A., Boivin, F., Duga, C. & Descaeeeaux, M. 2017. Effects of Muscle Fatigue, Creep, and Musculoskeletal Pain on Neuromuscular Responses to Unexpected Perturbation of the Trunk: A Systematic Review. Frontiers in Human Neuroscience, 10.
Abboud, J., Nougarou, F., and Descarreaux, M., 2016. Muscle activity adaptations to spinal tissue creep in the presence of muscle fatigue. PLoS ONE, 11 (2), e0149076.
Abdoli-E, M., and Stevenson, J. M., 2008. The effect of on-body lift assistive device on the lumbar 3d dynamic moments and emg during asymmetric treestyle lifting. Clinical Biomechanics, 23 (3), 372-380.
Adams, M. A., 2004. Biomechanics of back pain. Acupuncture in Medicine, 22 (4), 178-188. Adams, M. A., 1999. Biomechanics of the intervertebral disc, vertebrae and ligaments. In:
Szpalski, M., Gunzburg, R., and Pope, M. H. eds. Lumbar segmental instability. Philadelphia: Lippincott Williams & Wilkins, 3-13.
Adams, M. A., Green, T. P., and Dolan, P., 1994. The strength in anterior bending of lumbar intervertebral discs. Spine, 19 (19), 2197-2203.
Adams, M. A., Hutton, W. C., and Stott, J. R. R., 1980. The resistance to flexion of the lumbar vertebral joint. Spine, 5, 245-253.
Ahern, D. K., Follick, M. J., Council, J. R., Laserwolston, N., and Litchman, H., 1988. Comparison of lumbar paravertebral emg patterns in chronic low back pain patients and non-patient controls. Pain, 34, 153-160.
Ahern, D. K., Follick, M. J., Council, J. R., and Leser-Wolston, N., 1986. Reliability of lumbar paravertebral emg assessment in chronic low back pain. Archives of Physical Medicine and Rehabilitation, 67 (10), 770-776.
Ahmadi, A., Maroufi, N., Behtash, H., Zekavat, H., and Parnianour, M., 2009. Kinematic analysis of dynamic lumbar motion in patients with lumbar segmental instability using digital videofluoroscopy. European Spine Journal, 18, 1677-1685.
Ahn, A. C., Tewari, M., Poon, C.-S., and Phillips, R. S., 2006. The clinical applications of a systems approach. PLoS Medicine, 3 (7), 0956-0960.
Ailliet, L., Rubinstein, S. M., De Vet, H. C. W., Van Tulder, M. W., and Terwee, C. B., 2015. Reliability, responsiveness and interpretability of the neck disability index-dutch version in primary care. European Spine Journal, 24 (1), 88-93.
Aiyangar, A., Zheng, L., Anderst, W., and Zhang, X., 2015. Apportionment of lumbar l2-s1 rotation across individual motion segments during a dynamic lifting task. Journal of Biomechanics, 48, 3709-3715.
Aiyangar, A. K., Zheng, L., Tashman, S., Anderst, W. J., and Zhang, X., 2014. Capturing three-dimensional in vivo lumbar intervertebral joint kinematics using dynamic stereo-x-ray imaging. Journal of Biomechanical Engineering, 136, 011004-011001 - 011004-011009.
Alexiev, A. R., 1994. Some differences of the electromyographic erector spinae activity between normal subjects and low back pain patients during the generation of isometric trunk torque. Electromyography and Clinical Neurophysiology, 34 (8), 495-499.

259
Alqarni, A. M., Schneiders, A. G., and Hendrick, P. A., 2011. Clinical tests to diagnose lumbar segmental instability: A systematic review. Journal of Orthopaedic & Sports Physical Therapy, 41 (3), 130-140.
Andersson, E. A., Oddsson, L. I. E., Grundstrom, H., Nilsson, J., and Thorstensson, A., 1996. Emg activities of the quadratus lumborum and erector spinae muscles during flexion - relacation and other motor tasks. Clinical Biomechanics, 11, 392-400.
Anderst, W. J., Vaidya, R., and Tashman, S., 2008. A technique to measure three-dimensional in vivo rotation of fused and adjacent lumbar vertebrae. The Spine Journal, 8 (6), 991-997.
Arena, J. G., Sherman, R. A., Bruno, G. M., and Young, T. R., 1991. Electromyographic recordings of low back pain subjects and non-pain controls in six different positions: Effect of pain levels. Pain, 45 (1), 23-28.
Arjmand, N., Gagnon, D., Plamondon, A., Shirazi-Adl, S., and Lariviere, C., 2010. A comparative study of two trunk biomechanical models under symmetric and asymmetric loadings. Journal of Biomechanics, 43, 485-491.
Asmundson, G. J. G., Norton, G. R., and Allerdings, M. D., 1997. Fear and avoidance in dysfunctional chronic back pain patients. Pain, 69 (2), 231-236.
Aspden, R. M., 1989. The spine as an arch. A new mathematical model. Spine, 14 (3), 266-274.
Aubin, C.-E., Bellefleur, C., Joncas, J., De Lanauze, D., Kadoury, S., Blanke, K., Parent, S., and Labelle, H., 2011. Reliability and accuracy analysis of a new semiautomatic radiographic measurement software in adult scoliosis. Spine, 36 (12), E780-E790.
Bakker, D. A., and Richmond, F. J. R., 1982. Muscle spindle complexes in muscles around upper cervical vertebrae in the cat. Journal of Neurophysiology, 48 (1), 62-74.
Barker, P. J., Guggenheimer, K. T., Grkovic, I., Briggs, C. A., Jones, D. C., Thomas, C. D. L., and Hodges, P., 2006. Effects of tensioning the lumbar fasciae on segmental stiffness during flexion and extension. Young investigator award winner. Spine, 31 (4), 397-405.
Barlett, J. W., and Frost, C., 2008. Reliability, repeatability and reproducibility: Analysis of measurement error in continuous variables. Ultrasound Obstet Gynecol, 31, 466-475.
Barrey, C., and Darnis, A., 2015. Current strategies for the restoration of adequate lordosis during lumbar fusion. World Journal of Orthopedics, 6 (1), 117-126.
Barrey, C., Roussouly, P., Le Huec, J.-C., D'acunzi, G., and Perrin, G., 2013. Compensatory mechanism contributing to keep the sagittal balance of the spine. European Spine Journal, 22 (Suppl 6), S834-S841.
Bartelink, D. L., 1957. The role of abdominal pressure in relieving the pressure on the lumbar intervertebral discs. Journal of Bone & Joint Surgery, 39B, 718-725.
Basmajian, J. V., and De Luca, C. J., 1985. Muscles alive: Their functions revealed by electromyography. 5th ed. London: Williams & Wilkins.
Beattie, P., Meyers, S., Stratford, P., Millard, R., and Hollenberg, G., 2000. Associations between patient report of symptoms and anatomic impairement visible on lumbar magnetic resonance imaging. Spine, 25 (7), 819-828.
Been, E., and Kalichman, L., 2014. Lumbar lordosis. The Spine Journal, 14 (1), 87-97. Beneck, G. J., Kulig, K., Landel, R. F., and Powers, C. M., 2005. The relationship between
lumbar segmental motion and pain response produced by a posterior-to-anterior force in persons with nonspecific low back pain. Journal of Orthopaedic & Sports Physical Therapy, 35 (4), 203-209.
Bergmark, A., 1989. Stability of the lumbar spine: A study in mechanical engineering. Acta Orthopaedica Scandinavia, 60 (Suppl 230), 1-54.
260
Biedermann, H., Shanks, F., and Inglis, J., 1990. Median frequency estimates of paraspinal muscles: Reliability analysis. Electromyography and Clinical Neurophysiology, 30, 83-88.
Biering-Sorensen, F., 1983. A prospective study of low back pain in a general population. Scand. J. Rehab Med, 15, 81-88.
Billis, E. V., Foster, N. E., and Wright, C. C., 2003. Reproducibility and repeatability: Errors of three groups of physiotherapists in locating spinal levels by palpation. Manual Therapy, 8 (4), 223-232.
Bland, J. M., Altman, D.G., 1986. Statistical methods for assessing agreement between two methods of clinical measurement. The Lancet (February 8), 307-310.
Boden, S. D., Wiesel, S.W., 1990. Lumbosacral segmental motion in normal individuals - have we been measuring instability properly? Spine, 15, 571-576.
Bogduk, N., 1980. A reappraisal of the anatomy of the human lumbar erector spinae. Journal of Anatomny, 131 (3), 525-540.
Bogduk, N., 1997. Clinical anatomy of the lumbar spine and sacrum. New York: Churchill Livingstone.
Bogduk, N., 2012. Clinical and radiological anatomy of the lumbar spine. Fifth Edition ed.: Churchill Livingstone.
Bogduk, N., Amevo, B., Pearcy, M., 1995. A biological basis for instantaneous centres of rotation of the vertebral column. Proc Instn Mech Engineers, 209, 177-183.
Bogduk, N., Macintosh, J. E., and Pearcy, M. J., 1992. A universal model of the lumbar back muscles in the upright position. Spine, 17 (8), 897-913.
Boocock, M. G., Jackson, J.A., 1994. Continuous measurement of lumbar posture using flexible electrogoniometers. Ergonomics, 37 (1), 175-185.
Boulay, C., Tardieu, C., Hecquet, J., Benaim, C., Mouilleseaux, B., Marty, C., Prat-Pradal, D., Legaye, J., Duval-Beaupere, G., and Pelissier, J., 2006. Sagittal alignment of spine and pelvis regulated by pelvic incidence: Standard values and predicition of lordosis. European Spine Journal, 15, 415-422.
Bradl, I., Morl, R., Scholle, H. C., Grame, R., Muller, R., and Grieshaber, R., 2005. Back muscle activation pattern and spectrum in defined load situations. Pathophsiology, 12, 275-280.
Branney, J., 2014. An observational study of changes in cervical inter-vertebral motion and the relationship with patient-reported outcomes in patients undergoing spinal manipulative therapy for neck pain. Thesis. Bournemouth University, Bournemouth.
Branney, J., and Breen, A. C., 2014. Does inter-vertebral range of motion increase after spinal manipulation? A prospective cohort study. Chiropractic & Manual Therapies, 22:24.
Breen, A., Muggleton, J., and Mellor, F., 2006. An objective spinal motion imaging assessment (osmia): Reliability, accuracy and exposure data. BMC Musculoskeletal Disorders, 7 (1), 1-10.
Breen A.C., Teyhan, D. S., Mellor, F. E., Breen, A. C., Wong, K. W. N., and Deitz, A., 2012. Measurement of intervertebral motion using quantitative fluoroscopy: Report of an international forum and proposal for use in the assessment of degenerative disc disease in the lumbar spine. Advances in Orthopaedics, 2012 (802350).
Breen, A. C., 2013. Low back pain: Identifying sub-groups, clinical prediction rules and measuring results. Paper presented at the World Federation of Chiropractic Biennial Congress, Durban, South Africa.
Breen, A. C., Dupac, M., and Osborne, N., 2015. Attainment rate as a surrogate indicator of the intervertebral neutral zone length in lateral bending: An in vitro proof of concept study Chiropractic & Manual Therapies, 23:28.
261
Breen, A. C., Teyhen, D. S., Mellor, F. E., Breen, A. C., Wong, K., and Deitz, A., 2012. Measurement of inter-vertebral motion using quantitative fluoroscopy: Report of an international forum and proposal for use in the assessment of degenerative disc disease in the lumbar spine. Advances in Orthopaedics, 1-10.
Bridwell, K. H., Sedgewick, T. A., O'brien, M. F., Lenke, L. G., and Baldus, C., 1993. The role of fusion and instrumentation in the treatement of degenerative spondylolisthesis with spinal stenosis. Journal of Spinal Disorders, 6 (6), 461-472.
Bronfort, G., Hass, M., Evans, R., Kawchuk, G., Dagenais, S., 2008. Evidence-informed management of chronic low back pain with spinal manipulation and mobilization. The Spine Journal, 8, 213-225.
Brooks, V. B., 1986. The neural basis of motor control. New York: Oxford University. Brownhill, K. A., 2010. Spinal motion patterns in intermittent idiopathic low back pain.
Thesis. Kings College, London. Buchecker, M., Stoggl, E., and Muller, E., 2013. Spine kinematics and trunk muscle activity
during bipedal standing using unstable footwear. Scandinavian Journal of Medicene & Science in Sports, 23, e194-e201.
Bull, M. J., McGregor A.H., 2000. Measuring spinal motion in rowers: The use of an electromagnetic device. Clinical Biomechanics, 15 (10), 772-776.
Burden, A., 2010. How should we normalize electromyograms obtained from healthy participants? What we have learned from over 25 years of research. Journal of Electromyography and Kinesiology, 20, 1023-1035.
Burnett, A. F., Cornelius, M.W., Dankaerts, W., O'sullivan, P.B., 2004. Spinal kinematics and trunk muscle activity in cyclists: A comparison between healthy controls and non-specific chronic low back pain subjects - a pilot investigation. Manual Therapy, 9, 211-219.
Butler, H. L., Hubley-Kozey, C. L., and Kozey, J. W., 2009. Electromyographic assessment of trunk muscle activation amplitudes during a simulated lifting task using pattern recognition techniques. Journal of Electromyography and Kinesiology, 19, e505-e512.
Buxton, D. F., and Peck, D., 1989. Neuromuscular spindles relative to joint complexities. Clinical Anatomy, 2, 211-224.
Callaghan, J. C. & Dunk, N. M. 2002. Examination of the flexion relaxation phenomenon in erector spinae muscles during short duration slumped sitting. Clinical Biomechanics, 353-360.
Cao, D.-Y., Pickar, J. G., Ge, W., Ianuzzi, A., and Khalsa, P. S., 2009. Position sensitivity of feline paraspinal muscle spindles to vertebral movement in the lumbar spine. Journal of Neurophysiology, 101, 1722-1729.
Cassisi, J. E., Robinson, M. E., O'conner, P., and Macmillan, M., 1993. Trunk strength and lumbar paraspinal muscle activity during isometric exercise in chronic low-back pain patients and controls. Spine, 18 (2), 245-251.
Cerveri, P., Pedotti, A., and Ferrigno, G., 2005. Kinematical models to reduce the effect of skin artifacts on marker-based human motion estimation. Journal of Biomechanics, 38 (11), 2228-2236.
Chakraverty, R., Pynsent, P., and Isaacs, K., 2007. Which spinal levels are identified by palpation of the iliac crests and the posterior superior iliac spines? Journal of Anatomny, 210, 232-236.
Chamoli, U., Korkusuz, M. H., Sabnis, A. B., Manolescu, A. R., Tsafnat, N., and Diwan, A. D., 2015. Global and segmental kinematic changes following sequential resection of posterior osteoligamentous structures in the lumbar spine: An in vitro biomechanical investigation using pure moment testing protocols. Proceedings of
262
the Institution of Mechanical Engineers, Part H: Journal of Engineering in Medicine, 229 (11), 812-821.
Chang, S. D., Crawford, N. R., Sonntag, V. K. H., and Dickman, C. A., 2011. Chapter 291 - basic principles of spinal internal fixation. In: Winn, H. R. ed. Youmans neurological surgery 6th edition: Saunders.
Chapman, A. R., Vicenzino, B., Blanch, P., Knox, J. J., and Hodges, P. W., 2010. Intramuscular fine-wire electromyography during cycling: Repeatability, normalisation and a comparison to surface electromyography. Journal of Electromyography and Kinesiology, 20 (1), 108-117.
Chiarotto, A., Deyo, R. A., Terwee, C. B., Boers, M., Buchbinder, R., Corbin, T. P., Costa, L. O. P., Foster, N. E., Grotle, M., Koes, B. W., Kovacs, F. M., Lin C-W, C., Maher, C. G., Pearson, A. M., Peul, W. C., Schoene, M. L., Turk, D. C., Van Tulder, M. W., and Ostelo, R. W., 2015. Core outcome domains for clinical trials in non-specific low back pain. European Spine Journal, 24 (6), 1127-1142.
Childs, J. D., and Cleland, J. A., 2006. Development and application of clinical prediction rules to improve decision making in physical therapist practice. Physical Therapy, 86, 122-131.
Chin, K. R., Kuntz, A. F., Bohlman, H. H., and Emery, S. E., 2006. Changes in the iliac crest-lumbar relationship from standing to prone. The Spine Journal, 6, 185-189.
Chiou, W.-K., Lee, Y-H., Chen, W-J., Lee, M-Y., Lin Y-H.,. 1996. A non-invasive protocol for the determination of lumbar spine mobility. Clinical Biomechanics, 11 (8), 474-480.
Chleboun, G. S., Amway, M. J., Hill, J. G., Root, K. J., Murray, H. C., and Serveev, A. V., 2012. Measurement of segmental lumbar spine flexion and extension using ultrasound imaging. Journal of Orthopaedic & Sports Physical Therapy, 42 (10), 880-885.
Cholewicki, J., Juluru, K., McGill, S.M., 1999. Intra-abdominal pressure mechanisms for stabilizing the lumbar spine. Journal of Biomechanics, 32, 13-17.
Cholewicki, J., and McGill, S. M., 1996. Mechanical stability of the in vivo lumbar spine: Implications for injury and chronic low back pain. Clinical Biomechanics, 11, 1-15.
Cholewicki, J., Panjabi, M.M., Khachatryan, A., 1997. Stabilizing function of trunk flexor-extensor muscles around a neutral spine posture. Spine, 22, 2207-2212.
Cholewicki, J., and Van Vliet Iv, J. J., 2002. Relative contribution of trunk muscles to the stability of the lumbar spine during isometric exertions. Clinical Biomechanics, 17, 99-105.
Chow, D. H. K., Luk, K. D. K., Evans, J. H., and Leong, J. C. Y., 1996. Effects of short anterior lumbar interbody fusion on biomechanics of neighbouring unfused segments. Spine, 21 (5), 549-555.
Christensen, H. W., 1999. Precision and accuracy of an electrogoniometer. Journal of Manipulative & Physiological Therapeutics, 22 (1), 10-14.
Clark, F. J., and Brugess, P. R., 1975. Slowly adapting receptors knee joint: Can they signal joint angle? Journal of Neurophysiology, 38 (6), 1448-1463.
Claus, A. P., Hides, J. A., Moseley, G. L., and Hodges, P. W., 2009. Different ways to balance the spine. Spine, 34 (6), E208-E214.
Claus, A. P., Hides, J. A., Moseley, G. L., and Hodges, P. W., 2016. Thoracic and lumbar posture behaviour in sitting tasks and standing: Progressing the biomechanics from observations to measurements. Applied Ergonomics, 53, 161-168.
Cohen, J., 1992. Quantitative methods in psychology - a power primer. Psychological Bulletin, 112 (1), 155-159.
Colloca, C. J., and Hinrichs, R. N., 2005. The biomechanical and clinical significance of the lumbar erector spinae flexion-relaxation phenomenon: A review of literature. Journal of Manipulative and Physiological Therapeutics, 28 (8), 623-631.
263
Costa-Santos, C., Bernardes, J., Ayres-De-Campos, D., Costa, A., and Costa, C., 2011. The limits of agreement and the intraclass correlation coefficient may be inconsistent in the interpretation of agreement. Journal of Clinical Epidemiology, 64, 264-269.
Coxon, A., 2011. Computer aided analysis of paraspinal electromyography. Thesis. James Cook University Hospital, Middlesbrough.
Cram, J. R., and Engstrom, D., 1986. Patterns of neuromuscular activity in pain and nonpain patients. Clinical Biofeedback and Health, 9, 106-116.
Cresswell, A. G., Grundstrom, H., and Thorstensson, A., 1992. Observations on intra abdominal pressure and patterns of abdominal intra-muscular activity in man. Acta Physiol Scand, 144, 409-418.
Crisco, J. J., Panjabi, M.M., 1991. The intersegmental and multisegmental muscles of the lumbar spine: A biomechanical model comparing lateral stabilizing potential. Spine, 16 (7), 793-799.
Crommert, M. E., Ekblom, M. M., and Thorstensson, A., 2011. Activation of transversus abdominis varies with postural demand in standing. Gait & Posture, 33, 473-477.
D'hooge, R., Hodges, P., Tsao, H., Hall, L., Macdonald, D., and Danneels, D., 2013. Altered trunk muscle coordination during rapid trunk flexion in people in remission of recurrent low back pain. Journal of Electromyography and Kinesiology, 23, 173-181.
Daneels, L. A., Cagnie, B. J., Cools, A. M., Banderstraeten, G. G., Cambier, D. C., Witvrouw, E. E., and De Cuyper, H. J., 2001. Intra-operator and inter-operator reliability of surface electromyography in the clinical evaluation of back muscles. Manual Therapy, 6 (3), 145-153.
Dankaerts, W., O'sullivan, P., Burnett, A., and Straker, L., 2006. Differences in sitting postures are associated with nonspecific chronic low back pain disorders when patients are subclassified. Spine, 31 (6), 698-704.
Dankaerts, W., O'sullivan, P. B., Burnett, A. F., Straker, L. M., and Danneels, L. A., 2004. Reliability of emg measurements for trunk muscles during maximal voluntary isometric contractions in healthy controls and clbp patients. Journal of Electromyography and Kinesiology, 14 (3), 333-342.
Dankaerts, W., O'sullivan, P., Burnett, A., Straker, L., 2006. Altered patterns of superficial trunk muscule activiation during sitting in nonspecific chronic low back pain patients. Importance of subclassification. Spine, 31 (17), 2017-2023.
Dankaerts, W., O'sullivan, P.B., Burnett, A.F., Straker, L.M., 2007. The use of a mechanism-based classification system to evaluate and direct management of a patient with non-specific chronic low back pain and motor control impairment - a case report. Manual Therapy, 12, 181-191.
Dankaerts, W., O'sullivan, P.B., Burnett, A.F., Straker, L.M., Davey, P., Gupta, R., 2009. Discriminating healthy controls and two clinical subgroups of nonspecific chronic low back pain patients using trunk muscle activation and lumbosacral kinematics of postures and movements. Spine, 34 (15), 1610-1618.
Davis, K. G., and Marras, W. S., 2000. The effects of motion on trunk biomechanics. Clin Biomech (Bristol, Avon), 15 (10), 703-717.
De Foa, J. L., Forrest, W., and Biedermann, H.-J., 1989. Muscle fibre direction of longissimus, iliocostalis and multifidus: Landmark-derived reference lines*. Journal of Anatomny, 163, 243-247.
De Luca, C. J., Gilmore, L. D., Kuznetsov, M., and Roy, S. H., 2010. Filtering the surface emg signal: Movement artifact and baseline noise contamination. Journal of Biomechanics, 43, 1573-1579.
De Nooij, R., Kallenberg, L. a. C., and Hermens, H. J., 2009. Evaluating the effect of electrode location on surface emg amplitude of the m. Erector spinae p. Longissimus dorsi. Journal of Electromyography and Kinesiology, 19, e257-e266.
264
De Vet, H. C. W., Terwee, C.B., Knol, D.L., Bouter, L.M., 2006. When to use agreement versus reliability measures. Journal of Clinical Epidemiology, 59 (10), 1033-1039.
De Zee, M., Hansen, L., Wong, C., Rasmussen, J., and Simonsen, E. B., 2007. A generic detailed rigid-body lumbar spine model. Journal of Biomechanics, 40, 1219-1227.
Deitz, A. K., Breen, A.C., Mellor, F.E., Teyhan, D.S., Panjabi, M.M., Wong, K.W.M., 2011. Kinematics of the aging spine: A review of past knowledge and survery of recent developments, with a focus on patient-management implications for the clinical practitioner. . In: Yue, G., Johnson, Khoo & Hochschuler (Eds) ed. The comprehensive treatment of the aging spine: Minimally invasive and advanced techniques 1 ed. Philadelphia: Saunders, 51-62.
Demoulin, C., Crielaard, J., Vanderthommen, M., 2007. Spinal muscle evaluation in healthy individuals and low-back-pain patients: A literature review. Joint Bone Spine, 74, 9-13.
Demoulin, C., Vanderthommen, M., Duysens, C., and Crielaard, J.-M., 2006. Spinal muscle evaluation using the sorensen test: A critical appraisal of the literature. Joint Bone Spine, 73 (1), 43-50.
Descarreaux, M., Lafond, D., Jeffrey-Gauthier, R., Centomo, H., and Cantin, V., 2008. Changes in the flexion relaxation response induced by lumbar muscle fatigue. BMC Musculoskeletal Disorders, 9:10.
Deyo, R. A., Dworkin, S. F., Amtmann, D., Andersson, G., Borenstein, D., Carragee, E., Carrino, J., Chou, R., Cook, K., Delitto, A., Goertz, C., Khalsa, P., Loeser, J., Macky, S., Panagis, J., Rainville, J., Tosteson, T., Turk, D., Von Korff, M., and Weiner, D. K., 2014. Report of the national institutes of health task force on research standards for chronic low back pain. Journal of Manipulative and Physiological Therapeutics, 37 (7), 449-467.
Dickey, J. P., Mcnorton, S., Potvin, J.R., 2003. Repeated spinal flexion modulates the flexion-relaxation phenomenon. Clinical Biomechanics, 18, 783-789.
Dolan, P., and Adams, M. A., 1993. The relationship between emg activity and extensor moment generation in the erector spinae muscles during bending and lifting activities. Journal of Biomechanics, 26 (4), 513-522.
Dolan, P., Kingma, I., De Looze, M. P., Van Dieen, J. H., Toussaint, H. M., Baten, C. T. M., and Adams, M. A., 2001. An emg technique for measuring spinal loading during asymmetric lifting. Clinical Biomechanics, 16 (Suppl 1), S17-S24.
Dolphens, M., Cagnie, B., Vleeming, A., Vanderstraeten, G., Coorevits, P., and Danneels, L., 2012. A clinical postural model of sagittal alignment in young adolescents before age at peak height velocity. European Spine Journal, 21, 2188-2197.
Doulgeris, J. J., Aghayev, K., Gonzalez-Blohm, S. A., Lee Iii, W. E., and Vrionis, F. D., 2015. Biomechanical comparison of an interspinous fusion device and bilateral pedical screw system as additional fixation for lateral lumbar interbody fusion. Clinical Biomechanics, 30, 205-210.
Downs, S. & Black, N. 1998. The feasibility of creating a checklist for the assessment of the methodological quality both of randomised and non-randomised studies of health care interventions. Journal of Epidemiology and Community Health 52, 377-384.
Du Rose, A., and Breen, A., 2016a. Relationships between paraspinal muscle activity and lumbar inter-vertebral range of motion. Healthcare, 4 (4).
Du Rose A., and Breen, A., 2016b. Relationships between lumbar inter-vertebral motion and lordosis in healthy adult males: A cross sectional cohort study. BMC Musculoskeletal Disorders, 17 (121).
Dufour, N., Thamsborg, G., Oefeldt, A., Lundsgaard, C., and Stender, S., 2010. Treatment of chronic low back pain. A randomized, clinical trial comparing group-based
265
multidisciplinary biopsychosocial rehabilitation and intensive individual therapist-assisted back muscle strengthening exercises. Spine, 35 (5), 469-476.
Dvorak, J., Panjabi, M.M., Chang, D.G., Theiler, R., Grob, D., 1991. Functional radiographic diagnosis of the lumbar spine: Flexion-extension and lateral bending. Spine, 16 (5), 562-571.
Edwards, W. T., Hayes, W. C., Posner, I., White, A. a. R., and Mann, R. W., 1987. Variation of lumbar spine stiffness with load. Journal of Biomechanical Engineering, 109, 35-42.
Ellingson, A. M., and Nuckey, D. J., 2015. Altered helical axis patterns of the lumbar spine indicate increased instablity with disc degeneration. Journal of Biomechanics, 48, 361-369.
Essendrop, M., Maul, I., Laubli, T., Riihimaki, H., and Schibye, B., 2002. Measures of low back function: A review of reproducibility studies. Clinical Biomechanics, 17, 235-249.
Farina, D., and Merletti, R., 2004. Estimation of average muscle fiber conduction velocity from two-dimensional surface emg recordings. Journal of Neuroscience Methods, 134 (2), 199-208.
Fernand, R., Fox, D.E., 1985. Evaluation of lumbar lordosis. Spine, 10 (9), 799-803. Fife-Schaw, C., 2000. Esrc workshop in modelling latent constructs: Structural equation
modelling and confirmatory factor analysis. Guildford: University of Surrey. Finneran, M. T., Mazanec, D., Marsolais, M. E., Marsolais, E. B., and Pease, W. S., 2003.
Large-array surface electromyography in low back pain. A pilot study. Spine, 28 (13), 1447-1454.
Floyd, W. F., Silver, P.H., 1951. Function of erectores spinae in flexion of the trunk. The Lancet, 1 (6647), 133-134.
Floyd, W. F., Silver, P.H.S., 1955. The function of the erectores spinae muscles in certain movements and postures in man. Journal of Physiology, 129, 184-203.
Fritz, J. M., Cleland, J.A., Childs, J.D., 2007. Subgrouping patients with low back pain: Evolution of a classification approach to physical therapy. Journal of Orthopaedic & Sports Physical Therapy, 37 (6), 290-302.
Fritz, J. M., Erhard, R.E., Hagen, B.F., 1998. Segmental instability of the lumbar spine. Physical Therapy, 78, 889-896.
Fritz, J. M., Whitman, J.M., Childs, J.D., 2005. Lumbar spine segmental mobility assessment: An examination of validity for determining intervention strategies in patients with low back pain. Archives of Physical Medicine and Rehabilitation, 86 (9), 1745-1752.
Frobin, F., Brinckmann, P., Lievseth, G., Biggemann, M., Reikeras, O., 1996. Precision measurement of segmental motion from flexion-extension radiographs of the lumbar spine. Clinical Biomechanics, 11 (8), 457-465.
Gagnon, D., Lariviere, C., and Loisel, P., 2001. Comparative ability of emg, optimization, and hybrid modelling approaches to predict trunk muscle forces and lumbar spine loading during dynamic sagittal plane lifting. Clinical Biomechanics, 16, 359-372.
Galibarov, P., Dendorfer, S., and Torholm, S., 2011. On modelling spine curvature dependent on muscular and external forces in multibody dynamics system. Paper presented at the ISN Congress XXIII, Brussels, Belguim.
Gardner-Morse, M. G., Stokes, I.A.F., 1998. The effects of abdominal muscle coactivation on lumbar spine stability. Spine, 23, 86-92.
Gatton, M. L., Pearcy, M.J., 1999. Kinematics and movement sequencing during flexion of the lumbar spine. Clinical Biomechanics, 14, 376-383.
Gay, R. E., Ilhareborde, B., Zhao, K., Boumediene, E., an, K., 2008. The effect of loading rate and degeneration on neutral region motion in human cadaveric lumbar motion segments. Clinical Biomechanics, 23 (1), 1-7.
266
Ge, W., Cao, D.-Y., Long, C. R., and Pickar, J. G., 2011. Plane of vertebral movement eliciting muscule lengthening history in the low back influences the decrease in muscle spindle responsiveness of the cat. Journal of Applied Physiology, 111 (6), 1735-1743.
Geisser, M. E., Haig, A. J., Wallbom, A. S., and Wiggert, E. A., 2004. Pain-related fear, lumbar flexion, and dynamic emg among persons with chronic musculoskeletal low back pain. Clinical Journal of Pain, 20 (2), 61-69.
Geisser, M. E., Ranavaya, M., Haig, A. J., Roth, R. S., Zucker, R., Ambroz, C., and Caruso, M., 2005. A meta-analytic review of surface electromyography among persons with low back pain and normal, healthy controls. The Journal of Pain, 6 (11), 711-726.
Gillet, P., 2003. The fate of the adjacent motion segments after lumbar fusion. Journal of Spinal Disorders & Techniques, 16 (4), 338-345.
Glassman, S. D., Bridwell, K., Dimar, J. R., Horton, W., Berven, S., and Schwab, F., 2005. The impact of positive sagittal balance in adult spinal deformity. Spine, 30 (18), 2024-2029.
Gracovetsky, S., Newman, N., Pawlowsky, M., Lanzo, V., Davey, B., Robinson, L., 1995. A database for estimating normal spinal motion derived from non-invasive measurements. Spine, 20 (9), 1036-1046.
Granata, K. P., and Marras, W. S., 2000. Cost-benefit of muscle cocontraction in protecting against spinal instabilty. Spine, 25 (11), 1398-1404.
Granata, K. P., and Orishimo, K. F., 2001. Response of trunk muscle coactivation to changes in spinal stability. Journal of Biomechanics, 34, 1117-1123.
Gregory, D. E., Brown, S. H. M., and Callaghan, J. P., 2008. Trunk muscle responses to suddenly applied loads: Do individuals who develop discomfort during prolonged standing respond differently. Journal of Electromyography and Kinesiology, 18 (3), 495-502.
Grigg, P., 2001. Properties of sensory neurons innervating synovial joints. Cell Tissues Organs, 169, 218-225.
Gubler, D., Mannion, A. F., Schenk, P., Gorelick, M., Helbling, D., Gerber, H., Toma, V., and Sprott, H., 2010. Ultrasound tissue doppler imaging reveals no delay in abdominal muscles feed-forward activity during rapid arm movements in patients with chronic low back pain. Spine, 35 (16), 1506-1513.
Guzman, J., Esmail, R., Karjalainen, K., Malmivaara, A., Irvin, E., Bombardier, C., 2001. Multidisciplinary rehabilitation for chronic low back pain: Systematic review. British Medical Journal, 322 (23 June), 1511-1516.
Hancock, M. J., Maher, C. G., Laslett, M., Hay, E., and Koes, B., 2011. Discussion paper: What happended to the 'bio' in the bio-psycho-social model of low back pain? European Spine Journal, 20, 2105-2110.
Hansen, L., De Zee, M., Rasmussen, J., Bandesen, T. B., Wong, C., and Simonsen, E. B., 2006. Anatomy and biomechanics of the back muscles in the lumbar spine with reference to biomechanical modeling. Spine, 31 (17), 1888-1899.
Harada, M., Abumi, K., Ito, M., Kaneda, K., 2000. Cineradiographic motion analysis of normal lumbar spine during forward and backward flexion. Spine, 25, 1932-1937.
Harvey, S., Hukins, D., Smith, F., Wardlaw, D., and Kader, D., 2015. Measurement of lumbar spine intervertebral motion in the sagittal plane using videofluoroscopy. Journal of Back and Musculoskeletal Rehabilitation (Preprint), 1-13.
Harvey, S. B., Hukins, D.W., 1998. Measurement of lumbar spinal flexion-extension kinematics from lateral radiographs: Simulation of the effects of out-of-plane movement and errors in reference point placement. Medical Engineering and Physics, 20, 403-409.

267
Hasegewa, K., Kitahara, K., Hara, T., Takano, K., and Shimoda, H., 2009. Biomechanical evalualtion of segmental instability in degenerative lumbar spondlolisthesis. European Spine Journal, 18, 465-470.
Hashemirad, F., Talebian, S., Hatef, B., and Kahlaee, A. H., 2009. The relationship between flexibility and emg activity pattern of the erector spinae muscles during trunk flexion-extension. Journal of Electromyography and Kinesiology, 19 (5), 746-753.
Hashmi, J. A., Baliki, M. N., Huang, L., Baria, A. T., Torbey, S., Hermann, K. M., Schnitzer, T. J., and Apkarian, A. V., 2013. Shape shifting pain: Chronification of back pain shifts brain representation from nociceptive to emotional circuits. Brain 136 (Pt 9), 2751-2768.
Haskins, R., Rivett, D.A., Osmotherly, P.G., 2012. Clinical predicition rules in the physiotherapy management of low back pain: A systematic review. Manual Therapy, 17, 9-21.
Hay, D., Wachowiak, M. P. & Graham, R. B. 2016. Evaluating the relationship between muscle activation and spine kinematics through wavelet coherence. Journal of Applied Biomechanics.
Hayes, M. A., Howard, T.C., Gruel, C.R., Kopta, J.A., 1989. Roentgenographic evaluation of lumbar spine flexion-extension in asymptomatic individuals. Spine, 14 (3), 327-332.
Hebert, J. J., Koppenhaver, S. L., and Walker, B. F., 2011. Subgrouping patients with low back pain: A treatment-based approach to classification. Sports Health: A Multidisciplinary Approach, 3, 534-542.
Hemingway, M. A., Biedermann, H.-J., and Inglis, J., 1995. Electromyographic recordings of paraspinal muscles: Variations related to subcutaneous tissue thickness. Biofeedback and Self-Regulation, 20 (1), 39-49.
Hemming, R., Sheeran, L., Van Deursen, R. W. M., and Sparkes, V., 2015. Regional spinal kinematics during static postures: Discrimination between subclassified people with non-specific chronic low back pain (nsclpb) and healthy controls. Orthopaedic Proceedings: A Supplement of the Bone & Joint Journal, 97-B (S2), 17.
Hendershot, B., Bazrgari, B., Muslim, K., Toosizadeh, N., Nussbaum, M. A., and Madigan, M. L., 2011. Disturbance and recovery of trunk siffness and reflexive muscle responses following prolonged trunk flexion: Influences of flexion angle and duration. Clinical Biomechanics, 26, 250-256.
Herman, K. M., and Barnes, W. S., 2001. Effects of eccentric exercise on trunk extensor torque and lumbar paraspinal emg. Medicine & Science in Sports & Exercise, 33 (6), 971-977.
Hermens, H. J., Freriks, B., Merletti, R., Stegeman, D., Blok, J., Rau, G., Disselhorst-Klug, C., and Hagg, G., 1999. European recommendations for surface electromyography. Results of the seniam project.
Hermens, H. J., and Vollenbroek-Hutten, M. M. R., 2004. Effects of electrode dislocation on electromyographic activity and relative rest time: Effectiveness of compensation by a normalisation procedure. Medical & Biological Engineering & Computing, 42, 502-508.
Heylings, D. J. A., 1978. Supraspinous and interspinous ligaments of the human lumbar spine. Journal of Anatomny, 125 (1), 127-131.
Hicks, G. E., Fritz, J.M., Delitto, A., McGill, S.M., 2005. Preliminary development of a clincial prediction rule for determining which patients with low back pain will respond to stabilization exercise program. Archives of Physical Medicine and Rehabilitation, 86, 1753-1762.
Hicks, G. E., Fritz, J.M., Delitto, A., Mishock J., 2003. Interrater reliability of clinical examination measures for identification of lumbar segmental instability. Archives of Physical Medicine and Rehabilitation, 84, 1858-1864.
268
Hill, J. C., Whitehurst, D.G.T., Lewis, M., Bryan, S., Dunn, K.M., Foster, N.E., Konstantinou, K., Main, C.J., Mason, E., Somerville, S., Sowden, G., Vohora, D., Hay, E.M., 2011. Comparison of stratified primary care management for low back pain with current best practice (start back): A randomised controlled trial. The Lancet (September 29).
Hodges, P., Holm, A. K., Holm, S., Ekstrom, L., Cresswell, A., Hansson, G. A., and Thorstensson, A., 2003. Intervertebral stiffness of the spine is increased by evoked contraction of transversus abdominis and the diaphragm: In vivo porcine studies. Spine, 28 (23), 2594-2601.
Hodges, P., Van Den Hoorn, W., Dawson, A., and Cholewicki, J., 2009. Changes in the mechanical properties of the trunk in low back pain may be associated with recurrence. Journal of Biomechanics, 42, 61-65.
Hodges, P. W., 2001. Changes in motor planning of feedforward postural responses of the trunk muscles in low back pain. Experimental Brain Research, 141, 261-266
Hodges, P. W., and Bui, B. H., 1996. A comparison of computer-based methods for the determination of onset of muscle contraction using electromyography. Electroencephalography and Clinical Neurophysiology, 101, 511-519.
Hodges, P. W., Cholewicki, J., and Van Dieen, J. H., 2013. Spinal control: The rehabilitation of back pain: State of the art and science. Churchill Livingstone Elsevier.
Hodges, P. W., and Moseley, G. L., 2003. Pain and motor control of the lumbopelvic region: Effect and possible mechanisms. Journal of Electromyography and Kinesiology, 13 (4), 361-370.
Hodges, P. W., and Richardson, C. A., 1999. Altered trunk muscle recruitment in people with low back pain with upper limb movement at different speeds. Archives of Physical Medicine and Rehabilitation, 80 (9), 1005-1012.
Hodges, P. W., Richardson, C.A., 1996. Inefficient muscular stabilization of the lumbar spine associated with low back pain: A motor control evaluation of transversus abdominis. Spine, 21 (22), 2640-2650.
Hodges, P. W., Richardson, C.A., 1998. Delayed postural contraction of transversus abdominis in low back pain associated with movement of the lower limb. Journal of Spinal Disorders, 11 (1), 46-56.
Hoffman, S. L., Johnson, M. B., Zou, D., and Van Dillen, L. R., 2012. Differences in end-range lumbar flexion during slumped sitting and forward bending between low back pain subgroups and genders. Manual Therapy, 17 (2), 157-163.
Hoy, D., Bain, C., Williams, G., March, L., Brooks, P., Blyth, F., Woolf, A., Vos, T., and Buchbinder, R., 2012. A systematic review of the global prevalence of low back pain. Arthritis & Rheumatism, 64 (6), 2028-2037.
Hsu, C.-J., Chang, Y.-W., Chou, W.-Y., Chiou, C.-P., Chang, W.-N., and Wong, C.-Y., 2008. Measurement of spinal range of motion in healthy individuals using an electromagnetic tracking device. Journal of Neurosurgery Spine, 8 (2), 135-142.
Hu, Y., Siu, S. H. F., Mak, J. N. F., and Luk, K. D. K., 2010. Lumbar muscle electromyographic dynamic topography during flexion-extension. Journal of Electromyography and Kinesiology, 20 (2), 246-255.
Hu, Y., Wong, Y.L., Lu, W.W., Kawchuk, G.N., 2009. Creation of an asymmetrical gradient of back muscle activity and spinal stiffness during asymmetrical hip extension. Clinical Biomechanics, 24, 799-806.
Hug, F., 2011. Can muscle coordination be precisely studied by surface electromygraphy? Journal of Electromyography and Kinesiology, 21 (1), 1-12.
Huijing, P. A., 2003. Muscular force transmission necesitates a multilevel integrative approach to the analysis of function of skeletal muscle. Exercise and Sport Sciences Reviews, 31 (4), 167-175.
269
Hukins, D. W. L., Kirby, M. C., Sikoryn, T. A., Aspden, R. M., and Cox, A. J., 1990. Comparison of structure, mechanical properties, and functions of lumbar spinal ligaments. Spine, 15 (8), 787-795.
Iatridis, J. C., Nicoll, S. B., Michalek, A. J., Walter, B. A., and Gupta, M. S., 2013. Role of biomechanics on intervertebral disc degeneration and regenerative therapies: What needs repairing in the disc and what are promising biomaterials for its repair? Spine Journal, 13 (3), 243-262.
Iguchi, T., Kanemura, A., Kasahara, K., Sato, K., Kurihara, A., Yoshiya, S., Nishida, K., Miyamoto, H., Doita, M., 2004. Lumbar instability and clinical symptoms. Which is the more critical factor for symptoms: Sagittal translation or segment angulation? J Spinal Disord Tech, 17, 284-290.
Indahl, A., Kaigle, A., Reikeras, O., and Holm, S., 1995. Electromyographic response of the porcine multifidus musculature after nerve stimulation. Spine, 20 (24), 2652-2658.
Indahl, A., Kaigle, A.M., Reikeras, O., Holm, S.H., 1997. Interaction between the porcine lumbar intervetebral disc, zygapophysial joints and paraspinal muscles. Spine, 22, 2834-2840.
Jackson, R. P., Mcmanus, A.C., 1994. Radiographic analysis of sagittal plane alignment and balance in standing volunteers and patients with low back pain matched for age, sex and size. Spine, 19 (14), 1611-1618.
Jobson, S. A., Hopker, J., Arkesteijn, M., and Passfield, L., 2013. Inter- and intra-session reliability of muscle activity patterns during cycling. Journal of Electromyography and Kinesiology, 23 (1), 230-237.
Johansson, H., Sjolander, P., and Sojka, P., 1991. Receptors in the knee joint ligaments and their role in the biomechanics of the joint. Critical Reviews in Biomedical Engineering, 18 (5), 341-368.
Joliffe, I. T., 2002. Principal component analysis. 2nd ed. New York: Springer-Verlag. Jonsson, B., Omfeldt, M., and Rundren, A., 1968. Discomfor from the use of wire electrodes
for electromyograhy. Electromyography, 8 (1), 5-17. Julious, S. A., 2005. Sample size of 12 per group rule of thumb for a pilot study.
Pharmaceutical Statistics, 4, 287-291. Kaigle, A. M., Holm, S.H., Hansson, T.H., 1995. Experimental instability in the lumbar spine.
Spine, 20 (4), 421-430. Kaigle, A. M., Wesberg, P., Hansson, T.H., 1998. Muscular and kinematic behavior of the
lumbar spine during flexion-extension. Journal of Spinal Disorders, 11 (2), 163-174. Kaito, T., Hosono, N., Mukai, Y., Makino, T., Fuji, T., and Yonenobu, K., 2010. Induction of
early degeneration of the adjacent segment after posterior lumbar interbody fusion by excessive distraction of lumbar disc space. Journal of Neurosurgery Spine, 12 (6), 671-679.
Kanayama, M., Abumi, K., Kaneda, K., Tadano, S., Ukai, T., 1996. Phase lag of the intersegmental motion in flexion-extension of the lumbar and lumbosacral spine: An in vivo study. Spine, 21 (12), 1416-1422.
Kanayama, M., Cunningham, B.W., Weiss, J.C., Parker, L.M., Kaneda, K., Mcafree, P.C., 1998. The effects of rigid spinal instrumentation and solid bony fusion on spinal kinematics: A posterolateral spinal arthrodesis model. Spine, 23, 767-773.
Kanemura, A., Doita, M., Kasahara, K., Sumi, M., Kurosaka, M., Iguchi, T., 2009. The influence of sagittal instability factors on clinical lumbar spinal symptoms. Journal of Spinal Disorders and Techniques, 22 (7), 479-485.
Kang, Y.-M., Choi, W.-S., and Pickar, J. G., 2002. Electrophysiologic evidence for an intersegmental reflex pathway between lumbar paraspinal tissues. Spine, 27 (3), E56-E63.
270
Karayannis, N. V., Smeets, R. J. E. M., Van Den Hoorn, W., and Hodges, P. W., 2013. Fear of movement is related to trunk stiffness in low back pain. PLoS One, 8 (6), e67779.
Karjalainen, K., Malmivaara, A., Van Tulder, M., Roine, R., Jauhiainen, M., Hurri, H., and Koes, B., 2001. Multidisciplinary biopsychosocial rehabilitation for subacute low back pain in working-age adults. A systematic review within the framework of the cochrane collaboration back review group. Spine, 26 (3), 262-269.
Kasman, G. S., Cram, J. R., and Wolf, S. L., 1997. Clinical applications in surface electromyography: Chronic musculoskeletal pain. United States: Aspen Publishers Inc.
Kavcic, N., Grenier, S., McGill, S.M., 2004. Determining the stabilizing role of individual torso muscles during rehabilitation exercises. Spine, 29 (11), 1254-1265.
Keessen, W., During, J., Beeker, T.W., Goudfrooij, H., Crowe, A., 1984. Recordings of the movement at the intevertebral segment l5-s1: A technique for the determination of the movement in the l5-s1 spinal segment by using three specified postural positions. Spine, 9 (1), 83-90.
Kellgren, J. H., and Lawrence, J. S., 1958. Osteo-arthrosis and disc degeneration in an urban population. Annals of Rheumatic Diseases, 17, 388-397.
Kent, P., Keating, J., 2004. Do primary-care clinicians think that nonspecific low back pain is one condition? Spine, 29 (9), 1022-1031.
Keorochana, G., Taghavi, C.E., Lee, K-B., Yoo, J.H., Liao, J-C., Fei, Z., Wang, J.C., 2011. Effect of sagittal alignment on kinematic changes and degree of disc degeneration in the lumbar spine. Spine, 36 (11), 893-898.
Kienbacher, T., Ferhmann, E., Habenicht, R., Koller, D., Oeffel, C., Kollmitzer, J., Mair, P. & Ebenbichler, G. R. 2016. Age and gender related neuromuscular pattern during trunk flexion-extension in chronic low back pain patients. Journal of NeuroEngineering and Rehabilitation, 13.
Kim, H. W., Ko, Y. J., Rhee, W. I., Lee, J. S., Lim, J. E., Lee, S. J., Im, S., and Lee, J. I., 2007. Interexaminer reliability and accuracy of posterior superior iliac spine and iliac crest palpation for spinal level estimations. Journal of Manipulative and Physiological Therapeutics, 30 (5), 386-389.
Kim, J.-S., Kang, M.-H., Jang, J.-H., and Oh, J.-S., 2015. Comparison of selective electromyographic activity of the superficial lumbar multifidus between prone trunk extension and four-point kneeling arm and leg lift exercises. Journal of Physical Therapy Science, 27 (4), 1037-1039.
Kim, M.-H., Yoo, W.-G., and Choi, B.-R., 2013. Differences between two subgroups of low back pain patients in lumbopelvic rotation and symmetry in the erector spinae and hamstring muscles during trunk flexion when standing. Journal of Electromyography and Kinesiology, 23 (2), 387-393.
Kim, Y. J., Bridwell, K. H., Lenke, L. G., Rhim, S., and Cheh, G., 2006. An analysis of sagittal spinal alignment following long adult lumbar instrumentation and fusion to l5 or s1: Can we predict ideal lumbar lordosis? Spine, 31 (20), 2343-2352.
Kingma, I., Staudenmann, D., and Van Dieen, J. H., 2007. Trunk muscle activation and associated lumbar spine joint shear forces under different levels of external forward force applied to the trunk. Journal of Electromyography and Kinesiology, 17, 14-24.
Kippers, V., and Parker, A. W., 1984. Posture related to myoelectric silence of erectores spinae during trunk flexion. Spine, 9 (7), 740-745.
Kirkaldy-Willis, W. H., Farfan, H.F., 1982. Instability of the lumbar spine. Clinical Orthopaedics and Related Research, 165, 110-123.
Kiter, E., Karaboyun, T., Tufan, A. C., and Acar, K., 2010. Immunohistochemical demonstration of nerve ednings in iliolumbar ligament. Spine, 35 (4), E101-E104.

271
Knottner J., Audige, L., Brorson, S., Donner, A., Gajewski, B. J., Hrobjartsson, A., Roberts, C., Shoukri, M., and Streiner, D. L., 2011. Guidelines for reporting reliability and agreement studies (grras) were proposed. Journal of Clinical Epidemiology, 64, 96-106.
Knutson, L. M., Soderberg, G. L., Ballantyne, B. T., and Clarke, W. R., 1994. A study of various normalization procedures for within day electromyographic data. Journal of Electromyography and Kinesiology, 4 (1), 47-59.
Kollmitzer, J., Ebenbichler, G. R., and Kopf, A., 1999. Reliability of surface electromyographic measurements. Clinical Neurophysiology, 110, 725-734.
Konrad, P., 2006. The abc of emg. A practical introduction to kinesiological electromyography. Vol. Version 1.4.
Kottner, J., and Streiner, D. L., 2011. The difference between reliability and agreement - letter to the editor. Journal of Clinical Epidemiology, 64, 701-702.
Kozanek, M., Wang, S., Passias, P.G., Xia, Q., Li, G., Bono, C.M., Wood, K.B., Li, G., 2009. Range of motion and orientation of the lumbar facet joints in vivo. Spine, 34 (19), E689-E696.
Kravitz, E., Moore, M. E., and Glaros, A., 1981. Paralumbar muscle activity in chronic low back pain. Archives of Physical Medicine and Rehabilitation, 62 (4), 172-176.
Kuiken, T. A., Lowery, M. M., and Stoykov, N. S., 2003. The effect of subcutaneous fat on myoelectric signal amplitude and cross-talk. Prosthetics and Orthotics International, 27, 48-54.
Kulig, K., Powers, C., Landel, R., Chen, H., Fredericson, M., Guillet, M., and Butts, K., 2007. Segmental lumbar mobility in individuals with low back pain: In vivo assessment during manual and self-imposed motion using dynamic mri. BMC Musculoskeletal Disorders, 8 (1).
Kuriki, H. U., Micolis De Azevedo, F., De Faria Negrao Filho, R., and Alves, N., 2011. Comparison of different analysis techniques for the determination of muscle onset in individuals with patellofemoral pain syndrome. Journal of Electromyography and Kinesiology, 21 (6), 982-987.
Kuriyama, N., and Ito, H., 2005. Electromyographic functional analysis of the lumbar spinal muscles with low back pain. Journal of Nippon Medical School, 72 (3), 165-173.
Lariviere, C., and Arsenault, A. B., 2008. On the use of emg-ratios to assess the coordination of back muscles. Clinical Biomechanics, 23, 1209-1219.
Lariviere, C., Arsenault, A. B., Gravel, D., Gagnon, D., and Loisel, P., 2001. Median frequency of the electromyographic signal: Effect of time-window location on brief step contractions. Journal of Electromyography and Kinesiology, 11, 65-71.
Lariviere, C., Gagnon, D., Arsenault, A. B., Gravel, D., and Loisel, P., 2005. Electromyographic activity imbalances between contralateral back muscles: An assessment of measurement properties. Journal of Rehabilitation Research & Development, 42 (2), 235-250.
Lariviere, C., Gagnon, D., and Genest, K., 2009. Offering proper feedback to control for out-of-plane lumbar moments influences the activity of trunk muscles during unidirectional isometric trunk exertions. Journal of Biomechanics, 42, 1498-1505.
Lariviere, C., Gagnon, D., and Genest, K., 2014. Controlling for out-of-plane lumbar moments during unidirectional trunk efforts: Learning and reliability issues related to trunk muscle activation estimates. Journal of Electromyography and Kinesiology, 24, 531-541.
Lariviere, C., Gagnon, D., and Loisel, P., 2000. The comparison of trunk muscles emg activiation between subjects with and without chronic low back pain during flexion-extension and lateral bending tasks. Journal of Electromyography and Kinesiology, 10, 79-91.
272
Lariviere, C., Gagnon, D., Loisel, P., 2002. A biomechanical comparison of lifting techniques between subjects with and without chronic low back pain during freestyle lifting and lowering tasks. Clinical Biomechanics, 17 (2), 89-98.
Le Huec, J.-C., Faundez, A., Dominguez, D., Hoffmeyer, P., and Aunoble, S., 2015. Evidence showing the relationship between sagittal balance and clinical outcomes in surgical treatment of degenerative spinal diseases: A literature review. International Orthopaedics, 39 (1), 87-95.
Le Huec, J. C., Charosky, S., Barrey, C., Rigal, J., and Aunoble, S., 2011. Sagittal imbalance cascade for simple degenerative spine and consequences: Algorithm of decision for appropriate treatment. European Spine Journal, 20 (Suppl 5), 699-703.
Leboeuf-Yde, C., and Manniche, C., 2001. Low back pain: Time to get off the treadmill. Journal of Manipulative and Physiological Therapeutics, 24 (1), 63-66.
Lee, C. K., 1988. Accelerated degeneration of the segment adjacent to a lumbar fusion. Spine, 13 (3), 375-377.
Lee, C. K., and Langrana, N. A., 1984. Lumbosacral spinal fusion. Spine, 9 (6), 574-581. Lee, C. S., Hwang, C. J., Lee, S.-W., Ahn, Y.-J., Kim, Y.-T., Lee, D.-H., and Lee, M. Y., 2009. Risk
factors for adjacent segment disease after lumbar fusion. European Spine Journal, 18 (11), 1637-1643.
Lee, R. Y., 1995. The biomechanical basis of spinal manual therapy. Thesis. University of Strathclyde.
Lee, S., Wong, K., Chan, M., Yeung, H., Chiu, J., Leong, J. . 2002. Development and validation of a new technique for assessing lumbar spine motion. Spine, 27 (8), E215-E220.
Lee, Y.-P., Sclafani, J., and Garfin, S. R., 2011. Lumbar pseudarthrosis: Diagnosis and treatment. Seminars in Spine Surgery, 23, 275-281.
Lehman, G. J., 2004. Biomechanical assessments of lumbar spinal function. How low back pain sufferers differ from normals. Implications for outcome measures research. Part i: Kinematic assessments of lumbar function. Journal of Manipulative & Physiological Therapeutics, 27 (1), 57-62.
Lehman, G. J., and McGill, S. M., 1999. The importance of normalization in the interpretation of surface electromyography: A proof of principle. Journal of Manipulative and Physiological Therapeutics, 22 (7), 444-446.
Leinonen, V., Kankaanpaa, M., Airaksinen, O., and Hanninen, O., 2000. Back and hip extensor activities during trunk flexion/extension: Effects of low back pain and rehabilitation. Archives of Physical Medicine and Rehabilitation, 81, 32-37.
Leong, J. C., Luk, K.D., Chow, D.H., Woo, C.W., 1987. The biomechanical functions of the iliolumbar ligament in maintaining stability of the lumbosacral junction. Spine, 12 (7), 669-674.
Li, G., Wang, S., Passias, P., Xia, Q., Li, G., Wood, K., 2009. Segmental in vivo vertebral motion during function human lumbar spine activities. European Spine Journal, 18, 1013-1021.
Li, L., and Caldwell, G. E., 1998. Muscle coordination in cycling: Effect of surface incline and posture. Journal of Applied Physiology, 85, 927-934.
Lindstroem, R., Graven-Nielsen, T., and Falla, D., 2012. Current pain and fear of pain contribute to reduced maximum voluntary contraction of neck muscles in patients with chronic neck pain. Archives of Physical Medicine and Rehabilitation, 93 (3), 2042-2048.
Liu, A., Wang, J. & Hu, Y. 2011. Network modeling and analysis of lumbar muscle surface EMG signals during flexion–extension in individuals with and without low back pain. Journal of Electromyography and Kinesiology, 913–921.
273
Lotters, F., Burdorf, A., Kuiper, J., and Miedema, H., 2003. Model for the work-relatedness of low-back pain. Scandinavian Journal of Work, Environment and Health, 29 (6), 431-440.
Lucas, N. P., Macaskill, P., Irwig, L., Bogduk, N., 2010. The development of a quality appraisal tool for studies of diagnostic reliability (qarel). Journal of Clinical Epidemiology, 63, 854-861.
Luhring, S., Schinkel-Ivy, A., and Drake, J. D. M., 2015. Evaluation of the lumbar kinematic measures that most consistently characterize lumbar muscle activation patterns during trunk flexion: A cross-sectional study. Journal of Manipulative and Physiological Therapeutics, 38 (1), 44-50.
Macdonald, D., Moseley, G. L., and Hodges, P. W., 2010. People with recurrent low back pain respond differently to trunk loading despite remission from symptoms. Spine, 37 (7), 818-824.
Macdonald, D., Moseley, G.L., Hodges, P.W., 2009. Why do some patients keep hurting their back? Evidence of ongoing back muscle dysfunction during remission from recurrent back pain. Pain, 142 (3), 183-188.
Macdonald, D. A., Moseley, G. L., and Hodges, P. W., 2006. The lumbar multifidus: Does the evidence support clinical beliefs? Manual Therapy, 11, 254-263.
Macedo, L. G., Maher, C. G., Hancock, M. J., Kamper, S. J., Mculey, J. H., Stanton, T. R., Stafford, R., and Hodges, P. W., 2014. Predicting response to motor control exercises and graded activity for patients with low back pain: Preplanned secondary analysis of a randomized controlled trial. Physical Therapy, 94 (11), 1543-1554.
Macedo, L. G., Maher, C.G., Latimer, J., Mcauley, J.H., 2009. Motor control exercise for persistent, nonspecific low back pain: A systematic review. Physical Therapy, 89 (1), 9-25.
Macintosh, J. E., Bogduk, N., and Pearcy, M. J., 1993. The effects of flexion onthe geometry and actions of the lumbar erector spinae. Spine, 18 (7), 884-893.
Magee, D. J., Zachazewski, J. E., Quillen, W. S., and Manske, R. C., 2015. Pathology and intervention in musculoskeletal rehabilitation. Second edition. Saunders.
Mahato, N. K., 2013. Complexity of neutral zones, lumbar stability and subsystem adaptations: Probable alterations in lumbosacral transitional vertebrae (lstv) subtypes. Medical Hypotheses, 80 (1), 61-64.
Mannion, A., Troke, M., 1999a. A comparison of two motion analysis devices used in the measurement of lumbar spinal mobility. Clinical Biomechanics, 14, 612-619.
Mannion, A. F., 1999b. Fibre type characteristics and function of the human paraspinal muscles: Normal values and changes in association with low back pain. Journal of Electromyography and Kinesiology, 9, 363-377.
Mannion, A. F., Connolly, B., Wood, K., Dolan, P., 1997. The use of surface emg power spectral analysis in the evaluation of back muscle function. Journal of Rehabilitation Research and Development, 34 (4), 427-439.
Mannion, A. F., and Dolan, P., 1994. Electromyographic median frequency changes during isometric contraction of the back extensors to fatigue. Spine, 19 (11), 1223-1229.
Mannion, A. F., Dumas, G. A., Cooper, R. G., Espinosa, F. J., Faris, M. W., and Stevenson, J. M., 1997. Muscle fibre size and type distribution in thoracic and lumbar regions of erector spinae in healthy subjects without low back pain: Normal values and sex differences. Journal of Anatomny, 190, 505-513.
Mannion, A. F., Knecht, K., Balaban, G., Dvorak, J., and Grob, D., 2004. A new skin-surface device for measuring the curvature and global and segmental ranges of motion of the spine: Reliability of measurements and comparison with data reviewed from the literature. European Spine Journal, 13 (2), 122-136.
274
Mao, N., Shi, J., He, D., Xie, Y., Bi, Y., Wei, X., Shi, Z., and Li, M., 2014. Effect of lordosis angle change after lumbar/lumbosacral fusion on sacrum angluar displacement: A finite element study. European Spine Journal, 23, 2369-2374.
Marras, S. S., Davis, K. G., Ferguson, S.A., Lucas, B.R., Gupta, P., 2001. Spine loading characteristics of patients with low back pain compared with asymptomatic individuals. Spine, 26 (23), 2566-2574.
Marras, W. S., and Mirka, G. A., 1990. Muscle activities during asymmetric trunk angular accelerations. Journal of Orthopaedic Research, 8 (6), 824-832.
Marras, W. S., and Wongsam, P. E., 1986. Flexibility and velocity of the normal and impaired lumbar spine. Archives of Physical Medicine and Rehabilitation, 67, 213-217.
Mason, V., 1994. The prevalence of back pain in great britain: A report on opcs omnibus survey data produced on behalf of the department of health.: Office of Population Censuses & Surveys Social Survey Division.
Mathieu, P. A., and Fortin, M., 2000. Emg and kinematics of normal subjects performing trunk flexion/extensions freely in space. Journal of Electromyography and Kinesiology, 10 (3), 197-209.
May, S., Rosedale, R., 2009. Prescriptive clinical prediction rules in back pain research: A systematic review. Journal of Manipulative & Physiological Therapeutics, 17 (1), 36-45.
Mayer, T. G., Gatchel, R.J., Keeley, J., McGeary, D., Dersh, J., Anagnostis, C., 2004. A randomized clinical trial of treatment for lumbar segmental rigidity. Spine, 29 (20), 2199-2205.
Mayer, T. G., Kondraske, G., Brady Beals, S., Gatchel, Robert J., 1997. Spinal range of motion: Accuracy and sources of error with inclinometric measurement. Spine, 22 (17), 1976-1984.
Mayer, T., Neblett, R., Brede, E. & Gatchel, R. J. 2009. The Quantified Lumbar Flexion-Relaxation Phenomenon Is a Useful Measurement of Improvement in a Functional Restoration Program. Spine, 34, 2458–2465.
Mayer, T. G., Tencer, A.F., Kristoferson, S., Mooney, V., 1984. Use of noninvasive techniques for quantification of spinal range-of-motion in normal subjects and chronic low-back dysfunction patients. Spine, 9 (6), 588-595.
McGaugh, J. M., Brismee, J. M., Dedrick, G. S., Jones, E. A., and Sizer, P. S., 2007. Comparing the anatomical consistency of the posterior superior iliac spine to the iliac crest as reference landmarks for the lumbopelvic spine: A retrospective radiological study. Clinical Anatomy, 20, 819-825.
McGill, S., and Norman, R. W., 1985. Dynamically and statically determined low back moments during lifting. Journal of Biomechanics, 18 (2), 877-879, 881-885.
McGill, S. M., 1992. A myoelectrically based dynamic three-dimensional model to predict loads on lumbar spine tissues during lateral bending. Journal of Biomechanics, 25 (4), 395-414.
McGill, S. M., and Cholewicki, J., 2001. Biomechanical basis for stability: An explanation to enhance clinical utility. Journal of Orthopaedic & Sports Physical Therapy, 31 (2), 96-100.
McGill, S. M., Cholewicki, J., and Peach, J. P., 1997. Methodological considerations for using inductive sensors (3space isotrak) to monitor 3-d orthopaedic joint motion. Clinical Biomechanics, 12 (3), 190-194.
McGill, S. M., Grenier, S., Kavcic, N., and Cholewicki, J., 2003. Coordination of muscle activity to assure stability of the lumbar spine. Journal of Electromyography and Kinesiology, 13, 353-359.
275
McGill, S. M., Hughson, R.L., Parks, K., 2000. Changes in lumbar lordosis modify the role of the extensor muscles. Clinical Biomechanics, 15, 777-780.
McGill, S. M., Kippers, V., 1994. Transfer of loads between lumbar tissues during the flexion-relaxation phenomenon. Spine, 19 (19), 2190-2196.
McGorry, R. W., Hsiang, S. M., Fathallah, F. A., and Clancy, E. A., 2001. Timing of activation of the erector spinae and hamstrings during a trunk flexion and extension task. Spine, 26 (4), 418-425.
McGorry, R. W., and Lin, J.-H., 2012. Flexion relaxation and its relation to pain and function over the duration of a back pain episode. PLoS ONE, 7 (6), e39207.
McGraw, K. O., Wong, S.P., 1996. Forming inferences about some intraclass correlation coefficients. Psychological Methods, 1 (1), 30-46.
McGregor, A. H., Anderton, L. D., Gedroyc, W. M., Johnson, J., and Hughes, S., 2002. The use of interventional open mri to assess the kinematics of the lumbar spine in patients with spondylolisthesis. Spine, 27 (14), 1582-1586.
McGregor, A. H., Anderton, L.D., Gedroyc, W., 2002. The assessment of intersegmental motion and pelvic tilt in elite oarsmen. Medicine & Science in Sports & Exercise, 34 (7), 1143-1149.
McGregor, A. H., and Hukins, D. W. L., 2009. Lower limb involvement in spinal function and low back pain. Journal of Back and Musculoskeletal Rehabilitation, 22 (4), 219-222.
McGregor, A. H., Mccarthy, I. D., and Hughes, S. P., 1995. Motion characteristics of the lumbar spine in the normal population. Spine, 2- (22), 2421-2428.
McGregor, A. H., Mccarthy, I.D., Dore, C.J., Hughes, S.P., 1997. Quantitative assessment of the motion of the lumbar spine in the low back pain population and the effect of different spinal pathologies on this motion. European Spine Journal, 6, 308-315.
McGregor, A. H., Mccarthy, I.D., Hughes, S.P.F., 1995. Motion characteristics of normal subjects and people with low back pain. Physiotherapy, 81 (10), 632-637.
McKenzie, A. M., and Taylor, N. F., 1997. Can physiotherapists locate lumbar spinal levels by palpation? Physiotherapy, 83 (5), 235-239.
Meakin, J. R., and Aspden, R. M., 2012. Modeling the effect of variation in sagittal curvature on the force required to produce a follower load in the lumbar spine. Journal of Mechanics in Medicine and Biology, 12 (1).
Mehta, V. A., Amin, A., Omeis, I., Gokaslan, Z. L., and Gottfried, O. N., 2012. Implications of spinopelvic alignment for the spine surgeon. Neurosurgery, 70 (3), 707-721.
Mellor, F., Muggleton, J.M., Bagust, J., Mason, W., Thomas, P.W., Breen, A.C., 2009. Mid-lumbar lateral flexion stability measured in healthy volunteers by in-vivo fluoroscopy. Spine, 34 (22), E811-E817.
Mellor F.E., Thomas, P., Thompson, P., and Breen, A. C., 2014. Proportional lumbar spine inter-vertebral motion patterns: A comparison of patients with chronic non-specific low back pain and healthy controls. European Spine Journal, 23 (10), 2059-2067.
Mellor, F. E., 2014. An evaluation of passive recumbent quantitative fluoroscopy to measure mid-lumbar intervertebral motion in patients with chronic non-specific low back pain and healthy volunteers. Thesis. Bournemouth University, Bournemouth.
Mellor, F. E., Thomas, P., and Breen, A., 2014. Moving back: The radiation dose received from lumbar spine quantitative fluoroscopy compared to lumbar spine radiographs with suggestions for dose reduction. Radiography, 20, 251-257.
Merletti, R., Knaflitz, M., and Deluca, C. J., 1992. Electrically evoked myoelectric signals. Crit Rev Biomed Engineering, 1992 (19), 293-340.
Merz, O., Wolf, U., Robert, M., Gesing, V., and Rominger, M., 2013. Validity of palpation techniques for the identification of the spinous process l5. Manual Therapy, 18, 333-338.
276
Mieritz, R. M., Bronfort, G., Jakobsen, M. D., Aagaard, P., and Hartvigsen, J., 2014. Reliability and measurement error of sagittal spinal motion parameters in 220 patients with chronic low back pain using a three-dimensional measurement device. The Spine Journal, 14 (9), 1835-1843.
Mieritz, R. M., Bronfort, G., Kawchuk, G., Breen, A., and Hartvigsen, J., 2012. Reliability and measurement error of 3-dimensional regional lumbar motion measures: A systematic review. Journal of Manipulative and Physiological Therapeutics, 35 (8), 645-656.
Mitchell, T., O'sullivan, P. B., Burnett, A. F., Straker, L., and Smith, A., 2008. Regional differences in lumbar spinal posture and the influence of low back pain. BMC Musculoskeletal Disorders, 9 (152).
Miyasaka, K., Ohmori, K., Suzuki, K., Inoue, H., 2000. Radiographic analysis of lumbar motion in relation to lumbosacral stability: Investigation of moderate and maximum motion. Spine, 25 (6), 732-737.
Moher, D., Liberati, A., Tetzlaff, J., Altman, D.G., FOR THE PRISMA GROUP 2009. Preferred reporting items for systematic reviews and meta-analyses: the PRISMA statement. British Medical Journal, 339, 332-336.
Moore, K. L., Agur, A. M. R., and Dalley, A. F., 2014. Essential clinical anatomy. Vol. 5th edition: Lippincott Williams and Wilkins.
Moseley, G. L., Hodges, P. W., and Gandevia, S. C., 2002. Deep and superficial fibers of the lumbar multifidus muscle are differentially active during voluntary arm movements. Spine, 27 (2), E29-E36.
Muller, R., Strassle, K., and Wirth, B., 2010. Isometric back muscle endurance: An emg study on the criterion validity of the ito test. Journal of Electromyography and Kinesiology, 20, 845-850.
Muriuki, M. G., Harvey, R. M., Voronov, L. I., Carandang, G., Zindrick, M. R., Lorenz, M. A., ., Lomasney, L., and Patwardhan, A. G., 2016. Effects of motion segment level, pfirrmann intervertebral disc degeneration grade and gender on lumbar spine kinematics. Journal of Orthopaedic Research.
Myles, P., 2001. Using the bland-altman method to measure agreement with repeated measures: Editorial i. British Journal of Anaesthesia, 99 (3), 309-311.
Naik, G. R., 2012. Computational intelligence in electromyography analysis - a perspective on current applications and future challenges. Under CC BY 3.0 license: InTech.
Nairn, B., Chisholm, S. & Drake, J. D. M. 2013. What is slumped sitting? A kinematic and electromyographical evaluation. Manual Therapy, 18, 498-505.
Nattrass, C. L., Nitschke, J. E., Disler, P. B., Chou, M.J., Ooi, K.T., 1999. Lumbar spine range of motion as a measure of physical and functional impairment: An investigation of validity. Clinical Rehabilitation, 13 (3), 211-218.
Neblett, R., Mayer, T.G., Gatchel, R.J., Keeley, J., Proctor, T., Anagnostis, C., 2003. Quantifying the lumbar flexion-relaxation phenomenon: Theory, normative data, and clinical applications. Spine, 28 (13), 1435-1446.
Nelson-Wong, E., Alex, B., Csepe, D., Lancaster, D., and Callaghan, J. P., 2012. Altered muscle recruitment during extension from trunk flexion in low back pain developers. Clinical Biomechanics, 27 (10), 994-998.
Nelson-Wong, E., and Callaghan, J. P., 2010. Is muscle co-activation a predisposing factor for low back pain development during standing? A multifactorial approach for early identification of at-risk individuals. Journal of Electromyography and Kinesiology, 20, 256-263.
Nielsen, J. B., 2004. Sensorimotor integration at spinal level as a basis for muscle coordination during voluntary movement in humans. J Appl Physiol, 96 (5), 1961-1967.
277
Ning, X., Jin, S. & Mirka, G. A. 2012. Describing the active region boundary of EMG-assisted biomechanical models of the low back. Clinical Biomechanics, 27, 422-427.
Nitz, A. J., and Peck, D., 1986. Comparison of muscle spindle concentrations in large and small human epaxial muscles acting in parallel combinations. The American Surgeon, 52, 273-277.
Norcross, M. F., Blackburn, J. T., and Goerger, B. M., 2010. Reliability and interpretation of single leg stance and maximum voluntary isometric contraction methods of electromyography normalization. Journal of Electromyography and Kinesiology, 20, 420-425.
Nordander, C., Willner, J., Hansson, G. A., Larsson, B., Unge, J., and Granquist, L., 2003. Influence of the subcutaneous fat layer, as measured by ultrasound, skinfold calipers and bmi, on the emg amplitude. European Journal of Applied Physiology, 89, 514-519.
Norton, B. J., Sahrmann, S.A., Van Dillen, L.R., 2004. Differences in measurements of lumbar curvature related to gender and low back pain. Journal of Orthopaedic & Sports Physical Therapy, 34 (9), 524-534.
O'Shaughnessy, J., Roy, J.-F., and Descarreaux, M., 2013. Changes in flexion-relaxation phenomenon and lumbo-pelvic kinematics following lumbar disc replacement surgery. Journal of Neuroengineering and Rehabilitation, 10:72.
O'Sullivan, K., O'dea, P., Dankaerts, W., O'sullivan, P., Clifford, A., and O'sullivan, L., 2010. Neutral lumbar spine sitting posture in pain-free subjects. Manual Therapy, 15, 557-561.
O'Sullivan, K., Verschureren, S., Pans, S., Smets, D., Dekelver, K., and Dankaerts, W., 2012. Validation of a novel spinal posture monitor: Comparison with digital videofluoroscopy. European Spine Journal, 21 (12), 2633-2639.
O'Sullivan, P., 2005. Diagnosis and classificiation of chronic low back pain disorders: Maladaptive movement and motor control impairments as underlying mechanism. Manual Therapy, 10, 242-255.
O'Sullivan, P. B., 2000. Lumbar segmental "instability": Clinical presentation and specific stabilizing exercise management. Manual Therapy, 5, 2-12.
O'Sullivan, P. B., Dankaerts, W., Burnett, A. F., Farrell, G. T., Jefford, E., Naylor, C. S., and O'sullivan, K. J., 2006a. Effect of different upright sitting postures on spinal-pelvic curvature and trunk muscle activiation in a pain-free population. Spine, 31 (19), E707-E712.
O'Sullivan, P. B., Grahamslaw, K. M., Kendell, M., Lapenskie, S. C., Moller, N. E., and Richards, K. V., 2002. The effect of different standing and sitting postures on trunk muscle activity in a pain-free population. Spine, 27 (11), 1238-1244.
O'Sullivan, P. B., Mitchell, T., Bulich, P., Waller, R., and Holte, J., 2006b. The relationship between posture and back muscle endurance in industrial workers with flexion-related low back pain. Manual Therapy, 11, 264-271.
O'Sullivan, P. P., Dankaerts, W. P., Burnett, A. P., Chen, D. M., Booth, R. M., Carlsen, C. M., and Schultz, A. M., 2006c. Evaluation of the flexion relaxation phenomenon of the trunk muscles in sitting. Spine, 31 (17), 2009-2016.
Ochia, R., Inoue, N., Renner, S., Lorenz, E., Lim, T., Andersson, G., an, H., 2006. Three-dimensional in vivo measurement of lumbar spine segmental motion. Spine, 31 (18), 2073-2078.
Oddsson, L. I. E., and De Luca, C. J., 2003. Activation imbalances in lumbar spine muscles in the presence of chronic low back pain. Journal of Applied Physiology, 94, 1410-1420.
278
Ogston, N. G., King, G. J., Gertzbein, S. D., Tile, M. M. D., Kapasouri, A., Rubenstein, J. D. . 1986a. Centrode patterns in the lumbar spine: Baseline studies in normal subjects. SO - Spine July/August 1986;11(6):591-595.
Ogston, N. G., King, G.J., Gertzbein, S.D., Tile, M., Kapasouri, A., Rubinstein, J.D., 1986b. Centrode patterns in the lumbar spine: Baseline studies in normal subjects. Spine, 11 (6), 591-595.
Okawa, A., Shiomiya, K., Komori, H., Muneta, T., Arai, Y., Nakai, O., 1998. Dynamic motion study of the whole lumbar spine by videofluoroscopy. Spine, 23 (16), 1743-1749.
Olson, M., Solomonow, M., and Li, L., 2006. Flexion-relaxation response to gravity. Journal of Biomechanics, 39 (14), 2545-2554.
Olson, M. W., Li, L., and Solomonow, M., 2004. Flexion-relaxation response to cyclic lumbar flexion. Clinical Biomechanics, 19, 769-776.
Olsson, T. H., Selvik, G., Willner, S., 1976. Kinematic analysis of spinal fusions. Investigative Radiology, 11, 202-209.
Olsson, T. H., Selvik, G., Willner, S., 1977. Mobility in lumbosacral spine after fusion studies with the aid of roentgen stereophotogrammetry. Clinical Orthopaedics and Related Research, 129, 181-190.
Oomen, N. M. C. W., Reeves, N. P., Priess, M. C., and Van Dieen, J. H., 2015. Trunk muscle coactivation is tuned to changes in task dynamics to improve responsiveness in a seated balance task. Journal of Electromyography and Kinesiology, 25, 765-772.
Oxland, T. R., Panjabi, M.M., 1992. The onset and progression of spinal injury: A demonstration of neutral zone sensitivity. Journal of Biomechanics, 25 (10), 1165-1172.
Ozaktay, A. C., 1991. Fine nerve fibers and endings in the fibrous capsule of the lumbar facet joint Paper presented at the 37th Annual Meeting Orthopaedic Research Society, Ansheim, California.
Panjabi, M., Abumi, K., Duranceau, J., and Oxland, T., 1989. Spinal stability and intersegmental muscle forces. A biomechanical model. Spine, 14 (2), 194-200.
Panjabi, M. M., 1992a. The stabilising system of the spine - part 1: Function, dysfunction, adaptation and enhancement. Journal of Spinal Disorders, 5 (4), 383-389.
Panjabi, M. M., 1992b. The stabilising system of the spine - part 2: Neutral zone and instability hypothesis. Journal of Spinal Disorders, 5 (4), 390-397.
Panjabi, M. M., 2003. Clinical spinal instability and low back pain. Journal of Electromyography and Kinesiology, 13 (4), 371-379.
Panjabi, M. M., Krag, M.H., Chung, T.Q., 1984. Effects of disc injury on mechanical behaviour of the human spine. Spine, 9, 707-713.
Panjabi, M. M., Lydon, C., Vasavada, A., Grob, D., Crisco, J.J., Dvorak, J., 1994. On the understanding of clinical instability. Spine, 19 (23), 2642-2650.
Paquet, N., Malouin, F., and Richards, C. L., 1994. Hip-spine movement interaction and muscle activation patterns during sagittal trunk movements in low back pain patients. Spine, 19 (5), 596-603.
Park, P. M. D., Garton, H. J. M. D. M., Gala, V. C. M. D., Hoff, J. T. M. D., and McGillicuddy, J. E. M. D., 2004. Adjacent segment disease after lumbar or lumbosacral fusion: Review of the literature. Spine, 29 (17), 1938-1944.
Passias, P. G., Wang, S., Kozanek, M., Xia, Q., Li, W., Grottkau, B., Wood, K.B., Li, G., 2011. Segmental lumbar rotation in patients with discogenic low back pain during functional weight-bearing activities. The Journal of Bone and Joint Surgery American, 93, 29-37.
Patwardhan, A. G., Havey, R. M., Meade, K. P., Lee, B., and Dunlap, B., 1999. A follower load increases the load-carrying capacity of the lumbar spine in compression. Spine, 24, 1003-1009.

279
Pavlova, A. V., Cooper, K., Meakin, J. R., Barr, R., and Aspden, R., 2015. Internal lumbar spine motion during lifting. In: 21st Congress of the European Society of Biomechanics, Prague, Czech Republic.
Pavlova, A. V., Meakin, J. R., Cooper, K., Barr, R. J., and Aspden, R. M., 2014. The lumbar spine has an intrinsic shape specific to each individual that remains a characteristic throughout flexion and extension. European Spine Journal, 23 (Suppl 1), S26-S32.
Peach, J. P., Sutarno, C. G., and McGill, S. M., 1998. Three-dimensional kinematics and trunk muscle myoelectric activity in the young lumbar spine: A database. Archives of Physical Medicine and Rehabilitation, 79 (6), 663-669.
Pearcy, M. J., 1984a. Axial rotation and lateral bending in the normal lumbar spine measured by three-dimensional radiography. Spine, 9 (6), 582-587.
Pearcy, M. J., 1985. Stereoradiography of lumbar spine motion. Acta Orthopaedica Scandinavica, 56 (212(suppl)), 1-45.
Pearcy, M. J., Portek, I., Shepherd, J., 1984b. Three dimensional x-ray analysis of normal movement in the lumbar spine. Spine, 9, 294-297.
Pearcy, M. J., Whittle, M.W., 1982. Movements of the lumbar spine measured by three-dimensional x-ray analysis. Journal of Biomedical Engineering, 4 (April), 107-112.
Pearson, A. M., Spratt, K. F., Genuario, J., McGough, W., Kosman, K., Lurie, J., and Sengupta, D. K., 2011. Precision of lumbar intervertebral measurements. Spine, 36 (7), 572-580.
Peck, D., Buxton, D. F., and Nitz, A. J., 1984. A comparison of spindle concentrations in large and small muscles acting in parallel combinations. Journal of Morphology, 180 (3), 243-252.
Pelletier, R., Higgins, J., and Bourbonnais, D., 2015a. Addressing neuroplastic changes in distributed areas of the nervous system associated with chronic musculoskeletal disorders. Physical Therapy, 95 (11), 1582-1591.
Pelletier, R., Higgins, J., and Bourbonnais, D., 2015b. Is neuroplasticity in the central nervous system the missing link to our understanding of chronic musculoskeletal disorders? BMC Musculoskeletal Disorders, 16 (25).
Penfield, W., and Rasmussen, T., 1950. The cerebral cortex of man. New York: Macmillan. Pieper, C. C., Groetz, S. F., Nadal, J., Schild, H. H., and Niggemann, P. D., 2013. Radiographic
evaluation of ventral instability in lumbar spondylolisthesis: Do we need extension radiographs in routine exams? European Spine Journal, Epub ahead of print.
Portney, L. G., and Watkins, M. P., 2009. Foundations of clinical research: Applications to practice. 3rd ed. Upper Saddle River, New Jersey, USA: Pearson Education.
Preuss, R., and Fung, J., 2008. Musculature and biomechanics of the trunk in the maintenance of upright posture. Journal of Electromyography and Kinesiology, 18, 815-828.
Preuss, R., Fung, J., 2005. Can acute low back pain result from segmental spinal buckling during sub-maximal activities? A review of the current literature. . Manual Therapy, 10 (1), 14-20.
Proske, U., and Gandevia, S. C., 2009. The kinaesthetic senses. Journal of Physiology, 587 (17), 4139-4146.
Putzer, M., Auer, S., Malpica, W., Seuss, F., and Dendorfer, S., 2016. A numerical study to determine the effect of ligament stiffness on kinematics of the lumbar spine during flexion. BMC Musculoskeletal Disorders, 17 (95).
Quack, C., Schenk, P., Laeubli, T., Spillmann, S., Hodler, J., Michel, B. A., and Klipstein, A., 2007. Do mri finding correlate with mobility tests? An explorative analysis of the test validity with regard to structure. European Spine Journal, 16, 803-812.

280
Radcliffe, K. E., Kepler, C. K., Jakoi, A., Sidhu, G. S., Rihn, J., Vaccaro, A. R., Albert, T. J., and Hiliband, A. S., 2013. Adjacent segment disease in the lumbar spine following different treatment interventions. The Spine Journal, 13 (10), 1339-1349.
Radebold, A., Cholewicki, J., Panjabi, M. M., and Patel, T. C., 2000. Muscle response pattern to sudden trunk loading in healthy individuals and in patients with chronic low back pain. Spine, 25 (8), 947-954.
Reeves, N. P., and Cholewicki, J., 2003. Modeling the human lumbar spine for assessing spinal loads, stability, and risk of injury. Critical Reviews in Biomedical Engineering, 31 (1-2), 73-139.
Reeves, N. P., Cholewicki, J., and Silfies, S. P., 2006. Muscle activation imbalance and low-back injury in varsity athletes. Journal of Electromyography and Kinesiology, 16, 264-272.
Reeves, N. P., Cholewicki, J., 2010. Expanding our view of the spine system. European Spine Journal, 19 (2), 331-332.
Reeves, N. P., Narendra, K. S., Cholewicki, J. 2007. Spine stability: The six blind men and the elephant. Clinical Biomechanics, 22, 266-274.
Reeves, N. P., Narendra, K.S., Cholewicki, J., 2011. Spine stability: Lessons from balancing a stick. Clinical Biomechanics, 26 (4), 325-330.
Rezvani, A., Ergin, O., Karacan, I., and Oncu, M., 2012. Validity and reliability of the metric measurements in the assessment of lumbar spine motion in patients with ankylosing spondylitis. Spine, 37 (19), E1189-E1196.
Richardson, C. A., and Jull, G. A., 1995. An historial perspective on the development of clinical techniques to evaluate and treat the active stabilising system of the lumbar spine. Austrailian Journal of Physiotherapy Monograph, 1, 5-13.
Richmond, F. J. R., and Bakker, D. A., 1982. Anatomical organization and sensory receptor content of soft tissues surrounding upper cervical vertebrae in the cat. Journal of Neurophysiology, 48 (1), 49-61.
Roberts, S., Eisenstein, S.M., Menage, J., Evans, E.H., Ashton, L.K., 1995. Mechanoreceptors in intervertebral discs: Morphology, distribution and neuropeptides. Spine, 20, 2645-2651.
Rodriguez-Soto, A., Jaworski, R., Jensen, A., Niederberger, B., Hargens, A. R., Frank, L. R., Kelly, K. R., and Ward, S. R., 2013. Effect of load carriage on lumbar spine kinematics. Spine, 38 (13), E783-E791.
Roelofs, J., Sluiter, J.K., Frings-Dresen, M.H. W., Goossens, M., Thibault, P., Boersma, K., Vlaeyen, J.W. S., 2007. Fear of movement and (re)injury in chronic musculoskeletal pain: Evidence for an invariant two-factor model of the tampa scale for kinesiophobia across pain diagnoses and dutch, swedish, and canadian samples. Pain, 131 (1-2), 181-190.
Rogers, B., Wiese, S., Blankenbaker, D., Meyerand, E., Haughton, V., 2005. Accuracy of an automated method to measure rotations of vertebrae from computerized tomography data. Spine, 30 (6), 694-696.
Ross, G. B., Mavor, M., Brown, S. H. M., and Graham, R. B., 2015. The effects of experimentally induced low back pain on spine rotational stiffness and local dynamic stability. Annals of Biomedical Engineering, 43 (9), 2120-2130.
Rothenfluh, D. A., Mueller, D. A., Rothenfluh, E., and Min, K., 2015. Pelvic incidence-lumbar lordosis mismatch predisposes to adjacent segment disease after lumbar spine fusion. European Spine Journal, 24 (6), 1251-1258.
Roussouly, P., Gollogly, S., Berthonnaud, E., and Dimnet, J., 2005. Classification of the normal variation in the sagittal alignment of the human lumbar spine and pelvis in the standing position. Spine, 30 (3), 346-353.
281
Roussouly, P., and Nnadi, C., 2010. Sagittal plane deformity: An overview of interpretation and management. European Spine Journal, 19, 1824-1836.
Roussouly, P., and Pinheiro-Franco, J. L., 2011. Biomechanical analysis of the spino-pelvic organization and adaptation in pathology. European Spine Journal, 20 (Suppl 5), S609-S618.
Sahrmann, S. A., 2002. Movement impairment syndromes of the lumbar spine. In: Diagnosis and treatment of movement impairment syndromes. St. Louis, MO: Mosby, Inc, 51-119.
Salmons, S., and Henriksson, J., 1981. The adaptive response of skeletal muscle to increased use. Muscle and Nerve, 4 (2), 94-105.
Sanchez-Zuriaga, D., Adams, M. A., and Dolan, P., 2010. Is activation of the back muscles impaired by creep or muscle fatigue? Spine, 35 (5), 517-525.
Sanchez-Zuriaga, D., Lopez-Pascual, J., Garrido-Jaen, D., and Garcia-Mas, M. A., 2015. A comparison of lumbopelvic motion patterns and erector spinae behavior between asymtomatic subjects and patients with recurrent low back pain during pain-free periods. Journal of Manipulative and Physiological Therapeutics, 38 (2), 130-137.
Sarikaya, S., Ozdolap, S., Gumustas, S., and Koc, U., 2007. Low back pain and lumbar angles in turkish coal miners. American Journal of Industrial Medicine, 50 (2), 92-96.
Sarti, M. A., Lison, J. F., Monfort, M., and Fuster, M. A., 2001. Response of the flexion-relaxation phenomenon relative to the lumbar motion to load and speed. Spine, 26 (18), E421-E426.
Sasieni, P. D., Shelton, J., Ormiston-Smith, N., Thomson, C. S., and Silcocks, P. B., 2011. What is the lifetime risk of developing cancer?: The effect of adjusting for multiple primaries. British Journal of Cancer, 105, 460-465.
Scannell, J. P., and McGill, S. M., 2003. Lumbar posture - should it , and can it, be modified? A study of passive tissue stiffness and lumbar position during activities of daily living. Physical Therapy, 83 (10), 907-917.
Schuit, D., Petersen, C., Johnson, R., Levine, P., Knecht, H., Goldberg, D., 1997. Validity and reliability of measures obtained from the osi ca-6000 spine motion analyzer for lumbar spinal motion. Manual Therapy, 2 (4), 206-215.
Shaffer, W. O., Spratt, K. F., Weinstein, J. D., Lehmann, T. R., Goel, V . 1990. 1990 volvo award in clinical sciences: The consistency and accuracy of roentgenograms for measuring sagittal translation in the lumbar vertebral motion segment: An experimental model. Spine, 15 (8), 741-750.
Sharma, M., Langrana, N.A., Rodriguez, J., 1995. Role of ligaments and facets in lumbar spinal stability. Spine, 20 (8), 887-900.
Shirado, O., Ito, T., Kaneda, K., and Strax, T. E., 1995. Flexion-relaxation phenomenon in the back muscles. A comparative study between healthy subjects and patients with chronic low back pain. American Journal of Physical Medicine and Rehabilitation, 74 (2), 139-144.
Shiraishi, M., Masuda, T., Sadoyama, T., and Okada, M., 1995. Innervation zones in the back muscles investigated by multichannel surface emg. Journal of Electromyography and Kinesiology, 5 (3), 161-167.
Shirazi-Adl, A., Ahmed, A.M., Shrivastava, S.C., 1986. A finite element study of a lumbar motion segment subjected to pure sagittal plane moments. Journal of Biomechanics, 19 (4), 331-350.
Shirazi-Adl, A., El-Rich, M., Pop, D. G., and Parnianpour, M., 2005. Spinal muscle forces, internal loads and stability in standing under various postures and loads-application of kinematics-based algorithm. European Spine Journal, 14, 381-392.
Shrout, P. E., 1998. Measurement reliability and agreement in psychiatry. Statistical Methods in Medical Research, 7 (3), 301-317.
282
Sihvonen, T., 1988. Averages (rms) surface emg in testing back function. Electromyography and Clinical Neurophysiology, 28 (6), 335-339.
Sihvonen, T., Partanen, J., Hanninen, O., and Soimakallio, S., 1991. Electric behavior of low back muscles during lumbar pelvic rhythm in low back pain patients and health controls. Arch Phys Med Rehabil, 72 (13), 1080-1087.
Silfies, S. P., Mehta, R., Smith, S. S., and Karduna, A. R., 2009. Differences in feedforward trunk muscle activity in subgroups of patients with mechanical low back pain. Archives of Physical Medicine and Rehabilitation, 90, 1159-1169.
Sim, J., Wright, C.C., 2005. The kappa statistic in reliability studies: Use, interpretation, and sample size requirements. Physical Therapy, 85 (3), 257-268.
Singer, K. P., Day, R.E., Breidahl, P.D., 1989. In-vivo axial rotation at the thoracolumbar junction: An investigation using low dose ct in healthy male volunteers. Clinical Biomechanics, 4, 145-150.
Sirca, A., and Kostevc, V., 1985. The fibre type composition of thoracic and lumbar paravertebral muscles in man. Journal of Anatomny, 141, 131-137.
Smit, T. H., Van Tunen, M. S. L. M., Van Der Veen, A. J., Kingma, I., and Van Dieen, J. H., 2011. Quantifying intervertebral disc mechanics: A new definition of the neutral zone. BMC Musculoskeletal Disorders, 12 (38).
Soderberg, G. L., Knutson, L.M., 2000. A guide for use and interpretation of kinesiologic electromyographic data. Physical Therapy, 80 (5), 485-498.
Solomonow, M., Barratta, R., Bernardi, M., Zhou, B., Lu, Y., Zhu, M., and Acierno, S., 1994. Surface and wire emg crosstalk in neighbouring muscles. Journal of Electromyography and Kinesiology, 4 (3), 131-142.
Solomonow, M., Zhou, B.H., Harris, M., Lu, Y., Baratta, R.V., 1998. The ligamento-muscular stabilizing system of the spine. Spine, 23 (23), 2552-2562.
Sparto, P. J., Parnianour, M., Marras, W. S., Granata, K. P., Reinsel, T. E., and Simon, S., 1998. Effect of electromyogram-force relationships and method of gain estimation on the predictions of an electromyogram-driven model of spinal loading. Spine, 23 (4), 423-429.
Spinelli, B. A., Wattananon, P., Silfies, S., Talaty, M., and Ebaugh, D., 2015. Using kinematics and a dynamical systems approach to enhance understanding of clinically observed aberrant movement patterns. Manual Therapy, 20, 221-226.
Staub, B. N., Holman, P. J., Reitman, C. A., and Hipp, J., 2015. Sagittal plane lumbar intervertebral motion during seated flexion-extension radiogaphs of 658 asymptomatic nondegenerated levels. Journal of Neurosurgery Spine, 23 (6), 731-738.
Steele, J., Bruce-Low, S., Smith, D., Jessop, D., and Oborne, N., 2013. A randomized controlled trial of limited range of motion lumbar extension exercise in chronic low back pain. Spine, 38 (15), 1245-1252.
Steffen, T., Rubin, R.K., Baramki, H.G., Antoniou, J., Marchesi, D., Aebi, M., 1997. A new technique for measuring lumbar segmental motion in vivo: Method, accuracy and preliminary results. Spine, 22, 156-166.
Steiger, F., Becker, H.-J., Standaert, C. J., Nalague, F., Vader, J.-P., Porchet, F., and Mannion, A. F., 2014. Surgery in lumbar degenerative spondylolisthesis: Indications, outcomes and complications. A systematic review. European Spine Journal, 23, 945-973.
Stevens, V. K., Coorevits, P. L., Bouche, K. G., Mahieu, N. N., Vanderstraeten, G. G., and Danneels, L. A., 2007. The influence of specific training on trunk muscle recruitment patterns in healthy subjects during stabilization exercies. Manual Therapy, 12, 271-279.

283
Steventon, C., and Ng, G., 1995. Effect of trunk flexion speed on flexion relaxation of erector spinae. Austrailian Physiotherapy, 41 (4), 241-243.
Stokes, I. A., Gardner-Morse, M., Churchill, D., Laible, J.P., 2002. Measurement of a spinal motion segment stiffness matrix. Journal of Biomechanics, 35, 517-521.
Stokes, I. A., Moffroid, M. S., Rush, S., and Haugh, L. D., 1988. Comparison of acoustic and electrical signals from erectores spinae muscles. Muscle and Nerve, 11 (4), 331-336.
Stokes, I. a. F., Bevins, T.M., Lunn, R.A., 1987. Back surface curvature and measurement of lumbar spinal motion. Spine, 12 (4), 355-361.
Stokes, I. a. F., Henry, S. M., and Single, R. M., 2003. Surface emg electrodes do not accurately record from lumbar multifidus muscles. Clinical Biomechanics, 18 (1), 9-13.
Stokes, M., 1985. Reliability and repeatibility of methods of measuring muscle in physiotherapy. Physiotherapy Practice, 1 (2), 71-76.
Straker, L. M., O'sullivan, P. B., Smith, A. J., and Perry, M. C., 2009. Relationships between prolonged neck/shoulder pain and sitting spinal posture in male and female adolescents. Manual Therapy, 14, 321-329.
Stubbs, M., Harris, M., Solomonow, M., Zhou, B., Lu, Y., and Baratta, R. V., 1998. Ligamento-muscular protective reflex in the lumbar spine of the feline. Journal of Electromyography and Kinesiology, 8 (4), 197-204.
Suni, J., Rinne, M., Natri, A., Statistisian, M. P., Parkkari, J., and Alaranta, H., 2006. Control of the lumbar neutral zone decreases low back pain and improves self-evaluated work ability. Spine, 31 (18), E611-E620.
Swinkels-Meewisse, E. J. C. M., Swinkels, R.A.H.M., Verbeek, A.L.M., Vlaeyen, J.W.S., Oostendorp, R.A.B., 2003. Psychometric properties of the tampa scale for kinesiophobia and the fear-avoidance beliefs questionnaire in acute low back pain. Manual Therapy, 8 (1), 29-36.
Swinkels-Meewisse, I. E. J., Reolofs, J., Schoutern, E.G.W., Verbeek, A.L.M., Oostendorp, R.A.B., Vlaeyen, J.W.S., 2006. Fear of movement/(re)injury predicting chronic disabling low back pain: A prospective inception cohort study. Spine, 31 (6), 638-664.
Swinnen, E., Baeyens, J. P., Meeusen, R., and Kerckhofs, E., 2012. Methodology of electromyographic analysis of the trunk muscles during walking in healthly subjects: A literature review. Journal of Electromyography and Kinesiology, 22 (1), 1-12.
Tafazzol, A., Arjmand, N., Shirazi-Adl, A., and Parnianpour, M., 2014. Lumbopelvic rhythm during forward and backward sagittal trunk rotations: Combined in vivo measurement with inertial tracking device and biomechanial modeling. Clinical Biomechanics, 29 (1), 7-13.
Taghipour-Darzi, M., Takamjani, E. E., Salavati, M., Mobini, B., and Zekavat, H., 2012. The validity of vertebral translation and rotation in differentiating patients with lumbar segmental instability. Physiotherapy Research International, 17 (4), 227-234.
Takayanagi, K., Takahashi, K., Yamagata, M., Moriya, H., Kitahara, H., Tamaki, T., 2001. Using cineradiography for continuous dynamic-motion analysis of the lumbar spine. Spine, 26 (17), 1858-1865.
Tan, C. I. C., Song,S., Edmondston, S.J., Singer, K.P., 2000. Reliability of a modified grading scheme for mri assessment of thoracic intervertebral discs. Journal of Musculoskeletal Research, 4 (3), 199-208.
Tesh, K. M., Dunn, J.S., Evans, J.H., 1987. The abdominal muscles and vertebral stability. Spine, 12 (5), 501-508.
Teyhen, D. S., 2004. Kinematic assessment of lumbar segmental instability using digital fluoroscopic video. Thesis. Univeristy of Texas.
284
Teyhen, D. S., Flynn, T. W., Childs, J. D., Kuklo, T. R., Rosner, M. K., Polly, D. W., and Abraham, L. D., 2007. Fluoroscopic video to identify aberrant lumbar motion. . Spine, 32 (7), E220-E229.
Teyhen, D. S., Flynn, T.W., Bovik, A.C., Abraham, L.D., 2005. A new technique for digital fluoroscopic video assessment of sagittal plane lumbar spine motion. Spine, 30 (14), E406-E413.
Teyhen, D. S., Flynn, T.W., Childs, J.D., Abraham, L.D., 2007. Arthrokinematics in a subgroup of patients likely to benefit from a lumbar stabilization exercise program. Physical Therapy, 87 (3), 313-325.
Thelen, D. G., Schultz, A. B., and Ashton-Miller, J. A., 1995. Co-contraction of lumbar muscels during the development of time-varying triaxial moments. Journal of Orthopaedic Research, 13 (3), 390-398.
Thomas, J. S., and France, C. R., 2008. The relationship between pain-related fear and lumbar flexion during natural recovery from low back pain. European Spine Journal, 17, 97-103.
Thorstensson, A., and Carlson, H., 1987. Fibre types in human lumbar back muscles. Acto Physiol Scand, 131 (2), 195-202.
Thuresson, M., Ang, B., Linder, J., and Harms-Ringdahl, K., 2005. Intra-rater reliability of electromyographic recordings and subjective evaluation of neck muscle fatigue among helicopter pilots. Journal of Electromyography and Kinesiology, 15, 323-331.
Todorov, E., and Jordan, M. I., 2002. Optimal feedback control as a theory of motor coordination. Nature Neuroscience, 5 (11), 1226-1235.
Toussaint, H. M., Dewinter, A.F., Delooze, M.P., Vandieen, J.H., Kingma, I., Dehaas, Y., 1995. Flexion relaxation during lifting - implications for torque production by muscle-activity and tissue strain at the lumbosacral joint. Journal of Biomechanics, 28, 199-210.
Triano, J. J., Schultz, A.B., 1987. Correlation of objective measure of trunk motion and muscle function with low-back disability ratings. Spine, 12 (6), 561-565.
Troke, M., Moore, A.P., Cheek, E., 1996. Intra-operator and inter-operator reliability of the osi ca 6000 spine motion analyzer with a new skin fixation system. Manual Therapy, 1, 92-98.
Tsao, H., Danneels, L. A., and Hodges, P. W., 2011. Issls prize winner: Smudging the motor brain in young adults with recurrent low back pain. Spine, 36 (21), 1721-1727.
Tsao, H., Druitt, T. R., Schollum, T. M., and Hodges, P. W., 2010. Motor training of the lumbar paraspinal muscles induces immediate changes in motor coordination in patients with recurrent low back pain. The Journal of Pain, 11 (11), 1120-1128.
Tuzun, C., Yorulmaz, I., Cendas, A., and Vatan, S., 1999. Low back pain and posture. Clinical Rheumatology, 18 (4), 308-312.
Uecker, M., Zhang, S., Voit, D., Karaus, A., Merboldt, K.D., Frahm, J., 2010. Real-time mri at a resolution of 20 ms. NMR In Boimedicine, 23 (8), 986-994.
Untch, C., Liu, Q., Hart, R., 2004. Segmental motion adjacent to an instrumented lumbar fusion. Spine, 29 (21), 2376-2381.
Van Den Hoorn, W., Bruijn, S. M., Meijer, O. G., Hodges, P. W., and Van Dieen, J. H., 2012. Mechanical coupling between transverse plane pelvis and thorax rotations during gait is higher in people with low back pain. Journal of Biomechanics, 45, 342-347.
Van Dieen, J. H., Cholewicki, J., Radebold, A., 2003. Trunk muscle recruitment patterns in patients with low back pain enhance the stability of the lumbar spine. Spine, 28 (8), 834-841.
Van Dieen, J. H., Selen, L. P. J., and Cholewicki, J., 2003. Trunk muscle activation in low-back pain patients, an analysis of the literature. Journal of Electromyography and Kinesiology, 13, 333-351.
285
Van Dillen, L. R., Sahrmann, S. A., Norton, B. J., Caldwell, C. A., Mcdonnell, M. K., and Bloom, N. J., 2003. Movement system impairment-based categories for low back pain: Stage 1 validation. Journal of Orthopaedic & Sports Physical Therapy, 33 (3), 126-142.
Van Hoof, W., Volkaerts, K., O'sullivan, K., Verschueren, S., and Dankaerts, W., 2012. Comparing lower lumbar kinematics in cyclists with low back pain (flexion pattern) versus asymptomatic controls - field study using a wireless posture monitoring system. Manual Therapy, 17, 312-317.
Van Loon, I. H. M., Mellor, F. E., and A., B., 2012. Accuracy and repeatability of sagittal translation of lumbar vertebrae in vitro and in vivo using quantitative fluoroscopy. Clinical Chiropractic, 15, 135-146.
Vialle, R., Levassor, N., Rillardon, L., Templier, A., Skalli, W., and Guigui, P., 2005. Radiographic analysis of the sagittal alignment and balance of the spine in asymptomatic subjects. The Journal of Bone and Joint Surgery, 87A (2), 260-267.
Virchow, R., 1858. Die cellular pathologie in ihrer begrundurg auf physiologische und pathologische. Berlin: A Hirschwald.
Vlaeyen, J. W. S., Seelen, H.A.M., Peters, M., De John, P., Aretz, E., Beisiegel, E., Weber, W.E.J., 1999. Fear of movement/(re)injury and muscular reactivity in chronic low back pain patients: An experimental investigation. Pain, 82, 297-304.
Vleeming, A., Pool-Goudzwaard, A. L., Stoeckart, R., Van Wingerden, J.-P., and Snijders, C. J., 1995. The posterior layer of the thoracolumbar fascia. Its function in load transfer from spine to legs. Spine, 20 (7), 753-758.
Volkheimer, D., Malakoutian, M., Oxland, T. R., and Wilke, H.-J., 2015. Limitations of current in vitro test protocols for investigation of instrumented adjacent segment biomechanics: Critical analysis of the literature. European Spine Journal, 24, 1882-1892.
Von Elm, E., Altman, D. G., Egger, M., Pocock, S. J., Gotzsche, P. C., Vandenbroucke, J. P., and For the Strobe Initiative., 2008. The strengthening the reporting of observational studies in epidemiology (strobe) statement: Quidelines for reporting observational studies. Journal of Clinical Epidemiology, 61, 344-349.
Von Forell, G. A., and Bowden, A. E., 2014. Biomechanical implications of lumbar spinal ligament transection. Computer Methods in Biomechanics and Biomedical Engineering, 17 (15), 1685-1695.
Vrtovec, T., Pernus, F., and Likar, B., 2009. A review of methods for quantitative evaluation of spinal curvature. European Spine Journal, 18, 593-607.
Waddell, G., 1987. A new clinical model for the treatment of low back pain. Spine, 12 (7), 632-644.
Waddell, G., 2005. Subgroups within "nonspecific" low back pain. Journal of Rheumatology, 32, 395-396.
Walker, W. C., Keyset-Marcus, L. A., Johns, J. S., and Seel, R. T., 2001. Relation of electromyography-induced pain to type of recording electrodes. Muscle and Nerve, 24 (3), 417-420.
Ward, S. R., Kim, C. W., Eng, C. M., Gottschalk Iv, L. J., Tomiya, A., Garfin, S. R., and Lieber, R. L., 2009. Architectural analysis and intraoperative measurements demonstrate the unique design of the multifidus muscle for lumbar spine stability. Journal of Bone and Joint Surgery Am, 91, 176-185.
Watson, P. J., Booker, C.K., Main, C.J., Chen, A.C.N., 1997. Surface electromyography in the idenfification of chronic low back pain patients: The development of the flexion relaxation ratio. Clinical Biomechanics, 12 (3), 165-171.
Weiler, P. J., King, G.J., Gertzbein, S.D., 1990. Analysis of sagittal plane instability of the lumbar spine in-vivo. Spine, 15 (12), 1300-1306.
286
Weiner, B., 2008. The biopsychosocial model and spine care. Spine, 33 (2), 219-223. White, A. A., Panjabi, M.M., 1990. Clinical biomechanics of the spine. Philadelphia: JB
Lippincott. Wilke, H.-J., Wolf, S., Claes, L.E., Arand, M., Wiesend, A., 1995. Stability increase of the
lumbar spine with different muscle groups: A biomechanical in-vitro study. Spine, 20 (2), 192-198.
Willard, F. H., Vleeming, A., Schuenke, M. D., Danneels, L., and Schleip, R., 2012. The thoracolumbar fascia: Anatomy, function and clinical considerations. Journal of Anatomny, 221, 507-537.
Williams, J., Haq, I., and Lee, R. Y., 2013a. A novel approach to the clinical evaluation of differential kinematics of the lumbar spine. Manual Therapy, 18, 130-135.
Williams, J. M., Haq, I., and Lee, R. Y., 2013b. An investigation into the onset, pattern, and effects of pain relief on lumbar extensor electromyography in people with acute and chronic low back pain. Journal of Manipulative and Physiological Therapeutics, 36 (2), 91-100.
Windhorst, U., 2007. Muscle proprioceptive feedback and spinal networks. Brain Research Bulletin, 73, 155-202.
Wolf, S. L., Basmajian, J. V., Russe, C. T. C., and Kutner, M., 1979. Normative data on low back mobility and activity levels. American Journal of Physical Medicine, 58 (5), 217-229.
Womersley, L., and May, S., 2006. Sitting posture of subjects with postural backache. Journal of Manipulative and Physiological Therapeutics, 29 (3), 213-218.
Wong, C., Rasmussen, J., Simonsen, E., Hansen, L., De Zee, M., and Dendorfer, S., 2011. The influence of muscle forces on the stress distribution in the lumbar spine. The Open Spine Journal, 3, 21-26.
Wong, K., Luk, K., Leong, J., Wong, S., Wong, K., 2006. Continuous dynamic spinal motion analysis. Spine, 31 (4), 414-419.
Wong, K. W. N., Leong, J.C.Y., Chan, M-K., Lu, W.W., 2004. The flexion-extension profile of lumbar spine in 100 healthy volunteers. Spine, 29 (15), 1636-1641.
Wood, K. B., Popp, C.A., Transfeldt, E.E., Geissele, A.E., 1994. Radiographic evaluation of instability in spondylolisthesis. Spine, 19, 1697-1703.
Worsley, P., Warner, M., Mottram, S., Gadola, S., Veeger, H. E. J., Hermens, H., Morrissey, D., Little, P., Cooper, C., Carr, A., and Stokes, M., 2013. Motor control retraining exercises for shoulder impingement: Effects on function, muscle activation, and biomechanics in young adults. Journal of Shoulder and Elbow Surgery, 22 (4), e11-e19.
Wu, M., Wang, S., Driscoll, S. J., Cha, T. D., Wood, K. B., and Li, G., 2014. Dynamic motion characteristics of the lower lumbar spine: Implication to lumbar pathology and surgical treatment. European Spine Journal, 23, 2350-2358.
Xia, Q., Wang, S., Passias, P.G., Kozanek, M., Li, G., Grottkau, B.E., Wood, K.B., Li, G., 2009. In vivo range of motion of the lumbar spinous processes. European Spine Journal, 18, 1355-1362.
Xia, X.-P., Chen, H.-L., and Cheng, H.-B., 2013. Prevalence of adjacent segment degeneration after spine surgery. Spine, 38 (7), 597-608.
Yahia, L., Rhalmi, S., Newman, N., and Isler, M., 1992. Sensory innervation of human thoracolumbar fascia. An immunohistochemical study. Acta Orthopaedica Scandinavia, 63 (2), 195-197.
Yamamoto, I., Panjabi, M. M., Oxland, T. R., and Crisco, J. J., 1990. The role of the iliolumbar ligament in the lumbosacral junction. Spine, 15 (11), 1138-1141.
287
Yang, J. F., 1985. Human kinetics - day-to-day repeatability of emg patterns in gait. In: Winter D.A., Norman, R. W., Wells, R. P., and Hayes, K. C. eds. Biomechanics ix-a. Patla AE, 489-493.
Yeager, M. S., Cook, D. J., and Cheng, B. C., 2014. Reliability of computer-assisted lumbar intervertebral measurement using a novel vertebral motion analysis system. The Spine Journal, 14 (2), 274-281.
Youssef, J., Davidson, B., Zhou, B.H., Lu, Y., Patel, V., Solomonow, M., 2008. Neuromuscular neutral zones response to static lumbar flexion: Muscular stability compensator. Clinical Biomechanics, 23, 870-880.
Zander, T., Rohlmann, A., Calisse, J., and Bergmann, G., 2001. Estimation of muscle forces in the lumbar spine during upper-body inclination. Clinical Biomechanics, 16 (Suppl 1), S73-S80.
Zhang, X., Xiong, J., 2003. Model-guided derivation of lumbar vertebral kinematics in vivo reveals the difference between external marker-defined and internal segmental rotations. Journal of Biomechanics, 36, 9-17.
Zhang, X., and Zhou, P., 2012. Sample entropy analysis of surface emg for improved muscle activity onset detection against spurious background spikes. Journal of Electromyography and Kinesiology, 22, 901-907.
Zuhlke, T., Fine, J., Haughton, V.M., Anderson, P.A., 2009. Accuracy of dynamic computed tomography to calculate rotation occurring at lumbar spinal motion segments. Spine, 34 (6), E215-E218.

288
Appendices
289
Appendix A: Research Dissemination
Publications
Du Rose, A., and Breen, A., 2015. Influence of paraspinal muscle activity on lumbar inter-
vertebral flexion rotation range. The Spine Journal, 15 (3 Suppl 2), S57-S58.
Du Rose, A., and Breen, A., 2016. Relationships between paraspinal muscle activity and
lumbar inter-vertebral range of motion. Healthcare, 4 (4)14.
Du Rose, A., and Breen, A., 2016. Relationships between lumbar inter-vertebral motion and
lordosis in healthy adult males: A cross sectional cohort study. BMC Musculoskeletal
Disorders, 17 (121).
Breen A, Breen Ax, Mellor F, du Rose A, Bentman S. Control of intervertebral Motion: A
Critical Element of Spine Control and a Target for Treatment. Journal of Orthopaedic and
Sports Physical Therapy, (submitted).
Oral presentations
Du Rose, A. and Breen, A., 2015. Influence of paraspinal muscle activity on lumbar inter-
vertebral flexion rotation range. British Association of Spine Surgeons Annual Conference,
The Assembly Rooms, Bath March 2015.
Du Rose, A. and Breen, A., 2015. The influence of motor control on lumbar inter-vertebral
kinematics during forward bending. Research Seminar, Department of Rehabilitation
Sciences and Physiotherapy, Ghent University May 2015.
Du Rose, A. and Breen, A., 2015. Paraspinal muscle activity and morphology and their effects
on lumbar inter-vertebral kinematics. Research Seminar, Department of Surgical Specialities,
College of Osteopathic Medicine, Michigan State University June 2015.
Du Rose, A., 2016. The Society for Back Pain Research (SBPR) Travel Fellowship Review: The
normal biomechanics of the lumbar spine: a quantitative fluoroscopy and electromyography
study. BritSpine Conference, Nottingham Conference Centre, Nottingham April 2016.
Du Rose, A., 2016. Normal biomechanics of the lumbar spine: an inter-vertebral level
insight. Research Seminar, College of Biomedical and Life Sciences, Cardiff University,
Cardiff October 2016.
14 Note: In response to the open access publication in Healthcare (see above) and in recognition of the novel combination of sEMG and QF, the author was invited to submit an entry into the 14th Annual Delsys Prize (A prize designed to promote innovation in the use of electromyography).

290
Poster presentations
Du Rose, A. and Breen, A., 2015. The effect of paraspinal myoelectrical activity on the range
of lumbar inter-vertebral motion. WFC Congress and ECU Convention, Hilton Athens Hotel,
Greece May 2015.
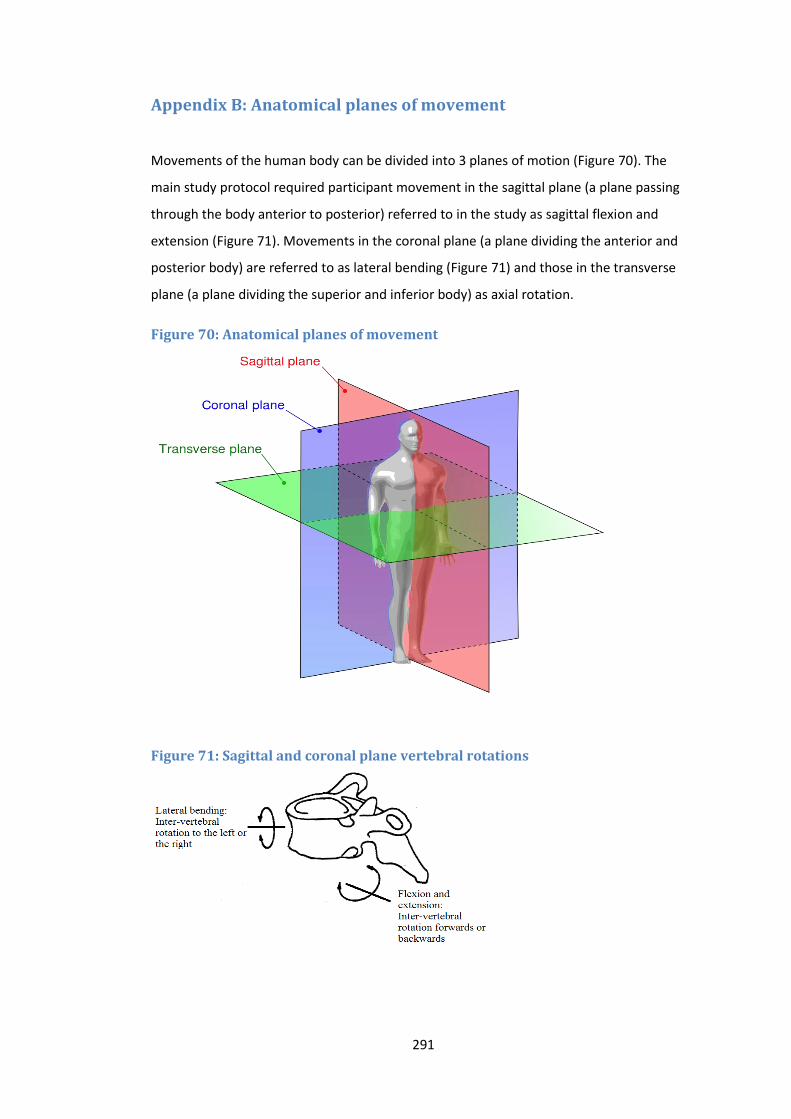
291
Appendix B: Anatomical planes of movement
Movements of the human body can be divided into 3 planes of motion (Figure 70). The
main study protocol required participant movement in the sagittal plane (a plane passing
through the body anterior to posterior) referred to in the study as sagittal flexion and
extension (Figure 71). Movements in the coronal plane (a plane dividing the anterior and
posterior body) are referred to as lateral bending (Figure 71) and those in the transverse
plane (a plane dividing the superior and inferior body) as axial rotation.
Figure 70: Anatomical planes of movement
Figure 71: Sagittal and coronal plane vertebral rotations

292
Appendix C: Participant information sheets
Information sheet for the sEMG reliability and agreement study
PARTICIPANT INFORMATION SHEET
Study Title: Surface Electromyography of the Lumbar Paraspinal Muscles during the
Weight Bearing Sagittal Plane OSMIA Acquisition Procedure: An intra-subject
repeatability study.
You are being invited to take part in this research study. Before you decide whether to do
so, it is important that you understand why the research is being done and what it will
involve. Please take time to read this Information Sheet carefully and discuss it with the
Principal Investigator if you wish.
Please ask if there is anything that is not clear or if you would like more information. Take
time to decide whether or not you wish to take part.
What is the purpose of the study?
This study is being conducted to find out if the electrical activity generated by the back
muscles, is the same each time we bend. If it is, then it should be possible to use it
together with motion x-ray images to find out how function of the back muscles and the
movement of bones in the back, normally relate to each other. This will further our
understanding of spinal function, and will hopefully become a useful tool in the
investigation of disorders affecting the lower back in the future. This study is part of the
development process for a larger study, and its findings will help inform decisions regarding
the larger study’s design.
Who is eligible for the study?
Males between the ages of 20 and 40 who are;
able to understand written information

293
willing to participate and able to freely give informed consent
have a body-mass index under 30
without any history of back pain that has prevented normal activity for at least 1
day in the previous year
Do I have to take part in this study?
Participation in the study is completely voluntary. There is no penalty for declining and you
are free to withdraw your consent at any time without explanation.
How is the study being done?
The testing process will take about 30 minutes per session, and participants will be asked to
attend 2 separate sessions over a 1 week period with a minimum of a 2 day break between
each session. All testing will take place in the x-ray department of the AECC clinic.
HOWEVER, YOU WILL NOT RECEIVE ANY X-RAYS.
Firstly, we will measure your height, weight and skin fold thickness using calipers. Next, the
skin over your lower back region will be prepared for sEMG electrodes (which are self-
adhesive pads). This should not be painful, but it does involve abrading the skin lightly with
a cloth, cleaning with an alcohol swab and if necessary shaving the area. Fifteen electrodes
will then be placed on the skin of your mid to lower back.
The actual test involves standing next to a motorised motion frame with your pelvis held
still by a strap. The frame will guide you as you bend your low back 60° forwards, and back
to your original position. You will then also be asked to bend as far forward as you can. This
process will be repeated 4 times at each session. In order to ensure the accuracy of
positioning the electrodes over subsequent sessions, an outline will be traced around each
electrode with an indelible marker.
In order to get an idea of the largest signal your back muscles can produce, you will be
asked to lie face down on a cushioned bench with your hands behind your head. Your pelvis
and legs will be supported and you will be asked to raise your upper body off the bench and
hold this position for 5 seconds. You will be asked to repeat this process 3 times, but only
on your initial session.
(Participants with long hair will be provided with bands to tie their hair back.)
Will my taking part in the study be kept confidential?
All participants will be allocated numbers. Data will be stored analysed and published
anonymously using these numbers. The data will be stored on a password protected
computer.
What if I agree and then change my mind?

294
Participants will be free to withdraw from the study at any time without prejudice. If a
participant decides to withdraw following data collection, already collected data will still be
used in the study, but no further data will be collected.
What will happen to the results of the research study?
These will eventually be published as part of my PhD thesis at Bournemouth University.
They may also be presented at scientific conferences, and published in a scientific journal.
Who is organising and funding the research?
The research is organised by the Institute for Musculoskeletal Research and Clinical
Implementation (IMRCI) and funded by the European Chiropractors’ Union Research Fund
(ECURF).
Who has reviewed this study?
The protocols for this study have been reviewed by Professor Alan Breen, DC PhD IPEM
Director of Research at the Institute for Musculoskeletal Research and Clinical
Implementation (IMRCI). This study has also been reviewed and approved by the Ethics
Sub-Committee of the Anglo-European College of Chiropractic.
What are the risks of taking part in the study?
There are no significant risks in taking part in this study. However you should be prepared
for possible temporary minor red skin marks due to the electrode preparation and removal
process. There is a very small chance that a participant may have an allergy to, or become
irritated by the gel electrodes used in the study. There is also the possibility that the
forward or return bending may cause physical discomfort. If this occurs you can cease the
testing at any time. You will be given an emergency stop button for this purpose.
(PARTICIPANTS WILL NOT BE SUBJECT TO ANY RADIATION)
What if there is a problem?
If you have any complaints about the way in which this study has been, or is being
conducted or wish to comment in any other way, please contact the Principal Investigator
using the details below.
Principal Investigator:
Alister du Rose Telephone: 01202 436353
Anglo European College of Chiropractic Email: [email protected]
13-15 Parkwood Road
Bournemouth

295
Information sheet for the main study
Information for volunteers:
Low back inter-vertebral motion patterns in healthy adults:
Reference ranges and reliability.
I would like to invite you take part in this research study. Before you decide it
is important for you to understand why the research is being done and what it
would involve for you. My contact details are at the end of this
information and I would be happy to answer any questions you may
have.
This information leaflet will:
1. Outline the purpose of the research.
2. Explain why you have received this leaflet.
3. Describe what happens next.
4. Describe what will happen if you decide to participate.
5. Clarify the risks and benefits to you of taking part.
6. Inform you about confidentiality and data protection.
7. Describe what to do if you have a problem
8. Explain what will happen to the results of this research
9. Tell you who is funding the research
10. State who has reviewed the study
11. Give contact details for the clinical investigator so you can ask any further
questions.

296
1. Purpose.
This study is being conducted to establish a database of the normal mechanics of
the low back in people without back pain. This is so there will be a reference for
patients being investigated for mechanical pain to help with treatment. A lot of
treatment for back pain s based on improving the functional mechanics of the spine,
which is reflected in the patterns of inter-vertebral motion. However, until now it has
been impossible to measure these in living people without penetrating the skin.
Quantitative Fluoroscopy is an X-ray video method doing this which was invented
and developed at the Anglo-European College of Chiropractic (AECC), where it has
been called ‘OSMIA’ (Objective Spinal Motion Imaging Assessment). This research
is to determine the limits of normal inter-vertebral motion so that clinicians who use
it in the future will be able to interpret its results and researchers will be able to test
the ability of treatments to improve spinal mechanics in living people.
A small number of volunteers will also be asked if they would like to
participate in a sub-group study that will investigate the activity of the
muscles in the lower back during the OSMIA procedure. This sub-group study
is being conducted to explore the relationships between the normal
mechanics of the low back and the concurrent activity of the low back
muscles. This study uses a technique called surface electromyography
(sEMG) which measures the electrical activity produced by your muscles as
they contract.
2. Why Have I Received this Leaflet?
You have received this leaflet because you are aged between 21 and 70 years and
you replied to and email or advertisement in the College asking for volunteers who
fit the inclusion criteria and who would like to take part in this research study. This
leaflet will explain the research in further detail.
3. What Happens Next?
After at least a week, I will contact you to ask if you are still interested in
taking part. I am happy to answer any questions you may have but it is
entirely your decision whether or not you decide to join the study. You are
free to refuse to participate or withdraw at any time prior to the taking of the x-
ray video without giving a reason (see Confidentiality and Data Protection p6).

297
4. What Will Happen if I Decide to Participate?
If you take part in this research your name, gender, age, height and weight, address
and telephone number and email will be stored on a password protected database.
You will be invited to attend the x-ray department at a time convenient to you. I will
meet and go through this Information Leaflet with you and explain the examination.
If you are happy to proceed you will be asked to sign two consent forms, one of
which will be for you to keep.
You will then be allocated to have either a forward-backward bending examination
or a side-bending one. You may also be asked to agree to have an additional one in
6 weeks time. If you are allocated to the forward-backward bending
examination, you may also be asked if you are willing to participate in the
sEMG sub-group study. You will then be shown to a changing room and asked to
change into a gown. We will then show you how the equipment works. OSMIA
uses specially designed motion tables and low dose video x-rays. You can view this
in advance on the College website if you wish.
(http://www.aecc.ac.uk/imrci/osmia.aspx). The tables rotate so that the upper half of
the body moves slowly from side to side.
One table is for lying examinations and the other is for standing.
First you will be asked to lie on one motion table. The upper half of the table will
swing slowly from side to side and video x-rays will be taken showing the movement
of your vertebrae as you bend. Then you will be asked to move to an upright motion
table and stand against it. Again the table will slowly swing while you bend,
following a moving arm rest, while the x-rays are taken simultaneously. Before we
take the x-rays we will find the range of bending that you are comfortable with.
sEMG sub-group study only: If you have agreed to participate in this study
there will be some additions to the procedure which will add approximately 15
minutes to your visit. At the point between the lying and standing
examinations, the skin over your lower back region will be prepared for sEMG
electrodes (which are self-adhesive pads). This should not be painful, but it
does involve abrading the skin lightly with a cloth, cleaning with an alcohol
swab and if necessary shaving the area. We will also measure the thickness
of a fold of your skin at 3 different levels, both on the left and right sides of
your lower back. Fifteen electrodes and three small wireless transmitters will
then be placed on the skin of your mid to lower back. This will enable the

298
measurement of your back muscle activity during the standing phase of the
examination. In order to get an indication of the maximum activity your low
back muscles can produce, at the end of the examination procedure you will
then be asked to lie prone on a padded bench with your hands behind your
head. You will then be asked to raise your upper body off the couch and hold
this position for 5 seconds whilst your legs and pelvis are supported. Finally,
when testing is completed you will also be asked a simple question about
your experience of the examination procedure.
During examinations, your lower abdomen will be covered with a lead apron to
protect the reproductive organs. You will also be provided with a button that will stop
the table should you begin to feel pain or discomfort. The whole procedure,
including filling in a form, will take no more than 30 minutes. (If you are
participating in the sEMG sub-group study the whole procedure will take no
more than 45 minutes). We may then make an appointment for you to have the
same examination 6 weeks later. (If you have volunteered to be in the sEMG
sub-group, this second examination will not include sEMG.) Before doing it we
will check to make sure you have had no disabling back pain since the first
examination. If you have, we will not proceed with the second examination.

299
5. Risks and Benefits of Participating.
This examination uses x-rays. Therefore it is important you understand the risks and
benefits of taking part. Females please note, x-rays may harm an unborn child.
It is therefore vital that you inform us beforehand if you are pregnant or
suspect you might be.
The radiation dose from the examination is roughly the same amount of naturally
occurring background radiation you would receive in the UK over a 17 month period.
Experts agree that it is very difficult to determine the risk of inducing cancer from
such low doses, however it is estimated that there is a 1 in 8.000 – 1 in 13,000
extra chance of
getting cancer from this examination. (This is in addition to the quoted 1 in 3
natural lifetime risk of you contracting cancer throughout your lifespan.) You
may wish to consider this risk in relation to some more familiar events as in the table
on page 5. There is no direct benefit to you from the radiation dose; however, the
risk is seen as minimal.
Some familiar risks (Sedgwick and Hall 2003) Chance they
will happen
Getting three balls in the UK national lottery 1 in 11
Needing emergency treatment in the next year after
being injured by a can, bottle, or jar
1 in 100
Death by an accident at home 1 in 7100
Getting five balls in the UK national lottery 1 in 11 098
Death by an accident at work 1 in 40 000
Death playing soccer 1 in 50 000
Death by murder 1 in 100 000
Being hit in your home by a crashing aeroplane 1 in 250 000
“Teaching medical students and doctors how to communicate risk." BMJ 327(7417): 694-695.
There is also a chance that an ‘incidental’ finding will be seen on your video x-ray.
An incidental finding is one that is discovered unintentionally. To date, 60 patients
have undergone this examination and there have been no significant incidental
findings. I will be reviewing all video x-rays and in the event of an incidental finding
you will be referred to your GP if that is what you would like.

300
Such detection has the benefit of starting treatment early but in a small number of
cases may have implications for future employment and insurance. There may be
no overall benefit to you from this study but the information I receive might help
improve the diagnosis of patients with NSLBP. If you are a student or faculty
member you will probably find the experience educational and you will be able to
watch the movement of your lumbar vertebrae and see a report on it.
sEMG sub-group study only: If you agree to participate in the sEMG sub-
study, there are no significant additional risks. You may however experience
minor discomfort during calliper measurements of skin fold thickness, as a
result of skin preparation prior to electrode attachment, or as a result of
electrode removal, any of which could possibly result in transient minor red
marks on the skin surface. There is also a very slight risk of allergy or
irritation caused by the adhesive on the electrodes.
6. Confidentiality and Data Protection
Ethical and legal practice will be followed with respect to any information obtained
from you in this study. Your details will be kept on a password protected database
until all the volunteers have been recruited. After this, all identifying details will be
destroyed. If you enter the study your GP will be informed and you will be asked to
provide your GP’s details (name and address) on the consent form. Following
review of your video x-rays all of your data will be anonymised so you cannot be
identified.
Consequently, you will not be able to withdraw from the study once your data have
been collected. This does not affect your right to withdraw from the study prior to, or
during data collection. Your anonymised data will also be retained indefinitely for
use in further studies.
7. What if there is a problem?
If you have a concern about any aspect of the study you should speak to me in the
first instance and I will do my best to answer your questions. If you remain unhappy
and wish to complain formally you can do this by contacting Professor Thiel, the
Chief Executive of the AECC.
In the event that something does go wrong and you are harmed during the research

301
due to someone’s negligence, you may have grounds for legal action for
compensation against the AECC but you may have to pay your own legal costs.
8. What will happen to the results of this study?
The results from this study will be anonymised, collated and analysed and published
in scientific journals as a reference database. It will also be presented at
international conferences such as that of the Society for Back Pain Research. Some
data will be referred to on the AECC website (www.aecc.ac.uk). You are welcome to
keep up to date with the study’s progress by periodically checking the website, or by
contacting me at any time; my details are at the end of this leaflet.
sEMG sub-group study only: The results from this study may also be
published as part of a PhD thesis at Bournemouth University.
9. Who is funding the research?
This research is being funded by the Anglo-European College of Chiropractic. The
sEMG sub-group study is funded by the European Chiropractors’ Union
Research Fund (ECURF).
10. Who has reviewed the study?
This research has been extensively reviewed by a spinal surgeon, a radiologist, a
statistician a medical physics expert, a bioengineer an ergonomist, a chief
superintendent radiographer and the South West 3 Research Ethics Committee
(REC Reference10/H0106/65). The sEMG sub-group study has been reviewed
by the Research Ethics Subcommittee of the AECC, and the AECC Patient and
Public Involvement (PPI) group.

302
11. Further information and contact details
Professor Alan Breen
Director
Institute for Musculoskeletal Research and Clinical Implementation,
Anglo-European College of Chiropractic.
13-15 Parkwood Road
Bournemouth BH5 2Df
Tel: 01202 436275
Email: [email protected]
Contact for sEMG sub-group study:
Mr Alister du Rose
Doctoral Research Fellow
Institute for Musculoskeletal Research and Clinical Implementation
Anglo-European College of Chiropractic.
13-15 Parkwood Road
Bournemouth BH5 2Df
Tel: 01202 436353
Email: [email protected]

303
Appendix D: Participant consent form for preliminary sEMG studies INFORMED CONSENT FORM
Title of Study:
Surface Electromyography of the Lumbar Paraspinal Muscles during the Weight Bearing
Sagittal Plane OSMIA Acquisition Procedure: An intra-subject repeatability study.
I confirm I have read and understood the Information Sheet for this study.
I understand that my participation is voluntary and that I am free to withdraw at
any time, and without giving a reason.
I understand that the information collected about me will be kept confidential and
treated at all times in an anonymous manner.
I agree to take part in the study.
___________________________ ____________________________ _________
Participant name (please print) Signature Date
___________________________ ____________________________ _________
Name of person taking consent Signature Date
One copy for participant, one copy for file
Contact Information (Researcher):
Alister du Rose
Anglo European College of Chiropractic
13-15 Parkwood Road
Bournemouth
BH52DF
Email [email protected]
Telephone 01202 436353

304
Appendix E: Copies of ethical approval letters

305
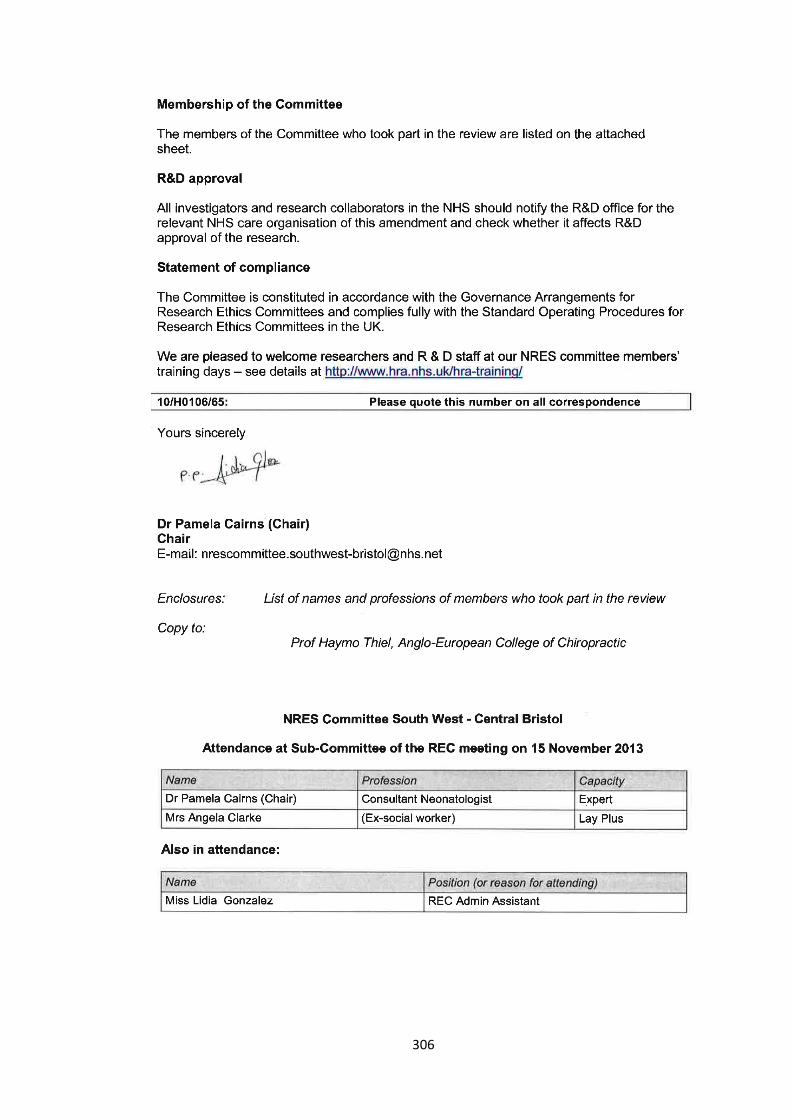
306
307
Appendix F: Summary of outcomes from PPI group meetings
Key points that were raised:
By participant
• Participants need to be re-assured that the bending will not cause the electrodes to fall
off. The patient felt that because they feel like they were moving slightly it can alter how
they were holding themselves, which could affect the muscle activity.
• When carrying out the sub-MVC, it would be beneficial to have a bench with a head piece
for comfort and avoiding a disproportionate measurement from one side due to head
positioning e.g. looking one way or the other.
• Practice repetitions would be helpful for the participant to get more used to the protocol.
By observers
• A concern was raised over the weight of the transmitters and whether this would affect
the findings.
• A concern was raised over the protocol if used with LBP patients, particularly the
requirement to fully flex the spine. It was explained that this was not a requirement for this
study, and that all current study participants were healthy.
• The question of age was raised. The author explained the limitations, pros and cons.
• Are obese participants going to fit in the equipment/ affect the signal? The author
explained the inclusion criteria of BMI<30 does account for this to some degree, although
the criteria may need to be tightened in future studies.
• There was concern that some of the information given to the participant may be
repeated and that some of the headings in the information sheet may be excluded. It was
explained that the headings are there usually at the request of the ethical institutions
themselves, and thus not under our control.
• It was suggested in order to improve participant comfort that they be given something to
rest on during the electrode application stage (whilst in flexion).
• If the participant decided at a late stage that they did not want the electrodes applied, it
was explained that they could still continue with the QF part of the study, without the
sEMG.
• Change to the wording of the information sheet: In the event of something going wrong
to IN THE UNLIKELY EVENT.
• Point made about pre-warning the participant about a question afterwards that relates to
pain, as this may instil the idea of pain in them and affect the activity. The problem could

308
be solved by exchanging the specific question to …you will be asked to complete a short
questionnaire
• Dr Val (name change) needs to be updated on the information sheets.
• The issue of chaperones was raised as female patients may be asked to remove their bras
for the testing procedure. It was decided to err on the side of caution that chaperones
should be offered in the event of a female radiographer not being present, and the
participant should be asked to make it clear that this is a requirement with good notice
before the session.
• There should be a mention of how many people will be in the room.
• Females will be gowned but will have opening at the back.
Timings
• Additional time allocated due to electrode application, skin preparation and sMVC
contraction was deemed appropriate.
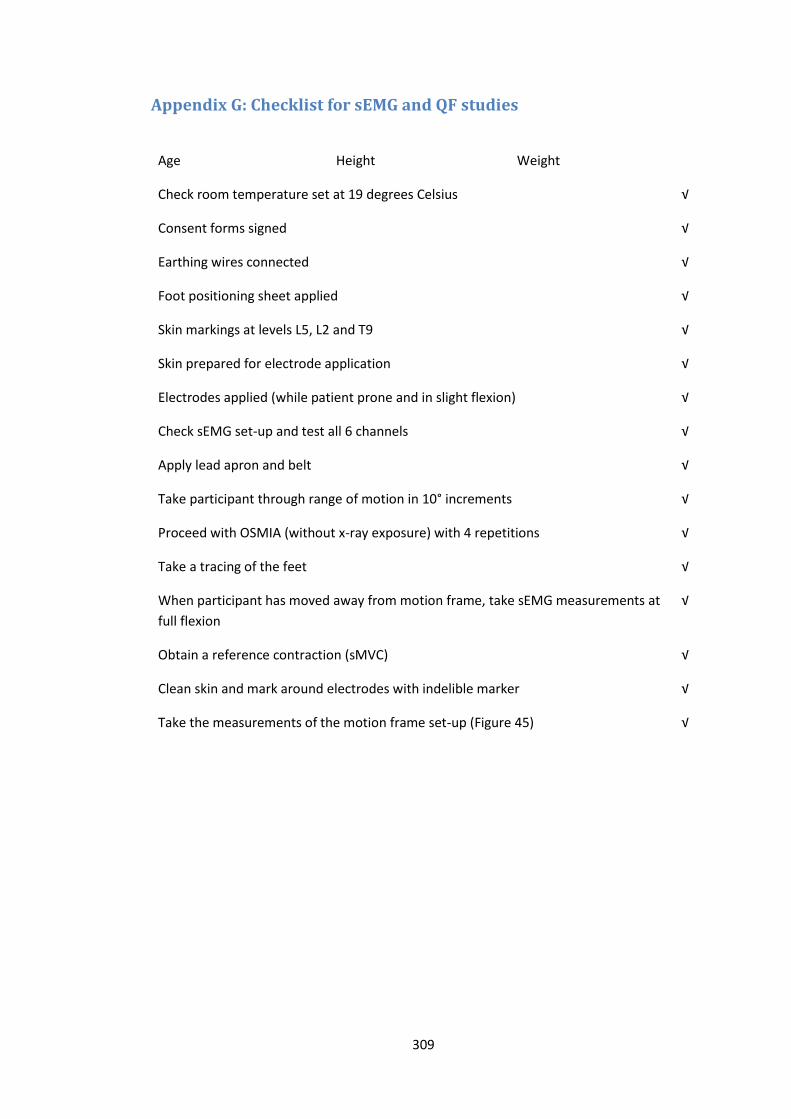
309
Appendix G: Checklist for sEMG and QF studies
Age Height Weight
Check room temperature set at 19 degrees Celsius √
Consent forms signed √
Earthing wires connected √
Foot positioning sheet applied √
Skin markings at levels L5, L2 and T9 √
Skin prepared for electrode application √
Electrodes applied (while patient prone and in slight flexion) √
Check sEMG set-up and test all 6 channels √
Apply lead apron and belt √
Take participant through range of motion in 10° increments √
Proceed with OSMIA (without x-ray exposure) with 4 repetitions √
Take a tracing of the feet √
When participant has moved away from motion frame, take sEMG measurements at
full flexion
√
Obtain a reference contraction (sMVC) √
Clean skin and mark around electrodes with indelible marker √
Take the measurements of the motion frame set-up (Figure 45) √
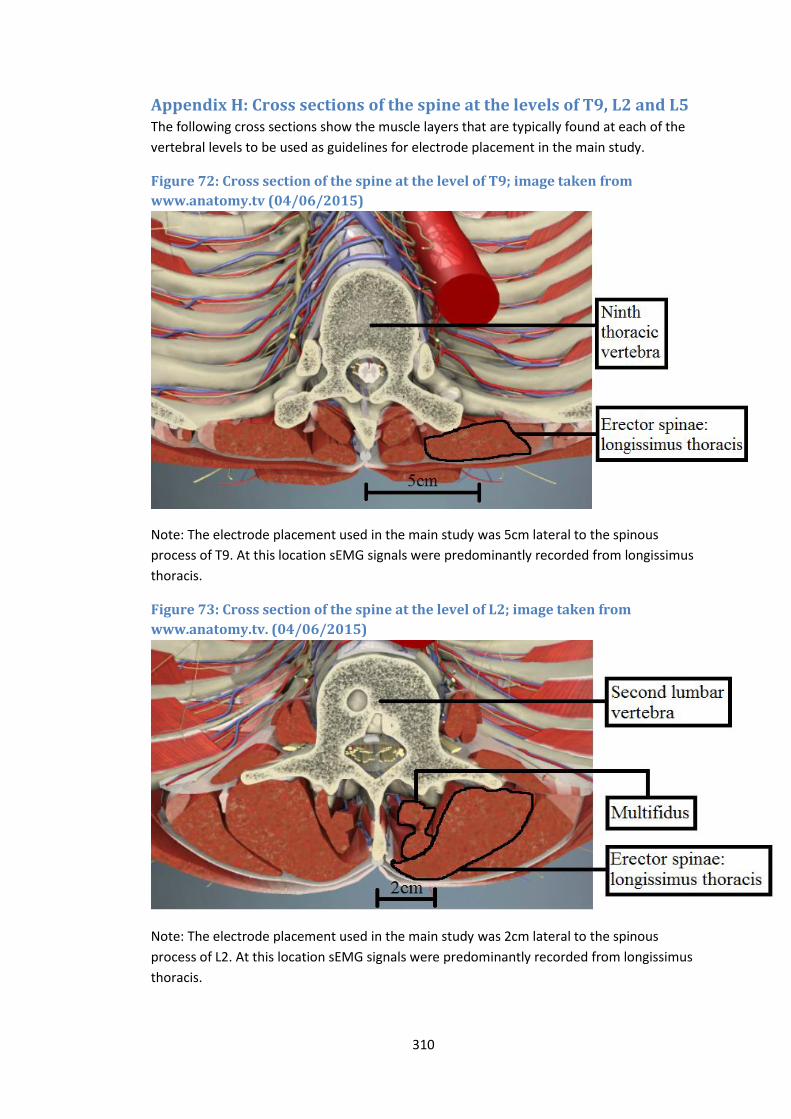
310
Appendix H: Cross sections of the spine at the levels of T9, L2 and L5 The following cross sections show the muscle layers that are typically found at each of the
vertebral levels to be used as guidelines for electrode placement in the main study.
Figure 72: Cross section of the spine at the level of T9; image taken from
www.anatomy.tv (04/06/2015)
Note: The electrode placement used in the main study was 5cm lateral to the spinous
process of T9. At this location sEMG signals were predominantly recorded from longissimus
thoracis.
Figure 73: Cross section of the spine at the level of L2; image taken from
www.anatomy.tv. (04/06/2015)
Note: The electrode placement used in the main study was 2cm lateral to the spinous
process of L2. At this location sEMG signals were predominantly recorded from longissimus
thoracis.
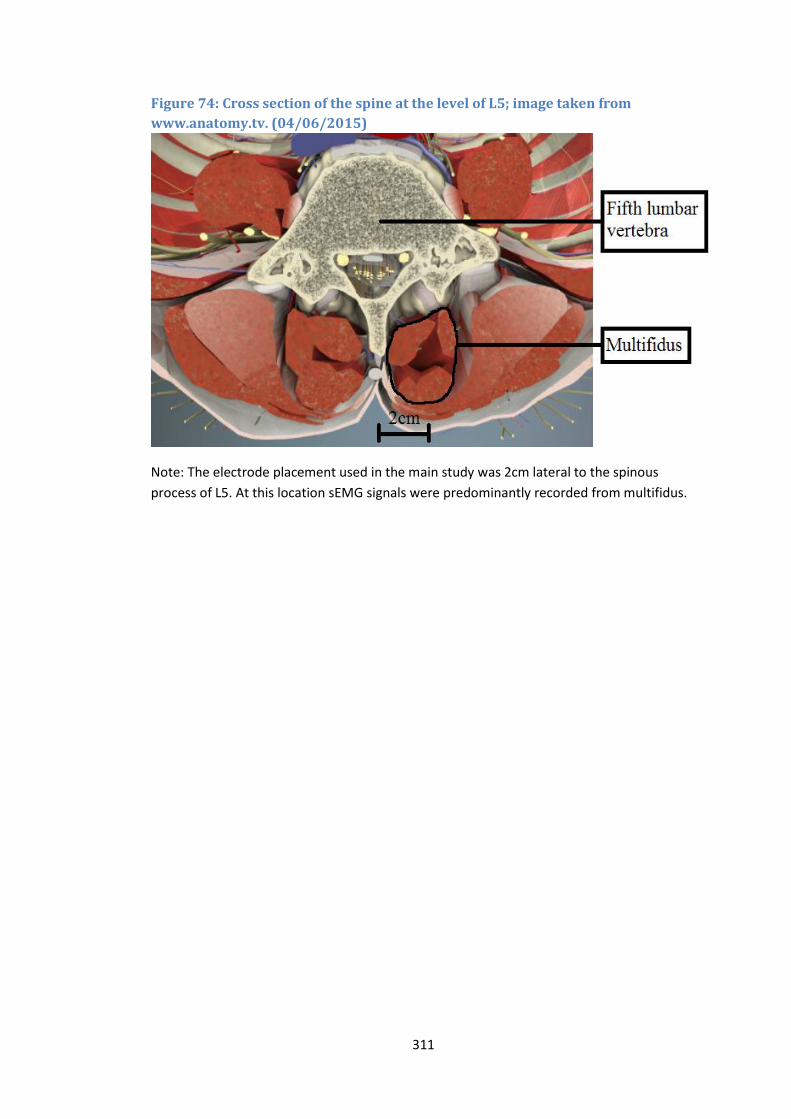
311
Figure 74: Cross section of the spine at the level of L5; image taken from
www.anatomy.tv. (04/06/2015)
Note: The electrode placement used in the main study was 2cm lateral to the spinous
process of L5. At this location sEMG signals were predominantly recorded from multifidus.

312
Appendix I
Tables of raw data for main study
Table 31: LMU sEMG amplitude changes throughout the flexion cycle Normalised EMG at L5 (epoch 1-epoch2)
Normalised EMG at L5 (epoch 2-epoch3)
Normalised EMG at L5 (epoch 3-epoch4)
Normalised EMG at L5 (epoch 4-epoch5)
Participant
RS082 -11.67483828 -8.478589139 -4.197349043 0.039149158
RS083 -7.138046797 -1.540323357 0.214186976 0.320520935
RS084 -5.440492648 -2.682543672 -1.357295463 1.17255247
RS085 -5.740485158 -6.245760135 -1.298275983 9.523029778
RS086 -7.987617247 -4.699143588 -2.150298447 0.717384051
RS087 -7.127847821 -6.320504313 -3.102189781 -4.927007299
RS088 -7.240250642 -1.917378629 1.840468852 -0.860316344
RS089 -6.406495426 -1.704702947 0.985747944 0.349949182
RS091 -8.483887619 -7.632180518 -7.709608436 -5.729665954
RS092 -20.90073159 -21.07691791 -7.636418552 1.902812269
RS093 -7.934198948 -1.020059982 0.871001922 2.336440206
RS094 -11.65020996 -8.160254228 -3.109749177 3.024628306
RS095 -6.768691023 -4.426264215 -0.588253085 -0.281272683
RS096 -4.926907797 -5.444914704 -5.583179706 -6.60166697
RS097 -5.825448383 -2.895071318 -2.072447394 -2.354893377
RS098 -6.282675048 -5.718322202 5.416880723 13.78471488
RS099 -8.306332842 -6.889638463 -5.287662122 -5.458691624
RS100 -7.213062597 -0.41587601 5.631370232 9.258354449
Shapiro-Wilk Statistic
0.683 0.777 0.965 0.91
df 18 18 18 18
Sig. 0 0.001 0.707 0.085
mean -8.169345546
-1.618503919 0.90089008
sd 3.667082139
3.801355762 5.471893874

313
Table 32: LES sEMG amplitude changes throughout the flexion cycle Normalised EMG at L2 (epoch 1- epoch 2)
Normalised EMG at L2 (epoch 2- epoch 3)
Normalised EMG at L2 (epoch 3- epoch 4)
Normalised EMG at L2 (epoch 4- epoch 5)
Participant
RS082 -7.376342204 -4.160677008 2.351279391 9.363867048
RS083 -3.884732128 4.10457549 3.952184069 1.199145609
RS084 -0.107118695 -0.120273622 -0.236788694
-0.210478839
RS085 -3.583946723 2.468162168 6.747283561 1.454609183
RS086 -3.695282404 0.965469595 3.408002729 2.68914765
RS087 -3.312377833 -2.205610439 4.543293359 0.612816314
RS088 -0.064352365 2.659897751 0.714004811 -0.177735103
RS089 -4.269183305 -0.668904297 4.154718398 1.89940204
RS091 -6.078212291 -4.931098696 -2.44320298 -2.003724395
RS092 -15.37917225 -2.673853149 7.93122657 3.789464175
RS093 -2.494378404 4.07796871 2.115032477 0.270194504
RS094 -1.878702582 2.16018067 2.186364678 2.169999673
RS095 -2.551885575 -1.263501309 1.783278652 2.507649206
RS096 -5.17243915 -2.559011692 -1.517758659
0.383851754
RS097 -0.521930665 0.252186682 0.142054523 0.178765243
RS098 -1.036708046 6.089790049 6.121100024 0.584452858
RS099 -8.594453053 -4.891977293 -0.397853755
-0.353196701
RS100 -0.497889656 -0.164278313 0.174387747 0.232516996
Shapiro-Wilk Statistic
0.842 0.97 0.974 0.789
df 18 18 18 18
Sig. 0.006 0.793 0.875 0.001
mean
-0.047830817 2.318255939
sd
3.213548543 2.883091056
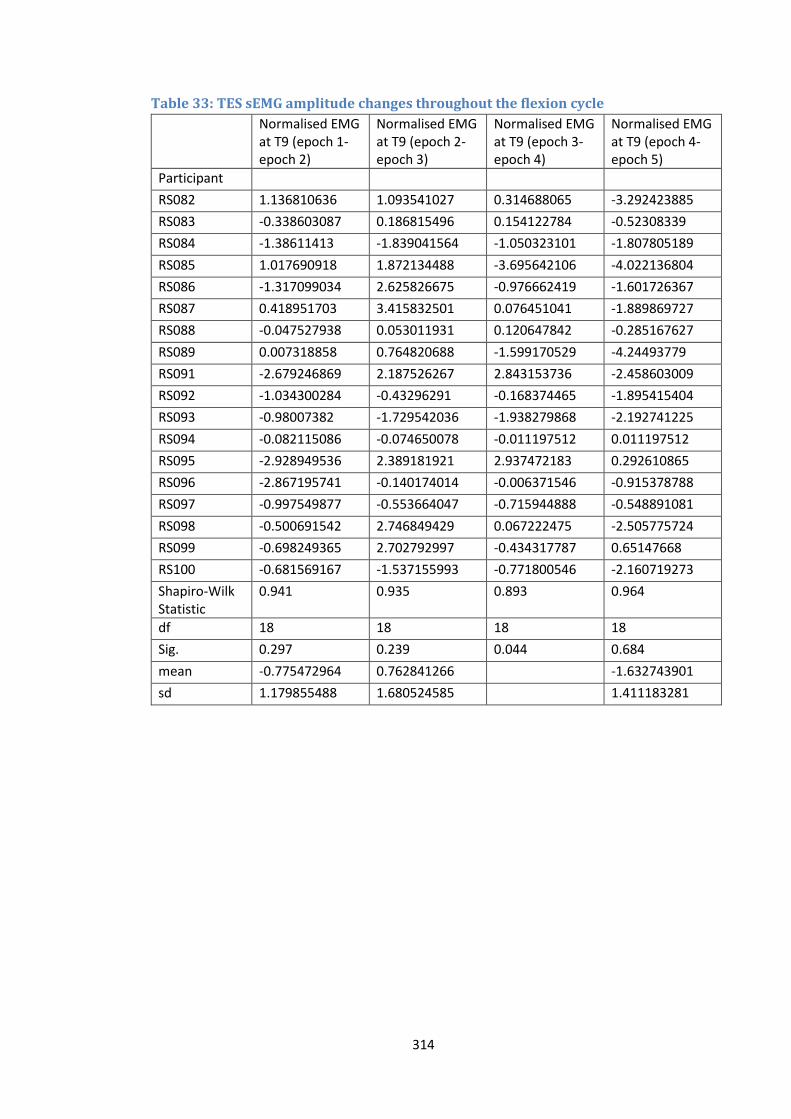
314
Table 33: TES sEMG amplitude changes throughout the flexion cycle Normalised EMG at T9 (epoch 1- epoch 2)
Normalised EMG at T9 (epoch 2- epoch 3)
Normalised EMG at T9 (epoch 3- epoch 4)
Normalised EMG at T9 (epoch 4- epoch 5)
Participant
RS082 1.136810636 1.093541027 0.314688065 -3.292423885
RS083 -0.338603087 0.186815496 0.154122784 -0.52308339
RS084 -1.38611413 -1.839041564 -1.050323101 -1.807805189
RS085 1.017690918 1.872134488 -3.695642106 -4.022136804
RS086 -1.317099034 2.625826675 -0.976662419 -1.601726367
RS087 0.418951703 3.415832501 0.076451041 -1.889869727
RS088 -0.047527938 0.053011931 0.120647842 -0.285167627
RS089 0.007318858 0.764820688 -1.599170529 -4.24493779
RS091 -2.679246869 2.187526267 2.843153736 -2.458603009
RS092 -1.034300284 -0.43296291 -0.168374465 -1.895415404
RS093 -0.98007382 -1.729542036 -1.938279868 -2.192741225
RS094 -0.082115086 -0.074650078 -0.011197512 0.011197512
RS095 -2.928949536 2.389181921 2.937472183 0.292610865
RS096 -2.867195741 -0.140174014 -0.006371546 -0.915378788
RS097 -0.997549877 -0.553664047 -0.715944888 -0.548891081
RS098 -0.500691542 2.746849429 0.067222475 -2.505775724
RS099 -0.698249365 2.702792997 -0.434317787 0.65147668
RS100 -0.681569167 -1.537155993 -0.771800546 -2.160719273
Shapiro-Wilk Statistic
0.941 0.935 0.893 0.964
df 18 18 18 18
Sig. 0.297 0.239 0.044 0.684
mean -0.775472964 0.762841266
-1.632743901
sd 1.179855488 1.680524585
1.411183281
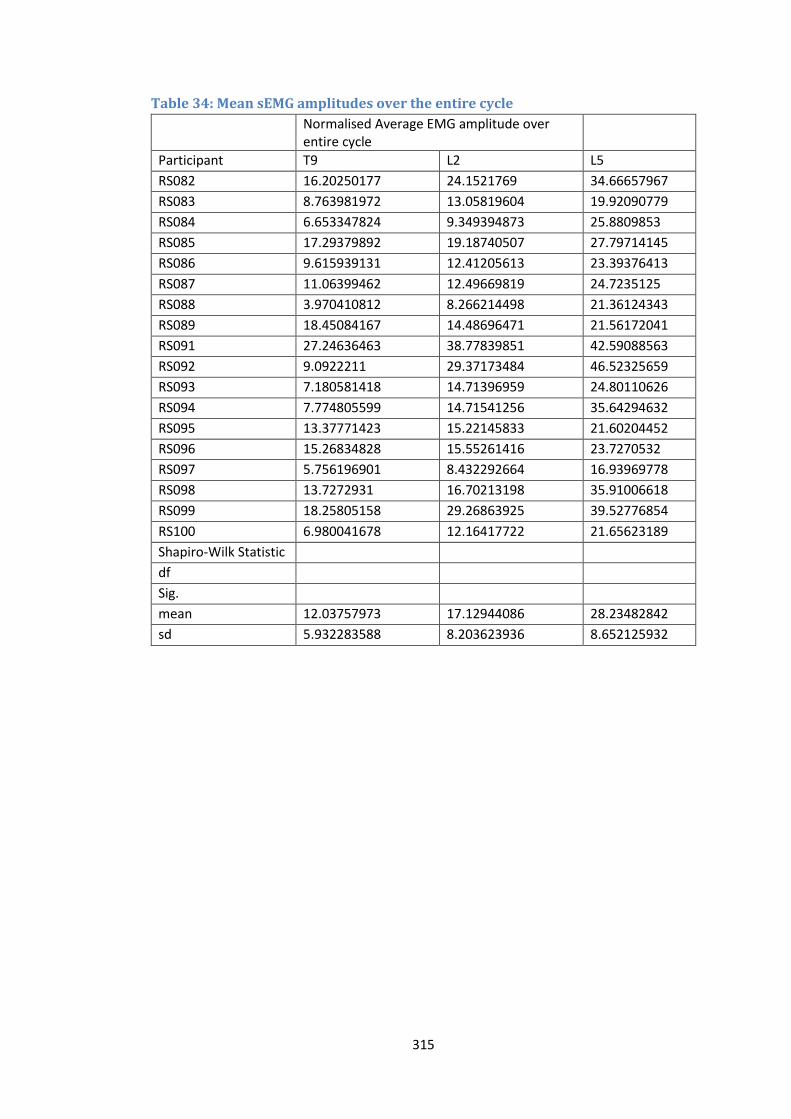
315
Table 34: Mean sEMG amplitudes over the entire cycle Normalised Average EMG amplitude over entire cycle
Participant T9 L2 L5
RS082 16.20250177 24.1521769 34.66657967
RS083 8.763981972 13.05819604 19.92090779
RS084 6.653347824 9.349394873 25.8809853
RS085 17.29379892 19.18740507 27.79714145
RS086 9.615939131 12.41205613 23.39376413
RS087 11.06399462 12.49669819 24.7235125
RS088 3.970410812 8.266214498 21.36124343
RS089 18.45084167 14.48696471 21.56172041
RS091 27.24636463 38.77839851 42.59088563
RS092 9.0922211 29.37173484 46.52325659
RS093 7.180581418 14.71396959 24.80110626
RS094 7.774805599 14.71541256 35.64294632
RS095 13.37771423 15.22145833 21.60204452
RS096 15.26834828 15.55261416 23.7270532
RS097 5.756196901 8.432292664 16.93969778
RS098 13.7272931 16.70213198 35.91006618
RS099 18.25805158 29.26863925 39.52776854
RS100 6.980041678 12.16417722 21.65623189
Shapiro-Wilk Statistic
df
Sig.
mean 12.03757973 17.12944086 28.23482842
sd 5.932283588 8.203623936 8.652125932
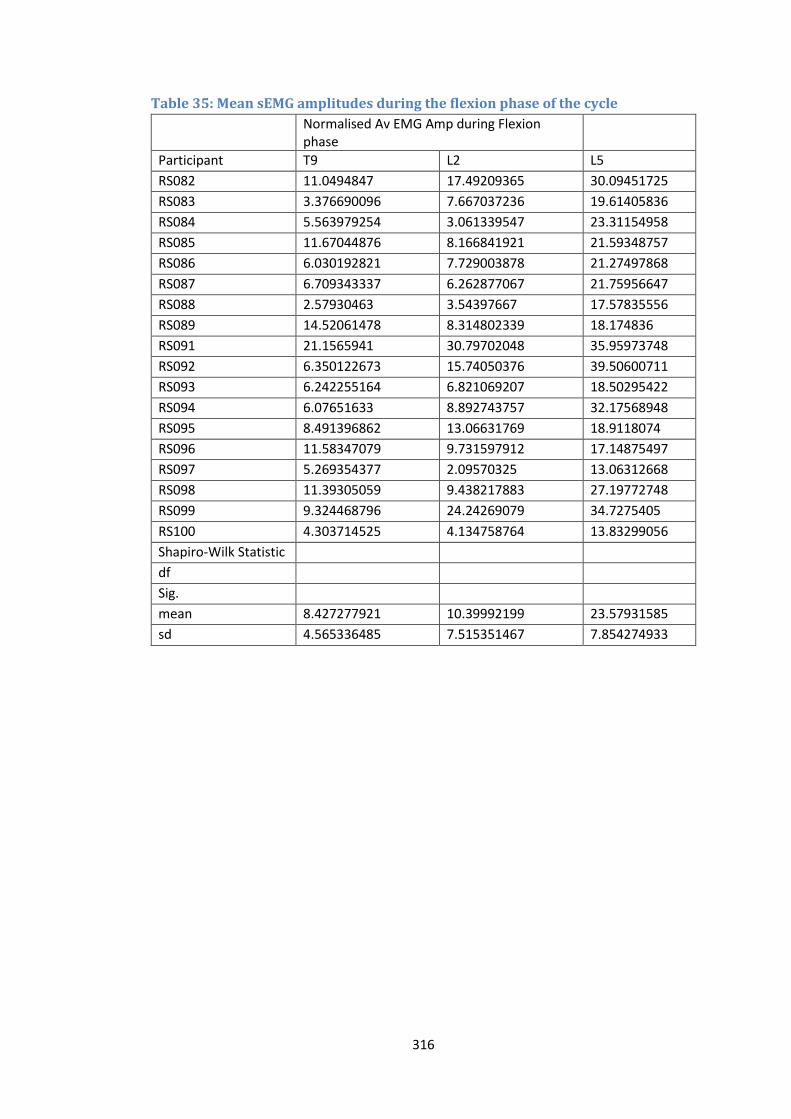
316
Table 35: Mean sEMG amplitudes during the flexion phase of the cycle Normalised Av EMG Amp during Flexion phase
Participant T9 L2 L5
RS082 11.0494847 17.49209365 30.09451725
RS083 3.376690096 7.667037236 19.61405836
RS084 5.563979254 3.061339547 23.31154958
RS085 11.67044876 8.166841921 21.59348757
RS086 6.030192821 7.729003878 21.27497868
RS087 6.709343337 6.262877067 21.75956647
RS088 2.57930463 3.54397667 17.57835556
RS089 14.52061478 8.314802339 18.174836
RS091 21.1565941 30.79702048 35.95973748
RS092 6.350122673 15.74050376 39.50600711
RS093 6.242255164 6.821069207 18.50295422
RS094 6.07651633 8.892743757 32.17568948
RS095 8.491396862 13.06631769 18.9118074
RS096 11.58347079 9.731597912 17.14875497
RS097 5.269354377 2.09570325 13.06312668
RS098 11.39305059 9.438217883 27.19772748
RS099 9.324468796 24.24269079 34.7275405
RS100 4.303714525 4.134758764 13.83299056
Shapiro-Wilk Statistic
df
Sig.
mean 8.427277921 10.39992199 23.57931585
sd 4.565336485 7.515351467 7.854274933
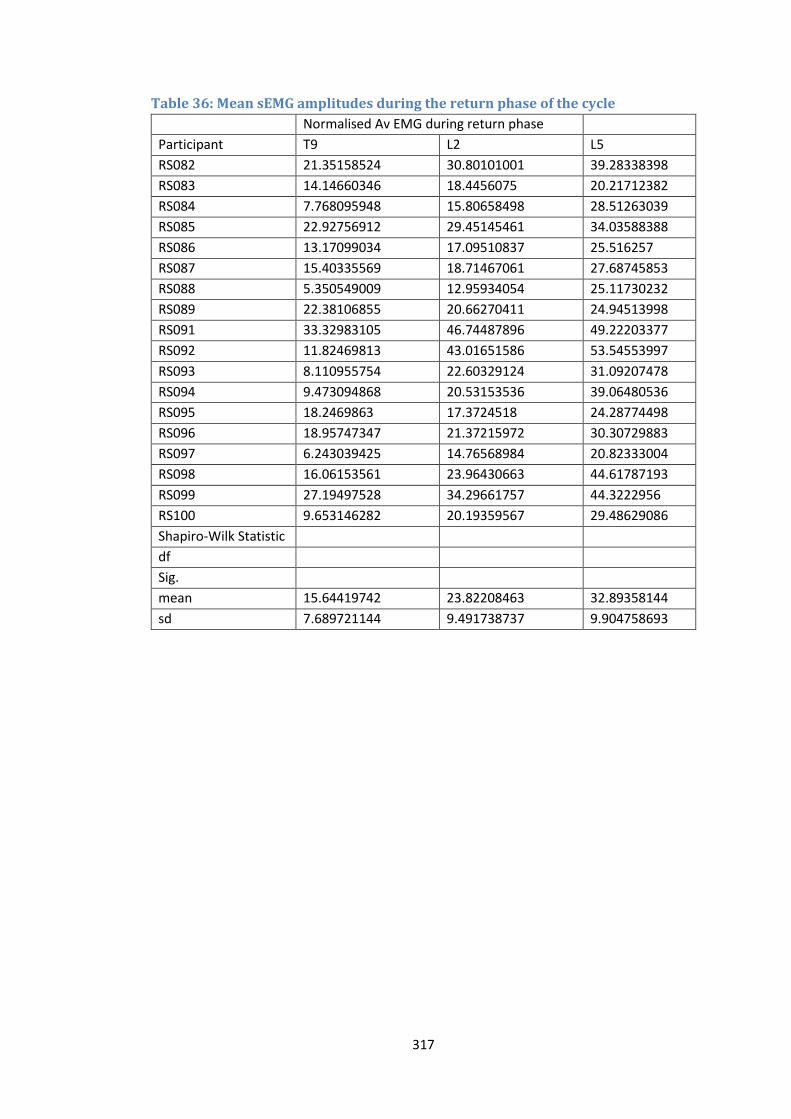
317
Table 36: Mean sEMG amplitudes during the return phase of the cycle Normalised Av EMG during return phase
Participant T9 L2 L5
RS082 21.35158524 30.80101001 39.28338398
RS083 14.14660346 18.4456075 20.21712382
RS084 7.768095948 15.80658498 28.51263039
RS085 22.92756912 29.45145461 34.03588388
RS086 13.17099034 17.09510837 25.516257
RS087 15.40335569 18.71467061 27.68745853
RS088 5.350549009 12.95934054 25.11730232
RS089 22.38106855 20.66270411 24.94513998
RS091 33.32983105 46.74487896 49.22203377
RS092 11.82469813 43.01651586 53.54553997
RS093 8.110955754 22.60329124 31.09207478
RS094 9.473094868 20.53153536 39.06480536
RS095 18.2469863 17.3724518 24.28774498
RS096 18.95747347 21.37215972 30.30729883
RS097 6.243039425 14.76568984 20.82333004
RS098 16.06153561 23.96430663 44.61787193
RS099 27.19497528 34.29661757 44.3222956
RS100 9.653146282 20.19359567 29.48629086
Shapiro-Wilk Statistic
df
Sig.
mean 15.64419742 23.82208463 32.89358144
sd 7.689721144 9.491738737 9.904758693
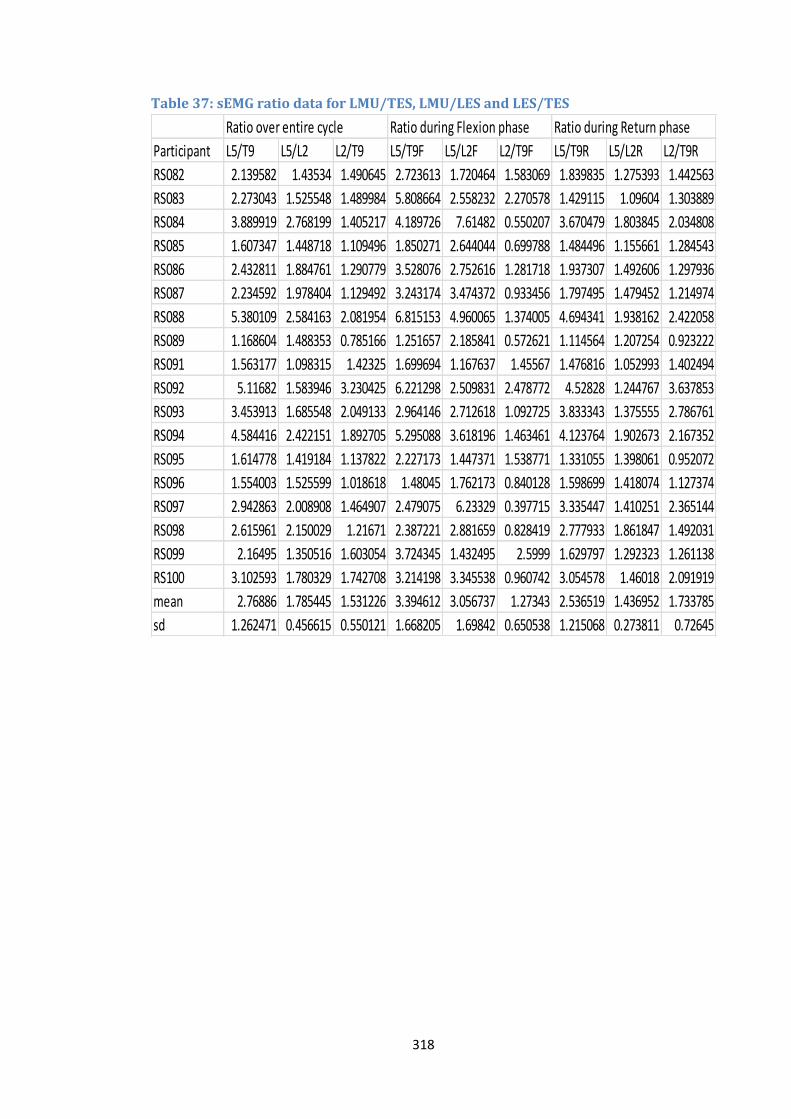
318
Table 37: sEMG ratio data for LMU/TES, LMU/LES and LES/TES
Ratio over entire cycle Ratio during Flexion phase Ratio during Return phase
Participant L5/T9 L5/L2 L2/T9 L5/T9F L5/L2F L2/T9F L5/T9R L5/L2R L2/T9R
RS082 2.139582 1.43534 1.490645 2.723613 1.720464 1.583069 1.839835 1.275393 1.442563
RS083 2.273043 1.525548 1.489984 5.808664 2.558232 2.270578 1.429115 1.09604 1.303889
RS084 3.889919 2.768199 1.405217 4.189726 7.61482 0.550207 3.670479 1.803845 2.034808
RS085 1.607347 1.448718 1.109496 1.850271 2.644044 0.699788 1.484496 1.155661 1.284543
RS086 2.432811 1.884761 1.290779 3.528076 2.752616 1.281718 1.937307 1.492606 1.297936
RS087 2.234592 1.978404 1.129492 3.243174 3.474372 0.933456 1.797495 1.479452 1.214974
RS088 5.380109 2.584163 2.081954 6.815153 4.960065 1.374005 4.694341 1.938162 2.422058
RS089 1.168604 1.488353 0.785166 1.251657 2.185841 0.572621 1.114564 1.207254 0.923222
RS091 1.563177 1.098315 1.42325 1.699694 1.167637 1.45567 1.476816 1.052993 1.402494
RS092 5.11682 1.583946 3.230425 6.221298 2.509831 2.478772 4.52828 1.244767 3.637853
RS093 3.453913 1.685548 2.049133 2.964146 2.712618 1.092725 3.833343 1.375555 2.786761
RS094 4.584416 2.422151 1.892705 5.295088 3.618196 1.463461 4.123764 1.902673 2.167352
RS095 1.614778 1.419184 1.137822 2.227173 1.447371 1.538771 1.331055 1.398061 0.952072
RS096 1.554003 1.525599 1.018618 1.48045 1.762173 0.840128 1.598699 1.418074 1.127374
RS097 2.942863 2.008908 1.464907 2.479075 6.23329 0.397715 3.335447 1.410251 2.365144
RS098 2.615961 2.150029 1.21671 2.387221 2.881659 0.828419 2.777933 1.861847 1.492031
RS099 2.16495 1.350516 1.603054 3.724345 1.432495 2.5999 1.629797 1.292323 1.261138
RS100 3.102593 1.780329 1.742708 3.214198 3.345538 0.960742 3.054578 1.46018 2.091919
mean 2.76886 1.785445 1.531226 3.394612 3.056737 1.27343 2.536519 1.436952 1.733785
sd 1.262471 0.456615 0.550121 1.668205 1.69842 0.650538 1.215068 0.273811 0.72645

319
Table 38: IV-RoMmax data Angular range
Participant L2/L3 L3/L4 L4/L5 L5/S1
RS082 14.8 11.8 2.8 1
RS083 11.9 11.6 4.4 6.4
RS084 8 11.7 11.6 6.1
RS085 8.4 11.2 15.3 7.9
RS086 11.3 10.7 8.7 2
RS087 9.1 9.9 13 5.2
RS088 10 11 11.2 5.4
RS089 9.9 11.9 8.8 7.6
RS091 7.4 10.6 7.4 4.6
RS092 4.6 6.4 9.7 9.5
RS093 7.7 10.3 9.7 9.2
RS094 10.4 13.4 6.2 11.4
RS095 4.3 9.3 16.6 0.8
RS096 12 10.19 9.1 5
RS097 5.1 7.7 11 10.5
RS098 7.7 9.7 13.3 9.8
RS099 9.8 8.9 4.1 4.3
RS100 8.3 9.3 14 8.7
Shapiro-Wilk Statistic
0.969 0.968 0.978 0.958
df 18 18 18 18
Sig. 0.78 0.767 0.931 0.556
mean 8.927777778 10.31055556 9.827777778 6.411111111
sd 2.712889832 1.646388105 3.875534962 3.179139523

320
Table 39: Initial attainment rate data laxity data for 18
Participant L2/L3 L3/L4 L4/L5 L5/S1
RS082 0.2168 0.0076 0.0425 0.0202
RS083 0.2954 0.2883 0.008 0.1006
RS084 0.3595 0.1779 0.0526 0.0505
RS085 0.1765 0.1304 0.0748 0.0697
RS086 0.1916 0.0429 0.0179 0.1373
RS087 0.2069 0.074 0.132 0.0211
RS088 0.1074 0.0476 0.0444 0.2587
RS089 0.2149 0.0873 0.0163 0.1441
RS091 0.1155 0.0875 0.0797 0.1161
RS092 0.1926 0.2004 0.1565 0.0843
RS093 0.3544 0.1143 0.039 0.0727
RS094 0.1238 0.1768 0.026 0.094
RS095 0.07 0.0344 0.1507 0.0077
RS096 0.2658 0.1519 0.1193 0.1015
RS097 0.1945 0.2239 0.0791 0.13
RS098 0.1675 0.1118 0.0699 0.641
RS099 0.1087 0.0428 0.0404 0.0453
RS100 0.237 0.4892 0.1776 0.3293
Shapiro-Wilk Statistic
0.949 0.847 0.909 0.698
df 18 18 18 18
Sig. 0.417 0.008 0.084 0
mean 0.199933333
0.073705556
sd 0.081584456
0.052428893
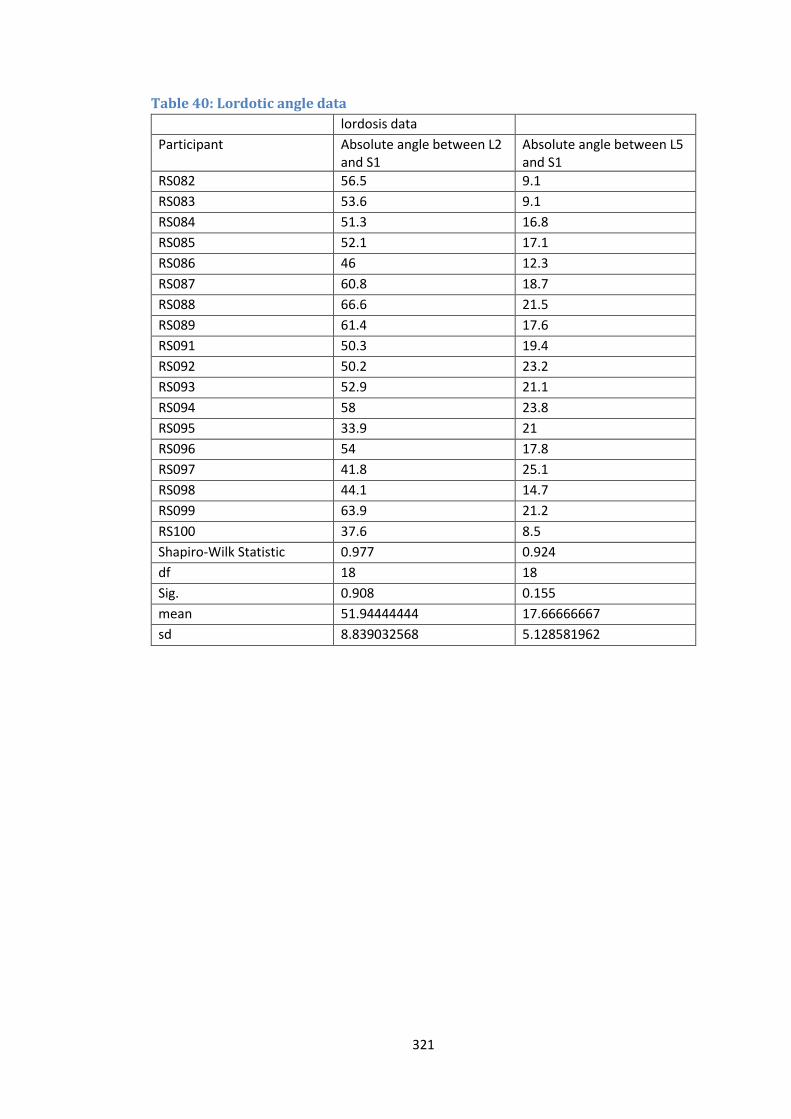
321
Table 40: Lordotic angle data lordosis data
Participant Absolute angle between L2 and S1
Absolute angle between L5 and S1
RS082 56.5 9.1
RS083 53.6 9.1
RS084 51.3 16.8
RS085 52.1 17.1
RS086 46 12.3
RS087 60.8 18.7
RS088 66.6 21.5
RS089 61.4 17.6
RS091 50.3 19.4
RS092 50.2 23.2
RS093 52.9 21.1
RS094 58 23.8
RS095 33.9 21
RS096 54 17.8
RS097 41.8 25.1
RS098 44.1 14.7
RS099 63.9 21.2
RS100 37.6 8.5
Shapiro-Wilk Statistic 0.977 0.924
df 18 18
Sig. 0.908 0.155
mean 51.94444444 17.66666667
sd 8.839032568 5.128581962
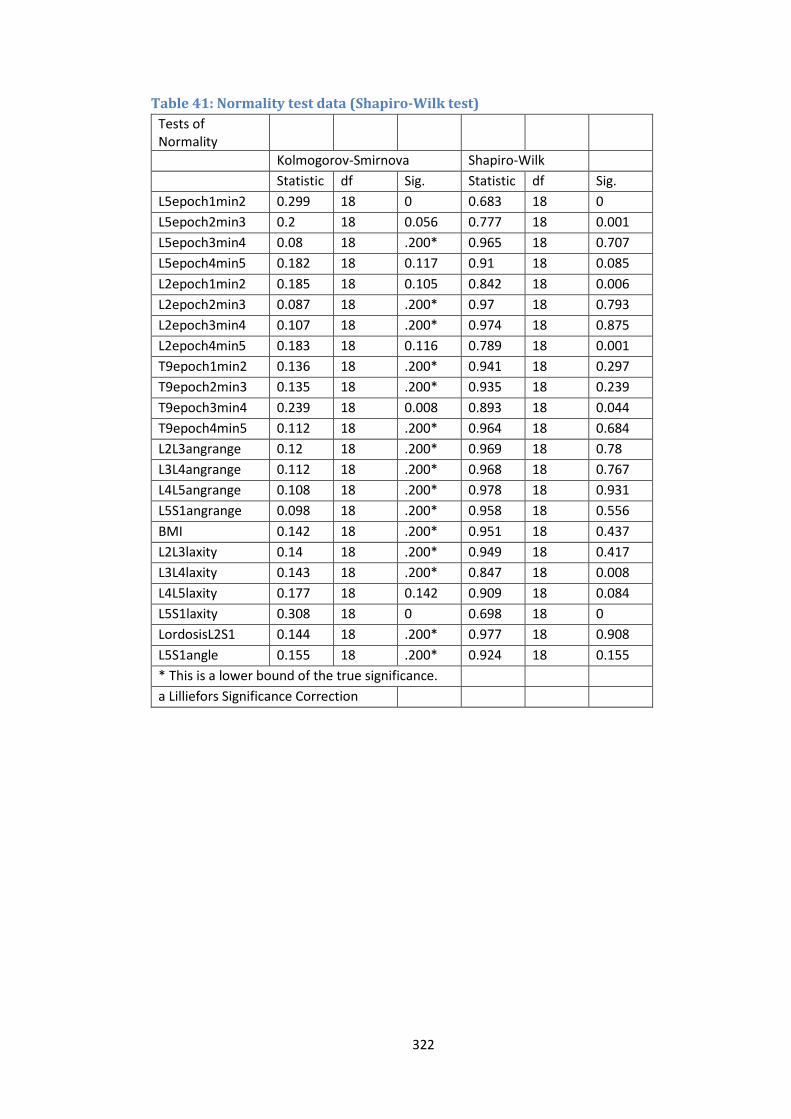
322
Table 41: Normality test data (Shapiro-Wilk test)
Tests of Normality
Kolmogorov-Smirnova Shapiro-Wilk
Statistic df Sig. Statistic df Sig.
L5epoch1min2 0.299 18 0 0.683 18 0
L5epoch2min3 0.2 18 0.056 0.777 18 0.001
L5epoch3min4 0.08 18 .200* 0.965 18 0.707
L5epoch4min5 0.182 18 0.117 0.91 18 0.085
L2epoch1min2 0.185 18 0.105 0.842 18 0.006
L2epoch2min3 0.087 18 .200* 0.97 18 0.793
L2epoch3min4 0.107 18 .200* 0.974 18 0.875
L2epoch4min5 0.183 18 0.116 0.789 18 0.001
T9epoch1min2 0.136 18 .200* 0.941 18 0.297
T9epoch2min3 0.135 18 .200* 0.935 18 0.239
T9epoch3min4 0.239 18 0.008 0.893 18 0.044
T9epoch4min5 0.112 18 .200* 0.964 18 0.684
L2L3angrange 0.12 18 .200* 0.969 18 0.78
L3L4angrange 0.112 18 .200* 0.968 18 0.767
L4L5angrange 0.108 18 .200* 0.978 18 0.931
L5S1angrange 0.098 18 .200* 0.958 18 0.556
BMI 0.142 18 .200* 0.951 18 0.437
L2L3laxity 0.14 18 .200* 0.949 18 0.417
L3L4laxity 0.143 18 .200* 0.847 18 0.008
L4L5laxity 0.177 18 0.142 0.909 18 0.084
L5S1laxity 0.308 18 0 0.698 18 0
LordosisL2S1 0.144 18 .200* 0.977 18 0.908
L5S1angle 0.155 18 .200* 0.924 18 0.155
* This is a lower bound of the true significance.
a Lilliefors Significance Correction

323
Appendix J: Scatter plots for sEMG variables vs IV-RoMmax
Figure 75: LES epoch 1-2 (%MVC) vs L4-L5 IV-RoMmax (°)
Figure 76: LMU epoch 4-5 (%MVC) vs L5-S1 IV-RoMmax (°)
0
2
4
6
8
10
12
14
16
18
-20 -15 -10 -5 0
L4-L
5 I
V-R
oM
max
(°)
L2 epoch 1-2 (%MVC)
0
2
4
6
8
10
12
-10 -5 0 5 10 15
L5-S
1 I
V-R
oM
max
(°)
LMU epoch 4-5 (%MVC)
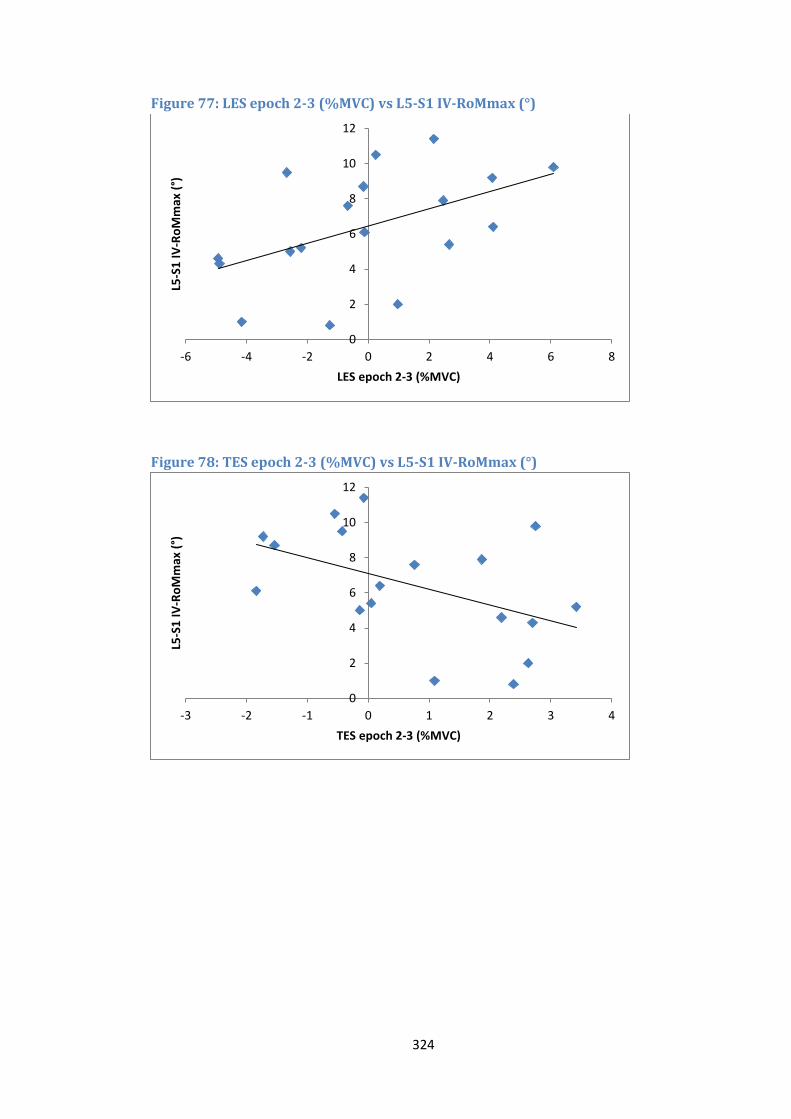
324
Figure 77: LES epoch 2-3 (%MVC) vs L5-S1 IV-RoMmax (°)
Figure 78: TES epoch 2-3 (%MVC) vs L5-S1 IV-RoMmax (°)
0
2
4
6
8
10
12
-6 -4 -2 0 2 4 6 8
L5-S
1 I
V-R
oM
max
(°)
LES epoch 2-3 (%MVC)
0
2
4
6
8
10
12
-3 -2 -1 0 1 2 3 4
L5-S
1 I
V-R
oM
max
(°)
TES epoch 2-3 (%MVC)
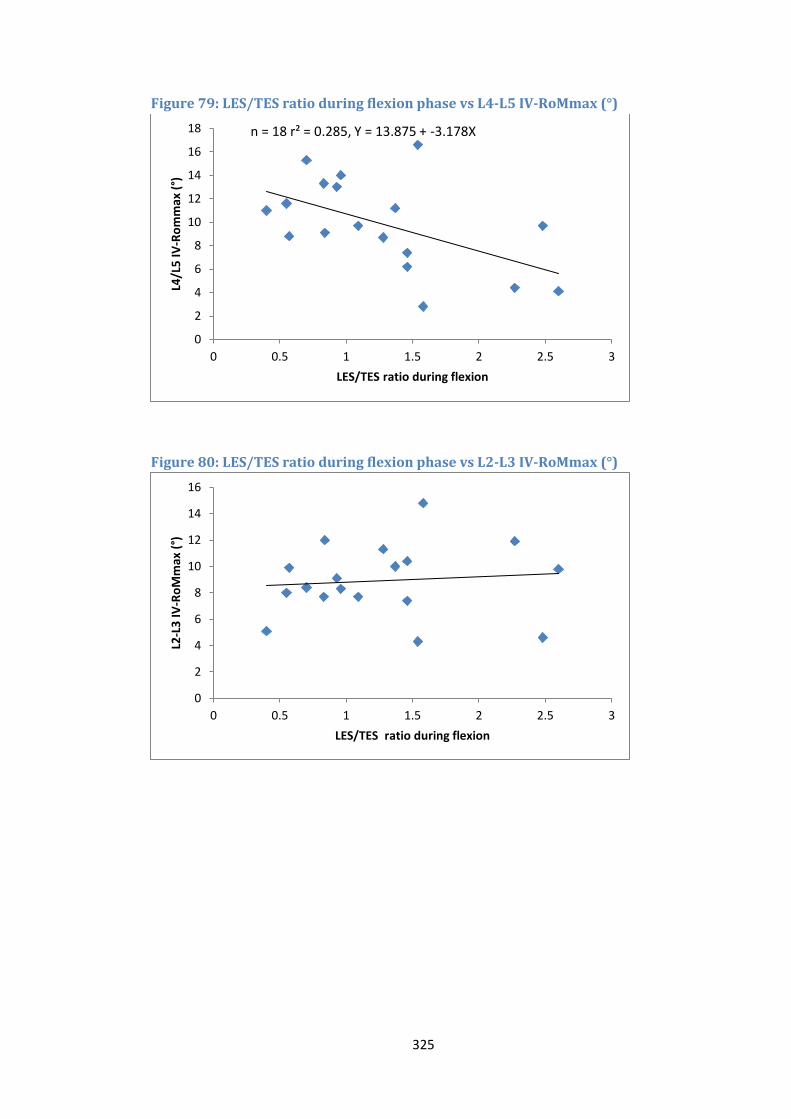
325
Figure 79: LES/TES ratio during flexion phase vs L4-L5 IV-RoMmax (°)
Figure 80: LES/TES ratio during flexion phase vs L2-L3 IV-RoMmax (°)
0
2
4
6
8
10
12
14
16
18
0 0.5 1 1.5 2 2.5 3
L4/L
5 I
V-R
om
max
(°)
LES/TES ratio during flexion
n = 18 r² = 0.285, Y = 13.875 + -3.178X
0
2
4
6
8
10
12
14
16
0 0.5 1 1.5 2 2.5 3
L2-L
3 I
V-R
oM
max
(°)
LES/TES ratio during flexion
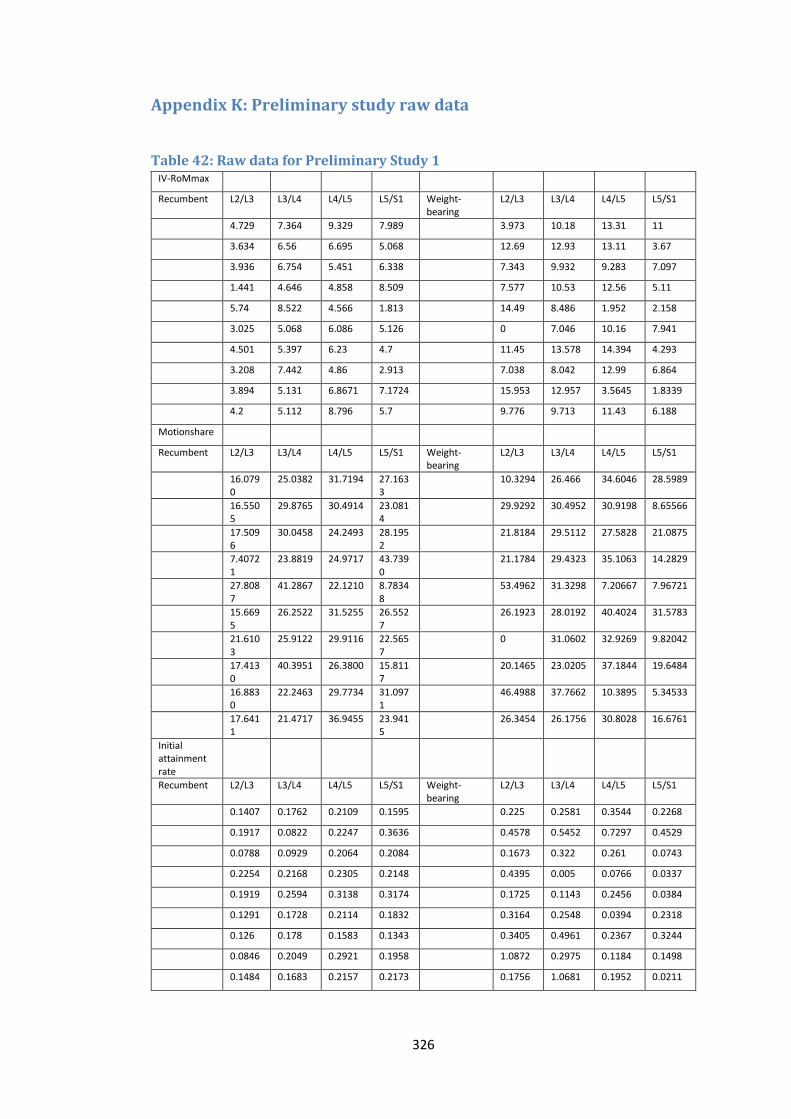
326
Appendix K: Preliminary study raw data
Table 42: Raw data for Preliminary Study 1 IV-RoMmax
Recumbent L2/L3 L3/L4 L4/L5 L5/S1 Weight-bearing
L2/L3 L3/L4 L4/L5 L5/S1
4.729 7.364 9.329 7.989
3.973 10.18 13.31 11
3.634 6.56 6.695 5.068
12.69 12.93 13.11 3.67
3.936 6.754 5.451 6.338
7.343 9.932 9.283 7.097
1.441 4.646 4.858 8.509
7.577 10.53 12.56 5.11
5.74 8.522 4.566 1.813
14.49 8.486 1.952 2.158
3.025 5.068 6.086 5.126
0 7.046 10.16 7.941
4.501 5.397 6.23 4.7
11.45 13.578 14.394 4.293
3.208 7.442 4.86 2.913
7.038 8.042 12.99 6.864
3.894 5.131 6.8671 7.1724
15.953 12.957 3.5645 1.8339
4.2 5.112 8.796 5.7
9.776 9.713 11.43 6.188
Motionshare
Recumbent L2/L3 L3/L4 L4/L5 L5/S1 Weight-bearing
L2/L3 L3/L4 L4/L5 L5/S1
16.0790
25.0382 31.7194 27.1633
10.3294 26.466 34.6046 28.5989
16.5505
29.8765 30.4914 23.0814
29.9292 30.4952 30.9198 8.65566
17.5096
30.0458 24.2493 28.1952
21.8184 29.5112 27.5828 21.0875
7.40721
23.8819 24.9717 43.7390
21.1784 29.4323 35.1063 14.2829
27.8087
41.2867 22.1210 8.78348
53.4962 31.3298 7.20667 7.96721
15.6695
26.2522 31.5255 26.5527
26.1923 28.0192 40.4024 31.5783
21.6103
25.9122 29.9116 22.5657
0 31.0602 32.9269 9.82042
17.4130
40.3951 26.3800 15.8117
20.1465 23.0205 37.1844 19.6484
16.8830
22.2463 29.7734 31.0971
46.4988 37.7662 10.3895 5.34533
17.6411
21.4717 36.9455 23.9415
26.3454 26.1756 30.8028 16.6761
Initial attainment rate
Recumbent L2/L3 L3/L4 L4/L5 L5/S1 Weight-bearing
L2/L3 L3/L4 L4/L5 L5/S1
0.1407 0.1762 0.2109 0.1595
0.225 0.2581 0.3544 0.2268
0.1917 0.0822 0.2247 0.3636
0.4578 0.5452 0.7297 0.4529
0.0788 0.0929 0.2064 0.2084
0.1673 0.322 0.261 0.0743
0.2254 0.2168 0.2305 0.2148
0.4395 0.005 0.0766 0.0337
0.1919 0.2594 0.3138 0.3174
0.1725 0.1143 0.2456 0.0384
0.1291 0.1728 0.2114 0.1832
0.3164 0.2548 0.0394 0.2318
0.126 0.178 0.1583 0.1343
0.3405 0.4961 0.2367 0.3244
0.0846 0.2049 0.2921 0.1958
1.0872 0.2975 0.1184 0.1498
0.1484 0.1683 0.2157 0.2173
0.1756 1.0681 0.1952 0.0211
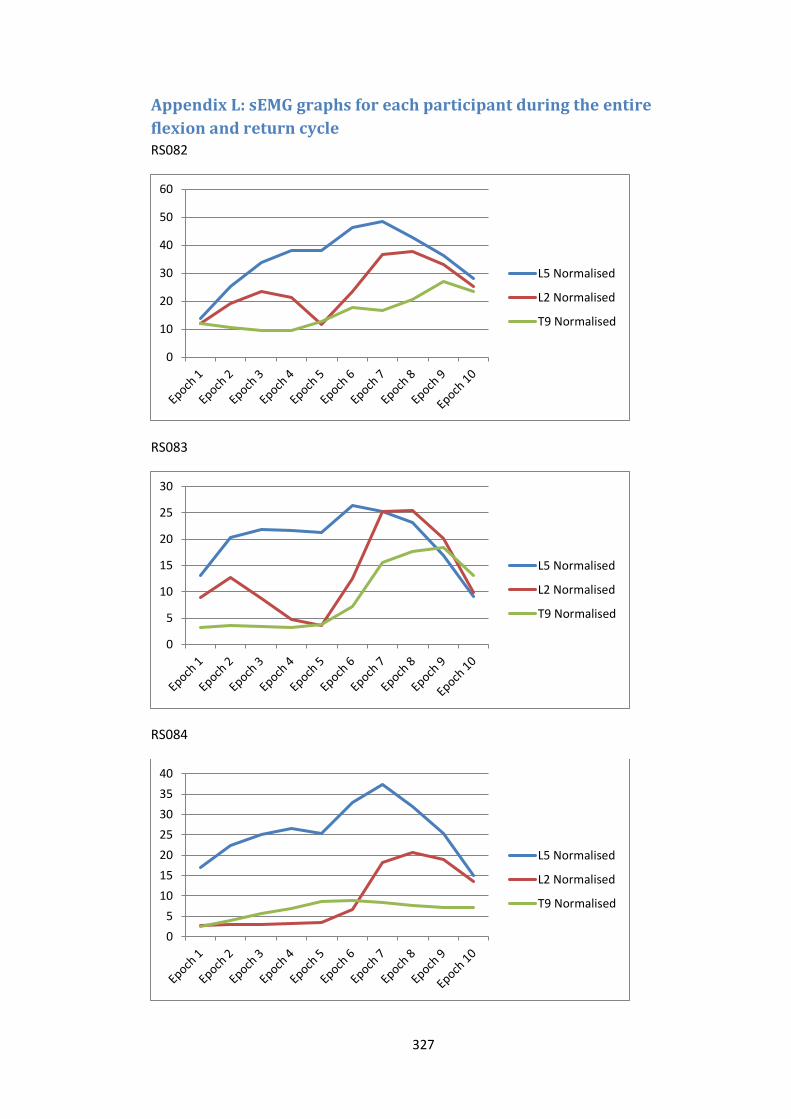
327
Appendix L: sEMG graphs for each participant during the entire
flexion and return cycle RS082
RS083
RS084
0
10
20
30
40
50
60
L5 Normalised
L2 Normalised
T9 Normalised
0
5
10
15
20
25
30
L5 Normalised
L2 Normalised
T9 Normalised
0
5
10
15
20
25
30
35
40
L5 Normalised
L2 Normalised
T9 Normalised
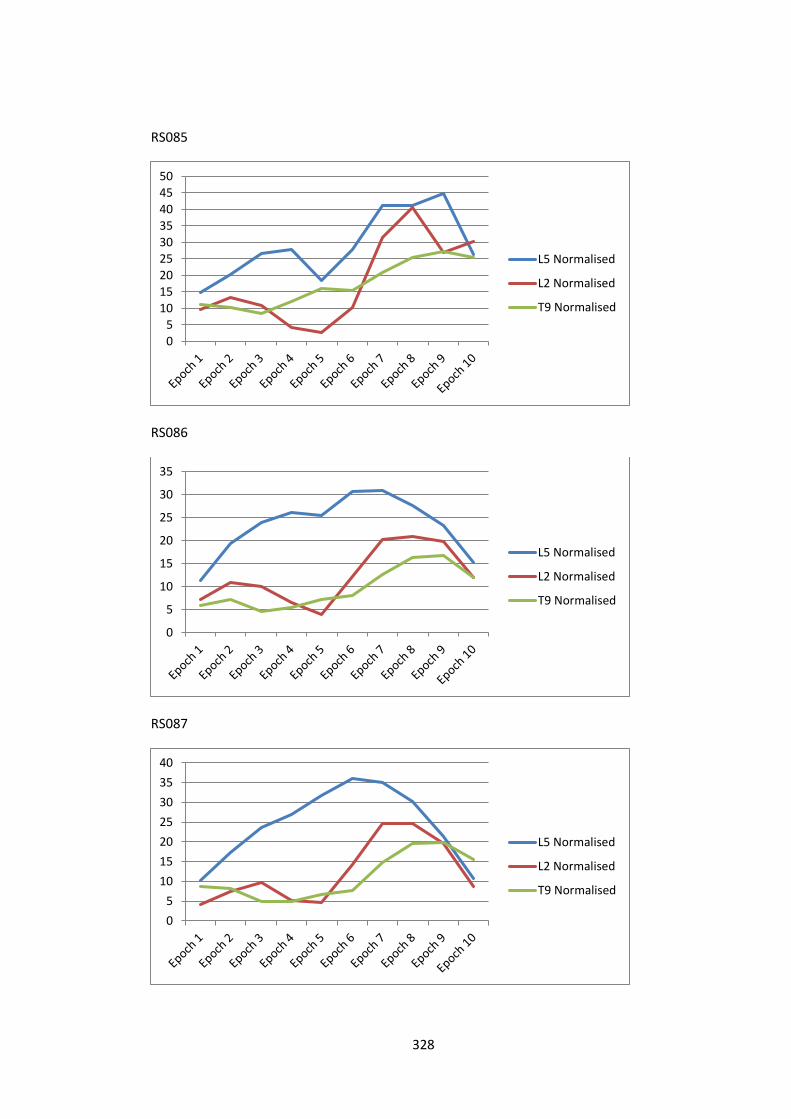
328
RS085
RS086
RS087
05
101520253035404550
L5 Normalised
L2 Normalised
T9 Normalised
0
5
10
15
20
25
30
35
L5 Normalised
L2 Normalised
T9 Normalised
0
5
10
15
20
25
30
35
40
L5 Normalised
L2 Normalised
T9 Normalised
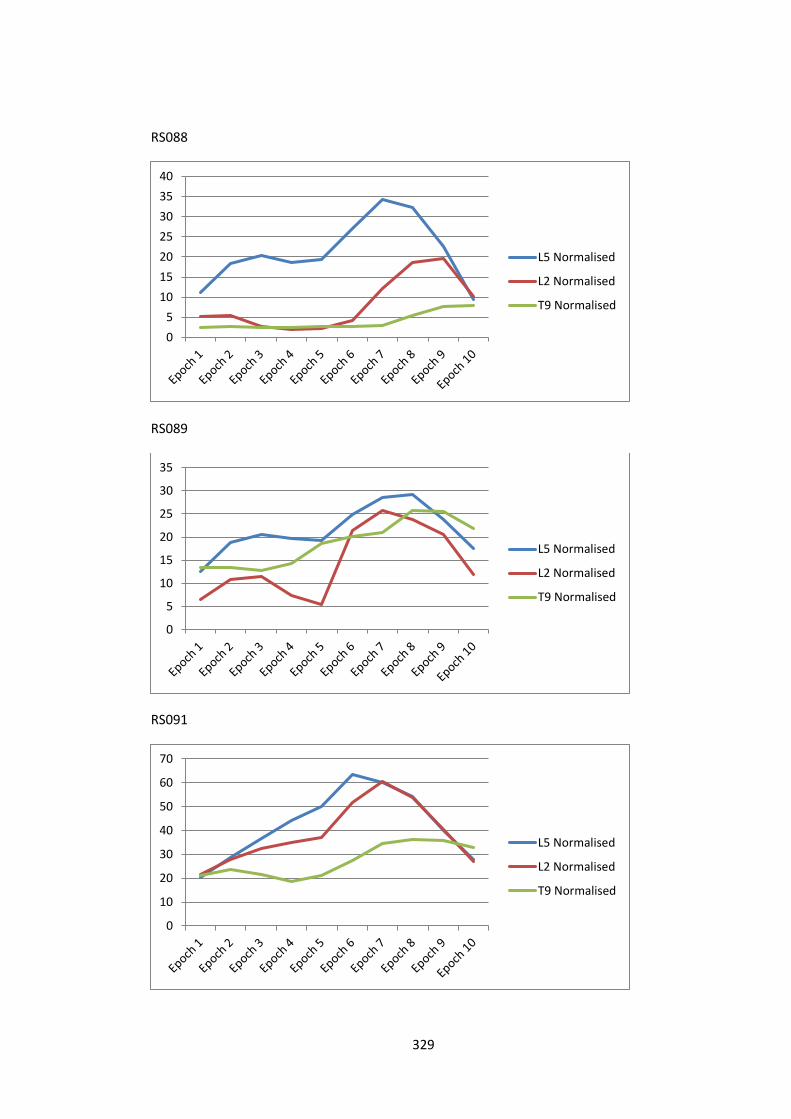
329
RS088
RS089
RS091
0
5
10
15
20
25
30
35
40
L5 Normalised
L2 Normalised
T9 Normalised
0
5
10
15
20
25
30
35
L5 Normalised
L2 Normalised
T9 Normalised
0
10
20
30
40
50
60
70
L5 Normalised
L2 Normalised
T9 Normalised

330
RS092
RS093
RS094
0
10
20
30
40
50
60
70
80
90
L5 Normalised
L2 Normalised
T9 Normalised
0
5
10
15
20
25
30
35
40
L5 Normalised
L2 Normalised
T9 Normalised
0
10
20
30
40
50
60
L5 Normalised
L2 Normalised
T9 Normalised
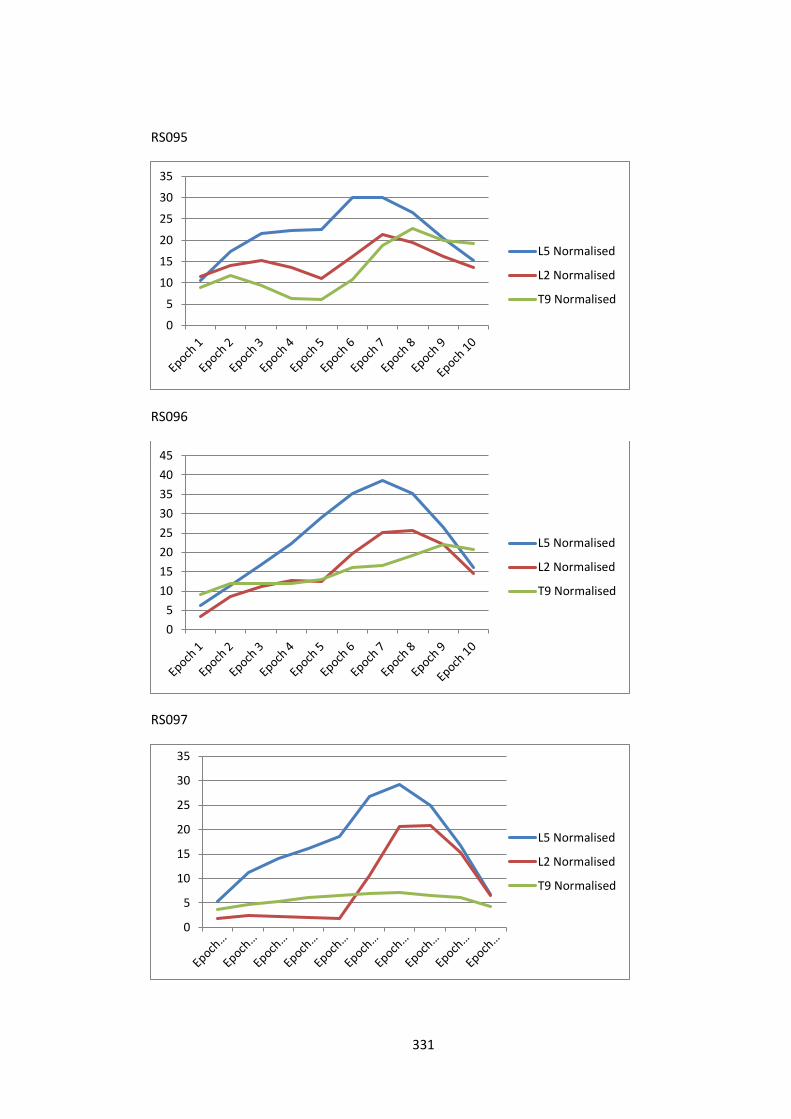
331
RS095
RS096
RS097
0
5
10
15
20
25
30
35
L5 Normalised
L2 Normalised
T9 Normalised
0
5
10
15
20
25
30
35
40
45
L5 Normalised
L2 Normalised
T9 Normalised
0
5
10
15
20
25
30
35
L5 Normalised
L2 Normalised
T9 Normalised
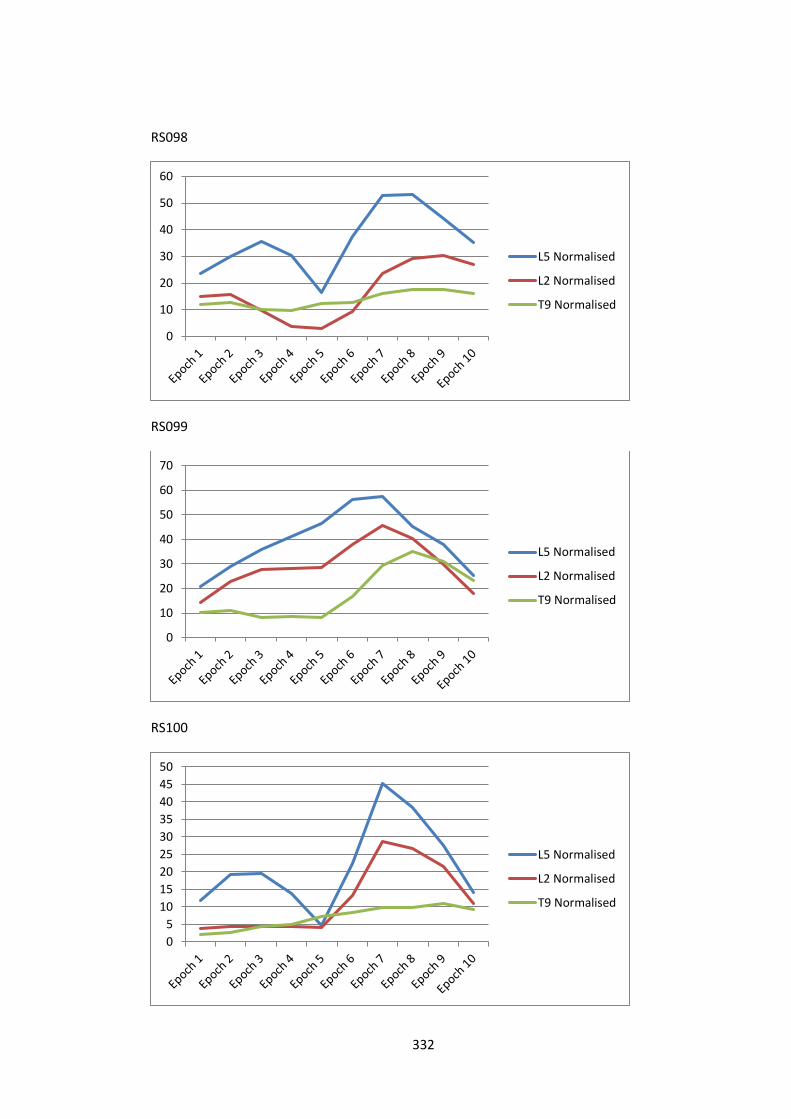
332
RS098
RS099
RS100
0
10
20
30
40
50
60
L5 Normalised
L2 Normalised
T9 Normalised
0
10
20
30
40
50
60
70
L5 Normalised
L2 Normalised
T9 Normalised
0
5
10
15
20
25
30
35
40
45
50
L5 Normalised
L2 Normalised
T9 Normalised
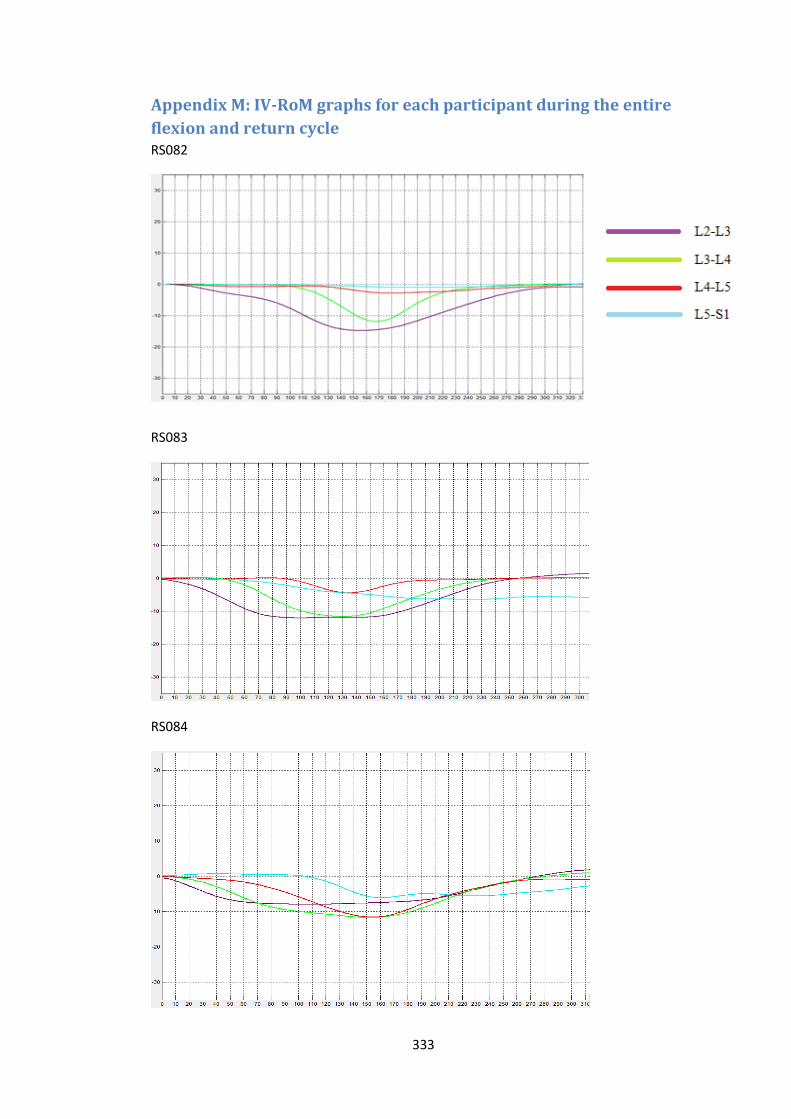
333
Appendix M: IV-RoM graphs for each participant during the entire
flexion and return cycle RS082
RS083
RS084
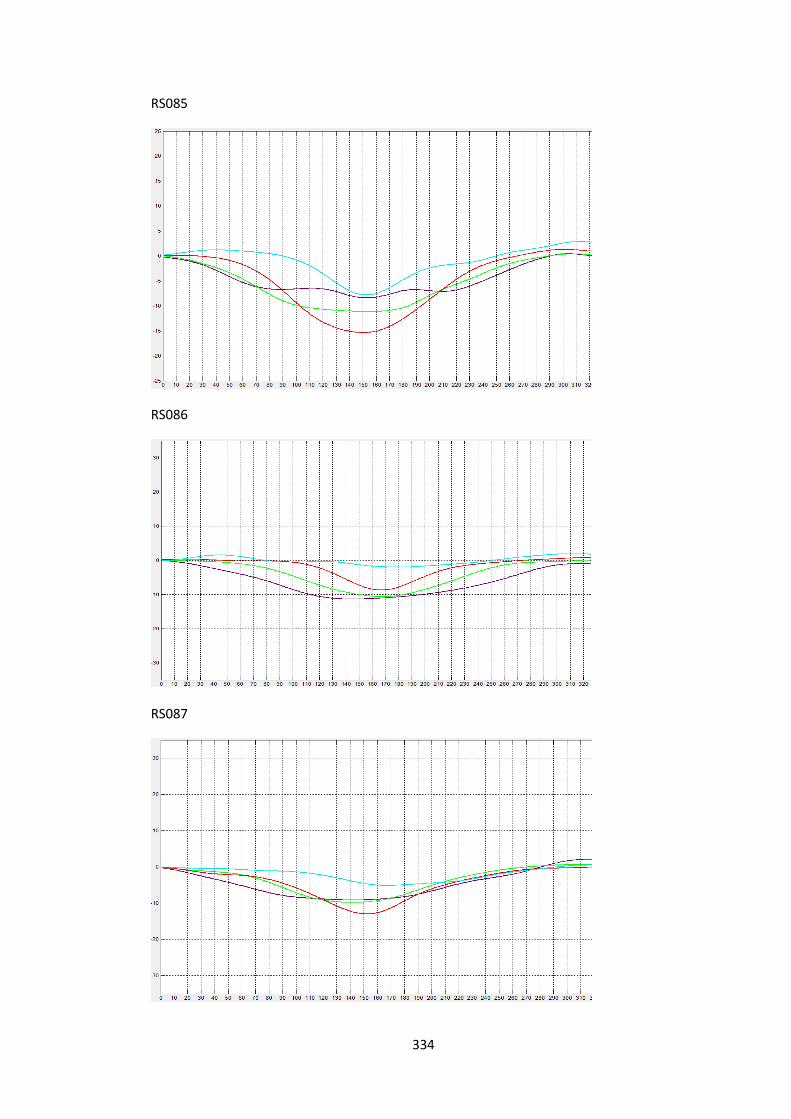
334
RS085
RS086
RS087
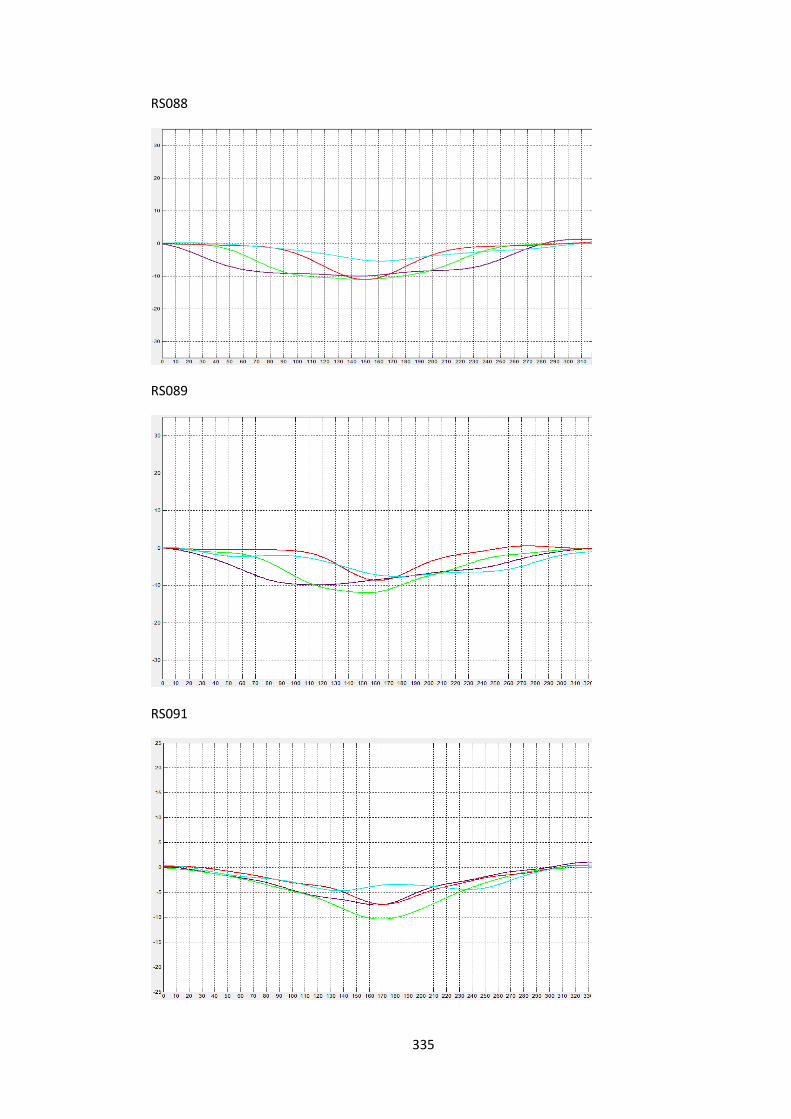
335
RS088
RS089
RS091
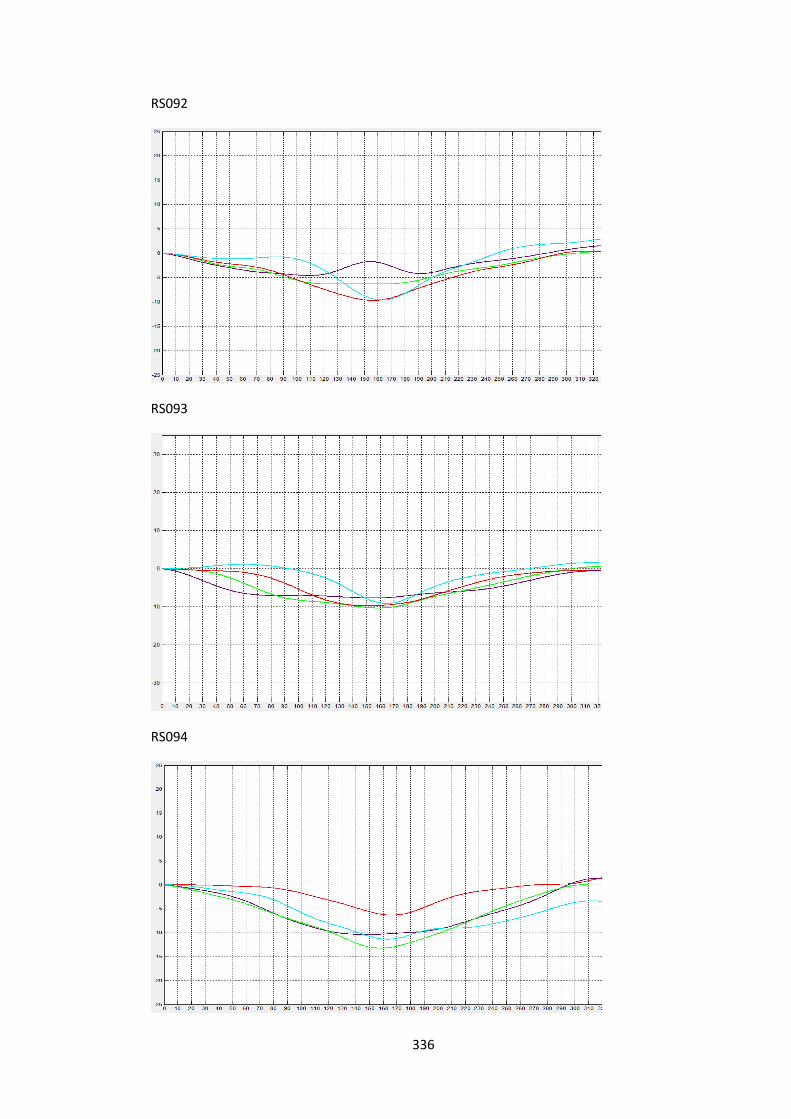
336
RS092
RS093
RS094
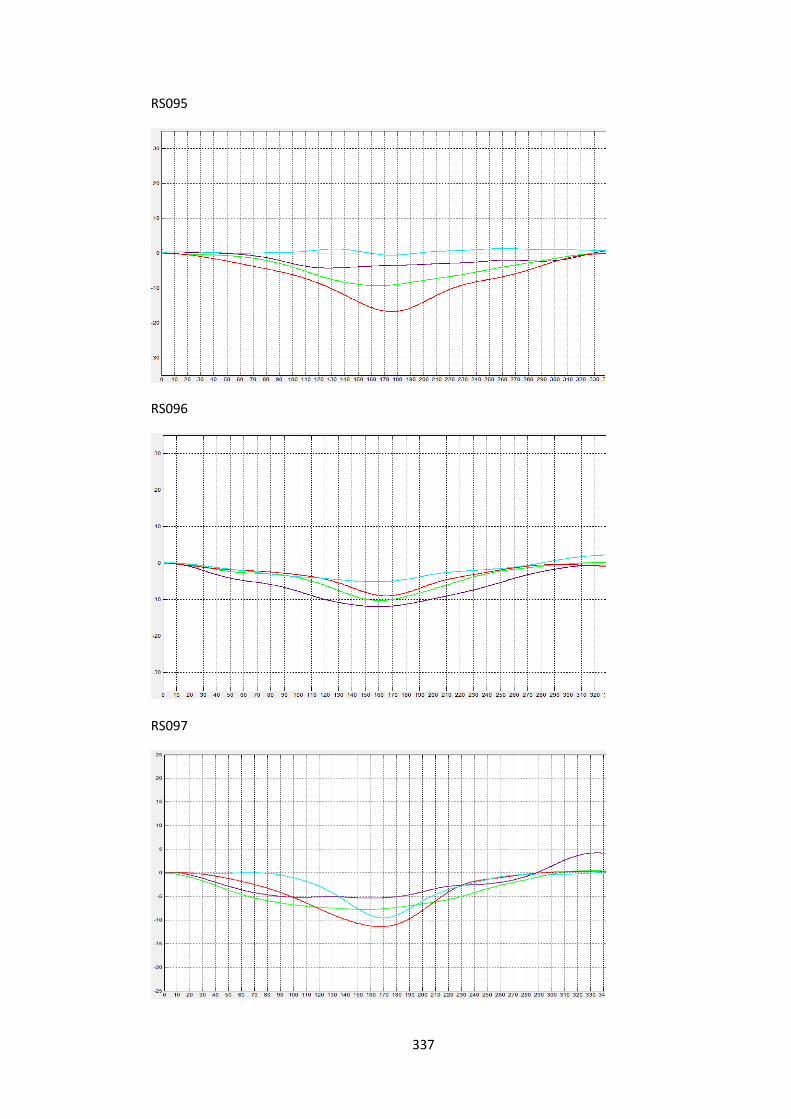
337
RS095
RS096
RS097
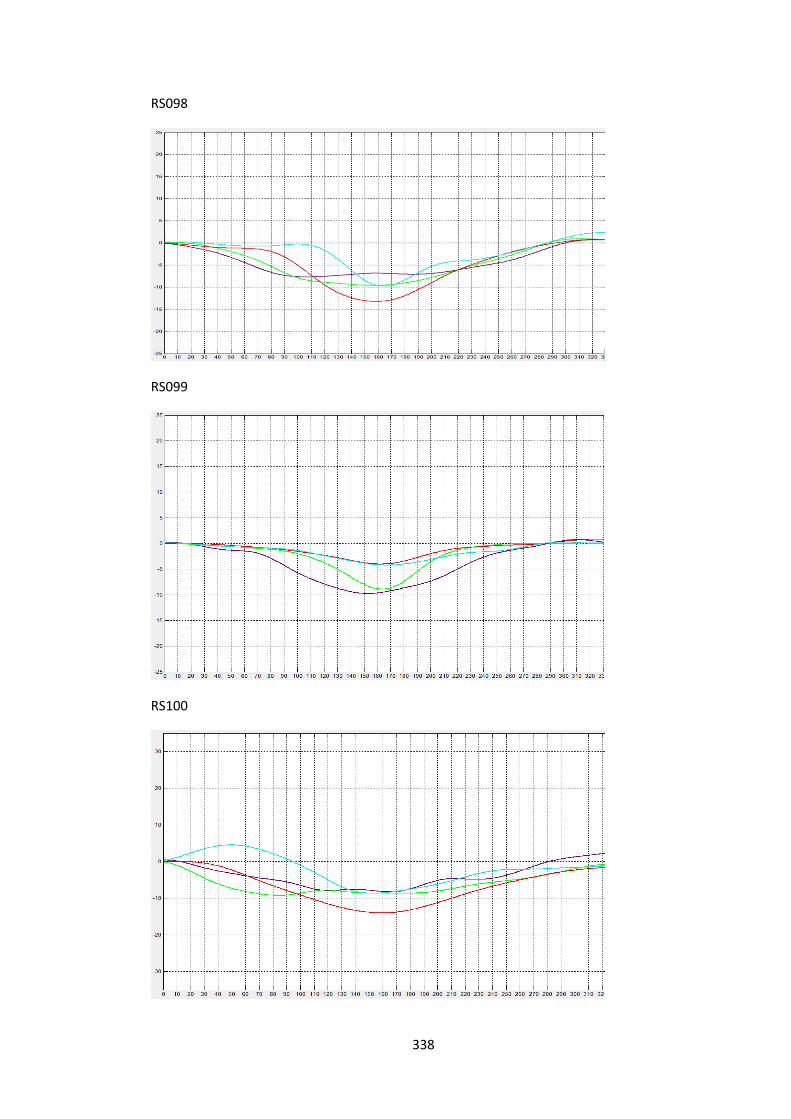
338
RS098
RS099
RS100
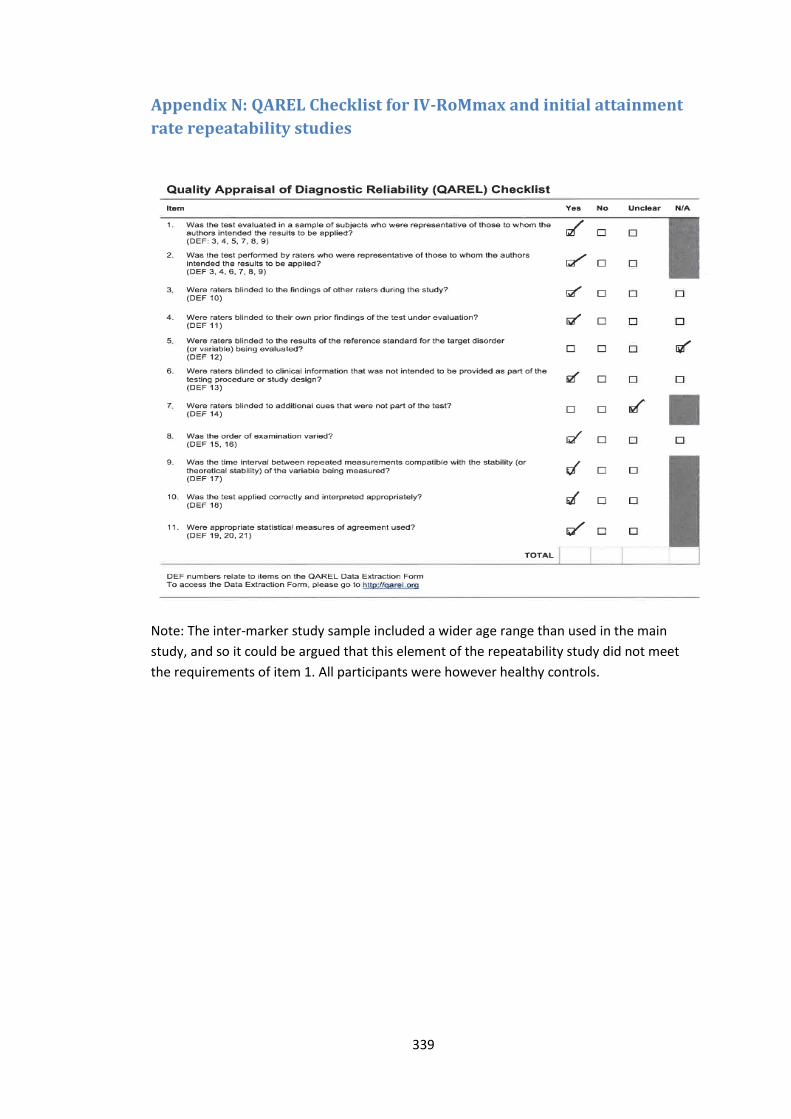
339
Appendix N: QAREL Checklist for IV-RoMmax and initial attainment
rate repeatability studies
Note: The inter-marker study sample included a wider age range than used in the main
study, and so it could be argued that this element of the repeatability study did not meet
the requirements of item 1. All participants were however healthy controls.

340
Appendix O: QAREL Checklist for RMS sEMG amplitude repeatability
study
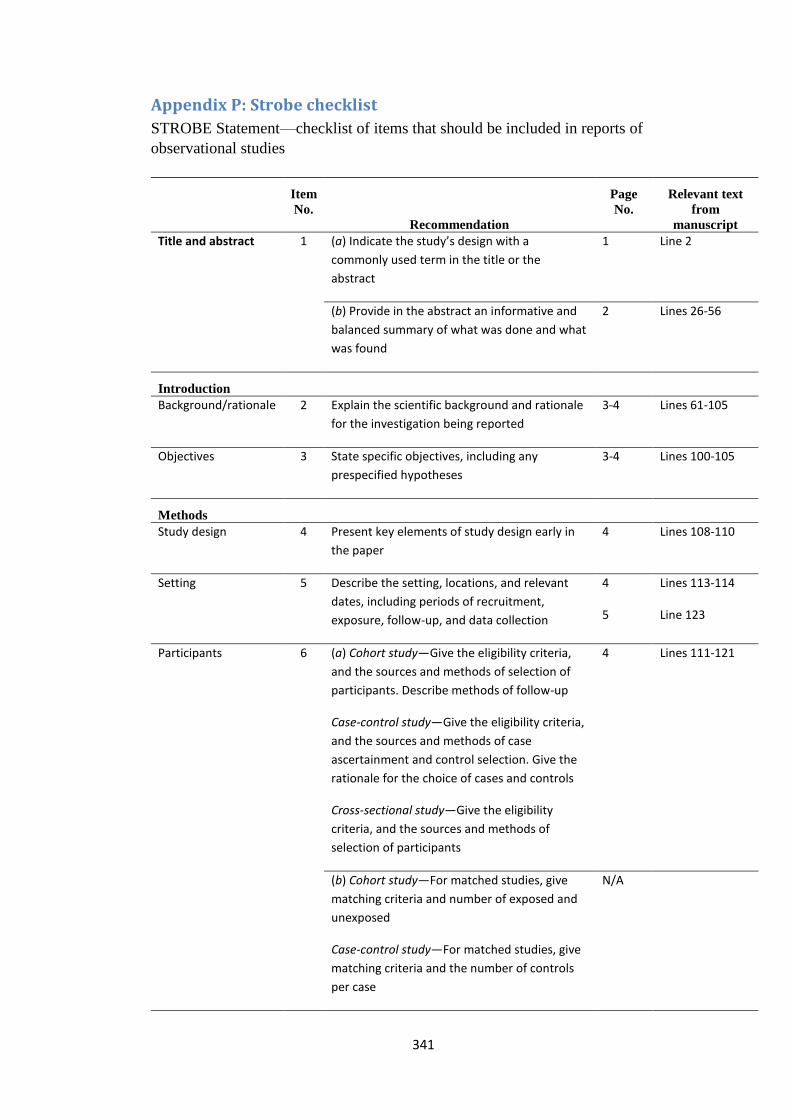
341
Appendix P: Strobe checklist
STROBE Statement—checklist of items that should be included in reports of
observational studies
Item
No.
Recommendation
Page
No.
Relevant text
from
manuscript
Title and abstract 1 (a) Indicate the study’s design with a
commonly used term in the title or the
abstract
1 Line 2
(b) Provide in the abstract an informative and
balanced summary of what was done and what
was found
2 Lines 26-56
Introduction
Background/rationale 2 Explain the scientific background and rationale
for the investigation being reported
3-4 Lines 61-105
Objectives 3 State specific objectives, including any
prespecified hypotheses
3-4 Lines 100-105
Methods
Study design 4 Present key elements of study design early in
the paper
4 Lines 108-110
Setting 5 Describe the setting, locations, and relevant
dates, including periods of recruitment,
exposure, follow-up, and data collection
4
5
Lines 113-114
Line 123
Participants 6 (a) Cohort study—Give the eligibility criteria,
and the sources and methods of selection of
participants. Describe methods of follow-up
Case-control study—Give the eligibility criteria,
and the sources and methods of case
ascertainment and control selection. Give the
rationale for the choice of cases and controls
Cross-sectional study—Give the eligibility
criteria, and the sources and methods of
selection of participants
4 Lines 111-121
(b) Cohort study—For matched studies, give
matching criteria and number of exposed and
unexposed
Case-control study—For matched studies, give
matching criteria and the number of controls
per case
N/A
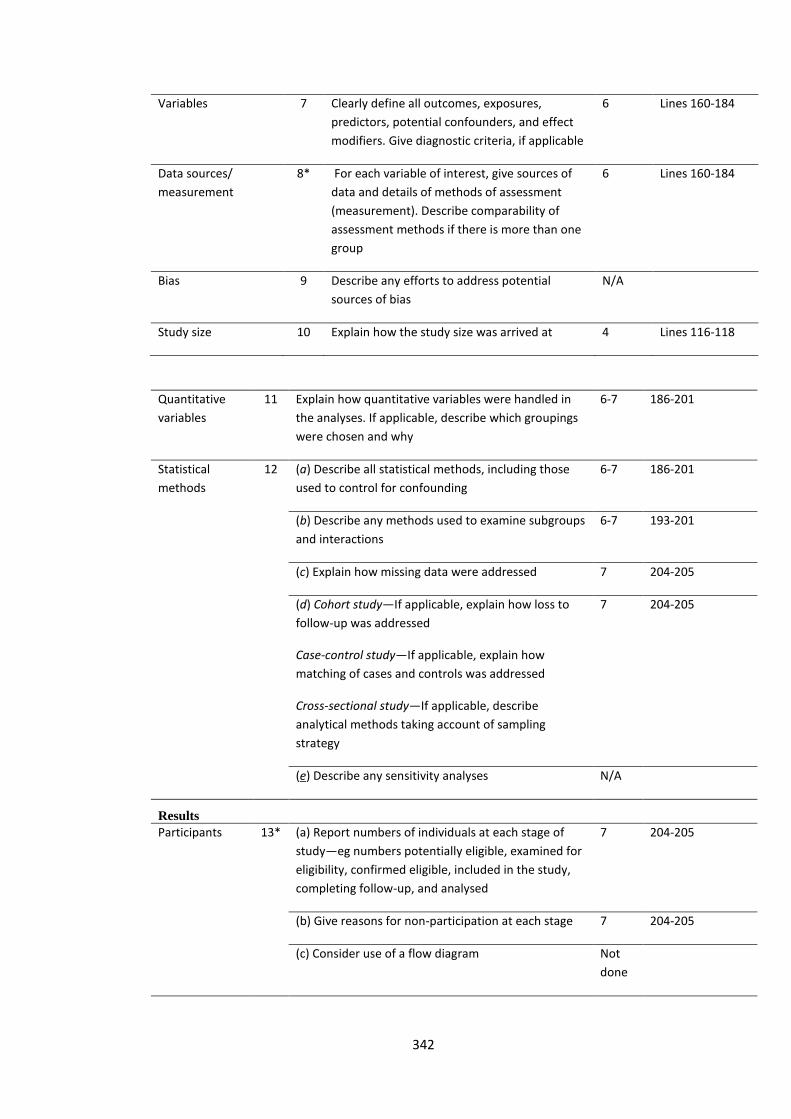
342
Variables 7 Clearly define all outcomes, exposures,
predictors, potential confounders, and effect
modifiers. Give diagnostic criteria, if applicable
6 Lines 160-184
Data sources/
measurement
8* For each variable of interest, give sources of
data and details of methods of assessment
(measurement). Describe comparability of
assessment methods if there is more than one
group
6 Lines 160-184
Bias 9 Describe any efforts to address potential
sources of bias
N/A
Study size 10 Explain how the study size was arrived at 4 Lines 116-118
Quantitative
variables
11 Explain how quantitative variables were handled in
the analyses. If applicable, describe which groupings
were chosen and why
6-7 186-201
Statistical
methods
12 (a) Describe all statistical methods, including those
used to control for confounding
6-7 186-201
(b) Describe any methods used to examine subgroups
and interactions
6-7 193-201
(c) Explain how missing data were addressed 7 204-205
(d) Cohort study—If applicable, explain how loss to
follow-up was addressed
Case-control study—If applicable, explain how
matching of cases and controls was addressed
Cross-sectional study—If applicable, describe
analytical methods taking account of sampling
strategy
7 204-205
(e) Describe any sensitivity analyses N/A
Results
Participants 13* (a) Report numbers of individuals at each stage of
study—eg numbers potentially eligible, examined for
eligibility, confirmed eligible, included in the study,
completing follow-up, and analysed
7 204-205
(b) Give reasons for non-participation at each stage 7 204-205
(c) Consider use of a flow diagram Not
done
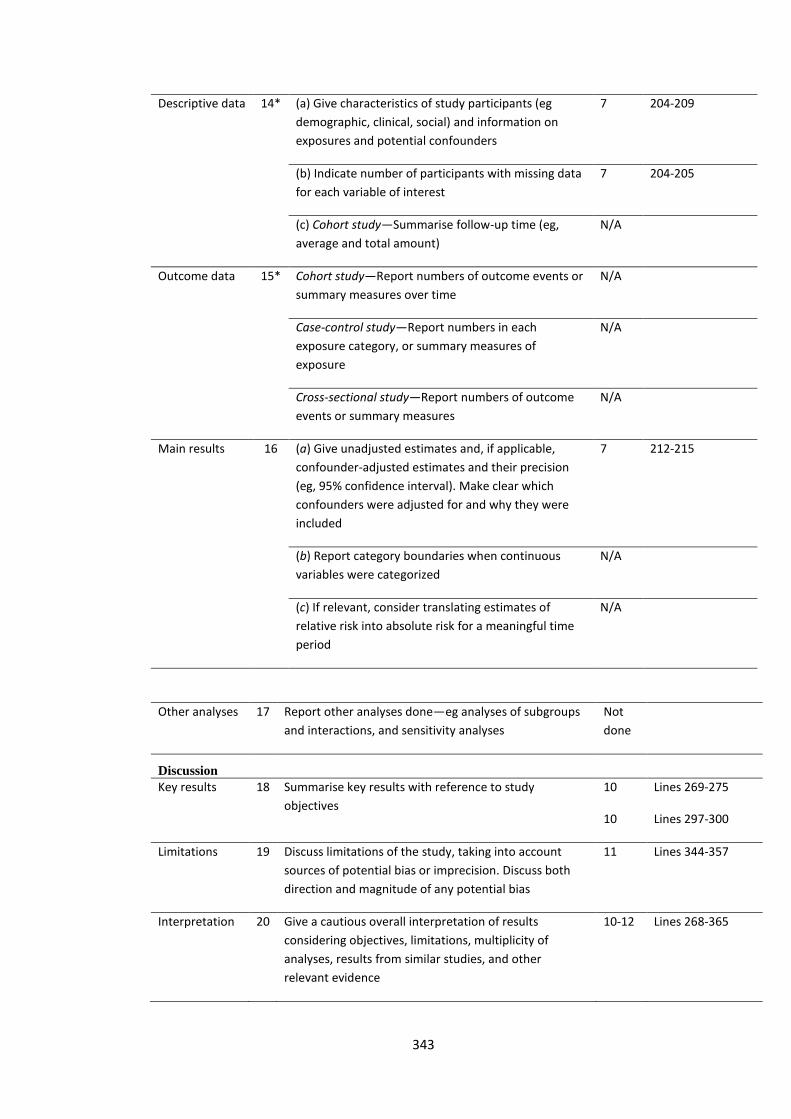
343
Descriptive data 14* (a) Give characteristics of study participants (eg
demographic, clinical, social) and information on
exposures and potential confounders
7 204-209
(b) Indicate number of participants with missing data
for each variable of interest
7 204-205
(c) Cohort study—Summarise follow-up time (eg,
average and total amount)
N/A
Outcome data 15* Cohort study—Report numbers of outcome events or
summary measures over time
N/A
Case-control study—Report numbers in each
exposure category, or summary measures of
exposure
N/A
Cross-sectional study—Report numbers of outcome
events or summary measures
N/A
Main results 16 (a) Give unadjusted estimates and, if applicable,
confounder-adjusted estimates and their precision
(eg, 95% confidence interval). Make clear which
confounders were adjusted for and why they were
included
7 212-215
(b) Report category boundaries when continuous
variables were categorized
N/A
(c) If relevant, consider translating estimates of
relative risk into absolute risk for a meaningful time
period
N/A
Other analyses 17 Report other analyses done—eg analyses of subgroups
and interactions, and sensitivity analyses
Not
done
Discussion
Key results 18 Summarise key results with reference to study
objectives
10
10
Lines 269-275
Lines 297-300
Limitations 19 Discuss limitations of the study, taking into account
sources of potential bias or imprecision. Discuss both
direction and magnitude of any potential bias
11 Lines 344-357
Interpretation 20 Give a cautious overall interpretation of results
considering objectives, limitations, multiplicity of
analyses, results from similar studies, and other
relevant evidence
10-12 Lines 268-365

344
Generalisability 21 Discuss the generalisability (external validity) of the
study results
11 Lines 345-348
Other information
Funding 22 Give the source of funding and the role of the funders
for the present study and, if applicable, for the original
study on which the present article is based
13 Lines 393-394
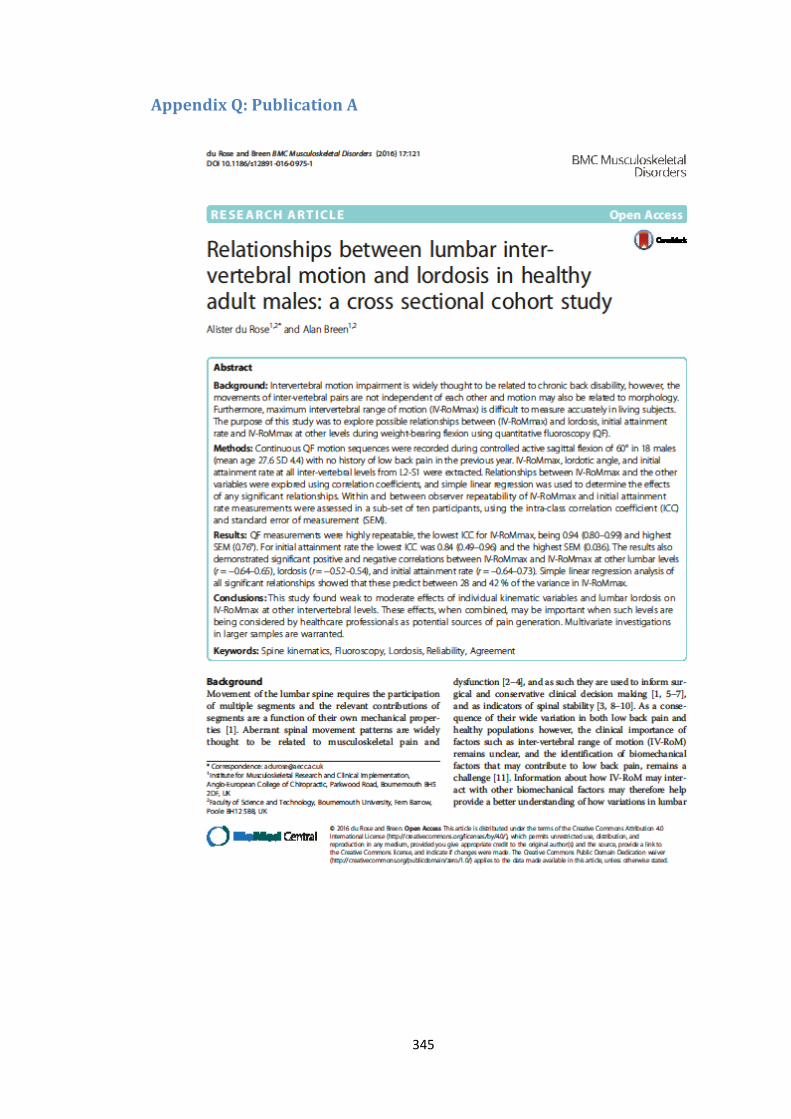
345
Appendix Q: Publication A
346
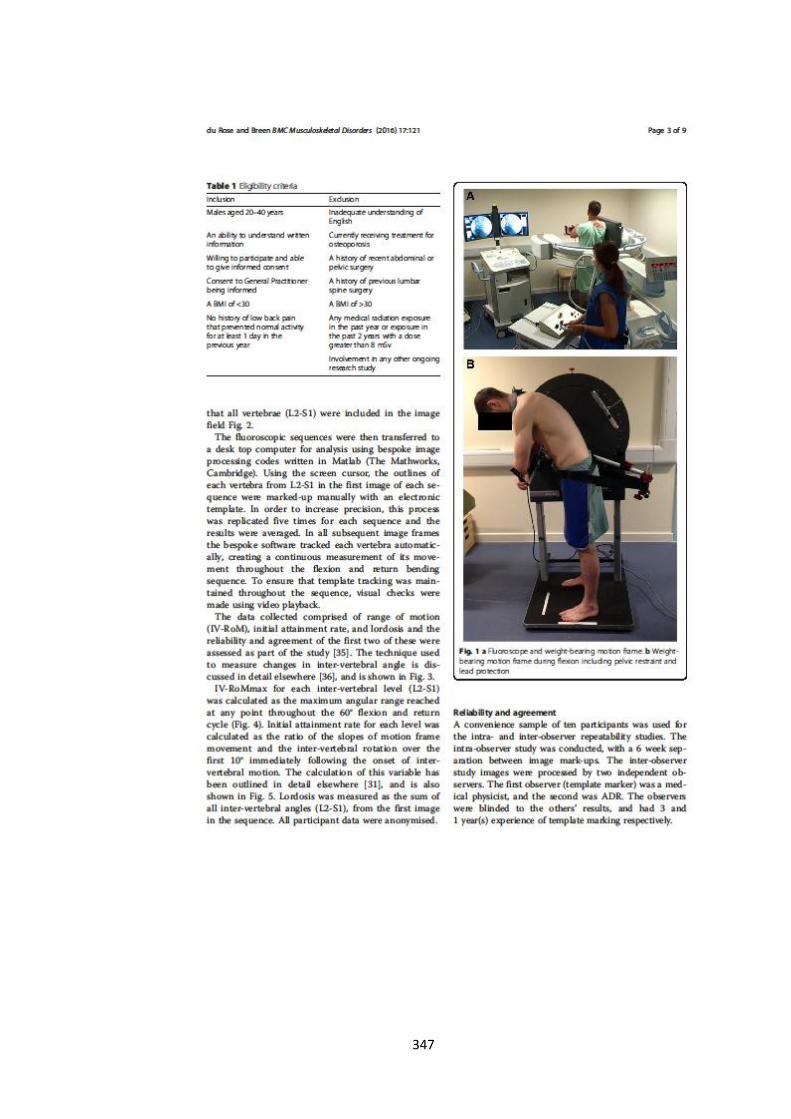
347
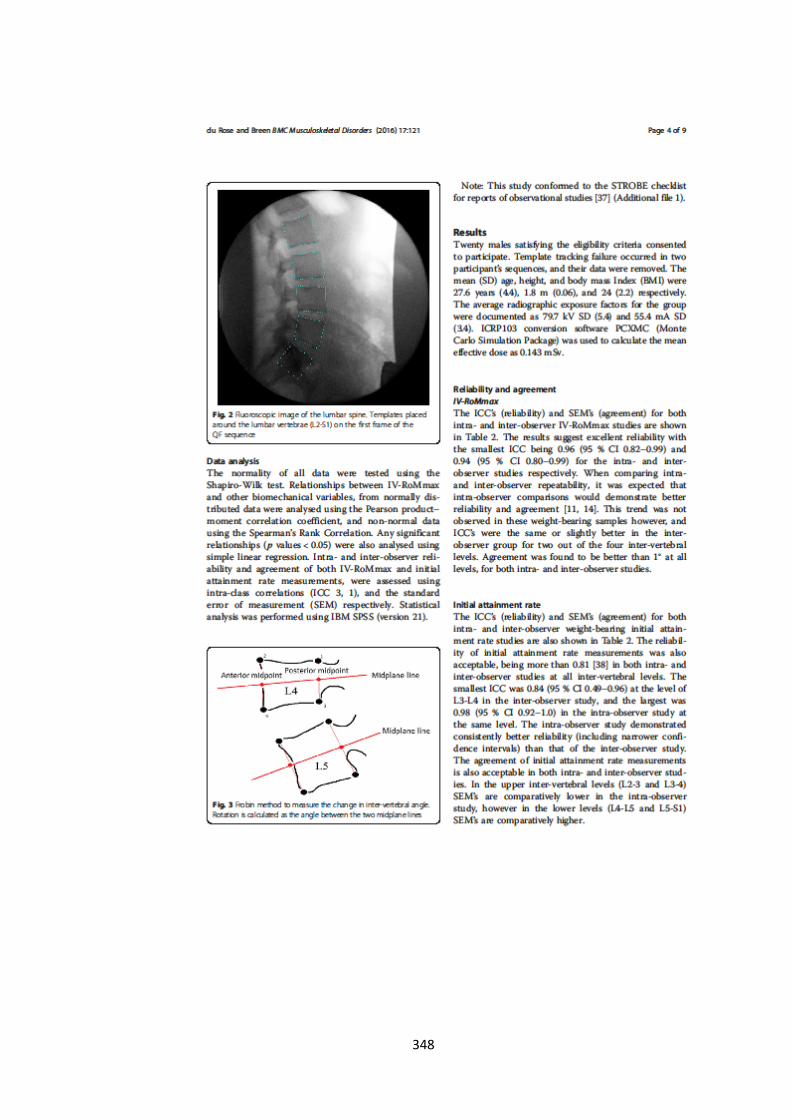
348
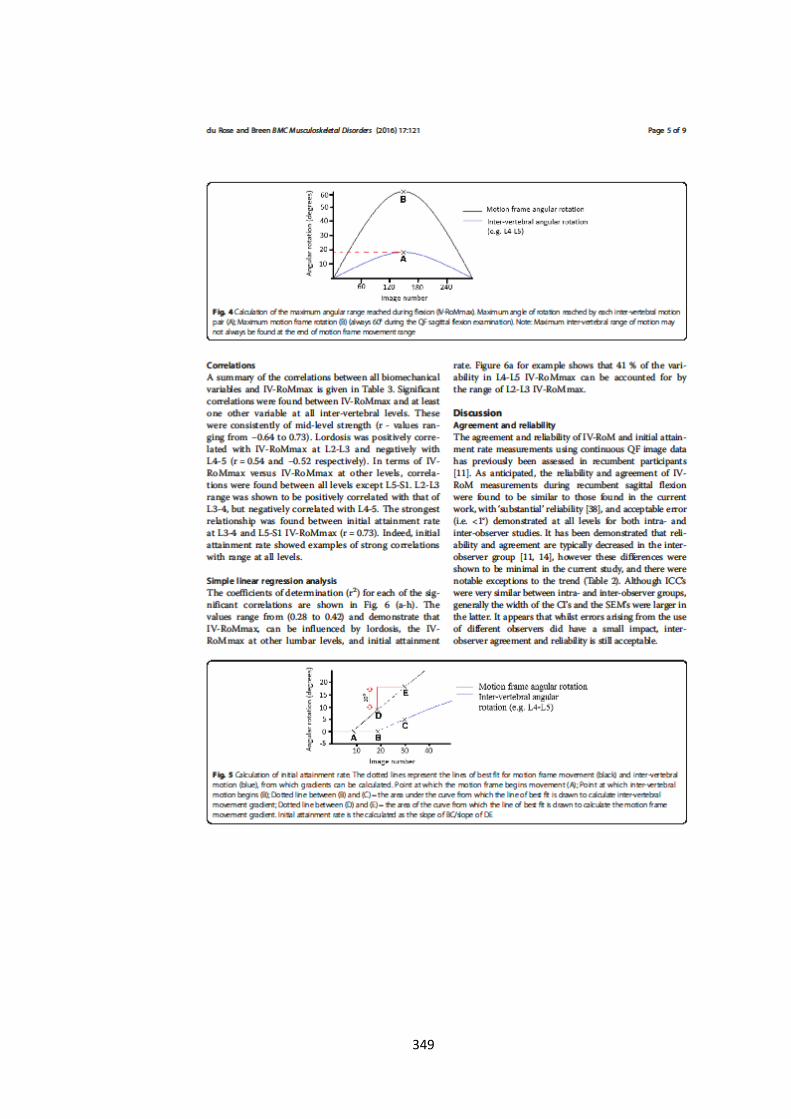
349
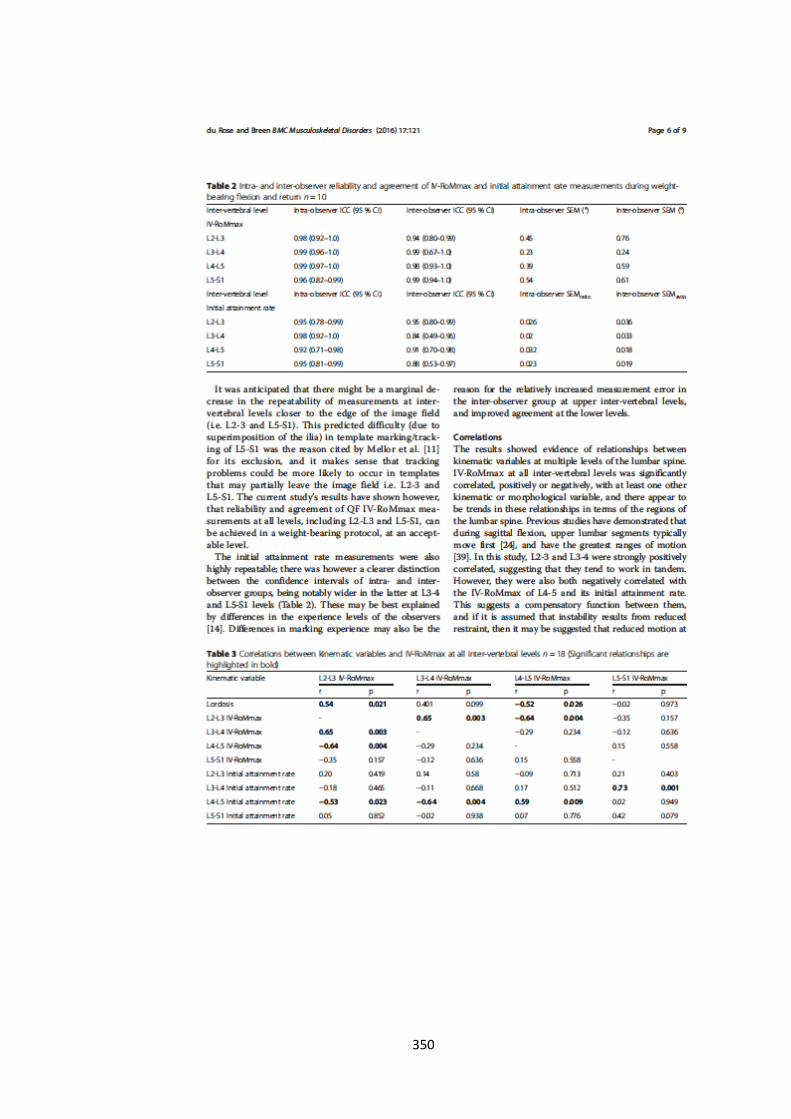
350
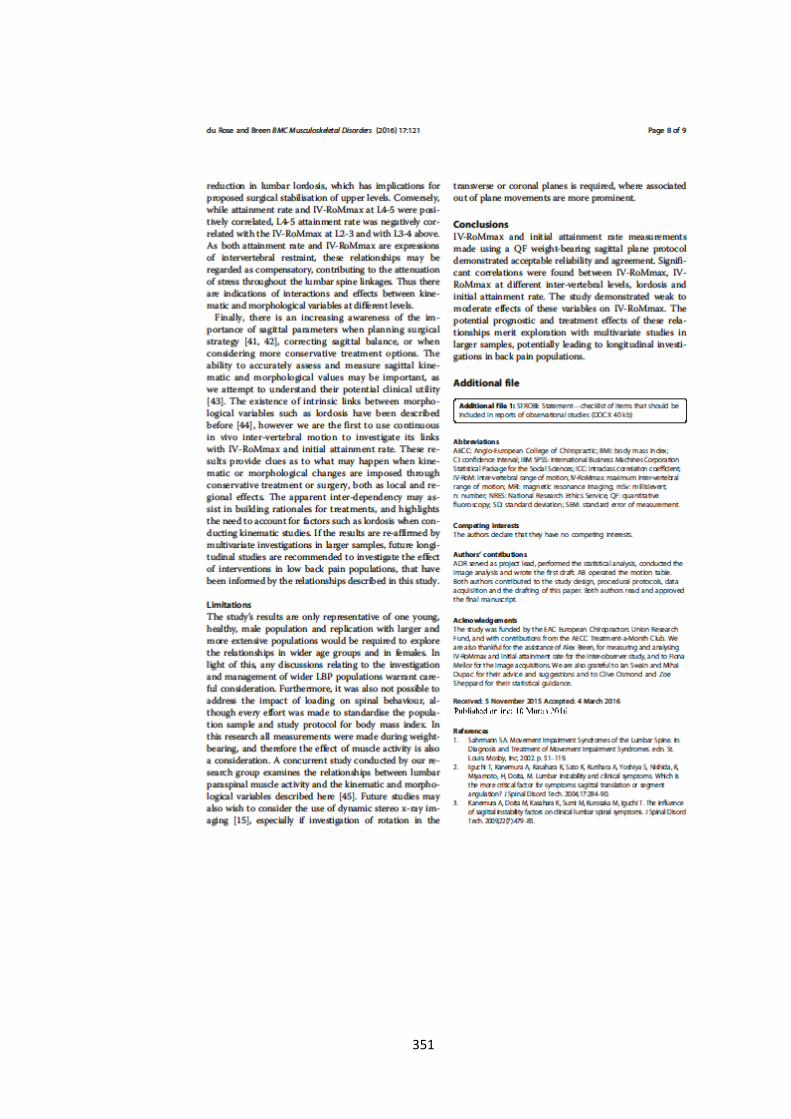
351
352

353
Appendix R: Publication B
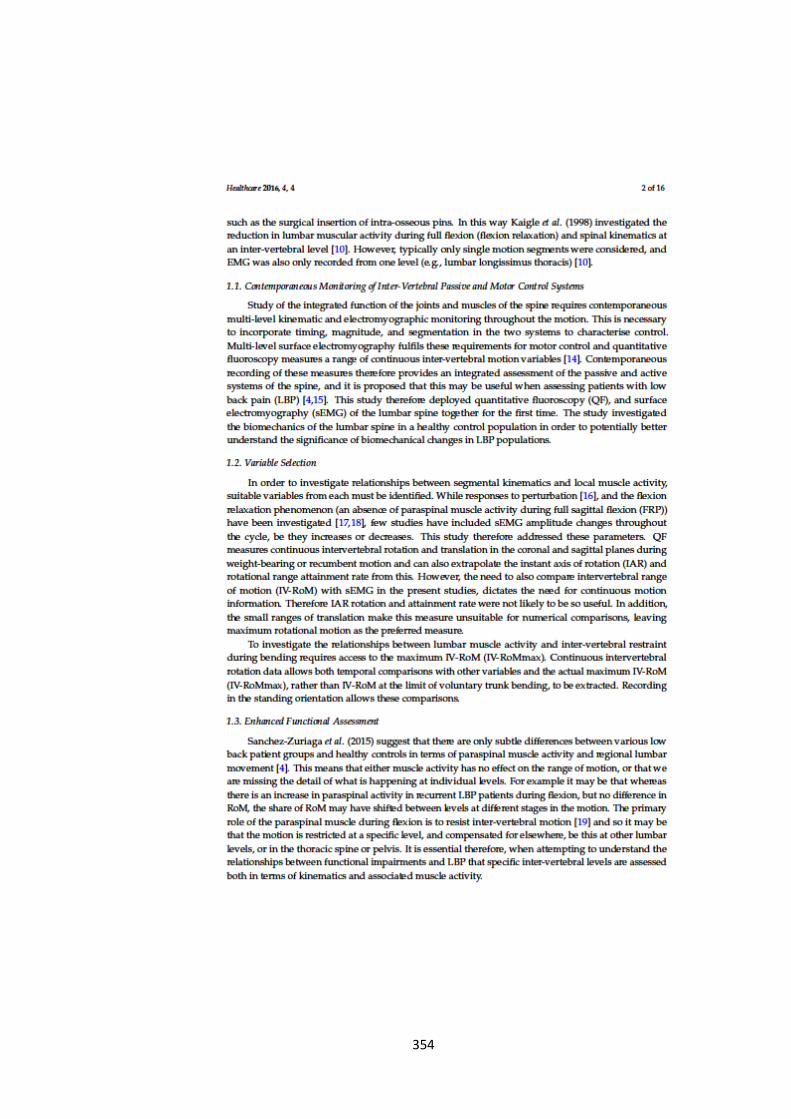
354
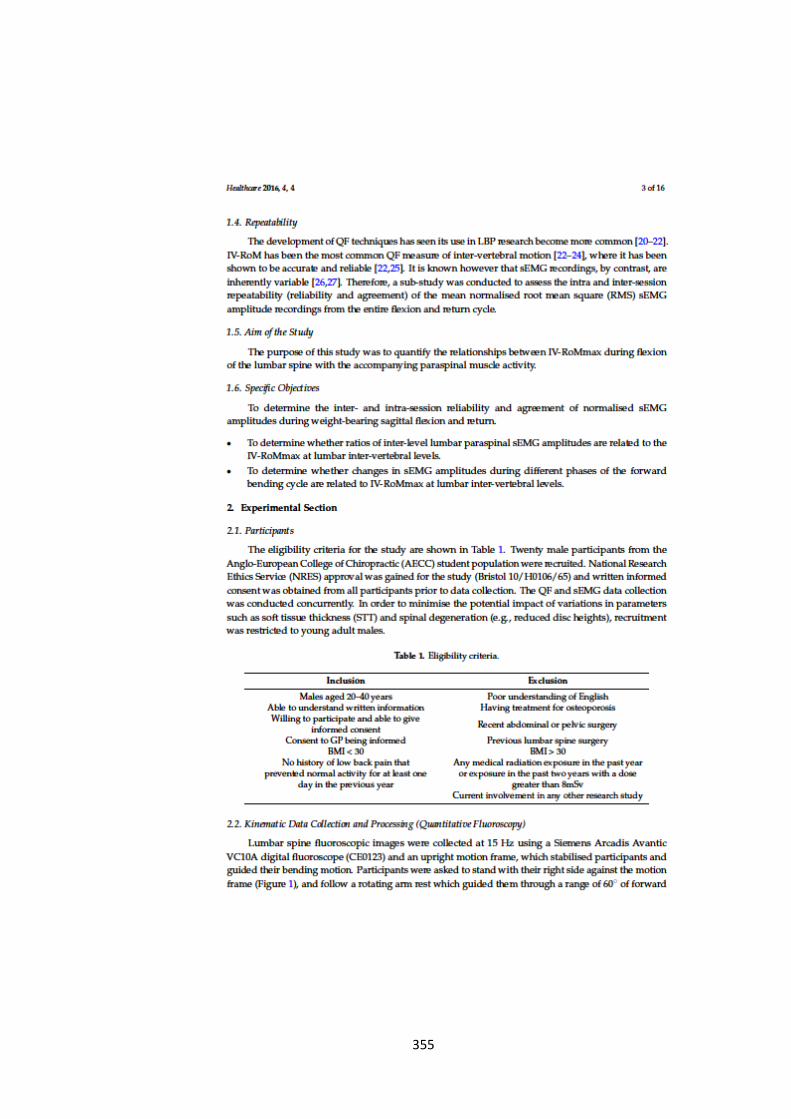
355
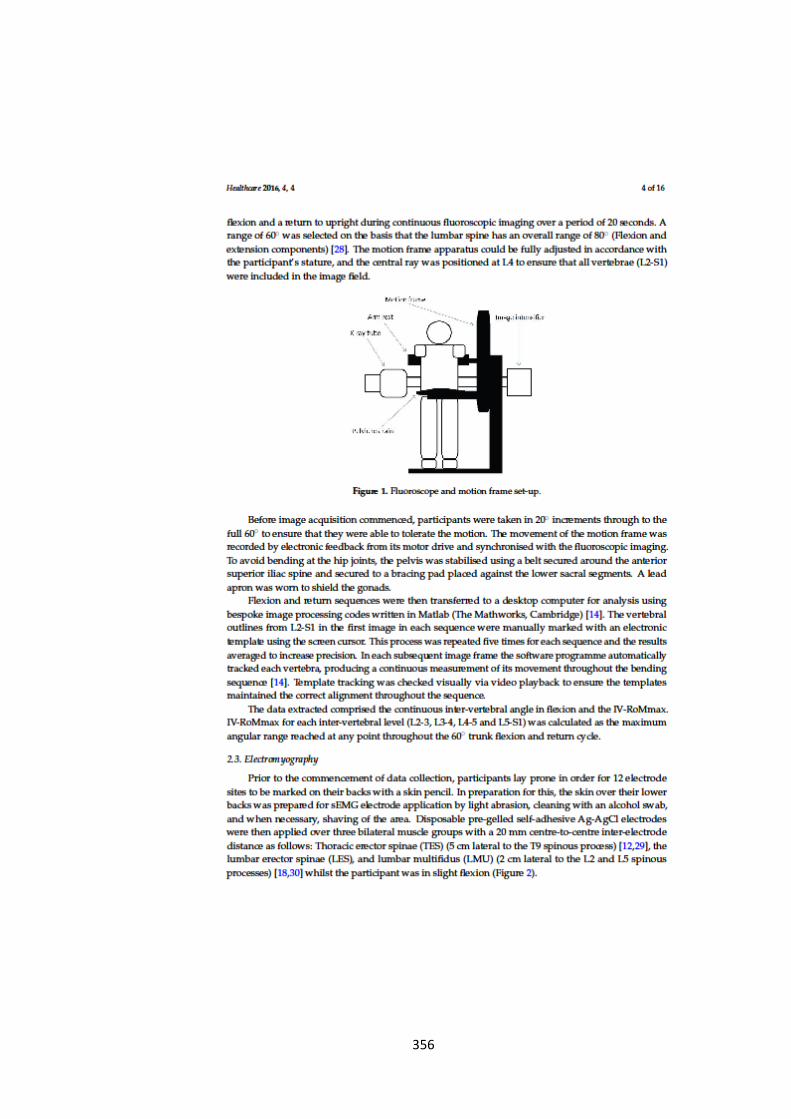
356
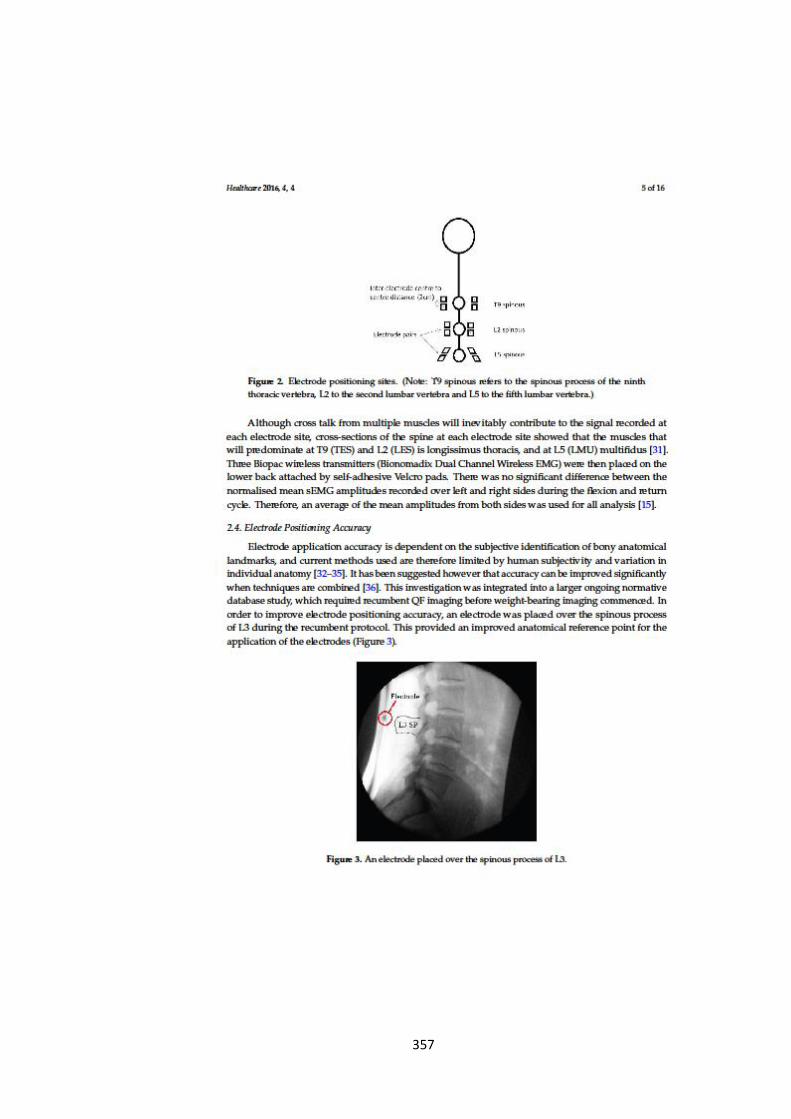
357
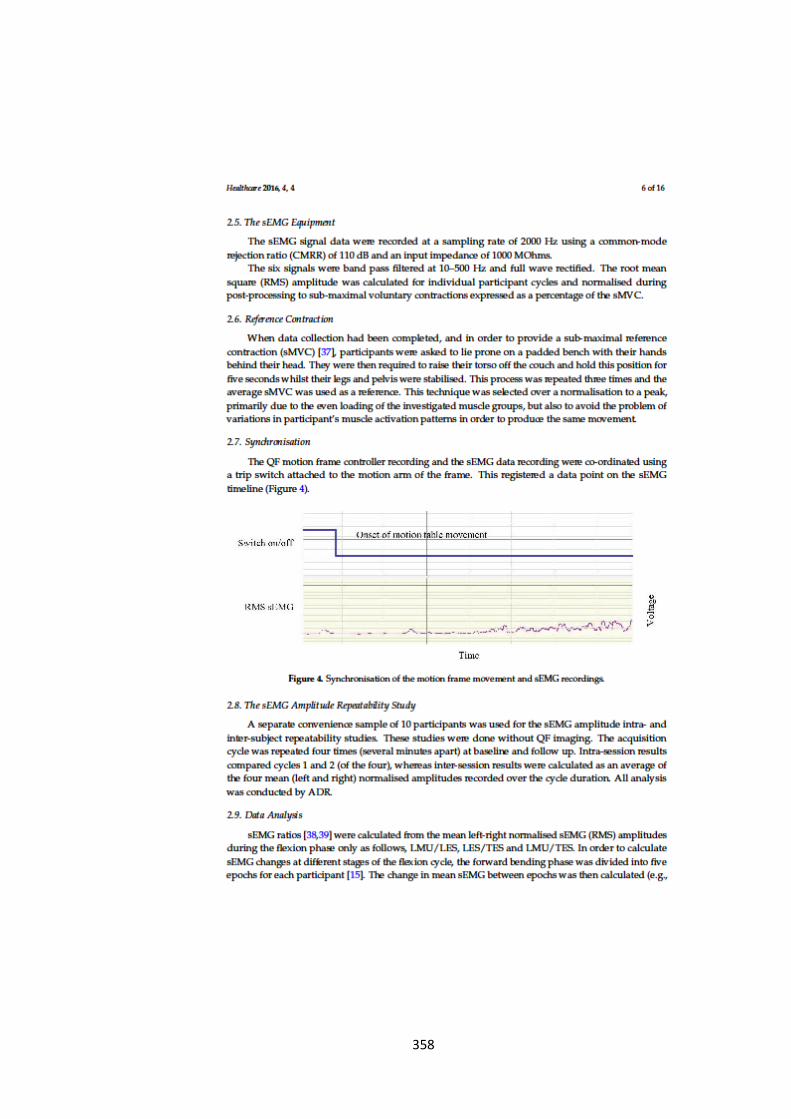
358

359

360
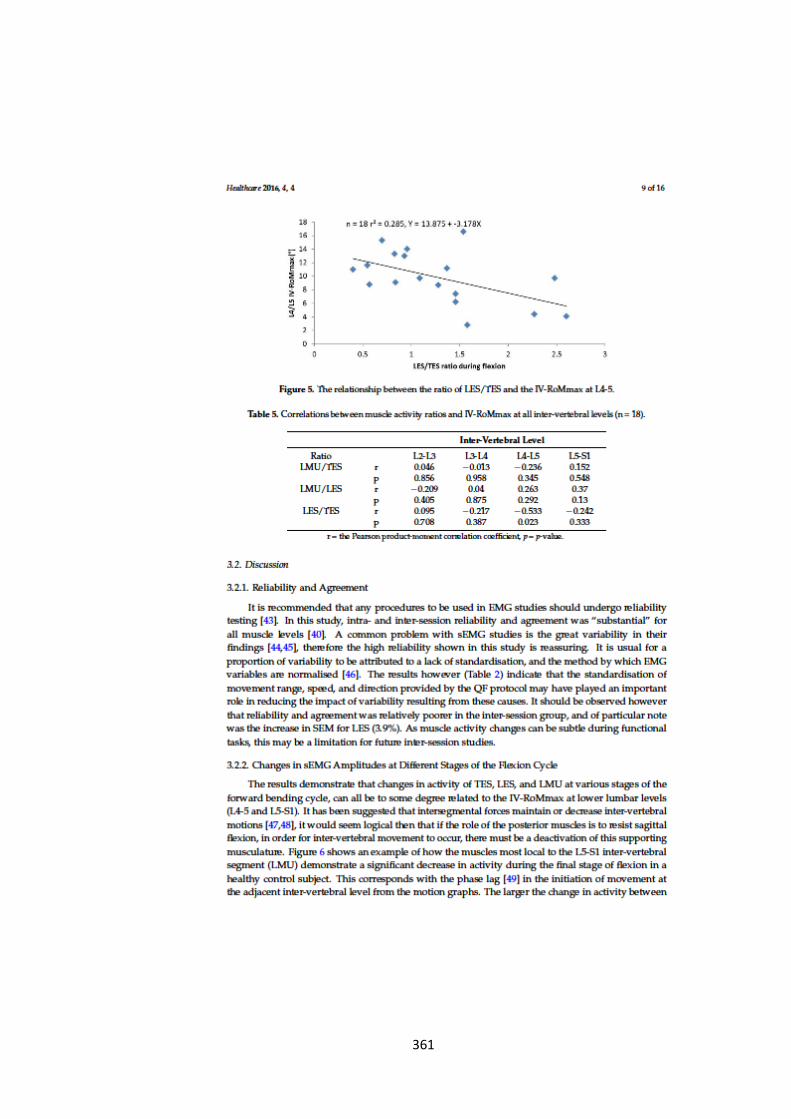
361
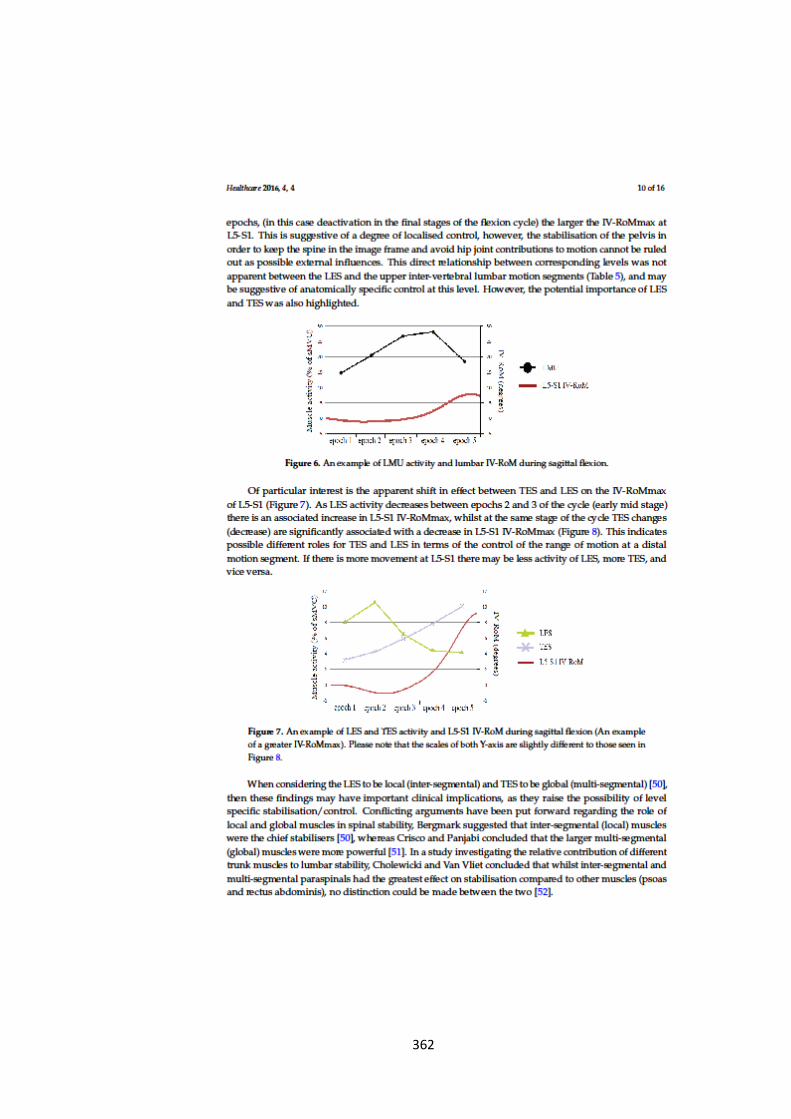
362
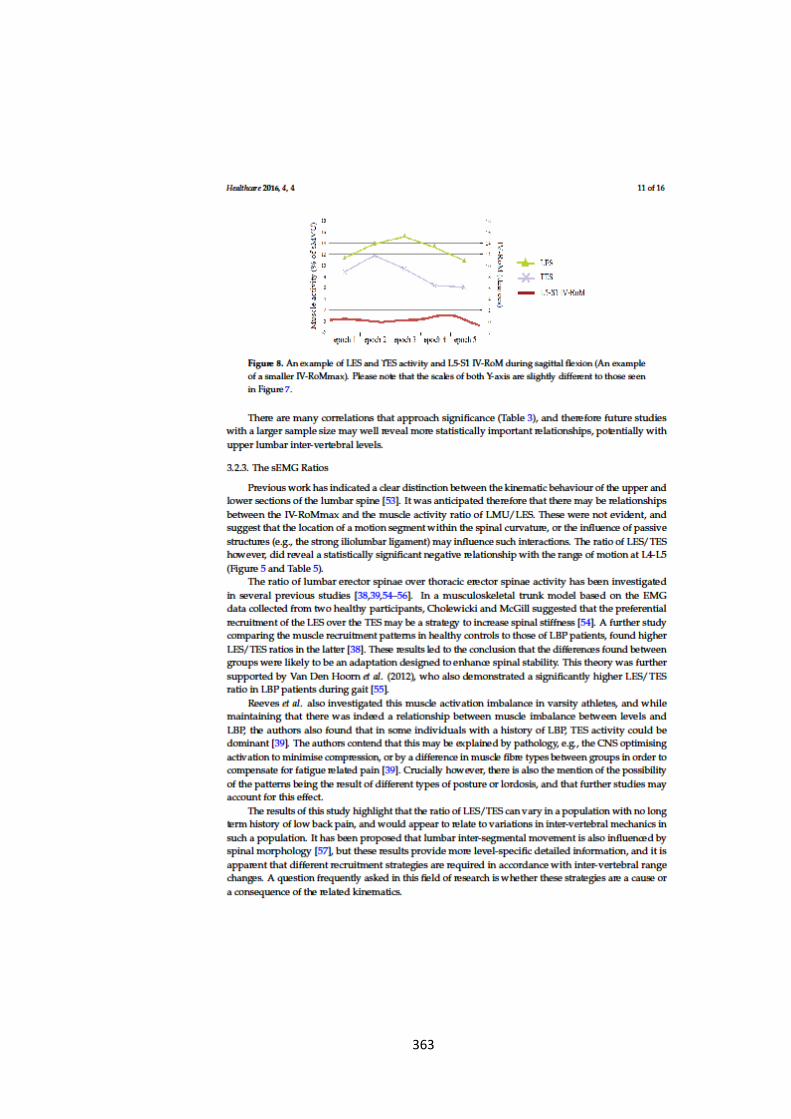
363
364
365
366
367
368
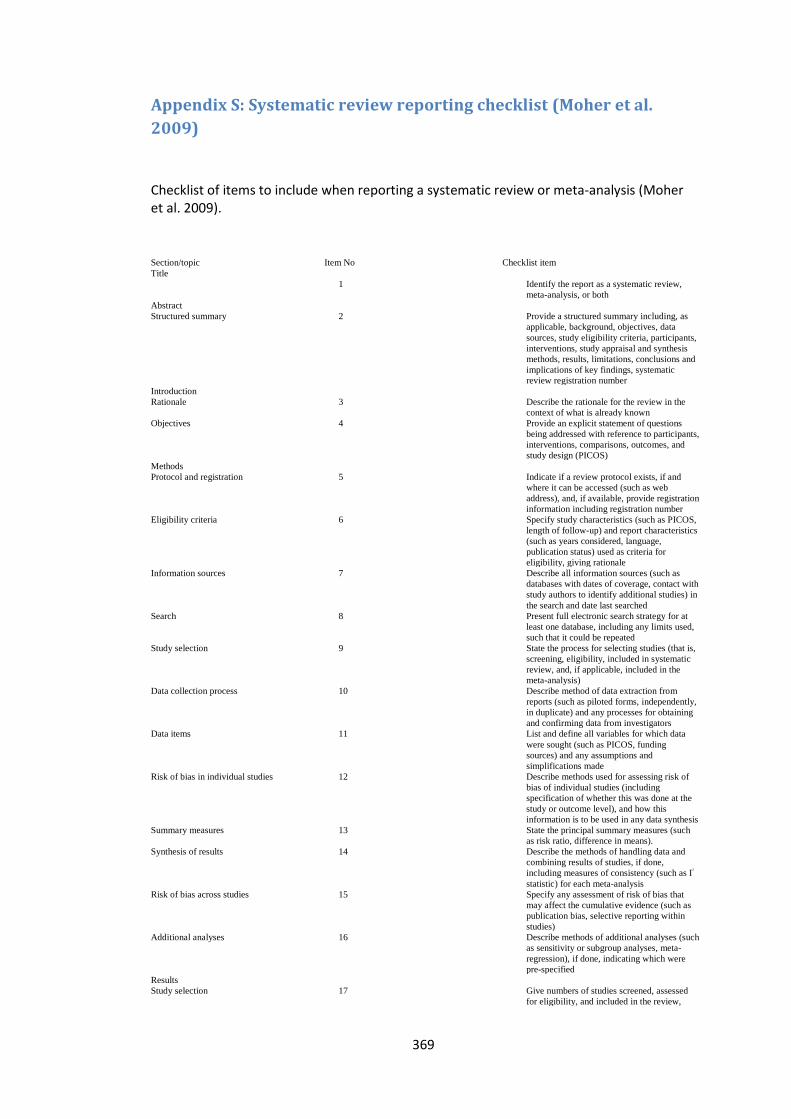
369
Appendix S: Systematic review reporting checklist (Moher et al.
2009)
Checklist of items to include when reporting a systematic review or meta-analysis (Moher et al. 2009).
Section/topic Item No Checklist item
Title
1 Identify the report as a systematic review,
meta-analysis, or both
Abstract
Structured summary 2 Provide a structured summary including, as
applicable, background, objectives, data
sources, study eligibility criteria, participants,
interventions, study appraisal and synthesis
methods, results, limitations, conclusions and
implications of key findings, systematic
review registration number
Introduction
Rationale 3 Describe the rationale for the review in the
context of what is already known
Objectives 4 Provide an explicit statement of questions
being addressed with reference to participants,
interventions, comparisons, outcomes, and
study design (PICOS)
Methods
Protocol and registration 5 Indicate if a review protocol exists, if and
where it can be accessed (such as web
address), and, if available, provide registration
information including registration number
Eligibility criteria 6 Specify study characteristics (such as PICOS,
length of follow-up) and report characteristics
(such as years considered, language,
publication status) used as criteria for
eligibility, giving rationale
Information sources 7 Describe all information sources (such as
databases with dates of coverage, contact with
study authors to identify additional studies) in
the search and date last searched
Search 8 Present full electronic search strategy for at
least one database, including any limits used,
such that it could be repeated
Study selection 9 State the process for selecting studies (that is,
screening, eligibility, included in systematic
review, and, if applicable, included in the
meta-analysis)
Data collection process 10 Describe method of data extraction from
reports (such as piloted forms, independently,
in duplicate) and any processes for obtaining
and confirming data from investigators
Data items 11 List and define all variables for which data
were sought (such as PICOS, funding
sources) and any assumptions and
simplifications made
Risk of bias in individual studies 12 Describe methods used for assessing risk of
bias of individual studies (including
specification of whether this was done at the
study or outcome level), and how this
information is to be used in any data synthesis
Summary measures 13 State the principal summary measures (such
as risk ratio, difference in means).
Synthesis of results 14 Describe the methods of handling data and
combining results of studies, if done,
including measures of consistency (such as I2
statistic) for each meta-analysis
Risk of bias across studies 15 Specify any assessment of risk of bias that
may affect the cumulative evidence (such as
publication bias, selective reporting within
studies)
Additional analyses 16 Describe methods of additional analyses (such
as sensitivity or subgroup analyses, meta-
regression), if done, indicating which were
pre-specified
Results
Study selection 17 Give numbers of studies screened, assessed
for eligibility, and included in the review,
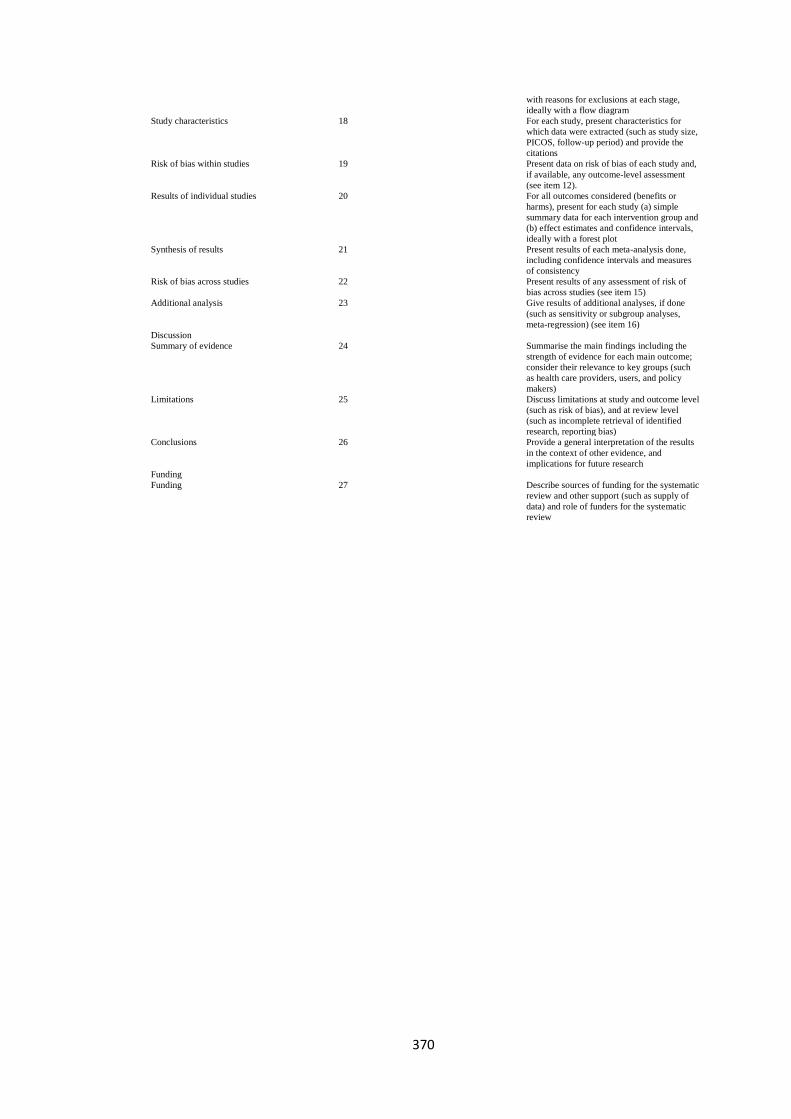
370
with reasons for exclusions at each stage,
ideally with a flow diagram
Study characteristics 18 For each study, present characteristics for
which data were extracted (such as study size,
PICOS, follow-up period) and provide the
citations
Risk of bias within studies 19 Present data on risk of bias of each study and,
if available, any outcome-level assessment
(see item 12).
Results of individual studies 20 For all outcomes considered (benefits or
harms), present for each study (a) simple
summary data for each intervention group and
(b) effect estimates and confidence intervals,
ideally with a forest plot
Synthesis of results 21 Present results of each meta-analysis done,
including confidence intervals and measures
of consistency
Risk of bias across studies 22 Present results of any assessment of risk of
bias across studies (see item 15)
Additional analysis 23 Give results of additional analyses, if done
(such as sensitivity or subgroup analyses,
meta-regression) (see item 16)
Discussion
Summary of evidence 24 Summarise the main findings including the
strength of evidence for each main outcome;
consider their relevance to key groups (such
as health care providers, users, and policy
makers)
Limitations 25 Discuss limitations at study and outcome level
(such as risk of bias), and at review level
(such as incomplete retrieval of identified
research, reporting bias)
Conclusions 26 Provide a general interpretation of the results
in the context of other evidence, and
implications for future research
Funding
Funding 27 Describe sources of funding for the systematic
review and other support (such as supply of
data) and role of funders for the systematic
review
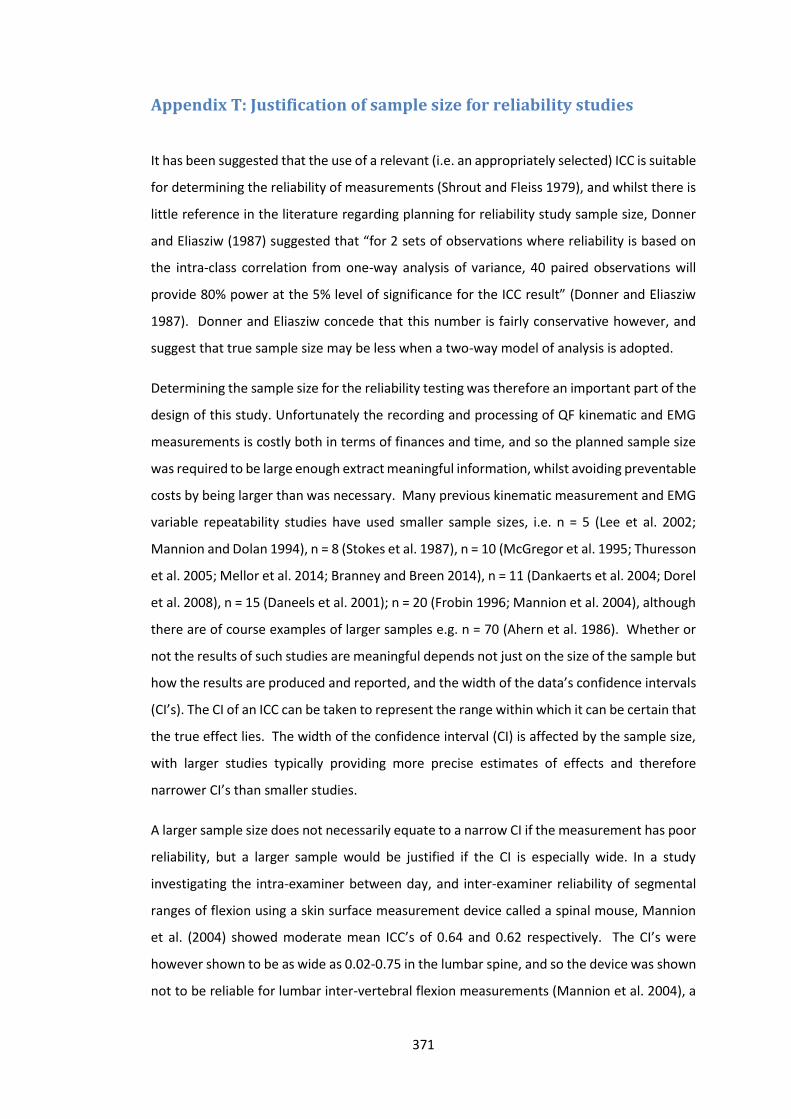
371
Appendix T: Justification of sample size for reliability studies
It has been suggested that the use of a relevant (i.e. an appropriately selected) ICC is suitable
for determining the reliability of measurements (Shrout and Fleiss 1979), and whilst there is
little reference in the literature regarding planning for reliability study sample size, Donner
and Eliasziw (1987) suggested that “for 2 sets of observations where reliability is based on
the intra-class correlation from one-way analysis of variance, 40 paired observations will
provide 80% power at the 5% level of significance for the ICC result” (Donner and Eliasziw
1987). Donner and Eliasziw concede that this number is fairly conservative however, and
suggest that true sample size may be less when a two-way model of analysis is adopted.
Determining the sample size for the reliability testing was therefore an important part of the
design of this study. Unfortunately the recording and processing of QF kinematic and EMG
measurements is costly both in terms of finances and time, and so the planned sample size
was required to be large enough extract meaningful information, whilst avoiding preventable
costs by being larger than was necessary. Many previous kinematic measurement and EMG
variable repeatability studies have used smaller sample sizes, i.e. n = 5 (Lee et al. 2002;
Mannion and Dolan 1994), n = 8 (Stokes et al. 1987), n = 10 (McGregor et al. 1995; Thuresson
et al. 2005; Mellor et al. 2014; Branney and Breen 2014), n = 11 (Dankaerts et al. 2004; Dorel
et al. 2008), n = 15 (Daneels et al. 2001); n = 20 (Frobin 1996; Mannion et al. 2004), although
there are of course examples of larger samples e.g. n = 70 (Ahern et al. 1986). Whether or
not the results of such studies are meaningful depends not just on the size of the sample but
how the results are produced and reported, and the width of the data’s confidence intervals
(CI’s). The CI of an ICC can be taken to represent the range within which it can be certain that
the true effect lies. The width of the confidence interval (CI) is affected by the sample size,
with larger studies typically providing more precise estimates of effects and therefore
narrower CI’s than smaller studies.
A larger sample size does not necessarily equate to a narrow CI if the measurement has poor
reliability, but a larger sample would be justified if the CI is especially wide. In a study
investigating the intra-examiner between day, and inter-examiner reliability of segmental
ranges of flexion using a skin surface measurement device called a spinal mouse, Mannion
et al. (2004) showed moderate mean ICC’s of 0.64 and 0.62 respectively. The CI’s were
however shown to be as wide as 0.02-0.75 in the lumbar spine, and so the device was shown
not to be reliable for lumbar inter-vertebral flexion measurements (Mannion et al. 2004), a
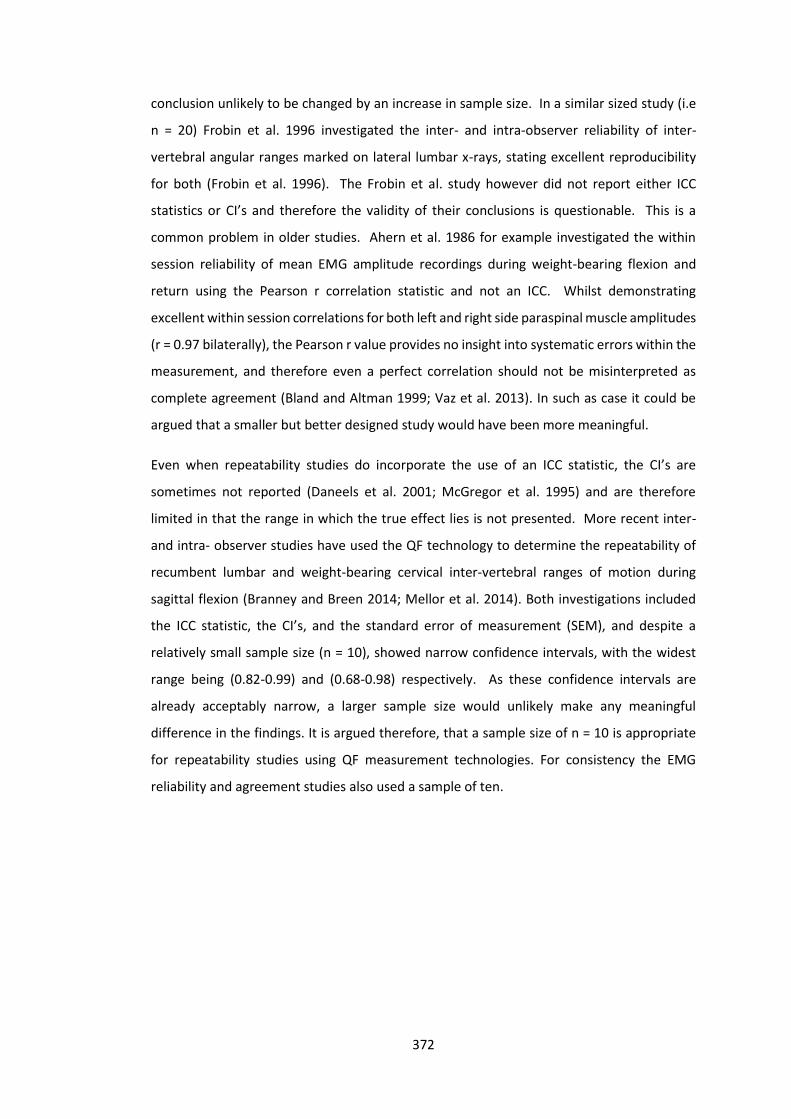
372
conclusion unlikely to be changed by an increase in sample size. In a similar sized study (i.e
n = 20) Frobin et al. 1996 investigated the inter- and intra-observer reliability of inter-
vertebral angular ranges marked on lateral lumbar x-rays, stating excellent reproducibility
for both (Frobin et al. 1996). The Frobin et al. study however did not report either ICC
statistics or CI’s and therefore the validity of their conclusions is questionable. This is a
common problem in older studies. Ahern et al. 1986 for example investigated the within
session reliability of mean EMG amplitude recordings during weight-bearing flexion and
return using the Pearson r correlation statistic and not an ICC. Whilst demonstrating
excellent within session correlations for both left and right side paraspinal muscle amplitudes
(r = 0.97 bilaterally), the Pearson r value provides no insight into systematic errors within the
measurement, and therefore even a perfect correlation should not be misinterpreted as
complete agreement (Bland and Altman 1999; Vaz et al. 2013). In such as case it could be
argued that a smaller but better designed study would have been more meaningful.
Even when repeatability studies do incorporate the use of an ICC statistic, the CI’s are
sometimes not reported (Daneels et al. 2001; McGregor et al. 1995) and are therefore
limited in that the range in which the true effect lies is not presented. More recent inter-
and intra- observer studies have used the QF technology to determine the repeatability of
recumbent lumbar and weight-bearing cervical inter-vertebral ranges of motion during
sagittal flexion (Branney and Breen 2014; Mellor et al. 2014). Both investigations included
the ICC statistic, the CI’s, and the standard error of measurement (SEM), and despite a
relatively small sample size (n = 10), showed narrow confidence intervals, with the widest
range being (0.82-0.99) and (0.68-0.98) respectively. As these confidence intervals are
already acceptably narrow, a larger sample size would unlikely make any meaningful
difference in the findings. It is argued therefore, that a sample size of n = 10 is appropriate
for repeatability studies using QF measurement technologies. For consistency the EMG
reliability and agreement studies also used a sample of ten.
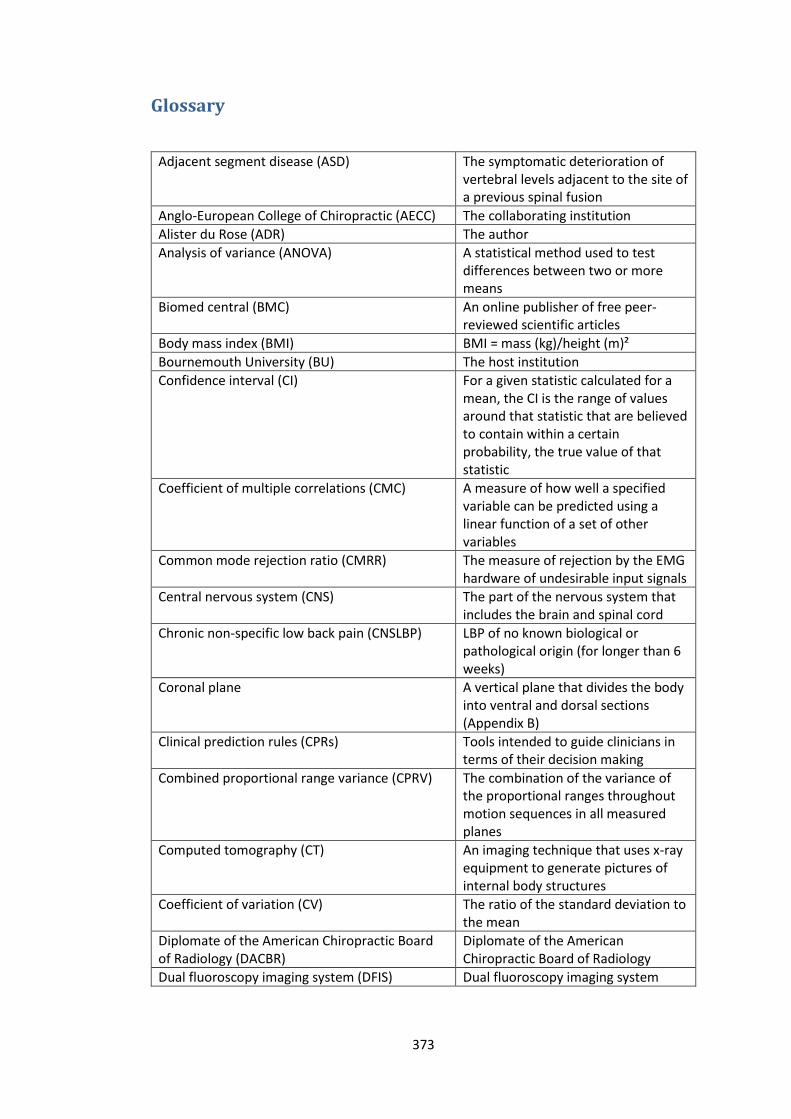
373
Glossary
Adjacent segment disease (ASD) The symptomatic deterioration of vertebral levels adjacent to the site of a previous spinal fusion
Anglo-European College of Chiropractic (AECC) The collaborating institution
Alister du Rose (ADR) The author
Analysis of variance (ANOVA) A statistical method used to test differences between two or more means
Biomed central (BMC) An online publisher of free peer-reviewed scientific articles
Body mass index (BMI) BMI = mass (kg)/height (m)²
Bournemouth University (BU) The host institution
Confidence interval (CI) For a given statistic calculated for a mean, the CI is the range of values around that statistic that are believed to contain within a certain probability, the true value of that statistic
Coefficient of multiple correlations (CMC) A measure of how well a specified variable can be predicted using a linear function of a set of other variables
Common mode rejection ratio (CMRR) The measure of rejection by the EMG hardware of undesirable input signals
Central nervous system (CNS) The part of the nervous system that includes the brain and spinal cord
Chronic non-specific low back pain (CNSLBP) LBP of no known biological or pathological origin (for longer than 6 weeks)
Coronal plane A vertical plane that divides the body into ventral and dorsal sections (Appendix B)
Clinical prediction rules (CPRs) Tools intended to guide clinicians in terms of their decision making
Combined proportional range variance (CPRV) The combination of the variance of the proportional ranges throughout motion sequences in all measured planes
Computed tomography (CT) An imaging technique that uses x-ray equipment to generate pictures of internal body structures
Coefficient of variation (CV) The ratio of the standard deviation to the mean
Diplomate of the American Chiropractic Board of Radiology (DACBR)
Diplomate of the American Chiropractic Board of Radiology
Dual fluoroscopy imaging system (DFIS) Dual fluoroscopy imaging system

374
European Academy of Chiropractic (EAC) The academic division of the European Chiropractors Union (ECU)
Electrocardiography (ECG) The recording of electrical activity from the heart using electrodes
Eccentric: concentric ratio (ECR) The ratio of eccentric muscle activity over the concentric muscle activity
Electromyography (EMG) The study of the function of muscles via the electrical signal associated with muscular contraction
Erector spinae (ES) Three collumns of paraspinal muscles (Iliocostalis, longissimus and spinalis) travelling from the skull to the pelvis
Food and Drug Administration (FDA) The U.S. Food and Drug Administration
Flexion relaxation phenomenon (FRP) The phenomenon of reduced paraspinal myoelectrical activity during sagittal flexion of the trunk
Flexion relaxation ratio (FRR) The ratio of maximal muscle activity during flexion and activity at full flexion
Functional spinal unit (FSU) The smallest physiological motion unit of the spine to exhibit biomechanical characteristics similar to those of the entire spine
General practitioner (GP) A medical doctor (U.K)
Graphical user interface (GUI) Software that works at the interface between the user and a computer, employing graphical elements
International Business Machines (IBM) An information technology company
Instantaneous axis of rotation (IAR) The centre about which spinal muscles employ their moment during flexion, extension and rotation
Intraclass correlation coefficient (ICC) A statistic that assesses the consistency between measures of the same class
Iliac crest level (ICL) Situated at the same level as the iliac crest
Institute for Musculoskeletal Research and Clinical Implementation (IMRCI)
A research institution within the AECC
The International Society of Electrophysiology and Kinesiology (ISEK)
An organisation devoted to the study of human movement and the neuromuscular system
Inter-vertebral flexion extension (IVFE) Inter-vertebral flexion extension
Inter-vertebral range of motion (IV-RoM) Inter-vertebral range of motion
Maximum inter-vertebral range of motion (IV-RoMmax)
Maximum inter-vertebral range of motion
Innervation zone (IZ) A site within a muscle where nerve terminations and muscle fibres are connected
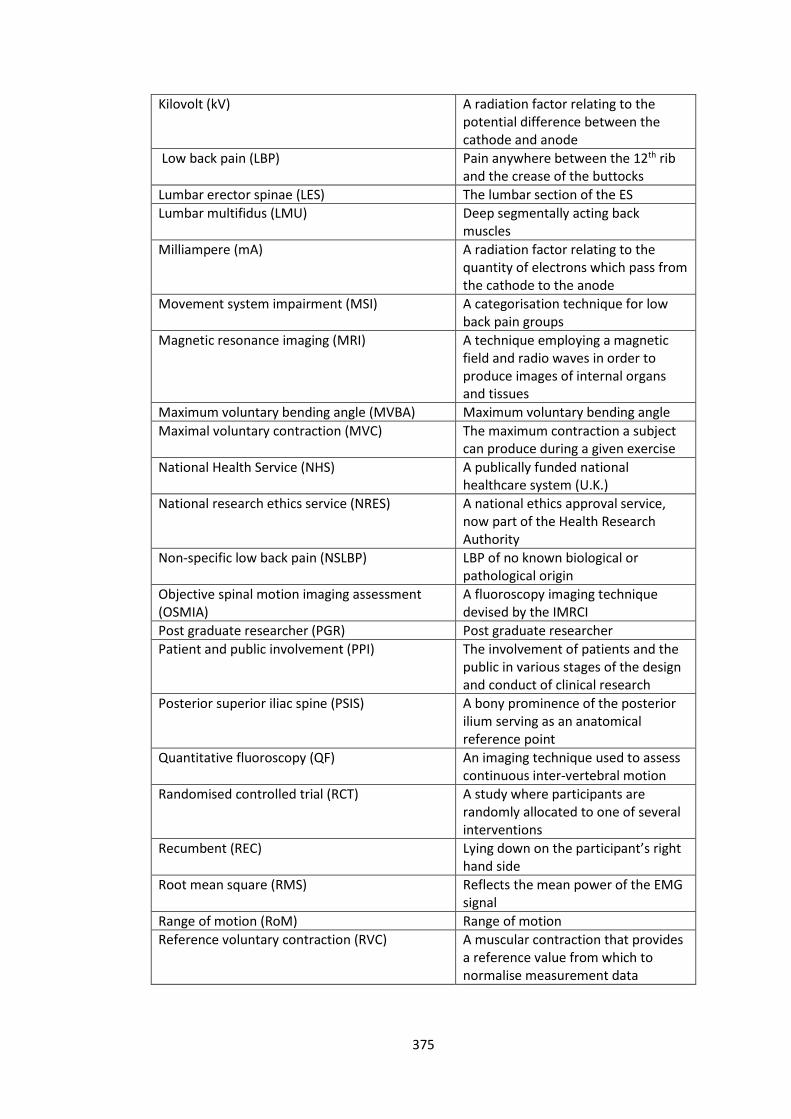
375
Kilovolt (kV) A radiation factor relating to the potential difference between the cathode and anode
Low back pain (LBP) Pain anywhere between the 12th rib and the crease of the buttocks
Lumbar erector spinae (LES) The lumbar section of the ES
Lumbar multifidus (LMU) Deep segmentally acting back muscles
Milliampere (mA) A radiation factor relating to the quantity of electrons which pass from the cathode to the anode
Movement system impairment (MSI) A categorisation technique for low back pain groups
Magnetic resonance imaging (MRI) A technique employing a magnetic field and radio waves in order to produce images of internal organs and tissues
Maximum voluntary bending angle (MVBA) Maximum voluntary bending angle
Maximal voluntary contraction (MVC) The maximum contraction a subject can produce during a given exercise
National Health Service (NHS) A publically funded national healthcare system (U.K.)
National research ethics service (NRES) A national ethics approval service, now part of the Health Research Authority
Non-specific low back pain (NSLBP) LBP of no known biological or pathological origin
Objective spinal motion imaging assessment (OSMIA)
A fluoroscopy imaging technique devised by the IMRCI
Post graduate researcher (PGR) Post graduate researcher
Patient and public involvement (PPI) The involvement of patients and the public in various stages of the design and conduct of clinical research
Posterior superior iliac spine (PSIS) A bony prominence of the posterior ilium serving as an anatomical reference point
Quantitative fluoroscopy (QF) An imaging technique used to assess continuous inter-vertebral motion
Randomised controlled trial (RCT) A study where participants are randomly allocated to one of several interventions
Recumbent (REC) Lying down on the participant’s right hand side
Root mean square (RMS) Reflects the mean power of the EMG signal
Range of motion (RoM) Range of motion
Reference voluntary contraction (RVC) A muscular contraction that provides a reference value from which to normalise measurement data
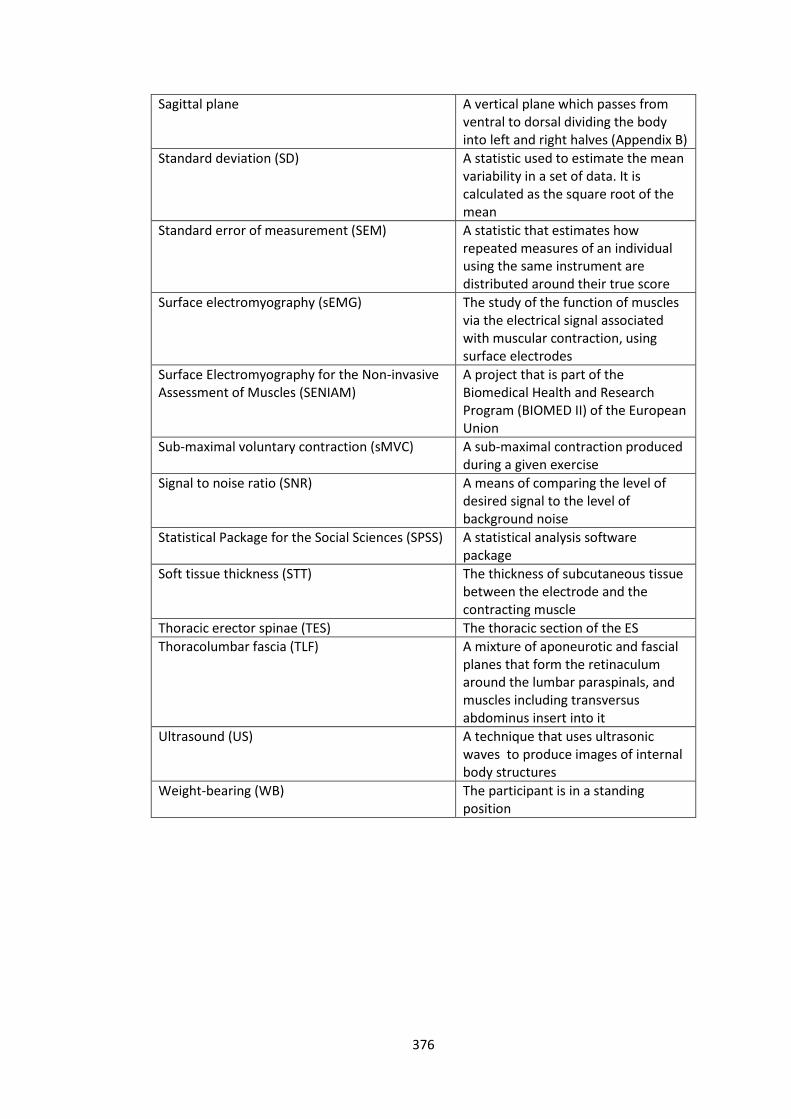
376
Sagittal plane A vertical plane which passes from ventral to dorsal dividing the body into left and right halves (Appendix B)
Standard deviation (SD) A statistic used to estimate the mean variability in a set of data. It is calculated as the square root of the mean
Standard error of measurement (SEM) A statistic that estimates how repeated measures of an individual using the same instrument are distributed around their true score
Surface electromyography (sEMG) The study of the function of muscles via the electrical signal associated with muscular contraction, using surface electrodes
Surface Electromyography for the Non-invasive Assessment of Muscles (SENIAM)
A project that is part of the Biomedical Health and Research Program (BIOMED II) of the European Union
Sub-maximal voluntary contraction (sMVC) A sub-maximal contraction produced during a given exercise
Signal to noise ratio (SNR) A means of comparing the level of desired signal to the level of background noise
Statistical Package for the Social Sciences (SPSS) A statistical analysis software package
Soft tissue thickness (STT) The thickness of subcutaneous tissue between the electrode and the contracting muscle
Thoracic erector spinae (TES) The thoracic section of the ES
Thoracolumbar fascia (TLF) A mixture of aponeurotic and fascial planes that form the retinaculum around the lumbar paraspinals, and muscles including transversus abdominus insert into it
Ultrasound (US) A technique that uses ultrasonic waves to produce images of internal body structures
Weight-bearing (WB) The participant is in a standing position
Related Documents