Joual of Cerebral Blood Flow and Metabolism 16: 1176-1188 © 1996 The International Society of Cerebral Blood Flow and Metabolism Published by Lippincott-Raven Publishers, Philadelphia Re l ationships Between High Oxygen Extraction Fraction in the Acute Stage and Fina l Infarction in Reversib l e Midd l e Cerebra l Artery Occlusion: An Investigation in Anesthetized Baboons with Positron Emission Tomography *tAlan R. Young, II Giuliano Sette, tOmar Touzani, *Patrice Rioux, t§Jean Michel Derlon, tEric T. MacKenzie, and *tJean Claude Baron *INSERM U 320, tCyceron Biomedical Cyclotron Unit of Caen, University of Caen, CNRS 1829, and §Universi Hospital of Caen, Caen, France; and I! Dipartimento di Scienze Neurologiche, 1° Clinica Neurologica, Universita "La Sapienza", Rome, Italy Summary: Studies in humans suggest that regions that show maximal increases in brain oxygen extraction fraction (OEF) in the hours following an ischemic episode are those most vul- nerable for infarction and are oſten, although not always, as- sociated with the final site of infarction. To clarify this issue, we followed the hemodynamic and metabolic characteristics of regions with an initially maximally increased OEF and com- pared them with the ultimately infarcted region in an experi- mental stroke model. Positron emission tomography (PET) was used to obtain functional images of the brain prior to and fol- lowing reversible unilateral middle cerebral artery occlusion (MCAO) in 11 anesthetized baboons. To model early reperfu- sion, the clips were removed 6 h after occlusion. Successive measurements of regional CBF (rCBF), regional CMR02 (rCMR02), regional cerebral blood volume, and regional OEF (rOEF) were performed during the acute (up to 2 days) and chronic (> 15 days) stage. Late magnetic resonance imaging (MRI) scans (coregistered with PET) were obtained to identify infarction. Reversible MCAO produced an MRI-measurable infarction in 6 of II baboons; the others had no evidence of ischemic damage. Histological analysis confirmed the results of the MRI investigation but failed to show any evidence of cor- tical ischemic damage. The lesion was restricted to the head of the caudate nucleus, inteal capsule, and putamen. The infarct volume obtained was 0.58 ± 0.31 cm 3 . The infarcts were situ- ated in the deep MCA territory, while the area of initially Received August 3, 1995; final revision received March 18, 1996; accepted March 18, 1996. Address correspondence and reprint requests to Dr. J.-C. Baron at INSERM U.320, Cyceron Biomedical Cyclotron Unit of Caen, Boule- vard Henri Becquerel, BP. 5229, 14074 Caen Cedex, France. Abbreviations used: AN OVA, analysis of variance; CBV, cerebral blood volume; CM, canthomeatal; MCA, middle cerebral artery; MCAO, MCA occlusion; MRI, magnetic resonance imaging; OEF, oxygen extraction fraction; PET, positron emission tomography; rCBF, regional CBF; rCBV, regional CBV; rCMR02, regional CMR02; rOEF, regional OEF; Ro!, region of interest. 11 76 maximally increased OEF was within the cortical mantle. The mean absolute rCBF value in the infarct region of interest (ROI) was not significantly lower than in the highest-OEF ROI until 1-2 days post-MCAO. Cerebral metabolism in the deep MCA territory was always significantly lower than that of the cortical mantle; decreases in CMR02 in the former region were evident as early as I h post-MCAO. In the cortical mantle, the rOEF was initially significantly higher than in the infarct-to-be zone. Subsequently, the OEF declined in both regions. The differences in the time course of changes in CMR02 and OEF between these two regions, with the eventually infarcted area showing earlier metabolic degradation and in tum decline in OEF, presumably underlie their different final outcomes. In conclusion, following MCAO, the region that shows an early maximal increase in the OEF is both topographically and physi- ologically distinct from the region with final consolidated in- farction if reperfusion is allowed at 6 h. This high OEF, al- though indicative of a threatened condition, is not an indicator of inescapable consolidated infarction and is thus a situation in which therapy could be envisaged. Whether or not it is at risk of infarction and thus constitutes one target for therapy remains to be seen. Key Words: Baboon-Cerebral blood flow and metabolism-Focal cerebral ischemia-Magnetic resonance imaging-Oxygen extraction fraction-Positron emission to- mography-Stroke-Temporary middle cerebral artery occlu- sion. In clinical studies of stroke, positron emission tomog- raphy (PET) has been of invaluable use in mapping both hemodynamic and metabolic parameters (Lenzi et al., 1982; Wise et al., 1983; Frackowiak and Lammertsma, 1985; Baron, 1991). One major finding in these studies has been the equent observation of an area in which there is a high oxygen extraction fraction (OEF) that persists up to 4 days following the ictus in some cases (Wise et al., 1983; Frackowiak and Lammertsma, 1985;

Welcome message from author
This document is posted to help you gain knowledge. Please leave a comment to let me know what you think about it! Share it to your friends and learn new things together.
Transcript
Journal of Cerebral Blood Flow and Metabolism 16: 1176-1188 © 1996 The International Society of Cerebral Blood Flow and Metabolism Published by Lippincott-Raven Publishers, Philadelphia
Relationships Between High Oxygen Extraction Fraction in the
Acute Stage and Final Infarction in Reversible Middle Cerebral
Artery Occlusion: An Investigation in Anesthetized Baboons
with Positron Emission Tomography
*t Alan R. Young, IIGiuliano Sette, t:j:Omar Touzani, *Patrice Rioux, t§Jean Michel Derlon,
t:J:Eric T. MacKenzie, and *tJean Claude Baron
*INSERM U. 320, tCyceron Biomedical Cyclotron Unit of Caen, :f:University of Caen, CNRS URA 1829, and §University
Hospital of Caen, Caen, France; and I!Dipartimento di Scienze Neurologiche, 1° Clinica Neurologica, Universita "La
Sapienza", Rome, Italy
Summary: Studies in humans suggest that regions that show maximal increases in brain oxygen extraction fraction (OEF) in the hours following an ischemic episode are those most vulnerable for infarction and are often, although not always, associated with the final site of infarction. To clarify this issue, we followed the hemodynamic and metabolic characteristics of regions with an initially maximally increased OEF and compared them with the ultimately infarcted region in an experimental stroke model. Positron emission tomography (PET) was used to obtain functional images of the brain prior to and following reversible unilateral middle cerebral artery occlusion (MCAO) in 1 1 anesthetized baboons. To model early reperfusion, the clips were removed 6 h after occlusion. Successive measurements of regional CBF (rCBF), regional CMR02 (rCMR02), regional cerebral blood volume, and regional OEF (rOEF) were performed during the acute (up to 2 days) and chronic (> 15 days) stage. Late magnetic resonance imaging (MRI) scans (coregistered with PET) were obtained to identify infarction. Reversible MCAO produced an MRI-measurable infarction in 6 of II baboons; the others had no evidence of ischemic damage. Histological analysis confirmed the results of the MRI investigation but failed to show any evidence of cortical ischemic damage. The lesion was restricted to the head of the caudate nucleus, internal capsule, and putamen. The infarct volume obtained was 0.58 ± 0.31 cm3. The infarcts were situated in the deep MCA territory, while the area of initially
Received August 3, 1995; final revision received March 18, 1996; accepted March 18, 1996.
Address correspondence and reprint requests to Dr. J.-C. Baron at INSERM U.320, Cyceron Biomedical Cyclotron Unit of Caen, Boulevard Henri Becquerel, BP. 5229 , 14074 Caen Cede x, France.
Abbreviations used: AN OVA, analysis of variance; CBV, cerebral blood volume; CM, canthomeatal; MCA, middle cerebral artery; MCAO, MCA occlusion; MRI, magnetic resonance imaging; OEF, oxygen extraction fraction; PET, positron emission tomography; rCBF, regional CBF; rCBV, regional CBV; rCMR02, regional CMR02; rOEF, regional OEF; Ro!, region of interest.
1176
maximally increased OEF was within the cortical mantle. The mean absolute rCBF value in the infarct region of interest (ROI) was not significantly lower than in the highest-OEF ROI until 1-2 days post-MCAO. Cerebral metabolism in the deep MCA territory was always significantly lower than that of the cortical mantle; decreases in CMR02 in the former region were evident as early as I h post-MCAO. In the cortical mantle, the rOEF was initially significantly higher than in the infarct-to-be zone. Subsequently, the OEF declined in both regions. The differences in the time course of changes in CMR02 and OEF between these two regions, with the eventually infarcted area showing earlier metabolic degradation and in tum decline in OEF, presumably underlie their different final outcomes. In conclusion, following MCAO, the region that shows an early maximal increase in the OEF is both topographically and physiologically distinct from the region with final consolidated infarction if reperfusion is allowed at 6 h. This high OEF, although indicative of a threatened condition, is not an indicator of inescapable consolidated infarction and is thus a situation in which therapy could be envisaged. Whether or not it is at risk of infarction and thus constitutes one target for therapy remains to be seen. Key Words: Baboon-Cerebral blood flow and metabolism-Focal cerebral ischemia-Magnetic resonance imaging-Oxygen extraction fraction-Positron emission tomography-Stroke-Temporary middle cerebral artery occlusion.
In clinical studies of stroke, positron emission tomog
raphy (PET) has been of invaluable use in mapping both
hemodynamic and metabolic parameters (Lenzi et al.,
1982; Wise et al., 1983; Frackowiak and Lammertsma,
1985; Baron, 1991). One major finding in these studies
has been the frequent observation of an area in which
there is a high oxygen extraction fraction (OEF) that
persists up to 4 days following the ictus in some cases (Wise et al. , 1983; Frackowiak and Lammertsma, 1985;
TRANSIENT MeA 0 IN ANESTHETIZED BABOONS lI77
Ackerman et aI., 1989; Baron, 1991; Marchal et aL
1993). Because a high OEF reflects an inadequate oxy
gen supply in relation to underlying metabolic needs, it is
implicit that the higher the OEF, the greater the risk of hypoxia and the tissue becomes more and more in a
situation of increased jeopardy. Wise et aI. (1983) re
ported that brain regions in which the OEF was initially elevated were consistently associated with an eventual
infarction that in turn caused a secondary fall in OEF to abnormally low values. There are, however, certain ex
ceptions to these observations and some brain regions that show an initially elevated OEF may not inevitably
progress to infarction (Powers et aI., 1985; Ackerman et
aI., 1989; Baron et aI., 1989; Furlan et aI., 1994). Ac
cordingly, regions of high OEF most probably represent
tissue that is at risk, but concrete sequential data to support this hypothesis are lacking. Thus, it is important to
clarify the relationship between OEF and final consoli
dated infarction, especially if PET is ever to be used as a tool for patient selection in therapeutic trials. As of to
day, it is not certain whether the area with maximal OEF
increase early after stroke is ineludibly destined to be
infarcted, or if it is only at risk, i.e., still amenable to
therapy.
In contrast to human studies that provide only discrete
time points of the highly dynamic changes in ischemic
brain physiology, studies in nonhuman primates are op
timal to address these issues because they allow both
acute and sequential studies (Yon as et aI., �988; Tenjin
et aI., 1992; Monsein et aI., 1993; Pappata et aI., 1993;
Touzani et aI., 1995) with controlled reperfusion and
computed tomography/magnetic resonance imaging
(MRI) infarct mapping in the chronic stage (Spetzler et
aI., 1983; Sette et aI., 1993).
We have calTied out one such a study in the acute (first
hour) and chronic stages following a 6-h temporary occlusion of the middle cerebral artery (MCAO) in the
anesthetized baboon. We chose a reversible occlusion model because it mimics the clinical situation in which,
ideally, early PET measurements may be made and continued during therapeutic or occasionally spontaneous
MCA recanalization (Fieschi et al., 1989). The experi
mental data obtained by Tenjin et aI. (1992), Pappata et
aI. (1993), and Heiss et aI. (1994) suggested that remark
able dynamic changes in the OEF in the acute stage of an
ischemic episode may be region dependent. Therefore, in
the present investigation, the following question was
asked: Is the area with maximal OEF ilTeversibly des
tined to consolidated infarction, or does it represent only
vulnerable tissue? To this end, we compared the topog
raphy of the region with early maximally elevated re
gional OEF (rOEF) with that which represents the final
consolidated infarct and compared the time course of
hemodynamic and metabolic changes in these two re
gions.
METHODS
Experiments were performed in 1 1 adolescent male baboons (Papio anubis) with body weights ranging from 7 to 16 kg. The baboons were housed in individual cages maintained at 24°C with 50% relative humidity on a 12-hiI2-h light/dark cycle and were fed commercial chow supplemented with fresh fruits and water ad libitum. The evening prior to investigation, all solid foods were withdrawn.
Anesthesia The baboons were tranquilized initially with a short-acting
barbiturate (methohexital 20 mg/kg i.m.; B rietal, Lilly), and subsequent to the placement of catheters in the external saphenous veins, anesthesia was induced by the administration of etomidate (3 mg/kg i.v.; Hypnomidate, 125 mg/ml, Janssen). The hypnotic effects of etomidate were potentiated by clonidine (80 f.Lg, infused intravenously over LO min; Catapressan, Boehringer Ingelheim). Following the administration of atracurium (0.5 mg/kg i.v.; Tracrium, Wellcome) so as to achieve adequate muscuLar relaxation, endotracheal intubation was performed. All baboons were placed on intermittent positivepressure ventilation with periodic hyperinflation to minimize atelectasis. A fixed respiratory rate (20 min-I) was employed and the tidal volume adjusted so as to maintain normocapnia (p "co2 39-4 1 mm Hg). In every case, anesthesia was maintained with 67% nitrous oxide in oxygen (humidified at 38°C) along with continuous intravenous infusions of etomidate (0.3 mg/kg-h) and atracurium (0.75 mg/kg-h). Under this maintenance anesthetic regimen, MABP remained remarkably stable throughout the entire duration of the studies. During surgical interventions, anesthesia was supplemented with isoflurane (0.5�1.5%; Forene, Abbott); isoflurane was discontinued at least 90 min before any PET measurement. Prior to the placement and removal of the stereotaxic ear bars, atropine sulfate (0.25 mg i.v.) was administered. All baboons received an intravenous perfusion of heparin (50 Iu/h at 3 ml/h) starting 2 h before the occlusion and continued until 1 h after the reperfusion period.
MeAO The transorbital approach to the right MCA described by
Hudgins and Garcia (1970) was employed. Following enucleation, a small craniectomy was performed using a high-speed saline-cooled dental drill to expose the right MCA. The dura was opened and the arachnoid dissected to allow placement of two microvascular clips: one on the proximal part of the main MCA trunk and the other on the orbitofrontal branch. During this procedure, warmed saline was used to reduce the possibility of vascular spasm. The occlusion was temporary (6 h), and both the occlusion and the reperfusion phases were verified by Doppler sonography. Reconstruction of the orbit under aseptic conditions allowed a complete postoperative recovery in all baboons and permitted long-term survival, with the exception of one baboon that died at day 3 due to postoperative complications.
Postoperative care Before recovery from the final surgical intervention, a blood
transfusion was given (250 ml of concentrated erythrocytes; hematocrit > 80%; hemoglobin 20 gIL, preceded by 2 mg dexamethasone i.m.; Soludecadron). In all instances, neostigmine (0.5 mg i.v.; Prostigmine) was administered to reverse the effects of atracurium before the baboons were weaned from the ventilator. Antibiotic treatment with cephamandole was continued over 5 days (15 mg/kg Lm. daily; Kefandol).
J Cereb Blood Flow Metab, Vol. 16, No.6. 1996
1178 A. R. YO UNG ET AL.
Physiological monitoring End-tidal CO2 and N20 concentrations were monitored con
tinuously by an infrared adsorption analyzer (5200 CO2 monitor; Ohmeda). Inspired oxygen concentrations were continuously measured by an electrochemical system (Ohmeda). Following the percutaneous insertion of a catheter into each femoral artery, blood samples were withdrawn periodically for the measurement of Paco2, Pao2, pH, and hemoglobin concentrations (ABL 300; Radiometer). Hematocrit and blood glucose concentrations (glucose oxidase method; Beckman) were also measured frequently. Total blood loss due to sampling and the surgical intervention was estimated to be of the order of 70 ml. As a vehicle for intravenous anesthetic agents, physiological fluids (saline or Ringer lactate) were infused intravenously (-50 mllh, over 14 h). A urethral catheter was inserted and urine output measured (-500-800 ml over 14 h). Metabolic acidosis, defined as a base deficit of >3 mEq/L, was corrected by NaHC03 administration. A physiological recording system (Hewlett Packard) was used to monitor the ECG, heart rate, and arterial pressure both by a plethysmograph and directly by a strain gauge system. Body temperature was maintained within normal limits (37-38°C) by heating blankets. Following the end of each PET session, the baboons were allowed to recover fully and were returned to their cage.
PET procedures A control PET measurement was performed -2 weeks prior
to the occlusion. Two further measurements were made during the occlusion (MCAO + 1 h and MCAO + 4 h) and another at 1 h following the reperfusion phase (MCAO + 7 h). Additional PET studies were performed at 1-2 days post-MCAO and again between 15 and 50 days postocclusion (Fig. 1). We used the four-ring, seven-slice LET! TTV03 PET device (CEN, Grenoble, France) with an intrinsic spatial resolution of 5.5 x 5.5 x 9 mm [x, y, zl (Mazoyer et aI., 1990). To obtain reproducible head positioning (both inter- and intraanimal), the baboon's head was fixed in a specially designed frame with ear bars being placed in the external bony auditory canal and checked by a radiogram. External laser beams allowed us to select seven planes [-27 to +45 mm relative and parallel to the canthomeatal (CM) line] for imaging, according to an anatomical PET atlas (Riche et aI., 1988). A 68Ga_ 68Ge transmission scan was performed prior to each PET session. With use of the 1502 steady-state technique (with measured attenuation correction), successive inhalations of 1502-labeled CO, O2, and CO2 allowed parametric imaging of the regional cerebral blood volume (rCBV), blood volume-corrected regional cerebral oxygen metabolism (rCMR02), regional CBF (rCBF) and the rOEF to be obtained (Frackowiak et aI., 1980; Sette et aI., 1989). A calculation was performed to obtain the rCBF/rCBV image.
Morphological imaging In the chronic stage (> 16 days after MCAO), the baboons
underwent an MRI procedure in vivo (slice thickness 3 mm, 1'2 scan; Signa 1.5 T, General Electric, Milwaukee, WI, U.S.A.) to establish the presence, topography, and size of a hyperintense
signal, taken to represent approximately the final infarct (Sette et aI., 1993). The same positioning procedure as that described for the PET study was employed during these examinations, which allowed us to obtain superimposable images for both procedures.
Regions of interest Region of interest based on highest OEF at MeAO + 1 h.
In accordance with the literature (Pappata et aI., 1993), we chose a region of interest (ROI) based on a computer-generated isocontour (88% of the maximal pixel value) that delineated the highest-OEF area in the I -h post-MCAO PET image. In this objective ROI procedure, the threshold (88%) was adjusted from that used by Pappata et a!. ( 1993) to allow for improved spatial resolution of the PET camera and so as to result in similar surface areas of interest (see Results). This ROI was constantly most prominent on the basal ganglia plane situated parallel to and +2 1 mm above the CM line (Fig. 2). The plane chosen represents most of the territory supplied by the MCA and showed the highest OEF with the most typical and striking changes as well as the area of infarcted tissue (see following). This highest-OEF ROI, where the phenomenon of misery perfusion was maximal, was copied by a computer mirror function onto the contralateral hemisphere. Subsequently, both these ROIs (on the ipsilateral and contralateral hemispheres) were transposed by an image analysis system to the PET images of all other parameters (i.e., CBF, CMR02, CBV, and CBF/CBV images) obtained on the same plane and at all times studied.
ROJ ba�ed on consolidated infarct. The MR images (coregistered with PET) were used to select the plane on which a hyperintense area was readily demonstrable. Again, this region was located on the basal ganglia plane (CM + 2 1 mm). These images, standardized to the same pixel size as the PET image, were displayed on a video device to determine an irregularly shaped ROJ (presumably representative of the infarct) that followed a computer-generated isocontour determination of density changes in the MRI hyperintense area and for which the computer provided the area in square centimeters. The infarct ROI was then copied by a computer mirror function procedure onto the contralateral hemisphere with respect to the midline (Fig. 2). As before, following computer-assisted superimposition of the MRI and PET images, the ROls were transposed onto the corresponding PET parametric images. The values for these functional parameters were then calculated for the infarct ROl on these images for both hemispheres and for all PET studies.
Neuropathology Approximately 4 weeks after MCAO, the baboons were cu
rarized, ventilated, and deeply anesthetized with 2-3% isot1urane. Heparin (5,000 IU) was administered intravenously to facilitate exsanguination. The baboons were placed in the supine position, the thorax opened through a midline incision, and a cannula inserted into the ascending aorta via the left ventricle. After incising the right atrium and clamping the descending aorta, heparinized saline (5 L) was perfused at the baboon's
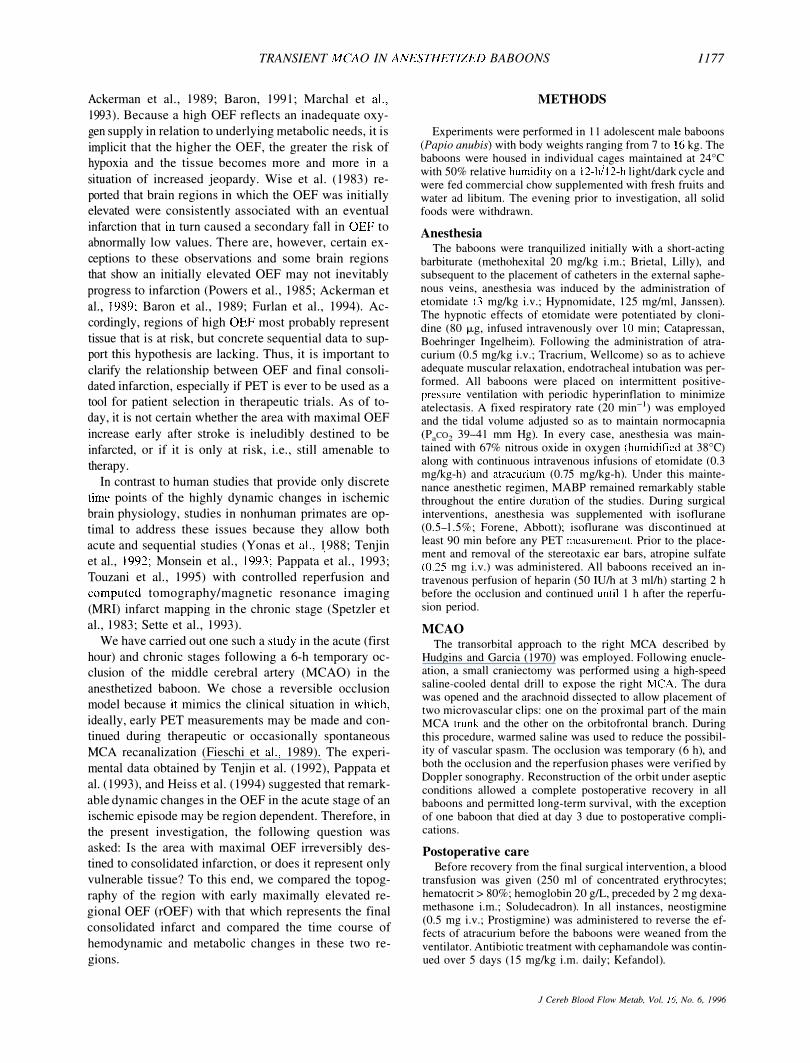
clip on clip off Rcperfusion phase MRI
r <:
rt· �l (in vivo) FIG. 1. Timing of the positron emis--;-:,," t-14 days y sion tomography (PET) studies (ar-
t f t f t rows) and magnetic resonance imag-ing (MRI) measurements. MCAO, middle cerebral artery occlusion.
PRE-MCAO t=O t+l h t+4h t +7 h t +1-2 days t >15 days t-28 days
J Cereb Blood Flow Metab. Vol. 16. No.6. 1996
TRANSIENT MeAO IN ANESTHETIZED BABOONS 1I79
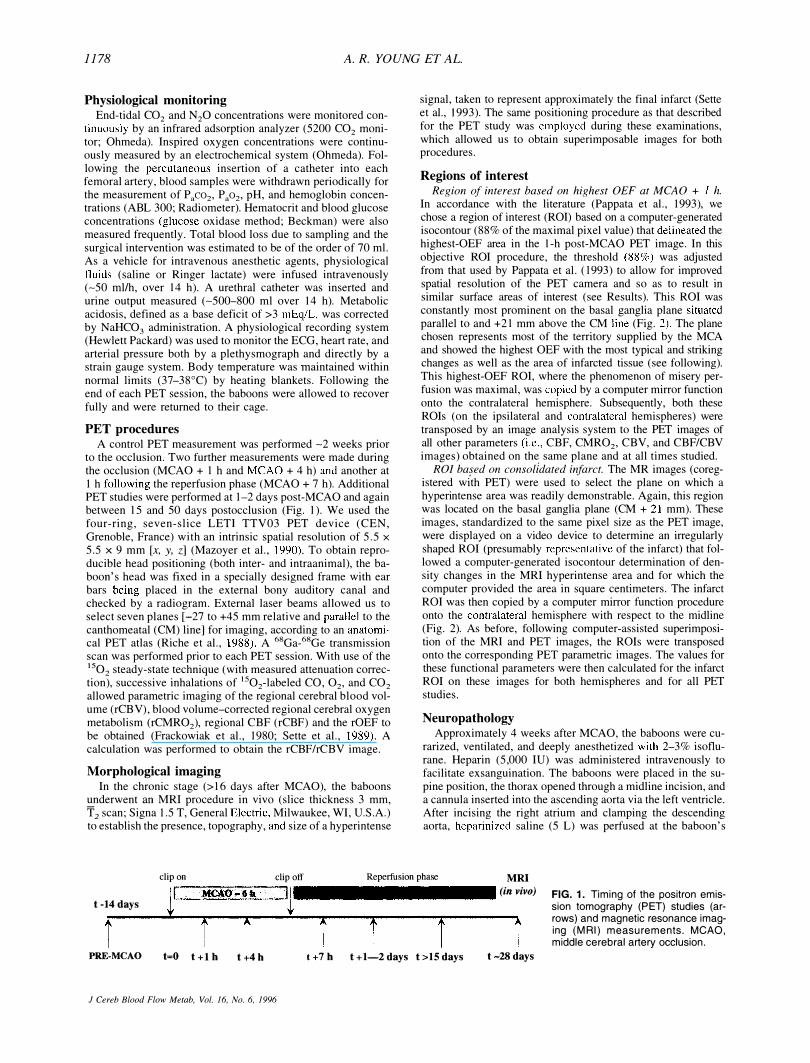
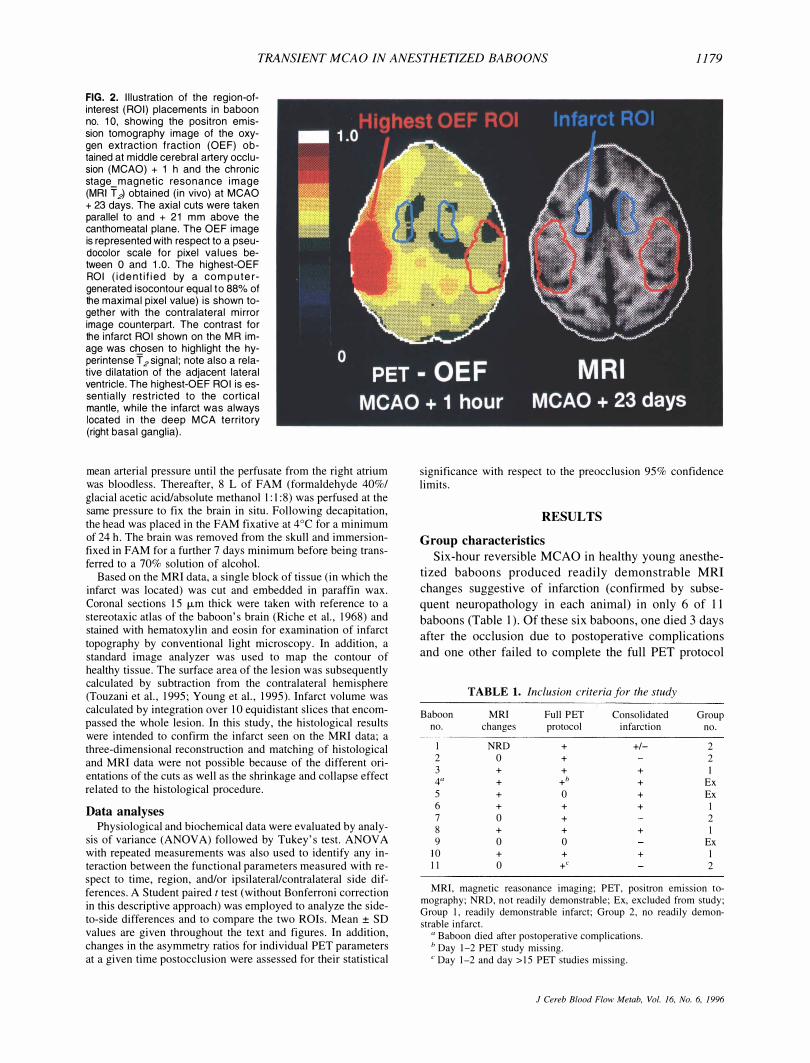
FIG. 2. Illustration of the region-ofinterest (ROI) placements in baboon no. 10, showing the positron emission tomography image of the oxygen extraction fraction (OEF) obtained at middle cerebral artery occlusion (MCAO) + 1 h and the chronic stage_magnetic resonance image (MRI T 2) obtained (in vivo) at MCAO + 23 days. The axial cuts were taken parallel to and + 21 mm above the canthomeatal plane. The OEF image is represented with respect to a pseudocolor scale for pixel values between ° and 1.0. The highest-OEF ROI (identified by a computergenerated isocontour equal to 88% of the maximal pixel value) is shown together with the contralateral mirror image counterpart. The contrast for the infarct ROI shown on the MR image was c�osen to highlight the hyperintense T 2 signal; note also a relative dilatation of the adjacent lateral ventricle. The highest-OEF ROI is essentially restricted to the cortical mantle, while the infarct was always located in the deep MCA territory (right basal ganglia) .
mean arterial pressure until the perfusate from the right atrium was bloodless. Thereafter, 8 L of FAM (formaldehyde 40%/ glacial acetic acid/absolute methanol I: I :8) was perfused at the same pressure to fix the brain in situ. Following decapitation, the head was placed in the FAM fixative at 4°C for a minimum of 24 h. The brain was removed from the skull and immersionfixed in FAM for a further 7 days minimum before being transferred to a 70% solution of alcohol.
Based on the MRI data. a single block of tissue (in which the infarct was located) was cut and embedded in paraffin wax. Coronal sections 15 f.Lm thick were taken with reference to a stereotaxic atlas of the baboon's brain (Riche et aI., 1968) and stained with hematoxylin and eosin for examination of infarct topography by conventional light microscopy. In addition, a standard image analyzer was used to map the contour of healthy tissue. The surface area of the lesion was subsequently calculated by subtraction from the contralateral hemisphere (Touzani et aI., 1995; Young et aI., 1995). Infarct volume was calculated by integration over 10 equidistant slices that encompassed the whole lesion. In this study, the histological results were intended to confirm the infarct seen on the MRI data; a three-dimensional reconstruction and matching of histological and MRI data were not possible because of the different orientations of the cuts as well as the shrinkage and collapse effect related to the histological procedure.
Data analyses Physiological and biochemical data were evaluated by analy
sis of variance (ANOYA) followed by Tukey's test. ANOYA with repeated measurements was also used to identify any interaction between the functional parameters measured with respect to time, region, and/or ipsilateral/contralateral side differences. A Student paired t test (without Bonferroni correction in this descriptive approach) was employed to analyze the sideto-side differences and to compare the two ROIs. Mean ± SD values are given throughout the text and figures. In addition, changes in the asymmetry ratios for individual PET parameters at a given lime postocclusion were assessed for their statistical
significance with respect to the preocclusion 95% confidence limits.
RESULTS
Group characteristics
Six-hour reversible MeAO in healthy young anesthe
tized baboons produced readily demonstrable MRI
changes suggestive of infarction (confirmed by subse
quent neuropathology in each animal) in only 6 of 11
baboons (Table 1). Of these six baboons, one died 3 days
after the occlusion due to postoperative complications
and one other failed to complete the full PET protocol
TABLE 1. Inclusion criteria for the study
Baboon MRI Full PET Consolidated Group no. changes protocol infarction no.
I NRD + +/- 2 2 0 + 2 3 + + + 1 4" + +b + Ex 5 + 0 + Ex 6 + + + I 7 0 + 2 8 + + + I 9 0 0 Ex
iO + + + 1 II 0 +c 2
MRI, magnetic reasonance imaging; PET, positron emission tomography; NRD, not readily demonstrable; Ex, excluded from study; Group I, readily demonstrable infarct; Group 2, no readily demonstrable infarct.
a Baboon died after postoperative complications. h Day 1-2 PET study missing. c Day 1-2 and day >15 PET studies missing.
J Cereb Blood Flow Metab, Vol. 16, No.6, 1996
1180 A. R. YOUNG ET AL.
(due to technical difficulties) and was therefore excluded
from the final PET analysis. Thus, overall, four baboons
with both readily delineated changes in the MRI and
complete PET protocol were available for this study
(Group 1). The remaining baboons showed no evidence
of infarction in four (one of which was excluded for PET
device failure just after MCAO) and questionable MRI
changes in one; this set of four "control" baboons will
be referred to as Group 2 (Table 1).
Neurological deficit and pathology
All baboons recovered consciousness within 20 min
after etomidate anesthesia was discontinued. There was
only slight contralateral hemiparesis in the upper limb
and visual field defeCts in the remaining eye. Turning of head, shoulders, and eye to the right ("neglect") was
commonly observed. All baboons showed prompt neu
rological improvement readily discernible within a 24- to
48-h recovery period. During the days after MCAO, the
baboons were alert and exhibited normal feeding and
grooming behavior.
To allow confirmation of adequate infarct imaging by
MRI procedures, we used light microscopy on brain sec
tions stained with hematoxylin and eosin. Of the 11 baboons, 4 showed no evidence of gross macroscopic dam
age and readily demonstrable changes on MRI (Table I). The remaining seven animals all showed a consolidated
infarct including the animal that died due to postopera
tive complications. The six animals with chronic infarc
tion had only small consolidated infarcts (mean ± SD
volume = 0.58 + 0.3 \ cm3) located in the head of the
caudate nucleus, internal capsule, and putamen (see Fig.
3). The baboon with the smallest infarct (0.2 cm3) is the
one with questionable MRJ findings. In no instance was
there evidence of a consolidated infarct in cortical re
gions (i.e., the region associated with the highest changes
(6 h TEMPORARY MeAO IN THE BABOON )
No. 3 6 8 10
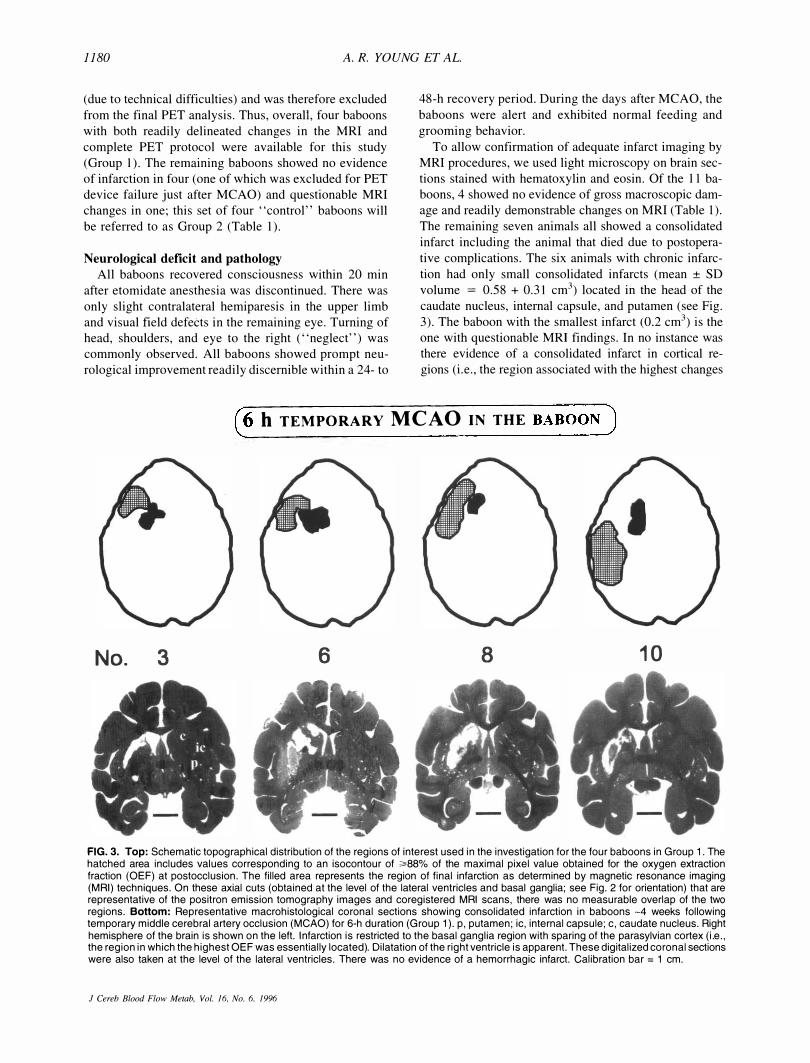
FIG. 3. Top: Schematic topographical distribution of the regions of interest used in the investigation for the four baboons in Group 1. The hatched area includes values corresponding to an isocontour of �88% of the maximal pixel value obtained for the oxygen extraction fraction (OEF) at postocclusion. The filled area represents the region of final infarction as determined by magnetic resonance imaging (MRI) techniques. On these axial cuts (obtained at the level of the lateral ventricles and basal ganglia; see Fig. 2 for orientation) that are representative of the positron emission tomography images and coregistered MRI scans, there was no measurable overlap of the two regions. Bottom: Representative macrohistological coronal sections showing consolidated infarction in baboons -4 weeks following temporary middle cerebral artery occlusion (MCAO) for 6-h duration (Group 1). p, putamen; ic, internal capsule; c, caudate nucleus. Right hemisphere of the brain is shown on the left. Infarction is restricted to the basal ganglia region with sparing of the parasylvian cortex (i.e., the region in which the highest OEF was essentially located). Dilatation of the right ventricle is apparent. These digitalized coronal sections were also taken at the level of the lateral ventricles. There was no evidence of a hemorrhagic infarct. Calibration bar = 1 cm.
J Cereb Blood Flow Metah. Vol. 16, No.6. 1996
TRANSIENT MeAO IN ANESTHETIZED BABOONS fI8I
in OEF noted in the PET studies). Figure 3 illustrates the
topography of the MRI and histological mapping of the
consolidated infarct, showing good correspondence for
the two methods employed.
Physiological and biochemical data
The physiological and biochemical data for the four
baboons in Group I are presented in Table 2. No signifi
cant differences were noted for any of these measured
parameters with respect to time (ANOV A).
Size and topographical distribution of ROIs
In all baboons, high OEF was prominent in the MCAO
+ I h image. In both groups, the highest-OEF ROI was
essentially located on the cortical mantle. In Group I, it
was topographically distinct from the infarct ROI that
was located in the deep MCA territory (see Figs. 2 and
3). At MCAO + I h, there was no significant difference
in the area of highest OEF between Group I and Group 2 (3.29 ± 1.21 and 3.47 ± 1.41 cm
2, respectively). The
area of the infarct ROI was 1.28 ± 0.54 cmz.
Group 1 Absolute and side-to-side asymmetry indexes for ROIs.
The data are shown in Tables 3-5. Figure 4 illustrates the
PET functional images of CBF, CMR02, and OEF, ob
tained in the anesthetized baboon before and following 6
h of reversible MCAO. For clarity, the ROIs have been
omitted from the color figures. Figures 5 and 6 show the
time course of the individual values (including the CBFI
CBV ratio) for each baboon. ROI based on highest OEF. Tables 3 and 4 show the
absolute values (mean ± SD) obtained in the highest
OEF ROI for the ipsilateral and contralateral hemi
spheres, respectively, before and after MCAO. Because
of large variance due to the small sample number and
interanimal variability, we decided to normalize the data
obtained with respect to contralateral homologous values
since no significant contralateral effects could be evidenced by repeated-measures ANOV A on time effect
(except for a significant widespread reduction of CBV at
the latest measurement, indicating the side-to-side ratios
for CBV for that specific time should be interpreted with
caution). As such, the data will be discussed in terms of
the asymmetry index values (i.e., the ipsilateral!
contralateral side ratios; see Table 5 and Fig. 5). By this
approach we were able to evidence more clearly the ef
fects due to MCA occlusion, which were assessed sta
tistically by comparing the values at each time post
MCAO with control values (paired t tests).
rOEF indexes were maximal at MCAO + 1 h. This
elevated rOEF was still present at MCAO + 4 h (though
to a lesser extent) and then tended to remain at control
levels or slightly below following reperfusion until the
latest PET study (see Fig. 5c).
rCBF indexes were significantly reduced at MCAO + 1 h and + 4 h. Following removal of the clips, rCBF
values returned to, or were slightly above, normal and
remained stable over the next 24-48 h (Fig. Sa). The
final PET study, however, revealed a moderate but sig
nificant reduction in rCBF.
No significant change in rCMR02 indexes was noted
either during the acute stage or at any time thereafter
except for a small but significant decrease at the last PET
study. One notes, however, that this trend, though not
significant, was already present at 24-48 h (Fig. 5b).
rCBV indexes were elevated during the period of oc
clusion (though significantly so for MCAO + 4 h only); at the terminal study, they were mildly but significantly
lower than pre-MCAO values. The index for the CBFI CBV ratio fell markedly during the period of occlusion,
but returned to near normal after MCA reopening (Fig.
5d).
ROI based on MRI infarct. Tables 3 and 4 show the
absolute values obtained by PET in the ipsilateral and
contralateral hemispheres, respectively. Again, we have
presented the data in terms of the ipsilateral/contralateral
ratios since no global effects were noted in the contra
lateral hemisphere (see Table 5 and Fig. 6), except for the final measurements of rCBV.
In the infarct ROI, the ratio for the rOEF showed a
trend for an increase at MCAO + 1 h, and in one baboon
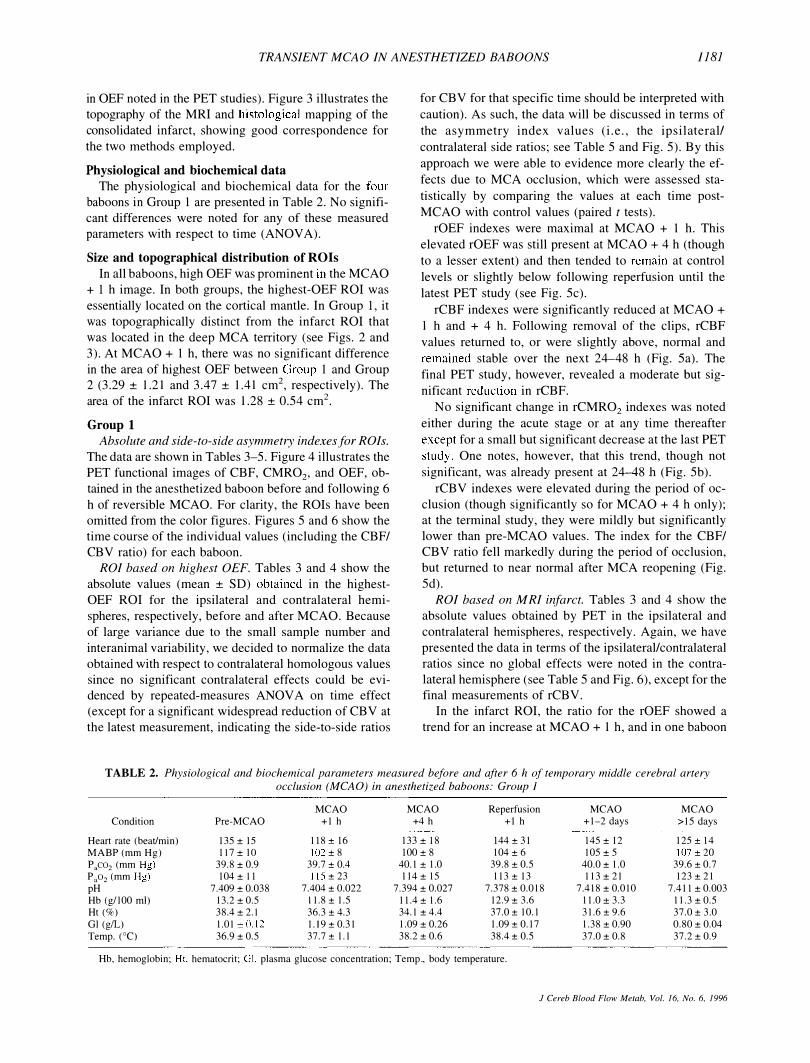
TABLE 2. Physiological and biochemical parameters measured before and after 6 h of temporary middle cerebral artery occlusion (MeAD) in anesthetized baboons: Group 1
MCAO MCAO Reperfusion MCAO MCAO Condition Pre-MCAO +1 h +4 h +1 h +1-2 days >15 days
�----Heart rate (beat/min) 135 ± 15 118 ± 16 133 ± 18 144± 31 145 ± 12 125 ± 14 MABP (mm Hg) 1 1 7± 10 1 02 ± 8 100± 8 104±6 105 ± 5 107 ± 20 P,co2 (mm Hg) 39.8 ± 0.9 39.7 ± 0.4 40.1 ± 1.0 39.8 ± 0.5 40.0 ± 1.0 39.6 ± 0.7 Pao2 (mm Hg) 104± 1 1 1 15 ±23 114± 15 113±13 113 ±21 123 ± 21 pH 7.409 ± 0.038 7.404 ± 0.022 7.394 ± 0.027 7.378 ± 0.018 7.418 ± 0.010 7.411 ± 0.003 Hb (gil 00 m]) 13.2 ± 0.5 1 1.8 ± 1.5 11.4 ± 1.6 12.9 ± 3.6 11.0±3.3 11.3 ± 0.5 Ht (%) 38.4 ± 2. 1 36.3 ± 4.3 34.1 ± 4.4 37.0 ± 10.1 31.6 ± 9.6 37.0 ± 3.0 Gl (gIL) 1.01 ±0.12 I.J9 ±0.31 1.09 ± 0.26 1.09 ± 0.17 1.38 ±0.90 0.80 ±0.04 Temp. (OC) 36.9 ± 0.5 37.7 ± 1.1 38.2 ± 0.6 38.4 ± 0.5 37.0 ± 0.8 37.2 ± 0.9
Hb. hemoglobin; Ht. hematocrit; GI. plasma glucose concentration; Temp .. body temperature.
J Cereb Blood Flow Metab, Vol. 16. No.6. 1996
1182 A. R. YOUNG ET AL.
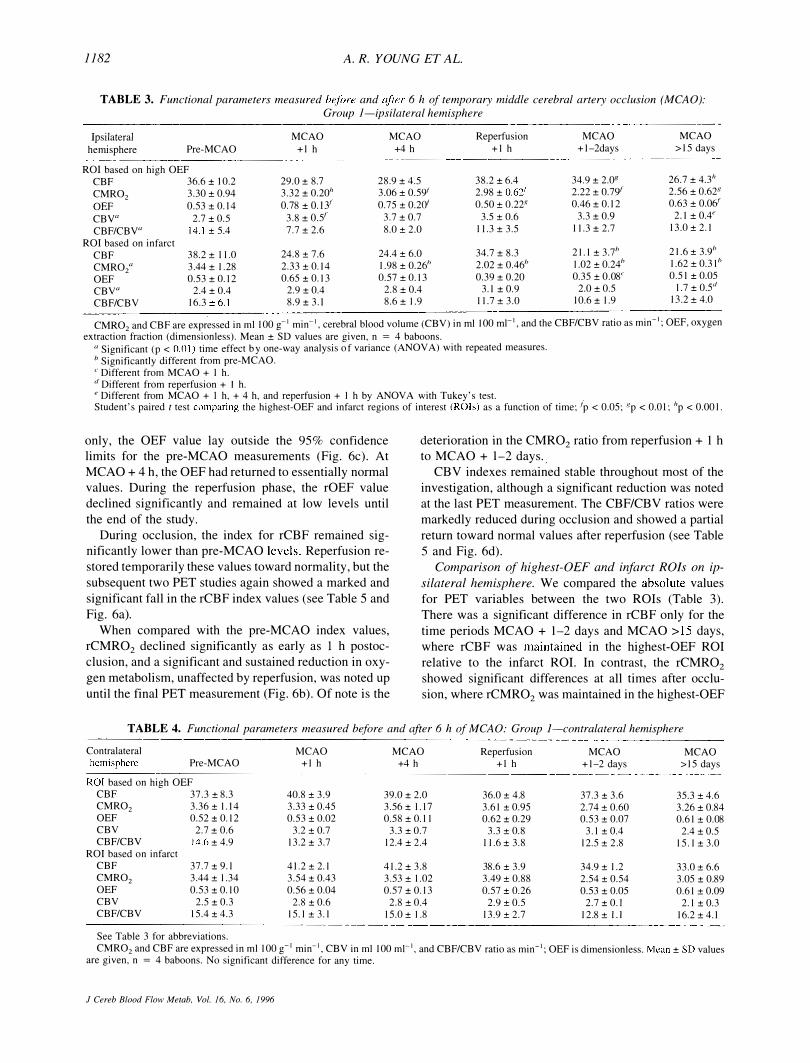
TABLE 3. Functional parameters measured betc)re and after 6 h of temporary middle cerebral artery occlusion (MCAO): Group I-ipsilateral hemisphere
Ipsilateral MCAO MCAO Reperfusion MCAO MCAO hemisphere Pre-MCAO +1 h +4 h +1 h +1-2days >15 days
��-----------------�-------���--'--------'---.
ROl based on high OEF 26.7 ± 4.3"
CBF 36.6 ± 1 0.2 29.0 ± 8.7 2 8.9 ± 4.5 38.2 ± 6.4 34.9 ± 2.0g CMR02 3.30 ± 0.94 3.32 ± 0.20" 3.06 ± 0.59' 2.98 ± 0.621 2.22 ± 0.7yf 2.56 ± 0.62-'
OEF 0.53 ± 0. 1 4 0.78±0.IY 0.75 ± 0.2(Ji 0.50 ± O.22g 0.46 ± 0. 1 2 0.63 ± O.O&'
CBVa 2.7 ± 0.5 3.8 ± 0.51 3.7 ± 0.7 3.5 ± 0.6 3.3 ± 0.9 2.1 ± 0.4"
CBF/CBV" 14. 1 ± 5.4 7.7 ± 2.6 8.0 ± 2.0 1 J.3 ± 3.5 11.3 ± 2.7 13.0 ± 2.1
ROI based on infarct 21.1 ± 3.7" 21.6 ± 3.9"
CBF 3 8.2 ± 11.0 24. 8 ± 7.6 24.4 ± 6.0 34.7 ± 8.3
CMR02a 3.44 ± 1.28 2.33 ± 0.14 1.98 ± 0.26" 2.02 ± 0.46" 1.02 ± 0.24" 1.62 ± 0.31"
OEF 0.53 ± 0.12 0.65 ± 0.13 0.57 ± 0.13 0.39 ± 0.20 0.35 ± 0.08' 0.51 ± 0.05
CBV" 2.4 ± 0.4 2.9 ± 0.4 2.8 ± 0.4 3.1 ± 0.9 2.0 ± 0.5 1.7 ± O.Sd
CBF/CBV 16.3 ±6. 1 8.9 ± 3. 1 8.6 ± 1.9 11.7 ± 3.0 10.6 ± 1.9 13.2 ± 4.0
CMR02 and CBF are expressed in ml 100 g-' min-', cerebral blood volume (CBV) in ml 100 ml-', and the CBF/CBV ratio as min-i; OEF, oxygen
extraction fraction (dimensionless). Mean ± SD values are given, n = 4 baboons. " Significant (p < 0.0 1 ) time effect b y one-way analysis o f variance (ANOVA) with repeated measures.
b Significantly different from pre-MCAO. e Different from MCAO + I h. d Different from reperfusion + 1 h. e Different from MCAO + I h, + 4 h, and reperfusion + 1 h by ANOVA with Tukey's test. Student's paired t test comparing the highest-OEF and infarct regions of interest (ROIs) as a function of time; Jp < 0.05; gp < 0.0 1 ; "p < 0.001.
only, the OEF value lay outside the 95% confidence limits for the pre-MCAO measurements (Fig. 6c). At
MCAO + 4 h, the OEF had returned to essentially normal values. During the reperfusion phase, the rOEF value declined significantly and remained at low levels until
the end of the study.
During occlusion, the index for rCBF remained significantly lower than pre-MCAO levels. Reperfusion re
stored temporarily these values toward normality, but the
subsequent two PET studies again showed a marked and
significant fall in the rCBF index values (see Table 5 and
Fig. 6a).
When compared with the pre-MCAO index values, rCMR02 declined significantly as early as I h postoc
clusion, and a significant and sustained reduction in oxy
gen metabolism, unaffected by reperfusion, was noted up
until the final PET measurement (Fig. 6b). Of note is the
deterioration in the CMR02 ratio from reperfusion + 1 h to MCAO + 1-2 days ..
CBV indexes remained stable throughout most of the
investigation, although a significant reduction was noted at the last PET measurement. The CBF/CBV ratios were
markedly reduced during occlusion and showed a partial
return toward normal values after reperfusion (see Table
5 and Fig. 6d).
Comparison of highest-OEF and infarct ROls on ip
silateral hemisphere. We compared the absolute values
for PET variables between the two ROIs (Table 3).
There was a significant difference in rCBF only for the
time periods MCAO + 1-2 days and MCAO > 15 days,
where rCBF was maintained in the highest-OEF ROI
relative to the infarct ROl. In contrast, the rCMR02
showed significant differences at all times after occlu
sion, where rCMR02 was maintained in the highest-OEF
TABLE 4. Functional parameters measured before and (lfter 6 h of MCAO: Group i-contralateral hemisphere
Contralateral MCAO MCAO Reperfusion MCAO MCAO hemisphere Pre-MCAO +1 h +4 h +1 h +1-2 days >15 days
ROI based on high OEF CBF 37.3±8.3 40.8 ± 3.9 39.0 ± 2.0 36.0 ± 4.8 37.3 ± 3.6 35.3 ± 4.6 CMR02 3.36± 1. 1 4 3.33 ± 0.45 3.56 ± 1.17 3.61 ± 0.95 2.74 ± 0.60 3.26 ± 0.84 OEF 0.52 ± 0.12 0.53 ± 0.02 0.5 8 ± 0.11 0.62 ± 0.29 0.53 ± 0.07 0.61 ± 0.08 CBV 2.7 ± 0.6 3.2 ± 0.7 3.3 ± 0.7 3.3 ± 0.8 3.1 ± 0.4 2.4 ± 0.5 CBF/CBV 14.6 ± 4.9 13.2 ± 3.7 12.4 ± 2.4 11.6 ± 3.8 12.5 ± 2.8 15.1 ± 3.0
ROI based on infarct CBF 37.7 ± 9.1 4 1.2 ± 2.1 41.2 ± 3.8 38.6 ± 3.9 34.9 ± 1.2 33.0 ± 6.6 CMR02 3.44 ± 1.34 3.54 ± 0.43 3.53 ± 1.02 3.49 ± 0.8 8 2.54 ± 0.54 3.05 ± 0.89 OEF 0.53 ± 0.10 0.56 ± 0.04 0.57 ± 0.13 0.57 ± 0.26 0.53 ± 0.05 0.61 ± 0.09 CBV 2.5 ± 0.3 2.8 ± 0.6 2.8 ± 0.4 2.9 ± 0.5 2.7 ±O.I 2.1 ±0.3 CBF/CBV 15.4 ± 4.3 15.1 ± 3.1 15.0 ± 1.8 13.9 ± 2.7 12.8 ± 1.1 16.2 ± 4. 1
See Table 3 for abbreviations. CMR02 and CBF are expressed in ml 100 g-' min-', CBV in ml 100 ml-', and CBF/CBV ratio as min-'; OEF is dimensionless. Mean ± SD values
are given, n = 4 baboons. No significant difference for any time.
J Cereb Blood Flow Metab, Vol. 16, No.6, 1996
TRANSIENT MeAO IN ANESTHETIZED BABOONS
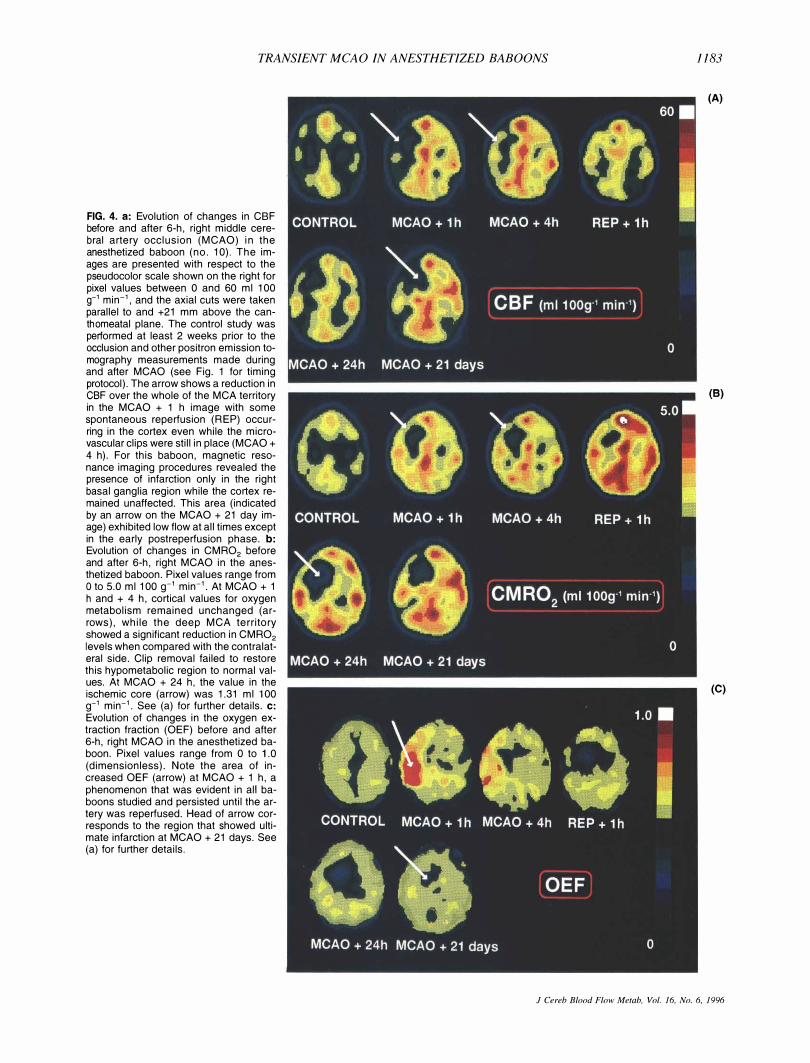
FIG. 4. a: Evolution of changes in CBF before and after 6-h, right middle cerebral artery occlusion (MCAO) in the anesthetized baboon (no. 10). The images are presented with respect to the pseudocolor scale shown on the right for pixel values between 0 and 60 ml 100 g-' min-', and the axial cuts were taken parallel to and +21 mm above the canthomeatal plane. The control study was performed at least 2 weeks prior to the occlusion and other positron emission tomography measurements made during and after MCAO (see Fig. 1 for timing protocol) . The arrow shows a reduction in CBF over the whole of the MCA territory in the MCAO + 1 h image with some spontaneous reperfusion (REP) occurring in the cortex even while the microvascular clips were still in place (MCAO + 4 h) . For this baboon, magnetic resonance imaging procedures revealed the presence of infarction only in the right basal ganglia region while the cortex remained unaffected. This area (indicated by an arrow on the MCAO + 21 day image) exhibited low flow at all times except in the early postreperfusion phase. b: Evolution of changes in CMR02 before and after 6-h, right MCAO in the anesthetized baboon. Pixel values range from o to 5.0 ml 100 g-' min-'. At MCAO + 1 h and + 4 h, cortical values for oxygen metabolism remained unchanged (arrows) , while the deep MCA territory showed a significant reduction in CMR02 levels when compared with the contralateral side. Clip removal failed to restore this hypometabolic region to normal values. At MCAO + 24 h, the value in the ischemic core (arrow) was 1.31 ml 100 g-' min-'. See (a) for further details. c: Evolution of changes in the oxygen extraction fraction (OEF) before and after 6-h, right MCAO in the anesthetized baboon. Pixel values range from 0 to 1.0 (dimensionless) . Note the area of increased OEF (arrow) at MCAO + 1 h, a phenomenon that was evident in all baboons studied and persisted until the artery was reperfused. Head of arrow corresponds to the region that showed ultimate infarction at MCAO + 21 days. See (a) for further details.
lI83
(A)
(8)
(C)
] Cereb Blood Flow Metab. Vol. 16. No.6, 1996
1184 A. R. YOUNG ET AL.
TABLE S. Mean asymmetry index values expressed as ipsilaterallcontralateral side ratio obtained before and after 6 h of temporary MeAD in anesthetized baboons-Group I
Condition! parameter Pre-MCAO
ROI based on high OEF CBF 0.98±0.10 CMR02 0.99 ± 0.05 OEF 1.01 ± 0.06 CBV 1.02 ± 0.05 CBF/CBV 0.95 ± 0.07
ROJ based on infarct CBF CMR02 OEF CBV CBF/CBV
1.01±0.12 1.00 ± 0.07 0.99 ± 0.06 1.06 ± 0.14 LOS ± 0.14
See Table 3 for abbreviations.
MCAO +1 h
0.71 ± O.IS,,·d 1.01 ±0.15" 1.46 ± 0.20"" 1.20 ± 0.16 0.59 ± 0.14"
0.60 ± 0.16" 0.67 ± 0.10" 1.16 ± 0.20 1.07 ± 0.08 0.59 ± O.IS"
Mean ± SD values are given, n = 4 baboons.
MCAO +4 h
0.74 ± 0.13a., 0.S9±0.IY 1.28 ± 0.11"" 1.14 ± 0.05"" 0.66 ± 0.13"
0.60 ± 0.18" 0.59 ± 0.13" 1.00 ± 0.13 1.03 ± 0.05 0.59 ± 0.17"
"p < 0.05, bp < 0.01, relative to control pre-MCAO values, by Student's paired t test.
Reperfusion MCAO MCAO +1 h +1-2 days >15 days
1.06 ± 0.06 0.94 ± 0.10' 0.75 ± 0.06b., 0.84 ± 0.14<1 0.80 ± 0.14" 0.79 ± 0.09"'<' 0.80 ± 0.14' 0.85 ± 0.14 1.04 ± 0.04" 1.09 ± 0.13 1.06 ± 0.20 0.S7 ± 0.04h 0.99±0.IS 0.90 ± 0.10 0.S7 ± O.OS
0.S9 ± 0.16 0.61 ± 0.1 zi' 0.66 ± 0.04" 0.60 ± 0.13" 0.40 ± O.OSb 0.54 ± 0.07" 0.66 ± 0.12" 0.66 ± 0.08h 0.83 ± 0.06" 1.04 ± 0.11 0.65 ± 0.17 0.82 ± 0.09" 0.84 ± 0.09" 0.83 ± 0.10" 0.81 ± 0.10"
c p < O.OS, dp < 0.01, "p < 0.001 by Student's paired t test comparing the highcst-OEF and infarct ROIs as a function of time.
ROI but was consistently reduced in the ROI that
evolved toward infarction. In terms of the rOEF values,
significant differences between the two regions existed at
MCAO + 1 h and MCAO + 4 h where the rOEF was
more elevated in the highest-OEF ROI than in the infarct
ROL After reperfusion, the OEF returned to normal in
the highest-OEF ROI, while in the infarct ROI, it dete
riorated considerably in the acute stage and then returned to normal, although still at significantly lower values
than in the highest-OEF ROl. At MCAO + 1 h, rCBV
was significantly greater in the highest-OEF region when
compared with the infarct ROL The values for the CBFI
CBV ratio changed in parallel in the two regions at all
time intervals studied.
Comparison of the index values between the two ROls
is shown in Table 5. As compared with the infarct ROI,
o
the highest-OEF ROI was characterized by significantly
higher OEF, CBF, and CMR02 indexes at 1 h, 4 h, and
1-2 days after MCAO and higher CBF and CMR02 indexes in the chronic stage.
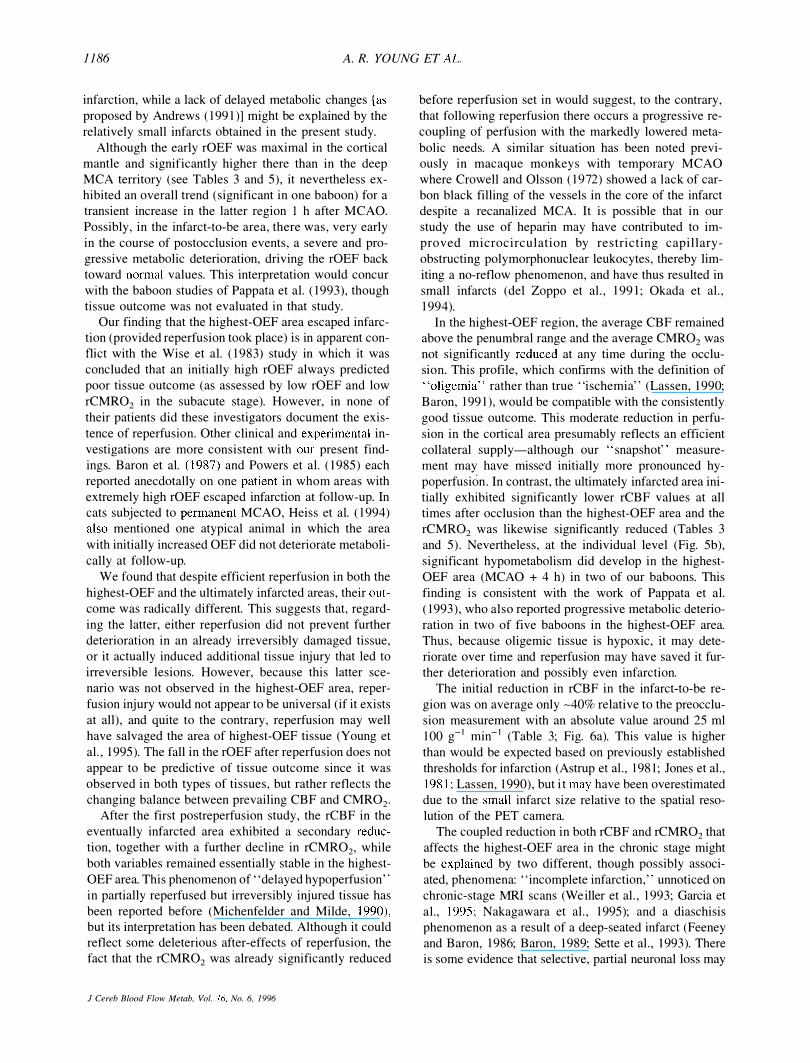
Group 2 There was no significant ditterence between the physi
ological and biochemical parameters of the two groups
(data not shown). The profile of changes in the param
eters measured at MCAO + I h in the highest-OEF ROI
(the only ROI available for analysis) was similar to that
of Group 1. The individual data are illustrated in Fig. 7.
Across the four baboons, the OEF index was signifi
cantly increased (p < 0.01) and CBF values significantly
reduced (p < 0.05), while the CMR02 was not signifi
cantly lower than the pre-MCAO levels. The time course
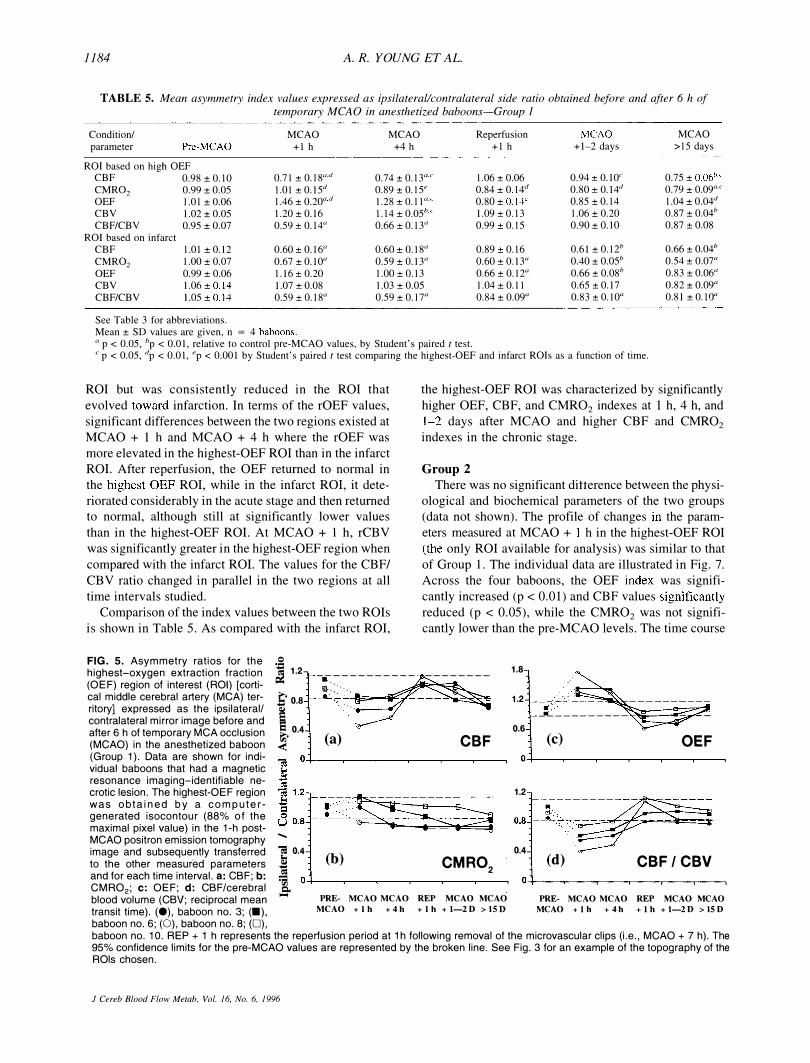
1.8 FIG. 5. Asymmetry ratios for the highest-oxygen extraction fraction (OEF) region of interest (ROI) [corti
� 1.2 -� �--------- --------
-.,,��� cal middle cerebral artery (MCA) territory] expressed as the ipsilateral! contralateral mirror image before and after 6 h of temporary MCA occlusion (MCAO) in the anesthetized baboon (Group 1). Data are shown for individual baboons that had a magnetic resonance imaging-identifiable necrotic lesion. The highest-OEF region was obtained b y a computergenerated isocontour (88% of the maximal pixel value) in the 1-h post
Eo.8 � � 0.4 <
1iI- .•....• �.-,:::."...J.�-.... �/ 1.2
...... --�/ -�--------- - -
0.6 (a) CBF (c) OEF
1.2
0.4 MCAO positron emission tomography
.....
image and subsequently transferred 1i! 0.4 to the other measured parameters i CMR02 and for each time interval. a: CBF; b: � O+----..---.----r---r---r----.
(b) (d) CBF/CBV
CMR02; c: OEF; d: CBF!cerebral .eblood volume (CBV; reciprocal mean transit time). (e), baboon no. 3; (.), baboon no. 6; (0), baboon no. 8; (D),
PRE- MCAO MCAO REP MCAO MCAO MCAO + I h + 4 h + I h + 1-2 D > 15 J)
O�----..----�---r----.---,----, PRE- MCAO MCAO REP MCAO MCAO
MCAO + I h + 4 h + I h + 1-2 D > 15 D
baboon no. 10. REP + 1 h represents the reperfusion period at 1 h following removal of the microvascular clips (i.e., MCAO + 7 h). The 95% confidence limits for the pre-MCAO values are represented by the broken line. See Fig. 3 for an example of the topography of the ROls chosen.
J Cereb Blood Flow Metab, Vol. 16. No.6, 1996
TRANSIENT MeAO IN ANESTHETIZED BABOONS 1185
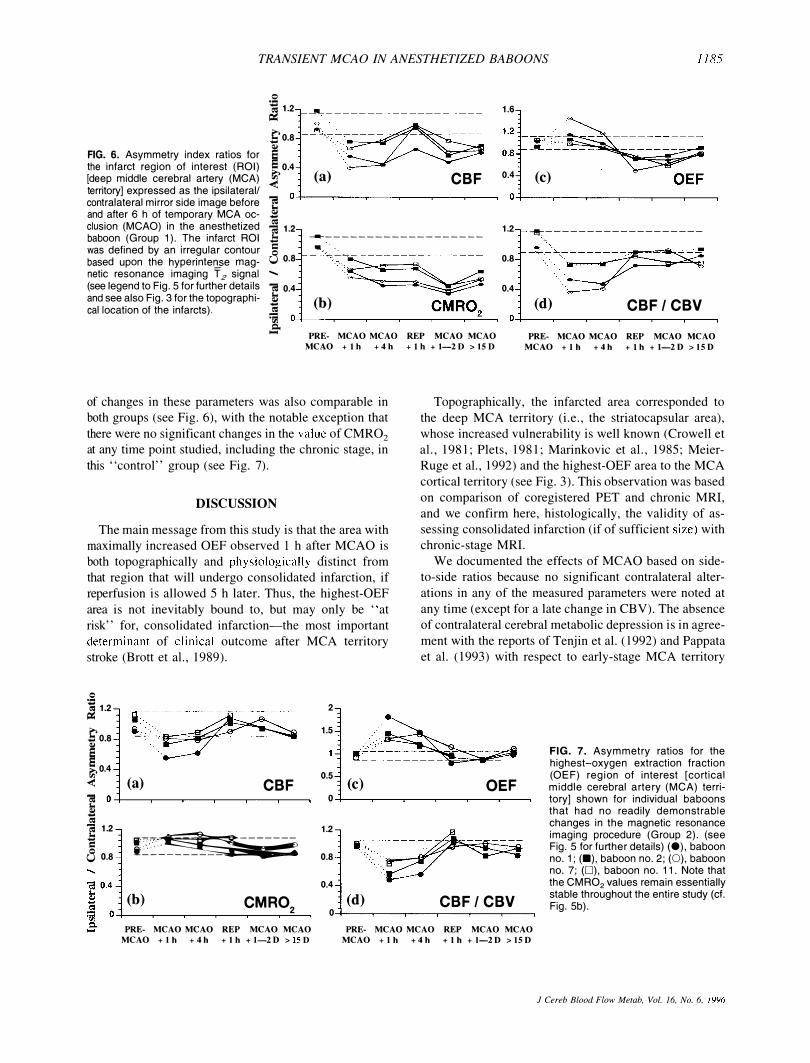
c � 1.2 � 1. --c� ::-=c=� .s0.8 FIG. 6. Asymmetry index ratios for the infarct region of interest (ROI) [deep middle cerebral artery (MCA) territory] expressed as the ipsilateral/
10.4
< (a) CBF 0.4 (c) OEF 04----r--�----r---�--_.--_,
contralateral mirror side image before ea 0 +----,-----,...----.----,----,...---, and after 6 h of temporary MCA oc- � elusion (MCAO) in the anesthetized � 1.2 baboon (Group 1). The infarct ROI "E �-------------------
1.2 �-------------------
was defined by an irregular contour c ... .. based upon the hyperinte'lse mag- U 0.8 --''''' '�:��'.��--------netic resonance imaging T 2 signal .....
�� (see legend to Fig. 5 for further details ea 0.4 and see also Fig. 3 for the topographi- � (b)
0.8
0.4
cal location of the infarcts). � CMR02 � 04---'-�""--�--'-��� (d) CBF/CBV
04---,---,...---,---.--,...---, c.. - PRE- MCAO MCAO REP MCAO MCAO
MCAO + I h + 4 h + I h + 1-2 j) > 15 j) PRE- MCAO MCAO REP MCAO MCAO
MCAO + 1 h + 4 h + I h + 1-2 D > 15 D
of changes in these parameters was also comparable in
both groups (see Fig. 6), with the notable exception that
there were no significant changes in the value of CMR02 at any time point studied, including the chronic stage, in
this "control" group (see Fig. 7).
DISCUSSION
The main message from this study is that the area with
maximally increased OEF observed I h after MCAO is
both topographically and physiologically distinct from
that region that will undergo consolidated infarction, if
reperfusion is allowed 5 h later. Thus, the highest-OEF
area is not inevitably bound to, but may only be "at
risk" for, consolidated infarction-the most important
determinant of clinical outcome after MCA territory
stroke (Brott et ai., 1989).
Q � � 1.2
.s0.8 � �0.4
<
i---� ��.�� ----- �
(a) CBF ea O�--.--.--.---,---.---, � �
'a 1.2 � 8 0.8 :=.=:=��
(b) CMR02
2
1.5
0.5 (c) 0
1.2
0.8
0.4
(d) 0
Topographically, the infarcted area corresponded to
the deep MCA territory (i.e., the striatocapsular area),
whose increased vulnerability is well known (Crowell et
ai., 1981; Plets, 1981; Marinkovic et aI., 1985; Meier
Ruge et aI., 1992) and the highest-OEF area to the MCA
cortical territory (see Fig. 3). This observation was based
on comparison of coregistered PET and chronic MRI,
and we confirm here, histologically, the validity of as
sessing consolidated infarction (if of sufficient size) with
chronic-stage MRI.
We documented the effects of MCAO based on side
to-side ratios because no significant contralateral alter
ations in any of the measured parameters were noted at
any time (except for a late change in CBV). The absence
of contralateral cerebral metabolic depression is in agree
ment with the reports of Tenjin et al. (1992) and Pappata
et ai. (1993) with respect to early-stage MeA territory
OEF
CBF/CBV
FIG. 7. Asymmetry ratios for the highest-oxygen extraction fraction (OEF) region of interest [cortical middle cerebral artery (MCA) territory] shown for individual baboons that had no readily demonstrable changes in the magnetic resonance imaging procedure (Group 2). (see Fig. 5 for further details) (e), baboon no. 1; (_), baboon no. 2; (0), baboon no. 7; (D), baboon no. 11. Note that the CMR02 values remain essentially stable throughout the entire study (el. Fig. 5b).
PRE- MCAO MCAO REP MCAO MCAO MCAO + 1 h + 4 h + 1 h + 1-2 D > 15 j)
PRE- MCAO MCAO REP MCAO MCAO MCAO + I h + 4 h + I h + 1-2 j) > 15 j)
J Cereb Blood Flow Metab, VoL 16, No.6, 1996
1186 A. R. YOUNG ET AL.
infarction, while a lack of delayed metabolic changes l as
proposed by Andrews (1991)] might be explained by the
relatively small infarcts obtained in the present study.
Although the early rOEF was maximal in the cortical
mantle and significantly higher there than in the deep
MCA territory (see Tables 3 and 5), it nevertheless ex
hibited an overall trend (significant in one baboon) for a
transient increase in the latter region I h after MCAO.
Possibly, in the infarct-to-be area, there was, very early
in the course of postocclusion events, a severe and pro
gressive metabolic deterioration, driving the rOEF back
toward normal values. This interpretation would concur
with the baboon studies of Pappata et al. ( 1993), though
tissue outcome was not evaluated in that study. Our finding that the highest-OEF area escaped infarc
tion (provided reperfusion took place) is in apparent con
flict with the Wise et al. (1983) study in which it was
concluded that an initially high rOEF always predicted
poor tissue outcome (as assessed by low rOEF and low
rCMR02 in the subacute stage). However, in none of
their patients did these investigators document the exis
tence of reperfusion. Other clinical and experimental in
vestigations are more consistent with our present find
ings. Baron et al. (1987) and Powers et aI. (1985) each
reported anecdotally on one patient in whom areas with
extremely high rOEF escaped infarction at follow-up. In cats subjected to permanent MCAO, Heiss et aI. (1994) also mentioned one atypical animal in which the area
with initially increased OEF did not deteriorate metaboli
cally at follow-up.
We found that despite efficient reperfusion in both the
highest-OEF and the ultimately infarcted areas, their out
come was radically different. This suggests that, regard
ing the latter, either reperfusion did not prevent further
deterioration in an already irreversibly damaged tissue,
or it actually induced additional tissue injury that led to
irreversible lesions. However, because this latter sce
nario was not observed in the highest-OEF area, reper
fusion injury would not appear to be universal (if it exists
at all), and quite to the contrary, reperfusion may well
have salvaged the area of highest-OEF tissue (Young et
aI. , 1995). The fall in the rOEF after reperfusion does not
appear to be predictive of tissue outcome since it was
observed in both types of tissues, but rather reflects the
changing balance between prevailing CBF and CMR02.
After the first postreperfusion study, the rCBF in the
eventually infarcted area exhibited a secondary reduc
tion, together with a further decline in rCMR02, while
both variables remained essentially stable in the highest
OEF area. This phenomenon of ' 'delayed hypoperfusion"
in partially reperfused but irreversibly injured tissue has
been reported before (Michenfelder and Milde, 1990), but its interpretation has been debated. Although it could reflect some deleterious after-effects of reperfusion, the fact that the rCMR02 was already significantly reduced
J Cereb Blood Flow Metab. Vol. 16. No.6. 1996
before reperfusion set in would suggest, to the contrary,
that following reperfusion there occurs a progressive re
coupling of perfusion with the markedly lowered meta
bolic needs. A similar situation has been noted previously in macaque monkeys with temporary MCAO
where Crowell and Olsson (1972) showed a lack of car
bon black filling of the vessels in the core of the infarct
despite a recanalized MCA. It is possible that in our
study the use of heparin may have contributed to im
proved microcirculation by restricting capillary
obstructing polymorphonuclear leukocytes, thereby lim
iting a no-reflow phenomenon, and have thus resulted in
small infarcts (del Zoppo et aI. , 1991; Okada et aI.,
1994).
In the highest-OEF region, the average CBF remained above the penumbral range and the average CMR02 was
not significantly reduced at any time during the occlu
sion. This profile, which confirms with the definition of
"oligemia" rather than true "ischemia" (Lassen, 1990;
Baron, 1991), would be compatible with the consistently
good tissue outcome. This moderate reduction in perfu
sion in the cortical area presumably reflects an efficient
collateral supply-although our "snapshot" measure
ment may have missed initially more pronounced hy
poperfusion. In contrast, the ultimately infarcted area ini
tially exhibited significantly lower rCBF values at all times after occlusion than the highest-OEF area and the
rCMR02 was likewise significantly reduced (Tables 3
and 5). Nevertheless, at the individual level (Fig. 5b),
significant hypometabolism did develop in the highest
OEF area (MCAO + 4 h) in two of our baboons. This
finding is consistent with the work of Pappata et aI.
( 1993), who also reported progressive metabolic deterio
ration in two of five baboons in the highest-OEF area.
Thus, because oligemic tissue is hypoxic, it may dete
riorate over time and reperfusion may have saved it fur
ther deterioration and possibly even infarction.
The initial reduction in rCBF in the infarct-to-be re
gion was on average only -40% relative to the preocclu
sion measurement with an absolute value around 25 ml
100 g- l min- 1 (Table 3; Fig. 6a). This value is higher
than would be expected based on previously established
thresholds for infarction (Astrup et aI., 1981; Jones et aI.,
1981; Lassen, 1990), but it may have been overestimated
due to the small infarct size relative to the spatial resolution of the PET camera.
The coupled reduction in both rCBF and rCMR02 that
affects the highest-OEF area in the chronic stage might
be explained by two different, though possibly associ
ated, phenomena: "incomplete infarction, " unnoticed on
chronic-stage MRI scans (We iller et aI. , 1993; Garcia et
aI., 1995; Nakagawara et aI. , 1995); and a diaschisis
phenomenon as a result of a deep-seated infarct (Feeney
and Baron, 1986; Baron, 1989; Sette et aI., 1993). There is some evidence that selective, partial neuronal loss may
TRANSIENT MeA 0 IN ANESTHETIZED BABOONS 1187
affect penumbral areas in the cat (Mies et aI., 1983;
Strong et aI., 1983). However, studies on human post
mortem material indicate neuronal loss only exception
ally extends more than a few millimeters from the borders of the established infarct (Nedergaard et aI., 1986;
Torvik and Svindland, 1986; Nedergaard, 1988). Fur
thermore, the lack of significant CMR02 reduction in the
highest-OEF area of the baboons in Group 2 (Fig. 7)
would speak strongly in favor of the "diaschisis" mechanism, as the selective neuronal loss mechanism, if
any, should have affected both groups in the same man
ner.
In conclusion, following MCAO, the region that
shows an early maximal increase in the OEF is both topographically and physiologically distinct from the re
gion with final consolidated infarction if reperfusion is allowed at 6 h. This high OEF, although indicative of a
threatened condition, is not an indicator of inescapable
consolidated infarction and is thus a situation in which
therapy could be envisaged. Whether or not it is at risk of
infarction and thus constitutes one target for therapy re
mains to be seen.
Acknowledgment: We thank Mr. C. Le Poec and Mr. P. Lochon of the Cyclotron Unit at Cyceron and Ms. N. Ravenel and Mr. V. Beaudouin of the Computer Department. A special mention to Mr. G. Huguet for his assistance with the care of the animals and to Ms. A. Brocquehaye for her technical expertise. We are also most grateful to the radiographers of the University Hospital of Caen, in particular Mr. Dominique Luet, for assistance with the MRI scanning procedures.
REFERENCES
Ackennan RH, Lev MH. Mackay BC, Katz PM, Babikian VL. Alpert NM, Correia JA, Panagos PD. Senda M ( 1 989) PET studies in acute stroke: findings and relevance to therapy . .I Cereb Blood Flow Metab 9 (suppl I): S359
Andrews RJ (1991) Transhemispheric diaschisis. A review and comment. Stroke 22:943-949
Astrup J, Siesjii BK. Symon L (1981) Thresholds in cerebral ischemia-the ischemic penumbra. Stroke 12:723-725
Baron JC (1989) Depression of energy metabolism in distant brain structures : studies with positron emission tomography in stroke patients. Semin Neurol 9:281-285
Baron JC (199 1 ) Pathophysiology of acute cerebral ischemia: PET studies in humans. Cerebrovasc Dis I (suppl 1 ) :22-31
Baron JC, Samson Y, Pantano p. Chiras J. Derouesne C, Bousser MG (1987) Interrelationships of local CBF, OEF. and CMR02 in ischemic areas with variable outcome: further PET studies in humans. .I Cereh Blood Flow Metab 7 (suppl 1) : S41
Baron JC, Frackowiak RSJ, Herholz K, Jones T, Lammertsma AA, Mazoyer B, Wienhard K (1989) Use of PET methods for measurement of cerebral energy metabolism and hemodynamics in cerebrovascular disease . .I Cereb Blood Flow Metab 9:723-742
Brott T, Marler JR. Olinger CP, Adams HP, Tomsick T. Barsan WG, Biller J. Eberle R, Hertzberg V, Walker M ( 1 989) Measurements of acute cerebral infarction: lesion size by computed tomography. Stroke 20:871-875
Crowell RM, Olsson Y (1972) Impaired microvascular filling after focal cerebral ischemia in monkeys . .I Neurosurg 36:303-309
Crowell RM, Marcoux FW, DeGirolami U ( 1 981) Variability and reversibility of focal cerebral ischemia in unanesthetized monkeys. Neurology 31: 1 295-1302
del Zoppo GJ, Schmid-Schonbein GW, Mori E, Copeland BR, Chang C-M ( 1 991) Polymorphonuclear leukocytes occlude capillaries following middle cerebral artery occlusion and reperfusion in baboons. Stroke 22:1276- 1 283
Feenev DM, Baron J-C (1986) Diaschisis . Stroke 17: 8 1 7-830 Fieschi C, Argentino C, Lenzi GL, Sacchetti ML, Toni D. Bozzao L
( 1 989) Clinical and instrumental evaluation of patients with ischemic stroke within the first six hours . .I Neurol Sci 91:311-322
Frackowiak RSJ, Lammertsma AA ( 1 985) Clinical measurement of cerebral blood now and oxygen consumption. Tn : Positron Emission Tomography (Reivich M, Alavi A, eds), New York, Liss, pp 1 53- 1 8 1
Frackowiak RSJ, Lenzi G-L, Jones T, Heather JD (1980) Quantitative measurement of regional cerebral blood now and oxygen metabolism in man using 1 50 and positron emission tomography: theory, procedure, and normal values . .I Comput Assist Tomogr 4:727-736
Furlan M. Marchal G, Beaudouin V, Ravenel N, Rioux P, Courtheoux P, Viader F, Derlon JM, Baron JC (1994) The mechanisms of early neurological recovery after acute ischemic stroke (AIS) : PET evidence of penumbral tissue (PT) in humans. Neurology 44 (suppl 2) :1102P
Garcia JH, Liu K-F, MacKenzie ET, Lassen NA. Baron JC (1995) Incomplete and complete brain infarcts in baboons with middle cerebral artery (MCA) occlusion. Cerebrovasc Dis 5 :235
Heiss W-D, Graf R, Wienhard K. Liittgen J, Saito R, Fujita T, Rosner G. Wagner R (1994) Dynamic penumbra demonstrated by sequential multitracer PET after middle cerebral artery occlusion in cats. .I Cereb Blood Flow Metab 14:892-902
Hudgins WR, Garcia JH ( 1 970) Transorbital approach to the middle cerebral artery of the squirrel monkey: a technique for experimental cerebral infarction applicable to ultrastructural studies. Stroke 1 : 1 07- 1 1 1
Jones TH, Morawetz RB, Crowell RM, Marcoux FW, FitzGibbon SJ, DeGirolami U. Ojemann RG ( 1 981) Thresholds of focal cerebral ischemia in awake monkeys . .I Neurosurg 54:773-782
Lassen NA ( 1 990) Pathophysiology of brain ischemia as it relates to the therapy of acute ischemic stroke. Clin Neuropharmacol 1 3 (suppl 3): SI-S8
Lenzi GL, Frackowiak RSJ, Jones T ( 1 982) Cerebral oxygen metabolism and blood now in human cerebral ischemic infarction . .I Cereb Blood Flow Metab 2:321-335
Marchal G, Serrati C, Rioux P, Petit-Taboue MC, Viader F. de la Sayette V, Le Doze F. Lochon P, Derlon JM, Orgogozo JM, Baron JC (1993) PET imaging of cerebral perfusion and oxygen consumption in acute ischaemic stroke: relation to outcome. Lancet 341 :2--4
Marinkovic SV, Milisavljevic MM, Kovacevic M S, Stevie ZD (1985) Perforating branches of the middle cerebral artery. Microanatomy and clinical significance of their intracerebral segments. Stroke 16: 1 022-1029
Mazoyer B, Trebossen R, Schoukroun C, Verry B. Syrota A, Vacher J . Lemasson p. Monnet 0, Bouvier A; Lecomte JL ( 1 990) Physical characteristics of TTV03, a new high spatial resolution time-ofnight positron tomograph. IEEE Trans Nucl Sci 37:778-782
Meier-Ruge W, Brunder A, Theodore D (1992) Histochemical and morphometric investigation of the pathogenesis of acute brain infarction. Acta Histochem 42 (suppl 1) :S59-S70
Michenfelder JD. Milde JH (1990) Postischemic canine cerebral blood tlow appears to be determined by cerebral metabolic needs . .I Cereb Blood Flow Metab 10:71-76
Mies G, Auer LM, Ebhardt G, Traupe H, Heiss W-D (1983) Flow and neuronal density in tissue surrounding chronic infarction. Stroke 14:22-27
Monsein LH, Mathews VP, Barker PB, Pardo CA, Blackband SJ, Whitlow WD, Wong DF, Bryan RN (1993) Irreversible regional cerebral ischemia: serial MR imaging and proton MR spectroscopy in a nonhuman primate model. A.lNR 14:963-970
Nakagawara J, Sperling B, Takeda R, Suematsu K, Nakamura J, Lassen NA (1995) Incomplete brain infarction of early reperfused, CTI MRT intact cortex in embolic stroke: in vivo evidence by 1 231_ iomazenil SPECT . .I Cereb Blood Flow Metab 15 (suppl 1):S131
Nedergaard M (1988) Mechanisms of brain damage in focal cerebral ischemia. Acta Neurol Scand 77:3-23
J Cereb Blood Flow Metab, Vol. 16. No. 6. 1996
1188 A. R. YOUNG ET AL.
Nedergaard M. Vorstrup S, Astrup J (1986) Cell density in the border zone around old small human brain infarcts. Stroke 17 : 1129-1137
Okada Y, Copeland BR, Fitridge R, Koziol JA, del Zoppo GJ (1994) Fibrin contributes to microvascular obstructions and parenchymal changes during early focal cerebral ischemia and reperfusion. Stroke 25:1847-1853
Pappata S, Fiorelli M, Rommel T, Hartmann A, Dettmers C, Yamaguchi T, Chabriat H, Poline JB, Crouzel C, Di Giamberardino L. Baron JC (1993) PET study of changes in local brain hemodynamics and oxygen metabolism after unilateral middle cerebral artery occlusion in baboons. J Cereb Blood Flow Metab 13:416--424
Plets C (1981) Macroscopic and microscopic anatomy of cerebral circulation. In : Cerebral Blood Flow: Basic Knowledge and Clinical Implications (Minderhound 1M , ed) , Amsterdam , Excerpta Medica, pp 1-19
Powers WJ, Grubb RL, Baker RP, Mintun MA , Raichle ME ( 1 985) Regional cerebral blood flow and metabolism in reversible ischemia due to vasospasm. J Neurosurg 62:539-546
Riche D, Christolomme A, Bert 1. Naquet R ( 1 968) Atlas Stereotaxique du Cerveau de Babouin (Papio papio) . Paris, Editions du C.N.R . S.
Riche D, Hantraye P, Guibert B, Naquet R, Loc 'h C, Maziere B. Maziere M (1988) Anatomical atlas of the baboon's brain in the orbito-meatal plane used in experimental positron emission tomography. Brain Res Bull 20:283-301
Sette G. Baron lC. Mazoyer B. Levasseur M. Pappata S, Crouzel C (1989) Local brain haemodynamics and oxygen metabolism in cerebrovascular disease. Positron emission tomography. Brain 112:931-951
Sette G, Baron 1-C, Young AR, Miyazawa H, Tillet I, Barre L, Travere 1-M, Derlon J-M, MacKenzie ET (1993) In vivo mapping of brain benzodiazepine receptor changes by positron emission tomography after focal ischemia in the anesthetized baboon. Stroke 24:2046-2057
Spetzler RF, Zabramski JM, Kaufman B. Yeung HN (1983) Acute NMR changes during MCA occlusion: a preliminary study in primates. Stroke 14: 185-191
J Cereb Blood Flow Metab, Vol. 16. No.6, 1996
Strong Al. Tomlinson BE. Venables GS. Gibson G. Hardy JA (1983) The cortical ischaemic penumbra associated with occlusion of the middle cerebral artery in the cat : 2. Studies of histopathology, water content, and in vitro neurotransmitter uptake. J Cereb Blood
Flow Metab 3:97-108
Tenjin H, Ueda S, Mizukawa N, Imahori Y, Hino A, Ohmori Y, Yasukochi K, Nakahashi H, Wakita K, Horii H, Fujii R (1992) Positron emission tomographic measurement of acute hemodynamic changes in primate middle cerebral artery occlusion. Neurol Med
ChiI' (To/C}'o) 32:805-810
Torvik A, Svindland A (1986) Is there a transitional zone between brain infarcts and the surrounding brain? A histological study. Acta Neu
rol Scand 74:365-370
Touzani 0, Young AR, Derlon J-M, Beaudouin V, Marchal G, Rioux P, Mezenge F, Baron J-C, MacKenzie ET (1995) Sequential studies of severely hypometabolic tissue volumes after permanent middle cerebral artery occlusion. A positron emission tomographic investigation in anesthetized baboons. Stroke 26:2112-2119
Weiller C, Willmes K, Reiche W, Thron A, Isensee C, Buell U, Ringel stein EB (1993) The case of aphasia or neglect after striatocapsular infarction. Brain 116: 1509-1525
Wise RJS. Bernardi S, Frackowiak RSJ. Lcgg NJ, Jones T (1983) Serial observations on the pathophysiology of acute stroke. The transition from ischaemia to infarction as reflected in regional oxygen extraction. Brain 1 06: 1 97-222
Yonas H, Gur D, Claassen D, Wolfson SK. Moossy J (1988) Stable xenon enhanced computed tomography in the study of clinical and pathologic correlates of focal ischemia in baboons. Stroke 19:228-238
Young AR, Touzani 0, Baron J-C, Mezenge F, Derlon J-M, MacKenzie ET (1995) To reperfllse or not to reperfusc? Quantitative infarct volumes after middle cerebral artery occlusion in the baboon. J Cereb Blood Flow Metab 15 (suppl 1):Sn
Related Documents