Accepted Manuscript Relationships between biomarkers and left ventricular filling pressures at rest and during exercise in patients after myocardial infarction Mads J. Andersen, MD, PhD Mads Ersbøll, MD, PhD John Bro-Jeppesen, MD, PhD Jacob E. Møller, MD, PhD, DMSc Christian Hassager, MD, DMSc Lars Køber, MD, DMSc Barry A. Borlaug, MD Jens P. Goetze, MD, DMSc Finn Gustafsson, MD, PhD, DMSc PII: S1071-9164(14)01222-6 DOI: 10.1016/j.cardfail.2014.09.012 Reference: YJCAF 3416 To appear in: Journal of Cardiac Failure Received Date: 23 May 2014 Revised Date: 19 September 2014 Accepted Date: 29 September 2014 Please cite this article as: Andersen MJ, Ersbøll M, Bro-Jeppesen J, Møller JE, Hassager C, Køber L, Borlaug BA, Goetze JP, Gustafsson F, Relationships between biomarkers and left ventricular filling pressures at rest and during exercise in patients after myocardial infarction, Journal of Cardiac Failure (2014), doi: 10.1016/j.cardfail.2014.09.012. This is a PDF file of an unedited manuscript that has been accepted for publication. As a service to our customers we are providing this early version of the manuscript. The manuscript will undergo copyediting, typesetting, and review of the resulting proof before it is published in its final form. Please note that during the production process errors may be discovered which could affect the content, and all legal disclaimers that apply to the journal pertain.

Welcome message from author
This document is posted to help you gain knowledge. Please leave a comment to let me know what you think about it! Share it to your friends and learn new things together.
Transcript
Accepted Manuscript
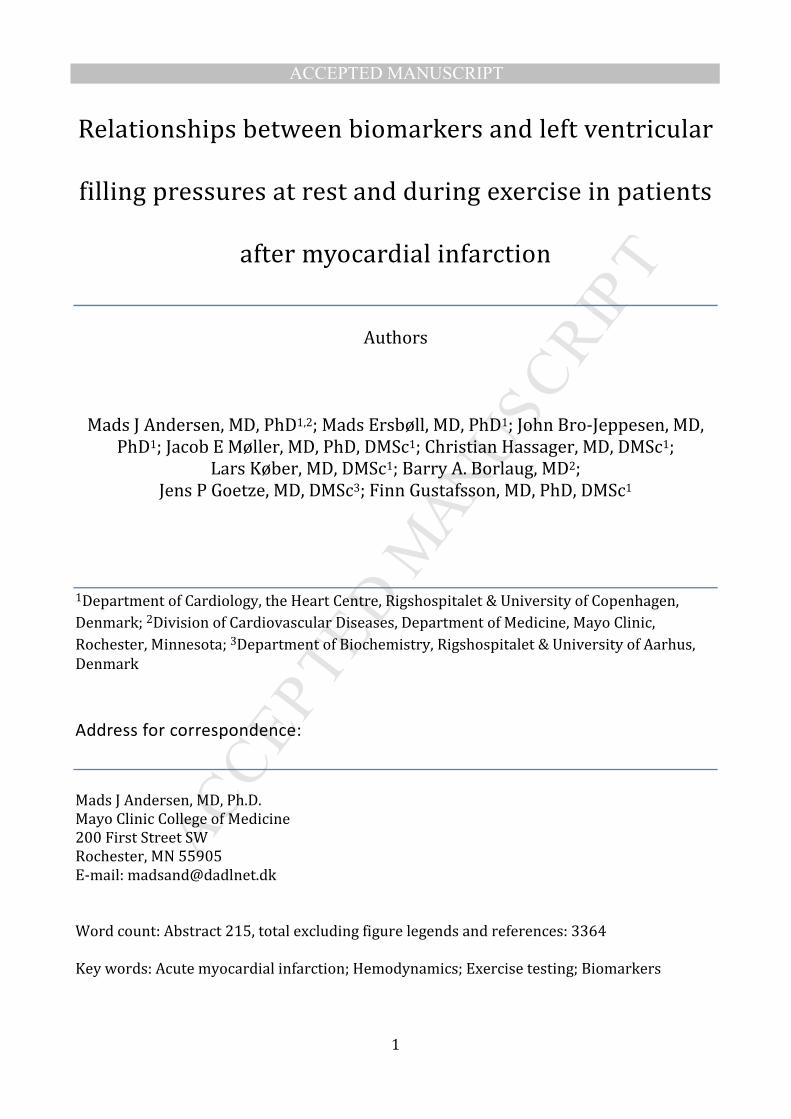
Relationships between biomarkers and left ventricular filling pressures at rest andduring exercise in patients after myocardial infarction
Mads J. Andersen, MD, PhD Mads Ersbøll, MD, PhD John Bro-Jeppesen, MD, PhDJacob E. Møller, MD, PhD, DMSc Christian Hassager, MD, DMSc Lars Køber, MD,DMSc Barry A. Borlaug, MD Jens P. Goetze, MD, DMSc Finn Gustafsson, MD, PhD,DMSc
PII: S1071-9164(14)01222-6
DOI: 10.1016/j.cardfail.2014.09.012
Reference: YJCAF 3416
To appear in: Journal of Cardiac Failure
Received Date: 23 May 2014
Revised Date: 19 September 2014
Accepted Date: 29 September 2014
Please cite this article as: Andersen MJ, Ersbøll M, Bro-Jeppesen J, Møller JE, Hassager C, KøberL, Borlaug BA, Goetze JP, Gustafsson F, Relationships between biomarkers and left ventricular fillingpressures at rest and during exercise in patients after myocardial infarction, Journal of Cardiac Failure(2014), doi: 10.1016/j.cardfail.2014.09.012.
This is a PDF file of an unedited manuscript that has been accepted for publication. As a service toour customers we are providing this early version of the manuscript. The manuscript will undergocopyediting, typesetting, and review of the resulting proof before it is published in its final form. Pleasenote that during the production process errors may be discovered which could affect the content, and alllegal disclaimers that apply to the journal pertain.
MANUSCRIP
T
ACCEPTED
ACCEPTED MANUSCRIPT
1
Relationships between biomarkers and left ventricular
filling pressures at rest and during exercise in patients
after myocardial infarction
Authors
Mads J Andersen, MD, PhD1,2; Mads Ersbøll, MD, PhD1; John Bro-Jeppesen, MD,
PhD1; Jacob E Møller, MD, PhD, DMSc1; Christian Hassager, MD, DMSc1;
Lars Køber, MD, DMSc1; Barry A. Borlaug, MD2;
Jens P Goetze, MD, DMSc3; Finn Gustafsson, MD, PhD, DMSc1
1Department of Cardiology, the Heart Centre, Rigshospitalet & University of Copenhagen,
Denmark; 2Division of Cardiovascular Diseases, Department of Medicine, Mayo Clinic,
Rochester, Minnesota; 3Department of Biochemistry, Rigshospitalet & University of Aarhus,
Denmark
Address for correspondence:
Mads J Andersen, MD, Ph.D.
Mayo Clinic College of Medicine
200 First Street SW
Rochester, MN 55905
E-mail: [email protected]
Word count: Abstract 215, total excluding figure legends and references: 3364
Key words: Acute myocardial infarction; Hemodynamics; Exercise testing; Biomarkers
MANUSCRIP
T
ACCEPTED
ACCEPTED MANUSCRIPT
2
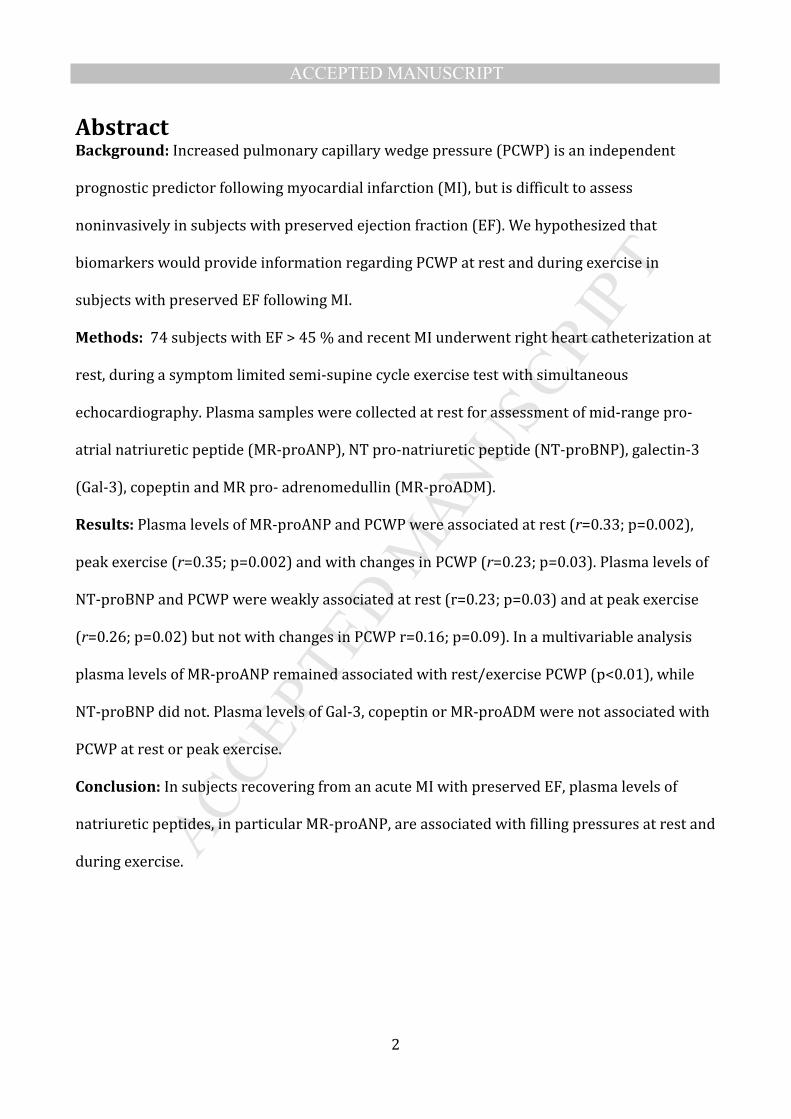
Abstract Background: Increased pulmonary capillary wedge pressure (PCWP) is an independent
prognostic predictor following myocardial infarction (MI), but is difficult to assess
noninvasively in subjects with preserved ejection fraction (EF). We hypothesized that
biomarkers would provide information regarding PCWP at rest and during exercise in
subjects with preserved EF following MI.
Methods: 74 subjects with EF > 45 % and recent MI underwent right heart catheterization at
rest, during a symptom limited semi-supine cycle exercise test with simultaneous
echocardiography. Plasma samples were collected at rest for assessment of mid-range pro-
atrial natriuretic peptide (MR-proANP), NT pro-natriuretic peptide (NT-proBNP), galectin-3
(Gal-3), copeptin and MR pro- adrenomedullin (MR-proADM).
Results: Plasma levels of MR-proANP and PCWP were associated at rest (r=0.33; p=0.002),
peak exercise (r=0.35; p=0.002) and with changes in PCWP (r=0.23; p=0.03). Plasma levels of
NT-proBNP and PCWP were weakly associated at rest (r=0.23; p=0.03) and at peak exercise
(r=0.26; p=0.02) but not with changes in PCWP r=0.16; p=0.09). In a multivariable analysis
plasma levels of MR-proANP remained associated with rest/exercise PCWP (p<0.01), while
NT-proBNP did not. Plasma levels of Gal-3, copeptin or MR-proADM were not associated with
PCWP at rest or peak exercise.
Conclusion: In subjects recovering from an acute MI with preserved EF, plasma levels of
natriuretic peptides, in particular MR-proANP, are associated with filling pressures at rest and
during exercise.
MANUSCRIP
T
ACCEPTED
ACCEPTED MANUSCRIPT
3
Introduction Increased filling pressures independently predict outcome following myocardial
infarction (MI).(1, 2) However, invasive hemodynamic testing is expensive and carries risk of
complications. When left ventricular (LV) ejection fraction (LVEF) is preserved (>45%) non-
invasive demonstration of elevated filling pressure is particularly challenging. Recent
recommendations suggest using the quotient of peak early mitral inflow velocity (E) and peak
early diastolic tissue Doppler velocity in the mitral annulus (e’) which have showed modest
association with invasive obtained filling pressure in most studies(3, 4) but not all.(5)
European guidelines suggest that filling pressures are increased when E/e’ is above 15.(6)
Accordingly studies have demonstrated that echocardiographic indices suggestive of
increased LV filling pressure and pulmonary hypertension are associated with worse outcome
following MI,(7-11), but ~ 25% of subjects with preserved LVEF following MI have E/e’ values
in the intermediate range (8-15) where the association with filling pressure is less clear.(12,
13)
Subjects with heart failure and preserved ejection fraction (HFpEF) (14) and post
MI subjects with preserved LVEF and diastolic dysfunction (13, 15) are prone to elevation in
pulmonary capillary wedge pressure (PCWP) during exercise in relation to limitations in LV
diastolic reserve, but identifying these vulnerable subjects requires invasive assessment. The
ability to non-invasively identify subjects with compromised resting or exercise
hemodynamics has gained increasing interest due to development of experimental therapies
aiming at reducing LV filling pressures.(14, 16)
Natriuretic peptides (N-terminal pro-B-type natriuretic peptide, NT-proBNP;
mid-regional pro-A-type natriuretic peptide, MR-proANP) are released in response to
increases in wall stress (17, 18), but little is known about these correlations with filling
MANUSCRIP
T
ACCEPTED
ACCEPTED MANUSCRIPT
4
pressures during exercise. In addition, other candidate biomarkers have been related to filling
pressures, including galectin-3, copeptin and mid-regional proadrenomedullin (MR-proADM),
but comparative data with directly-measured filling pressures is lacking. We hypothesized
that plasma concentrations of these biomarkers would identify subjects with increased filling
pressures at rest or during exercise in post MI subjects with preserved LVEF.
Methods Study design and patient population
We enrolled 80 post MI subjects with preserved LVEF (> 45 %) who all
underwent right heart catheterization at rest and during symptom limited semi-supine cycle
exercise test with simultaneous echocardiography. Inclusion criteria were preserved LVEF
and written informed consent. Subjects with permanent atrial fibrillation, known history of
cardiomyopathy, more than mild valvular heart disease (>mild stenosis or regurgitation),
obstructive or restrictive pulmonary disease and inability to perform exercise testing were
excluded. The majority (70) were post MI subjects with echocardiographic signs of diastolic
dysfunction (E/e’ > 8 and LA > 32ml/m2; MI+DD) and 10 post MI subjects had normal
diastolic function as judged by echocardiography (E/e’ < 8 and LA < 32 ml/m2; MI-DD).
Hemodynamic and echocardiographic data for these subjects has been previously published
(12, 15). Subjects were studied on chronic medications in the fasted state. The subjects were
stratified in a binary fashion using peak exercise PCWP > 25 mmHg as cutoff for abnormal
filling pressure with exercise.(14) The ethics committee in Region Hovedstaden approved the
study and written informed consent was obtained from all subjects.

MANUSCRIP
T
ACCEPTED
ACCEPTED MANUSCRIPT
5
Invasive hemodynamic measurements
Right heart catheterization was performed using a standard 7.5-F triple lumen
Swan-Ganz thermistor and balloon-tipped catheter (Edwards Lifesciences, Irvine, California,
USA). The catheter was introduced guided by ultrasound into the right internal jugular vein
and advanced to the pulmonary artery. PCWP, right atrial pressure (RAP), systolic pulmonary
artery pressure (PAP), diastolic PAP, mean PAP, blood pressure (BP) and cardiac output (CO,
thermodilution technique) were measured at rest, at each level of exercise until exhaustion,
and after 5 min of rest. PCWP at rest and post exercise was measured at end-expiration.
During exercise a mean PCWP was used. We considered resting PCWP>15 mmHg and/or
exercise PCWP > 25 mmHg to be abnormally increased.(14)
Exercise protocol
Subjects performed a multistage symptom-limited semi supine cycle exercise test
using an Echo Cardiac Stress Table (Lode B.V., the Netherlands). Workload started at 0 watts
and was increased by 25 watts every 2 min. Subjects were encouraged to maintain a fixed
pedaling speed of 60 RPM for the duration of the exercise. They were also encouraged to
exercise until exhaustion (Borg >18).
Echocardiography
All subjects underwent resting echocardiographic examinations obtained
according to current guidelines.(19, 20) During exercise 2-dimensional (2D), tissue Doppler
images (TDI) and pulsed - and continuous wave Doppler images were acquired in the apical 4
chamber view. All examinations were performed by an experienced echocardiographer using
a Philips iE33 (Philips Healthcare, Best, the Netherlands) cardiac ultrasound system.

MANUSCRIP
T
ACCEPTED
ACCEPTED MANUSCRIPT
6
Echocardiographic cine loops were obtained by recording a minimum of 3 consecutive heart
cycles. Images were stored digitally for offline analysis using Philips Xcelera analysis software
version 3.1 (Philips Healthcare, Best, the Netherlands).
LV volumes and LVEF were assessed using Simpson’s biplane method of discs
from the apical 4 and 2 chamber views at rest. LA volume was measured from the apical 4-
and 2-chamber views using Area-Length method at rest. Volumes were indexed to body
surface area (BSA) when appropriate. Using pulsed wave (PW) Doppler E velocities were
measured with the sample volume placed at the tips of mitral leaflets during diastole. Using
TDI and PW Doppler with the sample volume placed in the septal and lateral mitral annulus e’
velocities were measured and averaged.(4)
For Doppler recordings horizontal sweep was of 75 or 100 mm/s and 3-5
consecutive beats were used and averaged. All analyses were performed blinded to
hemodynamic and biomarker values.
Biomarkers
Plasma samples were collected at rest from the internal jugular vein after
positioning of the Swan-Ganz catheter prior to exercise. Plasma and serum were collected in
EDTA primed glass tubes, centrifuged for 10 minutes at 3,000 rpm and stored at −80°C until
analysis. Samples underwent ≤2 freeze/thaw cycles before analysis. NT-proBNP was
measured on the Modular E platform (Roche Diagnostics) with lower limit of detection (LOD)
at 25 pg/ml and interassay coefficient of variation (CV) of 12.6% at 29.2 pg/ml and 9.6% at
8.5 pg/ml.(21) Plasma concentrations of Copeptin were measured on the automated Kryptor
Plus platform (Thermo-Fischer, Waltham, MA, USA). The interassay CVs were 18.3% for 1.4
pmol/L, 6.8% for 9.3 pmol/L, and less than 3% for concentrations >18 pmol/L.(22) The
MANUSCRIP
T
ACCEPTED
ACCEPTED MANUSCRIPT
7
automated Kryptor Plus platform was also used to quantify the plasma levels of MR-proADM
(LOD of 0.08 nmol/L and CV was <20% for values >0.12nmol/L) and MR-proANP (LOD of the
assay is 6.0 pmol/L and CV was 10%). (22-24) Galectin-3 was measured on a VIDAS platform
(Biomérieux, Denmark) with a LOD of 1.13 ng/ml and interassay CV < 10.4%.(25)
Statistical analysis
Data are presented as mean ± standard deviation (SD) for Gaussian distributed
or median (interquartile range, IQR) for non-Gaussian distributed variables unless otherwise
indicated. Between group differences were tested using Student's t-test, χ2 or non-parametric
rank sum test where appropriate. Multivariable analysis was performed in a general linear
model and included resting values of LA volume indexed to BSA, E/e’, age and LVEF as
covariates. All biomarkers were log- transformed and PCWP > 25 mmHg at peak exercise and
> 15 mmHg at rest were used as binary cutoffs to create a logistic regression models.
Predictive capability was assessed by comparing C-statistics derived from the area under the
receiver operating characteristic (ROC) curves using the method proposed by deLong et
al.(26) The C-statistics were then compared using a paired t-test. All tests were two-sided, a
P-value < 0.05 was considered significant, and the explained variation of the general linear
model was derived from the global R2 value. Statistical analyses were performed using R
version 3.0.1 (R Development Core Team 2013, http://www.R-project.org/. library: Hmisc,
psych, pROC).
MANUSCRIP
T
ACCEPTED
ACCEPTED MANUSCRIPT
8
Results Of 80 subjects enrolled, six subjects (all MI+DD) were excluded due to missing
blood samples. Thus the total study population consisted of 74 subjects (mean age 62 ± 8
years, 86.5% male) with a recent myocardial infarction (31 days (IQR; 23-43 days) prior to
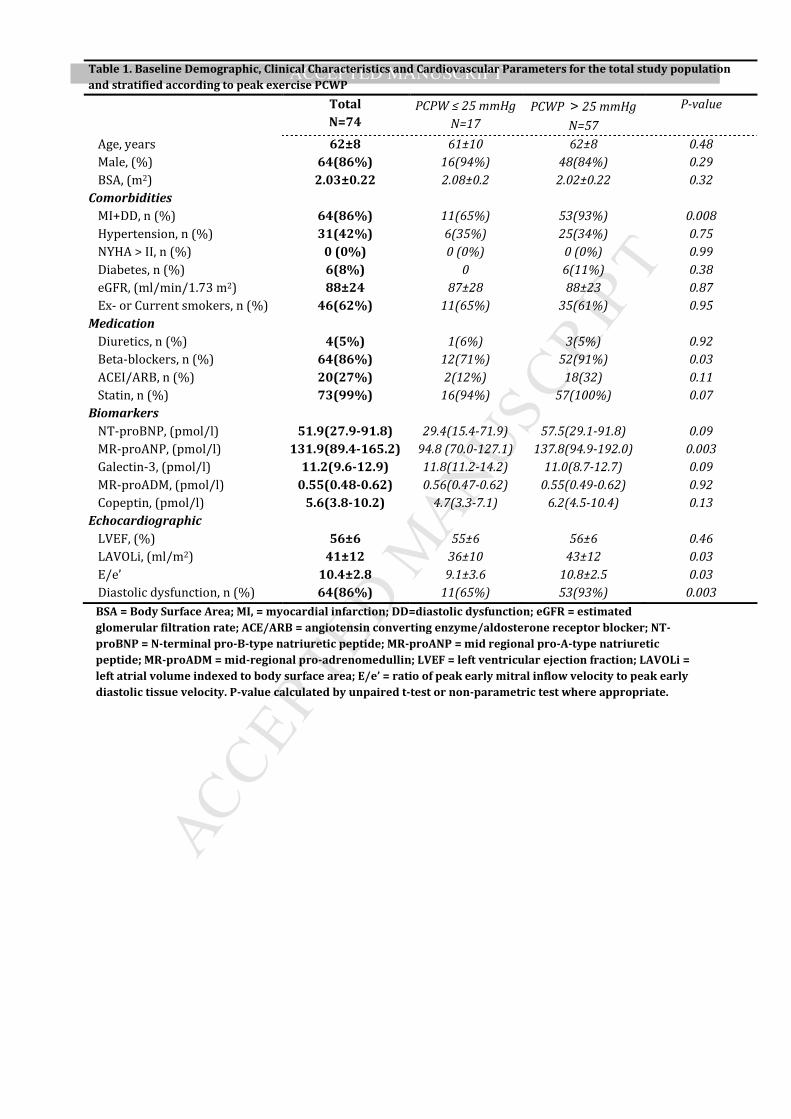
catheterization. Baseline characteristics and demographics are presented in table 1.
Compared to subject with exercise PCWP > 25 mmHg, subjects with exercise PCWP ≤ 25
mmHg had lower use of beta blockers, lower levels of natriuretic peptides, better diastolic
function but similar LVEF and plasma levels of copeptin, MR-proADM and Galectin-3
compared to subjects with exercise PCWP > 25 mmHg. The use of beta blockers was not
associated with increased filling pressure in a logistic regression analysis.
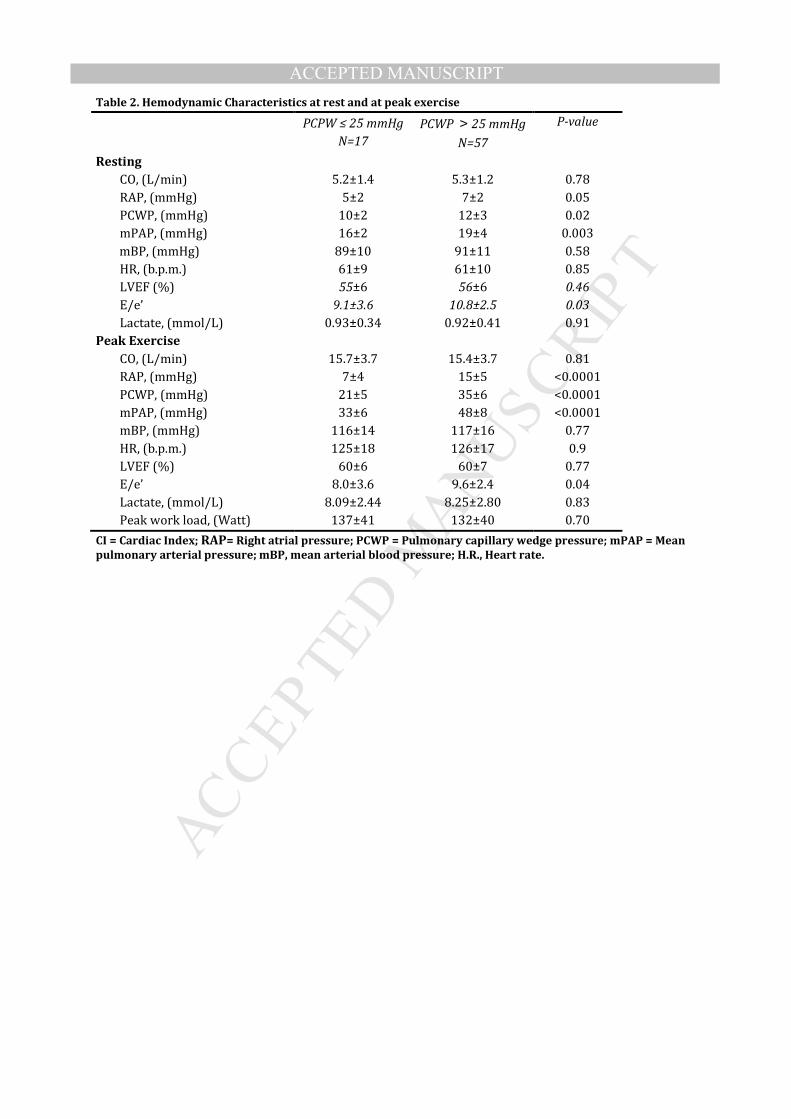
Hemodynamic response to exercise is presented in table 2. All subjects in both
groups exercised to exhaustion (>18 Borg scale) and all significantly increased lactate levels
from rest to peak exercise. During exercise no subjects complained of chest pain, no
significant ischemia was noted on the ECG nor was any regional wall motion abnormality
observed on the simultaneous echocardiography. The hemodynamic response to exercise and
workload achieved were similar in subjects with abnormal and normal exercise PCWP except
for right-sided and PA pressures (table 2).
MR-proANP
The median MR-proANP plasmal levels were significantly higher in MI+DD
compared to MI-DD (136 IQR: 93-188 vs 89 IQR: 65-120, p=0.01). Even larger differences
were seen when comparing subjects with normal and elevated PCWP at peak exercise (Table
1) where the MR-proANP plasma levels in subjects with normal PCWP were 68% (CI 53 –
87%) of the MR-proANP plasma levels of subjects with increased PCWP at peak exercise.
MANUSCRIP
T
ACCEPTED
ACCEPTED MANUSCRIPT
9
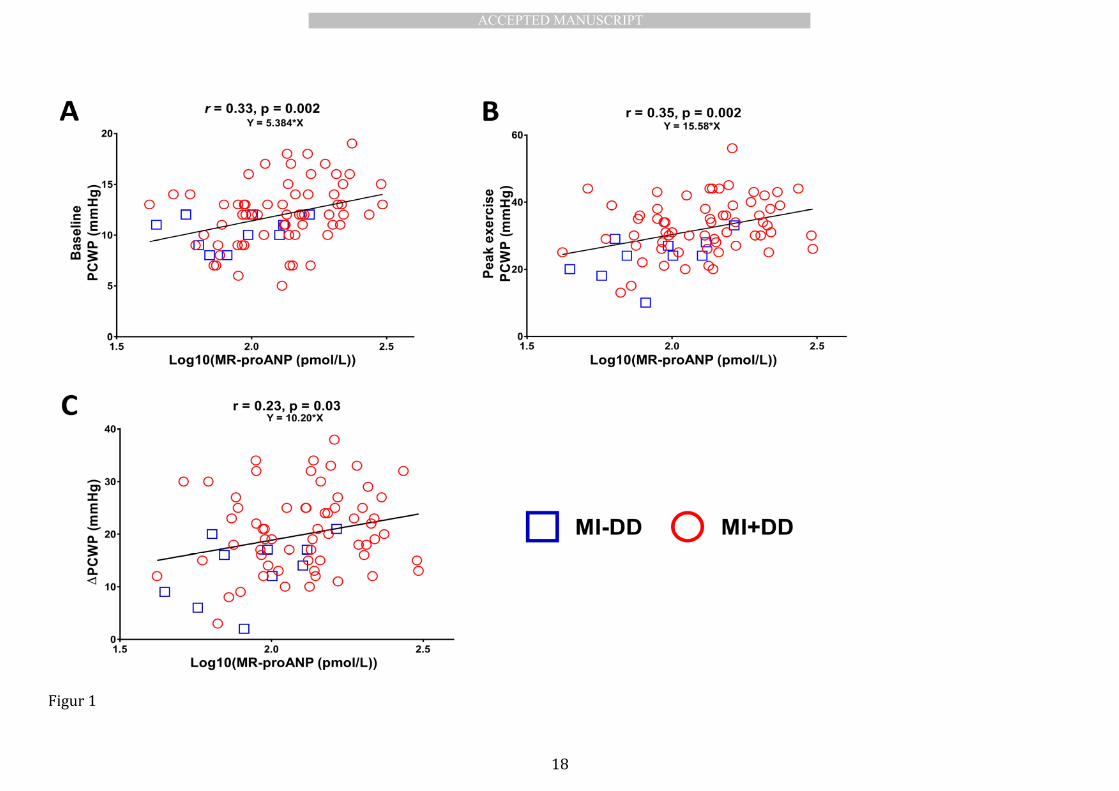
There was a moderate but significant association between MR-proANP and PCWP at rest
(r=0.33; p=0.002), at peak exercise (r=0.35; p=0.002) and with the changes in PCWP from
baseline to peak exercise (r=0.23; p=0.03, Figure 1). Similar association was found between
MR-proANP and E/e’ (r=0.37; p=0.0008) and MR-proANP and LA volume index (r=0.41;
p=0.0002).
There was a significant association between MR-proANP and PCWP in the
multivariable analysis at rest (r=0.60; p=0.003, entire model), at peak exercise (r =0.39,
p=0.04, entire model) but not between changes in MR-proANP and PCWP. Interestingly, MR-
proANP was the only significant variable at peak exercise, superior to echocardiographic
variables (LVEF p=0.71; E/e’ p=0.07, LAvoli p=0.27) and age (p=0.28).
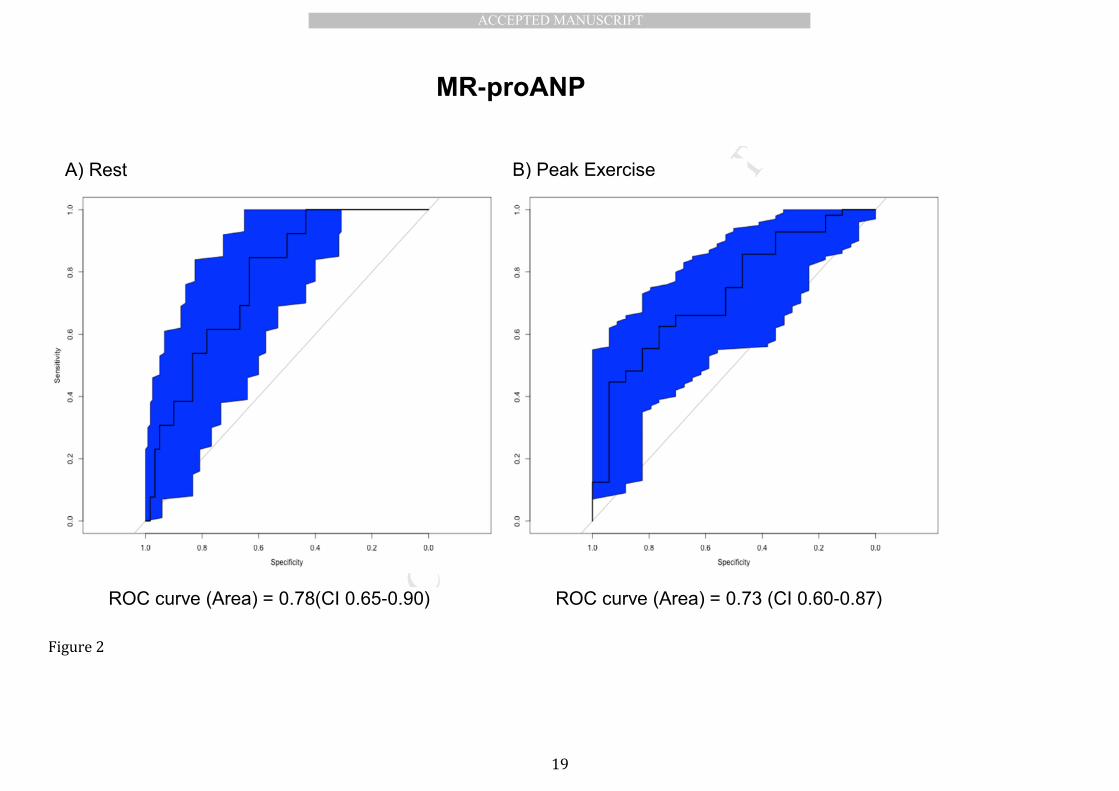
A receiver operating characteristic (ROC) analysis of the ability of MR-proANP to
predict elevated PCWP was evaluated by ROC curve analysis and revealed an area under the
curve (AUC) of 0.78 (CI 0.65 – 0.90) at rest and 0.73 (CI 0.60-0.87) at peak exercise (Figure 2).
Resting MR-proANP levels >140 pmol/L predicted high peak exercise PCWP with 43%
sensitivity and 88% specificity and levels <90 pmol/L predicted peak exercise PCWP ≤ 25
mmHg with 78% sensitivity and 44% specificity.
NT-proBNP
The median NT-proBNP concentration was significantly higher in MI+DD
compared to MI-DD (59 IQR: 29-99 vs 27 IQR: 12-32, p=0.02). However opposed to MR-
proANP plasma levels of NT-proBNP did not differ between subjects with peak PCWP ≤ 25
mmHg and PCWP > 25 mmHg (Table 1). The NT-proBNP plasma levels in subjects with
normal filling pressure were on average 63% (CI 35 – 112%) of the plasma levels in subjects
with elevated filling pressure at peak exercise. Despite, no significant differences between
MANUSCRIP
T
ACCEPTED
ACCEPTED MANUSCRIPT
10
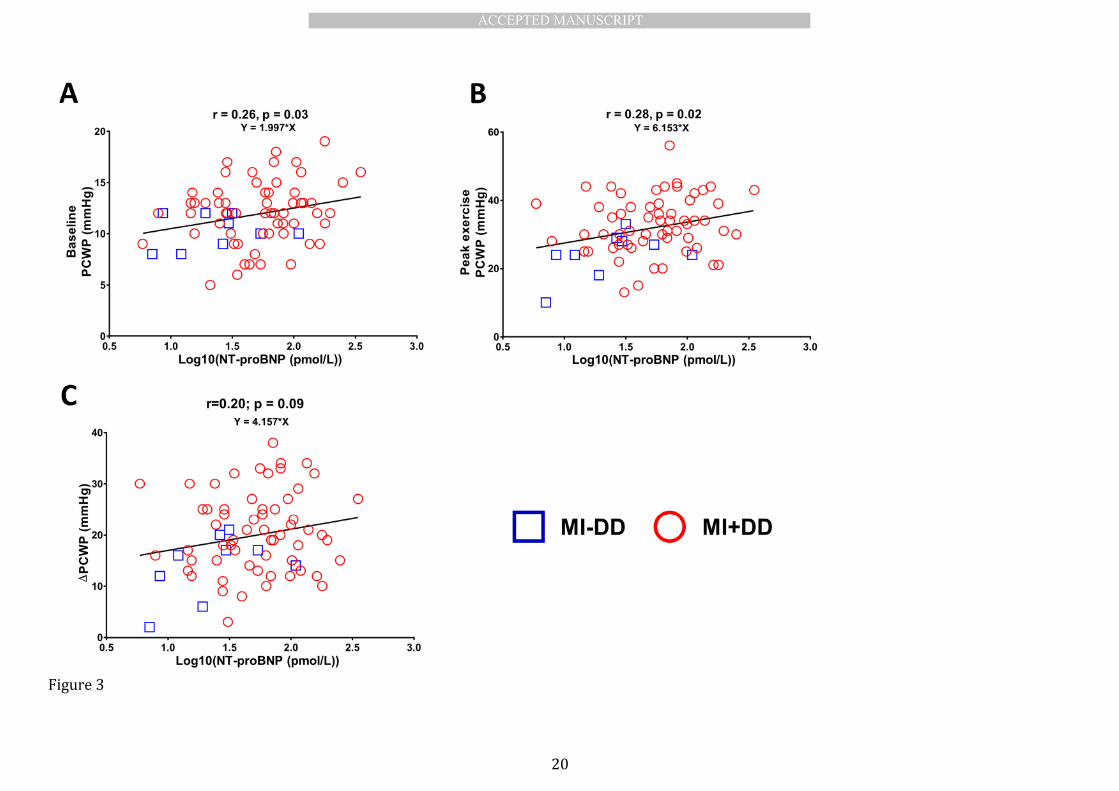
groups, a weak association between NT-proBNP and PCWP was found at rest (r=0.22; p=0.03)
and at peak exercise (r=0.25; p=0.02) but not between changes in PCWP from baseline to peak
exercise (p=0.09) Figure 3. In a multivariable analysis NT-proBNP was no longer associated
with PCWP at rest (p=0.39) or at peak exercise (p=0.29).
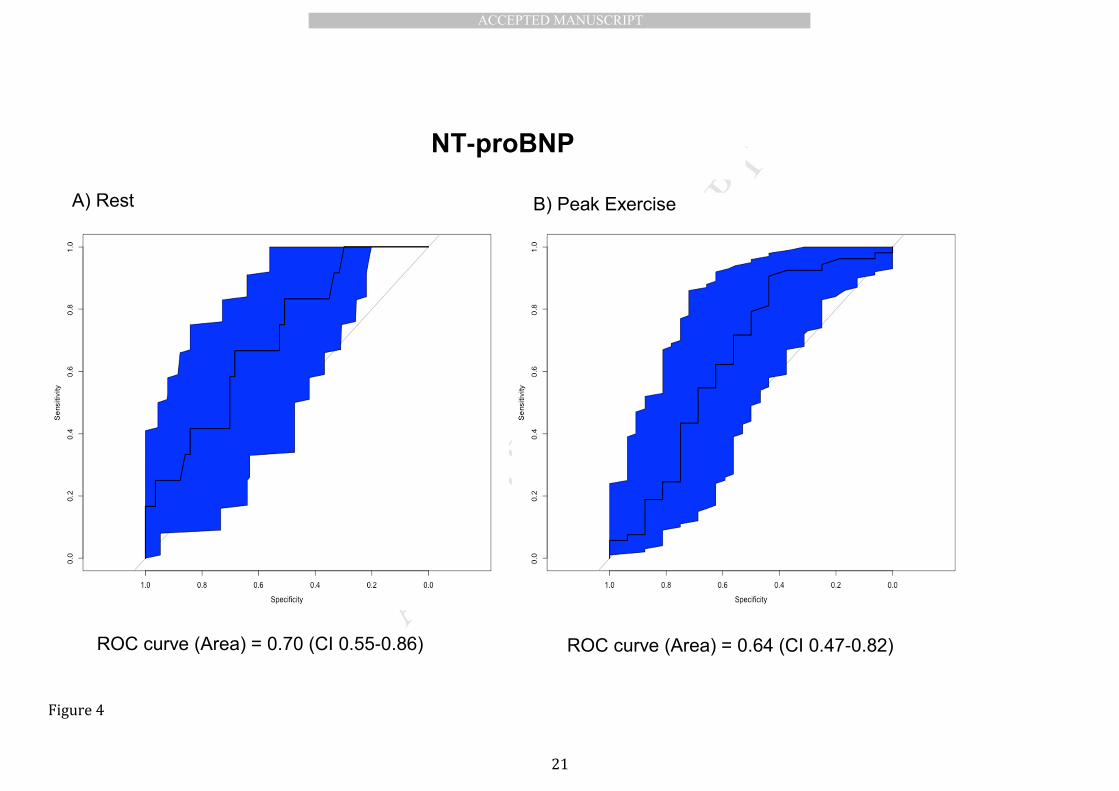
In a ROC analysis of the ability of NT-proBNP to predict elevated PCWP we found
an AUC of 0.70 (0.55-0.86) at rest and 0.64 (0.47-0.82) at peak exercise (figure 4). Despite
poorer AUC there were no significant differences between MR-proANP and NT-proBNP as
predictors of elevated PCWP at rest (0.78 vs 0.70; p=0.24) or with peak exercise (0.73 vs 0.64;
p=0.40).
Copeptin
The median copeptin concentration was significantly higher in subjects with
MI+DD compared to MI-DD (6.4 IQR: 4.4-15.5 vs 3.8 IQR: 3.1-5.3 pmol/l; p=0.03). This seems
unrelated to filling pressure as plasma levels of copeptin did not significantly differ between
subjects with peak PCWP ≤ 25 mmHg and peak PCWP > 25 mmHg (Table 1). The copeptin
plasma levels in subjects with normal filling pressure were on average 73% (CI 49-109%) of
the plasma levels in subjects with elevated filling pressure at peak exercise. There was no
association between copeptin and PCWP at rest (p=0.88), at peak exercise (p=0.24) or with
changes in PCWP (p=0.22).
MR-proADM
The median MR-proADM concentration did not differ between subjects with
MI+DD and MI-DD (p=0.11); similarly plasma concentrations did not differ between subjects
with peak PCWP ≤ 25 mmHg and peak PCWP > 25 mmHg (Table 1). The MR-proADM plasma
MANUSCRIP
T
ACCEPTED
ACCEPTED MANUSCRIPT
11
levels in subjects with normal filling pressure on average were 102% (CI 90% - 116%) of the
plasma levels in subjects with elevated filling pressure at peak exercise. There was no
association between plasma levels of MR-proADM and PCWP at rest (p=0.25), at peak exercise
(p=0.59) or with changes in PCWP (p=0.88).
Galectin-3
The median Gal-3 concentration did not differ between subjects with MI+DD and
MI-DD (p=0.09) similarly there was no difference between subjects with peak PCWP ≤ 25
mmHg and peak PCWP > 25 mmHg (Table 1). The average Gal-3 plasma levels in subjects with
normal filling pressure were 119% (CI 97% - 147%) of the plasma levels in subjects with
elevated filling pressure at peak exercise. There was no association between plasma levels of
Gal-3 and PCWP at rest (p=0.62), peak exercise (p=0.18) or with changes in PCWP (p=0.11).
Discussion This is, to our knowledge, the first study to report associations or lack of
association between MR-proANP, NT-proBNP, Gal-3, copeptin or MR-proADM and LV filling
pressure at rest and during exercise in humans. We found that resting plasma levels of
natriuretic peptides – in particular MR-proANP– were associated with PCWP both at rest and
at peak exercise in subjects with preserved LVEF post myocardial infarction, whereas
copeptin, galectin-3 and pro-adrenomedullin were not predictive of PCWP.
The increase in filling pressure is abrupt and abnormal even with minimal effort
in post MI subjects with diastolic dysfunction and in subjects suffering from HFpEF. (14, 15)
The natriuretic peptides are secreted by cardiomyocytes in response to elevated wall tension,
which varies directly with PCWP and chamber dimension.(17, 18) Prior studies have shown
MANUSCRIP
T
ACCEPTED
ACCEPTED MANUSCRIPT
12
tight correlations between diastolic wall stress and natriuretic peptide levels at rest.(18) As
the majority of time is spent under some form of physical exercise, filling pressure would be
elevated accordingly increasing wall stress. However, it has remained unclear how well
natriuretic peptide levels might reflect PCWP during exercise. We show that natriuretic
peptide plasma levels apart from the association with resting PCWP are reflective of peak
exercise PCWP that MR-proANP is associated with changes in PCWP and that MR-proANP is
the more robust marker as compared to NT-proBNP.
The fact that MR-proANP is a more robust marker of elevated filling pressure
compared to NT-proBNP could be explained by differences in location of secretion of the
natriuretic peptides as MR-proANP is believed to be secreted primarily from the atria and NT-
proBNP primarily from the ventricles. The relative steeper and more rapid exercise induced
increase in atrial pressures in patients with elevated filling pressures could explain the better
association between MR-proANP and PCWP. Similarly, the relative increase in mean blood
pressure did not differ between groups thus explaining the lesser association between NT-
proBNP as only the LA pressures would differ between groups.
While correlations are significant, the AUC indicates that natriuretic peptide
levels may be less helpful in the intermediate range. MR-proANP levels >140 pmol/L were
indicative of high PCWP with exercise, but although the specificity was high (88%) the
sensitivity was low (<50%) which limits the ability of MR-proANP as a sole marker for
increased filling pressure.
MANUSCRIP
T
ACCEPTED
ACCEPTED MANUSCRIPT
13
The lack of association between filling pressures and Galectin-3, Copeptin and MR-
proADM
In recent studies Gal-3 has been related to mortality in patients with acute and
chronic HF and has also been proposed as a novel marker of HFpEF.(27) Galectin is thought to
play an important role in cardiac fibrosis and since cardiac fibrosis is an important
contributor to the pathophysiology of diastolic dysfunction, we hypothesized that the marker
would identify subjects with elevated filling pressure. However, this hypothesis was rejected
by the data. One possible explanation might be that the subjects in the present study had a
recently suffered from a MI, where remodeling with development of scar tissue (fibrosis)
might not be completed. Furthermore, fibrosis is not the sole contributing factor to LV
diastolic dysfunction.
Mid-regional prohormone adrenomedullin (MR-proADM) is another notable
biomarker in HF. MR-proADM is increased in hypertension, chronic renal disease and chronic
HF(28) and has been shown to be an independent predictor of all-cause mortality in stable
outpatients with stage A-D HF.(29) Concurrent with this evidence we found a higher level of
MR-proADM in subjects with MI+DD. Although when comparing MR-proADM levels with peak
exercise PCWP we did not find any association with resting or peak exercise PCWP.
Copeptin, a novel biomarker of arginine vasopressin, has antidiuretic properties
and is a potent vasoconstrictor.(30) Given, the known association between filling pressures
and outcome in HF and the fact that vasopressin blockade in acute HF reduces dyspnea,
lowers PCWP, (31)we speculated that copeptin might be associated with filling pressures.
This hypothesis could not be confirmed in the current study population with early stage heart
failure although this does not preclude an association in more advanced HF.
MANUSCRIP
T
ACCEPTED
ACCEPTED MANUSCRIPT
14
There are several perspectives of the current study. Randomized clinical drug
trials in HFpEF have generally not been able to show any beneficial effects of the tested drug
on morbidity and mortality in HFpEF.(32-36) While lack of efficacy of the tested interventions
may be a likely explanation, the inability to identify and select the optimal candidates for
therapy might also contribute. Most therapies in one way or another have targeted the
common denominator in HFpEF – the elevated filling pressure (at rest or during exercise) –
but most studies did not include measurement of these parameters for practical reasons.
Hence biomarkers that could provide reliable information regarding filling pressure and help
identifying suitable candidates for therapeutic interventions, would be of considerable clinical
significance. The current study suggests that MR-proANP deserves greater study in this
context.
Limitations:
The small sample size increases the risk of a type II error nevertheless the
present study is to our knowledge the largest study to assess the association between
biomarkers and exercise hemodynamics in subjects with ischemic heart disease and
preserved LVEF. Furthermore this limitation does not affect the main result of the study that
natriuretic peptides are associated with filling pressure and that MR-proANP is superior to
NT-proBNP.
Acknowledging the skewed inclusion of MI-DD and MI+DD subjects we sought to
reclassify subjects, by applying a physiological approach, according to their filling pressure at
peak exercise in order to have a more even distribution between groups. Despite being
selected in two groups we pooled all data to increase the strength of the data. Although, all
subjects were examined using the same protocol one should always be careful when
interpreting the results of pooled data due to selection bias and the occurrence of spurious

MANUSCRIP
T
ACCEPTED
ACCEPTED MANUSCRIPT
15
correlation. We cannot safely state that the significant association between natriuretic
peptides and filling pressure is not partly caused by a spurious correlation.
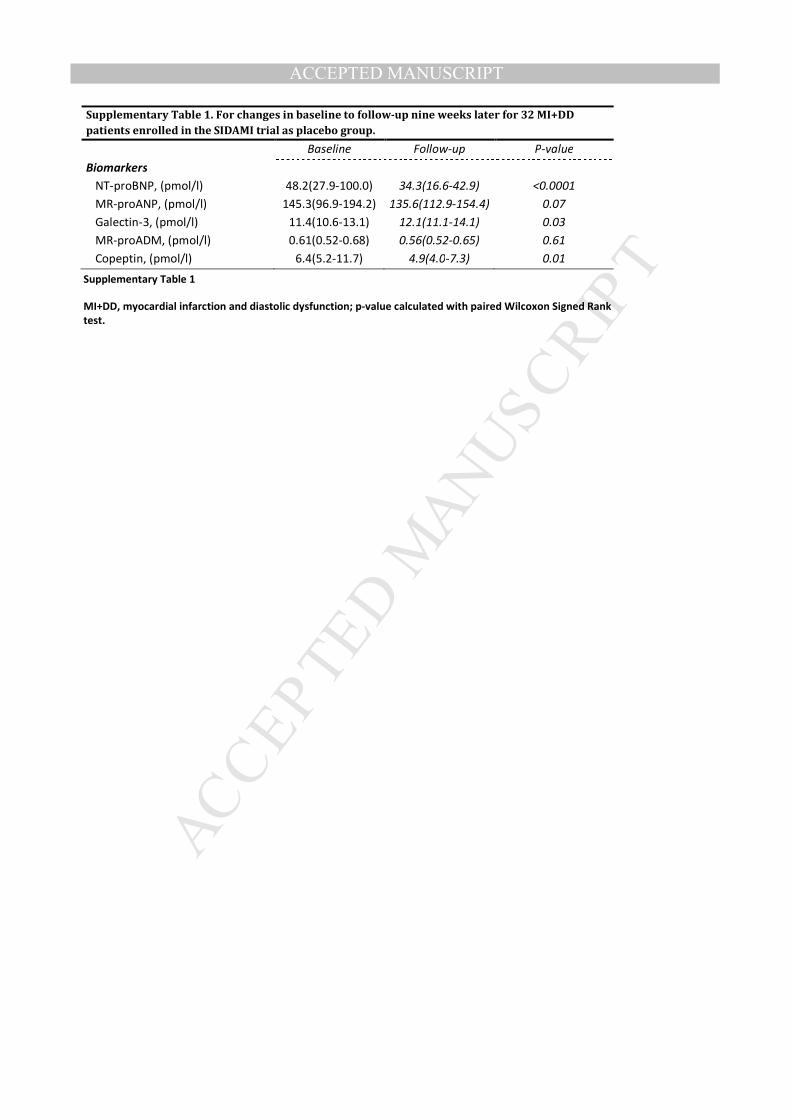
Due to some variation in time from myocardial infarction to enrollment we
cannot safely state that this did not affect the results. However 32 MI+DD subjects enrolled in
the SIDAMI trial(13) as placebo group had the exact same invasive hemodynamic exercise test
including biomarker sampling performed after 9 weeks of treatment. In those 32 subjects
receiving placebo NT-proBNP and Copeptin decreased significantly while Galectin-3 increased
whereas MR-proANP and MR-proADM did not change significantly over 9 weeks
(supplementary table 1). Furthermore the decrease was significant the absolute changes over
63 days were small therefore the variation in time from MI to enrollment would not
significantly affect the overall results of the present study.
Conclusion: In subjects recovering from an acute myocardial infarction with preserved
ejection fraction, plasma levels of natriuretic peptides, in particular MR-proANP, reflect the
filling pressures of the left ventricle at rest and with exercise. In contrast, no association
between filling pressures (rest or exercise) and copeptin, Galectin-3 or MR-proADM was
found. Further studies are required to determine if MR-proANP might be a useful non-
invasive marker to identify subjects with elevated filling pressures, which potentially could
have important implications for identification and selection of subjects for novel treatments.
Disclosures: Nothing to disclose.
MANUSCRIP
T
ACCEPTED
ACCEPTED MANUSCRIPT
16
Figure Legend:
Figure 1
Plot of correlation between log10(MR-proANP (pmol/L)) and pulmonary capillary wedge
pressure (mmHg) at rest (A) at peak exercise (B) and changes from rest to peak exercise (C).
Subjects with myocardial infarction and no diastolic dysfunction (MI-DD, blue squares), and
subjects with myocardial infarction with diastolic dysfunction (MI+DD, red circles). Reported
p-value is testing for association between MR-proANP plasma levels and PCWP by linear
regression. Y is slope of the regression line.
Figure 2
Univariate logistic models of the ability to predict elevated filling pressure with receiver
operating characteristic (ROC) curves and C-statistics at rest (A) and at peak exercise (B) for
MR-proANP the shaded area represents 95% CI.
Figure 3
Plot of correlation between log10(NT-proBNP (pmol/L and pulmonary capillary wedge
pressure (mmHg) at rest (A) at peak exercise (B) and changes from rest to peak exercise (C).
Subjects with myocardial infarction without diastolic dysfunction (MI-DD, blue squares), and
subjects with myocardial infarction with diastolic dysfunction (MI+DD, red circles). Reported
p-value is testing for association between NT-proBNP plasma levels and PCWP by linear
regression. Y is slope of the regression line.
MANUSCRIP
T
ACCEPTED
ACCEPTED MANUSCRIPT
17
Figure 4
Univariate logistic models of the ability to predict elevated filling pressure with receiver
operating characteristic (ROC) curves and C-statistics at rest (A) and at peak exercise (B) for
NT-proBNP the shaded area represents 95% CI.
MANUSCRIP
T
ACCEPTED
ACCEPTED MANUSCRIPT
18
Figur 1
MANUSCRIP
T
ACCEPTED
ACCEPTED MANUSCRIPT
19
Figure 2
ROC curve (Area) = 0.78(CI 0.65-0.90) ROC curve (Area) = 0.73 (CI 0.60-0.87)
A) Rest B) Peak Exercise
MR-proANP
MANUSCRIP
T
ACCEPTED
ACCEPTED MANUSCRIPT
20
Figure 3
MANUSCRIP
T
ACCEPTED
ACCEPTED MANUSCRIPT
21
Figure 4
ROC curve (Area) = 0.70 (CI 0.55-0.86) ROC curve (Area) = 0.64 (CI 0.47-0.82)
A) Rest B) Peak Exercise
NT-proBNP
MANUSCRIP
T
ACCEPTED
ACCEPTED MANUSCRIPT
22
1. Shell W, Peter T, Mickle D, Forrester JS, Swan HJ. Prognostic implications of reduction of
left ventricular filling pressure in early transmural acute myocardial infarction. Am Heart J. 1981
Sep;102(3 Pt 1):335-40.
2. Planer D, Mehran R, Witzenbichler B, Guagliumi G, Peruga JZ, Brodie BR, et al. Prognostic
utility of left ventricular end-diastolic pressure in patients with ST-segment elevation myocardial
infarction undergoing primary percutaneous coronary intervention. Am J Cardiol. 2011 Oct
15;108(8):1068-74.
3. Ommen SR, Nishimura RA, Appleton CP, Miller FA, Oh JK, Redfield MM, et al. Clinical
utility of Doppler echocardiography and tissue Doppler imaging in the estimation of left ventricular
filling pressures: A comparative simultaneous Doppler-catheterization study. Circulation. [Evaluation
Studies]. 2000 Oct 10;102(15):1788-94.
4. Nagueh SF, Middleton KJ, Kopelen HA, Zoghbi WA, Quinones MA. Doppler tissue imaging:
a noninvasive technique for evaluation of left ventricular relaxation and estimation of filling
pressures. J Am Coll Cardiol. 1997 Nov 15;30(6):1527-33.
5. Maeder MT, Thompson BR, {Brunner-La Rocca} H-P, Kaye DM. Hemodynamic basis of
exercise limitation in patients with heart failure and normal ejection fraction. Journal of the American
College of Cardiology. 2010;56:855-63.
6. Paulus WJ, Tschope C, Sanderson JE, Rusconi C, Flachskampf FA, Rademakers FE, et al.
How to diagnose diastolic heart failure: a consensus statement on the diagnosis of heart failure with
normal left ventricular ejection fraction by the Heart Failure and Echocardiography Associations of
the European Society of Cardiology. Eur Heart J. 2007 Oct;28(20):2539-50.
7. Hillis GS, Møller JE, Pellikka Pa, Gersh BJ, Wright RS, Ommen SR, et al. Noninvasive
estimation of left ventricular filling pressure by E/e' is a powerful predictor of survival after acute
myocardial infarction. Journal of the American College of Cardiology. 2004;43:360-7.
8. Møller JE, Whalley Ga, Dini FL, Doughty RN, Gamble GD, Klein aL, et al. Independent
prognostic importance of a restrictive left ventricular filling pattern after myocardial infarction: an
MANUSCRIP
T
ACCEPTED
ACCEPTED MANUSCRIPT
23
individual patient meta-analysis: Meta-Analysis Research Group in Echocardiography acute
myocardial infarction. Circulation. 2008;117:2591-8.
9. Beinart R, Boyko V, Schwammenthal E, Kuperstein R, Sagie A, Hod H, et al. Long-term
prognostic significance of left atrial volume in acute myocardial infarction. Journal of the American
College of Cardiology. 2004;44:327-34.
10. Whalley GA, Wright SP, Pearl A, Gamble GD, Walsh HJ, Richards M, et al. Prognostic role of
echocardiography and brain natriuretic peptide in symptomatic breathless patients in the community.
Eur Heart J. 2008 Feb;29(4):509-16.
11. Moller JE, Pellikka PA, Hillis GS, Oh JK. Prognostic importance of diastolic function and
filling pressure in patients with acute myocardial infarction. Circulation. 2006 Aug 1;114(5):438-44.
12. Andersen MJ, Ersboll M, Gustafsson F, Axelsson A, Hassager C, Kober L, et al. Exercise-
induced changes in left ventricular filling pressure after myocardial infarction assessed with
simultaneous right heart catheterization and Doppler echocardiography. Int J Cardiol. 2013 Apr 26.
13. Andersen MJ, Ersboll M, Axelsson A, Gustafsson F, Hassager C, Kober L, et al. Sildenafil
and diastolic dysfunction after acute myocardial infarction in patients with preserved ejection
fraction: the Sildenafil and Diastolic Dysfunction After Acute Myocardial Infarction (SIDAMI) trial.
Circulation. 2013 Mar 19;127(11):1200-8.
14. Borlaug BA, Nishimura RA, Sorajja P, Lam CS, Redfield MM. Exercise hemodynamics
enhance diagnosis of early heart failure with preserved ejection fraction. Circ Heart Fail. 2010 Sep
1;3(5):588-95.
15. Andersen MJ, Ersboll M, Bro-Jeppesen J, Gustafsson F, Hassager C, Kober L, et al. Exercise
hemodynamics in patients with and without diastolic dysfunction and preserved ejection fraction
after myocardial infarction. Circ Heart Fail. 2012 Jul 1;5(4):444-51.
16. Penicka M, Bartunek J, Trakalova H, Hrabakova H, Maruskova M, Karasek J, et al. Heart
failure with preserved ejection fraction in outpatients with unexplained dyspnea: a pressure-volume
loop analysis. Journal of the American College of Cardiology. 2010;55:1701-10.

MANUSCRIP
T
ACCEPTED
ACCEPTED MANUSCRIPT
24
17. Flynn TG, de Bold ML, de Bold AJ. The amino acid sequence of an atrial peptide with
potent diuretic and natriuretic properties. Biochemical and biophysical research communications.
[Research Support, Non-U.S. Gov't]. 1983 Dec 28;117(3):859-65.
18. Iwanaga Y, Nishi I, Furuichi S, Noguchi T, Sase K, Kihara Y, et al. B-type natriuretic peptide
strongly reflects diastolic wall stress in patients with chronic heart failure: comparison between
systolic and diastolic heart failure. J Am Coll Cardiol. 2006 Feb 21;47(4):742-8.
19. Lang RM, Bierig M, Devereux RB, Flachskampf FA, Foster E, Pellikka PA, et al.
Recommendations for chamber quantification: A report from the American Society of
Echocardiography's guidelines and standards committee and the chamber quantification writing
group, developed in conjunction with the European Association of Echocardiography, a branch of the
European Society of Cardiology. J Am Soc Echocardiog. 2005 Dec;18(12):1440-63.
20. Nagueh SF, Appleton CP, Gillebert TC, Marino PN, Oh JK, Smiseth OA, et al.
Recommendations for the evaluation of left ventricular diastolic function by echocardiography. J Am
Soc Echocardiogr. 2009 Feb;22(2):107-33.
21. Sokoll LJ, Baum H, Collinson PO, Gurr E, Haass M, Luthe H, et al. Multicenter analytical
performance evaluation of the Elecsys proBNP assay. Clin Chem Lab Med. [Comparative Study
Evaluation Studies
Multicenter Study
Research Support, Non-U.S. Gov't]. 2004;42(8):965-72.
22. Terzic D, Johansson-Fallgren A, Ragnarsson O, Goetze J, Hammarsten O. Evaluation of a
sensitive copeptin assay for clinical measurement. Open Clin Chem J. 2012;5(1):21-6.
23. Hunter I, Alehagen U, Dahlstrom U, Rehfeld JF, Crimmins DL, Goetze JP. N-terminal pro-
atrial natriuretic peptide measurement in plasma suggests covalent modification. Clinical chemistry.
[Comparative Study
Research Support, Non-U.S. Gov't]. 2011 Sep;57(9):1327-30.
MANUSCRIP
T
ACCEPTED
ACCEPTED MANUSCRIPT
25
24. Morgenthaler NG, Struck J, Alonso C, Bergmann A. Measurement of midregional
proadrenomedullin in plasma with an immunoluminometric assay. Clinical chemistry. [Comparative
Study]. 2005 Oct;51(10):1823-9.
25. Food and Drug Administration. Galectin-3 assay. FDA; 2010 [cited 2014 September 19];
Available from: http://www.accessdata.fda.gov/cdrh_docs/reviews/K093758.pdf.
26. DeLong ER, DeLong DM, Clarke-Pearson DL. Comparing the areas under two or more
correlated receiver operating characteristic curves: a nonparametric approach. Biometrics.
[Comparative Study
Research Support, U.S. Gov't, Non-P.H.S.]. 1988 Sep;44(3):837-45.
27. de Boer RA, Voors AA, Muntendam P, van Gilst WH, van Veldhuisen DJ. Galectin-3: a novel
mediator of heart failure development and progression. Eur J Heart Fail. 2009 Sep;11(9):811-7.
28. Jougasaki M, Burnett JC, Jr. Adrenomedullin: potential in physiology and pathophysiology.
Life sciences. 2000;66(10):855-72.
29. Xue Y, Taub P, Iqbal N, Fard A, Clopton P, Maisel A. Mid-region pro-adrenomedullin adds
predictive value to clinical predictors and Framingham risk score for long-term mortality in stable
outpatients with heart failure. Eur J Heart Fail. 2013 Jul 25.
30. Wenzel V, Krismer AC, Arntz HR, Sitter H, Stadlbauer KH, Lindner KH, et al. A comparison
of vasopressin and epinephrine for out-of-hospital cardiopulmonary resuscitation. N Engl J Med. 2004
Jan 8;350(2):105-13.
31. Pang PS, Konstam MA, Krasa HB, Swedberg K, Zannad F, Blair JE, et al. Effects of tolvaptan
on dyspnoea relief from the EVEREST trials. Eur Heart J. [Multicenter Study
Randomized Controlled Trial
Research Support, Non-U.S. Gov't]. 2009 Sep;30(18):2233-40.
32. Redfield MM, Chen HH, Borlaug BA, Semigran MJ, Lee KL, Lewis G, et al. Effect of
phosphodiesterase-5 inhibition on exercise capacity and clinical status in heart failure with preserved
ejection fraction: a randomized clinical trial. JAMA. 2013 Mar 27;309(12):1268-77.

MANUSCRIP
T
ACCEPTED
ACCEPTED MANUSCRIPT
26
33. Yusuf S, Pfeffer MA, Swedberg K, Granger CB, Held P, McMurray JJ, et al. Effects of
candesartan in patients with chronic heart failure and preserved left-ventricular ejection fraction: the
CHARM-Preserved Trial. Lancet. 2003 Sep 6;362(9386):777-81.
34. Massie BM, Carson PE, McMurray JJ, Komajda M, McKelvie R, Zile MR, et al. Irbesartan in
patients with heart failure and preserved ejection fraction. The New England journal of medicine.
[Multicenter Study
Randomized Controlled Trial
Research Support, Non-U.S. Gov't]. 2008 Dec 4;359(23):2456-67.
35. Cleland JG, Tendera M, Adamus J, Freemantle N, Polonski L, Taylor J, et al. The perindopril
in elderly people with chronic heart failure (PEP-CHF) study. Eur Heart J. 2006 Oct;27(19):2338-45.
36. Edelmann F, Wachter R, Schmidt AG, Kraigher-Krainer E, Colantonio C, Kamke W, et al.
Effect of spironolactone on diastolic function and exercise capacity in patients with heart failure with
preserved ejection fraction: the Aldo-DHF randomized controlled trial. JAMA. 2013 Feb
27;309(8):781-91.
MANUSCRIP
T
ACCEPTED
ACCEPTED MANUSCRIPT
Highlights
• Invasive hemodynamic exercise approach and biomarkers in post MI patients
• 74 post MI with LVEF >45%
• No association with filling pressures and Copeptin, MR-proADM or Galectin-3
• Natriuretic peptides were associated with resting, exercise and changes in PCWP
• MR-proANP was superior to NT-proBNP
MANUSCRIP
T
ACCEPTED
ACCEPTED MANUSCRIPT
BSA = Body Surface Area; MI, = myocardial infarction; DD=diastolic dysfunction; eGFR = estimated
glomerular filtration rate; ACE/ARB = angiotensin converting enzyme/aldosterone receptor blocker; NT-
proBNP = N-terminal pro-B-type natriuretic peptide; MR-proANP = mid regional pro-A-type natriuretic
peptide; MR-proADM = mid-regional pro-adrenomedullin; LVEF = left ventricular ejection fraction; LAVOLi =
left atrial volume indexed to body surface area; E/e’ = ratio of peak early mitral inflow velocity to peak early
diastolic tissue velocity. P-value calculated by unpaired t-test or non-parametric test where appropriate.
Table 1. Baseline Demographic, Clinical Characteristics and Cardiovascular Parameters for the total study population
and stratified according to peak exercise PCWP
Total
N=74
PCPW ≤ 25 mmHg
N=17
PCWP > 25 mmHg
N=57
P-value
Age, years 62±8 61±10 62±8 0.48
Male, (%) 64(86%) 16(94%) 48(84%) 0.29
BSA, (m2) 2.03±0.22 2.08±0.2 2.02±0.22 0.32
Comorbidities
MI+DD, n (%) 64(86%) 11(65%) 53(93%) 0.008
Hypertension, n (%) 31(42%) 6(35%) 25(34%) 0.75
NYHA > II, n (%) 0 (0%) 0 (0%) 0 (0%) 0.99
Diabetes, n (%) 6(8%) 0 6(11%) 0.38
eGFR, (ml/min/1.73 m2) 88±24 87±28 88±23 0.87
Ex- or Current smokers, n (%) 46(62%) 11(65%) 35(61%) 0.95
Medication
Diuretics, n (%) 4(5%) 1(6%) 3(5%) 0.92
Beta-blockers, n (%) 64(86%) 12(71%) 52(91%) 0.03
ACEI/ARB, n (%) 20(27%) 2(12%) 18(32) 0.11
Statin, n (%) 73(99%) 16(94%) 57(100%) 0.07
Biomarkers
NT-proBNP, (pmol/l) 51.9(27.9-91.8) 29.4(15.4-71.9) 57.5(29.1-91.8) 0.09
MR-proANP, (pmol/l) 131.9(89.4-165.2) 94.8 (70.0-127.1) 137.8(94.9-192.0) 0.003
Galectin-3, (pmol/l) 11.2(9.6-12.9) 11.8(11.2-14.2) 11.0(8.7-12.7) 0.09
MR-proADM, (pmol/l) 0.55(0.48-0.62) 0.56(0.47-0.62) 0.55(0.49-0.62) 0.92
Copeptin, (pmol/l) 5.6(3.8-10.2) 4.7(3.3-7.1) 6.2(4.5-10.4) 0.13
Echocardiographic
LVEF, (%) 56±6 55±6 56±6 0.46
LAVOLi, (ml/m2) 41±12 36±10 43±12 0.03
E/e’ 10.4±2.8 9.1±3.6 10.8±2.5 0.03
Diastolic dysfunction, n (%) 64(86%) 11(65%) 53(93%) 0.003
MANUSCRIP
T
ACCEPTED
ACCEPTED MANUSCRIPTTable 2. Hemodynamic Characteristics at rest and at peak exercise
PCPW ≤ 25 mmHg
N=17
PCWP > 25 mmHg
N=57
P-value
Resting
CO, (L/min) 5.2±1.4 5.3±1.2 0.78
RAP, (mmHg) 5±2 7±2 0.05
PCWP, (mmHg) 10±2 12±3 0.02
mPAP, (mmHg) 16±2 19±4 0.003
mBP, (mmHg) 89±10 91±11 0.58
HR, (b.p.m.) 61±9 61±10 0.85
LVEF (%) 55±6 56±6 0.46
E/e’ 9.1±3.6 10.8±2.5 0.03
Lactate, (mmol/L) 0.93±0.34 0.92±0.41 0.91
Peak Exercise
CO, (L/min) 15.7±3.7 15.4±3.7 0.81
RAP, (mmHg) 7±4 15±5 <0.0001
PCWP, (mmHg) 21±5 35±6 <0.0001
mPAP, (mmHg) 33±6 48±8 <0.0001
mBP, (mmHg) 116±14 117±16 0.77
HR, (b.p.m.) 125±18 126±17 0.9
LVEF (%) 60±6 60±7 0.77
E/e’ 8.0±3.6 9.6±2.4 0.04
Lactate, (mmol/L) 8.09±2.44 8.25±2.80 0.83
Peak work load, (Watt) 137±41 132±40 0.70
CI = Cardiac Index; RAP= Right atrial pressure; PCWP = Pulmonary capillary wedge pressure; mPAP = Mean
pulmonary arterial pressure; mBP, mean arterial blood pressure; H.R., Heart rate.
MANUSCRIP
T
ACCEPTED
ACCEPTED MANUSCRIPT
Supplementary Table 1. For changes in baseline to follow-up nine weeks later for 32 MI+DD
patients enrolled in the SIDAMI trial as placebo group.
Baseline Follow-up P-value
Biomarkers
NT-proBNP, (pmol/l) 48.2(27.9-100.0) 34.3(16.6-42.9) <0.0001
MR-proANP, (pmol/l) 145.3(96.9-194.2) 135.6(112.9-154.4) 0.07
Galectin-3, (pmol/l) 11.4(10.6-13.1) 12.1(11.1-14.1) 0.03
MR-proADM, (pmol/l) 0.61(0.52-0.68) 0.56(0.52-0.65) 0.61
Copeptin, (pmol/l) 6.4(5.2-11.7) 4.9(4.0-7.3) 0.01
Supplementary Table 1
MI+DD, myocardial infarction and diastolic dysfunction; p-value calculated with paired Wilcoxon Signed Rank
test.
Related Documents