Copyright is owned by the Author of the thesis. Permission is given for a copy to be downloaded by an individual for the purpose of research and private study only. The thesis may not be reproduced elsewhere without the permission of the Author.

Welcome message from author
This document is posted to help you gain knowledge. Please leave a comment to let me know what you think about it! Share it to your friends and learn new things together.
Transcript

Copyright is owned by the Author of the thesis. Permission is given for a copy to be downloaded by an individual for the purpose of research and private study only. The thesis may not be reproduced elsewhere without the permission of the Author.
RELATIONSIDPS AMONG WORK ADJUSTMENT VARIABLES
A thesis in partial fulfilment
of the requirements for the degree
of Doctor of Philosophy in Psychology
at Massey University
Monica Jessie Skinner (nee Montague-Brown)
1993

Title of thesis:
Massey University Library Thesis Copyright Form
(1) /(a) I give permission for my thesis to be made available to readers in Massey University Library under conditions determined by the Librarian.
(b) I do not wish my thesis to be made available to readers without my written consent for ... months.
'
(2) v(a) I agree that my thesis, or a copy, may be sent to another institution under conditions determined by the Librarian.
(b) I do not wish my thesis, or a copy, to be sent to another institution without my written consent for months.
(3) v(a) I agree that my thesis may be copied for Library use.
(b) I do not wish my thesis to be copied for Library use for ... months.
Signed jJ� Date /6 jOvt/93
The copyright of this thesis belongs to the author. Readers must
sign their name in the space below to show that they recognise
this. They are asked to add their permanent address.
NAME AND ADDRESS ·DATE
15
This thesis is dedicated to the memory of
Jessie Penrose Montague-Brown
(nee Freeman)

ACKNOWLEDGEMENTS
I would like to acknowledge and express my appreciation of the supervision I have received
beginning with Dr. Beryl Hesketh as my very able, enthusiastic and encouraging first chief
supervisor for the first year of my research at the very important initial stage before her
Departure from the university. I wish to thank Dr. Hesketh for suggesting the area of work
adjustment as one of interest. Dr. Mike Smith kindly continued her role by motivating me
through the lengthy task of coding the data. He was primarily responsible for having the
Computer Centre procure the LISREL programme for two years. I wish to thank him for
commenting on drafts of the thesis and offering support until he found it necessary to move
to second supervisor following a period of convalescence after an accident.
I would like to especially thank Professor George Shouksmith for suggesting undertaking
doctoral research in response to my wish to further my post-Graduate education, for being
second supervisor to my first two chief supervisors and in the final year while a busy Dean
of Social Sciences graciously adopting the role of chief supervisor left vacant by Dr. Smith's
period of recuperation and subsequent departure. Professor Shouksmith took part in joint
supervision sessions with Dr. Hesketh thus being involved at the design stage of the research.
I particularly appreciated his intelligent, enthusiastic, efficient and positive approach
throughout and the experience and willingness to assist whenever asked. I valued his
comments on the design of the questionnaire items and thesis drafts (to do with style, content
and structure) as a second supervisor and his further thorough reading and comments as a
chief supervisor.
I wish to thank Professor R. V. Dawis for granting permission to use the psychological
instruments relating to his and Lofquist's (1984) work adjustment and Professor Jo-Ida
Hansen for making available copies of the Strong-Carnpbell Inventory, for sharing in postage
costs and for computer scoring the completed forms. The funding made available by the then
Department of Labour for postage of the Strong-Carnpbell to The U.S.A. for scoring and a
grant from the Social Science Research Fund for postage of questionnaires to respondents
were of great assistance.
Thanks are due to the Heads of Departments who allowed access to classes and to the
Lecturers who gave up ten minutes of their lecture time to allow me to request volunteers.
iii
Some actively encouraged students to take part in the research. I appreciated the access to
students allowed by the Principal of the Teachers College, Palmerston North.
I am particularly grateful to Dr. D . M. Fergusson and L. J. Horwood for introducing me to
the use of LISREL (making their programme available before it was obtained by Massey
University) , for conducting a day workshop for our LISREL study group. I appreciated Dr.
Fergusson entering into correspondence concerning the application of LISREL to the factor
structure of work needs. I welcomed the support of the LISREL study group, the main
participants being Kerry Chamberlain, Dr. James Chapman, Dr. Mike Smith, Dr. John Spicer
and Dr. Paul Toulson. I would also like to thank Paul for reading an early draft of my thesis .
Thanks are due to Computer Centre staff, to Glennis W allbutton for assisting with data entry,
Patricia Fleming for her ever pleasant and willing reception work, and the help of computer
consultants Dr. Edward Drawneek and Robert Lambourne. The work of private consultant
Philip Hayward in finding extra disc space was appreciated. I thank the office staff and other
members of the Psychology Department who made resources available, in particular Alison
who designed the front cover of the questionnaires and Beverly Hong who coded some of the
questionnaire replies . I am indebted to Bruce Skinner for his technical skill and artistic
production of the figures, for his patient and endurance in the seemingly endless tasks of
printing and photocopying. Thanks to P. Brent Challis for his computer graphics work. I also
thank J ane Foot for her proof reading and Gail Francis for her assistance with word
processing and placing tabs expertly in various of the diagrams . I am especially grateful to
Heather Velvin for her thorough and unpaid proof reading of the fmal draft.
I owe others, students and staff in the Psychology Department for the academic context
provided by seminars and friends for their interest throughout in the progress of my research.
I am thankful to Viv Todd of Mita Copy Centre, for the photocopying she did at short notice
and sometimes after hours, and to my husband for his substantial assistance at the final
production stage of the thesis . Without the personal support and care of, Bruce, his frequent
assistance with the children and day-to day living and the nurturing child-care given by Marie
Valentine to our children from infancy, completion of the thesis would have impossible. I
thank Sheryl Hayward, Judy Englebrecht and other friends for their babysitting. Last but not
least, I thank our children (Emma, David and Leah) for allowing me to be frequently absent
with less of an opportunity to play with them.
iv

ABSTRACT
In the context of changing patterns of work and a growing trend for individuals to occupy
more than one position during their working life, knowledge about the factors affecting work
adjustment becomes increasingly important to employee and employer alike. The present
research investigated the application of aspects of a dominant but relatively unchallenged
psychological theory of work adjustment (and its instrumentation) of Dawis and Lofquist
(1984). The aspects of particular interest in this area of Occupational ,
Industrial/Organisational and Vocational Psychology, were the effect of work need
correspondence (as moderated by satisfactoriness) on job satisfaction and tenure and the use
of the adjustment styles of active, reactive, perseverance and flexibility.
A critical evaluation of the theory raised concerns about possible omissions of important
variables, about inconsistencies (such as having the key variables of job satisfaction and
satisfactoriness act mutually as moderators yet be relatively independent of each other) and
about the apparent failure of an orthogonal model to represent the relationships among work
need factors accurately. The underlying factor structure of work needs was explored using
confirmatory factor analytic techniques and the linear structural relations model (LISREL) .
Dawis and Lofquist's work need factor analyses were reworked in an empirical study and as
part of a meta-analysis . The work adjustment theory was expanded to take account of
relationships among constructs with a more cognitive component (such as subjective well
being, self-efficacy and locus of control), among social constructs (such as social support and
social reference group influences) and among non-work variables (such as satisfaction with
quality of life domains) . Vocational issues such as the relationship between occupational
fantasy and actual position taken up were explored.
The study was of a two-stage longitudinal design with questionnaires administered to a
relatively homogeneous group of 377 volunteers from a range of academic disciplines in a
New Zealand university towards the last third of their final year of study, prior to graduation
and to the 288 remaining in the study sample a year later, the majority of whom were in
work. Data about the characteristics of the respondent group including information about their
parents and individual work expectations were gathered at stage one. Stage two repeated
measures of self-efficacy, locus of control and subjective well-being and sought information
to evaluate aspects of work adjustment theory, non-work factors and the work/non-work
V
relationship. The psychological instruments in addition to those of work adjustment theory
used were Holland's (1965) Vocational Preference Instrument, The Strong-Campbell Interest
Inventory (Hansen, 1985) and the measures used by Campbell, Converse and Rodgers (1976)
of happiness, subjective well-being and personal competence.
The criticisms of the theory appeared valid and the expanded model outlined fitted the data
better than the original of Dawis and Lofquist with the additional variables performing as well
or better in the prediction of tenure. Job satisfaction was found to be a better predictor of
work adjustment than expected tenure. Job attachment explained more of the variance in the
work adjustment model than did expected length of tenure itself. Although correspondence
between work needs and work reinforcers usually occurred, only certain work needs when
reinforced affected job satisfaction. The factor structure of work needs was found to be
hierarchical with two second order factors. One second order factor was interpreted as being
intrinsic and involving personal development and growth aspects while the other was more
extrinsic in nature involving the work setting, management and working conditions. Just as
the first level factors correlated so did the second order factors to produce a single, general
work need factor. Not all work needs may need to be reinforced for job satisfaction to occur
and perhaps as few as five need to be measured. Adjustment style did not moderate
correspondence between all work needs and their reinforcers. The social reference group and
the degree of social support were found to be an important influence on the subjective well
being of respondents. When taken together a greater amount of variance in subjective well
being was accounted for by leisure satisfaction and social support than by job satisfaction.
Perceived job satisfactoriness was a better predictor of tenure than job satisfaction. Non-work
factors and the relative importance of work and job/lifestyle compatibility were found to be
of importance to work adjustment. The implications of the apparent limitations of Dawis and
Lofquist's theory of work adjustment are discussed along with the effect of the emergence of
a different work need factor structure on the theory's instrumentation.
vi

TABLE OF CONTENTS
CHAPTER ONE: INTRODUCTION
1.1 The importance and role of work 1
1.2 A comparison within different disciplines of the study of work
and work adjustment 4
1. 3 Psychological approaches to work and work adjustment 8
1. 3 .1 The theoretical approaches to the individual and the organisation 9
1.3.2 Work adjustment related constructs and theories 13
1.3.3 Work adjustment theories in vocational psychology 17
1.4 An outline of the approach of the present research 19
CHAPTER TWO: REVIEW OF THE RELEVANT LITERATURE
2.1 Personality theory
2.1.1 The different definitions and theories of personality
2.1.2 Personality theory, Dawis and Lofquist's theory and personality
theory traditions
2.1.3 Current personality theory
2.2 Motivation to work
2.2.1 The need approaches
2.2.2 Instrumentality theory
2.2.3 Goal-setting theory
2.2.4 Balance theory
2.2.5 Reinforcement approaches
2.2.6 Comparing the approaches
2.3 Job satisfaction and productivity
2.4 Job satisfaction and tenure
2.5 Individual work behaviour and the work environment
2.5.1 Conditions requiring an adjustment response
2.5.2 Work personality maturation
2.5.3 Adjustment mechanisms
2.6 Summary
Vll
24
24
26
30
32
32
36
38
39
40
41
45
48
51
51
53
61
61
CHAPTER THREE:
DAWIS AND LOFQUIST'S THEORY OF WORK ADJUSTMENT (1984)
3.1 Introduction 65
3. 2 Dawis and Lofquist's theory 68
3.3 The theory's propositions 71
3.3.1 Formal propositions I to IX 72
3. 3.2 Formal propositions XI to XVI 74
3. 3.3 A systems perspective 75
3. 4 The work personality 77
3.4.1 Skills/ abilities 77
3.4.2 Needs/values 80
3.4.3 Personality style 82
3.4.4 The adjustment mechanisms of Dawis and Lofquist and others 85
3.4.5 The development of personality structure and style 85
3.5 The work environment 88
3.6 Correspondence 90
3.6.1 The relationship between job satisfaction and satisfactoriness 91
3.6.2 Tenure 92
3.7 Predicting work adjustment 92
3.8 Measurement of Dawis and Lofquist's work personality 94
3.8.1 The measurement of abilities 96
3.8.2 The measurement of work needs 96
3. 8. 3 The measurement of personality style 99
3.9 Measurement of work environment constructs 101
3.9.1 The measurement of work environment structure 101
3.9.2 The measurement of work environment style 103
3.10 Measurement of the correspondence itself and its outcomes 104
3.10.1 The measurement of correspondence 104
3.10.2 The measurement of job satisfaction 105
3.10. 3 The measurement of satisfactoriness 105
3.10.4 The measurement of tenure 107
viii
CHAPTER FOUR: WORK ADJUSTMENT THEORY:
PREVIOUS RESEARCH, CRITICISMS, AND THE PRESENT STUDY
4.1 Work adjustment theory research
4.1.1 Proposition related research
4.1. 2 Research not relating directly to the propositions
4.1.3 The need for further research
4.2 Criticisms
4.2.1 The importance of assessing Dawis and Lofquist's theory
4.2.2 The conceptual and empirical limitations
4.2.3 The symmetry of the theory
4.2.4 Use of constructs
4.2.5 Relationships among constructs
4.2.6 Adjustment styles
4.2. 7 Conceptualisation and measurement of needs
4.2.8 People-environment fit measurement issues
4.3 The Present research
4.3.1 The present research and the direction of work adjustment theory
research generally
109
109
111
115
116
116
117
118
119
121
125
127
133
134
134
4.3.2 The present research and Dawis and Lofquist's theory specifically 137
4.3. 3 General outline of the present research 140
CHAPTER FIVE: DESCRIPTION OF PRESENT RESEARCH
5.1 Introduction to the study 143
5.1.1 The cognitive perspective: self-efficacy, subjective well-being 144
5.1. 2 Personality: personality factors, and locus of control 153
5.1. 3 Relevant social factors: social relations, social support and
social reference group 156
5.1.4 Vocational factors: preference, choice and fantasy 161
5.1.5 Non-work factors 161
5.2 Aims of the present study 168
5.2.1 Aim 1: An examination of Dawis and Lofquist's propositions 168
5.2.2 Aim 2: Potentially important missing variables and their
interrelationships 175
ix
5.2.3 Aim 3: Investigating structural relationships among Dawis
and Lofquist's key concepts using LISREL
5.2.4 Aim 4: Exploring the underlying structure of work needs by both
factor and latent structure analysis
5. 3 The Research design and procedure
5 .4 The respondent group
5.5 The Questionnaires: design, presentation and content
5. 5 .1 Design and presentation
177
187
188
188
191
191
5.6 Dawis and Lofquist's instruments and those used in the present research 196
5.6.1 The Minnesota Importance Questionnaire (MIQ)
5.6.2 The Minnesota Satisfaction Questionnaire (MSQ)
5.6.3 Dawis and Lofquist's Experimental Personality Rating and
Adjustment Style Rating Forms
5.7 Standard instruments other than Dawis and Lofquist's
5.7.1 The Vocational Preference Inventory (VPI), Holland (1965)
5.7.2 The Strong-Campbell Interest Inventory (1981), 3rd Edition
197
208
213
214
214
217
5.7.3 Index of Personal Competence (a locus of control measure) (1976) 220
5.7.4 Index of General Affect, Index of Well-being and a single-item
life satisfaction measure
5. 8 Measures developed or modified for the present research
5. 8.1 Self-efficacy instrument
5.8.2 Social support measure
5. 9 Statistical analyses
CHAPTER SIX: RESULTS: DESCRIPTIVE FINDINGS
6.1 Findings for information about the sample
6.1.1 Composition of the sample
6.1.2 Educational background of respondents
6.1.3 Parental data
6.1.4 Health, leisure and living circumstances
6.2 Similarities and differences among academic groups for the biographical
and background data
6.2.1 Differences in educational background of academic groups
X
221
224
224
229
230
236
236
238
240
241
244
246

6.2.2 The parental data of the academic groups 251
6.2.3 Accommodation 255
6.2.4 Work history variables 257
6.2.5 Academic performance measures 259
6.2.6 Working situation 261
6.2.7 Summary of section 6.2 263
6.3 Key statistics for work adjustment variables 265
6.3.1 Key statistics of the work adjustment and related variables
of the models 265
6.3.2 Correlates of variables of Dawis and Lofquist's paradigm 268
6.3.3 Key relationships of Dawis and Lofquist's paradigm 275
6.4 Academic group similarities and differences in work adjustment variables 278
6.4.1 Need-reinforcer correspondence 278
6.4.2 Job satisfaction aspects 283
6.4.3 Tenure related measures 284
6.5 Correlation of variables of the expanded model 285
6.6 Group similarities and differences for the additional variables
of the expanded model 287
6.6.1 Self-efficacy 287
6.6.2 Quality of life measures 303
6.6.3 Leisure activities 306
6.6.4 The relationship between leisure and work 306
6.6.5 Subjective well-being 307
6.7 Differences and similarities among academic groups for
Social Support variables 308
6.7.1 Superficiality of social relationships 308
6.7.2 Able to talk about personal concerns 309
6.7.3 Being able to rely on others 310
6.7.4 Not wishing to burden others 312
6.7.5 Fear of loss of respect 313
6.7.6 Others going out of their way to be helpful and offer support 313
6.7.7 Others really care 318
6.7.8 Other social support statements 319
6.8 Summary 320
xi
CHAPTER SEVEN: RESULTS: RESEARCH PROPOSITIONS AND HYPOTHESES
7.1 Dawis and Lofquist's individual propositions 323
7.1.1 Proposition Ill 323
7.1.2 Proposition VII 331
7.1.3 Proposition XIV 332
7.1.4 Proposition V 333
7.1.5 Proposition XII 334
7.1.6 Proposition I 335
7.1.7 Proposition VIII 340
7.1.8 Proposition XVII 340
7.2 Relationships among variables in the present study 341
7.2.1 Satisfaction and satisfactoriness 341
7.2.2 Estimates of tenure 343
7.2.3 Tenure as a function of use of adjustment styles 349
7.2.4 Relationship between locus of control and personality variables 350
7.2.5 Relationships between self-efficacy and locus of control 351
7.2.6 Relationships between self-efficacy for use of adjustment styles
and locus of control 353
7.2.7 Relationships among adjustment styles, locus of control and
self-efficacy for using adjustment styles 355
7.2.8 The association of vocational preference/training correspondence
with other variables 356
7.2.9 Non-employment satisfaction, leisure activities and social support 357
7.2.10 Variables associated with subjective well-being 357
7.2. 11 Relative importance of work as a moderator 364
7.2.12 Occupational fantasy and job satisfaction 364
7.2.13 Job satisfaction and planned-actual occupation correspondence 366
7.3 A Summary of the fmdings in relation to Dawis and Lofquist's
theoretical model 368
7.3.1 A summary of Dawis and Lofquist' s propositions and the hypotheses
of the present study 368
7.3.2 Job satisfaction 372
7.3.3 Satisfactoriness 373
7.3.4 Tenure 373
xii
7.3.5 Adjustment styles
7.3.6 Summary
7. 4 Summary and implications of fmdings in relation to the variables
additional to Dawis and Lofquist's theory
7 .4.1 Locus of control, self-efficacy and use of adjustment styles
7 .4.2 Factors less directly related to work: non-work activities, happiness
375
377
380
380
and life satisfaction, social support and subjective well-being 383
7.4. 3 Findings in relation to the broader literature 3 85
CHAPTER EIGHT: RESULTS: WORK NEED FACTOR STRUCTURE
8.1 Factor analyses 389
8 .1.1 Replication of Dawis and Lofquist' s factor analysis of present data 390
8.1.2 A correlated factors, higher order factor model 391
8.2 Modelling the work need factors with LISREL and Factor analysis 396
8.2.1 Modelling the work need factors with LISREL 396
8.2.2 The fitted model 402
8.3 Meta-analysis of factor labelling, interpretation and comparison
with previous findings
8. 4 Summary and conclusions of aims three and four of the study
CHAPTER NINE: CONCLUSIONS OF FINDINGS
9.1 The nature of the respondent group
9. 2 Findings on adjustment and work related variables
9.3 Level of support for the Dawis and Lofquist model
9.4 Level of support for the expanded model
9.5 Directions for future research
REFERENCES
APPENDIX A: RESPONDENT REQUEST FORlVI, PRELIMINARY STUDY
QUESTIONNAIRE, MODIFICATIONS TO ADJUSTMENT STYLE
RATING FORMS
A.1 Request for Respondents
A.2 Questionnaire for Preliminary Study
xiii
410
425
429
430
431
432
434
437
497
498
499

A.3 Modifications to Adjustment Style Rating Form 500
A.4 Modifications to Personality Style Rating Form 501
A. 5 Campbell, Converse and Rodger's (1976) reliability/validity estimates 502
APPENDIX B: QUESTIONNAIRES FOR BOTH PARTS OF THE STUDY 503
B .1 Questionnaire One 505
B. 2 Questionnaire Two 517
APPENDIX C: MODIFICATIONS TO THE VOCATIONAL PREFERENCE
INVENTORY, VPI, AND THE MINNESOTA IMPORTANCE
QUESTIONNAIRE, MIQ
C.1 Modifications to the Vocational Preference Inventory
C.2 Modifications to the Minnesota Importance Questionnaire
APPENDIX D: INFORMAL STATEMENT OF DA WIS AND LOFQUIST'S
THEORY
D .1 Informal statement of Dawis and Lofquist' s Theory (1984)
APPENDIX E: RESPONDENT CONSENT FORM
E.1 Respondent Consent Form
APPENDIX F: SCALE INTERPRETATION FOR VPI
F .1 Scale Interpretation for the Vocational Preference Inventory
(Holland, 1965)
APPENDIX G: OPERATIONALISATION OF CONSTRUCTS
G .1 Operationalisation of constructs
APPENDIX H: THE PSYCHOLOGICAL NEEDS
H.1 The 20 psychological needs of Dawis and Lofquist (1984)
H.2 The twenty work needs as presented in the Minnesota
Satisfaction Scale (MSS)
APPENDIX I: SATISFACTORINESS TERMS
I . l Satisfactoriness terms of self-efficacy items
xiv
555
556
558
559
560
563
564
565
566
569
570
575
576
576
577
578
APPENDIX J: PRELIMINARY STUDY OF WORK ADJUSTMENT STYLES 579
J.1 Introduction
J.2 Aims J.3 Subjects
J.4 Measurement Instruments
J.5 Procedure
J.6 Results
J.7 Discussion
J.8 Conclusion
APPENDIX K: LISREL AND FACTOR ANALYSES
K.1 The General LISREL model
K.2 Work Need Factor Analysis Matrices
K.3 LISREL confirmatory factor analysis of the correlated
factor (oblique) model of work needs
K.4 The LISREL modelling history
580
581
581
586
586
592
592
595
596
599
601
604
APPENDIX L: IDGHER ORDER FACTOR ANALYSES OF WORK NEEDS 619
L.1 Higher order factor analysis of work needs:
Principal axis factoring, varimax rotation
L.2 Higher order factor analysis of work needs:
Principal axis factoring, oblimin rotation
L.3 Higher order factor analysis: Maximum likelihood
extraction, oblimin rotation
APPENDIX M: BASIC STATISTICS FOR VARIABLES
M.1 Statistics for the key variables
M.2 Frequency distribution for expected tenure
APPENDIX N: CORRELATES OF KEY VARIABLES
N .1 Need-reinforcer correspondence correlates
N.2 Job satisfaction correlates
N.3 Intercorrelations of job satisfaction terms
XV
620
621
622
625
626
631
633
634
639
645
N.4 Dawis and Lofquist's intercorrelations of MIQ
adjusted scale scores 647
N.5 Correlates of the general job satisfaction scale
(MSQ composite measure) 647
N.6 Correlates of perceived job satisfactoriness 647
N.7 Correlates of job attachment 649
N.8 Correlates of adjusting to a new location and organisation 650
xvi
LIST OF FIGURES
Figure 2.1: Model of job satisfaction determinants (Campbell, Converse and Rodgers, 1976)
Figure 2.2: A comparison of developmental theorists' work adjustment stages including
factors such as abilities, interests and aptitudes
Figure 2.3: Adjustment styles categorised by Dawis and Lofquist's dimensions
Figure 3.1: Prediction of work adjustment
Figure 3.2: Work adjustment from a systems perspective
Figure 3.3: Relationships among adjustment style dimensions
Figure 3.4: Prediction of tenure
Figure 3.5: Establishing the requirements for work adjustment
Figure 3.6: Three-dimensional arrangement of values
Figure 3. 7: Interrelationships of celerity, pace, rhythm, and endurance
Figure 3.8: The theory of work adjustment in operational terms
Figure 4.1: Moderating variables producing interdependence between
satisfaction and satisfactoriness
Figure 4.2: Satisfactoriness and satisfaction correlating when satisfactoriness exists
Figure 4.3: Satisfactoriness and satisfaction correlating inversely when satisfactoriness
exists and correspondence is low
47
54
60
70
76
84
93
95
99
100
100
122
123
123
Figure 4.4: The possible effects of low satisfactoriness on the satisfactoriness-satisfaction 124
relationship
Figure 5.1: A causal flow chart of the Theory of Work Adjustment
(first ten propositions)
Figure 5.2: The Theory of Work Adjustment propositions XI to XVII
Figure 5.3: The matrix format for the social support questions
Figure 6.1: Percentage using each of the rating categories on the single-item
measure of job satisfaction
Figure 7.1: The Dawis and Lofquist propositions investigated in the present study
Figure 7.2: The variables added to Dawis and Lofquist's theory
Figure 7.3: Correlations among tenure related variables
Figure 7.4: Diagrammatic representation of summary of findings for Dawis and
Lofquist's propositions and the hypotheses of this study
xvii
169
172
229
267
324
342
345
376

Figure 8 .2 : Structural relations among the latent variables (exogenous and
endogenous) of Dawis and Lofquist's basic model 397
Figure 8 .3: Standardised solution for the 30-parameter five-factor hierarchical model 403
Figure 8 .4 : Higher order factor structure of work need factors using Maximum
Likelihood extractions to give second and third order factors and rotated
using oblimin for the second order factors
Figure 8 .5 : Higher order factor analysis of work need factors determined by principal
axis factoring at the second and third order factor levels and rotated to
oblimin criteria at the second order
xviii
407
408

LIST OF TABLES
3 . 1 Propositions I to IX 73
3 .2 Formal Propositions XI to XVI 74
3 .4 Examples of Abilities in Nine Content-Process Areas 79
3 . 5 Description of Values by Need Scale and Statement 98
3 . 6 The Source of Reinforcement for Pairs of Values 99
4. 1 Varimax Factor Loading Matrix for the Total Group (n = 5,358) 1 12
4.2 Comparing Dawis and Lofquist's Varimax Loadings for the
Male and Female groups (Gay et al . , 1 971) and the total Group of
Seaburg et al . ( 1976) 129
5 . 1 Time at which Variables were Measured 170
5 .2 Frequency and Percentage of Respondents Present, Consented and Returns 1 89
5 . 3 Broad Categorisations o f Academic Subjects : Frequency and Response Rate
between Stages of the Study 190
5.4 Reliability of MIQ Scale Scores, and Profiles 205
5 .5 The Eight Matched Traits and Instruments of MacNab and Fitzsimmons ( 1987) 207
6 . 1 Distribution of Age in the Respondent Group 237
6.2 The Marital Status of the Group 238
6 .3 Distribution of Nationality in the Respondent Group 238
6.4 Number of Years Secondary School for the Respondent Group 239
6 .5 Education Supplementary to School 239
6 .6 Highest Pre-university Qualification 240
6.7 Reasons Respondents Gave for Leaving their First Job 242
6 .8 Accommodation of Respondents Pre-Graduation 242
6 .9 Satisfaction with Living Circumstances of Respondents Pre-Graduation 243
6. 10 Satisfaction with Living Circumstances of Respondents Post-Graduation 243
6. 1 1 Percentage Distribution of Number of Years Secondary School Education
of Respondent Groups (N = 367) 247
6 . 12 Percentage Distribution (N = 363) of the Highest School Qualification
of Respondents 248
6 . 1 3 The Highest Secondary School Qualifications of Respondents of the
Academic Groups 249
xix
6 . 14 Percentage of respondents ' Parent's with Qualifications 252
6 . 15 Percentage of Parents in Each Occupational Group of the New Zealand
Classification of Occupations ( 1976) 253
6 . 16 Percentage Distribution of Respondents ' Fathers ' Income 253
6 . 17 Mother's Income of Academic Groups 254
6 . 1 8 Accommodation of Academic Groups 256
6 . 1 9 The First Vacation Employment of Academic Groups 258
6 .20 A Comparison of Distributions of Percentages of Grade for Respondents '
Average Final Year Grade and Their Overall Average Grade 260
6 .21 Distribution of Self-Reported Absenteeism of Respondents 263
6 .22 Means of Significant Correlates of Need Reinforcer correspondence for
Each of the Correspondence Terms 269
6 .23 S ignificant (p < .01) Correlates of Job Satisfaction (MSQ General Scale) 270
6 .24 Mean Correlates of Individual Job Satisfaction Terms (MSQ) 270
6 .25 Mean Significant Correlates of Self-Perceived Satisfactoriness 271
6 .26 Mean Significant Correlates of Job Attachment 272
6 .27 Mean Significant Correlates of General Adjustment Terms 272
6 .28 Frequency Table of Number of Times Variables were Correlates of
Need-Reinforcer Correspondence Terms 273
6 .29 Job Satisfaction and Satisfactoriness Correlated with Measures of Tenure
(Job Attachment and Expected Tenure) 275
6 . 30 Perceived Satisfactoriness Correlated with Satisfaction, with Job Attachment
and Expected Tenure 276
6 . 3 1 Need-reinforcer Correspondence Correlated with Job Satisfaction
(MSQ Composite Measure) 277
6 . 32 Distribution of Percentage for Correspondence Scores for
Those with No Significant Differences Among Academic Groups 279
6 .33 Social Status Correspondence for Academic Groups 280
6 . 34 Percentage Distribution of Satisfaction (low, medium, or high) in
each of the Work Needs 284
6 . 35 Percentage Distribution of Scores on the Seven Point Scale of
S elf-rated Job Attachment 285
6 .36 Percentage Distribution of Number of Years Individuals
Expected to remain in Their job (Expected Tenure) 285
XX
6 . 37 Dawis and Lofquist's Model Self-Efficacy Variables and Variables
Introduced to Their Model 286
6 .38 Distribution of Ratings of Self-efficacy Post-Graduation 288
6 .39 The Job-Fitting-Lifestyle Self-efficacy of Respondents at Time Two of
the Study 289
6.40 The Pay Self-Efficacy of Academic Groups 292
6 .41 Self-Efficacy for Promotability at Time Two of Academic Groups 294
6.42 A Comparison of Percentages Rating Themselves Highly or Completely
Confident on the Self-Efficacy for Variety Scale with the Percentage
Using These Rating Categories in the Whole Sample 297
6.43 Variety Self-Efficacy of Academic Groups 298
6.44 Percentage Using Rating Category 7 or 8 of the Self-Efficacy Scale 300
6.45 Performance of Academic Groups 301
6 .46 Group Differences in Human relations Supervision Self-Efficacy 302
6.47 Distribution of Respondents ' Satisfaction Rating Scores on the
Quality of Life Measures of Campbell, Converse and Rodgers ( 1976) 304
6 .48 A Comparison of the Distribution of the life Satisfaction of Respondents
at Time One and Two of the Study 305
6 .49 A comparison of Percentage Satisfied with Location for Both Stages
of the Study 306
6 .50 Distribution of Responses which Agreed or Disagreed with Statements
about the Superficiality of Relationships 309
6 .5 1 Percentage of "Talk about Personal Concerns " Statement in the
True and Untrue Categories 3 10
6 .52 Degree to which Statements about Talking to the Boss were True for
the Academic Groups 3 1 1
6 .53 Distribution of Responses which Agreed or Disagreed with Statements
about Being Able to Rely on Others 3 12
6 .54 Distributions of Responses Concerned with not Wishing to Burden
Others with Own Difficulties 3 12
6 .55 Distribution of Responses Concerned with not Talking about
Difficulties to Others for Fear of Loosing Their Respect 3 1 3
6 .56 Percentage Responding to the Statement that Others Offer Help
Was True and Not True 3 14
xxi
6 .57 Academic Group Responses Relating to Relatives Going Out of
Their Way to be Helpful 3 15
6 .58 Academic Group Differences for Workmates Helping 3 17
6.59 Academic Group Differences to the Statement that Others Really Care 3 19
7 . 1 Correlations Between Work Needs and Reinforcers Respondents
Perceived to be Available in that Job Generally 325
7.2 Non Parametric Correlations of Need-Reinforcer Correspondence
Difference Scores Between Ideal Needs and Reinforcers Perceived
to be in Existence, and Job Satisfaction Scores for each of the Needs 326
7 .3 Rank Order of the Nonparametric Correlations from Table 7.2 of
Need-Reinforcer Correspondence with Job Satisfaction for
Individual Needs 327
7.4 Needs-Reinforcer Correspondence Using Difference Scores,
Correlated with the General Satisfaction (composite) MSQ score,
and the Single Item Satisfaction Score 328
7.5 Percentage of Respondents Achieving Need-Reinforcer Correspondence for
Each of the Needs and Average Squared Correlations of Correspondence
Scores Regressed on Job Satisfaction (MSQ General Satisfaction Scale) 330
7.6 Correlations Between Job Satisfaction and Work Adjustment Styles for the
Single-item Job Satisfaction Measure and the General Satisfaction
Scale of the MSQ 332
7.7 Amount of Variance Need-Reinforcer Correspondence and Job Satisfaction
Items have in Common 336
7.8 Correlation Between Satisfaction MSQ Scores and Satisfactoriness Scores 339
7 .9 Average Squared Correlations for Tenure as a Function of
Satisfactoriness , and the Perseverance Levels of the Individual 341
7. 10 A Comparison of the Distributions for Expected Tenure for Self and
Perceived Usual Tenure for Others in the Same Job 347
7 . 1 1 Correlations of Adjustment Style Variables with Job Attachment and Average
Squared Correlations between Covariates , Use of Adjustment Styles , and the
Predicted Dependent Variable, Job Attachment 349
7 . 12 Stage One Self-efficacy Correlated with Locus of Control at Stage One and
Two, and Self-efficacy at Stage Two Correlated with Stage Two
Locus of Control 352
xxii

7 . 1 3 Correlations between Locus of Control and Adjustment Styles 353
7. 14 Average Squared Correlations Between Personal Competence (Locus of
Control) and Adjustment Styles 3 54
7 . 1 5 Means, Standard Deviations, and N for the Variables Included
in Hypothesis Four 354
7 . 16 Correlations (p < .001) Between Well-being and Satisfaction Domains 358
7 . 17 Comparison of Average Importance Ratings for Satisfaction Domains 360
7 . 1 8 Correlation between Domains of Satisfaction and Perceived Importance of
the Domains (p . < .001 ) 3 6 1
7 . 1 9 The Proportion of Shared Variance (r2) between the Index o f Well-being
and the Satisfaction Domain Scores for two Studies (Campbell, Converse
and Rodgers' ( 1976) and the Present Study 362
7.20 Rank Order Comparison for New Zealand and American Group of Life
Satisfaction as a Function of Domain Importance Regression
Coefficients (rank order) 363
7 .21 Frequency of Most Common Fantasy Occupations 365
7 .22 Association between Occupation and Previous Occupational Plans 367
8 . 1 Principal Axis Facto ring Rotated to a V arimax Criteria for MIQ Data 390
8 .2 Structure Matrix for ML Extraction and Oblimin Rotation for MIQ Data 392
8 . 3 A comparison o f Factor Analyses of Dawis and Lofquist's MIQ Data
with that of the Present Study 393
8 .4 Factor Correlation Maturix for ML Extraction and Oblimin Rotation
of MIQ data 394
8 .6 Correlation Matrix for Eta (Correlation Among First Order Factors) 405
8 .7 Proportion of Variance in Each First Factor Explained by the Model 405
8 . 8 Comparison o f Multidimensional Scaling and Factor Analyses o f Work Needs 4 1 1
8 . 9 Comparison o f MIQ Factors in Four Studies for Doering et al . 's Factor I 4 1 5
8 . 10 Comparison of MIQ Factors in Four Studies For Doering et al. 's Factor II 4 1 6
8 . 1 1 Comparison of MIQ Factors in Four Studies for Doering et al . 's Factor Ill 4 1 7
8 . 12 Varimax Rotated Matrix of Principal Factor Analysis of Dawis and Lofquist's
Data (intercorrelations of MIQ Adjusted Scale Scores for a Sample of 5 ,358) 4 1 8
8 . 13 Oblimin Rotation of Principal Factors 4 1 9
8 . 14 Matrix of Correlations among Factors of the Obliquely Rotated Principal
Factors Solution 420
xxiii

8. 15 Maximum Likelihood Extraction, Oblimin Rotation Structure Matrix 420
8 . 16 Factor Correlation Matrix for the Oblique Rotation of the Maximum Solution 421
8. 17 Comparison between Factors of Dawis and Lofquist' s Analysis and those
Resulting from a Re-working of their Matrix of MIQ Adjusted
Scores Intercorrelations 422
8 . 1 8 Factor Matrices of the Principal Axis Factoring and the Maximum Likelihood
Solutions of the Factor Correlation Matrix of Table 8 . 14. 423
8. 1 9 Structure Matrix of Principal Factors Solution o f the MSQ Data o f the
Present Research Using an Oblimin Rotation 424
8.20 Composition of Factors 425
xxiv
CHAPTER ONE
INTRODUCTION
In exploring the relationship among work adjustment variables, a logical place to begin is
with a brief look at the importance of work and its role. From there a comparison of the
study of work from the perspectives of those involved, the individual, groups and the
organisation will be made. A comparison of the psychological approaches to work and work
adjustment provides an account of the development of the theoretical approaches in the area.
This chapter outlines the main theoretical approaches to work adjustment and concludes with
an overview of the approach of the present research to do with the work adjustment of a
group of New Zealand graduates.
1. 1 The importance and role of work
Within the sub-area of psychology known as occupational or work psychology, an area of
increasing importance has been that of adjustment to work. The importance of the study of
work itself and the relationship of the individual to it have long been recognised. Of the many
different approaches to the study of the individual and work that have been adopted, the most
common have occurred within disciplines such as history, sociology, economics and
psychology. As a prelude to focusing on adjustment to work itself, it is helpful to briefly
examine the importance and meaning of work and the effects of changes in work and attitudes
towards it.
The importance of work within societies now, as historically, can be illustrated by the belief
that they are usually work-oriented. A goal within developed societies is often to achieve full
employment. That many institutions within a society are concerned or associated with work,
that there are an overwhelming number of books and articles about work and that work
occupies a place of importance in governmental processes and legislation, all attest to it being
regarded as an area of great importance. Work is expected to play a significant role in
determining the nature of relationships among individuals and between them and the society
within which they live.
1

2
The apparent centrality of work to individuals can be demonstrated by the amount of time
individuals spend engaging in work or work seeking activities. Often half an individual's
waking hours can be spent in work, with further time spent resting from or preparing for it.
Even in the case of part-time work, where only a few hours a day might be involved, its
impact can be out of proportion to the actual time spent. The same impact can occur as a
result of voluntary work. The amount of time, the potential importance of work to total life
adjustment and its relationship to the satisfaction of needs, all justify work as an appropriate
area of study for the behavioural sciences.
The importance assigned to work has in part related to attitudes towards it. Christian ethics
have been traced as the root of the development of a work ethic in early industrialised
societies. In such societies work was viewed as good for individuals, usually meaning men
at that time. Such an ethic is believed to have been replaced by materialism (Dunnette, 1 983)
and work has come to be regarded as a necessity rather than an activity engaged in by choice
(Auden, 1 972) . Shouksmith (1987) has emphasised that the industrial revolution has been
recognised as changing the work force from a rural to an urban one, from one which is no
longer craft-based to one which consists of groups of workers in large productive, mechanised
enterprises. The success of these societies is believed to depend upon a committed, regulated,
disciplined and productive effort on the part of the population. The surprise of Furnham
( 1984) that the protestant work ethic should have remained central in so many societies and
in sound research has been echoed by Shouksmith ( 1987) who emphasised that the ethic may
be a modern 'myth', a convenient assumption. Instead, new values for both the employed and
the unemployed are thought to have emerged from newer roles for work. Contributing factors
to these new values were listed as, increases in voluntary and enforced leisure, changing
technologies and the effect of unemployment.
Work has been described as a cultural transaction with the meanings attached to it being
recognised as a matter of the particular society within which individuals live and the sets of
prevailing cultural norms (Neff, 1 985) . A norm in this sense is a shared conception of the
behaviour that is appropriate or inappropriate in a given situation in a given culture
(Lundberg, Schrag, Larsen and Catton ( 1968) . The evaluation of work and the hierarchy of
values attached to different kinds of work have been said to vary sharply from society to
society. Neff regarded differences as a reflection, not of the intrinsic nature of the work
performed, but of complex sets of social, political and religious beliefs and events.
3
Consequently he advocated the main thing we need to know with respect to an indiv idual's
ability to work within a particular society is the manner in which the prevailing set of social
and cultural norms have been internalised.
Both the nature and patterns of work have been affected by many factors this century. The
speed often associated with the changes has demanded rapid adjustment on the part of all in
the work arena. Technological change has occupied a particular place of importance alongside
other factors such as economic and social ones which have accompanied significant events like
economic depression or war. The nature of work and the relationship of the individual to it
have continued to undergo change such that individuals throughout their working lives might
expect to need to adjust not only to a first job and changes within it, but also to several other
jobs they may occupy before retirement.
Individuals considering the relevance of work in relation to their search for identity has been
regarded as one of the consequences of the industrial revolution. With increasing automation
and computerization, the concern arose that machines would reduce individuals to an insecure
part of a person-machine system (Dawis and Lofquist, 1984) . The effects of social change on
work have been both obvious and subtle. Neff ( 1985) argued that in societies which are
heavily industrialised, even small technological changes can remove the need for certain
occupations and present major problems of work adjustment. Kinds of work which have been
previously valued may lose prestige, while others become more strongly valued. The structure
of work forces can dramatically alter in some cases. For example, America has witnessed a
shift in the proportion of blue-collar and white-collar workers, with the latter now comprising
the majority of the labour force (Neff, 1985).
In New Zealand studies (Inkson and Gidlow, 1981; and Carnmock and Inkson, 1985) it has
been observed (Shouksmith, 1987) that other changes have occurred, for example, in values
upon which decisions about work might be made. These changes have involved a movement
away from goals such as achievement, independence, self-control and enduring stress, to
goals such as self-expression and self-actualization. For women, the women's movement has
been credited with affecting the values of workers via pressure to alter women's roles. For
example, a New Zealand study (Abbott and Koopman-Boyden, 1981) demonstrated a change
in engaged couples' practices, with an increasing expectation that tasks will be shared more.

4
In contrast to men, the impact of work on women has been found to be more dependent upon
the degree to which it contributes to life satisfaction (Cromie, 1981) .
1 .2 A comparison within different disciplines of the study of work and work adjustment
Although work has been described as a social phenomenon that must be understood in the
context of social institutions and structure, because it is performed by individuals and not
societies it becomes an individual problem. The manner in which each individual comes to
terms with the almost universal demand to work, can be viewed as a problem in individual
psychology. The conditions that influence how we work and whether we work at all can be
influenced by individual and personal as well as by social, economic and historical factors.
The sets of conditions can be seen to interact . Within psychology the different factors and
their interrelationships are mirrored by different levels of analyses, that is of the individual ,
the group, or the organisation. The psychological, social psychological and sociological
disciplines themselves have been said to correspond to or be associated with these three
distinct levels of analyses, respectively (Gowler and Legge, 1982; Fincham and Rhodes,
1988) .
In contrast to other perspectives, psychology has taken the individual as its chief focus, the
individual's interaction with the environment and explanations of the way particular behaviour
occurred in a particular situation. It has aimed at producing theories of the psychological
processes which cause the behaviour and which will predict it in similar situations. The
principal interest lies in the way individual differences affect behaviour and how processes
within individuals are evident in behaviour. Often differences between individuals in terms
of their aptitudes, abilities and personalities, are studied. Likewise, Roberts, Hulin and
Rousseau (1978) submitted that the industrial/organisational psychology paradigm concentrates
on the individual as the unit of analysis, assuming that individual differences are more
relevant to individual responses than are characteristics of occupational settings. On the other
hand, the social psychological perspective would imply that individuals' responses cannot be
studied adequately without reference to the social groups to which they respond. Thus, the
social group becomes the basic unit of analysis.
Social psychology can be seen to represent the interface between psychology and sociology
in its description of how social structures can be internalized by the individual and affect their

5
attitudes, perceptions and beliefs, which in turn affect their behaviour. Customary ways of
behaving and specific patterns of behaviour, such as the roles of leader and follower, b ecome
topics of interest. Fincham and Rhodes ( 1988) have contended that almost all interaction in
organisations can be tied to groups. They believe that the recognition of the power of
informal groups and friendship groups to influence behaviour has served as an impetus for
research in social psychology.
The third level of analysis, that of sociological explanations, are characterised by Fincham
and Rhodes ( 1988) as being based on the idea of social action as a duality, consisting of the
structures of behaviour to which people conform and the more active and creative role played
by the individual as an agent. Structure here refers to the patterns of expectations and forms
of behaviour which have become ordered and which have persisted over time. At the social
level behaviour can be seen to originate in the interaction between people. Individual's
interests and motives are believed to create the possibility for change. The structure and the
part individuals play (agency) are together regarded as accounting for the opposing forces of
stability and change. The sociologist is concerned, less with the properties of individuals (or
the nature of group-based interaction) and more with relatively enduring social structures . The
industrial sociologist applies this broader analysis by looking at areas such as the relationship
between workers and employers as distinct classes, or the role of gender in employment. The
sociological paradigm is based on the premise that organisations are forms of social
collectives with lasting patterns of interaction which can continue unaltered when individual
members leave and others join. The units of analysis tend to become the group, organisation,
institution, society or culture.
It has been argued that using the three distinct levels of analysis provides a holistic view of
the human problems of work and that the resolution of multi-dimensional problems becomes
dependent upon the application of a variety of different approaches and perspectives (Fincham
and Rhodes, 1 988) . Problems apparent at one level of an organisation are thought to probably
have antecedents and effects at different levels (Gowler and Legge, 1982) . An assumption
behind the 'levels of analysis' concept is "that one level , operating in a hierarchical or vested
manner, provides the context or the environment for another" (Gowler and Legge, 1 982, p
73) .

6
Attempts at integration of disciplinary perspectives have been driven by problem-oriented
research in the study of work, as such research has rarely enjoyed the comfort of a neatly
constrained area of interest. Because the subject matter of the psychology of work or
occupational psychology involves individuals in an environment which can consist of groups
and organisations, inter-level and inter-disciplinary analyses become more likely even though
the primary focus in the psychology of work has probably tended to be at the individual level
of analysis.
Although the study of work adjustment within psychology may focus upon the individual,
some integration of levels of analysis would seem inevitable. For example, characteristics of
occupational settings would be expected to become more relevant than Roberts , Hulin and
Rousseau's ( 1978) Industrial/Organisational paradigm indicated. The social psychological
perspective of accounting for individual's social groups would be expected to be important
in relation to work adjustment. The sociological perspective, by moving the emphasis from
properties of individuals and group-based interaction to social structure, may be departing too
far from the domain of a psychological approach. Although the level of analysis involved in
the sociological perspective, that of the organisation, would at least be expected to have
relevance for the study of work adjustment .
Gowler and Legge noted that the assumed match between certain disciplines and levels of
analysis can be more apparent than real . At the same time they warned of the problems
inherent in the integration of different disciplinary perspectives and different levels of
analysis. They pointed out that as theories, levels of analysis not only involve ideas about
causation, they also define a range of empirical referents. An organisational psychologist and
a micro-sociologist might agree upon an empirical referent, such as employee performance,
but they are more likely to disagree about casual attribution. It is argued that for integration
or synthesis of different disciplinary approaches to occur, they have to operate simultaneously
at the level of cause and content.
Something approximating integration of levels of analysis occurs in the emphasis on one level
of analysis providing a context for another. This is especially notable in the work of
organisational researchers, sociologists and psychologists, who adopt some form of a
'systems' perspective. For example Rousseau ( 1977) , treated an organisational-level variable,
technology, as the context for two individual-level variables, perceived job characteristics and
7
affective responses of employees to their jobs. In the case of a f ully developed systems
approach inferences of causality become more complex because of the assumption of feedback
in the system (Gowler, 1969; Legge, 1970) . The contextual independent var iable at one point
in t ime can become the dependent var iable at a subsequent point in t ime.
Although levels of analysis, indiv idual, group, organisat ion may be differentiated
conceptually, when applied empir ically a t ime dimension can become involved. The t ime
dimension appropriate to measur ing behav iour at one level may be very different from that
used at other levels. For example, indiv idual att itudes to work may be measured at one point
in t ime by a quest ionnaire, while cohesiveness of the work groups which prov ide the context
for these att itudes may be measured by observat ion of patterns of interact ion over a much
longer t ime period. The results from these two sets of measurements may not therefore be
str ictly comparable. If the t ime period over which variation in the independent variable, the
context, is l ikely to produce variation in the dependent variable is not identified, ser ious
identificat ion problems can occur. This can be further complicated by the use of more than
one independent var iable, which is l ikely if several disciplinary perspectives are employed.
It is suggested that integration and sy nthesis must be limited in scope (Gowler and Legge,
1982) by adopt ing one of several partial designs. These are, using concepts from two or more
disciplines but focused on one level of analysis, integrating two or ientat ions from one
discipline focused at one level of analysis, or using concepts from one discipline and one
theoretical or ientat ion across levels of analysis. Ident ifying context var iables or var iables from
another level as moderating var iables of same level var iable relat ionships can be of use
conceptually and in statist ical analysis where more than one independent var iable is involved .
Rather than equating different levels of analysis w ith different approaches, a grouping based
on levels of analyses alone and which originated in sociological study (Riley, 1964) is useful
to descr ibe analyses w ithin occupational psychology. This typology defines individual analysis
as measurement carr ied out on the unit alone, such as measurement and correlation of an
ind iv idual's attitudes. Group analysis is descr ibed as measurement carr ied out on properties
of groups, sometimes relat ive to other groups of the same kind, as occurs in rank ing.
Structural analysis regards the group as the focus of data and conclusions, but ind iv idual
var iables are used for specifying the result or checking its validity. The fourth type of
analysis, that of contextual analysis, by pr imarily focusing on indiv iduals differs from

8
structural analysis, but individual relationships are checked or specified by accounting for
differences between the groups to which the individuals belong.
Gowler and Legge ( 1982) reported that structural and contextual analyses, in involving more
than one level, are regarded as more fruitful forms of analyses than group and individual
analysis. The information value of a finding is believed to be enhanced. This conclusion is
based upon Popper's ( 1 959) argument that the informative value of a finding has to do with
the degree to which it can be falsified, that is having a number of ways of showing a
statement to be false. It is argued that when analysis is at one level only, statements tend to
be more trivial , tend towards tautology and involve arbitrary, unstable operational definitions.
Research in the area of work adjustment can be categorised according to the above typology
to help clarify how fruitful an analysis might have been.
1.3 Psychological approaches to work and work adjustment
Employment has been claimed to have, apart from its social and its obvious economic
function, latent functions of immense psychological significance. For example, Roe ( 1956)
regarded work as important in the satisfaction of basic human needs. Jahoba (1979) identified
five major important categories of life experiences associated with work. These were, social
contact, enforced activity, involvement with collective purposes, time structure and status.
Despite its connotations of a relative lack of freedom, work has been regarded as more
important and of greater value than leisure. This is because it can motivate, challenge and
stimulate as well as provide resources of benefit to the individual (Brook, Kesha and George,
1987) .
The changes that have already taken place with respect to work and those yet to come can be
expected to continue to place demands on the adaptation of individuals to it. The primary
components of adjustment to work, as the individual and the work environment, can be
described as consisting of what individuals bring to the process and the effect the work
environment and interaction with it have on their behaviour. What individuals bring to the
process includes their basic attributes in relation to behaviour within organisations. Their
behaviour is expected to be affected by work environment factors such as different work
roles, work structures and organisational attributes. The above elements of work adjustment
are delineated in publications such as that of Landy ( 1 985) . He identified the individual's

9
attempts to adjust to the characteristics of the job, eo-workers, superiors and the
organisation's attempts to coexist with the characteristics of the worker, as an area of
particular interest within the broad area of the psychology of work behaviour. Landy
approached this area of individual adjustment and organisational coexistence from a molecular
view of individual's motives and affective responses to the work environment by looking at
work motivation and job satisfaction. He conducted a molar examination of the organisation's
expectancies and their effect on the employee's behaviour.
Scott (1961) identified a similar scheme as a way of understanding the behaviour of
individuals in an organisation. He argued for the examination of three elements. These were,
the requirements of the organisation, the characteristics of the individuals of the organisation
and the relationship between the organisational elements and the characteristics of the
individuals. In proposing such a scheme Scott was invoking different levels of analysis and
the study of their interrelationships.
Theories of organisation have influenced the study of work adjustment and work adjustment
related constructs, such as non-work factors, general adjustment, job satisfaction and job
success, subjective well-being and stress in the workplace, as set out in section 1 . 3 .2 . Work
adjustment study has largely taken place in vocational psychology with the emphasis initially
on developing psychometric measures (section 1 . 3 . 3) .
1 . 3 . 1 The theoretical approaches to the individual and the organisation
With respect to the examination of the organisation element of the behaviour of individuals
in an organisation, Landy ( 1985) suggested that factors such as its formal characteristics
might only be considered important to the extent that they exemplify the values, beliefs,
attitudes and predispositions or behaviours of organisational members and the extent to which
they have the capacity to help explain differences in the behaviour of organisation members.
In an effort to understand the influence of the organisational principles on the behaviour of
workers, the characteristics of both the individuals who function within the environment and
the characteristics of the environment itself, come under consideration. Different theories have
placed differing emphases upon these influences. The early theories of organisation
emphasised the immediate organisational environment and key variables within it as important
in relation to worker behaviour. These so called classic theorists, of which Weber ( 1947) is

10
the best known, argued that variables like the size and number of supervision levels were
responsible for organisational success and efficiency. The variables were considered to be
independent of the individual and a best way of organisation was prescribed, in order to affect
the behaviour of workers to lead to benefits such as maximising worker satisfaction and
productivity and minimising absenteeism and turnover.
A later perspective, that of the human relations approach, identified the importance of the
recognition of psychological characteristics, such as the need of individuals for independence
or affiliation or stimulation. This approach emphasised the personal perspective, making
things like satisfaction, motivation, interpersonal conflict, or leadership, key issues. This
approach to organisation theory has been identified by Landy ( 1985) as fitting best with
Scott's ( 196 1) third e lement, the relation between the organisational requirements and the
characteristics of the people in it. The human relations approach can be represented by the
work of McGregor and his Theory X/Theory Y ( 1960) , involving managers' beliefs about
subordinates' behaviour and the effect such belief systems have upon behaviour. The approach
can also be represented by the more developmental theory of Argyris ( 1972) who contrasted
the way individuals develop in the context of restrictions placed on that development by the
organisation. A lack of congruence between forms of work and the level of the development
of the individual would be seen as predictive of worker behaviours such as absenteeism,
turnover, unionization and apathy. Important to these examples of the human relations
approach is the notion of matching the goal system of the individual to the requirements of
the organisation.
Of the key issues in the human relations approach, the motivational approach has been one
of the major influences in the psychology of work behaviour and has included need,
instrumentality, goal-setting, equity, reinforcement, self-efficacy and physiological theories.
The latter two have had less of an influence for reasons such as lack of data and lack of
application to the occupational area because they are relatively new theories. The need
theories have had particular relevance. Industrial/Organisational Psychologists have applied
need theory assuming that individuals strive to meet their needs in the work setting. An
understanding of how these needs are met is expected to lead to an understanding of work
related behaviour such as work adjustment. The need theories have tended to categorise needs
in consistent ways semantically, but have differed in the number of needs proposed, the
interrelationship of needs and the process of moving from one need to another. The models
1 1
have ranged from the five need hierarchy of Maslow ( 1943), to Aldefer's ( 1969) three level
hierarchy, to Herzberg's two factors (Herzberg, Mausner, Peterson and Capwell, 1 959 ;
Herzberg, 1966) to the proposal of a single need, the need for achievement and power
(Murray 1 938; McClelland, 1 955) and the incorporation of cognitive elements in the latter
(Atkinson, 1964) .
The many problems associated with need theories have limited their validity. Wahba and
Bridwell ( 1976) noted some of these difficulties to be conceptual and operational in nature and
related to questions such as whether needs have a physiological or psychological basis and
whether they are always in existence or only because of a deficiency. The difficulty of the
identification and measurement of needs, the failure of data to support the various approaches
entirely and the questionable integrity of the needs approach have all been issues of concern.
The need approaches being referred to as 'theories' was questioned because they have lacked
a tight set of interrelated propositions that can be empirically tested.
An alternative to both the classical and human relations approach has been apparent in the
contingency perspective where the choice of the configuration of an organisation does not
involve a single best way but is dependent upon particular environmental variables. For some
theories these variables might involve technological aspects of environments. For example,
Woodward ( 1958) viewed span of control as dependent upon type of technology. In the case
of Lawrence and Lorsch (1967) , organisational characteristics were believed to be dependent
on the amount of change the organisation was experiencing. Other contingency theories
emphasised social aspects. This sociotechnical movement, based on both classical
organisational theory and human relations considerations, contended that organisations ought
to be arranged with the interaction of social patterns and technological change in mind. This
approach has become identified with the Tavistock Institute of Human Relations and
Researchers' (Trist and Bamforth, 195 1 ; and Rice, 1958) examination of the social
consequences of technological change in the coal-mining industry.
From the perspective of both the individual and the organisation and their interrelationships,
a more cognitive element is evident in the organisational climate approach. This has been
described as the perception of the objective characteristics of the organisation by its members.
Climate can be viewed as an individual's concept of the "personality" of the organisation.
Landy ( 1985) outlined the research of Litwin and Stringer (1966) as reported in their paper
12
presented to a conference on organizational climate. They proposed six distinct organisational
climatic factors, those of structure, individual responsibility, rewards, risks and risk taking,
warmth and support and tolerance and conflict. These factors have been said to be descriptive
of the way an organisation treats its members, that is its personality.
Much of the work in the area has been aimed at identifying definitive parameters (Campbell,
Dunnette, Lawler and Weick, 1 970; Sims and LaFollette, 1 975 ; and Muchinsky, 1 976) .
Organisational climate has been found to be a sole correlate of performance for the previously
hard-core unemployed (Friedlander and Greenberg, 1 971) . The research has supported
organisational climate as a distinct construct separate from others such as job satisfaction. It is thought to be represented by the characteristics of autonomy, structure, reward and
consideration (Campbell , Dunnette, Lawler and Weick, 1970) . As Payne and Pugh ( 1976)
depicted, climate is an excellent point of entry into the open system that includes the
individual , the organisation and the environment. As such, it can provide information relevant
to the match between organisational structure and individual characteristics and has particular
relevance for the work adjustment process.
Another theoretical approach involving the interaction between the individual and the
organisation and their mutual adjustment, but one which is more sociological in orientation,
is that of role conflict and role ambiguity. These constructs have been regarded as negative
by-products of organisational growth. An example of a role conflict approach has been that
of Miles and Perreault ( 1976) . They described four types of role conflict. One type was
person-role conflict with an individual wanting to do things in a manner different from that
suggested in a job description. A second type was intrasender conflict, described as the
individual receiving an assignment with insufficient staff to carry it out successfully. A third
type of role conflict was intersender conflict which involves an individual being asked to
behave in such a way that one person will be pleased with the result while others will not.
A fourth type of conflict has been described as role overload which involves the assignment
of more work than an individual can handle effectively. Such competing demands are
expected to produce stress in individuals which result in dissatisfaction and performance
difficulties.
The concept of role ambiguity, or the extent to which an individual understands what the job
requires, has often been studied along with that of role conflict . It has been expected to have
13
a similar effect on satisfaction and performance. Role ambiguity is concerned with the extent
to which an individual understands what the job requires. Landy (1985) notes the implications
role related concepts have for theories of work motivation, goal setting and leadership. The
Porter-Law ler model is given as an example. With respect to role conflict, it is thought that
instrumentalities, valences and expectancies, may cancel one another. W hen for example the
job description calls for certain behaviour but common sense calls for different behaviour,
difficulties with defining good performance could result. This would be an example of
inappropriate role perception in the Porter-Law ler model.
1.3.2 Work adjustment related constructs and theories
The study of work adjustment has been influenced not only by the different perspectives
associated with the individual, the group and the organisation, but also by the different areas
of applied and general psychology. Like most areas in psychology Industrial and
brganisational Psychology has its roots in experimental psychology, differential psychology
and industrial engineering, including time-and-motion study and the design of work and work
machines. These combined influences and the emphasis on the human characteristics, feelings
and reactions of individuals, affected the way in which Industrial/Organisational Psychology
has developed. Landy (1985) reports that three independent movements have evolved, the
testing movement (Personnel Psychology) which drew heavily on the individual differences
approach, the human relations movement (Social-Industrial Psychology) which was initiated
by the Hawthorne studies and the experimental/industrial engineering approach, which used
the methods of industrial and organisational engineering. Each movement developed relatively
independently with its own techniques and advocates. However, the overlap of the three
distinct, but related areas has received recognition such that the interdependence of social
organisational structure, machine and system design and worker characteristics has, according
to Landy, come to define the science of work behaviour.
The fourth major and more recent influence has been the so-called cognitive revolution which
has taken cognitive theory into account. Some problems of appraising performance have been
recast as cognitive rather than organisational or procedural. The cognitive complexity of many
tasks, rating tasks for example, have been considered. In the systems design area, information
processing capacities have been recognised as playing a major role in work environment and
work tasks design. The understanding of cognitive variables and processes has been

14
recognised as responsible for major advances in the identification of stressors and the
reduction of stress at work.
Work adjustment theory development and research itself has taken place often at the interface
of Industrial/Organisational and Vocational or Counselling Psychology. These have taken
work, although different aspects of it, as their primary focus. Work adjustment has been
closely related to other concepts of adjustment such as well-being in relation to work and
stress as related to work. The relationship to and interaction of the non-work setting with
work has been considered in the comparisons made of work and general adjustment (Crites,
1969) .
Work adjustment initially tended to be examined in relation to general adjustment in an effort
to define it as a separate construct (Crites, 1969) . Personal maladjustment of workers had
been found to be directly related to their work adjustment (Fisher and Hanna, 193 1 ; Paterson
and Darley, 1 936) . Super ( 1 95 1 ) viewed work adjustment as a specific aspect of personal
adjustment, expecting that change in one would affect the other. Forer (1953) argued that
occupational adjustment could improve personal adjustment by gratifying needs not gratified
in non-occupational behaviour and by allowing an outlet for neurotic needs whose expression
in other situations would lead to difficulties. Vocational adjustment has been regarded as a
function of general adjustment by psychoanalysts (Menninger, 1942) , adjustment psychologists
(Schaffer, 1 953) and occupational sociologists (Clark, 1953) . Others such as Ginzberg (1962)
argued that the two concepts were not necessarily related. Hoppock (1963) allowed for some
correlation between the two but argued the causal direction would be situation dependent.
Super ( 1957) , in response to the findings that a relationship between work and general
adjustment seemed to be moderate and not always clear, suggested that basic personal and
social modes of adjustment learned in the primary social situation set the pattern for
adjustment in other situations. Super believed general adjustment to be definable in terms of
several kinds of adjustment which are only partially interrelated. As a result no one type of
adjustment was expected to correlate highly with the composite of general adjustment. Crites
(1969) expected the occupation itself to attenuate or accentuate the relationship between work
and general adjustment. He argued that in some occupations a better-adjusted worker might
be a poorly adjusted person because of the nature of the work. Being adjusted to certain types
of work can be incongruent with being adjusted to society itself.
15
Crites developed his own model of work adjustment which depicted it as a process w ith
several components which interact, in a similar way to those of Bakke ( 1953) and Super
( 195 1). A worker was said to be mot ivated by external or internal stimuli to behave in certain
ways, such as seek help from eo-workers. When behav iour was impeded either by external
circumstances, referred to as f rustration, or by competing response tendencies, referred to as
conflict, the worker t ried to adjust by making a response to eliminate the thwart ing conditions
or reduce the tensions arising from them. Work adjustment was expected to be achieved by
an effect ive response and to result in either job sat isfact ion or job success.
Other researchers had proposed job satisfaction and job success as ways of evaluat ing work
adjustment (Lurie, 1942 ; Lurie and Weiss, 1942 ; Heron, 1952a, 1952b, 1954 ; Gellman,
1953 ; and Scott, Daw is, England and Lofquist, 1960). Crites added occupational persistence
(Strong, 1943, 1955) and vocat ional fitness (Scott, Daw is, England and Lofquist, 1960) to
the criteria of work adjustment. Work adjustment, often referred to as vocat iona l adjustment
in this early research, was v iewed as a developmental process w ith discernible stages (Miller
and Form, 195 1, 1964 ; Super, 1957, 1963) projecting over the total span of the work years.
Another construct which is related to and could be v iewed as an indicator of general
adjustment is that of subject ive well-being. In the literature the cost of work to the worker
has been considered in terms of well-being and stress. Both areas of research relate to the
construct of work adjustment, stress both initiating and affect ing the work adjustment process
and the achievement of work adjustment and well-being.
Consistent w ith the classical perspective, in itial approaches to work and well-being involved
examining concepts such as work safety and the ident ificat ion of elements in the work
env ironment which are aversive. There are many potent ial stressors in the objective work
env ironment of a physical and psychological nature, such as sound, noise, heat and cold,
which can affect informat ion processing and performance on the part of the worker
(McCorm ick, 1957; Poulton, 1970; Broadbent, 1954 ; Jerison, 1957; Finkelman, Zeit lin,
Filippi and F riend, 1977; Teichner, Arees and Reilly, 1963), either singly or in combination
(W ilk inson, 1963, 1969, Broadbent, 1971). However, a broader approach has emerged w ith
the examination of the psychological demands associated w ith work, that is the relationship
between stress and work. Stress in the workplace has implications for the work adjustment
of indiv iduals. Various theories of stress have emerged, examples involv ing the short and

16
long-term consequences of stress (Glass and Singer, 1 972) and viewing life events as having
stress values which have a cumulative effect on well-being (Holmes and Rahe, 1 967) . This
stress/vulnerability type of model implied that for work these accumulated negative effects
would include illness, dissatisfaction and poor performance which could culminate in
withdrawal through absenteeism and turnover.
Another theory of stress is a person-environment fit model which emphasises the match
between characteristics of individuals and the environment. A number of theories of human
stress (for example, Pervin, 1 968; French, Rodgers and Cobb, 1974) and performance
(McGrath, 1976) are based on the programmatic view that behaviour is a function of
characteristics of the person and of the environment (Lewin, 1935; and Murray, 1 938).
With respect to the work of French et al, for example, environmental events were not seen
as universal stressors. Instead the stress values of events were regarded as dependent upon
the individual's perceptions of the environmental demands and their own capacity and
motivation to meet them. Such an approach is more cognitive in emphasis and is consistent
with a definition of stress given by McGrath ( 1970) which identifies stress as a perceived
substantial imbalance between demands and response capabilities which has important
perceived consequences.
A person-environment fit approach with a long research history, developed within vocational
psychology, supported by instrumentation, currently still in use and influential in the work
adjustment area, is that of Holland ( 1 959) . He proposed that individuals develop a hierarchy
of adjustive orientations or preferred modes for dealing with the environment . He used these
same six orientations of realistic, investigative, artistic, social, enterprising and conventional ,
as defined in appendix F, to also describe occupations or environments. His model depicted
the orientations in a hexagonal shape with adjacent types being more similar to those further
away on the hexagon, see appendix F. The degree of congruence between an individual's
main orientation and that of their chosen occupation was believed to be predictive of job
satisfaction and tenure. An individual's personality or orientation was regarded as high on
consistency if the modal orientation involved two adjacent on the hexagon, but low on
consistency if the orientations were distant from each other. Individual preferences can be
measured by Holland's Vocational Preference Inventory (VPI) , ( 1965) and by the self
administered Self Directed Search (SDS), (1971) . The latter has been revised for the New
Zealand setting (Keeling and Tuck, 1 982) . Individuals with a differentiated score profile, that

17
is one in which a discernable difference between orientations was evident through the scores,
are expected to find it easier to make a career choice.
The person-environment fit approach rejected that stressors alone were sufficient to account
for the experience of stress. The perception of the objective world, the presence of defense
mechanisms and the effect of social support, all became considered. More reminiscent of the
human relations perspective was the next so-called logical model (Landy, 1985) that of Type
A personality and behaviour (Friedman and Roseman, 1974). This stress/vulnerability
approach emphasised the characteristics of individuals rather than the environment or the
person-environment fit.
Another model in stress research (Karasek, 1979) has highlighted the contradictions that have
become apparent in the stress literature. High demand characteristics have been found in both
assembly-line workers and executives, but they have not been equally satisfied (Quinn,
1971) . Karasek considered environmental stressors had been emphasised without taking what
he considered to be a mediating influence into account; that is the extent to which an
individual has control over important decisions. Payne (1979) extended this model by
emphasising the idea of individual's perceptions of demands and decision latitude as critical
and by including the concept of support. Support here referred to the environment making
available resources of a natural , physical , intellectual , technical and social kind.
Each of the approaches to work adjustment related concepts imply certain strategies for
managing or reducing stress and consequently improving adjustment. These approaches
include, behavioural intervention, physiological intervention, job design and redesign and
cognitive intervention.
1 . 3 .3 Work adjustment theories in vocational psychology
The initial focus in vocational psychology on work adjustment was two-fold. Firstly, it lay
in developing psychometric measures in the areas of vocational choice and personnel
selection, of which Holland's and the work of others at Minnesota University is an example.
A second area of focus was in the less vocationally oriented areas of work motivation,
employee morale and worker productivity. Each of the psychometric measures developed had
some relevance to work adjustment problems but produced relatively independent bodies of
18
research literature. A review of the literature on aspects of work adjustment by Scott, Dawis,
England, and Lofquist ( 1960) had revealed that to achieve a systematic investigation of the
area of adjustment there was a need for an integrating theory. Lofquist and Dawis ( 1969) and
Dawis and Lofquist ( 1984) set out to achieve this. They produced over 30 technical
monographs in the Minnesota Studies in Vocational Rehabilitation, many published papers
and two books (Lofquist and Dawis, 1969; Dawis and Lofquist, 1984).
Dawis, Lofquist and their associates responded to much of the criticisms of the trait and
factor tradition, as Holland had to a certain extent. They agreed that it was atheoretical and
unsuccessful in accounting for the process of career development (Crites, 1 969) . Crites
characterised their theory as one built upon basic psychological concepts of, stimulus-response
and reinforcement and one which has encompassed many of the points of view of the previous
approaches. Their approach was said to have incorporated the developmental aspect of more
recent trait-and-factor theory, in particular the concept of vocational fitness, the value of
knowledge about work histories of the developmental approaches and the need orientation of
psychodynamic theory. By developing a model comprised of a set of interrelated empirically
testable propositions the title of theory was justified to a greater extent than had been the case
with the other need approaches . It has been identified as one of three dominant approaches
in vocational psychology from the 1970s (Hackett, Lent and Greenhaus, 1991) , the others
being Super's developmental theory ( 1953; 1 957) and Holland's typology approach ( 1959;
1965).
Like person-environment fit theory, that of Holland's in particular, Dawis and Lofquist's
theory of work adjustment proposed an interaction between the individual and the work
environment . The key concepts involved were those of the work personality, the work
environment and the correspondence between the individual and the environment. The
indicators of this process were said to be job satisfaction, job satisfactoriness and tenure.
Dawis and Lofquist's theory ( 1984) can be summarised in the following way. Seeking
correspondence between the individual and the work environment is a basic motive of human
behaviour. The degree of correspondence is defined as the extent to which the individual
fulfils the work requirements of the work environment, that is achieves satisfactoriness and
the extent to which the work environment fulfils the requirements of the individual, that is
degree of job satisfaction. Work adjustment was defined as "the continuous and dynamic
19
process by which an individual seeks to achieve and maintain correspondence with the work
environment" (Dawis and Lofquist, 1984, p 55) . Tenure was viewed as the basic indicator
of correspondence, it was expected to increase when correspondence increased. A lack of
correspondence was expected to be associated with leaving the work environment.
The individual's work personality and their work environment were described in parallel
terms, each being said to have a structure and style. Personality structure consisted of the
skills and needs of individuals, or their reference dimensions or factors of abilities and values.
The environmental structure consisted of the skills requirements and needs reinforcers, or
their reference dimensions of ability requirements and reinforcer factors. The reference
dimensions were the factors produced via factor analysis. The characteristic patterns of these
reference dimensions for occupations were referred to as an occupational ability pattern and
an occupational reinforcer pattern. Personality style described individuals' customary ways
of interacting with the environment. The style of the work environment was depicted in terms
of its requirements for speed of response, level of activity, typical pattern activity and
duration of response.
1 .4 An outline of the approach of the present research
The present research arose from an interest in work adjustment as a potentially key factor in
the probability of individuals remaining in any one job or career. The stimulus for the
research was an awareness of continual change in the nature of work and its relationship to
non-work, the changing relationship of individuals to their work and the changing
expectations of societies in relation to work. The research pays attention to person
environment fit in the work adjustment process covering areas traditionally the domain of
both counselling and organisational psychology. It has been influenced by topics of the
counselling tradition such as the study of congruence and individual decision making in
educational and career choice. It has been influenced also by topics typical of organisational
psychology, such as job satisfaction and performance. However an attempt is made to avoid
the failings identified by Hackett, Lent and Greenhaus (1991) of the counselling and
organisational psychology approaches. They noted the underplaying of contextual factors
evident in the counselling research and the overemphasis of managerial perspectives of
organisational psychology.
20
A converging theme of both approaches is represented here by introducing a more cognitive
perspective, by the use of the constructs of self-efficacy, subjective well-being and perceived
work satisfactoriness. Some integration of levels of analysis, those of the individual and the
group outside the work setting in particular, is attempted by including social issues, such as
the importance of social support to work adjustment and perceived job satisfaction relative
to that of an individual's reference group.
The primary research question was whether one of the most comprehensive and testable
theoretical frameworks, that of Dawis and Lofquist ( 1984) , would account for aspects of work
adjustment behaviour in the population of interest. The population concerned was that of
tertiary students, mainly University but some teaching students, as groups in the latter stages
of educational choice and in the early part of career choice and work adjustment. The
respondents were studied both in the second term of the final year of their studies and a year
later. As a group, graduates offered the opportunity for longitudinal study, for gathering work
and general adjustment measures both prior to and upon taking up employment .
The existing criticisms of Dawis and Lofquist's theory were considered and some changes and
additions to the model were believed necessary in order to respond to those criticisms and
others which arose in preparation for the present research. The latter criticisms were related
to two areas. The first was a belief that Dawis and Lofquist, by placing little emphasis on
cognitive factors and placing only some emphasis on personality ones, whilst ignoring the
influence of social and non-work factors with respect to work adjustment, had not entirely
fulfilled their aim of producing a theory which would integrate the literature. The second was
concern about an apparent incomplete use of factor analysis in determining the factor structure
of work needs. The possibility of the existence of higher order needs had not been
considered. Consequently, the theory was expected to have some limitations generally and
specifically with respect to the respondent group whose members typically are young and in
the early stage of their working life. As such they might be expected to be particularly
influenced by cognitive factors such as their own degree of confidence and by social factors
such as social support and the influence of their peer group.
The appropriateness of applying aspects of Dawis and Lofquist's theory to graduates as a
group in early employment was particularly considered. The key concepts of interest in Dawis
and Lofquist's theory, such as job satisfaction, were expected to occur and vary in this group

2 1
and therefore be variables available for measurement . Job satisfaction was expected to b e of
importance to this group many of whom could be expected to be career oriented . The lengthy
study they had usually undertaken in preparation for employment would suggest they might
be career orientated and or at the least place work in a position of some importance in their
lives. As such they would probably have an expectation of achieving some degree of job
satisfaction. By including graduates from numerous different academic disciplines a wide
range of work needs would be expected to be represented and also comparisons could be
made in terms of Holland's personality type of adjustive orientations.

23
CHAPTER TWO
REVIEW OF THE RELEVANT LITERATURE
With respect to work and the individual's relationship to it, Dawis and Lofquist ( 1984)
examined the meaning of work through its various definitions. "Typical definitions include
activity engaged in for pay to make a living or to earn money; activity that occupies much
of the waking day (occupation); activity that uses abilities or skills in some social or
economic enterprise (employment) ; activity that one is called upon to do (vocation) ; or activity
that one contracts to do (job) " (p 3) . Many of these definitions have been interchangeable in
common usage.
The above definitions view work as an activity. More complete and broader definitions, such
as that of Roe ( 1956) , had viewed work as the main focus of the activities and thoughts of
an individual . Dawis and Lofquist (1984) argued that if individual's lives develop around
work and if it is an important medium for total adjustment, then work comes to mean more
than just the list of activities associated with it. They argued that to be fully understood, work
needs to be looked at in the historical and social context of the work values of the particular
society to which an individual belongs. For example, historically, for preindustrial society,
work was said to be " (1) a hard necessity, painful and burdensome; (2) instrumental , a
means towards an end, especially a religious end; and (3) a creative art, therefore intrinsically
good" (Dawis and Lofquist, 1984, p 5) .
The relationship between the individual and work can be regarded as basic to consideration
of the work adjustment process. The theoretical and research areas which form a background
to the work of Dawis and Lofquist and others at the University of Minnesota relate to the
individual's relationship with work and its antecedents and consequences. Motivation to work
has been a commonly studied work antecedent, whilst the rewards of work, job satisfaction
and productivity have been among the work outcomes predominantly studied. Because job
satisfaction and productivity can themselves have further consequences, for example on future
productivity and tenure, the factors affecting them have been of particular interest (as
described in section 2.2. 1) . The relationship between job satisfaction and tenure has been
given particular attention. It is out of the broader context of personality theory, motivation,
job satisfaction and performance theory and research that models have emerged such as those

24
of Dawis and Lofquist which in focusing on individual work behaviour and employee
attributes, values and personalities, involve the key concepts of satisfaction, satisfactoriness
and tenure.
2 . 1 Personality theory
A major objective of psychologists in their theorizing has been to identify universal
characteristics and principles of human functioning while taking into account individual
differences and the uniqueness of each person. Staub ( 1980) noted that "personality
psychology is concerned with universal characteristics of human beings and differences among
them" . He recognised that personality psychology is concerned not only with how persons
with a variety of characteristics function but also with seeking to provide a conception of
human beings in general. Examples given of such theories which strive to provide universal
descriptions were: psychoanalytic theory, certain cognitive theories and social learning theory.
The importance of the uniqueness of individuals versus the things they have in common is
evident in the use of the two different approaches of nomothetic (the study of groups leading
to universal characteristics and general laws) and idiographic (the intensive study of
individuals) . An advocate of the latter approach, such as Allport ( 1 937, 1961) , recommends
the study of individuals in terms of their uniqueness and therefore the use of in-depth case
studies. The argument against focusing on the uniqueness of every individual is the potential
inability to generalise to others. Yet the aim of science is often to find laws or principles
which are applicable to at least a significant group of individuals. Therefore, in order to
contribute to a science of psychology we need to take both approaches into account. Staub
(op. cit.) has concluded that, "While we may want to understand each person's complexity
and uniqueness, we certainly want to know what ways people are similar to some others and
in what ways they are similar to all other people" , (p.4) .
2 . 1 . 1 The different definitions and theories of personality
Within personality psychology, the term personality has been difficult to define in a precise
way. Its meaning can be app roached by looking at various definitions and theories of
personality which have emerged. However, concise definitions have not been able to give a
full account of the broad content of this area and they tend to reflect an individual differences
25
emphasis. Guildford's ( 1959, p.5) definition of personality as " a person's unique pattern of
traits " and Mischel's ( 1976, p.2) "distinctive patterns of behaviour" are examples of this. A
notable exception has been McClelland's ( 1951 ) definition of personality as "the most
adequate conceptualization of a person's behaviour in all its detail " , (p. 69) . Staub ( 1980)
noted various emphases in definitions of personality; Mischel ( 1976) focused on how
individuals adapt to situations in their lives ; for Sullivan ( 1953), interpersonal situations were
identified as the defining aspect; Allport ( 1961 ) emphasised personal characteristics and their
organisation (seen as dynamic and variable) . Most of the definitions are said to imply a
constancy in individual characteristics.
In describing aspects of personality, Staub ( 1980) commented upon the existence of a
dichotomy between characteristics apparent on the surface and those which lie underneath. He
noted that psychologists such as Maslow and Rogers imply that the inner person is more
genuine than the one indicated by the surface presentation. Staub agreed that it is appropriate
to distinguish between self-presentation and the thoughts, behaviours, desires and other
characteristics which may underlie it. He thought also that we should be concerned with both
and with the relationship between them. In general, personality psychology has focused not
so much on the human capacities per se (such as physical abilities and intelligence) but on
how they are modified by personal characteristics, like motivation and attitudes, when they
are expressed in differing situations (of which work is an example) .
Hall, Lindzey, Loehlin and Manosevitz ( 1985) in examining the influences of other traditions
on personality theory, traced its origins to early classical scholars (such as Hippocrates, Plato
and Aristotle) as well as to other great thinkers over the centuries. The study of personality
and the discipline of psychology as a whole show dissimilarities, in part as a result of their
having different origins. The discipline of psychology generally was said to have arisen
gradually in the late nineteenth century out of philosophy and experimental physiology,
whereas the study of personality arose from the theory and practice of Medicine and the need
to understand the 'patient' or the 'abnormal' person. On the one hand personality theorists
such as Sigmund Freud and Karl Jung worked mainly with clinical data while on the other
hand the study of phenomena such as perception and memory began the experimental and
learning approaches to psychology. Theorists such as Herman von Helrnholtz, Wilhelm
Wundt and John B. Watson belonged to the latter group.

26
Because of its different origins and purpose, personality theory has been recognised as functional in orientation, as also rebelling against accepted theory and research techniques and
as lacking in the disciplined systematic approach of traditional scientists. The theorists have
been interested in the motivation process and the study of the whole person. The theories have
acted as an integrative force often drawing together findings of studies relating to parts of
individuals' functioning. Personality theories themselves often focus on only certain aspects
of human behaviour. They have not been credited with achieving a grand theory or paradigm
which (as defined by Kuhn, 1962) provides a compelling way of looking at a problem and
a solution for a whole area of scientific research.
2 . 1 .2 Personality theory, Dawis and Lofquist's theory and Personality theory traditions
A discussion of personality theory is of particular relevance to Dawis and Lofquist's theory
for the following reasons. A large component of their theory is to do with work personality
specifically but they also advocated their theory has relevance for personality theory more
generally. They began by focusing on work adjustment behaviour specifically but later when
the theory was more fully developed they suggested it had application for many different
areas (some more closely allied to work than others) . The applications they suggested were
for use in vocational counselling, personal counselling, adjustment to retirement and
organisational and societal development. They went as far as to suggest that the concepts in
the theory of work adjustment "might serve as a more general theory of behaviour and, in
particular, as a theory of personality because it is rooted in basic psychological concepts as
they might relate to a major part of human behavior - work" (Dawis and Lofquist, 1 984, p
145 . ) In this way they appear to be postulating a paradigm. Their theory does focus
exclusively on the interaction of a work personality and work environment, in particular the
degree to which individuals' work personalities (made up of their work needs and abilities)
are reinforced by the work environment (the ability requirements and work need reinforcers
of the work environment) to produce satisfied and satisfactory workers more likely to remain
in the environment. However, Dawis and Lofquist suggested that the needs and ability
requirements could be identified for any environment and the theory would then have a
general application.
A look at the origins of personality theory (as discussed above) , the influences on it, its status
both at the time Dawis and Lofquist developed their theory and currently, is aimed at placing
27
their theory in context and comparing it with current personality theory, in particular
identifying aspects they have excluded.
The influences on personality theory have been identified by Hall et al (op. cit) as involving
four traditions. One was the tradition of clinical observation said to begin with Jean-Martin
Charcot, a French neurologist and psychiatrist 1 825- 1893) , to include Sigmund Freud ( 1 856-
1 939) and to have done more than any other single factor to determine the nature of
personality theory. Another influence was that of the gestalt tradition where human behaviour
was studied as a unit rather than a collection of small parts. The focus tended to be on the
individual ' s perception of self and the environment. It is represented by theorists such as
Maslow, Rogers, B inswanger and Boss, Lewin and Kelly. A third tradition was that of
experimental psychology (in general) and learning theory (in particular) . This tradition is
especially concerned with properly controlled research, better theory construction and detailed
accounts of how behaviour is modified. The fourth tradition, the psychometric one, in
focusing on individual differences, brought an improvement in the measurement of behaviour
and the analysis of data. Theorists exemplifying this tradition are Cattell and Eysenck and to
some extent Murray, Allport and Sheldon.
The current personality theories have been said (Hall et al op. cit . ) to make certain basic
assumptions about human behaviour which reflect theorists ' stance on some major issues
which face personality theorising. The theorists have been said to fall either somewhere on
a continuum, with regard to the extremes of any one issue or dimension of personality (such
as the importance of past or present factors determining behaviour) , or to take both extremes
into account . The basic assumptions about human behaviour were identified as involving the
following issues : a) conscious versus unconscious; b) acquisitions versus the process of
learning; c) heredity versus environment; d) past versus present; e) holistic versus analytic;
f) person versus situation; g) purposive versus mechanistic; h) a few motives versus multiple
motives ; and i) normal versus abnormal . Each of these assumptions can be briefly described
as follows.
The conscious versus unconscious issue is to do with whether rational process or irrational
factors control behaviour. Although most theorists admit to both existing, for some, one or
the other is given greater importance. Unconscious factors were emphasised by theorists such
28
as Freud, Jung and Murray. The other end of the continuum is represented by Roger 's ,
All port ' s and Lewin' s positions.
For some theorists, for example, Murray, Allport and Cattell, the acquisitions (or structures
of personality or the outcomes of learning) are of key importance. Whilst for others, such as
Skinner, Dollard, Bandura, the learning process (the way in which behaviour is modified) has
been regarded as the key to all behavioural phenomena. According to Hall et al (op. cit .)
most modern personality theorists were said to deal with both in some way. For example,
Miller and Dollard ( 1 941 ) include the structural concepts of psychoanalysis into their learning
theory. Most personality theorists view development in global terms like maturation,
individuation, self-actualization rather than detailing the learning process. The acquisitions or
structures of personality are not thought of as objects with existence in time or space but as
aspects of personality that are more enduring than other more changeable elements.
On the heredity versus environment issue, many personality theorists, American psychologists
in particular, are said (Hall and Lindzey, op. cit . ) to have minimised genetic and biological
factors as determinants of behaviour whilst European theorists such as Freud and Jung
emphasised them. Theorists such as Sheldon in the late 1 920s and Eysenck from the 1 950s
on, are credited with placing considerable emphasis on inherited tendencies. Hall and Lindzey
identify Murray and Allport as occupying a more middle-of-the-road position on the heredity
versus environment issue. More recent research in the area of behaviour genetics (using
identical and fraternal twin or biological and adoptive sibling comparisons) has tended to
support the influence of such tendencies on personality (Loehlin and Nichols, 1976; Young,
Eaves and Eysenck, 1 980; Floderus-Myrhed , Pedersen and Rasmuson, 1980) .
Theorists are no longer so much divided on the issue of whether mainly past or present
factors determine behaviour, but rather whether factors influencing present behaviour can be
assumed by observing that behaviour or whether knowledge about past events contributes
critical information. Theorists such as Freud and Erik Erikson were given as examples of
personality theorists for whom events occurring in the earliest years of development are of
paramount importance.
In the holistic versus analytic debate few contemporary personality theorists completely reject
the holistic approach and the individual is usually regarded as a total functioning unit.
29
However, Hall and Lindzey noted that theorists (Cattell, Eysenck, Skinner, Miller, Dollard
and Bandura are given as examples) do question to differing degrees the importance of
studying the whole individual. Those adopting a holistic view generally suggest that a
successful theory must be complex and multivariate and include the situation within which a
behavioural event occurs.
On the issue of theories of personality being either purposive (behaviour is goal oriented such
as seen in the work of Adler) or mechanistic (events explained entirely in terms of their
antecedents and behaviour accounted for by way of physical laws and principles), many
theorists maintain intermediate positions. Hall and Lindzey suggest theorists such as Skinner
and Eysenck at one extreme did not consider purpose critical to understanding behaviour.
Examples of theorists at the other extreme are Adler, Rogers, Binswanger and Boss, Kelly
and Allport in their emphasis on a purposive view.
Hall and Lindzey in discussing motivation as an issue in personality theory observe that it has
been represented in terms of a few variables or many. For Adler, Maslow, Rogers and Kelly,
the number of motives involved were said to be limited. Whilst for theorists, such as Lewin,
Murray, Allport and Cattell a large number of motivational variables are used to explain
behaviour.
Many theories of personality developed from a clinical concern with changing behaviour
which was indicative of psychological distress of some kind. On a normal-abnormal behaviour
continuum, most of the personality theorists fall somewhere in between (whether they be
psychotherapists or researchers basing their information on the 'abnormal' behaviour of
individuals) . Freud, Adler, Homey and Sullivan were placed by Hall and Lindzey (op. cit . )
at the abnormal end of the continuum and Maslow, Lewin, Kelly, Allport and Cattell , were
placed at the end concerned with the normal individual.
The person-situation debate has been concerned with whether behaviour is mainly the product
of the inner processes of individuals or a product of the situation or environment in which
they exist. Most theorists seem to subscribe to some form of interactionist view such that the
person and the situation are both viewed as critical in determining behaviour. Only theorists
such as Skinner (who located all causal factors ultimately in the environment) and Binswanger
and Boss (who locate the main determinants of behaviour within the person) can be located

30
at either extreme. The importance of sociocultural factors in personality has been closely
linked to the person-situation issue.
Dawis and Lofquist's theory is analysed according to the above issues or dimensions of
personality in the section concerned with the present research and placing their theory into
theoretical context (section 3 . 1 1 of chapter three) .
2 . 1 . 3 Current Personality Theory
In tracing the development of current personality theory and the changes which have occurred
over time Staub ( 1980) has noted that the traditional theories of personality tended to be all
encompassing and to do with varied aspects of psychological functioning. The focus and the
method of assessing personality has varied. Psychoanalytic theory focused on unconscious
motivation and intrapsychic conflicts, Rogerian theory on the nature of human consciousness
and subjective awareness and behaviourism, and social learning theory on overt behaviour and
principles guiding the acquisition of responses (behaviourism emphasized outwardly
observable behaviour and paid little attention to inner processes such as fantasies, thoughts
and feelings because these cannot be easily measured) . These comprehensive theorists
assumed their focus to be central and as a result tended to derive all other functioning from
their theories. Staub ( 1980) concluded that some aspects of these traditional theories have not
survived unmodified. Cognitive processes have been given a central role in later social
learning theory (Bandura, 1977b; Mischel , 1973, 1977) . Carl Rogers's notions are
represented in "self" theories. Much of the theory and research in child development (Staub,
1979) has been influenced by Freud's ideas of a child identifying with socializing agents and
internalising beliefs, values and behaviour.
There has been a tendency for some of the approaches to personality theory to have become
integrated. Epstein ( 1979) in reviewing personality theory and proposing an integrated theory
argued that to ignore all that is subjective, psychologists would have to ignore a great deal
of behaviour that is uniquely human. Phenomenologists have tended to believe behaviour can
only be understood from the viewpoint of the individual . Cognitive psychologists emphasise
the mediating concepts that individuals use to interpret the objective world. The cognitive
approach is viewed as an attempt to integrate the study of objectively oriented behaviour and
the work of the subjectively oriented phenomenologist by focusing on the processes used by
3 1
the individual (through cognitions) to transform the objective world into a subj ective one. A
theorist such as Kelly could be categorised as taking a phenomenologial and cognitive
approach. Adams-Webber ( 1979) noted in particular that Kelly ( 1969) based his psychology
of personal constructs on a single philosophical assumption, that of constructive alternativism
(this principle contends that reality does not directly show itself to us , but that is instead
subject to as many alternative ways of construing it as we can invent) . Individuals in their
attempts to anticipate their experience are said to develop a coherent system of constructions
which are then imposed upon events. Kelly suggested that although an event is open to several
interpretations, this is not to say that in the long term some ways of construing it will be
likely to be more useful than others. He believed that most of our current interpretations of
events are subject to continual revision.
With respect to the person versus s ituation issue, all theorists assume at least a minimal degree
of constancy in the personality at different times and in different s ituations. The conflict
between trait theorists (like Allport and Sheldon) and situational determinants (like Skinner
and Bandura) has dissipated in the face of the newer interactionist position. The individual ' s
dispositions o r traits help t o determine the situations as well as the stimuli in the environment
to which they attend. In this view, both traits and s ituational variables play a significant role
in determining behaviour (Endler, 1 98 1 ; Magnusson and Endler, 1977) .
The interactionist position was foreshadowed by Murray ' s conception of need and by Lewin' s
conception of psychological environment. The growing tendency i s for personality theorists
to attend to the sociocultural context within which behaviour occurs . Theorists such as
Erikson, Adler, Homey, Fromm, Sullivan, Lewin and Miller and Dollard , have all been
influenced by findings of sociology and anthropology.
In more contemporary personality theory Staub (op. cit.) observed the approaches to have the
following in common: a) the assumption that human beings actively seek interaction with their
environment; b) that consciousness and cognition are important; and c) recognition of factors
and their interrelationships, unconscious processes, the importance of measuring behaviour
and existence of different levels of human functioning. A trend which is noticeable among
personality theorists is a lessening of polarization on specific issues. The argument between
the trait theorists and the situational determinists seems to be resolving itself into an
interactionist position.

32
2 . 2 Motivation to work
It could be argued that work motivation does not differ greatly from other kinds of motivation,
hence most of the models of work motivation have their roots in the more general field of
human motivation. Motives and drives were traditionally approached from a psychodynamic
viewpoint (English and English, 1958) and offered theories relating to the identification and
satisfaction of needs. Differing from need theories, with their emphasis on cognition, were
the more work related instrumentality theories. Here activity was regarded as instrumental in
achieving some valued outcome and individuals may ask of themselves "should I expend
energy on this activity to achieve this particular outcome? " Other distinct positions in relation
to work motivation have included goal-setting, balance and reinforcement approaches .
2 .2 . 1 The need approaches
Although the need theories have differed in their structure, some being arranged
hierarchically, and in the number of needs proposed, they have tended to categorise needs in
consistent ways semantically as in the work of Maslow ( 1943), McLelland ( 1 955) and
Herzberg ( 1966) . Maslow' s ( 1943) theory of needs was generally employed in conceptualising
adjustment , but it has been regarded as a broad theory of human development . It was not
explicitly formulated for the work s ituation. Maslow 's hierarchy of five levels of,
physiological , safety, love, esteem and self-actualization needs and the movement of
individuals up the hierarchy in a systematic manner dependant upon the satisfaction of needs
at each level, has received little support from either cross-sectional or longitudinal studies.
Need intensity had been found to correlate positively with need satisfaction (Hall and
Nougaim, 1968) which is contrary to the expectation that a need would become unimportant
once satisfied. Changes in the importance of needs at one level did not correlate positively
with changes in the importance of needs in the next higher level of the hierarchy as the model
would predict (Lawler and Suttle, 1 972) .
Aspects of Maslow ' s theory under scrutiny have not withstood empirical investigation and
longitudinal study well (Lawler and Suttle, 1972) . That Maslow's propositions have been
either rejected or received only limited support has in part has been attributed to the vagueness
of the theory which in turn, according to Wahba and Bridwell ( 1 976), has impeded the
33
derivation of testable hypotheses. Maslow's model has been viewed more recently as of
importance historically rather than functionally (Landy, 1985) .
Despite the criticisms levelled at Maslow's theory, Landy ( 1985) suggested it was broader
than the typical research designs have allowed . It was thought possible that changes in need
levels may occur over years rather than the weeks or months implied by research. Because
Maslow ' s theory was not designed specifically for the workplace, Landy cautions that any
assessment of it should include non-work environments as well . He noted that it is not only
difficult but probably also questionable logically to separate work from non-work attitudes and
behaviour.
Alderfer ( 1969; 1 972) proposed a theory called ERG theory after the three basic sets of needs
he identified, that is existence needs, relatedness needs and growth needs. These were
effectively a rearrangement of Maslow' s five needs, but a different process to explain how
individuals move from one level to another was proposed. As well as Maslow' s fulfilment
progression, the satisfaction of one level of need before progression to the next can occur, a
frustration-regression component was added. This assumes that the needs vary on a continuum
of concreteness and that when the less concrete needs are not met the fulfilment of a more
concrete need is sought. Landy suggested such a theory is of more practical use in the work
setting because when needs at a higher level are not fulfilled managers can help redirect
energy towards lower-level needs. The l ittle research that has involved ERG theory has
produced mixed results. Although the existence of the three need levels has been supported
(Wanous and Zwany, 1 977; and Rauschenberger, Schmitt and Hunter, 1980) , Rauschenberger
et al did not find changes in need levels over time and Wanous and Zwany concluded that
need-hierarchy theories generally may not be of value.
Roe ' s ( 1 956) need theoretical orientation viewed occupations as an extremely important source
of need satisfaction in Western culture. Occupations were thought to have become so
important because they have been able to satisfy so many needs so wel l . More specifically
Millar and Form ( 1964) submitted that needs such as sense of belonging and love have been
traditionally frustrated by management policies and that deprivation of the higher-order needs
has occurred . Unlike other theorists such as Ginzberg and Super, Roe placed emphasis on the
events in early childhood, particularly the influence of early parent-child relationships as
having a special significance in relation to vocational development . Roe came to regard
34
personality as only one of the factors influencing occupational choices, thus believing there
is no universal personality pattern associated with members of occupations. She suggested
there is still some evidence for a relationship between specific and general early childhood
experiences and vocational choice.
A number of researchers have concentrated on the specific need for achievement, referred to
as nAch. This single need has been proposed by many as a major basis for motivational
behaviour. It has been defined by Murray ( 1938) who provided a measure of it among other
needs using his Thematic Apperception Test (TAT) and was in time used as a basis for a
theory of motivation (McClelland, 1 955) . Later cognitive elements were incorporated in the
concept by Atkinson ( 1 964) . Murray considered the need for achievement to be the desire to
"overcome obstacles, to exercise power, to strive to do something difficult as well as quickly
as possible" ( 1 938, pp 80-8 1 ) . For McClelland stimuli acquire motivational properties by
being associated with success and failure in the past; achieving behaviours are thought to be
more likely in a particular situation where they have been accompanied by success in the past .
McClelland and his associates have established a research tradition in which they use
projective measures to investigate various aspects of human motivation. The operation of
specific motives they have been particularly interested in are the need for achievement
(McClelland et al, 1953 ; McClelland, 1975 , 196 1 ; and Atkinson and Raynor, 1 974) , the need
for power (Winter, 1973 ; and McClelland, 1975), the motive to avoid success (Homer, 1 974)
and the origin-pawn1 variable (deCharms, 1 976) , (refer page 496 for these references) .
Steers ( 1975) and Steers and Spencer (1977) found work goals have become associated with
past achievement and the pleasure derived from satisfying this need. Good performance
becomes a reward for high achievers. However, achievement effects on performance were
perceived as relatively minor in comparison with other effects such as reward levels and
pressures for production.
Herzberg 's motivator-hygiene or two-factor theory has been extremely popular and like all
need theories assumes each individual is born with certain needs which must be satisfied. His
hygiene needs were defined as maintenance needs which provide a healthy environment and
in the work setting include such things as pay, security, coworkers, general working
conditions and company policies. His motivator needs were higher-order or growth needs
related to innate characteristics requiring individuals to seek challenge, stimulation and
1 A concept of personal motivation which has individuals differing along a dimension from
originating their own behaviour (origin) to being manipulated by others (a pawn) .
35
autonomy. These are satisfied by such things as responsible work, independence and
recognition for the accompl ishment of tasks. The motivator needs are part of the work itself,
rather than the context in which the work is done. Of Herzberg' s two levels of functioning,
motivation seeking and hygiene seeking, the former was considered preferable being abl e to
y ield productive worker activity and few problems of control for management . Job enrichment
was offered as a technique for moving individuals from hygiene seeking to motivation seeking
levels thus making them self-motivated . Although the two-factor theory was not proposed as
a hierarchical one, in practice if hygiene needs were unmet individuals may be more l ikely
to leave and not fulfi l thei r motivation needs . Because Herzberg did not postulate where the
needs originated , except to see them as part of an individual ' s defining characterist ics, the
reluctance of the scientific community to take anything as given has contributed to the
propositions not being accepted .
In the more l imited view of needs as found in the instrumentality approach of Lawler ( 1 97 1 ) ,
the concept of valence is related to need and objects which are said to acquire valence if they
are instrumental in meeting the basic needs of individuals. The concept of need is l imited to
certain s timul i which can be grouped because they are sought by people. But Wahba and
Bridwel l argued that even in this more l imited view there are questions which st i l l remain,
such as, why should needs be arranged hierarchically? Would the h ierarchy be the same for all? How would it alter over t ime? How can a fixed hierarchy of needs be consistent w ith
behav iour being multidetermined? Landy ( 1985) has suggested that the need-hierarchy theories
have the components of good theory that Campbell , Dunnette, Lawler and Weick ( 1970)
pointed out, that is the inclusion of both content and process considerations and that perhaps
a redefinition of need levels and the process component will gain more support. However,
there may be other models of need fulfilment which are in part hierarchical or which have
quite a different structure which account for the behaviour of individuals and which are
moderated by other individual and environmental factors, such as, traits and abil i ti es,
perception of l ikely success and the availabil ity of the opportunity and reward for need
fulfilment in the environment.
Roe had concluded that the most appropriate prediction model is a multivariate one where the
appropriate factors can be combined and weighted (Roe, 1964) . Although Neff ( 1985)
criticised Roe' s data for involving retrospective accounts from a small group of individuals
36
in advanced training for particular professions, he regarded her views as accurate and
persuasive.
The fai lure of the need approaches to acquire theoretical status because of a lack of
empirically testable interrelated propositions has affected their acceptabi lity. Although the
approaches have identified similar tendencies in behaviour, in Landy 's ( 1985) view these may,
where questionnaires have been used , merely be a reflection of subjects noticing the same
thing and thinking the same way as researchers.
2 .2 .2 Instrumentality theory
The first work-related instrumentality approach known as "path-goal theory" was that of
Georgopolous, Mahoney and Jones ( 1 957), which proposed that workers who regard high
productivity as a path leading to one or more personal goal will be highly productive. V room
( l964) formalised instrumentality hypotheses in Valence, Instrumentality and Expectancy
theory (VIE) . It was assumed that individuals assess the probabil i ty of a particular action
leading to a certain outcome, expectancy (E) ; and that the outcome wil l produce other
outcomes, instrumentality (!) ; which are valued , that is have valence (V).
A later and more current variation of instrumental ity theory, that of Porter and Lawler ( 1968),
rejected the traditional drive approach of need theories and their emphasis on previous
response-reward l inks in favour of the instrumentality emphasis on the anticipation of future
events, dealing with abstract concepts and the delaying of satisfaction . The Porter-Lawler
model involved the effect of the value of reward and perceived effort-reward probabil ity on
the effort made and the effect of effort on performance as moderated by abilities and traits and
role perceptions. The role perception was described as the individual ' s definition of successful
performance on a specific job. Performance brings intrinsic and/or extrinsic rewards, the
effect of which on satisfaction are moderated by perceived equitable rewards or the level of
reward fel t appropriate. Satisfaction in turn affects the valence and performance affects the
perceived effort-reward probabi l ity, that is the subjective estimate that increases in effort wi l l
lead to acquiring a valued reward .
The acceptance of both managers and researchers of the importance of cognitive activities and
their potential role in motivation and performance has lead to extensive research on
37
instrumentality models, as reviewed by Campbell and Pritchard ( 1976) and Mitchell ( 1974) .
As the reviewers noted, research in this area tended to involve either different ways valence,
instrumentality and expectancy combined to predict either effort or expenditure or both . Other
research investigated the ways variables were operationally defined and measured, or the
differing approaches to testing the model . Taking a different perspective, further studies
looked at the characteristics of workers or environments which affected the model ' s abi lity
to predict behaviour. In the tests of the instrumentality models of, for example, Lawler ( 1 97 1 ;
1973), Graen ( 1969) and Naylor, Pritchard and ligen ( 1980) effort was shown to b e more
accurately predicted than performance. Valence, instrumentality and expectancy have not been
found to play an equal role in effort expenditure, but weighting each differently, for example
by multiplying actual valence ratings by instrumentality ratings, have been fraught with
problems (Wanous, Keon and Latack, 1983; and Schmidt, 1973) . The V, I and E components
were not found to be highly interrelated (Wanous et al , 1983) unless instrumentality theory
was viewed as a theory of choice of courses of action as related to occupational or
organisational attractiveness, rather than one of work performance.
The Meta-analysis of Schwab, Olian-Gottlieb and Heneman ( 1 979) found a much greater
percentage of variance in either effort or performance to be explained by things other than the
cognitive, instrumentality and expectancy estimates. They questioned the mul tiplicative
relationship between valence and expectancy as determining a course of action, whilst the
research task itself was believed to create behaviours which are not representative of those
being investigated . Subjects are asked to evaluate many more outcomes than the few which
they tend to deal with in real l ife. It was suggested this might cause them to use decisions and
combination rules which are different from those they might employ in everyday situations.
Also individuals would be expected to differ in their ability to deal with compl icated
combination rules such as are involved in a multiplicative task. For example, many may
reduce it to a simpler one of adding V and E . It has also been difficult to assess if the failure
of the instrumentality approach has been due to the way variables are measured or the
theoretical propositions employed. The measurement has been unreliable (Deleo and Pritchard,
1974) and sensitive to aspects such as questionnaire format (ligen, Nebeker and Pritchard,
1 98 1 ) .
Several methods for measuring instrumentality, expectancy and valence have been found
which demonstrate greatly improved validity and reliability. For example Landy ( 1985) stated
38
that reserach has shown, when subjects have been permitted to suggest and evaluate thei r own
outcomes rather than those of a researcher, a marked increase in the relationship between
cognitive components and effort is found . The difference between posi tive and negative
outcomes has also become a measurement issue. A review of studies (Lean, 1981) found
many demonstrated VIE predictions to be more accurate if only positive outcomes were taken
into account . In contrast to negative outcomes, positive outcomes were found to be evaluated
as VIE theory would suggest , the more attractive the outcome the stronger the relationship
between that outcome and choices of courses of action. Lean noted that data from other areas
of applied psychology and from information processing work, also substantiate the fact that
negative information is processed differently. In this case it did not matter how negative an
outcome was, it had a fixed effect on the choice of actions. According to Landy ( 1985)
whether or not the Pol lyanna hypothesis of Boucher and Osgood ( 1969) is in operation, that
is individuals preferring not to think about negative things, a rethink of the VIE model would
seem appropriate. The qualitative and quantitative differences of positive and negative
outcomes would need to be considered further.
2 .2 .3 Goal-setting theory
As a theory of motivation the goal-setting approach has involved the role of intention in
motivated behaviour. In their review of fifteen years of research related to this approach,
Locke, Shaw, Sacri and Latham ( 198 1 ) concluded there is support for a relationship between
goal-setting and performance, g iven individuals have the abi lity to perform wel l . Goals are
believed to direct attention and action, mobi lize energy, prolong effort and motivate the
development of relevant strategies for goal attainment . Hard goals have been found to produce
higher importance and feedback or knowledge of results is needed for high level performance.
Rewards have been found to increase commitment to a goal which has been accepted but
performer participation in goal-setting does not necessar i ly have any affect .
There have been no consistent findings with respect to individual d ifferences variables other
than the abi lity variables, such as the need for achievement, or self-esteem. Goal acceptance
has been shown to be affected by individual participation in goal setting and goal commitment
may be strengthened w ith monetary or other awards. Feedback has been shown to influence
the intention to work fast on the part of lower performers.

39
2.2.4 Balance theory
Balance theory proposes that behaviour is initiated, directed and sustained by individuals
attempting to maintain an internal balance of psychological tension. The approach tends to be
based on Festinger ' s ( 1957) cognitive dissonance, that is that discrepant cognitions p roduce
psychological tension which, being unpleasant, becomes the object of action to reduce it .
Variations of the approach applicable to the work setting have included self-consistency
theory, such as that of Korman (1970) which is based on personality considerations,
suggesting that individuals attempt to balance the view of themselves with that held by others.
A more common version of dissonance theory is equity theory, for example Adam' s ( 1 965)
version. Individuals are believed to form a ratio of inputs, which may be anything an
individual feels he or she contributes, such as intellectual abilities, psychomotor skills,
personality traits, or experience, to their outcomes in a given situation. Outcomes are those
faftors seen by the individual as of personal value, such as money, praise, or promotion . The
individual then compares their ration of inputs to outputs to the value of the ration for
significant others. A situation is perceived as equitable and no tension exists if the individual ' s
ratio i s equal to that of the significant others . The intensity of any motivated behaviour
resulting from any inequity is expected to be proportional to the amount of tension created.
Some of the questions which have arisen in relation to equity theory; despite its intuitive
appeal , have been, the way in which a comparison person is selected by an individual , the
way in which tension reduction strategies are chosen, the emphasis on compensation as the
independent variable and the role of individual differences, such as cognitive factors, in equity
research. The significant other has been identified as someone else within an organisation,
someone outside the organisation, the stated structure of the system, the way a system such
as a pay system is administered, past experience, the extent to which needs of self and family
will be met and a conception of self-worth.
Landy ( 1985 , op. cit . ) noted that equity research in concentrating on the issue of compensation
has neglected other outcomes which might be of importance, such as promotions, interesting
work, pleasant eo-workers and increased status. In fact the outcomes perceived as important
to any one individual would seem to be those which should be the subject of study. Landy
expects substantial modification to occur in equity theory which will involve individual
40
differences, an extension to outcomes other than money and a definition of equity which will
replace relative equity with adjustment equity. Relative equity advocates that individuals of
equal merit should receive salary increases which are equal with respect to percent of salary
at the time. On the other hand, adjustment equity advocates that individuals of equal merit
should receive salaries which are equal in absolute dollar terms.
2 .2 .5 Reinforcement approaches
Behaviourist, reinforcement approaches, in an industrial setting have attempted to show that
behaviour can be accounted for by understanding various stimulus-response-reward
associations . The presence or absence of a contingent reward and the timing or schedule of
rewards, such as continuous or intermittent reinforcement are of concern. Landy ( 1985) has
reported that the research in the area demonstrates that although as expected contingent
reinforcement of any type is more effective than noncontingent reinforcement, the various
contingent schedules have not produced differences. In the case of complex tasks in job
settings, Pritchard, Hollenback and DeLeo ( 1980) concluded that intermittent schedules have
not been found to be superior to fixed schedules. Landy offers some reasons for this lack of
generalisation of the relevant animal studies to the work setting. The capacity to reason and
conceptualise would be expected to be greater in the human and many would superimpose
layers of meaning on immediate environmental events. In the work setting a reward would be
expected to carry with it excess meaning and reinforcement represents information which is
transformed and often stored in an altered form. There would be far less control over the
giving of reward in a non-laboratory setting. In the field setting there would be many different
reinforcers operating simultaneously, some of which, including social influences on behaviour,
would not be controlled by an experimenter.
As in all areas of psychology there has been a continuing debate between behaviourists and
in particular humanists and cognitive psychologists. One of the most basic areas of
disagreement is about the status of behaviourism. It has been called a technology rather than
a theory. Radical behaviourists in denying the importance of reasoning, judgement, creativity
and concept formation, for example, claim behaviour can be understood via associations
between behaviour and events. Others have pointed to evidence with respect to mental events
and the inability of the behaviourist interpretation to explain why, for example, behaviour
4 1
does not return to baseline levels after intervention when it is no longer under the control of
reinforcement or reinforcers.
Locke (1980), for example, suggested that there are problems associated with adopting
behaviourism as a sole approach to understanding industrial behaviour. He and others
following (Komaki , Collins and Penn, 1982) advocated the use of a more cognitive
interpretation for understanding the effects of contingent reinforcement. The earlier
anticognitive emphasis has tended to be replaced by a complex information processing and
self-control orientation (Mahoney, 1974; Thoresen and Mahoney, 1974) . Locke makes the
distinction that the behaviourist is interested in knowing only that a reinforcer reinforces while
the cognitive psychologist would want to know why it reinforces. Landy argues that the needs
of the practitioner and the theorist can be different in that a manager who wants to improve
certain behaviours does not need to know anything about goals or reasoning, but just needs
to observe the behaviour and apply reinforcement contingently. Furthermore, Landy, not
atypically, regards behaviourism as a technology rather than a theoretical position contending
that to understand why contingent reinforcement is effective, one must look elsewhere, to
cognitive psychology, to goal-setting theory or to instrumentality theory. However,
behaviourism does answer some 'why' questions or questions about the causal mechanisms
involved in contingent reinforcement, for example in terms of previous reinforcement h istory
and the strength of reinforcers. That it does not answer all of the why questions merely
suggests it is, like many other theories, incomplete. Earlier behaviourists did not take into
account cognitive aspects but only the most radical of behaviourists would maintain such a
position today.
2.2 .6 Comparing the approaches
The instrumentality approaches have been based on individual's estimates of the chances of
obtaining some valued reward rather than on inferred drives or needs and information about
the individual's reward history. Although it has been shown that it is sufficient to measure
current cognitive estimates without examining reward history, the rationality of the individual
in making estimates of obtaining reward is expected to be limited by certain factors. Some
of the factors suggested have been, cognitive skill, negative outcomes and the number of
alternatives under consideration (Landy, 1985) . Studies reviewed by Lean ( 1981) showed

42
predictions to be more accurate if only the positive outcomes are considered, which is at
variance with the averaging of negative and positive outcomes VIE theory would predict.
Instrumentality theories have been unclear about the nature of potential rewards, where
intrinsic and extrinsic rewards come from, how they develop and the effect of personality
differences on the potential of a reward to modify behaviour. Need theories have been more
specific, not so much about where needs come from but about their nature (if they are
hierarchical for example) , the objects able to satisfy them and (in Maslow's case) individual
differences in need strength. Instrumentality theories have on the other hand been more easily
able to be applied. Managers have been able to clearly show relationships among outcomes
and able to affect effort-reward probability by rewarding good performance. Herzberg's
theory is easier still to apply, but because his solution of job enrichment could fit with most
theories of work motivation, research results have not been able to be used in unique support
of his motivator-hygiene hypothesis.
It has been argued (Landy, 1985) that VIE theory and goal setting theory can be integrated.
He suggested goal-setting theory appears in conflict with other theories of motivation and
would predict the opposite to expectancy theory which would hold that easy goals will lead
to greater effort than hard goals. Achievement motivation theories might predict moderately
hard goals would produce higher performance and easy goals lower performance. However
a two-phase process for explaining motivated behaviour which would indicate the different
approaches may not be mutually exclusive. Menlo, Cartlede and Locke ( 1980) proposed that
the first stage, of goal setting, may be influenced by expectancies and valences. While the
second phase, energy expenditure, may be affected by the actual goals that were set, feedback
also plays a continuing role in energy expenditure. The expectancy perspective has hard goals
lowering the expenditure of energy but the higher valence of hard goals, because of their
attractiveness, may overwhelm the low expectancy of success. This results in higher energy
expenditure which in turn leads to higher performance. This approach is thought to explain
why goals are accepted and as such is not regarded as a different approach from that of
Locke. More generally, a number of findings suggest valences and expectancies influence
goal adoption or choice (Matsui , Okada and Mizuguchi , 198 1 ; Matsui , Okada and Inoshita,
1983) .

43
Equity theory has been regarded as a special case of expectancy theory, Landy (1985) . The
two theories are said to make identical predictions when individuals regard equitable behaviour
as in their best interests. Although the range of strategies employed to reduce inequity related
tension, from increased inputs , to sabotage, to leaving the job, generally fit with equity
theory, there are some inconsistencies. Weick, Bougon and Maruyana ( 1978) noted that equity
theory does not explain the strategy of requesting higher outcomes for self in response to
inequity involving low outcomes. Increased effort due to overpayment has not been as
common as previously thought. Thus it may be concluded expectancy theory is of assistance
in providing an explanation when the overriding concern is to maximise individual ' s
outcomes.
Although the different theories would probably like to be able to account for differences in
effort expenditure and performance, none claim to predict performance directly. Instead, they
do look at more general work-related behaviour, such as absenteeism and turnover. In looking
at effort expenditure and performance, which could be viewed as the antecedents and the
consequences of work motivation, need-hierarchy theories and equity theory agree that internal
tension directs behaviour. However, they differ about the causes of this tension. Equity theory
orders needs less rigidly, adopting a more cognitive approach in dealing with tension
reduction. Neither the behaviourists nor the instrumentalists feel the same compulsion to
concern themselves with motivation as a psychological construct.
The behaviourists avoid reference to internal states and emphasise environmental effects on
behaviour. Any explanation of the relationship between rewards and activity would have
"work motivation" as a system of needs obtained through past reinforcements . The
instrumentality theorists tend to view motivation as having two roles. One role is as a simple
measure of the effort expended . A second more broader role breaks motivation into functional
areas of perceived probabilities, values rewards and equitable reinforcement systems. Goal
setting theory would have harder goals leading to greater effort if appropriate feedback is
provided.
With respect to job performance, because performance has determinants additional to
motivation such as ability, equipment and opportunity, the motivation theories do not attempt
nor expect to account for performance on their own. Equity theory would regard performance
change as only one method among others of reducing inequity; other methods such as
44
absenteeism, quitting, changing comparison others, or devaluing inputs are also included. It
has been suggested that there are other aspects of equity theory of more interest than the
prediction of performance (Goodman and Friedman, 1 97 1) . For example, the intermediate
states between equity perceptions and performance, such as satisfaction and dissatisfaction may
be of more interest .
Some of the other theories have been more relevant to performance considerations. Balance
theories for example have been less vague in their predictions about performance than have
need-hierarchy theories. It is difficult to assess the performance implications of functioning
at a particular level in a need-hierarchy. However, balance theories have not been able to
specify which strategy will reduce tension and how that strategy will relate to performance.
For the radical behaviourists, performance would be regarded as an operant and a complex
one, which is a function of behaviour-reward contingencies. Relationships between self-esteem
and performance, for example, would be ignored , self-esteem being viewed as an
intraindividual construct which therefore has no place in their theoretical system. Goal-setting
and any sense of achievement associated with the attainment of a difficult goal would likewise
be disregarded because cognitive activity, another internal construct , would be implied . The
less radical behaviourist would be more likely to accept the joint effects of contingent
rewards, goals and feedback and less inclined to dismiss cognitive aspects, but contingent
reinforcement would still be viewed as critical to high performance.
According to Landy (1985) the instrumentality theories would have the most to say about
performance and motivated behaviour. The antecedents of motivated behaviour would include
effort expenditure, abilities and traits and role perception. The consequences of performance
through rewards can be seen in its affect on satisfaction. The consequences for performance
would also be cognitive, affecting perceived equitable outcomes and perceived effort-reward
probabilities.
Most of the research related to the testing of motivation theories has been aimed at the
acceptance or rejection of entire theories without modifications, refinements, or
reconceptualisations. Landy claimed that examples of "modification" research, as in equity
theory (Birnbaum, 1983; and Mellers, 1982) , expectancy theory (Leon, 1981 ) and the
emergence of cognitive behaviourism (Komaki, Collins and Penn, 1982) are both healthy and

45
necessary, especially if the concept of motivation is to survive. The theories tend to have a
mixture of useful and useless propositions as Landy ( 1985) also pointed out and they are still
in the process of developing. This should allow the acceptance of reasonable propositions only
and result in less of an emphasis on the application of theories in the form they were
originally proposed. Regardless of the motivational approach adopted, because of the manner
in which cognition affects behaviour, perceptions can be more important than reality. What
individuals perceive about reality in the work place may be so different in some cases from
the reality itself, that it certainly cannot be ignored by those researching the work
environment and the individual's relationship with it.
2 .3 Job satisfaction and productivity
Work satisfaction has been defined in a number of ways which are either similar or at least
complementary (Dawis and Lofquist, 1984) . Hoppock ( 1935) defined satisfaction as the
individual's expression of their overall like or dislike of a job. Satisfaction has been regarded
as the meeting of human needs (Schaffer, 1953; Maslow, 1954; and Roe, 1956) . For V room
( 1954) the product of the valence of work outcomes and the perceived instrumentality of the
job produced satisfaction. Katzell (1964) was interested in the discrepancy between the
amount of stimulus that is experienced and how much the stimulus is valued. He viewed
satisfaction as an affective response along a pleasurable-displeasurable continuum. Similarly,
satisfaction was seen as an affective response to different aspects of work that arises from a
perception of the fair and reasonable compared with what actually occurs, given the
alternatives that are available (Smith, Kendall and Hulin, 1969) . The expression of the extent
to which a job situation fits one's values in a pleasurable or positive way constituted job
satisfaction for Locke (1976) . Dawis, Lofquist and Weiss ( 1968) have regarded satisfaction
as resulting from the individual judging the extent to which the work environment fulfils their
needs .
It was the above definitions which Dawis and Lofquist ( 1984) synthesised to conclude that
"job satisfaction might be defined as a pleasurable affective condition resulting from one's
appraisal of the way in which the experienced job situation meets one's needs, values and
expectations " (p 72) . Conversely, job dissatisfaction was defined as an affective state that is
unpleasant which results from the failure to have one's needs, values and expectations met
by the j ob situation.
46
Cooper and Robertson ( 1986) have characterised job satisfaction as a relatively theory-free
construct which has most often been studied as a correlate of other variables or clusters of
variables. As an outcome variable they noted its determinants have included, goal setting, job
design, demographic profiles, rewards and reward systems, organizational characteristics,
leadership factors, decision participation and individual differences.
The cognitive element has been lacking in these descriptions of job satisfaction. Dawis and
Lofquist only hint at such a possibility by referring to "one's appraisal " of the way in which
the job matches expectations. Cognitive factors affecting an appraisal are not elaborated upon.
One such cognitive influence could be self-efficacy for achievements leading to job
satisfaction.
Performance and productivity have been defined often by way of the criteria used to measure
work output . Like job satisfaction, the cognitive element, individual's perceptions of their
performance, has received less emphasis than the so-called objective measures of performance
or measures based on observer ratings.
The relationship between satisfaction and performance has been described as a kind of "Holy
Grail " in industrial psychology (Landy, 1989), the search for it having been discouraging. No
"appreciable relationship " was believed to exist (Brayfield and Crockett, 1955; Vroom, 1 964) .
Meta-analysis by Iaffaldano and Muchinsky ( 1985) found the average correlation between
satisfaction and performance to be . 14 . Rather than satisfaction being said to cause
productivity, as has been maintained in the past, the opposite, that successful performance
causes satisfaction, has been suggested (Locke, 1 970; Porter & Lawler, 1 968) .
Campbell, Converse and Rodger's (1976) model of determinants of job satisfaction, as in
Figure 2 . 1 , has job satisfaction depending mainly on the way an individual perceives and
evaluates aspects of the job. The perceptions are said to depend primarily upon the
"corresponding objective characteristics of the job " (p 296) . Objective job characteristics were
depicted as having a direct effect on job satisfaction and an indirect effect, the latter through
the perception of respondents. Characteristics of the respondents were thought to have effects
at three levels, directly on job satisfaction, perceptions and assessments and on the
relationship between perceptions on the job and job satisfaction. Personal characteristics were
depicted as affecting job satisfaction directly and the perceptions and assessments of job
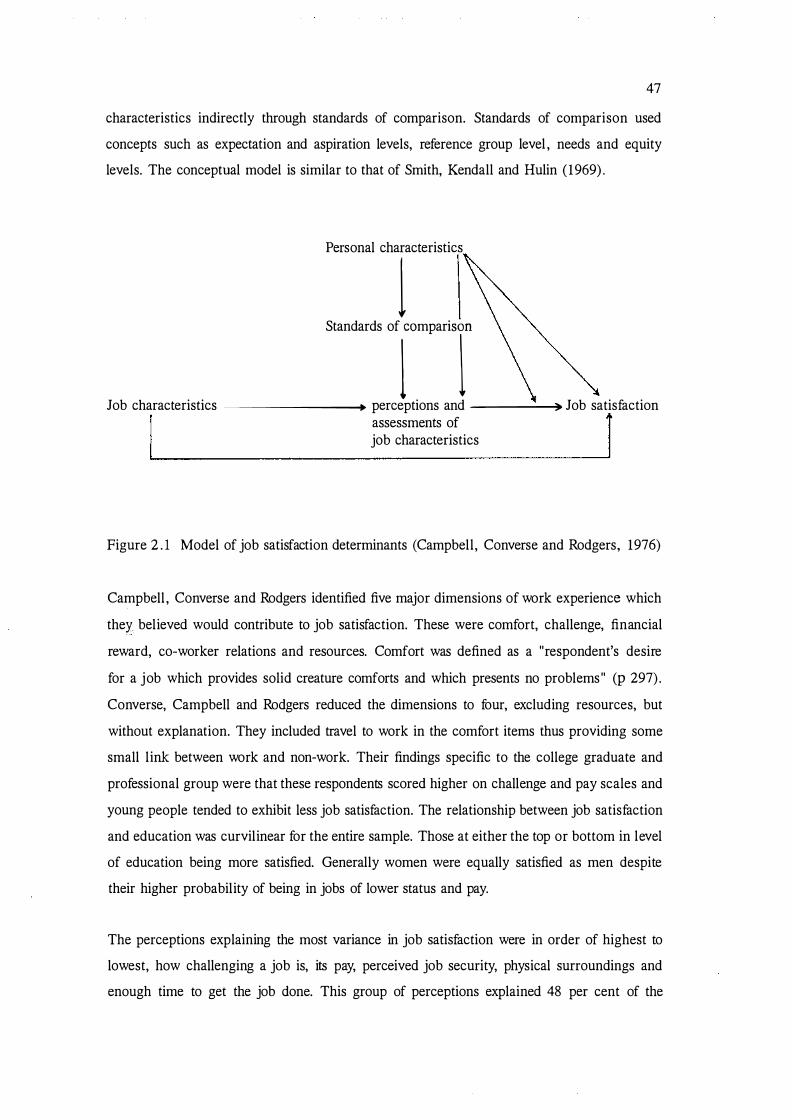
47
characteristics indirectly through standards of comparison. Standards of comparison used
concepts such as expectation and aspiration levels, reference group level , needs and equity
levels. The conceptual model is similar to that of Smith, Kendall and Hulin ( 1969) .
Personal characteristics
1 Standards of rmpariT
Job characteristics --------+ perceptions and -----� Job satisfaction I assessments of 1 job characteristics
Figure 2 . 1 Model of job satisfaction determinants (Campbell , Converse and Rodgers, 1976)
Campbell , Converse and Rodgers identified five major dimensions of work experience which
they believed would contribute to job satisfaction. These were comfort, challenge, financial
reward, eo-worker relations and resources. Comfort was defined as a "respondent's desire
for a job which provides solid creature comforts and which presents no problems" (p 297) .
Converse, Campbell and Rodgers reduced the dimensions to four, excluding resources, but
without explanation. They included travel to work in the comfort items thus providing some
small l ink between work and non-work. Their findings specific to the college graduate and
professional group were that these respondents scored higher on challenge and pay scales and
young people tended to exhibit less job satisfaction. The relationship between job satisfaction
and education was curvilinear for the entire sample. Those at either the top or bottom in level
of education being more satisfied. Generally women were equally satisfied as men despite
their higher probability of being in jobs of lower status and pay.
The perceptions explaining the most variance in job satisfaction were in order of highest to
lowest, how challenging a job is, its pay, perceived job security, physical surroundings and
enough time to get the job done. This group of perceptions explained 48 per cent of the

48
variance in job satisfaction, as measured by a single item, "All things considered, how
satisfied are you with your job?" on a scale of 1 to 7 from completely satisfied to completely
dissatisfied. None of the relationships of the objective job characteristics were regarded as
reasonable and they explained a meagre one per cent of the variance in job satisfaction.
Individuals in different occupational categories differed markedly in their assessments of job
attributes, but differed only slightly in their job satisfaction. The personal and objective
characteristics produced less than one percent more explanation of variance than did the
perceptual assessments. Most of the influence of personal and objective job characteristics on
job satisfaction came indirectly through the perception of job attributes .
Because the direct relationship between personal characteristics and job satisfaction was weak,
most of the influence of personal characteristics was indirect through their influence on the
way the job environment is perceived. This indicates the potential importance of constructs
such as self-efficacy. The link between personal characteristics and perceptions can be
understood by looking at the standards of comparison that vary among individuals of different
backgrounds. Personal characteristics as a moderator of the perceptions-job satisfaction
relationship was not considered to be very important . The relationship between assessment
of job attributes and job satisfaction was considered the most important in the model . The
three sets of variables, perceptions of the job, objective characteristics of the job and
respondent characteristics, were found to explain about half of the variance in reported job
satisfaction.
2 .4 Job satisfaction and tenure
Not surprisingly the potential effect of job satisfaction on tenure has generated considerable
research interest , as evidenced by the large number of studies included in Carsten and
Spector's (1987) meta-analysis of turnover studies.
Although job satisfaction has been shown to be associated with tenure it usually has accounted
for only part of the variance in common. Managers have tended to believe that both
absenteeism and turnover are related to satisfaction (Landy, 1989). These beliefs are
consistent with those of Brayfield and Crockett (1955) , Herzberg, Mausner, Peterson and
Capwell ( 1957) and Vroom (1964) whose reviews of studies concluded that the two variables
were closely related . It seemed that unhappy workers were more likely to be absent from or
to leave the job.
49
Porter and Steers ( 1973) argued that absenteeism is more spontaneous while the decision to
quit, because of its economic implications, is a decision which is much more carefully
considered. They noted a satisfaction-turnover relationship but advised caution in identifying
a relationship between satisfaction and absenteeism. It was concluded that absenteeism might
function as a substitute for quitting only under extreme conditions: However, as noted by
Landy ( 1989), more recent reviews have challenged these beliefs. The assumption that leaving
the job and absenteeism are similar has continued to be questioned and the role of satisfaction
in either absenteeism or turnover has been regarded with scepticism. Of the two, absenteeism
is expected to be the result of dissatisfaction rather than turnover.
Mobley, Homer and I-Iollingsworth ( 1 978) suggested that dissatisfaction was not the only, nor
even the most important, variable contributing to turnover. Their model of the turnover
process has job satisfaction several steps removed from the process of leaving the job. Job
satisfaction was found to be most closely associated with thoughts of leaving and intentions
to search for another job. The intention to quit was in turn found to be significantly related
to actually leaving, but job satisfaction was believed to play a greater role earlier in the
process, at the thinking about leaving stage.
A major controlling factor of quitting has been identified as the extensiveness of
unemployment both generally and in an individual ' s field (Landy, 1989) . Irrespective of level
of satisfaction, the scarcity of jobs was said to lessen the likelihood of quitting. Carsten and
Spector' s (1 987) meta-analysis of 47 studies of turnover carried out between 1947 and 1984,
found the relationship between satisfaction and unemployment to be minimal when
unemployment is high (- . 18) . The relationship strengthened as the unemployment rate
decreased (- .522 e.g . ) . Landy (1989) warned that the relationship between satisfaction and
turnover is only modest even under good conditions for quitting. Only 27 % of the variance,
that is - . 522 x 100, can be accounted for. Quitting therefore is only one of several other
responses that could be made when the opportunity to leave is available.
Hulin, Roznowski and Hachiya (1985) listed multiple influences on decisions relating to
leaving a job and multiple alternative mechanisms available for coping with dissatisfaction .
The first mechanism suggested involved behavioural intentions to increase job outcomes. Job
outcomes could be increased by behaviours such as stealing, using work time for personal
tasks and moonlighting. The second proposed coping mechanism was reducing job inputs.
50
Examples given of behaviour aimed at reduced input were, missing meetings, long coffee
breaks, drinking/taking drugs before work, wandering around looking busy and talking with
eo-workers about trivia. The third coping mechanism l isted was behavioural job withdrawal
or avoidance. This included higher absenteeism, higher turnover and leaving for retirement .
The fourth and final coping mechanism involved specific change behaviours such as
unionization activity, demotion and transfer attempts.
Another construct related to tenure is that of employment commitment . More conceptual
analysis of what is meant by employment commitment has been recommended in the literature
and some progress has been made in the use of a variable known as employment importance
(Feather, 1986) . Employment importance has been defined by variables involving job need,
job want, work interest, job satisfaction and unemployment disappointment .
It has been argued that career commitment, job involvement and organisational commitment
are distinct work referents which should be operationalised separately (Morrow, 1983). Blau
( 1985) developed a reliable measure of career commitment which showed discriminant validity
from job involvement and organizational commitment measures. Career commitment was
found to be distinct operationally from job involvement and career commitment (Blau, 1988).
Career commitment was defined as involving occupational commitment and career orientation.
Job involvement was defined as the degree to which the individual identifies with a job or the
importance of the job to one's self-image. Organisational commitment was defined in terms
of identification with an organisation and its goals. Blau also employed a measure of
withdrawal cognitions from the perspective of job and career. Withdrawal cognitions have
been found (Miller, Katerberg and Hulin, 1979) to be good predictors of turnover. These
cognitions are, thinking of leaving, intention to search for a job and intention to quit. Career
withdrawal cognitions have demonstrated adequate reliability and discriminant validity from
a job withdrawal cognitions scale (Blau, 1985) .
Another example of what is considered to be a standard commitment scale is that of Cook and
Wall (1980) . This is a nine-item scale of commitment of affective reaction to the employing
organisation and feelings of attachment to goals and values of the organisation not for any
instrumental reasons. The scale consists of three subscales, identification or pride in the
organisation, involvement or the willingness to invest personal effort as a member of the
organisation and loyalty or attachment to the organisation.

5 1
Recently organisational commitment has been examined with respect to work rewards and
work values (Oliver, 1990) . Three factors have resulted from factor analysis of the work value
items. Oliver explored how levels of commitment in an organisation owned by the employees
varied according to variables such as age, tenure, education, salary and work values. The
demographic variables were found to all be positively related to work value variables. Factor
analyses that included varimax, equamax, quartmax and oblimin rotations differed only
minimally. The factors which emerged were labelled as instrumental , participatory and task
centred values. Examples of instrumental values were job security, fairness of income and
working conditions. Participatory values included variables such as participating in decision
making and working for the mutual benefit of one' s self and one ' s coworkers. Examples of
task centred values were variety and interest in work.
2 . 5 Individual work behaviour and the work environment
With' respect to relating individual work behaviour to employee attitudes, values and
personalities, one can examine the antecedents of work adjustment relating to the conditions
of conflict and adjustment mechanisms as well as to the development of the work personality.
2 . 5 . 1 Conditions requiring an adjustment response
In the earlier literature the need for work adjustment behaviour to be initiated and therefore
adjustment styles to come into operation, was viewed as a response to conditions thwarting
adjustment behaviour. In Crites ' s ( 1969) discussions about vocational adjustment these
thwarting conditions were termed conflict and frustration. Thwarting conditions in work can
be seen to have their origins in and are a function of either the individual or the environment
and refer to some obstacles, either internal or external , which impede the individual from
reaching a goal . In the case of the process of work adjustment, the goals are usually thought
of as vocational success and satisfaction, although there are others such as securing
employment . Crites ( 1969) , by way of definition, noted that an internal thwarting condition
was often called conflict and an external thwarting condition, frustration.
Examples of thwarting conditions have been evident in research relating to women with both
internal and external barriers to vocational adjustment being identified (Crites, 1969) . External
barriers to women have included sexual harassment and discrimination in compensation
52
(Fitzgerald and Betz, 1983). External barriers have been exemplified in the attitudes of men
and women towards women in paid work, especially towards those in non-traditional
occupations. West Point cadets with traditional sex-role attitudes were found to react
negatively to a female leader (Rice, Bender and Villers, 1980) . Stevens and DeNisi ( 1980) ,
using a hypothetical female as a stimulus, found subjects with positive sex-role attitudes
tended to attribute a manager ' s success to ability and effort. Failure was more likely to be
attributed to bad luck and a difficult job. Internal barriers to women might relate to confidence
about their own abilities and performance, particularly in occupations traditionally the domain
of men.
Robbins ( 1939) grouped conflicts at work into disturbances of aim and disturbances of
function. Examples of disturbances of aim were grandiose aims, such as aiming to be original
in all work and a pervasive lack of ambition. Such a lack of ambition was expected to have
the effect of making it almost impossible for the individual to work. Disturbances of aim were
said to be related to individuals themselves, while disturbances of function were related to
what the worker can or cannot do on the job (frustration in Crites ' s terms) . Robbins divided
dysfunction at work into the misdirection of energy and the partial or absolute inhibition of
energy. If a worker ' s efforts were dissipated and scattered, tasks were left unaccomplished .
Inhibition of energy was expected to result in no effort being made to work. Robbins regarded
a hatred of work and the necessity to work as central conflicts, maintaining that states of
inertia and lesser obstructions arose because of a hatred against working.
Ichheiser' s (1940) classification of conflict consisted of five types. Conflict of function, was
said to arise from the nature of the job duties. Conflict of conviction, involved activities l ike sell ing an inferior product to earn a living . Coriflict of ambition , involved discord between the individual ' s personality and place in a social hierarchy because of occupational standing.
Conflict of response, was used to refer to a discrepancy between a person' s desire for a
certain social milieu and the kind of people with whom their job brought them into contact .
An example of an early attempt at classifying frustration at work (Baton, 1952) which was
more sociological in nature proposed seven external conditions which could lead to an
individual experiencing frustration in their work. These conditions involved , work which is
insignificant, absentee ownership of the products of work, unfulfilled expectations of upward
mobility, lack of a defined role, the availability of many alternatives in work, economic

53
insecurity and work, as it becomes more complex and more incomprehensible to others,
isolating workers in the community. In the early literature the identification of frustration at
work included the failure of management to delegate authority downward as one of the most
significant factors along with the importance of pay (Brinker, 1955) . Person-environment fit
theory would regard mismatches between the person and the environment as conditions
requiring adjustment type of behaviour. The most frequently mentioned source of grievances
and frustrations of workers generally have tended to be ' low pay' or 'poor profits' with the
upper occupational levels experiencing less frustration (Centers, 1 948) .
2 .5 .2 Work personality maturation
The individual has developed ways of adjusting to work conditions which represent a
development and maturation of a work personality. In vocational psychology the assumptions
of the. trait-and-factor approach of Parson's ( 1902) person-job matching model and Murray's
( 1938) need-personality theory, came to be no longer interpreted literally. The assumption
that by virtue of unique psychological characteristics each worker was best suited to a
particular type of work, had led to the belief that there was only one occupation to which an
individual was suited. Groups of workers in different occupations were assumed to have
different psychological characteristics. Vocational adjustment was believed to vary directly
with the extent of agreement between worker characteristics and work demands. There was
no recognition that individuals and j obs were interacting with each other, changing, or
adapting (Scott and Clothier, 1 925) . Anderson ( 1929) in his criticism of this static concept
of human nature, had argued that work failure tended to result not simply from a lack of
ability but from the presence of more dynamic factors that influence the personality and
general health of the worker.
The focus on other factors and the recognition of vocational adjustment as a developmental
process, previously seen mainly in the psychodynamic approach to vocational adjustment,
became characteristic of the trait-and factor approach. Career patterns and work histories
became a focus as dependent variables. The emerging vocational fitness concept differed also
by recognising that an individual may be qualified for success in more than one occupation.
Occupations themselves were believed to be broad enough for workers with different
attributes to become equally well adjusted within them.
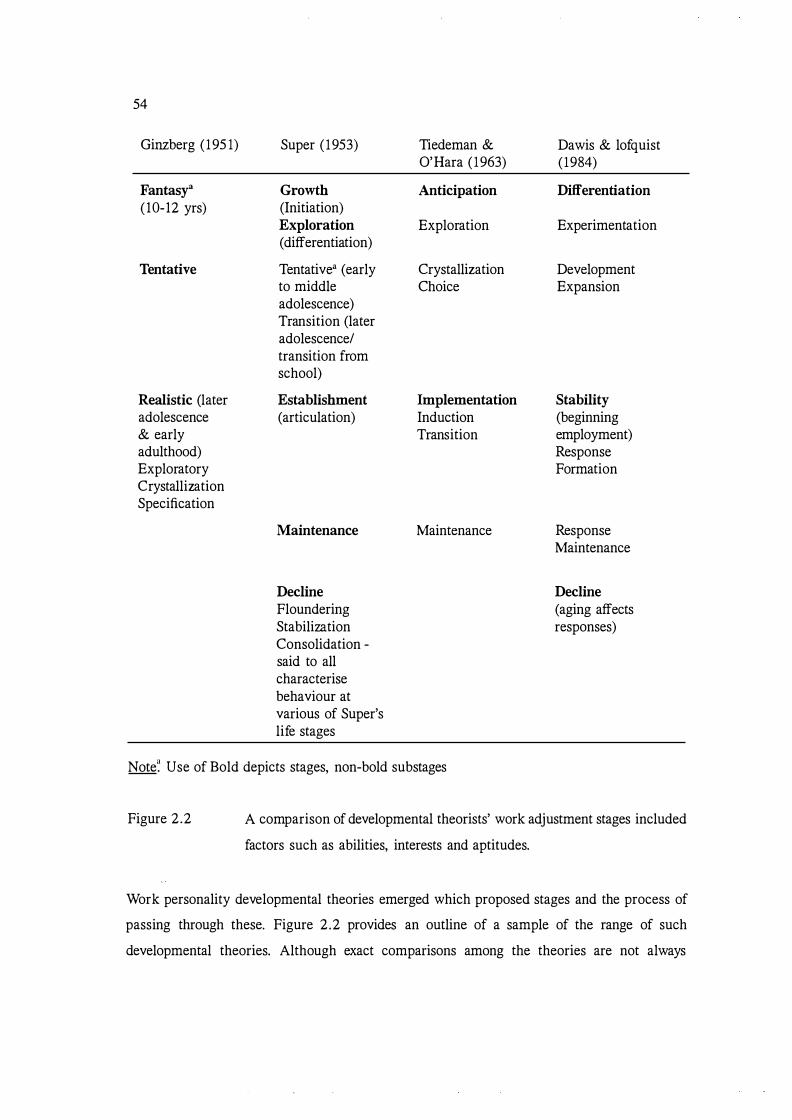
54
Ginzberg ( 195 1)
Fantasy" ( 10-12 yrs)
Tentative
Realistic (later adolescence & early adulthood) Exploratory Crystallization Specification
Super ( 1953)
Growth (Initiation) Exploration (differentiation)
Tentative (early to middle adolescence) Transition (later adolescence/ transition from school)
Establishment (articulation)
Maintenance
Decline Floundering Stabilization Consolidation -said to all characterise behaviour at various of Super's life stages
Tiedeman & O'Hara ( 1963)
Anticipation
Exploration
Crystallization Choice
Implementation Induction Transition
Maintenance
Dawis & lofquist ( 1984)
Differentiation
Experimentation
Development Expansion
Stability (beginning employment) Response Formation
Response Maintenance
Decline (aging affects responses)
Note� Use of Bold depicts stages, non-bold substages
Figure 2.2 A comparison of developmental theorists' work adjustment stages included
factors such as abilities, interests and aptitudes.
Work personality developmental theories emerged which proposed stages and the process of
passing through these. Figure 2 .2 provides an outline of a sample of the range of such
developmental theories. Although exact comparisons among the theories are not always

55
possible because the chronological age or period associated with the stages was not always
specified, the notion of stages was central to all the developmental theories. Ginzberg et al
( 195 1) regarded occupational choice as a process rather than an event and as a general type
of human behaviour to be approached using concepts from all of the chief behav ioural
sciences. He focused on the interplay of intra-individual and extraindividual determinants but
did not expect these factors to be highly correlated. /ntraindividual determinants included such
factors as abilities, interests and aptitudes. Extraindividual determinants included factors such
as environmental demands, pressures and constraints. Occupational choice was regarded as
a function of both sets acting together rather than able to be predicted from knowledge of
personal attributes alone, as theorists such as Super would maintain.
Vocational adjustment was viewed as a process which evolves over time. The individual was
treated as being born with "response potentials" which in interaction with " potential
reinforcers " in the environment produce behaviours which are a primitive set of cognitive,
perceptual and motor abilities. A primitive set of "needs " , such as , achievement, attention,
affection, was expected to develop from those reinforcers which occur most frequently in
association with the individual ' s responses.
Ginzberg ' s fantasy stage in the occupational decision making process, was defined as pre
awareness of social status and class values. His tentative stage was characterised by the
beginning of an awareness of social status and social class values. This stage was further
subdivided into an earlier phase, characterised by a preoccupation with interests and a later
stage distinguished by the emergence of a concern for capacities. Stages were believed to
occur in the same order for most people.
The chief difference in and criticism of Ginzberg 's approach was the irreversibility of the
process. The real options for choice were thought to become more and more limited over
time. Psychologically changing a given course of action, abandoning it and beginning again,
was thought to become increasingly difficult . Ginzberg did not describe the determinants in
detail, develop instruments to measure them, nor form propositions about the
interrelationships. His approach was also criticised for truncating development in early
adulthood, having operationalisation problems and having inconsistent research support
(Osipow, 1973) . His theory was criticised more and enjoyed less empirical support than
Super' s , but Neff (1985) suggested that Ginzberg ' s ideas were too hastily rejected.

56
Super ( 196 1 , 1963 ; Super et al . , 1967), regarded as the most influential writer in the field of
occupational choice (Holland, 1 969) , was critical of the assumption of early occupational
prediction models that once an individual and job were matched, no changes occurred. Super ' s
theory was credited with initiating research o n vocational maturity, career exploration and
self-concept implementation. But its main weaknesses were identified as, a lack of
operationalisation and a lack of attention to social and economic factors (Osipow, 1973) .
According to Neff ( 1985) the way the theory had been structured made it difficult for Super
and his eo-workers to fit their empirical findings to a general theory of vocational
development . Individuals were believed to make occupational choices which were the most
consistent with the concept they have of themselves. Self-concept was viewed as a pattern of
attitudes, interests and aspirations that develop through stages of initiation, d ifferentiation and
articulation, which translate into occupational choice. Neff suggested that the difficulties of
finding ways of assessing self-concept components in d ifferent individuals over time and
relating the components to career patterns, were in part associated with self-concept theory
itself. The theory in its long and complex development had been difficult to define and
describe precisely. Much of Super ' s efforts to derive testable hypotheses and operationalise
them through standardized methods of measurement were said to be fraught with technical
problems (Neff, 1985) .
Although Super' s developmentally based theory had been held up as an effective description
of the process of vocational development which systematically examined the important
components, none of the career theories at that time were accepted as adequate explanations
of vocational choice and development . Of the theories, Super 's was regarded as one of the
most technically adequate, all encompassing and advanced (Osipow, 1969, 1973) . However,
to be supported , Neff ( 1985) believed seemingly impossible conditions needed to be met.
Individuals would require an almost total freedom to make occupational choices. They would
need unlimited opportunities for training in order to meet different circumstances. In addition
they would need to operate as rationally as a computer in their matching of data about
themselves and occupations. In the absence of these conditions, Neff saw l ittle reason to
expect a generally detectable relationship between an individual ' s notions about themselves
and the occupations they enter.
57
Neff ( 1985) contended that individuals could be expected to be constrained by more than a
single factor in their occupational choices. The factors he added were socioeconomic status,
particular aspirations, family preferences, ethnic and demographic barriers, the characteristics
of the formal education system and the influence of adults and peers as possible factors. The
implication is that to be adequate, a theory of vocational behaviour needs to be multivariate
in nature. Super himself departed from a single concept approach in the elaboration of the
" Life Career Rainbow" (Super, 1980) which involved the overlap of roles of an individual and
their relative importance during different times of the life cycle. The concepts of role salience
and the development of instruments to measure it (Nevill and Super, 1 986, 1988) has been
regarded as another important addition to Super' s theory (Brown, 1990) .
Earlier research in developmental theory was said to concentrate on career maturity (Super
and Kidd, 1 979) and adult adjustment to careers (Crites, 1976) . Interest has been renewed in
the adult stages of Super' s theory. Life-long aspects of career development have been
addressed in the work of developmental theorists such as Levinson, Darrow, Klein and McKee
( 1 978) .
Another developmental theorist to go beyond the use of single explanatory concepts was
Gottfredson ( 1981) . Her theory of occupational aspirations challenged the traditional approach
of examining either the process or content of career choice. Her aim was to integrate both.
She was particularly interested in intelligence, socioeconomic status, race and sex because it
was maintained these variables had been either minimised or neglected previously. Her model
included concepts such as aspirations, self-concept, developmental stages and perceived match
between person and occupation, in a unique synthesis of her own ideas with those of Super
and Ginzberg.
Reviewers have noted that tests of Gottfredson' s model have hailed it as an important
theoretical development (Slaney and Russell , 1987; Brooks, 1990) . However, it has also
received criticism (Pryor, 1985; Vondracek, Lerner and Schulenberg, 1983), in particular for
what has been regarded as an overemphasis on the effects of personal factors on women' s
career choices (Betz and Fitzgerald, 1987) .
Developmental theorists such as Tiedeman and O 'Hara ( 1963), demonstrated an interest in
work history, in particular as a predictor of individual work adjustment styles. They listed

58
defining characteristics of the work history, such as the kinds of positions occupied, the
sequence in which they were held and time spent in each. The work history was used as a
criterion or dependent variable to show work adjustment through such things as progression
to higher positions . Tiedeman and O 'Hara ( 1963) built on some of Ginzberg' s ideas but called
their own model a "concatenation of concepts " rather than a theory. Their views received less
attention empirically than those of Super but they formed a bridge between the early
developmental work of Ginzberg (and his group) and the work of Super. Tiedeman showed
more interest in the specific process of occupational choice than the development of work
attitudes.
A number of Tiedeman' s empirical investigations about vocational decision have been claimed
to have assisted in the clarification of some issues (Neff, 1985) . Sex-role and family status
have been shown to be at least as important as determinants of choice, as the self-concept.
Interest and personality tests have been shown to better predict occupational choice than
aptitude tests. Also support for Ginzberg 's observation about when the vocational self-concept
begins to emerge was found. Tiedeman' s theory of vocational development has been seen to
be related to the work of Erikson (1963) and his psychogenic ideas. A need for a broad
psychosocial theory was proposed that examines how a "vocational identity " is acquired. Like
Erikson, Tiedeman also viewed vocational development as an "epigenetic process " , one which
involves the differentiation of a previously undifferentiated structure. Tiedeman became
interested also in the development of computer-assisted self-guidance systems (Tiedeman and
Willis, 1972; Tiedeman and Miller, 1974) in response to what he saw as the obsolescence,
as a result of rapid technological change, of the relatively leisurely process of making
vocational choices. His expectation was that individuals must be prepared for multiple careers
in rapidly altering work environments. He expected the resultant decision making to be a
continuous process with the need for the implementation of particular skills being determined
by the environment .
Neither Ginzberg nor Super has been said to produce sufficient evidence for their theories but
Ginzberg' s was regarded as more plausible by Neff ( 1985) . Ginzberg' s theory, the more
complex and sophisticated of the two, did not ignore environmental constraints , as Super had
by focusing on the self-concept and he treated the environment in a dynamic way.
Environmental determinants were believed to play different roles at different times, but
expected to become increasingly influential . Both theorists regarded the experiences of later
59
childhood and adolescence, rather than early childhood, as more important in relation to work
behaviour and were less inclined to specify when work adjustment stages occur.
Other research in developmental theory has concentrated upon career maturity (Crites, 1 978;
Super and Kidd, 1979) and adult adjustment to careers (Crites, 1976) . A more recent
developmental perspective was represented in the work of Vondracek et al ( 1986) , in which
both life-span development and contextualist perspectives were emphasised. Development was
seen as an interaction between an active organism and a dynamic environment. Hackett, Lent
and Greenhaus (1991) noted this to be in contrast to approaches derived from mechanistic or
organismic notions of individuals in environments. Vondracek et al's work has generated little
empirical activity and has been criticised for failing to improve the conceptual status of career
development to any great extent (Gottfredson, 1983) .
Vocational terminology and thinking about career behaviour has been considerably affected
by developmental models, such as Super's. Despite career choices continuing to be studied
as static events, there is a general acknowledgement of career development being a dynamic
process . Although Super's notions of career stages, vocational identity, career maturity,
developmental tasks and career patterns have helped generate a wide range of research in the
past twenty years, empirical studies have usually not been conducted within the framework
of his. theory (Hackett, Lent and Greenhaus, 1991) . Instead Super's theory has been referred
to in a post hoc way (Fitzgerald and Rounds, 1989; Phillips, Cairo, Blustein and Myers,
1988). Hackett et al . (op. cit) argued, however, that this criticism applies to much of the
research related to career theories. It becomes difficult to determine whether studies which
have examined concepts such as self-concept, career stages, or career exploration have tested
Super's theory, or alternative models. Later theories, such as that of Dawis and Lofquist
( 1984) , have been more successful in their attempts to produce testable hypotheses and
standardized methods of measurement than Super and his associates who experienced many
technical difficulties in their attempts. Although Dawis and Lofquist's theory is as likely to
be referred to in a post hoc way as are the theories preceding it, this may be just as much a
comment on the failure of researchers to use theoretical frameworks generally than the
testability or potential of the theory itself.

60
active reactive active/ persev-reactive erance/
flexibility Super compensation outside ( 1 940) work/contrasting
leisure
Meltzer domination integrating compromises neglect ( 1 945) appeasement the conflict
Shaffer & bullying to attention getting Schoben compensate mechanisms/
( 1 956) rationalisation by
chronic fault finding
in others/ use of hysteria!
delusional beliefs
Crites seeking help/remove acquiescence or give up/
( 1969) obstacles to goals compliance/suppressing endure the
own conflicting conflict/
motives/changing self leave
synthesising factors
in conflict and frustration
without change
Beehr & Newman altering physical denial/ distortions
( 1978) conditions/ altering
behaviour I changing
the work environment
Folkman & Lazarus problem-focused emotion - focused
( 1980) coping coping
Gottfredson changing the job changing aspirations changing both
( 1981) to match to match jobs and aspirations
Van Sell, Brief establish emotionally distort the
& Schuler ( 1981 ) new behaviour situation/block out
threatening stimuli
Farrel exit or leave/ changing comparison neglect ( 1983) verbalising standards for job (passive)
dissatisfaction/ satisfaction patho-accidents/sabotage logically
accept
situation La tack altering stressor cognitive reappraisal altering the ( 1984) directly /managing re-evaluating to relationship
the symptons e.g. lessen stress to the exercise, relaxation or devalue job situation
Nicholson proactive role personal development personal ( 1984) development strategy adapting to meet
role development environment
Figure 2.3 Adjustment styles categorised by Dawis and Lofquist's dimensions

61
2 . 5 . 3 Adjustment mechanisms
It was recognised in early adjustment psychology that conflict and frustration produce anxiety and
tension (Shaffer and Schoben, 1956) . Because these emotional states are uncomfortable, the
individual was expected to attempt to allay them in some way. If a certain response reduces
anxiety and tension there is a high probability that when these feelings are re-experienced a similar
response will be made. There have been a number of different classifications of work adjustment
mechanisms in existence, Figure 2 .3 presents some for comparison.
Two of the models represented in Figure 2 . 3 postulated other dimensions along which their
mechanisms could also vary. Farrel (1983) proposed that his four response model of exit, voice,
loyalty, or neglect could be each described also on the conceptual dimensions of active/passive
and constructive/destructive. Also Nicholson ( 1984) posited that development could be potentially
retrograde, reactionary, or destructive. He added a third independent dimension to his personal
and role development dimensions, that of affective responses. Each dimension was thought to be
equally able to carry positive or negative connotations. Two characteristics were expected to
interact with adjustment to a change in role, the discretion and the novelty of role demands.
Discretion was described by the dimensions of, the capacity to choose goals, the means for
achieving them, the timing of the means-ends relationships and the pattern of interpersonal
relationships and their influence and evaluation. Low-discretion roles were predicted to prescribe
replication or absorption outcomes and high-discretion roles, determination or exploration. Novelty
was defined as the similarity of the new role to previously occupied roles. Low novelty was
expected to prescribe replication or determination and high novelty absorption or exploration
outcomes.
2 . 6 Summary
In summary, within the theoretical context out of which Dawis and Lofquist's theory developed
and which formed a part of the literature their theory aimed to integrate theories concerning
personality, motivation, job satisfaction and productivity were of importance. The literature
relating to job satisfaction and tenure was also of particular significance.
The long history of personality theory has culminated in contemporary personality theory being
less divergent on specific issues and sharing many common assumptions, for example, the

62
assumption that individuals actively seek interaction with their environment . A lessening of
polarization on certain issues such as the argument between trait theorists and situational
determinists resolving itself into an interactionist position. A certain degree of consensus appears
to have been reached in the area of personality theory. Dawis and Lofquist ' s theory, as described
in the next chapter, reflects this consensus to a large degree. Although their theory will be seen
to have many elements in common with personality theory generally and contemporary personality
theory in particular, some aspects (such as the recognition of the consciousness and cognition
issues) have been neglected by them.
Most approaches to motivation have received criticism, even if to varying degrees. Because most
research has tested the approaches in their entirety and usually without modification, no one theory
has tended to gain universal acceptance. The debate over the number and the structure of work
needs and the processes of need fulfilment has not lessened the apparent importance of the need
concept . Moreover, each of the approaches to motivation has offered some useful propositions.
For example, we are left with the need theories being more specific than others about the nature
of needs, although instrumentalists and behaviourists concern themselves little with the concept
of motivation. The instrumentality approaches have emphasised individuals ' perception of what
to expect in the way of rewards and the goals of goal-setting theory have been credited with
motivating individuals to consider strategies of obtaining goals. The balance theory approach has
emphasized the importance of achieving a balance of what is referred to as psychological tension.
The need for an integrating theory has been apparent, particularly in view of the specific
criticisms levelled at the various approaches and each approach being guilty of excluding
important aspects of the others. For example, the need approach has been criticised for the lack
of a definitive description of needs and the structure they are arranged in, the instrumentality
approach for its inability to account for effort or performance on its own, that is, through using
just cognitive, instrumentality and expectancy estimates. The goal-setting approach has been
criticised for being unable to account for motivation on its own and the reinforcement approaches
for failing to generalise to the work setting and for excluding, with a few exceptions, cognitive
elements.
Another major area discussed which has provided the context for work adjustment theory has been
that of personality theory. Although the direct application of personality theory to vocational and
work psychology has been limited, its influence appears to have been strong, particularly in the

63
instrumentality approach for its inability to account for effort or performance on its own, that
is, through using just cognitive, instrumentality and expectancy estimates. The goal-setting
approach has been criticised for being unable to account for motivation on its own and the
reinforcement approaches for failing to generalise to the work setting and for excluding, with
a few exceptions, cognitive elements.
The third major area forming a theoretical context to Dawis and Lofquist's theory, the
relationship of job satisfaction to productivity and to tenure as will be seen in the next
chapter, has been defined by Dawis and Lofquist in such a way as to exclude the cognitive
component. Just as a relationship between satisfaction and performance has not been
established, a strong relationship between job satisfaction and tenure has not emerged in the
literature. Other concepts such as job involvement and career commitment have been
suggested as more useful.
The fourth major area discussed in this chapter is that of relating individual work behaviour
to the work environment. In this context, the conditions requiring an adjustment response,
provide the circumstances in which work adjustment is required and to which a theory such
as Dawis and Lofquist's can be applied. These conditions of conflict and frustration are
defined by Dawis and Lofquist as being those situations where the individual's work
personality does not match that of the work environment. Dawis and Lofquist's stages of
maturation of the work personality are similar to those previously proposed, but they were
credited with being more successful in producing testable hypotheses and standardised
methods of measurement. The same could be said of their adjustment mechanisms. Most of
those proposed by others could be categorised according to Dawis and Lofquist's styles of
active, reactive, flexibility and perseverance (as described in the next chapter) . However,
Nicholson ( 1984) did propose other dimensions and in particular added an affective
component. Yet other approaches, to be discussed later, appear to have been of influence . For
example, Dawis and Lofquist reinterpreted their theory in systems theory terms.
Although Dawis and Lofquist are to be commended for many aspects of their theory, in
particular the use of testable propositions, they can be criticised for other aspects such as
neglecting the cognitive perspective. However extensive criticism of their theory will be
reserved for chapter four and instead be presented in a more expository manner in the next
chapter.

65
CHAPTER THREE
DAWIS AND LOFQUIST'S THEORY OF WORK ADJUSTMENT (1984)
3 . 1 Introduction
The study of work adjustment within vocational psychology initially focused upon developing
psychometric measures of vocational choice, personnel selection, work motivation, employee
morale and worker productivity. Each of these psychometric measures had some relevance
to work adjustment problems, but had produced independent bodies of literature. Lofquist and
Dawis advanced their first general formulation of a theory of work adjustment ( 1969) in
response to the need for an integration of the literature. Neff (1985) has described the
development of the theory of work adjustment as arising from a long series of research
studies, under the title of the WJrk Adjustment Project, which began in 1959 at the University
of Minnesota under the leadership of Lloyd H . Lofquist and Rene V. Dawis and was
supported by the U.S. Department of Health, Education and Welfare.
Dawis and Lofquist's theory once developed (1984) gave the appearance of being highly
valid, in part because its basis lies in a well accepted experimentally based stimulus-response
model and more importantly because its testable propositions were operationalised through
extensive instrumentation. It has attracted little criticism and has come to be regarded as one
of the dominant theories relating to vocational behaviour (Hackett, Lent and Greenhaus,
1991) . Most of the research related to it has been undertaken by the theorists and their
associates. They have also noted the research of others which support their theoretical
propositions. A summary of the research and a critical analysis of the theory is presented in
the next chapter. Because much of the research of others was not designed to test Dawis and
Lofquist's theory, its interpretation has had to be of a post hoc nature. Although factors such
as this may in themselves not invalidate the theory, the need for caution in its wholesale
acceptance and application becomes apparent. Despite the theory's possible limitations, it still
has remained the most appropriate work adjustment theory to use in research like the present
for two main reasons. Firstly, its propositions and extensive instrumentation help make it
empirically testable. Secondly, it has been used in vocational counselling and research in
relation to similar respondents in America.

66
The first version of the theory appeared in 1964 (Dawis, England and Lofquist), was revised
in 1968 (Dawis, Lofquist and Weiss) , and was produced in an extended form in 1969
(Lofquist and Dawis) . The most recent version (Dawis and Lofquist, 1984) discussed the
historical aspects and research literature which together demonstrated the centrality of work
to human development, its importance in total life adjustment and its contribution to the
satisfaction of needs. Dawis and Lofquist saw the amount of time an individual spends in
work and work related activities as a major justification for work being an appropriate area
of study for the behavioural sciences. Work was viewed as a way of improving understanding
of human behaviour and as an area to which psychological theory could be usefully applied.
Dawis and Lofquist described their work behaviour research as a psychological study about
how individuals adjust to work which uses the concepts and methods employed by scientific
psychology in the study of behaviour generally. Their definitions of work as an occupation,
employment, vocation, or job, viewed work as an activity.
Dawis and Lofquist claimed the studies forming the basis of our scientific knowledge of
human behaviour, have taken place mainly in the highly controlled setting of the laboratory
where specific responses and stimuli have been defined. They suggested such laboratory
studies can be applied to the study of more complex and larger units of behaviour which
occur over longer periods of time. Their aim was to take laboratory derived concepts, such
as response and reinforcement, and adapt them to larger units of individual behaviour and
environmental stimulation. Such a stimulus-response approach was regarded by Dawis and
Lofquist (1984) as a typical model upon which the study of human behaviour is based in
contemporary psychology. Individual's responses are examined in relation to preceding
stimuli, in the case of classical conditioning, or the stimuli which follow as reinforcers, in the
case of instrumental conditioning. In the work setting an individual was said to respond to a
variety of stimuli using many related responses over a long period. All the relevant stimuli
and responses were believed to be of importance. In order to make the task of observing these
manageable, global clusters of responses and stimuli arrived at through factor analysis were
used as the focus of interest in the first instance.
They believed the most desirable context for the study of work behaviour to be the natural
setting and the most desirable aim of such research to be the solution of practical problems.
They acknowledged that laboratory experiments provide the most dependable approach in
developing knowledge, but they argued that work behaviour needs to be studied in its natural

67
setting initially in order to identify the significant variables for further study. Also they were
concerned that laboratory findings are not always able to be generalised to naturally occurring
behaviour, particularly where findings involving specific behavioural elements are expected
to generalise to larger units of behaviour.
The basic principles they referred to appear to be mainly those exemplified in operant
conditioning or the experimental analysis of behaviour. These are represented for example
in Reynold's ( 1968) definition of operant behaviour as an experimental science of behaviour,
a process involving the frequency of a behaviour being modified by the consequences of the
behaviour, and as being concerned with the relationship between the behaviour of organisms
and their environment. The analysis of behaviour was characterised as deterministic and
experimental, and as focusing on the study of the operant or instrumental behaviour, but not
to the exclusion of the study of instinctive and reflexive behaviour. Reynold viewed it as an
objective science, confined to the study of factors that can be observed, measured, and
replicated.
As well as the stimulus-response model, Dawis and Lofquist identified differential
psychology, or the psychology of individual differences, as a basis of their research. They
noted that:
"People differ on any behavioural dimension. An individual's standing in a group
may differ from one behavioural dimension to the next. For some behavioural
dimensions, the individual's standing in a group will remain stable over time,
whereas for others there may be a change. An individual's status on a behavioural
dimension is the result of a unique genetic inheritance and a unique response
reinforcement history. " (Dawis and Lofquist, 1984, p 8 ,9)
Dawis and Lofquist conceptualized differences among individuals and work environments as
being able to be measured reliably, using the statistical technology generally available. They
assessed these differences using their matching model, in which work environments and
individuals were described using the same constructs and the same dimensions. Their theory
of work adjustment concentrated upon the work behaviour of specific individuals in continual
interaction with their specific work environments.
68
Dawis and Lofquist's ( 1984) starting point was the individual as an organism which responds
by reacting to and acting on sets of stimuli, thus developing a response repertoire for coping
with the environment, which includes communicating with it. Because an individual can
report on their stimulus and response experiences, the presence of memory is inferred.
Memory is viewed as a unique reference system for classifying present experiences. The
environments of individuals are also regarded as unique. Reports of observers about stimulus
conditions and the ways individuals respond, were also regarded as distinctive in keeping with
their own unique reference system or memory. The observer is expected to make inferences
about an individual's behaviour on the basis of observing responses that follow specific
stimuli, and observing the changes in responses that might be associated with changes in
stimuli conditions. Dawis and Lofquist believed that both the individual and observer or
observers, should describe an individual's behaviour, and that standard methods of
observation should be used as a way of increasing observer reliability and minimising
subjectivity.
The theory can be categorised in ways other than in individual differences and stimulus
response model terms as discussed at the conclusion of this chapter. The theorists themselves
couched it in systems theory terms, as in Figure 3 .2 .
3 .2 Dawis and Lofquist's theory
Dawis and Lofquist ( 1968; 1984) depicted their theory of work adjustment in a diagrammatic
form, as in Figure 3 . 1 . They maintained that because their theory is based upon " the concept
of correspondence between the individual and environment" (p 54), a harmonious relationship
that is reciprocal, complementary, and mutually responsive or corresponsive is implied. A
basic assumption is that " each individual seeks to achieve and maintain correspondence with
the environment" (p 54) , such an activity being regarded as a basic motive of human
behaviour. Achieving and maintaining correspondence in the case of one environment is
thought to affect that achieved and maintained in other environments, and work is regarded
as "a major environment to which most individuals relate" (p 54) . As can be seen from Figure
3 . 1 , both the individual and the environment contribute to the work adjustment process. The
skills which the individual brings to the environment were said to enable them to respond to
the work environment's requirements and at the same time the rewards of the work
69
environment can match individual's requirements. Correspondence is said to be achieved by
both parties when their minimal requirements are mutually fulfilled.
The concept of work adjustment is defined as, "the continuous and dynamic process by which
the individual seeks to achieve and maintain correspondence with the work environment" (p
55) has individual's behaviour in a work environment directed towards meeting its
requirements. In the absence of a correspondent relationship, the individual seeks to establish
and maintain it but if this fails other courses of action such as leaving the work environment
may be taken. Each work environment-individual relationship is regarded as idiosyncratic,
with the initial relationship often not being correspondent, and both elements constantly
changing. It is this process of change which is referred to as work adjustment. Achieving
minimal correspondence and remaining in the work environment allows more optimal
correspondence to be achieved, the correspondent relationship to be stabilised and tenure to
increase. "This stability of the correspondence between the individual and the work
environment is manifested as tenure in the job" (p 55) . As such tenure was viewed as the
most basic indicator of correspondence and defined as "a function of correspondence between
the individual and the environment" (p 55) .
Other basic indicators of correspondence were said to be satisfactoriness and satisfaction.
These were developed from the basic concepts of correspondence and tenure. Satisfaction
regarded as an internal indicator was defined as "a pleasurable affective condition resulting
from one's appraisal of the way in which the experienced job situation meets one's needs,
values, and expectations " (Dawis and Lofquist, 1984, p. 72) . Satisfactoriness was called an
external indicator and referred to the extent to which an individual met a standardised set of
work behaviours required by the employer. In the case of substantial tenure it was inferred
that the requirements of the work environment and the individual are being met.
The individual's work personality, representing the chief characteristics of the individual in
relation to work adjustment, is said to consist of at least two sets of characteristics : status
characteristics, personality structure; and process characteristics, personality style. Personality
structure is described via the skills and needs of the individual or their reference dimensions
of abilities and values, respectively. Personality style, in describing the individual's customary
ways of interacting with the environment given a particular personality structure, uses the
dimensions of celerity, or quickness or slowness in interacting with the environment, pace or
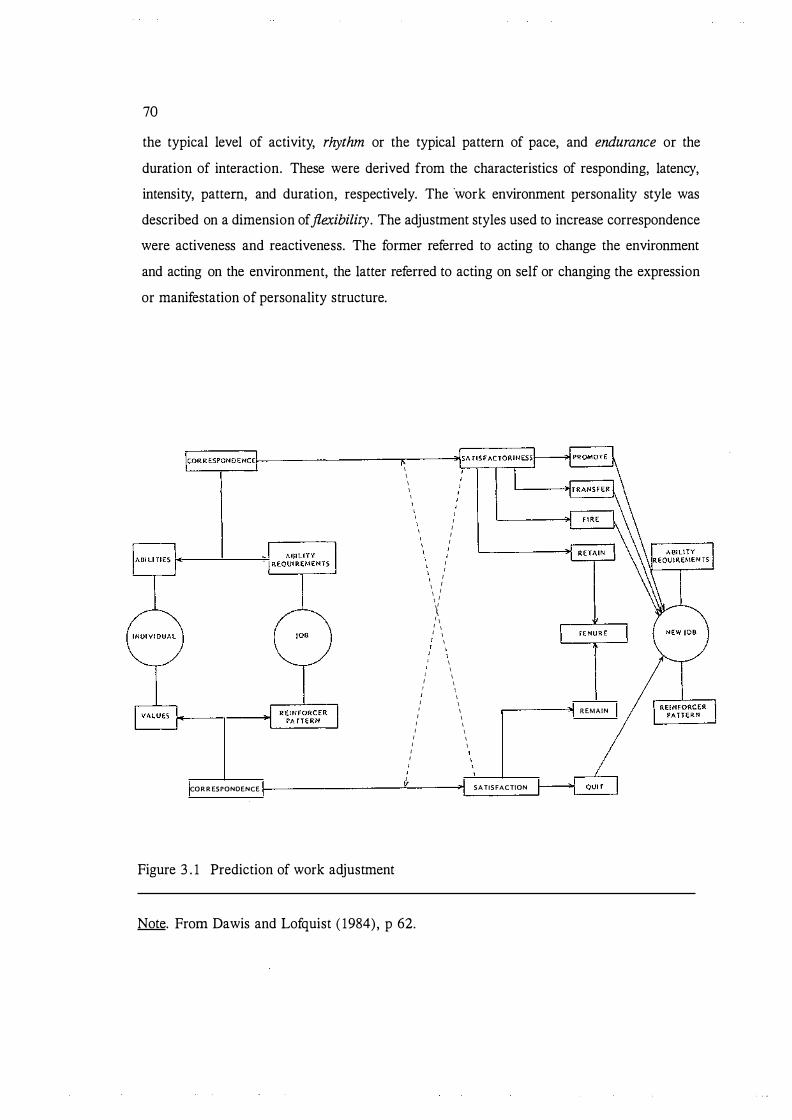
70
the typical level of activity, rhythm or the typical pattern of pace, and endurance or the
duration of interaction. These were derived from the characteristics of responding, latency,
intensity, pattern, and duration, respectively. The ·work environment personality style was
described on a dimension offlexibility. The adjustment styles used to increase correspondence
were activeness and reactiveness. The former referred to acting to change the environment
and acting on the environment, the latter referred to acting on self or changing the expression
or manifestation of personality structure.
I I I I \
I I I I
I I I I I
I I !
I I I I I I I \\1 1 1 I I I I I
I I I I
I I I I \ I I I I I I I I
COR R ESPONDENCE 1----------L---__..;;
Figure 3 . 1 Prediction of work adjustment
Note. From Dawis and Lofquist ( 1984) , p 62.
,-----� REMAIN
SATISFACTION
7 1
The work environment's status characteristics or structure is described by way of skill
requirements and need reinforcers, or classes of stimulus conditions via their respective
reference dimensions of ability requirements and reinforcer factors. The presence or absence
of skill requirements and need reinforcers are associated with the satisfaction of needs. The
characteristic patterns of these reference dimensions for any occupation are referred to as an
occupational ability pattern and an occupational reinforcer pattern. The style of the work
environment is depicted in terms of its requirements for speed of response (celerity) , level of
activity (pace), typical pattern of pace (rhythm) and duration of response (endurance) . Work
adjustment itself is then predicted from the correspondence between the work personality and
the work environment.
3 . 3 The theory's propositions
In developing their theory of work adjustment Dawis and Lofquist aimed to construct a
conceptual framework to give direction to the study of a specific class of behaviours (work
adjustment) occurring in the natural, rather than laboratory setting of the work environment.
A second aim was to require the operationalisation of its concepts such that both individual
and environmental differences were incorporated. And a third aim was to provide for the
study of behaviour from both a historical retrospective position, and a predictive prospective
position.
In the use of a stimulus-response paradigm Dawis and Lofquist identified their theory as
conceptualising behaviour at a molar level. They attempted to use response and stimulus
dimensions which were " optimally descriptive, manageable in number, and combined so as
to reflect both the individual and the environment functioning as integrated systems in an
interactive adjustment process " (Dawis and Lofquist, 1984, p 148 . ) . The dimensions specified
in their theory, abilities, values, and personality style, were viewed as combinations and
patterns, rather than separately. The particular combination or pattern for each set of
dimensions was believed to have greater significance than each dimension on its own. The
patterns were expected to better represent reality because they were thought to reflect a
hypothesised underlying interconnectedness of single dimensions and to represent the
integration of the individual with the overall organisation of the environment.
72
Dawis and Lofquist articulated their theory of work adjustment in terms of sixteen formal
propositions, and their associated corollaries and diagrammatic representations which
operationalised those propositions, as shown in Figure 3 . 8 . The first nine propositions, see
Table 3 . 1 , provided Dawis and Lofquist with both the direction for their research and a basis
for the prediction of work adjustment. A further work adjustment proposition related to the
belief that knowledge of the characteristic ways in which an individual interacts with an
environment, given a particular work personality structure, can improve the prediction of
work adjustment. The first ten propositions were said to be related to the prediction aspect
of work adjustment, while propositions XI to XVII described the process of work adjustment.
3 . 3 . 1 Formal propositions I to IX
Crites' ( 1976) summary and review of the theory provides a useful description of it in its
earlier stage, as represented by propositions I to IX, prior to the later development of process
aspects as represented by adjustment styles in 3 .4: He regarded the theory as consisting of
dynamically interrelated components of motivation, adjustment, outcomes, and time. The
motivation component related to needs as antecedents of behaviour both when they are met
and when they are frustrated. The consideration of both facilitating and thwarting
environmental conditions were believed necessary to adequately represent the work
environment.
The adjustment component referred to an attempt to fulfil work-related needs in response to
thwarting or constraining conditions which in the event of failure might result in such
withdrawal behaviours as job instability (Vaitenas and Wiener, 1 977) . However,
correspondence between an individual's needs and situational characteristics were expected
to lead to adjustment and p ositive attitudes towards work (O'Reilly, 1 977; Dreher, 1 980) . The
outcomes component was described as a state of adjustment which may act as an important
antecedent for effective role behaviour, or satisfactoriness, which may be followed by
affective reactions primarily in the form of satisfaction. The component of time was that over
time the interactions between the individual and the organisation will produce positive
outcomes given that motivation, adjustment, and satisfaction remain positively related. In the
event of a misfit, negative personal and organisational outcomes were expected. The central
1 Section 3 .4 herein.

73
Table 3 . 1 Propositions I to IX
PROPOSITION I. Work adjustment at any time is indicated by an individual's concurrent levels of satisfactoriness and satisfaction.
PROPOSITION II. Satisfactoriness is a function of the correspondence between the individual's abilities and the ability requirements of the work environment provided that the reinforcer pattern of the work environment corresponds to the individual's values.
Corollary Ha. Knowledge of the abilities of individuals and their satisfactoriness permits determination of the effective ability requirements of the work environment. Corollary lib. Knowledge of the ability requirements of the work environment and of the individual's satisfactoriness permits the inference of the individual's abilities.
PROPOSITION Ill. Satisfaction is a function of the correspondence between the reinforcer pattern of the work environment and the individual's values, provided that the individual's abilities correspond to the ability requirements of the work environment .
Corollary Ilia. Knowledge of the values of individuals and their satisfaction permits the determination of the effective reinforcer pattern of the work environment. Corollary IIIb. Knowledge of the reinforcer pattern of the work environment and of the individual's satisfaction permits the inference of the individual's values.
PROPOSITION IV. Satisfaction moderates the functional relationship between satisfactoriness and ability-requirement correspondence.
PROPOSITION V. Satisfactoriness moderates the functional relationship between satisfaction and value-reinforcer correspondence.
PROPOSITION VI. The probability that an individual will be forced out of the work environment is inversely related to the individual's satisfactoriness.
PROPOSITION VII. The probability that an individual will voluntarily leave the work environment is inversely related to the individual's satisfaction.
PROPOSITION VIII. Tenure is a joint function of satisfactoriness and satisfaction (a combination of VI and VII) .
Corollary VIlla . Tenure is a function of correspondence between abilities and requirements and between values and reinforcers.
PROPOSITION IX. Correspondence between work personality and work environment increases as a function of tenure.
Note. From Dawis and Lofquist ( 1984) pp 60-61 .
74
concept of Dawis and Lofquist's model was identified by Tziner (1983) as the notion of
correspondence.
3 . 3 .2 Formal propositions X to XVI
Dawis and Lofquist (1976) attempted to improve their prediction of work adjustment by
adding the concept of adjustment style and its dimensions of flexibility, perseverance,
activeness, and reactiveness. They formulated additional propositions and corollaries, X to
XVII, to provide direction for research. These were as in Table 3 .2 .
Table 3 .2 Propositions X to XVII
N.B. Corollary VIlla followed from propositions II, Ill and VIII. Proposition X related to the characteristic way individuals interact with their environment.
PROPOSITION X . The correspondence between work personality style and work environment style moderates the prediction of work adjustment from the correspondence between work personality structure and work environment structure.
PROPOSITION XI. The flexibility of the work environment moderates the functional relationship between satisfactoriness and ability-requirement correspondence.
PROPOSITION XII. The flexibility of the individual moderates the functional relationship between satisfaction and value-reinforcer correspondence.
PROPOSITION XIII. The probability that the work environment will use adjustment modes is inversely related to the individual's satisfactoriness.
Corollary XIIIa. Knowledge of this probability associated with the individual's satisfactoriness permits the determination of the work environment's flexibility threshold.
PROPOSITION XIV. The probability that the individual will use adjustment modes is inversely related to the individual's satisfaction.
Corollary XIVa. Knowledge of this probability associated with the individual's satisfaction permits the determination of the work environment's flexibility threshold.
PROPOSITION XV. The probability that the work environment will act to remove the individual is inversely related to the perseverance level of that work environment.
(continued)

75
Corollary XVa. Knowledge of this probability associated with the work environment's perseverance permits the determination of the work environment's perseverance threshold.
PROPOSITION XVI. The probability that the individual will act to leave the environment is inversely related to the perseverance level of that individual.
Corollary XVIa. Knowledge of this probability associated with the individual's perseverance permits the determination of the individual's perseverance threshold.
Given Propositions VIII, XV, and XVI, it follows that:
PROPOSITION XVII. Tenure is a function of satisfactoriness, satisfaction, and the perseverance levels of the individual and of the work environment.
Note . From Dawis and Lofquist ( 1984) pp 67-68.
3 . 3 .3 A systems perspective
Dawis and Lofquist believed their set of propositions suggested research hypotheses which
could be used to assess the applicability of the theory and to gain further understanding of
work adjustment. They acknowledged that work adjustment is very complex and that
additional research findings and improved methods for the description of work personalities
and work environments may suggest other propositions. They attempted to integrate the
adjustment process and prediction aspects of their theory by viewing work adjustment from
a systems perspective, as depicted in Figure 3 .2 (Dawis and Lofquist, 1978) .
In Figure 3 .2 , the individual (I) is expected to evaluate a set of needs against a set of expected
reinforcers. If these reinforcers equal or exceed the needs, satisfaction (SN) occurs and the
individual behaves in an expected way. The individual's work behaviour is said to consist
mainly of task performance which is then evaluated by the work environment (E) against the
task requirements . If the individual has achieved satisfactoriness (SS), the organisation
produces the reinforcement necessary to meet the individual's needs. The individual
experiences job satisfaction. The individual remains satisfied and satisfactory until further
significant changes occur.
The main points in the system believed to affect a stable interaction between an individual and
the work environment are needs, work behaviour, task requirements, and organisational

76
behaviour. The possibility that an inaccurate evaluation could be made by either the individual
or the work environment was also expected to have an effect.
In the case of reinforcers not meeting needs, the individual is said to experience
dissatisfaction (DSN) which if above the individual's lower threshold (T), will result in better
adjustment being sought. Either the active (A) or reactive (R) modes of adjustment (AM) may
be brought into play on their own or together. If these adjustments do not culminate in at least
a tolerable level of satisfaction, the individual could leave the work environment instead of
attempting to meet task requirements through work behaviour. When the work environment
(E) evaluates an individual's task performance as not meeting task requirements, the
individual would be considered unsatisfactory (USS). When the unsatisfactoriness exceeds the
work environment's threshold (T), the appropriate adjustments would be made by the work
environment. These include accommodating, which is categorised as a reactive response by
the environment, or making an active response by taking steps to have the individual change.
If a mode of adjustment did not have the desired effect, the work environment would effect
a separation (S) of the individual from the work environment through methods such as
transfer, demotion, termination of employment or even promotion in some instances.
1 r·· ·········--·······-.... ·-··-·· A .!,':,
A ········-······-·-···-··················]
;> O = SS L------------ - - - - - - - - - - - - - - - - -
Figure 3 .2 Work adjustment from a systems perspective.
Note. From Dawis and Lofquist ( 1984), p 66.
I = the individual SN = satisfaction DSN = dissatisfaction T = the individual's threshold A = active adjustment mode s = separation
E ss uss AM R
= the environment = satisfactoriness = unsatisfactory = · adjustment modes = reactive adjustment
mode
77
Information on the four components of the system, needs, reinforcers, task performance and
task requirements, is needed in order to predict work adjustment. Information can be obtained
in advance on all components with the exception of task performance. This can b e known
only when the individual is in the work environment, therefore a measure of the potential for
task performance, that is, abilities, is substituted. For convenience and to match the
translation of task performance into abilities, task requirements are also translated into ability
requirements, as shown to the bottom right of Figure 3 .2 . The initial formal propositions of
work adjustment theory, the subsequent adjustment style dimensions and the intervening
variables of individual work behaviour and organisational behaviour are all incorporated into
the dynamic system to describe the flow of the work adjustment process.
3 .4 The work personality
Dawis and Lofquist claimed that the behaviour of an individual is perceived by others in
terms of the social standards of behaviour that have developed within a particular society.
Societies are said to have well defined and stable prescriptions for behaviour which are
acceptable in different environments, the work setting being one of these. These prescriptions
are administered and promoted by social institutions. The responses of an individual in this
context come to constitute their work personality.
3 .4 . 1 Skills/ abilities
An individual's 'personality' can be represented by describing their responses to stimuli.
Recurring sequences of responses, referred to as skills, are believed to be being continually
improved upon thus developing a repertoire of skills. Despite individual differences in skill
repertoires, response sequences can be similar for some individuals. Where a common skill
for individuals exists, a skill dimension can be defined using characteristics, such as level of
difficulty.
Individuals can be ranked on dimensions according to their skilfullness. Dawis and Lofquist
recognised the large number of skill dimensions likely to exist and the resulting difficulty in
any attempt to describe individual responses. Consequently, factor analysis was used to
produce fewer and more basic dimensions called ability dimensions, which underlie the
numerous skill dimensions. These ability dimensions were regarded as reference dimensions
78
for skills. The description of individuals, using such dimensions, was believed to be both
more economical and efficient. It was acknowledged that the measurement of the entire range
of abilities was 'formidable' and that such measures commonly include ability tests which are
developed on a factor analysis basis.
An individual's abilities were expected to improve over time and become established as
development occurs. Measurements of ability at different points in time were said to reflect
this change. An individual's abilities are regarded as mature when the measurements of them
appear stable. Abilities are believed to be used not in an automatic way but in response to the
presence of the appropriate stimulus conditions. It was maintained that as responses are made
in the context of many stimuli, and as similar response-stimuli sequences occur, an individual
is able to describe the stimuli and responses and make an evaluation of them. This evaluation
is thought to be made in relation to how satisfying the stimuli are. Evaluations like this help
to establish 'stimulus-condition requirements' for responses which will produce satisfaction.
The individual may then report these requirements as preferences.
In the case of an observer, the individual's preferences for stimulus conditions are inferred
by sampling their behavioural responses to different stimuli conditions, and by comparing
these observations with those of other observers while taking the individual's stated
preferences into account. The stimuli are referred to as reinjorcers when they are associated
with an increase in the rate of responding over a base rate. An increase in and maintenance
of a response rate is said to have resulted from reinforcement. Different reinforcers are
expected to have different reinforcement strengths for any one individual and among different
individuals. Dawis and Lofquist distinguished among actual reinforcement strengths, those
experienced by the individual, stated, those reported by the individual, and observed, those
reported by an observer. They noted that stated and observed strengths may differ and that
actual strengths could be inferred from either. The need for reinforcement at certain levels
of strength is believed to become established because some reinforcers need to be higher in
strength than others to be of importance to an individual.
In identifying the most important ability dimensions of the work personality, Dawis and
Lofquist elaborated on other classification systems of categories of work tasks (Fine, 1 955;
and the U.S. Department of Labor, 1 977) where tasks are grouped in terms of the functions
of workers as they relate to data, people and things. They translated these into the

79
psychological terms, as in Table 3 .4, of symbolic abilities, interpersonal abilities, and sensori
motor abilities respectively, which were abilities categorised in terms of their content . The
basic psychological processes involved in work skills were said to be afferent, mediational ,
and efferent in nature. Afferent abilities, or input, were defined as those involved with
receiving, processing and the transformation of information. Mediational abilities, or central
processing, referred to the storing, processing, and transformation of information on the part
of the individual . Efferent abilities, or output, related to the individual acting on the
environment.
Table 3 .4 Examples of abilities in nine content-process areas
PROCESS Symbolic abilities (Data)
Afferent abilities Verbal , numerical , (Input) and spatial
perception
Mediational abilities Verbal , numerical, (Central processing) and spatial
reasoning; memory for words, numbers and space
Efferent abilities Verbal fluency; (Output) numerical compu-
tation; spatial manipulation; verbal , numerical , and spatial reporting; speaking
Note. From Dawis and Lofquist (1984), p 27.
CONTENT
Interpersonal abilities (People)
Person dynamics, group dynamics, and mass dynamics perception
Reasoning about person, group, and mass behavior; memory for person, group and mass phenomena
Communicating; persuading; leading, and following
Sensorimotor abilities (Things)
Visual, auditory, tactual , kines-thetic, and form perception
Sensory judgement; mechanical reason-ing; memory for objects and sensations
Manual and finger dexterity; eye-hand coordination; mechanical assembly; physical abilities (strength endurance); inventing ability
The three processes were said to apply to all of the so called content areas of data, people,
and things. Abilities were therefore able to be classified in terms of both process and content.
A cross classification of these produced nine ability areas regarded as important for an
individual functioning in their work. These are presented in Table 3 .4 . Work skills were
thought to involve the use of one or more of these different abilities in combination. Some
80
studies had identified the abilities used where skills are complex (Fleishman, 1954) . However,
Dawis and Lofquist advocated more empirical research to recognise abilities which are central
to the wide range of work skills required in any one culture and to discover which are the
most important when describing the personality structure of individuals.
3 .4.2 Needs/Values
A need was defined as " an individual's requirement for a reinforcer at a given level of
strength " (p 17) . The collection of needs was described as a required pattern of reinforcers
at certain levels of strength. The theorists emphasised that their use of the term need was
different from its common definition as a particular state of deprivation. They recognised that
deprivation may affect a reinforcer's strength, but emphasised that the important psychological
point lies in the requirement of a reinforcer at a particular strength, irrespective of its
deprivation. It is for this reason their needs were called psychological needs. They were said
to be stable when repeated measurements of them, usually via questionnaires, inventories or
judges' ratings, show little change. Often this has been found to occur as an individual
reaches maturity. In the case of a large degree of change in an individual's environment,
some change in an individual's psychological needs were still expected but to a lesser degree
once an individual has reached maturity.
Dawis and Lofquist in reviewing the concept of values concluded there is general agreement
that it is what the individual regards as important which is central to a definition of values.
In the l iterature values had been described as "an enduring belief that a specific mode of
conduct or end-state of existence is personally or socially preferable to an opposite or
converse mode of conduct or end-state of existence" (Rokeach, 1973 , p 5) . Values had been
equated with 'basic interests or motives' and 'evaluative attitudes' (All port, Vernon and
Lindzey, 1970) . They have been described as "a special kind of attitude, functioning as
standards by which choices are evaluated" (Smith, Kendall and Hulin 1969, p 102) . England
and Lee (1974) regarded values as a relatively permanent perceptual framework which shapes
and influences the general nature of an individual's behaviour. Although similar to attitudes,
they were characterised as more ingrained, permanent, and stable in nature, more general,
and as less tied to any specific referent than are many attitudes. Super ( 1973) stated that
" traits, values, and interests derive from needs . . . Traits are ways of acting to
meet a need in a given situation. Values are objectives that one seeks to attain to
8 1
satisfy a need. Interests are specific activities and objects through which values
can be attained and needs met. " (p 189-190)
Holland ( 1973) treated values as one of several characteristics, including interests and
competencies that create a characteristic disposition or personality type. Locke ( 1976)
distinguished the concept of values from that of need. The latter was regarded as those
conditions necessary to maintaining an organism's life and well being. Needs were regarded
as subjective and innate while values were believed to be objective and acquired. But it is
.Katzell's (1964) definition of a value, "that magnitude of a stimulus or job characteristic
which evokes a relatively high level of satisfaction" (p 346), which Dawis and Lofquist
regarded as being the most similar to their own concept of needs.
The psychoanalytic and self-theoretical orientations classified as psychodynamic (Crites, 1 969)
have only some aspects in common with Dawis and Lofquist's approach to needs. Some of
the needs are the same and work needs are believed to have a reinforcement history (Dawis
and Lofquist, 1984) . Like Maslow's theory, Dawis and Lofquist believed that individuals will
initiate and sustain behaviour aimed at satisfying needs and they placed importance on
knowing which needs individuals are attempting to satisfy.
The approach to work needs adopted by Dawis and Lofquist could suffer some of the same
criticisms levelled at operant conditioning generally. Of particular concern might be the
circuitous nature of the definition of needs and reinforcers. Needs were defined as
requirements for reinforcers, and reinforcers defined in terms of their effects on the
subsequent frequency of the response, that is the need response, which immediately preceded
them.
Needs were thought to be measurable in at least two ways : 1 ) through questionnaires,
inventories, or surveys, in order to gain reported preferences or 2) via observers evaluating
the relative reinforcement strengths of stimulus conditions. Because there could be as many
need dimensions as stimulus conditions associated with them, the more basic dimensions that
underlie needs were sought through factor analysis, these common elements being referred
to as value dimensions. In the same way that abilities were inferred from skills, values were
inferred from the factor structure of needs.

82
3 .4 .3 Personality style
While personality structure referred to the stable measurements of abilities and values and the
relationships among them, personality style was defined as the utilisation of abilities in the
context of values in terms of the dimensions of celerity, pace, rhythm, and endurance.
Personality style represented the process characteristics of the work personality and the
individual's typical ways of interacting with the environment. Tolerance of discorrespondence
between the individuals and the work environment was described on an adjustment style
dimension of flexibility. The description of minimal correspondence needed to predict tenure
was said to involve knowledge of the individual's flexibility. The adjustment style dimensions
or modes used to increase correspondence were those of activeness and reactiveness.
With instruments for measuring these three adjustment styles at the development stage, Dawis
and Lofquist suggested that data on the individual's past history could be used to assess their
standing on these dimensions. It was suggested that the highly celerious individual would be
expected to have a history of early completion of tasks, behaviour that is approaching being
impulsive, and an inclination towards favouring speed of response rather than accuracy. In
contrast, low celerity was expected to be characterised by deliberateness, procrastination, and
response latency. Participation in a large number of activities or, particularly where high
levels of activity were expended was expected to be indicative of an individual exhibiting a
high pace. The high level of activity of high-paced individuals was thought to be compulsive
in nature and represent an inability to relax.
The variability of the indicators of pace, historical or observed, were expected to shw the
nature of any rhythm of responding. Endurance, it was suggested, might be inferred from
length of tenure in j obs, length of relationships with people, the completion of lengthy
projects and the tendency to continue with hobbies, interests, and sporting activities.
It was hypothesised that an individual with a history of participation in a wide range of
activities and situations would have a high level of flexibility. Similarly an individual with a
heterogeneous group of friends and a successful work history over a wide range of jobs,
would be expected to have a high level of flexibility. It was argued that because personality
style develops over time, suitable sources of data might include records, such as biographical
data, school and work history, and cumulative psychometric data. Other data sources
83
suggested were clinical observation of behaviour in a number of different settings and
supplementary ratings from individuals who have made observations over a prolonged period.
The extent to which an individual adopted the leadership role was expected to be associated
with the use of the active mode. The indicators for reactiveness suggested were, a history of
"abiding by the rules, carrying out assignments according to prescribed
procedures, comfort or satisfaction in highly structured situations and groups, and
loyal and continued participation in groups as a member rather than a leader. "
(Dawis and Lofquist, 1984, p 64)
Dawis and Lofquist probably did not intend any one of their suggested indicators be used in
isolation nor expect the individual indicators to accommodate varying cultural or
organisational differences in values. Without measurements which are known to be reliable
and valid, their suggested indicators may provide some degree of valid prediction about the
adjustment styles of an individual in the interim. They did not seem to be suggesting that any
one individual is capable of employing only one of the adjustment modes exclusively but
rather that they have a propensity towards the use of a particular one.
Some of the research relating to adjustment styles (Dawis and Lofquist, 1984) has, however,
focused upon the exclusive use of styles, upon occupations and organisations able to be
clearly identified with a particular adjustment style and upon vocational preference and
adjustment of individuals whose preferred style coincides with that of the occupation or
organisation.
Dawis and Lofquist (1984) defined the interrelationships among the three adjustment style
dimensions of flexibility, activeness and reactiveness as in Figure 3 . 3 . They used the notions
of a lower and upper threshold on an axis of discorrespondence and a range of tolerable
discorrespondence, within which the styles of activeness and reactiveness can be applied. The
length of time an individual remains in the tolerable range is their perseverance, and is said
to depend upon the effectiveness of an individual's particular mode of adjustment. Flexibility
defined the distance between points 0 and TL, whilst the range of tolerable discorrespondence
and perseverance defined the distance from point TL to the upper threshold on the axis of
discorrespondence (TU) .

84
When discorrespondence is above this lower threshold but does not exceed the upper
threshold, the individual is said to be within the range of adjustment. The range of
unmanageable discorrespondence is that above the upper threshold. Within this range a
change to another environment would be expected. Of the four adjustment style dimensions,
activeness and reactiveness are referred to as adjustment modes. Initially their use and the
length of time they operate is determined by the degree of individual flexibility and
perseverance.
Range of in tolerable discorrespondence
1 0
f Range of u nmanageable d iscorrespondence requiring change to another environment
1 Range of adjustment
. l i Range of tolerable d iscorrespondence
Poin t of perfect correspondence 1 Figure 3 . 3 Relationships among adjustment style dimensions
Note. From Dawis and Lofquist ( 1984) , p 64.
There are similarities and differences between Dawis and Lofquist's and other treatments of
the conditions which necessitate work adjustment and the need to adopt an adjustment style
or styles. For Dawis and Lofquist the internal thwarting conditions Crites ( 1969) wrote of
would have involved an individual lacking certain abilities to match the environment's ability
requirements. Crites' external thwarting conditions would relate to a failure or inability on
the part of the environment to reinforce the work needs of the individual . In summary,
thwarting conditions would be the lack of correspondence between the individual and the
environment. But Dawis and Lofquist's treatment of conflict did not focus upon types of
conflict, such as disturbances of aim and function, as did the earlier researchers of which
Robbins ( 1939) is an example. Of Homey's necessary factors for creative work which were
abilities, a lack of extensive conflict, a good level of self-confidence and an interest in work,
85
only ability considerations were the focus of Dawis and Lofquist's theory. Ichheiser's (1940)
conflict of function was represented in Dawis and Lofquist's individual abilities and work
requirement correspondence. The identification of moral values as a work need resembled
conflict of conviction. Conflicts of ambition and response were represented to some extent
by Dawis and Lofquist's social status needs. Like the more sociological approach of Eaton
( 1952) , Dawis and Lofquist were interested in the importance of work and a defined role. In
addition they recognised the importance of the failure of top management to delegate authority
downward. This failure and concerns about pay were seen by Brinker (1955) as the most
significant factors causing frustration.
In Dawis and Lofquist's theory, both the employee and employer are credited with
determining the relevant abilities, values and style dimensions in a work personality. The
employer determines the behaviour necessary for the achievement of workplace goals,
determines the stimulus conditions and provides the reinforcement intended to maintain the
desired behaviour, all within the constraints of the wider environmental context. The context
of influence can include governmental policies and actions, union activity and other work
organisations. The employee affects the work environment by accepting, changing, or
rejecting working conditions as specified by the employer. In order to retain workers, an
employer is believed to need to take satisfaction into consideration, facilitating it through
meeting employee requirements.
3 .4.4 The adjustment mechanisms of Dawis and Lofquist and others
Because Dawis and Lofquist's categories of adjustment mechanisms are broad and reasonably
comprehensive, most other adjustment mechanisms can usually be reclassified according to
their theory as in Figure 2 .3 . Some involve more than one style. Farrell's (1983) dimensions
did not appear to have a Dawis and Lofquist equivalent. On the other hand, Nicholson's
analysis of role demands and their impact and the addition of the affective component, appear
to represent a reasonable expansion of Dawis and Lofquist's theory.
3 .4 .5 The development of personality structure and style
The personality style of an individual was expected to stabilise with maturity. Three phases
were postulated in this maturation process. The differentiation stage was described as the
86
experimentation, development, and expansion of responses in relation to their variety, range
and complexity. A second stage was regarded as one of stability, where a response repertoire
is being formed and maintained. A third and final period of decline was postulated where
physiological changes associated with the aging process are expected to affect responses.
Within the differentiation stage the development of perceptual and motor skills were thought
to predominate. As mastery is achieved over the physical environment and other individuals
are interacted with, skills and needs are exhibited and a set of abilities and values developed.
At certain periods, development is expected to be more rapid than others. Examples given of
expected rapid development have been puberty and other times where there is change in the
physical development of individuals and/or environmental stimuli . Graduation from university
might be such a period of rapid development. Abilities and values are said to crystallize and
stabilize, the former referring to the keeping of sets of abilities in the personality structure,
and the latter to the maintenance of abilities and values at certain levels of strength relative
to each other.
An individual's work personality, made up of abilities, values, and style dimensions, is said
to mature when there is a crystallized and stable personality structure and style. Physical and
psychological maturity generally have been believed to occur about the same time (Anastasi ,
1958; Tyler, 1 965) . This maturity was thought to coincide with the time when most begin
employment (Dawis and Lofquist, 1984) , which is however also a time characterized by new
stimulus conditions. These conditions can produce certain new skills and needs such that the
initial employment period results in some change in an individual's skills and needs.
By postulating a maturation of personality style involving developmental stages, Dawis and
Lofquist's theory departed from its trait-and-factor foundations that Rounds, Dawis and
Lofquist ( 1987) had identified. Dawis and Lofquist identified fewer developmental stages than
Super ( 1953) but more than either Ginzberg et al. (1951) or Tiedeman and O'Hara ( 1963).
See Figure 2.2 which is a comparison of developmental theorist's work adjustment stages.
For Dawis and Lofquist, stages of development seemed to be less central to their theory and
to function more as a chronological context for their interest in work personality /work
environment correspondence and the stimuli and responses involved. The maturation of the
work personality, however, was a developmental stage fundamental to the application of their
theory which assumed a mature personalty. The time period involved in their developmental
87
stages were only indicated by their somewhat self-explanatory labelling of the stages of
differentiation, stability, and decline (differentiation included sub stages of experimentation,
development, and expansion) . The third stage of decline to do with age and aging affecting
responses also lacked specificity about the typical age of onset.
Like Ginzberg, Dawis and Lofquist viewed occupational choice as a process rather than an
event. They also focused on the interplay between intraindividual and extraindividual
determinants, that is between work personality and work environment. However, unlike many
others they described the determinants in detail, developed instruments to measure them, and
formed propositions about the interrelationships. Osipow's ( 1975) criticisms of Ginzberg's
theory could not be as easily applied to Dawis and Lofquist's approach, those criticisms
having been concerned with the truncation of development in early childhood, poor
operationalisation of the constructs, and inconsistent research support.
Like Super, Dawis and Lofquist were critical of early occupational prediction models.
Although they focused on work adjustment rather than occupational choice, it was attention
to many of the difficulties associated with occupational choice theories that influenced the way
in which their theory developed. This was evident in the extensive instrumentation used to
operationalise their theory. Although they went beyond a single concept approach (like that
of a self-concept, Super et al 1967) their additional factors, unlike Neff ( 1985) , included
fewer of an occupational choice nature. In addition, Neff included factors such as
socioeconomic status, particular aspirations, family preferences, ethnic and demographic
barriers, formal education system characteristics and the influence of others, adults and peers.
In keeping with developmental theorists such as Teideman and O'Hara ( 1963), Dawis and
Lofquist also demonstrated an interest in work histories, in particular as a predictor of
individual work adjustment styles. But unlike theorists such as Ginzberg and Super they were
not interested in the experiences of childhood and adolescence. Dawis and Lofquist's theory
was more similar to the approach of Vondracek et al ( 1986) , which post-dated theirs, and
which emphasised interaction between an active organism and a dynamic environment.
Although Dawis and Lofquist's work has, like other career related theories, been referred to
more often in a post hoc way, Hackett, Lent and Greenhaus ( 1991) noted they have been
more successful in their attempts to produce testable hypotheses and standardised methods of
measurement than were Super and his associates, for example.

88
3 .5 The work environment
The work environment itself, its nature and complexity, has been described by Dawis and
Lofquist ( 1984) using terms applicable to the work personality. Firstly, the importance of
taking into account the diversity of work environments was noted. The increasing diversity
was thought to provide more opportunity for unique skills of individuals to be used and to
increase the likelihood that needs would be satisfied. However, the enormous number of
occupations and the resulting complexity of their interrelationships has made it difficult for
individuals to locate occupations which are compatible with their work personalities.
Therefore information was sought which would facilitate work adjustment for individuals
entering the workforce or changing employment, by allowing them to classify work
environments.
The type of information thought helpful to individuals to optimise work adjustment through
increasing the likelihood of choosing the best occupation included knowing which occupations
have the work environments to meet their needs and what can be brought to a j ob to make
them satisfactory employees. A system was sought which classifies jobs in a sophisticated
manner and provides information about groups of occupations which are congruent with work
personalities. In this way work adjustment was expected to be optimised through increasing
the likelihood of choosing the best occupation. Such a system could of course suffer from the
same criticisms applied to the traditional matching jobs and people approach. There may not
be an exact match for everyone, some groups of occupations would lack congruence with the
needs of most individuals and some occupations may have no match. But the individuals for
whom this was the case would still seek work and the positions in question would still need
to be filled, despite problems of congruence.
The work environment has been defined usually from the perspective of employers and has
involved an account of the work performed, the materials used, the title of the j ob and the
rate of pay. Such descriptions are based on an economic model of work where the individual
is regarded as only one of the factors in the production of services and/or goods, with the
central focus being the j ob itself. Dawis and Lofquist noted that task oriented definitions of
work usually involved the tasks necessary for the attainment of employer related goals. They
maintained that where the understanding of adjustment to work is the main consideration, task
requirements would be better translated in terms that identify the abilities needed for the task
89
performance. Similarly, work-environment descriptions would be better to focus upon how
to meet the needs of workers, and how workers can influence work-environment
characteristics.
Dawis and Lofquist recognised the enormity of the task of describing the work environment
in work personality terms, particularly in view of the complexity of work. The United States'
Department of Labor's Dictionary of Occupational Titles ( 1977) alone describes some twenty
thousand jobs. Dawis and Lofquist have found merit in viewing jobs in terms of their
similarities and differences and have used the stimulus conditions as a basis for making such
comparisons among jobs. They grouped stimulus conditions into two main classes : cues and
reinjorcers. The stimulus conditions which signal the type of response which is appropriate
and when it should occur were called cues. The stimulus conditions associated with the
likelihood of a response occurring were called reinforcers.
Cues were said to be associated with skills. In the expression of a skill, cues were believed
to initiate the appropriate response sequences. In part, the level of skilfullness was expected
to be linked to the speed with which appropriate cues are perceived. Cues were said also to
be associated with reinforcers by signalling which are to be expected and at what strength.
On the other hand, reinforcers were described as being associated with needs. Needs were
said to be an individual's requirements for stimulus conditions if responding is to be
maintained. They were said to arise from previous experience with responding and to be
expressed by individuals as preferences for certain stimulus conditions. Effective reinforcers
were said to be those which respond to individual needs. The effective reinforcers established
by employers are often labelled rewards, for example, pay. Other types of rewards are
established to form incentives, such as bonuses. Other stimulus conditions were thought to
represent effective reinforcers because they are congruent with a particular employee's needs.
It was contended that work environments can be described in terms of their similarities
through identifying the presence and level of reinforcers. Where there are a large number of
reinforcers these may be referenced via reinforcer factors which can then be used to depict
reinforcer patterns.
The description of work environments in terms of ability requirements and reinforcer patterns
was referred to as work environment structure paralleling the description of the work
90
personality structure. The work environment, the work personality and relationship between
them, thus formed the basis of work adjustment theory.
For b oth work personality and the work environment, Dawis and Lofquist (1984) regarded
basic theoretical concepts having been built upon stimulus and response formulations of
behaviour in the laboratory setting. Their concepts of skills and abilities were derived from
response dimensions studied in laboratory research and were to do with sensation and
perception generally, perceptual and motor skills specifically, and information processing as
found in cognitive psychology. The concepts of needs and values were derived from stimulus
dimensions in laboratory research relating to reinforcement and conditioning.
3 .6 Correspondence
Correspondence is the key concept in work adjustment theory linking the work personality
and the work environment. Dawis and Lofquist claimed the maintenance of correspondence
becomes a basic motive of human behaviour as each individual attempts to attain
correspondence with the environment. In the attempt to achieve correspondence, both
individuals and work environments were thought to be constantly changing. It is this
continuous and dynamic process of mutual responsiveness which is labelled work adjustment.
The degree of correspondence between work personality and work environment was expected
to predict tenure and indicate the degree of work adjustment achieved at any one time. The
correspondence between the personality and work environments was operationalised by
examining the correspondence between the variables of needs and reinforcers, using
satisfaction as an indicator. The correspondence between abilities and ability requirements was
operationalised using satisfactoriness as an indicator. Satisfactoriness was termed an external
indicator because it was obtained from sources outside the worker while satisfaction was
termed an internal indicator because it represented the worker's appraisal of the degree to
which their requirements were being fulfilled by the work environment.
AE discussed in the previous chapter, section 2 . 3 , Dawis and Lofquist's definition of job
satisfaction was a synthesis of earlier definitions (Schaffer, 1953; Hoppock, 1935; Vroom,
1 943 ; Maslow, 1954; Roe, 1 956; Dawis, Lofquist and Weiss, 1968; and Smith, Kendall and
Hulin, 1 969) . The resulting definition had job satisfaction as a "pleasurable affective condition
91
resulting from one's appraisal of the way in which the experienced job situation meets one's
needs, values, and expectations " (p 72) . Conversely, job dissatisfaction was regarded as an
affective unpleasant state which results from the failure to have one's needs, values and
expectations met by the job situation.
Satisfactoriness was said to have arisen from employers having objectives, the achievement
of which necessitated groups of people to carry out the required separate tasks in a
coordinated fashion. Sets of tasks would be allocated to employees along with rules
concerning how these tasks are to be undertaken in relation to other tasks. Over time, sets of
tasks and rules were believed to become standardised for most employers, which then enables
employee performance to be evaluated against a desired standard and compared to other
employees. Satisfactoriness referred to a standardized set of work behaviours required of the
employee, rather than the contribution of the employee towards the achievement of the greater
goals of the employer.
Although the construct of satisfactoriness bears some resemblance to those of performance
and productivity, it involves judgements about criteria of good performance as defined by
employers rather than the individual.
3 . 6 . 1 The relationship between job satisfaction and satisfactoriness
Although Dawis and Lofquist proposed that job satisfaction and satisfactoriness were
relatively independent, their use of the word relative implied they expected a relationship,
albeit slight. As already discussed satisfaction has not been reported to have an appreciable
affect on performance in the literature (Brayfield and Crockett, 1955; Vroom, 1964; Locke,
1976; Iaffaldano and Muchinsky, 1985), but it has been suggested that successful performance
causes satisfaction (Locke, 1970; Porter and Lawler, 1968). The construct of satisfactoriness
may be different from that of performance.
The relationship of satisfaction to satisfactoriness may be expected to differ from that of
satisfaction and performance as discussed previously in chapter two. For example, j ob
satisfaction may be associated with satisfactoriness although it has not been associated with
performance. One might expect individuals to achieve greater satisfaction if they have met
the expectations of employers and compare favourably with other employees. When
92
performance is evaluated using other criteria which are not necessarily the standards of the
employer one might expect less of an association between satisfaction and performance. At
the same time that Dawis and Lofquist described the relationship between satisfaction and
satisfactoriness as relatively independent, they regarded satisfaction as a moderator of the
relationship between ability-skill correspondence and satisfactoriness. Also they regarded
satisfactoriness as a moderator of the relationship between need-reinforcer correspondence and
satisfaction. Therefore, the correspondence between their abilities and the job requirements
would determine their satisfactoriness only if an individual is satisfied with their job.
Similarly, the correspondence between the needs of individuals and the available reinforcers
would determine their job satisfaction, only if they were satisfactory workers. Dawis and
Lofquist's argument would suggest that the relationship between satisfaction and
satisfactoriness would be less independent for groups achieving either satisfaction or
satisfactoriness.
3 .6 .2 Tenure
A reasonable level of the two primary indicators of the work adjustment process, satisfaction
and satisfactoriness, were thought to be required for the individual to either choose to remain
in the work environment or be retained on the job. Tenure, the third and final indicator of
correspondence between the work personality and the work environment was defined as, "the
length of time an individual remains in a work environment " (Dawis and Lofquist, 1984 p
73). Because it was recognised as both an indicator and result of adjustment to work, tenure
was posited as indicative of adequate levels of satisfaction and satisfactoriness. As an outcome
of work adjustment, it was regarded as a criterion mea,sure in its prediction.
3 . 7 Predicting work adjustment
In predicting work adjustment, Dawis and Lofquist argued that both satisfaction and
satisfactoriness fluctuate with changes over time in both individuals and their work
environments and that there are minimum levels of both required by individuals and work
environments, respectively. These minimum levels were thought to be best established by
observing individuals who have remained in a work environment. In this way limits of
satisfactoriness and satisfaction could be established and used to predict tenure, see Figure
3 .4. That is, the level of satisfactoriness observed for a group with substantial tenure in
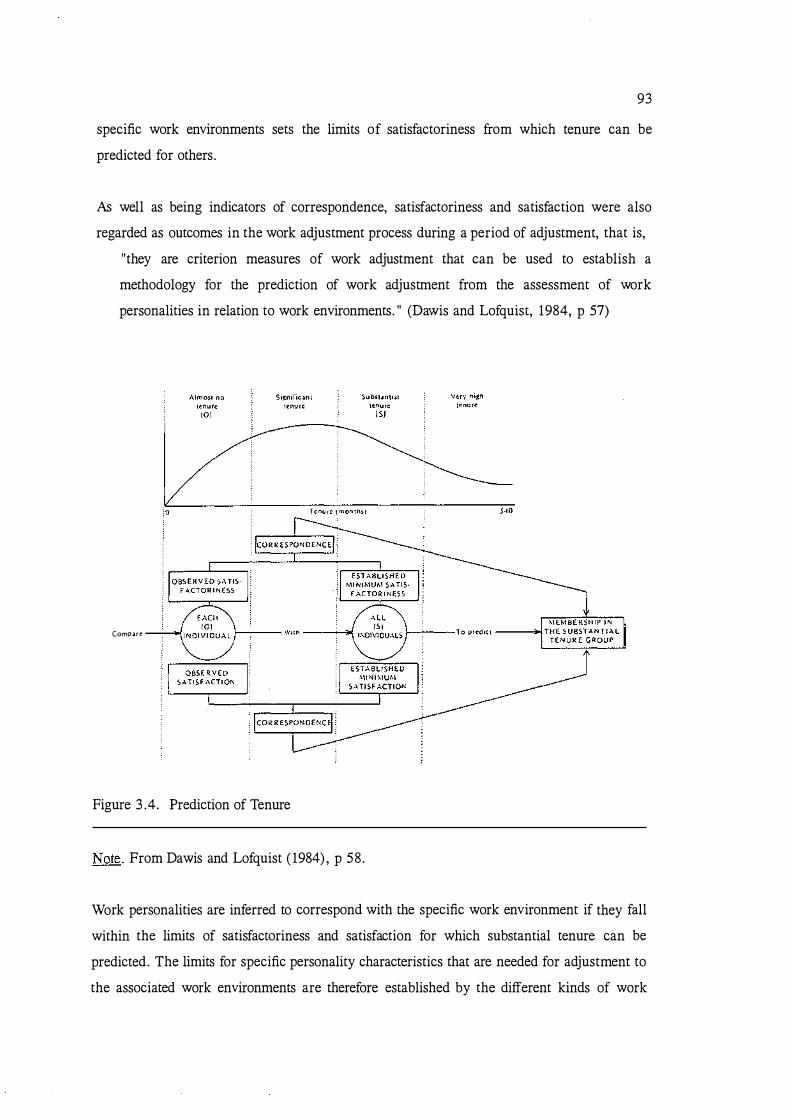
93
specific work environments sets the limits of satisfactoriness from which tenure can be
predicted for others.
As well as being indicators of correspondence, satisfactoriness and satisfaction were also
regarded as outcomes in the work adjustment process during a period of adjustment, that is,
"they are criterion measures of work adjustment that can be used to establish a
methodology for the prediction of work adjustment from the assessment of work
personalities in relation to work environments. " (Dawis and Lofquist, 1984, p 57)
Comp�re
Figure 3 .4 . Prediction of Tenure
Note. From Dawis and Lofquist ( 1984) , p 58 .
Work personalities are inferred to correspond with the specific work environment if they fall
within the limits of satisfactoriness and satisfaction for which substantial tenure can be
predicted. The limits for specific personality characteristics that are needed for adjustment to
the associated work environments are therefore established by the different kinds of work

94
personalities for which correspondence can be inferred, see Figure 3 .5 . These limits can then
be used to estimate the degree of correspondence between other individuals and the specific
work environments. The correspondence estimated in this manner can be used to predict
satisfactoriness and satisfaction.
It was argued that because satisfactoriness and satisfaction together can be used to predict
tenure, the correspondence between work personality and work environment can be used to
predict tenure, given relative stability of the work personality. This stability is expected after
the structure and style variables of abilities and values, have undergone a "process of
development and differentiation" (p 58) . Both ability requirements and reinforcer patterns of
the work environment were to be obtained by studying workers with substantial tenure who
are satisfactory, in the case of the former, and who are satisfied, in the case of the latter.
The variables of the structure and style of the work personality and the work environment
were operationalised through the development of various psychological instruments.
3 . 8 Measurement of Dawis and Lofquist's work personality
The work needs, abilities and adjustment style dimensions of the work personality were
operationalised by Dawis and Lofquist via instruments designed to measure each of the
dimensions. The theory of work adjustment in operational terms is depicted in Figure 3 . 8 .
Because they represent common components, the measurements of underlying dimensions of
abilities and values were expected to be more stable than measurements of skills and needs.
The relationships that can occur between abilities and values were recognised as complex and
at times as potentially resulting in conflict, for example, where values can compete in relation
to an ability. Nevertheless, it was thought that most individuals do not experience such
conflict in a lasting form and instead are able to behave in an integrated manner on the whole.
The ability-value relationships are represented by expressed or stated interests . In the case of
sampling activity preferences experienced by most individuals, they can be scaled
psychometrically to give measured interests . Such a structured approach is believed to provide
a superior sampling of activities and a good measure of the entire set of preferences. The
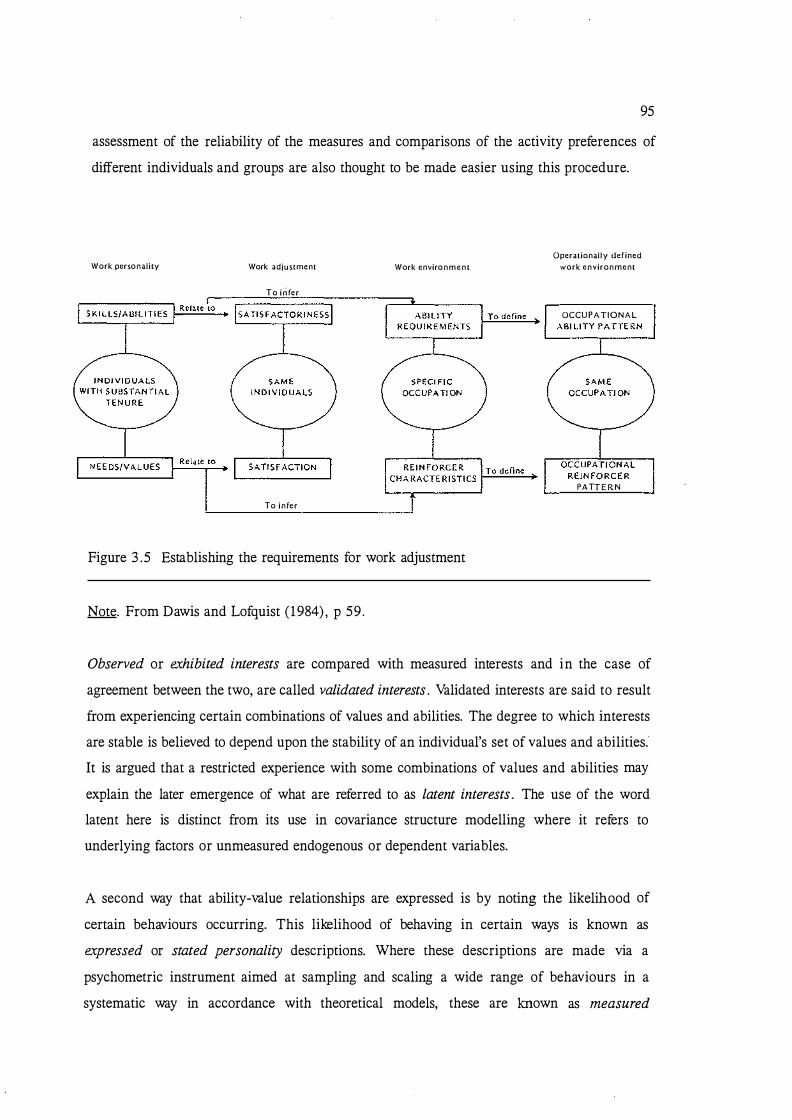
95
assessment of the reliability of the measures and comparisons of the activity preferences of
different individuals and groups are also thought to be made easier using this procedure.
Work personality Work adjustment Work environment
To infer
To infer
Figure 3 .5 Establishing the requirements for work adjustment
Note. From Dawis and Lofquist ( 1984) , p 59.
Operationally defined work environment
OCCUPATIONAL
PATT E R N
Observed or exhibited interests are compared with measured interests and in the case of
agreement between the two, are called validated interests . Validated interests are said to result
from experiencing certain combinations of values and abilities. The degree to which interests
are stable is believed to depend upon the stability of an individual's set of values and abilities.
It is argued that a restricted experience with some combinations of values and abilities may
explain the later emergence of what are referred to as latent interests . The use of the word
latent here is distinct from its use in covariance structure modelling where it refers to
underlying factors or unmeasured endogenous or dependent variables.
A second way that ability-value relationships are expressed is by noting the likelihood of
certain behaviours occurring. This likelihood of behaving in certain ways is known as
expressed or stated personality descriptions. Where these descriptions are made via a
psychometric instrument aimed at sampling and scaling a wide range of behaviours in a
systematic way in accordance with theoretical models, these are known as measured

96
personality descriptions. Where personality descriptions are based on observation these are
called descriptions of exhibited personality and when these are in agreement with measured
personality descriptions, they are termed validated personality descriptions. However, they
are said to refer only to important aspects of the personality rather than a complete personality
description.
Although Dawis and Lofquist consider the description of interests and personality as useful
in examining ability-value relationships, they adopted a more direct approach by starting with
ability and values measurements rather than the constructs that are another level again away
from their data. Abilities and values were therefore used as the principal personality variables
and interests and personality descriptions were relegated to a supporting role.
3. 8 . 1 The measurement of abilities
Dawis and Lofquist ( 1984) recognised the difficulty of the task of assessing the many abilities.
Multifactor test batteries had been found to represent the most feasible and economic method
of assessing abilities (Super, 1958). However, as Dawis and Lofquist noted the batteries may
examine 9 to 15 ability dimensions and each of these might include one or more of the basic
abilities depicted in Table 3 .4 . Most of the test batteries were said to concentrate on symbolic
abilities, to usually include assessment of sensori-motor abilities to a small degree and to
exclude the assessment of interpersonal abilities, which are usually assessed by observation.
The General Aptitude Test Battery (GATB) of the USA Department of Labor ( 1970) was
provided as a good example of a multifactor test battery. It assesses nine abilities which
sample several of the major ability dimensions. Dawis and Lofquist (1984) maintained that
the value of the GATB (1970) lies in having been standardised on large samples of workers
in a broad range of occupations and being used to describe occupational ability requirements.
3 .8 .2 The measurement of work needs
The concept of needs was operationalised by developing the Minnesota Importance
Questionnaire (MIQ), (Gay, Weiss, Hendel, Dawis and Lofquist, 1971) . The MIQ focuses
upon the relative importance to an individual of having twenty particular needs reinforced.
Both Super ( 1970), in his Work Values Inventory, and Rokeach ( 1973), in his rank-order

97
measure of values, had used the dimension of importance to define values. But Dawis and
Lofquist used this dimension of importance to define needs . By regarding values as reference
dimensions for the description of needs, through using factor analysis to group needs
according to their underlying communalities, they identified the more basic dimensions.
The factor structure of the needs of the MIQ, as organised around six value dimensions, is
presented in Table 3 . 5 . The MIQ had developed out of the Work Adjustment Project at the
University of Minnesota to assess 20 work-related needs. The varimax factor loadings are
given in Table 4. 1 . Seven factors were found, but only six of them were deemed interpretable
in representing the 20 need dimensions underlying the MIQ data. The factors were labelled
as :
11 Achievement:
accomplishment
the importance of an environment that encourages
Comfort: the importance of an environment that is comfortable and not stressful
Status : the importance of an environment that provides recognition and prestige
Altruism: the importance of an environment that fosters harmony with and service
to others
Safety: the importance of an environment that is predictable and stable
Autonomy: the importance of an environment that stimulates initiative. 1 1 (Dawis
and Lofquist, 1984, p 29)
The description of the six factor derived values by the twenty needs of the need scale and the
Minnesota Importance Questionnaire statements used to measure these are given in Table 3 . 5 .
Dawis and Lofquist listed the values according to their source of the reinforcement,
environmental , social, or self, and used multidimensional scaling to identify pairs of
contrasting values, as in Table 3 .6 . Their three-dimensional arrangement of the values is
reproduced in Figure 3 . 6 .
·' Two forms of the MIQ are available and are described in chapter five in the section
concerned with Dawis and Lofquist's instruments. The MIQ is claimed to give a wide
coverage of the work-relevant needs which can then aid in the description of value dimensions
of the work personality structure. Occupational reinforcer patterns have been generated to
depict work environments in MIQ terminology.
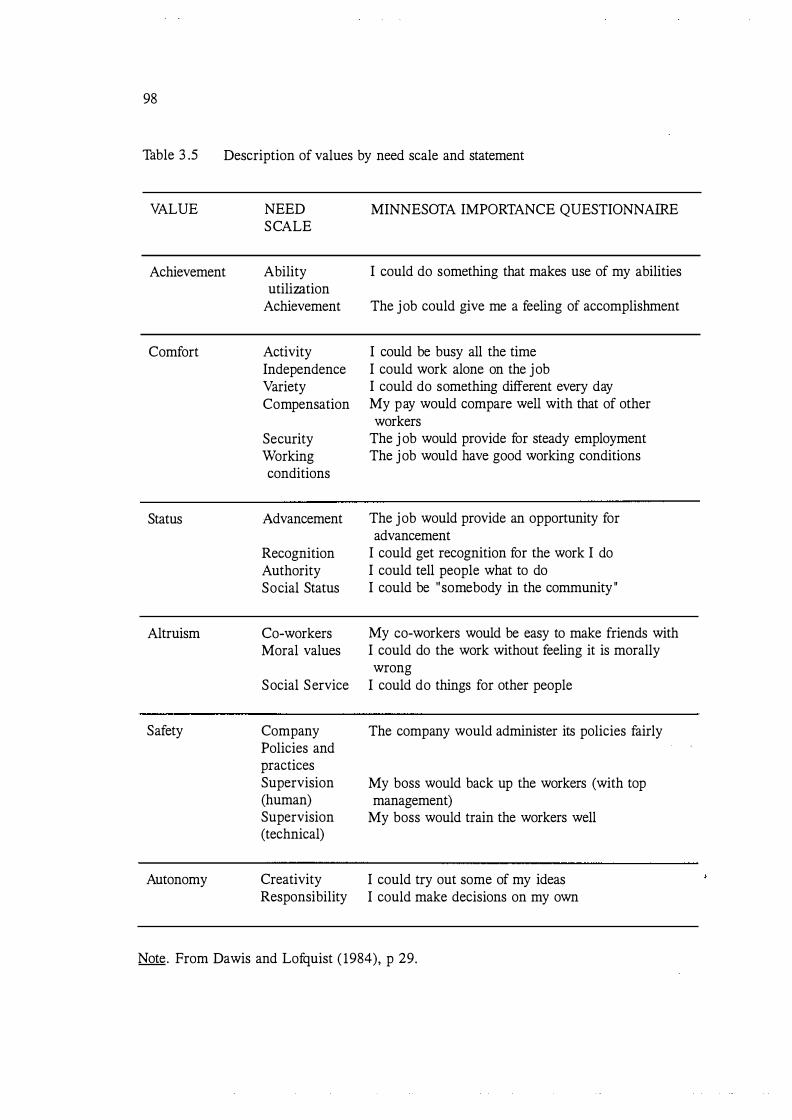
98
Table 3 .5 Description of values by need scale and statement
VALUE NEED SCALE
Achievement Ability utilization
Achievement
Comfort Activity Independence Variety Compensation
Security Working conditions
Status Advancement
Recognition Authority Social Status
Altruism eo-workers Moral values
Social Service
Safety Company Policies and practices Supervision (human) Supervision (technical)
Autonomy Creativity Responsibility
MINNESOTA IMPORTANCE QUESTIONNAIRE
I could do something that makes use of my abilities
The job could give me a feeling of accomplishment
I could be busy all the time I could work alone on the job I could do something different every day My pay would compare well with that of other workers
The j ob would provide for steady employment The job would have good working conditions
The job would provide an opportunity for advancement
I could get recognition for the work I do I could tell people what to do I could be 11 somebody in the community 11
My eo-workers would be easy to make friends with I could do the work without feeling it is morally wrong
I could do things for other people
The company would administer its policies fairly
My boss would back up the workers (with top management)
My boss would train the workers well
I could try out some of my ideas I could make decisions on my own
Note. From Dawis and Lofquist ( 1984), p 29.
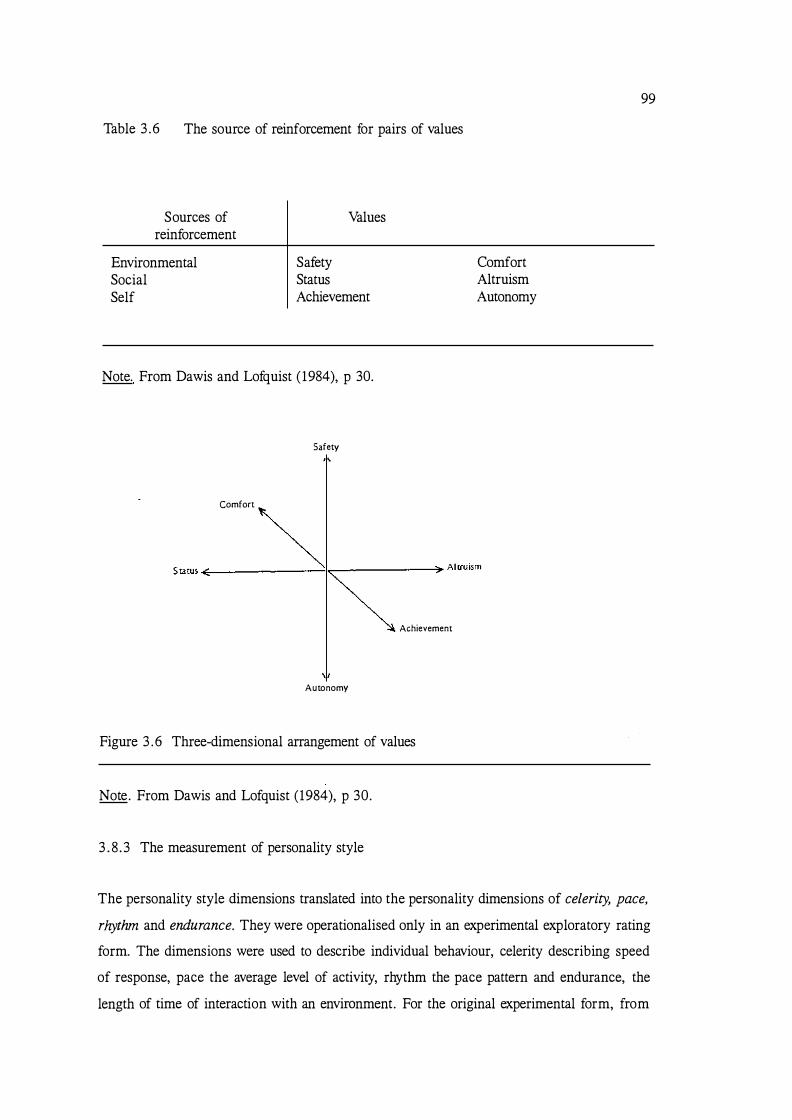
Table 3 .6 The source of reinforcement for pairs of values
Sources of reinforcement
Environmental Social Self
Values
Safety Status Achievement
Note. From Dawis and Lofquist ( 1984), p 30.
Safety
Comfort
Autonomy
Achievement
Figure 3 . 6 Three-dimensional arrangement of values
Note. From Dawis and Lofquist (1984), p 30.
3 . 8 . 3 The measurement of personality style
Comfort Altruism Autonomy
99
The personality style dimensions translated into the personality dimensions of celerity, pace,
rhythm and endurance. They were operationalised only in an experimental exploratory rating
form. The dimensions were used to describe individual behaviour, celerity describing speed
of response, pace the average level of activity, rhythm the pace pattern and endurance, the
length of time of interaction with an environment. For the original experimental form, from

1 00
which the modified version for the present research was developed, refer section A.4 of
Appendix A. An example of different patterns of responding is given in Figure 3 . 7 where it
can be seen that the steepness of the lines indicate rate of responding or celerity.
High CELER ITY Low RHYTHM
PACE B
�---------------------------- A
Low ENDU RANCE High
Figure 3 . 7 Interrelationships of celerity, pace, rhythm, and endurance
Note. From Dawis and Lofquist ( 1984), p 32.
Line length shows the continuance or endurance of behaviour over time. The distance the
lines travel up the graph represents the pace or effort expended, and the straightness of a line
exhibits how constant the activity level is, that is the response rhythm.
D E G R E E OF COR· �--------------�Pr�ed�ic�ts----------------� R ESPON D E N C E I ":_ \ \
I
\ \
I I
\ ,.,_ \�� M I N N ESOTA
SATISFACTO R I N ESS SCALES \�� \� I \ I \ I \ I \ I \ I \ I \ I \ I
� I \ I \ / \ I \ I \ I \ .. .,, \ �I \
�)1 r-'--:M-:-:-1 N'""N�E'::-,S O"""T,_A---, ;f,1
SATI S F ACTION / QU ESTION N A I R E
I DEGR E E OF CO R· �--------------����----------------J R ESPON D E N C E I Predic ts
Figure 3 . 8 The theory of work adjustment in operational terms
Note. From Dawis and Lofquist ( 1984), p 75 .
Predicls
101
Because Dawis and Lofquist have not studied the dimensions of personality style widely the
constructs involved needed further clarification and instruments other than the exploratory
ones developed.
The psychometric instruments thought to yield information about the dimensions of
personality style included personality inventories and tests of ability. It was suggested, for
example, that the completion of repetitive tasks, such as responding to the MIQ itself, may
indicate endurance and the speed with which self-report inventories are completed may be a
guide to an individual's level of celerity and pace.
3 .9 Measurement of work environment constructs
Instruments were developed to measure the structure and style of the work environment in
terms commensurate with these aspects of the work personality and its operationalisation.
3 .9 . 1 The measurement of work environment structure
In the measurement of work environment structure, the occupational aptitude patterns (OAPs)
as developed by the US Department of Labor ( 1970, 1979) were given as a good example of
establishing ability requirements for occupations. Job analyses are undertaken for the same
occupation in different sites and the U.S. Department of Labor's GATB ( 1 970) is
administered . Three or four separate ability requirements are defined by their correlation with
a criterion such as productivity, by the mean score level and standard deviation size, and by
an importance rating of the ability to job performance. The ability cutoff scores are
determined such that individuals in the top and lower halves of the distribution of criterion
scores can be identified. For example, OAPs and GVNS or general learning ability, verbal
ability, numerical ability and spatial ability, have been developed for several occupations such
as biologist, botanist, soil conservationist and zoologist.
Dawis and Lofquist's summary of other approaches in establishing ability requirements
included Ghiselli's 1 966 taxonomy of occupations. This was derived from validity coefficients
of .occupational aptitude tests, the Job Psychograph of Viteles ( 1932) , Paterson, Gerkin and
Hahn's ( 194 1 , 1953) Minnesota Occupational Rating Scales and the Minnesota Job
requirements questionnaire (Desmond and Weiss, 1970) which all used estimation methods.

1 02
The estimation method develops ability requirements for many occupations quickly and they
can be applied with reasonable confidence. The OAP approach uses the same instrument
(GATB) to measure both abilities and ability requirements and bases the latter on the direct
measurement of an incumbent worker's abilities.
Occupational Reinforcer Patterns (ORPs) were arrived at to describe the work environment
in need-value terms through using the Minnesota Job Description Questionnaire (MJDQ), of
Borgen, Weiss, Tinsley, Dawis and Lofquist ( 1968) . This presented the twenty MIQ need
reinforcer statements in a multiple rank-order format to be rated by supervisors and
incumbents for each occupation " in terms of the relative presence or absence of the
reinforcers described in the statements " (Dawis and Lofquist, 1 984, p 40) . A twenty-first
statement was included to accommodate the multiple rank-order format which uses statements
in blocks of five.
The expression of ORPs in the same terms as the MIQ allws comparisons of profiles for an
individual. Although other approaches could be applied in relation to the description of the
reinforcer systems of work environments Dawis and Lofquist had not found others in use.
The other approaches they referred to were, Super's work Values Inventory ( 1970) , England's
Personal Values Questionnaire ( 1967) , Rokeach's Survey of Values ( 1973), and the Allport,
Vernon and Lindzey Study of Values ( 1970) .
They noted that others have used job satisfaction studies to infer need-satisfying characteristics
(Campbell & Pritchard, 1 976; Herzberg, Mauser and Snyderman, 1 959; and Schaffer, 1 953)
or have used needs, interests and personality data of individuals in different occupations.
Dawis and Lofquist with others (Weiss, Dawis , England and Lofquist, 1 965) have employed
a method similar to the OAP approach to determine reinforcer systems. Firstly, the needs and
values of individuals in different occupations were measured. The patterns of needs and
values that were able to discriminate among occupations, and correlate significantly with a
criterion, were determined.
The two sets of dimensions, ability requirements and need/value reinforcer patterns which
make up work-environment structure, were combined in a single system by cross-classifying
occupations using the two sets of dimensions to produce the Minnesota Occupational
Classification System, (MOCS) Dawis and Lofquist, ( 1974) . A broader coverage of
103
occupations was achieved by the Minnesota Occupational Classification System II (MOCS II) ,
Dawis and Lofquist, Henley, and Rounds ( 1979/1982). Two axes were used. One was based
on the Dictionary of Occupational Titles coding system. Occupations were presented in three
ability requirement levels (high, moderate, average) for worker functions in the three separate
fields of data, people, and things. This produced 27 ability-requirement groups. The second
axis represented the work environment classified in terms of occupational reinforcers present.
The reinforcer environments were grouped into six occupational reinforcer clusters yielding
28 groups or taxons that gave information about 1 , 161 separate occupations of which 1094
had occupational aptitude data (OAPs) and 184 had occupational reinforcer potential data
(ORPs). Of the occupations, 723 had been classified by expert raters into one of the six major
occupational reinforcer clusters.
3 .9 .2 The measurement of work environment style
It was considered important by Dawis and Lofquist that information about the work
environment style should also be part of descriptions of work environments, but because of
the newness of this concept at the time, the necessary psychometrically adequate measures
were still being developed. Three other assessment measures based on clinical judgements
were available instead.
One method was that of direct observation via job analyses concerned with the interaction of
work environment and workers. The observers could be job analysts, supervisors, or workers.
The observation process was able to be assisted by the use of structured instruments which
focus on whether certain observable environmental behaviours exist in that setting. A second
method used was that of estimation. Ratings are obtained from individuals who are considered
to be informed about that occupation. This method involves developing valid and reliable
rating instruments like the MJDQ but using environmental style variables. A third method was
one of inference which uses employee data from a work environment that describes
individuals in terms of personality style. The characteristics of work environment style are
inferred from these descriptions.
Each of the three methods are considered to have some limitations. It was therefore
recommended that at least two be used in conjunction to provide a description of work

104
environment style. Dawis and Lofquist ( 1984) also pointed to earlier studies of the US
Department of Labor which have described work environments in their 1965 Dictionary of
Occupational Titles, in terms of requisite personality traits and the reinforcer characteristics
present. Other earlier psychological studies have related the description of occupations to the
typical personalities of their members (Harrower and Cox, 1942; Roe, 1946, 1949, 1950,
1952; and Steiner, 1948).
3 . 1 0 Measurement of the correspondence itself and its outcomes
The operationalisation of the formal propositions of Dawis and Lofquist's theory of work
adjustment necessitated the operationalisation of the key construct of correspondence and
those associated with it, the indicators of satisfactoriness and satisfaction and their
hypothesised outcome, tenure.
3 . 1 0 . 1 The measurement of correspondence
Research in the Work Adjustment Project has principally concentrated on the need-reinforcer
correspondence and satisfaction. When satisfaction is predicted from need scores, the
closeness of the observed satisfaction to that predicted is employed as a measure of the
correspondence between the reinforcer pattern of the work environment and the individual's
needs.
The relationship of correspondence has been inferred and expressed technically as a
correlation coefficient. Correlations have been used to assess the closeness of predicted
satiSfactoriness to observed satisfactoriness as a measure of the correspondence between an
individual's abilities and the work environment's ability requirements.
Correspondence has been expressed as a difference score, the square of the differences, an
example being the difference between vocational needs and job rewards for the same 20 work
aspects. Also correspondence between individual's needs and the reinforcer pattern has been
estimated by comparing satisfaction predicted from need scores with observed satisfaction .
105
3 . 10 .2 The measurement of job satisfaction
Job satisfaction has been measured using many different instruments (Robinson, Athanasiou
and Head, 1969) and the authors of early examples of such instruments as listed by Dawis
and Lofquist ( 1984, p 72) were "Hoppock ( 1935), Kerr ( 1948), Brayfield and Rothe ( 1 95 1) ,
Baehr (1953), Morse, ( 1953), Johnson (1955) and Twery, Schmid, and Wrigley ( 1958) " .
Hoppock's Job Satisfaction Blank (JSB), a four-item measure of job satisfaction, was believed
to be the most used. Each item consisted of seven statements and the statement which best
represented a respondent's feelings about their job was endorsed. The seven statements were
on a continuum with extreme dissatisfaction at one end and extreme satisfaction at the other.
The reported reliability of the JSB is in the .80s. Other instruments included the Comell Job
Descriptive Index (JDI) of Smith, Kendall and Hulin ( 1969) and the Minnesota Satisfaction
Questionnaire (MSQ) of Weiss, Dawis, England and Lofquist ( 1967) .
The JDI uses five scales consisting of nine to eighteen items. The items measure satisfaction
with work, supervision, pay, promotion and eo-workers and are descriptions, using a word
or phrase, of these five aspects of a job. The respondent indicates whether the items describe
the job. Reliabilities for the JDI were claimed to be satisfactory. The MSQ assesses
satisfaction via 100 items taking into account 20 different features of the work environment.
These different aspects represent the work reinforcers and they pertain to the 20 psychological
needs as shown in appendix H. Each item is rated on a 5-point scale ranging from not
satisfied to extremely satisfied. Dawis and Lofquist ( 1984) claimed the reliability and validity
data supported the use of the MSQ in research and in practice. The instrument is advocated
for use in work adjustment theory research because it was designed to assess dimensions of
job satisfaction which exactly parallel the dimensions of needs the Minnesota Importance
Questionnaire (MIQ) measures.
3 . 1 0. 3 The measurement of satisfactoriness
Satisfactoriness as a standardized set of work behaviours required of the employee rather than
representing their contribution towards the achievement of the greater goals of the employer
was assessed in terms of the degree to which task requirements are met and rules are
followed. It was noted that usually in the majority of organisations, satisfactoriness of
employees is judged via supervisor ratings. It was considered desirable to facilitate the
106
assessment by developing a single measuring instrument, the Minnesota Satisfactoriness Scales
(MSS) . This instrument allows the theory to be tested in different types of work environments
but under similar conditions. The MSS was developed from a literature search to identify the
type of information which may show satisfactoriness, Gibson, Weiss, Dawis and Lofquist
( 1970) . Experimental rating forms used indicators such as quantity and quality of work, job
suitability, promotability, merit in relation to pay rises, and frequency of absences, lateness,
accidents and disciplinary actions. Two factors were identified in preliminary analyses which
accounted for the variance in most groups of employees. These factors were labelled
performance and conformance. The former was represented by quality of work, promotability
and meriting a pay rise and the latter by frequency of absences, lateness and accidents. The
experimental scales, resulted in the development of the MSS as a 28-item rating questionnaire.
The rater compares an employee in relation to their work group on a 3-point scale using the
categories of not as well, about the same, or better; or the categories of less, about the same,
or more (Dawis and Lofquist, 1984 p 71 ) . The comparisons were made about the 20 work
needs. Refer to Appendix H.2 for examples of presentation of these in the MSS .
Other items ask about promotability and whether a pay rise is merited. A rating of the
employee's satisfactoriness on the whole when compared with others doing the same work
is obtained. This rating asks in which quarter of the distribution of other workers a particular
employee would be placed, in terms of certain factors. These factors are listed in Appendix
H.2 . This judgement was to be made with respect to overall competence, the effectiveness
of the j ob performance, proficiency and general overall value. All the elements of successful
job performance were to be taken into account and these were specified as knowledge of the
job and functions performed, quantity and quality of output, relations with subordinates,
equals, and superiors, ability to get the job done, intelligence, interest and response to
training. The rater was asked " In other words, how closely does he/she approximate the ideal ,
the kind of worker you want more of? " (Dawis and Lofquist, 1984, p 206) .
The MSS is scored using five scales, general satisfactoriness, performance, conformance,
dependability, and personal adjustment. Internal consistency reliabilities for the scales were
given as ranging between . 69 and . 95 with a median of . 87.

1 07
Two criterion variables of performance and effectiveness have been identified, as noted by
Campbell, Dunnette, Lawler and Weick (1970) . Performance referred to the evaluation of on
the job behaviour, and effectiveness referred to the way in which the employee contributed
to the objectives of the organisation. Of the two criteria, the MSS measured the performance
criterion variables. Dawis and Lofquist justified their choice of measuring performance
criterion variables over effectiveness criteria by emphasising that the theory of work
adjustment relates more to individual performance than to organisational objectives. They
also noted there are greater difficulties associated with measuring effectiveness criteria. Some
factors were expected to be beyond an employee's control, such as those of a market,
technological and/or social nature. Problems have been found in at least three areas, those of
definition, data collection and use. Dawis and Lofquist gave an example where in a sample
of 620 manufacturing firms an enormous variation was found in the formulae. Up to 17
different formulae were being used to calculate absenteeism (Vander N oot, Kunde, and
Heneman, 1958) .
3 . 1 0 . 4 The measurement of tenure
Tenure was claimed to be one of the easiest indicators of work adjustment to observe and
measure. In practice, already recorded information and reports of tenure are often depended
upon. Because considerable time must pass in some cases before an actual measure of tenure
can be obtained, the shorter term indicators of satisfaction and satisfactoriness have been the
measures often relied upon. In defining tenure Dawis and Lofquist (1984) identified three
kinds. They were position or job tenure, organisational tenure, and occupational tenure. The
most frequently used meaning or meanings of tenure in work adjustment research were said
to be those related to position or occupation (Strong, 1943; Cherry, 1974; Hunt and Smith,
1945 ; Thorndyke and Hagen, 1959; Porter and Steers, 1973; Farris, 197 1 ; and Rabowitz and
Hall, 1977) .
Position or job tenure from a work adjustment theory perspective is identified as the least
ambiguous of the tenure measures, because it can be seen as directly dependent upon the
interaction of an individual with a specific work environment. However, because p osition or
job tenure is often limited to a shorter time period it is regarded as being less representative
of career adjustment than is occupational tenure. It was concluded that studies of j ob
satisfaction and tenure naturally use position tenure while studies concerning career

108
satisfaction employ occupational tenure. But in the broadest study of work adjustment, both
kinds of tenure were believed to be needed as outcome criteria (Dawis and Lofquist, 1984) .
109
CHAPTER FOUR
WORK ADJUSTMENT THEORY: PREVIOUS RESEARCH, CRITICISMS, AND THE
PRESENT STUDY
4. 1 Work adjustment theory research
Dawis and Lofquist have grouped research pertinent to their theory into that relevant to the
formal propositions and that which relates to aspects of the theory and its application. Some
of the research discussed relating to the propositions has been conducted to test these
specifically. The research of others, usually not designed to test the theory, has been
reinterpreted in relation to it. Dawis and Lofquist have grouped research other than that
relating to their formal propositions into those areas concerned with needs, values and
reinforcers, and adjustment styles.
4. 1 . 1 Proposition related research
Proposition I , in Table 3 . 1 , was said to lead to the expectation that measured satisfaction and
satisfactoriness are relatively independent. Data showing correlations between sets of scores
of satisfaction and satisfactoriness have been interpreted as confirming the expectation. Weiss,
Dawis, Lofquist and England ( 1966) found the range of the correlations between the two
measures to be . 13 to . 3 1 with the variance common to both not exceeding 1 0 % for any of
the six occupational groups involved. Studies in the applied psychology literature have also
been found to support the independence of constructs very similar to satisfaction and
satisfactoriness, that is, those of job performance and job satisfaction (Brayfield and Crockett,
1 955; and Pervin, 1 968) . Support for Proposition II, see Table 3 . 1 , was shown by the
closeness of predicted satisfactoriness, from ability test scores, with observed satisfactoriness
expressed as a correlation coefficient for groups of four occupations. Studies in the literature
have shown significant relationships between other measures of satisfactoriness such as
supervisor ratings of job performance and grades in occupation training programmes (Ghiselli,
1966; and U.S. Department of Labor, 1970) . Support has been found for a corollary of
Proposition II, knowledge of individual's abilities and satisfactoriness allows the determination
of the ability requirements of the work environment. This corollary is believed to be
corroborated by the development of occupational aptitude patterns (U.S. Department of

1 10
Labor, 1970) and selection test batteries which have established cutoff scores which describe
the ability requirements of the relevant environment.
In part, Proposition Ill states that satisfaction is a function of the correspondence between the
reinforcer pattern of the work environment and individual's values. Much of the research in
the Work Adjustment Project has concentrated on need-reinforcer correspondence. Support
has been found for this proposition using the closeness of satisfaction predicted from need
scores, to observed satisfaction as a measure of correspondence between needs and reinforcer
patterns (Dawis and Lofquist , 1 984; and Betz, 1969). Elizur and Tziner ( 1977) found a
canonical correlation of . 84 between 20 work aspects satisfaction scores and their
corresponding job rewards.
A corollary of Proposition Ill, knowledge of values and satisfaction of individuals allows the
effective reinforcer pattern of the environment to be identified, has been supported by studies
concerned with the development of the U.S. Employment Service's Occupational Aptitude
Patterns. The reinforcer pattern of an occupation is inferred from the correlation of need and
satisfaction scores.
Proposition IV, Table 3 . 1 , has received support (Dawis and Lofquist, 1 984) . A Work
Adjustment Project study found that the prediction of satisfactoriness from ability scores was
more accurate for a high satisfaction group than for a group with low satisfaction scores. The
levels of prediction of job performance criteria from scores on the Employee Aptitude Survey
were found to differ for different types of satisfaction, that is job performance was moderated
by satisfaction. If satisfaction is regarded as an indicator of motivation, the work of Locke,
Mento and Katcher ( 1978) can be taken to support Proposition IV. Ability was found to
predict performance better when groups were homogeneous in their motivation.
Proposition VI, the probability that an individual will be forced out of the work environment
is inversely related to their satisfactoriness, was supported for satisfied but not dissatisfied
groups. Proposition VII received some support in a study by Taylor and Weiss ( 1972) . The
degree to which job termination could be predicted from satisfaction, and biographical items,
age, number of dependents, education and gender, was investigated using the MSQ. Only
satisfaction had some success in predicting job leavers. Dawis and Lofquist referred to
reviews of employee turnover research having shown job satisfaction to be consistently

1 1 1
negatively related to turnover for a wide variety of occupational groups (Munchinsky &
Tuttle, 1979; and Porter & Steers, 1973) . These same reviews have shown absenteeism to be
similarly related to job satisfaction. Dawis and Lofquist (1984) argued that if absenteeism is
viewed as the beginning of departure from a job, Proposition VII is supported further.
Dawis and Lofquist ( 1984) reported that Proposition VIII, a combination of Propositions VI
and VII, see Table 3 . 1 , has been supported. It was found that individuals who were both
satisfied and satisfactory at time one were more likely to remain in a job at time two than
individuals who were either unsatisfactory, dissatisfied, or both.
Proposition IX, see Table 3 . 1 , has been undergoing longitudinal study by Dawis and Lofquist.
Indirect evidence has been found in the studies concerned with changes in abilities and
interests with tenure (Bentz, 1953). Interests have become more similar to characteristics of
the occupational group (Strong, 1955). For long-tenured individuals the relationship between
job satisfaction and vocational interest-occupation congruence has been found to be positive,
Weiner and Klein ( 1978) .
4. 1 .2 Research not relating directly to the propositions
Dawis and Lofquist's discussion of research other than that directly related to the propositions
focused on their reference dimension or values, that is the factor structure of the MIQ as
determined by factor analysis.
Using a principal factor solution with squared multiple correlations as communality estimates
and orthogonal rotation to a varimax criterion, the factor structure of the MIQ was able to
be organised around six dimensions (Gay, Weiss, Hendel , Dawis and Lofquist, 1971 ) . Table
4. 1 summarises the factor structure for the large group (N = 5 ,358). Four factor analyses
of MIQ data were performed on the MIQ data of vocational rehabilitation clients (N = 1 ,62 1) ,
employed workers (N = 3 ,033) , college students (N = 419) and a heterogenous group of
individuals (N = 5,358) that included the three groups above plus 285 vocational-technical
school students. The negative loadings in factors I, III, IV, V, and VI were said to be an
artifact of the analysis that can be reversed by reflecting the dimension to give positive
loadings. The size of the loadings, positive or negative, were said to give the significant
information to identify the factor dimensions.
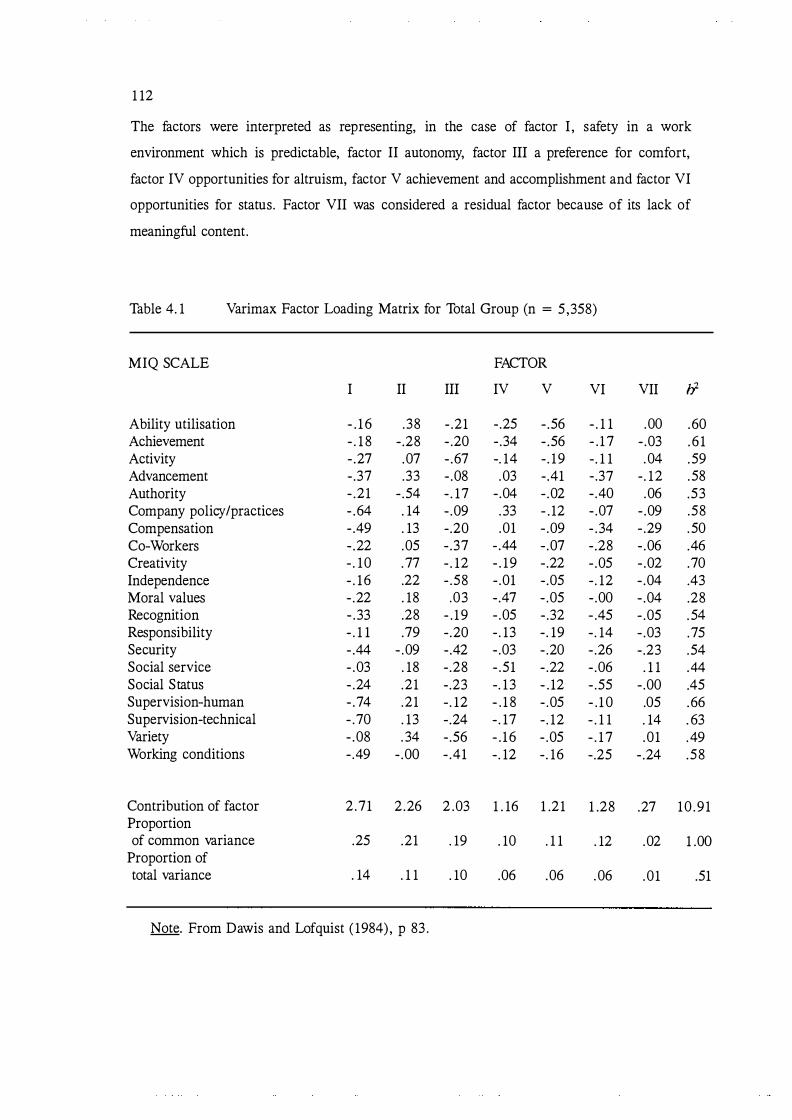
1 12
The factors were interpreted as representing, in the case of factor I , safety in a work
environment which is predictable, factor II autonomy, factor Ill a preference for comfort,
factor IV opportunities for altruism, factor V achievement and accomplishment and factor VI
opportunities for status. Factor VII was considered a residual factor because of its lack of
meaningful content.
Table 4. 1 Varimax Factor Loading Matrix for Total Group (n = 5 ,358)
MIQ SCALE
I II
Ability utilisation - . 1 6 .38 Achievement - . 1 8 - .28 Activity - .27 .07 Advancement - .37 .33 Authority - .21 - .54 Company policy/practices - .64 . 14 Compensation - .49 . 13 Co-Workers - .22 .05 Creativity - . 10 .77 Independence - . 16 .22 Moral values - .22 . 18 Recognition - .33 .28 Responsibility - . 1 1 .79 Security - .44 - .09 Social service - .03 . 18 Social Status - .24 .21 Supervision-human - .74 .21 Supervision-technical - .70 . 13 Variety - .08 . 34 Working conditions - .49 - .00
Contribution of factor 2 .71 2 .26 Proportion of common variance .25 .21
Proportion of total variance . 14 . 1 1
Note. From Dawis and Lofquist ( 1984), p 83 .
FACTOR
Ill IV V VI
- .21 -.25 - .56 - . 1 1 - .20 - .34 - .56 - . 1 7 - .67 -. 14 - . 19 -. 1 1 - .08 .03 -.41 - .37 - . 17 - .04 - .02 - .40 - .09 .33 - . 12 - .07 -.20 .01 - .09 - . 34 - .37 - .44 - .07 -.28 - . 12 - . 19 -.22 - .05 - .58 - .01 -.05 - . 12 .03 -.47 - .05 - .00
- . 1 9 - .05 - .32 - .45 -.20 - . 13 -. 19 - . 14 -.42 - .03 - .20 - .26 -.28 - .51 - .22 - .06 -.23 -. 1 3 - . 12 - .55 - . 12 - . 1 8 - .05 - . 1 0 -.24 - . 17 - . 12 - . 1 1 - .56 - . 16 - .05 - . 1 7 - .41 -. 12 -. 16 -.25
2 .03 1 . 16 1 .2 1 1 .28
. 19 . 10 . 1 1 . 12
. 10 .06 .06 .06
VII 1)2
.00 .60 - .03 . 6 1 . 04 . 59
-. 12 . 58 .06 .53
- .09 .58 - .29 . 50 - .06 .46 - .02 .70 - .04 .43 - .04 .28 - .05 . 54 - .03 .75 -.23 .54 . 1 1 .44
- .00 .45 .05 .66 . 14 . 63 .01 .49
- .24 .58
.27 10 .9 1
.02 1 .00
.01 .51
1 13
The generalis ability of the factor structure was found to be similar for age groups but differed
between the sexes in each age group. Separate factor analyses for male (N = 1 ,609) and
female (N = 1 , 67 4) data were said to elicit factor structures as for the total group. It was
concluded that six dimensions were sufficient to describe the common variance in the 20 MIQ
need dimensions. Dawis and Lofquist noted that the value dimensions tended to suggest areas
of importance which may go beyond those the MIQ assesses. An example given was that the
safety values assessed by the MIQ touched on the importance of company policies and
practices and of supervision. It was felt that more complete assessment may identify other
reinforcers in a job that contribute to a safe environment, such as stability of management,
company size and reputation and position of the company in the marketplace. It may be more
appropriate to say that their label of safety is not particularly descriptive of the needs
representing that factor. The needs, company policies and practices, and supervision both
technical and to do with human relations, could equally well be interpreted as a management
factor.
In the factor analysis of 6,000 raters (Shubsachs, Rounds, Dawis and Lofquist, 1 978) on
reinforcer patterns for 109 occupations that represented the distribution of the U.S labour
force, perceptions of work reinforcers paralleled the six-value structure of need-reinforcer
preferences. The data was represented well by three factors, a self-reinforcement factor, an
environmental/organisational factor and a reinforcement via altruism factor. The three factors
were believed to correspond to the achievement-autonomy-status, safety-comfort, and altruism
need factors (values) of the MIQ. This study was regarded as providing confirmation of the
validity of the construct of values as reference dimensions for needs. It was believed to also
extend the usefulness of the construct to describe reinforcers in the work environments via
reinforcer factors that parallel values.
The six-value way of representing work reinforcers provided a basis for developing a
taxonomy of work environments (Dawis, Lofquist, Henly and Round's Minnesota
Occupational Classification System IT (MOCS II), 1979/ 1982) . This involved the clustering
of 1 , 100 occupations into 78 taxons according to the similarity of reinforcer patterns and
ability-requirement patterns. The six-value system was regarded as a meaningful way of
differentiating among occupational groups in terms of their identifying reinforcer
characteristics.
1 14
Reliable but modest relationships have been found between needs and activities (Dawis and
Lofquist, 1984) . Factor analysis arrived at 27 biographical factors which were used to develop
biodata-factor scales enabling the prediction of 1 8 of the 20 MIQ needs and all 6 of the MIQ
values. Dawis and Lofquist ( 1984) have concluded that needs as measured by the MIQ can
be predicted from biographical data for both sexes.
Gender differences in the development of needs from experienced reinforcement have been
found in some cases (Rounds, Dawis and Lofquist, 1 979) but not in others. The perception
of reinforcers in male dominated, female dominated occupations and occupations which were
not dominated by either gender have been examined. Equal numbers of male and female
raters in each occupation were used and highly similar occupational reinforcer patterns
emerged. Correlations between the profiles of both sexes ranged from . 9 1 to . 98 which is
very similar to the median random split group reliability for Occupational Reinforcer Patterns
(Borgen, Weiss, Tinsley, Dawis and Lofquist, 1968) . The vocational needs of distinctly
different groups, such as neuropsychiatric patients, rehabilitation clients, and college students,
have been studied with regard to their assumed different reinforcement histories with the aim
of assessing whether these have produced d ifferent reinforcer preferences or needs.
Differences have been found for groups on 1 3 of the 20 MIQ scales (Eberly, Rounds, Dawis
and Williams, 1 976) . The relationship between vocational needs and other personality
dimensions has been investigated. Thorndike, Weiss and Dawis ( 1968) looked at the
relationship between MIQ measured needs and interests as measured by the Strong Vocational
Interest Blank (SVIB ; Strong, 1943) . Maximum canonical correlations of .78 (for a student
group) and . 74 (for a rehabilitation) group were found. It was thought that these canonical
correlations were sufficiently high to show that needs and interest measured in this manner
were part of the same domain of personality variables but not high enough to indicate the
same construct was being measured by these instruments.
The research on adjustment style has concentrated on the construct validity of the adjustment
style measures of flexibility, activeness and reactiveness . Dawis and Lofquist ( 1984) discussed
the development of threshold measures of flexibility, tolerance of discorrespondence and
evidence of the convergent and divergent validity of the constructs. The development of
instruments for assessing the adjustment styles has been ongoing. One instrument is the Life
Experiences Questionnaire (LEQ). This obtains self-report data on life experiences which
1 15
reflect tolerance for discorrespondent situations, actions to alter environmental situations and
actions to change the expression of one's personality.
Another instrument undergoing development is the Work Situation Questionnaire (WSQ) . In
this, individuals are presented with response choices for coping with a number of work
environment problems. The problems were included to allow for the appropriateness of either
an active or reactive response choice. Both the LWQ and WSQ have received preliminary
validation when compared to self-report ratings other than adjustment style dimensions.
4. 1 .3 The need for further research
Dawis and Lofquist have not regarded their theory as a definitive account of work adjustment
and themselves expected to further explore the area. They acknowledged the need to further
refine the assessment instruments by expanding their coverage and continuing to develop the
assessment of adjustment styles. Dawis and Lofquist suggested that a promising way to
validate the LEQ and WSQ adjustment style measures might be to use them to test the newer
propositions in the theory of work adjustment which are to do with adjustment style.
Occupations could be identified which clearly need workers who are active, or reactive, and
the satisfaction and satisfactoriness of the workers in each group assessed to see if the
expected higher levels occurred. It was also suggested that adjustment style might be assessed
by inferring style characteristics from the configuration of scores from existing personality
measures for satisfactory and satisfied workers in environments which can be clearly
identified as requiring workers which are reactive or active.
As well as the need for research as identified by Dawis and Lofquist (1984), further research
appeared to be necessary in the light of the minor criticism their theory has attracted (Neff,
1985 ; and Hackett, Lent and Greenhaus, 1991) . Similar limitations had been noticed (prior
to Neff's publication) in preparing to apply aspects of the theory to university graduate groups
in the present research. Despite the criticisms outlined next, Dawis and Lofquist's theory
remained the most appropriate to use with the population of interest . However, additional
constructs to describe work adjustment behaviour were introduced in the present research as
an attempt to better describe and predict work adjustment behaviour.
1 16
4. 2 Criticisms
4.2. 1 The importance of assessing Dawis and Lofquist's theory
The little theory in existence in vocational psychology before the 1950s was found to be
limited in scope (Crites, 1969). The field had been dominated by the generally atheoretical
approach of the trait and factor perspective. The next two decades saw more systematic and
varied theoretical efforts. Developmental theories (Super, 1953, 1957; Super, Crites,
Hummel, Maser, Overstreet and Warnath, 1957; and Tiedeman and O'Hara, 1963) emerged.
Then vocational development was approached from a personality perspective (Roe, 1956; and
Holland, 1959) . Needs and personality characteristics in relation to vocational behaviour were
investigated, for example by Hoppock (1957). Psychodynamic interpretations of vocational
choice continued, such as in the work of Bordin, Nachmann, and Segal ( 1963) . Others, Gelatt
( 1962) and Hershenson and Roth (1966), for example, applied decision-making models to
vocational choice.
Hackett, Lent and Greenhaus (1991) have identified the major theories before the 1970s as
developmental, trait and factor, personality based theories and Holland's typology theory.
They noted the emergence of three dominant perspectives, Super's developmental theory
( 1953, 1957) , Holland's typology approach and development of the trait and factor tradition
as represented by work adjustment theory (Dawis and Lofquist, 1984). They listed the current
dominant perspectives as developmental theories (Super, 1980; Nevill and Super, 1986, 1988;
Brown, 1990; Levinson et al , 1978; and Super and Kidd, 1979), Holland's theory and work
adjustment theory (Dawis and Lofquist, 1969, 1984) .
Hackett, Lent and Greenhaus (op. cit.) have identified work adjustment theory as one of the
current dominant theoretical perspectives without elaborating the reasons for their choice.
However, as an approach which is considered dominant, it needs to be evaluated to a greater
extent. It has undergone revisions and extensions (Dawis and Lofquist, 1976, 1984) as a
result of research in the 1970s and these included positing the influence of personality style
variables on the work adjustment process. Osipow ( 1983) noted that although their theory was
operationalisable and testable, its potential had remained uncertain and difficult to assess
because few independent tests of Lofquist and Dawis' ( 1969) propositions had occurred. As already indicated, most of the research testing aspects of the theory, was undertaken by Dawis

1 17
and Lofquist and their associates. Hackett, Lent and Greenhaus have noted that little empirical
work related to the theory has appeared in the published literature in the 1980s. In view of
this the categorisation of the theory as a dominant perspective appears to have arisen from
its apparent conceptual importance, the degree it is referred to and perhaps the amount of its
instrumentation, rather than the extent of its empirical support outside that proffered by the
theorists and their associates.
4 .2 .2 The conceptual and empirical limitations
The theory may have certain limitations which impair its suitability, not only for the
university student and graduate population, but generally. The limitations, identified while
reviewing the literature and planning the present research, and taken into account in applying
aspects of the theory to the population in question, were of both a conceptual and empirical
nature. Some of the areas of concern were not unexpected in view of Dawis and Lofquist's
own expectations for further research and the exploratory nature of their adjustment style
measures. Other areas of concern, to do with the factor structure of needs and the lack of a
cognitive perspective, could be regarded as more serious, having conceptual, methodological
and theoretical modelling implications for the acceptance of their theory.
The conceptual issues related to the symmetry of the theory, to the adequacy of the constructs
themselves, to the use of tenure as a work adjustment outcome variable, to the proposed
relationship between job satisfaction and satisfactoriness and to the extent to which the
adjustment styles may not represent the full range of responses to conflict and frustration
which can categorise work adjustment behaviour. Dawis and Lofquist regarded their study
of adjustment styles and their measurement of these in particular to be in the exploratory
stages, as such, this area of their theory was expected to be more susceptible to criticism. The
construct of tenure, its use as an outcome variable and its operationalisation needed to be
examined further as did the interrelationships of constructs such as satisfaction and
satisfactoriness and their use as moderators. One of the assumptions underlying the application
of the theory, that is a mature work personality as judged by the stability of work needs, may
not allow it to be applied to the early stage of employment, as for example, represented by
graduates beginning work.
1 18
An issue of both a conceptual and empirical nature and one which is more a criticism of the
research techniques of Dawis and Lofquist, related to the underlying factor structure of work
needs, which was seemingly not examined appropriately. An oblique rotation of the extracted
factors was not conducted, or if it was, has not been reported. The possibility of the presence
of higher order factors, therefore, has neither been raised nor examined. Conceptualising
work factors as having one or more underlying factors would have implications for the
instruments and their interpretation, which would be different from the six factor work need
model assumed.
The main empirical issues of concern were the lack of research outside that of the theorists
and their associates and that the theory has not been tested in its entirety. Tziner ( 1983) has
noted that the theory generally has received inadequate attention. The little criticism it has
incurred appertained to its abstract theoretical position, which does not appear to match the
disorder of the real world (Neff, 1985; and Hackett, Lent and Greenhaus 1991) , and the low
correlations generally found among the key variables in the model (Neff, op. cit . ) . Low
correlations may be indicative of important variables not having been included.
Some of the variables identified in the planning of the present research as of potential
importance to the work adjustment process involved cognitive and social aspects in particular,
and the potential interrelationship of work and non-work variables in the work adjustment
process. Obviously if any aspects of the theory lack empirical support or have not been
adequately investigated to date, there will be implications for the validity of generalising the
theory in the way Dawis and Lofquist have advocated, that is across career stages and to
settings other than work.
4.2 .3 The symmetry of the theory
The criticisms above were also among those noticed independently at the time the present
research was designed. Hackett, Lent and Greenhaus ( 1991) had concluded that the theory
is very symmetrical in nature, particularly in relation to the concept of correspondence. They
suspected that in reality the relationships may not conform to such a well-ordered pattern.
Although Dawis and Lofquist did not specify their expectations, the theory's symmetry could
imply that s imilar amounts of correspondence between work needs and reinforcers and
between abilities and ability requirements are needed to produce similar levels of satisfaction
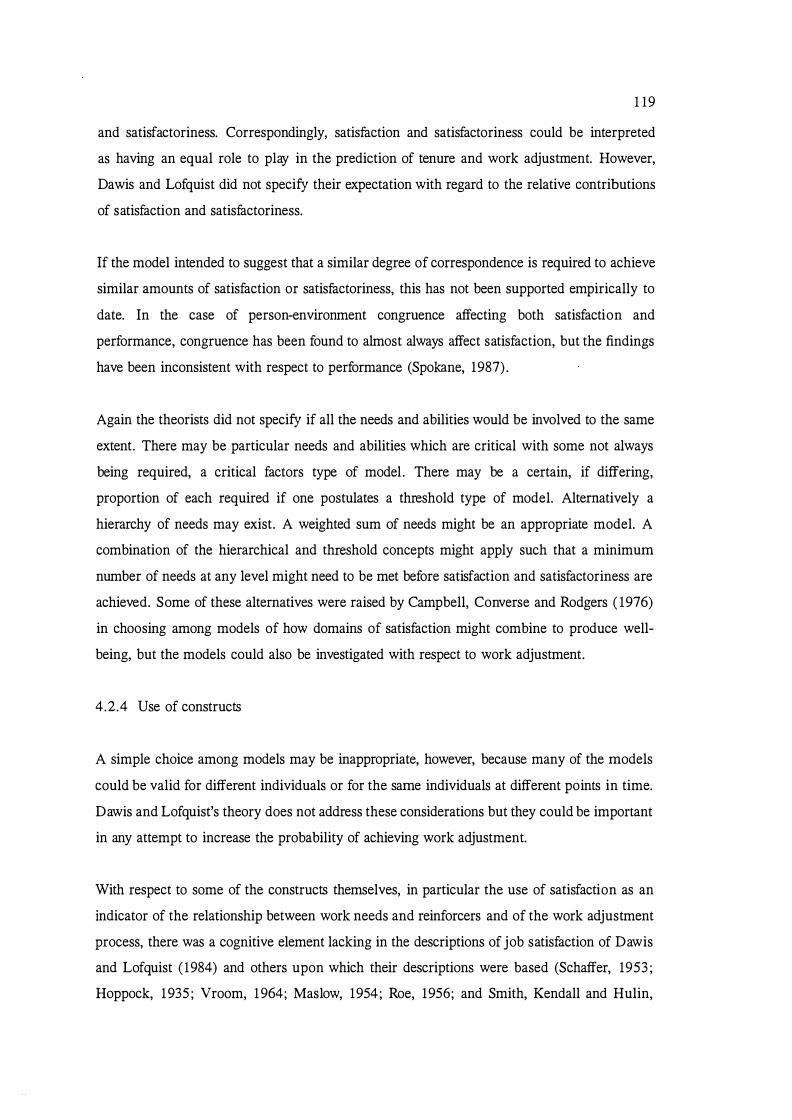
1 19
and satisfactoriness. Correspondingly, satisfaction and satisfactoriness could be interpreted
as having an equal role to play in the prediction of tenure and work adjustment. However,
Dawis and Lofquist did not specify their expectation with regard to the relative contributions
of satisfaction and satisfactoriness.
If the model intended to suggest that a similar degree of correspondence is required to achieve
similar amounts of satisfaction or satisfactoriness, this has not been supported empirically to
date. In the case of person-environment congruence affecting both satisfaction and
performance, congruence has been found to almost always affect satisfaction, but the findings
have been inconsistent with respect to performance (Spokane, 1987) .
Again the theorists did not specify if all the needs and abilities would be involved to the same
extent. There may be particular needs and abilities which are critical with some not always
being required, a critical factors type of model . There may be a certain, if differing,
proportion of each required if one postulates a threshold type of model. Alternatively a
hierarchy of needs may exist. A weighted sum of needs might be an appropriate model. A
combination of the hierarchical and threshold concepts might apply such that a minimum
number of needs at any level might need to be met before satisfaction and satisfactoriness are
achieved. Some of these alternatives were raised by Campbell, Converse and Rodgers ( 1976)
in choosing among models of how domains of satisfaction might combine to produce well
being, but the models could also be investigated with respect to work adjustment.
4.2.4 Use of constructs
A simple choice among models may be inappropriate, however, because many of the models
could be valid for different individuals or for the same individuals at different points in time.
Dawis and Lofquist's theory does not address these considerations but they could be important
in any attempt to increase the probability of achieving work adjustment.
With respect to some of the constructs themselves, in particular the use of satisfaction as an
indicator of the relationship between work needs and reinforcers and of the work adjustment
process, there was a cognitive element lacking in the descriptions of job satisfaction of Dawis
and Lofquist ( 1984) and others upon which their descriptions were based (Schaffer, 1953 ;
Hoppock, 1935 ; Vroom, 1964; Maslow, 1954; Roe, 1956; and Smith, Kendall and Hulin,

120
1969). Dawis and Lofquist only hint at such a possibility by referring to 'one's appraisal' of
the way in which the job matches expectations. Cognitive influences of importance might be
self-efficacy for achievements which lead to job satisfaction and perceptions about job
satisfaction relative to those of significant others, such as family and peer group.
Although tenure has come to be regarded as a criterion measure in the prediction of work
adjustment (Dawis and Lofquist, 1984) , it is unlikely to be the only predictor and may in fact
not be the best. In particular the role of satisfaction in both absenteeism and turnover has been
questioned. Porter and Steers ( 1973) treated them as different responses and in their review,
Nicholson, Brown and Chadwick-Jones ( 1976) regarded the relationship between satisfaction
and absenteeism as artifactual . Alternative models have been proposed, for example, Steers
and Rhodes' ( 1978) process model which related concepts other than satisfaction to
absenteeism and Chadwick-Jones, Nicholson and Brown's (1982) social exchange theory
which has absence rates depending upon group norms and expectations. With respect to
tenure, Mobley, Homer and Hollingsworth ( 1978) found job satisfaction played a greater role
earlier in the quitting process when an individual contemplates leaving a job. Landy ( 1985)
noted that even under good conditions for leaving, the relationship between satisfaction and
turnover has been found to be only modest. He also concluded that a major controlling factor
with respect to turnover is how widespread unemployment is generally, as well as in an
individual's occupational area. Other tenure related concepts such as career commitment, job
involvement and organisational commitment may be of greater importance. If the main
objective was to predict tenure, satisfaction and satisfactoriness may not be ideal or even the
important indicators. The literature would suggest others such as organisational commitment
may perform more reliably.
For a recent university graduate population, which is in the early stage of employment and
work adjustment, job satisfaction and any influence it may have upon tenure could be
expected to be moderated by the stage of employment. This is consistent with the influence
of employment stage as advocated by Gould and Hawkins (1978) . Specifically, there may be
factors external to the work environment which affect work adjustment and tenure in a
recently graduated university population, specifically. Factors external to the work
environment, such as living circumstances, may exert an equal or greater importance on
tenure than the factors proposed by Dawis and Lofquist. Distance travelled to work and mode
of transport, for example, may be a physical factor which strongly influences the amount of

121
work adjustment which is achievable. The importance of tenure as an outcome of job
satisfaction and satisfactoriness may be context specific, moderated by the work environment
or individual factors.
4 .2 .5 Relationships among constructs
In terms of relationships among constructs, a relationship between satisfaction and
performance is not one which has been supported in the literature, as discussed in section 2 . 3
(Landy, 1985; Brayfield and Crockett, 1955; Vroom, 1964; Locke, 1976; and Iaffaldano and
Muchinsky, 1985) . Satisfaction and satisfactoriness are stated by Dawis and Lofquist ( 1984)
themselves to be relatively independent. However, the size of the correlation and the
proportion of the variance accounted for may not be too dissimilar from other constructs in
the model Dawis and Lofquist claim interdependence for. The magnitude of the correlations
among the constructs in Dawis and Lofquist's model are not high and on that basis could
themselves be said to be 'relatively independent' .
More serious however, is the apparent logical inconsistency in one aspect of their theory.
Satisfaction and satisfactoriness are said to be 'relatively independent' , a claim which is
inconsistent with the notion that the two constructs act as moderators in relationships in which
each is involved. To elaborate upon this, Dawis and Lofquist maintain that given
satisfactoriness correspondence between work needs and reinforcers will affect job satisfaction
and similarly given satisfaction correspondence between abilities and ability requirements will
affect satisfactoriness in the work environment. This means that satisfaction and
satisfactoriness need to be at certain levels before the correspondent relationships can affect
satisfactoriness and satisfaction, respectively. Thus satisfaction and satisfactoriness are
expected to act as moderating variables in the relationships concerned. For these variables to
be moderators some degree of correlation between them (satisfactoriness and satisfaction)
would be expected, certainly greater than the term 'relatively independent' would imply. For
example, when work needs correspond with work reinforcers, job satisfaction is expected to
result. For this to occur a reasonable level of satisfactoriness is assumed always to be present .
In other words, job satisfaction being affected by work need and reinforcer correspondence
is conditional upon job satisfactoriness. Consequently when job satisfaction exists a level of
satisfactoriness (probably moderate at least) must also exist and the two would be correlated
(as shown in Figure 4 . 1) at least to a moderate degree. For example, high satisfactoriness
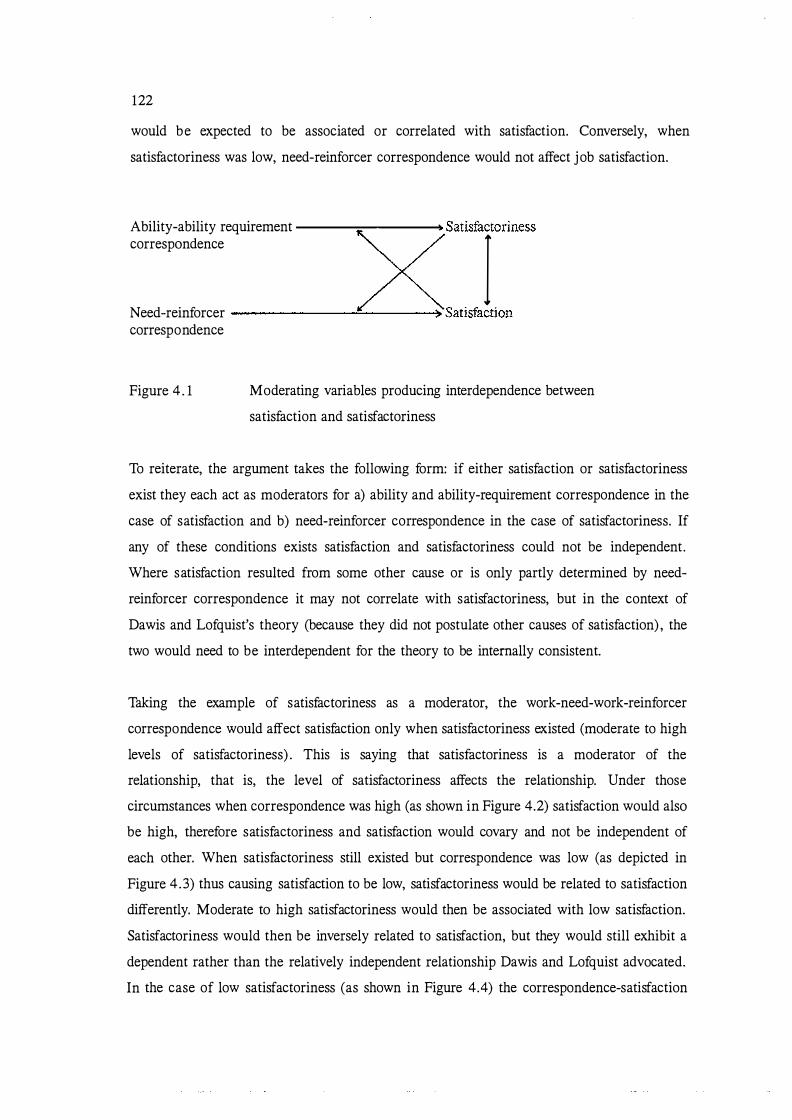
122
would be expected to be associated or correlated with satisfaction. Conversely, when
satisfactoriness was low, need-reinforcer correspondence would not affect job satisfaction.
Ability-ability requirement -----=:-----� Satisfactoriness correspondence I Need-reinforcer -------......:=-----�·satisfaction correspondence
Figure 4 . 1 Moderating variables producing interdependence between
satisfaction and satisfactoriness
To reiterate, the argument takes the following form: if either satisfaction or satisfactoriness
exist they each act as moderators for a) ability and ability-requirement correspondence in the
case of satisfaction and b) need-reinforcer correspondence in the case of satisfactoriness. If
any of these conditions exists satisfaction and satisfactoriness could not be independent.
Where satisfaction resulted from some other cause or is only partly determined by need
reinforcer correspondence it may not correlate with satisfactoriness, but in the context of
Dawis and Lofquist's theory (because they did not postulate other causes of satisfaction) , the
two would need to be interdependent for the theory to be internally consistent.
Taking the example of satisfactoriness as a moderator, the work-need-work-reinforcer
correspondence would affect satisfaction only when satisfactoriness existed (moderate to high
levels of satisfactoriness) . This is saying that satisfactoriness is a moderator of the
relationship, that is, the level of satisfactoriness affects the relationship. Under those
circumstances when correspondence was high (as shown in Figure 4.2) satisfaction would also
be high, therefore satisfactoriness and satisfaction would covary and not be independent of
each other. When satisfactoriness still existed but correspondence was low (as depicted in
Figure 4 .3) thus causing satisfaction to be low, satisfactoriness would be related to satisfaction
differently. Moderate to high satisfactoriness would then be associated with low satisfaction.
Satisfactoriness would then be inversely related to satisfaction, but they would still exhibit a
dependent rather than the relatively independent relationship Dawis and Lofquist advocated.
In the case of low satisfactoriness (as shown in Figure 4.4) the correspondence-satisfaction
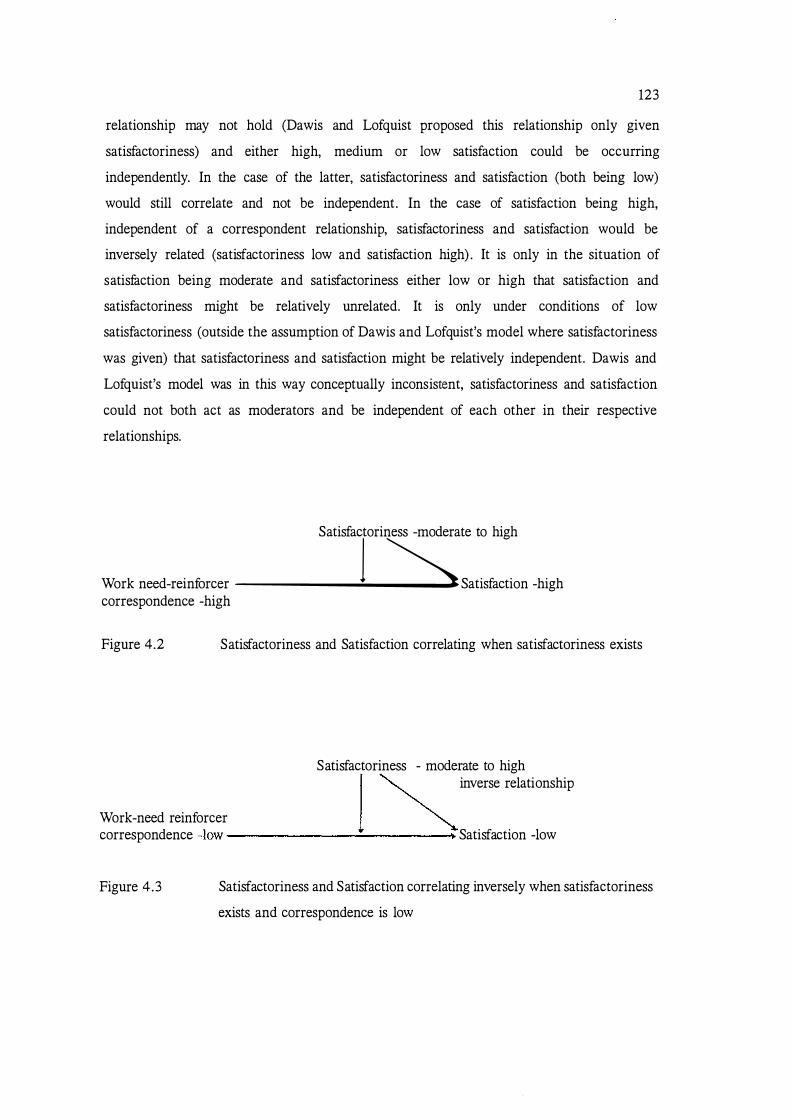
123
relationship may not hold (Dawis and Lofquist proposed this relationship only given
satisfactoriness) and either high, medium or low satisfaction could be occurring
independently. In the case of the latter, satisfactoriness and satisfaction (both being low)
would still correlate and not be independent. In the case of satisfaction being high,
independent of a correspondent relationship, satisfactoriness and satisfaction would be
inversely related (satisfactoriness low and satisfaction high) . It is only in the situation of
satisfaction being moderate and satisfactoriness either low or high that satisfaction and
satisfactoriness might be relatively unrelated. It is only under conditions of low
satisfactoriness (outside the assumption of Dawis and Lofquist's model where satisfactoriness
was given) that satisfactoriness and satisfaction might be relatively independent. Dawis and
Lofquist's model was in this way conceptually inconsistent, satisfactoriness and satisfaction
could not both act as moderators and be independent of each other in their respective
relationships.
Satisfactoriness -moderate to high
Work need-reinforcer ---------!.j--�---�Satisfaction -high correspondence -high
Figure 4.2 Satisfactoriness and Satisfaction correlating when satisfactoriness exists
Satisfactoriness - moderate to high j � inverse relationship
Work-need reinforcer � correspondence -low --------------- Satisfaction -low
Figure 4.3 Satisfactoriness and Satisfaction correlating inversely when satisfactoriness
exists and correspondence is low

124
satisfactoriness -low
Work-need reinfurcer No � satisfaction -low or high correspondence -low or high
Figure 4.4 The possible effects of low satisfactoriness on the satisfactoriness
satisfaction relationship
Because independence of satisfactoriness and satisfaction appears inconsistent with these
variables acting as moderators, one of the two following outcomes would be logical. Firstly
satisfactoriness may be related to satisfaction, even if performance is not, and may therefore
be correlated and free to act as a moderator of the need-reinforcer correspondence affecting
satisfaction relationships. Alternatively, satisfaction and satisfactoriness may be independent,
as has been the case with satisfaction and performance, and satisfactoriness will not operate
as a moderator.
Another concern about the relationship among constructs in Dawis and Lofquist's model is
that the parts both job satisfaction and satisfactoriness play together in determining tenure has
not been specified. Intuitively one might expect satisfaction and satisfactoriness to affect
tenure to differing degrees and their respective effects to be modified by still other factors.
Some individuals may be only minimally satisfactory but be highly satisfied. Also, if the
importance an individual attaches to satisfaction and satisfactoriness is different, the respective
influence of these two variables on tenure may also be expected to differ. Therefore, can we
expect symmetry with both these variables contributing equally to tenure and therefore being
of equal importance in the work adjustment process? It was unlikely that Dawis and Lofquist
were implying that equal amounts of satisfactoriness and satisfaction were involved in
influencing tenure, but some specification of the minimum levels of satisfaction and
satisfactoriness required for tenure would have made their theory more specific and therefore
more readily testable.
125
4.2 .6 Adjustment styles
The questions on Dawis and Lofquist's (1984) experimental rating form for obtaining data
about adjustment styles appear too complex, see Appendix A.3 . Moreover, their interim
alternative estimates of adjustment styles did not always seem to be appropriate. Their use of
success in a wide range of jobs as an estimate of high flexibility may not always be
appropriate, particularly if an individual has changed jobs often as a result of
discorrespondence. If such discorrespondence has been caused by inflexibility, then a wide
range of jobs would, in that case, be an indicator of inflexibility rather than flexibility.
Although the extent to which an individual adopts a leadership role was expected to be
associated with the use of the active mode, it may not necessarily follow. Individuals with
leadership skills, who influence others and make changes on behalf of them, are not
necessarily willing or able to do the same for themselves. Abiding by the rules and carrying
out assignments according to prescribed procedures may suggest the preferred use of a
reactive mode as Dawis and Lofquist postulate. However, the rules and procedures of a social
group or organisation may actually sanction attempts to change the work environment where
appropriate. In this case members of such groups could have a history of abiding by the rules,
but because the rules support or even encourage the use of an active mode their adherence
to the rules would predispose them towards activeness rather than reactiveness.
Although Dawis and Lofquist have not advocated the exclusive use of styles, some of the
research relating to adjustment styles they reported has, by focusing upon identifying
particular adjustment styles typically found in certain occupations and organisations. Carrying
out research in organisations where only one style is identifiable may produce results from
atypical organisations which do not generalise well to other settings. Dawis and Lofquist's
notion that individuals may have a propensity towards the use of a particular adjustment style
suggests that where an individual feels more able to use a particular mode they may be more
satisfied with work environments where this mode is more easily used and accepted.
Although Dawis and Lofquist do not take their analysis further, it seems to suggests that an
individual who is able to assess which is the most appropriate style, able to use this regardless
of their own personal preference and able to decide upon and execute this response speedily
may be more likely to be considered a satisfactory worker. Such an individual might be
126
valued for their adaptiveness rather than for the propensity to use a particular adjustment
style, especially in work environments where there is not an optimal style. Similarly, the
organisation which is able to respond appropriately and quickly using the style or combination
of styles which most suit the needs of the individual would be capable of providing the
individual with closer to optimum satisfaction. Where both the individual and the work
environment are highly adaptive one would expect compromises to be made on both sides
without one or the other needing to make most of the changes thus achieving work adjustment
more rapidly.
It seems another adjustment style dimension may be needed that involves this notion of
adaptiveness. This would refer to the employment of the adjustment modes themselves, that
is, the individual or the work environment choosing from among them or employing them in
sequence appropriately. This is not covered by Dawis and Lofquist's notions of flexibility or
perseverance, but rather involves the ideas of tolerance, or delay before a response is made
and of a sequence of responses or a pattern of adjustment styles. At times an individual who
is highly adaptive may need to exercise delay through flexibility or perseverance. Although
these have been used as a type of adjustment response or in relation to using adjustment
responses, they have not been used to describe the choice of adjustment modes themselves.
Although a notion of adaptiveness is not included in either of Dawis and Lofquist's concepts
of personality structure or personality style which make up the work personality, aspects of
adaptiveness are present within the description of personality style. For example, the
dimension of celerity, that is the speed of interacting with the environment, could also be
made applicable to the speed of choice of adjustment style and the speed of adapting the use
of different adjustment styles in response to the environment. Similarly celerity could be used
to refer to speed with which the environment selects adjustment styles and thus adapts to the
needs of the individual .
Further theoretical clarification of the personality style dimensions and their interrelationships
is required. Flexibility, for example, may be confounded with need level such that highly
flexible individuals may simply have a lower need level so that they appear more flexible
when compared with individuals with a higher need level . Because of the dynamic nature of
the adjustment process and the interaction of the individual's attempts with those of others in
the work environment while attempting to reduce discorrespondence, activeness needs to be

127
examined in conjunction with reactiveness. In describing adjustment styles responses, their
source needs to be clearly identified, that is, as the individual or the environment.
Moreover, the locus of the response and its target need to be stipulated. The dimensions of
these two change factors of locus and target have been classified in a two dimensional
schema. Such a labelling system can not only assist in describing work behaviour but also in
identifying behavioural strategies which might be in use in the work adjustment process.
Within the schema as discussed by Hesketh (1982, 1985) both the locus for change and the
target for change can be the individual, for example, where a decision is made to dress in
keeping with the work environment. Alternatively both the locus and the target for change
can be the environment, for example, the boss purchases equipment to lighten the load for
the individual by using ergonomic principles. The locus for change can be the environment
and the target for change the individual, for example where an organisation arranges exposure
to key role models in the job through formal and informal training on the job. Alternatively,
the locus for change can be the individual and the target for change the environment, for
example, an individual reorganises work to delegate more routine tasks.
4. 2 . 7 Conceprualisation and measurement of needs
Needs as a focus of criticism occupy a particular place of importance, because the conceptual
and operationalisation issues of defining and measuring work needs are critical to the
application of the theory. As has been pointed out earlier, one of the assumptions of the
application of the theory, that the work needs have reached maturity, may not be fully met
by a group such as recent university graduates, which is in the early stages of employment.
Because Dawis and Lofquist believe the maturation of needs to coincide with physical
maturity and employment, but do not specify when this occurs, for the university population,
physical maturity and employment in a career related to ·their studies probably would not
coincide. For them work-need maturity may have occurred at the time of vacation
employment during their university studies. However, the amount of change which would be
expected to occur at certain times, such as would accompany graduating and possibly moving
to another location, may still affect work needs and assessing their maturity. Dawis and
Lofquist's criteria of the work needs remaining stable may be the best indicator of their
maturity. However, longitudinal study might be necessary to determine if there are significant

128
changes in work needs during an individual's working life and when they are most likely to
occur.
A very important issue in the conceptualisation and measurement of needs is the number and
structure of the needs as reference dimensions, or underlying factors, of work values. An
inappropriate method of rotation had been used by Dawis and Lofquist in the development
and interpretation of their instruments. They sought a principal factor solution using an
orthogonal rotation to a varimax criterion. By using Varimax, the work need factors were
assumed not to be correlated in any way. It seems inappropriate to assume there would not
be any intercorrelations involving at least some of the factors. Of course some work needs
must have been more highly correlated for factors to b e identified but also some of the factors
might be expected to correlate to some extent with each other, some significantly. Also with
a construct such as work needs it seems possible, if not even likely, that an underlying
general factor might be in existence. Thus the presence of nonorthogonal factors should be
investigated .
More importantly, close examination of Dawis and Lofquist's tables of varimax factor
loadings indicate that some work needs could have been equally well placed in another factor.
This suggests some factors might be correlated and it highlights the arbitrariness of assigning
factors within the constraints of a varimax rotation technique which attempts to minimise
correlations among factors. Another apparent problem was that differences with respect to
factor loadings on the male and female loadings of work needs were not always reflected in
the factor loadings for studies using a total group . Seaburg and Round's tables for separate
male and female groups are reported in Dawis and Lofquist ( 1984) , pages 84 and 85 .
Table 4 .2 presents the varimax factor loadings for vocational rehabilitation clients (N = 1 ,621) , employed workers (N = 3 ,033), college students (N ,;, 419), and 285 vocational
technical school students, giving a total group (N = 5 ,358) from Gay, Weiss, Hendel , Dawis
and Lofquist ( 1 971 ) as in Table 4 . 1 . These are compared with a male group (N = 1 , 609) and
a female group (N = 1 ,674) of Seaburg, Rounds, Dawis and Lofquist's study ( 1 970) .

Table 4.2
Work Need
Security
Working conditions
Advancement
Authority
eo-workers
129
Comparing Varimax Factor Loadings for the Male (N = 1 ,609), Female
(N = 1 ,674) Groups (Gay et al . , 1971 ) and the Total Group (N = 5 ,358)
of Seaburg et al. ( 1970)
Factor
Comfort Safety Status
Comfort
Safety Status
Comfort Safety Status Autonomy Achievement
Status Autonomy
Comfort Safety Status Altruism
Total group
-.42 .44
- .26
- .41
- .49 -.25
- .08 . 37
- .37 . 33
- .41
-.40 . 54
.37 -.22 - .28 -.44
Males
.43
. 52
.28
.41
. 54 .34
. 5 1
.41
. 5 1
.22
. 37
.47
.45
. 3 1
. 3 1
. 3 3
. 42
Females
. 6 1
. 16
.44
.49
.33
.43
.30
. 1 8
.58
. 18
.27
.42
. 5 1
. 1 8
.22
. 32
.58
Note. The factors the studies assigned the work needs to are in bold type.
Table 4.2 shows that the security work need was included in the comfort factor o n which it
was loaded for the female but not the male group. For the male group the security need better
correlated with the safety factor. Although the comfort factor loading was clearly the highest
for the female group, the security work need was related to the status factor to a similar
130
degree that it had related to the comfort factor for the male group. For the male group it is
apparent that correlations between the comfort and safety factors would be expected.
The working conditions need was included in the comfort factor for the total group but had
achieved the highest loading for the female rather than the male group. The male group's
working conditions need seemed to better belong to the safety factor. The working conditions
need in the female group was allied mainly to the comfort factor followed by the status and
safety factors. For both the male and female groups the comfort and safety needs would be
expected to correlate and for the female group the status factor would also be related to these
factors.
The advancement need loaded most highly on the status factor for both genders, but in the
total group this work need loaded similarly on a number of factors, all of which could be
correlated. The authority need being included in the status factor for the total group better
represented the loading for the male rather than the female group. For the female group
authority loaded more highly on the autonomy factor. Certainly the two factors of status and
authority would be expected to be correlated for both genders. The friendly eo-worker need
did load most highly on the same factor for the male, female, and the total group, but there
were other factors which were related to a reasonable degree. These were the comfort, safety,
and altruism factors among which some correlation might be expected.
The implications of the factor structure being different across studies has implications for the
stability and interpretation of the factors generally but also suggests some gender specific
difficulties. In relation to particular work needs the underlying factors associated with them
would be gender dependent. The interpretation of the MIQ in measuring needs would be
complicated and gender dependent for some needs also.
Although McNab and Fitzsimmons ( 1987) found correlated factors, higher order factors did
not emerge. The fact that needs were measured using a single instrument (the MIQ) should
be reason enough to expect at least some correlation among items which arises from the
method of measurement itself. The correlation of factors may be different for different
samples, for example recent graduates. But apart from any substantive reasons for looking
for higher order factors, it is usually considered good practice to perform both orthogonal and
nonorthogonal rotations for comparison purposes (Gorsuch, 1983) .

1 3 1
Gorsuch (1983) identified the main difference between primary and higher-order factors as
the former being concerned with limited areas of generalisation and high accuracy and the
latter as being concerned with greater generalisation accompanied by a loss of accuracy. The
amount of reduction in accuracy that can occur in moving from primary to higher-order
factors is said to be data dependent. Either level of factors can be more basic in a causal sense
and as such higher-order factors are not considered to be superior to lower-order factors
(Cattell, 1966) .
All oblique rotations imply higher-order factors and Gorsuch recommended that higher-order
factors be extracted and looked at in order that the data be understood. They are said to be
of definite interest if they contribute 40 % to 50 % of the variance extracted. A discovery of
higher-order factors in MIQ scores would have implications for the use of values as reference
dimensions for work needs. Determining the relationship of the test items to each level of
higher-order factors may be important, especially if a higher-order factor is found to have a
stronger relationship with an original variable, a test item, than with any of the primary
factors. Dawis and Lofquist in using varimax assumed no correlation between factors.
However, using varimax would have had the self-fulfilling effect of minimising any
correlation, perhaps erroneously, between factors.
Conceptually it may be inappropriate to assume a lack of correlation among work need
factors. It has been shown that some work needs are more highly correlated with each other
and this may be the same for relationships among factors also. In addition it might be
reasonable to assume that some groups of needs are more intercorrelated, perhaps
significantly, with each other than are other groups. Similarly, some of the factors might be
clearly identified as more dependant upon the individual than the organisation, be more highly
correlated with each other than with other factors and therefore be grouped together on this
basis as higher order factors. On this somewhat intuitive basis alone the investigation of
factors seems justified.
Although McNab and Fitzsimmons ( 1987) did not find higher order factors emerged from
their correlated factors it was important for them to have checked and to know this.
Otherwise they could not be as confident about the way in which they had interpreted the
factors. Once correlated factors are found, their interpretation would be less clear and
132
questions about differences in correlations among different factors and the relative
contribution of each to the variance would be of concern.
An alternative and more sophisticated statistical modelling technique which may be more
appropriate than factor analysis in examining latent variables and their interrelationships is
the covariance structure model . The factor model is described (Long, 1983a) as estimating
latent variables without taking the structural relations among these latent variables into
account. However, it is these structural relations which are often of the greatest interest
theoretically. The structural relations model on the other hand by focusing on structural
relations assumes error free measurement of all the variables. But the very use of the factor
model indicates that this assumption may not be justified. The covariance structure model is
hailed as overcoming the complementary weaknesses and combining the strengths of the
factor analytic and structural equation models by merging them into a single model. The
resulting model investigates, simultaneously, latent and observed variables and their structural
relations.
Models for the analysis of covariance structures try to explain the relationships among a set
of observed variables in terms of a smaller number of unobserved variables. Long ( 1983b)
noted that
" . . the relationships among the observed variables are characterised by the
covariances among the variables, contained in a matrix I: . This matrix is
decomposed by a model that assumes that unobserved variables are generating the
pattern or structure among the observed variables. Using a measurement model
linking the observed variables to the unobserved variables, and a structural model
relating the unobserved variables, an analysis of the covariance matrix I; is made
to describe its structure. " (Long, 1983b, p 1 1)
The term "analysis of covariance structures" was introduced by Bock and Bargmann ( 1986)
to describe what would be called a confirmatory factor model now, according to Long
( 1983b) . The model has grown in generality and complexity from the factor analytic model
of Bock and Bargmann to one in which the covariance matrix is considered to be any function
of any set of parameters, with many forms of the model along the way. Bentler and Weeks
( 1979) and Bender ( 1980) have reviewed these models. A description and specification of the
general model appears in chapter five and Appendix K herein.
133
In the case of the operationalisation of person-environment fi t theory, some concerns have
been raised in the literature. Rounds et al . ( 1987) in focusing on a reciprocal influence among
person-environment fit theory and measurement, have discussed three types of commensurate
measurement, commensurate concepts, commensurate units and commensurate structures.
Commensurate concepts referred to the way person characteristics and environmental
properties are related logically, commensurate units to the equality of person and environment
units and commensurate structures to equivalent structural person characteristics and
environment properties. Commensurate concepts were regarded as being necessary for fit
measurement.
4 .2 .8 People-environment fit measurement issues
The need for commensurate units and structure to vary with the method of person
environment fit quantification was emphasised. If a profile shape measure is used, only
commensurate structure was believed to be necessary. However if a distance measure, such
as a difference score, is used both commensurate units and structure are said to be required.
Needs and reinforcers were found to be structurally equivalent, but the two metrics used in
both cases were not equivalent. The reason offered for this was that the environmental
assessment used a consensual or aggregate method. Such methods were thought to decrease
the psychological space between some intervals.
Rounds et al advocated the re-scaling of environment units, if the units are affected
uniformly, and the calibration of these to the individual's own perception of the amount or
level of the reinforcers in the environment. They warned against the incautious use of
difference scores in that they can be unreliable, and be systematically correlated with
components of need-reinforcer correspondence, such as profile elevation, shape, and scatter.
Spokane ( 1987) identified some common themes in person-environment fit research. These
involved questions of whether fit is a matter of matching, whether relationships are linear and
whether over the longer term high congruence might have some negative effects. A
methodological issue was that the range of congruence in many studies is restrictive because
incongruent individuals may depart from a work environment that does not suit. This leaves
only congruent individuals to become the subject matter of person-environment fit research.
Although subjective measures are believed to be less of a problem than originally thought,

134
the use of different measurement methods with individuals and environments has resulted in
different findings.
Commensurate methods of measuring people and environments have been accepted as
desirable, but independence of the measurement of people and environments is advised.
Spokane recommended that the common moderators of congruence relationships should be
established. Person-environment congruence has been found to almost always affect
satisfaction, but the findings in relation to other domains, such as performance, have been
inconsistent. The lack of uniformity of the effects of congruence was said to need further
attention.
On a more general note, some of the problems associated with person-environment fit
research have been noted, for example, by O'Brien ( 1986). He commented on the problem
that most of the person-fit measures do not have a uniform and inclusive set of variables to
describe the dimensions on which a match occurs. O'Brien noted that many types of needs,
motives and abilities have been measured but that there is no theory about which is important.
He considered it important to identify the degree to which jobs use individuals' skills.
Another problem with the person-environment fit model was said to be that it cannot account
for the direct effects of Environment and of Person. It was thought that the person and the
environment measures themselves might be 'fit' measures. Another problem O'Brien
discussed was that the person-fit approach tends to think that fit alone determines strain (strain
is defined as an interactional concept, as an imbalance or lack of fit between job demands and
capabilities of the employee. A third difficulty O'Brien raised was that cross-sectional studies
show few effects of fit on physiological measures of strain.
4. 3 The Present research
4 .3 . 1 The present research and the direction of work adjustment theory research generally
In the context of economic uncertainty and conditions of rapid social change in work
environments and technology, work adjustment may be particularly desired. For organisations
employee satisfactoriness might be of particular importance. For the individuals, factors such
as job security might be paramount. Certainly the identification of important factors could
benefit both employers and employees. If work adjustment can be better predicted and
135
information about the respective contributions of the individual and the environment be made
available, this will enable positive change to occur.
In terms of an appraisal of where the theory and research in the area has been leading,
Hackett, Lent and Greenhaus ( 1991) have noted that the general trends in the 1980s have been
an increased attention to person-environment fit and cognitive issues, two foci of the present
research. Counselling psychologists have been said to make forays into areas traditionally
regarded as organisational behaviour topics, such as adult career development, career
adjustment, work-place justice and occupational stress (Fitzgerald and Rounds, 1989; Osipow,
1986) . The areas receiving greatest emphasis in counselling psychology in the latter part of
the 1980s were identified as involving the person-environment fit and life-span research
(Fitzgerald and Rounds, 1989), relating to the two most dominant approaches, of Holland and
Super, respectively.
Hackett, Lent and Greenhaus maintain that the important differences in both the research and
theoretical emphasis among the two traditions are that in the counselling tradition a small
number of theoretical frameworks have shaped the research questions pursued. On the other
hand vocational/counselling research has involved topics that are related in some degree to
the major theoretical perspectives, such as the study of congruence (Holland's theory) and
career maturity (Super's work) . The major career development model is said to continue to
persist as an influence, despite the concerns about its formal scientific adequacy (Crites, 1969 ;
and Osipow, 1983) and the tendency to exclude interdisciplinary advances in developmental
and cognitive psychology (Hackett, Lent and Greenhaus, 1991 ) .
The counselling perspective i s embodied by theories of career choice and development which
highlight career decision making content and process and which tend to concentrate on
vocational outcomes from the worker's perspective with implications for vocational
counselling. On the other hand, vocational research in organisational settings attempts to
explain performance in, and adjustment to, work settings. The theories are concerned with
organisation-centred themes, such as conditions promoting productivity and worker retention,
and often are from other areas in psychology (Hackett, Lent and Greenhaus, 1991) .
The approach taken in the present research is congruent with Hackett, Lent and Greenhaus'
analysis of trends in the counselling and organisational behaviour traditions in the 1980s. The

136
present research included attention to person-environment fit, cognitive issues an:d career
adjustment. It has covered areas traditionally the domain of both counselling and
organisational psychology. It has been driven by research topics of the counselling tradition,
such as the study of congruence and individual decision making in educational and career
choices, and organisational approach topics such as job satisfaction and performance. It has
been theory based in line with Staw's ( 1984) observation of trends, that is, the emergence of
more basic theory-building and research which is theory based. The use of theory as a
framework for research in vocational psychology is important as a departure from what
Fitzgerald and Round (1989) noted, in their review of research in the area, to be the common
practice of invoking theories in a post hoc fashion. The choice of a theory for investigation
which accommodates two of the major theoretical approaches, counselling and organisational
psychology, is of value in the light of Hackett, Lent and Greenhaus' (op. cit . ) comments that
one tradition's strength has been the other's weakness. Work adjustment theory generally
represents one of the dominant approaches in the area over recent decades and by
incorporating career entry, career stages, career adjustment and performance processes,
represents an integration of counselling and organisational traditions that is currently regarded
as a vital aim by reviewers such as Hackett, Lent and Greenhaus ( 1991) .
Some of the failings of the two approaches as noted by Staw ( 1984) have been avoided here.
The contextual factors have not been underplayed, as has occurred in counselling research,
and managerial perspectives have not been overemphasised as has happened in organisational
psychology. The individual well-being and social issues have not been ignored. The
converging themes of the two traditions are represented here .to some extent by . using a
developmental career framework, but more so by the use of the cognitive perspective,
particularly in the form of the self-efficacy construct. The cognitive emphasis has been said
to contrast with prevailing modes of person-environment interaction and to increase the
complexity of the conceptual frameworks by recognising the active participation of individuals
in the construction of their environments.
Of the conceptual, methodological and statistical advances in vocational research listed by
Hackett, Lent and Greenhaus ( 1991) which included integrative research reviews, meta
analytical procedures for synthesising findings across studies and sophisticated multivariate
and causal modelling techniques, the latter two are evident in the present research.

137
4.3 .2 The present research and Dawis and Lofquist's theory specifically
Dawis and Lofquist's approach has from the beginning been within the domain of industrial
and vocational psychology, as we saw in chapter one. The present research aims to consider
social psychological perspectives in an attempt to address the theory's limitations and to
increase its predictive validity. That individual's responses in the case of work adjustment
cannot be studied adequately without reference to the social groups involved and the power
of the informal groups to influence behaviour, as noted by Fincham and Rhodes (1980) , has
been taken into account.
Some integration of levels of analysis, the individual, the group, and the organisation, has
occurred in Dawis and Lofquist's use of a systems perspective to describe the work
adjustment process. However, their propositions did not enter into the complexity that
feedback into the system (Gowler, 1969; Legge, 1970) would entail . The present research
attempts some integration of individual and group levels by adopting an overall systems
perspective and by examining group differences relevant to some of the key concepts such as
job satisfaction.
With respect to the context of the theoretical approaches to the individual and the
organisation, Dawis and Lofquist, in the human relations tradition, recognised the importance
of psychological characteristics and the personal perspective, making constructs like
satisfaction a key issue. Another human relations approach key issue emphasised was that of
motivation and the need theories. Although some of the problems of need theories had been
resolved in Dawis and Lofquist's approach, such as a lack of empirical testability, others,
including the difficulty of identifying and measuring needs and the failure of data generally
to support any one need approach entirely, had not been resolved.
Aspects of a more sociological approach, as discussed in chapter one, are recognisable in
Dawis and Lofquist's work, such as the social structures involved in identifying the sets of
conditions required for satisfactoriness that the organisation expect to establish. Their
environmental style construct has some similarities to organisational climate research in the
drawing of parallels between the individual and the environment in relation to style, although
different factors are identified. But the focus of the present research is confined to those
aspects of Dawis and Lofquist's theory which involved the individual over the organisation,
138
thus excluding these, no less important, group and organisational factors and the role conflict
and ambiguity approach of a more sociological analysis.
Although the direct application of personality theory to vocational and work psychology has
been limited, its influence in describing the psychology of individuals at work has been
apparent in the work of Holland. A particular example is his Vocational Preference Inventory
( 1965), as a personality approach to matching individuals and jobs. In Dawis and Lofquist's
( 1984) theory the satisfaction and satisfactoriness of workers is dependent upon the extent to
which aspects of their so-called work personality (namely, their abilities and their work needs)
match the work environment (skill requirements and work need reinforcers) .
As a theory of work adjustment which looks at the match between an individual's work
personality and the work environment, Dawis and Lofquist's theory can be compared with
the basic dimensions of personality theory generally. In their theory, consciousness and
cognition are not emphasised. It deals with both the ways in which behaviour is modified and
the acquisition or structure of personality, the outcomes of learning. They have not excluded
genetic factors entirely. By taking abilities into account the heredity component of abilities
is being recognised. With respect to past or present factors determining behaviour they
acknowledge that past behaviour has contributed to present functioning. They appear to view
the individual as a total functioning unit in interaction with their environment from
somewhere between an holistic and analytic perspective. One holistic notion, that everything
people do is related to everything else they do and to their entire physiological functioning,
is unlikely to be evident in a theory which deals with one aspect of an individual's experience,
namely work adjustment. The second basic holistic notion that an individual and his or her
behaviour can be understood only with reference to the environmental context, is evident in
their theory in its focus on the adjustment of the individual to the work environment. Dawis
and Lofquist do not go as far as some in this respect, they are prepared to separate aspects
of behaviour without relating them to all other aspects of the individual's behaviour. On the
other hand, they do not go to the analytical extreme of Skinner or Miller and Dollard, or
Bandura, who begin with small and discrete units of behaviour, such as reflexes, and build
up to more complex analyses.
With respect to the person versus the situation issue, D awis and Lofquist have assumed a
degree of consistency in the personality over time, adopting an interactionist framework.
139
Their theory is purposive to the extent that the satisfaction of work needs are sought, but it
also has mechanistic aspects, the acquisition of needs, for example, is explained in terms of
antecedents. Motivation is explained in terms of only a few variables determining the
achievement of satisfaction and satisfactoriness, that is work needs and abilities. Within these
variables, however a large number of skills and needs are taken into account and then reduced
through taking a factor analytic approach. Their theory as one of work personality can be
characterised as describing and predicting both normal and abnormal work behaviour but it
has been developed from the normal end of a normal-abnormal continuum.
In the context of Industrial/Organisational Psychology, Dawis and Lofquist have drawn on
the testing movement of Personnel Psychology and its reliance on the individual differences
approach, and on the human relations movement, but less so on the Experimental/Industrial
engineering approach. However, the cognitive revolution as discussed in section 1 .3 . 2 has had
little impact upon their research. The present research attempts to redress this imbalance as
a way of both better integrating the work adjustment literature and accounting for more
variance in the work adjustment model by including such previously omitted but potentially
important variables.
With respect to the relationship between the individual and work and the associated theoretical
approaches, as outlined in chapter two in relation to work antecedents and motivation, section
2�2, Dawis and Lofquist's theory could be categorised as a need approach and a
reinforcement approach. As such it is not surprising that the more cognitive approach (which
asks the question why a reinforcer reinforces) of instrumentality theory, goal-setting theory,
and balance theory, is not represented in Dawis and Lofquist's work. As suggested in the
comparison of approaches in section 2.2.6, there has been a mixture of useful and useless
propositions. Because of this, research aimed at the acceptance or rejection of an entire theory
without some alteration would probably be inappropriate.
In relation to work outcomes , job satisfaction and productivity, section 2 .3 , Dawis and
Lofquist's theory did not differ from previous approaches except in its inclusion of the
construct of satisfactoriness which is distinct from performance or productivity. Job
satisfaction excluded the cognitive element of Converse, Campbell and Rodgers, which had
it depending upon the way an individual perceives the objective characteristics of the j ob and
on the more indirect use of standards of comparison. Thus both need levels and concepts such
140
as reference group and equity levels became important. The relationship between job
satisfaction and tenure was not as strongly advocated in other theories discussed in section
2 .4. We are left in doubt that tenure is a useful explanatory concept in work adjustment.
Some alternatives such as career involvement, job involvement, and organisational
commitment are expected to be of more value. The conditions requiring an adjustment type
of response touched on in section 2 .5 . 1 , were not described in either Dawis and Lofquist's
research or in the present study. Focusing on such conditions would not be inconsistent with
either approach. For example for Dawis and Lofquist they would be treated as stimulus
conditions and described as cues for reinforcers.
In the present research the preconditions were not focused on, not because they were
considered unimportant but because they formed a large area on their own. Likewise the area
of work personality development and maturation received attention only in terms of
applicability to the present research, that is in relation to the first stages of employment.
4 . 3 . 3 General outline of the present research
Although Dawis and Lofquist responded adequately to problems associated with the trait and
factor tradition being atheoretical and not accounting for career development, as discussed
previously in section 1 .3 . 3 , they do not appear to have entirely achieved their intent of
integrating the literature. The additional constructs examined in the present research aimed
to include previously neglected areas, such as the cognitive and social psychological
perspectives. The study also reintroduces an earlier approach (for example Crites, 1969) that
of relating work adjustment to general adjustment. In this case the concept of subjective well
being is used to assess general adjustment. The effect on the individual of stress associated
with mismatches between the person and the environment in the person-environment fit model
was seen as dependent upon the cognitive emphasis of the perception of the imbalance. By
taking social factors into account, the present research is more in line with the theory and
application of other person-environment approaches as represented in the work of Holland
( 1965) , Friedman and Roseman ( 1974) and Karasek (1979) .
The exploration of the type and use of adjustment mechanisms is continued in the present
research. Comparisons of Dawis and Lofquist's work with that of others highlight possible
omissions in their theory. One work need not included was Nicholson's concept of the job
141
fitting in with an individual's lifestyle. Although his analysis of role demands and their
importance and the addition of the affective component to work adjustment theory seemed a
reasonable extension of Dawis and Lofquist's theory, the present research in the interests of
size alone was confined to Dawis and Lofquist's adjustment mechanisms.
The study, a two-stage longitudinal one, used a group of volunteer students from a range of
academic disciplines to examine aspects of Dawis and Lofquist's theory and additions aimed
at improving its predictive validity. The aspects of particular interest were work need/work
reinforcer correspondence and its effect on j ob satisfaction and tenure and ability-ability
requirement correspondence and its effect on satisfactoriness and tenure. The additions
proposed were aimed at representing a better integration of the conceptual areas influencing
work adjustment and included cognitive aspects (such as self-efficacy for obtaining needs) and
social aspects (such as degree of social support and the influence of social reference groups) .
The areas called into question by the propositions examined were: the job
satisfaction/satisfactoriness or performance relationship, tenure as a work adjustment outcome,
the abstractness and symmetry of the constructs not being mirrored in reality, and the
comprehensiveness of the adjustment styles and the adequacy of their operationalisation.
The first stage of the study was a questionnaire for the students to complete about two-thirds
of the way through their final year prior to graduation. This questionnaire surveyed work
needs (by administering the MIQ), self-efficacy for obtaining work needs and use of Dawis
and Lofquist's adjustment styles of active, reactive, perseverance and flexibility. It sought
biographic data, previous work history and work plans, leisure activities, parent's socio
economic status and degree of life satisfaction and subjective well-being. The second stage
of the study took place six months into the post-graduate year and consisted of a mailed
questionnaire to determine the respondents' employment status, their confidence about work
needs being met, their job satisfaction (by administering the MSQ) , their perception of the
reinforcers available, the usual tenure associated with their position and their expected tenure.
Subjective well-being, locus of control measures, and Holland's VPI were repeated . Other
information sought concerned leisure activities and satisfaction with these and living
circumstances, satisfaction with the various domains in life, the nature and degree of social
support available, and the relative importance of work and non-work. In addition, an
alternative estimate of work adjustment and tenure, the extent to which individuals are

142
attached to their jobs, was used and the factor structure of the work needs questioned and
explored.
Because that part of Dawis and Lofquist's theory relating to adjustment styles was the more
recent, they regarded their adjustment styles and the measurement of them in particular as
experimental. In view of this a small study, as described in Appendix J, was undertaken with
two objectives. One was to identify the range of adjustment styles in use, to see if any had
been omitted by Dawis and Lofquist. The other objective was to evaluate Dawis and
Lofquist's exploratory instruments comparing these with other ways of measuring adjustment
styles.

CHAPTER FIVE
DESCRIPTION OF PRESENT RESEARCH
5 . 1 Introduction to the study
The principal object of the present research was to investigate the application of Dawis and
Lofquist's theory of work adjustment in an attempt to increase our understanding of the
concept. The main areas explored were the latent structure of the work needs revealed in the
subject sample and their relationship to other personal, social and environmental variables .
In this study, modifications of the theory and its concomitant measurement model were made,
to take into account the findings of the literature review.
Within this context, therefore, an exploration of the structure of work needs was made in
response to Gorsuch's ( 1983) general comment that the failure to investigate whether factors
are correlated (as occurred in Dawis and Lofquist's factor analyses of work needs) could be
considered poor practice. The present researcher concludes, from the review evidence and
an examination of Dawis and Lofquist' s work need factor loadings that some of the
underlying work factors could well be correlated (a belief supported by the research of
MacNab and Fitzsimmons, 1987) resulting in the presence of second or even third order
factors. The implications of finding a factor structure different from that of Dawis and
Lofquist could be far reaching, certainly for their specific theory and its instrumentation.
MacNab and Fitzsimmons proposed in their general model that the factors of the Minnesota
Importance Questionnaire (MIQ) were correlated. In their examination of alternative models
via Confirmatory Factor Analysis (CFA), they found those which required the factors to be
uncorrelated, either in combination with uncorrelated or correlated method factors, produced
a poorer fit to the data. Such models were significantly different from the general model,
leading the researchers to conclude that the trait factors are truly correlated. However, when
two of the most highly correlated factors were combined, a significant difference between this
and the general model did not arise, suggesting that traits are not strongly enough correlated
to be combined. Such conclusions should more properly be confined to the MacNab and
Fitzsimmons study only because just eight of the total 20 needs of the MIQ were used in the
instrument comparisons .
143
144
It may not be particularly meaningful to combine only some traits to form conclusions. The
eight traits used to match those of the other instruments did not represent all the six factors
of the MIQ. The two factors omitted were achievement and safety. The achievement factor
consists of needs to do with ability utilisation and achievement, and the safety factor consists
of the needs relating to company policies and practices and technical and human relations o
supervision. The omissions are especially serious if they are found to be important factors
which can account for a large proportion of variance with respect to a number of variables .
The suggested changes to work adjustment theory were aimed at having it take into account
factors already regarded as important in research in other aspects of occupational and social
psychology, that is those of a cognitive, social , non-work and vocational nature. These
considerations, although having general importance also, appear to have particular relevance
for university graduates who are typically in the young adult age group from a range of
disciplines at the beginning of their careers. The cognitive perspective has been unevenly
represented in the counselling and organisational approaches generally (Hackett and Lent,
1991). The areas explored in the present research were, personality factors such as those of
self-efficacy and locus of control; social influences relating to social support and social
reference groups; vocational factors of job preference-actual job congruence and job fantasy
occupation congruence; and the often non-work related influences of subjective well-being,
work-lifestyle compatibility and the relative importance of work and non-work. The social and
vocational factors may be of particular importance to the younger adult.
To date, the organisational perspective has included the cognitive element more, but has been
limited to extensions of self-efficacy theory. Hackett, Lent and Greenhaus (1991) argued that
research on social cognition and other cognitive theory should enhance our understanding of
many vocational phenomena. As already discussed the contribution of non-work factors to
work adjustment should not be overlooked.
5 . 1 . 1 The cognitive perspective: self-efficacy, subjective well-being
It would seem inappropriate to consider work adjustment without taking the affect of an
individual 's subjective perception into account. An individual's belief in their own ability, the
extent to which their needs can be met and the extent to which they perceive they can achieve
need-satisfaction are all important influences on work satisfaction and satisfactoriness . Such
145
a factor relates most closely to the self-efficacy construct. However, the use of self-concept
variables, such as self-efficacy, has been controversial . Pryor (1985) and Gottfredson ( 1985)
disagreed about the relevance of self-concept to vocational behaviour, for example. Pry or
maintained that it is an unacceptable construct because it is typically defined in terms of the
selfs relationship to other variables, for example perceptions, and expectations , rather than
in terms of its inherent properties . Because the self-concept has meaning only in terms of
other entities it is said not to be able to truly explain human behaviour and should be
exorcised from vocational behaviour and from psychology. On the other hand Gottfredson
(1985) viewed the relational nature of the self-concept as its strength, because it reflects
people's views of themselves in relation to the larger society. Those who are similar
otherwise were said to often pursue different career directions because of their views of
themselves and their associated self-efficacy expectations and self-esteem.
Self-efficacy
In the application of social learning theory to career decision making, which has been
heralded as one of the most significant innovations to have come out of research in the 1 970s,
little empirical evidence had been sought by the mid 1980s (Robbins , 1985). But Robbins
regarded Hackett and Betz's (1981) work, positing a self-efficacy model to explain gender
differences in vocational aspirations, as promising in this regard. However, it was said to be
limited by results which only partially supported the differences in self-efficacy expectations,
by the unknown influence of ability and vocational interest variables, and by a not very
clearly defined sample.
By way of definition, Bandura (1977a) originally distinguished between the construct of
outcome expectancy and that of self-efficacy expectation. The former was defmed as an
individual's estimate that a given behaviour will lead to certain outcomes . The latter was
defined as the conviction that one can successfully execute the behaviour required to produce
the outcomes . It is because individuals believe that a particular course of action will produce
certain outcomes, that is outcome expectations, that behaviour can be influenced differentially
by outcome expectancy and efficacy expectation. Bandura (1982) said self-efficacy
expectations affect "thought patterns, actions and emotional arousal" (p 122) by increasing
performance, lowering emotional arousal and accounting for change in a wide range of coping
behaviours in response to a wide range of differing stimuli.
146
Bandura saw self-efficacy expectations as affecting both the initiation and the persistence of
coping behaviour by affecting the choice of behavioural settings . Situations believed to exceed
one's coping skills could be avoided by controlling coping efforts once initiated, by
controlling both how much effort is expended and how persistent the behaviour will be. The
amount of effort expended and the persistence involved could be seen to have a parallel in
Dawis and Lofquist's notions of intensity and perseverance, respectively.
Self-efficacy expectations were described by Bandura as varying on the dimensions of
magnitude, strength and generality. Expectations were said to vary in their magnitude such
that different individuals may attempt different tasks , some simpler, others moderately
difficult, and others very difficult . With respect to the concept of generality, some experiences
were said to create mastery expectations while others produced a more generalised sense of
efficacy. The strength of expectations were said to vary such that weak expectations are easily
extinguished by disconfirming experiences whilst individuals tend to persevere in their coping
efforts when expectations are strong .
Efficacy expectations and performance were viewed as having reciprocal effects , successes
raising mastery expectations and failures decreasing efficacy expectations . Once strong
efficacy expectations have developed, the negative impact of occasional failure was expected
to be reduced. The effects of failure on self-efficacy are believed to partly depend upon the
timing and the total pattern of experience in which the failure occurs . An individual 's sense
of self-efficacy is thought to be increased by having a serviceable coping skill at their
disposal .
In the context of Dawis and Lofquist's theory, self-efficacy might be increased by having a
wide range of adjustment styles available and being flexible in their use. Bandura emphasised
that successes are more likely to enhance self-efficacy if the performance is perceived as
resulting from skill rather than fortuitous or external events . Whereas, failures were said to
more likely reduce self-efficacy when they are attributed to ability rather than to unusual
circumstances . Some work needs individuals can exercise control over, or are able to
influence on some occasions . Work variety, for example, might be expected to be determined
by the nature of the work but where individuals can choose when to perform which of their
job tasks, they can have control over the variety in their work. For some work needs or for
other work needs on some occasions , individual 's self-efficacy for obtaining these needs could
147
influence whether the needs are met. In Bandura's (1977a) terms, self-efficacy for obtaining
those needs the individual is able to influence, would be the conviction or belief that the
behaviour required to produce the outcomes would be successfully executed.
Bandura concluded that under conditions of perceived self-determination of outcomes , the
impact of performance attainments on self-efficacy varies according to the attributions made.
Where there is success with minimal effort, ability ascriptions are fostered and these reinforce
a strong sense of self-efficacy. Where success is achieved through a high expenditure of effort
a lesser ability is connoted and the effect on perceived self-efficacy is likely to be weaker.
Therefore, attribution factors and locus of control would need to be explored as possible
moderators of the effect of success and failure on self-efficacy. Cognitive app�aisals of the
difficulty level of tasks are thought to further affect the influence of performance
accomplishments on perceived self-efficacy.
Comparisons of self-efficacy and expectancy models in the area of occupational preference
(Wheeler, 1983) have found expectancy models to be characterised by relating individual
work values and the availability of desired rewards in different occupations to occupational
preferences. "The expectancy model describes occupational preferences as a function of
occupational valence, (Vi) , the algebraic sum of the products of the valence of each outcome,
(VJ, and the instrumentality of an occupation for the attainment of these outcomes , (IjJ"
(Wheeler, 1983 , p 73) . On the other hand self-efficacy models have emphasised personal
perceptions of capacities to perform in different occupations to occupational preferences
(Wheeler, 1983 ; Mitchel, T. R. and Beach, L. R. , 1976) .
O'Brien (1986) in reviewing Bandura's theory of competence or 'self-efficacy' classified such
beliefs as concerned with personal control . He stated that competence beliefs are concerned
with an employees's belief about his or her ability to perform tasks . In Bandura's approach
self-efficacy is measured separately from performance and he viewed Ratter's (1966) theory
of internal-external control as neglectful of efficacy beliefs for outcome beliefs . O 'Brien
maintained it is possible that outcome expectations can mediate the effect of performance on
self-efficacy. O'Brien noted the paucity of studies testing self-efficacy in the work situation.
One study directly related to work situations (Locke et al . , 1984) found self-efficacy beliefs
to be positively related to performance on creative tasks even when ability was controlled for.
Self-efficacy was found to be related to past performance also . In the area of work
148
performance Brief, Stumpf and Hartman (1983) in testing a model of self-efficacy for use in
employment interviews , and examining alternative conceptual links among the constructs of
self-efficacy, task performance and coping methods found the model unable to predict actual
performance levels . Self-efficacy for mastering job interviewing tasks was found to predict
reliance on what was referred to as emotion focused ways of coping.
O'Brien examined Bandura's theory and Korman's ( 1968a, 1968b, 1970, 1971a, 197 1b,
1976) theory of self-esteem and task performance. Korman's theory of work motivation
predicts the level of task performance of an individual will reflect their reported level of
competence or chronic self-esteem. There has been support for Korman's theory but the
results have been equally well interpreted in terms of another theory (self-enhancement theory
of Dipboye, 1977) . O 'Brien found some difficulties associated with interpretation of
Bandura's and Korman's work. He noted ability has not usually been controlled for in studies
that have showed competence/self-efficacy to have positive effects on performance. Those
studies where ability was controlled for have usually found no effect of perceived competence
on performance. O 'Brien and Pere (1985) found high-self esteem subjects performed better
in both easy and difficult tasks but when self-esteem and ability were used as joint predictors
of performance, self-esteem was unrelated to performance. However Locke et al's (op. cit . )
study did find self-efficacy effects on performance when ability was controlled for. Such
mixed results demonstrate the need for further studies looking at the joint effects of ability,
efficacy and competence on performance.
O'Brien argued that self-efficacy theory can go beyond locus of control theory only where
a clear distinction between beliefs about response-outcome relationships and beliefs about
ability to perform the required behaviours can be made. It was noted that if outcomes are
visible rewards then the distinction is clear but if they are, as in Bandura's case, 'desired'
outcomes the distinction is less clear, as Bandura himself noted, expected outcomes
cannot be dissociated from judgements about performance. Beliefs about degree of
competence can determine what desired outcomes will be. O'Brien concluded that
"To the extent that Bandura's theory is confined to perceived outcomes (as it
seems to be) and since work activities involve both intrinsic and extrinsic
perceived rewards it must be considered that perceptions of self-efficacy at work
cannot be disconnected from perceptions of control over rewards (outcomes) . " (p
176)
149
Because Bandura's theory was said to not include an analysis of the task situation it was
described as restricted. Although O'Brien believed it likely that Bandura's theory was
preferable to those just based on response-outcome expectancy, especially in situations where
desired outcomes are independent of performance. O'Brien expected self-efficacy theory to
be useful when employees have the ability to do the job but cannot because they do not
believe they have the ability.
Hackett and Betz (1981) have regarded self-efficacy as a principal mediator in developing a
causal model of career choice. It was found that the career interests and pursuits of women
are restrained by self-beliefs that traditionally male occupations are inappropriate for them
because they lack the capabilities to master the skills needed. In contrast , the males were
equally efficacious for having the educational requirements and carrying out the tasks of both
traditionally male and female vocations .
Studies have suggested that women more than men are likely to rely upon luck as an
explanation for both successes and failures (Bar-tal & Frieze, 1977; and Sirnon & Feather,
� 1973), that in academic achievement the lower self-efficacy expectations of women may be
affected by their personal responsibility for their successes (Betz and Hackett, 198 1 ) . High
levels of anxiety have been found debilitating in terms of performance and efficacy
expectations, and female anxiety scores have tended to be higher than males . Beck and
Hackett ( 1981) saw anxiety as a eo-effect of low self-efficacy rather than a cause. Anxiety
was thought to further lower both self-efficacy and the probability that the behaviours will be
successful and lead to increased self-efficacy. The self-efficacy model, as a perceived match
of personal abilities to occupational requirements, was found to be more highly related to
occupational preference than to occupational valence. Because support for both models was
found (Wheeler, 1983), however each having separate and independent relationships to
occupational preference, it was concluded that a more complete model of occupational
preference was needed which would include elements of the two.
Lent and Hackett ( 1987) concluded that the empirical support for the extension of self-efficacy
theory to career-relevant behaviour is growing. They claim that it surpasses others of the
more established variables like interests and abilities in its ability to predict career behaviour,
even although not all findings have been favourable. The use of different samples , self
efficacy measures and criterion variables were thought to have been responsible for the
150
discrepancies. Many of the future research suggestions of Lent and Hackett (op. cit. ) made
after the data had been collected for this present study were congruent with its aims and foci.
Lent and Hackett's ( 1987) suggestions were, clarification of the causal links between self
efficacy and career behaviour and investigating the relationship of self-efficacy variables to
career adjustment, vocational interests , career salience, work values, locus of control and
occupational outcome expectations .
Factors which have been shown to be of importance to an occupational preference model also
might be of importance to work adjustment. Because self-efficacy expectations are believed
to affect the choice of behavioural settings , the initiation of coping efforts , the amount of
effort expended and the persistence of those efforts in general, it would seem logical to expect
similar effects in the specific case of the work setting. Therefore, self-efficacy expectations
would be expected to affect satisfaction and satisfactoriness and thus the degree of work
adjustment attained. With respect to occupational valence, as defined above, Dawis and
Lofquist's notion of correspondence bears some resemblance to the expectancy model . By
adding the self-efficacy construct, the two elements Wheeler (1983) recommends as necessary
for a complete occupational preference model would be present in the work adjustment
model .
Subjective Well-being
The second cognitively oriented construct introduced in the present research, and one which
is an expected outcome in work adjustment is that of subjective well-being. Such a
relationship might be expected because subjective well-being could be regarded as a measure
of self-perceived general adjustment, part of which would be expected to be determined by
work adjustment. In her review of the theory and measurement of subjective well-being
Grainger ( 1985) noted that the concept has developed from two sources . One was that of
social indicators . Researchers initially focused on measurable units such as income levels, but
from the late 1960s began to ask how satisfied individuals were with their lives . Quality of
life came to be defined then not only by physical , but also by subjective variables concerned
with how people perceive their lives and conditions . From this a focus upon the measurement
of perceptions of well-being that define the quality of people's lives developed (Andrews and
Withey, 1976) .
151
The second source of the development of the theory and measurement of perceptions of
subjective well-being was said to come from what Bradburn (1969) called the 'happiness
problem' . Happiness, it was suggested, had been debated as a religious, a political and an
economic problem, first becoming the subject of social scientific research in the twentieth
century. It has been defined through the use of a normative framework, such as an individual
possessing desirable qualities . Bradburn viewed happiness as affect balance, as the
experiencing of more positive than negative affect. He defined psychological well-being by
incorporating the emotional components to a greater extent than did the definitions of the life
satisfaction literature.
Researchers in the area of subjective well-being have generally focused upon two components ,
life satisfaction and affect balance. Deiner (1984) described three hallmarks of 'well-being' .
Firstly, that it is subjective in nature, because it is as perceived by the individual and not
measured by some criteria external to the individual . Secondly, that it includes positive as
well as negative measures. And thirdly, that it usually includes a global assessment of an
individual's life. Subjective well-being has been defined as an individual's perception of how
they feel about life which is separate and distinct from the objective circumstances which may
affect these perceptions (Grainger, 1985) .
There has been extensive debate about the components and dimensions of subjective
well-being which have had implications for the construct both conceptually and in terms of
its operationalisation. Deiner (1984) proposed that positive and negative affect tend to
suppress each other at particular moments in time, but that this suppression is less likely with
graded responses, than the Y§/no response of Bradburn's 1969 multi-item measure. A graded
response asks if a feeling is present, at all, not at all, occasionally, some of the time, often,
or all the time. Studies that have used a longer time span are thought to have blurred
frequency of positive affect, and the intensity with which affect was experienced. Deiner
demonstrated that scales measuring only frequency will be correlated but that those scales
measuring mean levels of affect, both frequency and intensity, will be independent.
Viet and Ware ( 1983) in developing a Mental Health Inventory based upon Dupay's General
Well-being Schedule used a single mental health factor made up of psychological distress and
psychological well-being. Chamberlain (1984) believed this to be simply negative and positive
affect renamed. Viet and Ware included a social support component in psychological
152
well-being and viewed psychological distress and psychological well-being as being distinct
and separate. Tanuka and Huba's ( 1984) factor analysis of Viet and Ware' s Inventory, found
distress and positive well-being factors to be indicators of a general mental health construct.
The presence of a higher order factor is consistent with Kammann's ( 1983) criticism of Viet
and Ware's concept of mental health as being merely subjective well-being with its component
dimensions, positive and negative affect. The methodology was criticised as failing to separate
frequency and intensity data. A third dimension of subjective well-being has emerged from
factor analysis of the Affectometer 2 (McFarland, 1984) . This extra dimension was less
important statistically and was labelled social-loving feelings.
Evidence has been found of a cognitive dimension in subjective well-being which involves
individuals ' appraising their life situation relative to some standard or situation about which
they either have expectations, hoped would exist, or have seen in others' lives (Chamberlain,
1984; Deiner, 1984) . Beiser ( 1974) found three principal factors , negative affect, pleasurable
involvement and long term satisfaction. He believed these three factors represented an
affective dimension which is related to emotional and family ties . However, Grainger (1985)
believed this dimension to be closer to cognitive evaluation in the light of research. Bryant
and Veroff (1982) in a longitudinal study found a stable three-factor structure of positive
affect, negative affect and perceived competence in handling one's life. McKennell and
Andrews (1983) looked at models in terms of how cognition and affect operate in the
perception of well-being. The models which contained a cognitive factor were found to fit the
data better. They suggested that affect, unlike the cognitive dimension, is an immediate
feeling state not anchored to the same extent to cognitive frames of reference.
Subjective well-being has been discussed in relation to several different factors. It has been
predicted by some personality factors, for example, extroversion and neuroticism, locus of
control and self-esteem (Costa and MacCrae, 1980) . Unemployment has been found to reduce
subjective well-being (Campbell, Converse, and Rogers, 1984)., but it appears unrelated to
factors of psychological maturity (Costa and McCrae, op. cit.), gender (Andrews and Withey,
1976) , or intelligence (Deiner, 1984) . A positive but somewhat inconsistent relationship
between income and subjective well-being has also been found (Deiner, 1984). Other
identified predictors of subjective well-being have been marital status (Kammann, 1983) and
social contacts and friendships (Deiner, 1984). Employment or unemployment, and marriage
have been regarded as related to subjective well-being variables, but on their own have not

153
been expected to completely account for the relationships. Factors such as financial strains
and loss of status have been found to be associated with diminished subjective well-being
(Grainger, 1985).
Campbell, Converse and Rodgers ( 1976) highlighted the degree of self-esteem as a component
of a sense of well-being. They chose the word component to avoid definitively stating that
self-esteem is either a cause or an effect of well-being. They believed that feelings of self
esteem are established early in life and as such are more likely to be causative of current
satisfaction, but at the same time they acknowledged there probably is a major element of
reciprocal causation.
Both well-being and self-efficacy have been investigated together (Stumpf, Brief and Hartman,
1987) in an attempt to better understand how individuals become motivated to cope with
career-related stressful events such as the job interview. Psychological well-being, as indexed
by self-report, was found to be affected directly by the ways in which individuals cope and
indirectly through the development of positive efficacy expectations . Self-report measures of
coping showed reduced levels of psychological well-being accompany the use of emotion
focused ways of coping.
Deiner (1984) advocated the need both for the development of more theory and the
application of suitable methodology in the area of subjective well-being. The above discussion
shows support for the approach taken in the present research of exploring interrelationships
among subjective well-being, self-efficacy and locus of control variables .
5 . 1 .2 Personality: personality factors , and locus of control
The effect of personality factors on the process of work adjustment may be one of the most
important influences and one which has previously lacked emphasis. Personality factors would
be expected to help determine, firstly, the work needs which are important to any one
individual, and secondly, the part an individual can play in having their needs met. With
respect to the part the individual may play, two important personality related factors could
be, the degree of individual self-confidence or self-efficacy about having needs met and their
locus of control (the degree of control over having their needs met) .
154
Anastasi (1964) indicated that research on occupational personality using need measures, as
opposed to interests, has frequently shown there to be gross differences among occupations.
However, these have appeared trivial in nature when compared to the differences among
members of the same occupation. It was suggested that the type of individuals for whom the
concept of the occupational personality might be the most appropriate are high self-esteem
'normals' and those for whom the concept might be least appropriate are so called low self
esteem, high self-dislike 'abnormals ' .
An approach in vocational psychology which has been primarily oriented towards personality
factors and their congruence with the work environment and which has generated much
research has been that of Holland (1973) . Of the more than 150 studies which used the theory
as a basis, over 90 of these offered some support (Lackey, 1975) . Taylor, Kelso, Cox,
Alloway and Mathews (1979) argued that Holland's theory, as described earlier, might be
generalisable to non-vocational behaviour.
Elton and Smart ( 1986) found job satisfaction to be positively related to congruence between
personality types of individuals and their environment (person-environment congruence) , as
consistent with that proposed by Holland (1965, 1973) . In contrast to earlier findings of
Mount and Muchinsky (1978) and Wiggens et al (1983), job satisfaction, however, was not
found to vary with personality type. Elton and Smart noted that reconciling the discrepancies
appears a problem, but that the type of measures used may in part help to explain those
differences . Mount and Muchinsky used measured interest to look at congruence whereas
Elton and Smart used respondent expressed or perceived congruence.
Smart contended that although Holland's theory provides a sound framework, several
refinements are needed. Multiple dimensions of job satisfaction were recommended because
person-environment fit hypotheses have not been found to be equally applicable to all
dimensions of job satisfaction. This finding also encourages the examination of Dawis and
Lofquist's need-reinforcer dimensions for their potentially differing effects on job satisfaction.
Further research was said to be required with respect to the gender specific findings and the
relationship between person-environment congruence and job satisfaction being gender
dependent. Also, non-linearity had been found in the relationship between person-environment
congruence and the extrinsic job satisfaction of males, involving income, fringe benefits and
job security .

155
In the case of recent graduates, personality dimensions, whether approached from a trait-state
or behavioural perspective, may be as important as or even more relevant to work adjustment
than Dawis and Lofquist's congruence of work needs and abilities with the work environment.
It may be difficult for a group of respondents to know which needs are important to them if
their work history shows little relevance to their position taken upon graduation. Even if their
work needs have matured they may undergo change in response to the situation of immense
change associated with graduation and employment. Instead, the broader categorisations of
Holland may be of more assistance in predicting congruence between the individual and the
environment.
A personality factor expected to influence individuals' adjustment to work is the degree to
which they tend to have control over their interaction with the work environment in terms of
the causal attributions they make about themselves . The concept of locus of control is
regarded as being based upon a social learning theory or 'interactionist' view of the
individual, the individual learning through past experience and 'modelling' . Locus of control ,
in referring to the amount of perceived control an individual has over a situation,
distinguishes between an internally oriented individual who believes that personal actions and
decisions influence outcomes and an e-rternally oriented individual who believes in fate or luck
as influencing outcomes. Scales such as that of Rotter (1966) assess where the locus of control
lies . Sutherland and Cooper (1988) reported that research has found the locus of control scale
to be multidimensional. Examples of different domains suggested were personal or socio
political. This is more readily apparent when outcomes are likely to be negative . They
regarded locus of control as only one expectancy construct which on its own should not
expect to account for a large proportion of the variance in any relationship. One important
aspect of self-esteem has been said to be the degree to which an individual feels in control
of his or her life as opposed to being subject to control by chance factors or external forces ,
such as the government or superiors . When measured in different social science contexts it
has become a strong predictor of many important social behaviours and noted as a possible
important moderator of self-efficacy. Locus of control has also been referred to as personal
competence (Campbell, Converse and Rodgers, 1976).
O'Brien ( 1986) categorised locus of control measures (along with self-efficacy measures) as
'personal control beliefs ' . He discussed his own work and that of others to conclude that
personal control beliefs have an effect on performance. 'Internals' tended to perform better

156
than 'externals' . However the effect of locus of control was found to depend upon the type
of situation and the ability of the individual . O'Brien postulated a model which specified the
manner in which locus of control, skill utilisation, influence (or degree of autonomy) and
ability could determine individual work performance. It was suggested that Ratter's scale be
revised to make it a better measure of generalized expectancies and to sample a wider range
of situations . Ratter's ( 1966) scale was found to have underlying factors of personal control
and system or political control . O 'Brien recommended that a revised scale classify situations
on the basis of the objective source of determination, that is, personal, structural, or a mixed
personal-structural source. O 'Brien warned that results of locus of control studies should not
be interpreted as indicating that ' internals ' are best. Such extreme individuals who believe all
situations can be determined by them could be inflexible and uncooperative. O 'Brien (op. cit.)
advocated more research relating to the 'realist' who "is able to differentiate between
situations where personal effort is effective and situations where structural factors preclude
individual freedom of movement" (p . 179) .
Work has been viewed as coercive from a sociological perspective (Friedmann and
Havighurst, 1954) and as involving the surrendering of control (Blauner, 1969) . Significant
cultural differences have been apparent in the need for control and for independence in
employment. In relation to different occupations, lack of control over work and its conditions
have been identified as the most pronounced for industrial workers . Blauner used the concept
of control in a vague manner to cover a wide range of phenomena. These included, control
over the use of one's time, control over physical movement, and freedom from hierarchal
authority or the control of others . These dimensions were recognised as being interrelated
such that an individual high in occupational status would tend to be high on these dimensions.
It was believed that the higher the degree of control the greater the job satisfaction. Skill was
viewed as control over the technological process of work. But the apparent contradiction of
a low-status occupation such as railroading in America exhibiting high job satisfaction was
thought to relate to the high degree of control of the incumbents, especially in terms of
freedom from supervision.
5 . 1 . 3 Relevant social factors: social relations, social support and social reference group
Korman (1971c) maintained that there is considerable evidence suggesting psychological needs
tend to be related to the social roles of an individual, whether the role is a level or a position
157
within an organisation. Occupational differences in job satisfaction have been explained in
part by an important factor, that of the nature of social relations on the job (Blauner, 1969).
Higher satisfaction was expected for workers who are members of an integrated group or
work team. The nature of the non-work association of workers was identified as a factor in
job satisfaction. Levels of satisfaction were found to be higher in industries where the types
of jobs, one example being mining, have resulted in workers making up an occupational
community, a residential area made up mainly of their fellow workers . These communities
can develop in response to conditions such as physical isolation, the nature of the work, or
atypical work hours. They can be characterised by workers socialising outside work hours
more than do a cross-section of other kinds of occupations . The workers tend to 'talk shop'
and occupational communities can become like little worlds in themselves .
It is believed that when workers know their eo-workers off the job that they will gain
increased social satisfactions on the job. Occupational isolation can instill a sense of pride and
devotion to that particular line of work. Workers are insulated from outsiders and from the
image the public have of their occupational status, an image which is often lower than their
own perception. The assembly line worker's work and nonwork activities tend to be separate
whereas the leisure and work interests of those in occupational communities are integrated to
a higher degree. Blauner argued that if the integration of work and non-work is as important
to general psychic adjustment in the way others have maintained, then workers in
occupational communities should show higher job satisfaction because the two are more
integrated in such communities.
For the recent graduate population, the degree to which social relations will affect their job
satisfaction would be expected to depend upon the type of occupation and the extent to which
off-the-job social contacts are established. The graduate population's job satisfaction might
be influenced by both their social reference group and their social support. As mainly young
adults their social relationships may also predominantly involve their peer group. As with
other occupational communities where they are working with their peers, work and nonwork
is better integrated and higher job satisfaction might be expected. Regardless of the extent of
work/non-work integration, however, such a group might be content with their level of job
satisfaction if it compares favourably with that of others in their reference group. Such a
notion is consistent with social reference group theory.

158
Social reference groups have been regarded as important in relation to subjective well-being
(Deiner, 1984) . Because of this, social reference groups could be expected to have a role to
play in work adjustment as well. This approach employs a similar framework to that of need
fulfilment theories, but takes as its point of departure not the desires, needs and interests of
an individual but the opinions and perspective of the 'group' to which the individual looks
for guidance. Such groups are defined as the reference group of an individual , serving to
define the way in which the world should be perceived and how various phenomena in the
environment should be evaluated (Korman, 1971c) .
According to this theory, individuals predict that if a job meets the interests , desires, and the
requirements of their reference group then the individuals will be satisfied with their job. It
could be argued that not all people will be influenced by group opinions and as such the
approach on its own would be an incomplete explanation of job satisfaction. Where the
individual is influenced by a reference group, a likely assumption for a graduate group, their
satisfaction may be affected by the extent to which a job situation matches a reference group's
conception of what is appropriate and proper for an individual in that group (Korman, 1971c) .
Little systematic knowledge exists about how people choose and accept reference groups as
a basis for evaluating themselves or their jobs . Individuals were thought to seek out those who
are similar to themselves in order to evaluate themselves clearly (Festinger, 1950; Patchen,
1961 ; and Pettigrew, 1967). Most of the research in the area has been aimed at demonstrating
the existence of reference groups and that they affect evaluation. Pettigrew (1967 op . cit.)
noted that many questions have been left unanswered such as : what kind of similarities affect
reference group selection? what are the areas of influence which different groups have and
how are these different among individuals? how do such influences alter over time and as a
function of different circumstances? and how do these different effects combine with each
other?
Early research tended to suggest the most important social influences are socio-economic class
(Centers and Bugental , 1966) , race (Bloom and Barry, 1967), urban or rural residence
(Katzell , Barrett and Parker, 1961) , national culture and location (suburban versus central city
residence) (Korman, 1971c) . In discussing the correlates and determinants of job satisfaction
generally, Korman believed the positive relationship between occupational level and job
satisfaction commonly found seems to stem in part from social-reference-group theory, in that
159
over all a society values some jobs more than others . He also suggested that jobs can increase
in range and spread of activities, the higher one climbs an occupational hierarchy. Greater
satisfaction can then result, for these reasons, rather than the influence of the importance of
a job to the social reference group. Certainly more research is required relating to the
influence of social psychological variables, such as attitudes of parents , spouse, and friends
towards the work situation.
On the basis of reviews of the social support literature by Broadhead et al, (1983), Berkman
( 1986) and Pearson ( 1987) , Pearson concluded that social networks have played an important
role in physical health and emotional adjustment, and that social support has assisted
individuals to cope with change. Definitions of social support have been either affective or
process oriented (Gore, 198 1 ; Thoits, 1982; Leavy, 1983 ; House and Kahn, 1985; Kessler,
Price and Wortman, 1985; and Pearson, 1983). Vaux (1988) regarded social support as a
metaconstruct subsuming the theoretically distinguishable constructs of subjective appraisals
of support, specific supportive behaviour and support network resources . Rook ( 1990) in
reviewing Vaux's (1988) work concerning the theory, research and intervention concerned
with social support, recommended a balance in the need for both complexity and parsimony
in social support theory. This was in response to V aux advocating social support as a
metaconstruct. Social support was viewed not as a static property of person or environment
but as a dynamic transactional process with many contextual factors able to influence it.
Contextual factors included the composition of social networks, norms regarding help-seeking,
roles available to individuals in particular social settings and the physical design features of
some settings .
There has been a move away from focusing on simple undifferentiated models of social
support to an emphasis on increasingly intricate, context-specific models . Social support has
been found to vary as a function of gender and marital status . Ethnicity or socioeconomic
status have been found to moderate effects of marital status but not gender, but V aux was less
clear about the involvement of other moderators . The investigation of developmental
continuum and discontinuum in social support via longitudinal studies has been recommended
and the suggestion is that social networks expand throughout adolescence and young
adulthood then shrink with age. The implications for psychological well-being is thought to
be less well understood, (Vaux, 1988) .

160
House ( 1981) maintained that a supportive social relationship can reduce stress and improve
health by satisfying needs for affection, approval , social contact, and security, and act as a
buffer and effect modifier. Moderation effects of social support have been found to be specific
rather than general and perceived social support has been believed to influence subjective
reporting of stress and to operate as a confounding factor (Mackay and Cooper, 1987). La
Rocco, House and French (1980) did not find social support to moderate job-related strains
such as job dissatisfaction and boredom. Social support was found to influence the impact of
critical life events on depression and anxiety but only for individuals with an internal locus
of control (Sandler and Lakey, 1982). Support from the boss rather than the family has acted
as a buffer (Kobassa and Pucetti, 1983) . Support for buffering effects have been found in
some studies (Karasek, 1982; Abdel-Halirn, 1982; and Seers, McGee, Serey and Graen,
1983), but not in others (Aneshensel and Stone, 1982; Blau, 198 1 ; Ganellan and Blaney,
1984; and LaRocco and Jones, 1978) . Some of the critical factors have involved settings ,
measurement of stress , and locus and type of support (Henderson and Argyle, 1985) . The
availability of social support is said to be affected by factors such as ethnic and social class
values, expectations about helpers and helping, ability to reciprocate, self-disclosure, and
social competence (Gottlieb, 1983) . The new developments in types of social support all of
which have relevance for the graduate population are, networking, mentor relationships , peer
counselling and self-help groups (Pearson, 1987).
Social support has been identified as an important factor in subjective well-being (Viet and
Ware, 1983). In New Zealand studies, Voges (1984) found social support to affect employees
reaction to stress and to vary with housing and living circumstances . Social support was
recognised as an external moderator of stress in a particular group of New Zealand
occupations. Voges also found social support from a spouse to be the best at reducing the
effect of perceived stress on health. The high correlations between marital status and well
being that have been noted (Kamrnann, 1983) may have arisen in part from the support that
a marital relationship might offer.
The particular relevance of social support to a work adjustment theory is that it may act as
a moderator with respect to, in work adjustment theory terms, the amount of
discorrespondence an individual can tolerate in relation to the work environment before
initiating adjustment behaviour and the degree of perseverance with adjustment behaviour
1 6 1
before taking up the option of leaving the work environment. The moderators possibly
affecting social support itself, such as locus of control, also need to be considered.
5 . 1 . 4 Vocational factors: preference, choice and fantasy
Another construct potentially important to work adjustment for recent graduates is that of
vocational preference and its effect on the choice of vocation. The degree to which an
individual's occupation is similar to their fantasy about the occupation they would like to
pursue, the more an individual could be expected to be satisfied with their choice of
occupation. One might also expect an association between fantasy occupation and type of
leisure activities chosen. Leisure may begin to compensate for being in a job different from
the fantasy position, the interaction of leisure and work is discussed further in section 5 . 1 . 5 .
Job satisfaction itself may be affected by the degree to which occupational fantasy matches
occupational choice; job satisfaction would be expected to increase as a job more closely
approximates or matches occupational fantasies .
The degree to which work adjustment is affected by job satisfaction and subjective well-being
may be affected by the degree to which an individual's vocational fantasies correspond to the
occupation they take up. This would suggest that those who experience high correspondence
between occupational choice and fantasy may at least initially be satisfied. However, if the
fantasy job does not meet expectations and other factors such as the needs are not reinforced,
or ability requirements of the environment differ from the individual's abilities (creating
correspondence problems) satisfaction from such a source may not endure.
5 . 1 .5 Non-work factors
Although the importance of non-work activities for work processes has been increasingly
recognised, Dawis and Lofquist have generally not taken them into account in their theory
of work adjustment. They have, however, examined one of the indicators of work adjustment
in relation to life satisfaction. In a study using the Minnesota Satisfaction Questionnaire, life
satisfaction was found to influence job satisfaction rather than the reverse (Weiss, England
and Lofquist, 1967) . Hackett, Lent and Greenhaus (1991) have observed that the
interdependence between work and non-work roles has formed the basis of other topics within
organisational behaviour research. The study of withdrawal behaviour was said to have
162
benefited from taking a multiple role approach. Job attitudes as the only determinants of work
withdrawal, have been replaced with absenteeism and turnover models which have recognised
withdrawal decisions as often being a response to non-work role demands (Steers and Rhodes,
1978; and Mobley, 1982). The potential influence of non-work factors has been recognised
by Nicholson (1984) in his emphasis on the role of non-work variables, such as changes in
family and community involvements .
The interdependence of work and family has been emphasised (Nieva, 1984, 1985) and
growing evidence of it found (Burke and Greenglass, 1987). The need for a two-part
approach to investigate life-space activities has been advocated (Shouksmith and Hesketh,
1986) and Burke and Greenglass (1987) noted that research supports the increasing
recognition of an open systems approach, that is , that events in one part of life are likely to
affect and be influenced by events in another sphere.
Greenhaus and Parasuramans (1986) expected the emphasis on work/non-work
interdependence to continue and they thought it desirable to apply the link to areas of job
design, career planning, organisational culture and the quality of work life. They expected
multiple role pressures to continue, and advocated further examination of the impact of
organisational and personal influences on the integration of work and non-work.
The relationship between work and non-work has been approached in a number of different
ways, not all of which allow a relationship between work adjustment and non-work to be fully
assessed. The variables which have been used to operationalise work aspects of the work/non
work relationship have included work satisfaction, work activities , work involvement, work
role demands , job satisfaction and work adjustment. The variables used relating to the non
work part of the relationship have been leisure activities , psychological well-being, personal
life stress , leisure satisfaction, life satisfaction, general adjustment, personal adjustment and
general satisfaction. The more recent term of subjective well-being seems to have replaced
the use of terms such as psychological adjustment and even general adjustment, in the same
way that the term work adjustment has superseded vocational adjustment.
Some terms , such as vocational adjustment and general adjustment, have subsumed other
variables. The criterion for vocational adjustment has been given as degree of satisfaction and
satisfactoriness (Heron, 1952a, 1952b, 1955), which is similar to Dawis and Lofquist's ( 1984)
163
definition of work adjustment. Similarly, Super (1957) defined general adjustment as a
composite of personal and social adjustment. The variables relating to a work/non-work
relationship have been paired in various ways in the literature and have often addressed
different questions.
Although the influence of activities external to work were examined by theorists such as
Super ( 1940, 1941), Kanter ( 1977) is credited with destroying the myth of the separate worlds
of work and family. An extensive body of research in the 1980s identified links between work
and non-work. A common pair of variables examined together were work satisfaction and
leisure. The debate about this relationship tended to examine the relative value of each
(McDaniels , 1977; Alien, 1980; Parker, 1983 ; Stothart, 1984; and Weiner and Hunt, 1983)
assuming a unitary and direct causal relationship between the two, (Brook, Kesha and George,
1987).
Three hypotheses, each gaining some support tended to emerge from this type of research.
One hypothesis, known as spillover or generalisation, had individuals engaging in leisure
e activities similar to their work. Another proposed a compensatory relationship which had
people choosing leisure activities which compensate for unfulflling work experiences . A third,
the segmentalist or neutral hypothesis, regarded work and leisure as distinct domains of life .
Since Wilensky (1960) first introduced the notions of compensation and spillover, most
studies, largely occurring in the early 1980s, debated the relative worth of the first two
hypotheses . Support has been found for the compensation hypothesis (Mansfield & Evans,
1975; and Snyder & Spreitzer, 1974), for the spillover hypothesis (Meissner, 197 1 ; Orpen,
1978; Rousseau, 1978; Evans and Bartolome, 1980; Staines, 1980; Kremer & Harpaz, 1982;
Crouter, 1984; and Jackson, Zedeck, and Summers, 1985) , and one or other of the
hypotheses conditional upon other factors (Champoux, 1978, 1980, 1981a; Payton-Miyazaki
and Brayfield, 1978; Melamed and Eichanan, 198 1 ; and Evans and Bartolome, 1986) .
Some findings have shown a negative spillover from work to non-work (Bartolorne and
Evans, 1980; and Jackson, Zedeck and Summers, 1985) such that a stressful work
environment can reduce the quality of family and personal life. Negative spillover, from non
work to work, has also been found (Crouter, 1984) . Evans and Bartolome (1980, 1984) found
support for their expansion of the spillover and compensation constructs to involve both
negative and positive spillover; the work and family could be in conflict with each other,

1 64
independent of each other, or satisfaction in one setting could be instrumental in maintaining
satisfaction in the other. Other studies supported the segmentalist hypothesis (Bacon, 1975;
and Gupta & Beehr, 1981) . One model of work/non-work stress (Greenhaus and
Parasuramans, 1986) looked at explaining relationships among stressors, stress and strain in
the two domains of work and non-work.
More sociologically oriented approaches have challenged the over-simplicity of the work/non
work dichotomy (Parker, 1971) with work and leisure instead being examined in terms of
roles, role activities , role involvement and subjective role reactions (Staines, 1980) . Structural
features, like community type, degree to which work and leisure activities are separated in
the community have been emphasised (Shamir and Ruskin, 1983). For Newman (1983), the
work/leisure distinction has been superseded by a triad made up of work, leisure and
consumption. A role conflict perspective looking at the demands of competing roles has been
adopted (Hackett, Lent & Greenhaus 1991) . The demands of the work role and the family are
seen to compete to the extent of being incompatible (Greenhaus and Beutell , 1985) . This
assumption has guided research to focus upon negative features of spill over. Positive aspects
of multiple roles have been the focus of an alternative approach (Marks, 1977; and Sieber,
1 974) . Multiple roles have been regarded as promoting emotional well-being (Thoits , 1983) .
O 'Brien, Dowling and Kabanoff (1978) had already concluded there were weak and confusing
levels of support for the compensation, generalisation and segmentation approaches. No
unequivocal support for either of the three major hypotheses has emerged (Zuzanek and
Mannell, 1983) to explain work/non-work relationships in all situations (Kabanoff, 1980) . In
investigating social status, job scope and personality variables , multiple determinants of non
work behaviour specific to social, political and religious segments of non-work life have been
found (Champoux ( 1981b). Also personality characteristics , such as the need for achievement,
were found to interact with job scope to affect the work non-work relationship (Champoux,
1981b).
Zuzanek and Mannell ( 1983) have advocated more complex and flexible research designs
viewing work-leisure relationships as reciprocal and multi-dimensional while proposing
demographic and cognitive moderating variables. With respect to relationships between work
and family, these have been identified as compensatory, reciprocal, and independent. A
further three called incompatible, instrumental (one setting is instrumental in gaining what is

165
desired in the other) and integrative, have been added (Payton-Miyazaki and Brayfield, 1 976) .
Rather than searching for a single model to explain work and non-work relationships , Burke
and Greenglass (1987) recommended placing emphasis on understanding psychological and
social factors, such as marital status and stages in both life and career cycles . Adopting a
developmental perspective may be of relevance in studying populations representative of
different stages, such as a recent university graduate population. Relevant also would be
Evans and Bartolome's (1984) moderating factors of emotional outcomes of work and the
importance of work in the life of an individual, both of which could vary with career stage.
In Kabanoff's (1980) review (highly regarded by Landy, 1985) of the work/non-work
relationship, a broader view of satisfaction was recommended. An understanding of the
complex relationship between work and leisure was expected to come from the identification
of patterns of activity and satisfaction based on work, leisure and family pursuits .
In the work/non-work relationship, Korman (1980) focused on the effect of unrealistic
expectations on behaviour and happiness and the depression that can accompany success.
Indiyiduals can be ill-prepared for success and find it to be in conflict with their goals .
Contrary to their expectations success can allow individuals less time with family and friends,
thus potentially leading to a deterioration in health and to less self-determination.
Rather than simply looking at the relationship between work and non-work, the contribution
of job and leisure to the overall quality of life perceptions has been examined. The attempt
is usually made to establish the predictive uses of work and leisure and their relative
importance to individuals . With the exception of disadvantaged groups, individuals have
tended to segment their experiences (London, Candall and Seals, 1977). Leisure satisfaction
was found to better predict life satisfaction than job satisfaction (Near, Rice and Hunt, 1 978;
and Rice, Near and Hunt, 1979). American university students were found to be more
positively oriented towards leisure than work, and a representative sample of the American
workforce stated a willingness to exchange future pay increases for more non-work time
(Best, 1980) . In the New Zealand context, Stothart ( 1984) regarded leisure as undervalued
and recommended it be regarded as essential to balanced development and personal
satisfaction. Shouksmith and Hesketh (1986) in their two-part approach to life-space activities,
viewed adjustment and psychological well-being as dependent upon total life activity being
166
congruent with and therefore satisfying the individual's main needs. Such an approach could
be viewed as an application of work adjustment theory to the general adjustment process .
In the early research work adjustment was regarded as one aspect of other partially
interrelated aspects of general adjustment (Super, 1951) and as a function of it (Pruette and
Fryer, 1923 ; Fisher and Hanna, 193 1 ; Paterson and Daley, 1936; Menninger, 1942; Shafer
and Shoben, 1953; Clark, 1953). Others maintained they were not related under certain
conditions (Gellman, 1953) , such as the less debilitating types of mental illness (Ginzberg,
1962) . Moreover, only moderate correlation between the two adjustment constructs has been
found (Super, 1957; Hoppock, 1963) .
The direction of the relationship between work and general adjustment has been assessed.
Hoppock (1963) argued against assuming all work maladjustment is caused by emotional
maladjustment and for a reverse relationship in some cases. Shouksmith and Hesketh (1986)
in a sample of New Zealand veterinarians found that although job satisfaction and mental
health were related to the nature of the job, lack of factors positively related to these did not
affect overall adjustment. Life satisfaction was obtained through non-work activities instead.
Adjustment was believed to depend on factors like the degree to which needs could be
satisfied and how aspects of job and lifestyle were valued. The relationship between such
value systems and general well-being were moderated by factors such as gender, variety in
a job and control over job activities .
A relationship between job satisfaction and well-being or general adjustment, has been found
(Oates, 197 1) in some cases, and not in others (London et al. , 1970) . Landy (1989) noted the
assumption that job satisfaction influenced life satisfaction has not been generally supported.
But life satisfaction has been found to affect job satisfaction (Orpen, 1978). Campbell ,
Converse and Rodgers ( 1976) investigated domains of life experience or quality of life
variables in relation to subjective well-being using a national American sample. Using
smallest space analysis of the intercorrelations of domains they found satisfaction with non
work activities to be the domain closest to their index of well-being. The next closest in order
were financial concerns, then work, which included housework. The domain of satisfaction
with work was found to be one of the strongest predictors of well-being. The friendship
domain was less central . Early adulthood friendship patterns , as expected in a graduate
167
sample perhaps, were found to be relatively open and often determined by factors such as
physical proximity.
Of the many models of the relationship between satisfaction domains and well-being,
Campbell, Converse and Rodgers (1976) concluded that a weighted summation of satisfaction
domains best represented the relationship. A linear additive model was found to be
appropriate, such that dissatisfaction with one domain could be compensated for by
satisfaction with other domains. Their set of seventeen domain scores were found to account
for about 10 percent more of the variance in well-being for a group of college graduates and
professionals , to about 63 percent.
Self-reports of importance of the various domains did not perform well as weighting factors .
It was thought that the reason was because they are less stable than satisfaction measures ,
because individuals change their minds about the importance of different domains and that the
measures contain uncommon error. Domains were also expected to differ in importance as
life circumstances change. Campbell, Converse and Rodgers concluded that global reports of
well-being can be regarded as composite measures of satisfaction and dissatisfaction of a
range of more specific domains of life . They noted that both global and specific domain
measures were biased towards positive reports , which is consistent with Zarjonc's (1968)
findings that the frequency of positive words in the English language vastly outnumber
negative ones . They found the more intensely personal domains attracted greater bias .
Certainly Kabanoff's ( 1980) suggestion that a broader view of satisfaction be taken to
facilitate understanding the complex work/non-work relationship should be taken up . In this
way patterns of activity and satisfaction associated with work, leisure and family pursuits
would be examined. The role of leisure activities in work adjustment should be continually
examined in a context where the nature of work is changing, and when individuals are in any
stage of transition in their career, such as recent graduates are. Such an approach of
interdependence is also consistent with the highly valued systems perspective.
Unlike Dawis and Lofquist's earlier work the present study examined the effect of the wider
non-work environment on work and the relative importance of work and non-work. When a
new position is taken up, previous general and work adjustment would be expected to have
a role to play in work adjustment. Factors such as gender, importance of work, stage of

168
employment, and value systems might therefore be examples of moderators in the relationship
between work and previous adjustment, general and/or work adjustment. The potential of the
relative importance of work to moderate the effect of work and non-work factors on work
adjustment was of special interest.
5.2 Aims of the present study
Within the general aim of the study to test aspects of Dawis and Lofquist's work adjustment
as applied to a particular respondent group (recent graduates from a variety of academic
disciplines in the early stages of their employment) there were four specific aims . Briefly, the
first of such aims was to examine certain Dawis and Lofquist's propositions . The second
specific aim, in response to the potential limitations of Dawis and Lofquist's theory as
identified in the process of reviewing the literature, was to consider the effect of including
previously omitted but potentially important concepts . These were the cognitive, social,
vocational and non-work factors. The third specific aim was to examine the structural
relations among the key concepts of Dawis and Lofquist' s basic paradigm (as shown in Figure
5 .3) , in an attempt to develop a structural model representing the co-variances of the various
factors included. It was hoped to develop such a model using LISREL statistical analysis
techniques described in Joreskog and Sorbum (1984), Saris and Stonkhorst (1984) , and
Hayduk ( 1987) . The fourth specific aim was to examine the factor or latent structure of work
needs using factor analysis and LISREL, where appropriate. The time at which the variables
of the research propositions and hypotheses were measured are given in Table 5 . 1 .
5 .2. 1 Aim 1 : An examination of Dawis and Lofquist' s propositions
A complete list of the propositions of Dawis and Lofquist' s theory is detailed in Tables 3 . 1
and 3 .2 in section 3 .3 . 1 . Those propositions selected for investigation in the present study are
shown together with their interrelationships , as suggested by Dawis and Lofquist, in Figures
5 . 1 (Propositions I to IX) and 5.2 (Propositions XI to XVII) . Excluded from investigation
were most of the propositions which entailed measures needing to be obtained from the work
environment, such as the work environment adjustment styles .

Ability-Requirement 1 II -satisfactoriness ---VI_,. Fire
correspondence ~ Work environment Retain
style
IX
X
style
Value-Reinforcer
correspondence
�
Remain
ID - Satisfaction---- VII � Quit
169
Figure 5 . 1 A Causal Flow chart of the Theory of Work Adjustment (first ten
propositions).
The propositions included for examination were mainly those concerned with needs-reinforcer
correspondence, and its effects on job satisfaction and tenure. Some of the propositions
involving the work environment concept of satisfactoriness were examined but Dawis and
Lofquist's instruments could not be used for satisfactoriness in the present study because to
do so would have necessitated taking measures from supervisors or others in the work place.
Instead satisfactoriness was operationalised using measures of self-perceived satisfactoriness .
Similarly, a selection of ability-requirements was investigated using self-perceived measures

170
Table 5 . 1 Time at which variables were measured
Stage One of Research Stage Two of Research
Background data Age, Gender, Where living Marital status, Occupation Children Own salary, friends' salaries Citizenship Course of study Secondary schooling Future occupational plans Parental income & Friends ' jobs qualifications Work history Accommodation, Health
Work and qualification plans Work and qualification plans
Salary expectations
Job fantasies
Work needs (MIQ) Importance of 20 work needs
Self-efficacy for Obtaining work needs Self-efficacy for Obtaining work needs Being satisfactory Being satisfactory Adjustment style use Adjustment style use Lifestyle fits j ob Lifestyle fits job
Leisure company and activities Leisure company and activities
Subjective well-being Subjective well-being
Happiness Happiness
Health Health
Life satisfaction Life satisfaction
Personal competence/Locus of control Personal competence/Locus of control
Friendship patterns Friendship patterns
Vocational Preference Inventory Vocational Preference Inventory
Self-efficacy for use of adjustment styles Adjustment Style self-efficacy and use
Job satisfaction (MSQ)
Relative importance of leisure and work
Satisfaction with and importance of various domains (quality of life)
Social support
Tenure related Expected tenure measures Job attachment
Job's usual tenure
171
rather than those of Dawis and Lofquist. The propositions investigated are listed below, stated
in the manner in which they were tested in the present research with the modifications to
Dawis and Lofquist's wording in italics . The propositions can be grouped together according
to the constructs they concern. Some relate mainly to job satisfaction, others involve variables
which are believed to moderate these relationships , and a third group relate to the joint effects
of job satisfaction and satisfactoriness on tenure and work adjustment.
Job satisfaction propositions
In the following propositions job satisfaction was measured by the Minnesota Satisfaction
Questionnaire (MSQ) at stage two of the study, about six months into the first year of
employment after the final year of study. Work values were measured by the Minnesota
hnportance Questionnaire (MIQ) at stage one of the study, the few months prior to
graduation. Work reinforcers were measured at stage two and using a checklist requiring a
Y.§ or no answer as to the presence of the different reinforcers for workers in their job . The
correspondence between work values and reinforcers was measured by taking the square of
the difference between the reinforcers present and the importance of that particular need for
each individual . Voluntarily leaving the work force (or the likelihood of this) was measured
by low expected tenure. Expected tenure was how long respondents expected to remain in
their present job. Adjustment modes were operationalised asking respondents the extent to
which they used each of the modes of active, reactive, perseverance and flexibility.
Proposition Ill was " Satisfaction is a function of the correspondence between the perceived
reinforcer pattern of the work environment and the individual's values, provided that the
individual 's abilities correspond to the perceived ability requirements of the work
environment" (Dawis and Lofquist, 1984, p 60) .
Proposition VII was "The probability that an individual will voluntarily leave the work
environment (demonstrate low expected tenure) is inversely related to the individual's
satisfaction" (Dawis and Lofquist, op. cit. p.60.) .
Proposition XIV was "The probability that the individual will use adjustment modes is
inversely related to the individual's satisfaction" (Dawis and Lofquist, op . cit. p 67) .
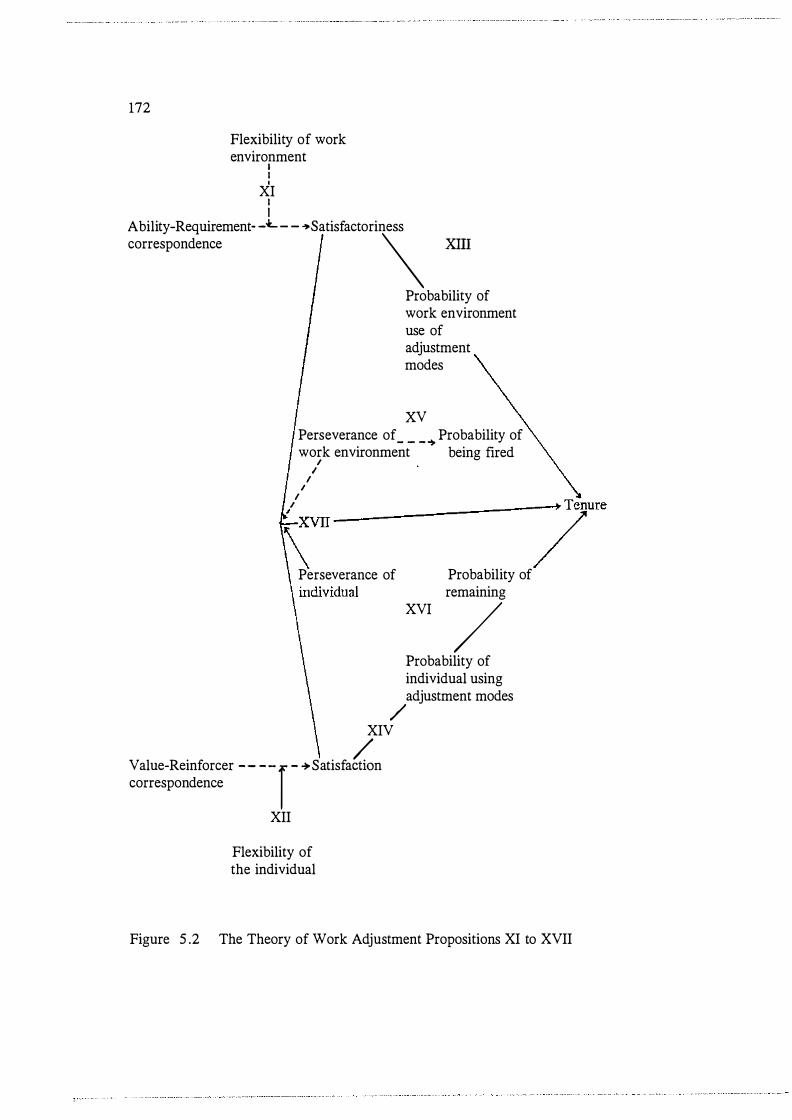
172
Flexibility of work environment I I I
XI I I
Ability-Requirement- --L - - �satisfactoriness correspondence \ xm
Probability of work environment use of adjustment modes
XV Perseverance of _ _ _ � Probability of work environment being fired I I I I
I I I 1\XVll Perseverance of
/ XIV
Value-Reinforcer -- --r - + Satisfa�n correspondence
XII
Flexibility of the individual
Probability of remaining
XVI / Probability of individual using adjustment modes
lure
Figure 5 .2 The Theory of Work Adjustment Propositions XI to XVII
173
The Moderating relationships
Proposition V was "Self-reported satisfactoriness moderates the functional relationship
between satisfaction and value-perceived reinforcer correspondence. " , Dawis and Lofquist,
op. cit. p. 60).
Satisfactoriness was operationalised, as described in the section concerned with the
instrumentation, by using a measure of self-rating of satisfactoriness developed from items
of the Minnesota Satisfactoriness Scales (MSS).
Proposition XII was "The flexibility of the individual moderates the functional relationship
between satisfaction and value-perceived reinforcer correspondence" (Dawis and Lofquist,
op .cit. p 67).
Job satisfaction and satisfactoriness together
Proposition I was "Work adjustment at any time is indicated by an individual 's concurrent
levels of self-reported satisfactoriness and satisfaction" (Dawis and Lofquist, op. cit. p . 60) .
Proposition VIII was "Expected tenure is a joint function of self-reported satisfactoriness and
satisfaction" (Dawis and Lofquist, op. cit. p. 61). (This is a combination of VI and VII, that
is , the probability that an individual will be forced out of the work and the probability that
an individual will voluntarily leave the work environment is inversely related to the
individual's satisfaction) .
Proposition XVII was , that is "given proposition VIII, XV ("The probability that the work
environment will act to remove the individual is inversely related to the perseverance level
of that work environment" Dawis and Lofquist, op. cit. p. 67) , and XVI it follows that:
"Expected tenure is a function of satisfactoriness, satisfaction, and the perseverance levels of
the individual and of the work environment" (Dawis and Lofquist, op. cit. p. 68) .
In their wording, Proposition I and VIII appeared very similar. Proposition I stated that
"Work adjustment at any time is indicated by an individual's concurrent levels of
satisfactoriness and satisfaction" and Proposition VIII stated that "Tenure is a joint function

174
of satisfactoriness and satisfaction" . The concept of work adjustment itself is not presented
on any of Dawis and Lofquist's diagrams to help distinguish between the two. However,
Proposition I seems to represent the dynamic and on-going process of work adjustment by
emphasising the potential for differences in levels of work adjustment which are dependent
upon the concurrent levels of satisfaction and satisfactoriness . Work adjustment is viewed as
an outcome of work satisfaction and satisfactoriness , without reference to tenure. Proposition
VIII on the other hand appears to propose tenure as an outcome of achieving satisfaction and
satisfactoriness . Dawis and Lofquist appear to be saying levels of satisfaction and
satisfactoriness both indicate degree of work adjustment and determine tenure. However, in
Proposition I satisfaction and satisfactoriness seem to be treated as indicators or variables
which are associated with work adjustment and which allow its level to be assessed. Whilst,
in the case of Proposition VIII, satisfaction and satisfactoriness are treated as independent
variables causing tenure.
Dawis and Lofquist's definition of work adjustment and tenure help clarify the similarities and
the differences between the two propositions. "The continuous and dynamic process by which
the individual seeks to achieve and maintain correspondence with the environment is called
work adjustment" (Dawis and Lofquist, 1984, p 55). Work adjustment refers to attempting
to gain correspondence and to maintaining it once achieved. Therefore, Proposition I focuses
on achieving and maintaining correspondence. With respect to tenure, it is regarded as the
most basic indicator of correspondence and the achievement of correspondence is said to
enable an individual to remain in an environment and therefore achieve further
correspondence until the correspondent relationship becomes stable. The stability of
correspondence between the individual and the work environment was expected to be
manifested as tenure on the job . Therefore tenure, like work adjustment, is regarded as an
indicator of achieving and maintaining correspondence. Proposition VIII focuses on tenure
both as an outcome of correspondence and an indicator of the stability of correspondence. The
propositions are similar in that they both focus on maintaining correspondence, but
Proposition I looks at achieving it to attain work adjustment whilst Proposition VIII looks at
its outcome (tenure) .
Not only do the two propositions differ in terms of which constructs they focus on but also
in terms of which part of the work adjustment model they refer to . In addition, the two
concepts which are at the centre of the difficulty in distinguishing between the propositions,
175
that is tenure and work adjustment, themselves are different substantively. Proposition I seems
to refer to the point in the process involving levels of satisfaction and satisfactoriness
(achieved through correspondence) as indicators of degree of work adjustment and Proposition
VIII refers to the point at which satisfactoriness and satisfaction determine tenure. Because
tenure further affects the correspondent relationship it also indirectly acts as an indicator of
further work adjustment. Proposition I refers to an earlier part of the process, at the levels
of satisfaction and satisfactoriness whilst Proposition VIII refers to the next point in the
process , tenure. Although both tenure and work adjustment appear to have similar effects in
the model, Dawis and Lofquist's use of two different words tends to indicate they did not
equate them. On the face of it, tenure would appear to refer simply to information about
length of time on the job whereas work adjustment would refer to the state (physical and
psychological) or response to the job. It is unfortunate that Dawis and Lofquist did not
include work adjustment in the diagrams of their theory as this would have helped clarify the
differences and similarities between the two propositions .
5 .2 .2 Aim 2: To investigate potentially important missing variables and their
interrelationships .
Hypothesis 1: Given Dawis and Lofquist' s proposition XVI (The probability that the
individual will act to leave the environment is inversely related to the
perseverance level of that individual) tenure is also a function of use
of adjustment styles .
An estimate of voluntarily leaving the work place was taken by measuring expected tenure,
respondents were asked the time they expected to remain in the job. Adjustment styles were
measured by asking respondents whether they were active, reactive flexible and persevered :,
and about their celerity, pace, rhythm and endurance on a rating scale of 1 to 7 .
Hypothesis 2 : Locus of control (as measured by Converse, Campbell and Rodgers's
Personal Competence Scale) is a function of those aspects of
personality measured by Holland's (1965) Vocational Preference
Scale.
176
Hypothesis 3:
Hypothesis 4:
Hypothesis 5:
Hypothesis 6:
Hypothesis 7:
Hypothesis 8:
Hypothesis 9:
Self-efficacy for obtaining work needs (using the instrument developed
for this study and discussed in the instrument section) is a function
of locus of control (as measured by the Personal Competence Scale) .
Self-efficacy for the use of adjustment styles (measured as in
hypothesis 1) is a function of locus of control (as measured in
hypothesis 2) .
Use of differing adjustment styles is a joint function of locus of
control and self-efficacy for use of adjustment styles .
Job satisfaction is a function of (a) vocational preference/training
correspondence (a score on Holland's VPI was compared to the
position trained for) ; (b) perceived satisfaction, (as measured by the
Minnesota satisfaction Questionnaire (MSQ)) ; (c) social reference
group, (a measure of respondent's job satisfaction compared with that
of their friends); and (d) the degree of social support as
operationalised by the social support instrument and group of
questions described in the instruments section.
Non-employment satisfaction ( operationalised by a question asking the
degree of non-employment satisfaction on a scale of 1 to 7) is a
function of (a) the number of leisure activities and (b) the degree of
social support (as measured in the previous hypothesis) .
Subjective well-being ( operationalised by Camp bell, Converse and
Rodgers' indices as described in the instrument section) is a function
of; (a) employment satisfaction (as measured by degree of satisfaction
on a scale of 1 to 7); (b) the degree of social support; (c) non
employment satisfaction (as previously measured in the above
hypotheses); and (d) health (self-ratings of health) .
The relationship between employment satisfaction and subjective well
being is moderated by the relative importance of work (as measured

Hypothesis 10:
Hypothesis 11 :
177
by respondents rating the relative importance of work and non-work) .
Employment satisfaction is expected to have less of an effect upon
subjective well-being where employment is considered less important
than leisure activities .
Job satisfaction (as operationalised by the MSQ, individual scores on
each of satisfaction areas and a composite score, known as general
satisfaction, of a number of the satisfactions) is a function of degree
of correspondence between occupational fantasy (a measure of the
positions or positions respondents would take up if there were no
obstacles) and occupational reality.
Job satisfaction is a function of the degree of correspondence between
planned occupation (occupation planned the previous year) and actual
occupation (position taken up upon graduation) .
5 .2 .3 Aim 3 : Investigating structural relationships among Dawis and Lofquist' s key
concepts using LISREL
Dawis and Lofquist' s model has not been investigated using a statistical technique which
examines the whole model, or even the relationships among its key concepts, at once.
Although not all of the constructs of the basic paradigm were operationalised using Dawis and
Lofquist's measurement instruments, other operationalisations were available in the present
study to investigate the paradigm using LISREL. The LISREL technique was used in relation
to this and the fourth research aim (although different models of LISREL were involved in
each case, the general model and the confirmatory factor analytic model, respectively) . A
description of LISREL and a justification for its use follows whilst the mathematical
representation of LISREL is given in Appendix K.
A description of LISREL
The LISREL model (Joreskog, 1973 ; Joreskog and van Thillo, 1972; and Wiley 1973) has
been referred to also as an analysis of covariance structures, a linear structural relations
model, the moments structure model, latent variable equation systems in structured linear

178
models , but is most commonly known as LISREL (an acronym for Linear Structural
Relationships) , or the Covariance structure model .
Models can be estimated by the use of sophisticated software. A most frequently used
programme to assess structural relations has been LISREL (Joreskog and Sorbom, 198 1 ,
1984) . The importance of this programme is evident b y the fact that the term LISREL has
come to represent not only the computer software but also the statistical model and the
approach to the analysis of data.
It is not easy to give a definition and description of LISREL which is both accurate and not
over-simplified without resorting to mathematics. However, the following description is an
attempt to do this while the mathematical representation is given in Appendix K. Hayduk
(1984) has also noted that description of LISREL remains opaque until it is applied to a real
model .
LISREL is a computer programme for estimating unknown coefficients in a set of linear
structural equations . Structural equation models1 are models of relationships among variables .
The variables in the equation system may be either directly observed variables (indicators)
or unmeasured latent variables (hypothetical construct variables) which are not observed but
related to observed variables . It has long been recognised that variable values gathered during
data collection do not exactly correspond to the variables of theoretical interest. The
discrepancy between desired and achieved measurements is typically considered under topics
of reliability and validity. Each latent variable, construct or concept is classified as
endogenous or exogenous. If a concept always acts as a 'cause' in the model and never as an
'effect' then it is labelled exogenous . If a concept acts as a 'cause' in one link among
relationships and as an 'effect' in another, it is labelled endogenous because it has not always
acted as a 'cause' in that model .
The computer programme is based on a general model which is particularly designed to
handle models with latent variables, measurement errors and reciprocal causation. In its most
general form the model assumes that there is a causal structure among a set of latent
1 The equation Y = a + Bx is a structural equation and the coefficients a and b are structural coefficients . Hayduk (1984) notes it is sometimes of assistance to consider such equations as structural equation models , "the term 'models ' is usually not applied until at least two equations simultaneously describe the set of variables under consideration" (p 25).

179
variables . The latent variables appear as underlying causes of the observed variables . Latent
variables can also be treated as caused by observed variables or as intervening variables in a causal chain. Other submodels of LISREL allow the analysis of different models.
The LISREL model consists of two parts : the measurement model and the structural model.
The measurement model specifies how the latent variables or hypothetical constructs are
measured in terms of the observed variables and is used to describe the measurement
properties (validities and reliabilities) of the observed variables . The structural equation model
specifies the causal relationships among the latent variables and is used to describe the causal
effects and the amount of unexplained variance. Equations involving variables imply links
between the distributions of those variables and, in particular, how the structural coefficients
in equations control various aspects such as the locatior?- and spread3 of the variables
concerned.
The means, variances and covariances4, of the observed indicator variables make up the
known data which are used in the estimation of the unknowns which are the means, variances
and covariances of the concepts , the structural coefficients among the concepts and the
structural coefficients linking the concepts to the indicators . LISREL can be described using
three basic equations and four additional covariance matrices which provide a general mould
into which it is claimed that almost any model can be fitted. The matrices are denoted by
Greek letters . The three basic equations are structural equations indicating how the scores on
2 "The location of a distribution is determined by the kind of x values likely to appear. The likelihood or probability, p(x;), of any particular value xi appearing is defined and calculated as the frequency with which that value appears (jiJ divided by the total frequency (N); hence p(x;) = f/N. " (Hayduk, 1984, p 3-4). The combined set of variable values and accompanying probabilities are called a random variable by statisticians. 'Random' refers to the hypothetical random selection grounding the probabilities and 'variable' refers to the dimension underlying the particular set of values . The best guess of the value of the randomly selected case is the mean.
3 To find out how correct the best guess of a randomly selected value might be we consider the spread of cases which is provided by the variance, the average or expected value of the squared (to avoid positive and negative deviations cancelling out) deviations from the mean.
4 Covariance between two variables (X and Y) is defined and calculated as the expected value (average size) of the product of the deviations of the X and Y scores from their respective means .

180
some variables (X, for example) can be obtained as the weighted sum of the other variables
(exogenous, endogenous and error variables). If one or more variables can be created as
weighted sums of other variables, the variances and covariances of the created variables can
be expressed as functions of the structural equations which link the variables with the
variances and covariances among the original variables .
We can ask, what is implied about the variances and covariances among the observed x and
y indicators if these variables function in the way indicated by the structural equations of the
LISREL model (and the four extra matrices as shown in Appendix K figure K. 1)? In
Appendix K these are equations 1 , 2 , 3 and the four extra matrices are the
variance/covariance matrix for the exogenous concepts and the matrices for the covariance
among error terms in the three equations (the structural equation, the x and the y measurement
equations). The model-implied variance and covariances of the observed indicators , which are
recorded in a covariance matrix called sigma, can be compared to the variances and
covariances calculated from the data on the observed indicators . This comparison of the
model's predictions (sigma) with observed reality (the actual observed covariances) provides
the fundamental basis for testing the particular model's adequacy and for obtaining reasonable
estimates of the coefficients of the model .
In applying LISREL the process is one of specifying a model, estimating its coefficients (the
computer programme employing an iterative technique such as Generalised Least Squares or
the Maximum Likelihood Procedure), then assessing the adequacy of the estimated model .
Using chi-square, the fit between a matrix of variances and covariances that the model would
imply and the observed data variances and covariance matrix is assessed. Smaller )(2 values
indicate better fitting models and a nonsignificant )(2 is desirable. Degrees of freedom for the
chi-squares are calculated as the difference between the total number of unique entries in the
covariance matrix (of the observed variances and covariances) and the total number of the
coefficients in the model5• Finding a nonsignificant chi-square is not said to prove that the
right model has been located, it instead shows a model has been located and a set of
coefficients that are consistent with the observed covariances . However, it does show that the
model has survived a challenge that many models do not.
5 d.f. = l/2[(p + q)(p + q + 1)] - t, where t is the total number of estimated coefficients, p + q is the total number of observed indicators (p endogenous , q exogenous) .

1 8 1
The chi-square test assessing the fit between the model implied matrix and the observed
matrix provides an omnibus test of the model6• If maximum likelihood estimation is used we
can claim that the estimates maximise the likelihood of the observed matrix arising as a
sampling fluctuation around the model implied matrix. LISREL creates maximum likelihood
estimates by selecting as estimates those coefficient values implying a variance eo-variance
matrix (a model-implied matrix) which maximises the likelihood that the observed data
variances and covariances could arise by chance sampling fluctuations. If more than one set
of coefficient estimates imply the same best fit we have encountered the identification
problem.
Maximum Likelihood estimates result from a combination of model and data constraints. The
theoretical model constrains the estimates by specifying the variables included in the model
and the location of the free coefficients linking the variables. The data constrains the estimates
s�ce comparison of the model-and-estimate implied matrix of variances and covariances with
the data matrix ultimately selects the best set of coefficient estimates.
The general LISREL model subsumes many other models as special cases. A submodel is
obtained when one or more of the y-variables, the x-variables, the 17-variables, or the � -
variables are not included. Some of the more common submodels are (1) specifying only
latent variables (this is a " measurement model " or factor analytic model), (2) specifying only
the x and y variables (a structural equation model for directly observed variables) and (3)
specifying only the y-variables, the endogenous and the exogenous variables. This third
submodel is a second-order factor analysis model with first-order factor loadings given by the
coefficient linking observed variables and endogenous variables (namely, lambda) and second
order factor loadings given by gamma (a coefficient linking the exogenous variables to
endogenous variables).
The LISREL model covers a wide range of models, for example those of particular relevance
for psychology are, exploratory and confirmatory factor analysis models, path analysis
models, recursive and non-recursive models for cross-sectional and longitudinal data and
covariance structure models. Using factor analytic models to illustrate one use of LISREL,
a distinction between exploratory and confirmatory factor analysis needs to be made. The
6 Tests of significance for single coefficients are made via t-tests or as a special instance of the difference between chi-squares for nested models.
182
basic idea underlying factor analysis of either type is that some variables of interest cannot
be observed directly. Information about these latent variables or factors can be obtained
indirectly by noting their effects upon observed variables . The factor analytic procedure
uncovers a smaller number of latent variables by examining the covariation among a set of
observed variables . The exploratory factor model consists of common factors (their effects
are shared in common with more than one of the observed variables) and unique factors (or
errors) the effects of which are unique to one and only one observed variable. These unique
factors are assumed to be uncorrelated with the common factors and with one another. This
model is referred to as exploratory because other than the specifications of the number of
common factors and observed variables to undergo analysis , the researcher does not specify
the structure of the relationship among the model's variables . It has been this model 's
inability to take into account substantively meaningful constraints and its imposition of
constraints which may be meaningless that has according to Long (1983a) earned it the label
of 'garbage in/garbage out' model .
In the confirmatory model, the common factors are assumed to be uncorrelated. In contrast,
the exploratory model assumes the common factors to be either all correlated or all
uncorrelated. In the confirmatory model, the observed variables are affected by only some
of the common factors rather than all as in the exploratory model . The confirmatory model
can allow correlations among 'unique' factors and observed variables do not have to have an
error factor associated with them. Where a single compelling model is not evident, or a model
suggested by theory does not fit, the confirmatory factor model can be used in an exploratory
fashion. The common factors in factor models are often of significant interest theoretically
and researchers are usually interested in the structural relations among these factors . While
the confirmatory factor model can provide correlations among common factors , these are
usually insufficient for determining what the structural parameters of interest are. It is the
estimation of structural parameters which requires that a structural equation model be applied
to the common factors (in the same way that structural equation models are often applied to
observed variables) . The incorporation of structural relations among latent variables can be
achieved by the covariance structure or LISREL model .
Although the confirmatory factor model is said to be limited by not allowing structural
relations among the common factors, it is still regarded as an extremely flexible model which
can deal with important applications such as: (1) measurement models in which latent

183
variables are estimated to exclude error in measurement, (2) multiple indicator models where
several indicators of the latent variables are available and the factor model is used to
determine the correlations among the common factors and (3) multimethod-multitrait models
where each factor is measured by various methods to attempt to eliminate the distorting
effects of methods of measurement.
Why use LISREL?
Part justification for the use of the LISREL model lies in the need to consider reliability and
validity issues. It is common knowledge in the social sciences that the values of variables
recorded through data collection do not correspond precisely to the variables of theoretical
concern. Discrepancy between desired and actual measurements have been usually confronted
by examining reliability and validity issues. Reliability estimates have assessed the stability
of replicated measurements, and validity estimates whether the measure is a true
representation of what it is supposed to measure as opposed to a measure of some similar but
conceptually distinct variable. Certainly the issue of measurement has been so central that
both the practitioners and the philosophers of science frequently treat the investigation of
measurement as synonymous with scientific progress (Blalock, 1982) . According to Hayduk
( 1987), however, discussions of measurement have characteristically degenerated into
recording the types of reliability and validity which is simply listing the different forms of
replication, re-test, inter-item and split-half, and the strategies for checking measures, face
validity, construct validity and criterion or predictive validity. Hayduk has argued that
discussions of measurement often are separate from other stages of research, those of
theorising, model development and model estimation.
Hayduk referred to considering latent versus measured variables as a new way of thinking.
LISREL represents an integration of measurement considerations with structural equation
modelling, by incorporating both latent theoretical concepts and observed or measured
indicator variables into the one structural equation model . Knowledge of the methodological
adequacy of the process of gathering data, in particular the quality of particular measurement
issues and questionnaire items, can be directly incorporated into LISREL models . This is
achieved by specifying, or fixing, a proportion of the variance in an indicator variable to be
error variance. In this way measurement concerns become an integral part of model
development, estimation, evaluation and interpretation concerns .
184
LISREL in its body of statistical theory and computer programme makes it possible to fit a
wide range of structural models to observed variance/covariance matrices . Hayduk (1987)
claimed LISREL's three basic equations which contain four matrices of coefficients and its
four additional covariance matrices (the general structural equation model summarised in
Appendix K) allow almost any model to be fitted. The three basic equations require that all
concepts or latent variables are classified as either endogenous or exogenous. As defined
previously, a concept is classified as endogenous if it ever appears as the effect or dependent
variable. If a concept always acts as a cause and never as an effect or dependent variable, it
is classified as exogenous. Fluctuations in its values are not the object of explanation by the
model, although they may be used to explain fluctuations in the values of the endogenous
concepts . Hayduk noted that 'cause' is used to mean that we are imagining a system in which
the dependent concept's values are derivable from or determined by the values of other
concepts . Causation is regarded as part of our abstract conceptual system and not necessarily
as a property of the real world.
While structural equation models describe causal theory of the structure of a set of variables
in terms of an explicit solvable set of linear equations, Fergusson and Horwood (1986) noted
that structural equation models seldom provide a direct test of causal assumptions on which
models are based. They argued it is better to think of the models as a formal statement of an
investigator's beliefs about the causal structures which underlie observed variables . The
beliefs can be formulated on the basis of intuition or on strong evidence. Models can be
subjected to indirect tests via attempts to falsify them on the basis of model fit. This is the
logic of falsification of Popper ( 1961) who proposed that while it is possible to reject false
theories on the basis of evidence which contradicts them, there is no certainty that a theory
which has survived testing is the accurate theory of the observed data. Fergusson and
Horwood (1986) characterise good models as those which "summarise the structure of a set
of variables in a realistic, informative and parsimonious way and which are able to withstand
concerted attempts at falsification using both goodness of fit criteria and external evidence of
the plausibility of model assumptions " (p 3) .
Fergusson and Horwood noted that it is not immediately obvious why the LISREL model
would be chosen in view of the highly abstract account of the way in which covariance
matrices of observed variables may be analyzed in the model to obtain estimates of the
parameters of linear equations. It is not obvious at first sight why it would be chosen to

185
analyze longitudinal data or survey data when less complex methods of analyses would appear
to be appropriate. Three major justifications of the use of such an approach relate to
explicitness of model formulation, latent and observed variables and testability.
Because the LISREL model necessitates making explicit all the assumptions required to
impose a given causal interpretation on a set of the data, the likelihood of overlooking or
ignoring these assumptions becomes less . The assumptions involved are described as being
of two types. There are assumptions about linearity of relationships, distributional forms of
variables and the disturbance or error terms of exogenous and endogenous variables . There
are also assumptions about the restrictions on the LISREL parameter matrices which specify
the causal linkages assumed.
In causal analyses based upon statistical examination of data through techniques such as
multiple regression analysis, the lack of an explicit model can lead to faulty inference.
Because theory occupies such a central role in causal data analysis, integrating theory and the
statistics used to analyze the data is regarded as a valuable step . LISREL type of models
provide this integration.
With respect to latent and observed variables, most of the variables chosen by social scientists
refer to hypothetical constructs or latent variables rather than to directly observable
characteristics . Such a distinction between latent and observed variables raises the question
of the rules of correspondence existing between the latent variables and the observed variables
which supposedly represent them (Costner, 1985) . LISREL is regarded as making a major
contribution by clearly distinguishing between what investigators observe, fallible indicator
variables and what they would like to observe, errorless measures of latent constructs , and
by estimating the relationships between these variables , given a model specification.
Distinguishing between latent and observed variables is important not only for conceptual
clarity but because it also has implications for estimating the coefficients of a causal model.
The distinction has tended to be resolved by assuming that the structural relationships between
the latent variables are represented by the observed variables . However, there are according
to Fergusson and Horwood (1986) virtually no grounds for such an assumption. Costner
( 1985) noted that a subsidiary theory to link the observed and latent variables is needed
permitting estimation of the structural relationships between the latent and observed variables .
LISREL measurement model components provide this subsidiary theory.
1 86
The third important justification for employing LISREL is that testability is an important
feature in establishing how plausible a causal model might be. In causal analysis models are
normally tested by establishing whether specific coefficients are non zero. Using the LISREL
model, all of the causal model predictions can be evaluated.
The specification of the model can be provided by a description of the free, fixed and
constrained LISREL parameters which imply the model or, for those unfamiliar with the
LISREL model these more difficult to interpret specifications can be represented by path
diagrams. These diagrams show linkages between the observed, latent and disturbance terms
of the model. The conventions used in the path diagrams are summarised in Appendix K.
Structural relationships among Dawis and Lofquist's key concepts
In the case of the present research the interrelationships of the variables as proposed by Dawis
and Lofquist were initially examined as a whole rather than individually, proposition by
proposition. The aim was to allow examination of Dawis and Lofquist's basic model as a
preliminary one. In view of the literature reviewed their model seemed unlikely to provide
an integration of the key aspects of work adjustment.
The structural relations among the latent variables of Dawis and Lofquist's basic model are
presented in Figure 8 .2 . This model represents the key concepts of Dawis and Lofquist's
model as they described it but depicted in a diagrammatic form which is consistent with their
propositions. The moderating relationships are missing from the model at this point because
models involving these are handled differently in LISREL. This basic paradigm represents
a preliminary position in the iterative and interactive modelling process characteristic of
LISREL and can be represented by what is referred to as the general LISREL model (as
specifically defined in Appendix K). In this LISREL analysis of Dawis and Lofquist's entire
basic model, because Dawis and Lofquist's ability and satisfactoriness measurement
instruments were not used, the constructs were operationalised using academic performance
as a measure of ability and the self-report satisfactoriness measures of the self-efficacy scale
as a measure of satisfactoriness.
1 87
5 .2.4 Aim 4: Exploring the underlying structure of work needs by both factor and latent
structure analysis
The factor analyses of work needs undertaken were firstly, a replication of Dawis and
Lofquist's factor analytic model, section 8 . 1 . 1 , and secondly, a nonorthogonal rotation of
factors assuming a correlated factors model of work needs, section 8 . 1 .2 .
The work needs operationalised as the responses to the Minnesota Importance Questionnaire
(MIQ) items (described in the instruments section), were first factor analyzed in the same way
Dawis and Lofquist's had analyzed their MIQ results . These were exploratory factor solutions
which assumed no theoretical knowledge relevant to guide the factor extraction or produce
hypotheses to be tested. The procedures for extraction are based entirely upon mathematical
criteria. Dawis and Lofquist (1984) reported using a principal factor solution with squared
multiple correlations as communality estimates and orthogonal rotation to a varimax criteria,
as shown in Tables 3 .5 and 4. 1 . This same procedure was employed with the present data.
A reinterpretation of the factor structure appeared to be needed, to allow for the possibility
of correlated dimensions. It seemed reasonable to expect, intuitively, some of the work need
factors would be correlated because they are influenced by similar external events in the work
place and included aspects of work which are likely to be interrelated. Just as importantly,
it is good practice in exploratory factor analysis to test any assumption of orthogonality,
which Dawis and Lofquist have not reported doing. Gorsuch has (1983) suggested that such
a test of orthogonality still encourages the selection of the simpler uncorrelated model .
The plan for investigating the factor structure of work needs, as an iterative process, was to
begin by attempting to replicate Dawis and Lofquist's factor structure from the present data
using their factorial model . On the basis of the outcome of that analysis , the factor structure
would be modelled using LISREL until the best fit for the data could be found. In the event
of a considerably less than perfect fit, higher order factor analysis would then be undertaken
and a nonorthogonal or oblique model be investigated.
188
5 . 3 The Research design and procedure
The research was conducted employing a within-subject or repeated measures two-stage
longitudinal design with volunteer subjects completing a first questionnaire about half-way
through their final year of study prior to graduation and a second questionnaire a year later.
The research was planned to comply with the University's requirements for research using
human subjects and be consistent with the ethics for research of the New Zealand
Psychological Society. The first questionnaire was handed to the respondents and the second
mailed. To encourage return of the first questionnaire, the researcher arranged to attend the
next and following classes to collect completed questionnaires . This resulted in a gap of a
week between each collection time and involved up to three visits to each class. Where
respondents did not attend classes or had forgotten to return questionnaires they received up
to two reminder phone calls asking that they please take the questionnaires to the Psychology
Department. Respondents were thanked again at the beginning of their second questionnaires
for participating in the first part of the study. Up to three reminder letters requesting the
return of the second questionnaire were sent.
5 .4 The respondent group
The respondents were 475 final year university student volunteers enrolled in the different
faculties at Massey University, Palmerston North, New Zealand, during 1985 . Only those
who agreed to take part in a follow up study the following year were selected. The faculties
were those of, Science, Computer Science (the new Mathematics Information Services) ,
Business Studies, Agriculture, Horticulture, Technology, Humanities, Social Sciences and
Veterinary Science. A small group of College of Education students , that is, student teachers,
also took part. Table 5 .2 shows the structure of the volunteer group, both the volunteer rate
(the percentage of those present from each class roll who volunteered) and the response rates
for the questionnaires for both stages of the study. The then First Supervisor of the researcher
contacted each of the Faculty Deans by phone to inform them the present researcher would
meet with them individually to discuss the possibility of involving their students in research
concerning work adjustment. Initial contact with the Deans was made by phone and all agreed
to meet with the researcher. During these meetings an outline of the research proposal was
presented and permission was given in all cases for Departmental Heads and Lecturers to be
approached for their cooperation. The classes, and therefore the Lecturers, to be approached
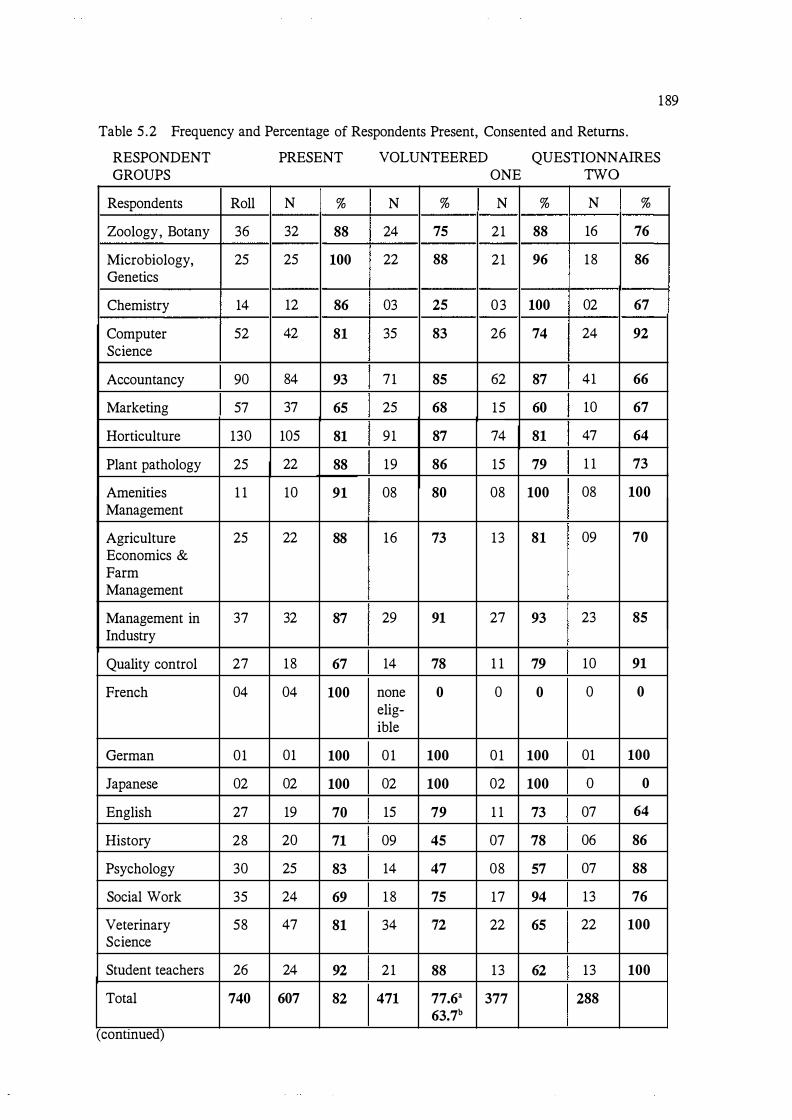
189
Table 5 .2 Frequency and Percentage of Respondents Present, Consented and Returns.
RESPONDENT GROUPS
Respondents
Zoology, Botany
Microbiology, Genetics
Chemistry
Computer Science
Accountancy
Marketing
Horticulture
Plant pathology
Amenities Management
Agriculture Economics & Farm Management
Management in Industry
Quality control
French
German
Japanese
English
History
Psychology
Social Work
Veterinary Science
Student teachers
Total
(contmued)
Roll
36
25
14
52
90
57
130
25
1 1
25
37
27
04
01
02
27
28
30
35
58
26
740
PRESENT
N %
32 88
25 100
12 86
42 81
84 93
37 65
105 81
22 88
10 91
22 88
32 87
18 67
04 100
01 100
02 100
19 70
20 71
25 83
24 69
47 81
24 92
607 82
VOLUNTEERED QUESTIONNAIRES
N %
24 75
22 88
03 25
35 83
71 85
25 68
91 87
19 86
08 80
16 73
29 91
14 78
none 0 elig-ible
01 100
02 100
15 79
09 45
14 47
1 8 75
34 72
21 88
471 77.6a 63.7b
ONE TWO
N % N
21 88 16
21 96 18
03 100 02
26 74 24
62 87 41
15 60 10
74 81 47
15 79 1 1
08 100 08
13 81 09
27 93 23
1 1 79 10
0 0 0
01 100 01
02 100 0
1 1 73 07
07 78 06
08 57 07
17 94 13
22 65 22
13 62 13
377 288
%
76
86
67
92
66
67
64
73
100
70
85
91
0
100
0
64
86
88
76
100
100

190
Note.
b Percentage PRESENT Percentage VOLUNTEERED Questionnaire ONE
Questionnaire TWO
Percentage of those present over all classes Percentage of those on the roll for all classes = Percentage present of those enrolled in that paper = Percentage of those present in class = Percentage returned at stage one of those who volunteered = percentage returned at stage two of those who responded to stage
were selected in consultation with the Deans . The criteria for selection was the class with the
largest number of students in their final year in each of the disciplines to be represented. The
aim was to include at least more than one academic subject in each Faculty. The papers
chosen were usually either the compulsory or the most popular one, whichever had the
greatest numbers of students . Table 5 .3 provides a broad categorisation and response rate of
the respondents .
Table 5 .3 Broad Categorisation of Academic Subjects : Frequency and Response Rate
Between Stages of the Study
Stage One f
Science 45 Computer science 26 Accountancy 62 Business studies 15 Horticulture 97 Agriculture 13 Technology 38 Humanities 21 Social science 25 Vet 22 Teachers College students 13
Means 34.27 S .D . 25 .67
377
Note.
a mean response rate for groups for questionnaire two b overall response rate for questionnaire two
Stage Two f % response
36 80 24 92 41 66 10 67 66 68 09 69 33 87 14 67 20 80 22 100 13 100
26. 18 79.64a 16 .99 13 .38
288 76.39b
191
All lecturers approached gave their permission for the researcher to seek subjects from a
lecture or laboratory session. The Deans of the faculties and the lecturer for each class from
which respondents volunteered were promised a summary of findings .
The procedure followed was that in the first five minutes of the session, students were asked
if they would take part in the study by being given a written request form (refer Appendix
A. 1)and a copy of the questionnaire for their immediate brief perusal . They were assured of
individual confidentiality, told they would receive a brief summary of the research findings
at its conclusion and would be given, upon their request at the time or later, a more detailed
summary of the interpretation of their own data. The students were told they could consent
to take part knowing they were free to leave the study at any stage should they wish to . It was
emphasised, however, that the quality of the findings would be related to the size of the
sample in the first instance and to the number who choose to remain in the study. The
respondents signed a consent form, refer Appendix E, to agree to participate in the research
and to allow their academic records to be seen for the purposes of the study.
The return rate for stage one of the two-stage longitudinal study was 80% , N = 377, and
77 % for stage two, N = 288, 199 of these were employed and 3 1 returned to university.
Therefore, 58 were either unemployed or overseas .
5 .5 The Questionnaires: design, presentation and content
5 . 5 . 1 Design and presentation
Particular attention was given to the presentation of the questionnaires for both stages of the
study. This was aimed at increasing the initial volunteer rate, increasing the rate of filling in
the questionnaire completely and increasing the actual return rate. The colour chosen for the
questionnaire covers was a bright gold to make them highly visible. Because respondents
would be returning the questionnaires at a later date (in person for stage one and by mail for
stage two) anything that might enhance visibility and make them less easily mislaid or
confused with other printed material seemed important.
Care was taken to thank respondents for their participation when they volunteered, at the end
of the first questionnaire, again at the beginning of the second for having completed the first

192
and at its conclusion. Respondents were encouraged to write further comments on the
questionnaires at any point, especially if, for example, they felt any of the response
alternatives did not cover their situation.
The second questionnaire included a comment about the importance of completing and
returning the questionnaire and information about the unusually high response to the previous
questionnaire. The information relating to completing the second one included a reminder
about the confidential nature of replies . Again these comments were aimed at maximising the
response rate. A checklist was placed at the end of the second questionnaire to summarise
which parts of the questionnaire applied to which respondents on the basis of whether they
had returned to university or were employed.
The order of items in the questionnaires was determined by principles of questionnaire design
(Phillips, 1971) . However, one of these principles was intentionally not adhered to . Usually
where respondents are asked for personal information such as parental income and education
and religious beliefs , these questions are placed at the end of a questionnaire. Questions of
this nature, and those about religion, have been thought to exert an important influence on
all the questions that follow, potentially antagonizing respondents .
In the present questionnaire such questions were placed at the beginning so that when students
were asked if they wished to participate in the research they could decide with the most
personal questions placed first and highly visible. They were assured there would be nothing
more personal in the second questionnaire than in the first. It seemed more ethical to draw
students ' attention to the more sensitive questions , even at the risk of losing potential subjects .
Any respondent leaving the study at its second stage would less likely to have to do so
because of the sensitive nature of questions .
This approach was also aimed at helping establish rapport with respondents through an
absence of techniques involving deception, in the hope of making them more willing to
complete the second questionnaire. It was also considered preferable to potentially jeopardise
the participation rate in the research at the start , rather than later, when the opportunity to
approach more students would have been lost.
Both the first and the second questionnaire for the two stages of the study were designed to
examine Dawis and Lofquist 's propositions , the criticisms which arose from these as a result

193
of the literature review process and the hypotheses which emerged, as previously outlined.
Some instruments and questionnaire items were designed specifically for the study while
others were well established standardised instruments modified only, for example, where
changes in language seemed appropriate to either adapt them to the New Zealand setting or
to produce gender neuter items. Appendix B includes copies of the questionnaires (copyright
material is excluded), and an accompanying description and justification for use of items.
Appendix C includes modifications of instruments, the Vocational Preference Inventory
(Holland, 1985) and the Minnesota Importance Questionnaire (1975 Revision, in Dawis and
Lofquist, 1984).
Questionnaire One:
The first questionnaire was designed to obtain background biographic data, information about
qualifications, future employment plans, confidence about adjusting to paid employment, and
measures of satisfaction, subjective well-being and locus of control. The questionnaire began
with a brief description of its purpose, a plea for its return even if uncompleted and a
reminder that respondents would be sent a summary of the results of the study. Justification
for how variables were operationalised appears in Appendix G. The questionnaire consisted
of three sections containing the following:
1 . An introduction: "This questionnaire has been designed for final year University students .
We are interested in gathering information from different groups of students in order to look
at the transition from university to work. The questions in Section A, for example, ask about
things such as your parents ' qualifications and income because previous studies in this area
have shown these to be important factors .
No person other than the researcher will ever see your completed questionnaire (as you can
see your name does not appear anywhere on it) to ensure that absolute confidentiality can be
maintained at all times. No individual will be identifiable in any of the published results . "
2 . Section A : This section sought information about age, gender, marital status, offspring,
ethnicity, citizenship, number of years schooling, some school grades, school qualifications ,
parents ' occupations and incomes and qualifications . A work history was sought along with

194
identifying the most and least favoured job. Other information sought related to state of
health, leisure activities, living circumstances and satisfaction with these.
3 . Section B : This section was to do with future work plans, qualification and salary
expectations of self and of friends and job fantasies . The instrument developed to assess self
efficacy for obtaining the various work needs, to the extent an individual is able to influence
this , was included here.
4. Section C : This section consisted of measures of the relative importance of work needs (the
Minnesota Importance Questionnaire), personal competence or locus of control, happiness ,
life satisfaction, subjective well-being and vocational preferences.
The Vocational Preference Inventory (Holland, 1965) assessed vocational preferences and the
effect of the personality factors thought to be ascertainable from it. Vocational interests were
also measured using the Strong-Campbell Interest Inventory, 3rd Edition (Campbell and
Hansen, 198 1 ; Hansen 1984). The measures of personal competence, happiness, well-being
and life satisfaction were those of Campbell, Converse and Rodgers, (1976) .
The operationalisation of the work personality in terms of the work needs and the adjustment
style dimensions, were through Dawis and Lofquist's instrument designed to measure work
needs and their experimental adjustment style rating form, modified. Because they represent
common components, the measurements of underlying dimensions (or latent variables) called
values were expected to be more stable than measurements of needs . The relationships that
can occur between abilities (the latent variables of skills) and values are recognised as
complex and at times expected to result in conflict, for example, where values compete in
relation to an ability. Nevertheless it is thought that most individuals do not experience such
conflict in a lasting form and instead are able to behave in an integrated manner on the whole .
Questionnaire Two:
1 . Introduction: This questionnaire included an introduction and five sections (A to E) . The
introduction included a section about the importance of completing the questionnaire, thanked
the respondents for their previous participation and gave them feedback about the high
response rate which had been achieved, (see Appendix B , Transition to Employment Study,
195
Part Two, Introductory page) . Confidentiality of answers was again assured, and a plea for
patience with the repetition involved because parts of the second questionnaire were a
readministration of the first. Instructions were given about which sections of the questionnaire
were applicable to which respondents (as dependent upon whether they were in employment
or studying et cetera) and about returning the questionnaire.
2 . Section A: This section was concerned with the respondents' circumstances, whether they
were employed, on holiday, or had returned to university for further study. The self-efficacy
instrument of the first questionnaire was re-administered, this time as a measure of the
confidence that each of the needs included were being met, that respondents work was
satisfactory, and that the adjustment styles were in use. A measure of the importance of work
needs at that time and the use and importance of adjustment styles was included. The measure
of the satisfaction of work needs used was the Minnesota Satisfaction Questionnaire (MSQ)
(Weiss, Dawis , England and Lofquist, 1967) .
3 . Section B : This section was included for those who had returned to study. Information was
requested about the Degree or Diploma course which was being undertaken, about reasons
for the return to study, and about what type of occupation the respondent might be interested in
upon completion of their studies .
4. Section C: In this section the Vocational Preference Inventory of Holland ( 1965) was re
administered and the questions were concerned with leisure activities , living circumstances,
friends ' jobs and incomes and the number of people interacted with on a social basis .
5 . Section D : This section was concerned with quality of life measures, the satisfaction and
importance of various life domains . These domains were those of location and neighbourhood,
living accommodation, life in New Zealand, amount of education received, usefulness of the
education received, job, way free time is spent, health, standard of living, savings ,
friendships , intimate relationships , family life and home-making activities . Respondents were
asked the degree to which they were satisfied with their job compared to their friends . The
reliability and validity of the quality of life measures are discussed in Appendix A, section
A.5.
196
6 . Section E: The measures of personal competence or locus of control, happiness, life
satisfaction and subjective well-being, the importance of all the work needs (the importance
section of the MIQ) from the first questionnaire were re-administered in this section. The
social support instrument was included and respondents were asked about the relative
importance of work and leisure activities for them.
The instruments used in the two questionnaires can be grouped into those already in existence
and well-established, that is , those of Dawis and Lofquist (as described in section 5 .6) , those
of others (section 5 .7), and those developed or modified for use in this study (section 5 . 8) .
5 . 6 Dawis and Lofquist's instruments and those used in the present research
Dawis and Lofquist distinguished among expressed, measured, exhibited, validated, and latent
interests . The ability value-relationships are represented by expressed or stated interests . In
the case of sampling activity preferences experienced by most individuals, they can be scaled
psychometrically to give measured interests. Such a structured approach is believed to provide
a superior sampling of activities and a good measure of the entire set of preferences . The
assessment of the reliability of the measures and comparisons of the activity preferences of
different individuals and groups are also made easier using this procedure.
Observed, or exhibited interests, are compared with measured interests and in the case of
agreement between the two, are called validated interests . Validated interests are said to result
from experiencing certain combinations of values and abilities . The degree to which interests
are stable is believed to depend upon how stable an individual's set of values and abilities is.
It is argued that a restricted experience with some combinations of values and abilities may
explain the later emergence of what are referred to as latent interests. The use of 'latent' here
is different from its usual use in factor analysis and structural modelling where it refers to the
factors, the unmeasured underlying variables, or the constructs as opposed to measured
variables .
A second way that ability-value relationships are expressed is by noting the likelihood of
certain behaviours occurring. This likelihood of behaving in certain ways is known as
expressed or stated personality descriptions. Where these descriptions are made via a
psychometric instrument aimed at sampling and scaling a wide range of behaviours in a

197
systematic way in accordance with theoretical models , these are referred to as measured
personality descriptions. Where personality descriptions are based on observation they are
called descriptions of exhibited personality and when these are in agreement with measured
personality descriptions, they are termed validated personality descriptions. However, they
are said to refer only to the important aspects of the personality rather than provide a
complete personality description.
Although Dawis and Lofquist consider the description of interests and personality as useful
in examining ability-value relationships, they adopted the more direct approach by starting
with ability and values measurements rather than the constructs that are another level again
away from their data. Abilities and values were therefore used as the principal personality
variables and interests and personality descriptions were relegated to a supporting role .
Dawis and Lofquist's instruments used in the present research were those concerned with
values, their importance (as measured by the Minnesota Importance Questionnaire) and their
satisfaction (as measured by the Minnesota Satisfaction Questionnaire) . Their experimental
instruments used were those concerned with work adjustment styles .
5 . 6 . 1 The Minnesota Importance Questionnaire (MIQ)
Description and Administration
The concept of needs was operationalised by using the Minnesota Importance Questionnaire
(MIQ) 1975 Revision, in Dawis and Lofquist (1984), which was based on the earlier version
(Gay, Weiss , Hendel, Dawis and Lofquist, 1971) . The purpose of the MIQ is to measure
vocational needs in order to relate them to occupational reinforcers . The MIQ is a multiple
item paper-pencil inventory. The MIQ focuses upon the relative importance to an individual
of having 20 particular needs reinforced. The need dimensions measured are : ability
utilisation, achievement, activity, independence, variety, compensation, security, working
conditions, advancement, recognition, authority, social status, coworkers, moral values , social
service, company policies and practices , supervision-human relations , supervision-technical,
creativity, responsibility . Of the two forms available, one uses a paired-comparison format,
the subject being asked for each pair of 20 needs to mark which is the most important in their
ideal job ("the kind of job you would most like to have") . The different combinations of each
item with every other item gives 190 pairs in total . In response to subjects finding this format

198
repetitive a multiple ranked form was developed where statements are ranked in blocks of
five, giving a total of 105 responses . For both forms the subjects are asked to rate on a five
point scale if each work need is important to them.
The computer generated report includes an individual's profile of needs, and interpretive
information. A validity check is incorporated which is based on illogical comparisons not
exceeding a certain number. Illogical comparisons are referred to as totally circular triads
(TCTs) . The TCT scores are used to calculate error bands which in turn are used to indicate
the extent of limits to which scores (the adjusted scale values) could change if responses were
perfectly consistent. The TCT scores, error bands and adjusted scale values are described in
detail in the scoring subsection of this section ( 5 . 6 . 1) . Validity scores above a certain level
are used to indicate that random responding, or carelessness, or fatigue has rendered the
profile invalid. For the valid profiles a comparison can be made with patterns of reinforcers
for 148 different occupations and a list of the 50 most similar and the 50 least similar
occupations is provided.
The multiple ranked form was used in the present study. Twenty-one statements are presented
in groups of five for respondents to rank according to their importance resulting in 105
responses. Respondents are asked to enter their rankings of statements for each group on the
separate answer sheet. An example of such a group of statements is :
On my ideal job . . .
a . I could be busy all the time.
b . I could do things for other people.
c . I could try out some of my own ideas .
d . my pay would compare well with that of other workers .
e. the job would provide an opportunity for advancement.
These statements represented the needs of activity, social service, creativity, compensation
and advancement, respectively. Subjects were asked to rate on a Yes/No scale the
importance of each work need to them. These absolute judgements are used to determine the
subject' s zero point which is used to anchor the comparative judgements from all need items
199
to yield adjusted scores. These scores have a meaningful zero point along with a ' + ' or '- '
sign which indicates if the score is in the 'important' or 'not important' , direction.
The minor modifications to the MIQ's instructions and wording involved using New Zealand
spelling are presented in Appendix C. The changes made were to do only with the
instructions and presentation of the instrument, for example to allow responses to appear on
the same page as the items to be ranked (not on a separate answer sheet) , and the use of the
word "workers " in two of the items.
The instrument is self-administered with clinical supervision but is suitable for group use also.
Scoring
Because hand scoring is laborious and prone to error, forms are usually computer scored at
the University of Minnesota producing a computer-generated profile and interpretation . The
profiles include scores on each dimension. The ranked form includes an Autonomy scale
because an extra or 2 1st statement was required in order to convert the ranked responses from
the blocks of five statements to a complete set of paired comparison responses . This new
dimension is not scored in order to make this form comparable with the paired-comparison
form. The profile includes, scores on each dimension, correspondence of examinee' s need
patterns to Occupational Reinforcer Patterns (ORPs), lists (50 each) of occupations with the
ORPs most similar and least similar to the respondent's MIQ profile, predictions of job
satisfaction for each occupation listed, references for further information, a validity score and
an error factor for each score. An optional report lists MIQ-ORP correspondence for 1 87
occupations.
The MIQs for the present study were scored locally using a modified programme7 which
produced the Totally Circular Triad scores and the error bands, described below. The scoring
produced the 20 adjusted scale scores (scores with a meaningful zero-point and a ' = ' or '- '
sign indicative of ' important' or 'not important' , respectively) . The various types of scores
produced in the scoring process described below are the raw scores, the scale scores, adjusted
scale values, the Total Circular Triad (TCT) score, the Stimulus Circular Triad (SCT) score,
and error bands, all of which were available in the local computer programme.
7 The author wishes to thank Dr. T. Hesketh, Massey University, for providing the modified programme.
200
1 . Raw Scores .
There is a raw score generated for each of the need scales and a " zero-point" scale which is
used to anchor the 20 vocational needs . The raw score for each need is the number of times
the statement representing that scale is chosen as 'more important' to the individual in his or
her ' ideal job ' . A statement is given a score of 1 every time it is chosen over another
statement and for the absolute judgement section the vocational need scales identified as
' important' by a � response are scored ' 1 ' and those identified as 'not important' by a no
response are scored '0' . The zero-point scale raw score is obtained by counting the number
of 'no' responses to the absolute judgement items. Raw scores range from 0 to 20 for both
the vocational need scales and the zero-point scale.
2. Scale Values .
An MIQ scale value is calculated by taking the raw score on a scale for an individual (the
number of times a given statement is chosen over all other statements) and converting it to
an intra-individual z score. Each raw score is expressed as a proportion of the total number
of stimuli being scaled (21 , including the zero point) . This proportion is converted to the
appropriate z-value from the cumulative normal distribution. In calculating the proportion .50
is added to the raw score to include the expected number of times the statement would be
chosen over itself had such a comparison been made. The MIQ scale values range from -2.0
to +2.0. Scale values show how many standard deviations a given raw score is from the
individual's own mean raw score, which is arbitrarily defined as 0.0 . Individuals are their
own basis for comparison, rather than a normative group. The procedure gives a set of scale
scores which are equally distributed about zero, with half the scale values positive and half
negative. Different individuals will have different scale values for the different scales . The
scale values reflect the relative levels of the measured vocational needs for a particular person
and allow only limited comparisons among individuals. To enable more meaningful
comparison among individuals , scale values are adjusted.
3 . Adjusted Scale Values .
The individual's zero-point raw scale score is derived. The scale value of the zero-point scale
is determined in the same way as the scale values for the twenty vocational need scales . Scale
values for the other twenty scales are adjusted with respect to the scale value for the zero
point by subtracting it from the other scale values, and from itself. This procedure results in
21 adjusted scale values , with the individual's zero-point scale adjusted to zero and the
201
vocational need scales adjusted with respect to the individual's zero-point. The potential range
for adjusted scale values is -4.0 to +4.0. However, the maximum range of values for an
individual is only half of that. Where this half is located depends on the zero-point scale value
before adjustment. The sign of each adjusted scale value shows whether the reinforcer is
thought to be important or not. Adjusted scale values with positive signs indicate
characteristics of the individual's ideal job . They represent significant vocational needs . The
magnitude of the adjusted scale value indicates how important a reinforcer is . Scale values
with negative signs indicate characteristics which are not considered important and are not
therefore relevant vocational needs for the individual .
4. Total Circular Triad Score (TCT). This is an index of the extent of random guessing and
other forms of invalid responding to the MIQ. The Total Circular Triad score (TCT) indicates
the logical consistency (transitivity of preference) of the responses . It is the number of
circular triads. A circular triad occurs when an individual responds to a group of three items
in the following manner:
Item 1. Statement A is chosen over Statement B .
Item 2 . Statement B is chosen over Statement C .
Item 3 . Statement C is chosen over Statement A .
The sequence of these choices is illogical o r intransitive. For responses to be perfectly
consistent one statement would be chosen over all the others, a second statement over all the
others except the first, a third over all the others but the first and second and so on to the
statement representing the twentieth vocational need, which would not be chosen over any of
the other statements . At the other extreme for responses to be logically inconsistent, each
statement would be chosen half the time and its alternative half the time, so that all triads
would be intransitive. An individual responding in this manner would obtain the maximum
number of circular triads, which is 385.
The number of circular triads for an individual on the MIQ is calculated by the formula
(Kendall, 1955 , p 125):
21 TCT = (2870 - :E
i= l
21 where
i= l
is the sum of the squared raw scores for each of the vocational need scales (including the
zero-point scale) .

202
The distribution of TCT scores for random responding has a mean of 333 and a standard
deviation of 1 5 . 8 . The maximum allowable TCT score for a valid profile has been set at 254.
This number is 5 . 0 standard deviations below the mean TCT scores for random responding.
Gay, Weiss , Hendel , Dawis and Lofquist (1971) report a study where in 4,682
administrations of the MIQ, the TCT scores ranged from 1 to 360, with a median of 73 and
with 96 % of the profiles being classified as valid on the basis of the TCT score.
5. Error Bands .
These are the extent to which the adjusted scale values could change if responses were
perfectly consistent. Circular triads reflect some indecision on the part of the individual . To
show the location of such indecision, error bands are computed for each scale from an
analysis of the TCT score. These bands show the limits to which the adjusted scale value
could change if the individual were to respond in a perfectly logically consistent manner.
The error bands were computed by determining for each item whether it appeared in a
circular triad. On the assumption that the individual 's scale scores are more reliable than each
of the item choices, each item choice which is involved in a circular triad is compared with
the ranking of the individual 's scale scores for the two statements in the item. Logically, the
statement chosen should have the scale score which is ranked higher. A count is kept of each
time the item choice is inconsistent with the scaleranking, separating the instances when the
choice increases the scale score from those which decrease the scale score. These counts are
added or subtracted (whichever applies) from the raw score and converted to scale values . A
range of scale values around the observed scale values is produced which represents the
individual's indecision for the scale.
6. Random Response Patterns .
Invalid MIQ profiles (TCT greater than 254) can be random response patterns of two different
types, true random and pseudo-random. The Stimulus Circular Triad Score (SCT)
distinguishes between these two types . The SCT score for a particular scale is derived by
counting the number of times the statement for that scale appears in a circular triad. (The total
number of SCT scores for all of the MIQ scales is three times the number of TCTs because
203
each circular triad involves three scale statements .) If an individual were responding to the
MIQ in a truly random manner the SCT scores should produce a rectangular distribution.
However, if an individual is just having difficulty with respect to some of the statements,
there would be more SCTs for those statements than for others . Evaluation of the distribution
of the SCTs is made using the chi-square statistic. The MIQ manual (Gay, Weiss , Hendel,
Dawis and Lofquist, 1971) describes how a distribution of chi-square values for a true
random responding was developed from 1 ,000 randomly generated MIQ response records .
The observed distribution of SCTs was compared with the expected distribution among the
2 1 stimuli . A chi-square was computed separately for each random response record. The
cumulative frequency distribution of chi-square values for these 1 ,000 records is used to test
the deviation of an observed chi-square from the random response expectation. According to
this distribution there is a 5 % probability that a chi-square greater than 25 .9 would occur
under conditions of true random responding. If this value is reached, the response pattern is
labelled pseudo-random.
Once the MIQ is scored it can then be compared with Occupational Reinforcer Patterns which
are scaled by the same methods used in scaling the MIQ. However, this procedure was
unnecessary in the present study because the MIQ was not being used for vocational purposes
in the sense of attempting to find the most or least suitable jobs . Instead the interest lay in
examining the occupation the individual had taken up in terms of correspondence between
needs and the reinforcers available for that occupation.
In addition, rather than using the American ORPs for an individual 's particular occupation,
which may or may not be the same as those in New Zealand, the work needs of individuals
were matched with the reinforcers perceived by the individual to be available.
Reliability and Validity
The authors claim the MIQ gives a wide coverage of the work-relevant needs which can then
aid in the description of value dimensions of the work personality structure. With respect to
the reliability and validity of the Minnesota Importance Questionnaire (MIQ), Albright ( 1978)
reviewed the MIQ noting that the 20 vocational needs, although probably not all
encompassing, should be adequate for most situations. It was thought that one item could
benefit from re-wording and that is the statement used to represent the authority need. "I
could tell people what to do" . This was felt to be limited, reflecting a quaint view of authority
204
rather than how the concept functions in most organisations . This need is also said to have
a low rate of endorsement. It was suggested that items be equated for social desirability.
Of the two forms of the MIQ, the comparatively more recently developed ranked format has
been preferred by users over the earlier paired-comparison format because it is less repetitive
and requires less time and effort to complete (requiring 105 rather than 190 responses) . The
authors have claimed that the psychometric properties and the results yielded are similar for
both forms. The ranked form required a 2 1st work need dimension in order to convert ranked
responses from the blocks of five to a set of paired comparison responses. In order to make
the two forms comparable the newly created dimension, that of autonomy, was not scored.
This discrepancy in item content prompted Albright to ask why the authors used a ranking
method when they could have shortened their questionnaire by using partial pairing
techniques .
The reliability and validity data as based on 1967 and earlier versions of the MIQ was
considerable. The median internal consistency, Hoyt reliability coefficients for the 20 scales
was .77 to . 8 1 for nine different groups and .30 to . 95 for individual scale scores . Scale
intercorrelations ranged from . 05 to .77, the median being . 33 . Test-retest reliability for the
scale scores shown in Table 5 .4 ranged from . 19 (for a nine-month interval) to .93 (for an
immediate retest) and the median coefficients ranged from .48 to . 89 . The median stability
coefficients for the MIQ profiles (rather than just the scale scores) were higher, ranging from
.70 (for a four-month interval) to . 95 (for an immediate retest) .
Zedeck ( 1978) in his review of the MIQ regarded these intercorrelations along with the factor
composition as evidence of the soundness of the MIQ. Common factor structures have been
found for vocational rehabilitation clients , employed workers and college students . The
reliability findings led Albright to conclude the internal consistency and stability, particularly
with respect to the stability of profiles, are satisfactory and that there is an acceptable degree
of scale independence.
Although Albright did not find the validity evidence as satisfying, he beleived that it seemed
to indicate the MIQ functioned as intended. He noted that concurrent validity studies
demonstrated that four occupational groups have MIQ profiles which correspond to their
occupational reinforcer patterns to some degree, with rank-order correlation coefficients

. 205
ranging from .48 to .60. As was expected, the MIQ was found to correlate more highly with
the Strong Vocational Interest Blank, SVIB (1933) than with the GATB (1970) in an
investigation of convergent and discriminant validity. It was noted there have been no
predictive validity studies to indicate whether individuals the MIQ would predict to be
satisfied in certain occupations have achieved higher satisfaction than would be likely if they
had entered another occupation.
Table 5 .4 Reliability of MIQ scale scores, and profiles
Reliability Time Interval
Scale scores
Median stability coefficient
for dimension scores
Median stability MIQ profiles
Immediate
.93
. 89
.95
Four-month Nine-month
. 19
.48
.70
Zedeck (1978) found the approaches to validity less impressive than the way in which
reliability was assessed. The discriminant validity was based on a lack of relationship between
the MIQ and the multifactor abilities of the GATB, while the evidence for convergent validity
was based on canonical correlations of .78 and .74, for two groups , between the MIQ and
the SVIB. The other two strategies were based on pre-1967 forms and the 1967 edition and
involved validation by confirming group differences according to hypotheses generated by the
theory. The pre-1967 approach used a Likert-type response and a form with twice as many
items, thus minimising the value of the validity evidence. However, Zedeck maintained the
results were adequate. It was concluded that the validity research needed to focus on
predictive validity, emphasising multivariate methods of data analysis and to investigate
relationships between the MIQ and other measures and constructs of interest.
Conceptually the MIQ has been said to appropriately measure needs by providing a within
person type of analysis (Zedeck, 1978) . This allows the interpretation of the importance to

206
workers of each need relative to their own rather than work needs of others . Zedeck noted
this in contrast to the less appropriate but more frequently used strategy of normative
assessment which involves the comparison of one worker's needs with those of other workers .
Albright concluded that the MIQ is a potentially useful measure of vocational needs . It was
regarded as easy to use in terms of readability and administration but does require the
administrator to have a considerable understanding of the underlying theory and other
vocational and technical information in order to interpret test results. It was suggested that
users could benefit from the development of a handbook updating and amassing the relevant
material found in the numerous manuals , monographs and research reports accompanying the
MIQ. Zedeck argued for more information about how items and scales were chosen for the
MIQ, criticised the lack of information about definition and purpose, and the absence of
examples of concepts , which are measures for other aspects of work adjustment, such as
'occupational reinforcement patterns' and 'clusters ' . The MIQ's reliance and dependence on
other instruments and strategies developed in the Work Adjustment Project at Minnesota
University, was considered a limitation.
Zedeck would have liked descriptions in terms of demographic and background factor of the
groups from which most of the data were obtained, and an account of sampling procedures
and information about whether the MIQ correlates with other measures of needs or work
values . The use of the ' ideal ' job as a frame of reference was questioned. The manual in
suggesting the psychometrist ask the subject to explain what the phrase means, tends to
suggest alternative interpretations are possible. Zedeck wondered if the MIQ would be useful
in studying motivation, in suggesting job redesign, and as a way of establishing incentive
programs.
The MIQ was thought to be of the most use in university counselling centres or other
vocational guidance facilities where highly experienced and well qualified personnel are likely
to be employed. It was regarded as inappropriate for employee career planning programmes
in organisations unless its administrators are trained in its use. Therefore, it was expected to
be an appropriate instrument for use with the present sample of university students . More
recent reviews of the MIQ are lacking, but some of the criticisms relating to the collating of
information would be expected to be overcome as manuals are updated.

207
Table 5 .5 The eight matched traits and instruments of MacNab and Fitzsimmons ( 1987)
Instruments The Work Values inventory, Super ( 1970)
Traits
The Values Scale (VS), The Work Importance study ( 1980) The Work Preference Scale (WAPS), Pryor ( 1979) The Minnesota Importance Questionnaire (MIQ), Gay, Weiss , Hendel, Dawis and Lofquist, ( 1971)
Authority eo-workers Creativity Responsibility Security Social service Work conditions Recognition
The MIQ was examined in a study, attempting to resolve some of the confusion in the
definition and use of the concepts of needs, values and preferences (MacNab and
Fitzsimmons, 1987), using a multitrait-multimethod design (Campbell and Fiske, 1959) . The
convergent and discriminant validity of eight matched traits across four instruments were
investigated, see Table 5 .5 .
The eight scales common to the four instruments demonstrated high convergent and
discriminant validities when judged against Campbell and Fiske's ( 1959) criteria.
Confirmatory factor analysis of the general model specified, which hypothesised four
correlated method factors and eight correlated trait factors, supported the results of the
Campbell and Fiske analysis. The trait factors accounted for about 50% of the variance, the
MIQ showed the least amount of trait variance, but its trait variance was greater than its
method variance.
Confirmatory Factor Analysis (CFA) found models with correlated method factors, produced
a better fit to the data. Although it was concluded that the trait factors are truly correlated,
McNab and Fitzsimmons suggested not strongly enough correlated to be combined. As
discussed earlier such a conclusion based on only eight of the 20 of the MIQ should be treated
with great caution.

208
5 . 6 . 2 The Minnesota Satisfaction Questionnaire (MSQ)
Description and administration
The long-form Minnesota Satisfaction Questionnaire (MSQ) consists of 100 items. Each item
refers to a reinforcer in the work environment. Respondents indicate how satisfied they are
with the reinforcer on their present job. The statement preceding response alternatives was
" on my present job, this is how I feel about . . . How steady my job is " . Five response
alternatives are presented for each item: Very Dissatisfied; Dissatisfied; neither (dissatisfied
nor satisfied) ; Satisfied; Very Satisfied. The most recent form of the Minnesota Satisfaction
Questionnaire was used. It was similar to that presented in Weiss , Dawis, England and
Lofquist (1967) . The 1967 form was identical to the original edition except for response
options . No reliability and validity data or norms were available for this revision, however
it was intended for research use only. The MSQ used with its revised response alternatives
was that published in Dawis and Lofquist ( 1984) , a copy of which was sent by them in 1985
for use in the present study. The rating instructions were as follows : "Ask yourself: How
satisfied am I with this aspect of my job?
Very Sat. means I am very satisfied with this aspect of my job .
Sat. means I am satisfied with this aspect of my job.
N. means I can't decide whether I am satisfied with this aspect of my job.
Dissat. means I am dissatisfied with this aspect of my job.
Very Dissat. means I am very dissatisfied with this aspect of my job .
An example of an item is:
Very Dissat. Dissat.
1 . My job security.
N Sat. Sat Very Sat
Each long-form MSQ scale consists of five items. The items appear in blocks of 20, with
items of a given scale appearing at 20-item intervals . For example the five items representing
the Social Service scale are: "The chance to be of service to others " (item 1) ; " The chance
to be of service to people" (item 21); "The chance to help people" (item 41) ; "The chance
to do things for other people" (61) ; "The chance to be of small service to other people" (8 1) .
The MSQ scales are the same as those of the MIQ. Alongside each of these listed below is
the satisfaction item which correlated highest with the scale score for a group of 1 , 793
individuals (Weiss , Dawis, England and Lofquist , 1967) . The items referred to are those of
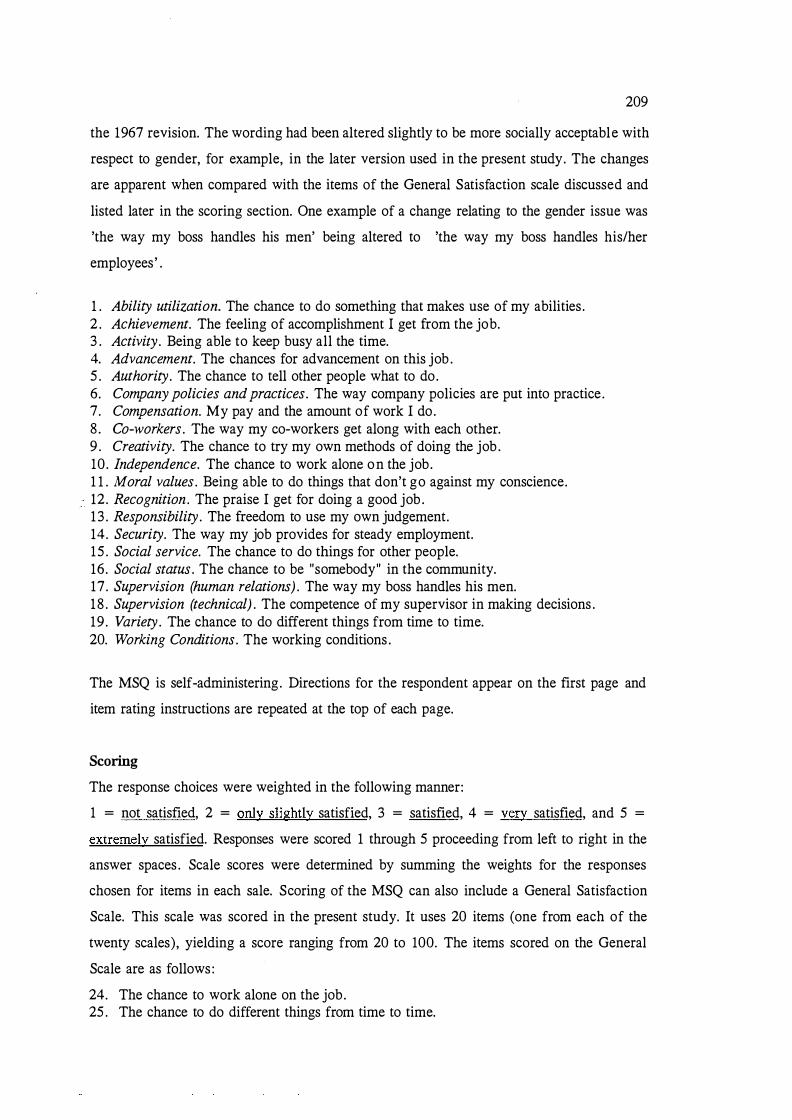
209
the 1967 revision. The wording had been altered slightly to be more socially acceptable with
respect to gender, for example, in the later version used in the present study. The changes
are apparent when compared with the items of the General Satisfaction scale discussed and
listed later in the scoring section. One example of a change relating to the gender issue was
'the way my boss handles his men' being altered to 'the way my boss handles his/her
employees' .
1 . Ability utilization. The chance to do something that makes use of my abilities . 2 . Achievement. The feeling of accomplishment I get from the job. 3 . Activity. Being able to keep busy all the time. 4. Advancement. The chances for advancement on this job . 5 . Authority. The chance to tell other people what to do. 6. Company policies and practices. The way company policies are put into practice . 7. Compensation. My pay and the amount of work I do. 8 . eo-workers. The way my eo-workers get along with each other. 9 . Creativity. The chance to try my own methods of doing the job . 10. Independence. The chance to work alone on the job. 1 1 . Moral values. Being able to do things that don't go against my conscience. 12. Recognition. The praise I get for doing a good job . 13 . Responsibility. The freedom to use my own judgement. 14. Security. The way my job provides for steady employment. 15 . Social service. The chance to do things for other people. 16. Social status. The chance to be "somebody" in the community. 17. Supervision (human relations) . The way my boss handles his men. 18 . Supervision (technical) . The competence of my supervisor in making decisions . 19 . Variety. The chance to do different things from time to time. 20. Working Conditions. The working conditions .
The MSQ is self-administering. Directions for the respondent appear on the first page and
item rating instructions are repeated at the top of each page.
Scoring
The response choices were weighted in the following manner:
1 = not satisfied, 2 = only slightly satisfied, 3 = satisfied, 4 = very satisfied, and 5 =
extremely satisfied. Responses were scored 1 through 5 proceeding from left to right in the
answer spaces . Scale scores were determined by summing the weights for the responses
chosen for items in each sale. Scoring of the MSQ can also include a General Satisfaction
Scale. This scale was scored in the present study. It uses 20 items (one from each of the
twenty scales), yielding a score ranging from 20 to 100. The items scored on the General
Scale are as follows :
24. The chance to work alone on the job. 25 . The chance to do different things from time to time.
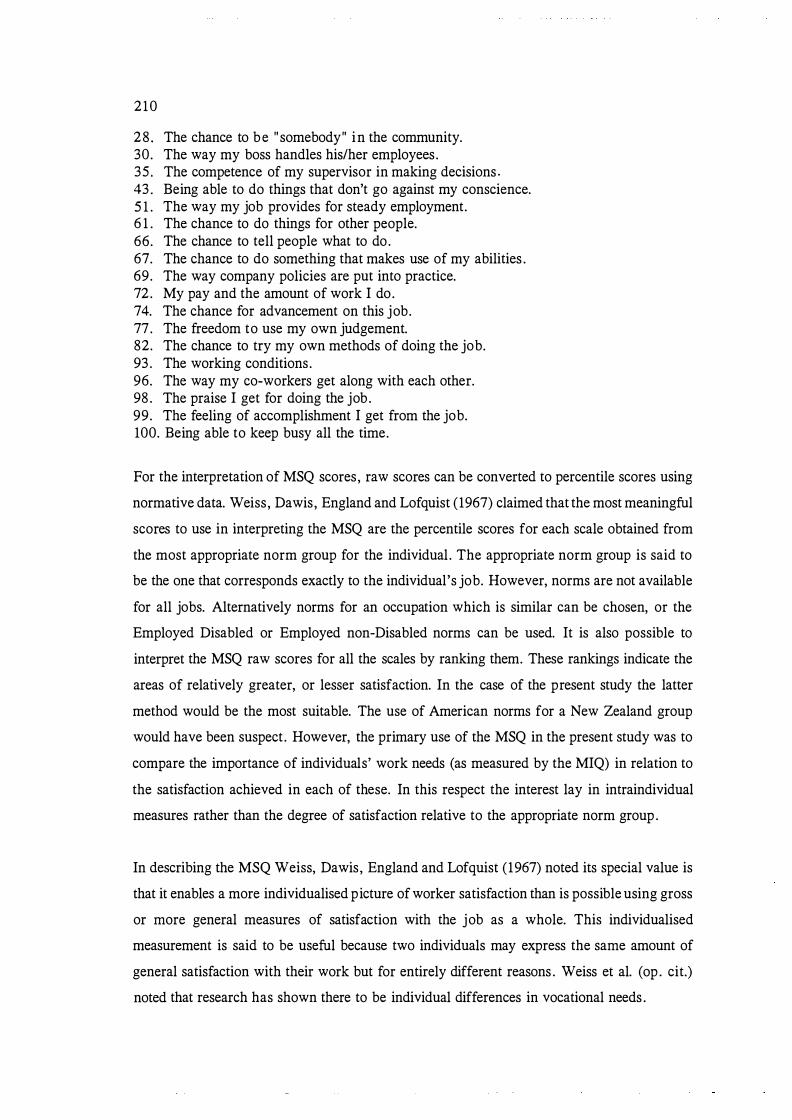
210
28 . The chance to be " somebody" in the community. 30. The way my boss handles his/her employees. 35 . The competence of my supervisor in making decisions . 43 . Being able to do things that don't go against my conscience. 5 1 . The way my job provides for steady employment. 6 1 . The chance to do things for other people. 66. The chance to tell people what to do. 67. The chance to do something that makes use of my abilities . 69. The way company policies are put into practice. 72. My pay and the amount of work I do. 74. The chance for advancement on this job. 77. The freedom to use my own judgement. 82. The chance to try my own methods of doing the job. 93 . The working conditions. 96. The way my eo-workers get along with each other. 98 . The praise I get for doing the job . 99. The feeling of accomplishment I get from the job. 100. Being able to keep busy all the time.
For the interpretation of MSQ scores, raw scores can be converted to percentile scores using
normative data. Weiss , Dawis, England and Lofquist (1967) claimed that the most meaningful
scores to use in interpreting the MSQ are the percentile scores for each scale obtained from
the most appropriate norm group for the individual . The appropriate norm group is said to
be the one that corresponds exactly to the individual's job. However, norms are not available
for all jobs. Alternatively norms for an occupation which is similar can be chosen, or the
Employed Disabled or Employed non-Disabled norms can be used. It is also possible to
interpret the MSQ raw scores for all the scales by ranking them. These rankings indicate the
areas of relatively greater, or lesser satisfaction. In the case of the present study the latter
method would be the most suitable. The use of American norms for a New Zealand group
would have been suspect . However, the primary use of the MSQ in the present study was to
compare the importance of individuals' work needs (as measured by the MIQ) in relation to
the satisfaction achieved in each of these. In this respect the interest lay in intraindividual
measures rather than the degree of satisfaction relative to the appropriate norm group .
In describing the MSQ Weiss, Dawis, England and Lofquist (1967) noted its special value is
that it enables a more individualised picture of worker satisfaction than is possible using gross
or more general measures of satisfaction with the job as a whole. This individualised
measurement is said to be useful because two individuals may express the same amount of
general satisfaction with their work but for entirely different reasons . Weiss et al. (op . cit.)
noted that research has shown there to be individual differences in vocational needs .

21 1
Reliability and validity
Dawis and Lofquist ( 1984) claimed the reliability and validity data supported the use of the
MSQ in research and in practice. They noted that it takes little time to administer ( 15-20
minutes) and is easy to read (fifth grade reading level, that is , about the level of a ten year
old) . The instrument is advocated for use in research because it was designed to assess
dimensions of job satisfaction which exactly parallel the dimensions of needs the Minnesota
Importance Questionnaire (MIQ) measure.
While the authors had claimed the MSQ scales had demonstrated adequate psychometric
characteristics , a 'ceiling effect' had been found on many of the scale scores . The scale means
for most groups were within a few points of the maximum possible. Most scale score
distributions were extremely negatively skewed. Most items alternated between Very satisfied
and Satisfied. The rating categories were altered to control for this ceiling effect and the
numbers 1 to 5 used to define the categories. The neutral point was eliminated and the two
dissatisfied categories collapsed into one. Four degrees of satisfaction were provided. The
desired objectives were met when the modified rating scale with the long-form MSQ was
administered to a sample of 200. Means scale scores were in the middle of the available
range, and the scale scores were distributed more symmetrically across the range. No change
in scale reliabilities or intercorrelations were said to result.
In reviewing the MSQ, Guion (1978) was critical that neither the theoretical foundations nor
the psychometric history of the MSQ was presented in its otherwise informative manual . It
was observed that the internal consistency of the scales may have been generally high because
the items were very close in meaning. What little evidence on stability there was tended to
indicate that responses probably change no faster than the satisfactions they reflect. Although
scale intercorrelations were high, they were low relative to the estimates of reliability. They
were believed to be low enough to show unique variance in scales , yet high enough to justify
combining scales to form a general satisfaction score. Normative tables for 27 occupational
groups for the long form of the MSQ were provided, and sample characteristics and summary
statistics detailed well , although some of the groups were considered small . The MSQ was
said to give reasonably reliable, valid, well-normed indications of 20 aspects of job
satisfaction, which could be divided into intrinsic and extrinsic components and a general job
satisfaction composite measure.
212
Guion compared the MSQ to another well used measure of job satisfaction, the Job
Descriptive Index (JDI) . Both instruments came out of research in the 1960s, have underlying
rationales, are based on empirical research, produce reliable scores, have evidence of
construct validity and are extensively normed. However, the MSQ has four times the number
of scales than the JDI. The scales of the MSQ are more interdependent, but the JDI was
designed to create independence making a composite score inappropriate . The MSQ internal
consistency scores were higher, but probably spuriously because of the close similarity of
some items . Construct validity for the MSQ was assessed via confirmation of theoretical
predictions whereas the JDI's construct validity was based on factor analyses confirming five
scales. Factor analysis of the MSQ was based on scales rather than individual items, and it
was normed using occupations rather than demographic groups.
When MSQ and JDI data have been factor analyzed together the five factors which emerge
have been different from those of the JDI. These five factors also yielded a further two higher
order factors, equivalent to the intrinsic and extrinsic factors of the MSQ. It was concluded
that the MSQ is well developed and holds up when compared with a major alternative
instrument. It was praised as being able to give either detailed results or parsimonious
summary statements in accordance with an investigator's needs.
The MSQ is one of the measures of job satisfaction which continues to be widely used.
Among the reasons given for being frequently used is that it assesses job satisfaction via a
wide range of organisational features (Robertson, 1990) . Another measure of overall job
satisfaction in wide use is that of Brayfield and Roche (1951), which has 1 8 items with
Thurstone scale values of equal intervals rated on a Likert agreement scoring system using
weights of 1 to 5 to give a total possible score of 90 (Rahman, 1989) . Both the JDI and MSQ
have been listed among measures of job satisfaction which have become widely accepted
(Staw, 1984) . Cook, Hepworth, Wall and Warr (1981) have given a detailed psychometric
analysis of the instruments (17 measures of general job satisfaction and 29 measures of
satisfaction with specific work aspects) . However, many of the scales were said to be poorly
documented.
213
5 .6 .3 Dawis and Lofquist's Experimental Personality Rating and Adjustment Style Rating
Forms
The Personality Style Rating and the Adjustment Style Rating forms were experimental
instruments of Dawis and Lofquist ( 1984) for obtaining ratings relating to the process of work
adjustment (rather than its prediction) of which the adjustment style dimensions were regarded
as the major variables . Both these instruments were modified for use in the present study.
They were converted to self-rating scales using a seven-point instead of a five-point scale (to
be consistent with other scales used elsewhere in the questionnaire) and the wording was
simplified (as in Appendix A) following findings of a preliminary study (as reported in
Appendix J) . The adjustment style dimension questions were in Section A of the second
questionnaire. The questions related to each of the styles of flexibility, activeness ,
reactiveness, perseverance, celerity, pace, rhythm, and endurance. Respondents were asked
to "Please consider the following statements and decide how well they apply to you by
circling one of the numbers from 1 to 7 . " Anchors were used for each item. Using the
reactiveness item as an example, this stated " I make changes in myself when I am dissatisfied
with work. " The scale to be rated ranged from 1 to 7 with 1 labelled low reactiveness and
7 labelled high reactiveness (refer Appendix A for the questions for all the styles).
Description and Administration
The Personality Style Rating Form dealt with the personality style dimensions of celerity,
pace, rhythm and endurance. Respondents were asked to rate themselves with respect to each
of these on a scale of 1 (Low) to 7 (High) .
Scoring
The score for each adjustment style for each individual was simply the scale number which
the individual had circled.
Reliability and validity
There was no reliability and validity data available. The format of the questions used in the
present study were developed from findings and comments of the preliminary study which
suggested that the wording in Dawis and Lofquist' s experimental forms needed to be
simplified , (Appendix J, p 579).
214
5 . 7 Standard instruments other than Dawis and Lofquist's
5 . 7. 1 The Vocational Preference Inventory (VPI) , Holland ( 1965)
The Vocational Preference Inventory is a personality inventory composed of 160 occupational
titles to indicate which occupations an individual likes or dislikes . The clusters of personal
traits assessed by the inventory provide a wide range of information about subject's
interpersonal relations, interests , values, self-conception, coping behaviour, and
identifications . The inventory has eleven scales : Realistic, Intellectual, Social, Conventional,
Enterprising, Artistic, Self-Control , Masculinity, Status, Infrequency and Acquiescence (these
are interpreted as defined in Appendix F).
The VPI is self-administering. The subject simply records the preferences for occupations on
the answer sheets . The instructions and examples of the first few items are:
This is an inventory of your feelings and attitudes about many kinds of work. Fill out your
answer sheet by following the directions given below:
1 . Show on your answer sheet the occupations which interest or appeal to you by blackening
Y for "yes " .
2 . Show the occupations which you dislike or find uninteresting by blackening N for "No " .
3 . Make no marks when you are undecided about an occupation.
The above instructions were modified in the present research to be consistent with placing
answers on the same sheet as the occupational stimuli . Respondents were therefore asked to :
1 . place a tick in the YES box beside those occupations which INTEREST or APPEAL to
you.
2 . Place a tick in the NO box beside those occupations which you DISLIKE or find
UNINTERESTING.
3 . Make NO MARKS when you are undecided about an occupation.
In the present research the minor modifications to the wording of Holland's instrument
involving using New Zealand spelling and replacing unfamiliar American occupations are
presented in Appendix C. The changes were considered insufficient and not of a type to cause
concern in any comparisons made with results from previous research. The American spelling

2 1 5
was altered to make the language consistent with that of the respondents and to avoid making
the origin of the instrument obvious if this might affect the responses in some indeterminate
way. The use of occupational titles not found in New Zealand was avoided for the same
reason and to prevent respondents having to assess occupations they either had little
knowledge of or would be unable to pursue in New Zealand. When an occupation was
generally known by a different title in this country or was not very well known as an
occupation other appropriate titles were substituted. Where there was not an equivalent
occupation another was chosen according to certain criteria. To maintain consistency for
scoring these occupational titles were taken from the Self-Directed Search New Zealand
Revision (Keeling and Tuck, 1982) from among those occupations exhibiting the same three
letter Holland code. The replacement occupation was one which would be expected to occur
with a similar frequency, to avoid altering the instrument significantly and minimise any
effect on scores on the infrequency scale. Gender specific titles were replaced by their gender
neuter equivalent (see Table C. 1 , Appendix C) .
The primary purpose of the VPI was to assess personality but it can also be used as an
interest inventory, to assess personality types in a theory of occupational choice and as a way
of stimulating occupational exploration among high school and college students . Holland
viewed its most desirable use as a brief, screening inventory for high school and college
students and employed adults.
Scoring
All scales except the Acquiescence Scale are scored by counting the 'correct' responses using
a single scoring stencil for all scales . In the present study these 'correct' items for each of the
scales were added using the SPSSx to give a score on each of the scales . The Acquiescence
score is obtained by counting the number of 'like' responses among items 1 through 30 . The
Acquiescence score was computer scored in the present study with the number of YES
responses among the items 1 to 30 inclusive being counted. Although hand scoring an
individual VPI takes about 60 seconds using a statistical programme to score the instruments
was preferable because of the large number of respondents involved.
Reliability and Validity
With the exception of the Infrequency, Masculinity and Status scales , the remaining eight
scales showed moderate to high homogeneity of content, coefficients ranging from .70 to .95,
216
with a mode of . 89 for adult males, . 85 for college males, and .79 for college females . The
retest reliability coefficients for both the third and sixth revisions were moderate to high. The
reliabilities were lower for the four than the one year interval, from a mode of .78 to . 52 for
adult males and from .78 to .49 for females . Holland attributed this lower reliability for the
four year interval to the use of mail surveys rather than supervised sessions or to the
possibility that the VPI may be unreliable over long intervals . However, another explanation
might be that occupational preferences alter considerably over longer intervals and that the
expression of personality or personality itself, as based on them, alters also.
With respect to validity, the VPI differentiated among several groups , for example, normal
and psychiatric patients . Some VPI scales correlated with supervisor ratings and job
satisfaction. Scores intercorrelate moderately with several personality inventories and with
self-ratings of personal traits and abilities , life goals and values, coping behaviour and
competencies and self characterisation in an adjective checklist (Holland, 1965) . For students
the VPI was moderately predictive of major field and vocation over one and two year
intervals for students (Holland, 1962) . Selective VPI scales were predictive of academic and
extracurricular achievements for one to three year intervals. Although significant statistically
the predictive ability was considered generally inefficient (Holland, 1960; Holland and Astin,
1962; and Nichols and Holland, 1963) .
The instrument's advantages listed by Holland are all applicable to the present research. These
desirable properties were that occupational titles provide subtle stimuli which avoid the
negative reactions that can be provoked by the ambiguity and threat of inventories which are
obviously personality assessments and that the occupational content lessens the need to fake
because the content is not usually perceived as being related to personal adjustment. Also
requests by the respondents for test interpretation are less than for tests which are more
obviously personality tests and the VPI is economical in use of time and money. Holland did
not expect the VPI to have more validity than comparable inventories but saw its worth lying
in its ability to obtain a broad range of reliable information economically, in having a short
testing and scoring time, and not needing special equipment.
Walsh ( 1978) in reviewing of the VPI was critical of the lack of validity studies in the large
non-college population, the fact that many occupational titles were not appropriate for women
and the lack of specific occupational alternatives being suggested. It was noted also that
217
research has indicated the personality types are not mutually exclusive and independent
classes . However, the coefficients of stability have indicated the inventory has acceptable
reliability. The application of Holland's theory and the VPI were said to be easily translated
into research terms . The VPI data was thought to be of use in a counselling situation. In
general the validity studies are believed to have supported the meaning attributed to the scales
and the rationale underlying the development of the inventory. The rationale for the VPI was
that preferences for occupations are expressions of personality. Although stereotypic, these
preferences have tended to be reliable and consistent with reality. Individuals ' favoured
coping behaviour for dealing with interpersonal and environmental problems is inferred from
the degree to which a large number of occupations associated with a personality orientation
are preferred. In Holland's view interest inventories and vocational preferences represent a
major facet of an individual's personality.
5 .7.2 The Strong-Campbell Interest Inventory (1981), 3rd Edition
Description and administration
The Strong-Campbell Interest Inventory (SCII) , the merged form (Form T325) and current
edition of the Strong Vocational Interest Blank (SVIB) (1985) , is a vocational interest
inventory consisting of a list of 325 items for respondents to indicate a degree of preference.
The items represent a wide range of occupations, occupational activities , school subjects ,
activities, amusements and types of people. It asks the individual to respond either Like,
Indifferent, or Dislike to the items covering familiar occupational tasks and day-to-day
activities. Respondents are asked whether statements about characteristics , for example "have
patience when teaching others " are descriptive of them, Yes or No.
Most individuals require 25 to 35 minutes to complete the inventory by marking their
responses on a machine-scorable answer form.
The manual for the third edition of the Strong-Campbell Interest Inventory (Campbell and
Hansen, 1981) notes that it can be used in vocational counselling, as a selection device for
employment decisions , as a tool for understanding job dissatisfaction, for research on groups
such as studying characteristics of particular occupations, in relation to change in groups or
institutions , to investigate societal trends , examine change within an individual, and to look
at cross-cultural influences . It is suggested the inventory is potentially useful in research in

2 1 8
the identification of homogeneous types, the understanding of influences o n career
development, for a census of interest patterns, for studying interpersonal relationships and the
behavioural-type composition of groups and helping to design jobs around interests . The
user's guide (Hansen, 1984) claims the SCII can be used with anyone in need of career or
lifestyle guidance in schools and universities , by industry, by private institutions and
government agencies and by the military. She claims it is one of the most widely used of all
psychological inventories, for both vocational and avocational purposes . Hansen (op.cit.) also
notes that because consistency within occupations across cultures has been demonstrated (that
is , the likes and dislikes of, for example, engineers, lawyers, accountants and physicians are
similar across cultures) the SCII is used in similar settings outside the United States of
America.
Scoring
The answers are computer scored only, resulting in a profile of scores on a number of scales
accompanied by three main types of interpretive information. The SCII gives the respondent
scores on: six General Occupational Themes to reflect their overall occupational orientation;
scores on 23 Basic Interest Scales , reporting consistency of interests or aversions in specific
areas , such as art, science, or public speaking; and scores on 162 Occupational Scales which
show degree of similarity between the respondent's interests and the characteristic interests
of men and women in a wide range of occupations .
The answer forms were forwarded to the author of the 1985 Revision of the Strong
Vocational Interest Blank (Hansen, 1984; 1985) who arranged computer scoring and the
return of the profiles .
Reliability and validity
For the Occupational Scales the test-retest reliability statistics of three samples produced
median correlations at two week, 30-day, and three year intervals to be . 9 1 , . 89, and . 87,
respectively. Concurrent validity in contrasting the occupational criterion samples and the
reference samples (Men-in-general or Women-in-general) looked at the percentage of scores
in one sample matched by scores in the other. the median overlap for Occupational Scales is
34 % or 2 standard deviations of separation which corresponds to a difference between the
16th and the 86th percentiles thus representing a large separation. The predictive validity for
219
the Occupational Scales was found to be reasonable, with a half to three quarters entering
occupations predicted from earlier SVIB-SCII scores .
For the Basic Interest Scales content validity was evident, each scale focusing on a content
area. The test-retest reliability statistics produced median correlations at two weeks, 3 0-days,
and three years of .91 , .88, and . 82 , respectively. Although lower, the median coefficients
of .56 for high school and .68 for college students , in contrast to that of . 82 for adults, still
were considered sufficiently high to warrant their use with young adults . The test-retest
correlations for the General Occupational Themes were .91 , . 86 , and . 8 1 , for the two week,
thirty day and three year periods, respectively.
The concurrent validity of the Basic Interest scales expected individuals to score highly on
scales relevant to their own occupation. Occupational scores on each scale were generally
spread over 2 to 2 .5 standard deviations or a range of 20 to 25 points . This was taken as
��evidence of the scales discriminating among occupations. The scores on scales were said to
be substantially related to the occupations individuals pursued. The Basic Interest Scales
predictive validity, because of the nature of the scales , do not allow detailed predictions or
the tallying of hits and misses , but students with a high score on one scale have tended to take
up an occupation of that character. Some scale scores were less predictive than others . The
more consistent the pattern across a profile the more predictive it has been shown to be.
Consistency between scores on the Basic Interest Scales and their Occupational Scales has
been associated with greater accuracy.
One reviewer has noted that millions of copies of the SCII have been sold and thousands of
studies relating to it undertaken but that firstly, it is a sex restrictive instrument, the number
of career options suggested to males and females being disproportionate, and secondly, that
the predictive validity of the SVIB is less than reported by Strong. The concurrent validity
was also found to be less than that reported by Strong with a hit rate of 50% . Low scores
were found to be as predictive or more predictive of occupational membership than high
scores (Crites , 1978) . Dolliver (1978) viewed the secrecy regarding the scale content as an
inconvenience which might be small for the practitioner but very large for the researcher.
However, he believed the SCII met most of the criteria of an unbiased test by using gender
neuter terms, and by including some nontraditional female and male occupations . He
concluded that The SCII was the best vocational interest inventory available although thought
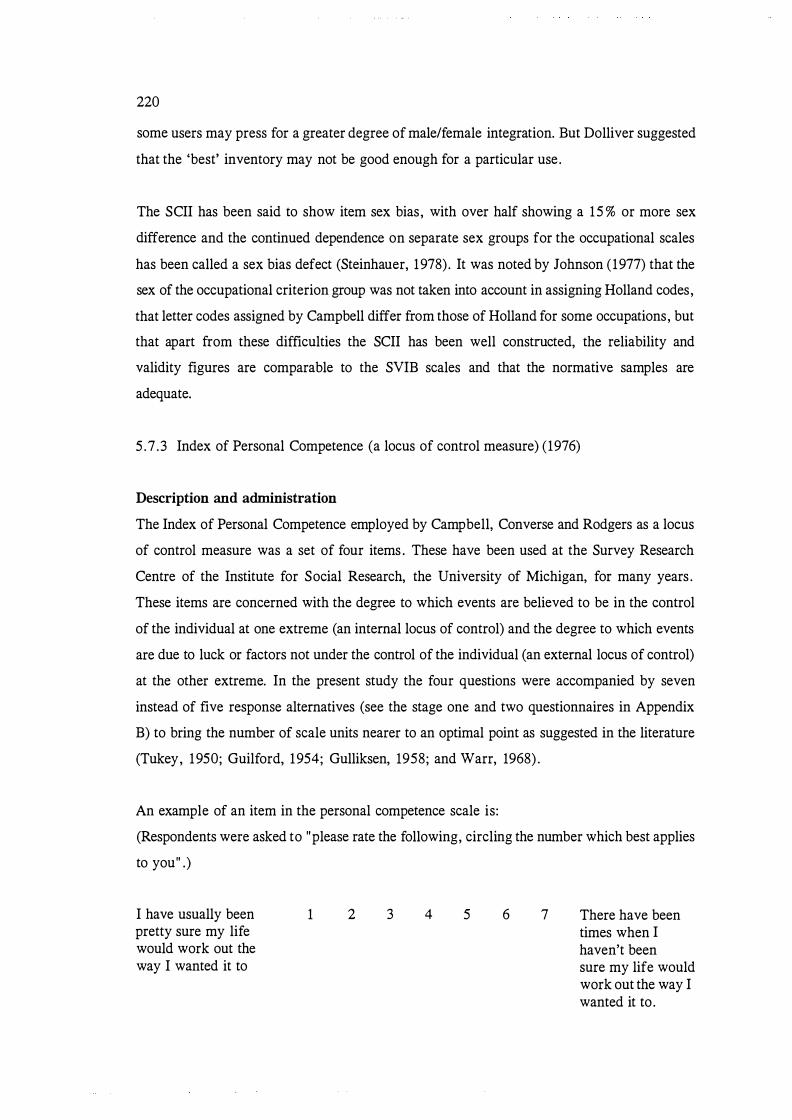
220
some users may press for a greater degree of male/female integration. But Dolliver suggested
that the 'best' inventory may not be good enough for a particular use.
The SCII has been said to show item sex bias , with over half showing a 15 % or more sex
difference and the continued dependence on separate sex groups for the occupational scales
has been called a sex bias defect (Steinhauer, 1978) . It was noted by Johnson (1977) that the
sex of the occupational criterion group was not taken into account in assigning Holland codes,
that letter codes assigned by Campbell differ from those of Holland for some occupations, but
that apart from these difficulties the SCII has been well constructed, the reliability and
validity figures are comparable to the SVIB scales and that the normative samples are
adequate.
5 .7 .3 Index of Personal Competence (a locus of control measure) (1976)
Description and administration
The Index of Personal Competence employed by Campbell, Converse and Rodgers as a locus
of control measure was a set of four items . These have been used at the Survey Research
Centre of the Institute for Social Research, the University of Michigan, for many years .
These items are concerned with the degree to which events are believed to be in the control
of the individual at one extreme (an internal locus of control) and the degree to which events
are due to luck or factors not under the control of the individual (an external locus of control)
at the other extreme. In the present study the four questions were accompanied by seven
instead of five response alternatives (see the stage one and two questionnaires in Appendix
B) to bring the number of scale units nearer to an optimal point as suggested in the literature
(Tukey, 1950; Guilford, 1954; Gulliksen, 1958; and Warr, 1968) .
An example of an item in the personal competence scale is:
(Respondents were asked to "please rate the following, circling the number which best applies
to you" .)
I have usually been pretty sure my life would work out the way I wanted it to
1 2 3 4 5 6 7 There have been times when I haven't been sure my life would work out the way I wanted it to .
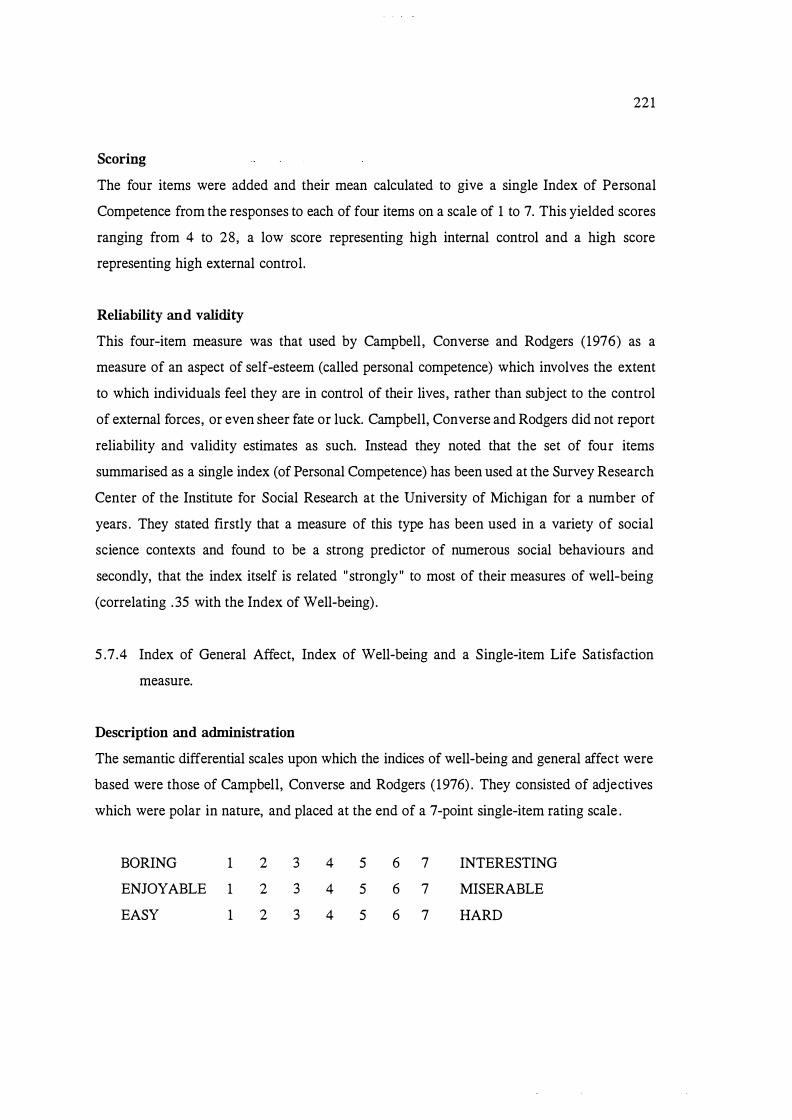
221
Scoring
The four items were added and their mean calculated to give a single Index of Personal
Competence from the responses to each of four items on a scale of 1 to 7. This yielded scores
ranging from 4 to 28, a low score representing high internal control and a high score
representing high external control.
Reliability and validity
This four-item measure was that used by Campbell , Converse and Rodgers (1976) as a
measure of an aspect of self-esteem (called personal competence) which involves the extent
to which individuals feel they are in control of their lives, rather than subject to the control
of external forces, or even sheer fate or luck. Campbell, Converse and Rodgers did not report
reliability and validity estimates as such. Instead they noted that the set of four items
summarised as a single index (of Personal Competence) has been used at the Survey Research
Center of the Institute for Social Research at the University of Michigan for a number of
years . They stated firstly that a measure of this type has been used in a variety of social
science contexts and found to be a strong predictor of numerous social behaviours and
secondly, that the index itself is related "strongly" to most of their measures of well-being
(correlating . 35 with the Index of Well-being) .
5 .7.4 Index of General Affect, Index of Well-being and a Single-item Life Satisfaction
measure.
Description and administration
The semantic differential scales upon which the indices of well-being and general affect were
based were those of Campbell, Converse and Rodgers (1976) . They consisted of adjectives
which were polar in nature, and placed at the end of a 7-point single-item rating scale .
BORING 1
ENJOYABLE 1
EASY 1
2
2
2
3
3
3
4
4
4
5
5
5
6 7
6 7
6 7
INTERESTING
MISERABLE
HARD

222
Respondents were asked to circle the point on each scale which provided the best
representation of their description of the concept, as in the first three scales given above. The
second, third, fifth, sixth, and final scale were reversed in order to "minimize the effect of
any tendency to simply check boxes down a column, ignoring distinctions among the adjective
pairs " (Campbell, Converse and Rodgers, 1976, p 38).
Like Camp bell et al, in order to provide a measure relating more to the concept of happiness
than satisfaction, a single item measure of happiness was used. This was derived from Gurin,
Veroff, and Feld's mental health study (1960) and the work of Bradburn (1960) . Campbell
et al's 7-point scale global measure of life satisfaction was used, that is , "How satisfied are
you with your life as a whole these days? "
The semantic differential scales were used by Campbell et al as a way of assessing perceived
quality of life. Respondents were asked to respond to adjective pairs about a sense of
achievement or disappointment in life, with the aim of providing more qualitative detail by
giving a more differentiated image of the meaning of the global responses to the satisfaction
and happiness items . The different ways in which Camp bell et al combined these semantic
differentials were also adopted here.
Scoring
Their Index of General Affect was calculated by taking the mean of individuals ' scores on the
eight items which have been found to be highly correlated. Their composite index of Well
Being combined the eight life descriptions . The "free vs tied down" and "easy vs hard" items
were excluded because they were not highly correlated to other items . They excluded the
happiness measure from the Index of well-being. The happiness measure was -
Taking all things together, how would you say things are these days? Would you say you
are:
1 . very happy
2. pretty happy
3 . not too happy.
This measure was excluded from the Index of Well-Being because it fitted the major cluster
of semantic differential items less well than the life satisfaction measure and was found to be
a less reliable measure.
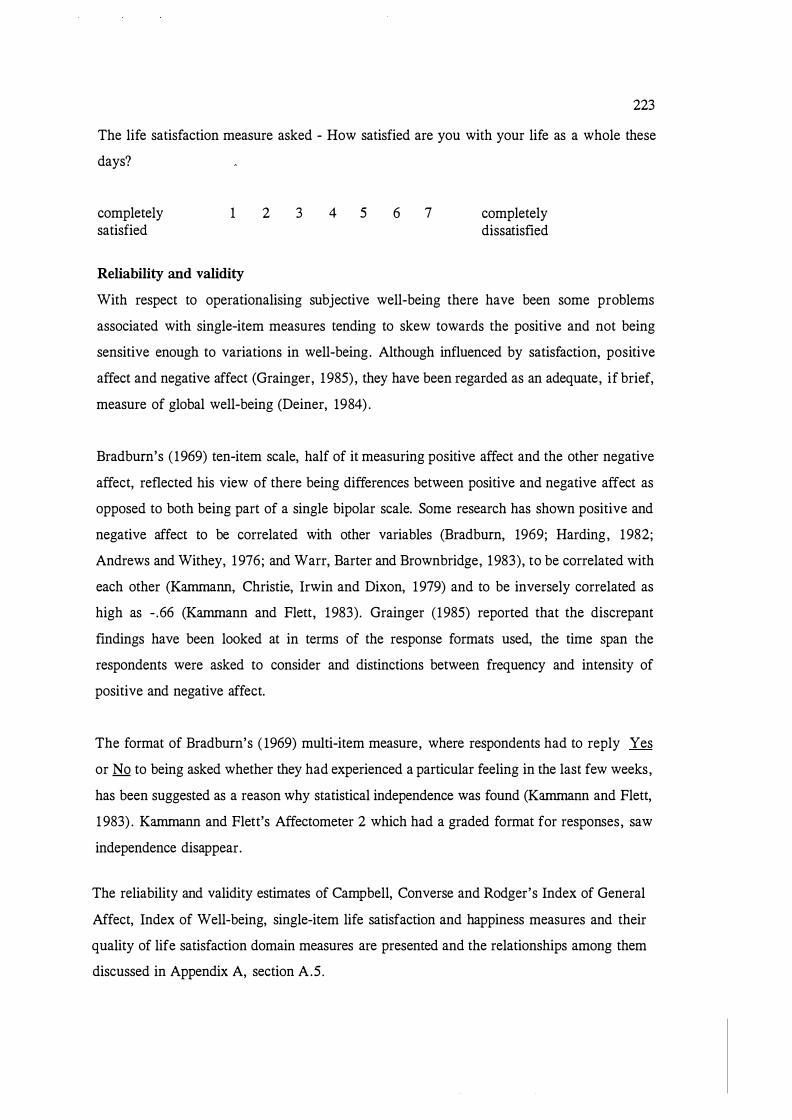
223
The life satisfaction measure asked - How satisfied are you with your life as a whole these
days?
completely satisfied
1
Reliability and validity
2 3 4 5 6 7 completely dissatisfied
With respect to operationalising subjective well-being there have been some problems
associated with single-item measures tending to skew towards the positive and not being
sensitive enough to variations in well-being. Although influenced by satisfaction, positive
affect and negative affect (Grainger, 1985) , they have been regarded as an adequate, if brief,
measure of global well-being (Deiner, 1984) .
Bradbum's ( 1969) ten-item scale, half of it measuring positive affect and the other negative
affect, reflected his view of there being differences between positive and negative affect as
opposed to both being part of a single bipolar scale. Some research has shown positive and
negative affect to be correlated with other variables (Bradbum, 1969; Harding, 1982;
Andrews and Withey, 1976; and Warr, Barter and Brownbridge, 1983), to be correlated with
each other (Kammann, Christie, Irwin and Dixon, 1979) and to be inversely correlated as
high as - .66 (Kammann and Flett, 1983). Grainger (1985) reported that the discrepant
findings have been looked at in terms of the response formats used, the time span the
respondents were asked to consider and distinctions between frequency and intensity of
positive and negative affect.
The format of Bradbum's ( 1969) multi-item measure, where respondents had to reply Yes
or No to being asked whether they had experienced a particular feeling in the last few weeks,
has been suggested as a reason why statistical independence was found (Kammann and Flett,
1 983) . Kammann and Flett's Affectometer 2 which had a graded format for responses, saw
independence disappear.
The reliability and validity estimates of Campbell, Converse and Rodger's Index of General
Affect, Index of Well-being, single-item life satisfaction and happiness measures and their
quality of life satisfaction domain measures are presented and the relationships among them
discussed in Appendix A, section A.5 .

224
5 . 8 Measures developed or modified for the present research
5 . 8 . 1 Self-efficacy instrument
Description and administration
A set of self-efficacy items was developed for this study, a copy of which is in Appendix A .
It seemed appropriate to use the need statements from the Minnesota Importance
Questionnaire (MIQ) and satisfaction statements from the Minnesota Satisfaction
Questionnaire (MSQ)8 as a starting point in the development of a self-efficacy measure
related to the importance and satisfaction of vocational needs.
Similarly, the self-efficacy measure for satisfactoriness in the work setting was based upon
items9 of the Minnesota Satisfactoriness Scale (MSS). Because the MIQ, the MSQ and the
MSS are based on the same items (although the latter has additional dimensions and the same
number of factors have not been extracted for each instrument), the two self-efficacy
measures relating to satisfaction and satisfactoriness were developed using the same basic
items and dimensions of the MIQ, and the MSQ. Each of the items in the instruments could
have been converted to questions about self-efficacy in relation to all the need, the satisfaction
and the satisfactoriness statements . However, the relevant instruments each had too many
items to be included in their entirety as part of a larger questionnaire. Therefore, only some
of the statements from each of the instruments were chosen. Certain criteria were applied in
making this choice. In the case of the MIQ at least two, those with the highest varimax factor
loadings, from each of its six factors were included.
The self-efficacy expectations about needs were operationally defined by specifying the
domain of work adjustment related behaviours and asking the degree of confidence (on a scale
of 0 to 7 of No confidence to Complete Confidence) respondents had about being satisfied
in relation to each aspect of work investigated.
The items constructed to assess self-efficacy for obtaining job satisfaction were also chosen
to be representative of the six factors found to underlie work needs and the two satisfaction
factors (extrinsic and intrinsic) extracted for the MSQ. At least two MIQ items, based on high
8 See Appendix H for needs and satisfaction statements
9 See Appendix I
225
factor loadings , from each factor were included for later assessment of internal consistency.
Also more than one item was needed to provide multiple indicators for the structural equation
modelling of the LISREL approach. Where more than two statements loaded highly on a
factor, a third need or satisfaction statement was used giving 15 need related self-efficacy
statements in total . The dimension of lifestyle (Nicholson, 1984) as a vocational need was
added.
In constructing items to assess self-efficacy for being a satisfactory worker the five subscales
of the MSS were represented in the self-efficacy statements, that is , general satisfactoriness ,
performance, conformance, dependability and personal adjustment. The items included were,
following standard work rules and procedures, performing repetitive tasks when necessary,
producing work to a good standard, working as a member of a team, getting along with
supervisors , adapting to changes in procedures and methods , maintaining a low rate of
absenteeism, being promotable, adjusting to a new club or organisation and adapting to a new
city or town. Bandura's notion of generality was included, as represented by the two latter
items above.
The self-efficacy scale also included assessment of self-efficacy for using the different work
adjustment styles . The scale was based on improved definitions of the styles which arose from
the pilot study. The four dimensions of active, reactive, flexibility and perseverance were
explored via the self-efficacy items , "actively change aspects of my job and the work
environment when needed" , "change my views and attitudes, if required" , " tolerate
dissatisfaction with my job for some time before acting, " try to improve my work situation
rather than leaving" . These statements reflected self-efficat;y for the use of the active and
reactive adjustment modes, self-efficacy for when the adjustment modes would be used, that
is flexibility, and self-efficacy for the length of time a mode or modes would be in operation,
that is perseverance. Of the 29-item self-efficacy instrument, 15 items were concerned with
work need dimensions, eight with satisfactoriness , four with adjustment styles and two with
generalised self-efficacy expectations .
In designing the form of the self-efficacy scale, the different methods of measuring self
efficacy which have been used were reviewed. The principal research in the area, that of
Bandura ( 1977) , used a lOO-point probability scale which placed items in order of difficulty,
varied their specificity, and required subjects to rate the degree of confidence associated with
achieving a particular task. This was done to account for the three identified dimensions of
magnitude or level, generality, and strength, respectively. Similarly Betz and Hackett' s ( 1983)
226
10-point scale covered specific mathematical problems, everyday mathematical tasks, and
mathematics related course work when subjects were asked to rate the degree of confidence
they had in achieving the various tasks .
The measure of self-efficacy expectations involved the use of four items of a Likert-type
format with a five point response range ( 1 = strongly disagree, to 5 = strongly agree) .
Examples of the items are: "I am confident of my interviewing abilities " , "I know I present
myself well in interviews" , and "I tend not to perform well in interviews " (p 7) . In the study
most subjects had experienced being interviewed and could therefore respond to all items .
However, Bandura (1977) has postulated that one of the ways in which self-efficacy
expectations could be developed is through vicarious learning.
The three different scales usually employed in measures of self-efficacy expectations then vary
in their type, number of items and number of units employed. The scales are Bandura's
(1977) lOO-point probability scale, Betz and Hackett's (1983) 10-point confidence scale and
Brief, Stumpf and Hartman's (1983) 5-point Likert scale .
Criticisms have been made about the measurement of self-efficacy. Clement (1987) has stated
that the main flaw in the work of Hackett and Betz ( 1981) resides in their measurement of
self-efficacy. They measured self-efficacy level, whether or not the individual feels capable
of the behaviour, and self-efficacy strength, the confidence in the capability. The former was
measured by asking subjects if they could carry out the duties of various occupations
successfully. Those who reported they could were asked to show on a scale of 1-10 their
degree of confidence in being able to carry out the duties . This was the measure of self
efficacy strength. This way of measuring self-efficacy was thought to make little sense
(Marziller & Eastman, 1984) , because if the subject reports they can do the job of an
accountant (self-efficacy level) , and then rates their confidence in their ability to do the job
(self-efficacy strength) as 1 (completely unsure) this is the same as saying "I can do the job,
but I am completely unsure whether I could do that job " . Clement regarded the obvious
solution to this problem to be a single-judgement format which includes a zero to indicate "I
could not do that" judgement. Bandura (1984) continued to claim the validity of separate level
and strength measurements but admitted to using single-judgement format with a scale ranging
from 1-100 in some situations . In Betz's later work on self-efficacy, a single-judgement
measure was used (Betz & Hackett, 1983; and Taylor & Betz, 1983) .
227
Clement ( 1987) was also critical of Betz and Hackett apparently misconstruing the effects of
level and strength self-efficacy. They had reported that Bandura expected the level of self
efficacy expectations would influence the behaviours attempted and those avoided. Self
efficacy strength, on the other hand, would influence the persistence of behaviour. For these
reasons, Betz and Hackett's research, concerned with career choice, focused on self-efficacy
level. However, Clement ( 1987) maintained that Bandura ( 1977) had not made these strict
causal interpretations of findings as Hackett and Betz had suggested (that is , that self-efficacy
strength affects persistence and self-efficacy level affects choice of activities) . Clement argued
that Hackett and Betz's reliance on level measurement was more constrained than when a
single-judgement format is used because the relationship between self-efficacy level and the
outcome variable of the range of career options, is likely to be inflated. This is because of
the desire for subjects to appear consistent (Festinger, 1957; and Schlenker, 1980) . To be
consistent one cannot say both "I could not do that job " (on a self-efficacy scale measuring
level) and "I have seriously considered doing that job" (in rating their confidence in their
ability to do the job) that is , on a self-efficacy scale measuring strength). Betz and Hackett's
lack of reliability and validity data for their self-efficacy measures came under criticism also .
Clement ( 1987) herself used a 0 (no confidence at all) to 10 (complete confidence) scale in
response to the question "How confident are you that you could competently do the job of a
. . . " There does seem to be a move away from using two separate scales to measure strength
and level of self-efficacy to using a single scale which incorporates both. Level is represented
by having a zero = "I cannot do that job" response category and strength is represented by
having scale values up to ten = "I am completely confident I can . . . " Thus the potential
conflict of responding in a certain way on one scale to be consistent with the way responses
were made on the other scale, is eliminated.
Although Brief, Stumpf and Hartman (1983) in their 5-point Likert scale accounted for
Bandura's dimension of strength they did not employ a measure of magnitude nor generality
in the self-efficacy items themselves . A measure of magnitude would have required an
ordering of tasks according to their respective level of difficulty and if interviewing is thought
of as a single task then obviously because only one task is being performed ordering of tasks
would not be possible. If interviewing performance is regarded as being made up of numerous
sub-tasks or components then these components would first need to be identified, ordered,
and a multiple-item measure developed. A potential difficulty is that there may not be a
generally agreed upon hierarchy of difficulty of tasks which is intrinsic to interviewing
behaviour.

228
In the case of the present self-efficacy instrument the three dimensions of strength, generality
and magnitude were considered. A single-judgement format which included zero was used.
Requiring subjects to rate self-efficacy statements in terms of the degree of confidence
(ranging from 0 = no confidence, to 8 = complete confidence) associated with achieving
both specific statements and more general ones, was a measure of the strength dimension. The
generality criterion was met to a certain extent by including items concerned with situations
outside work, such as "adjust to joining a new club or organisation" . Subjects were asked to
rate statements in view of the employment position they expected to obtain upon completion
of their studies . Since the items were specific to employment in the future generally rather
than to a particular job, they could be seen as satisfying the generality criterion. The third
dimension, that of magnitude, was not included because of the lack of an apparent order in
the difficulty of items . In relation to self-efficacy expectations for obtaining work needs, and
for adjusting to employment, an identifiable universal ordering of difficulty of achieving work
needs may not exist. Some needs may be considered more important than others by most
individuals, but a consistent ranking of needs by everybody would be highly unlikely.
A nine-point scale ranging from 0 to 8 was chosen for the present self-efficacy scale, based
on the recommendations of Guilford (1954) to use scales greater than seven; of Gulliksen
(1958) to increase the length of semantic differential scales; and of Warr (1968) for the need
to increase reliability and to provide a mid-point in the scale. In keeping with Guilford's
(1954) recommendations, questions involving the form scales should take are best determined
empirically. The use of the self-efficacy scale in the present study was exploratory and
alterations could be expected for future use following empirical examination.
Scoring
Each of the 29 items were scored according to weights (0 to 8) respondents had assigned. The
first 27 individual scores can be combined to give a mean of overall self-efficacy, and a mean
can be calculated for the two items relating to general self-efficacy for adjustment to new
situations (the last two items) .
Reliability and validity.
No previous reliability and validity data was available for this instrument because it was
designed for the present study.

229
5 .8 .2 Social support measure
Description and administration
The instrument to measure social support was based upon Vogue's (1983) questionnaire which
measured social support. His questions were given in a modified form and in a more
economical manner of presentation. Rather than asking the same question repeatedly , seven
times, each in relation to a different support person, the questions and response alternatives
were presented in matrix form. Each question was written once with the support roles of
wife, friends et cetera listed as rows of a matrix and the response alternatives as columns,
refer Appendix B . For example the question relating to "I can ask for help from my wife, I
can ask for help from my girlfriend/boyfriend etc . . . " was presented as follows:
very true
wife/husband
girl/boyfriend
friends
neighbours
relatives
boss
workmate
Note. aN.A. = Not applicable
somewhat a little not too true true true
Figure 5 .3 The matrix format for the social support questions
not at all N.A.a true
Questions 1 to 9 were in a matrix format as shown in Figure 5 .3 . The questions were to do
with how things were going for the respondent, who goes out of their way to be helpful to
them when they are down, whom can be asked for help, with whom personal concerns and
difficulties are talked about, whom can be talked to about pressures and strains , whom can
be relied upon, and with whom relationships are superficial. Questions 8 and 9 were to do
with reasons why an individual may not talk to others , the first because they are afraid that
person will lose respect for them, and the second because they do not want to burden that
person or persons.
230
The remaining social support questions were to do with having someone to talk about personal
problems with, whether at least one other is talked to, whether someone other than a person
in an intimate relationship is talked to, whether there are friends who can be visited when
respondents are feeling deflated in mood, and whether respondents have a number of close
friends in the community where they live, whether respondents prefer to keep their worries
to themselves and whether they actually do keep their worries to themselves .
Scoring
The questions in matrix format were scored 1 to 5 for (very true to not at all true) . The not
applicable option was coded 6 in the scoring process. The questions 10 to 1 8 in this section
of the questionnaire had response options of YES or NO and were coded 1 for YES and 2 for
NO. These represented the presence or absence of social support.
5 .9 Statistical analyses
Basic descriptive statistics , frequencies, percentages, measures of central tendency (modes ,
medians and/or means) and where appropriate standard deviations, were calculated first, to
allow for a descriptive analysis of the responses . These are reported in Appendix M. The raw
data itself is archived at The New Zealand Social Research Data Archive at Massey
University, New Zealand. Correlation coefficients were used to examine the associations
among the variables studied as specified in the propositions and hypotheses and r square
calculated to assess the proportion of variance accounted for in these relationships . Multiple
regression analysis and Multiple analysis of Variance techniques were used to investigate
propositions and hypotheses , look at causal relationships , the effect of variables on each other
and the amount of variance accounted for. Confirmatory factor analysis via LISREL was used
to see if the factor structure of work needs as proposed by Dawis and Lofquist was replicated.
A covariance structure model was applied to examine the latent structure and
interrelationships of aspects of Dawis and Lofquist's theory and the structure of work need
factors of the respondent group was analyzed using both LISREL and Factor analysis .
LISREL is described in section 8.2 and Appendix K. The choice of factor analytic models is
discussed next.
The purpose of using factor analysis is usually to aid conceptualisation by summarizing
interrelationships among variables in a concise but still accurate way. This is attempted by
23 1
including the maximum amount of information from the original variables in as few derived
variables (or factors) as possible. Any relationship is recognised as having a limited area of
applicability. Areas which are qualitatively different and which therefore do not generalise
to other areas are referred to as separate factors. The extent to which generalisability is found
between each variable and factor is calculated and referred to as a factor loading. The further
the loading is from zero, the more we are able to generalise from the factor to the variable .
The statistical linear model includes all of regression analysis and analysis of variance and
becomes the multivariate linear model when it is used to predict more than one dependent
variable. The only assumption of the linear model is that the variables are linear functions of
the factors. The variables themselves do not have to be linearly related. The factor analytic
model of the present research, the multivariate linear factor model, itself has variants , the two
most common being the full component model and the common factor model. Within these
two classes of models a division can be made according to whether the factors are assumed
to be correlated or uncorrelated. The full component model occurs when one factors for all
components . It is assumed that a set of factor scores exist which exactly reproduce the
original variables . Any error observed is due to the inaccuracy of the model for that particular
sample.
Full component analysis was not used herein because it is seldom of use for empirical
research because observed data are not regarded as infallible. However, the model can be
used to look at the question of sampling error. It is also used to obtain a set of intercorrelated
variables from variables which are correlated only moderately. However, a truncated
components model is more likely to be used where only some of the components are used to
estimate the original variables . The smaller components are then interpreted as due to the
inaccuracy in the model's fit for the sample in question. The common factor model is divided
into the common factors which are those factors which contribute to two or more of the
variables, that is, several variables have these factors in common. However variables will
usually not be able to be calculated from the common factors alone but will be influenced by
other independent sources . Gorsuch (1983) notes these sources may be "legitimate causal
influences that are not affecting the other variables , systematic distortions in the scores
(usually called bias) or random error from inaccuracies of measurement" (p 26) . The
noncommon factor variance for each variable is often of less interest being usually thought
of as detracting from accurately computing variable scores from common factors . However,
232
the noncommon factor variance is summarized in a unique factor that includes the scores
needed to predict that variable. The proportion of the variance of a variable which can be
accounted for by the common factors is known as the variable's communality.
Component and common factor models can be correlated (which is considered the more
general form) or uncorrelated. Correlated models are referred to as oblique or nonorthogonal
as opposed to orthogonal for uncorrelated models (from the rotation of factors represented
geometrically in the general Cartesian coordinate system). This system allows the axes (or
factors) to form an oblique angle and thus be correlated. Gorsuch (op. cit.) gives an example
of the correlated form noting that if abilities are analyzed, verbal and numerical ability factors
could occur that would not be independent of each other. However, if factors overlap
extensively, as shown by factors with high intercorrelations (above .7) they may be of little
theoretical interest. In the uncorrelated model terms such as factor coefficient and factor
loading are clearer because the factor structure10 is equal to the factor pattern" for standard
scores .
The principal factor model which is used by Dawis and Lofquist in relation to work needs,
is a general one that can be used with either the component or common factor model . For the
component model the principal factor method is applied to the correlation matrix with unities
in the diagonal . Each factor accounts for the maximum amount of variance of the variables
being factored. Gorsuch describes the process clearly by saying the first factor extracted from
the correlation matrix is comprised of "that weighted combination of all variables that will
produce the highest squared correlations between the variables and the factor because the
squared correlation is a measure of the variance accounted for" (p 95) . There is no correlated
version of the procedure but the principal factors can be rotated to correlated or noncorrelated
criteria.
As well as using the principal factor solution the Maximum Likelihood Factor Analytic model
was applied in the present research. Principal factors as normally extracted are based on
equations for which it is assumed that the population correlation matrix is being factored. In
Maximum Likelihood procedures it is explicit that a sample is being analyzed and the
10 A variable's correlations with a set of factors.
1 1 The factor pattern consists of the weights which summarize the relative contribution of each factor to the variable.

233
procedures are defined as those that best reproduce the population values . It was for this
reason it was used in the present research. It is regarded as a variant of the principal factor
solution. When exploratory and confirmatory Maximum Likelihood criteria are used to
provide a unique solution of factors , further mathematical limits are set. These limits are in
the principal factor tradition of accounting for as much variance as possible in each of the
successive, orthogonal factors with the Maximum Likelihood specifications . As with Principal
Factor methods the Maximum Likelihood solution can be rotated to correlated
(nonorthogonal) or noncorrelated ( orthogonal) criteria.
In the present research for purposes of comparison both Principal Factors and Maximum
Likelihood solutions were applied to analyses where factor analysis was used and each
solution rotated to orthogonal and then nonorthogonal criteria. The questions Gorsuch ( 1 983)
posed in relation to choosing among factor-analytic models were considered, that is whether
using different models produced noticeably different results (and if so which mathematical
model is the most appropriate given the relevant substantive theory) and whether there were
major differences in the cost (for example, in computer time) of using an expanded model .
Maximum Likelihood procedures are no longer as costly to conduct with modem computer
programmes and hardware and were comparable to Principal Factoring in computing time.
The Maximum Likelihood procedure is also one of the procedures used in LISREL herein,
this being another reason for using it as well as Principal Factors when factor analysis was
performed, thus allowing for possible comparison with LISREL results .
More generally, Hage (1982) noted that in order to develop more complex models and to
move beyond a linear and additive conception of work adjustment theory ' organ-
isational research designs have tended to add more and more variables until there is no further
increase in the explanation of variance. It is the combination of regression analysis and linear
hypotheses which is said to have lead to the acceptance of theory which consists of adding
more and more concepts . One of the common mistakes made, according to Hage, is to
assume that adding more variables produces greater understanding. This is said to be an error
in the linear, additive model of regression analysis in that adding more variables does not
automatically increase understanding and the amount of variance explained tends not to
increase after a certain point . Most researchers are said to find that once 50 % of the v ariance
has been explained, it is difficult to move past that barrier, irrespective of the number of
variables added. Hage instead, advocates being concerned with a few key concepts which are

234
combined in non-linear ways, involving curvilinear relationships or polynomic functions .
Hage noted that the introduction of even a single variable from a separate paradigm or
theoretical orientation has been fruitful in breaking the 50% barrier. He stated that the
addition of the previous history of change as a variable along with another variable from a
different paradigm was shown to raise the amount of variance explained to 70 % in helping
to account for the rate of innovation in organisations .
The small cell frequencies apparent in many of the tables in chapter six were not a major
cause of concern because the use of the Chi-Square statistic here involved analyses at a
descriptive level. Although these pertained to the central aims of the research they were not
crucial to nor involved the formal testing of hypotheses and models . However, a precaution
was automatically taken. In calculating chi-square to allow for small cell frequencies the
computer programme used (SPSSx) computes Fisher's Exact Test12 • Also by using Cramer's
V the influence of the degrees of freedom (often large in this case) is minimised. With respect
to the Chi-square statistics themselves the use of the Likelihood Ratio Chi Square allows us
to feel more confident about conclusions concerning interdependence among variables because
it does not just consider the null hypothesis . The Likelihood Chi Square Ratio compares the
estimated joint probability of occurrence of data under the conditions specified by the null
hypothesis with the corresponding probability for the alternative hypothesis . The measure
represents a ratio between the two likelihoods and has a chi-square distribution with the same
number of degrees of freedom. This ratio is compared with Pearson Chi Square on p 244.
All Chi-squares had been recalculated collapsing academic groups from eleven to five thus
giving larger cell frequencies (one example of which is given on page 297). However, no
differences, in which chi-squares were significant, resulted. It was preferable to preserve the
greater detail provided by the eleven academic categories in the cross-tabulations , particularly
in view of the nature of the variables under consideration.
12 SPSSx Users ' Guide (1983); Upton. G.J .G. (1978) . The analysis of cross-tabulated data. Chichester: Wiley and Sons .
235
CHAPTER SIX
RESULTS: DESCRIPTIVE FINDINGS
This chapter is divided into two main parts . The first part has two main sections (6 . 1 and
6 .2) . The first (section 6 . 1) is comprised of a descriptive analysis of the data relating to
background information about the sample which includes the composition of the sample,
parental data and the health, leisure and living circumstances of respondents . The description
employs frequency distributions, minimum and maximum values, the range, standard
deviations, the N involved for each variable, measures of central tendency and
intercorrelations . The second section (6.2) describes an analysis by academic groups of their
similarities and differences with respect to the background variables , ability measures , work
history and work situation variables .
The second part of the chapter (from 6.3 on) is also sectionalized. Section 6 .3 presents the
key statistics for the work adjustment variables (6. 3 . 1) , the correlates of the Dawis and
Lofquist variables studied here (section 6 .3 .2) and the key relationships of Dawis and
Lofquist's model examined in the present research (6 .3 .3). Section 6 .4 describes the
similarities and differences among the academic groups for the Dawis and Lofquist variables
of this study. Section 6 .5 presents the fmdings for the expanded model, the correlations
among the key variables. The academic group similarities and differences for the additional
variables of the expanded model are presented in sections 6. 6 and 6 . 7 . Within section 6 . 6 the
divisions are the work related variable of self-efficacy (6 .6 . 1), the non-work related variables
of quality of life satisfaction measures, (6 .6 .2) and leisure activities (6 . 6 .3) and the interaction
of the two areas , that is the relationship between leisure and work (6 .6 .4) and the subjective
well-being variable (6 .6 .5) . Section 6. 7 presents findings for the social support variables .
Descriptive statistics (means, medians , modes, standard deviations and N) for sections 6 . 3 to
6 . 7 are given in Appendix M while the distributions for the variables appear in the
discussions of the similarities and differences among the groups .
Chapter Seven gives the findings of the propositions and research hypotheses. These were
concerned with the propositions of Dawis and Lofquist, with the suggested changes and
additions to their model of the present research which were investigated and the constructs
introduced into their model in the present research. Chapter Eight gives results of the work
236
need factor structure analyses. It is concerned with the investigation of the factor or latent
structure of work needs using the LISREL and factor analytic approaches .
In this chapter (section 6 . 1) the respondent group is described using the demographic data and
background information obtained. The findings with respect to all of the variables are
described (section 6 .2) through the measures of central tendency, the minimum and maximum
values (to give the range), standard deviations, correlations coefficients and the N involved
in each calculation. Frequencies tables are given for some of the variables where, for
example, the distribution is unusual or better described in this form. The similarities and
differences among the respondent groups (the academic disciplines) for the variables are
detailed in section 6 . 3 .
6 . 1 Information about the sample
This section gives a descriptive analysis of the background information of the sample, that
is, the variables which are not part of Dawis and Lofquist's model or the expanded model of
this study. The information presented is the composition of the sample (section 6. 1 . 1) which
includes age, gender, marital status, education and health information, the respondents ' own
living circumstances and leisure activities, the educational background of respondents (section
6 . 1 .2) which includes school qualifications, number of years schooling and parental data
(section 6 . 1 . 3) which includes information about parents' occupations , their income and
qualifications and lastly, health, leisure and living circumstances (section 6 . 1 .4) which
includes information about such non-work activities .
6 . 1 . 1 Composition of the sample
The return rate for the first part of the longitudinal study was initially 66 % but was raised
to nearly 80 % following the reminder notes being sent. The details of the response rate for
each of the respondent categories are provided in Tables 5 .2 (frequency distributions for both
stages of the study) and 5. 3 (broad categorisation of respondents by academic subjects) . The
structure of the respondent group with respect to a number of variables, such as age and
gender, can be described as in the following account. The number of cases for each variable
is given because this varied according to how many answered the questionnaire item or items
pertaining to it.
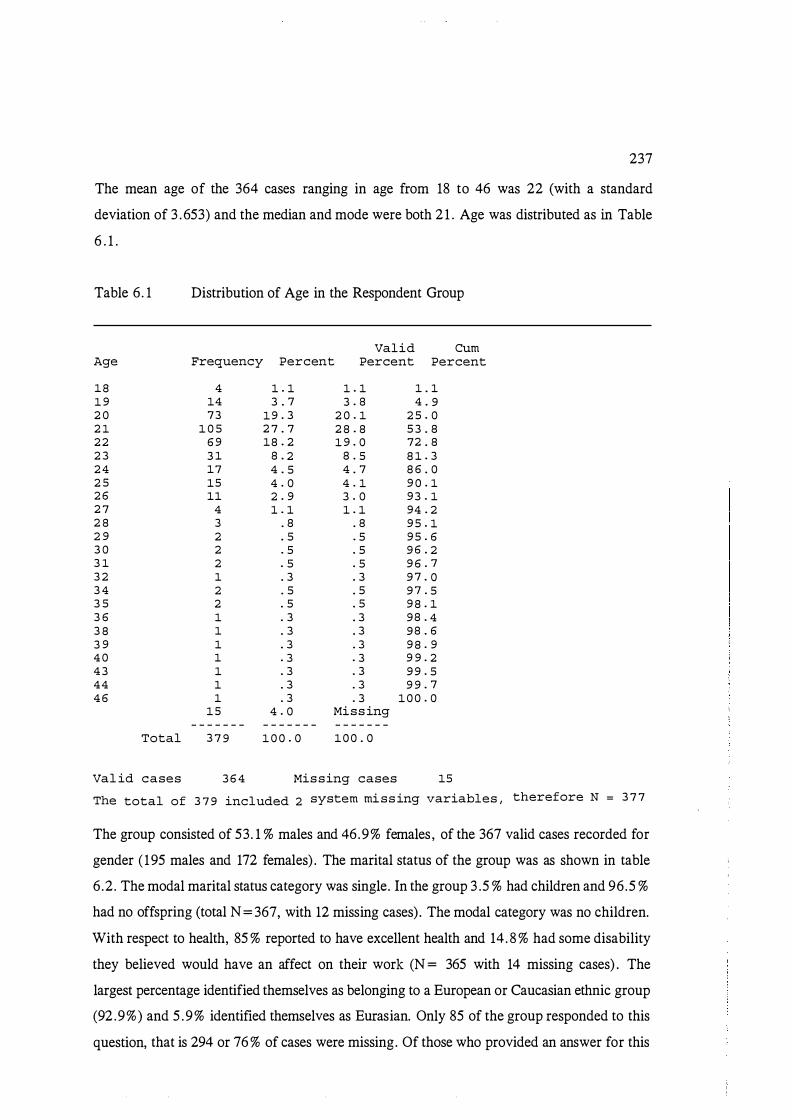
237
The mean age of the 364 cases ranging in age from 18 to 46 was 22 (with a standard
deviation of 3 . 653) and the median and mode were both 2 1 . Age was distributed as in Table
6 . 1 .
Table 6. 1 Distribution of Age in the Respondent Group
Val i d Cum Age Frequency Percent Percent Percent
1 8 4 1 . 1 1 . 1 1 . 1 1 9 14 3 . 7 3 . 8 4 . 9 2 0 7 3 1 9 . 3 2 0 . 1 2 5 . 0 2 1 1 0 5 2 7 . 7 2 8 . 8 5 3 . 8 2 2 6 9 1 8 . 2 1 9 . 0 72 . 8 2 3 3 1 8 . 2 8 . 5 8 1 . 3 2 4 1 7 4 . 5 4 . 7 8 6 . 0 2 5 1 5 4 . 0 4 . 1 9 0 . 1 2 6 11 2 . 9 3 . 0 9 3 . 1 2 7 4 1 . 1 1 . 1 9 4 . 2 2 8 3 . 8 . 8 9 5 . 1 2 9 2 . 5 . 5 9 5 . 6 3 0 2 . 5 . 5 9 6 . 2 3 1 2 . 5 . 5 9 6 . 7 3 2 1 . 3 . 3 9 7 . 0 3 4 2 . 5 . 5 9 7 . 5 3 5 2 . 5 . 5 9 8 . 1 3 6 1 . 3 . 3 9 8 . 4 3 8 1 . 3 . 3 9 8 . 6 3 9 1 . 3 . 3 9 8 . 9 4 0 1 . 3 . 3 9 9 . 2 4 3 1 . 3 . 3 9 9 . 5 4 4 1 . 3 . 3 9 9 . 7 4 6 1 . 3 . 3 1 0 0 . 0
1 5 4 . 0 Mi s s ing - - - - - - - - - - - - - - - - - - - - -
Total 3 7 9 1 0 0 . 0 1 0 0 . 0
Val id cases 3 6 4 Mis s ing cases 15
The total of 3 7 9 included 2 system mi s s ing variables , therefore N = 3 7 7
The group consisted of 53. 1 % males and 46.9% females , of the 367 valid cases recorded for
gender ( 195 males and 172 females) . The marital status of the group was as shown in table
6.2. The modal marital status category was single. In the group 3 .5 % had children and 96.5 %
had no offspring (total N= 367, with 12 missing cases) . The modal category was no children.
With respect to health, 85 % reported to have excellent health and 14. 8 % had some disability
they believed would have an affect on their work (N = 365 with 14 missing cases) . The
largest percentage identified themselves as belonging to a European or Caucasian ethnic group
(92 .9%) and 5 . 9 % identified themselves as Eurasian. Only 85 of the group responded to this
question, that is 294 or 76 % of cases were missing. Of those who provided an answer for this

238
question European was the modal category. Asking the nationality of respondents brought
a better response rate, with 367 valid cases and 12 missing. The distribution of nationalities
is shown in Table 6 .3 . The modal nationality category was New Zealand.
Table 6.2 The Marital Status of the Group
Val id Cum Value Label Frequency Percent Percent Percent
de facto 7 1 . 8 1 . 9 1 . 9 Engaged 6 1 . 6 1 . 6 3 . 6 Married 3 0 7 . 9 8 . 2 1 1 . 8 S ingle 3 2 2 8 5 . 0 8 8 . 2 1 0 0 . 0
1 4 3 . 7 Mis s ing
- - - - - - - - - - - - - - - - - - - - -
Total 3 7 9 1 0 0 . 0 1 0 0 . 0
The total included 2 sys t em miss ing variab l e s , therefore total N 3 7 7
Table 6.3 Distribution of Nationality in the Respondent Group
Value Label
New Zealander British Dutch Vie tnames e Aus t ralian S ingaporean Papua New Guinean Sri Lankan Malaysian Fij ian
Total
Frequency
3 3 1 9 3 2 1 4 1 2 2 1
2 3
- - - - - - -
3 7 9
Percent
8 7 . 3 2 . 4
. 8
. 5
. 3 1 . 1
. 3
. 5
. 5
. 3 6 . 2
- - - - - - -
1 0 0 . 0
Val i d Cum Percent Percent
9 0 . 2 9 0 . 2 2 . 5 9 2 . 6
. 8 9 3 . 5
. 5 9 4 . 0
. 3 9 4 . 3 1 . 1 9 5 . 4
. 3 9 5 . 6
. 5 9 6 . 2
. 5 9 6 . 7
. 3 9 7 . 0 Mis s ing 1 0 0 . 0
- - - - - - -
1 0 0 . 0
The total included 2 sys tem m i s s ing vari ab l e s , therefore total N 3 7 7
6 . 1 .2 Educational background of respondents
The respondents varied to a limited extent in the number of years schooling they had
received. Of the 367 valid responses to this question the largest percentage (69. 8) had
attended a secondary school for five years . The next most frequent number of years at
secondary school was four ( 19 .3 %) . The minimum number attended was three years and the
maximum nine, giving a range of six years for the group . The mean number of years was 4.9
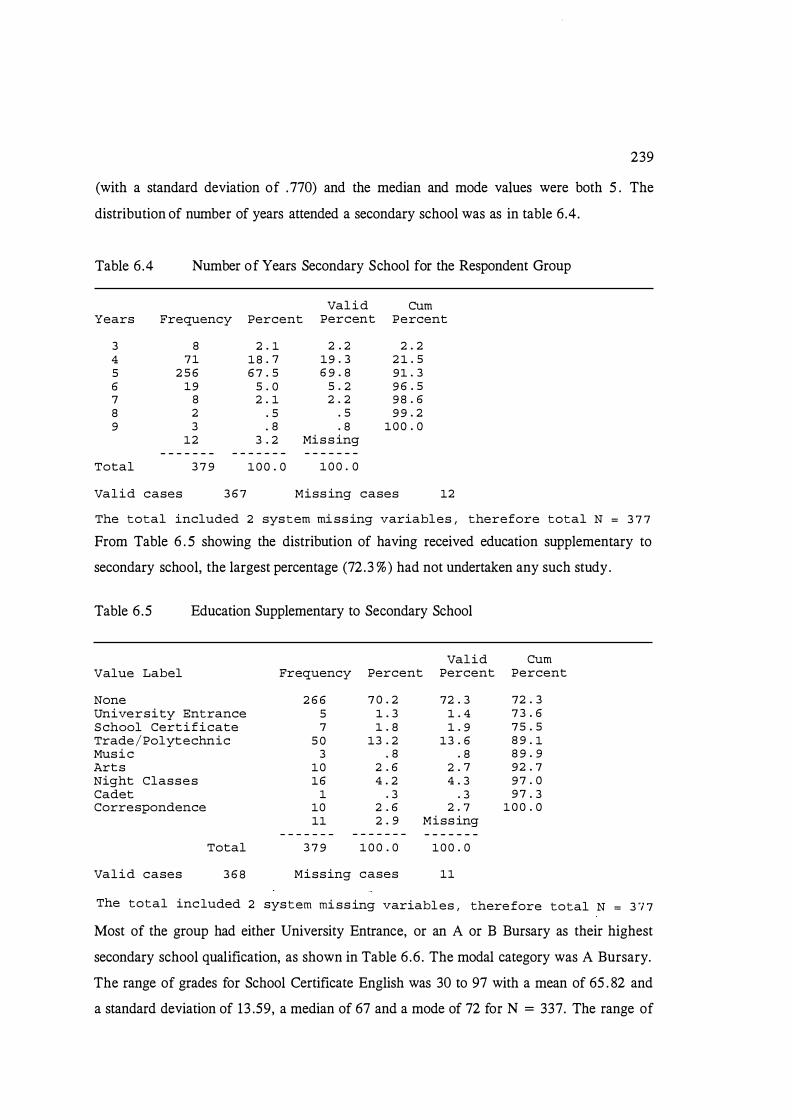
239
(with a standard deviation of . 770) and the median and mode values were both 5 . The
distribution of number of years attended a secondary school was as in table 6.4.
Table 6 .4 Number of Years Secondary School for the Respondent Group
Val i d Cum Years Frequency Percent Percent Percent
3 8 2 . 1 2 . 2 2 . 2 4 7 1 1 8 . 7 1 9 . 3 2 l . 5 5 2 5 6 6 7 . 5 6 9 . 8 9 l . 3 6 1 9 5 . 0 5 . 2 9 6 . 5 7 8 2 . 1 2 . 2 9 8 . 6 8 2 . 5 . 5 9 9 . 2 9 3 . 8 . 8 1 0 0 . 0
1 2 3 . 2 Mi s s ing - - - - - - - - - - - - - - - - - - - - -
Total 3 7 9 1 0 0 . 0 1 0 0 . 0
Val i d cases 3 6 7 Miss ing cases 12
The total included 2 sys t em mi s s ing variabl es , therefore total N = 3 7 7
From Table 6 . 5 showing the distribution of having received education supplementary to
secondary school, the largest percentage (72.3 %) had not undertaken any such study.
Table 6 .5 Education Supplementary to Secondary School
Val i d Cum Value Label Frequency Percent Percent Percent
None 2 6 6 7 0 . 2 72 . 3 72 . 3 Unive r s i ty Entrance 5 l . 3 l . 4 7 3 . 6 S chool Cert i f i cate 7 l . 8 l . 9 7 5 . 5 Trade / Polyt echnic 5 0 1 3 . 2 1 3 . 6 8 9 . 1 Mus i c 3 . 8 . 8 8 9 . 9 Art s 1 0 2 . 6 2 . 7 9 2 . 7 Night Clas s e s 1 6 4 . 2 4 . 3 9 7 . 0 Cadet 1 . 3 . 3 9 7 . 3 Correspondence 1 0 2 . 6 2 . 7 1 0 0 . 0
11 2 . 9 Miss ing - - - - - - - - - - - - - - - - - - - - -
Total 3 7 9 1 0 0 . 0 1 0 0 . 0
Val i d cases 3 6 8 M i s s ing cases 11
The total inc luded 2 sys t em mi s s ing variabl es , there fore total N = 3 7 7
Most of the group had either University Entrance, or an A or B Bursary as their highest
secondary school qualification, as shown in Table 6 .6 . The modal category was A Bursary.
The range of grades for School Certificate English was 30 to 97 with a mean of 65 . 82 and
a standard deviation of 13 .59, a median of 67 and a mode of 72 for N = 337. The range of
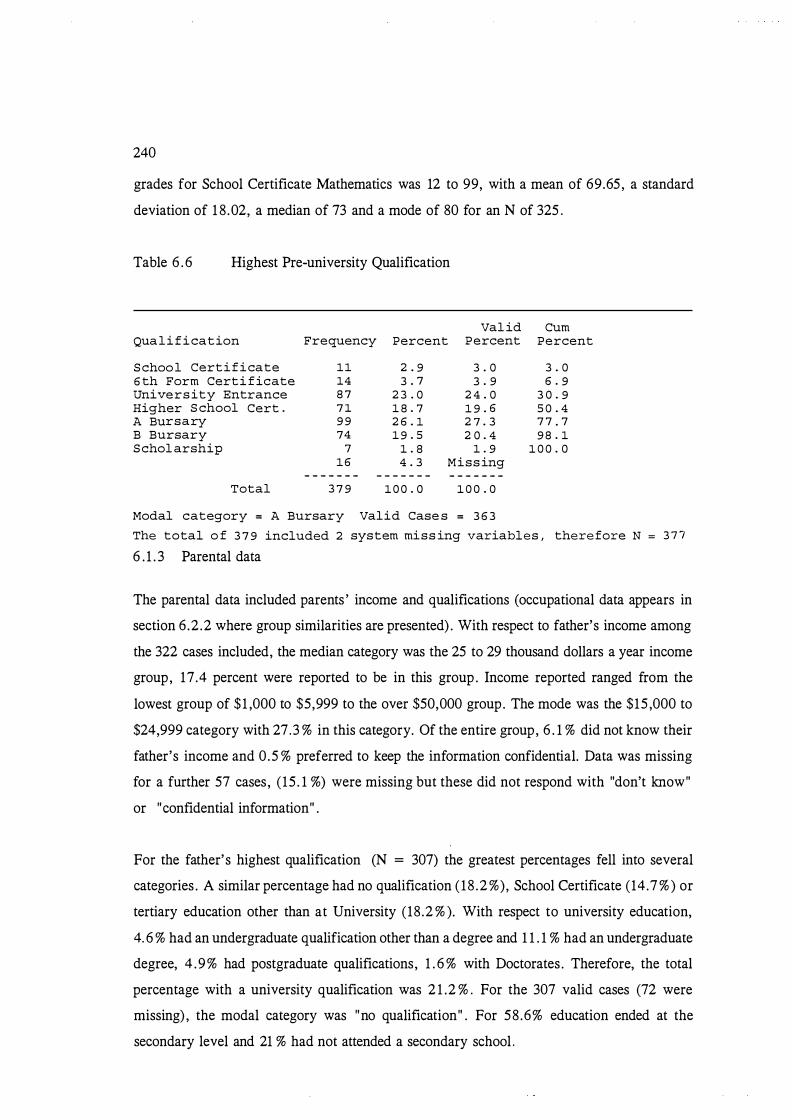
240
grades for School Certificate Mathematics was 12 to 99, with a mean of 69.65 , a standard
deviation of 1 8 .02, a median of 73 and a mode of 80 for an N of 325 .
Table 6 . 6 Highest Pre-university Qualification
Val id Cum Qua l i f i ca t ion Frequency Percent P ercent Percent
S choo l Cert i f i ca t e 1 1 2 . 9 3 . 0 3 . 0 6 th Form Cert i f icate 14 3 . 7 3 . 9 6 . 9 Unive r s ity Entrance 8 7 2 3 . 0 2 4 . 0 3 0 . 9 Higher S chool Cert . 7 1 1 8 . 7 1 9 . 6 5 0 . 4 A Bur s a ry 9 9 2 6 . 1 2 7 . 3 7 7 . 7 B Bursary 74 1 9 . 5 2 0 . 4 9 8 . 1 S chol arship 7 1 . 8 1 . 9 1 0 0 . 0
1 6 4 . 3 M i s s ing - - - - - - - - - - - - - - - - - - - - -
Total 3 7 9 1 0 0 . 0 1 0 0 . 0
Modal category = A Bursary Val i d Case s = 3 6 3
The total o f 3 7 9 included 2 sys tem mi s s ing variabl e s , there fore N = 3 7 7
6 . 1 . 3 Parental data
The parental data included parents ' income and qualifications (occupational data appears in
section 6 .2 .2 where group similarities are presented) . With respect to father's income among
the 322 cases included, the median category was the 25 to 29 thousand dollars a year income
group, 17.4 percent were reported to be in this group . Income reported ranged from the
lowest group of $1 ,000 to $5,999 to the over $50,000 group. The mode was the $15 ,000 to
$24,999 category with 27.3 % in this category. Of the entire group, 6 . 1 % did not know their
father's income and 0.5 % preferred to keep the information confidential. Data was missing
for a further 57 cases, (15 . 1 %) were missing but these did not respond with "don't know"
or "confidential information" .
For the father's highest qualification (N = 307) the greatest percentages fell into several
categories . A similar percentage had no qualification ( 18 .2 %), School Certificate (14.7 % ) or
tertiary education other than at University (18 .2 % ). With respect to university education,
4. 6 % had an undergraduate qualification other than a degree and 1 1 . 1 % had an undergraduate
degree, 4 . 9 % had postgraduate qualifications, 1 . 6 % with Doctorates . Therefore, the total
percentage with a university qualification was 2 1 .2 % . For the 307 valid cases (72 were
missing) , the modal category was "no qualification" . For 58 .6% education ended at the
secondary level and 21 % had not attended a secondary school .
241
For the mothers' incomes (N = 302), 8 1 % had annual incomes below $29,999. The modal
category was 1 ,000 to 5,999 and the median was $6,000 to $14,999. For the mother's highest
qualification (N = 309), 6 1 .2 % had completed their education at the secondary level, 22 .3 %
had undertaken tertiary education other than at university and 14.5 % had a university
qualification. With respect to the university qualifications, 3 . 2 % gained undergraduate
qualifications, 8 . 7 % undergraduate degrees , 2. 3 % postgraduate degrees and 0. 3 % (which
represented one individual) had a Doctorate. The modal qualification category was tertiary
education other than university. The other most frequent levels of qualification were School
Certificate ( 1 8 . 8 % ) and University Entrance (13 .6%) . Those reported to have received no
education at the secondary level totalled 42 or 13 .9 % .
6 . 1 .4 Health, leisure and living circumstances
The questions relating to health found 85.2 % of respondents (N = 365) describing themselves
as in excellent health and 14. 8 % reported to have disabilities which would affect their work.
In response to a question regarding reasons for leaving their first job, the answers (N = 349)
where distributed as in Table 6.7 . The modal category was "going to university" .
In stage one of the study when respondents (N = 356) were asked what their leisure company
consisted of, the largest percentage (63 . 8 % ) reported to spend their leisure time mostly with
one or two other individuals . The next highest group (21 . 1 %) spent their time mostly in
groups of three or more. Only 1 1 . 2 % reported to spend their leisure time mostly alone. The
remainder shared their time alone and with one or two others (2 . 2 %), or alone and in groups
of more than three (0 .3 %) , or alone, with a few others and in larger groups (0 . 8 %), or
shared their time among all the situations (0 . 6%) .
By stage two of the study 17. 8 % (N = 197) spent their leisure time mainly alone, 68.5 %
with one or two others , 12.2 % in groups greater than three and the other 1 .5 % shared their
time with one or two others and groups of individuals . The number of leisure activities the
respondents (N = 225) reported engaging in at the beginning of the study ranged from one
to nine, the median was two and the mode one. The percentage having one leisure activity
was 42.2, the percentage engaging in two activities was 30.2 and the percentage engaging in
three leisure activities was 15 .6 . Only 8 . 9 % of the respondents reported having four leisure
activities . Only 3 . 0 % engaged regularly in more than four activities .

242
Table 6 .7 Reasons Respondents Gave for Leaving their First Job
Value Label
Back t o s chool Going to univer s i ty Pay reasons D i s s at i s f i ed general For better j ob Finished s chool Redundant / seasona l / For exams Personal S t i l l in j ob To gain experience Training cour s e For ful l t ime work Family reasons Going ove r s eas S tudy pres sure To hol iday Moved t own Bus ine s s s ol d Practi cum ended Dismi s s ed Di spute with management Go to Teachers ' Col l eg e Pregnancy Saved enough No Reason
Total
Frequency
7 5 l 3 4
5 2 6 1 9
5 2 6
5 2 7 3 2 6 1 6 1 1 8 5 3 2 1 4 1 1
1 1 1 9
3 7 9
Percent
1 9 . 8 3 5 . 4
1 . 3 6 . 9 5 . 0 1 . 3 6 . 9 1 . 3
. 5 1 . 8
. 8
. 5 1 . 6
. 3 1 . 6
. 3
. 3 2 . 1 1 . 3
. 8
. 5
. 3 1 . 1
. 3
. 3 2 . 9 5 . 0
1 0 0 . 0
Val i d Cum P ercent
2 1 . 5 3 8 . 4
1 . 4 7 . 4 5 . 4 1 . 4 7 . 4 1 . 4
. 6 2 . 0
. 9
. 6 1 . 7
. 3 1 . 7
. 3
. 3 2 . 3 1 . 4
. 9
. 6
. 3 1 . 1
. 3
. 3 M i s s ing M i s s ing
1 0 0 . 0
Percent
2 1 . 5 5 9 . 9 6 1 . 3 6 8 . 8 7 4 . 2 7 5 . 6 8 3 . 1 8 4 . 5 8 5 . 1 8 7 . 1 8 8 . 0 8 8 . 5 9 0 . 3 9 0 . 5 9 2 . 3 92 . 6 9 2 . 8 9 5 . 1 9 6 . 6 9 7 . 4 9 8 . 0 9 8 . 3 9 9 . 4 9 9 . 7
1 0 0 . 0
The total inc luded 2 sys tem mi s s ing variab l e s , therefore total N 3 7 7
The accommodation living circumstances at the beginning of the study (N = 367) were as
shown in Table 6 . 8 .
Table 6 . 8 Accommodation of Respondents Pre-graduation
Val i d Cum Value Lab e l Frequency P ercent Percent P ercent
Hos t e l 2 7 7 . 1 7 . 4 7 . 4 With f amily 3 4 9 . 0 9 . 3 1 6 . 6 Hous e / f l at with others 2 9 7 7 8 . 4 8 0 . 9 9 7 . 5 Alone 7 1 . 8 1 . 9 9 9 . 5 Own home 1 . 3 . 3 9 9 . 7 Private boarding 1 . 3 . 3 1 0 0 . 0
1 2 3 . 2 Mi s s ing - - - - - - - - - - - - - - - - - - - - -
Total 3 7 9 1 0 0 . 0 1 0 0 . 0
The total included 2 sys t em m i s s ing variab l e s , there fore total N 3 7 7
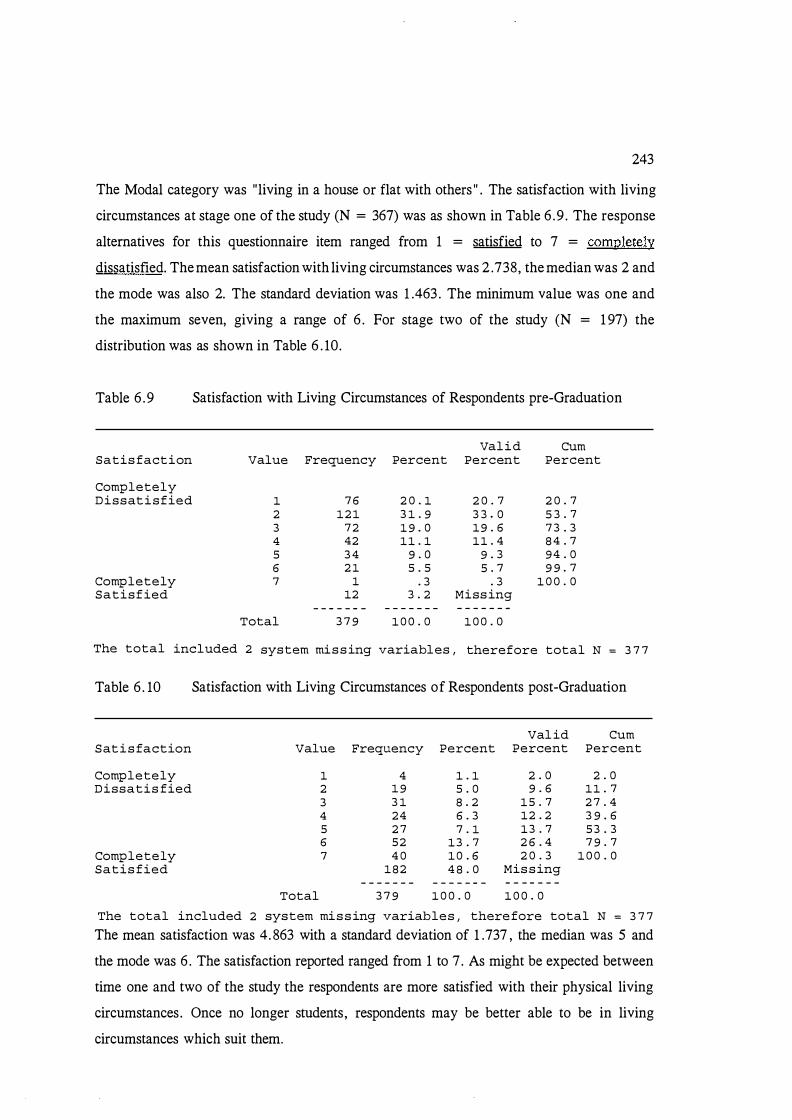
243
The Modal category was "living in a house or flat with others " . The satisfaction with living
circumstances at stage one of the study (N = 367) was as shown in Table 6 .9 . The response
alternatives for this questionnaire item ranged from 1 = satisfied to 7 = completely
dissatisfied. The mean satisfaction with living circumstances was 2 .738, the median was 2 and
the mode was also 2. The standard deviation was 1 .463 . The minimum value was one and
the maximum seven, giving a range of 6 . For stage two of the study (N = 1 97) the
distribution was as shown in Table 6 . 10.
Table 6 .9 Satisfaction with Living Circumstances of Respondents pre-Graduation
Val i d Cum S a t i s fact i on Value Frequency Percent Percent Percent
Completely D i s s at i s fied 1 7 6 2 0 . 1 2 0 . 7 2 0 . 7
2 1 2 1 3 1 . 9 3 3 . 0 5 3 . 7 3 7 2 1 9 . 0 1 9 . 6 7 3 . 3 4 42 1 1 . 1 1 1 . 4 8 4 . 7 5 3 4 9 . 0 9 . 3 9 4 . 0 6 2 1 5 . 5 5 . 7 9 9 . 7
Comp l e t e ly 7 1 . 3 . 3 1 0 0 . 0 S a t i s f ied 12 3 . 2 Miss ing
- - - - - - - - - - - - - - - - - - - - -Total 3 7 9 1 0 0 . 0 1 0 0 . 0
The total included 2 sys tem mi s s ing variabl es / therefore total N = 3 7 7
Table 6 . 10
S at i s faction
Comp l e t e ly D i s s a t i s fied
Comp l e t e ly S a t i s fied
Satisfaction with Living Circumstances of Respondents post-Graduation
Val id Cum Value Frequency Percent Percent Percent
1 4 1 . 1 2 . 0 2 . 0 2 1 9 5 . 0 9 . 6 1 1 . 7 3 3 1 8 . 2 1 5 . 7 2 7 . 4 4 2 4 6 . 3 1 2 . 2 3 9 . 6 5 2 7 7 . 1 1 3 . 7 5 3 . 3 6 5 2 1 3 . 7 2 6 . 4 7 9 . 7 7 4 0 1 0 . 6 2 0 . 3 1 0 0 . 0
1 8 2 4 8 . 0 Mis s ing - - - - - - - - - - - - - - - - - - - - -
Total 3 7 9 1 0 0 . 0 1 0 0 . 0
The total included 2 sys tem mi s s ing variab l e s / there fore total N = 3 7 7
The mean satisfaction was 4. 863 with a standard deviation of 1 . 73 7 , the median was 5 and
the mode was 6 . The satisfaction reported ranged from 1 to 7. As might be expected between
time one and two of the study the respondents are more satisfied with their physical living
circumstances . Once no longer students , respondents may be better able to be in living
circumstances which suit them.
244
6 .2 Similarities and differences among academic groups for the biographical and
background data
The variables were analysed by academic groups to examine similarities and differences
among groups with respect to the biographic data collected in this section (6.2) and in the
remaining sections with respect to the variables of Dawis and Lofquist's investigated (section
6 .4) and expanded upon in the present study (section 6 . 6) . In analysing the characteristics of
the academic groups , crosstabulations were produced and chi-square applied with Fisher's
exact test using the rounded values of cell entries when there were fewer than 20 cases in a
cell (that does not result from missing rows or columns). The chi-square measures of
independence applied to the data were those available in SPSSx, that is, Pearson's chi-square
and the Likelihood Ratio. Pearson chi-square is calculated by summing the squared residuals
divided by the expected frequencies for all cells . An alternative to the commonly used
Pearson chi-square is the Likelihood Ratio chi-square. This is based upon maximum
likelihood theory and is often used in the analysis of categorical data. The two chi-squares
produce very similar results when the samples are large (SPSS/PC + 4.0 Base Manual, 1990) .
The significance level criterion applied in the present research was the . 0 1 level. Sometimes
the Pearson chi-square was significant at the . 05 level while the Likelihood Ratio was
significant at the .01 level . Cramers' V was used because the chi-square statistic on its own
is not considered to be a good measure of the degree of association between variables (SPSS
Inc . , 1988) . Cramer's V modifies chi-square to minimise the influence of sample size and the
degrees of freedom and to restrict the range of values to between 0 and 1 . Such adjustments
are necessary to make comparisons of chi-square values meaningful. Cramer' s V can attain
the maximum of 1 for tables where any dimension is involved. The measure can be used to
compare strength of association in different tables . However, the strength of association being
compared is difficult to relate to an intuitive concept of association. Cramer's V allows
comparison among tables and the significance level associated with it assists in interpreting
the size of the value. The significance level for Cramer's V is a Pearson chi-square
probability.
The other statistics used here are lambda, Goodman and Kruskal 's tau and eta. Lambda is a
common alternative to chi-square-based measurements and is based on the idea of
proportional reduction in error (PRE) . The meaning of association is thought to be clearer in
PRE measures . These are ratios of a measure of error in predicting one variable's values
245
based on the knowledge of that variable alone to the same measure of error applied to
predictions based on the knowledge of a second or additional variable. Lambda multiplied by
100 gives a percentage reduction in error when one variable is used to predict another. This
is the percentage that error is reduced from the error of the best prediction otherwise . The
best prediction otherwise is the category with the largest proportion of observations , that is,
the modal category. Lambda ranges between 0 and 1 . A value of 0 means that the
independent variable is not of any help in predicting the dependent variable. A value of 1
means that the independent variable perfectly predicts the categories of the dependent
variable. However, a lambda of 0 does not necessarily imply statistical independence. Other
measures of association may find association even when lambda is 0. Lambda can be zero as
an artifact of having different marginals (Upton 1978) .
In the case of lambda the same prediction is made for all cases in a particular row or column.
Goodman and Kruskal 's tau takes a different approach. The prediction is randomly made in
the same proportion as the marginal totals . Kruskal and Goodman' s tau is computed by
comparing the probability of error when predicting from the column marginal totals and from
row information. A test of the null hypothesis that tau is 0 is based on the value (N -1 )( c-1 )tau
(col/row), which has a chi-square distribution with (c-1) x (r - 1) degrees of freedom. The
probability for Goodman Kruskal 's tau's is based on a chi-square approximation.
The asymptotic standard error term was available for both lambda and tau and can be used
to construct confidence intervals . While the properties of a small sample might be unknown,
it is be possible to describe the sampling distribution of estimators as the sample becomes
very large (its asymptotic distributional properties) (Hanushek and Jackson, 1977).
The eta coefficient squared provides information about the magnitude of a relationship. The
coefficient is used for data in which the dependent variable is measured on an interval scale
and the independent variable on a nominal or ordinal scale. When squared, eta can be
interpreted as the proportion of the total variability in the dependent variable that can be
associated with, is accounted for, or is determined by (the latter term is used if a causal
relationship is defendable) , knowing the independent variable values . The measure is
asymmetric . It does not assume a linear relationship between the variables .

246
The distributions of the variables which resulted in no significant group differences are
presented in tables . The findings were described in more detail where there were significant
differences among the academic groups and crosstabulations accompanied by the chi-square
and other significant statistics were given in order to assess where the differences appeared
to lie.
The respondents demonstrated similarities in most of the biographic and background
information data such as age, gender, number of children, ethnicity, New Zealand citizenship,
permanent residency, work permits , School Certificate English and Mathematics marks,
father's occupation and income and qualifications of parents . The differences which emerged
are shown in the Tables in section 6.2.
6 .2 . 1 Differences in educational background of groups
Number of years secondary education
There were significant differences among the groups (the academic and the teacher group
were included) and the teachers with respect to number of years secondary school education.
Most respondents had between four and six years secondary school education (N = 367) .
Computer science and Accountancy had a small percentage with 7 and 8 years at secondary
school. Only two individuals (studying Horticulture) reported having had nine years secondary
schooling. The chi-square Likelihood ratio of 89.56, d.f. 60, was significant p < .01 . Some
Horticulture and Social Science respondents reported having had less than four years
secondary schooling. The Pearson chi-square was also significant at 9 1 .49 d.f. 60, p < .01 .
Cramer's V was .20384, p. < . 0 1 . Although lambda with number of secondary school years
dependent was zero , Goodman and Kruskal 's tau with Secondary school years dependent was
.07736 (with an ASE of .01947), p < .00 1 . Therefore, about an 8 % reduction in error
occurred in the classification of number of years secondary education when knowledge of
academic grouping was taken into account. The eta value with number of secondary school
years dependent was . 1885 1 . Therefore, eta squared was . 03 , thus only 3 % of the variance
was accounted for by the various groups .
The distribution of the number of years secondary school in terms of percentages is as follows
in Table 6 . 1 1 .

Table 6 . 1 1
GROUP
S c iences
Computer S c i ence
247
Percentage Distribution of Number of Years Secondary School Education
of Respondent Groups (N = 367)
Count Row P e t C o l P e t
YEARS SECONDARY SCHOOL I I I I Row
I 3 1 4 1 S I 6 1 7 1 8 1 9 1 Total - - - - - - - - + - - - - - - + - - - - - - + - - - - - - + - - - - - - + - - - - - - + - - - - - - + - - - - - - +
1 I I 3 I 3 9 1 2 I I I I 4 4 1 1 6 . 8 1 8 8 . 6 1 4 . s l 1 1 1 12 . o 1 I 4 . 2 1 1s . 2 1 1o . s 1 I I I + - - - - - - + - - - - - - + - - - - - - + - - - - - - + - - - - - - + - - - - - - + - - - - - - +
2 I I 6 1 1s 1 2 1 2 1 1 1 I
3
1 1 23 . 1 1 s 1 . 1 1 1 . 1 1 1 . 1 1 3 . 8 1 I I I 8 . S I S . 9 1 10 . S I 2 S . O I S O . O I I + - - - - - - + - - - - - - + - - - - - - + - - - - - - + - - - - - - + - - - - - - + - - - - - - + I I 1 1 4 9 1 1 1 2 1 1 1 I
2 6 7 . 1
Accountancy 1 1 11 . 1 1 8 1 . 7 1 1 . 1 1 3 . 3 1 1 . 1 1 I 6 0
16 . 3
Bus ine s s S tudi es
Horticul ture
Agricul ture
Technology
Human i t i e s
S o c i a l S ci ences
Veterinary S cience
Teachers
I I 9 . 9 1 19 . 1 1 S . 3 1 2 S . O I S O . O I I + - - - - - - + - - - - - - + - - - - - - + - - - - - - + - - - - - - + - - - - - - + - - - - - - +
4 I I 3 1 8 1 I 2 1 I I I I 2 3 . 1 1 61 . s 1 I 1S . 4 1 I I I I 4 . 2 1 3 . 1 1 I 2 s . o I I I
+ - - - - - - + - - - - - - + - - - - - - + - - - - - - + - - - - - - + - - - - - - + - - - - - - +
13 3 . S
s I 7 1 2 7 1 S 1 1 S I 1 1 I 2 1 9 3 1 1 . s 1 2 9 . o l s4 . 8 l s . 4 1 1 . 1 1 I 2 . 2 1 2 s . 3 1 8 7 . s l 3 8 . o l 19 . 9 1 2 6 . 3 1 12 . s 1 I 6 6 . 7 1
+ - - - - - - + - - - - - - + - - - - - - + - - - - - - + - - - - - - + - - - - - - + - - - - - - + 6 I I I 13 1 I I I I
I I I 1o o . o I I I I I I I I s . 1 1 I I I I
+ - - - - - - + - - - - - - + - - - - - - + - - - - - - + - - - - - - + - - - - - - + - - - - - - + 1 I I 4 1 3 1 1 2 1 I I I
13 3 . S
3 7 1 1 1o . 8 1 8 3 . 8 1 s . 4 1 1 1 I 10 . 1 I I s . 6 1 12 . 1 1 10 . S I I I I + - - - - - - + - - - - - - + - - - - - - + - - - - - - + - - - - - - + - - - - - - + - - - - - - +
8 I I s I 13 I 2 I I I 1 1 1 1 23 . 8 1 61 . 9 1 9 . s l I I 4 . 8 1 I I 1 . 0 1 s . 1 1 1o . s 1 I I 3 3 . 3 1
+ - - - - - - + - - - - - - + - - - - - - + - - - - - - + - - - - - - + - - - - - - + - - - - - - + 9 I 1 1 8 I 12 I 3 I 1 1 I I
1 4 . o l 32 . o l 4 8 . o l 12 . 0 1 4 . o l I I I 12 . S I 11 . 3 I 4 . 7 I 1S . 8 I 12 . S I I I + - - - - - - + - - - - - - + - - - - - - + - - - - - - + - - - - - - + - - - - - - + - - - - - - +
10 I I 3 1 11 1 2 1 I I I I I 13 . 6 1 7 7 . 3 1 9 . 1 1 I I I I I 4 . 2 1 6 . 6 1 10 . s 1 I I I
+ - - - - - - + - - - - - - + - - - - - - + - - - - - - + - - - - - - + - - - - - - + - - - - - - + 11 I I S I 8 1 I I I I
I I 3 8 . S I 6 1 . S I I I I I I I 1 . o I 3 . 1 1 I I I I
+ - - - - - - + - - - - - - + - - - - - - + - - - - - - + - - - - - - + - - - - - - + - - - - - - +
2 1 S . 7
2 S 6 . 8
2 2 6 . 0
13 3 . S
Column Total
8 71 2 S6 19 8 2 3 3 6 7 2 . 2 19 . 3 69 . 8 S . 2 2 . 2 . s . 8 1 0 0 . 0
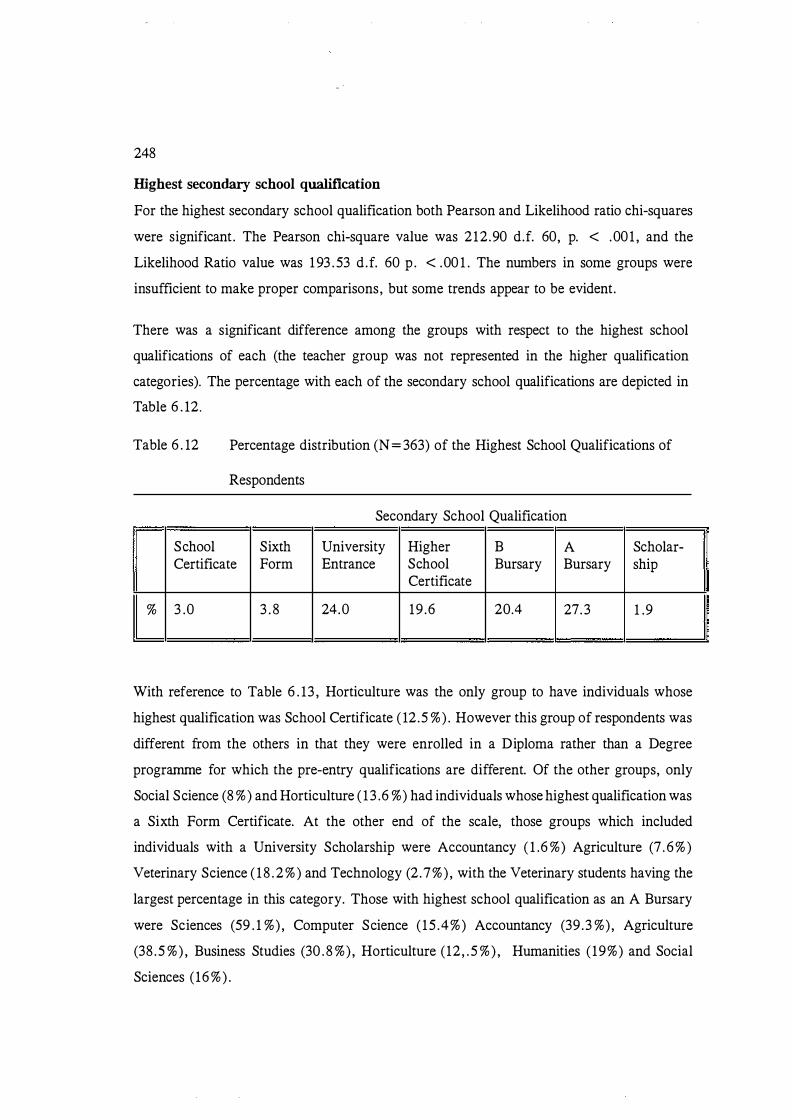
248
Highest secondary school qualification
For the highest secondary school qualification both Pearson and Likelihood ratio chi-squares
were significant . The Pearson chi-square value was 212.90 d.f. 60, p. < .00 1 , and the
Likelihood Ratio value was 1 93 . 53 d.f. 60 p . < .00 1 . The numbers in some groups were
insufficient to make proper comparisons, but some trends appear to be evident.
There was a significant difference among the groups with respect to the highest school
qualifications of each (the teacher group was not represented in the higher qualification
categories). The percentage with each of the secondary school qualifications are depicted in
Table 6 . 12.
Table 6 . 12 Percentage distribution (N = 363) of the Highest School Qualifications of
Respondents
Secondary School Qualification
School Sixth University Higher B A Scholar-Certificate Form Entrance School Bursary Bursary ship
Certificate
% 3 .0 3 . 8 24.0 19 .6 20.4 27.3 1 .9
With reference to Table 6 . 13 , Horticulture was the only group to have individuals whose
highest qualification was School Certificate ( 12 .5 %) . However this group of respondents was
different from the others in that they were enrolled in a Diploma rather than a Degree
programme for which the pre-entry qualifications are different. Of the other groups, only
Social Science (8 %) and Horticulture ( 1 3 . 6 %) had individuals whose highest qualification was
a Sixth Form Certificate. At the other end of the scale, those groups which included
individuals with a University Scholarship were Accountancy ( 1 .6 %) Agriculture (7 . 6 % )
Veterinary Science ( 1 8 . 2 % ) and Technology (2 .7%) , with the Veterinary students having the
largest percentage in this category. Those with highest school qualification as an A Bursary
were Sciences (59 . 1 %) , Computer Science ( 15 .4%) Accountancy (39 .3 %), Agriculture
(38 .5 %) , Business Studies (30 . 8 %) , Horticulture (12, . 5 %) , Humanities ( 19%) and Social
Sciences ( 16 % ) .
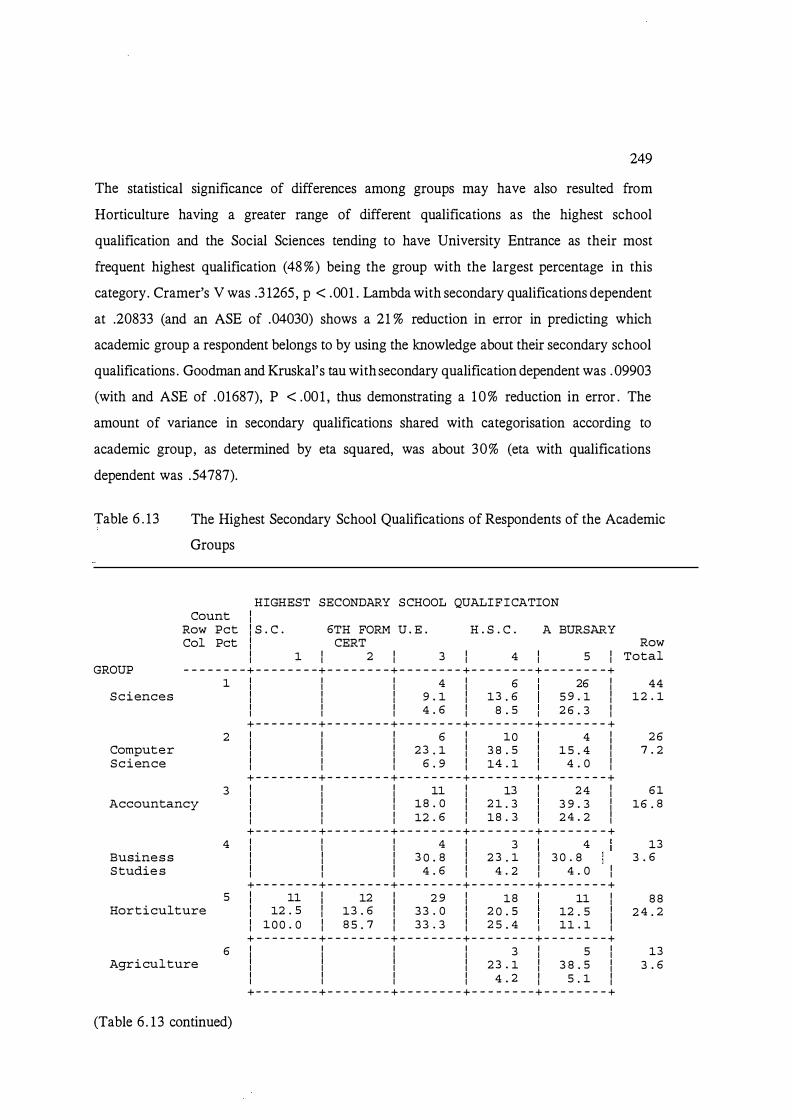
249
The statistical significance of differences among groups may have also resulted from
Horticulture having a greater range of different qualifications as the highest school
qualification and the Social Sciences tending to have University Entrance as their most
frequent highest qualification ( 48 %) being the group with the largest percentage in this
category. Cramer' s V was . 3 1265, p < . 001 . Lambda with secondary qualifications dependent
at .20833 (and an ASE of .04030) shows a 21 % reduction in error in predicting which
academic group a respondent belongs to by using the knowledge about their secondary school
qualifications . Goodman and Kruskal' s tau with secondary qualification dependent was . 09903
(with and ASE of .01687), P < .00 1 , thus demonstrating a 1 0 % reduction in error . The
amount of variance in secondary qualifications shared with categorisation according to
academic group, as determined by eta squared, was about 30% (eta with qualifications
dependent was .54787).
Table 6 . 13 The Highest Secondary School Qualifications of Respondents of the Academic
Groups
HIGHEST SECONDARY SCHOOL QUALIFICATION Count I
Row Pet I S . C . 6TH FORM U . E . H . S . C . A BURSARY Col Pet I CERT Row
I 1 I 2 I 3 I 4 I 5 I Total GROUP - - - - - - - - + - - - - - - - - + - - - - - - - - + - - - - - - - - + - - - - - - - - + - - - - - - - - +
1 I I I 4 I 6 26 I 44 Sciences I I I 9 . 1 I 13 . 6 5 9 . 1 I 12 . 1
I I I 4 . 6 I 8 . 5 I 2 6 . 3 I + - - - - - - - - + - - - - - - - - + - - - - - - - - + - - - - - - - - + - - - - - - - - +
2 I I I 6 I 10 1 4 1 26 Computer I I I 23 . 1 I 3 8 . 5 I 1 5 . 4 I 7 . 2 Science I I I 6 . 9 I 14 . 1 I 4 . 0 I
+ - - - - - - - - + - - - - - - - - + - - - - - - - - + - - - - - - - - + - - - - - - - - + 3 I I I 11 I 13 I 24 I 61
Accountancy I I I 18 . 0 I 2 1 . 3 I 3 9 . 3 I 16 . 8 I I I 12 . 6 I 18 . 3 I 2 4 . 2 I
+ - - - - - - - - + - - - - - - - - + - - - - - - - - + - - - - - - - - + - - - - - - - - + 4 I I I 4 I 3 1 4 13
Business I I I 3 0 . 8 I 2 3 . 1 I 3 0 . 8 3 . 6 Studie s I I I 4 . 6 I 4 . 2 I 4 . 0 I
+ - - - - - - - - + - - - - - - - - + - - - - - - - - + - - - - - - - - + - - - - - - - - + 5 1 11 1 12 1 2 9 I 18 11 I 8 8
Horticulture I 12 . 5 I 13 . 6 I 33 . 0 I 2 0 . 5 12 . 5 I 2 4 . 2 I 100 . 0 I 8 5 . 7 I 33 . 3 I 2 5 . 4 I 11 . 1 I
+ - - - - - - - - + - - - - - - - - + - - - - - - - - + - - - - - - - - + - - - - - - - - + 6 I I I I 3 I 5 I 13
Agriculture I I I I 2 3 . 1 I 3 8 . 5 I 3 . 6
(Table 6 . 13 continued)
I I I I 4 . 2 I 5 . 1 I + - - - - - - - - + - - - - - - - - + - - - - - - - - + - - - - - - - - + - - - - - - - - +
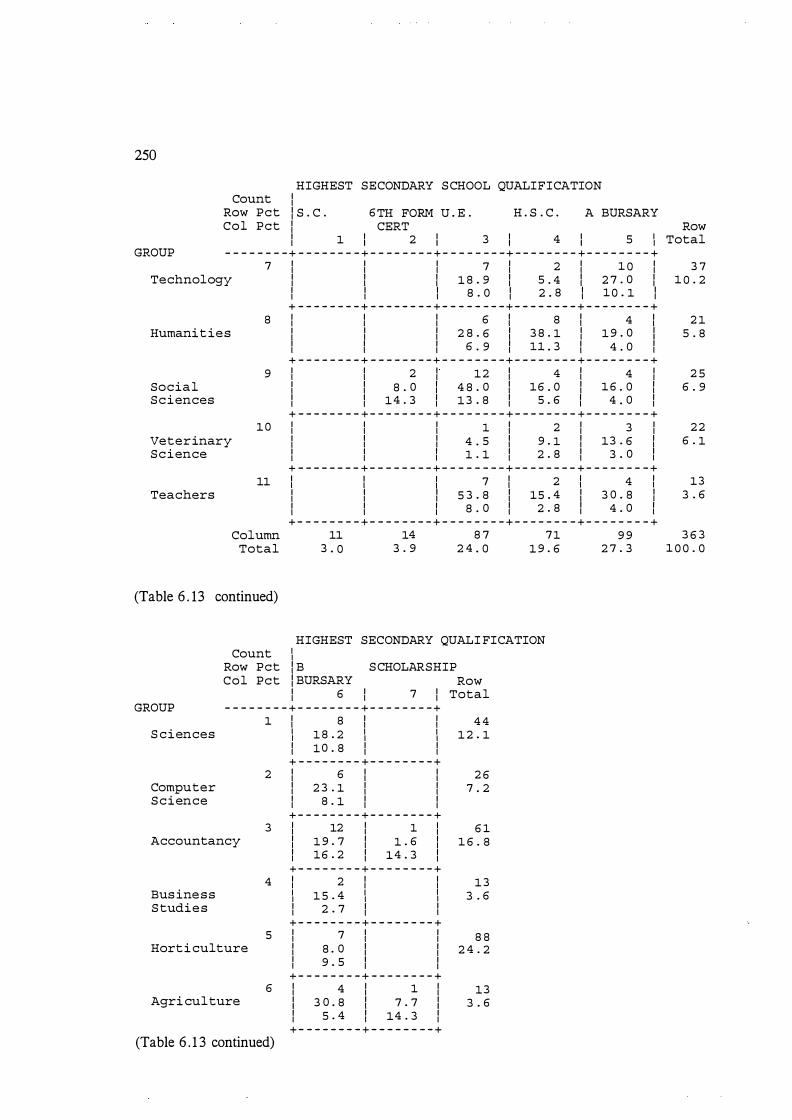
250
Count Row Pet Col Pet
HIGHEST SECONDARY SCHOOL QUALIFICATION I I S . C . 6TH FORM U . E . I CERT
H . S . C . A BURSARY
I 1 1 2 1 3 1 4 1 5 I GROUP - - - - - - - - + - - - - - - - - + - - - - - - - - + - - - - - - - - + - - - - - - - - + - - - - - - - - +
7 I I I 7 I 2 I 1 0 I Technology
8 Humanities
I I I 1 8 . 9 I 5 . 4 I 2 7 . o I I I I 8 . o I 2 . 8 I 10 . 1 I
+ - - - - - - - - + - - - - - - - - + - - - - - - - - + - - - - - - - - + - - - - - - - - + I I I 6 I 8 I 4 I I I I 2 8 . 6 I 3 8 . 1 I 1 9 . o 1 I I I 6 . 9 I n . 3 I 4 . o I + - - - - - - - - + - - - - - - - - + - - - - - - - - + - - - - - - - - + - - - - - - - - +
9 I I 2 I 12 I 4 I 4 I Social Sciences
I I 8 . o I 4 8 . o I 16 . o I 16 . o I I I 14 . 3 I 13 . 8 I 5 . 6 I 4 . o I + - - - - - - - - + - - - - - - - - + - - - - - - - - + - - - - - - - - + - - - - - - - - +
10 I I I 1 I 2 I 3 I Veterinary Science
I I I 4 . 5 I 9 . 1 I 13 . 6 I I I I 1 . 1 I 2 . 8 I 3 . o I
+ - - - - - - - - + - - - - - - - - + - - - - - - - - + - - - - - - - - + - - - - - - - - + 11 I I I 7 I 2 I 4 I
Teachers
Column Total
(Table 6 . 13 continued)
Count Row Pet Col Pet
I I I 5 3 . 8 I 15 . 4 I 3 o . 8 I I I I 8 . o I 2 . 8 I 4 . o I
+ - - - - - - - - + - - - - - - - - + - - - - - - - - + - - - - - - - - + - - - - - - - - + 11 14 8 7 71 9 9
3 . 0 3 . 9 2 4 . 0 1 9 . 6 2 7 . 3
HIGHEST SECONDARY QUALI FICATION I I B SCHOLARSHIP I BURSARY Row I 6 I 7 I Total
GROUP - - - - - - - - + - - - - - - - - + - - - - - - - - +
S ciences
Computer Science
Accountancy
Business Studies
Horti culture
Agri culture
1 I 8 I I 4 4 I 1 8 . 2 I I 1 2 . 1 I 1o . 8 I I + - - - - - - - - + - - - - - - - - +
2 I 6 I I 2 6 7 . 2
3
I 2 3 . 1 I I I 8 . 1 I I + - - - - - - - - + - - - - - - - - + I 12 I 1 I 6 1 I 1 9 . 7 I 1 . 6 I 1 6 . 8 I 16 . 2 I 14 . 3 I + - - - - - - - - + - - - - - - - - +
4 I 2 I I 13 3 . 6
5
6
I 1 5 . 4 I I I 2 . 7 I I
+ - - - - - - - - + - - - - - - - - + I 7 I I 8 8 I 8 . o I I 2 4 . 2 I 9 . 5 I I
+ - - - - - - - - + - - - - - - - - + I 4 I 1 I 1 3 o . 8 I 7 . 7 1 I 5 . 4 I 14 . 3 I
+ - - - - - - - - + - - - - - - - - +
13 3 . 6
(Table 6 . 1 3 continued)
Row Total
3 7 1 0 . 2
2 1 5 . 8
2 5 6 . 9
22 6 . 1
13 3 . 6
3 6 3 1 0 0 . 0
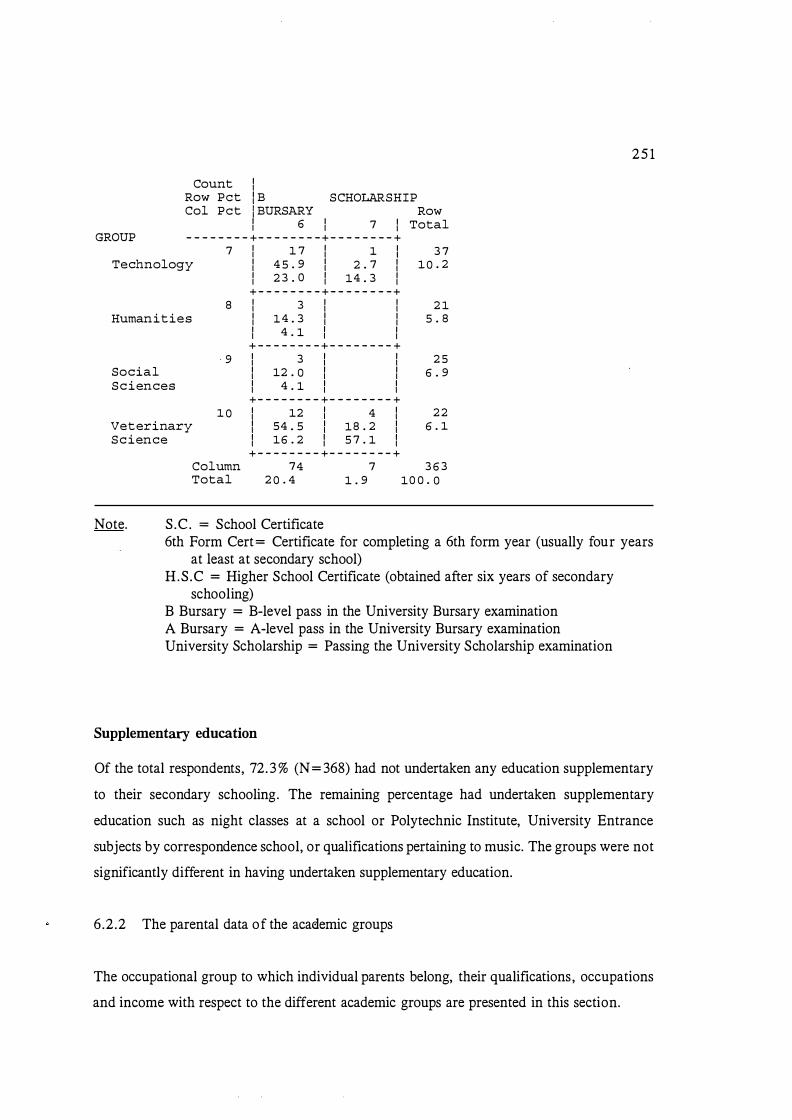
Count I Row Pet I B SCHOLARSHIP Col Pet ! BURSARY Row
I 6 I 7 I Total GROUP - - - - - - - - + - - - - - - - - + - - - - - - - - +
7 I 1 7 I 1 1 3 7 Technology I 4 5 . 9 I 2 . 7 I 10 . 2
I 2 3 . o I 14 . 3 I + - - - - - - - - + - - - - - - - - +
8 I 3 I I 2 1 Humanities I 14 . 3 I I 5 . 8
I 4 . 1 I I + - - - - - - - - + - - - - - - - - +
9 I 3 I I 2 5 Social I 12 . 0 I I 6 . 9 Sciences I 4 . 1 I I
+ - - - - - - - - + - - - - - - - - + 1 0 I 12 I 4 I 22
Veterinary I 54 . 5 I 18 . 2 I 6 . 1 Science I 16 . 2 I 5 7 . 1 I
Note.
+ - - - - - - - - + - - - - - - - - + Column 74 7 3 6 3 Total 2 0 . 4 1 . 9 10 0 . 0
S.C. = School Certificate
25 1
6th Form Cert= Certificate for completing a 6th form year (usually four years at least at secondary school)
H.S .C = Higher School Certificate (obtained after six years of secondary schooling)
B Bursary = B-level pass in the University Bursary examination A Bursary = A-level pass in the University Bursary examination University Scholarship = Passing the University Scholarship examination
Supplementary education
Of the total respondents, 72. 3 % (N = 368) had not undertaken any education supplementary
to their secondary schooling. The remaining percentage had undertaken supplementary
education such as night classes at a school or Polytechnic Institute, University Entrance
subjects by correspondence school, or qualifications pertaining to music. The groups were not
significantly different in having undertaken supplementary education.
6.2.2 The parental data of the acaclemic groups
The occupational group to which individual parents belong, their qualifications, occupations
and income with respect to the different academic groups are presented in this section.

252
Parental qualifications
There were no s ignificant differences in the qualifications of fathers across academic groups
(N = 305). The percentage distribution of qualifications were as in Table 6 . 14.
Table 6 . 14 Percentage of Respondents ' Parents with Qualifications
Qualifications Father Mother % %
No qualifications 18 .2 12 .3 No secondary schooling 3 .3 1 . 6 Limited secondary schooling 12.7 12.6 School Certificate 14.7 18 .8 6th Form Certificate 0 .3 0 .3 University Entrance Subjects 7.8 13 .6 Higher School Certificate 0.7 1 . 3 B Bursary 0.7 0 .0 A Bursary 0.3 0 .6 Tertiary not University 18.2 22.6 Accountancy exams 0.0 0.3 Primary Teaching 0.0 0.3 Undergraduate but not degree 4.6 3 .2 Undergraduate Degree 1 1 . 1 8 .7 Music Qualification 0.3 0 .6 Postgraduate Qualification 4.9 2.3 PhD 1 .6 0 .3 Deceased 0.7 0.6
100.0 (N = 307) 100.00 ( N = 309)
Parents' Occupation
There were no significant differences among the academic groups with respect to the
occupations of their parents . The occupational categories were the major occupational groups
of the New Zealand Standard Classification of Occupations (1976) . The categories and the
distribution of the percentage of individuals within them was as in Table 6 . 15.
Father's income
The income of the respondents' fathers were not significantly different across the different
academic groups as shown in Table 6. 16 .
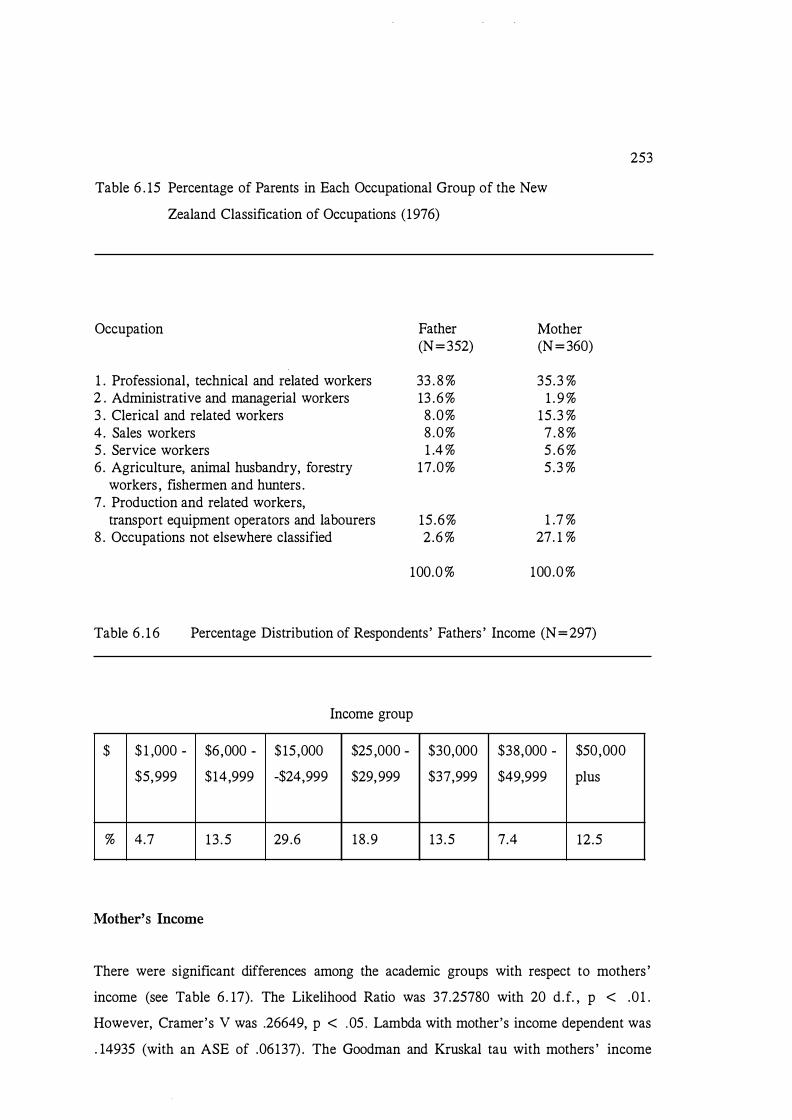
Table 6 . 15 Percentage of Parents in Each Occupational Group of the New
Zealand Classification of Occupations (1976)
Occupation Father Mother (N = 352) (N = 360)
1 . Professional, technical and related workers 33 . 8 % 35.3 % 2 . Administrative and managerial workers 13 .6% 1 . 9 % 3 . Clerical and related workers 8 .0% 15 .3 % 4 . Sales workers 8 .0% 7 . 8 % 5 . Service workers 1 .4 % 5 . 6 % 6 . Agriculture, animal husbandry, forestry 17 .0% 5 .3 %
workers , fishermen and hunters . 7 . Production and related workers,
transport equipment operators and labourers 15 .6% 1 .7 % 8 . Occupations not elsewhere classified 2.6 % 27. 1 %
100.0 % 100.0 %
Table 6 . 1 6 Percentage Distribution of Respondents ' Fathers ' Income (N = 297)
Income group
$ $ 1 ,000 - $6,000 - $15,000 $25 ,000 - $30,000 $38,000 - $50,000
$5,999 $14,999 -$24,999 $29,999 $37,999 $49,999 plus
% 4.7 13 .5 29 .6 18 .9 13 .5 7.4 12.5
Mother's Income
253
There were significant differences among the academic groups with respect to mothers '
income (see Table 6 . 17). The Likelihood Ratio was 37.25780 with 20 d.f. , p < .0 1 .
However, Cramer's V was .26649, p < .05 . Lambda with mother's income dependent was
. 14935 (with an ASE of .06137) . The Goodman and Kruskal tau with mothers ' income
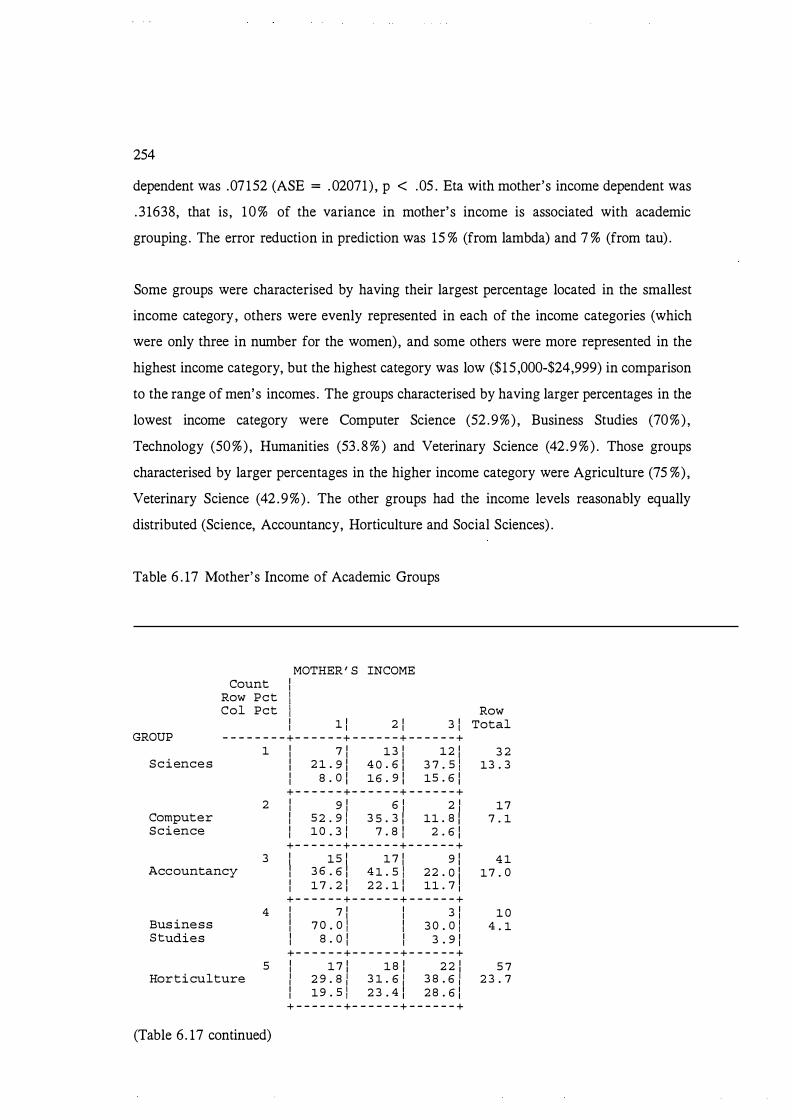
254
dependent was .07152 (ASE = . 02071) , p < .05 . Eta with mother's income dependent was
. 3 1638, that is , 1 0 % of the variance in mother's income is associated with academic
grouping. The error reduction in prediction was 15 % (from lambda) and 7 % (from tau) .
Some groups were characterised by having their largest percentage located in the smallest
income category, others were evenly represented in each of the income categories (which
were only three in number for the women), and some others were more represented in the
highest income category, but the highest category was low ($1 5 ,000-$24,999) in comparison
to the range of men's incomes . The groups characterised by having larger percentages in the
lowest income category were Computer Science (52 .9%) , Business Studies (70%) ,
Technology (50%) , Humanities (53 . 8 % ) and Veterinary Science (42.9 %) . Those groups
characterised by larger percentages in the higher income category were Agriculture (7 5 %) ,
Veterinary Science (42 .9%) . The other groups had the income levels reasonably equally
distributed (Science, Accountancy, Horticulture and Social Sciences) .
Table 6 . 17 Mother' s Income of Academic Groups
GROUP
Sciences
Computer Science
Count Row Pet Col Pet
I
11 MOTHER' S INCOME
Row I 1 I 2 I 3 I Total
- - - - - - - - + - - - - - - + - - - - - - + - - - - - - + 1 I 7 I 13 I 12 I 3 2
1 2 1 . 9 1 4 0 . 6 1 3 7 . s l 13 . 3 I 8 . o 1 16 . 9 1 1s . 6 1
+ - - - - - - + - - - - - - + - - - - - - + 2 I 9 I 6 I 2 I
I s 2 . 9 l 3 5 . 3 1 11 . 8 1 I 10 . 3 I 7 . 8 I 2 . 6 1 + - - - - - - + - - - - - - + - - - - - - +
17 7 . 1
3 I 1s I 1 7 I 9 1 4 1 Accountancy I 3 6 . 6 1 4 1 . s l 22 . 0 1 17 . o
I 1 7 . 2 1 2 2 . 1 1 11 . 7 1
Business Studies
+ - - - - - - + - - - - - - + - - - - - - + 4 I 7 I I 3 I
I 7 o . o l I 3 o . o l I 8 . o I I 3 . 9 I + - - - - - - + - - - - - - + - - - - - - +
1 0 4 . 1
s I 1 7 1 1 8 1 2 2 1 s 7 Horticulture I 2 9 . 8 / 3 1 . 6 / 3 8 . 6 / 2 3 . 7
I 19 . s l 2 3 . 4 1 2 8 . 6 1 + - - - - - - + - - - - - - + - - - - - - +
(Table 6 . 17 continued)

MOTHER ' S INCOME Count I
Row Pet 1 Col Pet I Row
I 1 I 2 I 3 I Total GROUP - - - - - - - - + - - - - - - + - - - - - - + - - - - - - +
6 I 1 1 2 1 9 1 12 Agriculture I 8 . 3 1 16 . 7 1 75 . 0 1 5 . 0
I 1 . 1 1 2 . 6 1 11 . 7 1 + - - - - - - + - - - - - - + - - - - - - +
7 1 14 1 a : 6 1 2 8 Technology I 5 0 . 0 1 2 8 . 6 1 2 1 . 4 1 11 . 6
1 16 . 1 1 10 . 4 1 7 . a : + - - - - - - + - - - - - - + - - - - - - +
a I 7 1 4 1 2 1 13 Humanities I 53 . 8 1 3 0 . 8 1 15 . 4 1 5 . 4
I s . o : 5 . 2 1 2 . 6 1 + - - - - - - + - - - - - - + - - - - - - +
9 I 6 1 6 1 6 1 1s Social I 33 . 3 1 3 3 . 3 1 3 3 . 3 1 7 . 5 Sciences I 6 . 9 1 7 . 8 I 7 . 8 I
+ - - - - - - + - - - - - - + - - - - - - + 10 I 3 1 1 1 3 1 7
Veterinary I 42 . 9 1 14 . 3 1 4 2 . 9 1 2 . 9 Science I 3 . 4 I 1 . 3 I 3 . 9 1
+ - - - - - - + - - - - - - + - - - - - - + 11 I 1 1 2 1 3 1 6
Teachers I 16 . 7 1 3 3 . 3 1 5 0 . 0 1 2 . 5 I 1 . 1 1 2 . 6 1 3 . 9 1 + - - - - - - + - - - - - - + - - - - - - +
Column 8 7 77 7 7 241 Total 36 . 1 3 2 . 0 32 . 0 1 0 0 . 0
Note. Income Category 1 = $ 1 ,000- $5 ,999 Income Category 2 = $6,000 - $14,999 Income Category 3 = $15 ,000 - $24,999
6 .2 .3 Accommodation
The chi-squares were significant for the association between academic group and
accommodation while studying. The Pearson chi-square was 95 .57, d. f. = 40, p < .00 1 . The
Likelihood Ratio was 86.60, d. f. = 40, p < .00 1 . Cramer's V of .25550 was significant, p
< .001 . The lambda with accommodation dependent was zero, however, Goodman and
Kruskal' s tau with accommodation dependent was .08341 with an ASE of .02162, p < .00 1 ,
thus giving a percentage reduction in error of prediction of 8 % . Eta accommodation
dependent was . 3 1 indicating that about 10% of the variance of the two variables was shared.
From Table 6 . 1 8 it can be seen that the largest percentage of all respondents (8 1 . 1 %) and the
largest percentage in each group during stage one of the study lived in a house or flat with
others . Only Business Studies and Veterinarian Science respondents did not have a percentage
255
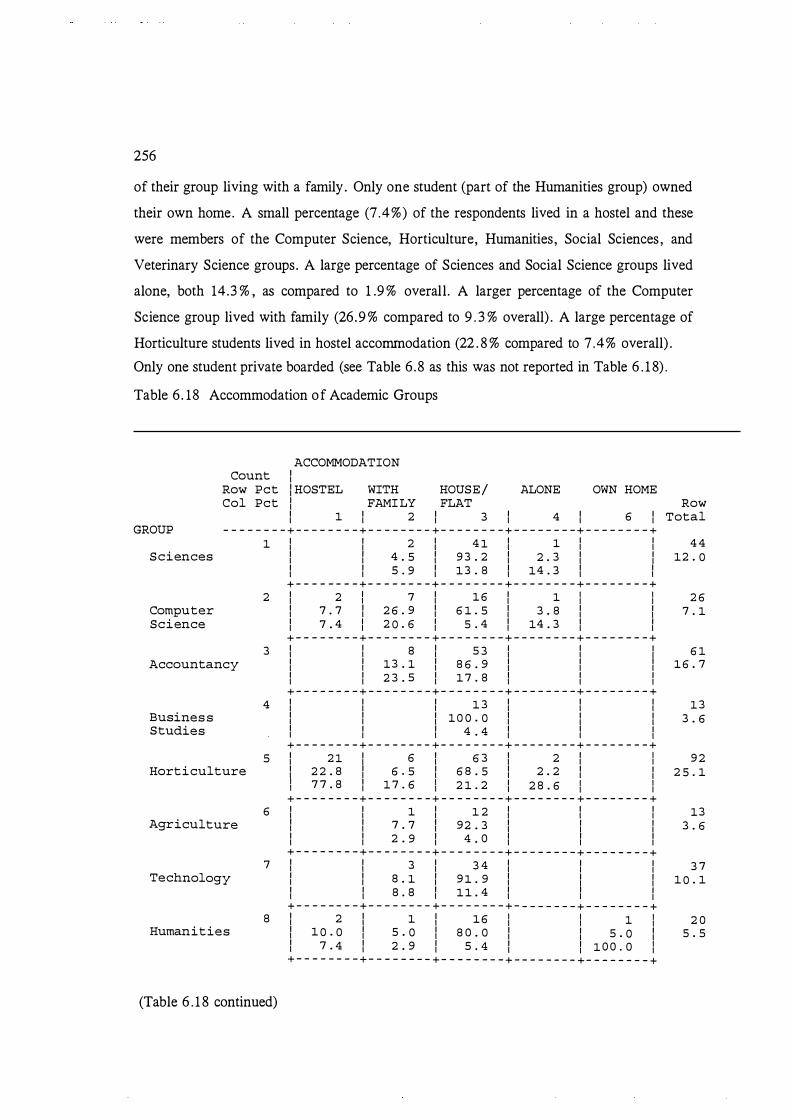
256
of their group living with a family. Only one student (part of the Humanities group) owned
their own home. A small percentage (7 .4%) of the respondents lived in a hostel and these
were members of the Computer Science, Horticulture, Humanities , Social Sciences , and
Veterinary Science groups. A large percentage of Sciences and Social Science groups lived
alone, both 14.3 % , as compared to 1 .9 % overall . A larger percentage of the Computer
Science group lived with family (26. 9 % compared to 9 . 3 % overall) . A large percentage of
Horticulture students lived in hostel accommodation (22 . 8 % compared to 7 .4% overall) .
Only one student private boarded (see Table 6 .8 as this was not reported in Table 6 . 1 8) .
Table 6 . 18 Accommodation of Academic Groups
ACCOMMODATION Count I
Row Pet I HOSTEL WITH HOUSE/ ALONE OWN HOME Col Pet I FAMILY FLAT Row
I 1 I 2 I 3 I 4 I 6 I Total GROUP - - - - - - - - + - - - - - - - - + - - - - - - - - + - - - - - - - - + - - - - - - - - + - - - - - - - - +
1 I I 2 I 4 1 I 1 I I 4 4 Sciences I I 4 . 5 I 9 3 . 2 I 2 . 3 I I 12 . 0
I I s . 9 I 13 . 8 I 14 . 3 I I + - - - - - - - - + - - - - - - - - + - - - - - - - - + - - - - - - - - + - - - - - - - - +
2 I 2 I 7 I 16 I 1 1 1 2 6 Computer I 7 . 7 I 2 6 . 9 I 6 1 . 5 I 3 . 8 I I 7 . 1 Science I 7 . 4 I 2 0 . 6 I 5 . 4 I 14 . 3 I I
+ - - - - - - - - + - - - - - - - - + - - - - - - - - + - - - - - - - - + - - - - - - - - + 3 I I 8 I s 3 I I I 6 1
Accountancy I I 13 . 1 I 8 6 . 9 I I I 16 . 7 I I 2 3 . s I 1 7 . 8 I I I + - - - - - - - - + - - - - - - - - + - - - - - - - - + - - - - - - - - + - - - - - - - - +
4 I I I 1 3 I I I 13 Business I I I 10 0 . 0 I I I 3 . 6 Studies I I I 4 . 4 I I I
+ - - - - - - - - + - - - - - - - - + - - - - - - - - + - - - - - - - - + - - - - - - - - + s I 21 I 6 I 6 3 I 2 I 1 9 2
Horticulture I 2 2 . 8 I 6 . 5 I 6 8 . 5 I 2 . 2 I I 2 5 . 1 1 7 7 . 8 I 1 7 . 6 1 2 1 . 2 I 2 8 . 6 1 1
+ - - - - - - - - + - - - - - - - - + - - - - - - - - + - - - - - - - - + - - - - - - - - + 6 I I 1 I 1 2 I I I 13
Agriculture I I 7 . 7 I 92 . 3 I I I 3 . 6 I I 2 . 9 I 4 . o I I I
+ - - - - - - - - + - - - - - - - - + - - - - - - - - + - - - - - - - - + - - - - - - - - + 7 I I 3 I 3 4 I I I 3 7
Technology I I 8 . 1 I 9 1 . 9 I I I 1 0 . 1 I I 8 . 8 I 11 . 4 I I I + - - - - - - - - + - - - - - - - - + - - - - - - - - + - - - - - - - - + - - - - - - - - +
8 I 2 I 1 I 16 1 1 1 1 2 0 Humanities I 1 0 . 0 I 5 . 0 I 8 0 . 0 I I 5 . 0 I 5 . 5
(Table 6 . 1 8 continued)
I 7 . 4 I 2 . 9 I s . 4 I I 1 o o . o 1 + - - - - - - - - + - - - - - - - - + - - - - - - - - + - - - - - - - - + - - - - - - - - +
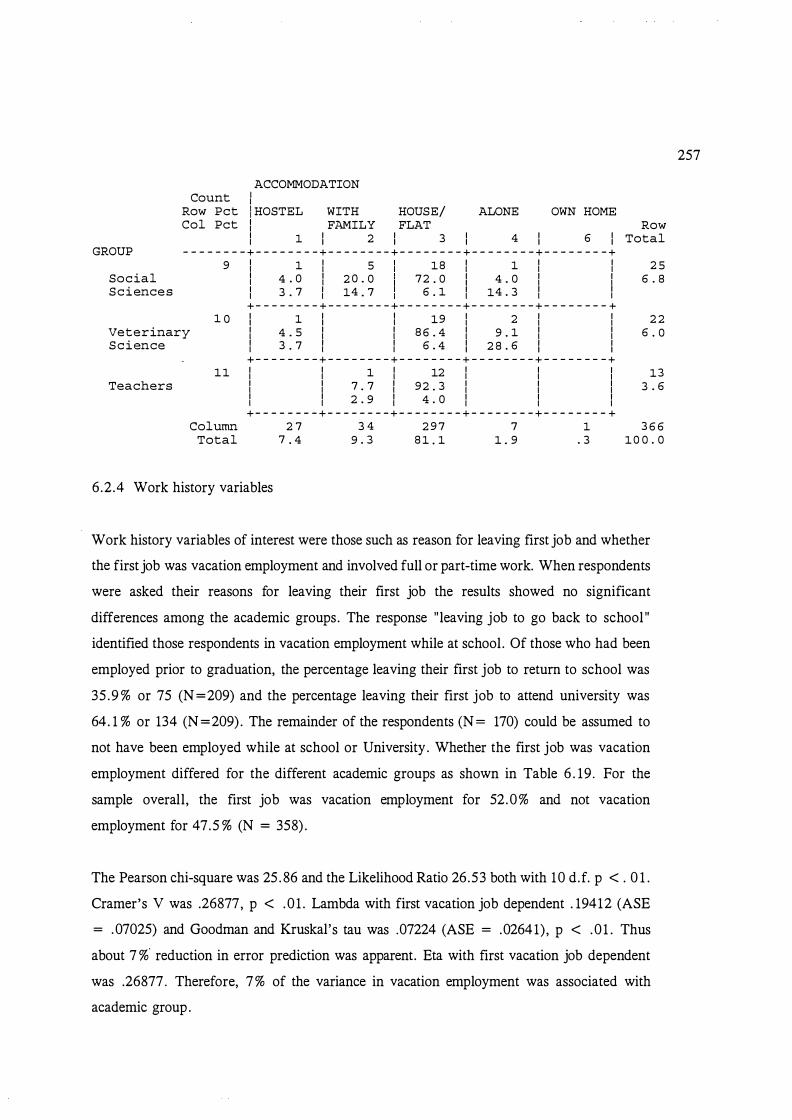
GROUP
Social Sciences
Count Row Pet Col Pet
ACCOMMODATION I I ! HOSTEL WITH HOUSE/ I FAMILY FLAT
ALONE OWN HOME
I 1 1 2 1 3 1 4 1 6 1 - - - - - - - - + - - - - - - - - + - - - - - - - - + - - - - - - - - + - - - - - - - - + - - - - - - - - +
9 I 1 I 5 18 I 1 I I I 4 . o I 2 o . o 72 . o 1 4 . o I I I 3 . 7 I 14 . 7 I 6 . 1 I 14 . 3 I I
+ - - - - - - - - + - - - - - - - - + - - - - - - - - + - - - - - - - - + - - - - - - - - + 1 0 1 1 1 I 19 I 2 I I
Veterinary Science
I 4 . 5 I I 8 6 . 4 I 9 . 1 I I I 3 . 7 I I 6 . 4 1 2 8 . 6 1 1
Teachers
+ - - - - - - - - + - - - - - - - - + - - - - - - - - + - - - - - - - - + - - - - - - - - + 11 I I 1 I 12 I I I
Column Total
I I 7 . 7 I 92 . 3 I I I I I 2 . 9 I 4 . o I I I + - - - - - - - - + - - - - - - - - + - - - - - - - - + - - - - - - - - + - - - - - - - - +
2 7 3 4 2 9 7 7 1 7 . 4 9 . 3 8 1 . 1 1 . 9 . 3
6.2 .4 Work history variables
Row Total
2 5 6 . 8
2 2 6 . 0
13 3 . 6
3 6 6 10 0 . 0
Work history variables of interest were those such as reason for leaving first job and whether
the first job was vacation employment and involved full or part-time work. When respondents
were asked their reasons for leaving their first job the results showed no significant
differences among the academic groups. The response "leaving job to go back to school "
identified those respondents in vacation employment while at school . Of those who had been
employed prior to graduation, the percentage leaving their first job to return to school was
35 .9 % or 75 (N =209) and the percentage leaving their first job to attend university was
64. 1 % or 134 (N =209) . The remainder of the respondents (N = 170) could be assumed to
not have been employed while at school or University . Whether the first job was vacation
employment differed for the different academic groups as shown in Table 6 . 19 . For the
sample overall, the first job was vacation employment for 52.0% and not vacation
employment for 47.5 % (N = 358) .
The Pearson chi-square was 25 . 86 and the Likelihood Ratio 26.53 both with 10 d.f. p < . 0 1 .
Cramer's V was .26877, p < . 0 1 . Lambda with first vacation job dependent . 19412 (ASE
= . 07025) and Goodman and Kruskal's tau was .07224 (ASE = .02641), p < . 0 1 . Thus
about 7 %' reduction in error prediction was apparent. Eta with first vacation job dependent
was .26877 . Therefore, 7 % of the variance in vacation employment was associated with
academic group .
257
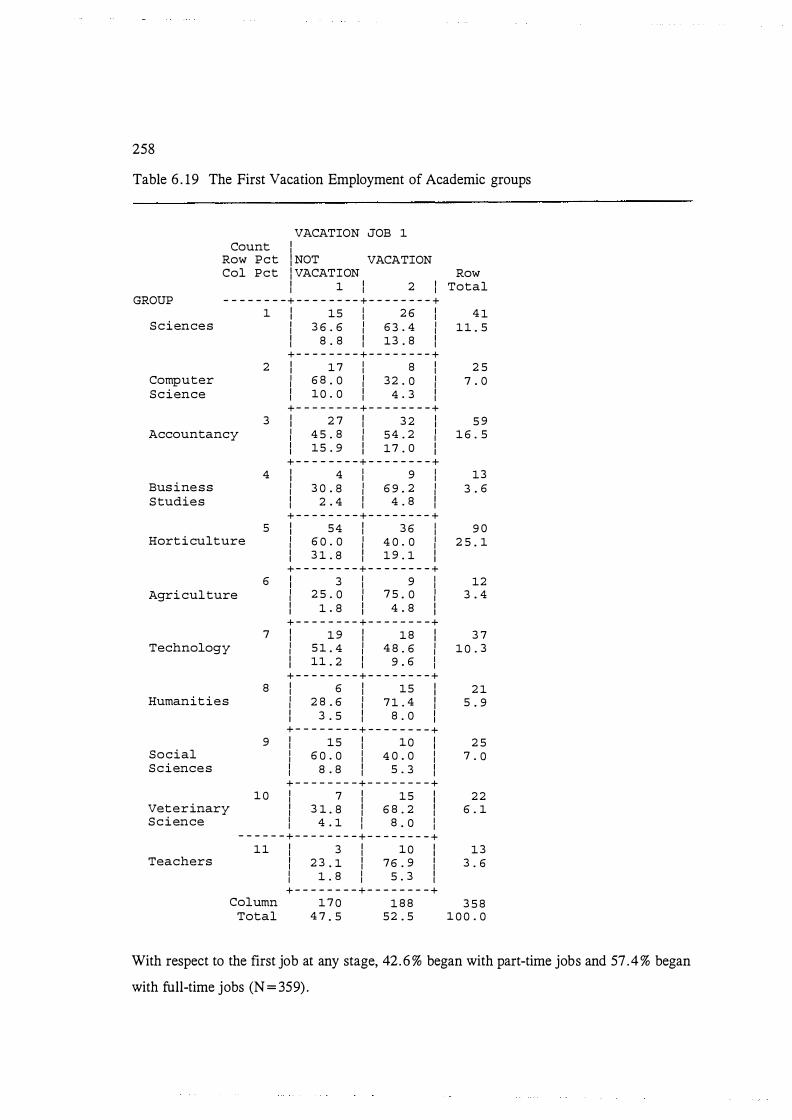
258
Table 6 . 19 The First Vacation Employment of Academic groups
VACATION JOB 1 Count I
Row Pet / NOT VACATION Col Pet / VACATION Row
I 1 I 2 I Total GROUP - - - - - - - - + - - - - - - - - + - - - - - - - - +
1 1 15 1 2 6 I 4 1 Sciences I 3 6 . 6 I 63 . 4 I 11 . 5
I 8 . 8 I 13 . 8 I + - - - - - - - - + - - - - - - - - +
2 1 1 7 I 8 I 2 5 Computer I 6 8 . 0 I 32 . 0 I 7 . 0 Science I 10 . 0 I 4 . 3 I
+ - - - - - - - - + - - - - - - - - + 3 1 2 7 I 3 2 1 5 9
Accountancy I 4 5 . 8 I 54 . 2 I 1 6 . 5 1 15 . 9 1 17 . o 1
+ - - - - - - - - + - - - - - - - - + 4 1 4 1 9 1 13
Business I 3 0 . 8 I 6 9 . 2 I 3 . 6 Studies I 2 . 4 I 4 . 8 I
+ - - - - - - - - + - - - - - - - - + 5 1 54 I 3 6 1 9 o
Horticulture I 6 0 . 0 I 4 0 . 0 I 2 5 . 1 1 3 1 . 8 I 1 9 . 1 1 + - - - - - - - - + - - - - - - - - +
6 1 3 I 9 1 12 Agri culture I 2 5 . 0 I 7 5 . 0 I 3 . 4
1 1 . 8 1 4 . 8 1 + - - - - - - - - + - - - - - - - - +
7 I 1 9 I 1 8 1 3 7 Technology I 5 1 . 4 I 4 8 . 6 I 1 0 . 3
1 11 . 2 I 9 . 6 1 + - - - - - - - - + - - - - - - - - +
8 I 6 I 15 1 2 1 Humanities I 2 8 . 6 I 7 1 . 4 I 5 . 9
1 3 . 5 I 8 . o 1 + - - - - - - - - + - - - - - - - - +
9 I 15 I 10 1 2 5 Social I 6 0 . 0 I 4 0 . 0 I 7 . 0 Sciences I 8 . 8 I 5 . 3 I
+ - - - - - - - - + - - - - - - - - + 1 0 I 7 I 15 1 22
Veterinary I 3 1 . 8 I 6 8 . 2 I 6 . 1 Science I 4 . 1 I 8 . 0 I
- - - - - - + - - - - - - - - + - - - - - - - - + 11 I 3 I 10 1 13
Teachers I 2 3 . 1 I 76 . 9 I 3 . 6 I 1 . 8 I 5 . 3 I + - - - - - - - - + - - - - - - - - +
Column 1 7 0 1 8 8 3 5 8 Total 4 7 . 5 52 . 5 1 0 0 . 0
With respect to the first job at any stage, 42. 6 % began with part-time jobs and 57 .4% began
with full-time jobs (N = 359) .

259
6 .2 .5 Academic performance measures
A difference among the academic groups was evident in the ability related measures of
academic performance at university . The two measures were the average grade in the final
year and the average overall grade while at university.
Average fmal year grade
The average final year grade for N = 284 ranged from E to A+ with a mean and median
of B- and a mode of C+ . The standard deviation was the equivalent of two grade steps (a
step being between A-and A + , or C+ and B, for example) . The average final year grade
(N =282) produced significant chi-squares, 125 .30 , d.f. = 100 , only at the .05 level for
Pearson's but at the .01 level for the Likelihood Ratio with a value of 140.23 , d.f. = 100.
Cramer's V of .21 showed a degree of association between the variables, p < .05. Lambda
with final year average grade dependent was .08 with an ASE of .0422, meaning an 8 % error
reduction in prediction of fmal average using academic groups . Goodman and Kruskal ' s value
of .06179 with an ASE of .01093 locates the error reduction at around 6 % . The eta with final
year grade in major dependent of .32 showed the variables to have about 10% of their
variance in common.
The differences in the groups seemed to lie at both extremes of the scale of grades .
Examination of the frequency Table (Table 6 .20) shows that only some respondents obtained
a D grade. The groups which did not obtain a D or lower were Business Studies , Agriculture
and Veterinary Science. Such differences may be accounted for in part by differences in
marking practices among Departments as well as differences in the ability of different groups .
At the other end of the grade scale those obtaining B+ and above were 20% of Sciences,
33 . 3 % of Computer Science, 2.4% of Accountancy, 32.3 % of Horticulture, 33 . 3 % of
Agriculture, 9% of Technology, 7. 7% of Humanities , 25 % of Social Sciences and 1 8 . 1 % of
Veterinary Science. A similar percentage of all groups obtained grades of between C- to B
inclusive. The distribution of the final year grades for the majoring subject for the
respondents overall (N =284) is presented in Table 6.20. The median is located between C +
and B- for the final year average and at C + for the overall grade.
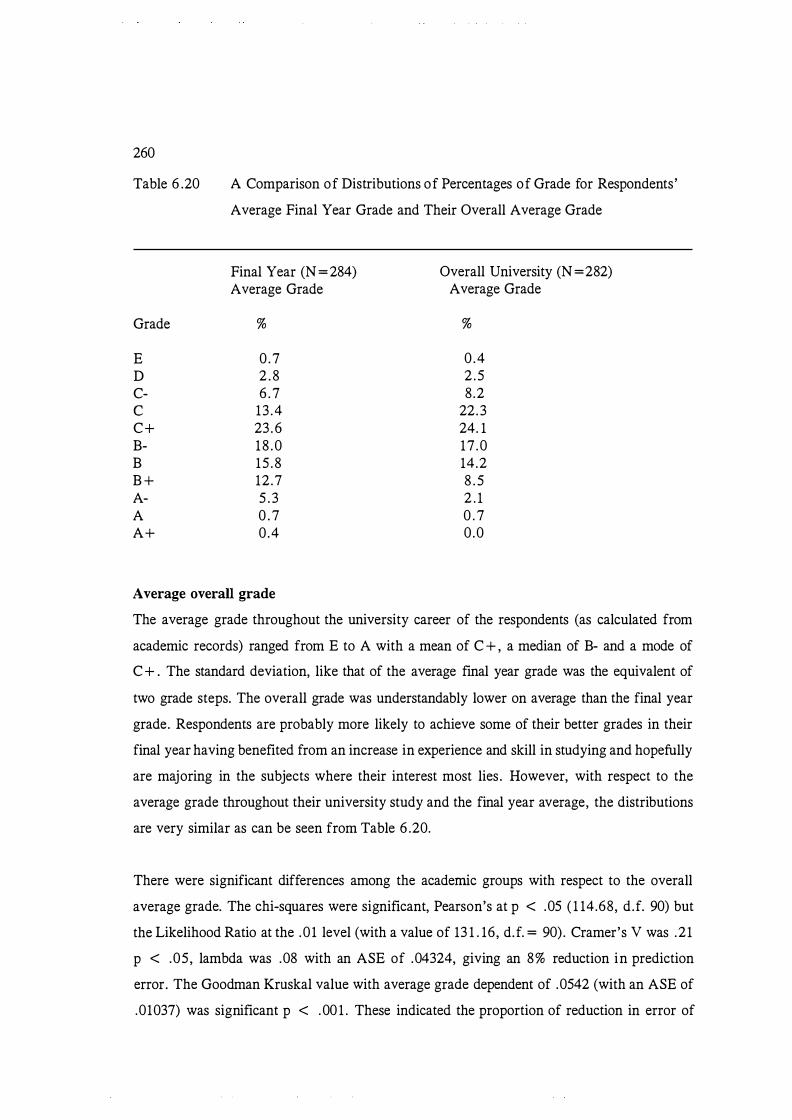
260
Table 6 .20
Grade
E D C-c C+ B-B B + A-A A+
A Comparison of Distributions of Percentages of Grade for Respondents '
Average Final Year Grade and Their Overall Average Grade
Final Year (N = 284) Overall University (N =282) Average Grade Average Grade
% %
0 .7 0 .4 2 . 8 2 .5 6 .7 8 .2
13 .4 22. 3 23 . 6 24. 1 18 .0 17 .0 15 .8 14.2 12 .7 8 . 5 5 . 3 2 . 1 0 . 7 0 . 7 0 .4 0 .0
Average overall grade
The average grade throughout the university career of the respondents (as calculated from
academic records) ranged from E to A with a mean of C + , a median of B- and a mode of
C + . The standard deviation, like that of the average final year grade was the equivalent of
two grade steps. The overall grade was understandably lower on average than the final year
grade. Respondents are probably more likely to achieve some of their better grades in their
final year having benefited from an increase in experience and skill in studying and hopefully
are majoring in the subjects where their interest most lies . However, with respect to the
average grade throughout their university study and the final year average, the distributions
are very similar as can be seen from Table 6 .20.
There were significant differences among the academic groups with respect to the overall
average grade. The chi-squares were significant, Pearson's at p < .05 ( 1 14.68, d.f. 90) but
the Likelihood Ratio at the .01 level (with a value of 13 1 . 16, d. f. = 90) . Cramer's V was .21
p < .05 , lambda was .08 with an ASE of .04324, giving an 8% reduction in prediction
error. The Goodman Kruskal value with average grade dependent of .0542 (with an ASE of
.01037) was significant p < .00 1 . These indicated the proportion of reduction in error of
261
prediction to be only about 5 % . The eta of . 32236 showed the proportion of shared variance
to be . 10, (or 10%).
The groups obtaining D's or less were Computer Science, Business Studies , Horticulture and
Veterinary Science. The groups not obtaining D grades , therefore, were Sciences,
Accountancy, Agriculture, Technology, Humanities and Social Sciences . Those obtaining B +
and above were all of the groups except Sciences, Accountancy and Business Studies . The
group with the largest percentage obtaining these higher grades was Computer Science
(34 .7%) , the remaining groups had about 7 % to 19 % obtaining such grades .
6 .2 .6 Working situation
The work related variables providing background data but not part of the expanded model
itself are discussed in this section. These variables to do with the working situation were
respondents' salaries, the salaries of their friends and their own rate of absenteeism.
Salaries (expected)
With respect to individuals own salaries (N = 339) there were differences among groups .
Pearson's chi-square was significant, 601 .69 with 290 d.f. , p < .001 and the Likelihood
Ratio was 453 .53 , d.f. 290, p < .00 1 . Cramer's V was .42, p < .00 1 . The lambda with
own salary dependent at . 13 and an ASE of .025 indicated that a 13 % reduction in error of
prediction was likely when predicting salary from academic grouping. Goodman and
Kruskal 's tau with salary dependent was significant (p < . 001) with a value of . 08506 and
an ASE of .00982, indicating that a 9 % reduction of error in prediction of salary was possible
with the knowledge of academic grouping. The eta with own salary dependent at .37 showed
14 % of the variance in salaries could be associated with academic grouping.
The groups with a percentage reporting to have high salaries (above $40,000) were
Horticulture and between $22,000 to $38,000 were Computer Science, Accountancy, Business
Studies , Technology, Humanities and Veterinary Science. All groups were represented in the
$15000 to $20000 group. Almost all groups were represented in the lower salary range. The
exceptions were Veterinary Science and Business Studies .

262
Friends' salary (expected)
With respect to friends' salaries (N = 337), the Pearson chi-square was 438 .96 , d. f. = 290,
p < .00 1 . Cramer's V measure of association was . 3609 1 , p < .001 . The lambda with
friend's salaries dependent was only .08 and the ASE .02572. The Goodman and Kruskal tau
was .05256 with an ASE of .00791 . Thus only a 5 % reduction in error would be likely in
classifying friend's salaries on the basis of respondent's academic group. The eta was .25
which indicated 6 % of the variance in the two variables was shared.
Sciences , Horticulture and Humanities groups reported to have friends with incomes in the
lowest group. Only the Humanities group reported their friends' salaries to be above $40,000,
a small percentage of all groups reported to have friends earning between $22,000 and
$33 ,000 (the percentages were 2 . 8 % for sciences, 4.2 % for Computer Sciences, 5 .4% for
Accountancy, 10% for humanities , 4 . 3 % for Social Sciences and 9 . 1 % for Veterinary
Science) . All groups were represented in the $18,000 to $24,000 salary range with 59% of
Veterinary Scientist's , 34. 7 % of the Social Sciences, 1 0 % of the Humanities group, 58 . 3 %
of the Technology group, 38 .5 % of the Agriculture group, 23 .4 % of the Horticulture group,
6 1 . 6 % of the Business Studies group, 2 1 .4% of the Accountancy group, 37. 6 % of the
Computer Science group and 19 .5 % of the Sciences group represented in this range. Almost
all groups (the exceptions being Veterinary Science and Technology) had a large percentage
of their group with friends' salaries at $ 15,000, $ 16,000 and $ 17,000.
The Humanities group had friends earning high and lower incomes. The Veterinary Science
and Technology groups did not have friends earning very low or very high incomes. The
Science group had friends earning medium and lower incomes.
Absenteeism
No significant differences among groups was evident for absenteeism. The number of days
respondents reported being absent was distributed as shown in Table 6 .21 . The median
number of days absent was around 28 .
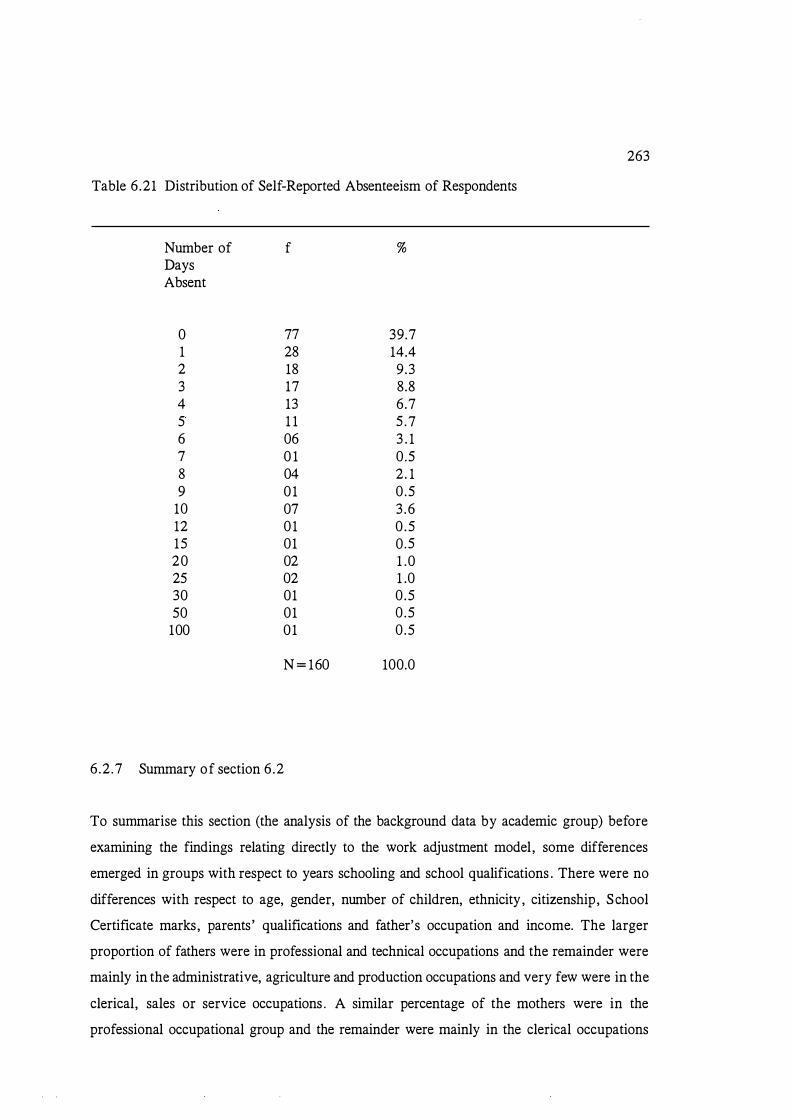
Table 6 .21 Distribution of Self-Reported Absenteeism of Respondents
Number of Days Absent
0 1 2 3 4 5 6 7 8 9
10 12 15 20 25 30 50
100
6 .2 .7 Summary of section 6 .2
f %
77 39.7 28 14.4 18 9 .3 17 8.8 13 6.7 1 1 5 .7 06 3 . 1 0 1 0 .5 04 2 . 1 0 1 0 .5 07 3 .6 01 0 .5 01 0 .5 02 1 .0 02 1 .0 01 0 .5 01 0 .5 01 0 .5
N = 160 100.0
263
To summarise this section (the analysis of the background data by academic group) before
examining the findings relating directly to the work adjustment model , some differences
emerged in groups with respect to years schooling and school qualifications . There were no
differences with respect to age, gender, number of children, ethnicity, citizenship, School
Certificate marks, parents ' qualifications and father's occupation and income. The larger
proportion of fathers were in professional and technical occupations and the remainder were
mainly in the administrative, agriculture and production occupations and very few were in the
clerical, sales or service occupations . A similar percentage of the mothers were in the
professional occupational group and the remainder were mainly in the clerical occupations

264
with fewer in the sales and services occupations and in an agriculture type of occupation. In
contrast to their male counterparts there were a very small percentage in administrative and
managerial positions or in production and labour type of occupations . A larger percentage
were working in the home but otherwise unemployed.
Differences between the occupations of the fathers and of the mothers were as might be
expected and similar to that present in the general population with the mothers being under
represented in the administrative and managerial occupations etc. and over-represented in the
'housewife' group, although it was perhaps less typical that both were equally represented in
the professional occupations. Consistent with fewer being employed outside the home, the
income of the mothers was less than that of the fathers . However, for some academic groups
(Agriculture, Veterinary Science and Teacher groups) mothers ' incomes were higher.
Most respondents described themselves to be in excellent health. Most spent their leisure
time with one or two others and engaged in one or two leisure activities . There were some
differences in accommodation patterns with the largest group living on Campus
accommodation being the Horticulture group. These were Diploma students at University for
that one year only and as such they were probably less likely to seek accommodation of a
longer term nature such as a flat. With respect to their own employment history and at stage
one of the study, most of the sample had been in employment of some kind. Just under a half
of the students had their first experience of work in a part -time capacity. By stage two of the
study an improvement in satisfaction with living circumstances was reported.
In relation to salaries, only the Horticulture group reported high salaries and Veterinary
Science and Business Studies were the only groups not represented at the lower end of the
salary range (below $14,999) . Only one group (Humanities) had friends in the high salary
range but they also had friends who could be categorised in other income groups as well .
Only Veterinary Scientists and Technologists did not have friends at either extreme of the
salary range (below $15 ,000 and above $40,000) .
Absenteeism was similar for all of the groups . The median number of days was 28.
Differences among the academic groups were apparent in their academic performance with
larger percentages of Computer Science, Agriculture, Horticulture groups attaining higher
grades .
6 . 3 Key statistics for work adjustment variables
265
The key descriptive statistics for the work adjustment variables of Dawis and Lofquist's
paradigm and the expanded model are given in the list of statistics in Appendix M and
summarised in section 6 .3 . 1 . Significant correlations were found among variables of Dawis
and Lofquist's model, among the variables of the expanded model (of the present research)
and between the models . Where the correlates of the variables are numerous the statistics are
presented in a summary form, by using the mean of all correlations with the target variable
(see Tables 6 .22, 6 .24 to 6 .27) . The number of correlates and the range of the correlation
coefficients are also included. The individual correlates are given in Appendix N . The
relationships among the variables central to Dawis and Lofquist's paradigm which were
included in the present research are presented and discussed in section 6 . 3 . 3 . The propositions
and hypotheses representing these relationships and the expansion of the model are examined
formally later (in chapter seven) using multiple regression and multiple analyses of variance
techniques .
6 .3 . 1 Key statistics of the work adjustment and related variables of the models
The statistics discussed in this section are given in Appendix M. The work needs produced
adjusted scale scores (see the scoring part of section 5 .8 . 1) on the MIQ ' of between -2.4 to
3 . 5 with means ranging from -.48 to 1 .68 (negative values indicate lower levels of work need
importance) . The standard deviations were similar for most needs with the exception of moral
values being compatible, social service (altruistic need) and the need for social status . These
three needs produced higher standard deviations suggesting respondents produced more
discrepant results for those needs or that these needs are more diverse in the population
studied. The needs rating as more important were ability utilisation (mean of 1 . 5 1 ) ,
achievement (mean of 1 .68) , advancement (mean of 1 .0) , friendly eo-workers (mean of 0 .94),
creativity (mean of 0 .9) , moral values (mean of 0 .91) , recognition (mean of 0 .92) and
responsibility (mean of 0 .96). The needs which emerged as the least important were authority
(mean of -0.48) and social status (mean of -0 .38) .
All of the needs were involved in need-reinforcer correspondence over all of the respondents .
The needs where less correspondence occurred were activity, authority, compensation,
independence, social status and variety. The needs where the standard deviation was greater
266
thus suggesting greater difference among respondents, were company policies and practices
and social status . For at least about 60 % of respondents, workers in their occupation were
perceived to have most of the work need reinforcers available. The reinforcers not present
for workers in their occupation for about half of the respondents were authority, creativity,
independence, technical supervision and variety.
The twenty satisfaction scores (of the MSQ general scale) for the various work needs ranged
from 0 to 30. The mean satisfaction level was similar for all needs, lying between 14 and 16 .
Satisfaction was slightly higher for independence, moral values and supervision (human
relations and technical) . The composite general satisfaction score ranged from 0 to 94 with
a mean of 62.46 and a standard deviation of 15 .02 . The percentage responding to each
category of the 1 to 7 scale of the single-item job satisfaction measure is shown in Figure 6 . 1 .
Overall 64.6 rated themselves as satisfied to some degree (categories 5 to 7) and 44. % chose
either category 6 or 7 on the rating scale (where 7 = satisfied) . Only 20% chose categories
1 to 3 which represented the dissatisfied end of the scale. Job satisfaction of the respondents
compared with that of their friends ranged from 1 to 7 but produced a mean of 5 and a mode
of 6 thus indicating a high level of satisfaction.
The average expected tenure was 3 .5 years but the median and mode were two years . The
standard deviation was 8 (years) because of a few extreme scores . This large standard
deviation can be seen to result from a small number of extreme scores (see Table M.2 in
Appendix M) . Only 20 of the respondents expected to stay longer than three years and of
these, results from the job attachment measure produced a mean of 3 .5 (on a scale of 1 to 7
with 1 = completely attached). Personal competence (locus of control) measures ranged from
4 to 28, with a low score representing high locus of control . The median was 14 for both
stages of the study, the mean was 14 for stage one and 14.5 for stage two. The standard
deviations were both similar (around 4) . The index of well-being and life satisfaction scores
were similar at both research stages .
Satisfaction with living circumstances was higher at stage two. The mean at stage one was 2.7
compared with 4 .9 at stage two (on the 1 to 7 scale) . On average respondents reported their
health to be good and to be satisfied with it. Leisure satisfaction was reasonable on average.
The job tended to be rated as of less or equal importance when compared with leisure
activities .
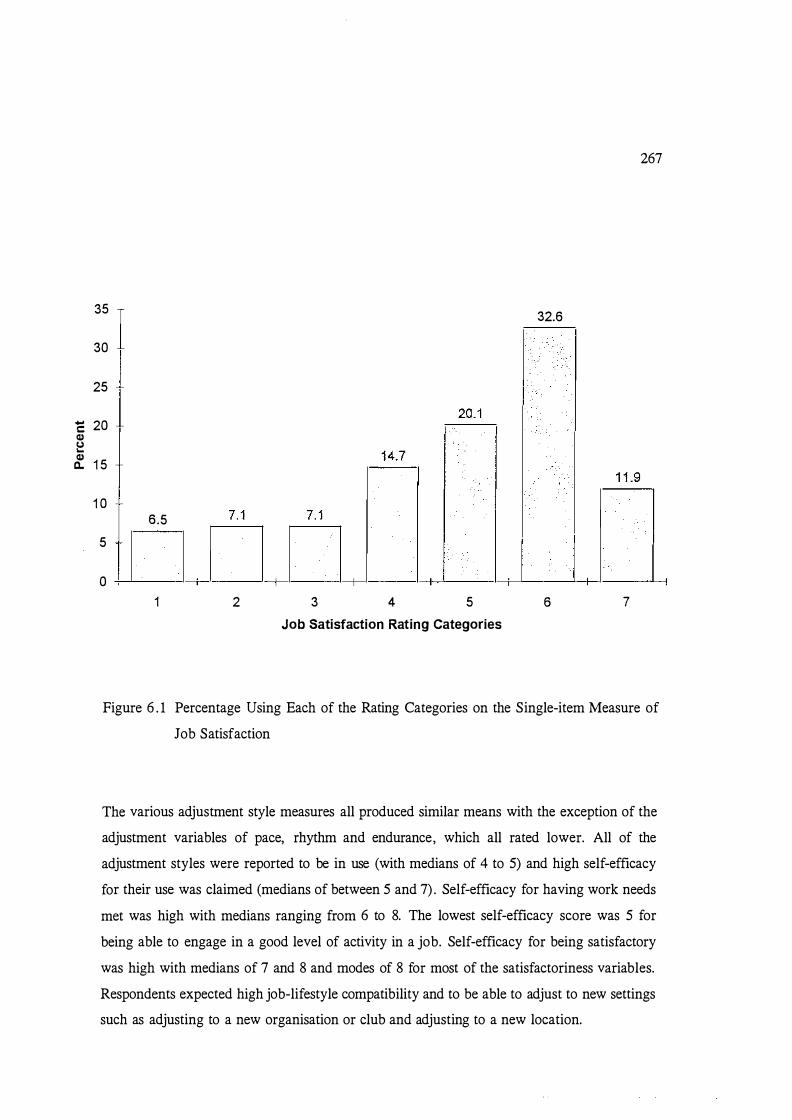
..... c: Cl) (.,) ... Cl) c.
267
35 32.6
30
25
20
t 1 5
1 0 6.5
5
0 1 2 3 4 5 6 7
Job Satisfaction Rating Categories
Figure 6 . 1 Percentage Using Each of the Rating Categories on the Single-item Measure of
Job Satisfaction
The various adjustment style measures all produced similar means with the exception of the
adjustment variables of pace, rhythm and endurance, which all rated lower. All of the
adjustment styles were reported to be in use (with medians of 4 to 5) and high self-efficacy
for their use was claimed (medians of between 5 and 7) . Self-efficacy for having work needs
met was high with medians ranging from 6 to 8. The lowest self-efficacy score was 5 for
being able to engage in a good level of activity in a job. Self-efficacy for being satisfactory
was high with medians of 7 and 8 and modes of 8 for most of the satisfactoriness variables.
Respondents expected high job-lifestyle compatibility and to be able to adjust to new settings
such as adjusting to a new organisation or club and adjusting to a new location.
268
The findings for the satisfaction with the quality of life measures demonstrated a degree of
satisfaction in relation to most of the satisfaction domains . Individuals were on average
dissatisfied only with their savings (mode of 2 on the 1 to 7 scale with 7 = satisfied) . That
they were not satisfied with their savings is not surprising in a sample in the early stages of
employment. Most of the quality of life measures were regarded as important, although
housework rated lower in importance on average. The social support measures showed usually
between 72 % to 92 % believed they received support. However, for the statement of
preferring to keep worries to oneself, about half preferred to do this .
6 .3 .2 Correlates of variables of Dawis and Lofquist's paradigm
The variables of the basic work adjustment paradigm for which the correlates are presented
are need-reinforcer correspondence, job satisfaction (individual satisfaction terms and the
MSQ General Satisfaction scale) and perceived job satisfactoriness .
Some of the highest correlations of the need-correspondence terms (listed in Appendix N and
summarised in Table 6 .22) , those correlations of around .60 and greater, occurred in the
correlation of work needs with their respective correspondence term with the exception of
ability utilisation and the ability utilisation need-reinforcer term and the achievement work
need and its correspondence term. Other high correlations involved the authority of workers
in the job and authority correspondence, the autonomy in the job need and authority
correspondence, responsibility correspondence and creativity correspondence, and lastly,
social status typical of the occupation and social status correspondence.
With reference to Table 6 .26 and Appendix N some of the higher correlates of job attachment
were job satisfaction compared with friends ( . 64) and the specific satisfaction scores to do
with ability utilisation ( .62) , achievement ( .62) , creativity (-.53) and variety ( .55) , self
efficacy for ability utilisation ( . 58) achievement ( . 66) and recognition ( .55) . The general
satisfaction score gave a coefficient of reasonable magnitude. Of the self-efficacy measures , ,
those exhibiting higher correlations with job attachment were self-efficacy for achievement,
variety and perseverance. Some of the same work needs were involved significantly with job
attachment, both in the satisfaction and self-efficacy dimensions . Not all of the associations
were positive relationships . Personal competence, satisfaction with company policies and
creativity satisfaction all were negatively related to job attachment.
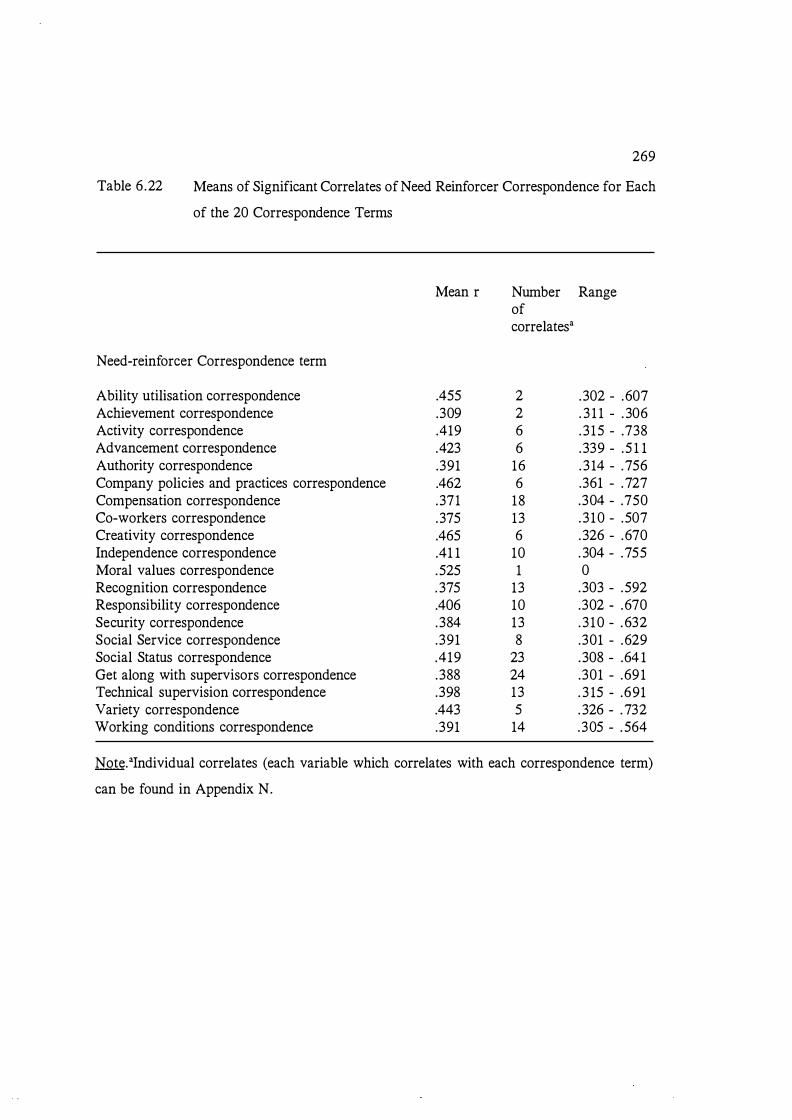
269
Table 6 .22 Means of Significant Correlates of Need Reinforcer Correspondence for Each
of the 20 Correspondence Terms
Need-reinforcer Correspondence term
Ability utilisation correspondence Achievement correspondence Activity correspondence Advancement correspondence Authority correspondence Company policies and practices correspondence Compensation correspondence eo-workers correspondence Creativity correspondence Independence correspondence Moral values correspondence Recognition correspondence Responsibility correspondence Security correspondence Social Service correspondence Social Status correspondence Get along with supervisors correspondence Technical supervision correspondence Variety correspondence Working conditions correspondence
Mean r
.455
.309
.419
.423
.391
.462
.371
.375
.465
.41 1
.525
. 375
.406
.384
.391
.419
.388
.398
.443
.391
Number Range of correlates a
2 2 6 6
16 6
18 13 6
10 1
13 10 13 8
23 24 13 5
14
.302 - .607
. 3 1 1 - . 306
. 3 15 - .738
.339 - .5 1 1
. 3 14 - .756
.361 - .727 .304 - .750 . 3 10 - .507 .326 - .670 . 304 - .755 0
.303 - .592
.302 - .670
. 3 10 - . 632
.301 - .629
.308 - .64 1
.301 - .69 1
. 3 15 - .691
. 326 - . 732
.305 - . 564
Note.alndividual correlates (each variable which correlates with each correspondence term)
can be found in Appendix N.
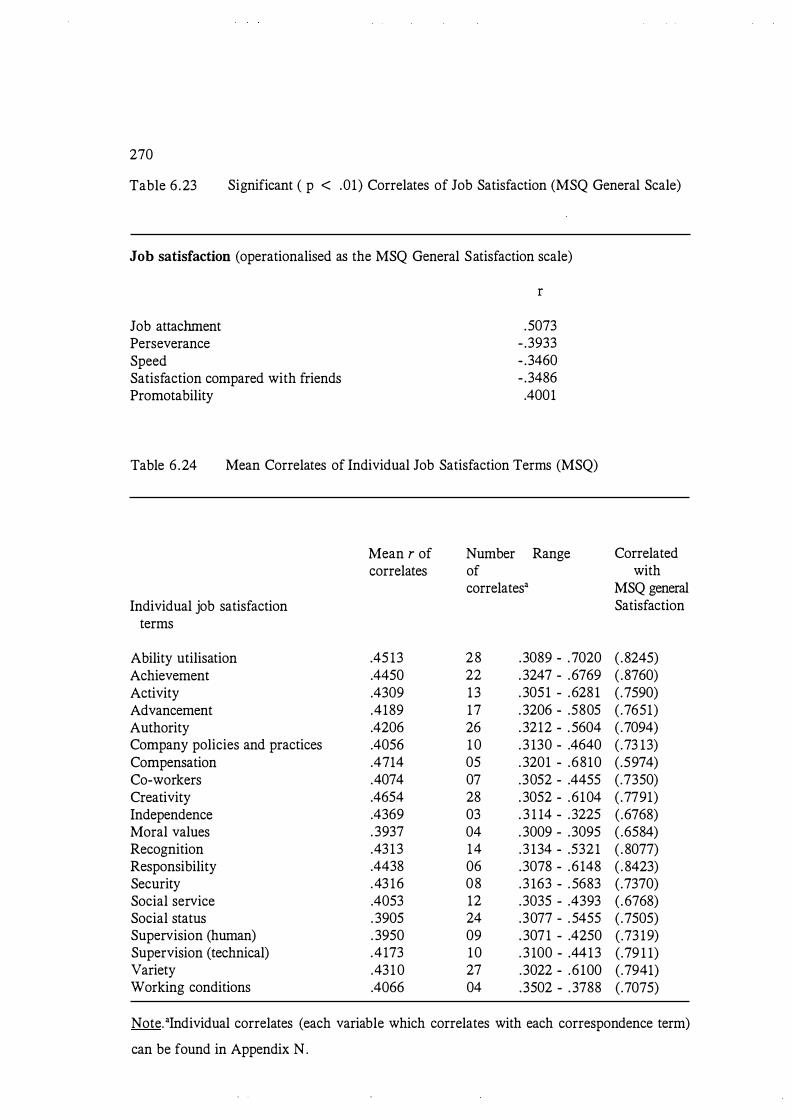
270
Table 6 .23 Significant ( p < .01) Correlates of Job Satisfaction (MSQ General Scale)
Job satisfaction (operationalised as the MSQ General Satisfaction scale)
Job attachment Perseverance Speed Satisfaction compared with friends Promotability
r
.5073 - .3933 - .3460 - .3486 .4001
Table 6 .24 Mean Correlates of Individual Job Satisfaction Terms (MSQ)
Mean r of Number Range correlates of
correlatesa Individual job satisfaction
terms
Ability utilisation .45 13 28 .3089 - .7020 Achievement .4450 22 . 3247 - .6769 Activity .4309 1 3 . 3051 - .6281 Advancement .4189 17 . 3206 - .5805 Authority .4206 26 . 3212 - . 5604 Company policies and practices .4056 1 0 . 3 130 - .4640 Compensation .4714 05 . 3201 - .6810 eo-workers .4074 07 .3052 - .4455 Creativity .4654 28 . 3052 - .6104 Independence .4369 03 . 3 1 14 - .3225 Moral values . 3937 04 . 3009 - .3095 Recognition .43 13 14 .3 134 - .5321 Responsibility .4438 06 .3078 - .6 148 Security .43 16 08 .3 163 - . 5683 Social service .4053 12 .3035 - .4393 Social status . 3905 24 .3077 - . 5455 Supervision (human) . 3950 09 . 3071 - .4250 Supervision (technical) .4173 10 . 3 100 - .4413 Variety .43 1 0 27 .3022 - .6 100 Working conditions .4066 04 .3502 - . 3788
Correlated with
MSQ general Satisfaction
( .8245) ( .8760) ( .7590) ( .7651) ( .7094) ( .73 13) ( .5974) (.7350) ( .7791) ( .6768) ( .6584) ( . 8077) ( . 8423) (.7370) ( . 6768) ( .7505) ( .73 19) ( .79 1 1) ( .7941) ( .7075)
Note. alndividual correlates (each variable which correlates with each correspondence term)
can be found in Appendix N .

271
With reference to Table 6 .24, the value in parentheses following the range is the maximum
correlation but this is not used as the upper limit of the range because it is the score for
general satisfaction. As such it is a composite score made up of some of the individual
satisfaction items. Consequently, it is not independent of the individual satisfaction measures
and would inflate the range if included in it. The range can be seen to vary considerably.
Variety and moral values satisfaction demonstrated a very small range. Those with the greater
range of degree of correlation were ability utilisation, compensation, creativity and
responsibility satisfactions .
Table 6 .25 Mean Significant Correlates of Self-Perceived Satisfactoriness
Perceived Satisfactoriness term
Performance satisfactoriness Achievement satisfactoriness Abiding by rules satisfactoriness Promotability satisfactoriness Adapting to procedure changes Team member satisfactoriness Getting along with supervisors satisfactoriness
Mean r
.356
.490
.351
.329
.375
.401
.400
Number of correlates"
08 32 02 09 08 05 07
Range
. 3 13 - .401
.301 - .80
. 3 13 - . 389
.302 - . 382
.249 - .489
.302 - .478
.308 - .489
Note. "Individual correlates (each variable which correlates with each correspondence term)
can be found in Appendix N.
Job attachment correlated with 13 of the job satisfaction measures and 1 1 of the self-efficacy
measures (refer Table 6 .26) . Of all the variables those with a reasonable number of correlates
above could all be considered 'central' to work adjustment or at the very least interconnected
more than others because of their high number of correlates .
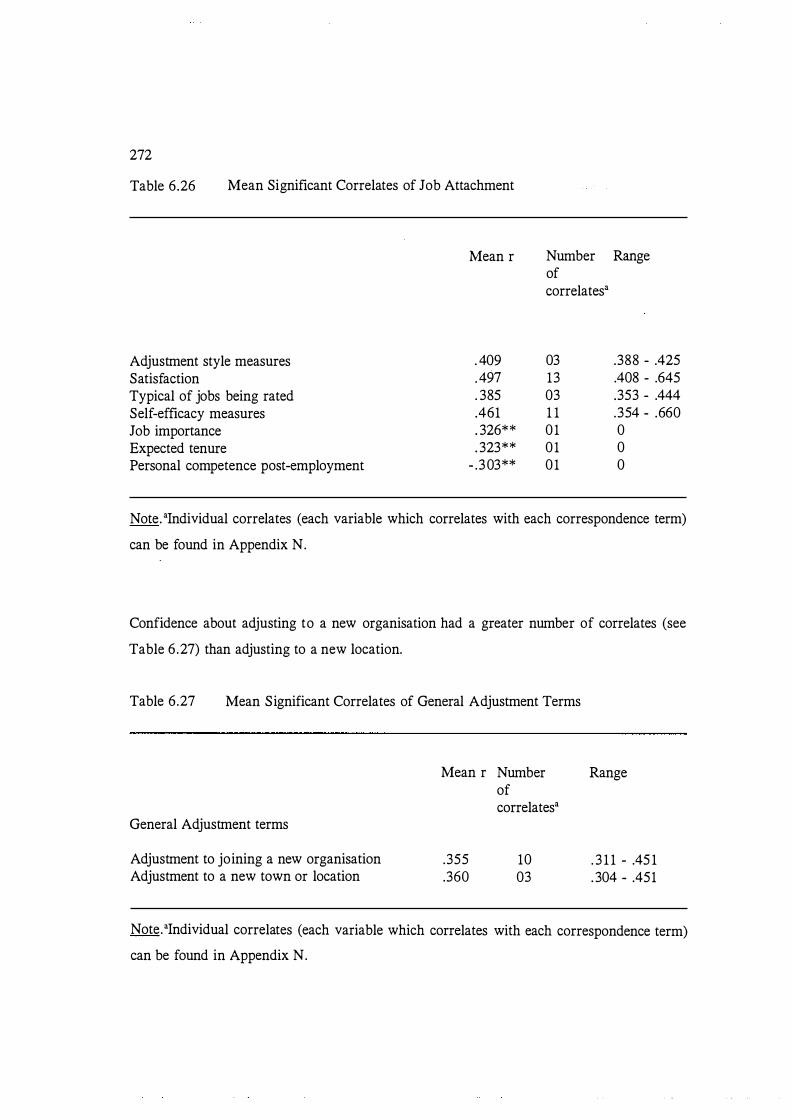
272
Table 6.26 Mean Significant Correlates of Job Attachment
Mean r
Adjustment style measures . 409 Satisfaction . 497 Typical of jobs being rated . 385 Self-efficacy measures .461 Job importance . 326** Expected tenure . 323** Personal competence post-employment - .3 03**
Number Range of correlatesa
03 .388 - .425 13 .408 - .645 03 .353 - .444 1 1 .354 - .660 01 0 01 0 01 0
Note. alndividual correlates (each variable which correlates with each correspondence term)
can be found in Appendix N.
Confidence about adjusting to a new organisation had a greater number of correlates (see
Table 6 .27) than adjusting to a new location.
Table 6.27 Mean Significant Correlates of General Adjustment Terms
Mean r Number Range of correlatesa
General Adjustment terms
Adjustment to joining a new organisation .355 10 . 3 1 1 - .45 1 Adjustment to a new town or location .360 03 . 304 - .451
Note.alndividual correlates (each variable which correlates with each correspondence term)
can be found in Appendix N.
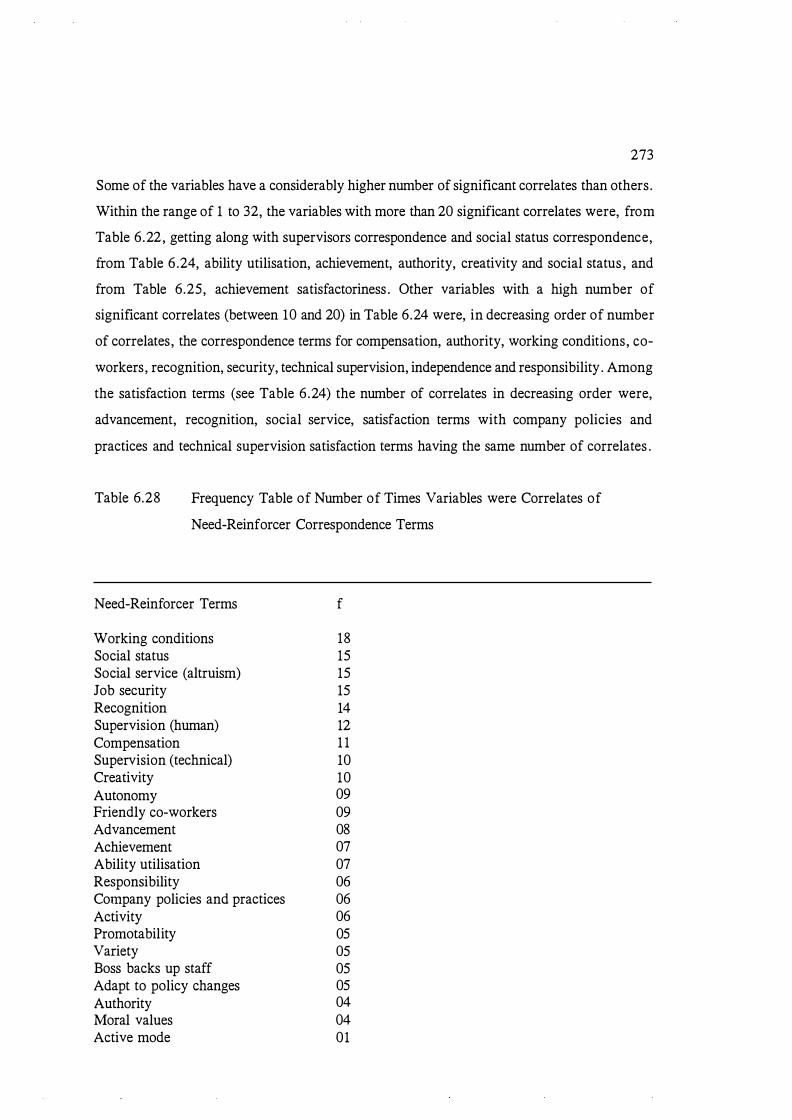
273
Some of the variables have a considerably higher number of significant correlates than others .
Within the range of 1 to 32, the variables with more than 20 significant correlates were, from
Table 6 .22 , getting along with supervisors correspondence and social status correspondence,
from Table 6 .24, ability utilisation, achievement, authority, creativity and social status , and
from Table 6.25, achievement satisfactoriness . Other variables with a high number of
significant correlates (between 10 and 20) in Table 6.24 were, in decreasing order of number
of correlates , the correspondence terms for compensation, authority, working conditions, eo
workers , recognition, security, technical supervision, independence and responsibility . Among
the satisfaction terms (see Table 6 .24) the number of correlates in decreasing order were,
advancement, recognition, social service, satisfaction terms with company policies and
practices and technical supervision satisfaction terms having the same number of correlates .
Table 6.28 Frequency Table of Number of Times Variables were Correlates of
Need-Reinforcer Correspondence Terms
Need-Reinforcer Terms f
Working conditions 18 Social status 15 Social service (altruism) 15 Job security 15 Recognition 14 Supervision (human) 12 Compensation 1 1 Supervision (technical) 10 Creativity 10 Autonomy 09 Friendly eo-workers 09 Advancement 08 Achievement 07 Ability utilisation 07 Responsibility 06 Company policies and practices 06 Activity 06 Promotability 05 Variety 05 Boss backs up staff 05 Adapt to policy changes 05 Authority 04 Moral values 04 Active mode 01
274
Some of the variables were correlates of need-reinforcer correspondence terms more
frequently than others . Table 6 .28 lists the frequency in descending order. The individual
satisfaction terms which had the most significant correlates were ability, achievement,
activity, authority and creativity. The significant correlates of the general job satisfaction term
were job attachment, perseverance, speed of adjustment, satisfaction compared with friends
and promotability . Job satisfactoriness as measured by performance, correlated with
adjustment style variables (pace and endurance), self-efficacy (for authority, abiding by rules
and working independently) , being promotable, working independently and experiencing well
being (see Table M . l in Appendix M) . Perceived satisfactoriness measured by achievement
correlated with many of the satisfaction terms, with the general satisfaction measure, with
many of the self-efficacy measures , with low absenteeism and with job-lifestyle compatibility .
Satisfactoriness measured by abiding by the rules was associated with being able to undertake
repetitive work. Perceived satisfactoriness as measured by promotability was correlated with
advancement satisfaction, with some self-efficacy measures (using skills and authority) and
with some work needs. Satisfactoriness measured by adapting to change was associated with
the adjustment style of endurance, with some work needs (variety and friendly eo-workers)
with good performance, low absenteeism and getting along with supervisors . Satisfactoriness
measured by ability to work as a member of a team was related to self-efficacy for using an
active adjustment style, some work needs and eo-workers being friendly. Satisfactoriness as
measured by ability to get along with supervisors was associated with job security, obtaining
recognition, good supervision, adaptability to changes in procedures and methods and the
ability to work as part of a team.
Job attachment was correlated with a high number of the measures, 33 in all, particularly with
expected tenure, adjustment styles , locus of control , being satisfied in many of the work needs
and exhibiting self-efficacy. General adjustment, as measured by expectation of adjusting to
a new organisation, was associated with adjustment styles (perseverance, predictability of
pace, activeness , reactiveness and speed of response) with well-being at both stages of the
study and life satisfaction at stage two, with eo-worker satisfaction and with adjusting to a
new location. Adjustment to a new location was associated with speed of response, stage two
life satisfaction and adjusting to a new organisation. These two general adjustment measures
appear to be related.
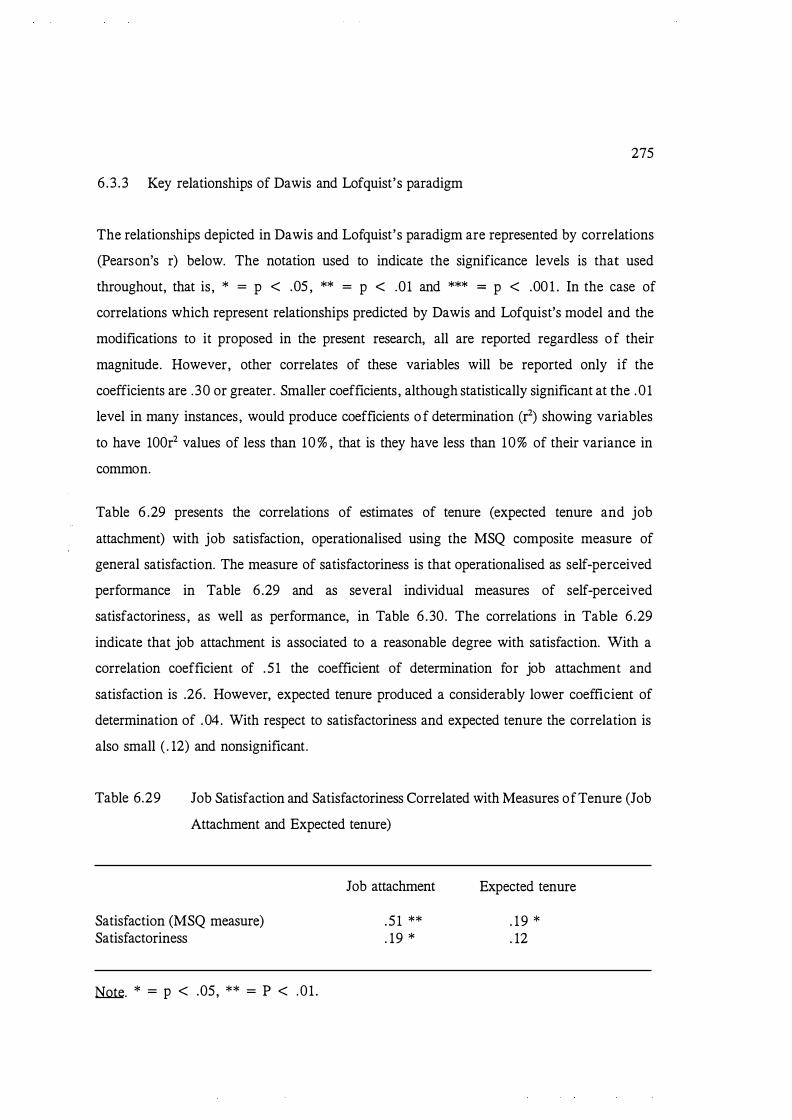
6 .3 .3 Key relationships of Dawis and Lofquist's paradigm
275
The relationships depicted in Dawis and Lofquist's paradigm are represented by correlations
(Pears on's r) below. The notation used to indicate the significance levels is that used
throughout, that is , * = p < .05 , ** = p < .01 and *** = p < .00 1 . In the case of
correlations which represent relationships predicted by Dawis and Lofquist's model and the
modifications to it proposed in the present research, all are reported regardless of their
magnitude. However, other correlates of these variables will be reported only if the
coefficients are . 30 or greater. Smaller coefficients , although statistically significant at the . 0 1
level in many instances, would produce coefficients of determination (r) showing variables
to have 100r2 values of less than 10 % , that is they have less than 10% of their variance in
common.
Table 6 .29 presents the correlations of estimates of tenure (expected tenure and job
attachment) with job satisfaction, operationalised using the MSQ composite measure of
general satisfaction. The measure of satisfactoriness is that operationalised as self-perceived
performance in Table 6 .29 and as several individual measures of self-perceived
satisfactoriness , as well as performance, in Table 6 .30. The correlations in Table 6 .29
indicate that job attachment is associated to a reasonable degree with satisfaction. With a
correlation coefficient of . 5 1 the coefficient of determination for job attachment and
satisfaction is .26. However, expected tenure produced a considerably lower coefficient of
determination of .04. With respect to satisfactoriness and expected tenure the correlation is
also small ( . 12) and nonsignificant.
Table 6.29 Job Satisfaction and Satisfactoriness Correlated with Measures of Tenure (Job
Attachment and Expected tenure)
Satisfaction (MSQ measure) Satisfactoriness
Note. * = p < .05, ** = P < .0 1 .
Job attachment
. 5 1 **
. 19 *
Expected tenure
. 19 *
. 12
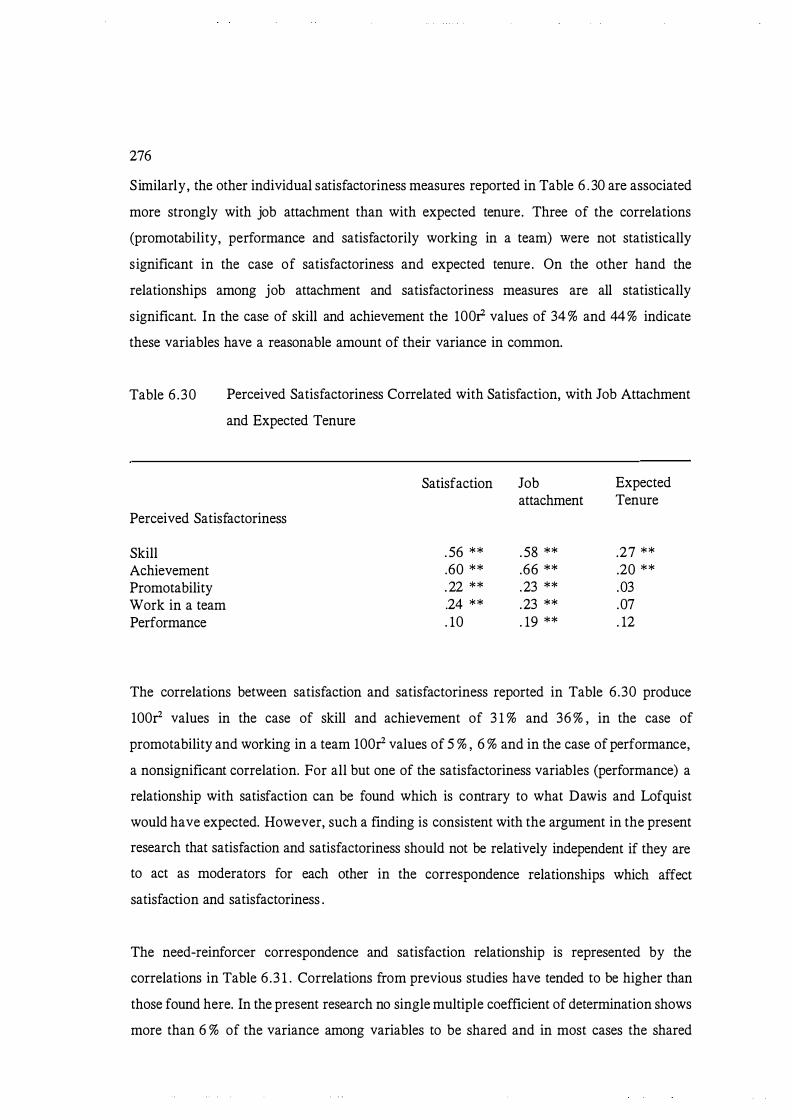
276
Similarly, the other individual satisfactoriness measures reported in Table 6 . 30 are associated
more strongly with job attachment than with expected tenure. Three of the correlations
(promotability, performance and satisfactorily working in a team) were not statistically
significant in the case of satisfactoriness and expected tenure. On the other hand the
relationships among job attachment and satisfactoriness measures are all statistically
significant. In the case of skill and achievement the 100r2 values of 34 % and 44% indicate
these variables have a reasonable amount of their variance in common.
Table 6 .30 Perceived Satisfactoriness Correlated with Satisfaction, with Job Attachment
and Expected Tenure
Satisfaction Job Expected attachment Tenure
Perceived Satisfactoriness
Skill . 56 ** . 58 ** .27 ** Achievement .60 ** .66 ** .20 ** Promotability .22 ** .23 ** .03 Work in a team .24 ** .23 ** .07 Performance . 10 . 19 ** . 12
The correlations between satisfaction and satisfactoriness reported in Table 6 .30 produce
lOOr values in the case of skill and achievement of 3 1 % and 36 % , in the case of
promotability and working in a team lOOr values of 5 % , 6 % and in the case of performance,
a nonsignificant correlation. For all but one of the satisfactoriness variables (performance) a
relationship with satisfaction can be found which is contrary to what Dawis and Lofquist
would have expected. However, such a finding is consistent with the argument in the present
research that satisfaction and satisfactoriness should not be relatively independent if they are
to act as moderators for each other in the correspondence relationships which affect
satisfaction and satisfactoriness .
The need-reinforcer correspondence and satisfaction relationship is represented by the
correlations in Table 6 .3 1 . Correlations from previous studies have tended to be higher than
those found here. In the present research no single multiple coefficient of determination shows
more than 6 % of the variance among variables to be shared and in most cases the shared

277
variance is only around 4 % . Dawis and Lofquist ( 1984) report correlations between predicted
and observed satisfaction ranging from .46 to .92. However, theirs are multiple correlations
between job satisfaction predicted from twenty need scores and observed satisfaction (a
measure of the correspondence between the same twenty needs and the reinforcer pattern of
the environment) . These multiple correlations may be inflated and not have been corrected
for bias . In samples with Ns below 100 (which many of the samples were in Dawis and
Lofquist's examples), multiple R needs to be corrected for bias (Guildford, 1965) . The
multiple R represents the maximum correlation between a dependent variable and a weighted
combination of independent variables . The least-squares solution in computing the combined
weights and ensuring the maximum correlation, tends to produce an inflated value because
it capitalises on any chance deviation which favours a high multiple correlation. Guildford
discusses a usual way of reducing R to be a better estimate of the multiple correlation in the
population. The method takes into account the number of cases and the number of variables
correlated. In his example, an r of .677 was 'shrunk' to .45 .
Table 6 . 3 1 Need-reinforcer Correspondence Correlated with Job Satisfaction (MSQ
Composite Measure)
Need-reinforcer correspondence
Activity Authority Recognition Security Social service Supervision (human relations) Supervision (technical)
Note. * = p < .05, ** = p < .0 1 .
Satisfaction (%)
.20 *
.20 * . 17 * . 15 * . 18 * .25 ** . 19 *
4.0 4.0 2 .9 2 .3 3 .2 6 . 3 3 . 6
To summarise, the correlation findings for the basic relationships of Dawis and Lofquist's
model under consideration suggest that tenure is not as strongly associated with job
satisfaction and satisfactoriness as they would predict. The two constructs appear to be
dependent rather than relatively independent. Although, the need-reinforcer correspondence
is associated with job satisfaction the degree of association is less than that found in previous
research.
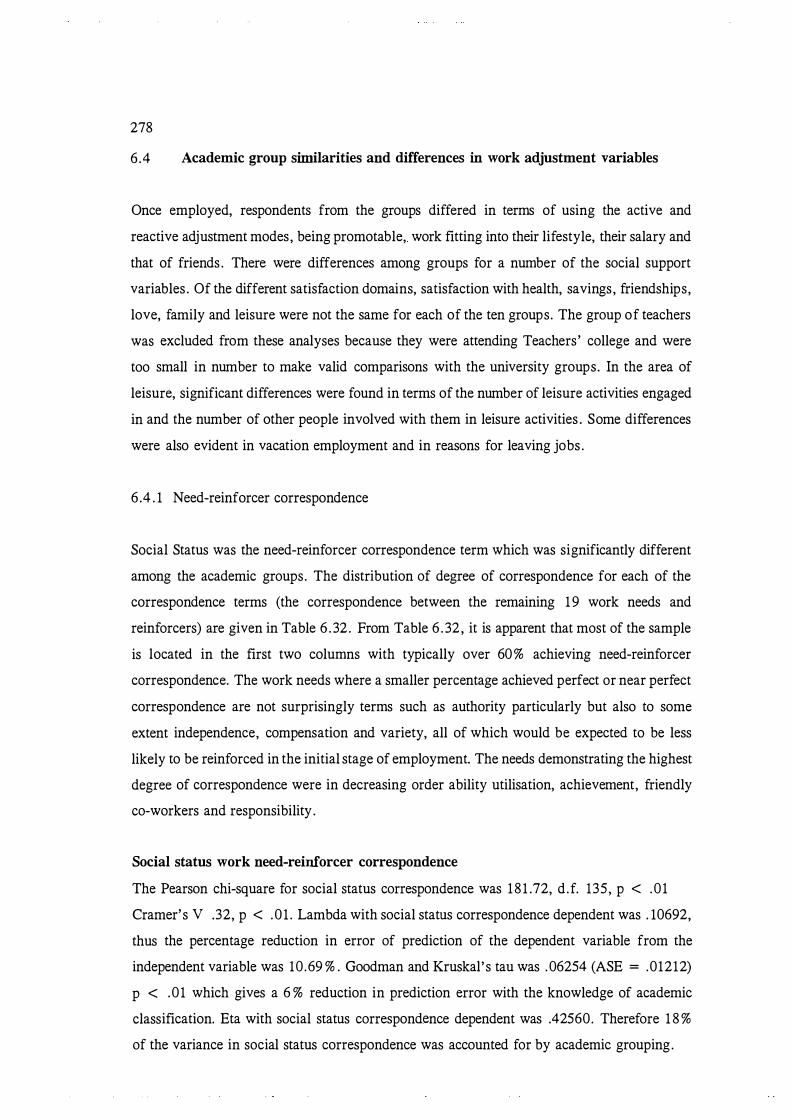
278
6 .4 Academic group similarities and differences in work adjustment variables
Once employed, respondents from the groups differed in terms of using the active and
reactive adjustment modes, being promotable, work fitting into their lifestyle, their salary and
that of friends . There were differences among groups for a number of the social support
variables . Of the different satisfaction domains, satisfaction with health, savings, friendships,
love, family and leisure were not the same for each of the ten groups. The group of teachers
was excluded from these analyses because they were attending Teachers ' college and were
too small in number to make valid comparisons with the university groups. In the area of
leisure, significant differences were found in terms of the number of leisure activities engaged
in and the number of other people involved with them in leisure activities . Some differences
were also evident in vacation employment and in reasons for leaving jobs .
6 .4 . 1 Need-reinforcer correspondence
Social Status was the need-reinforcer correspondence term which was significantly different
among the academic groups. The distribution of degree of correspondence for each of the
correspondence terms (the correspondence between the remaining 1 9 work needs and
reinforcers) are given in Table 6 . 32 . From Table 6 . 32 , it is apparent that most of the sample
is located in the first two columns with typically over 60% achieving need-reinforcer
correspondence. The work needs where a smaller percentage achieved perfect or near perfect
correspondence are not surprisingly terms such as authority particularly but also to some
extent independence, compensation and variety, all of which would be expected to be less
likely to be reinforced in the initial stage of employment. The needs demonstrating the highest
degree of correspondence were in decreasing order ability utilisation, achievement, friendly
eo-workers and responsibility .
Social status work need-reinforcer correspondence
The Pearson chi-square for social status correspondence was 181 .72, d .f. 135, p < .01
Cramer's V .32, p < .0 1 . Lambda with social status correspondence dependent was . 10692,
thus the percentage reduction in error of prediction of the dependent variable from the
independent variable was 10 .69 % . Goodman and Kruskal' s tau was .06254 (ASE = .01212)
p < .01 which gives a 6 % reduction in prediction error with the knowledge of academic
classification. Eta with social status correspondence dependent was .42560. Therefore 1 8 %
of the variance in social status correspondence was accounted for by academic grouping.

Table 6 . 32 Distribution of Percentage for Correspondence Scores (O =perfect correspondence) for Those with No Significant Differences
Among Academic Groups (N = 193).
Correspondence
Need/reinforcer 0 1 2 3 4 5 6 7 8 9 10 11 12 13 14 15 16 17
Ability utilisation 76.2 16 .6 2 .6 1 . 0 3 . 1 0 .0 0 .5 Achievement 69. 9 20.2 6 .2 1 .0 1 . 6 0 .0 1 .0 Activity 41 . 5 20.2 7 .8 7 .3 1 1 .4 1 . 6 4.7 1 . 0 0 .5 1 .0 1 .0 0 .0 0 .5 0 .5 Advancement 55 . 5 24.9 8 . 3 3 .6 2 .6 1 . 0 2 . 1 0 .5 0 . 0 1 .0 0 .5 Authority 1 1 .4 10 .9 14.0 6 .7 13 .5 5 .2 9 . 3 8 . 3 0 .0 6 .7 4 .7 0 .5 4 .7 3 . 1 0 .5 0 .5 Company policies 44.6 23 .8 1 1 .4 4 .7 7 .8 3 . 1 2 . 1 1 .6 0 .0 0 .5 0 .0 0 .0 0 .0 0 .5 Compensation 37. 3 26.4 7 .8 6 .7 8 . 3 4 . 1 2 . 6 3 .6 0 .0 1 .0 1 .0 0 .0 0 .5 0 .0 0 .0 0 .5 Coworkers 68.4 19.7 7 .8 1 . 6 1 . 6 0 . 0 0 .0 1 . 0 Creativity 58 .8 23 .8 6 .7 4 .7 3 . 1 1 .0 1 . 6 0 . 0 0 .0 0 .5 0 .0 0 .0 0 .0 0 .5 Independence 3 1 .6 20.7 9 .3 4.7 14 . 0 5 .7 4.7 2 .6 0 .5 3 . 1 1 . 0 0 . 0 0 .0 1 . 6 0 .0 0 .0 0 .0 0 .5 Moral values 56.6 22 .8 7 . 3 4.7 3 . 1 1 . 6 1 .0 2 . 1 0 .5 0 .0 0 .0 0 .5 0 .5 0 .0 Recognition 54 .9 22. 3 7 . 3 4.7 3 . 1 4. 1 1 .6 0 .5 1 .0 0 .5 Responsibility 67.4 19 .2 3 .6 3 .6 3 . 1 1 .0 0 .5 0 .5 0 .5 0 .5 Security 57 .0 19.7 7 .8 4 . 1 6 .2 1 .0 2 . 1 1 . 6 0 .5 Social services 46 . 1 2 1 . 8 12.4 3 . 6 7 . 3 4. 1 1 .6 1 . 6 0 . 0 0 .0 0 .0 0 .5 0 .5 0 .5 Supervision (human) 47 .7 22.8 9 . 3 8 . 3 5 .7 2 .2 2 . 1 1 .0 0 .0 0 .5 0 .5 Supervision (technical) 43 .0 20.7 1 1 .9 6 .7 10 .4 3 .6 1 .6 0 .5 1 .0 0 .0 0 .5 Variety 38 .3 23 . 3 10.4 7 . 3 8 . 8 3 .6 4 . 1 2 . 1 0 .0 0 .5 0 .5 0 .0 1 .0 Working Conditions 6 1 .7 19 .7 8 . 3 4 . 1 3 . 1 1 . 6 0 .5 0 .5 0 .0 0 .5
N --.1 1.0

280
All groups were represented in the high correspondence end of the score range, with perfect
correspondence being achieved in terms of social status for 9 .7% of the Sciences group, 10 %
of the Computer Science group, 38 .7% of the Accountancy group, 44.4 % of Business
Studies , 12.5 % of Horticulture, 23 . 1 % of Humanities , 8 .3 % of Social Sciences and 16 .7 %
of Veterinary Science. Of all the respondents (N= 193) 17.6 % obtained perfect
correspondence between their social status needs and the social status reinforcers in their work
environment. At the low correspondence end of the score range groups appearing here were
Sciences, Computer sciences, Horticulture and Agriculture. Overall the correspondence scores
ranged from 0 (that is no difference between the need and the reinforcer) and 17.
Some differences among groups were noticeable from the crosstabulation (Table 6 .33).
Differences are apparent particularly for correspondence scores from 0 to 1. For some groups
the largest percentages were in this range. A comparison of all the groups for correspondence
scores of 0 to 1 shows that Sciences had 19.4% , Computer Science 20 % , Accountancy
64. 5 % , Business Studies 55 .5 % , Horticulture 25 % , Agriculture 14.3 % , Technology 25 % ,
Humanities 38.5 % , Social Sciences 33 . 3 % and Veterinarian Science 55.6 % .
Table 6 .33 Social Status Correspondence of Academic Groups
Count Row Pet Col Pet
Social Status Correspondence
O l 4 1 I S I
Row 6 1 Total
GROUP - - - - - - - - + - - - - - - + - - - - - - + - - - - - - + - - - - - - + - - - - - - + - - - - - - + - - - - - - + 1 I 3 1 3 1 3 1 1 1 6 1 1 1 3 1 3 1
Sciences I 9 . 7 1 9 . 7 1 9 . 7 1 3 . 2 1 19 . 4 1 3 . 2 1 9 . 7 1 16 . 1 I 8 . 8 1 8 . 8 1 16 . 7 1 12 . s 1 22 . 2 1 7 . 1 1 2 7 . 3 1
+ - - - - - - + - - - - - - + - - - - - - + - - - - - - + - - - - - - + - - - - - - + - - - - - - + 2 I 2 1 2 1 3 1 1 1 2 1 1 2 0
Computer I 10 . 0 1 10 . 0 1 1S . O I S . O I 10 . 0 1 I 10 . 4 Science I S . 9 1 S . 9 1 16 . 7 1 12 . S I 7 . 4 1 I 1
+ - - - - - - + - - - - - - + - - - - - - + - - - - - - + - - - - - - + - - - - - - + - - - - - - + 3 I 12 I 8 I 3 I 1 1 3 1 1 2 1 3 1
Accountancy I 3 8 . 7 1 2 S . 8 1 9 . 7 1 3 . 2 1 9 . 7 1 I 6 . S I 1 6 . 1 I 3 S . 3 I 2 3 . s l 16 . 7 1 12 . s 1 11 . 1 1 1 1 8 . 2 1
+ - - - - - - + - - - - - - + - - - - - - + - - - - - - + - - - - - - + - - - - - - + - - - - - - + 4 I 4 1 1 1 1 1 I 1 1 1 1 1 1 9
Business I 44 . 4 1 11 . 1 1 11 . 1 1 I 11 . 1 1 11 . 1 1 11 . 1 1 4 . 7 Studies I 11 . 8 1 2 . 9 1 S . 6 1 I 3 . 7 1 7 . 1 1 9 . 1 1
+ - - - - - - + - - - - - - + - - - - - - + - - - - - - + - - - - - - + - - - - - - + - - - - - - +
(Table 6 .33 continued)

Count Row Pet Col Pet
I I I I
Social Status Correspondence
281
I �w I 0 I 1 1 2 I 3 I 4 I S I 6 I Total
GROUP - - - - - - - - + - - - - - - + - - - - - - + - - - - - - + - - - - - - + - - - - - - + - - - - - - + - - - - - - + s I 6 1 6 1 2 1 1 1 9 1 6 1 4 1 4 8
24 . 9 Horticulture
Agriculture
Technology
Humanities
Social Sciences
Veterinary Sciences
6
7
8
9
10
(Table 6 . 33 continued)
Count Row Pet Col Pet
I 12 . s 1 12 . s 1 4 . 2 1 2 . 1 1 1s . s 1 12 . s 1 s . 3 1 I 17 . 6 1 1 7 . 6 1 11 . 1 1 12 . s 1 33 . 3 1 42 . 9 1 3 6 . 4 1
+ - - - - - - + - - - - - - + - - - - - - + - - - - - - + - - - - - - + - - - - - - + - - - - - - + I I 1 1 1 1 1 1 I 1 1 I I I 14 . 3 1 14 . 3 1 14 . 3 1 1 14 . 3 1 I 1 I 2 . 9 1 s . 6 I 12 . s I 1 1 . 1 1 1 + - - - - - - + - - - - - - + - - - - - - + - - - - - - + - - - - - - + - - - - - - + - - - - - - + I I 1 1 I I 1 1 I I I 2 s . o 1 I I 2 s . o 1 I I I 2 . 9 1 I I I 7 . 1 1 I
+ - - - - - - + - - - - - - +- - - - - - + - - - - - - + - - - - - - + - - - - - - + - - - - - - + I 3 1 2 1 1 1 1 1 4 1 I I 1 2 3 . 1 1 1s . 4 1 7 . 7 1 7 . 7 1 3 o . s l 1 I I 8 . 8 I s . 9 1 s . 6 1 12 . S i 14 . 8 I I I
+ - - - - - - + - - - - - - + - - - - - - + - - - - - - + - - - - - - + - - - - - - + - - - - - - + I 1 1 3 1 1 1 1 1 2 1 I 1 1 I s . 3 1 2 s . o 1 s . 3 1 s . 3 1 16 . 7 1 I s . 3 1 I 2 . 9 1 s . 8 1 s . 6 1 12 . s 1 7 . 4 1 I 9 . 1 1
+ - - - - - - + - - - - - - + - - - - - - + - - - - - - + - - - - - - + - - - - - - + - - - - - - + I 3 1 7 1 3 1 1 1 I 4 1 I 1 16 . 7 1 3 8 . 9 1 16 . 7 1 s . 6 l I 22 . 2 1 I 1 s . s : 2 o . 6 1 16 . 7 1 12 . s 1 I 2 s . 6 1 I + - - - - - - + - - - - - - + - - - - - - + - - - - - - + - - - - - - + - - - - - - + - - - - - - +
I I I
Social Status Correspondence
7 3 . 6
4 2 . 1
13 6 . 7
12 6 . 2
1 8 9 . 3
I �w I 7 1 S I 9 1 10 I 12 1 13 I 14 I Total
GROUP - - - - - - - - + - - - - - - + - - - - - - + - - - - - - + - - - - - - + - - - - - - + - - - - - - + - - - - - - + 1 I 2 1 I 2 1 4 1 1 1 I 1 1
Sciences
Computer Science
Accountancy
Business Studies
Horticulture
2
3
4
s
(Table 6 .33 continued)
I 6 . s I I 6 . s I 12 . 9 I 3 . 2 I I 3 . 2 I I 2 0 . 0 1 I 16 . 7 1 3 6 . 4 1 2 S . O I I S O . O I
+ - - - - - - + - - - - - - + - - - - - - + - - - - - - + - - - - - - + - - - - - - + - - - - - - + I 2 1 1 1 1 1 1 1 3 1 I 1 1 1 10 . o I s . o I s . o I s . o I 1s . o I I s . o I I 2 0 . 0 1 S O . O I 8 . 3 1 9 . 1 1 7S . O I I S O . O I + - - - - - - + - - - - - - + - - - - - - + - - - - - - + - - - - - - + - - - - - - + - - - - - - + I 1 1 I I 1 1 I I I I 3 . 2 1 I I 3 . 2 1 I I I I 10 . o I I I 9 . 1 1 I I I + - - - - - - + - - - - - - + - - - - - - + - - - - - - + - - - - - - + - - - - - - + - - - - - - + I I I I I I I I I I I I I I I I I I I I I I I I I I I I I I I I I I I I I I I I I I I I I I I I + - - - - - - + - - - - - - + - - - - - - + - - - - - - + - - - - - - + - - - - - - + - - - - - - + I 3 1 I 4 1 S I I 1 1 I 1 6 . 3 1 1 8 . 3 1 10 . 4 1 1 2 . 1 1 I I 3 o . o l I 3 3 . 3 1 4 s . s l I 3 3 . 3 1 I
+ - - - - - - + - - - - - - + - - - - - - + - - - - - - + - - - - - - + - - - - - - + - - - - - - +
3 1 1 6 . 1
2 0 1 0 . 4
3 1 1 6 . 1
9 4 . 7
4 8 2 4 . 9
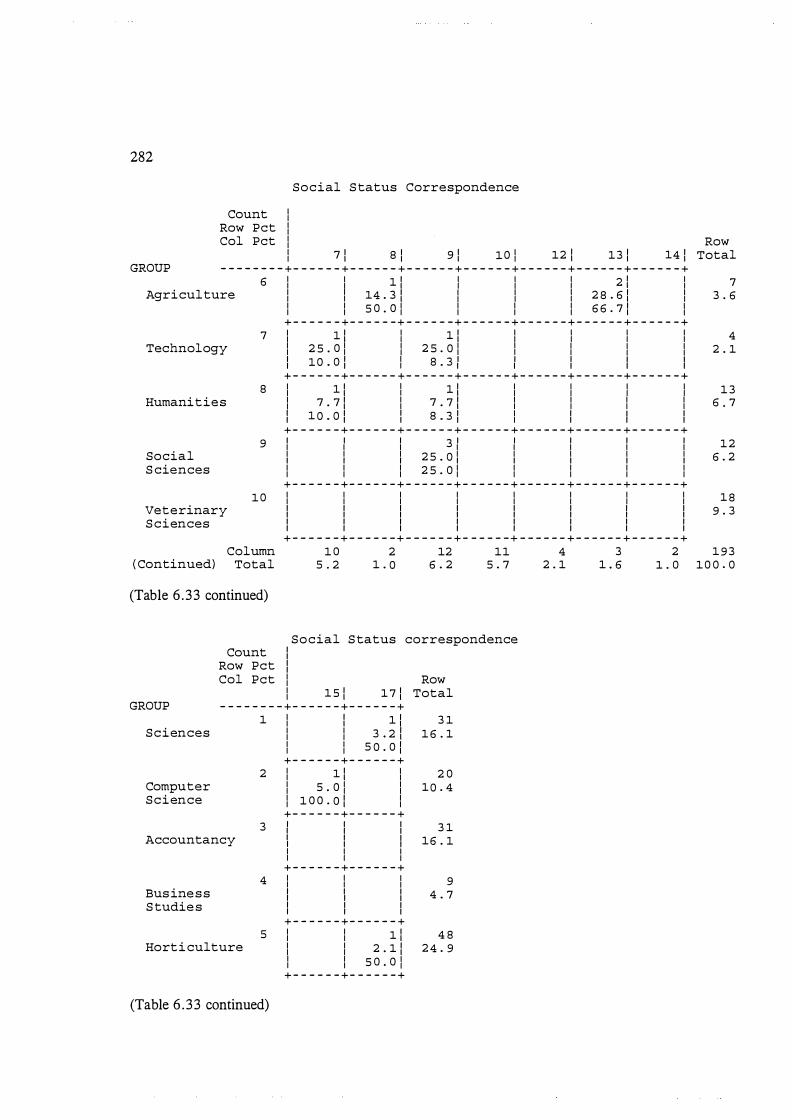
282
I I
Social Status Correspondence
Count Row Pet Col Pet I Row
I 7 1 8 1 9 1 10 I 12 1 13 1 14 1 Total GROUP - - - - - - - - + - - - - - - + - - - - - - + - - - - - - + - - - - - - + - - - - - - + - - - - - - + - - - - - - +
Agriculture
Technology
Humanities
Social S ciences
Veterinary Sciences
6 I I 1 1 I I I 2 1 I I I 14 . 3 1 I I I 2 8 . 6 1 I I I 5 o . o I I I I 6 6 . 7 1 I
+ - - - - - - + - - - - - - + - - - - - - + - - - - - - + - - - - - - + - - - - - - + - - - - - - + 7 I 1 1 I 1 1 I I I I
8
I 2 5 . o I I 2 5 . o I I I I I I 10 0 I I 8 3 I I I I I I • I • I I I I I + - - - - - - + - - - - - - + - - - - - - + - - - - - - + - - - - - - + - - - - - - + - - - - - - + I 1 1 I 1 1 I I I I I 7 . 7 1 I 7 . 7 1 I I I I I 1 0 0 I I 8 3 I I I I I I • I I • I I I I
+ - - - - - - + - - - - - - + - - - - - - + - - - - - - + - - - - - - + - - - - - - + - - - - - - + 9 I I I 3 I I I I I
I I I I I I I I I I I 2 5 · 0 I I I I I I I I 2 5 . o I I I I I
+ - - - - - - + - - - - - - + - - - - - - + - - - - - - + - - - - - - + - - - - - - + - - - - - - + 10 I I I I I I I I I I I I I I I I I I I I I I I I I I I I I I I I I I I I I I I I
+ - - - - - - + - - - - - - + - - - - - - + - - - - - - + - - - - - - + - - - - - - + - - - - - - +
7 3 . 6
4 2 . 1
1 3 6 . 7
12 6 . 2
1 8 9 . 3
Column Total
1 0 2 12 11 4 3 2 193 ( Continued) 5 . 2 1 . 0 6 . 2 5 . 7 2 . 1 1 . 6 1 . 0 10 0 . 0
(Table 6 .33 continued)
GROUP
Sciences
Computer Science
Count Row Pet Col Pet
Social Status correspondence I I I I I Row I 1 5 1 1 7 1 Total
- - - - - - - - + - - - - - - + - - - - - - + 1 I 1 1 1 3 1
I I 3 . 2 1 1 6 . 1 I I 5 0 . 0 1 + - - - - - - + - - - - - - +
2 I 1 1 I
3
I 5 . o I I I 1 o o . o 1 I + - - - - - - + - - - - - - + I I I I I I
2 0 10 . 4
Accountancy I I I I I I 3 1
16 . 1
Business Studies
Horticulture
I I I + - - - - - - + - - - - - - +
4 I I I I I I I I I I I I I I I + - - - - - - + - - - - - - +
9 4 . 7
5 I I 1 1 4 8 I I 2 . 1 1 24 . 9 I I 5 o . o I
+ - - - - - - + - - - - - - +
(Table 6 . 33 continued)
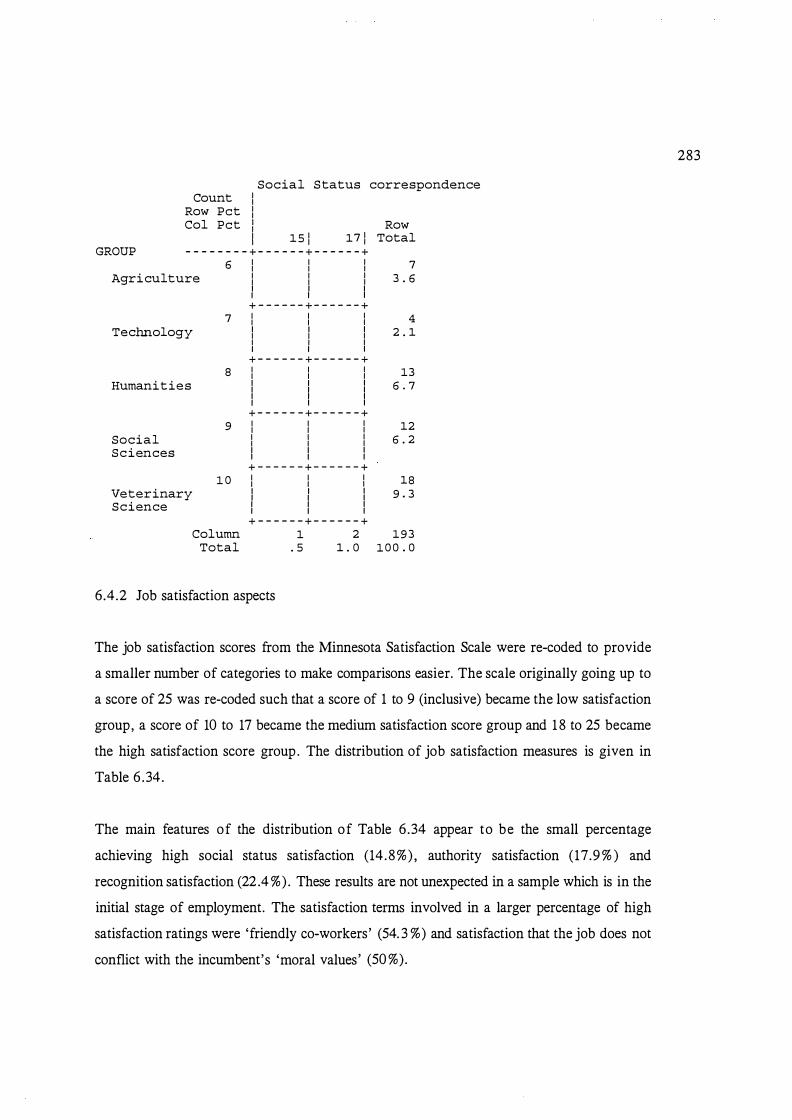
GROUP
Count Row Pet Col Pet
I I Social Status correspondence
1 Row I 15 1 17 1 Total - - - - - - - - + - - - - - - + - - - - - - +
6 I I I Agriculture I I I
7 3 . 6 I I I I I I
+ - - - - - - + - - - - - - + 7 I I I
Technology I I I I I I 4
2 . 1
Humanities
Social Sciences
Veterinary Science
I I I + - - - - - - + - - - - - - +
8 I I I I I I I I I I I I I I I + - - - - - - + - - - - - - +
9 I I I I I I I I I I I I
+ - - - - - - + - - - - - - + 1 0 I I I I I I I I I I I I I I I
+ - - - - - - + - - - - - - +
13 6 . 7
12 6 . 2
18 9 . 3
Column Total
1 2 1 9 3 . 5 1 . 0 1 0 0 . 0
6.4.2 Job satisfaction aspects
The job satisfaction scores from the Minnesota Satisfaction Scale were re-coded to provide
a smaller number of categories to make comparisons easier. The scale originally going up to
a score of 25 was re-coded such that a score of 1 to 9 (inclusive) became the low satisfaction
group, a score of 10 to 17 became the medium satisfaction score group and 1 8 to 25 became
the high satisfaction score group . The distribution of job satisfaction measures is given in
Table 6 .34.
The main features of the distribution of Table 6 .34 appear to be the small percentage
achieving high social status satisfaction ( 14.8%) , authority satisfaction ( 17.9 % ) and
recognition satisfaction (22 .4 %) . These results are not unexpected in a sample which is in the
initial stage of employment. The satisfaction terms involved in a larger percentage of high
satisfaction ratings were 'friendly eo-workers ' (54. 3 %) and satisfaction that the job does not
conflict with the incumbent's 'moral values ' (50 %).
283

284
Table 6 . 34 Percentage Distribution of Satisfaction (Low, Medium, or High) in Each of
the Work Needs
Satisfaction Low Medium High N
Ability utilisation 1 3 .6 55. 6 30.9 162 Achievement 8 .0 56.2 35 .8 162 Activity 6 .2 54.9 38 .9 162 Advancement 1 3 . 6 59.9 26.5 162 Authority 1 1 . 1 7 1 . 0 17.9 162 Policies & practices 14 .3 62.7 23 .0 161 Compensation 14 .8 59.9 25.3 162 eo-workers 5 . 6 40. 1 54.3 162 Creativity 14.2 57.4 28.4 162 Independence 3 .7 53 .7 42.6 162 Moral values 3 .7 46.3 50.0 162 Recognition 12.4 65 .2 22.4 161 Responsibility 8 .6 55. 6 35 .8 162 Security 8 .0 48 .8 43.2 162 Social service 9 .3 63 .0 27.8 162 Social status 1 1 . 1 74. 1 14.8 162 Supervision (human) 9 .3 45 .3 45.3 161 Supervision (technical) 5 . 0 52.2 42.9 161 Variety 12 .3 57.4 30.2 162 Working conditions 1 1 .7 50.6 37.7 162
6 .4 .3 Tenure related measures
The tenure related measures were expected tenure (years expect to remain in the job) and job
attachment. The latter variable was part of the expanded model of the present research but
will be included for discussion here also because it was a measure related to the construct of
tenure. There were no significant differences among the groups in the tenure related
measures . Their respective distributions are reported in Table 6.35 for job attachment and
Table 6 . 36 for expected tenure .
Job attachment
There were no significant differences among the academic groups in the distribution of scores
on the seven point scale of degree of job attachment (as in Table 6 .35) .
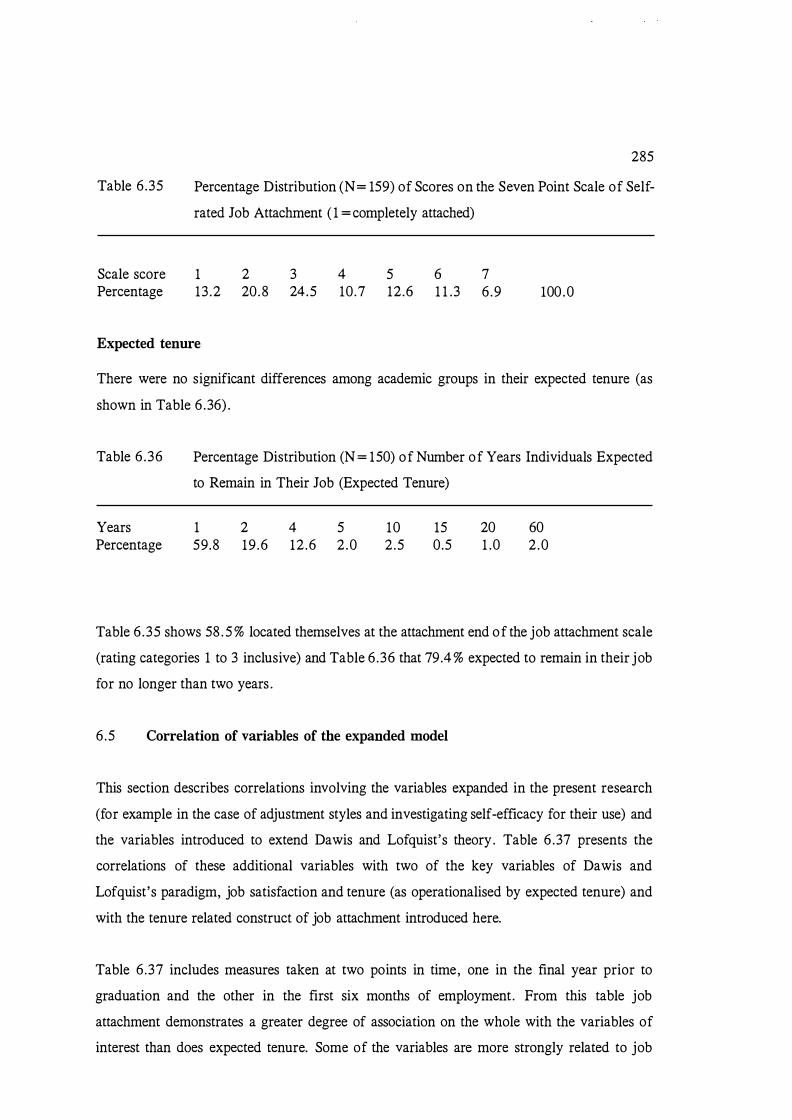
Table 6 .35
Scale score Percentage
285
Percentage Distribution (N = 159) of Scores on the Seven Point Scale of Self
rated Job Attachment ( 1 = completely attached)
1 2 13 .2 20.8
3 24.5
4 10.7
5 12 .6
6 1 1 .3
7 6 .9 100 .0
Expected tenure
There were no significant differences among academic groups in their expected tenure (as
shown in Table 6 .36) .
Table 6 .36 Percentage Distribution (N = 150) of Number of Years Individuals Expected
to Remain in Their Job (Expected Tenure)
Years Percentage
1 59.8
2 19 .6
4 12 .6
5 2 .0
10 2 .5
15 0.5
20 1 .0
60 2 .0
Table 6 .35 shows 58 . 5 % located themselves at the attachment end of the job attachment scale
(rating categories 1 to 3 inclusive) and Table 6 .36 that 79.4 % expected to remain in their job
for no longer than two years .
6 .5 Correlation of variables of the expanded model
This section describes correlations involving the variables expanded in the present research
(for example in the case of adjustment styles and investigating self-efficacy for their use) and
the variables introduced to extend Dawis and Lofquist's theory. Table 6 .37 presents the
correlations of these additional variables with two of the key variables of Dawis and
Lofquist's paradigm, job satisfaction and tenure (as operationalised by expected tenure) and
with the tenure related construct of job attachment introduced here.
Table 6.37 includes measures taken at two points in time, one in the final year prior to
graduation and the other in the first six months of employment. From this table job
attachment demonstrates a greater degree of association on the whole with the variables of
interest than does expected tenure. Some of the variables are more strongly related to job
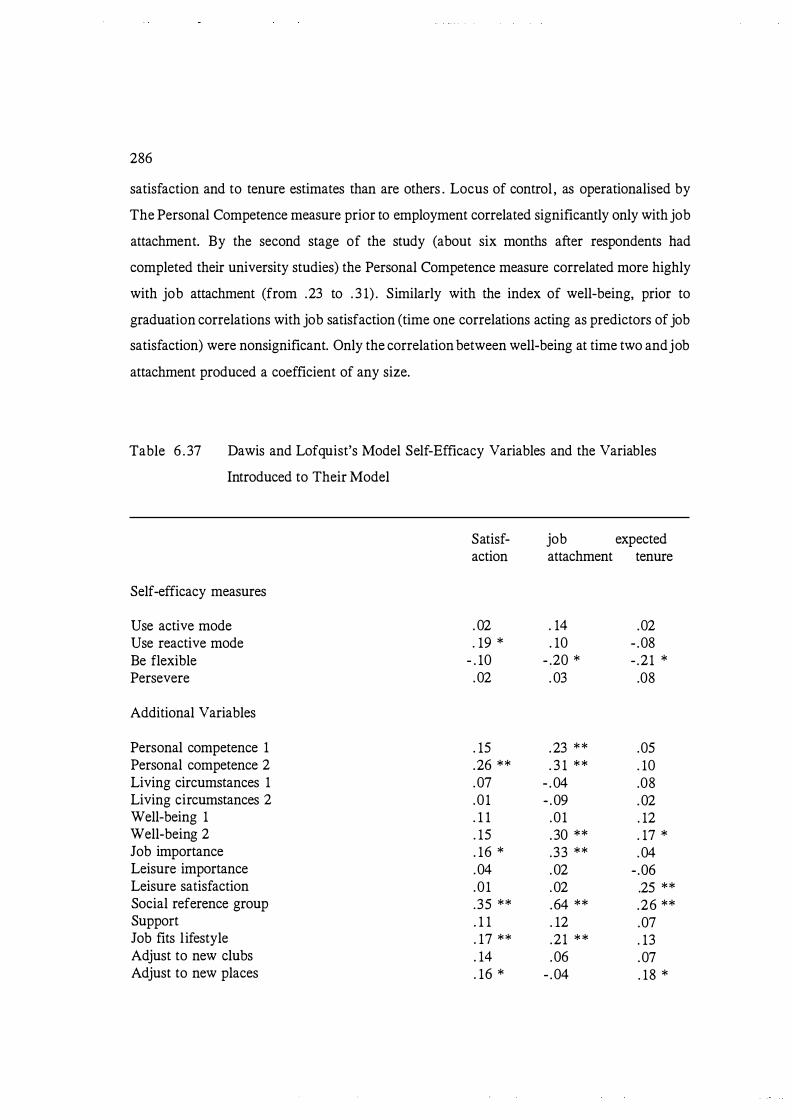
286
satisfaction and to tenure estimates than are others . Locus of control , as operationalised by
The Personal Competence measure prior to employment correlated significantly only with job
attachment. By the second stage of the study (about six months after respondents had
completed their university studies) the Personal Competence measure correlated more highly
with job attachment (from .23 to . 3 1) . Similarly with the index of well-being, prior to
graduation correlations with job satisfaction (time one correlations acting as predictors of job
satisfaction) were nonsignificant. Only the correlation between well-being at time two and job
attachment produced a coefficient of any size.
Table 6 . 37 Dawis and Lofquist's Model Self-Efficacy Variables and the Variables
Introduced to Their Model
Satisf- job expected action attachment tenure
Self-efficacy measures
Use active mode . 02 . 14 .02 Use reactive mode . 19 * . 10 - .08 Be flexible - . 10 - .20 * - .21 * Persevere .02 . 03 .08
Additional Variables
Personal competence 1 . 15 .23 ** .05 Personal competence 2 .26 ** . 3 1 ** . 10 Living circumstances 1 . 07 - . 04 .08 Living circumstances 2 .01 - .09 .02 Well-being 1 . 1 1 .01 . 12 Well-being 2 . 15 . 30 ** . 17 * Job importance . 16 * . 33 ** . 04 Leisure importance .04 .02 - .06 Leisure satisfaction .01 . 02 .25 ** Social reference group .35 ** . 64 ** .26 ** Support . 1 1 . 12 .07 Job fits l ifestyle . 17 ** .21 ** . 13 Adjust to new clubs . 14 .06 .07 Adjust to new places . 16 * - .04 . 18 *
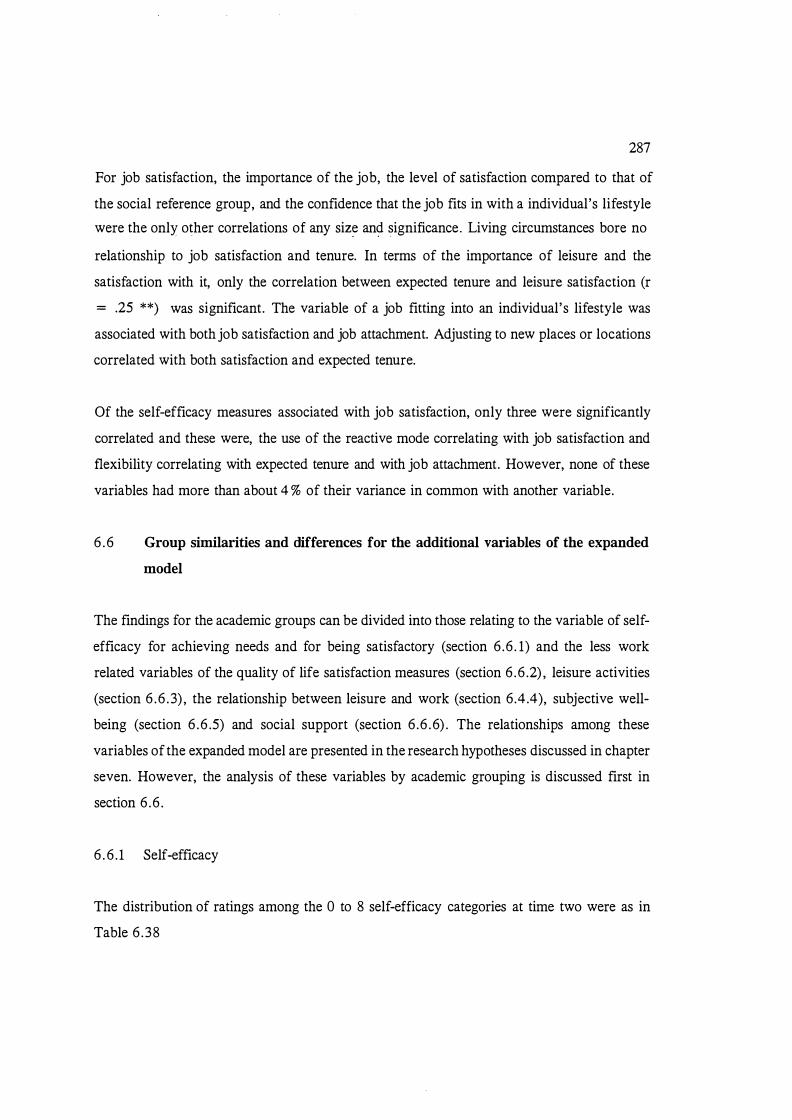
287
For job satisfaction, the importance of the job, the level of satisfaction compared to that of
the social reference group, and the confidence that the job fits in with a individual's lifestyle
were the only other correlations of any size and significance. Living circumstances bore no
relationship to job satisfaction and tenure. In terms of the importance of leisure and the
satisfaction with it, only the correlation between expected tenure and leisure satisfaction (r
= .25 **) was significant. The variable of a job fitting into an individual's lifestyle was
associated with both job satisfaction and job attachment. Adjusting to new places or locations
correlated with both satisfaction and expected tenure.
Of the self-efficacy measures associated with job satisfaction, only three were significantly
correlated and these were, the use of the reactive mode correlating with job satisfaction and
flexibility correlating with expected tenure and with job attachment. However, none of these
variables had more than about 4 % of their variance in common with another variable.
6 . 6 Group similarities and differences for the additional variables of the expanded
model
The findings for the academic groups can be divided into those relating to the variable of self
efficacy for achieving needs and for being satisfactory (section 6.6 . 1) and the less work
related variables of the quality of life satisfaction measures (section 6 .6 .2) , leisure activities
(section 6 .6 .3) , the relationship between leisure and work (section 6.4.4), subjective well
being (section 6 .6 .5) and social support (section 6.6 .6) . The relationships among these
variables of the expanded model are presented in the research hypotheses discussed in chapter
seven. However, the analysis of these variables by academic grouping is discussed first in
section 6 .6 .
6 . 6 . 1 Self-efficacy
The distribution of ratings among the 0 to 8 self-efficacy categories at time two were as in
Table 6 .38

288
Table 6 .38 Distribution of Ratings of Self-efficacy (0 = no confidence and 8 = complete
confidence) Post Graduation (Time Two of the Study) in Percentages
Ratings
Median 0 1 2 3 4 5 6 7 8
Ability use 6 3 .7 2 .5 8 . 1 8 .7 9.9 7 .5 26. 1 23 .0 10 .6 Achievement 6 3 . 8 1 .3 3 . 8 5 . 0 10 .6 12 .5 20.0 25 .6 17 .5 Authority 6 3 . 1 1 .9 2 .5 6 .2 6 .2 1 1 .8 28.0 23 .0 17 .4 Autonomy 7 0.6 1 .2 0 .6 1 .9 5 .0 1 1 . 8 19 .9 32. 3 26.7 Active mode 5 2.5 5 . 6 4 . 3 8 . 1 16 . 1 17 .4 19 .9 14 .9 1 1 .2 Activity 5 2 .5 1 .2 1 .2 1 .9 5 .0 8 . 1 16 . 1 25. 5 38 .5 Follow rules 7 0 .6 0 .0 1 .9 0 .6 5 . 6 3 . 8 20.0 3 1 .3 36 .3 Pay 7 3 .7 4 .3 4 .3 3 .7 1 1 . 8 14.9 19 .3 19 .9 18 .0 Reactive mode 5 4.4 5 . 6 4.4 6 .9 13 .8 16 .3 26.3 14. 1 08. 1 Repetition 7 0 .6 0 .0 4.4 5 .0 8 . 1 10 .6 1 8 . 1 25.0 28. 1 Promotability 8 3 . 8 1 . 3 1 .9 3 . 1 6 .9 8.2 16 .4 23 .3 35 .2 Security 6 3 . 1 1 . 9 2 .5 2 .5 8 .7 6 .2 1 1 . 8 26. 1 37. 3 Flexibility 4 1 .9 4 .3 5 .0 1 1 . 8 15 .5 14 .3 23 .6 13 .0 10 .6 Independence 8 0 .0 0 .6 1 .2 1 .2 1 .2 1 .9 10 .6 25 .5 57. 8 Absenteeism 7 0 .6 0 .6 0 .6 0 .6 1 .9 0 .0 13 .0 19 .3 63 .4 Procedures 8 1 .3 0 .0 0 .0 0 .6 2 .5 8 . 1 20.0 36 .9 30 .6 Teamwork 7 0 .6 0 .6 0 .6 1 .2 3 .7 5 .6 18 .0 28 .6 4 1 .0 Supervision
(technical) 6 1 .2 0 .6 0 .6 0 .6 3 . 1 5 .6 16 .8 3 1 . 1 40.4 Creativity 7 1 .2 0 .6 1 .2 4 .3 5 .6 10 .6 23 .6 29.2 23 .6 Lifestyle fits
job 6 1 .2 2 .5 2 .5 4 .3 9 .3 1 1 .2 19 .9 21 .7 27 .3 Adjust to
organisation 7 0 .6 0 .6 2 .5 7 .5 7 .5 13 .0 27 .3 25 . 5 1 5 . 5 Adjust to new
location 7 0 .6 1 .9 8 . 1 9 .4 1 1 . 9 1 3 . 1 24.4 13 .8 16 .9 Perseverance 5 2 .5 1 .2 3 . 1 3 . 1 1 1 .2 1 3 .7 26. 1 28 .6 10 .6 Recognition 6 3 . 1 0 .6 2 .5 3 . 8 13 . 1 15 .6 27 .5 21 .9 1 1 .9 Make work
friends 7 0 .6 0 .6 1 .9 3 . 1 3 . 8 5 . 6 13 . 1 36 .3 35 .0 Supervision
(human) 7 5 .0 2 .5 5 .0 8 .7 1 1 .2 8 .7 19 .9 14 .9 24.2 Variety 5 1 .3 1 .3 2 .5 5 . 0 3 . 1 8 . 1 20.6 26 .3 3 1 .9 Performance 7 0 .0 0 .0 0 .6 0 .0 3 . 1 5 .0 23 .6 32 .3 35 .4
The median self-efficacy ranged from 4 to 8 with the modal categories tending to be 6,7, or
8 (see Appendix M also) . Overall the needs where self-efficacy was lower were ability
utilisation, use of active and reactive adjustment styles and flexibility and perseverance.
N
161 160 161 161 161 161 160 161 160 160 159 161 161 161 161 160 161
161 161
161
161
160 161
160
161 160 161
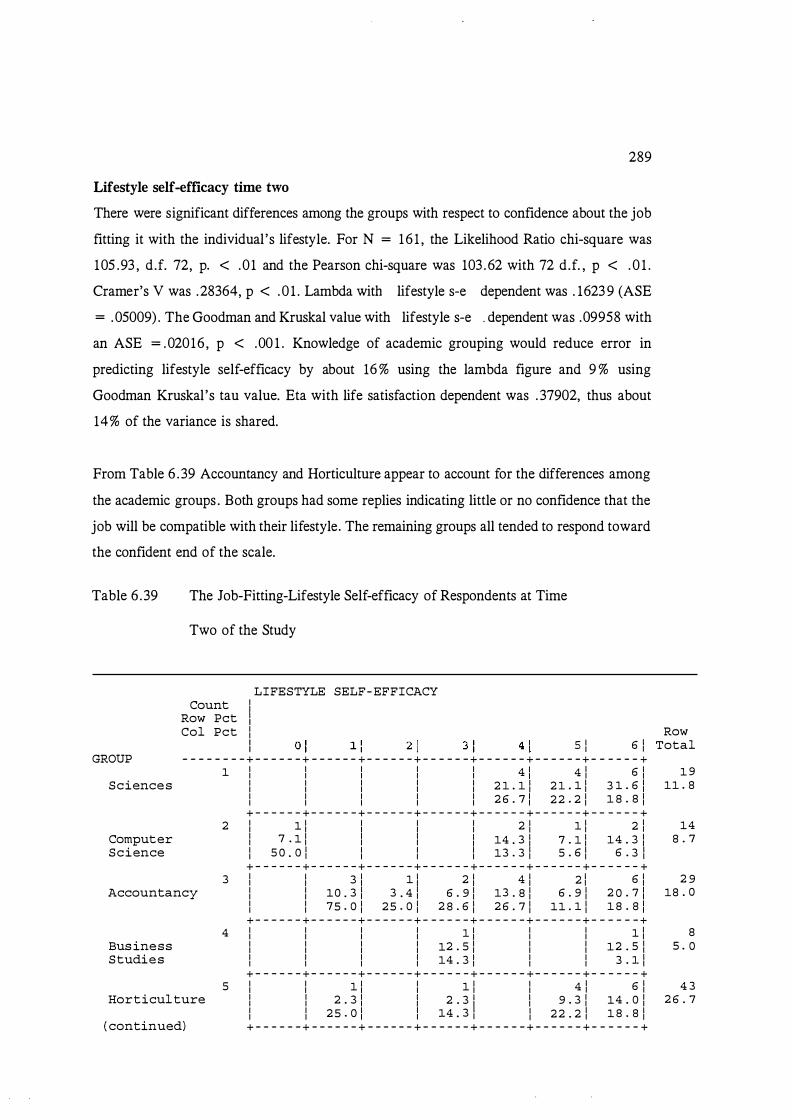
289
Lifestyle self-efficacy time two
There were significant differences among the groups with respect to confidence about the job
fitting it with the individual 's lifestyle. For N = 16 1 , the Likelihood Ratio chi-square was
105 .93 , d.f. 72, p. < .01 and the Pearson chi-square was 103 .62 with 72 d.f. , p < . 0 1 .
Cramer's V was .28364, p < . 0 1 . Lambda with lifestyle s-e dependent was . 1623 9 (ASE
= . 05009) . The Goodman and Kruskal value with lifestyle s-e . dependent was .09958 with
an ASE = . 02016 , p < .00 1 . Knowledge of academic grouping would reduce error in
predicting lifestyle self-efficacy by about 16 % using the lambda figure and 9 % using
Goodman Kruskal 's tau value. Eta with life satisfaction dependent was . 37902, thus about
14% of the variance is shared.
From Table 6 . 39 Accountancy and Horticulture appear to account for the differences among
the academic groups . Both groups had some replies indicating little or no confidence that the
job will be compatible with their lifestyle. The remaining groups all tended to respond toward
the confident end of the scale.
Table 6 .39 The Job-Fitting-Lifestyle Self-efficacy of Respondents at Time
Two of the Study
LIFESTYLE SELF-EFFICACY I I Count Row Pet Col Pet I I I S I
Row 6 1 Total
GROUP - - - - - - - - + - - - - - - + - - - - - - + - - - - - - + - - - - - - + - - - - - - + - - - - - - + - - - - - - +
Sciences
Computer Science
Accountancy
Business Studies
Horticulture
( continued)
1. I I I I I 4 1 4 1 6 1 I I I I I 2 1. . 1. 1 21. . 1. 1 3 1. . 6 1 I I I I I 2 6 . 7 1 22 . 2 1 1. 8 . 8 1
+ - - - - - - + - - - - - - + - - - - - - + - - - - - - + - - - - - - + - - - - - - + - - - - - - + 2 I 1. 1 I I I 2 1 1. 1 2 1
1 7 . 1. 1 1 1 1 1.4 . 3 1 7 . 1. 1 1.4 . 3 I I s o . o 1 I I I 1.3 . 3 1 s . 6 1 6 . 3 1 + - - - - - - + - - - - - - + - - - - - - + - - - - - - + - - - - - - + - - - - - - + - - - - - - +
3 1 1 3 1 1. 1 2 1 4 1 2 1 6 1 I I 1.o . 3 1 3 . 4 1 6 . 9 1 1.3 . 8 1 6 . 9 1 2 0 . 7 1 I I 75 . 0 1 25 . 0 1 2 8 . 6 1 2 6 . 7 1 1.1. . 1. 1 1. 8 . 8 1 + - - - - - - + - - - - - - + - - - - - - + - - - - - - + - - - - - - + - - - - - - + - - - - - - +
4 I I I I 1. 1 I I 1. 1 I I I I 1.2 . s I I I 1.2 . s I I I I I 1.4 . 3 I I I 3 . 1. 1
+ - - - - - - + - - - - - - + - - - - - - + - - - - - - + - - - - - - + - - - - - - + - - - - - - + s I I 1. 1 I 1. 1 I 4 1 6 1
I I 2 . 3 I 1 2 . 3 1 1 9 . 3 I 1.4 . o I I I 25 . 0 1 I 1.4 . 3 1 I 22 . 2 1 1. 8 . 8 1 + - - - - - - + - - - - - - + - - - - - - + - - - - - - + - - - - - - + - - - - - - + - - - - - - +
1. 9 1.1. . 8
1.4 8 . 7
2 9 1.8 . 0
8 5 . 0
4 3 2 6 . 7
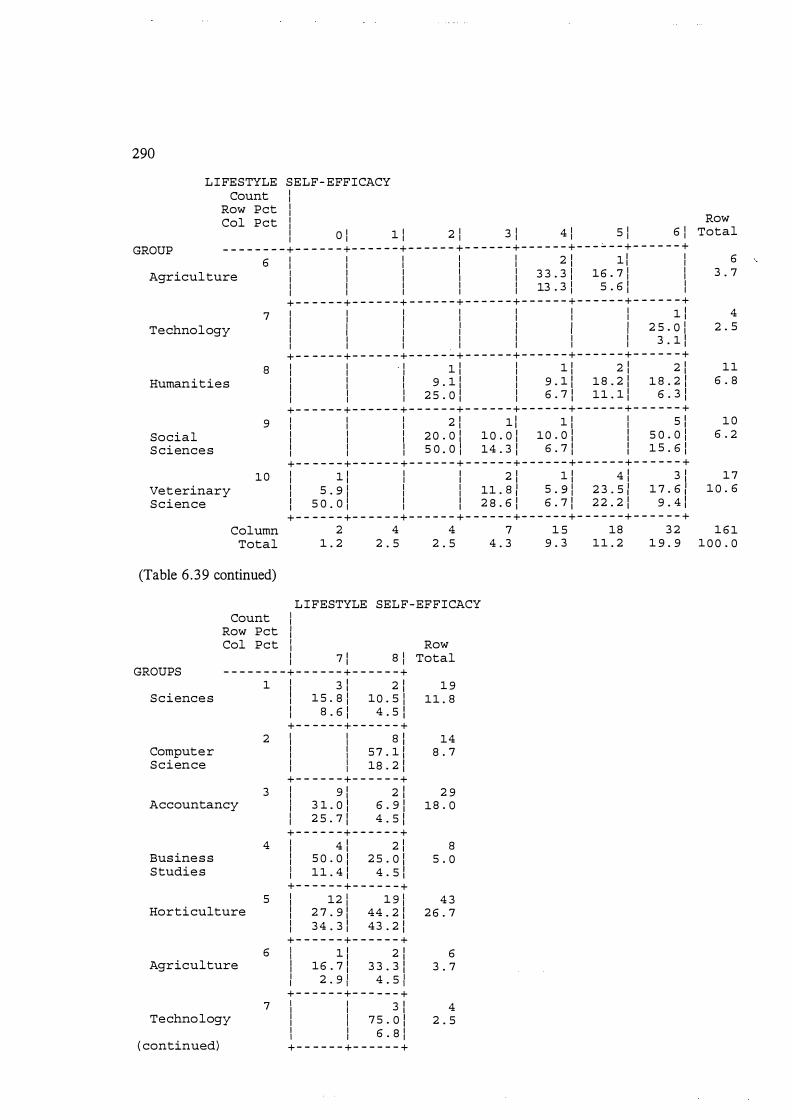
290
LIFESTYLE SELF- EFFICACY Count
Row Pet Col Pet
I I I Row I 0 I 1 I 2 I 3 I 4 I 5 I 6 I Total
GROUP - - - - - - - - + - - - - - - + - - - - - - + - - - - - - + - - - - - - + - - - - - - + - - - - - - + - - - - - - + 6 I I I I I 2 1 1 1 I
1 1 I I I 3 3 3 I 16 7 I I 6
3 . 7 Agriculture I I I I I . I • I I
I I I I I 13 . 3 I 5 . 6 1 I + - - - - - - + - - - - - - + - - - - - - + - - - - - - + - - - - - - + - - - - - - + - - - - - - +
7 I I I I I I I 1 1 I I I I I I I 2 5 0 I
4 2 . 5 Technology
Humanities
Social Sciences
s
9
I I I I I I I •
I I I I I I I 3 . 1 1 + - - - - - - + - - - - - - + - - - - - - + - - - - - - + - - - - - - + - - - - - - + - - - - - - + I I · I 1 1 I 1 1 2 1 2 1 I I I 9 . 1 1 I 9 . 1 1 1 s . 2 1 1 s . 2 1 I I I 2 5 . 0 1 I 6 . 7 1 11 . 1 1 6 . 3 1
+ - - - - - - + - - - - - - + - - - - - - + - - - - - - + - - - - - - + - - - - - - + - - - - - - + I I I 2 1 1 1 1 1 I s i I I I 2 0 . 0 1 1 0 . 0 1 10 . 0 1 1 s o . o 1 I I I s o . o 1 14 . 3 1 6 . 7 1 1 1 s . 6 1 + - - - - - - + - - - - - - + - - - - - - + - - - - - - + - - - - - - + - - - - - - + - - - - - - +
11 6 . S
1 0 6 . 2
10 I 1 1 I 1 2 1 1 1 4 1 3 1 1 7 I s . 9 1 I I 11 . s 1 s . 9 1 2 3 . 5 1 1 7 . 6 1 1 0 . 6 Veterinary
Science
Column Total
(Table 6 .39 continued)
Count Row Pet Col Pet
1 s o . o 1 I 1 2 S . 6 1 6 . 7 1 2 2 . 2 1 9 . 4 1 + - - - - - - + - - - - - - + - - - - - - + - - - - - - + - - - - - - + - - - - - - + - - - - - - +
2 4 4 7 1 5 1S 3 2 1 61 1 . 2 2 . 5 2 . 5 4 . 3 9 . 3 11 . 2 1 9 . 9 1 0 0 . 0
LIFESTYLE SELF-EFFICACY I I I 1 Row I 7 1 S I Total
GROUPS - - - - - - - - + - - - - - - + - - - - - - +
Sciences
Computer Science
Accountancy
Business Studies
Horticulture
Agriculture
Technology
( continued)
1 I 3 1 2 1 1 9
2
3
4
5
6
7
I 1 5 . S I 10 . S I 11 . s I s . 6 1 4 . s i + - - - - - - + - - - - - - + I I s i I I I I 5 7 . 1 1 I I I I 1S . 2 1 I I + - - - - - - + - - - - - - + I 9 1 2 1 I I 3 1 . o 1 6 . 9 1 I I 2 5 . 7 1 4 . 5 1 I
+ - - - - - - + - - - - - - + I 4 1 2 1 I I 5 0 . 0 1 2 5 . 0 1 I I 11 . 4 1 4 . 5 1 I + - - - - - - + - - - - - - + I 12 1 1 9 1 I I 2 7 . 9 1 44 . 2 1 I I 3 4 . 3 1 43 . 2 1 I + - - - - - - + - - - - - - + I 1 1 2 1 I I 16 . 7 1 3 3 . 3 1 I I 2 . 9 1 4 . 5 1 I
+ - - - - - - + - - - - - - + I I 3 1 I I I I 7 5 . 0 1 I I I I 6 . S I I I + - - - - - - + - - - - - - +
14 S . 7
2 9 1S . O
s 5 . 0
4 3 2 6 . 7
6 3 . 7
4 2 . 5
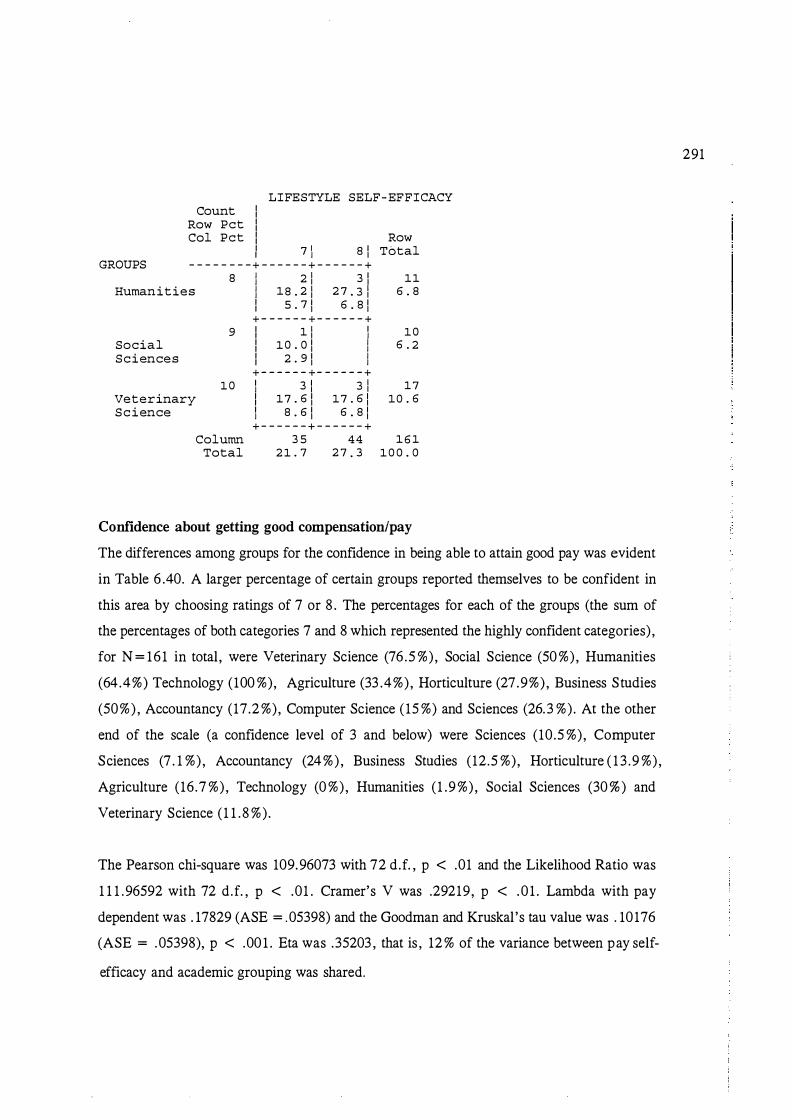
LIFESTYLE SELF-EFFICACY Count I I
Row Pet I I Col Pet I Row I I 7 1 s J Total I I
GROUPS - - - - - - - - + - - - - - - + - - - - - - + 8 I 2 1 3 J 11 I
Humanities I 18 . 2 1 2 7 . 3 1 6 . 8 I I 5 . 7 J 6 . 8 J I + - - - - - - + - - - - - - +
9 I 1 1 I 10 I I Social I 10 . 0 J I 6 . 2 I I Sciences I 2 . 9 J I I I
+ - - - - - - + - - - - - - + 10 I 3 J 3 1 17 I
Veterinary I 17 . 6 J 17 . 6 J 10 . 6 I Science I 8 . 6 J 6 . 8 J I
+ - - - - - - + - - - - - - + Column 3 5 4 4 1 6 1
Total 21 . 7 2 7 . 3 10 0 . 0
Confidence about getting good compensation/pay
The differences among groups for the confidence in being able to attain good pay was evident
in Table 6 .40. A larger percentage of certain groups reported themselves to be confident in
this area by choosing ratings of 7 or 8 . The percentages for each of the groups (the sum of
the percentages of both categories 7 and 8 which represented the highly confident categories) ,
for N = 161 in total , were Veterinary Science (76 .5 %) , Social Science (50 %) , Humanities
(64 .4%) Technology (100 %), Agriculture (33 .4%) , Horticulture (27 .9%) , Business Studies
(50%) , Accountancy ( 17.2 %), Computer Science ( 15 %) and Sciences (26. 3 %) . At the other
end of the scale (a confidence level of 3 and below) were Sciences (10 .5 %), Computer
Sciences (7 . 1 %) , Accountancy (24%) , Business Studies (12 .5 %), Horticulture ( 1 3 .9 %) ,
Agriculture (16 .7 %) , Technology (0 %) , Humanities ( 1 .9 %) , Social Sciences (30 % ) and
Veterinary Science (1 1 . 8 %) .
The Pearson chi-square was 109.96073 with 72 d.f. , p < .01 and the Likelihood Ratio was
1 1 1 .96592 with 72 d.f. , p < .01 . Cramer's V was .29219, p < . 0 1 . Lambda with pay
dependent was . 17829 (ASE = .05398) and the Goodman and Kruskal 's tau value was . 10176
(ASE = .05398), p < .00 1 . Eta was .35203 , that is , 12 % of the variance between pay self-
efficacy and academic grouping was shared.
291
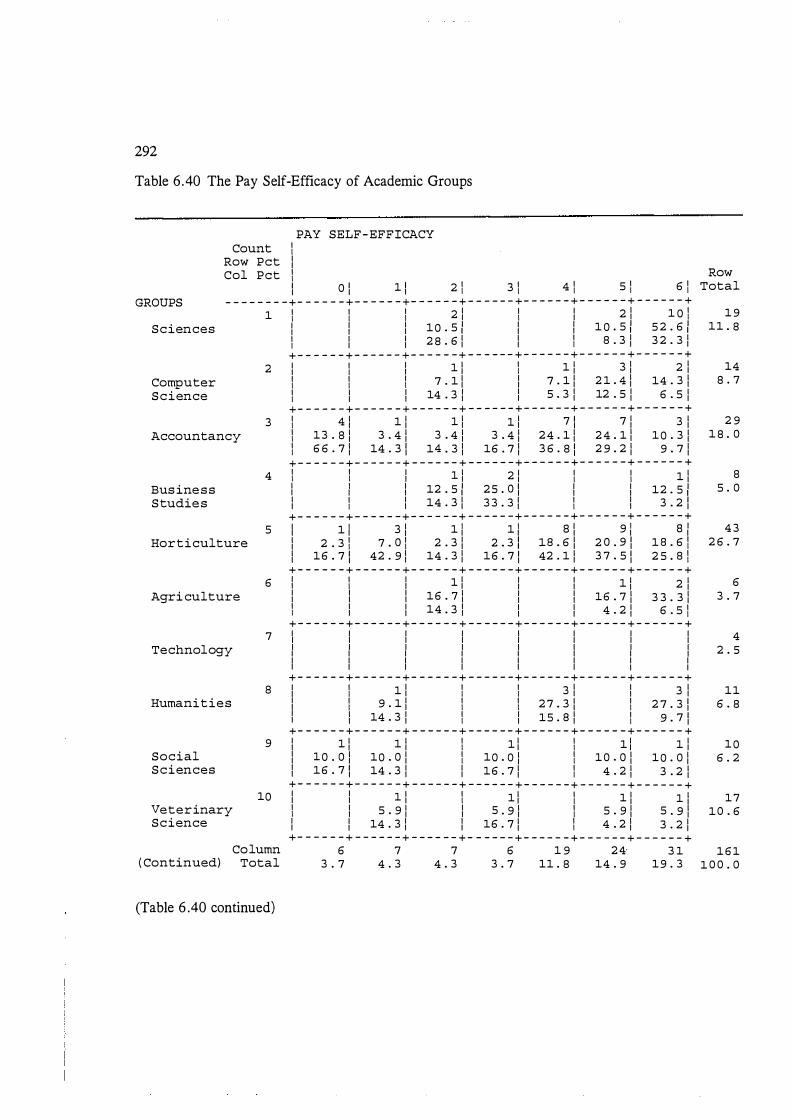
292
Table 6 .40 The Pay Self-Efficacy of Academic Groups
Count Row Pet Col Pet
l I I
PAY SELF-EFFICACY
l Row J 0 J 1 J 2 l 3 l 4 l 5 l 6 l Total
GROUPS - - - - - - - - + - - - - - - + - - - - - - + - - - - - - + - - - - - - + - - - - - - + - - - - - - + - - - - - - + 1
Sciences
2 Computer Science
3 Accountancy
4 Business Studies
5 Horticulture
6 Agri culture
7 Technology
8 Humanities
9 Social Sciences
10 Veterinary Science
Column ( Continued) Total
(Table 6 .40 continued)
l l l 2 1 l I 2 1 1 0 l I I I 10 . 5 1 I I 1 0 . 5 1 5 2 . 6 1 l 1 I 2 8 . 6 1 I l s . 3 1 3 2 . 3 1 + - - - - - - + - - - - - - + - - - - - - + - - - - - - + - - - - - - + - - - - - - + - - - - - - + I l I 1 1 l 1 1 3 1 2 1 l l l 7 . 1 1 I 7 . 1 1 2 1 . 4 1 14 . 3 1 l 1 I 14 . 3 I 1 5 . 3 I 12 . 5 I 6 . 5 1 + - - - - - - + - - - - - - + - - - - - - + - - - - - - + - - - - - - + - - - - - - + - - - - - - + l 4 1 1 1 1 1 1 1 7 J 7 1 3 1 l 13 . 8 1 3 . 4 1 3 . 4 1 3 . 4 1 24 . 1 1 24 . 1 1 10 . 3 1 l 6 6 . 7 1 14 . 3 J 14 . 3 1 16 . 7 1 3 6 . 8 J 2 9 . 2 1 9 . 7 1 + - - - - - - + - - - - - - + - - - - - - + - - - - - - + - - - - - - + - - - - - - + - - - - - - + l l I 1 1 2 1 l l 1 1 I l I 12 . 5 1 25 . o J I I 12 . 5 1 I l I 14 . 3 1 3 3 . 3 1 l I 3 . 2 J
+ - - - - - - + - - - - - - + - - - - - - + - - - - - - + - - - - - - + - - - - - - + - - - - - - + I 1 1 3 1 1 1 1 1 g l 9 1 g l I I I I I I I 1 2 . 3 l 7 . o l 2 . 3 I 2 . 3 1 1s . 6 1 2 o . 9 J 1 s . 6 l 1 16 . 7 J 42 . 9 1 14 . 3 1 16 . 7 J 42 . 1 1 3 7 . 5 J 2 5 . s l
+ - - - - - - + - - - - - - + - - - - - - + - - - - - - + - - - - - - + - - - - - - + - - - - - - + I l I 1 1 I I 1 1 2 1 I I I 16 . 7 1 I I 16 . 7 1 3 3 . 3 1 l I I 14 . 3 I I I 4 . 2 I 6 . 5 l + - - - - - - + - - - - - - + - - - - - - + - - - - - - + - - - - - - + - - - - - - + - - - - - - + I I I I I I I I I I I I I I I I I I I I I I I I I I I I I I I I I I I I I I I I I I I I I I I
+ - - - - - - + - - - - - - + - - - - - - + - - - - - - + - - - - - - + - - - - - - + - - - - - - + I l 1 1 l l 3 1 I 3 1 I l 9 . 1 1 l l 2 7 . 3 1 l 2 7 . 3 J I I 14 . 3 I l I 15 . S I l 9 . 7 J + - - - - - - + - - - - - - + - - - - - - + - - - - - - + - - - - - - + - - - - - - + - - - - - - + I 1 1 1 1 l 1 1 l 1 1 1 1 I 10 . 0 1 10 . 0 1 l 10 . 0 1 l 10 . 0 1 10 . 0 1 I 16 . 7 J 14 . 3 I 1 16 . 7 1 l 4 . 2 1 3 . 2 1
+ - - - - - - + - - - - - - + - - - - - - + - - - - - - + - - - - - - + - - - - - - + - - - - - - + I I 1 1 l 1 1 l 1 1 1 1 l I 5 . 9 1 I s . 9 1 l 5 . 9 1 s . 9 1 I I 14 . 3 I I 16 . 7 1 l 4 . 2 1 3 . 2 1 + - - - - - - + - - - - - - + - - - - - - + - - - - - - + - - - - - - + - - - - - - + - - - - - - +
6 7 7 6 1 9 2� 3 1 3 . 7 4 . 3 4 . 3 3 . 7 11 . 8 14 . 9 19 . 3
1 9 11 . 8
14 8 . 7
2 9 1 8 . 0
8 5 . 0
4 3 2 6 . 7
6 3 . 7
4 2 . 5
11 6 . 8
10 6 . 2
17 10 . 6
161 1 0 0 . 0
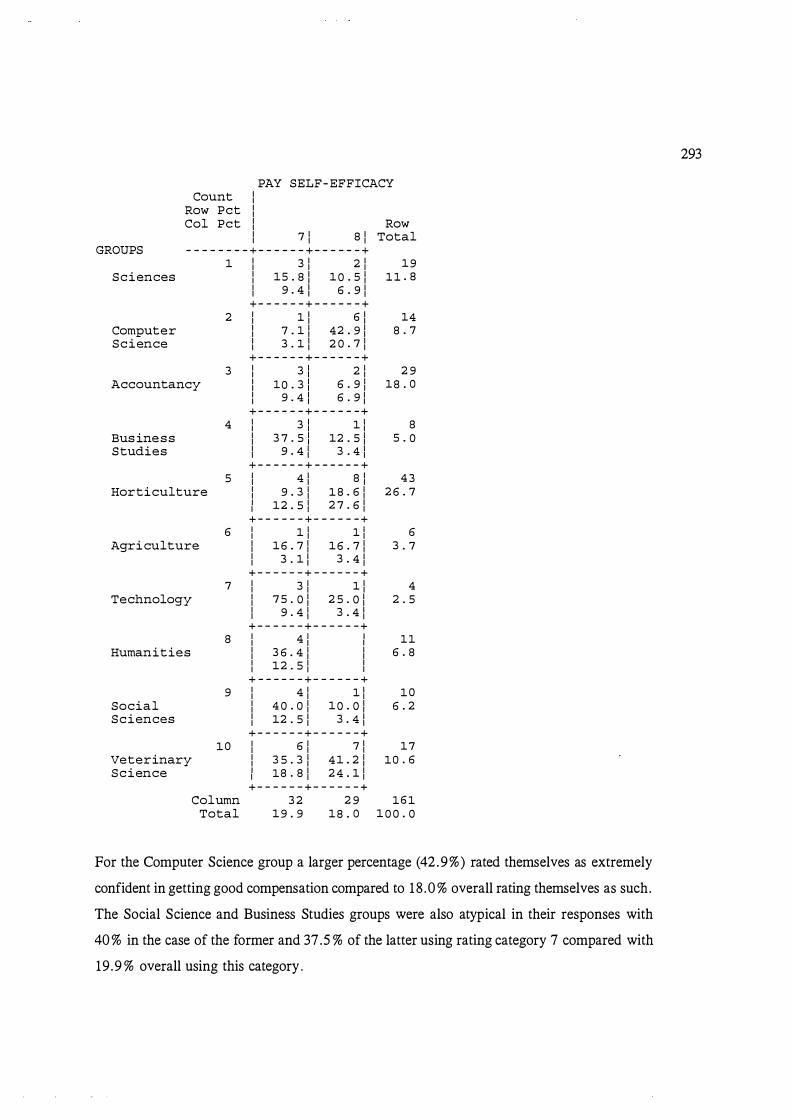
PAY SELF-EFFICACY Count I
I Row Pet I
I Col Pet I Row I
I 7 1 S I Total I GROUPS - - - - - - - - + - - - - - - + - - - - - - +
1 I 3 1 2 1 19 Sciences I 15 . S I 10 . 5 1 ll . S I
I 9 . 4 1 6 . 9 1 I + - - - - - - + - - - - - - +
2 I 1 1 6 1 14 I Computer I 7 . 1 1 42 . 9 1 S . 7 I Science I 3 . 1 1 2 0 . 7 1 I
+ - - - - - - + - - - - - - + 3 I 3 1 2 1 2 9 I
Accountancy I 10 . 3 1 6 . 9 1 1S . O I I 9 . 4 1 6 . 9 1 I
+ - - - - - - + - - - - - - + 4 I 3 1 1 1 s I
Business I 3 7 . 5 1 12 . 5 1 5 . 0 I Studies I 9 . 4 1 3 . 4 1 I
+ - - - - - - + - - - - - - + 5 I 4 1 S I 43 I
Horticulture I 9 . 3 1 1S . 6 1 2 6 . 7 I I 12 . 5 1 2 7 . 6 1 I
+ - - - - - - + - - - - - - + 6 I 1 1 1 1 6 I
Agriculture I 16 . 7 1 16 . 7 1 3 . 7 I I 3 . 1 1 3 . 4 1 I
+ - - - - - - + - - - - - - + 7 I 3 1 1 1 4 I
Technology I 7 5 . 0 1 2 5 . 0 1 2 . 5 I I 9 . 4 1 3 . 4 1 I
+ - - - - - - + - - - - - - + s I 4 1 I 11 I I I
Humanities I 3 6 . 4 1 I 6 . S I I I 12 . 5 1 I I I
+ - - - - - - + - - - - - - + 9 I 4 1 1 1 10 I
Social I 4 0 . 0 1 10 . 0 1 6 . 2 I Sciences I 12 . 5 1 3 . 4 1 I
+ - - - - - - + - - - - - - + 10 I 6 1 7 1 17 I
Veterinary I 3 5 . 3 1 41 . 2 1 10 . 6 I Science I 1S . S I 24 . 1 1 I
+ - - - - - - + - - - - - - + Column 3 2 2 9 161
Total 19 . 9 1S . O 1 0 0 . 0
For the Computer Science group a larger percentage (42 .9%) rated themselves as extremely
confident in getting good compensation compared to 18 .0 % overall rating themselves as such.
The Social Science and Business Studies groups were also atypical in their responses with
40 % in the case of the former and 37 .5 % of the latter using rating category 7 compared with
19 .9 % overall using this category.
293
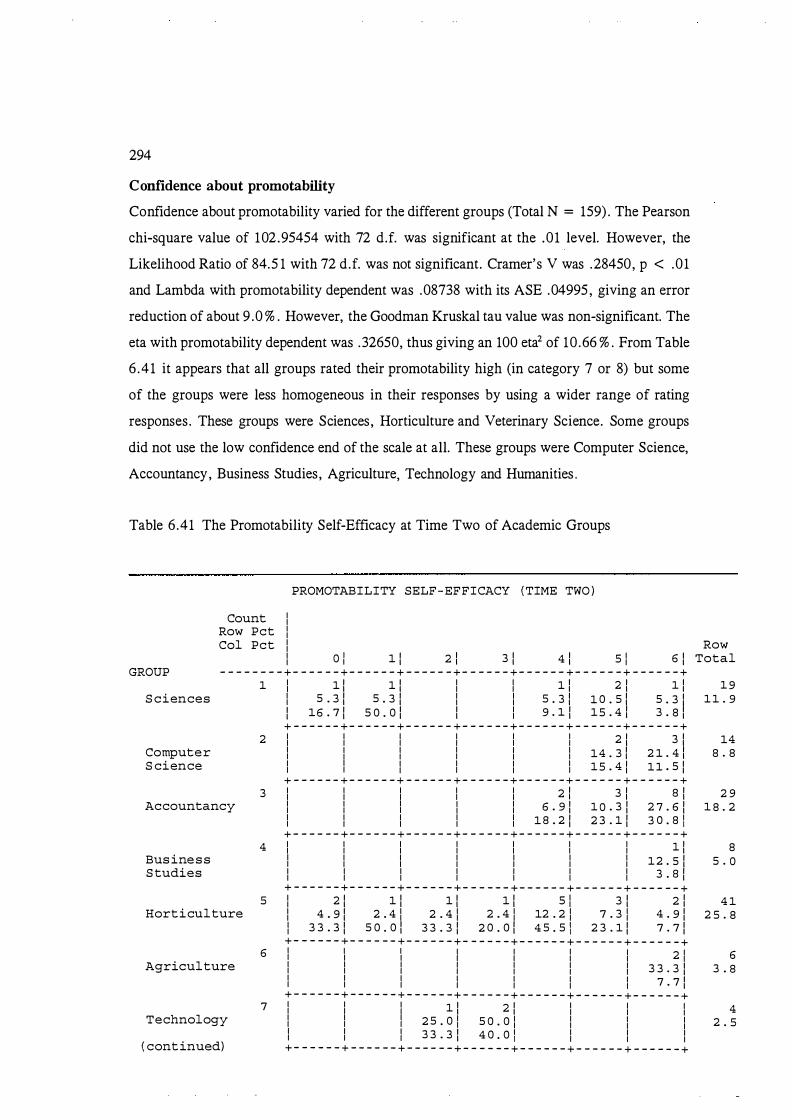
294
Confidence about promotability
Confidence about promotability varied for the different groups (Total N = 159) . The Pearson
chi-square value of 102 .95454 with 72 d.f. was significant at the .01 level. However, the
Likelihood Ratio of 84.5 1 with 72 d.f. was not significant. Cramer's V was .28450, p < .01
and Lambda with promotability dependent was .08738 with its ASE .04995 , giving an error
reduction of about 9 .0 % . However, the Goodman Kruskal tau value was non-significant. The
eta with promotability dependent was .32650, thus giving an 100 eta2 of 10 .66 % . From Table
6 .41 it appears that all groups rated their promotability high (in category 7 or 8) but some
of the groups were less homogeneous in their responses by using a wider range of rating
responses . These groups were Sciences, Horticulture and Veterinary Science. Some groups
did not use the low confidence end of the scale at all. These groups were Computer Science,
Accountancy, Business Studies , Agriculture, Technology and Humanities .
Table 6 .41 The Promotability Self-Efficacy at Time Two of Academic Groups
Count Row Pet Col Pet
I I I I I
PROMOTABILITY SELF-EFFICACY (TIME TWO)
I O l 1 1 2 1 3 1 4 1 S I 6 1 GROUP - - - - - - - - + - - - - - - + - - - - - - + - - - - - - + - - - - - - + - - - - - - + - - - - - - + - - - - - - +
S ciences
Computer S cience
Accountancy
Business Studies
1 I 1 1 1 1 I I 1 1 2 1 1 1 I s . 3 1 s . 3 1 I I s . 3 1 1 o . s 1 s . 3 1 1 16 . 7 1 s o . o 1 1 I 9 . 1 1 15 . 4 1 3 . 8 1 + - - - - - - + - - - - - - + - - - - - - + - - - - - - + - - - - - - + - - - - - - + - - - - - - +
2 I I I I I I 2 1 3 1 I I I I I I 14 . 3 1 2 1 . 4 1 I I I I I I 15 . 4 1 11 . s 1
+ - - - - - - + - - - - - - + - - - - - - + - - - - - - + - - - - - - + - - - - - - + - - - - - - + 3 I I I I I 2 1 3 1 s 1
I I I I I 6 . 9 1 1 0 . 3 1 2 7 . 6 1 I I I I I 1 s . 2 1 2 3 . 1 1 3 o . s l
+ - - - - - - + - - - - - - + - - - - - - + - - - - - - + - - - - - - + - - - - - - + - - - - - - + 4 I I I I I I I 1 1
I I I I I I I 12 . s 1 I I I I I I I 3 . s 1
+ - - - - - - + - - - - - - + - - - - - - + - - - - - - + - - - - - - + - - - - - - + - - - - - - + 5 I 2 1 1 1 1 1 1 1 S I 3 1 2 1
Horticulture I 4 . 9 1 2 . 4 I 2 . 4 I 2 . 4 I 12 . 2 I 7 . 3 I 4 . 9 1 I 3 3 . 3 1 s o . o 1 3 3 . 3 1 2 o . o 1 4 s . s l 2 3 . 1 1 7 . 7 1
Agriculture
Technology
( continued)
+ - - - - - - + - - - - - - + - - - - - - + - - - - - - + - - - - - - + - - - - - - + - - - - - - + 6 I I I I I I I 2 I
I I I I I I I I I I I I I I 1 3 3 · 3 1 I I I I I I I 7 . 7 1
+ - - - - - - + - - - - - - + - - - - - - + - - - - - - + - - - - - - + - - - - - - + - - - - - - + 7 I I I 1 1 2 1 I I I
I I I 2 s . o I s o . o I I I I I I I 3 3 . 3 1 4 o . o l I I I + - - - - - - + - - - - - - + - - - - - - + - - - - - - + - - - - - - + - - - - - - + - - - - - - +
Row Total
1 9 11 . 9
14 8 . 8
2 9 1 8 . 2
8 5 . 0
4 1 2 5 . 8
6 3 . 8
4 2 . 5
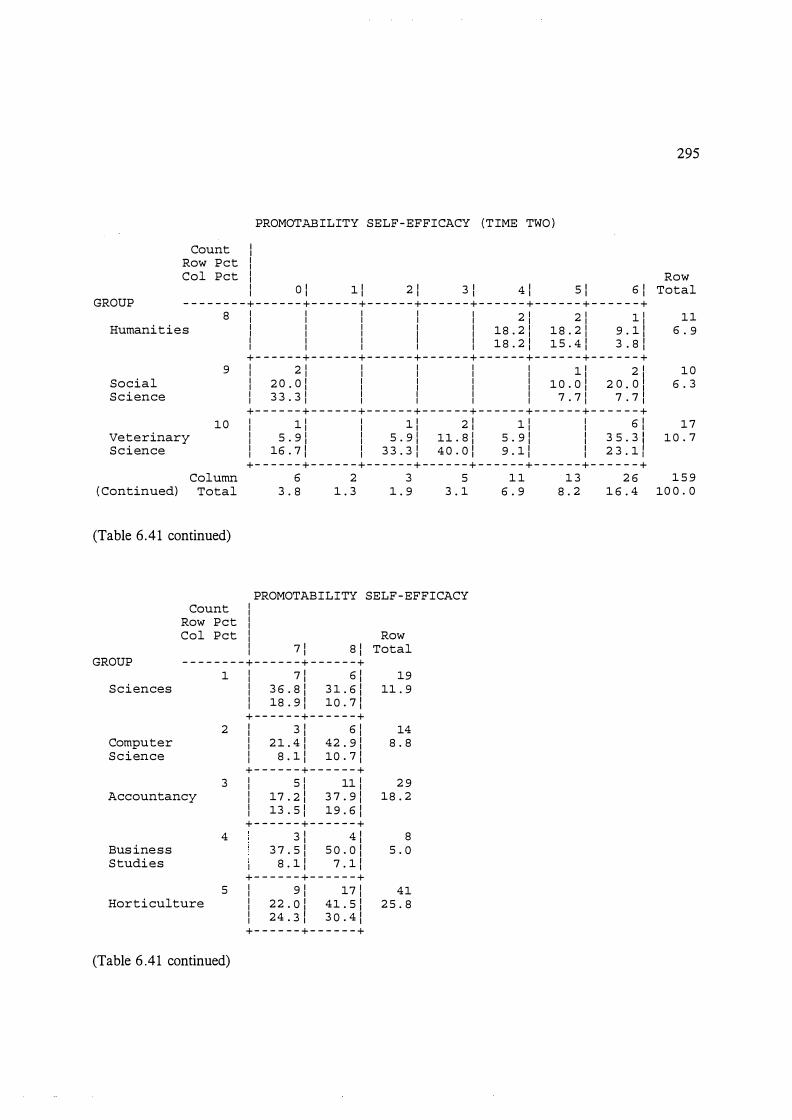
GROUP
Count Row Pet Col Pet
I I I I I
PROMOTABILITY SELF-EFFICACY (TIME TWO)
I O i 1 1 2 1 3 1 4 1 S i 6 1 - - - - - - - - + - - - - - - + - - - - - - + - - - - - - + - - - - - - + - - - - - - + - - - - - - + - - - - - - +
8 I I I I I 2 I 2 I 1 I Humanities I I I I I 18 . 2 I 1 8 . 2 I 9 . 1 1
Social Science
I I I I I 1 8 . 2 1 1 s . 4 1 3 . 8 1 + - - - - - - + - - - - - - + - - - - - - + - - - - - - + - - - - - - + - - - - - - + - - - - - - +
9 I 2 I I I I I 1 1 2 1 I 2 o . o 1 I I I I 1 0 . 0 1 2 o . o 1 I 3 3 . 3 I I I I I 7 . 7 I 7 . 7 1 + - - - - - - + - - - - - - + - - - - - - + - - - - - - + - - - - - - + - - - - - - + - - - - - - +
10 I 1 I I 1 1 2 1 1 I I 6 1 Veterinary Science
I s . 9 ! I s . 9 ! n . 8 ! s . 9 1 1 3 5 . 3 1 I 16 . 7 1 I 3 3 . 3 1 4 0 . o i 9 . 1 1 1 2 3 . 1 1
( Continued) Column
Total
+ - - - - - - + - - - - - - + - - - - - - + - - - - - - + - - - - - - + - - - - - - + - - - - - - + 6 2 3 5 1 1 1 3 2 6
3 . 8 1 . 3 1 . 9 3 . 1 6 . 9 8 . 2 1 6 . 4
(Table 6 .41 continued)
GROUP
Sciences
Computer Science
Count Row Pet Col Pet
PROMOTABILITY SELF-EFFICACY I I I I I Row I 7 1 8 1 Total
- - - - - - - - + - - - - - - + - - - - - - + 1 I 7 1 6 1 19
I 3 6 . 8 1 3 1 . 6 1 11 . 9 I 18 . 9 1 10 . 7 1
+ - - - - - - + - - - - - - + 2 1 3 1 6 I
I 2 1 . 4 1 42 . 9 1 I 8 . 1 1 10 . 7 1
+ - - - - - - + - - - - - - + 3
14 8 . 8
Accountancy I 5 I 11 I 2 9 I 17 . 2 1 3 7 . 9 I 18 . 2 I 13 . 5 1 19 . 6 1
Business Studies
Horticulture
4 + - - - - - - + - - - - - - +
3 1 4 1 3 7 . 5 1 5 0 . 0 1
1 8 . 1 1 7 . 1 1 + - - - - - - + - - - - - - +
8 5 . 0
5 I 9 1 17 I 41 I 22 . 0 1 41 . 5 1 2 5 . 8 I 24 . 3 1 3 0 . 4 1 + - - - - - - + - - - - - - +
(Table 6 .41 continued)
295
Row Total
11 6 . 9
1 0 6 . 3
1 7 1 0 . 7
1 5 9 10 0 . 0
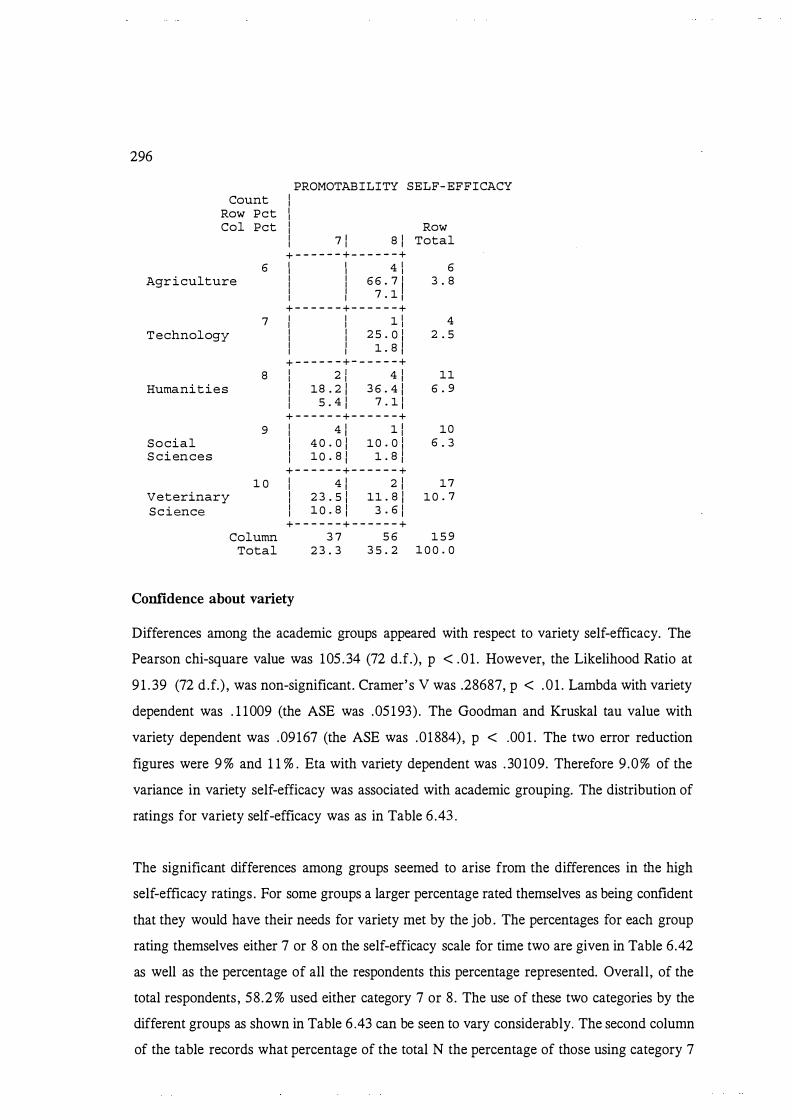
296
PROMOTABILITY SELF- EFFICACY Count I I
Row Pet I I Col Pet I Row I I 7 1 8 \ Total I I
+ - - - - - - + - - - - - - + 6 I I 4 \ 6 I I
Agriculture I I 66 . 7 \ 3 . 8 I I I I 7 . 1 \ I I + - - - - - - + - - - - - - +
7 I I 1 \ 4 I I Technology I I 2 5 . 0 \ 2 . 5 I I I I 1 . 8 \ I I
+ - - - - - - + - - - - - - + 8 I 2 1 4 \ 11 I I
Humanities I 18 . 2 \ 3 6 . 4 \ 6 . 9 I I 5 . 4 \ 7 . 1 \ I + - - - - - - + - - - - - - +
9 I 4 \ I 1 1 I 10 Social I 4 0 . 0 \ 10 . 0 1 6 . 3 I S ciences I 10 . 8 \ I 1 . 8 1
+ - - - - - - + - - - - - - + 1 0 I 4 \ 2 \ 17 I
Veterinary I 2 3 . 5 \ 11 . 8 \ 10 . 7 I S c i ence I 1 0 . 8 \ 3 . 6 \ I
+ - - - - - - + - - - - - - + Column 3 7 5 6 1 5 9
Total 2 3 . 3 3 5 . 2 1 0 0 . 0
Confidence about variety
Differences among the academic groups appeared with respect to variety self-efficacy. The
Pearson chi-square value was 105 . 34 (72 d.f.), p < . 0 1 . However, the Likelihood Ratio at
9 1 . 39 (72 d.f.) , was non-significant. Cramer's V was .28687, p < . 0 1 . Lambda with variety
dependent was . 1 1009 (the ASE was .05 193) . The Goodman and Kruskal tau value with
variety dependent was .09167 (the ASE was .01884), p < .00 1 . The two error reduction
figures were 9 % and 1 1 % . Eta with variety dependent was . 30 109. Therefore 9 .0% of the
variance in variety self-efficacy was associated with academic grouping. The distribution of
ratings for variety self-efficacy was as in Table 6 .43 .
The significant differences among groups seemed to arise from the differences in the high
self-efficacy ratings . For some groups a larger percentage rated themselves as being confident
that they would have their needs for variety met by the job . The percentages for each group
rating themselves either 7 or 8 on the self-efficacy scale for time two are given in Table 6.42
as well as the percentage of all the respondents this percentage represented. Overall , of the
total respondents , 58 .2 % used either category 7 or 8 . The use of these two categories by the
different groups as shown in Table 6 .43 can be seen to vary considerably. The second column
of the table records what percentage of the total N the percentage of those using category 7

297
and 8 in each group, represents . Veterinary Science, Sciences, Agriculture and Technology
recorded a higher level of confidence they will find variety in their work.
Table 6.42 A Comparison of Percentages Rating Themselves Highly or Completely
Confident on the Self-Efficacy for Variety Scale with the Percentage Using
These Rating Categories in the Whole Sample
Academic group
Sciences Computer Science Accountancy Business Studies Horticulture Agriculture Technology Humanities Social Sciences Veterinary Science
Percentage using categories 7 and 8 within groups
73.7 38.5 44.8 50.0 55 .8 100 .0 100 .0 45 .5 60.0 70.5
Percentage of all respondents (N = 160) using 7 and 8 ratings here
29.0 1 1 .0 28.5 08 . 1 5 1 .7 12 .6 08 .0 1 1 .0 13 .9 24.7
Excluding the Technology group because of its smaller N and collapsing to give five
academic groups (Sciences/Computer Science, Accountancy/Business Studies ,
Horticulture/Agriculture, Humanities/Social Sciences , and Veterinary Science) because of the
low N in Agriculture also, the Pearson chi Square (69 .69, d.f. = 25) and the Likelihood
Ratio (6 1 .28, d.f. = 5) were significant with p < .01 and .05, respectively. As shown in
Table 6.42, Sciences (at 73 .7%) and Veterinary Science (at 70.5 %) were extremely confident
they are finding variety in their jobs and the Horticulture/ Agriculture group (now combined)
had 6 1 . 2 % using the 7 or 8 category.

298
Table 6 .43 Variety Self-Efficacy of Academic Groups
Count Row Pet Col Pet
I I I
VARIETY SELF-EFFICACY
I O l 1 1 2 1 3 1 4 1 S I 6 1 GROUP - - - - - - - - + - - - - - - + - - - - - - + - - - - - - + - - - - - - + - - - - - - + - - - - - - + - - - - - - +
1 I I 1 1 I 1 1 I 2 1 1 1 Sciences
Computer Science
Accountancy
Business Studies
Horticulture
Agriculture
Technology
Humanities
Social Sciences
Veterinary Science
2
3
4
s
6
7
8
9
1 0
( Continued) Column
Total
(Table 6 .43 continued)
I I s . 3 1 I s . 3 1 I 1 o . s 1 s . 3 1 I I s o . o l I 12 . s 1 I 1s . 4 1 3 . o l
+ - - - - - - + - - - - - - + - - - - - - + - - - - - - + - - - - - - + - - - - - - + - - - - - - + I I I I 2 1 1 1 3 1 2 1 I I I I 1s . 4 1 7 . 7 1 2 3 . 1 1 1s . 4 I I I I I 2 s . o 1 2 o . o 1 2 3 . 1 1 6 . 1 1
+ - - - - - - + - - - - - - + - - - - - - + - - - - - - + - - - - - - + - - - - - - + - - - - - - + I I 1 1 I 1 1 I 4 1 10 I I I 3 . 4 1 I 3 . 4 1 I 1 3 . 8 1 3 4 . S I I I s o . o 1 I 12 . s 1 I 3 o . 8 1 3 0 . 3 1
+ - - - - - - + - - - - - - + - - - - - - + - - - - - - + - - - - - - + - - - - - - + - - - - - - + I I I I 1 1 I I 3 1 I I I I 12 . 5 1 I I 3 7 . 5 1 I I I I 12 . s I I I 9 . 1 I
+ - - - - - - + - - - - - - + - - - - - - + - - - - - - + - - - - - - + - - - - - - + - - - - - - + I 1 1 I I 1 1 4 1 2 1 11 1 I 2 . 3 1 I I 2 . 3 \ 9 . 3 1 4 . 7 1 2 5 . 6 1 I 5 o . o l I I 12 . s 1 8 o . o 1 15 . 4 1 3 3 . 3 1
+ - - - - - - + - - - - - - + - - - - - - + - - - - - - + - - - - - - + - - - - - - + - - - - - - + I I I I I I I I I I I I I I I I I I I I I I I I I I I I I I I I I I I I I I I I I I I I I I I I
+ - - - - - - + - - - - - - + - - - - - - + - - - - - - + - - - - - - + - - - - - - + - - - - - - + I I I I I I I I I I I I I I I I I I I I I I I I I I I I I I I I I I I I I I I I I I I I I I I I
+ - - - - - - + - - - - - - + - - - - - - + - - - - - - + - - - - - - + - - - - - - + - - - - - - + I I I 1 1 2 1 I I 3 1 I I I 9 . 1 1 18 . 2 1 1 I 2 7 . 3 1 I I I 2 5 . o l 2 5 . o l I I 9 . 1 1
+ - - - - - - + - - - - - - + - - - - - - + - - - - - - + - - - - - - + - - - - - - + - - - - - - + I I I 3 1 I I 1 1 I I I I 3 o . o I I I 10 . o I I I I I 7 s . o I I I 7 . 7 1 I
+ - - - - - - + - - - - - - + - - - - - - + - - - - - - + - - - - - - + - - - - - - + - - - - - - + I 1 1 I I I I 1 1 3 1 I s . 9 1 I I I I 5 . 9 1 1 7 . 6 1 I s o . o 1 I I I I 7 . 7 1 9 . 1 1
+ - - - - - - + - - - - - - + - - - - - - + - - - - - - + - - - - - - + - - - - - - + - - - - - - + 2 2 4 8 s 1 3 3 3
1 . 3 1 . 3 2 . S s . o 3 . 1 8 . 1 2 0 . 6
Row Total
1 9 11 . 9
1 3 8 . 1
2 9 18 . 1
8 s . o
4 3 2 6 . 9
6 3 . 8
4 2 . S
11 6 . 9
10 6 . 3
1 7 10 . 6
1 6 0 10 0 . 0
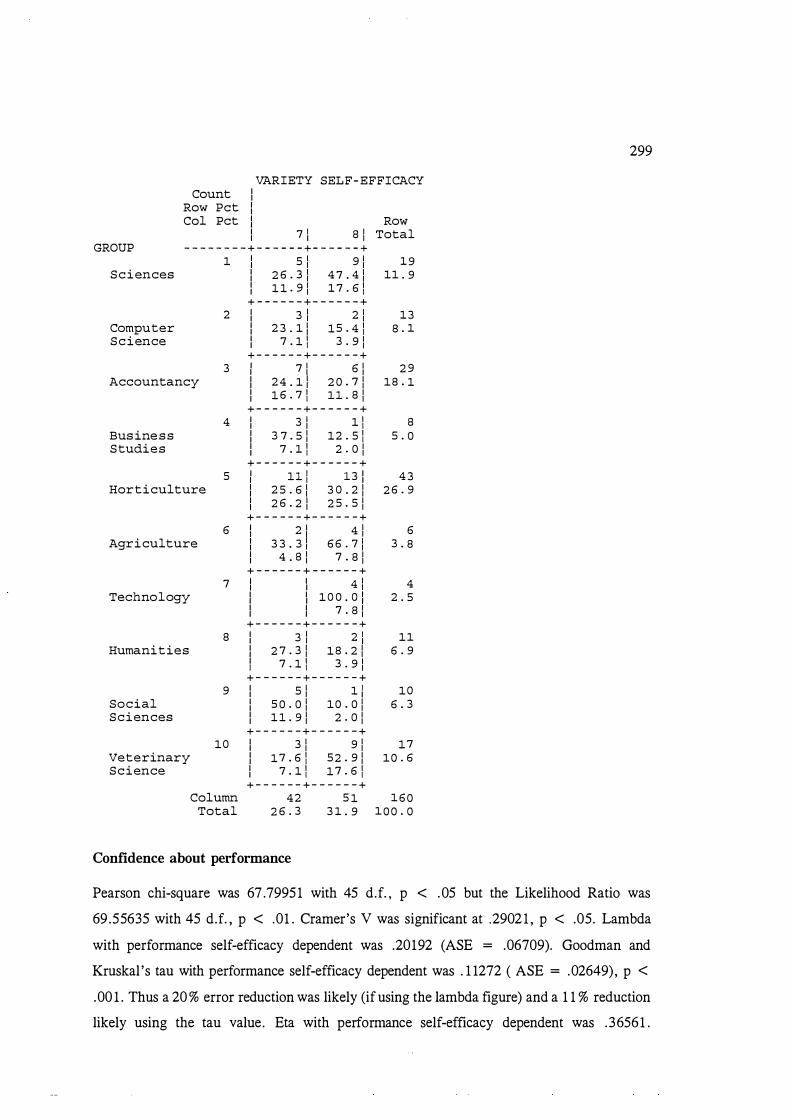
299
VARIETY SELF-EFFICACY Count I I
Row Pet I I Col Pet I Row I I 7 1 a : Total I I
GROUP - - - - - - - - + - - - - - - + - - - - - - + l I 5 1 9 1 19 I
Sciences I 2 6 . 3 1 4 7 . 4 1 11 . 9 I I l l . 9 : l 7 . 6 l I + - - - - - - + - - - - - - +
2 I 3 1 2 1 l3 I Computer I 2 3 . 1 1 l5 . 4 l a . 1 I Science I 7 . l l 3 . 9 : I
+ - - - - - - + - - - - - - + 3 I 7 1 6 1 2 9 I
Accountancy I 2 4 . 1 1 2 0 . 7 1 1a . l I I l 6 . 7 l u . a : I + - - - - - - + - - - - - - +
4 I 3 1 l l a I Business I 3 7 . 5 1 l2 . 5 l 5 . 0 I Studies I 7 . l l 2 . 0 : I
+ - - - - - - + - - - - - - + 5 I u : B i 4 3 I
Horticulture I 2 5 . 6 1 3 0 . 2 1 2 6 . 9 I I 2 6 . 2 1 2 5 . 5 1 I + - - - - - - + - - - - - - +
6 I 2 1 4 1 6 I Agriculture I 3 3 . 3 1 66 . 7 1 3 . a I I 4 . a : 7 . a : I
+ - - - - - - + - - - - - - + 7 I I 4 1 4 I I
Technology I I l O O . O i 2 . 5 I I I I 7 . a : I I + - - - - - - + - - - - - - +
a I 3 1 2 1 l1 I I Humanities I 2 7 . 3 1 la . 2 1 6 . 9 I I 7 . l l 3 . 9 : I
+ - - - - - - + - - - - - - + 9 I 5 1 l l 10 I I
Social I 5 0 . 0 1 10 . 0 1 6 . 3 I Sciences I ll . 9 1 2 . 0 : I
+ - - - - - - + - - - - - - + 10 I 3 1 9 1 l7 I
Veterinary I l7 . 6 l 52 . 9 1 10 . 6 I Science I 7 . l l l7 . 6 l I
+ - - - - - - + - - - - - - + Column 42 5 l 160
Total 2 6 . 3 3 1 . 9 100 . 0
Confidence about performance
Pearson chi-square was 67 .79951 with 45 d.f. , p < .05 but the Likelihood Ratio was
69 .55635 with 45 d.f. , p < .01 . Cramer's V was significant at .2902 1 , p < .05. Lambda
with performance self-efficacy dependent was .20192 (ASE = .06709). Goodman and
Kruskal 's tau with performance self-efficacy dependent was . 1 1272 ( ASE = .02649), p <
.00 1 . Thus a 20 % error reduction was likely (ifusing the lambda figure) and a 1 1 % reduction
likely using the tau value. Eta with performance self-efficacy dependent was . 36561 .

300
Therefore, about 13 % of the variance in self-efficacy performance was associated with
academic grouping.
The percentage of use of the categories is given in Table 6.44 Differences were noticeable
in self-efficacy ratings at the extremely confident end of the scale in particular. Table 6 .44
shows the percentage of each group using either category 7 or 8 on the self-efficacy rating
scale.
Table 6 .44 Percentage Using Rating Category 7 or 8 of the Self-Efficacy Scale
Groups
Sciences Computer Sciences Accountancy Business Studies Horticulture Agriculture Technology Humanities Social Science Veterinary Science
Percentage using category 7 or 8
94. 8 % 78 . 6 % 62.0% 50.0% 76. 7 % 50.0%
100 .0% 45 .5 % 40.0% 52. 9 %
Percentage of total respondents using 7 and 8 ratings
33 . 1 % 78 . 6 % 34. 1 %
7.3 % 60. 1 %
5 . 6 % 7 .0% 9. 1 % 7 .3 %
16 .3 %
Sciences showed the greatest degree of confidence in their ability to perform (if we exclude
Technology from the comparisons because the N for that group by stage two of the study was
small).
Confidence about receiving good hwnan relations supervision
Of the chi-square tests only the Likelihood Ratio 101 .86 (72 d. f.) was significant, p < .01 .
Crarner's V was non-significant at .26. Lambda with supervision dependent was .09836 with
an ASE of .05719 . Goodman and Kruskal' s tau with human relations supervision dependent
was .07549 (ASE = . 01464) , p < .05 . Therefore, 7 % to 9 % of error reduction could be ·
expected. Eta with human relations supervision dependent was . 38648, giving an 100 Eta2 of

301
about 15 % . The responses using categories 0 to 8 were crosstabulated as shown in Table
6.46 .
Table 6.45 Performance Self-efficacy of Academic Groups
Performance Self- efficacy Count i
Row Pet i Col Pet i Row
i 2 i 4 i 5 i 6 i 7 i 8 i Total GROUP - - - - - - - - + - - - - - - + - - - - - - + - - - - - - + - - - - - - + - - - - - - + - - - - - - +
Sciences
Computer Science
Accountancy
Business Studies
Horticulture
Agriculture
Technology
Humanities
Social Sciences
Veterinary Science
1
2
3
4
s
6
7
8
9
10
Column Total
i i i i 1 i 9 i 9 i i i i i S . 3 i 4 7 . 4 i 4 7 . 4 i i i i i 2 . 6 i 1 7 . 3 i 1 S . 8 i + - - - - - - + - - - - - - + - - - - - - + - - - - - - + - - - - - - + - - - - - - + i i i 2 i 1 i 4 i 7 i i i i 14 . 3 i 7 . 1 i 2 8 . 6 i S O . O i i i i 2 S . O I 2 . 6 1 7 . 7 i 12 . 3 1 + - - - - - - + - - - - - - + - - - - - - + - - - - - - + - - - - - - + - - - - - - + I 1 1 3 i i 7 1 1s 1 3 I 1 3 . 4 i 10 . 3 i 1 24 . 1 1 s 1 . 1 1 1 0 . 3 1 1 1 o o . o 1 6 o . o i I 18 . 4 i 2 8 . 8 1 s . 3 1
+ - - - - - - + - - - - - - + - - - - - - + - - - - - - + - - - - - - + - - - - - - + I I I 4 1 2 1 2 1 I I I 5 o . o l 2 s . o 1 2 s . o 1 I i I I 10 . S i 3 . 8 I 3 . S I
+ - - - - - - + - - - - - - + - - - - - - + - - - - - - + - - - - - - + - - - - - - + I I I 3 1 7 1 13 i 2 o I I I I 7 . o l 16 . 3 1 3 0 . 2 i 4 6 . s i I I I 3 7 . 5 1 18 . 4 1 2 s . o 1 3 S . 1 i
+ - - - - - - + - - - - - - + - - - - - - + - - - - - - + - - - - - - + - - - - - - + I I I I 3 1 2 1 1 1 I I I I S O . O i 3 3 . 3 1 16 . 7 1 i I i I 7 . 9 1 3 . 8 1 1 . 8 1 + - - - - - - + - - - - - - + - - - - - - + - - - - - - + - - - - - - + - - - - - - + I I I I i I 4 1 I i i I i I 1 o o . o I I i i I i I 7 . o I
+ - - - - - - + - - - - - - + - - - - - - + - - - - - - + - - - - - - + - - - - - - + I I i 2 1 4 i 2 1 3 1 I I I 18 . 2 1 3 6 . 4 1 1 8 . 2 1 2 7 . 3 1 I I I 2 S . 0 I 10 . S i 3 . 8 I s . 3 I + - - - - - - + - - - - - - + - - - - - - + - - - - - - + - - - - - - + - - - - - - + i I I I 6 i 2 1 2 1 i I I I 6 o . o i 2 o . o 1 2 o . o 1 I I I I 1s . 8 i 3 . 8 1 3 . s l + - - - - - - + - - - - - - + - - - - - - + - - - - - - + - - - - - - + - - - - - - + i I 2 1 1 1 S I 3 1 6 1 I I n . 8 1 s . 9 1 2 9 . 4 1 1 7 . 6 1 3 S . 3 1 I I 4 o . o l 12 . 5 1 13 . 2 1 s . 8 1 1 o . s 1
+ - - - - - - + - - - - - - + - - - - - - + - - - - - - + - - - - - - + - - - - - - + 1 5 8 3 8 52 5 7
. 6 3 . 1 5 . 0 2 3 . 6 3 2 . 3 3 S . 4
1 9 1 1 . 8
14 8 . 7
2 9 1 8 . 0
8 s . o
4 3 2 6 . 7
6 3 . 7
4 2 . S
11 6 . 8
10 6 . 2
1 7 1 0 . 6
16 1 10 0 . 0
Where the differences lie is not very clear from Table 6 .46, but some differences appear
notable . The Science group's use of the 7th category was atypical in that 3 1 . 6 % used this as

302
against 14.9 % of all respondents . At the other extreme of the scale, 14. 3 % of Computer
Science, 25 % of Technology and 20% of Social Sciences rated themselves as having no
confidence at all about receiving good human relations supervision as compared to 5 % of all
respondents using this category. However, the technology percentage is inflated and should
be excluded from comparison because of its very small N, 25 % in this case represents only
one individual.
Table 6 .46 Group Differences in Human Relations Supervision Self-Efficacy
HUMAN RELATIONS SUPERVISION SELF-EFFICACY Count I
Row Pet I Col Pet I Row
I 0 I 1 I 2 I 3 I 4 I 5 I 6 I Total GROUP - - - - - - - - + - - - - - - + - - - - - - + - - - - - - + - - - - - - + - - - - - - + - - - - - - + - - - - - - +
Sciences
Computer Science
Accountancy
Business Studies
Horticulture
Agriculture
Technology
Humanities
Social Sciences
Veterinary Science
1
2
3
4
5
6
7
8
9
10
Column ( Continued) Total
I I I I 1 1 I 3 1 5 1 I I I I 5 . 3 1 I 15 . 8 1 2 6 . 3 1 I I I I 7 . 1 1 I 2 L 4 1 15 . 6 1
+ - - - - - - + - - - - - - + - - - - - - + - - - - - - + - - - - - - + - - - - - - + - - - - - - + I 2 1 I 1 1 2 1 2 1 2 1 1 1 I 14 . 3 I I 7 . 1 1 14 . 3 1 14 . 3 1 14 . 3 1 7 . 1 1 I 2 5 . o 1 I 12 . 5 1 14 . 3 1 11 . 1 1 14 . 3 1 3 . 1 1
+ - - - - - - + - - - - - - + - - - - - - + - - - - - - + - - - - - - + - - - - - - + - - - - - - + I I 1 1 I 1 1 5 1 3 1 7 1 I I 3 . 4 1 I 3 . 4 1 1 7 . 2 1 10 . 3 1 24 . 1 1 I I 2 5 . o l I 7 . 1 1 2 7 . 8 1 21 . 4 1 2 1 . 9 1 + - - - - - - + - - - - - - + - - - - - - + - - - - - - + - - - - - - + - - - - - - + - - - - - - + I I 1 1 2 I 1 1 I I 1 I I I 12 . 5 1 2 5 . o l 12 . 5 1 1 1 12 . 5 1 I I 2 5 . o l 2 5 . o l 7 . 1 1 1 1 3 . 1 1 + - - - - - - + - - - - - - + - - - - - - + - - - - - - + - - - - - - + - - - - - - + - - - - - - + I 3 1 1 1 3 1 4 1 4 1 1 1 12 1 I 7 . o l 2 . 3 1 7 . o l 9 . 3 1 9 . 3 1 2 . 3 1 2 7 . 9 1 I 3 7 . 5 1 2 5 . o l 3 7 . 5 1 2 8 . 6 1 2 2 . 2 1 7 . 1 1 3 7 . 5 1
+ - - - - - - + - - - - - - + - - - - - - + - - - - - - + - - - - - - + - - - - - - + - - - - - - + I I I 1 1 1 I 2 1 I 1 I I I 1 6 . 7 1 16 . 7 1 3 3 . 3 1 1 1 I I I 12 . 5 1 7 . 1 1 11 . 1 1 1 1 + - - - - - - + - - - - - - + - - - - - - + - - - - - - + - - - - - - + - - - - - - + - - - - - - + I 1 1 I I 1 1 1 1 1 1 1 I 2 5 . o l I I 2 5 . o l 2 5 . o l 2 5 . o l 1 I 12 . 5 I I I 7 . 1 1 5 . 6 1 7 . 1 1 1
+ - - - - - - + - - - - - - + - - - - - - + - - - - - - + - - - - - - + - - - - - - + - - - - - - + I I 1 1 I I I 2 I 1 1 I I 9 . 1 1 I I I 1 8 . 2 1 9 . 1 1 I I 2 5 . o I I I 1 14 . 3 1 3 . 1 1
+ - - - - - - + - - - - - - + - - - - - - + - - - - - - + - - - - - - + - - - - - - + - - - - - - + I 2 1 I 1 1 1 1 2 1 1 1 2 1 I 2 0 . 0 1 I 10 . 0 1 10 . 0 1 2 0 . 0 1 10 . 0 1 2 0 . 0 1 I 2 5 · 0 I I 12 . 5 I 7 . 1 I 11 . 1 I 7 . 1 1 6 . 3 I + - - - - - - + - - - - - - + - - - - - - + - - - - - - + - - - - - - + - - - - - - + - - - - - - + I I I l 2 1 2 J 1 J 3 J I I I I 1l . 8 J 1l . 8 1 5 . 9 1 1 7 . 6 J I I l l 14 · 3 l 11 . 1 l 7 . 1 1 9 . 4 l + - - - - - - + - - - - - - + - - - - - - + - - - - - - + - - - - - - + - - - - - - + - - - - - - +
8 4 8 14 18 14 32 5 . 0 2 . 5 5 . 0 8 . 7 11 . 2 8 . 7 1 9 . 9
1 9 1l . 8
14 8 . 7
2 9 1 8 . 0
8 5 . 0
4 3 2 6 . 7
6 3 . 7
4 2 . 5
11 6 . 8
1 0 6 . 2
1 7 1 0 . 6
1 61 10 0 . 0
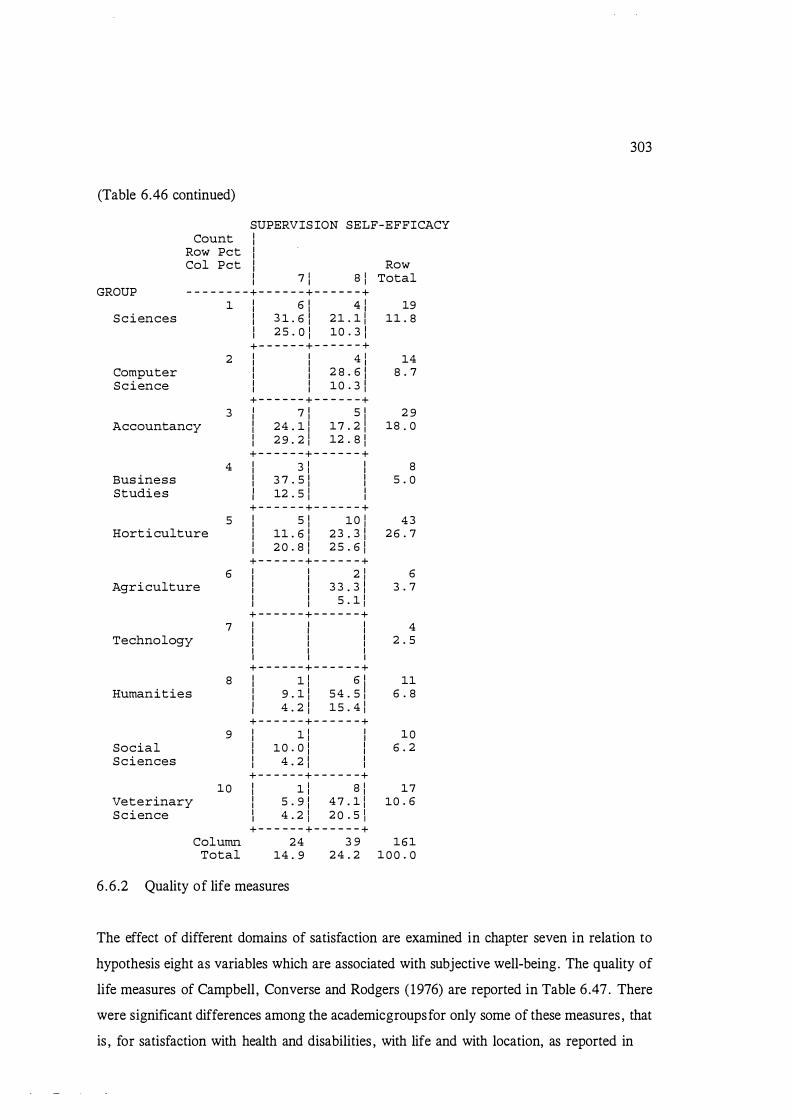
(Table 6.46 continued)
SUPERVISION SELF-EFFICACY Count I I
Row Pet I I Col Pet I I I 7 1 a : I I
GROUP - - - - - - - - + - - - - - - + - - - - - - + 1 I 6 J 4 1 I - I
Sciences I 3 1 . 6 J 21 . 1 1 I I 2 5 . 0 j 10 . 3 J I + - - - - - - + - - - - - - +
2 I I 4 1 I I I Computer I I 2 8 . 6 J I I Science I I 10 . 3 J I I
+ - - - - - - + - - - - - - + 3 I 7 J 5 J I
Accountancy I 24 . 1 1 17 . 2 1 I 2 9 . 2 1 12 . 8 J I + - - - - - - + - - - - - - +
4 I 3 j I I I Business I 3 7 . 5 J I I I Studies I 12 . 5 1 I I I
+ - - - - - - + - - - - - - + 5 I 5 J 10 j I
Horticulture I 11 . 6 J 23 . 3 J I I 2 0 . 8 J 2 5 . 6 1 I + - - - - - - + - - - - - - +
6 I I 2 j I I Agriculture I I 3 3 . 3 J I I I I 5 . 1 j I I
+ - - - - - - + - - - - - - + 7 I I I I I I
Technology I I I I I I I I I I I I + - - - - - - + - - - - - - +
8 I 1 j 6 J I Humanities I 9 . 1 J 54 . 5 1 I I 4 . 2 J 15 . 4 1 I
+ - - - - - - + - - - - - - + 9 I 1 j I I I
Social I 10 . 0 J I I I Sciences I 4 . 2 J I I I
+ - - - - - - + - - - - - - + 10 I 1 1 a :
Veterinary I 5 . 9 J 4 7 . 1 1 I Science I 4 . 2 J 2 0 . 5 J I
+ - - - - - - + - - - - - - + Column 24 3 9
Total 14 . 9 24 . 2
6 .6 .2 Quality of life measures
Row Total
19 11 . 8
14 8 . 7
2 9 18 . 0
8 5 . 0
43 2 6 . 7
6 3 . 7
4 2 . 5
11 6 . 8
10 6 . 2
17 10 . 6
161 1 0 0 . 0
303
The effect of different domains of satisfaction are examined in chapter seven in relation to
hypothesis eight as variables which are associated with subjective well-being. The quality of
life measures of Campbell , Converse and Rodgers ( 1976) are reported in Table 6 .47 . There
were significant differences among the academicgroupsfor only some of these measures , that
is , for satisfaction with health and disabilities , with life and with location, as reported in
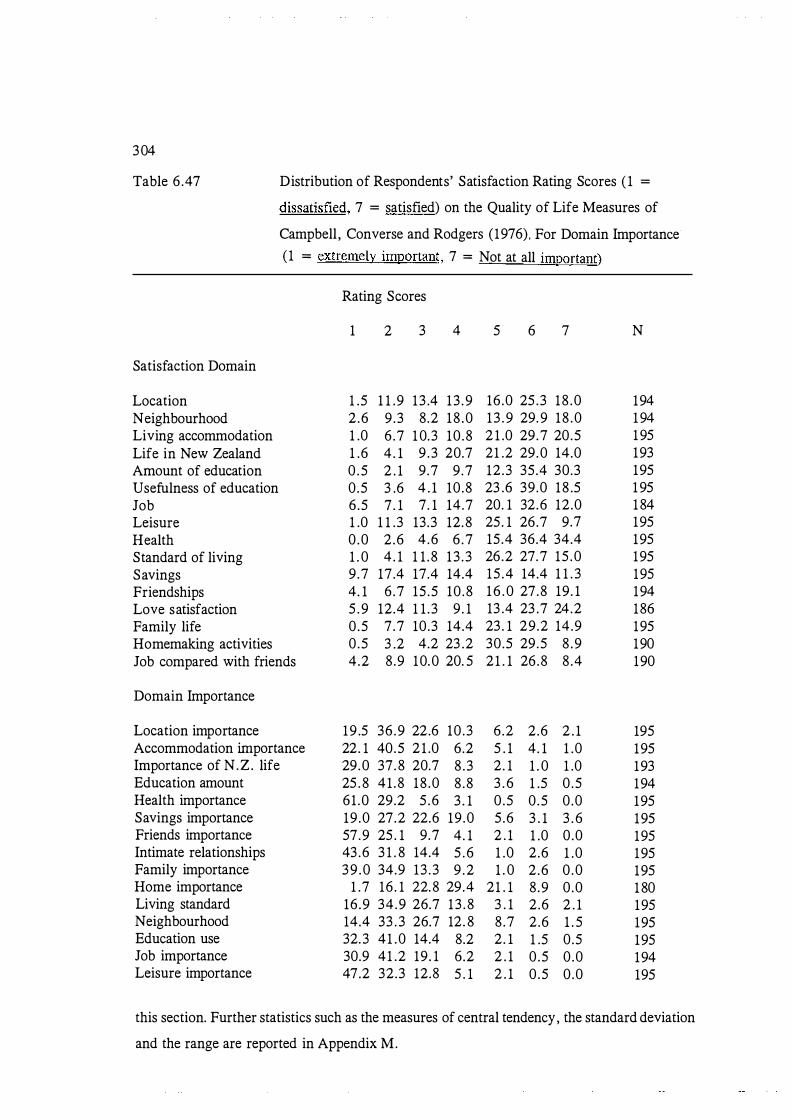
3 04
Table 6 .47 Distribution of Respondents' Satisfaction Rating Scores ( 1 =
dissatisfied, 7 = satisfied) on the Quality of Life Measures of
Campbell , Converse and Rodgers (1976) , For Domain Importance (1 = extremely important, 7 = Not at all important)
Satisfaction Domain
Location Neighbourhood Living accommodation Life in New Zealand Amount of education Usefulness of education Job Leisure Health Standard of living Savings Friendships Love satisfaction Family life Homemaking activities Job compared with friends
Domain Importance
Location importance Accommodation importance Importance of N.Z . life Education amount Health importance Savings importance Friends importance Intimate relationships Family importance Home importance Living standard Neighbourhood Education use Job importance Leisure importance
Rating Scores
1 2 3 4
1 .5 1 1 .9 13 .4 13 .9 2 .6 9 .3 8.2 18 .0 1 .0 6 .7 1 0.3 10 .8 1 .6 4 . 1 9 .3 20.7 0 .5 2 . 1 9 .7 9 .7 0 .5 3 .6 4 . 1 10 .8 6 .5 7 . 1 7. 1 14.7 1 .0 1 1 .3 13.3 12.8 0 .0 2 .6 4 .6 6 .7 1 . 0 4 . 1 1 1 .8 13 . 3 9 .7 17 .4 17.4 14.4 4. 1 6 .7 15 .5 10 .8 5 . 9 12.4 1 1 .3 9 . 1 0 .5 7 .7 10.3 14.4 0 .5 3 .2 4.2 23 .2 4.2 8 .9 10.0 20. 5
19 .5 36 .9 22.6 10 .3 22. 1 40.5 2 1 .0 6.2 29.0 37. 8 20.7 8 .3 25 . 8 41 .8 18 .0 8 .8 61 .0 29.2 5 .6 3 . 1 19 .0 27.2 22.6 19 .0 57.9 25 . 1 9 .7 4. 1 43 .6 3 1 . 8 14.4 5 . 6 39 .0 34.9 13 . 3 9 .2
1 .7 16 . 1 22.8 29.4 16 .9 34 .9 26.7 1 3 . 8 14.4 33 . 3 26.7 12. 8 32.3 41 .0 14.4 8.2 30.9 41 .2 19 . 1 6.2 47.2 32.3 12.8 5 . 1
5 6 7
16 .0 25 .3 18 .0 1 3 . 9 29. 9 18 .0 2 1 .0 29.7 20.5 21 .2 29.0 14.0 12 .3 35.4 30.3 23 .6 39.0 18 .5 20. 1 32.6 12.0 25. 1 26.7 9.7 15 .4 36.4 34.4 26.2 27.7 15 .0 15 .4 14.4 1 1 . 3 1 6 . 0 27.8 19 . 1 13 .4 23 .7 24.2 23 . 1 29.2 14.9 30.5 29.5 8 .9 21 . 1 26.8 8 .4
6 .2 2 .6 2 . 1 5 . 1 4. 1 1 .0 2 . 1 1 . 0 1 .0 3 . 6 1 .5 0 .5 0 .5 0 .5 0 .0 5 .6 3 . 1 3 . 6 2 . 1 1 .0 0 .0 1 .0 2 .6 1 .0 1 . 0 2 .6 0 .0
21 . 1 8 .9 0 .0 3 . 1 2 .6 2 . 1 8 .7 2 .6 1 . 5 2 . 1 1 .5 0 .5 2 . 1 0 .5 0 .0 2 . 1 0 .5 0 .0
N
194 1 94 1 95 193 195 1 95 1 84 195 195 195 195 194 186 195 190 190
195 195 193 194 195 195 195 195 195 1 80 195 195 195 194 195
this section. Further statistics such as the measures of central tendency, the standard deviation
and the range are reported in Appendix M.

305
Health and disabilities
The question asking respondents about their health and disabilities found that 85 . 2 % rated
themselves to be in excellent health, 14.5 % stated they had a disability which would affect
employment and 0 .3 % said they had more than one disability which would affect their
employment. No significant differences among academic groupings were found.
Life satisfaction
For both stages of the study the life satisfaction categories were collapsed such that on the
scale of 1 to 7 (with 7 = completely satisfied and 1 = completely dissatisfied) , 1 to 2 was
recoded to low satisfaction, 2 to 5 medium satisfaction, and 6 to 7 high satisfaction. The life
satisfaction of all groups at stage one of the study appeared similar and degree of satisfaction
appeared unchanged by stage two of the study, that is six months into the year post
graduation, as shown in Table 6.48.
Table 6 .48 A Comparison of the Distribution of the Life Satisfaction of Respondents at
Time One and Two of the Study (Final Year University and the Following
Year)
% Low life satisfaction
Prior to graduation 4.9 Post graduation 7.0
Satisfaction with Location
% Medium life satisfaction
56 . 1 57.8
% High life satisfaction
39 .0 35 .2
N
367 199
Satisfaction with location at time one tended to be homogeneous for the different academic
groups. For N = 367 the proportion of responses were distributed among the 1 to 7 categories
of satisfaction (with 7 = satisfied) as shown in Table 6 .49.
Even when the ratings were collapsed into three categories (low, medium and high
satisfaction) no significant differences among the academic groups were found. Satisfaction
with location was higher at time two .
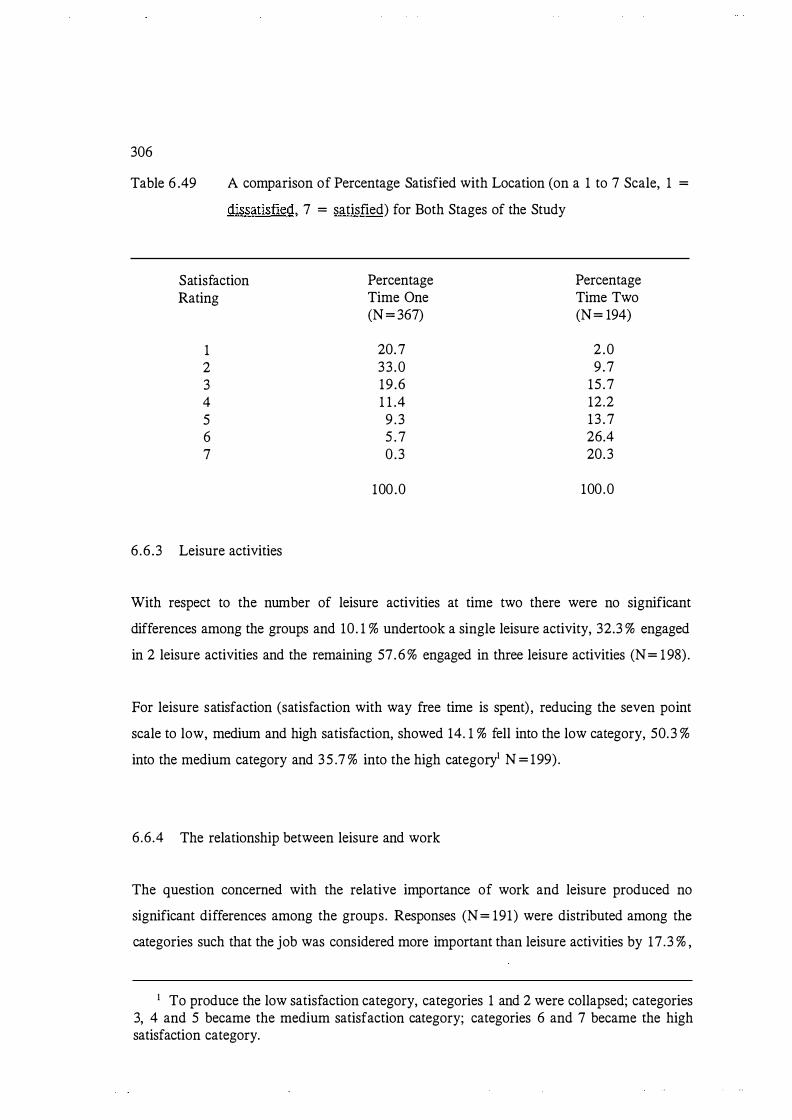
306
Table 6 .49 A comparison of Percentage Satisfied with Location (on a 1 to 7 Scale, 1 =
dissatisfied, 7 = satisfied) for Both Stages of the Study
Satisfaction Percentage Percentage Rating Time One Time Two
(N = 367) (N= 194)
1 20.7 2 .0 2 33 .0 9 .7 3 19 .6 15 .7 4 1 1 .4 12.2 5 9 . 3 1 3 .7 6 5 . 7 26.4 7 0 .3 20.3
100 .0 100 .0
6 .6 .3 Leisure activities
With respect to the number of leisure activities at time two there were no significant
differences among the groups and 10. 1 % undertook a single leisure activity, 32.3 % engaged
in 2 leisure activities and the remaining 57. 6 % engaged in three leisure activities (N = 1 98) .
For leisure satisfaction (satisfaction with way free time is spent) , reducing the seven point
scale to low, medium and high satisfaction, showed 14. 1 % fell into the low category, 50.3 %
into the medium category and 3 5 .7 % into the high category1 N = 199) .
6 .6 .4 The relationship between leisure and work
The question concerned with the relative importance of work and leisure produced no
significant differences among the groups. Responses (N = 191) were distributed among the
categories such that the job was considered more important than leisure activities by 17 .3 % ,
1 To produce the low satisfaction category, categories 1 and 2 were collapsed; categories 3, 4 and 5 became the medium satisfaction category; categories 6 and 7 became the high satisfaction category.
307
the job and leisure activities were considered to be of equal importance by 57.6 % and the job
was viewed as less important than leisure by 24.6 % with . 5 % regarding this question as not
applicable to them.
6 .6 .5 Subjective well-being
For subjective well-being at time one there were some differences among groups but only at
the .05 level . The Likelihood Ratio was 3 1 .73385 with 20 d.f. , p < .05 . Cramer's V was not
significant. Lambda with the Index of Well-Being at time one dependent was . 04348 .
Goodman and Kruskal 's tau was . 19616 (ASE = .06772) , p < .03413 , giving about a 20%
reduction in prediction error. Eta with the Index of Well-being at time one dependent was
.47466, thus giving a reasonable 100eta2 of 22.2 % .
The maximum index of well-being score was 14. The categories were collapsed such that 1
to 5 was recoded low well-being, 6 to 10 medium well-being, and 1 1 to 14 high well-being.
The largest percentage (72 .9%) fell into the medium well-being category, the next largest
percentage (22 .4%) into the high well-being category and the remaining percentage (4. 7 %)
into the low well-being group (N = 85).
The groups with a percentage falling into the low well-being category were Computer Science
( 16 .7%) , Accountancy (1 1 . 1 %) , Horticulture (5 %) and Technology (12 .5 %) . The academic
groups which had a percentage falling into the high well-being category were Sciences
(21 .4%) , Horticulture ( 45 %) , Humanities (20 %), Social Science ( 60 %) and Veterinary
Science (50% ) . Any differences seemed to lie in groups such as Veterinary Science and
Social Science where the largest percentage reported high well-being. For these groups, 60 %
of the Social Sciences and 50% of the Veterinary Sciences reported their subjective well-being
to be high which is in contrast to the 22.4% for the respondents overall .
At time two there were no significant differences among the groups with respect to well
being. However, as at time one, most rated themselves as experiencing a medium level of
well-being (78 . 0 % ) and a smaller percentage rated themselves as experiencing either higher
(8.5 %) or lower well-being ( 12 .8%) (N =47) .
308
Happiness
For happiness at stage two of the study no significant differences emerged among the
academic groups. Overall (N= 194) , 22.7% said they were very happy, 67.5 % said they were
pretty happy and 9 . 8 % said they were not too happy.
6.7 Differences and similarities among academic groups for Social Support Variables
The social support statements can be grouped into social support questions asked in a matrix
response format in relation to a number of people in different relationships with the
respondent. The other type of social support question asked for a Yes or No response rather
than using a rating category to do with how true the statement was for the respondent. The
matrix questions are discussed first .
The social support responses for the questions presented in matrix format were summarised
by grouping those statements which indicated the statements were true to some extent (either
very true, somewhat true or a little true) and those responses which indicated the statements
were not true for that individual (not too true, and not at all true) into two categories
respectively. A third category was that of the statement being not applicable to a respondent.
6 . 7. 1 Superficiality of social relationships
In relation to the statements like "My relationship with my wife/husband, girlfriend etc. is
pretty superficial" there were no significant differences among the groups for the relationships
reported in Table 6 .50 except for the relationship with the boss (the distributions of the sum
of the " true" "not true" categories are given) . Table 6 . 50 shows respondents regard their
relationships with their intimate friends, other friends , relatives and their workmates as not
superficial . However, the relationships with neighbours , and the boss tended to be rated as
superficial .
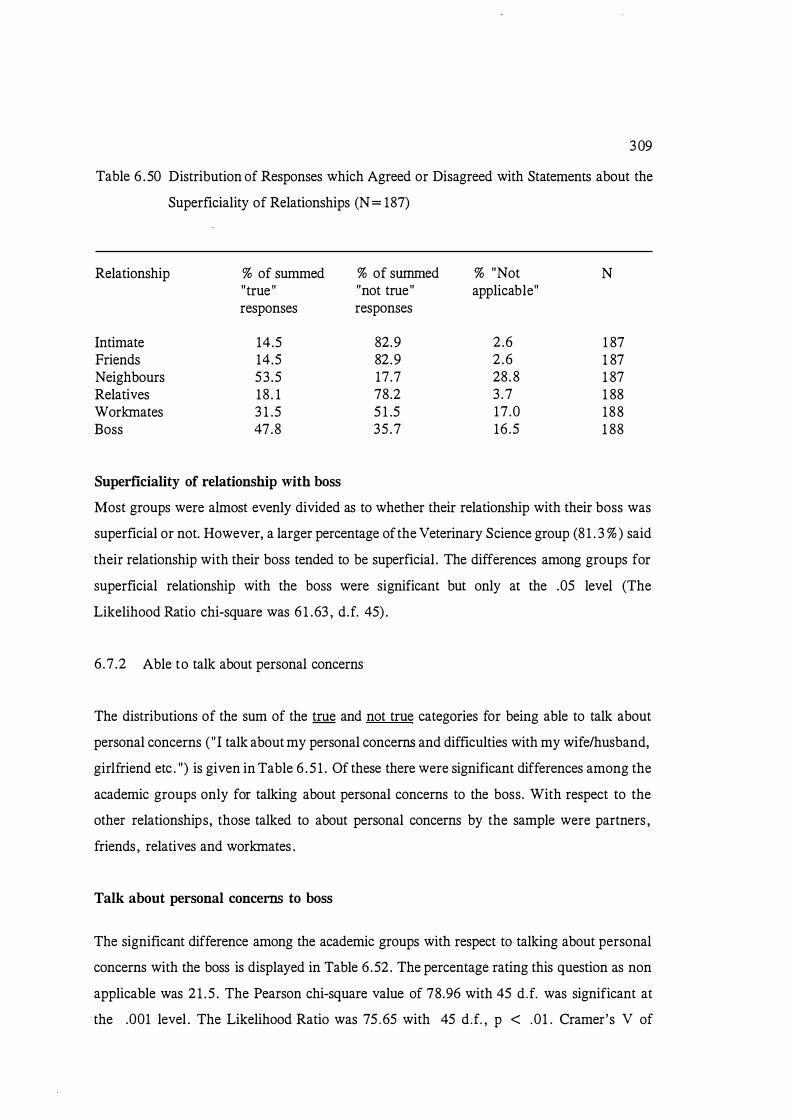
3 09
Table 6 . 50 Distribution of Responses which Agreed or Disagreed with Statements about the
Superficiality of Relationships (N = 187)
Relationship % of summed % of surnrned % "Not N "true" "not true" applicable" responses responses
Intimate 14.5 82.9 2 .6 1 87 Friends 14.5 82.9 2 .6 1 87 Neighbours 53 .5 17.7 28. 8 1 87 Relatives 18 . 1 78.2 3 .7 1 88 Workmates 3 1 .5 5 1 .5 17 .0 188 Boss 47.8 35 .7 16 .5 1 88
Superficiality of relationship with boss
Most groups were almost evenly divided as to whether their relationship with their boss was
superficial or not. However, a larger percentage of the Veterinary Science group (81 . 3 % ) said
their relationship with their boss tended to be superficial . The differences among groups for
superficial relationship with the boss were significant but only at the . 05 level (The
Likelihood Ratio chi-square was 6 1 .63 , d.f. 45) .
6 .7 .2 Able to talk about personal concerns
The distributions of the sum of the true and not true categories for being able to talk about
personal concerns ( "I talk about my personal concerns and difficulties with my wife/husband,
girlfriend etc . ") is given in Table 6 . 5 1 . Of these there were significant differences among the
academic groups only for talking about personal concerns to the boss. With respect to the
other relationships, those talked to about personal concerns by the sample were partners ,
friends , relatives and workmates .
Talk about personal concerns to boss
The significant difference among the academic groups with respect to talking about personal
concerns with the boss is displayed in Table 6 .52 . The percentage rating this question as non
applicable was 2 1 . 5 . The Pearson chi-square value of 78.96 with 45 d.f. was significant at
the .001 level . The Likelihood Ratio was 75 .65 with 45 d.f. , p < .01 . Cramer's V of
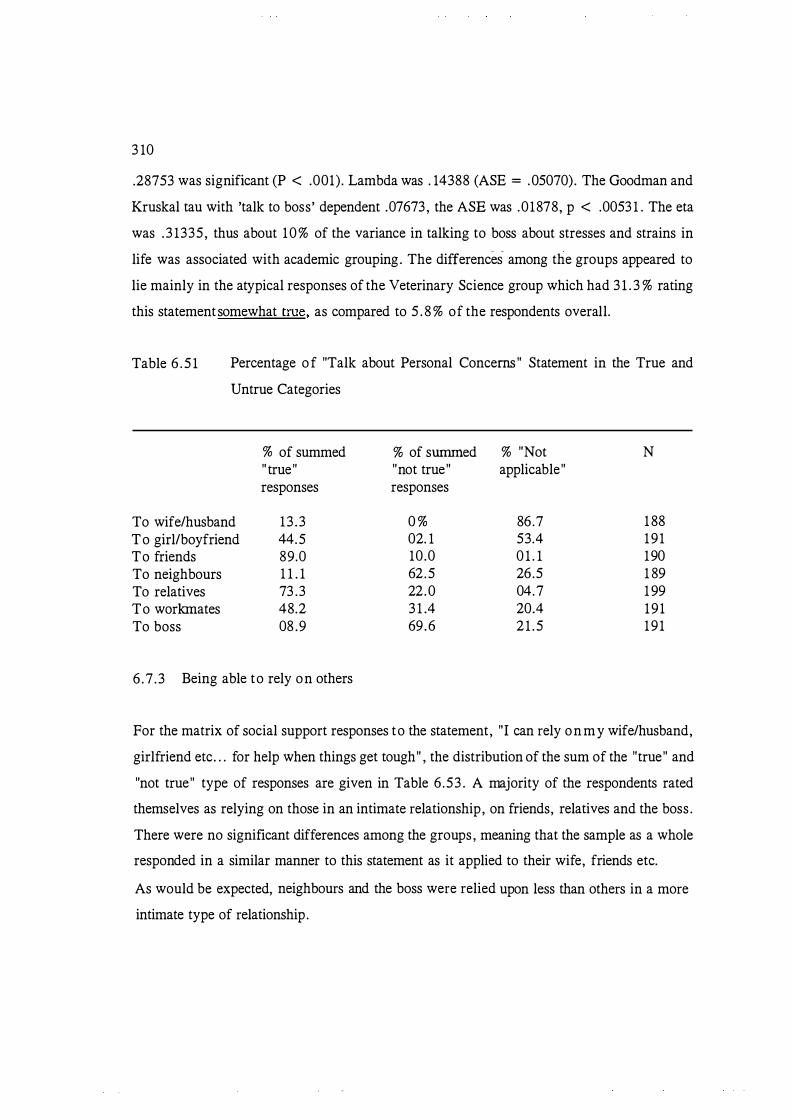
3 10
.28753 was significant (P < .001). Lambda was . 14388 (ASE = . 05070) . The Goodman and
Kruskal tau with 'talk to boss' dependent .07673 , the ASE was .01878, p < .0053 1 . The eta
was . 3 1335, thus about 10% of the variance in talking to boss about stresses and strains in
life was associated with academic grouping. The differences- among the groups appeared to
lie mainly in the atypical responses of the Veterinary Science group which had 3 1 . 3 % rating
this statement somewhat true, as compared to 5 . 8 % of the respondents overall.
Table 6 . 5 1 Percentage of "Talk about Personal Concerns" Statement in the True and
Untrue Categories
% of summed " true" responses
To wife/husband 13 . 3 To girl/boyfriend 44.5 To friends 89.0 To neighbours 1 1 . 1 To relatives 73 .3 To workmates 48.2 To boss 08 .9
6 .7 .3 Being able to rely on others
% of summed "not true" responses
0 % 02. 1 10.0 62.5 22.0 3 1 .4 69.6
% "Not applicable"
86.7 53.4 0 1 . 1 26.5 04.7 20.4 21 .5
N
1 88 191 190 1 89 1 99 191 191
For the matrix of social support responses to the statement, "I can rely on my wife/husband,
girlfriend etc . . . for help when things get tough" , the distribution of the sum of the "true" and
"not true" type of responses are given in Table 6 .53 . A majority of the respondents rated
themselves as relying on those in an intimate relationship, on friends, relatives and the boss .
There were no significant differences among the groups , meaning that the sample as a whole
responded in a similar manner to this statement as it applied to their wife, friends etc.
As would be expected, neighbours and the boss were relied upon less than others in a more
intimate type of relationship.

3 1 1
Table 6 .52 Degree to which Statements about Talking to the Boss were True for the
Academic Groups
Count Row Pet Col Pet
TALK TO BOSS I I VERY SOMEWHAT A LITTLE NOT TOO NOT AT I TRUE TRUE TRUE TRUE ALL TRUE I 1 1 2 1 3 1 4 1 5 1
GROUP - - - - - - - - + - - - - - - - - + - - - - - - - - + - - - - - - - - + - - - - - - - - + - - - - - - - - +
Sciences
Computer Science
Accountancy
Business Studies
Horticulture
Agriculture
Technology
Humanities
Social Sciences
Veterinary Science
1 1 I 1 1 6 1 9 1 7 1
2
I I 3 . 2 I 1 9 . 4 1 2 9 . o 1 2 2 . 6 1 I I 9 . 1 I 14 . 3 I 2 3 . 1 I 13 . 5 1
+ - - - - - - - - + - - - - - - - - + - - - - - - - - + - - - - - - - - + - - - - - - - - + I I 1 I 2 I 5 I 3 I I I 5 . 3 I 1o . 5 I 2 6 . 3 1 1 5 . 8 1 I I 9 . 1 I 4 . 8 1 12 . 8 1 5 . 8 1
+ - - - - - - - - + - - - - - - - - + - - - - - - - - + - - - - - - - - + - - - - - - - - + 3 I I I 7 I 3 I 17 I
I I I 2 3 . 3 I 10 . o 1 5 6 . 7 I I I I 16 . 7 I 7 . 7 1 3 2 . 7 1
+ - - - - - - - - + - - - - - - - - + - - - - - - - - + - - - - - - - - + - - - - - - - - + 4 1 1 1 I 2 1 3 1 2 1
I 11 . 1 I I 22 . 2 I 3 3 . 3 I 2 2 . 2 I I 16 . 7 I I 4 . 8 1 7 . 7 1 3 . 8 I
+ - - - - - - - - + - - - - - - - - + - - - - - - - - + - - - - - - - - + - - - - - - - - + 5 I 4 I 3 I 9 I 6 I 1 6 1
1 8 . o I 6 . o 1 18 . o 1 12 . 0 1 3 2 . o 1 I 6 6 . 7 1 2 7 . 3 1 21 . 4 1 15 . 4 1 3 o . 8 1
+ - - - - - - - - + - - - - - - - - + - - - - - - - - + - - - - - - - - + - - - - - - - - + 6 I I I 3 1 1 1
I I I 42 . 9 14 . 3 14 . 3 1 I I I 7 . 1 I 2 . 6 I 1 . 9 I
+ - - - - - - - - + - - - - - - - - + - - - - - - - - + - - - - - - - - + - - - - - - - - + 7 I 1 I I I 2 I 1 I
I 2 5 . o I I I 5 o . o I 2 5 . o I I 16 . 7 I I I 5 . 1 I 1 . 9 I
+ - - - - - - - - + - - - - - - - - + - - - - - - - - + - - - - - - - - + - - - - - - - - + 8 I I I 5 I 3 I 2 I
I I I 3 8 . 5 I 2 3 . 1 1 1 5 . 4 1 I I I 11 . 9 I 7 . 7 I 3 . 8 I
+ - - - - - - - - + - - - - - - - - + - - - - - - - - + - - - - - - - - + - - - - - - - - + 9 1 I 1 1 2 1 3 1 3 1
I I 8 . 3 I 16 . 7 I 2 5 . o 1 2 5 . o 1 I I 9 . 1 I 4 . 8 I 7 . 7 I 5 . 8 I
+ - - - - - - - - + - - - - - - - - + - - - - - - - - + - - - - - - - - + - - - - - - - - + 10 I I 5 I 6 I 4 I I
I I 3 1 . 3 I 3 7 . 5 1 2 5 . o 1 1 I 1 4 5 . 5 1 14 . 3 1 10 . 3 1 1
+ - - - - - - - - + - - - - - - - - + - - - - - - - - + - - - - - - - - + - - - - - - - - + Column
Total 6 11 42 39 52
3 . 1 5 . 8 22 . 0 2 0 . 4 2 7 . 2
Row Total
3 1 1 6 . 2
19 9 . 9
3 0 1 5 . 7
9 4 . 7
5 0 2 6 . 2
7 3 . 7
4 2 . 1
1 3 6 . 8
12 6 . 3
16 8 . 4
1 9 1 10 0 . 0
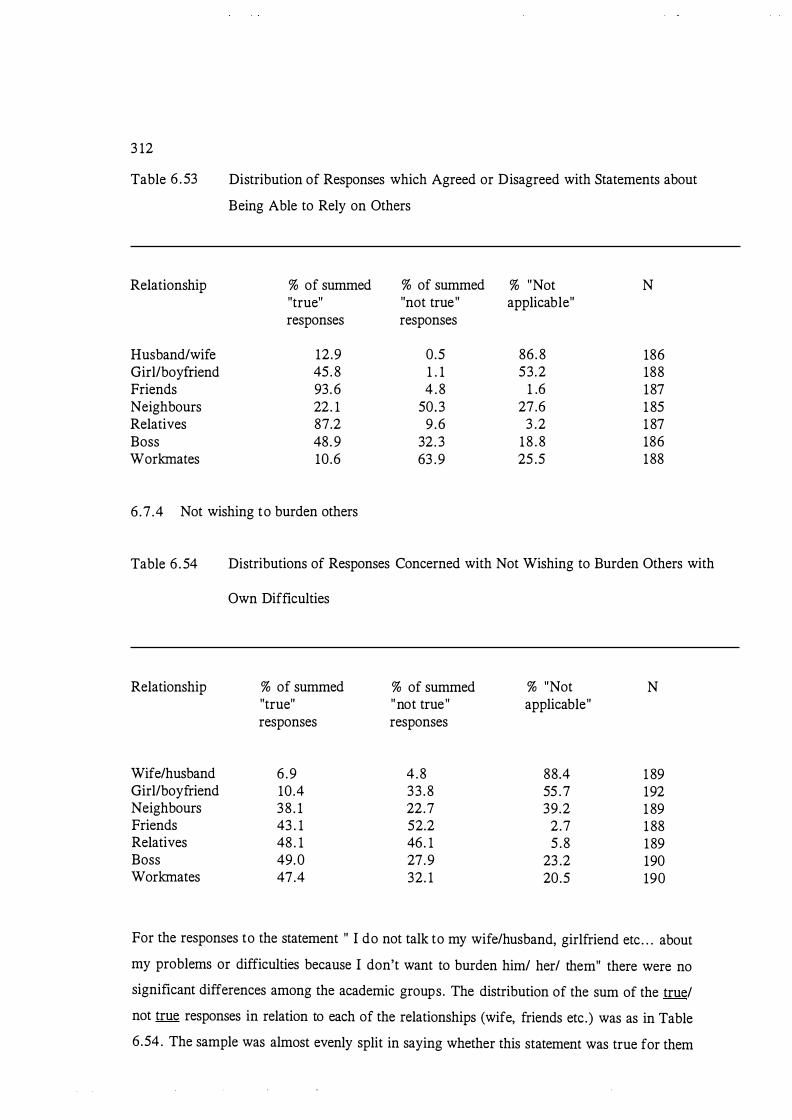
3 12
Table 6 . 53
Relationship
Husband/wife Girl/boyfriend Friends Neighbours Relatives Boss Workmates
Distribution of Responses which Agreed or Disagreed with Statements about
Being Able to Rely on Others
% of summed % of summed "true" "not true" responses responses
12.9 0.5 45. 8 1 . 1 93 . 6 4 . 8 22. 1 50.3 87.2 9 .6 48. 9 32. 3 10.6 63 .9
% "Not applicable"
86. 8 53 .2
1 .6 27.6
3 .2 18 . 8 25 .5
N
186 188 187 1 85 1 87 186 188
6 .7 .4 Not wishing to burden others
Table 6 . 54 Distributions of Responses Concerned with Not Wishing to Burden Others with
Own Difficulties
Relationship % of summed % of summed % "Not N "true" "not true" applicable" responses responses
Wife/husband 6 .9 4 .8 88.4 1 89 Girl/boyfriend 10.4 33 .8 55 .7 192 Neighbours 38 . 1 22.7 39.2 1 89 Friends 43 . 1 52.2 2.7 1 88 Relatives 48 . 1 46. 1 5 .8 189 Boss 49.0 27.9 23 .2 190 Workmates 47.4 32. 1 20.5 190
For the responses to the statement " I do not talk to my wife/husband, girlfriend etc . . . about
my problems or difficulties because I don't want to burden him/ her/ them" there were no
significant differences among the academic groups. The distribution of the sum of the true/
not true responses in relation to each of the relationships (wife, friends etc.) was as in Table
6.54 . The sample was almost evenly split in saying whether this statement was true for them
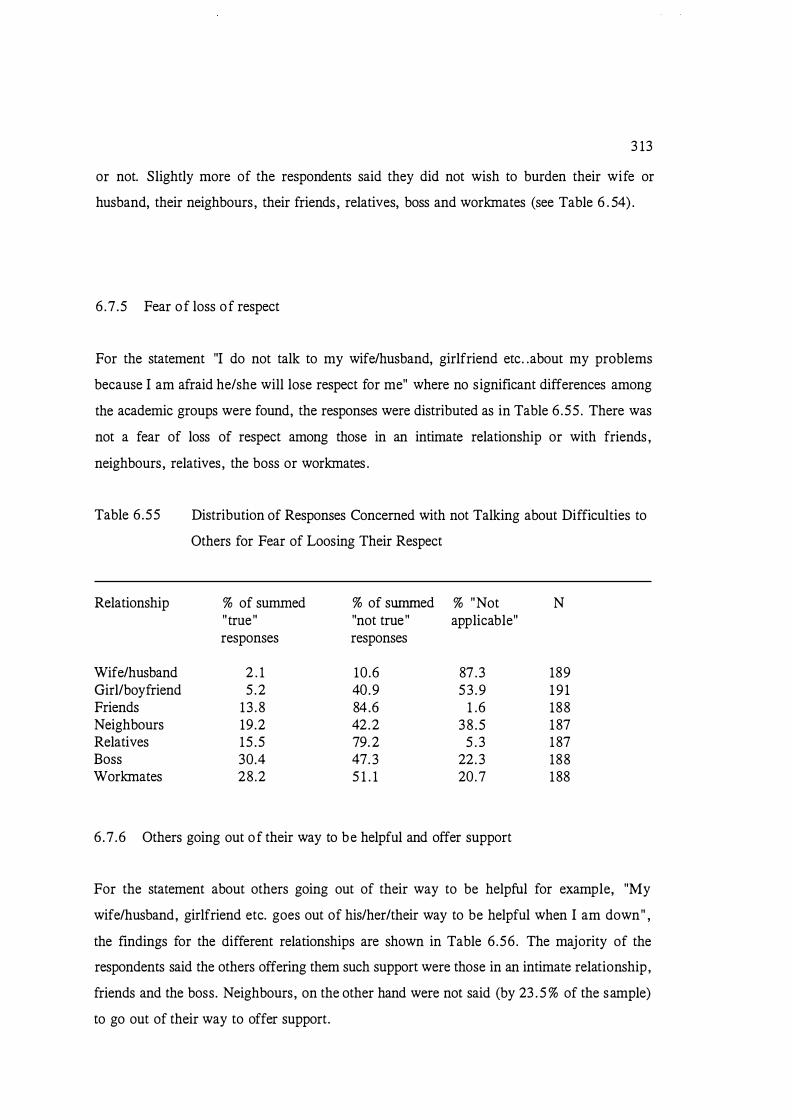
3 13
or not. Slightly more of the respondents said they did not wish to burden their wife or
husband, their neighbours, their friends , relatives, boss and workmates (see Table 6 . 54) .
6 . 7 .5 Fear of loss of respect
For the statement "I do not talk to my wife/husband, girlfriend etc . . about my problems
because I am afraid he/she will lose respect for me" where no significant differences among
the academic groups were found, the responses were distributed as in Table 6 .55 . There was
not a fear of loss of respect among those in an intimate relationship or with friends ,
neighbours, relatives, the boss or workmates .
Table 6 .55
Relationship
Wife/husband Girl/boyfriend Friends Neighbours Relatives Boss Workmates
Distribution of Responses Concerned with not Talking about Difficulties to
Others for Fear of Loosing Their Respect
% of summed % of summed % "Not N "true" "not true" applicable" responses responses
2 . 1 10.6 87 .3 189 5 .2 40.9 53 .9 191
13 .8 84.6 1 .6 188 19.2 42.2 38 .5 187 15 .5 79. 2 5 . 3 187 30.4 47. 3 22. 3 188 28.2 5 1 . 1 20.7 188
6 .7 .6 Others going out of their way to be helpful and offer support
For the statement about others going out of their way to be helpful for example, "My
wife/husband, girlfriend etc. goes out of his/her/their way to be helpful when I am down" ,
the findings for the different relationships are shown in Table 6 .56. The majority of the
respondents said the others offering them such support were those in an intimate relationship,
friends and the boss. Neighbours, on the other hand were not said (by 23 . 5 % of the sample)
to go out of their way to offer support.
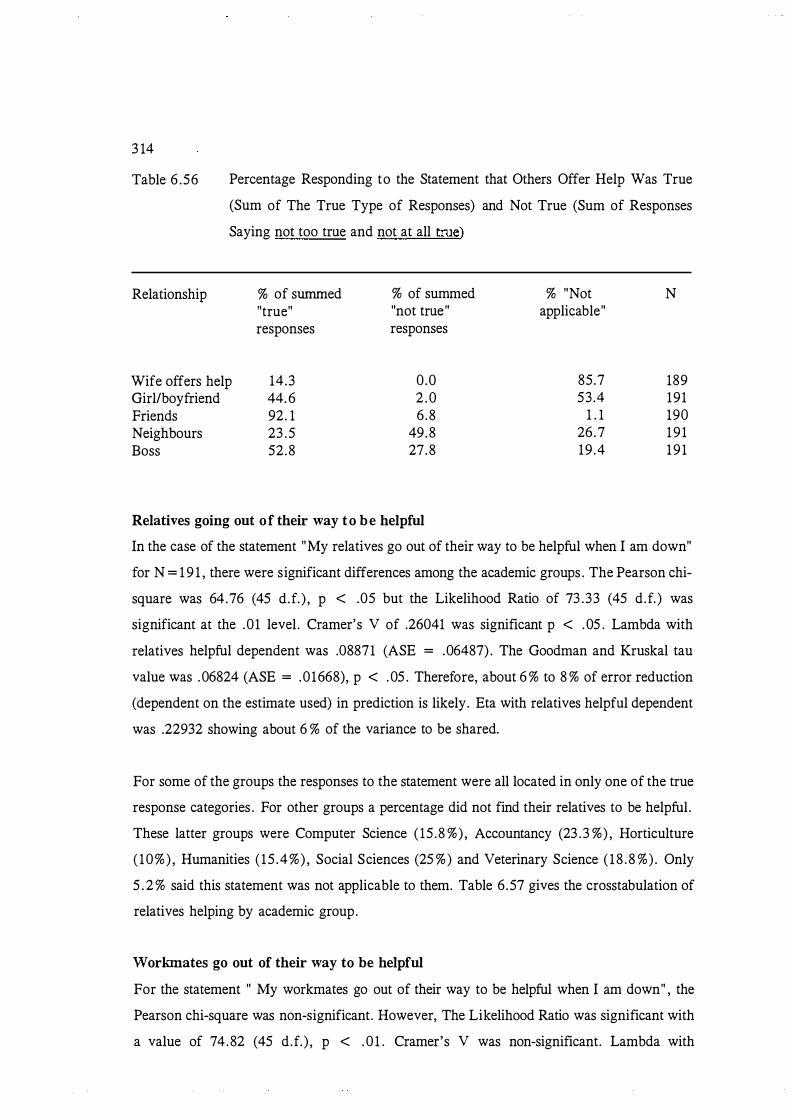
3 14
Table 6 .56 Percentage Responding to the Statement that Others Offer Help Was True
(Sum of The True Type of Responses) and Not True (Sum of Responses
Saying not too true and not at all true)
Relationship % of summed % of summed % "Not N "true" "not true" applicable" responses responses
Wife offers help 14.3 0 .0 85.7 189 Girl/boyfriend 44. 6 2 . 0 53 .4 191 Friends 92. 1 6 .8 1 . 1 190 Neighbours 23 .5 49.8 26.7 191 Boss 52.8 27.8 19 .4 191
Relatives going out of their way to be helpful
In the case of the statement "My relatives go out of their way to be helpful when I am down"
for N = 1 9 1 , there were significant differences among the academic groups . The Pearson chi
square was 64.76 (45 d.f. ) , p < .05 but the Likelihood Ratio of 73 .33 (45 d.f. ) was
significant at the .01 level . Cramer's V of .26041 was significant p < .05 . Lambda with
relatives helpful dependent was .08871 (ASE = .06487) . The Goodman and Kruskal tau
value was .06824 (ASE = .01668), p < .05 . Therefore, about 6 % to 8 % of error reduction
(dependent on the estimate used) in prediction is likely. Eta with relatives helpful dependent
was .22932 showing about 6 % of the variance to be shared.
For some of the groups the responses to the statement were all located in only one of the true
response categories . For other groups a percentage did not find their relatives to be helpful.
These latter groups were Computer Science ( 15 .8 %) , Accountancy (23 . 3 %) , Horticulture
( 10%) , Humanities ( 15 .4%) , Social Sciences (25 %) and Veterinary Science ( 18 .8 %) . Only
5 . 2 % said this statement was not applicable to them. Table 6 .57 gives the crosstabulation of
relatives helping by academic group.
Workmates go out of their way to be helpful
For the statement " My workmates go out of their way to be helpful when I am down" , the
Pears on chi-square was non-significant. However, The Likelihood Ratio was significant with
a value of 74.82 (45 d.f. ) , p < . 0 1 . Cramer's V was non-significant. Lambda with
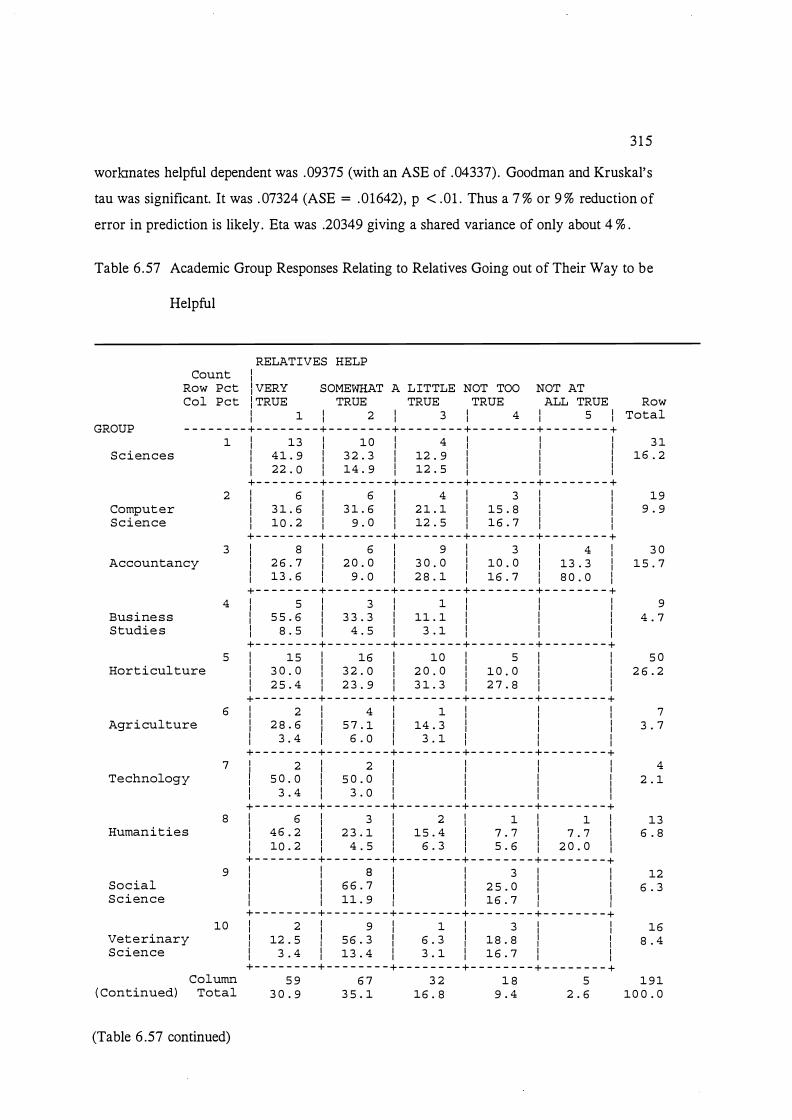
3 1 5
worlanates helpful dependent was .09375 (with an ASE of .04337) . Goodman and Kruskal's
tau was significant. It was . 07324 (ASE = .01642), p < .01 . Thus a 7 % or 9 % reduction of
error in prediction is likely. Eta was .20349 giving a shared variance of only about 4 % .
Table 6 .57 Academic Group Responses Relating to Relatives Going out of Their Way to be
Helpful
RELATIVES HELP Count I
Row Pet J VERY SOMEWHAT A LITTLE NOT TOO NOT AT Col Pet I TRUE TRUE TRUE TRUE ALL TRUE Row
I 1 I 2 I 3 I 4 I 5 I Total GROUP - - - - - - - - + - - - - - - - - + - - - - - - - - + - - - - - - - - + - - - - - - - - + - - - - - - - - +
Sciences
Computer Science
Accountancy
Business Studie s
Horticulture
Agriculture
Technology
Humanities
Social Science
Veterinary Science
1
2
3
4
5
6
7
8
9
10
Column ( Continued) Total
(Table 6 .57 continued)
I 13 I 1o I 4 I I I 3 1 I 41 . 9 I 3 2 . 3 I 12 . 9 I 1 I 16 . 2 1 22 . 0 1 14 . 9 1 12 . 5 1 1 1 + - - - - - - - - + - - - - - - - - + - - - - - - - - + - - - - - - - - + - - - - - - - - + I 6 I 6 I 4 I 3 I I 19 I 3 1 . 6 I 3 1 . 6 I 2 1 . 1 1 15 . 8 1 1 9 . 9 1 10 . 2 1 9 . o 1 12 . 5 1 1 6 . 7 1 1
+ - - - - - - - - + - - - - - - - - + - - - - - - - - + - - - - - - - - + - - - - - - - - + I 8 I 6 I 9 I 3 I 4 I 3 o I 2 6 . 7 I 2 o . o I 3 o . o I 1o . o 1 13 . 3 1 1 5 . 7 I 13 . 6 I 9 . o I 2 8 . 1 I 16 . 7 1 8 o . o 1 + - - - - - - - - + - - - - - - - - + - - - - - - - - + - - - - - - - - + - - - - - - - - + I 5 I 3 I 1 I I I 9 I 5 5 . 6 I 3 3 . 3 I 11 . 1 I 1 1 4 . 7 I 8 . 5 I 4 . 5 I 3 . 1 I I I
+ - - - - - - - - + - - - - - - - - + - - - - - - - - + - - - - - - - - + - - - - - - - - + I 15 I 16 I 10 I 5 1 1 5 o I 3 o . o I 3 2 . o I 2 o . o I 1 o . o 1 1 2 6 . 2 I 2 5 . 4 I 2 3 . 9 I 3 1 . 3 1 2 7 . 8 1 1
+ - - - - - - - - + - - - - - - - - + - - - - - - - - + - - - - - - - - + - - - - - - - - + I 2 I 4 I 1 I I I 1 I 2 8 . 6 I 5 7 . 1 I 14 . 3 1 1 1 3 . 7 I 3 . 4 I 6 . o I 3 . 1 1 1 1
+ - - - - - - - - + - - - - - - - - + - - - - - - - - + - - - - - - - - + - - - - - - - - + I 2 I 2 I I I I 4 I 5 o . o I 5 o . o I 1 1 1 2 . 1 I 3 . 4 I 3 . o I I I I
+ - - - - - - - - + - - - - - - - - + - - - - - - - - + - - - - - - - - + - - - - - - - - + I 6 I 3 I 2 l 1 I 1 1 13 I 46 . 2 I 2 3 . 1 I 15 . 4 1 7 . 1 1 7 . 1 l 6 . 8 I 10 . 2 I 4 . 5 I 6 . 3 1 5 . 6 1 2 o . o 1
+ - - - - - - - - + - - - - - - - - + - - - - - - - - + - - - - - - - - + - - - - - - - - + I I 8 I I 3 I I 12 I I 6 6 . 7 I I 2 5 . o 1 1 6 . 3 I I 11 . 9 I I 16 . 7 I I + - - - - - - - - + - - - - - - - - + - - - - - - - - + - - - - - - - - + - - - - - - - - + I 2 I 9 I 1 I 3 1 1 16 I 12 . 5 I 5 6 . 3 I 6 . 3 1 1 8 . 8 1 l 8 . 4 I 3 . 4 I 13 . 4 1 3 . 1 1 1 6 . 7 1 1 + - - - - - - - - + - - - - - - - - + - - - - - - - - + - - - - - - - - + - - - - - - - - +
5 9 6 7 3 2 1 8 5 1 9 1 3 0 . 9 3 5 . 1 16 . 8 9 . 4 2 . 6 10 0 . 0
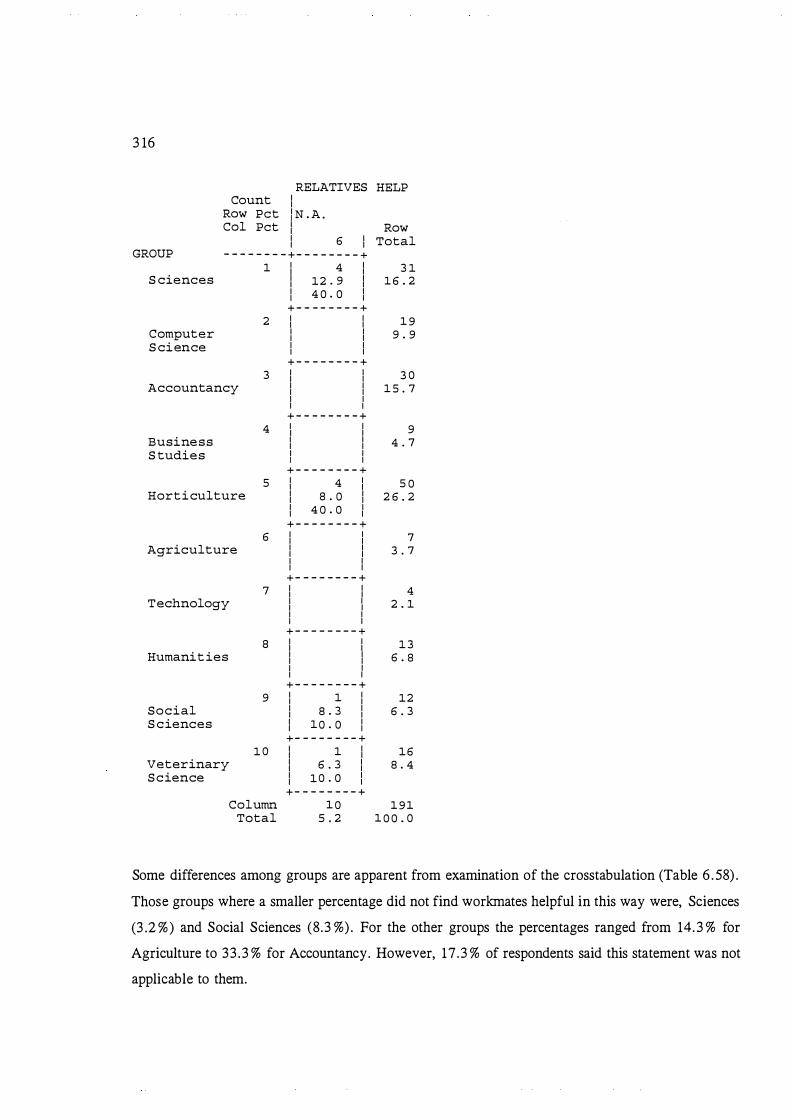
3 16
RELATIVES HELP Count I I
Row Pet I N . A . Col Pet I Row I I 6 I Total I I
GROUP - - - - - - - - + - - - - - - - - + 1 I 4 I 3 1 I
S ciences 12 . 9 I 1 6 . 2 I I I 4 0 . 0 I I I + - - - - - - - - +
2 I I 1 9 I I Computer I I 9 . 9 I I S cience I I I I
+ - - - - - - - - + 3 I I 3 0 I I
Accountancy I I 1 5 . 7 I I I I I I + - - - - - - - - +
4 I I 9 I I Business I I 4 . 7 I I S tudies I I I
+ - - - - - - - - + 5 I 4 I 5 0 I I
Horticulture I 8 . 0 I 2 6 . 2 I I I 4 0 . 0 I I I + - - - - - - - - +
6 I I 7 I I Agriculture I I 3 . 7 I I I I I I
+ - - - - - - - - + 7 I I 4 I I
Technology I I 2 . 1 I I I I I I + - - - - - - - - +
8 I I 1 3 I I Humanities I I 6 . 8 I I I I I I
+ - - - - - - - - + 9 I 1 I 12 I I
Social I 8 . 3 I 6 . 3 I I S ciences I 10 . 0 I I I
+ - - - - - - - - + 1 0 I 1 I 16 I I
Veterinary I 6 . 3 I 8 . 4 I I Science I 10 . 0 I I I
+ - - - - - - - - + Column 1 0 191
Total 5 . 2 1 0 0 . 0
Some differences among groups are apparent from examination of the crosstabulation (Table 6 . 58) .
Those groups where a smaller percentage did not find workmates helpful in this way were, Sciences
(3 .2 %) and Social Sciences (8.3 %) . For the other groups the percentages ranged from 14. 3 % for
Agriculture to 33 .3 % for Accountancy. However, 17 .3 % of respondents said this statement was not
applicable to them.

Table 6 .58 Academic Group Differences for Workmates Helping
Count Row Pet Col Pet
WORKMATES HELPING I ! VERY SOMEWHAT A LITTLE NOT TOO NOT AT I TRUE TRUE TRUE TRUE ALL TRUE I 1 1 2 1 3 1 4 1 S I
GROUP - - - - - - - - + - - - - - - - - + - - - - - - - - + - - - - - - - - + - - - - - - - - + - - - - - - - - +
Sciences
Computer Science
Accountancy
Business Studies
Horticulture
Agriculture
Technology
Humanities
Social Sciences
Veterinary Science
1 I 4 I 12 I 6 I 1 I 1 1 12 . 9 1 3 8 . 7 1 19 . 4 1 3 . 2 1 1 1 1 7 . 4 1 19 . o 1 15 . 4 1 3 . 8 1 1
+ - - - - - - - - + - - - - - - - - + - - - - - - - - + - - - - - - - - + - - - - - - - - + 2 1 I 7 1 2 1 3 1 1
I 1 3 6 . 8 I 1o . s 1 1s . 8 s . 3 1 I I 11 . 1 I 5 . 1 I 11 . 5 I 14 . 3 I
+ - - - - - - - - + - - - - - - - - + - - - - - - - - + - - - - - - - - + - - - - - - - - + 3 I 4 1 4 1 1 1 1 7 I 3 1
I 13 . 3 I 13 . 3 I 3 6 . 7 I 2 3 . 3 I 1o . o I 1 17 . 4 1 6 . 3 I 2 8 . 2 1 2 6 . 9 I 42 . 9 I
+ - - - - - - - - + - - - - - - - - + - - - - - - - - + - - - - - - - - + - - - - - - - - + 4 I I 6 I 2 I I I
1 1 66 . 7 1 22 . 2 1 I 1 I I 9 . s I s . 1 I I I
+ - - - - - - - - + - - - - - - - - + - - - - - - - - + - - - - - - - - + - - - - - - - - + s 1 s 1 1 7 I 10 I 7 I 2 I
1 1 o . o 1 34 . o I 2 o . o I 14 . o I 4 . o I 1 2 1 . 7 1 2 7 . o 1 2 s . 6 1 26 . 9 I 2 8 . 6 I
+ - - - - - - - - + - - - - - - - - + - - - - - - - - + - - - - - - - - + - - - - - - - - + 6 I 1 I 3 I I 1 I I
I 14 . 3 I 42 . 9 I I 14 . 3 I I I 4 . 3 I 4 . 8 I I 3 . 8 I I
+ - - - - - - - - + - - - - - - - - + - - - - - - - - + - - - - - - - - + - - - - - - - - + 7 1 1 1 1 1 1 1 1 1 I
I 2 s . o 1 2 s . o 1 2 s . o I 2 s . o I I I 4 . 3 I 1 . 6 I 2 . 6 I 3 . a I I + - - - - - - - - + - - - - - - - - + - - - - - - - - + - - - - - - - - + - - - - - - - - +
8 I 3 I 3 I I 3 I I 1 2 3 . 1 1 23 . 1 I I 2 3 . 1 I I I 13 . o 1 4 . 8 I I 11 . s I I
+ - - - - - - - - + - - - - - - - - + - - - - - - - - + - - - - - - - - + - - - - - - - - + 9 I 2 I 7 I I 1 I I
1 16 . 7 1 s a . 3 I I 8 . 3 I I 1 8 . 7 1 11 . 1 I I 3 . 8 I I
+ - - - - - - - - + - - - - - - - - + - - - - - - - - + - - - - - - - - + - - - - - - - - + 10 1 3 1 3 I 7 I 2 I 1 I
1 1 8 . 8 1 18 . 8 1 4 3 . a 1 12 . s I 6 . 3 1 1 13 . o 1 4 . 8 1 17 . 9 1 7 . 7 I 14 . 3 1
+ - - - - - - - - + - - - - - - - - + - - - - - - - - + - - - - - - - - + - - - - - - - - +
( Continued) Column
Total 23 63 3 9 2 6 7
12 . 0 3 3 . 0 2 0 . 4 13 . 6 3 . 7
(Table 6 .58 continued)
3 17
Row Total
3 1 1 6 . 2
19 9 . 9
3 0 15 . 7
9 4 . 7
s o 2 6 . 2
7 3 . 7
4 2 . 1
13 6 . 8
12 6 . 3
16 8 . 4
1 9 1 1 0 0 . 0
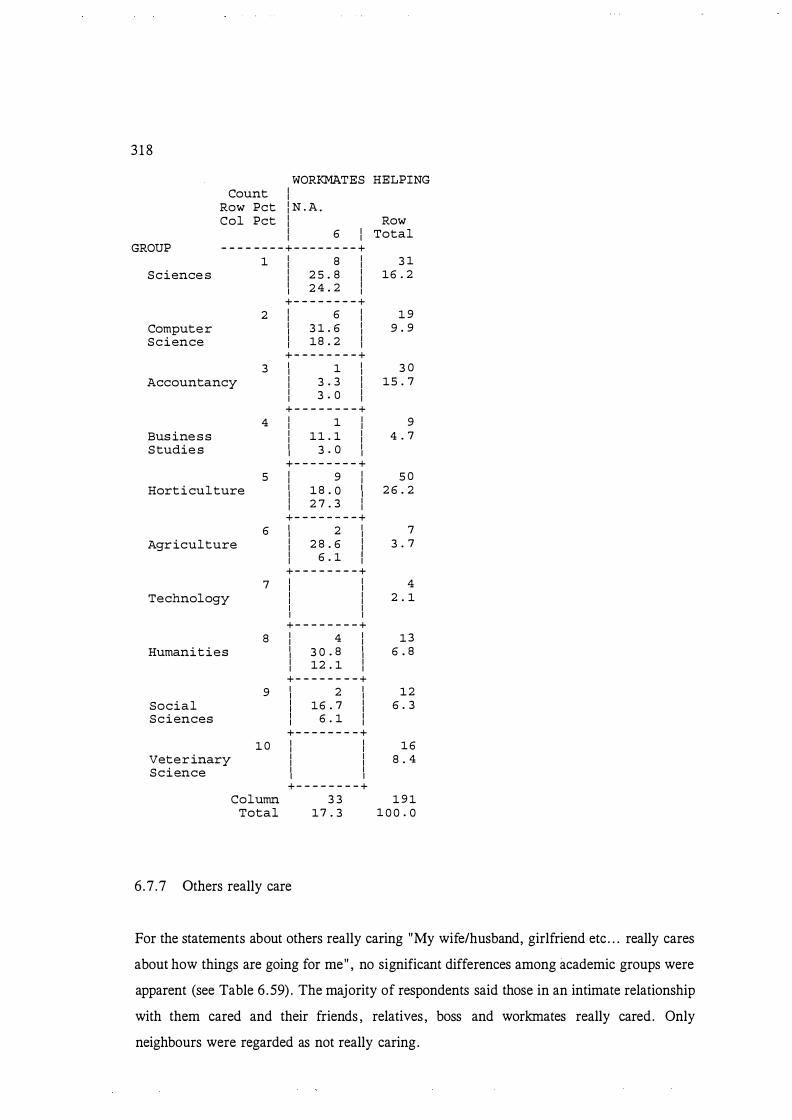
3 1 8
WORKMATES HELPING Count I I
Row Pet j N . A . Col Pet I Row I I 6 I Total I I
GROUP - - - - - - - - + - - - - - - - - + 1 I 8 I 3 1 I I
Science s I 2 5 . 8 I 16 . 2 I I I 2 4 . 2 I I I + - - - - - - - - +
2 I 6 I 1 9 I I Computer I 3 1 . 6 I 9 . 9 I I Science I 18 . 2 I I I
+ - - - - - - - - + 3 I 1 I 3 0 I I
Accountancy I 3 . 3 I 15 . 7 I I I 3 . 0 I I I + - - - - - - - - +
4 I 1 I 9 I I Business I 11 . 1 I 4 . 7 I I Studie s I 3 . 0 I I I
+ - - - - - - - - + 5 I 9 I 5 0 I I
Horticulture I 1 8 . 0 I 2 6 . 2 I I I 2 7 . 3 I I I + - - - - - - - - +
6 I 2 I 7 I I Agriculture I 2 8 . 6 I 3 . 7 I I I 6 . 1 I I
+ - - - - - - - - + 7 I I 4 I I
Technology I I 2 . 1 I I I I I I + - - - - - - - - +
8 I 4 I 13 I I Humanities I 3 0 . 8 I 6 . 8 I I I 12 . 1 I I I
+ - - - - - - - - + 9 I 2 I 12 I I
Social I 16 . 7 I 6 . 3 I I Sciences I 6 . 1 I I I
+ - - - - - - - - + 1 0 I I 16 I I
Veterinary I I 8 . 4 I I Science I I I I
+ - - - - - - - - + Column 3 3 1 9 1
Total 17 . 3 1 0 0 . 0
6.7 .7 Others really care
For the statements about others really caring "My wife/husband, girlfriend etc . . . really cares
about how things are going for me" , no significant differences among academic groups were
apparent (see Table 6 .59) . The majority of respondents said those in an intimate relationship
with them cared and their friends , relatives , boss and workmates really cared. Only
neighbours were regarded as not really caring.

Table 6 .59 Academic Group Responses to the Statement that Others Really Care
Relationship
Wife/husband cares Girl/boyfriend Friend Neighbours Relatives Boss Workmates
% of summed "true" responses
13 .8 44.5 97.4 33.2 92.2 72.0 74.8
6 . 7 . 8 Other social support statements
% of summed % "Not "not true" applicable" responses
0 .0 86.2 1 .0 54.5 1 .6 1 .0
42.6 24.2 6 .8 1 .0
12.6 15 .4 8 .9 16 .3
3 19
N
189 191 1 9 1 190 191 190 191
For the following social support questions (with Yes/No response alternatives) there were no
significant differences among the academic groups. The statement " I have someone to talk to
about any personal problems" had 9 1 . 0% agree with this but 8. 3 % say they had no such
social support (N = 193). For the statement "I prefer to keep my worries and my problems
to myself" , 56 . 0 % said "yes " to this and 44.0% said "no " (N = 191) . In response to the
statement "I have someone other than my wife/husband/girlfriend/boyfriend with whom I can
talk about things that bother me" 83 . 9 % agreed and 16 . 1 % disagreed (N = 193). The greater
percentage appeared to have social support beyond that found in their most intimate
relationships . For the statement " I usually talk personal problems through with at least one
other person" 7 1 .5 % agreed with the statement and 28. 5 % (N = 193) said they did not talk
over problems with another person. In response to the statement "I have a number of friends
in the community where I live" 56.0% said this statement was true for them while 44. 0 %
(N = 193) said they did not have such friends . For the statement " I have friends who would
be willing to give me a hand with household tasks and projects " of the 191 responding to this
question 86.4 % said they did have friends who would do this and 13 . 6% said they did not.
For the statement "I have friends who would lend me money if I needed it" of the 192,
9 1 . 7 % said "yes " and 8 .3 % said "no " .
320
6 .8 Summary
In the case of the work adjustment variables correspondence between work needs and
reinforcers occurred in most cases . Social status need-reinforcer correspondence occurred for
the Accountancy, Business Studies and Computer Science groups. However, Social Sciences
and the Sciences group tended to have their social status work needs met to a lesser extent
than did the sample overall . The job satisfaction findings identified those areas expected to
be less satisfying in the early stage of employment, areas such as authority, recognition and
social status satisfaction. The tenure related measures had indicated students expected to
remain in their jobs for a shorter time than others in the same position and they expected to
remain about two years .
A higher level of self-efficacy was evident at stage two of the study with the most frequently
used categories being 6 , 7 and 8 at the extremely confident end of the scale. Only
Accountancy and Horticulture showed low self-efficacy and that was in relation to their work
fitting into their lifestyle. The same academic groups tended to demonstrate higher self
efficacy for each of the different work need items. They were the Veterinary group,
Humanities , Technology, Sciences, Accountancy, Computer Science and Horticulture. These
same groups reported a higher level of well-being with Veterinary Scientists and the Social
Sciences groups reporting the highest level of well-being.
Of the quality of life measures as represented by the satisfaction domains , respondents were
most satisfied with accommodation, their health, the amount and usefulness of their education
and their job , followed by being satisfied with their location, with neighbours, friendships,
intimate relationships , family life and homemaking. Of all the satisfaction domains
respondents were the least satisfied with their savings . The importance of the same quality
of life measures showed health and friendship to rate the highest followed by location,
accommodation, the New Zealand way of life, the amount of education, intimate relationships
and family life, all rated a '2 ' . Savings and housework were all rated less important again,
'3 ' and '4 ') .
With respect to the social support variables , the larger percentage reported having someone
to talk to . With superficiality of relationships, a greater percentage rated their intimate
relationships and friendships and relationships with relatives as non-superficial . However,

321
more regarded their relationships with neighbours and the boss as superficial. Respondents
tended to talk about personal concerns to friends, relatives and to a lesser extent, workmates
(Table 6 .5 1) . The Veterinary Scientists reported talking to their bosses more. Individuals
relied most on their friends, both intimate and other. Individuals felt able to rely upon their
friends most of all . A slight majority of respondents were not as concerned to burden friends
with their difficulties , they tended to fear a loss of respect if they talked about their
difficulties, and believed most individuals will offer support. Neighbours were thought to
really care least of all . Overall respondents tended to rate neighbours as the least supportive
(as based on all of the social support statements) followed by the boss and sometimes
workmates . Those usually rated as being supportive were those in an intimate relationship,
friends and relatives .
Although a slight majority did burden their contacts with their difficulties , this of course
means that the other half did have such fears . More than half tended not to be concerned that
talking about problems would bring disrespect upon themselves . However, the other half did
have such concerns. The people viewed as going out of their way to offer support were
mainly friends and those in an intimate relationship and, to a lesser extent, bosses . Some
groups did not find relatives to be helpful. Workmates were found to be helpful and
supportive less so for the Science and Social Science groups. Friends, intimate friends and
relatives were viewed as really caring and a reasonable percentage (74. %) rated workmates
and the boss (72 .0%) as caring. A large percentage (83 .9%) had individuals other than those
with whom they were in an intimate relationship to whom they could talk. A high percentage
had friends who would help them with household tasks (86 .4%) and lend them money
(91 .7 % ) . Overall more respondents rated job and leisure to be of equal importance.
From examining the intercorrelations of the expanded model, the self-efficacy measures
appear to have a role to play even if only a limited one because of their small degree of
association with other variables in the Dawis and Lofquist work adjustment model . On the
basis of the sizes of correlations, many of the additional variables correlate to an equal or
greater extent than the variables of Dawis and Lofquist's model . Of particular note (see Table
6 . 37) are the Personal Competence, well-being, job importance, leisure satisfaction, social
reference group, job fits lifestyle, and general adjustment to places and locations , measures .
These intercorrelations and others of this chapter are explored in chapter seven in a more
formal manner through investigating the specific research hypotheses .

CHAPTER SEVEN
RESULTS: RESEARCH PROPOSITIONS AND HYPOTHESES
7 . 1 Dawis and Lofquist's individual propositions
The aspects of Dawis and Lofquist' s work adjustment theory examined related to individuals '
needs , reinforcers , level of satisfaction, satisfactoriness and tenure. The propositions
investigated in the present study grouped again as in chapter five section 5 . 2 . 1 , are those
concerned mainly with job satisfaction (propositions m, VII and XIV), those concerned
mainly with moderating relationships (propositions V and XII) and those concerned with job
satisfaction and satisfactoriness together (propositions I, VIII and XVII), as shown in Figure
7 . 1 . The statistical analyses included multiple regression and MANOV A using the Statistical
Package for Social Sciences , version X (SPSSx) .
7 . 1 . 1 Proposition Ill
Proposition Ill, "Satisfaction is a function of the correspondence between the reinforcer
pattern of the work environment and the individual 's values, provided that the individual' s
abilities correspond to the ability requirements of the work environment" , was investigated.
It is a particularly important proposition in any exploration of Dawis and Lofquist 's theory
of work adjustment because it is the one much of their own research and the research of
others has been focused upon.
In the measurement of job satisfaction, the distribution of the scores for the single item
measure was slightly skewed, as expected, with a larger percentage responding towards the
positive or satisfied end of the scale (7 on the 1 to 7 scale) . The mean was 5 .0 , the mode 6 ,
and the median 5 . The first three units at the dissatisfied end of the scale attracted 7% (21 %
in total) of the responses per unit, while 1 5 % responded with a 4 (the central point on the
scale) . The fifth unit of the scale was used by 20 % , the sixth by 32 % , and the seventh unit
(the positive end of the scale) was used by about 12 % . Therefore, about 21 % of the
respondents used the dissatisfied end of the scale, 15 % the mid-point of the scale, and about
65 % rated themselves as satisfied.
323
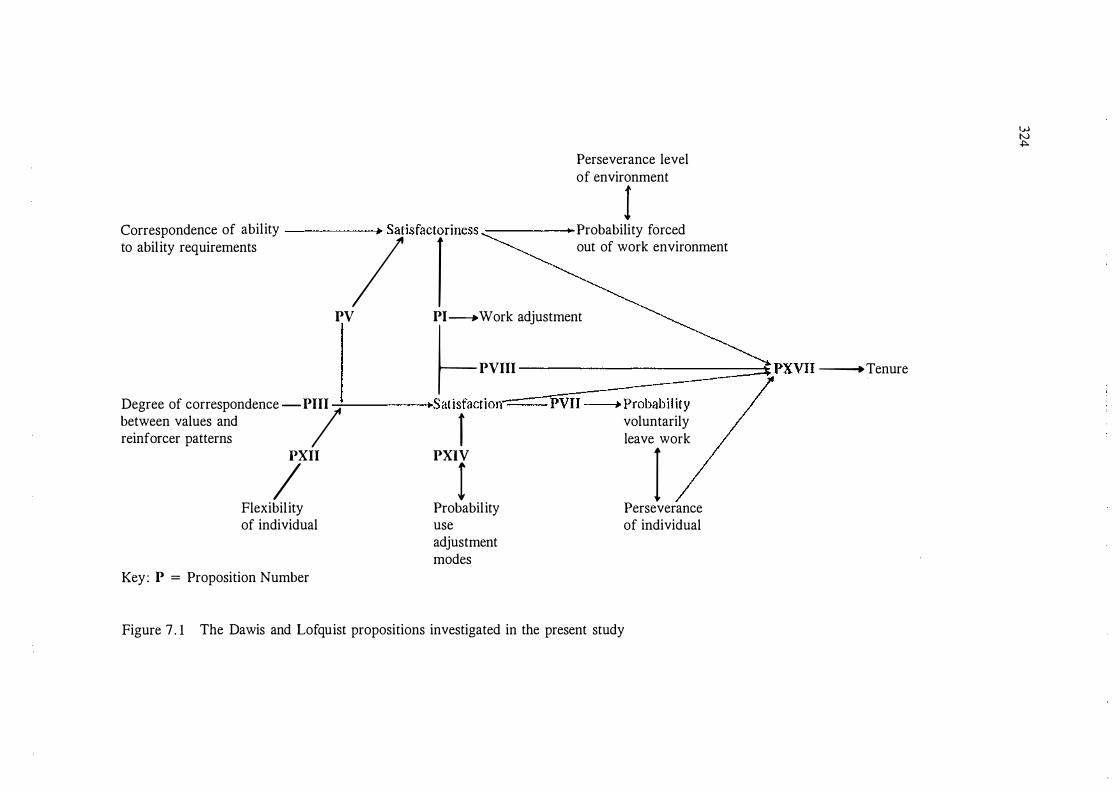
Perseverance level of environment
1 Correspondence of ability Satisfactoriness -..........._ Probability forced to abil ity requirements I f ---.__ out of work environment
PV PI ---.Work adjustment �PVIII -
Degree of correspondence -P/111 • Satisfaction--Pvn �Probabil ity between values and l voluntarily reinforcer patterns leave work ;XII PXT I
Flexibil ity Probabil ity Perseverance of individual use of individual
adjustment modes
Key : P = Proposition Number
Figure 7 . 1 The Dawis and Lofquist propositions investigated in the present study
---i>Tenure
VJ N +:>.

325
One method of examining the degree of correspondence between work needs and reinforcers
is to correlate ratings of the needs which are important in a respondent's ideal job with those
respondents believe are available to workers in that job generally . This was done for data
from the second stage of the research, as given in Table 7. 1 . The only significant (p. < .001)
correlations between the needs seen as ideal and the work needs respondents ' jobs reinforced,
are shown in Table 7 . 1 .
Table 7. 1 Correlations Between Work Needs and Reinforcers Respondents Perceived to be
Available in that Job Generally
Types of work needs and their reinforcers
Moral values Company policies and practices Security Social service Supervision (human relations) Independence needs Recognition needs Creativity needs
Note. *** = p < .00 1 , ** = p < .01 , * = p < .05 .
Coefficients
Pearson's r
.38 ***
.27 ***
.26 ***
.26 ***
.23 **
. 19 **
. 16 *
. 13 *
The needs which did not correlate significantly were, ability utilisation, achievement, activity,
advancement, authority, compensation, eo-workers , responsibility, social status , variety,
supervision (technical) and working conditions . The magnitude of the significant correlations
were small to moderate which suggests the degree of correspondence for any of the needs
with their reinforcers may not be high.
The second and more usual method of creating need-reinforcer correspondence scores uses
difference scores (the square of the differences between the work needs and the perceived
reinforcers in the job) correlated with satisfaction scores , as in Tables 7.2 and 7 .4 . For
example, the difference between the score achieved for ability utilisation ideally and the score
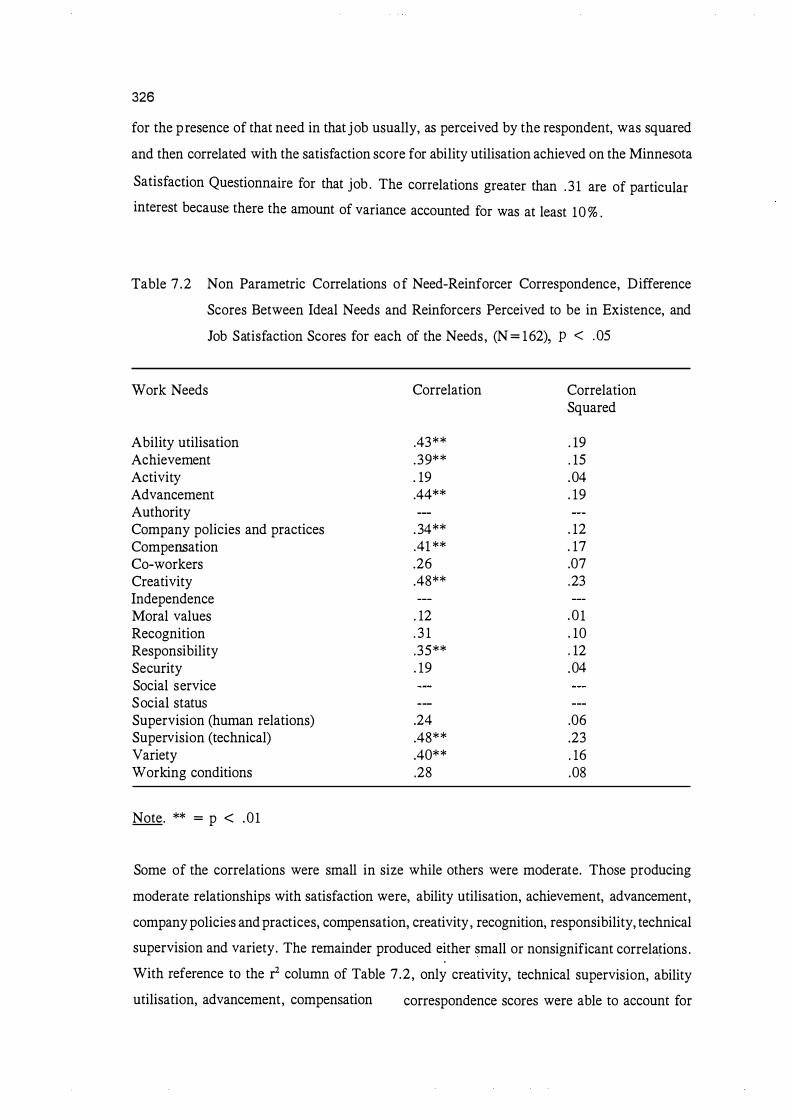
326
for the presence of that need in that job usually, as perceived by the respondent, was squared
and then correlated with the satisfaction score for ability utilisation achieved on the Minnesota
Satisfaction Questionnaire for that job . The correlations greater than . 3 1 are of particular interest because there the amount of variance accounted for was at least 10 % .
Table 7 .2 Non Parametric Correlations of Need-Reinforcer Correspondence, Difference
Scores Between Ideal Needs and Reinforcers Perceived to be in Existence, and
Job Satisfaction Scores for each of the Needs, (N = 162), P < . 05
Work Needs
Ability utilisation Achievement Activity Advancement Authority Company policies and practices Compensation eo-workers Creativity Independence Moral values Recognition Responsibility Security Social service Social status Supervision (human relations) Supervision (technical) Variety Working conditions
Note. ** = p < . 0 1
Correlation
.43**
.39**
. 19
.44**
. 34**
.41 **
.26
.48**
. 12
. 3 1
.35**
. 19
.24
.48**
.40**
.28
Correlation Squared
. 19
. 15
.04
. 19
. 12
. 17
.07
.23
. 0 1
. 10
. 12
.04
.06
.23
. 16
.08
Some of the correlations were small in size while others were moderate. Those producing
moderate relationships with satisfaction were, ability utilisation, achievement, advancement,
company policies and practices, compensation, creativity, recognition, responsibility, technical
supervision and variety. The remainder produced either small or nonsignificant correlations .
With reference to the r column of Table 7 .2 , only creativity, technical supervision, ability
utilisation, advancement, compensation correspondence scores were able to account for
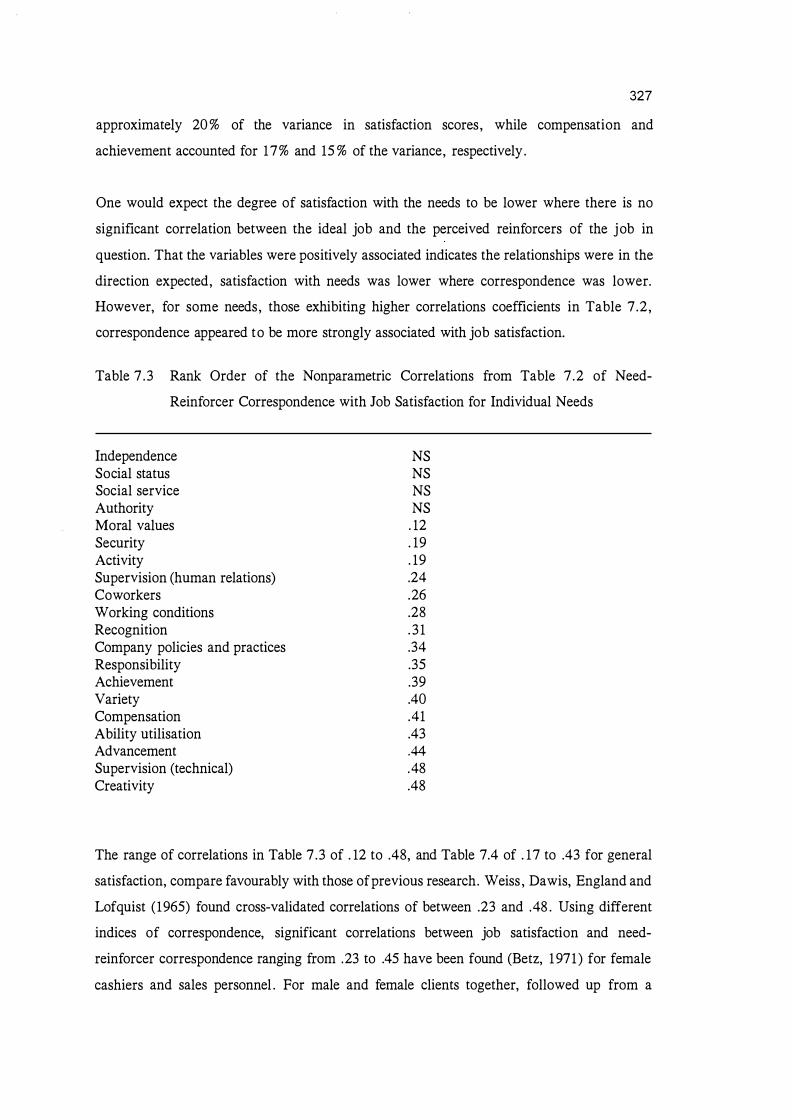
327
approximately 20 % of the variance in satisfaction scores, while compensation and
achievement accounted for 17% and 15 % of the variance, respectively.
One would expect the degree of satisfaction with the needs to be lower where there is no
significant correlation between the ideal job and the perceived reinforcers of the job in
question. That the variables were positively associated indicates the relationships were in the
direction expected, satisfaction with needs was lower where correspondence was lower.
However, for some needs, those exhibiting higher correlations coefficients in Table 7 .2 ,
correspondence appeared to be more strongly associated with job satisfaction.
Table 7 . 3 Rank Order of the Nonparametric Correlations from Table 7 .2 of Need
Reinforcer Correspondence with Job Satisfaction for Individual Needs
Independence Social status Social service Authority Moral values Security Activity Supervision (human relations) Coworkers Working conditions Recognition Company policies and practices Responsibility Achievement Variety Compensation Ability utilisation Advancement Supervision (technical) Creativity
NS NS NS NS
. 12
. 19
. 19
.24
.26
.28
. 3 1
.34
.35
.39
.40
.41
.43
.44
.48
.48
The range of correlations in Table 7 .3 of . 12 to .48, and Table 7.4 of . 17 to .43 for general
satisfaction, compare favourably with those of previous research. Weiss , Dawis, England and
Lofquist ( 1965) found cross-validated correlations of between .23 and .48 . Using different
indices of correspondence, significant correlations between job satisfaction and need
reinforcer correspondence ranging from .23 to .45 have been found (Betz, 1 971 ) for female
cashiers and sales personnel . For male and female clients together, followed up from a
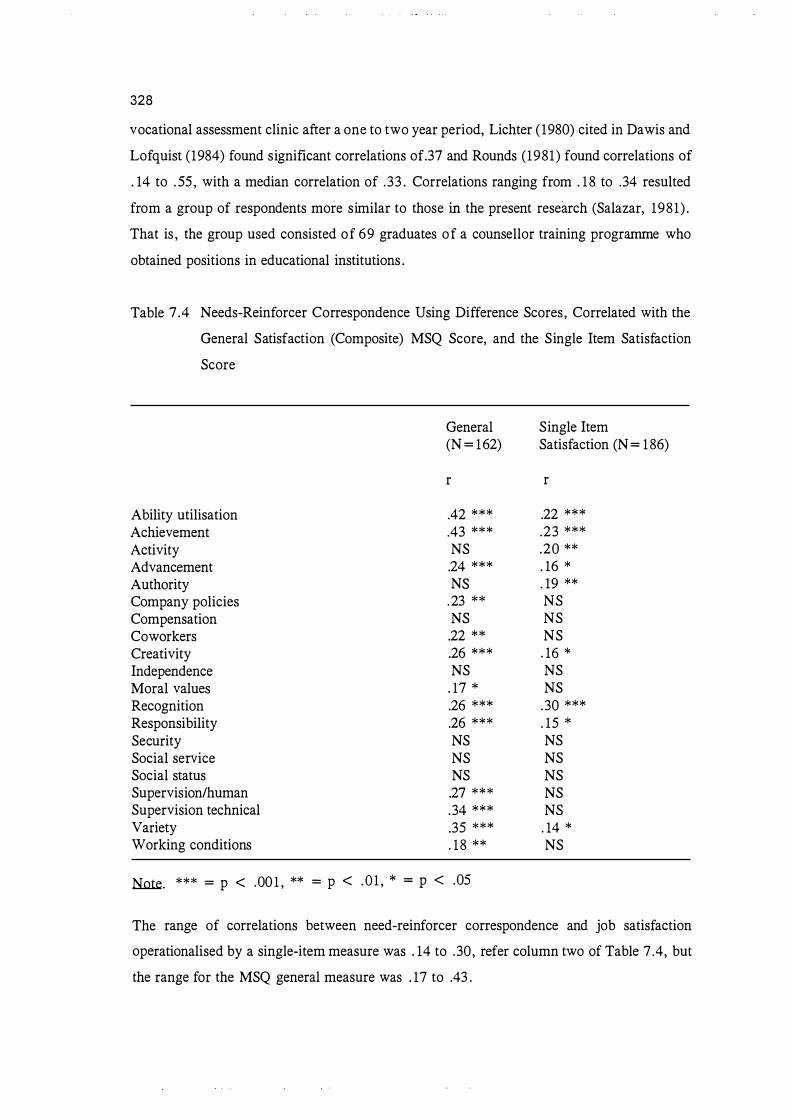
328
vocational assessment clinic after a one to two year period, Lichter ( 1980) cited in Dawis and
Lofquist ( 1984) found significant correlations of.37 and Rounds (1981) found correlations of
. 14 to . 55 , with a median correlation of .33 . Correlations ranging from . 18 to .34 resulted
from a group of respondents more similar to those in the present research (Salazar, 1981) .
That is , the group used consisted of 69 graduates of a counsellor training programme who
obtained positions in educational institutions .
Table 7.4 Needs-Reinforcer Correspondence Using Difference Scores, Correlated with the
General Satisfaction (Composite) MSQ Score, and the Single Item Satisfaction
Score
General (N = 162)
r
Ability utilisation .42 * * * Achievement .43 * * * Activity NS Advancement .24 * * * Authority NS Company policies .23 * * Compensation NS Coworkers .22 * * Creativity .26 * * * Independence NS Moral values . 17 * Recognition .26 * * * Responsibility .26 * * * Security NS Social service NS Social status NS Supervision/human .27 * * * Supervision technical .34 * * * Variety .35 * * * Working conditions . 18 * *
Note. * * * = p < .00 1 , ** = p < . 0 1 , * = p < .05
Single Item Satisfaction (N = 1 86)
r
.22 * * * .23 * * * .20 ** . 16 * . 19 ** NS NS NS . 16 * NS NS
.30 * * *
. 15 * NS NS NS NS NS . 14 * NS
The range of correlations between need-reinforcer correspondence and job satisfaction
operationalised by a single-item measure was . 14 to .30, refer column two of Table 7 .4, but
the range for the MSQ general measure was . 17 to .43 .

329
Multiple regression analysis of need-reinforcer correspondence regressed on job satisfaction
in terms of the General Satisfaction Scale is given in Table 7 .5 . A multiple r of .50, and an
r square of .25 resulted. Therefore, the need-reinforcer correspondence for all work needs
accounted for 25 % of the variance in satisfaction scores for all of the needs . Not all the work
needs could be expected to correspond to a similar degree and for all respondents in all
occupations . Some of the needs were not met at all . Also in Table 7 .5 are the percentage of
respondents achieving need-reinforcer correspondence for each of the needs . The mean
percentage satisfied for the different correspondences was 6 1 . 6 % (S . D . 6 .6) . Overall ,
reasonable levels of satisfaction were obtained, with around 65 % of respondents rating
themselves as satisfied. The range of being satisfied with the job with respect to the different
work needs (50 % to 72 %) indicates that some work needs were being satisfied for half of the
respondents and others for up to 72% of the respondents . Obviously the remaining percentage
of the respondents were not satisfied in relation to these same work needs . Although the
percentage column of Table 7 .5 shows a similar percentage of respondents achieved need
reinforcer correspondence in the case of all the needs involved, in contrast the correspondence
scores of the different needs contributed in differing amounts to the variance in the
satisfaction scores.
The average squared correlations between the covariates (the need-reinforcers correspondence
scores) and the predicted dependent variable (satisfaction) , calculated via multiple analysis of
variance using MANOVA in SPSSx provided the proportions of variance in satisfaction scores
accounted for by correspondence between each of the needs (as shown in the second column
of Table 7.5) . Not all of the need-reinforcer correspondences were involved in a relationship
between work-need reinforcer correspondence. The individual need-reinforcer correspondence
scores showing large variance estimates , between 17% and 28 % , numbered only four . Only
the first four listed in Table 7 .5 had more than 10% of the variance in job satisfaction
accounted for by need-reinforcer correspondence and of these achievement and ability
utilisation accounted for a reasonable percentage of the variance (28 % and 27 % ,
respectively) . Variety and supervision (both of the human relations and technical kind)
followed closely, accounting for moderate amounts of shared variance 20% and .17 �o . The
next highest group of work need-reinforcer correspondence accounting for variance in job
satisfaction included recognition, responsibility, creativity and advancement. The next group
steadily drop away to 06 % and down to 04 % in the case of working conditions . It seems
apparent that important variables other than work need-reinforcer correspondence might be
contributing to job satisfaction. It is also important to remember that for some work needs

330
anything from half to a quarter of the respondents did not experience correspondence for this
to have any impact or otherwise on job satisfaction. That correspondence between needs and
reinforcers accounts for only some of the variance in j ob satisfaction is of course evident in
the r square (based on the multiple r) being only .25, that is , only 25 % of the total variance
was accounted for by need-reinforcer correspondence.
Table 7 .5 Percentage of Respondents Achieving Need-Reinforcer Correspondence for each
of the Needs and Average Squared Correlations of Correspondence Scores
Regressed on Job Satisfaction (MSQ General Satisfaction Scale)
Need-Reinforcer Correspondence
Achievement Ability utilisation Variety Supervision (technical) Supervision (human relations) Recognition Responsibility Creativity Advancement Company policies and practices eo-workers Working conditions Moral values Security Social service Activity Compensation Social status Independence Authority
Percentage
63 64 6 1 53 70 64 60 56 55 65 72 64 7 1 72 64 55 50 53 62 58
Mean 6 1 . 6 %
Manova average squared correlations
.28
.27 .20 . 17 .03 .06 . 12 .07 .06 .02 .01 .04 .00 .00 .03 .01 .01 .00 .00 .02
(N = 20, S . D . = 6 . 6 % )
With respect t o Dawis and Lofquist's work values (factors derived from their factor analyses
of work needs), the individual need-reinforcer correspondence scores showing the larger
variance estimates were representative of their achievement, comfort and safety factors , (and
the achievement, working conditions, policies and practices factors of the nonorthogonal
rotation of the present research as discussed in the next chapter) . The first two represented
achievement and the second two comfort and safety, respectively. Those correspondence

331
scores showing some variance in common with satisfaction scores but to a lesser amount,
ranging from 13 % to 20 % , represented the factors of safety, status, autonomy and altruism
(and the policies , achievement, autonomy, altruism and working conditions factors of the non
orthogonal rotation of the present research, as discussed in the next chapter) . The remainder
of the correspondence scores contributed little, less than 10% , to the relationship between
correspondence scores and were representative of the comfort, altruism and status factors only
(which are the working conditions, altruism, achievement and autonomy factors of the present
research) . Five of the correspondence scores related to the comfort factor of the present
research, and two each related to the altruism and status factors of Dawis and Lofquist's
model . Five related to the working conditions, two to the autonomy and one each to the
achievement and altruism factors of the present research. This suggests that not all of Dawis
and Lofquist's factors are important to job satisfaction, at least in this respondent group.
7 . 1 .2 Proposition VII
The seventh proposition that, "The probability that an individual will voluntarily leave the
work environment is inversely related to the individual's satisfaction" was rephrased to enable
investigation using the variables of the present study. By rephrasing this proposition as the
probability that the individual will remain in the work environment is positively related to the
individual 's satisfaction, it can be examined by looking at expected tenure and job attachment
as estimates of voluntarily leaving the environment. Using expected tenure, operationalised
as years expected to stay in the job as the independent variable, only 4 % of the variance was
found to be shared between this and satisfaction (r= .20) . Dawis and Lofquist's measure, the
general job satisfaction score obtained from the MSS, correlated . 15 with expected tenure,
thus accounting for 2 % of the variance.
If the proposition is reworded as above and job attachment is used to operationalise the
statement "unlikely to voluntarily leave the work environment" , a positive rather than an
inverse relationship would be expected. Job attachment correlated .67 with the single-item job
satisfaction measure and . 5 1 with the General Satisfaction scale, giving an r square of .45 and
. 26, respectively.
Multiple regression analysis produced a multiple r of .66 with an r square of .44, that is 44 %
of the variance in job attachment is accounted for by the satisfaction measures . When
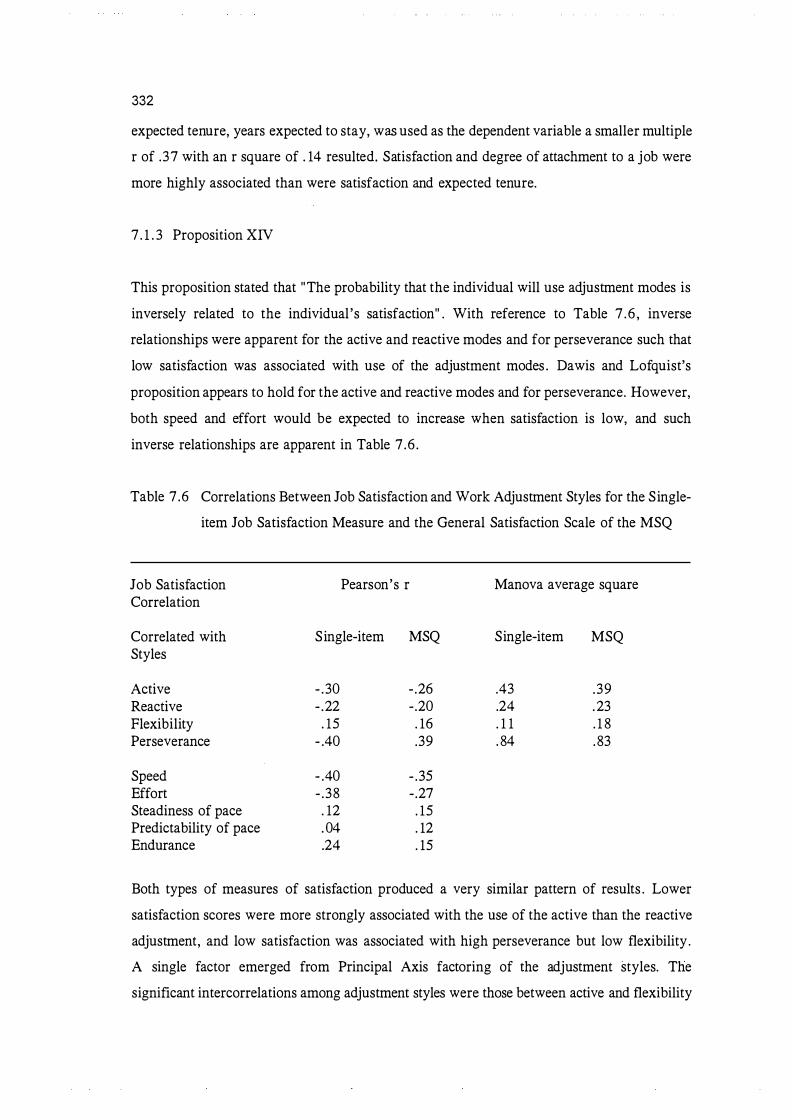
332
expected tenure, years expected to stay, was used as the dependent variable a smaller multiple
r of .37 with an r square of . 14 resulted. Satisfaction and degree of attachment to a job were
more highly associated than were satisfaction and expected tenure.
7 . 1 . 3 Proposition XIV
This proposition stated that "The probability that the individual will use adjustment modes is
inversely related to the individual 's satisfaction" . With reference to Table 7 .6 , inverse
relationships were apparent for the active and reactive modes and for perseverance such that
low satisfaction was associated with use of the adjustment modes . Dawis and Lofquist's
proposition appears to hold for the active and reactive modes and for perseverance. However,
both speed and effort would be expected to increase when satisfaction is low, and such
inverse relationships are apparent in Table 7 .6 .
Table 7 . 6 Correlations Between Job Satisfaction and Work Adjustment Styles for the Single
item Job Satisfaction Measure and the General Satisfaction Scale of the MSQ
Job Satisfaction Correlation
Correlated with Styles
Active Reactive Flexibility Perseverance
Speed Effort Steadiness of pace Predictability of pace Endurance
Pearson's r
Single-item MSQ
- .30 - .26 - .22 -.20 . 15 . 16
- .40 .39
- .40 - .35 - .38 -.27 . 12 . 15 . 04 . 12 .24 . 15
Manova average square
Single-item MSQ
.43 .39
.24 . 23
. 1 1 . 1 8
. 84 . 83
Both types of measures of satisfaction produced a very similar pattern of results . Lower
satisfaction scores were more strongly associated with the use of the active than the reactive
adjustment, and low satisfaction was associated with high perseverance but low flexibility .
A single factor emerged from Principal Axis factoring of the adjustment styles. The
significant intercorrelations among adjustment styles were those between active and flexibility
333
( - . 17, p . < .01), active and perseverance ( .47, p < .0001) , reactive and perseverance ( .22,
p < .01) and reactive and active ( .25 , p < .001) . The higher correlation between active
adjustment style and perseverance is consistent with these two variables exhibiting the greatest
degree of association with job satisfaction. The single factor found accounted for 28 % of the
variance. The reproduced correlation matrix produced residuals which were all less than .05
demonstrating a good fit between the original correlation matrix and the matrix of correlations
of the one factor solution. Chi-square was also non-significant indicating the similarity among
the variables . But within the single factor solution there appeared two subsets of variables
such that active style and perseverance were largely responsible for the shared variance. Their
communalities were .54 and .43 respectively whereas the communalities for flexibility and
reactiveness were only . 06 and . 1 1 , respectively.
To summarise the results relating to propositions concerned with the adjustment modes, the
probability that adjustment modes would be used did tend to relate inversely to individual
level of satisfaction as Dawis and Lofquist proposed, but a large proportion of the variance
was not accounted for . The correlations involved were either low or moderate. A single factor
emerged when adjustment styles were factor analyzed, and the styles of active and
perseverance had the largest communalities . The adjustment style variables correlated
significantly with satisfaction indicating they are important variables in the work adjustment
process.
7 . 1 .4 Proposition V
The fifth proposition stated "Satisfactoriness moderates the functional relationship between
satisfaction and value-reinforcer correspondence" . Perceived satisfactoriness interacted
significantly with some of the correspondence scores (p < .001) in the need/reinforcer
correspondence affects job satisfaction relationship. The correspondence scores involved were
those of authority, ( . 15), pay ( . 15), social status ( .21) , technical supervision (- . 14) , and
variety (- .25) . Therefore, when pay, authority, social status , technical supervision and variety
are perceived as satisfactory this correspondence between these needs and their reinforcers
will result in higher job satisfaction. In the case of technical supervision and variety, the
effect correspondence had on satisfaction was not only different for different levels of
satisfactoriness but the relationships were inverse ones . Therefore, in the case of high
technical supervision correspondence scores produced high satisfaction when satisfactoriness
was low, or low satisfaction when satisfactoriness was high. For the high variety need-
334
reinforcer correspondence scores, high satisfaction resulted when satisfactoriness was low,
and low satisfaction when satisfactoriness was high.
With respect to the other correspondence scores with significant interactions, the relationships
were positive. High correspondence produced high satisfaction only when satisfactoriness was
high. Although the interaction terms were significant, the average squared correlations
between the interaction terms (or moderating variable relating to satisfactoriness and the
predicted dependent variable) were only .02 for authority, .02 for pay, .04 for social status,
.02 for technical supervision, and .06 for variety. Therefore, the proportion of variance
satisfactoriness accounted for in moderating the value-reinforcer correspondence was no
greater than .06 for any one need-reinforcer correspondence term. For the remainder of the
needs, satisfactoriness did not influence the effect of correspondence on satisfaction, that is ,
satisfactoriness was independent of satisfaction. This finding is consistent with the low to
moderate relationship between the two which Dawis and Lofquist ( 1984) interpreted as
indicative of relative independence.
That the construct of satisfactoriness was operationalised differently from the way Dawis and
Lofquist had operationalised it may in itself help to account for its failure to moderate the
relationship between need correspondence and job satisfaction for all the needs.
Satisfactoriness did rely on self-ratings in the present instance. Because only some aspects of
satisfactoriness were involved, composite scores may make all the variables appear
independent. In this way those needs which are involved in a moderating relationship are most
likely to be disguised and any interdependence of satisfaction and satisfactoriness go
unnoticed. Also in a graduate group, satisfactoriness may be expected to be at a reasonable
high base level anyway and by being less variable might be less of a moderator on the need
reinforcer-correspondence-affecting-job satisfaction compared with some other groups of
employees.
7 . 1 . 5 Proposition XII
This proposition, "The flexibility of the individual moderates the functional relationship
between satisfaction and value-reinforcer correspondence" was supported for most of the work
values involved. The magnitude of the relationships between value-reinforcer correspondence
terms and satisfaction were small to moderate and the amount of variance each
correspondence term accounted for was limited, as shown in Table 7 . 7 .
335
With reference to Table 7 . 7, only ability utilisation, achievement, advancement and variety
value-reinforcer correspondence had a reasonable amount of variance in common with
satisfaction. Advancement shared about twice as much of its variance with job satisfaction
than with the other two needs. Of all the needs it is the only one which has more than half
of its variance in common with job satisfaction. It can be considered the most important need
reinforcer correspondence in relation to job satisfaction. Flexibility acted as a moderator in
the relationship between value-reinforcer correspondence and work satisfaction, as
operationalised by the General Satisfaction Scale, MSQ, for some of the work values . The
interaction terms which accounted for variance included, ability utilisation ( .33) , achievement
( .29), responsibility ( . 13) social status ( . 1 3) and variety ( . 16) , giving r squares of . 12 , . 03 ,
.02 and .02, respectively.
Flexibility had its greatest effect on ability utilisation and achievement. Responsibility and
social status correspondence shared little variance and therefore were not associated to any
meaningful degree. The interaction terms for these are not of any importance therefore, that
is , if a relationship is of little significance knowing whether or not it is moderated by another
variable is of little or no practical value.
7 . 1 . 6 Proposition I
With respect to Proposition I, "Work adjustment is at any time indicated by an individual 's
concurrent levels of satisfactoriness and satisfaction" . Dawis and Lofquist ( 1984) include the
construct of work adjustment in their propositions but not in their diagrams . This proposition
is not presented as a causal statement as other of the propositions are . Work adjustment is not
said to be a function of satisfaction and satisfactoriness but rather these are called indicators ,
they are work adjustment operationalised. Work adjustment is expected to be j ointly
influenced by both variables and could be said to be a function of them. But the emphasis in
work adjustment theory was more on the work adjustment process and tenure as an outcome
of that process rather than focusing on causes of high tenure.
Firstly, let us look at the relationship between work adjustment and job satisfaction as
represented by tenure and job satisfaction. The two different measures of job satisfaction used
were, the single item measure, and the Minnesota Satisfaction Questionnaire's General
Satisfaction Scale (the 20 items of the MSQ, one from each of the twenty sub-scales which
yields a score in the range 20 to 1 00). The two measures of tenure used were the respondents '

336
estimate of time expected to remain in the job and their self-reported job attachment. The
correlation of the single item job satisfaction measure with job attachment at .67 and
correlation of the MSQ general satisfaction scale and j ob attachment measure of .50 , were
higher than the correlation of .22 of the single item satisfaction measure and the expected
tenure measure. These were also higher than the .20 correlation of expected tenure with the
MSQ measure.
Table 7 . 7 Amount of Variance Need-Reinforcer Correspondence and Job Satisfaction Items
Have in Common
Achievement Ability utilisation Variety Creativity Recognition Advancement Working conditions Supervision (human) Social service Company policies & practices Authority Compensation Activity Independence Responsibility eo-worker relations Social status Supervision (technical) Security Moral values
r Square
.28
.27
.20 . 07 .06 . 05 . 04 .03 . 03 .02 . 02 . 0 1 .01 .0 1 . 0 1 . 0 1 .00 .00 .00 .00
The magnitude of the relationship between job satisfaction and job attachment is of a size
reasonable enough to support that part of Proposition I which expects a relationship between
satisfaction and work adjustment, if the latter is operationalised as job attachment. Multiple
regression analysis using the General Satisfaction Scale and individual self-report
satisfactoriness items (from the self-efficacy scale at time two) , as independent variables , and
job attachment as the dependent variable, yielded a multiple r of .69 and an r square of .48.
Job attachment therefore shared 48 % of its variance with satisfaction and perceived

337
satisfactoriness . The items from the satisfactoriness scale were confidence that performance
is good, confidence that skills and abilities can be exercised, confidence of adhering to rules
and procedures, and confidence of promotability.
That work adjustment, operationalised by job attachment, and degree of satisfaction and
satisfactoriness had nearly half of their variance in common supports Proposition I on the one
hand, but also indicates these are not the only variables which account for the degree of work
adjustment (as operationalised by job attachment) . Dawis and Lofquist's proposition was
supported only to the extent that job attachment operationalises work adjustment. In section
7.2 and Proposition XVII it is concluded that job attachment and tenure are probably not the
same construct (Tenure has been found to be negatively related to job satisfaction in the
literature as discussed in section 4.4. 1 herein) . It was thought job attachment may be
predictive of work adjustment.
Therefore, although one of the major tenets of Dawis and Lofquist 's theory, that work
adjustment is a function of or indicated by concurrent levels of satisfaction and
satisfactoriness, was supported to some degree, satisfaction and satisfactoriness were not
found to contribute equally to work adjustment. Multiple regression analysis showed the
amount of variance shared between satisfaction and job attachment alone to be around 4 1 % .
Each of the satisfactoriness measures were shown to produce r squares of only 4 to 5 percent
in relation to tenure . However, when scores such as confidence about skills and abilities were
used as estimates of satisfactoriness, up to 60 % of the variance was accounted for . The
satisfactoriness measures where less variance was accounted for may have influenced the work
adjustment process less in the respondent group because many would have gained
qualifications that are directly applicable to their occupation, thus increasing the likelihood
of being satisfactory. In other words, they probably have the skills and abilities to do the
work satisfactorily but may be unsatisfactory in a particular job in terms of other factors .
In discussing research relating to this proposition, Dawis and Lofquist argued that Proposition
I required the relative independence of satisfactoriness and satisfaction. The correlations they
quoted in support of this contention, correlations between sets of satisfactoriness and
satisfaction scores for six occupational groups, ranged between . 12 and .3 1 . They concluded
that the variance common to satisfactoriness and satisfaction did not exceed 1 0 % for any of
the groups . Dawis and Lofquist noted studies in the applied psychology literature which
support the independence of job performance, satisfactoriness and job satisfaction (Brayfield,
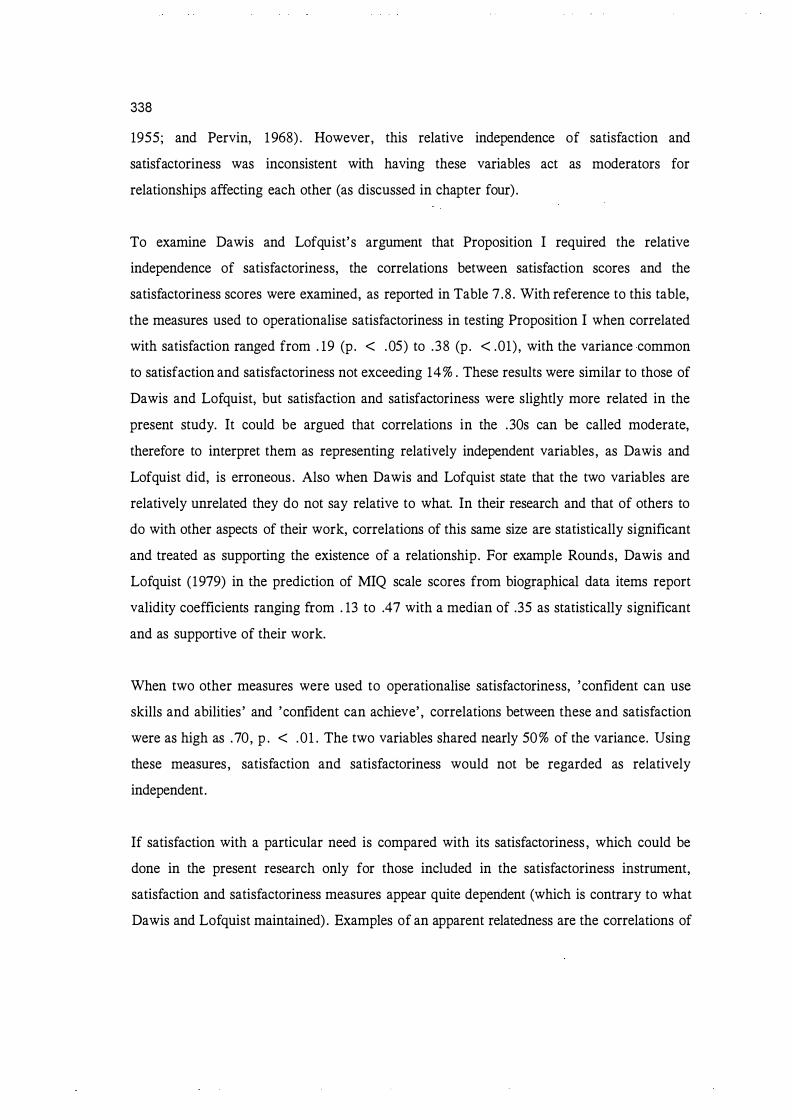
338
1955; and Pervin, 1 968) . However, this relative independence of satisfaction and
satisfactoriness was inconsistent with having these variables act as moderators for
relationships affecting each other (as discussed in chapter four) .
To examine Dawis and Lofquist's argument that Proposition I required the relative
independence of satisfactoriness, the correlations between satisfaction scores and the
satisfactoriness scores were examined, as reported in Table 7 .8 . With reference to this table,
the measures used to operationalise satisfactoriness in testing Proposition I when correlated
with satisfaction ranged from . 19 (p . < .05) to .38 (p . < .01) , with the variance common
to satisfaction and satisfactoriness not exceeding 14% . These results were similar to those of
Dawis and Lofquist, but satisfaction and satisfactoriness were slightly more related in the
present study. It could be argued that correlations in the .30s can be called moderate,
therefore to interpret them as representing relatively independent variables, as Dawis and
Lofquist did, is erroneous . Also when Dawis and Lofquist state that the two variables are
relatively unrelated they do not say relative to what. In their research and that of others to
do with other aspects of their work, correlations of this same size are statistically significant
and treated as supporting the existence of a relationship. For example Rounds, Dawis and
Lofquist ( 1979) in the prediction of MIQ scale scores from biographical data items report
validity coefficients ranging from . 13 to .47 with a median of .35 as statistically significant
and as supportive of their work.
When two other measures were used to operationalise satisfactoriness, 'confident can use
skills and abilities ' and 'confident can achieve' , correlations between these and satisfaction
were as high as .70, p . < . 0 1 . The two variables shared nearly 50% of the variance. Using
these measures, satisfaction and satisfactoriness would not be regarded as relatively
independent.
If satisfaction with a particular need is compared with its satisfactoriness , which could be
done in the present research only for those included in the satisfactoriness instrument,
satisfaction and satisfactoriness measures appear quite dependent (which is contrary to what
Dawis and Lofquist maintained) . Examples of an apparent relatedness are the correlations of
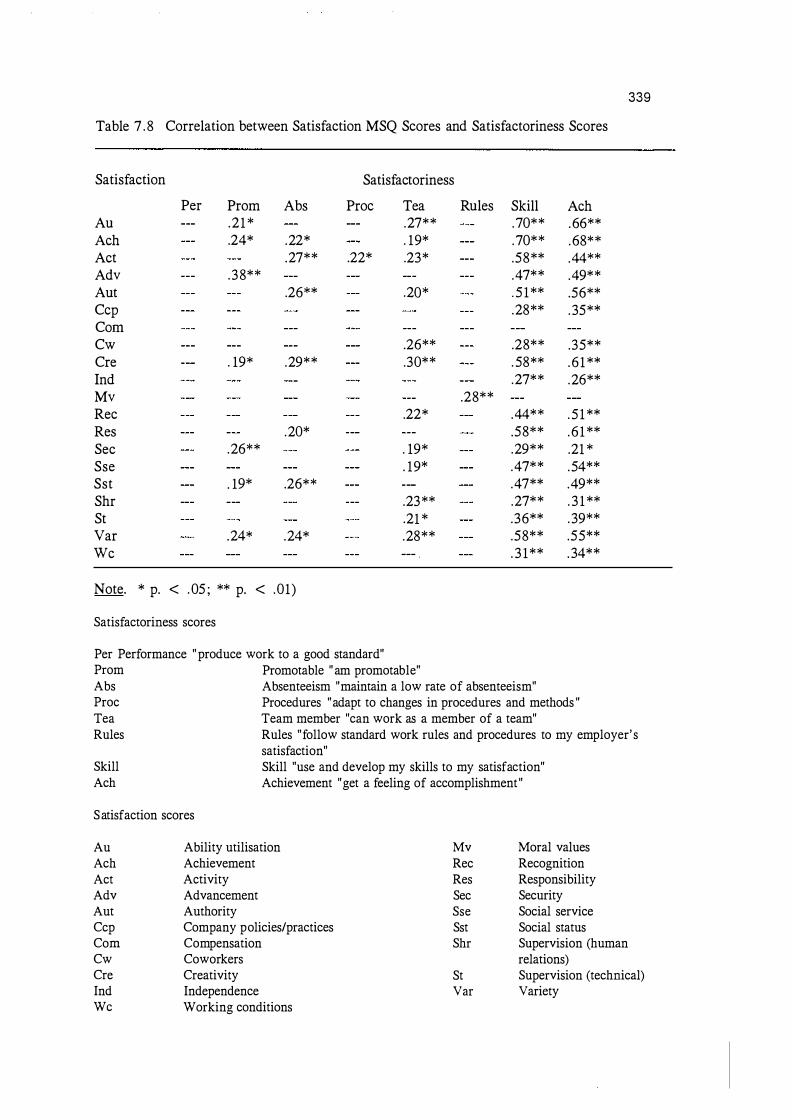
Table 7 . 8 Correlation between Satisfaction MSQ Scores and Satisfactoriness Scores
Satisfaction
Per Prom Abs Au .21 * A eh .24* .22* Act .27** Adv .38** Aut .26** Ccp Corn Cw Cre . 19* .29** Ind Mv Rec Res .20* Sec .26** Sse Sst . 19* .26** Shr St Var .24* .24* We
Note. * p. < . 05 ; ** p. < .01)
Satisfactoriness scores
Satisfactoriness
Proc Tea .27** . 19*
.22* .23*
.20*
.26**
.30**
.22*
. 19*
. 19*
.23**
.21 * .28**
---
Per Performance " produce work to a good standard" Prom Promotable " am promotable"
Rules Skill .70** .70** .58** .47** . 5 1** .28**
.28**
. 58**
.27** .28**
.44**
.58**
.29**
.47**
.47**
.27**
.36**
.58**
. 3 1**
Abs Absenteeism "maintain a low rate of absenteeism"
A eh .66** . 68** .44** .49** .56** . 35**
.35**
. 6 1 **
.26**
. 5 1 **
. 6 1 **
.21 *
.54**
.49**
. 3 1 **
. 39**
.55**
. 34**
Proc Procedures "adapt to changes in procedures and methods "
Tea Team member "can work as a member of a team"
339
Rules Rules "follow standard work rules and procedures to my employer' s
satisfaction" Skill Skill "use and develop my skills to my satisfaction" Ach Achievement "get a feeling of accomplishment "
S atisfaction scores
Au Ability utilisation Mv Moral values
A eh Achievement Rec Recognition
Act Activity Res Responsibility
Adv Advancement Sec Security
Aut Authority Sse Social service
Ccp Company policies/practices Sst Social status Corn Compensation Shr Supervision (human Cw Coworkers relations) Cre Creativity St Supervision (technical) Ind Independence Var Variety We Working conditions

340
. 70 (p . < . 01) , between ability utilisation satisfaction and skill satisfactoriness , and . 68 (p .
< .01) between achievement satisfaction and achievement satisfactoriness . These correlations
may be a little inflated, however, because they measure the same needs as opposed to a more
general satisfaction and satisfactoriness .
7 . 1 . 7 Proposition VIII
This proposition stated "Tenure is a joint function of satisfactoriness and satisfaction" . When
satisfactoriness and satisfaction, the latter measured by the General Satisfaction scale, were
regressed on expected tenure, a multiple r of .68 and an r square of .47 resulted. The average
squared correlation with job attachment was .56 for the General Satisfaction scale and .96 for
the satisfactoriness estimate of achievement (achievement correlated . 98 with job attachment,
p . < . 001 ) , a greater proportion of variance in expected tenure being accounted for by
satisfactoriness than by satisfaction. The General Satisfaction scale correlated . 75 with job
attachment and .50 with achievement, a greater proportion of the variance in job attachment
was accounted for by satisfaction than by the achievement estimate of satisfactoriness . The
correlation of .50 between the General Satisfaction scale measure of satisfaction and the
achievement measure of satisfactoriness does not support Dawis and Lofquist' s contention that
they are relatively independent.
7 . 1 . 8 Proposition XVII
This proposition stated that, "Tenure is a function of satisfactoriness, satisfaction, and the
perseverance levels of the individual and the work environment" . Because of the research
design and therefore the data which was available, only part of this proposition could be
examined . Perseverance levels of the work environment were not able to be taken into
account because the present research did not examine such work environment variables .
When satisfaction and satisfactoriness measures were regressed on job attachment, a multiple
r of .69, and an r square of 48 resulted. Therefore, nearly half of the shared variance was
accounted for . When perseverance levels of the individuals were included using MANOV A,
see Table 7. 9, job satisfaction, skill, and in particular achievement, were all good predictors
of job attachment. Perseverance was able to predict job attachment but not as well as some
of the other variables of interest.

341
Table 7 .9 Average Squared Correlations for Tenure as a Function of Satisfactoriness,
Satisfaction, and the Perseverance Levels of the Individual
Achievement Skill General job satisfaction Perseverance Authority Active mode Activity Autonomy Reactive mode Pay Rules and procedures
7.2 The relationships among variables in the present study
Average squared Correlations
.70
.52
.49
.28
.24
.24
.21
.20
.06
.01
.00
The relationships proposed as additional to Dawis and Lofquist' s theory were examined
according to the hypotheses in chapter five. These hypotheses are depicted in Figure 7 .2 .
7 . 2 . 1 Satisfaction and satisfactoriness
As already discussed in section 7 . 1 .6 in relation to Proposition I, the General Satisfaction
scale correlated with satisfactoriness .50, sharing 25 % of the variance which was considerably
more than the 1 0 % that Dawis and Lofquist found when advocating the relative independence
of the two constructs . As already discussed in chapter four (section 4.2.5), this aspect of
Dawis and Lofquist's theory appeared logically inconsistent. It was inconsistent for
satisfaction and satisfactoriness to be relatively independent and at the same time act as
moderating variables for each other in the correspondence relationships which determined
their levels. The findings show the two constructs to be correlated and therefore logically able
to act as moderators .
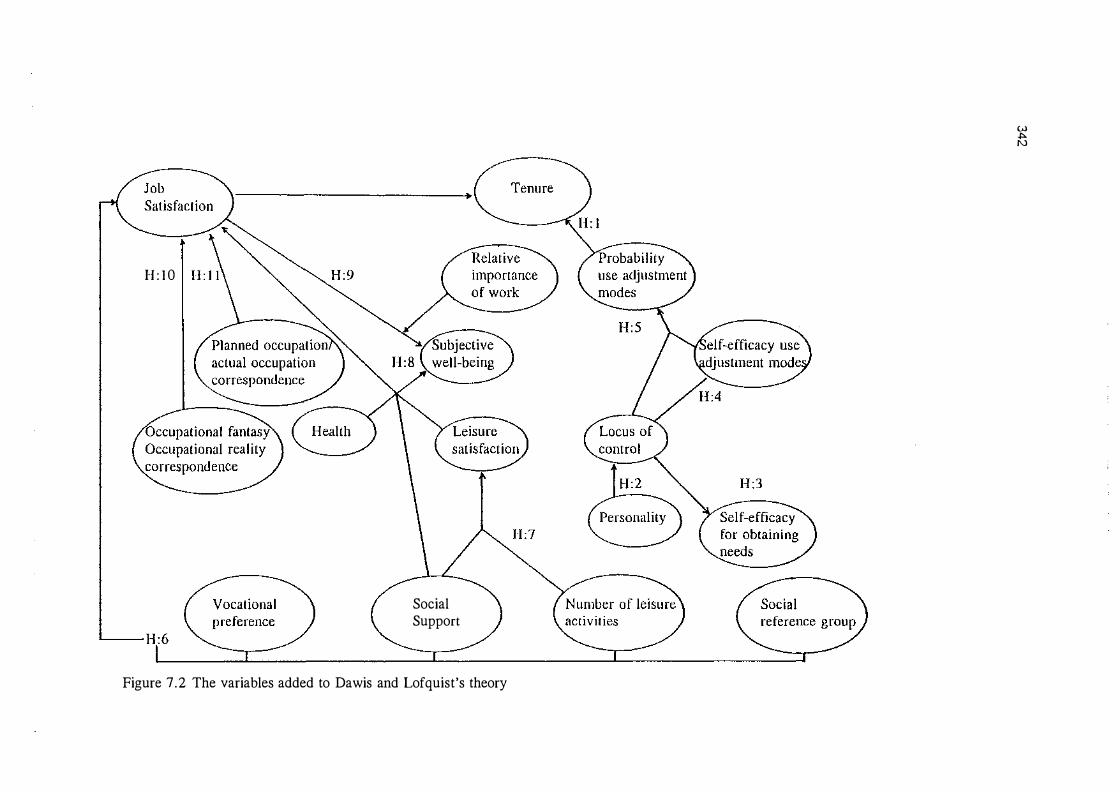
H : I O
.__- H:6
Social Support
Figure 7 .2 The variables added to Dawis and Lofquist's theory
w """ N

343
7 .2 .2 Estimates of tenure
Many of the propositions involved the construct of tenure, or a tenure-related one.
Propositions VI, VII and VIII included the construct of tenure. Proposition VI included forced
to leave work, Proposition VII voluntarily leaving work, and Proposition VIII remaining at
work, all of which are tenure related constructs . These various constructs were
operationalised in different ways . The construct of tenure was operationalised as 'expected
tenure' as measured by respondents ' estimates of the time they expected to remain in their
job. Such an operationalisation is probably consistent with Dawis and Lofquist's construct of
tenure which appears in their theoretical propositions . Introduced in the present study was a
further measure which was expected to be related to tenure but which might be more
associated with job satisfaction than tenure itself (as was found) . This measure was ' degree
of job attachment' . In the case of a group in the initial stage of employment a measure such
as job attachment might be more associated with job satisfaction than would tenure. Tenure
may be short for most of this group thus showing little variation. However, job attachment
may vary more and be a function of variables such as satisfaction. Job attachment might be
expected to better demonstrate in the present respondent group the relationship Dawis and
Lofquist propose between satisfaction and tenure generally (and the results show this to have
occurred) .
With the use of different estimates of tenure or tenure related measures, we can explore,
assess, what each concept might be measuring. The estimates can be compared through
looking at their intercorrelations as presented in Figure 7 . 3 . Job attachment correlated . 32
with expected tenure and .46 with perseverance, but perseverance and expected tenure were
not correlated. One might conclude firstly, that perseverance influences job attachment but
not expected tenure, perhaps only indirectly through job attachment. Job attachment has some
association with expected tenure but may not represent the same construct. Job satisfaction
however did not correlate highly with expected tenure ( .22) . Expected tenure is the least
related among the variables . This may mean it is a poor measure of tenure, but only if
variables like attachment and perseverance are regarded as good estimates of tenure. Expected
tenure being only moderately related to job satisfaction is consistent with the weak
relationship usually found between job satisfaction and tenure (Landy, 1 989) .
One would have predicted expected tenure to be a good operationalisation of tenure because
previous research has shown self-ratings to be valid (George, 1988) . More recently, observer

344
ratings have been found to be more positive than self-responses on multi-dimensional self
concept ratings (Marsh and Richards, 1990) . This modesty bias in self-concept is in contrast
to the commonly expected self-favourability bias found by Wylie ( 1979) in reviewing
evaluative tasks . The low to moderate correlations between expected tenure and job
attachment ( .32) and job satisfaction and expected tenure ( .22) , and the non-significant
relationship between expected tenure and perseverance could suggest either that expected
tenure was a poor operationalisation of tenure and that job satisfaction would otherwise be
related to tenure, or that job satisfaction does not predict tenure but is better related to other
variables such as job attachment and perseverance. Previous research would support expected
tenure as an appropriate operationalisation of tenure and job satisfaction as a poor predictor
of tenure.
Because job attachment and perseverance have demonstrated little or no association with
expected tenure and expected tenure is usually accepted as a reasonable estimate of tenure ,
one could argue firstly, that job attachment and perseverance are different constructs from
tenure. These two variables may be regarded as representing a construct or constructs
different from tenure because job satisfaction has predicted them better. Job satisfaction
certainly does not appear a major influence on tenure as demonstrated by the correlation
which although significant at the .005 level was low and able to explain only 5 % of the
variance. If expected tenure is regarded as the more likely valid measure of tenure, and it is
not predicted by job satisfaction as is the case here, and previous research is heeded in its
lack of relationship between satisfaction and tenure, considerable doubt is thrown on the
validity of Dawis and Lofquist's proposition that job satisfaction predicts tenure.
If tenure is regarded as an appropriate indicator of work adjustment and both job satisfaction
and satisfactoriness are deemed required for work adjustment to occur, one would expect both
satisfaction and satisfactoriness to be associated with tenure. As already discussed, tenure in
this instance as operationalised, respondents ' expected tenure, correlated significantly with
general job satisfaction although only a small coefficient of .22 (p < .01) resulted. However,
expected tenure did not correlate significantly with self-perceived satisfactoriness . When
degree of job attachment was used as an estimate of work adjustment, a significant and
reasonable correlation of .67 (p . < .001) was produced using the single item measure of job
satisfaction and a low but significant correlation of .20 (p < .01) resulted from the self-report
measure of satisfactoriness (self-perceived performance) . The relationship between satisfaction
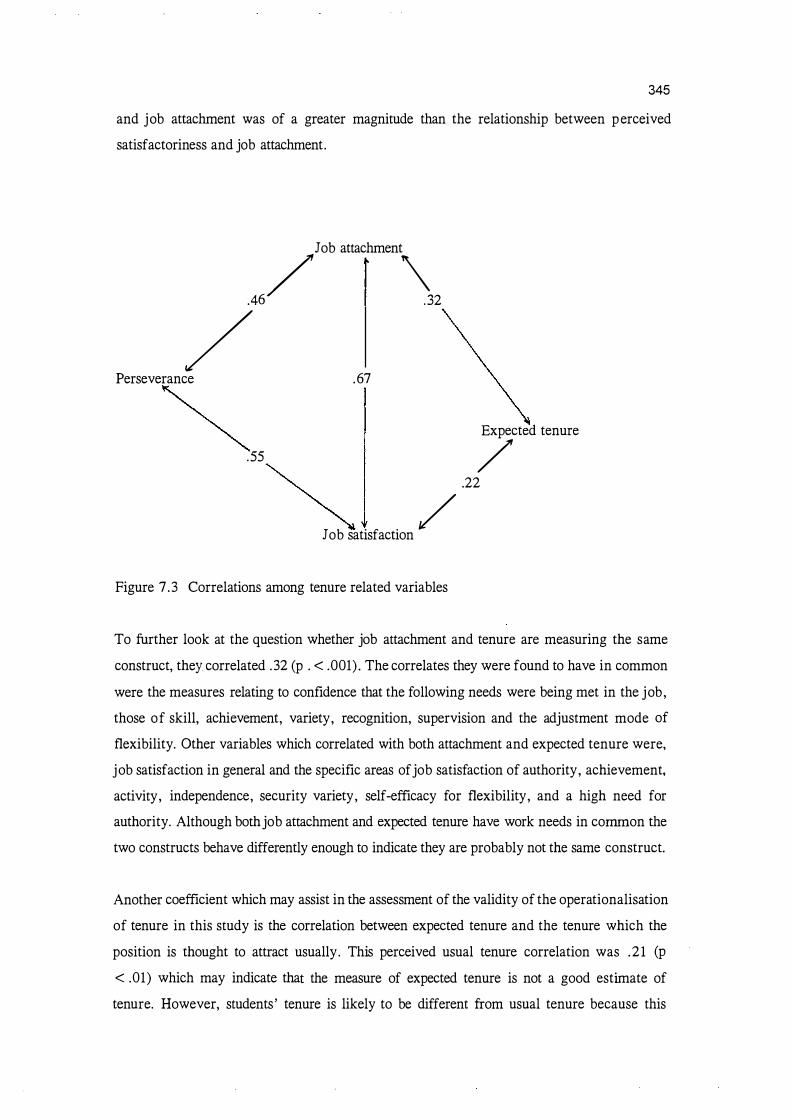
345
and job attachment was of a greater magnitude than the relationship between perceived
satisfactoriness and job attachment .
. 46
/Job attachment\2
/ Perseverance . 67
~ Expected tenure
. 55 / ~
.22
Job satisfaction / Figure 7 .3 Correlations among tenure related variables
To further look at the question whether job attachment and tenure are measuring the same
construct, they correlated .32 (p . < . 001) . The correlates they were found to have in common
were the measures relating to confidence that the following needs were being met in the job,
those of skill, achievement, variety, recognition, supervision and the adjustment mode of
flexibility. Other variables which correlated with both attachment and expected tenure were,
job satisfaction in general and the specific areas of job satisfaction of authority, achievement,
activity, independence, security variety, self-efficacy for flexibility, and a high need for
authority. Although both job attachment and expected tenure have work needs in common the
two constructs behave differently enough to indicate they are probably not the same construct.
Another coefficient which may assist in the assessment of the validity of the operationalisation
of tenure in this study is the correlation between expected tenure and the tenure which the
position is thought to attract usually. This perceived usual tenure correlation was .2 1 (p
< .01) which may indicate that the measure of expected tenure is not a good estimate of
tenure. However, students ' tenure is likely to be different from usual tenure because this

346
respondent group is being assessed during the early stages of first employment after
graduation. This stage of employment could be atypical of tenure for those positions . Because
these positions were those attained upon graduation, and therefore early in a career, they are
most likely to be occupied for a shorter time relative to subsequent positions or to holding the
same position later in a career. The positions themselves as first positions in a career, or as
temporary positions while awaiting a preferred position, would also probably be less senior
positions than respondents were likely to be capable of attaining even a short time later.
Therefore, job attachment may be a better indicator of work adjustment in a recent graduate
group. Because the early stages of employment are involved and the positions are likely to
be regarded as short-term only, tenure would probably be short and provide little information
about work adjustment itself. Instead, a variable such as job attachment may be more
informative. Job attachment may perform for this sample more as measures of tenure might
for a group not in the early stages of employment.
Examining the frequency distribution of expected tenure responses helps to indicate whether
expected tenure was influenced more by the early employment phenomena or by degree of
satisfaction and satisfactoriness. If early employment is an important factor, tenure would tend
to vary little among respondents and be relatively independent of satisfaction and
satisfactoriness levels . Certainly mean expected tenure of 3 .5 years , standard deviation 1 . 8 ,
suggested this group may be atypical of employees generally in their tenure expectations . In
such an atypical group expected tenure would be expected to be less associated with variables
such as satisfaction and satisfactoriness .
Another possibility accounting for the lack of association between expected and perceived
tenure associated with any position could be that the respondents had unrealistic notions about
the usual tenure for their positions . However, this explanation is perhaps the least likely
because the respondents having been in their positions about six months would be expected
to have a reasonable idea of usual tenure, as a result of both their own observations and
discussions with other employees .

347
From Table 7 . 10 it can be seen that generally the perceived usual tenure of the positions was
greater than the respondents ' expected tenure. The spread and range of number of years of
usual tenure was greater than respondents ' expected tenure. The maximum expected tenure
for others was 40 years in contrast to only 10 years for self. The median number of years for
expected tenure was located between one and two years but the median perceived usual tenure
was located around four years . The distribution for usual tenure was less skewed. Although,
there was sufficient variation among the responses in expected tenure to indicate that early
employment was not the only factor involved in the estimates of expected tenure, that the
responses clustered around only a few number of years tended to indicate respondents
regarded these first jobs as short-term employment. They seemed to expect longer
employment for others in the same occupation. Other variables such as satisfaction and
satisfactoriness seemed to have a role to play but the smaller range of responses compared
with those for usual tenure seems to suggest variables like these may affect tenure less , at
least for a group in the early stages of employment.
Table 7 . 10
Years
0 1 02 03 04 05 06 07 08 09 10 15 20 30 40
Total
A Comparison of the Distributions for Expected Tenure for Self and
Perceived Usual Tenure for Others in the Same Job .
Expected Tenure Perceived Usual Tenure
Cum Cum % % % %
3 1 3 1 09 09 34 65 30 39 08 73 06 45 08 8 1 04 49 15 96 15 64 02 98 04 68 0 98 0 68 0 98 0 68 0 98 0 68
02 15 83 04 87 02 89 09 98 02
100 100 100 100

348
If a better measure of the construct of work adjustment for this stage of employment is to be
found it is important to consider variables which are associated with both satisfaction and
satisfactoriness , given these affect work adjustment. The variables which were found to be
significantly correlated with both measures were, confidence in attaining authority, autonomy,
activity, variety, recognition, being friendly with workers, being able to persevere, using an
active adjustment style and being creative . Other correlates were confidence in work fitting
in with lifestyle, adjusting to a new club and location and the self-efficacy measures of
achievement, authority and autonomy. Any one of or a combination of these may better
indicate that a worker is both satisfied and satisfactory and therefore adjusted. At the same
time other variables may be less sensitive to the time during a career that the measurement
of work adjustment takes place. However, because individuals vary in the specific needs
which correspond for them, vary in the importance of difference needs, and vary in terms of
which needs correlate with job satisfaction, it is unlikely that any one of these variables on
their own will represent the construct of work adjustment. It is arguable that tenure may not
be a good indicator of work adjustment, in part because past research has shown one of the
expected relationships , between satisfaction and tenure, to be weak. In particular, tenure does
not appear to be a good indicator of work adjustment for the period of initial employment for
this respondent groups and perhaps generally also . Tenure would be expected to be influenced
in some instances by factors which have less to do with work adjustment directly. Such
factors might include the availability of better jobs, distance travelled to work, the opinion
of others, or non-work factors .
As previously discussed, satisfaction and satisfactoriness may not contribute to work
adjustment or estimates of it to the same degree and such an expectation seems more
symmetrical than one would expect in reality. Satisfaction correlated .50 with job attachment
while satisfactoriness correlated .98 . Tenure, as estimated by job attachment, appears to have
a strong association with both satisfaction and satisfactoriness , : with the latter producing the
correlation of greater magnitude. When satisfactoriness and satisfaction were regressed on job
attachment the average squared correlation was higher for satisfactoriness . 96 , than for
satisfaction, .56.
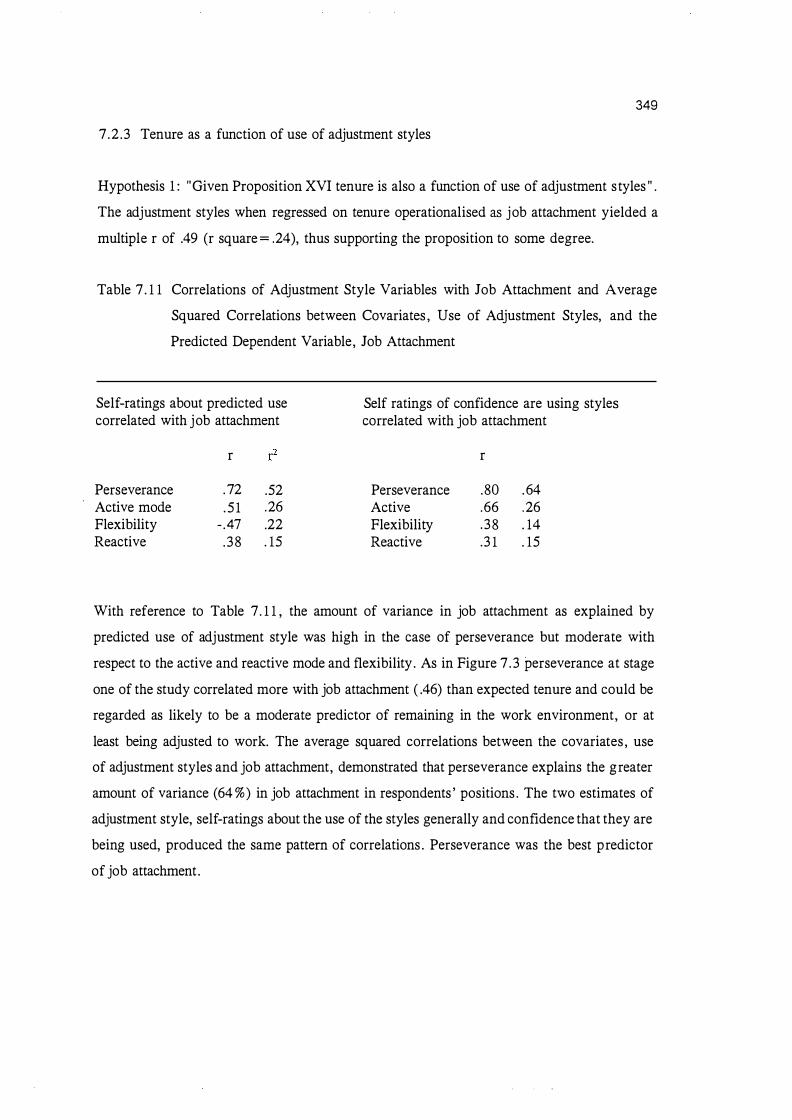
349
7.2 .3 Tenure as a function of use of adjustment styles
Hypothesis 1 : 1
1 Given Proposition XVI tenure is also a function of use of adjustment styles 11•
The adjustment styles when regressed on tenure operationalised as job attachment yielded a
multiple r of .49 (r square = .24), thus supporting the proposition to some degree.
Table 7 . 1 1 Correlations of Adjustment Style Variables with Job Attachment and Average
Squared Correlations between Covariates , Use of Adjustment Styles, and the
Predicted Dependent Variable, Job Attachment
Self-ratings about predicted use correlated with job attachment
Perseverance Active mode Flexibility Reactive
r
. 72 .52
. 5 1 . 26 - .47 .22 . 38 . 15
Self ratings of confidence are using styles correlated with job attachment
Perseverance Active Flexibility Reactive
r
.80 . 64
.66 .26
. 38 . 14
.3 1 . 15
With reference to Table 7 . 1 1 , the amount of variance in job attachment as explained by
predicted use of adjustment style was high in the case of perseverance but moderate with
respect to the active and reactive mode and flexibility . As in Figure 7 . 3 perseverance at stage
one of the study correlated more with job attachment ( .46) than expected tenure and could be
regarded as likely to be a moderate predictor of remaining in the work environment, or at
least being adjusted to work. The average squared correlations between the covariates , use
of adjustment styles and job attachment, demonstrated that perseverance explains the greater
amount of variance (64 %) in job attachment in respondents ' positions . The two estimates of
adjustment style, self-ratings about the use of the styles generally and confidence that they are
being used, produced the same pattern of correlations . Perseverance was the best predictor
of job attachment.
350
7.2.4 Relationship between locus of control and personality variables
Hypothesis 2: "The locus of control of an individual is related to personality" . The regression
of locus of control , operationalised as the sum of the Personal Competence Measures, on the
personality orientations of Holland (1973) produced a multiple r of .32.
There were only some significant correlation coefficients among scores on Holland's
Vocational Preference Inventory and the locus of control measure used in stage one of the
research. Although statistically significant, they were all small in magnitude and involved the
Holland types of conventional ( . 12), enterprising ( . 1 3), artistic ( . - 1 1 ) and status ( . 16). Traits
associated with the conventional orientation are, conforming, status-oriented, appearing
controlled, productive in well-structured tasks and adopting an obsessive, orderly pattern of
adjustment. Traits associated with the enterprising orientation are dominant, sociable,
cheerful , adventurous, a preference for ambiguous verbal tasks and a greater need for power
than with the conventional orientation. The traits associated with the artistic type are, a need
for self-expression, artistic interest, anxiety and immaturity, originality, unconventionality and
erratic effort and behaviour. The status orientation is represented by the need for status ,
prestige and upward mobility.
The direction of the relationships were positive, a high score on the personality type being
associated with high locus of control with the exception of the relationship between Personal
Competence and the artistic type. This was a negative correlation, a high artistic score was
associated with a low locus of control score, that is an external locus of control. There were
no significant relationships between Personal Competence and the remaining Holland
personality types, that is , Personal Competence was not associated with the realistic,
sociability, intellectual , self-control, masculinity, or infrequency scales .
The lack of association between locus of control and the Intellectual scale was perhaps the
most surprising. The Intellectual scale is defined as being characterised by a value of science
and aesthetic problems and would "deprecate social, political and business activities " (p . 18) .
It could be argued at least that being scholarly, persistent and having high educational
aspirations would be associated with an internal locus of control, even if other characteristic
factors of the Intellectual scale are not. Characteristic factors such as a lack of interest in
political , social and business activities may not be expected so much to be associated with
locus of control. It is these latter characteristics which may account for the overall lack of
351
association between the Personal Competence Scale and Holland's Intellectual Orientation.
Not all factors which make up this scale may be uniformly associated with being competent
and it may have been those specific factors which mitigated against scores on the Intellectual
scale correlating significantly with locus of control.
For stage one of the research, the correlations between Holland orientations and Personal
Competence correlations, although significant, were small and therefore probably of limited
explanatory value. Stage two of the study produced even fewer significant correlations, and
again none were of a reasonable magnitude. Holland's personality orientations were associated
with locus of control competence measures only to a small degree, the square of the multiple
r of . 32 being . 10 . Thus only about 10% of the variance in personality and locus of control
measures was shared.
7 .2 .5 Relationships between self-efficacy and locus of control
Hypothesis 3 : 11 Self-efficacy for obtaining needs is related to locus of control 11 • For stage one
of the study although some of the items of the indices of Personal Competence and self
efficacy expectations intercorrelated significantly, the relationships were small in magnitude.
Multiple analysis of variance produced small average squared correlations of the self-efficacy
items and locus of control, and a non-significant F. The multiple r of .32, indicated that locus
of control and self-efficacy measures shared only 10% of their variance, and that the personal
competence measure predicted self-efficacy to only a limited extent.
When need self-efficacy at stage one of the study was correlated with locus of control at stage
one, see Table 7 . 12 , significant correlations resulted .
Examining correlations between locus of control at stage one and self-efficacy at stage two,
as a way of assessing whether locus of control is likely to predict self-efficacy, revealed a
smaller number of significant correlations than occurred in comparisons between stage one
self-efficacy and locus of control. The work needs involved in significant correlations between
stage one locus of control and stage two self-efficacy were, in descending order, those of
status , activity, recognition and ability utilisation. These work needs represented Dawis and
Lofquist's achievement, comfort and status factors and excluded their safety and autonomy
factors , although one of the achievement related items (achievement itself) did not correlate
significantly. With respect to the factors identified in the present study, achievement and
comfort were represented but safety, autonomy and moral value factors were excluded .

352
The other work needs seemingly unaffected by locus of control were those of authority, pay,
security, variety, work friends, human relations and technical supervision and creativity. With
the exception of creativity, these results would be expected because the work needs in
question involve other individuals and the work environment and are therefore less able to
be influenced by factors such as the self-efficacy of the individual.
Table 7 . 12 Stage One Self-efficacy Correlated with Locus of Control at Stage One and
Two, and Self-efficacy at Stage Two Correlated with Stage Two Locus of
Control
Self-efficacy
Ability utilisation Achievement Authority Pay Reactive mode Promotability Security Variety Status Perseverance Recognition Work friends
Self-efficacy and Locus of Control stage one
Stage One
. 27**
.21**
.22**
.22**
. 13*
. 14*
.25**
. 14* . 19** .20** .23** . 16*
Supervision (technical) . 12* Absenteeism . 24** Supervision (human
relations) . 14* Creativity . 14* Lifestyle . 16* Adjustment new club .24** Adjust to new
environment . 18** Flexibility . 16* Activity .21 ** Active mode Repetitive Performance Procedures Team work
Note. ** = p < . 01 , * = p < .05
Self-efficacy Stage Two and locus of control Stage one
Stage One & Two
. 1 8* *
.20**
.23* *
.20**
. 16*
. 17* *
.20* *
Self-efficacy and Locus of Control Stage two
Stage Two
.30**
.27**
. 16*
. 16*
. 1 8**
. 32**
. 18**
. 37**
. 16*
. 30**
.21 **
. 18**
.21 **
. 19**
.22**
. 19**
.22**
.20**
.21 **
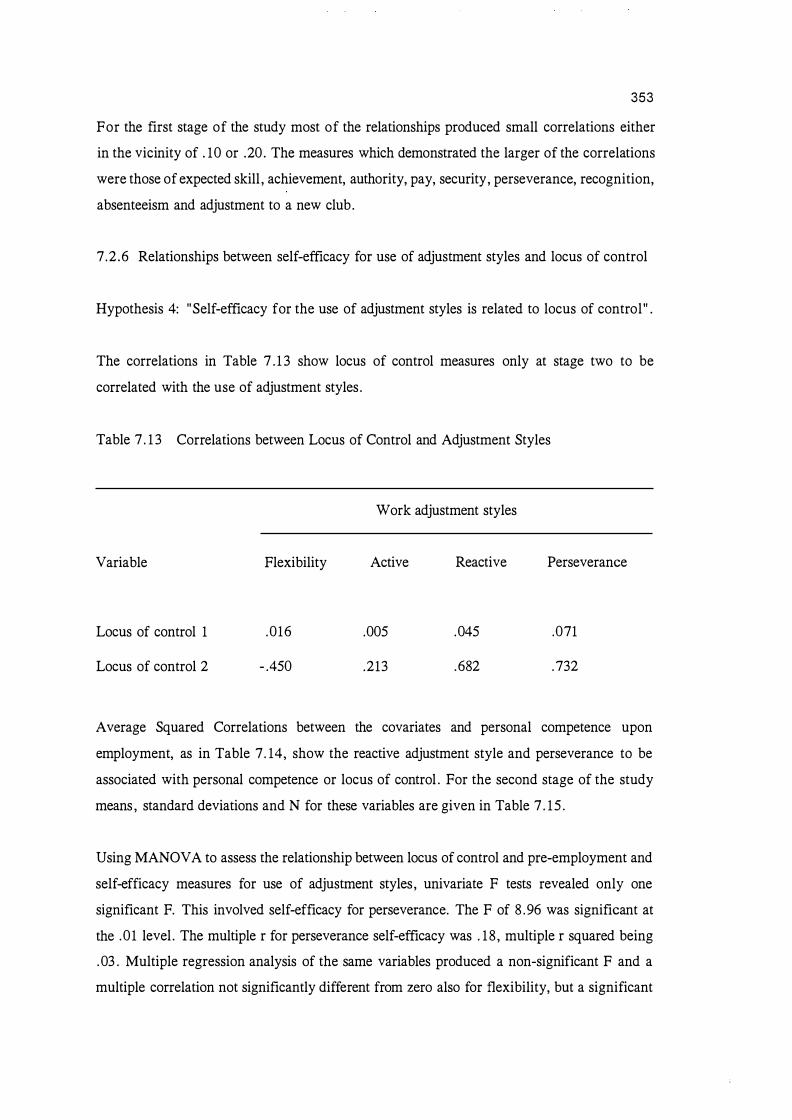
353
For the first stage of the study most of the relationships produced small correlations either
in the vicinity of . 1 0 or .20 . The measures which demonstrated the larger of the correlations
were those of expected skill , achievement, authority, pay, security, perseverance, recognition,
absenteeism and adjustment to a new club.
7 .2 .6 Relationships between self-efficacy for use of adjustment styles and locus of control
Hypothesis 4: "Self-efficacy for the use of adjustment styles is related to locus of control" .
The correlations in Table 7 . 1 3 show locus of control measures only at stage two to be
correlated with the use of adjustment styles .
Table 7 . 1 3 Correlations between Locus of Control and Adjustment Styles
Work adjustment styles
Variable Flexibility Active Reactive Perseverance
Locus of control 1
Locus of control 2
.016
- .450
.005
.213
.045
.682
.071
.732
Average Squared Correlations between the covariates and personal competence upon
employment, as in Table 7 . 14, show the reactive adjustment style and perseverance to be
associated with personal competence or locus of control . For the second stage of the study
means , standard deviations and N for these variables are given in Table 7 . 15 .
Using MANOV A to assess the relationship between locus of control and pre-employment and
self-efficacy measures for use of adjustment styles, univariate F tests revealed only one
significant F. This involved self-efficacy for perseverance. The F of 8 .96 was significant at
the .01 level . The multiple r for perseverance self-efficacy was . 1 8 , multiple r squared being
.03 . Multiple regression analysis of the same variables produced a non-significant F and a
multiple correlation not significantly different from zero also for flexibility, but a significant
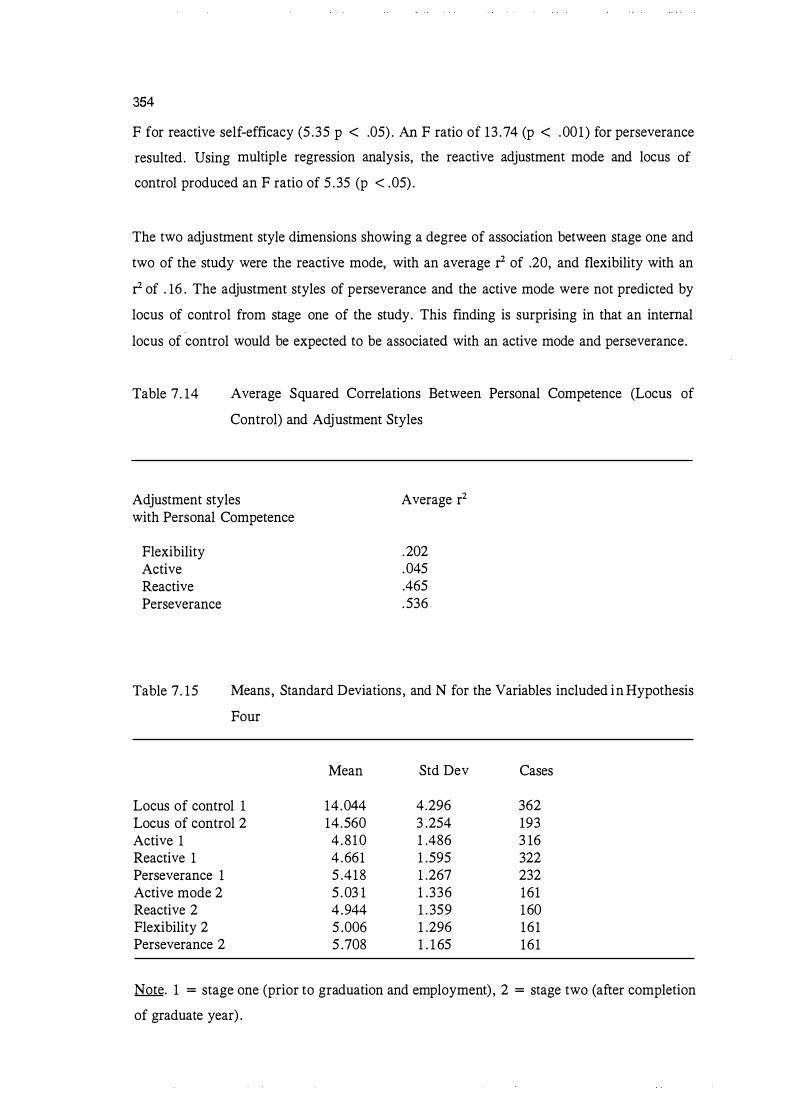
354
F for reactive self-efficacy (5 .35 p < .05) . An F ratio of 13 .74 (p < .001 ) for perseverance
resulted. Using multiple regression analysis, the reactive adjustment mode and locus of
control produced an F ratio of 5 . 35 (p < .05) .
The two adjustment style dimensions showing a degree of association between stage one and
two of the study were the reactive mode, with an average r of .20, and flexibility with an
r of . 16 . The adjustment styles of perseverance and the active mode were not predicted by
locus of control from stage one of the study. This finding is surprising in that an internal
locus of control would be expected to be associated with an active mode and perseverance.
Table 7. 14 Average Squared Correlations Between Personal Competence (Locus of
Control) and Adjustment Styles
Adjustment styles with Personal Competence
Flexibility Active Reactive Perseverance
Average r2
.202
.045
.465
. 536
Table 7. 15 Means, Standard Deviations, and N for the Variables included in Hypothesis
Four
Mean Std Dev Cases
Locus of control 1 14 .044 4.296 362 Locus of control 2 14.560 3 .254 193 Active 1 4 .8 10 1 .486 3 16 Reactive 1 4 .661 1 .595 322 Perseverance 1 5 .418 1 .267 232 Active mode 2 5 .03 1 1 .336 161 Reactive 2 4 .944 1 . 359 160 Flexibility 2 5 .006 1 .296 161 Perseverance 2 5 .708 1 . 1 65 161
Note. 1 = stage one (prior to graduation and employment) , 2 = stage two (after completion
of graduate year) .

355
An examination of the effect of locus of control prior to employment on self-efficacy for use
of the adjustment styles on the job, revealed small associations . Locus of control had an
influence on self-efficacy for the use of the reactive style and for flexibility, the multiple r
for each being .20 and . 16 respectively. The F for reactive style self-efficacy was 7 . 1 5 (p
< . 0 1) and for flexibility 3 . 87 (p < .05) . Multiple regression analysis of locus of control at
time one having an effect on self-efficacy for use of adjustment styles at time two, produced
a non-significant multiple correlation for the active mode and for perseverance. The reactive
mode self-efficacy produced a multiple r of . 12 and an F of 6.23 (p < .01) and flexil?ility
self-efficacy produced a multiple r of .09 but a significant F of 3 . 8 (p < .05) .
When the effect of locus of control for the second stage of the study on self-efficacy measures
at that same stage was investigated, the correlations for active, reactive, flexibility and
perseverance were .22, . 16 , . 17, and . 16 , respectively. The F ratios were 8 .24 (p < . 0 1) ,
4. 15 , 4 .39 and 3 .90, the latter three significant at the .05 level. Multiple regression analyses
produced a multiple r of .2, with r2 = .04, and an F of 15 .79 for active mode self-efficacy.
A multiple r of . 14 and F of 7 .82 (p < .01) was produced by the reactive mode. Flexibility
self-efficacy resulted in a multiple r of . 15 , F of 8 .56 (p < .01) and perseverance self
efficacy produced a multiple r of . 14 and an F ratio of 7 .56 (p < .01) . Although the multiple
correlations are small and their corresponding squares also small, it is useful to note that it
is only locus of control at the time of employment which is associated with self-efficacy for
all of the adjustment style variables .
In looking at whether locus of control influences self-ratings of use of adjustment styles rather
than the self-efficacy for their use, a significant multiple r of . 1 1 resulted and the F ratio of
4.598 with 1 d.f. was significant (p < .05) .
7 .2 . 7 Relationships among adjustment styles , locus of control and self-efficacy for using
adjustment styles
Hypothesis 5 : " Use of differing adjustment styles is jointly related to locus of control and
self-efficacy for use of adjustment styles " . The adjustment styles produced similar multiple
r's in relation to locus of control and self-efficacy. The modes of reactive, flexible, active and
perseverance produced moderate multiple r's of .38, .29, .29, and .33 , respectively with r
squares of . 14, .08, .08, . 1 1 . In view of hypothesis 5 incorporating aspects of hypotheses 3
and 4, and that these received limited support, it follows that hypothesis 5 would also be

356
expected to receive some support. Statistically significant results were obtained, and the
prediction of the use of adjustment styles by examining locus of control and self-efficacy
variables would be obviously better than chance. Although, in practical terms, the magnitude
of the relationships would suggest, because so much of the variance was unaccounted for, that
other variables may be of more importance. However, the magnitude of these correlations
were similar to many of those quoted by Dawis and Lofquist in support of their propositions .
Therefore, relative to other work adjustment variables Dawis and Lofquist identified as
important, they are no less important.
Higher correlations between self-efficacy for the use of adjustment styles and self-ratings
about use of adjustment styles for stage two of the study may have been related to the
likelihood that once respondents were in their jobs, their self-efficacy ratings could be more
realistic and therefore closer to the adjustment styles they rated as being in use . At stage one
of the study, because the reactive style correlated with the later use of the active style, it may
be reasonable to conclude that styles become part of a repertoire such that confidence about
the use of one style is likely to affect confidence about the use of other styles as well .
Respondents seemed to choose an adjustment style over others during stage one of the study,
but preferences at that stage tended not to be predictive of use of the same styles by stage
two. For example, perseverance at stage one correlated more highly with the active mode at
stage two . Perseverance also seemed to be the best overall indicator of use of adjustment
modes . No other styles correlated more highly between the two parts of the study. The
different circumstances associated with being a student and a graduate may account for the
differences . Adjustment styles respondents believed to be appropriate while students and those
perceived to be important once employed, may be different.
7 .2 . 8 The association of vocational preference/training correspondence with other
variables
Hypothesis 6 : "Job satisfaction is associated with vocational preference/training
correspondence, perceived satisfaction of social reference group and social support" . In order
to examine the relationship between job satisfaction and vocational preference/training
correspondence, the existence of any difference among the vocational groups in the sample
in terms of job satisfaction was looked at first. If there was no difference among the groups
in their job satisfaction, there would be no variability to attempt to account for in this group,
therefore vocational preference/training correspondence would not be effecting satisfaction.

357
The chi-square (20 d.f. ) for the vocational groups was non-significant. It is not meaningful
therefore to talk of job satisfaction being a function of vocational preference/training
correspondence.
The social reference group and social support variables were both found to be associated with
job satisfaction. The social reference group variable of having more job satisfaction than
friends produced a high correlation, .78 (p < .001), N = 184. Some social support related
variables correlated more highly than others with job satisfaction. Having a boss who helps,
correlated . 33 (p < .001) , having workmates who help, correlated . 30 (p < .001 ) and
having a boss who could be relied upon, correlated . 30 (p < .001) . Having relatives who
help correlated, - .21 (p < .01) , having neighbours who help, correlated . 19 (p < . 0 1 ) and
having someone to discuss personal problems with, correlated . 15 (p < .05) .
7 .2 .9 Non-employment satisfaction, leisure activities and social support
Hypothesis 7 : "Non-employment satisfaction is related to the number of leisure activities and
ability to seek social support" . When leisure satisfaction was regressed on the number of
leisure activities and social support, operationalised as self-ratings about extent respondents
can talk to significant others, a multiple r of .23 resulted, with an r square of only .05 .
Leisure activities and social support when considered together as predictors o f non
employment satisfaction performed poorly.
7.2 . 1 0 Variables associated with subjective well-being
Hypothesis 8 : "Subjective well-being is associated with employment satisfaction, social
support, non-employment satisfaction, and health" . The domain of job satisfaction, that is the
single-item measure of job satisfaction and the MSQ general satisfaction scale, correlated
positively with Converse, Carnpbell and Rodgers' ( 1976) Index of Well-being. The single
item measure produced a moderate correlation of .39 ( 1-tailed significance p . < . 0001 ) ,
accounting for about 1 5 % of the shared variance. The MSQ job satisfaction measure produced
a lower correlation of . 15 (p . < . 05) which accounted for only 2 % of their shared variance.
Satisfaction domains and well-being correlations (as shown in Table 7 . 16 , with the domains
ordered according to degree of correlation with well-being) demonstrated that leisure,
friendship, education use, intimate relationships and job satisfaction were correlated similarly

358
with well-being and all were significant at the .001 level . However the correlations for leisure
and friendships were the highest, each sharing around 25 % of their variance with that of well
being. The next three domains, education use , intimate relationships and job satisfaction, each
shared 1 6 % to 1 8 % of their variance with well-being. The remainder of the domains shared
smaller but similar amounts of variance with well-being, ranging from 7 % for neighbourhood
satisfaction to 1 2 % for location satisfaction.
Table 7 . 16 Correlations (p < .001) Between Well-being and Satisfaction Domains
Leisure satisfaction Friendship satisfaction Intimate relationship Education use Job satisfaction Location satisfaction Compared with friends Level of education satisfaction Satisfaction with life in N.Z . Home satisfaction Family satisfaction Neighbourhood satisfaction Savings Health
Note. * p. < . 05
r r
. 50 .25
.49 .24
.42 . 17
.41 . 18
.40 . 16
. 34 . 12 .33 . 1 1 . 3 1 . 10 .29 .08 .28 .08 .28 .08 .26 .07 .20 .04 . 14 * .02
Neither satisfaction with living standard nor accommodation satisfaction correlated with well
being. With respect to Hypothesis 8 and the degree of association, all the variables of interest
correlated with well-being, but leisure and job satisfaction correlated to the greatest degree.
This was followed by the social support variables of friendship and intimate relationships and
then the other social support variables of family and neighbourhood satisfaction. The latter
could be regarded as the potentially more emotionally distant forms of social support.
Although still statistically significant, health showed the weakest relationship with well-being.
For this respondent group, the variables accounting for most of the variance in well-being
were leisure and friendship satisfaction at 25 % , while job satisfaction accounted for less at
16 % . It is important to note that some of the satisfaction domains are not independent of each
359
other. For example, measures of the domains of location and neighbourhood satisfaction will
be related because the neighbourhood forms part of an individual's location. Some of the
domains are more global in nature, for example satisfaction with life in New Zealand would
include judgements about many of the other domains taken together.
A question allied to hypothesis 8 is the extent to which the importance to the individual of
the various satisfaction domains might affect on well-being. That is the effect the satisfaction
domains have on well-being may be moderated by the importance of those domains . These
were Campbell, Converse and Rodgers's ( 1976) expectations also. Despite their findings to
the contrary, intuitively it is difficult to dismiss the expectation that the importance of the
various domains to the individual, influences satisfaction ratings . A relationship in the other
direction may exist, that is , the level of satisfaction with a domain might be expected to affect
the importance of that domain.
Ratings on a scale of 1 to 7 about the importance of satisfaction domains exhibited similar
standard deviations . The importance of health and friends rated the highest (median of 1 =
extremely important), most other domains were rated either 2 or 3 and the importance of
housework achieving a median rating of 4. Such a rating representing the mid-point of the
scale indicates that housework is either considered to be in the mid-point on a continuum of
extremely important to not at all important or that this mid-point was chosen to represent a
neutral one as an indication of indifference or of non-applicability to the individual . However,
because this notion of indifference is in fact accounted for by one end of the scale, "not at
all important" , it would be more appropriate to interpret the mid-point as representing an
average amount of importance or as the middle of a continuum of importance.
The distribution of use-of-scale scores for each of the domains showed the extremely
important category was employed by some respondents . The range of use of the category was
from 1 . 5 % to 6 1 % , with a mean percentage of 30.67 % . The not at all important end of the
scale was not used for all of the domains, the maximum score being 6 for the domains of,
job , leisure, health, friends and family. This end of the rating scale was employed less often
than the extremely important end. The percentage of use of the last two low importance
categories of the scale ranged from 0 . 3 % to 4 .3 % for a rating of 6 and 0 .3 % to 4 . 1 % for
a rating of 7 . However, the degree of closeness among the measures of central tendency,
mean, mode and median, tended to indicate a lack of skew, the ratings closely approximating
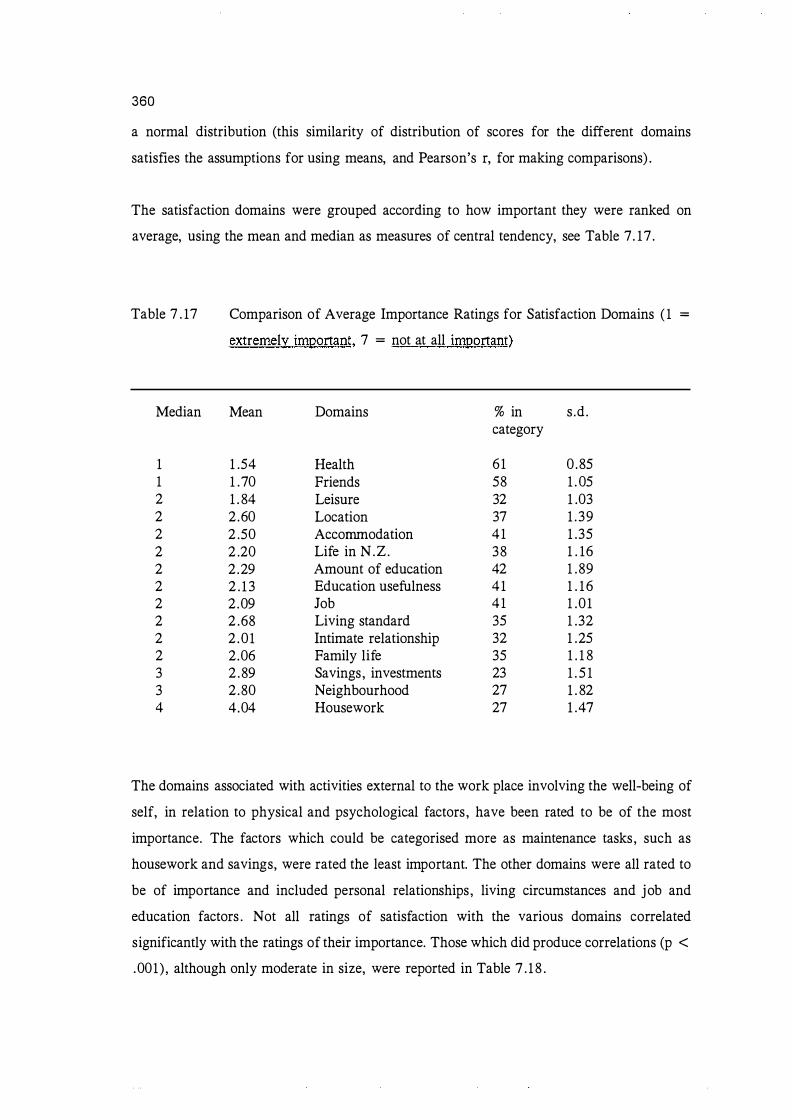
360
a normal distribution (this similarity of distribution of scores for the different domains
satisfies the assumptions for using means, and Pearson's r, for making comparisons) .
The satisfaction domains were grouped according to how important they were ranked on
average, using the mean and median as measures of central tendency, see Table 7. 17 .
Table 7 . 17
Median
1 1 2 2 2 2 2 2 2 2 2 2 3 3 4
Comparison of Average Importance Ratings for Satisfaction Domains ( 1 =
extremely important, 7 = not at all important)
Mean Domains % in s .d . category
1 .54 Health 61 0 .85 1 .70 Friends 58 1 . 05 1 . 84 Leisure 32 1 .03 2 .60 Location 37 1 . 39 2 .50 Accommodation 41 1 .35 2 .20 Life in N.Z . 38 1 . 16 2 .29 Amount of education 42 1 . 89 2 . 1 3 Education usefulness 41 1 . 16 2 .09 Job 41 1 .0 1 2 .68 Living standard 35 1 .32 2 .01 Intimate relationship 32 1 .25 2.06 Family life 35 1 . 1 8 2 .89 Savings, investments 23 1 . 5 1 2 .80 Neighbourhood 27 1 . 82 4.04 Housework 27 1 .47
The domains associated with activities external to the work place involving the well-being of
self, in relation to physical and psychological factors , have been rated to be of the most
importance. The factors which could be categorised more as maintenance tasks, such as
housework and savings, were rated the least important. The other domains were all rated to
be of importance and included personal relationships, living circumstances and job and
education factors . Not all ratings of satisfaction with the various domains correlated
significantly with the ratings of their importance. Those which did produce correlations (p <
.001) , although only moderate in size, were reported in Table 7 . 1 8 .

361
Certainly for the domains of key interest in this study, those of job and leisure satisfaction,
correlated with their importance. For these domains then, a high rating of importance was
associated with a high rating of satisfaction, except in the case of living standard where the
correlation was negative. When satisfaction with living standard was lower, its importance
scores were higher.
It is not surprising in a study involving the early stages of employment that the importance
of health and savings were less associated with job satisfaction. Although the location and
neighbourhood may not always be ideal when people begin in paid work, respondents may
consider them satisfactory for that stage. This may be the case where choice of location, and
neighbourhood are more likely to be dependent upon factors such as proximity to work and
accommodation that can be afforded. The actual ratings of the domains rated less important
were still above the midpoint of the importance scale, so that all the domains in fact were
rated important. The importance of family may be less for this group than for other groups ,
because many of the respondents were at the age of separating from their families to begin
life as independent adults . Also they have been in a period of strong peer influences .
Table 7 . 1 8 Correlation between domains of satisfaction and perceived importance of the
domains (p . < .001) .
Domains
Use of education Job satisfaction Leisure satisfaction Living standard Family satisfaction
r
. 33
.22
.33 - .23 .28
From Tables 7 . 16 and 7 . 17 it can be seen that friendship satisfaction was associated with a
sense of well-being and was rated as one of the three most important domains . However there
was no significant correlation between its importance and the degree of satisfaction. Health
was also rated as one of the most important domains but satisfaction with health did not
correlate with its importance and it was not associated with well-being. The age of the sample
was young and therefore may enjoy a better standard of health than the general population.
Most did in fact report to be in good health. Health was probably less of an issue because it

362
appeared not to create any problems for the respondents . Probably for similar reasons, health
did not correlate significantly with either the single-item job satisfaction measure or the MSQ
General Satisfaction scale .
Job satisfaction correlated significantly with the index of well-being for the second stage, r
= .40 (p . < .00 1) , accounting for 1 6 % of the variance. With respect to the other domains
of satisfaction, correlations of a size similar to that found for job satisfaction occurred.
Satisfaction with accommodation and with living circumstances were the only two where a
significant correlation did not emerge.
Table 7 . 1 9 The Proportion o f Shared Variance (r2) between the Index of Well-being and
the Satisfaction Domain Scores for two studies (Campbell, Converse and
Rodgers ( 1976) and the present study
Campbell et al Present study
r2 r
Non-work .29 .25 Family life .28 .08 Standard of living .23 . 0 1 Work . 18 . 16 Marriage . 16 . 1 8 Savings . 15 .03 Friendships . 13 . 24 Location . 1 1 . 1 1 Housing . 1 1 . 0 1 Amount of education .09 . 10 Neighbourhood .08 . 07 Life in N.Z. .08 .08 Usefulness of education .08 . 17 Health .08 . 02
A multiple r of . 54 resulted when subjective well-being was regressed on employment
satisfaction, leisure satisfaction and health. Using multiple analysis of variance and averaged
squared correlations , employment satisfaction produced average squared correlations of .27
with subjective well-being, .42 with leisure satisfaction, and .02 with health. The social
support variables of satisfaction with neighbourhood, friendships, love, family and home
resulted in average squared correlations of . 1 1 , .52, . 30 , . 1 1 and . 12, respectively with
subjective well-being. Leisure satisfaction and satisfaction with friendships appear to be the
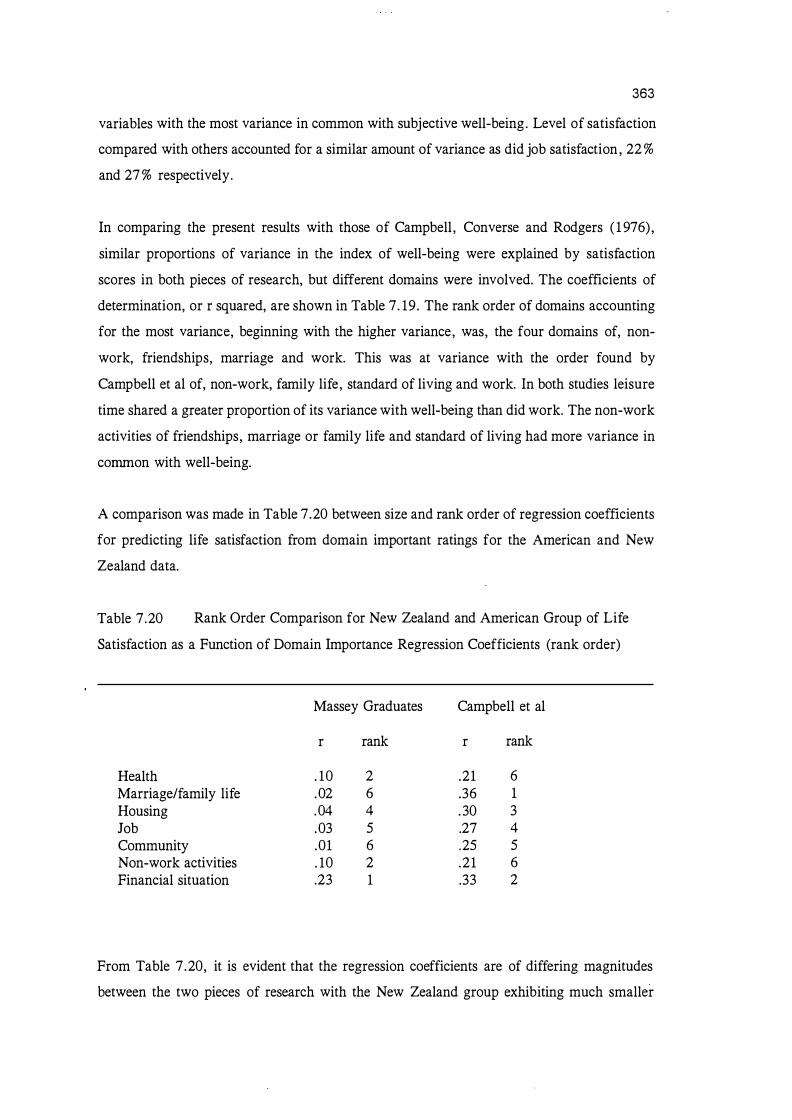
363
variables with the most variance in common with subjective well-being. Level of satisfaction
compared with others accounted for a similar amount of variance as did job satisfaction , 22 %
and 27 % respectively.
In comparing the present results with those of Campbell , Converse and Rodgers ( 1 976) ,
similar proportions of variance in the index of well-being were explained by satisfaction
scores in both pieces of research, but different domains were involved. The coefficients of
determination, or r squared, are shown in Table 7. 19 . The rank order of domains accounting
for the most variance, beginning with the higher variance, was, the four domains of, non
work, friendships, marriage and work. This was at variance with the order found by
Campbell et al of, non-work, family life , standard of living and work. In both studies leisure
time shared a greater proportion of its variance with well-being than did work. The non-work
activities of friendships, marriage or family life and standard of living had more variance in
common with well-being.
A comparison was made in Table 7.20 between size and rank order of regression coefficients
for predicting life satisfaction from domain important ratings for the American and New
Zealand data.
Table 7.20 Rank Order Comparison for New Zealand and American Group of Life
Satisfaction as a Function of Domain Importance Regression Coefficients (rank order)
Massey Graduates Campbell et al
r rank r rank
Health . 10 2 .21 6 Marriage/family life .02 6 .36 1 Housing .04 4 . 30 3 Job .03 5 .27 4 Community .01 6 .25 5 Non-work activities . 10 2 .21 6 Financial situation .23 1 .33 2
From Table 7 .20, it is evident that the regression coefficients are of differing magnitudes
between the two pieces of research with the New Zealand group exhibiting much smaller
364
coefficients . For the New Zealand group, financial situation, non-work activities and health
importance ratings were the better predictors of life satisfaction. For Campbell et al marriage
and financial situation contributed most to life satisfaction. Housing, job and community were
ranked the same in both groups . Marriage was the least associated with life satisfaction for
the New Zealand group. This might be expected to some extent because the group were
recent graduates for whom marriage may not be an immediate goal. Health and non-work
activities were better predictors of life satisfaction for Campbell et al.
7 .2 . 1 1 Relative importance of work as a moderator
Hypothesis 9 : "The effect employment satisfaction has upon subjective well-being is
moderated by the relative importance of work, that is, employment satisfaction will have less
of an effect upon subjective well-being where employment is considered less important than
leisure activities . "
Using MANOV A the interaction term of importance of work was examined in the
employment/satisfaction well-being relationship. The correlation between the Index of Well
being and job satisfaction, single-item measure, was . 96 , and r square .92. The interaction
term of .29 produced an r square of .08. Employment satisfaction and well-being had most
of their variance in common, with the importance of work acting as a moderator but
accounting for little of the variance. In contrast to Campbell, Converse and Rodgers findings
with respect to their domain importance ratings, differences in satisfaction ratings were
accounted for to some extent by differences in their importance.
When job satisfaction is regressed on well-being alone, a large proportion of their variance
was found to be in common. However, when leisure satisfaction was included along with
other factors, such as in Hypothesis 8 , leisure satisfaction accounted for a relatively larger
proportion of the variance.
7 .2 . 12 Occupational fantasy and job satisfaction
Hypothesis 10 : "Job satisfaction is associated with the degree of correspondence between
occupational fantasy and occupational reality " .
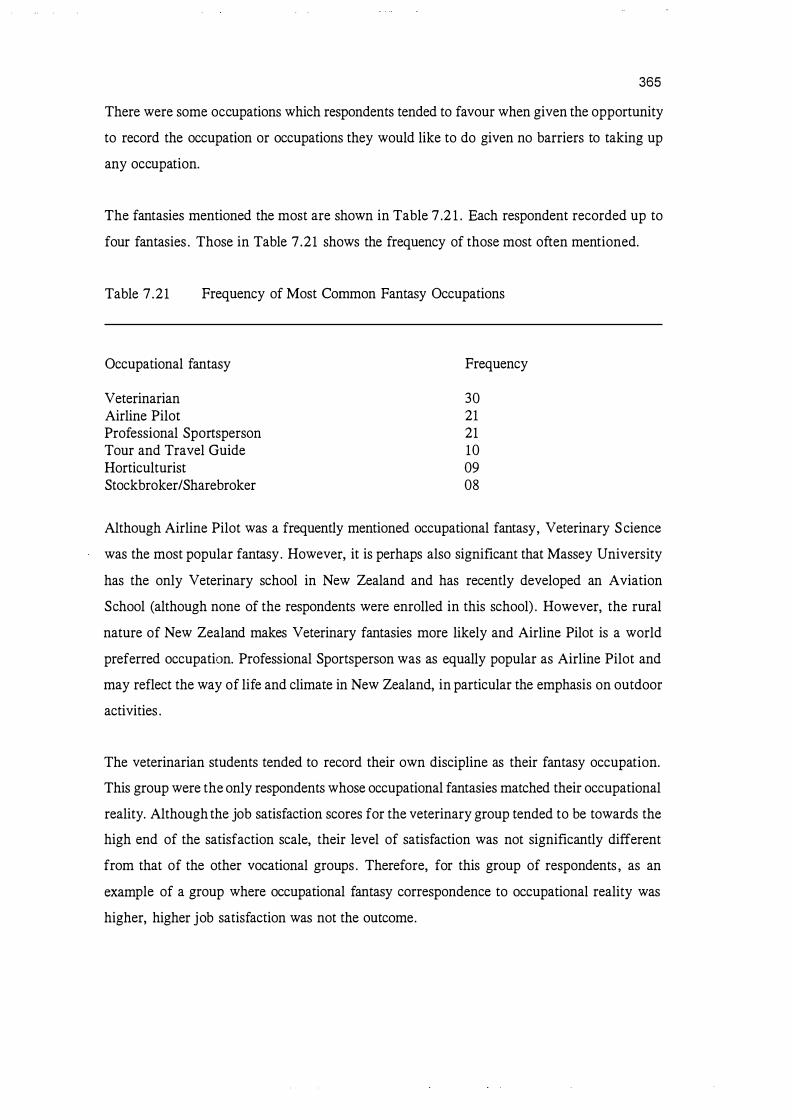
365
There were some occupations which respondents tended to favour when given the opportunity
to record the occupation or occupations they would like to do given no barriers to taking up
any occupation.
The fantasies mentioned the most are shown in Table 7 .2 1 . Each respondent recorded up to
four fantasies . Those in Table 7 .21 shows the frequency of those most often mentioned.
Table 7 .21 Frequency of Most Common Fantasy Occupations
Occupational fantasy
Veterinarian Airline Pilot Professional Sportsperson Tour and Travel Guide Horticulturist Stockbroker/Sharebroker
Frequency
30 21 21 10 09 08
Although Airline Pilot was a frequently mentioned occupational fantasy, Veterinary S cience
was the most popular fantasy. However, it is perhaps also significant that Massey University
has the only Veterinary school in New Zealand and has recently developed an Aviation
School (although none of the respondents were enrolled in this school) . However, the rural
nature of New Zealand makes Veterinary fantasies more likely and Airline Pilot is a world
preferred occupation. Professional Sportsperson was as equally popular as Airline Pilot and
may reflect the way of life and climate in New Zealand, in particular the emphasis on outdoor
activities .
The veterinarian students tended to record their own discipline as their fantasy occupation.
This group were the only respondents whose occupational fantasies matched their occupational
reality. Although the job satisfaction scores for the veterinary group tended to be towards the
high end of the satisfaction scale, their level of satisfaction was not significantly different
from that of the other vocational groups . Therefore, for this group of respondents , as an
example of a group where occupational fantasy correspondence to occupational reality was
higher, higher job satisfaction was not the outcome.

366
Allied to hypothesis 10 is the question of the extent to which the occupations individuals
expect to occupy in the long term are related to their occupational fantasies. Such a question
clarifies whether occupational fantasies for some are expected to become occupational
realities . The nearer an individual is to achieving such a goal the more satisfying their job
would be expected to be. The first nominated occupational fantasy was usually not associated
with any of the occupational plans (plan A, B , or C). The second fantasy mentioned
correlated with plan C only ( .3 1 , P. < .01) . The third occupational fantasy mentioned
correlated with both plans A and B ( .34 and .44, respectively) .
The first four occupational fantasies correlated with expected long term occupations . With
respect to the second long term occupation mentioned, the first mentioned fantasy correlated
. 2 1 , the second .57 and the third . 6 1 . (p. < .01) . It seems the later a fantasy was included
in a list of fantasies the more it was similar to expected long-term occupations and was thus
perhaps approaching expected reality . The nature of the construct of occupational fantasy may
be such that some fantasies are more fanciful and would not be expected to eventuate while
others are achievable long-term goals . Similarities among respondents were found in the
initial occupational fantasies recorded.
Consistent with the findings about occupational fantasies and occupational plans, the first
position taken up correlated . 65 (p . < .05) with the fourth occupational fantasy mentioned,
but not with any of the other fantasies. However, only 10 of the respondents included a fourth
occupational fantasy. For those respondents their last mentioned fantasy more closely
approximated their occupational plans, thus probably becoming less of a fantasy and more of
a dream which could be realised or an occupational goal.
7 .2 . 1 3 Job satisfaction and planned occupation/actual occupation correspondence
Hypothesis 1 1 : "Job satisfaction is a function of the degree of correspondence between
planned occupation and actual occupation" .
The correlations between positions taken up and occupational plans in Table 7 .22 show that
both the first and second plans were associated with positions taken up. The magnitude of the
association between occupational plans and the first position taken up was smaller than for
the second position. But these figures need to be interpreted with caution because the first
position and the current position were not always independent measures . In some cases the

367
first position was also the one respondents were in at the time they were surveyed. Because
the size of the groups varied for these correlations some caution needs to be exercised in their
interpretation although they were all significant at the .01 level.
Table 7 .22 Association between Occupation and Previous Occupational Plans
Occupation
1 st position
position at follow up
1st plan
.29
. 5 1
2nd plan 3rd plan
.20 NS
.52 NS
With respect to short term occupational plans prior to graduation, over 70 % of the
respondents classified the probability of their carrying out their first plan as very good or
good on a five-point scale of very good to very poor. For the second plan given, the median
was around the 'average' probability. For plan B, 1 9 % intended to re-train in some way, 3 %
wished to work part-time, 45 % planned to work full-time, 1 1 % wished to travel , 2 % planned
self-employment, and the remaining expected to be in temporary employment ( 1 8 % ) ,
unemployed (0. 3 % ) o r did not know what would do (1 .7%) .
When likely long-term occupation was compared with respondents ' first expected occupation,
respondents were found to nominate up to four occupations they would be likely to undertake
in the long term. Only the first occupation mentioned correlated significantly with their plans
upon graduation, resulting in a correlation of . 15 at the .01 level. Thus most of long term
plans were different from those being adopted in early employment. The degree of
correspondence of planned occupation and actual occupation was not high at this early stage
of employment, certainly not high enough to be related to levels of job satisfaction. Again
because there were no significant differences among levels of job satisfaction for the different
vocational groups, a search for causes such as degree of correspondence between planned and
actual occupations becomes irrelevant.

368
7.3 A summary of the fmdings in relation to Dawis and Lofquist's theoretical model
A summary of the fmdings of the propositions examined in the present study is presented next
in section 7 . 3 . 1 . This summary gives a brief statement of the proposition, whether it was
supported (or supported for only some aspects) and the percentage of shared variance between
the variables of the proposition (subsection 7 .3 . 1) . Following this, interpretation of the
findings is given for those relating to job satisfaction (subsection 7 .3 .2) , for satisfactoriness
(subsection 7 .3 . 3) , for tenure (subsection 7 .3 .4) and for adjustment styles (subsection 7 .3 .5) .
Implications o f the findings relating t o the relationships among Dawis and Lofquist's key
variables investigated in this study are presented in subsection 7 .3 .6 . The implications of the
variables introduced in the present study are examined in section 7 .4.
7.3 . 1 A summary of Dawis and Lofquist's Propositions and the Hypotheses of the
present study
Proposition
I
Satisfaction and Satisfactoriness predict work adjustment
for satisfaction
for satisfactoriness items
m
Satisfaction a function of need- reinforcer correspondence
V
Satisfactoriness as a moderator on the effect of need-reinforcer correspondence on satisfaction
Support
YES
41 %
5 %
for some needs only for achievement, variety, ability utilisation, supervision (technical)
for some needs for authority, pay, social status , supervision (technical) , variety
% shared variance
48 %
25 %
2 % 2 % 4 % 2 % 6 %
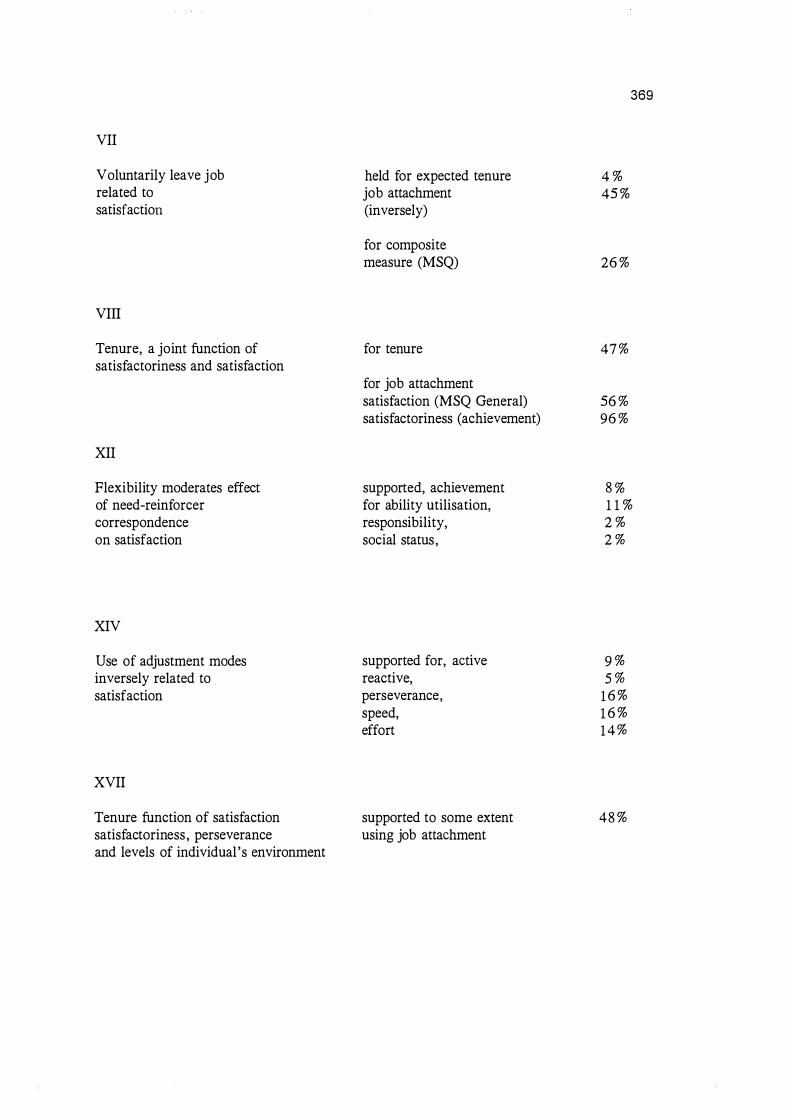
VII
Voluntarily leave job related to satisfaction
VIII
Tenure, a joint function of satisfactoriness and satisfaction
XII
Flexibility moderates effect of need-reinforcer correspondence on satisfaction
XIV
Use of adjustment modes inversely related to satisfaction
XVII
Tenure function of satisfaction satisfactoriness, perseverance and levels of individual 's environment
held for expected tenure job attachment (inversely)
for composite measure (MSQ)
for tenure
for job attachment satisfaction (MSQ General) satisfactoriness (achievement)
supported, achievement for ability utilisation, responsibility, social status,
supported for, active reactive, perseverance, speed, effort
supported to some extent using job attachment
369
4 % 45 %
26 %
47 %
56 % 96 %
8 % 1 1 % 2 % 2 %
9 % 5 %
1 6 % 1 6 % 1 4 %
48 %
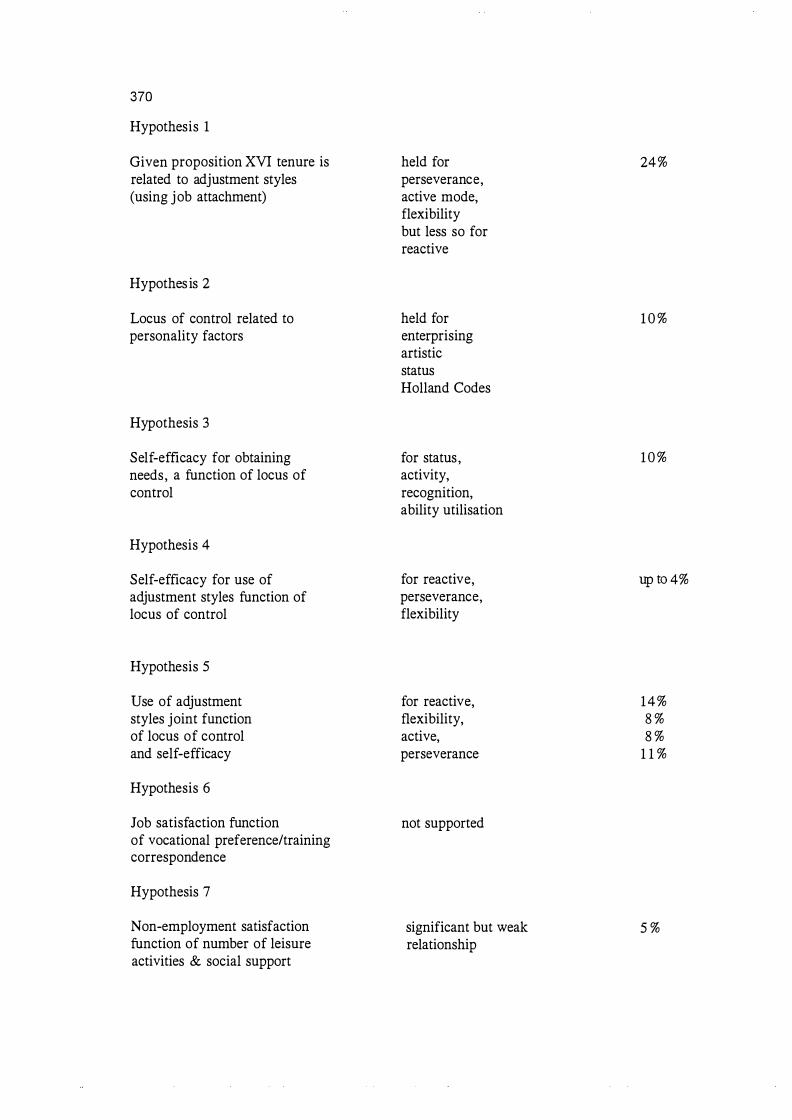
370
Hypothesis 1
Given proposition XVI tenure is held for 24% related to adjustment styles perseverance, (using job attachment) active mode,
flexibility but less so for reactive
Hypothes is 2
Locus of control related to held for 1 0 % personality factors enterprising
artistic status Holland Codes
Hypothesis 3
Self-efficacy for obtaining for status, 1 0 % needs, a function of locus of activity, control recognition,
ability utilisation
Hypothesis 4
Self-efficacy for use of for reactive, up to 4% adjustment styles function of perseverance, locus of control flexibility
Hypothesis 5
Use of adjustment for reactive, 1 4 % styles joint function flexibility, 8 % of locus of control active, 8 % and self-efficacy perseverance 1 1 %
Hypothesis 6
Job satisfaction function not supported of vocational preference/training correspondence
Hypothesis 7
Non-employment satisfaction significant but weak 5 % function of number of leisure relationship activities & social support
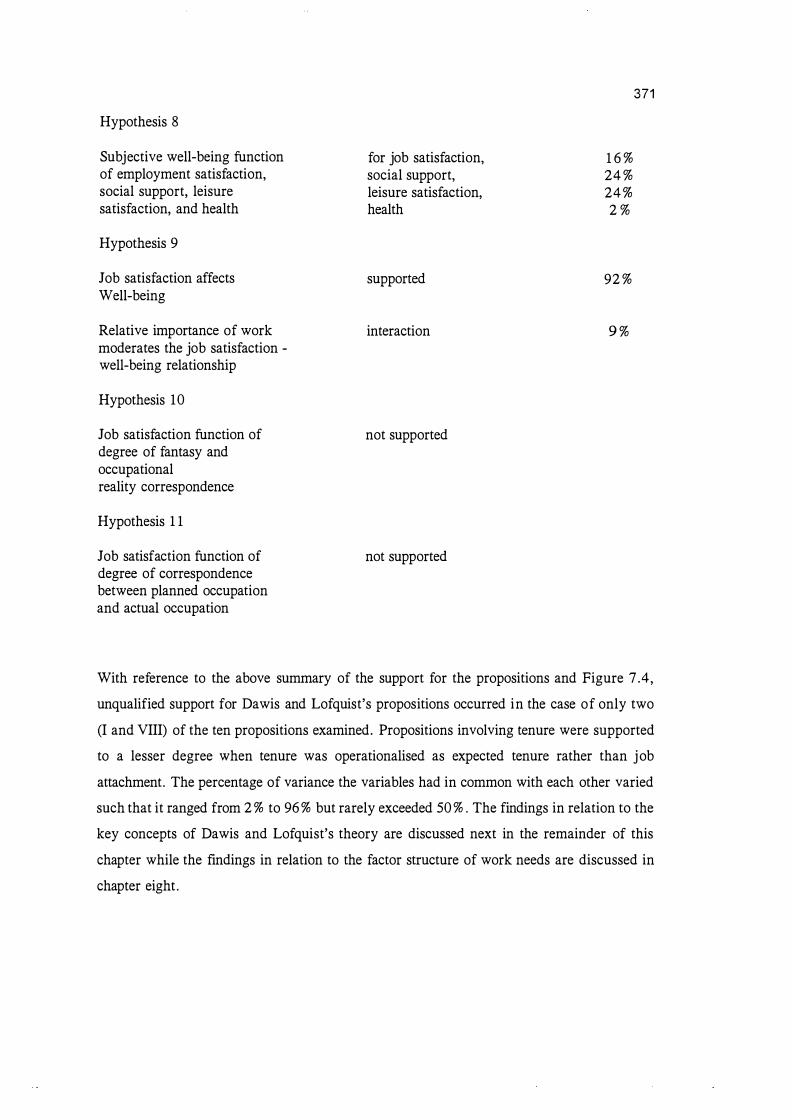
371
Hypothesis 8
Subjective well-being function for job satisfaction, 1 6 % of employment satisfaction, social support, 24 % social support, leisure leisure satisfaction, 24 % satisfaction, and health health 2 %
Hypothesis 9
Job satisfaction affects supported 92 % Well-being
Relative importance of work interaction 9 % moderates the job satisfaction -well-being relationship
Hypothesis 10
Job satisfaction function of not supported degree of fantasy and occupational reality correspondence
Hypothesis 1 1
Job satisfaction function of not supported degree of correspondence between planned occupation and actual occupation
With reference to the above summary of the support for the propositions and Figure 7 .4,
unqualified support for Dawis and Lofquist's propositions occurred in the case of only two
(I and VIII) of the ten propositions examined. Propositions involving tenure were supported
to a lesser degree when tenure was operationalised as expected tenure rather than job
attachment. The percentage of variance the variables had in common with each other varied
such that it ranged from 2 % to 96 % but rarely exceeded 50 % . The findings in relation to the
key concepts of Dawis and Lofquist's theory are discussed next in the remainder of this
chapter while the findings in relation to the factor structure of work needs are discussed in
chapter eight .
372
7.3 .2 Job satisfaction
The key fmdings in relation to job satisfaction were that not all work needs had to correspond
with their work reinforcers for satisfaction to occur and satisfaction as a predictor of tenure
in this instance showed little promise. The particular respondent group again may have
contributed to this because the factors other than satisfaction are more likely to account for
expected tenure in a group of graduates in early employment.
Satisfaction with work has been found to demonstrate a curvilinear relationship with
organisational tenure. However only 1 % of the variance was accounted for by this
relationship. The lowest satisfaction evident was at the so called advancement career stage
(age 30 to 45), (Morrow and McElroy, 1 987) . However, the differences reported there were
small and not tested for significance.
That not all work needs had to correspond with their work reinforcers in order for a
reasonable level of job satisfaction to occur has implications for how easily the theory of work
adjustment can be applied. Individuals achieving an equal level of satisfaction are likely to
have attained this through differing work needs being reinforced (perhaps only a single
item, global measure of need-reinforcer correspondence may be needed as a predictor of job
satisfaction where little specificity of work needs is required) . That different work needs and
their reinforcement account for satisfaction in different individuals makes the application of
the theory easier at the individual than the group level. For individuals, selection and
placement of personnel, development and training, their unique profile of correspondent work
needs could be of assistance. However, with respect to groups of individuals and occupational
groups, there is less likely to be a unique profile representative of the work needs . In job
analysis and job design there may be no group of work needs and reinforcers unique to a
particular job . Therefore, it may be difficult to achieve Dawis and Lofquist' s aim of selection
equations based upon groups of satisfied workers . Although need satisfaction equations for
individuals might be more easily developed, accomplishing the same for groups of workers
or for particular occupations would be more difficult, if impossible in some cases .
If the lack of success of correspondence in relation to work needs and reinforcers as
predictors of job satisfaction is because important variables are missing, one variable did
emerge as being capable of explaining more of the shared variance in job attachment than
correspondence, by accounting for 6 1 % . This variable was, job satisfaction compared with
373
that of friends, which was found to influence job attachment to a greater degree than did
need/reinforcer correspondence. If respondents judged themselves to be better satisfied than
their friends, their job satisfaction was higher. The highest correlations, those of job
satisfaction compared with friends, and life being rewarding, were more strongly associated
with job satisfaction measures than any of the need-reinforcer correspondence scores .
Subjective well-being was also a correlate of job satisfaction. In the case of respondents
making comparisons of themselves with friends, such a finding may be unique to a young
respondent group, where the influence of the peer group could be expected to be greater.
7 . 3 . 3 Satisfactoriness
The operationalisation of satisfactoriness was thought to affect observed relationships of
satisfactoriness with the tenure related measures . Skill and achievement measures correlated
more with both job attachment and expected tenure rather than the other measures which
would normally be regarded as estimates of satisfactoriness , such as following rules and
procedures, and performance. The use of achievement may not be an appropriate measure
because an individual rating themselves high on achievement does not necessarily mean they
are achieving to a satisfactory standard in accordance with the criteria of the organisation.
However, achievement may be a more appropriate measure of satisfactoriness than exercising
skills and abilities . The latter may simply indicate confidence about being able to use skills
and abilities . However, exercising skills and abilities may only be appropriate as
operationalisations of satisfactoriness if those skills and abilities match those of the work
environment. This was not investigated further in the present research because correspondence
between abilities and work environment ability requirements were not one of the main foci
of investigation.
7 .3 .4 Tenure
The expected tenure of the respondent group did not correlate well with the tenure perceived
to be usual for the job . It was concluded that the expected tenure for this group was atypical
for the occupations involved. This implies that tenure may not be an appropriate indicator of
work adjustment in this case. Aside from this it is argued also that tenure may not be a good
indicator of work adjustment per se because tenure could be influenced by other factors which
have little to do with work adjustment. It seems that Dawis and Lofquist were focusing upon
374
tenure as an indicator of work adjustment and an outcome of satisfaction and satisfactoriness .
They put less emphasis on satisfaction and satisfactoriness as important predictors of tenure.
If the focus had been on the prediction of tenure (rather than tenure as an outcome), then
satisfaction and satisfactoriness would not have been expected on their own to emerge as good
predictors (for reasons discussed in chapter four) . Many other variables , both internal and
external to the work setting, would be expected to be associated with tenure and these would
need to have been considered if prediction of tenure had been the main objective.
As expected, satisfaction and satisfactoriness were poor predictors of tenure. The construct
of job attachment correlated better with satisfaction and satisfactoriness than with expected
tenure. On this basis degree of job attachment would probably provide a better estimate of
degree of work adjustment. All that tenure may show is a limited amount of association with
work adjustment. It may be influenced by other factors more specifically for this group. Such
other factors might include the stage of employment. This group were in the initial stage of
their employment and may not remain in their positions long. More generally, the other
influencing factors might be the tenure for particular positions generally and the average
tenure for all occupations (which might be dependent upon other factors again such as
economic climate, employment needs and patterns of individuals moving to different jobs) .
Tenure may indicate at the very least that a level of work adjustment exists which allows an
individual to remain in a job at least for the minimum period that is usual . From the point
of view of an employer the minimum level of work adjustment which will result in tenure and
satisfactory work is all that may be expected. From the individual 's perspective, however,
a higher level of work adjustment may be of greater importance and their emphasis may be
on job satisfaction more than job satisfactoriness. They probably recognise the need for their
work to be at least at the minimum level of satisfactoriness which will allow them to remain
on the job, should they wish to stay, but they may emphasise the amount of satisfaction they
receive as the main contributor to their perception of their work adjustment. If an individual
is attached to their job it also tends to suggest they are satisfied at least to a minimum level
sufficient to allow them to remain on the job. An individual may aim for a minimum level
of satisfactoriness but a higher level of satisfaction while the employer would probably have
a higher level of satisfactoriness taking priority over satisfaction. However, high job
attachment, in contrast to tenure, may be indicative of more than minimum levels of
satisfaction and even satisfactoriness .

375
It could be argued that tenure as an indicator of work adjustment may reflect only minimum
levels of work adjustment or in some cases workers may be adjusted but leave for reasons un
related to work adjustment. Therefore, indicators of work adjustment other than tenure may
be more appropriate (such as job attachment and job commitment) . A more direct measure
of work adjustment such as self-perceived work adjustment may be another useful indicator.
There were other correlates of both satisfaction and satisfactoriness which may be useful in
assessing work adjustment. Such correlates found here were confidence in attaining authority,
in gaining autonomy and recognition, in engaging in work where there was activity and
variety, in having friendly eo-workers, in persevering, in being creative and in adopting an
active adjustment style.
7 . 3 . 5 Adjustment styles
That the correspondence between needs and reinforcers was moderated by the adjustment style
of flexibility for only five of Dawis and Lofquist's twenty work needs (ability utilisation,
achievement, responsibility, variety and social status) suggests their theory probably needed
to be more specific about which of the needs are more likely to be moderated by flexibility.
Of course not all needs were found to be important for all individuals , and not all
corresponded with reinforcers in the work environment, both of which would need to happen
for the moderating relationship to be able to occur. But for those where these conditions
existed, that is the need was considered important and did have available reinforcers , and the
moderating relationship then did not occur, we can question the validity of this particular
proposition of Dawis and Lofquist. An alternative explanation might be of course that for this
respondent group not all needs are moderated in this way.
In relation to the finding that not all of the adjustment modes were inversely related to job
satisfaction level, one would expect there to be an inverse relationship for the active and
reactive modes (as was found) and for perseverance, (in the case of the latter the higher the
satisfaction the less need there would be for perseverance) . That speed and effort were
inversely related to satisfaction was also not contrary to expectations . As satisfaction increased
one would expect speed and effort to decrease . The relationships which were not as Dawis
and Lofquist predicted were the positive relationships between the use of flexibility and
satisfaction and between endurance and satisfaction. Because these relationships were different
for different adjustment styles , they could be said to be type-of-adjustment-style dependent .
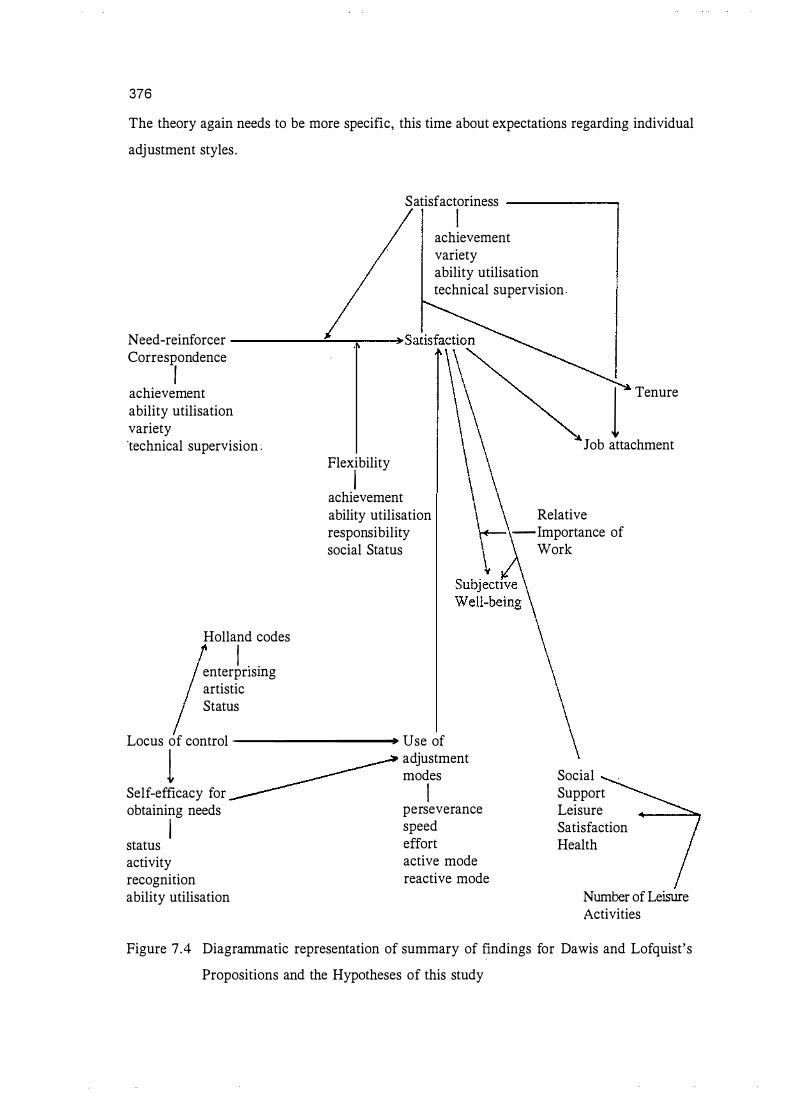
376
The theory again needs to be more specific, this time about expectations regarding individual
adjustment styles .
Satisfactoriness -------, I achievement variety ability utilisation technical supervision
Need-reinforcer -----�--=--� Correspondence I achievement ability utilisation variety 'technical supervision :
Holland codes
I . . enterpnsmg artistic Status
Flexibility I achievement ability utilisation responsibility social Status
Locus of control ----------+ Use of
l adjustment modes
Self-efficacy for I obtaining needs perseverance
I speed effort status
activity recognition ability utilisation
active mode reactive mode
1 Tenure
Job attachment
Relative -Importance of
Work
Social Support Leisure Satisfaction Health
Number of Leisure Activities
Figure 7.4 Diagrammatic representation of summary of findings for Dawis and Lofquist's
Propositions and the Hypotheses of this study
377
The basic notion relating to adjustment styles and satisfaction (that as satisfaction decreased
the need for the use of adjustment styles would increase) was supported for only some of the
styles . However, one might not expect flexibility and endurance to operate in the same way
as the other modes . It seems to make sense that low flexibility and endurance might be
associated with low satisfaction. However, it also seems congruent that one could be satisfied
and still demonstrate both high flexibility and endurance . A degree of flexibility may be
required to attain satisfaction and endurance might be needed to persist with behaviour that
can maintain job satisfaction.
7 .3 .6 Summary
Dawis and Lofquist justify the use of their theory as a personality theory and a motivation and
learning theory. They believe it to be useful in the areas of human development, social
behaviour and abnormal behaviour. They may have attempted to generalise their theory too
far . They claimed it provides a stimulus response orientation. Their theory was consistent
with the general behavioural tradition predominant at the time of their writing. However, the
theory could be interpreted without reference to a stimulus-response or the general
behavioural model of the time. Alternatively, cognitive and humanistic approaches may well
provide better explanations of the underlying relationships in a work adjustment model .
The criticisms extended in chapter four herein and discussed next appear to be justified.
Those which Neff ( 1985) listed and which were independently noted earlier when the present
research was begun, have validity. These were the abstract theoretical model not mirroring
the less well ordered reality, not all work needs being involved to the same extent, and
satisfaction and satisfactoriness not having an equal effect upon tenure . The finding that
another variable, job attachment, was more closely associated with satisfaction and
satisfactoriness may be generalisable to populations other than university graduates in the
initial stage of employment. Job attachment could well be interpreted in the framework of the
concepts of modern industrial psychology such as 'employment importance' (Feather, 1986)
or the work referents of 'career involvement' , 'job involvement' and 'organisational
commitment' that Morrow (1983) recommended be operationalised separately. In the event
of individuals being employed in many different jobs during their working life (in response
to their own needs, to economic climates and to changing work patterns) job satisfaction and
performance may have less of an influence on tenure than other factors . It might be preferable
to regard job satisfaction as a better outcome variable than tenure. This would be in keeping
378
with Mobley, Homer and Hollingsworth's ( 1978) findings that job satisfaction may be more
closely associated, negatively, with thoughts of leaving and intention to search for another
job, than with tenure. However, regarding satisfactoriness in the same way as an outcome
variable (but in its case as an outcome of the ability-ability requirement relationship) may not
be equally valid because satisfactoriness was seen to have a greater effect on tenure than
satisfaction. However, using both satisfaction and satisfactoriness together to predict work
adjustment (as in Dawis and Lofquist's Proposition I) would be expected to be more valid
than using the same two constructs to predict tenure. The two constructs could both be treated
as outcome variables and be regarded as indicators of the work adjustment construct but not
tenure.
Dawis and Lofquist' s newer part of work adjustment theory, that to do with adjustment styles,
seems to have suffered from over simplification or lack of specificity. It does not seem
reasonable to expect that typically a particular style would be favoured over others or be
characteristic of particular occupations . A more useful concept might be the extent to which
individuals are able to adapt by using the adjustment styles which will maximise both
satisfaction and satisfactoriness .
The generalisation of work adjustment theory across time to other stages of employment may
be more appropriate than applying it to the employment of university graduates in the initial
stage of employment. Although Dawis and Lofquist' s believed that the maturation of the work
personality coincides with beginning employment, this may not be the case for university
graduates . Individuals ' work needs at the two stages of the present study were not identical ,
however Dawis and Lofquist did not state how dissimilar they would have to be before they
would be regarded as unstable and therefore immature. In the present research a further
assessment at a later stage would have been required to see if and when the work needs had
stabilised. Because work adjustment theory assumes a mature work personality, the
application of it to a group for whom stability of needs has not been generally established,
needs to be undertaken with this in mind.
The whole area of the stability and maturity of work needs raises some general issues . The
climate in which Dawis and Lofquist's theory emerged was one of a more stable work force.
Currently with employees expecting to change jobs more often, their work needs may
correspondingly alter to some extent. Dawis and Lofquist believed work needs remained
stable unless other marked changes were affecting the individual . The changes they referred
379
to could be happening periodically throughout an individual 's working life, thus their work
needs may not stabilise or only for short periods . Therefore, it may not be appropriate per
se to view work needs as stable and unchanging. Even when an individual 's work situation
remains relatively stable and unchanging intuitively one would expect some changes in work
needs as the individual goes through stages in their life cycle.
The respondent group in this study may have particular characteristics that interact with the
application of work adjustment theory to them. Satisfactoriness and satisfaction not having
identical effects on tenure might be expected in a well-qualified respondent group which
would be likely to regard themselves as satisfactory in their job (if their academic training and
experience have direct application) . Therefore, they may believe their satisfactoriness to have
little influence on their degree of job attachment (and therefore work adjustment) . This group
of respondents may have a baseline of satisfactoriness which would predispose them towards
being work adjusted on that account, leaving more of the variance in work adjustment to be
explained by satisfaction and other factors . They may be unsatisfactory only in a small
number of factors . When a certain level of satisfactoriness is achieved and likely, it may no
longer influence work adjustment. Where satisfactoriness occurs at the beginning of
employment or soon after, it may not be part of the work adjustment process, until the job
changes in some way to produce new demands and the need for new or different skills.
If this respondent group is unsatisfactory in only a few factors these factors may be ones that
have less of an influence on job attachment than others . The lack of strong association
between satisfactoriness and tenure related variables may also have resulted from
'satisfactoriness ' having been measured differently in the present research. However, even
though this particular respondent group may view themselves as satisfactory to some extent,
because they have received the appropriate training and qualifications for the job, their
satisfactoriness may be less when they are first employed. In this early employment stage, job
attachment could be expected to be less because there has been little time for it to build.
When first employed, individuals may not expect to be satisfactory workers (until they have
had more training and experience perhaps) . The graduates were in their first half year of
employment which could coincide with the induction period within which any job training that
may be necessary would probably be given. The level of respondents ' satisfactoriness would
not necessarily influence the degree to which they are attached to their jobs at this early stage,
because both their satisfactoriness and their attachment could be developing still, and levels
of both might be expected to be lower than in a later stage of employment.

380
Of the other potential measures of work adjustment, job attachment may be a contender
because it correlated more highly with satisfaction. Expected tenure may tell us little about
the degree of work adjustment for this respondent group, because the average expected tenure
was so low. This seems consistent with these respondents being in their first job which may
be seen as a stepping stone to other jobs or the first step of a career. Therefore, job
attachment may provide a better outcome measure of job satisfaction and degree of work
adjustment for this group.
7.4 Summary and implications of fmdings in relation to the variables additional to
Dawis and Lofquist's theory
Of the variables introduced to the study, the findings in relation to personality type of factors
such as locus of control, self-efficacy and the use of adjustment styles are discussed in section
7 .4. 1 and the less work related factors such as non-work activities , general happiness, life
satisfaction and subjective well-being findings are discussed in section 7.4.2.
7 .4. 1 Locus of control, self-efficacy and use of adjustment styles
Locus of control
Locus of control ( operationalised using the personal competence measure) was of interest,
being associated with some of Holland's personality orientations , and the adjustment styles
of flexibility and perseverance. The lack of a relationship between personal competence (or
locus of control) and the reactive and active adjustment styles , may relate to adjustment styles
being situation specific. Personal competence and locus of control may be associated more
with choosing the appropriate style in response to a stimulus rather than the confidence to use
one or other of the styles .
The locus of control measure had a role to play along with self-efficacy, in the use of
adjustment styles . Any estimate of the use of adjustment style may be an important indicator
of future work adjustment, particularly if the use of adjustment styles is viewed as an
indicator of the potential to become adjusted to work. Measures of self-efficacy about having
work need reinforcers available and adopting adjustment styles taken at the first stage of the
longitudinal study correlated well with self-ratings about having work needs met and the use
of adjustment styles once on the job. That personality orientations of Holland were unable to

381
be of assistance in predicting level of personal competence/locus of control, may be allied to
the measure used for locus of control in this study or to the usefulness of the VPI more
generally. Further research using one of the longer and better known instruments , such as that
of Ratter ( 1966) refined along the lines O'Brien ( 1986) suggested, may be preferable to use
to examine this possibility .
Self-efficacy and self-efficacy for the use of adjustment styles
As would be expected, self-efficacy was associated more with variables operating at the
personal level than at the organisational level . That parental socio-economic level was
associated with level of self-efficacy is also not surprising. Self-efficacy has implications for
the preparation of individuals entering the work force. Obtaining estimates of self-efficacy for
obtaining work reinforcers (that are potentially under the control of the individual to attain)
and self-efficacy for adopting adjustment styles could be informative for the individual by
clarifying their attitudes and how these affect their work and further vocational options . Any
need for intervention to improve self-efficacy could be identified and acted upon. Self-efficacy
estimates may also be of assistance in the employee selection process as an indicator of
personal attitudes which may interact with other factors which are likely to affect job
suitability, performance, work adjustment and tenure.
Self-efficacy has received support relatively recently as a promising and legitimate construct
with respect to the study of careers , as demonstrated by an extensive literature review and
account of the empirical status and future directions of career self-efficacy (Lent and Hackett,
1 987) . Career self-efficacy was reported to have been examined in terms of career entry
variables such as career choice and academic achievement, persistence, and choice, the career
adjustment process, and in relation to causal links between self-efficacy and performance beh
aviour.
Possible gender differences in career self-efficacy has been a recurring theme. Although
gender differences in self-efficacy have been found to predict gender differences in consider
ing taking up certain occupations, no gender differences in overall self-efficacy were
identified here. Support has been found for the existence of career self-efficacy as a unique
construct distinct from overall self-confidence which could offer useful but not necessarily
sufficient information to aid in the prediction of career-related choices and behaviour. This
support was in the form of nonsignificant correlations between career self-efficacy and
measures of self-esteem and career indecision (Lent et al, 1986) .

382
Self-efficacy had been recognised as having potential for the understanding of career
adjustment (Hackett and Betz, 1981 ) and initial efforts were being made in this area at the
same time as the present research was being conducted, that is, Hackett, Betz and Doty
(1985) were seeking to define specific job-related skills critical to an academic career. Hackett
et al found self-efficacy to be moderately related to performance. Pre-test assessment of self
efficacy was found to have an affect on performance. It was thought that the method of
ascertaining self-efficacy enabled students to perform more competently by giving them
information about expected performance. Although not assessed in the present research, this
possible reactivity of the self-efficacy measure may be less of a problem here because self
efficacy measures were taken a year prior to the assessment of performance and as such
would not be expected to exert much influence.
Of the areas of self-efficacy research, the present research examined the career adjustment
process through self-efficacy for having work needs met (Betz and Hackett, 1981) , rather than
via self-efficacy for being qualified for, and being able to do different occupations . A
common criticism of self-efficacy research that it creates a "blame the victim" viewpoint, that
if the source of a problems lies with the individual then a lack of success at work can only
be blamed on the individual . Hackett, Lent and Greenhaus ( 1991) believed this criticism to
be unjust viewing self-efficacy instead as part of a social learning framework which takes into
account the reciprocal nature of person-environment relationships. However, at the same time
they suggested the expansion of self-efficacy theory to give more consideration of self-efficacy
in relation to environment variables (which occurred in the present research when self-efficacy
for obtaining work environment reinforcers was assessed).
In discussing further areas for career self-efficacy research, Hackett, Lent and Greenhaus
(1991) identified many others that have already been the subject of this present research (thus
giving some support and validity to their inclusion as suggested important constructs to
consider along with Lofquist and Dawis's theory of work adjustment) . Among areas identified
as ripe for research in relation to the impact of self-efficacy in the workplace are careers
adjustment, the prediction of job tenure, the prediction of satisfaction, career changes, and
occupational stress . As was examined in the present research, one of the theoretical specul
ations of Hackett, Lent and Greenhaus (op. cit.) was that self-efficacy is related to work
adjustment. They postulated that,
"When self-efficacy is defined operationally as perceived competence in the skills
required for ones's work performance, it is likely that high self-efficacy workers
383
report more job satisfaction, receive higher performance ratings, and achieve greater
job tenure than low self-efficacy workers (with actual ability held constant) . " (p 378)
It was noted that some circumstances may produce curvilinear relationships between self
efficacy and indices of work adjustment. The example given was that workers with moderate
self-efficacy may be more satisfied with repetitive and dull work than those with either very
low or very high self-efficacy expectations .
Support for extending the application of the self-efficacy model is evident in Hackett, Lent
and Greenhaus' (op.cit) conclusions where they noted support for the need to investigate
aspects of career development, in addition to occupational or major choices, when testing the
career self-efficacy model.
7 .4 .2 Factors less directly related to work: Non-work activities , happiness and life
satisfaction, social support and subjective well-being
Non-work activities
The principal findings in relation to the constructs explored to expand work adjustment theory
to include taking non-work activities into account were, that for this groups of respondents ,
leisure was rated as more important than work (although work was usually still rated as
important) . Satisfaction with non-work activities was seen to have a greater association with
well-being than did j ob satisfaction. On this basis alone it would seem important to consider
non-work activities when examining work adjustment because it may help account for
attitudes to work that are unexplained by work activities alone. In relation to leisure
satisfaction (like its work place counterpart, job satisfaction), the relative importance of work
and leisure interacted with it. As the relative importance of the job increased, the degree of
satisfaction with leisure activities decreased.
Happiness, life satisfaction and subjective well-being
The factors which are more external to the job itself but which were believed to have some
impact upon work adjustment (that is, happiness and life satisfaction measures or subjective
well-being, leisure satisfaction and social support) were found to be important to the work
adjustment process in the present study. Comparison of life and job satisfaction measures
indicated that more than half of the respondents were satisfied in their job and expressed life
satisfaction. Although more than half of the respondents saw themselves as being satisfied

384
with their job , a greater percentage still were satisfied with their life. For that proportion
satisfied with their life but dissatisfied with their j ob , there is the implication that being
satisfied overall may indicate a potential for obtaining j ob satisfaction. For these individuals
reasons for having attained life satisfaction may assist in the assessment of what is further
needed to obtain j ob satisfaction.
At the same time some of the skills used to achieve l ife satisfaction may be generalisable to
the work place in any attempt to achieve j ob satisfaction. Also the changes in happiness and
life satisfaction over time, as evidenced in this longitudinal study, can be used as a way of
identifying factors associated with those changes . As in previous research (Campbell et al ,
1 976) the happiness measures were only moderately correlated with well-being, supposedly
reflecting the lack of a cognitive component which seems to contribute to satisfaction rather
than to happiness measures, while life satisfaction measures achieved one of the highest
correlations (of r = .93) with well-being.
Some estimate of work adjustment from a measure of subjective well-being would seem to
have some validity because factors relating to the work place (such as self-efficacy for use
of adjustment styles and having work needs met, the use of adjustment styles and personal
competence) were found to be associated with well-being. That other factors external to the
work place (such as , satisfaction with education, level, friends and intimate relationships)
were also associated with well-being tends to indicate there is a relationship between work
adjustment type of factors and more general adjustment factors . When individuals make
ratings about their subjective well-being their judgements would be expected to include both
work and non-work factors , such that subjective well-being and work adjustment are related
measures which overlap. Looking at subjective well-being and work adjustment variables may
be of assistance in answering questions about the relationship between work and general
adjustment. The variables that were of importance to particular respondents tended to be more
associated with experiencing well-being in those areas . Although accounting for a small
amount of variance, the effect that job satisfaction had upon well-being was greater where
work was more important relative to non-work activities . It may be important to establish the
relative importance of the two domains of work and non-work while examining any reciprocal
relationships between well-being and j ob satisfaction (such as the influence of well-being upon
j ob satisfaction) .

385
In the second stage of the study, having work reinforcers available for individual needs and
using adjustment styles were both less associated with well-being than self-efficacy for well
being had been in stage one. This is consistent with work related factors being less associated
with well-being than non-work factors were. It is not surprising therefore that the work need
which was introduced in this study, that of the job being compatible with one's lifestyle, was
one of the work needs associated with well-being. A measure of satisfaction with living
circumstances was also associated with well-being for the second part of the study.
The other work needs associated with well-being could be categorised into (a) the more
personal needs of using skills and abilities, achieving, gaining autonomy and recognition, (b)
the needs more influenced by the organisation (pay, job security and supervision), and (c) ,
some of the adjustment style variables (the active mode and perseverance) .
Social Support
The availability of social support was associated with the measures related to general
adjustment such as satisfaction with living circumstances, happiness , well-being and life
satisfaction. In recent research examining social support and self-esteem, social support has
been found to have a positive relationship with self-esteem. The relationship between
psychological adjustment and later social support has been found to be more positive than the
relationship between social support and subsequent psychological adjustment. In terms of
establishing a causal direction, this was interpreted as suggesting that social support results
from psychological adjustment (Cramer, 1990) , rather than the reverse.
7 .4. 3 Findings in relation to the broader literature
Dawis and Lofquist in their development of work adjustment theory set out to integrate
disparate areas of literature such as the psychometric measures of job satisfaction and the
vocationally oriented areas of work motivation. The present research supported the contention
that the model needed to be expanded to take into account other significant areas of the
literature involving cognitive and social factors . Caution is needed in accepting Dawis and
Lofquist's claim for their work adjustment theory as a theory of personality and as a more
general theory of behaviour which could be applied to numerous settings . As a personality
theory their model does not have all the elements of contemporary personality theory as listed
by Staub ( 1980) and reported in section 2 . 1 . 3 herein. The expanded model of the present
research in fact does have all the elements present.
386
The present research echoes Landy's ( 1985) belief that it is questionable to separate work
from non-work attitudes and behaviour. Dawis and Lofquist 's need-oriented approach is
entitled to more recognition than the need approaches generally and warrants the use of the
title of 'theory' because they produced empirically testable interrelated propositions . Also
their focus was not only on identifying needs likely to be important to individuals but also on
the useful notion of the effect of needs corresponding with reinforcers in the work
environment. However, the present research demonstrated the need to expand the model to
take into account a motivational approach which acknowledges the importance of cognitive
and social factors .
With respect to the integration of some disciplinary perspectives the expanded model, with
reference to social reference groups and other social factors such as social support, moves to
a more social psychological perspective of accounting for the effect of individual' s social
groups on their work adjustment related behaviour. Gowler and Legge's ( 1982) criteria for
integration of disciplinary approaches, that is variables operating simultaneously at the level
of cause and content, have been met in the present research. The individual's work adjustment
variables and their social reference group variables (their job satisfaction level in relation to
their friends) are individual and group type of variables , respectively; this is their content
level . These variables are investigated at the individual and the group (academic group
differences) level; this is the causal level at which the variables are operating. That part of
the present research to do with analysis by academic groups and by individuals is in Riley's
( 1964) terms contextual analysis (as described in chapter one) which primarily focuses on
individuals and accounts for differences between groups . As an example of contextual analysis
the present research has therefore been more fruitful than if group or individual analysis alone
had been used.
The relationship between subjective well-being and job satisfaction is reminiscent of earlier
work adjustment research models where work adjustment was examined in relation to general
adjustment (Fisher and Henn, 193 1 ; Menninger, 1942; Schaffer 1953 ; and Clark, 1953) . This
is in contrast to Ginzberg ( 1962) maintaining that personal and general adjustment are not
related and Super's (1957) contention that no one type of adjustment would correlate highly
with the composite of general adjustment. The earlier emphasis on the use of job satisfaction
to evaluate work adjustment (Lurie, 1 942; Heron, 1952, 1954, Gellman, 1953 ; and Scott,
Dawis, England and Lofquist, 1968) was shown to still have relevance. Although Dawis and
Lofquist's (1968 , 1984) additional concept of satisfactoriness appears to have an important

387
role to play in predicting work adjustment, their emphasis on and use of tenure as an outcome
variable has little predictive value.
A person-environment fit approach focusing on personality factors , such as that of Holland
(1959) as measured through his Vocational Preference Inventory and the Strong-Campbell
Inventory does not appear to be of particular value in differentiating among the different
academic groups of this study. However, the presence of social support (which person
environment fit models expect will moderate the effect of stress) was found to contribute to
the existence of reasonable levels of job satisfaction and subjective well-being. The
importance of the cognitive perspective, in particular Payne's (1979) contention that the
individual 's perception of demands moderates the effects of stress (as discussed in chapter
one) was echoed in the usefulness of the self-efficacy concept in work adjustment, in the self
efficacy for the use of adjustment styles in particular . Self-efficacy has a strong cognitive
component in the degree to which individuals perceive themselves to be efficacious in
becoming adjusted.


389
CHAPTER EIGHT
RESULTS : WORK NEED FACTOR STRUCTURE
The results relating to aims three and four of the research, to investigate structural
relationships among Dawis and Lofquist's key concepts using LISREL and to explore the
underlying structure of work needs (using factor analysis and LISREL) are presented in this
chapter. The factor structure of the data is compared with that of Dawis and Lofquist' s
findings (section 8 . 1) . The work need factors arising from the present study were modelled
using LISREL and factor analysis (section 8 .2) . A meta-analysis involving work need factors
is presented in section 8 . 3 .
In general , the findings are reported in a manner which was consistent with the interactive
modelling process characteristic of the exploration of the latent structure of variables . In the
case of LISREL, initial models were modified in a series of analyses until the best fit for the
data, both statistically and substantively, was found. The results of the LISREL analyses are
discussed at each stage, before the next modification of a model occurred.
With respect to aim three of the research an attempt was made to apply LISREL to Dawis and
Lofquists ' paradigm as depicted in Figure 8 .2 using the LISREL general model (defined in
general terms in section 5 .4 .3 and Appendix K) and the measurement of it (using the MSQ
twenty work need scores , perceptions of available work reinforcers and school examination
grades to represent ability estimates, self-efficacy scores for performance to represent
satisfactoriness measures and expected tenure as a measure of tenure) . However, the model
failed to converge. It would appear that either the general LISREL model was inappropriate
or the data too large and the variables too diverse. However, as will be seen in section 8 .2,
when applied to the five work need factors which had emerged, the LISREL model was found
to be most useful.
8 . 1 Factor analyses
The factor analyses of work needs undertaken to replicate Dawis and Lofquist ' s factor
analysis are reported in section 8 . 1 . 1 , and a nonorthogonal rotation of factors assuming a
correlated factors model of work needs is reported in section 8 . 1 .2 .

390
8 . 1 . 1 . Replication of Dawis and Lofquist 's factor analysis for the present data
The work needs operationalised as the responses to the MIQ questionnaire items , were first
factor analyzed in the same way Dawis and Lofquist's had analyzed MIQ results . These
exploratory factor solutions like those of Dawis and Lofquist ( 1984) as reported in Tables 3 . 5
and 4 . 1 , used a principal factor solution with squared multiple correlations as communality
estimates and orthogonal rotation to a varimax criteria. Such an analysis of the present data
resulted in less factors , five instead of six, as reported in the rotated factor matrix, Table 8 . 1 .
Table 8 . 1 Principal Axis Factoring Rotated t o a Varimax Criteria for MIQ Data
Advancement .71570 .21 136 .21320 .04714 - . 19671 Recognition .69590 .26269 . 10573 . 09495 - .04885 Social status .60226 . 1 6327 - .01680 .2093 1 . 1 1427 Compensation .49298 .02565 . 3 1 130 .36230 -.23323 Achievement .48546 .44836 .21 152 . 17900 .25675 Authority .4339 1 .41488 . 16355 . 19836 - . 1 1935 Security .41828 - .03671 .33046 . 35237 .06158
Responsibility .26 1 9 1 . 80523 . 14046 . 12258 - .02075 Creativity .223 16 .74603 .05259 .06125 .21 1 86 Ability utilisation .40637 .53627 . 17204 . 13606 .22 1 15 Independence - .01 145 .43062 . 10915 .30261 .01350
Supervision/human . 10173 .23602 .72568 . 12125 . 16760 Company policies .06805 .06806 .70757 .08076 .26738 Supervision/technical .22383 .09772 .69301 . 15014 .02573
Coworkers .24007 ,07898 .28750 .60404 .20337 Variety . 13390 .42460 - .02782 .59292 .07937 Working conditions .25278 . 12359 .37891 .47277 .08681 Activity .20064 . 3 1609 .075 13 .44420 . 14455
Social service - .01928 .23884 . 15442 . 3 1599 . 63301 Moral values - . 06279 .02598 . 16769 .02845 .49422
Although there were some similarities between the Dawis and Lofquist's factor analysis and
those of the present study, there were some major differences, as represented in the first two
'need scales ' columns of Table 8 . 3 .

391
With reference to the varimax column of the present study in Table 8.3, factor one involved
work needs which were loaded on Dawis and Lofquist 's factors of status , achievement and
comfort. Factor two consisted of work needs from Dawis and Lofquist's autonomy,
achievement and comfort factors . Factor three was the same as Dawis and Lofquist ' s safety
factor. Factor four was made up of Dawis and Lofquist's comfort factor with one item from
their altruism factor. Factor five was the same as their altruism factor without the eo-worker
need scale.
8 . 1 .2 A correlated factors, higher order factor, model
To assess the way in which Dawis and Lofquist 's values served as reference dimensions for
work needs (that is , the factors underlying work needs or the latent variables of work needs)
and the possible intercorrelations, a correlated factors hierarchical model was examined.
Reinterpretation of factors was made to allow the possibility of correlations among them.
Upon investigating whether factors were correlated using principal axis facto ring (P A2 in
SPSSx, 1983), the nonorthogonal (oblimin) rotation did not converge in 25 iterations .
However, using a Maximum Likelihood Solution (and multiple squared correlation as
communality estimates) five factors were produced. The structure matrix1 is reported in
Table 8 .2 and the pattern matrix in Appendix K (Table K.3) . With reference to the factor
correlation matrix (shown in Table 8.4) , five of the ten possible factor correlations were of
a moderate size being between .33 and .46 and three of these were significant at the less than
.05 level , (r crit = .433, d.f. 19 . ) .
The factor structure (the variables ' correlations with the set of factors in the structure matrix
of Table 8.2) showed some similarities to the factors which arose from principal axis
facto ring rotated to a varimax criterion. Only the structure of one factor, Dawis and
Lofquist 's safety factor, remained the same for all analyses and rotations . This factor included
the work needs of supervision, both human relations and technical , and company policies and
practices .
1 The correlations of variables with the factors . The Pattern matrix (the weight matrix to calculate variable standard scores from factor standard scores) is reported in Appendix K.
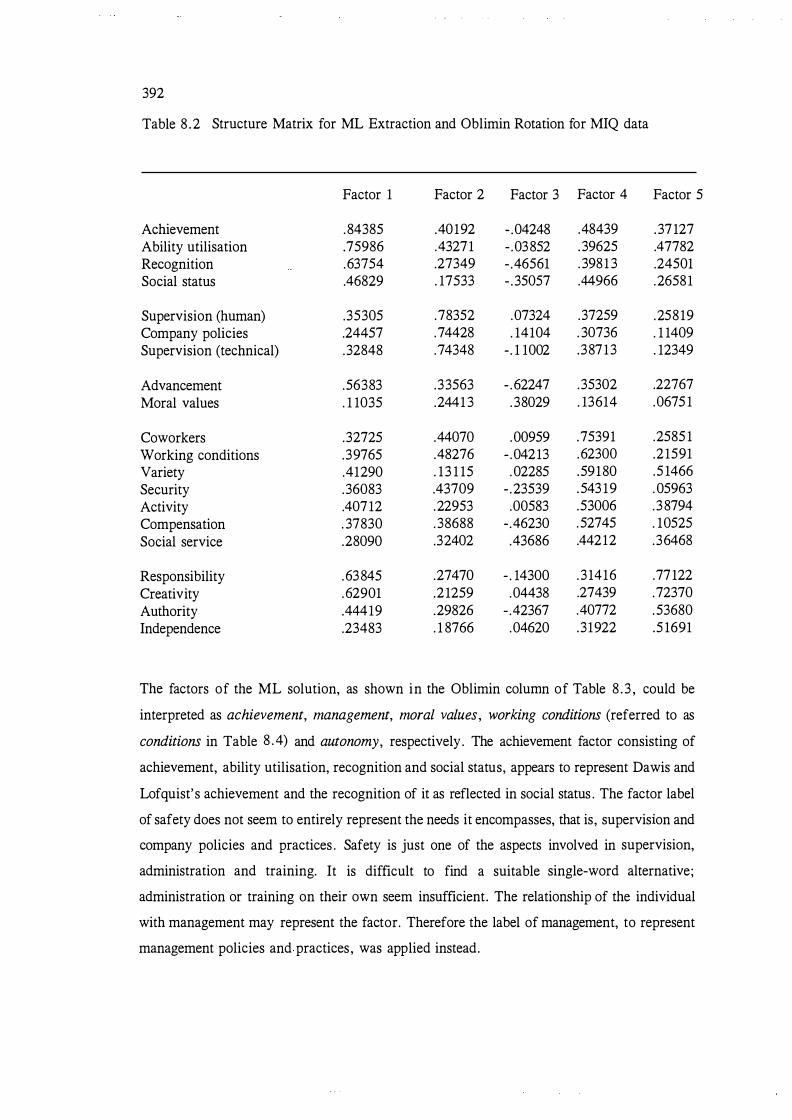
392
Table 8 .2 Structure Matrix for ML Extraction and Oblimin Rotation for MIQ data
Factor 1 Factor 2 Factor 3 Factor 4
Achievement .84385 .40192 - .04248 .48439 Ability utilisation .75986 .43271 - .03852 . 39625 Recognition .63754 .27349 - .46561 . 3981 3 Social status .46829 . 17533 - . 35057 .44966
Supervision (human) .35305 .78352 .07324 .37259 Company policies .24457 .74428 . 14104 . 30736 Supervision (technical) .32848 .74348 - . 1 1002 .38713
Advancement .56383 .33563 - . 62247 .35302 Moral values . 1 1035 .2441 3 . 38029 . 13614
Coworkers .32725 .44070 .00959 .75391 Working conditions .39765 .48276 - .04213 .62300 Variety .41290 . 1 3 1 15 .02285 .59180 Security .36083 .43709 - .23539 . 543 19 Activity .40712 .22953 .00583 .53006 Compensation . 37830 . 38688 - .46230 . 52745 Social service .28090 .32402 .43686 .44212
Responsibility .63845 .27470 - . 14300 . 3 1416 Creativity .62901 .2 1259 .04438 .27439 Authority .44419 .29826 - .42367 .40772 Independence .23483 . 1 8766 .04620 .31922
Factor 5
. 37127
.47782
.24501
.26581
.25819
. 1 1409
. 12349
.22767
.0675 1
.2585 1
.2 1591
.5 1466
.05963
. 38794
. 10525
.36468
.77122
.72370
. 53680
.5 1691
The factors of the ML solution, as shown in the Oblimin column of Table 8 . 3 , could be
interpreted as achievement, management, moral values, working conditions (referred to as
conditions in Table 8 . 4) and autonomy, respectively . The achievement factor consisting of
achievement, ability utilisation, recognition and social status, appears to represent Dawis and
Lofquist' s achievement and the recognition of it as reflected in social status . The factor label
of safety does not seem to entirely represent the needs it encompasses, that is, supervision and
company policies and practices . Safety is just one of the aspects involved in supervision,
administration and training. It is difficult to find a suitable single-word alternative;
administration or training on their own seem insufficient. The relationship of the individual
with management may represent the factor. Therefore the label of management, to represent
management policies and practices , was applied instead.
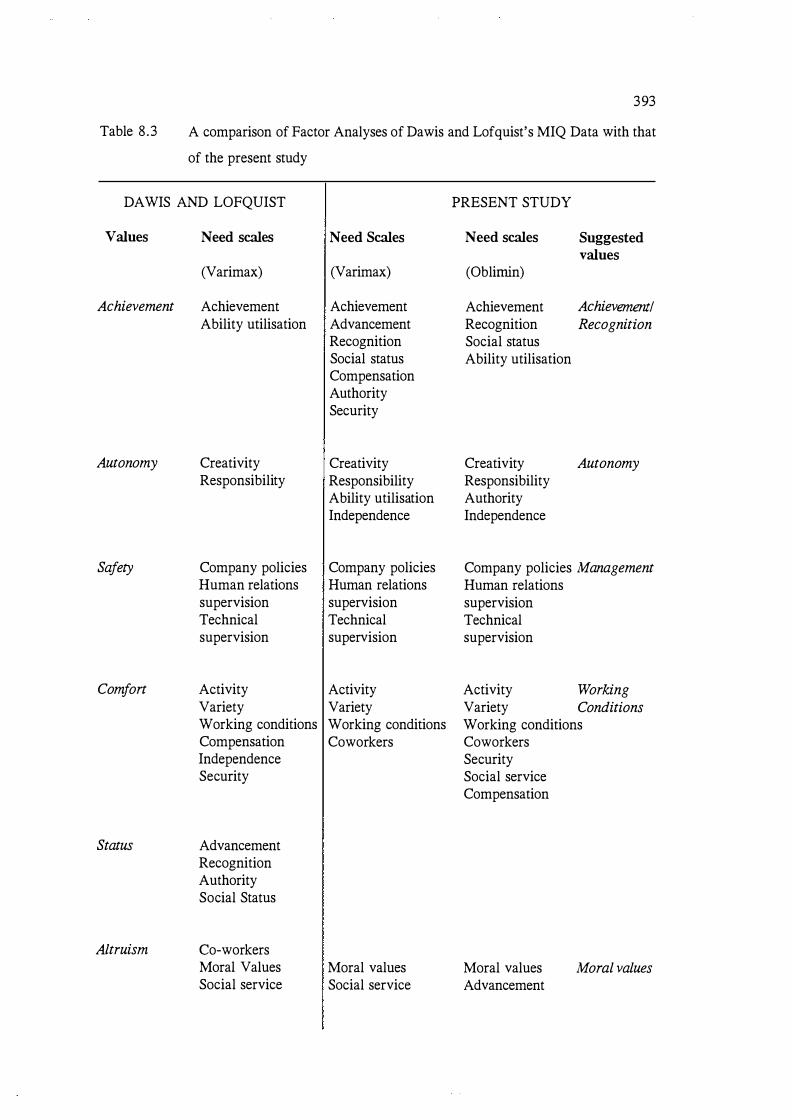
Table 8 .3
393
A comparison of Factor Analyses of Dawis and Lofquist's MIQ Data with that
of the present study
DAWIS AND LOFQUIST PRESENT STUDY
Values
Achievement
Autonomy
Safety
Comfort
Status
Altruism
Need scales
(Varimax)
Achievement Ability utilisation
Creativity Responsibility
Company policies Human relations supervision Technical supervision
Activity Variety Working conditions Compensation Independence Security
Advancement Recognition Authority Social Status
eo-workers Moral Values Social service
Need Scales
(Varimax)
Achievement Advancement Recognition Social status Compensation Authority Security
Creativity Responsibility Ability utilisation Independence
Company policies Human relations supervision Technical supervision
Activity Variety Working conditions Coworkers
Moral values Social service
Need scales
(Oblirnin)
Suggested values
Achievement Achievement/ Recognition Recognition Social status Ability utilisation
Creativity Responsibility Authority Independence
Autonomy
Company policies Management Human relations supervision Technical supervision
Activity Working Variety Conditions Working conditions Coworkers Security Social service Compensation
Moral values Advancement
Moral values

394
Table 8 .4 Factor Correlation Matrix for ML Extraction and Oblimin Rotation of MIQ Data
Achievement
Achievement Management Moral values Conditions Autonomy
Note.
* p < .05
Management
1 .00000 .37469
- . 17580 .46 141 * .44520*
Moral values Conditions Autonomy
1 .00000 .00995 1 .00000 .44 1 6 1 * - .08970 1 .00000 . 14427 .03607 .32854 1 . 00000
The moral values factor involved Dawis and Lofquist's advancement and moral values needs.
The factor consisting of responsibility, creativity, authority and independence seems well
represented by the label autonomy because the needs concerned involve a sense of autonomy,
individuality and independence. The factor consisting of friendly coworkers, working
conditions, variety, security, activity, compensation and social service might be better
represented by the label working conditions rather than comfort. The factors involve more of
the conditions of the work environment than might be immediately associated with the word
comfort. Therefore, the label comfort seems less descriptive and encompassing with respect
to all of the items.
In comparing the varimax and oblimin rotations (Table 8 .3) of the present study, work needs
which were identified as the same factor for both were: the achievement, recognition and
social status needs (of the achievement factor) ; the creativity, and responsibility needs (of the
autonomy factor) ; the company policies, and supervision needs (of the management factor) ;
and the activity, variety, working conditions and coworker needs (of the working conditions
factor). Therefore the work needs changing factors were ability utilisation (from autonomy
to achievement), authority (from achievement to autonomy), security and compensation (from
achievement to working conditions), social service needs (from altruism to working
conditions) and achievement (from achievement to altruism).
It is apparent from Table 8 .4 , (with its range of correlations) that the achievement factor
correlated more frequently with other factors and correlated negatively with moral values
only. Moral values was the factor which had the least in common with the other factors by
exhibiting zero or near-zero correlations with safety, working conditions and autonomy. The

395
placement of work needs in different factors resulting from nonorthogonal rotation happened
in the case of certain of the factors more than others . It is not surprising that the factors
involved were those which were correlated, those involved in the most changes being those
the most highly correlated. Work needs moved between the autonomy and achievement
factors and these factors were correlated r = .45 . The work needs of compensation and
security moved from the achievement factor to working conditions and these factors had
correlated r = .46 . The authority need moved from the achievement to the autonomy factor
and these factors had correlated (r = .45) . Among the less highly correlated factors moves
also occurred. The advancement need moved from the achievement to the altruism factor
(these factors had correlated r = - . 1 8) and the social service need moved from altruism to
working conditions (but these latter two factors had not correlated with each other with an
r of - .09) .
The existence of correlated needs reinforced the researcher's belief that Dawis and Lofquist' s
six needs were not independent. This belief was based on what makes sense in reality and on
an examination of Dawis and Lofquist's own factor analyses . The allocation of some needs
to certain factors appeared to be almost arbitrary, some needs could equally have been
regarded as belonging to two and sometimes more factors . The use of an orthogonal rotation
technique such as Varimax tends to artificially force factors to be independent of each other
(Gorsuch, 1983) and this is probably what happened. Because some of the needs were more
highly correlated than others , a hierarchical model with more than one order of factors
becomes likely.
The simpler model of a single higher order need was investigated first, using confirmatory
factor analysis through LISREL V and using half of the work needs . A more complex model
postulating more than one level of higher order needs would be better investigated through
exploratory factor analytic techniques and using all of the variables , the twenty work needs .
Long (1983) noted that generally the easiest way to estimate the confirmatory factor model
(CFM) is with software designed for the covariance structure model and that LISREL (version
I through V is one of the most commonly available programs) .

396
8 .2 Modelling the work need factors with LISREL and factor analysis
The work needs of the present study were modelled using LISREL in section 8 .2 . 1 and the
results from higher order factor analysis for the same data are presented in section 8 .2 .2 .
8 .2 . 1 Modelling the work need factors with LISREL
The various work need factor models examined and modified using LISREL to arrive at the
best fit between the model and the data are reported in Appendix K. The modelling process
is reported in keeping with Hayduk's (1987) recommendations that a modelling history be
provided in the reporting of LISREL results . In examining the factor structure of work needs ,
the work needs part of the sub-model relating to need-reinforcer correspondence in Figure 8 .2
was the area of interest. It represents a second-order factor analysis submodel of the LISREL
general model with first-order loadings given by Ay and second-order factor loadings given
by r (These gamma and lambda coefficients are shown in Figure K. 1 , Appendix K.) The
model is of the form of Joreskog's ( 1 969, 1970, 1973 , 1974) ACOVS-model .
Dawis and Lofquist's 1984 basic model or paradigm can be represented by the general
LISREL model (described in section 5 .2 .3 and represented mathematically in Appendix K)
and the structural model of the paradigm is depicted in Figure 8 .2 with a description of the
coefficients given in the footnote to the Table .
The conditions needed for model convergence (Fergusson and Horwood, 1986) appeared
satisfied, that is , there was a well specified causal theory which could be expressed as an
identified system of linear equations and that the data was of sufficient quality and quantity
to fit and test the model . Dawis and Lofquist's interconnected propositions could be specified
as a system of linear equations although they had not specified the error portion of their
model . The data appeared to be of sufficient quantity and quality. The sample size was more
than the recommended minimum number of 200. The values for the work need statements of
the MIQ fell within the expected range, they were comparable to the scores of Dawis and
Lofquist's data and no completed instruments were rejected through the MIQ's in-built
response consistency measure (The Totally Circular Triad Scores or TCTs) . On these bases
the MIQ data for the present research appeared of good quality .
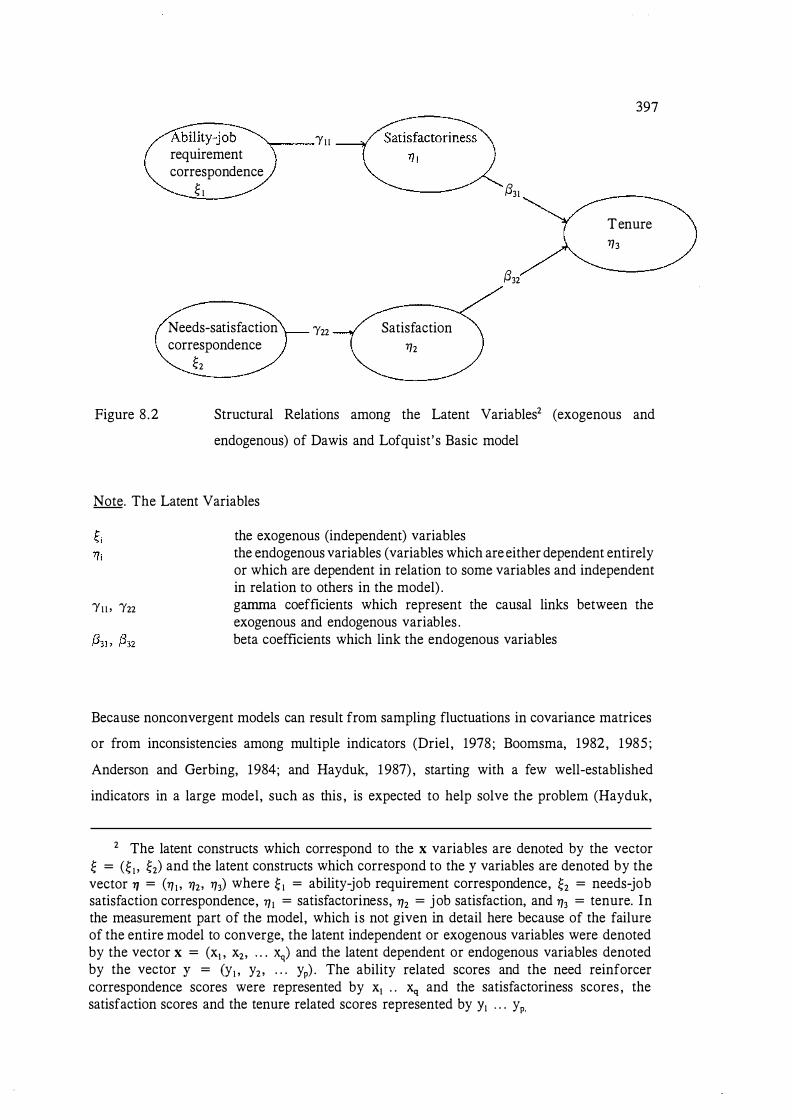
Figure 8 .2
397
'YII requirement correspondence
� I {33I
Tenure
Yf3
{332
Needs-satisfaction 1'22 Satisfaction correspondence Yf2
�2
Structural Relations among the Latent Variables2 (exogenous and
endogenous) of Dawis and Lofquist' s Basic model
Note. The Latent Variables
'YII ' 1'22
the exogenous (independent) variables the endogenous variables (variables which are either dependent entirely or which are dependent in relation to some variables and independent in relation to others in the model) . gamma coefficients which represent the causal links between the exogenous and endogenous variables . beta coefficients which link the endogenous variables
Because nonconvergent models can result from sampling fluctuations in covariance matrices
or from inconsistencies among multiple indicators (Driel , 1978 ; Boomsma, 1982, 1985 ;
Anderson and Gerbing, 1984; and Hayduk, 1987) , starting with a few well-established
indicators in a large model, such as this , is expected to help solve the problem (Hayduk,
2 The latent constructs which correspond to the x variables are denoted by the vector � = (� I '
�2) and the latent constructs which correspond to the y variables are denoted by the vector YJ = (YJ I , 712, YJ3) where � I = ability-job requirement correspondence, �2 = needs-job satisfaction correspondence, Yfi = satisfactoriness, YJ2 = j ob satisfaction, and YJ3 = tenure. In the measurement part of the model, which is not given in detail here because of the failure of the entire model to converge, the latent independent or exogenous variables were denoted by the vector x = (xi , x2, . . . Xq) and the latent dependent or endogenous variables denoted by the vector y = (Y� > y2, . . . yp) . The ability related scores and the need reinforcer correspondence scores were represented by xi . . xq and the satisfactoriness scores , the satisfaction scores and the tenure related scores represented by YI . . . Yp.
398
1987) . Therefore, a smaller number of indicators were chosen because of the difficulties
associated with fitting large models early on in the process . To avoid problems of a positive
definite matriX (which had occurred when the entire model was analyzed using LISREL) ,
matrices were kept small initially. Smaller matrices can also lessen the likelihood of
identification4 problems .
To elaborate on the issue of identification, Saris and Stronkhorst ( 1984) describe the study
of the identification of models in the following way. In LISREL the variances of covariances
or correlations obtained from data are expressed in the parameters of a model (a linear
structural relations model) . The relationships between the variances and covariances or
correlations and the parameters of the model are derived. For each combination of variables
the variances and covariances or correlations are expressed as a specific function of the
parameters of the model . The parameters are of special interest because they are more
fundamental (than the covariances etc . ) to the causal process. In trying to solve the structural
parameters from information supplied by the data a unique solution for the values of the
structural parameters cannot always be found from the values of variances and covariances
or correlations . It is this " Study of the uniqueness of the solution of the parameters which has
been called the study of identification of models " (Saris and Stonkhorst, op . cit. p . 1 3 1) .
There are both necessary and sufficient conditions for the identification of structural equation
models . The general rule in algebra is that a necessary condition for solving unknowns in
equations (the unknowns being the structural parameters in this case) is that the number of
unknowns should be equal or less than the number of distinct equations . The number of
equations equals the number of different variances and covariances (or correlations) of
observed variables . The difference between this number and the number of structural
parameters provides the number of degrees of freedom (df). The necessary condition for
identification is that the degrees of freedom should be equal to or larger than zero. The
necessary condition is not always sufficient for identification and each model needs to be
checked. A discussion of such other conditions as described in Saris and Stonkhorst (1984)
and Hayduk ( 1987) is not required here.
3 A positive definite matrix occurs when one or more of the variables in the data matrix is completely dependent upon one or more of the other variables in the matrix.
4 The question of identification refers to the lack of a unique solution for the values of the structural parameters . The identification issue is discussed in more detail in Appendix K.
399
Coefficients can lack identification for different reasons , such as collinearity and
multicollinearity and impossible estimates such as negative variances (negative variances are
impossible because the squaring of negative values which occurs in calculating variances
means they take on positive values only) . Collinearity and multicollinearity refers to the
situation where two (or more in the case of multicollinearity) variables are highly correlated.
In multiple regression it has the effect of regression slopes possibly being inaccurate or
unstable and there being no unique solution for the slope coefficients. Collinearity is detected
by large simple or multiple correlations among the independent variables or by unusually
large standard errors for slopes in regression equations . Sometimes indicative of identification
problems are matrices for which no inverse can be found (that is , is a singular matrix or one
with a zero determinant) . Because determinants of matrices are used in solving sets of
equations the absence of solutions can be regarded as questions about the rank (to do with a
nonzero determinant, invertibility, or nonsingularity) of particular matrices (Hayduk, 1987) .
Solutions to the problem of collinearity can include eliminating one or other of the collinear
variables or combining them to create a single scale.
The Maximum Likelihood estimates produced in LISREL are arrived at within a combination
of model and data constraints . The theoretical model constrains the estimates through
specification of the variables to be included and the location of the free coefficients (those to
be estimated) which link the variables . The data constrains the estimates because the
comparison of the :E (a model-and-estimate implied covariance matrix among the observed
indicators) and the data S (the observed covariance matrix) selects the best set of coefficient
estimates . It is the failure of the combined data and model constraints to locate or identify
unique estimates which results in the identification problem. The combined force of the theory
and data constraints are then insufficient to determine unique estimates of the structural
coefficients , thus more than one set of coefficient estimates imply the same best fitting :E. Hayduk (op . cit) notes that a way to visualise identified and unidentified coefficients is in the
context of the fit function. "LISREL creates maximum likelihood estimates by selecting as
estimates those coefficient values implying a :E maximising the likelihood that the observed
data S could arise by chance sampling fluctuations. If more than one set of coefficient
estimates imply the same best fitting :E, we have encountered the identification problem"
(Hayduk, op.cit. p. 140) .
400
Although not foolproof or always available, especially where model analysis does not
converge, there are checks within the LISREL which alert the researcher to the model not
being identified. If there is more than one way to calculate a particular coefficient the model
is said to be overidentified. If all the coefficients in a model are identified (or overidentified)
the entire model is identified. If even a single coefficient is not identified, the entire model
is not identified.
The overall goodness of fit of the models were estimated using the log likelihood ratio chi
square statistic. Hayduk (1987) noted that in contrast to the usual role of the null hypothesis
smaller x2 values are indicative of better fitting models , a nonsignificant I is desirable, and
accepting the null hypothesis amounts to accepting one's theory. Hayduk supported a
preference for using a . 1 or even a .2 level of significance. Accepting the null hypothesis that
the differences between the model-implied covariance matrix .E and the observed S are
sufficiently small to be sampling fluctuations at a .05 level, amounts to accepting a model if
the observed sampling fluctuations could be present in about 1 in every 20 samples. Hayduk
regards this as not a particularly strong confirmation of a model. It was noted that
interpretation of the x2 test should acknowledge the existence of an implicit alternative
hypothesis , that is an imaginary perfectly fitting model involving a perfect match between the
implied .E and S . A nonsignificant x2 is said to inform us that our model is not significantly
worse than a perfect model capable of predicting a .E that is the same as S . At the same time
we are reminded that the ability to perfectly reproduce or predict S does not guarantee that
a correct model has been specified and estimated, rather it simply means a set of estimates
have been located which make the model consistent with the observed data and that the model
has survived a challenge that many do not.
Another consideration taken into account in the use of i in LISREL was that it is an omnibus
test of all the model constraints and that tests of significance for single coefficients are made
via the difference between chi-squares for nestedmodels or t-tests . The T-values used are the
coefficient estimates divided by their standard errors , which therefore provide the number of
sampling distribution standard deviations the estimate is away from zero . This value is used
to test the null hypothesis that the value of the true parameter is zero . A final consideration
related to the feature of � common to most tests of significance is that with large sample
sizes even minute differences tend to be detectable as more than just sampling fluctuations
thus producing a statistically significant result.
401
With respect to chi-square and N, Hayduk (1987) demonstrated, for example, that a sample
100 times as large as the real sample produces a X: a hundred times larger. Among the
corrective strategies suggested in the literature are that x2 be expressed relative to the degrees
of freedom, that is x21d.f is a more appropriate measure when N is unusually large . Two
figures have been suggested in response to the question of how much larger x2 must be than
the degrees of freedom (the size of the x21d.f ratio) before a model is regarded as a poor fit.
Wheaton, Muthen, Alwin and Summers (1977) advocated x2 five times the degrees of
freedom, but Carmines and Mciver suggested (1977) that one to two times was more
acceptable .
. Hoelter (1983) argued against the x21d.f procedure (the ratio is a function of the number of
variables and estimated coefficients rather than N) and instead recommended focusing upon
the size of N. His formula for what he refers to as the critical - N (the size of the sample
required to make observed differences between :E and S just significant at a typical level of
significance such as . 05) identifies a critical - N as 200 or more as a reasonable criteria.
Hayduk noted the same decision criterion can be obtained without Hoetler's formula by just
using the x2
that results from inserting N = 200 in the LISREL program. If the real N is
larger (as in the case of the present research) , this is effectively ignoring the extra sensitivity
or precision that extra cases provide. If the real N is smaller, this is the same as asking if the
observed differences are large enough to be detected by a reasonable sized sample (N = 200) .
The most attention is paid to X: as an indicator of model fit if N is modest because if N is
large even trivial differences between :E and S become significant and if N is small x2 may
not be powerful enough to detect large differences . Hayduk ( 1977) has found x2 to be
instructive for N from about 50 to 500. But this range is thought to be dependent upon the
types of models estimated. The models examined in relation to sample size have tended to be
factor models rather than causal ones . Anderson and Gerbing (1984) found X: compared
favourably with several other indices. Hayduk has concluded that it is difficult to generalise
about sample size because results can be very different for different types of models , but
where N is less than 100 these analyses were thought to be deserving of extra attention.
In the present research the real N was located within the 50 to 500 range but the extra
sensitivity of an N that much above 200 did allow chi-square to become significant thus
showing a difference between the data and the theoretical model which capitalised upon trivial
differences . Therefore, an N of 200 (Hayduk's 1987 preference for controlling for a too large
402
sample size) was inserted in the programme for the purpose of calculating significance level
only and on this basis a non-significant chi-square resulted. Chi-square was used as just one
of several model quality indicators. The other ways of judging the quality of the model were
the examination of residuals, partial derivatives and modification indices .
8 .2.2 The fitted model
The Confirmatory Factor Analysis (using LISREL) was undertaken of Dawis and Lofquist's
six factor model with the addition of a single second or higher order need and of the five
factor analytic solution which emerged from the data of this study. Maximum Likelihood
extraction of factors rotated to an oblimin criteria was used. The models in LISREL
represented a second order factor model in which there was a general need factor subsuming
a number of specific first order factors . The fitted hierarchical model is depicted in Figure
8 .3 and a full specification, of the equations and parameter matrices of LISREL, is given in
Appendix K (K.3) .
Because o f the problems associated with multiple indicators and attempting to fit larger
models initially as already discussed, a smaller number of indicators (shown in Figure 8 .3)
than the twenty work needs were chosen to represent the work need factors . In order to keep
matrices small, the two better indicators for each factor (those loading most highly on their
factor) were selected. These variables were denoted y1 . . . . Yn (n= 12 in the first model and
10 in the subsequent models) . In keeping with the recommendation that a modelling history
be provided in the reporting of results of LISREL analyses (Hayduk, 1987) , this is reported
in detail with accompanying diagrams in Appendix K, K.4. In summary, there were four
models examined each involving different numbers of first factors . One model was a
representation of Dawis and Lofquist 's six factors plus a higher order work need factor using
12 indicators or work need variables . The other models used ten indicators and were five
factor hierarchical models with a sixth single higher order factor of work needs . The five
factors were selected on the basis of exploratory factor analysis of the data. The five factor
hierarchical model was analyzed first without estimating observed variable error terms , then
with some of the error terms and disturbance terms, and finally with some correlated error
and disturbance terms . Each model successively provided a closer fit to the data. The final
standardised solution (the penultimate model investigated) is presented in Figure 8 . 3 .

'Yil
I . 9 1
. 85 .84
I I A1 , 1 A2,1
Note. au a eh res ere shr cpp var WC sse mv a eh aut mgte alt
� 1 'YII • • • • 'Ys1 771 71s r1 rs A11 · · · · AlO,s Y1 Y10 €1 €10 0,1 e,3
. 81 I I /\5,3 A.6,3
'Y41 I ifis3 . 06 . 89 ......-
403
:Y5I I
.69 .46 I /..;,5 Aw,5
E4 E5 €6 €7 Eg Eg E 10 0€4 . .2_.1 --�0.:2JEJt=======· 1 0==2 =--J -----=..::· 0�28:.......JL36 I = Ability utilisation = Achievement = Responsibility = Creativity = Supervision (human relations) = Company policies and practices = Variety = Working conditions = Social service = Moral values = Achievement = Autonomy = Management = Altruism = A general work need factor = Gamma coefficients = First order factors (endogenous variables) = Eta disturbance terms (1{; = covariances among these errors) = Lambda coefficients = Observed variables = Error terms of observed variables = Covariances among error terms of observed variables
Figure 8 .3 Standardised Solution for the 30-Parameter Five-Factor Hierarchical Model
404
The standard errors of the observed variables in Figure 8 .3 (from the theta epsilon matrix of
the LISREL computer printout) and the standard errors of the coefficients in the model are
shown in Table K.4.7 in Appendix K. Appendix K.4 presents the series of models run in
order to arrive at the one which approximated the data best after modifying the model
according to the LISREL programme's modification indices . Section K.4.4 compares the
models in terms of the quality indicators of chi-square, small residuals and the programme's
modification indices .
Using criteria of goodness of fit other than just ..;, the 30 parameter five-factor hierarchical
penultimate model with correlated error terms and residuals, emerged as fitting the data
reasonably well . The final model did provide a nonsignificant chi-square but because the psi
matrix was not 'positive definite' the probable identification problems made this model
suspect. Consequently the penultimate model was the one used as shown in the standardised
solution of Figure 8 . 3 . The tests of significance for the model parameters in Table K.4 .3 of
Appendix K show all gamma and lambda coefficients to be significant at p < . 001 . The
covariances among the disturbance terms (PSI) which were significantly different from zero
(all at the < .00 1 except for the error term for altruism which was significant at the .01 level)
were the autonomy, management and altruism variances and the covariance between the
management and altruism disturbance terms. Only random error remained in the normalised
residuals matrix as evidenced by all the standardised residuals being within 2 standard
deviations. In the standardised solution (presenting the structural relations of the model) of
Figure 8 .3 , all the coefficients in the model have been expressed in standardised form and
may therefore be read in a way analogous to standardised path coefficients .
The correlation matrix for the work need first order factors shown in Table 8 . 6 is similar to
that produced from analyses of the earlier model already reported (except that the
management and altruism factors correlate more highly in Table 8 .6) . If Dawis and Lofquist
had looked at whether their factors were correlated their results could have been expected to
be very similar. None of the first order derivatives are large. The modification indices were
small with the exception of the covariance between the variety and working conditions needs
and the first order factors of achievement, autonomy, management and altruism. Using the
standard errors and 1 - 1/; to assess the proportion of variance in each first factor explained
by the model , the proportion of variance in each of the factors were as shown in Table 8 . 7 .
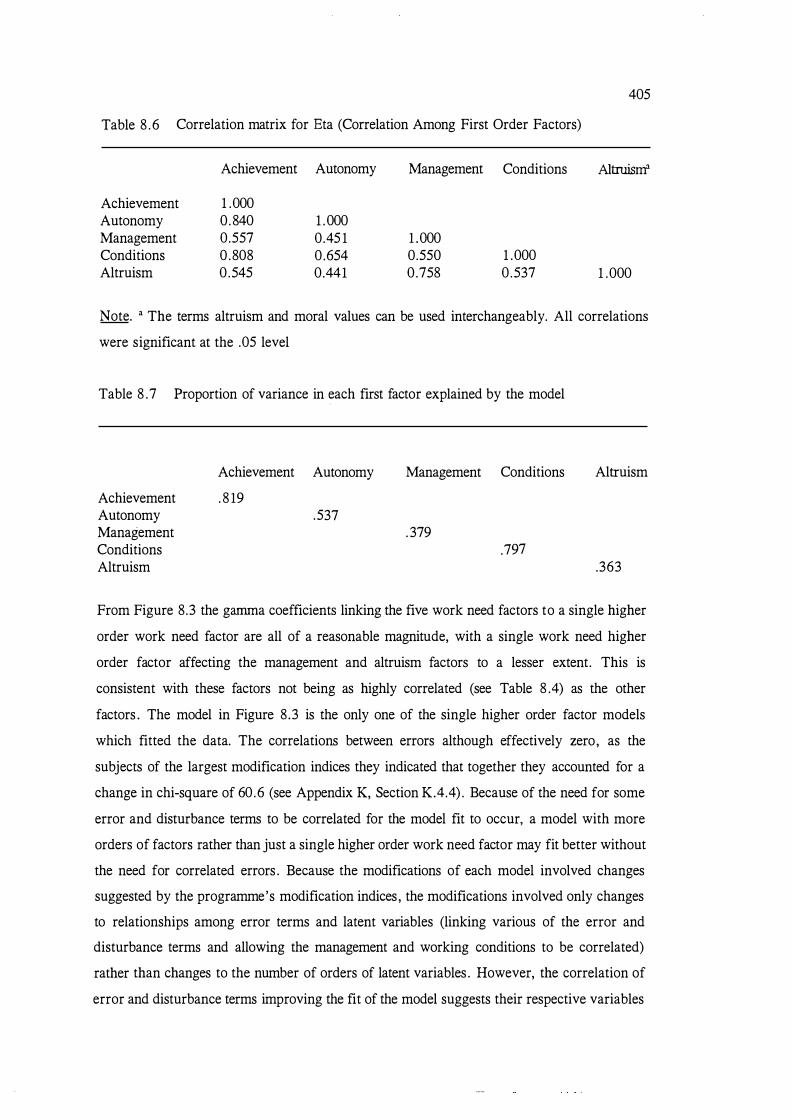
Table 8 . 6 Correlation matrix for Eta (Correlation Among First Order Factors)
Achievement Autonomy Management Conditions
Achievement 1 .000 Autonomy 0.840 1 .000 Management 0.557 0.45 1 1 .000 Conditions 0 .808 0.654 0.550 1 .000 Altruism 0.545 0.441 0 .758 0 .537
405
Altruism"
1 .000
Note. • The terms altruism and moral values can be used interchangeably. All correlations
were significant at the .05 level
Table 8 . 7 Proportion of variance in each first factor explained by the model
Achievement Autonomy Management Conditions
Achievement . 8 19 Autonomy .537 Management . 379 Conditions .797 Altruism
Altruism
.363
From Figure 8.3 the gamma coefficients linking the five work need factors to a single higher
order work need factor are all of a reasonable magnitude, with a single work need higher
order factor affecting the management and altruism factors to a lesser extent. This is
consistent with these factors not being as highly correlated (see Table 8 .4) as the other
factors . The model in Figure 8.3 is the only one of the single higher order factor models
which fitted the data. The correlations between errors although effectively zero, as the
subjects of the largest modification indices they indicated that together they accounted for a
change in chi-square of 60.6 (see Appendix K, Section K.4.4) . Because of the need for some
error and disturbance terms to be correlated for the model fit to occur, a model with more
orders of factors rather than just a single higher order work need factor may fit better without
the need for correlated errors . Because the modifications of each model involved changes
suggested by the programme's modification indices , the modifications involved only changes
to relationships among error terms and latent variables (linking various of the error and
disturbance terms and allowing the management and working conditions to be correlated)
rather than changes to the number of orders of latent variables . However, the correlation of
error and disturbance terms improving the fit of the model suggests their respective variables
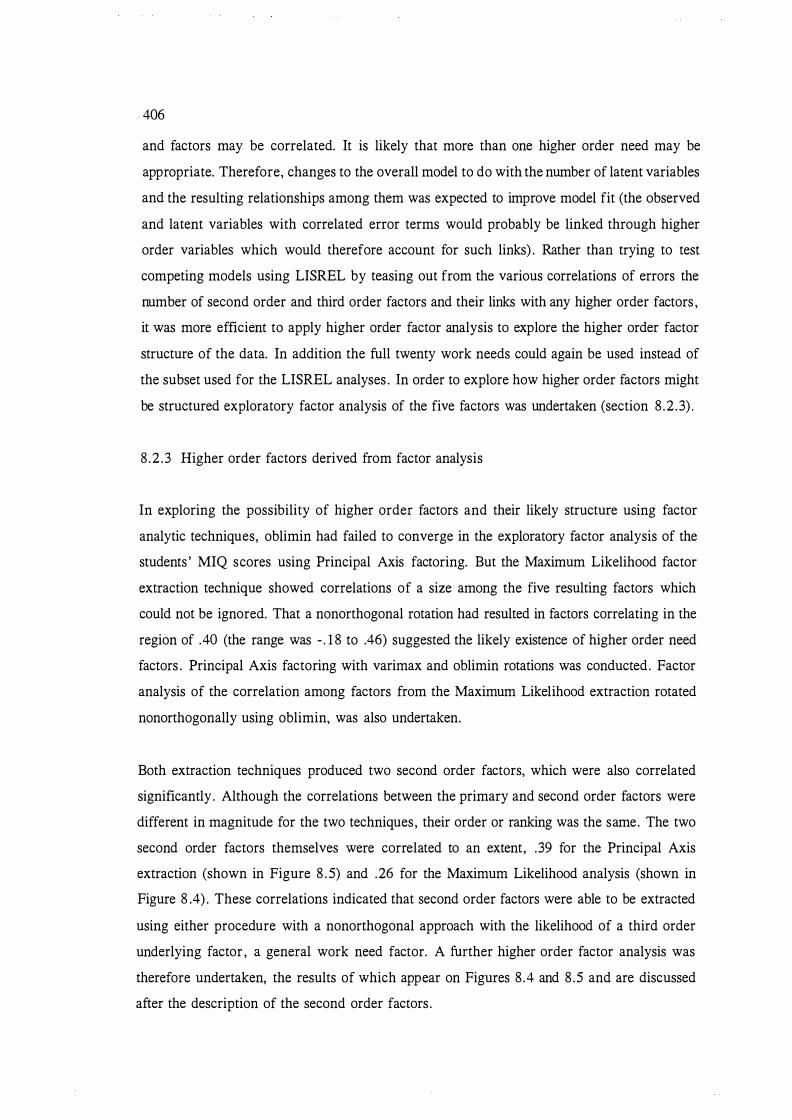
406
and factors may be correlated. It is likely that more than one higher order need may be
appropriate. Therefore, changes to the overall model to do with the number of latent variables
and the resulting relationships among them was expected to improve model fit (the observed
and latent variables with correlated error terms would probably be linked through higher
order variables which would therefore account for such links) . Rather than trying to test
competing models using LISREL by teasing out from the various correlations of errors the
number of second order and third order factors and their links with any higher order factors ,
it was more efficient to apply higher order factor analysis to explore the higher order factor
structure of the data. In addition the full twenty work needs could again be used instead of
the subset used for the LISREL analyses . In order to explore how higher order factors might
be structured exploratory factor analysis of the five factors was undertaken (section 8 .2 .3) .
8 .2 .3 Higher order factors derived from factor analysis
In exploring the possibility of higher order factors and their likely structure using factor
analytic techniques, oblimin had failed to converge in the exploratory factor analysis of the
students ' MIQ scores using Principal Axis factoring. But the Maximum Likelihood factor
extraction technique showed correlations of a size among the five resulting factors which
could not be ignored. That a nonorthogonal rotation had resulted in factors correlating in the
region of .40 (the range was - . 1 8 to .46) suggested the likely existence of higher order need
factors . Principal Axis factoring with varimax and oblimin rotations was conducted. Factor
analysis of the correlation among factors from the Maximum Likelihood extraction rotated
nonorthogonally using oblimin, was also undertaken.
Both extraction techniques produced two second order factors, which were also correlated
significantly . Although the correlations between the primary and second order factors were
different in magnitude for the two techniques, their order or ranking was the same. The two
second order factors themselves were correlated to an extent, .39 for the Principal Axis
extraction (shown in Figure 8 . 5) and .26 for the Maximum Likelihood analysis (shown in
Figure 8 .4) . These correlations indicated that second order factors were able to be extracted
using either procedure with a nonorthogonal approach with the likelihood of a third order
underlying factor , a general work need factor. A further higher order factor analysis was
therefore undertaken, the results of which appear on Figures 8 .4 and 8 .5 and are discussed
after the description of the second order factors .
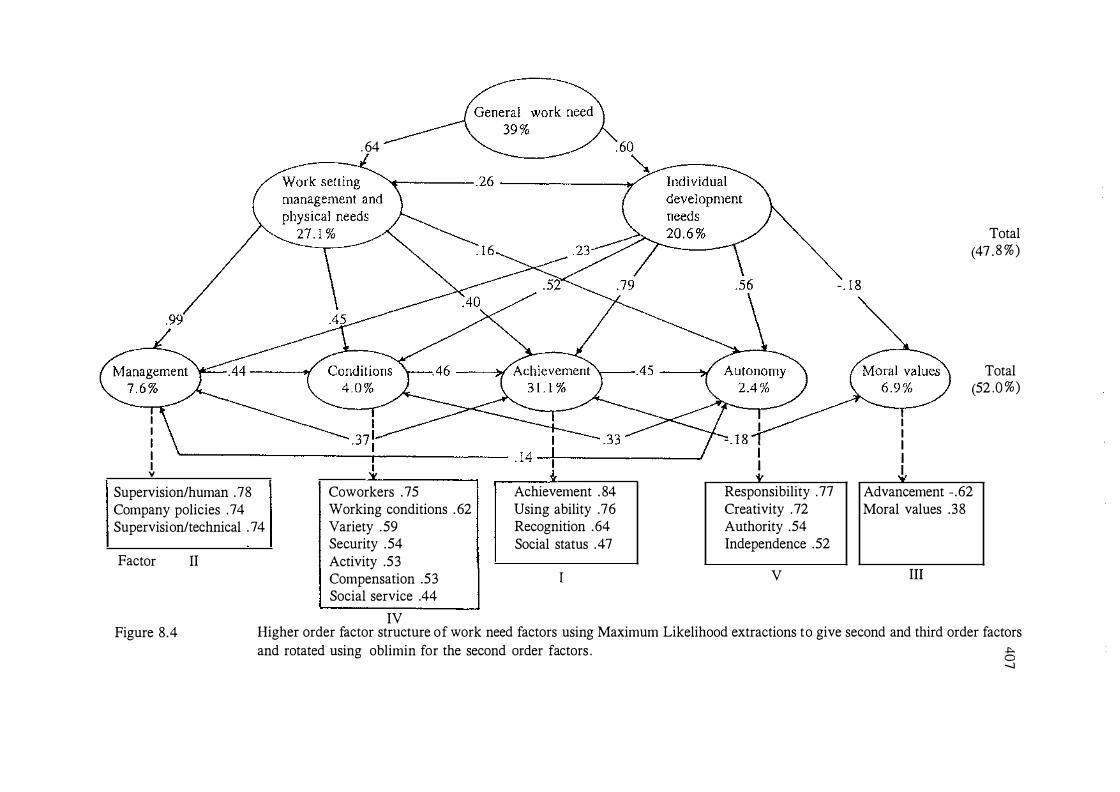
. 64
�------------------�;�------------- . 14 ��---------------J
Supervision/human . 78 Company policies . 74 Supervision/technical . 74
Factor II
Coworkers . 75 Achievement . 84 Working conditions . 62 Using ability .76 Variety . 59 Recognition .64 Security . 54 Social status .47 Activity .53 Compensation .53 Social service .44
IV
I
I I v
Responsibility . 77 Creativity . 72 Authority .54 Independence .52
V
I I I I .1
Total (47 .8 %)
Total (52 .0 %)
Advancement - .62 Moral values .38
Ill
Figure 8.4 Higher order factor structure of work need factors using Maximum Likelihood extractions to give second and third order factors and rotated using oblimin for the second order factors . 23
-..l
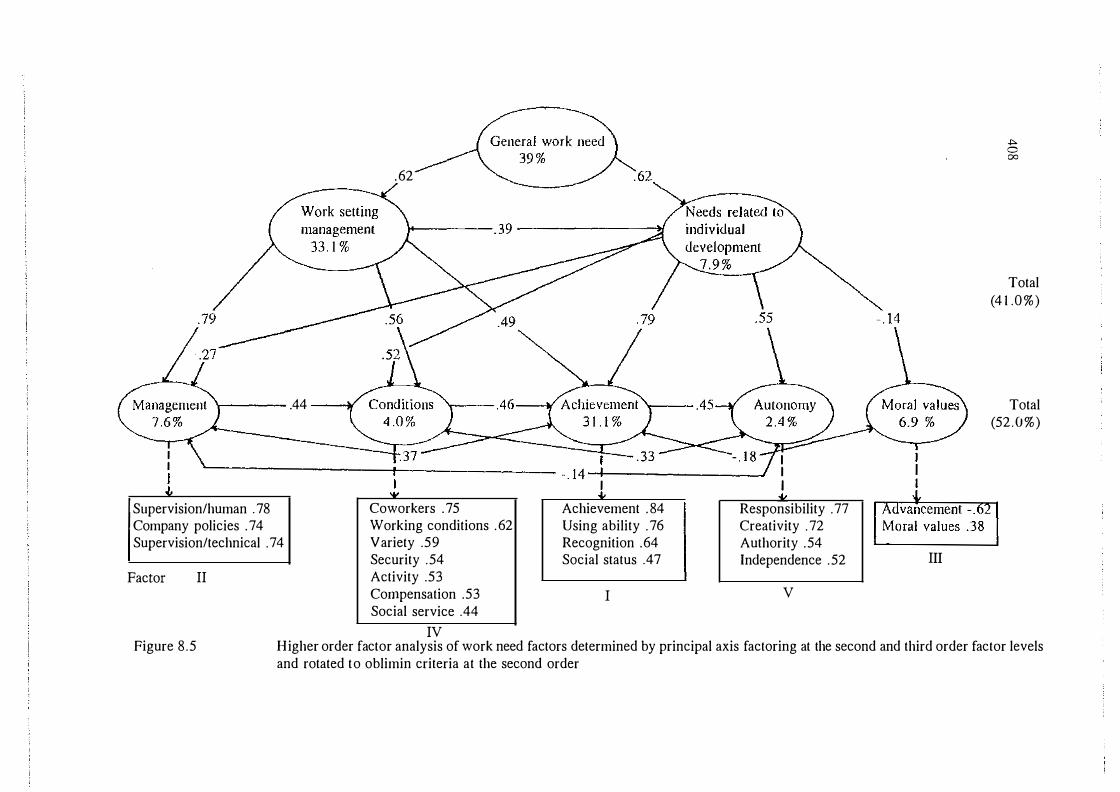
'r----- .44 w
Supervision/human . 78 Company policies . 74 Supervision/technical . 74
Factor II
. 62
l, - . 14 -r-------· · l
I "'
I I I
"' Coworkers . 75 Working conditions . 62 Variety .59 Security . 54 Activity .53 Compensation .53 Social service .44
Achievement . 84 Using ability . 76 Recognition .64 Social status .47
I
Responsibility . 77 Creativity . 72 Authority . 54 Independence . 52
V
Ill
+>-0 00
Total (4 1 .0%)
Total (52 .0%)
IV Higher order factor analysis of work need factors determined by principal axis factoring at the second and third order factor levels Figure 8 .5 and rotated to oblimin criteria at the second order

409
The Principal Axis factoring of the primary factors and rotating to oblimin criteria produced
two second order factors (shown in Figure 8 .5) . The factor loadings of each work need from
the Maximum Likelihood oblique rotation, which indicated the correlations between the first
order factors , are the same as those given at the bottom of Figure 8.4. One second order
factor accounted for 33 . 1 % of the variance and appeared to represent work needs to do with
management practices and the work setting because the factor loadings were greatest in
respect to the management and comfort factors .
The work needs loading on these two factors had been ones relating to the conditions in the
work setting, that is , the work needs of supervision, coworkers , working conditions , variety,
security, activity, compensation and social service. Because the first second order factor was
loaded most on the management ( .79) and the comfort ( .56) primary factors , as shown in the
structure matrix in section L.2 of Appendix L, it was named a management/work setting
factor. It also loaded, but to a lesser extent, ( .49) on the achievement primary factor which
appeared to belong more to the other second order need factor.
The second higher order factor accounted for 7. 9 % of the variance and the first order factors
loading on it were the achievement ( .79) , autonomy ( . 55) and altruism (- . 14) factors . As such
it appeared to represent the more self oriented work needs or those perhaps associated with
the development and expression of the individual (perhaps similar to Maslow's notion of self
actualization) . This could be labelled an individual expression/development factor . The
altruism factor exhibited the smallest of the factor loadings. It was smaller than achievement's
loading on the work setting management second order factor.
When the second order factors were extracted using the Maximum Likelihood and oblimin
rotation procedures, as shown in Figure 8.4, two second order factors also emerged. With
reference to Figure 8 .5 and section L.3 , Appendix L, although these second order factors
were less highly correlated with each other ( .26) than many of the first order factors had
been, the magnitude of the correlation was sufficient to consider the existence of a single third
order factor, a general factor . The Principal Axis factoring procedure with an oblique rotation
gave a larger correlation of . 39 between the second order factors (see Figure 8 .5)
With reference to section L .3 , Appendix L, and the factor matrix for the Maximum
Likelihood solution, not surprisingly the conditions primary factor loaded almost equally on
the two higher factors, with .45 on the work setting management factor and .52 on the
410
individual expression/development factor. The work needs of the conditions factor included
needs which relate more to some work setting needs and less closely to the individual . These
included needs such as the friendliness of coworkers, pay, the security, working conditions
and the social service aspects of the job. At the same time the comfort factor included aspects
of the nature of the work task itself which relate more to individual needs . These included
the variety and activity work needs . The management primary factor loaded more highly at
.23 rather than .27 for the individual expression/needs factor when Maximum Likelihood was
used as opposed to a Principal Axis solution.
The factor loadings of the second order factors on the first were higher for the Maximum
Likelihood than the Principal Axis extraction. The management factor loaded . 99 (instead of
.79) , and the comfort factor loaded .45 (instead of . 56) with the work setting/ management
factor. Similarly, the achievement factor loaded on the individual expression/development
second-order factor .79 (and also .79) , the autonomy factor loaded .56 (rather than .55),
and the altruism factor -. 18 (rather than - . 14) . With Maximum Likelihood the two second
order factors accounted for a more even share of the variance, 27 . 1 % for the work setting
factor and 20.6 % for the individually oriented factor, in contrast to a 33 . 1 % and 7 . 9 % share
of the variance, respectively, for the Principal Axis extraction.
Further higher order factor analyses, of the correlations between the second order needs,
produced a third and single order factor which explained 39 % of the variance between the
two. In the case of Principal Axis factoring the third order general work need factor loaded
. 62 on both the second order needs . In the case of the Maximum Likelihood procedure third
order need loaded . 64 on the work setting/management second order factor and . 60 on the
individual development second order Factor .
8 . 3 M eta-analysis of factor labelling, interpretation and comparison with previous
findings
A meta-analysis was undertaken of findings relating to, (1) the factor analysis of the MIQ data
in this study, (2) the multidimensional scaling of work needs (Rounds, 1970) , (3) Doering,
Rhodes and Kaspin's study comparing work need factor studies, (4) a reworking of Dawis
and Lofquist 's factor analysis of work needs using the sensitivity of modern computer
programme analysis to look for correlated factors and (5) a factor analysis of the structure
4 1 1
of satisfaction of work needs (measured by The Minnesota Satisfaction Scale, MSQ) of this
study's data.
The five first order factors of this study can be labelled in a similar way to Dawis and
Lofquist's factors . The five factors can be given the labels of (i) achievement-recognition, (ii)
autonomy, (iii) organisational policies and supervision, (iv) working conditions or comfort
and lastly (v) altruism or moral values . However the final choice of labelling was (i)
achievement, (ii) autonomy, (iii) management, (iv) working conditions , and (v) moral values .
These factors bear some similarities to those of Dawis and Lofquist but when the higher order
factors are extracted a greater similarity emerges between the findings of the present study
and other reorganisations of Dawis and Lofquist's (1984) six factors . Their six factors of
achievement, comfort, status, altruism, safety and autonomy were further organised in
unpublished work by Rounds (1976) , cited in Dawis and Lofquist (1984, p 86) , along three
dimensions . These were made up of contrasting pairs of values arrived at through the use of
multidimensional scaling rather than factor analysis . The dimensions revealed were those of
altruism versus status, achievement versus comfort and autonomy versus safety and they are
compared with the present findings in Table 8 .8 .
Table 8 . 8 Comparison o f Multidimensional Scaling and Factor Analyses o f
Work Needs
Rounds Present study
Altruism vs status Altruism vs achievement (status factor was subsumed in achievement)
Autonomy vs safety Autonomy vs management
Achievement vs comfort Achievement vs working conditions
These dimensions are similar to the lower order factors produced in the present study. The
opposing dimensions identified in the most part belong to different second order factors, with
the exception of altruism versus status. Achievement and autonomy loaded onto the individual
development factor, while comfort and safety (or management) loaded onto the work
setting/management factor. Although status did not have an equivalent in the present study,
the variables which loaded onto it were placed in the achievement and altruism factors . The
412
first order factors of altruism and achievement loaded onto the individual/expression
development second order factor but the achievement factor also loaded onto the work
setting/management factor, thus the opposing dimensions of status and altruism had their
related variables loaded on different second-order factors . Alderfer's ( 1969, 1972) sets of
needs appear to have some relevance to these findings in particular his grouping of needs into
existence, growth and relatedness needs which could equate to the work setting/management,
individual development and altruism needs respectively .
Factors were able to be grouped together then by either multidimensional scaling or high
order factor analyses , although different types of information are available through the
different techniques . Higher order factor analysis provides a more thorough and useful
description of the relationships among factors , acknowledges correlations among factors and
the different levels of factors which result (rather than just identifying opposing dimensions),
provides factor loadings and gives the percentages of the amount of variance higher order
factors account for .
Dawis and Lofquist (1978) also reported classification of their six factors as external
environmental preferences (safety and comfort) , other people preferences (aggrandizement or
status and altruism) and intrinsic or self-preferences (achievement and autonomy) . The
equivalent of Dawis and Lofquist's safety-comfort pair (management/comfort in the present
study) belonged to the work setting/management higher order need. Although their
dimensions produced by multidimensional analysis were organised in a similar way to that
of the second order factors of the present study, their analysis stopped short of looking at the
relationship between those pairs and therefore the correlations among them (which in the
present study produced a single underlying work factor) and viewing work factors in a
hierarchical fashion. The second-order factors of the present study can be categorised using
Dawis and Lofquist's classification system by regarding the management/ work setting factor
as representing the external environmental preferences, and the individual
expression/development factor as representing both the intrinsic or self-preferences and the
other people preferences (through altruism) .
The factor structure of the needs in the present study were also similar to those of Doering,
Rhodes and Kaspin' s ( 1988) study. Research on person-environment correspondence has been
said to require commensurate measurement of occupational needs and reinforcers (Shubsachs,
413
Rounds, Dawis and Lofquist, 1978) but the factor structure of needs and reinforcers had been
dissimilar . Doering, Rhodes and Kaspin observed that comparisons have used data from
different sample sets of individuals and have involved different levels of analyses . Previously
the unit of analysis in the case of the M.I .Q. has been individual responses but in the case of
the Minnesota Job Description Questionnaire (MJDQ), the factor structures have been based
on group mean occupational profiles . Their study was undertaken to examine needs and
reinforcer data from the same set of individuals. Tables 8 .9 to 8 . 1 1 show the factor loadings
greater than .34 across three studies (Doering, Rhodes and Kaspin, 1986; Shubsachs, Rounds ,
Dawis and Lofquist, 1978; and Tinsley and Weiss, 1974) compared with the factors of the
present study.
As shown in Table 8 .9 the high loadings of Doering et al . ' s Factor I were dispersed between
first order factors I and V which in turn were part of higher order Factor two5 (Individual
development needs) in the present study. The high loadings were for responsibility , creativity,
and ability utilisation. As can be seen in Tables 8 . 9 to 8 . 1 1 , the moderate loadings of
Doering et al. 's were dispersed between the two second order factors . Achievement,
independence and authority were loaded on second order Factor Two (individual development
needs), and variety, activity, and social service were loaded on Second Order Factor One
(Work setting/management) . As Doering et al. had found, their Factor I was similar to the
autonomy need Factor II and achievement need Factor V identified in previous studies (Gay
et al . , 1971 ; Seaburg et al . , 197 6) . Mirroring Doering et al . ' s findings , the present Factors
I and V, like their Factor I, also differed from previous autonomy-achievement need factors
in that advancement was not included while activity, autonomy, independence, and social
service did appear.
Doering et al. 's Factor II coincided less clearly with the present study. The second factor was
characterised by high loadings on social status and compensation and moderate loadings on
recognition, advancement, authority, security, and working conditions . This was said to
represent the importance of environmental reinforcement through status and recognition. In
other previous studies advancement was excluded but compensation, working conditions, and
security were part of Gay et al . 's (1971) and Seaburg et al . ' s ( 1976) Safety Factor (Factor
I) and authority and recognition were included in the aggrandizement factor (Factor VI) . In
5 First order factors are denoted by Roman Numerals and Second order factors by the number in words .

414
the present study the only loadings coinciding with Factor II were advancement (but
negatively) , compensation, security and working conditions, while authority, recognition, and
social status loaded on Factors V and I and the second order factor two . With the exception
of advancement, these loaded on second order Factor one, work setting/management.
As in previous studies , Factor Ill was defined by the variables of supervision, both technical
and human relations, and company policies and practices . Doering et al. interpreted the factor
as employee's preferences for safety through stable management. Gay et al (1971) and
Seaburg et al . ( 1970) identified the factor as safety in a predictable environment. In the
present study this factor, identified as comfort or conditions in the work environment,
belonged to the second-order Factor I (work setting/ management) . The altruism factor (IV)
was eliminated from Doering et al . 's study because the eo-workers and moral values variables
did not load greater than . 34 on any factor. The altruism factor did emerge in the present
study and belonged to the second-order Factor II with loadings of - .62 for advancement and
.38 for moral values. However, the altruism factor did not correlate with the other factors
and did not load as highly on its second order factor.
The three factors of the MIQ characterised by Doering et al . as autonomy-achievement,
environmental reinforcement-aggrandizement and safety are similar to the second order factors
of the present study but could not be exactly the same because we are comparing a different
number of factors (three factors as opposed to two second-order factors) . However, the
similarities are that in the present research achievement and autonomy did belong to the same
second-order factor (individual development needs) although achievement was also loaded
onto the work setting second-order factor. For Doering et al . environmental reinforcement
aggrandizement was separated from the safety factor whereas the factors representing these
made up the work setting second-order factor in the present case. Although the variables of
the altruism factor loaded more highly than Doering et al . ' s criteria of .34, the altruism factor
itself had a negative loading of - . 1 8 on the second order factor two for the Maximum
Likelihood extraction and - . 1 5 for the Principal Axis solution. Because altruism did not
correlate with any of the other factors it would be unlikely to be influenced by the underlying
general work need (the single third order factor) . Although the three factors of previous
studies can be seen to be similar to the second order factors of the present study comparisons
are limited by the relationships in the other studies not having been investigated with the
possibility of a hierarchy of factors in mind.

Table 8 . 9
Comparison of MIQ Factors in Four Studies for Doering et al . ' s Factor I
Ability utilization Achievement Activity Advancement Authority Autonomy Co . Policies & Practices Compensation eo-workers Creativity Independence Moral Values Recognition Responsibility Security Social Service Social Status Supervision-Human Relations Supervision-Technical
Doe ring et al . ( 1986)
Factor I
.62
.49
. 54
.44
. 57
.67
.49
.77
.39
Variety .59 Working Conditions
Gay et al . ( 1971)
Factor Factor 11 V
.38 - .56 - .56
- .41 . 54
.77
.79
Seaburg Seaburg This et al . et al. study ( 1976) (1976) male female
Factor Factor Factor Factor Factor 11 V 11 V I V
. 60 .35 .58 .76
. 62 .56 . 84
.37 .45 . 5 1 . 54
.78 .76 . 72 .52
. 35 .64 .78 .78 . 77
.47
.38 . 42
(Factor I = Achievement,
Factor V = Autonomy)
+>--Vl

Table 8 . 1 0 .p... ......
Comparison of MIQ Factors in Four Studies for Doering et al . 's Factor 11 0\
Doering Gay Gay Seaburg Seaburg Seaburg This study et al . et al . et al . et al et al . Study
(1986) (1971) ( 1976) (1976) ( 1976) male female
Factor Factor Factor Factor Factor Factor Factor 11 I VI I VI VI Ill IV (Factor Ill = Moral Values/ Altruism,
Ability Utilization Factor IV = Working Conditions) Achievement . 32 Activity .53 Advancement .49 - .37 - . 37 .41 . 5 1 . 5 8 - .62 Authority .48 - .40 .47 . 42 Autonomy* Co. Policies & Practices - .64 . 7 1 Compensation . 60 - .49 .41 . 53 . 62 .53 eo-workers .75 Creativity Independence .38 Moral Values Recognition . 59 - .45 .60 . 65 Responsibility Security . 39 - .44 . 52 .44 . 54 Social Service .44 Social Status .6 1 - .55 . 68 . 57 Supervision-Human Relations - . 74 - .74 .71 . 7 1
Supervision-Technical - .70 . 70 Variety . 59 Working Conditions . 38 -.49 .54 .43 . 62

Table 8 . 1 1 Comparison of MIQ Factors in Three Studies for Doering et al . ' s Factor Ill
Doe ring Seaburg This et al . et al. study (1986) ( 1976)
female
Factor Factor Factor Ill I 11 (Factor II = Management)
Ability Utilization Achievement Activity Advancement Authority Autonomy Co. Policies & Practices . 7 1 . 7 1 .74 Compensation eo-workers Creativity Independence Moral Values .41 Recognition Responsibility Security Social Service Social Status Supervision-Human Relations .70 . 72 .78 Supervision-Technical . 72 . 6 1 .74 Variety +>-
.......
Working Conditions -.l

418
Other more recent factor analyses of work needs, such as that of Oliver ( 1990) which
distinguished between instrumental, participating and task centred values , may have some
relevance for the labelling of the factors of the present study. However, again 0 liver does not
view the factors as being structured hierarchically, thus the conceptualisation of the factor
structure of work needs is different in his work from that of the present study.
Reworking of Dawis and Lofquist's Factor analysis
A reworking of Dawis and Lofquist 's data (intercorrelations of the 20 MIQ work need
adjusted scale scores for an N of 5 ,358 reported in the MIQ manual, Gay, Weiss, Hendel,
Dawis and Lofquist, 1971) was undertaken in the present study and a nonorthogonal model
investigated. A principal factors solution with a varimax rotation was applied first. Factors
which emerged are shown in Table 8 . 12. With the use of modern factor analytic computer
techniques the number of factors extracted was different from that of Gay et al (op. cit . ) , that
is, a total of four instead of six. The oblimin rotation converged and the structure matrix is
presented in Table 8. 13 (The pattern matrix is shown in Appendix L) .
Table 8 . 12 Varimax Rotated Matrix of Principal Factor Analysis of Dawis and Lofquist' s
Data (intercorrelations of MIQ Adjusted Scale Scores for a Sample of 5 ,358)
Factor 1 Factor 2 Factor 3 Factor 4
Shr . 66 6 2 4 . 19 3 06 . 0 7 9 2 3 . 3 1 9 1 9 Corn . 62 7 8 4 . 21 7 8 5 . 22 116 - . 05 3 9 7 St . 62 2 3 0 . 15124 . 19 9 4 9 . 3 0 52 1 Cpp . 62 03 8 . 14 6 6 9 . 04 8 7 6 . 46 2 3 2 We . 5 9 0 34 . 0 9 1 0 5 . 43 8 8 1 . 12 2 4 2 Sec . 5 5 6 10 . 02 7 3 3 . 45 1 9 5 . 03 6 9 0
Res . 0 8 3 76 . 82 117 . 16 9 53 . 16 53 3 ere . 04 0 9 7 . 78 4 8 4 . 08 2 2 2 . 2 5644 Auth . 25 9 04 . 5 8 8 7 7 . 19424 . 0 02 5 7 Au . 17 2 4 5 . 52 2 3 1 . 24 7 0 4 . 3 5 3 6 1 Adv . 4 9 0 7 5 . 51 1 0 7 . 12 704 . 02 5 8 0 Rec . 452 0 5 . 46 8 93 . 26 2 19 . 03 98 6 A eh . 2 1 4 9 1 . 45 7 5 8 . 26 7 0 7 . 4 0 4 6 8 Sst . 2 8 6 5 9 . 3 6 3 4 0 . 3 3 1 71 . 01 5 1 6
Act . 2 6 4 8 4 . 11 6 3 6 . 68 5 0 1 . 19 0 8 6 Var . 0 8 6 7 6 . 3 5 9 7 5 . 5 6 2 8 8 . 114 9 9 Ind . 17 7 3 3 . 23 4 3 1 . 5 4 6 1 9 . 00442 Cow . 2 6 5 64 . 12 6 2 9 . 44 8 6 2 . 33 4 6 4
Sse - . 04 3 74 . 23 3 01 . 3 52 5 0 . 54 9 5 1 Mv . 16 9 0 9 . 06 9 8 8 - . 0 02 2 0 . 48 53 1 Percentage of 3 4 . 5 7 . 5 4 . 5 4 . 1 Common variance Total variance = 5 0 . 6 % ( continued)
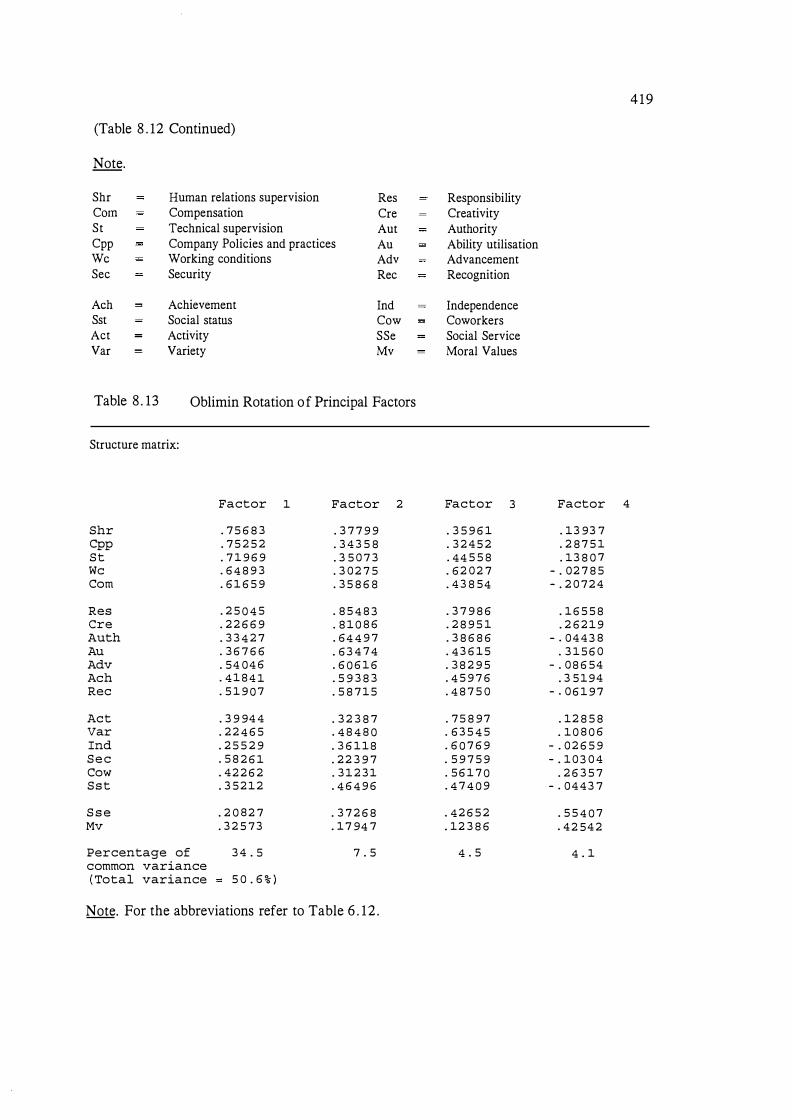
(Table 8 . 12 Continued)
Note.
Shr Human relations supervision Res Corn Compensation Cre St Technical supervision Aut Cpp Company Policies and practices Au We Working conditions Adv Sec Security Rec
A eh Achievement Ind Sst Social status Cow Act Activity SSe Var Variety Mv
Table 8 . 13 Oblimin Rotation of Principal Factors
Structure matrix:
Factor 1 Factor
Shr . 7 5 6 8 3 . 3 7 7 9 9 Cpp . 7 5 2 5 2 . 3 4 3 5 8 St . 7 1 9 6 9 . 3 5 0 7 3 We . 64 8 9 3 . 3 02 7 5 Corn . 61 6 5 9 . 3 5 8 6 8
Res . 2 5 0 4 5 . 8 5 4 8 3 ere . 22 6 6 9 . 8 10 8 6 Auth . 3 3 4 2 7 . 64 4 9 7 Au . 3 6 7 6 6 . 63 4 74 Adv . 54 04 6 . 6 0 6 1 6 A eh . 4184 1 . 5 9 3 8 3 Rec . 5 1 9 0 7 . 5 8 715
Act . 3 9 94 4 . 3 2 3 8 7 Var . 22 4 6 5 . 4 8 4 8 0 Ind . 2 5 5 2 9 . 3 6 118 Sec . 5 8 2 6 1 . 22 3 9 7 Cow . 42 2 6 2 . 3 1 2 3 1 Sst . 3 5212 . 4 6 4 9 6
S s e . 2 0 82 7 . 3 7 2 6 8 Mv . 3 2 5 73 . 17 94 7
Percentage of 3 4 . 5 7 . 5 common variance ( Total variance 5 0 . 6 % )
Note. For the abbreviations refer to Table 6 . 1 2 .
2
Responsibility Creativity Authority Ability utilisation Advancement Recognition
Independence Coworkers Social Service Moral Values
Factor 3
. 3 5 9 6 1
. 3 24 5 2
. 44 5 5 8 . 62 02 7 . 4 3 8 54
. 3 7 9 8 6
. 2 8 9 5 1
. 3 8 6 8 6
. 43 6 15
. 3 8 2 9 5
. 4 5 9 7 6
. 4 8 7 5 0
. 75 8 97
. 63 5 4 5
. 6 0 7 6 9
. 5 9 7 5 9
. 56 1 7 0
. 4 7 4 0 9
. 42 6 5 2
. 12 3 8 6
4 . 5
4 1 9
Factor 4
. 13 93 7
. 2 8 7 5 1
. 13 8 0 7 - . 02 7 8 5 - . 2 0 724
. 16 5 5 8
. 2 6219 - . 0443 8
. 3 1 5 6 0 - . 08 6 54
. 3 5194 - . 06 1 9 7
. 12 8 5 8
. 10 8 0 6 - . 02 6 5 9 - . 103 0 4
. 2 6 3 5 7 - . 0443 7
. 5 5 4 0 7
. 42 54 2
4 . 1

420
Table 8 . 14 Matrix of Correlations among Factors of the Obliquely Rotated Principal Factors
Solution
Factor correlation matrix:
Factor 1 Factor 2 Factor 3 Factor 4
Note . * p
Factor 1 Factor 2
1 . 00000 .36720 1 .00000 .45620* .46088* .07914 . 14488
< . 05
Factor 3 Factor 4
1 .00000 . 05517 1 .00000
Table 8 . 1 5 Maximum Likelihood Extraction, Oblimin Rotation Structure matrix
Act we Sec Var Cow Ind Rec S s t
Res ere Auth Au A eh Adv
Shr Cpp St Corn Mv
S S E
Factor 1
. 73 4 1 5
. 66 5 7 9
. 65 1 5 8
. 5 9 6 13
. 58 0 7 5
. 5 7 944
. 5 5 3 94
. 5 1347
. 3 8 9 5 8
. 3 0 244
. 4 0 5 7 1
. 4 92 3 9
. 52 4 5 2
. 4 7 3 5 2
. 41 5 3 1
. 4 01 9 1
. 4 9 5 6 8
. 5 0 5 7 3
. 15 5 7 9
. 43 119
Percentage 34 . 1 of common variance ( Total variance = 5 0 . 5 � )
Factor 2
- . 318 3 2 - . 2 8 7 92 - . 2 0 3 0 2 - . 4924 6 - . 2 9 6 8 1 - . 3 7 7 2 8 - . 53 8 18 - . 42 2 6 7
- . 8 8 3 13 - . 84 5 2 5 - . 64 3 62 - . 60 7 1 9 - . 55 8 2 2 - . 5 5 7 5 0
- . 3 7 1 0 9 - . 32 84 9 - . 3 3 12 2 - . 3 3 7 2 5 - . 17 3 7 8
- . 3 6 12 9
7 . 9
Factor 3
- . 3 902 1 - . 5 8163 - . 4 8934 - . 2 32 1 8 - . 4247 7 - . 2 2 9 12 - . 45641 - . 2 9146
- . 2 8 5 74 - . 2 8 8 0 6 - . 31734 - . 3 9 0 3 8 - . 43 52 1 - . 47199
- . 79 6 8 7 - . 77470 - . 7 5142 - . 51919 - . 3 976 1
- . 2 942 1
4 . 5
Factor 4
. 06821 - . 18 0 5 6 - . 242 8 0
. 0 9058
. 15 8 8 9 - . 05102 - . 18 5 8 5 - . 13 142
. 10195
. 2 0100 - . 12 751
. 22572
. 2 3 6 6 8 - . 2 2 2 61
- . 0 8 3 3 6 . 04 5 3 1
- . 0 5491 - . 3 8119
. 3 0666
. 5 0 8 8 8
4 . 1
The Principal Axis solution shown in Table 8 . 12 is the one closest to that undertaken by
Dawis and Lofquist. Here the largest correlation was entered in the diagonal of the correlation
matrix to be analyzed whereas Dawis and Lofquist used multiple correlations as communality
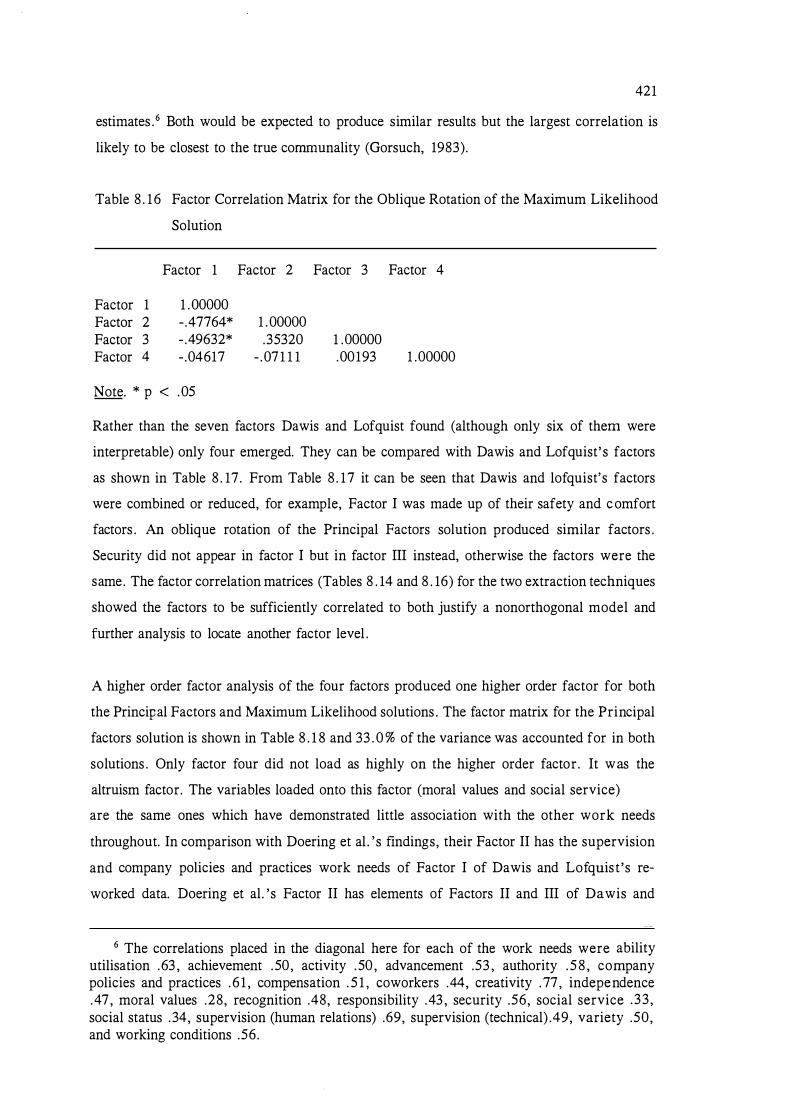
421
estimates . 6 Both would be expected to produce similar results but the largest correlation is
likely to be closest to the true cornrnunality (Gorsuch, 1983).
Table 8 . 1 6 Factor Correlation Matrix for the Oblique Rotation of the Maximum Likelihood
Factor 1 Factor 2 Factor 3 Factor 4
Note. * p
Solution
Factor 1
1 . 00000 - .47764* - .49632* - .04617
< . 05
Factor 2 Factor 3 Factor 4
1 .00000 .35320 1 .00000
- .071 1 1 .00193 1 .00000
Rather than the seven factors Dawis and Lofquist found (although only six of them were
interpretable) only four emerged. They can be compared with Dawis and Lofquist' s factors
as shown in Table 8 . 17. From Table 8 . 17 it can be seen that Dawis and lofquist' s factors
were combined or reduced, for example, Factor I was made up of their safety and c omfort
factors . An oblique rotation of the Principal Factors solution produced similar factors .
Security did not appear in factor I but in factor m instead, otherwise the factors were the
same. The factor correlation matrices (Tables 8 . 14 and 8 . 16) for the two extraction techniques
showed the factors to be sufficiently correlated to both justify a nonorthogonal model and
further analysis to locate another factor level .
A higher order factor analysis of the four factors produced one higher order factor for both
the Principal Factors and Maximum Likelihood solutions . The factor matrix for the Principal
factors solution is shown in Table 8 . 1 8 and 33 . 0 % of the variance was accounted for in both
solutions . Only factor four did not load as highly on the higher order factor . It was the
altruism factor. The variables loaded onto this factor (moral values and social service)
are the same ones which have demonstrated little association with the other work needs
throughout. In comparison with Doering et al . ' s findings, their Factor II has the supervision
and company policies and practices work needs of Factor I of Dawis and Lofquist ' s re
worked data. Doering et al. ' s Factor II has elements of Factors II and m of Dawis and
6 The correlations placed in the diagonal here for each of the work needs were ability utilisation .63 , achievement . 50, activity . 50 , advancement .53 , authority . 5 8 , company policies and practices . 6 1 , compensation . 5 1 , coworkers .44, creativity .77, independence .47, moral values .28, recognition .48, responsibility .43 , security .56, social service .33 , social status .34, supervision (human relations) .69, supervision (technical) .49, variety .50, and working conditions .56.

422
Lofquist ' s re-worked data. Their Factor I has elements of Factor II and Ill of the re-worked
data. The safety and altruism factors were the most distinct.
Table 8 . 17 Comparison between Factors of Dawis and Lofquist' s Analysis and those
Resulting from a Re-working of their Matrix of MIQ Adjusted Score
Intercorrelations
Factor 1
Supervision, human relations Supervision, technical Company policies and practices Compensation Working conditions security
Factor 2
Responsibility creativity Ability utilisation Achievement Recognition Authority Social status
Factor 3
Activity Variety
Independence Coworkers
Factor 4
Social service Moral values
Dawis and Lofquist
Safety Safety Safety Comfort Comfort Comfort
Autonomy Autonomy Achievement Achievement Status Status Status
Comfort Comfort
Comfort Altruism
Altruism Altruism
Dawis and Lofquist's reworked factors could be labelled organisational working conditions
(Factor I) , an intrinsic developmental factor (Factor II), a task oriented working conditions
factor (Factor Ill) and an altruism factor (Factor IV) which are similar to the higher order
factors of the present study and Doering et al 's Safety, Autonomy-achievement and
environmental reinforcement aggrandizement factors.

423
Table 8 . 1 8 Factor Matrices of the Principal Axis Factoring and the Maximum Likelihood
Solutions of the Factor Correlation Matrix of Table 8 . 14.
Principal Factors solution
Factor 3 Factor 2 Factor 1 Factor 4
Factor 1
.734 1 1 . 62835 . 60527 . 13802
Maximum Likelihood solution
Factor 1
Factor 3 Factor 2 Factor 1 Factor 4
.74306
.6201 3 . 60670 . 12847
Ach = achievement Cpp = company policies and practices Adv = advancement Sst = social status H.r = human relations Tech = technical
Factor Analysis of the Minnesota Satisfaction Questionnaire (MSQ) results of the present
research
From the factor structure matrix shown in Table 8 . 19 and the factor composition or
interpretation shown in Table 8 .20 , Factor One can be seen to mainly consist of items relating
to the individual 's intrinsic satisfaction whilst Factor Two mainly consists of factors outside
the individual to do with extrinsic satisfaction. This is consistent with Dawis and Lofquist's
division of " intrinsic" and "extrinsic" in job satisfaction as measured by the MSQ. In the light
of the satisfaction factor analysis findings it might make sense to consider re-labelling the two
higher order factors of the factor analyses of the present study as extrinsic (instead of work
setting/management) and intrinsic (instead of needs related to individual development) . Such
a re-labelling would fulfil suggestions in the literature that the measurement of work needs
and job satisfaction be commensurate. However, it would be important not to lose the self
development/self-actualization theme present in the intrinsic work needs .
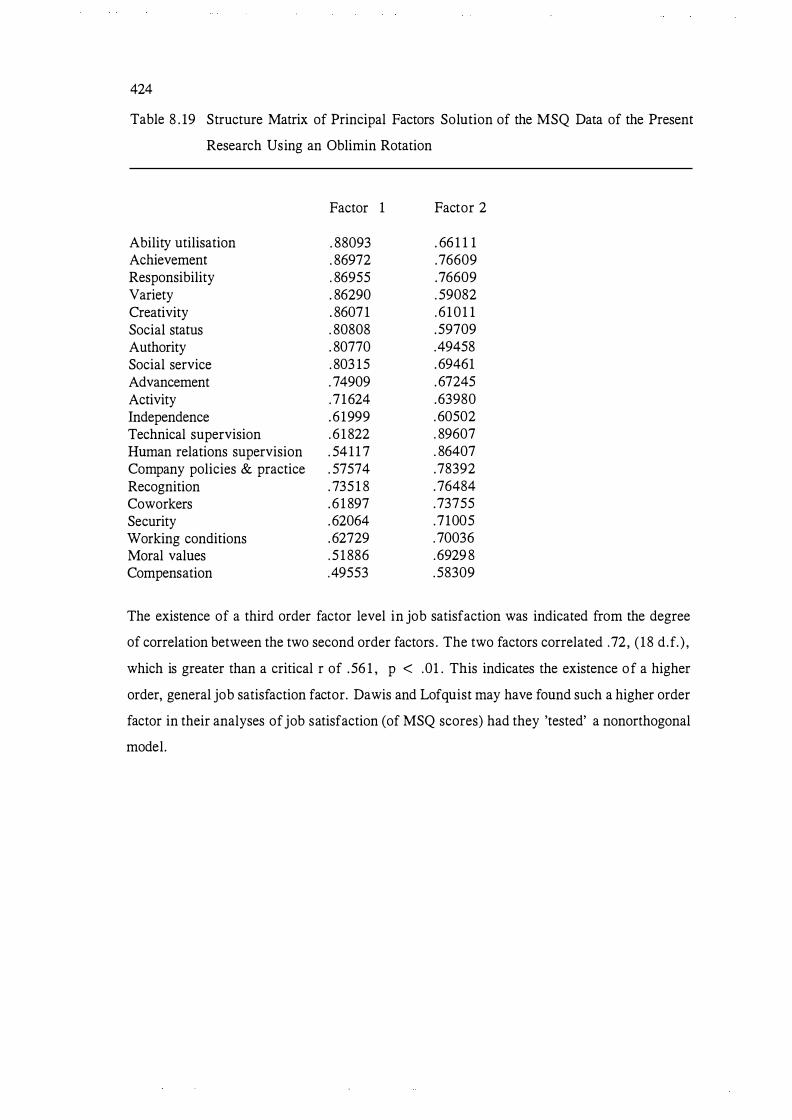
424
Table 8 . 19 Structure Matrix of Principal Factors Solution of the MSQ Data of the Present
Research Using an Oblimin Rotation
Factor 1 Factor 2
Ability utilisation . 88093 . 66 1 1 1 Achievement . 86972 .76609 Responsibility . 86955 .76609 Variety . 86290 . 59082 Creativity . 86071 . 6 101 1 Social status . 80808 . 59709 Authority . 80770 .49458 Social service . 803 15 . 69461 Advancement . 74909 . 67245 Activity .71624 .63980 Independence . 6 1999 . 60502 Technical supervision . 6 1 822 . 89607 Human relations supervision . 54 1 1 7 . 86407 Company policies & practice . 57574 .78392 Recognition . 735 1 8 .76484 Coworkers . 6 1 897 .73755 Security . 62064 .71005 Working conditions . 62729 .70036 Moral values . 5 1 886 .6929 8 Compensation .49553 . 58309
The existence of a third order factor level in job satisfaction was indicated from the degree
of correlation between the two second order factors . The two factors correlated . 72, ( 18 d .f. ) ,
which is greater than a critical r of . 56 1 , p < .01 . This indicates the existence of a higher
order, general job satisfaction factor. Dawis and Lofquist may have found such a higher order
factor in their analyses of job satisfaction (of MSQ scores) had they 'tested' a nonorthogonal
model.
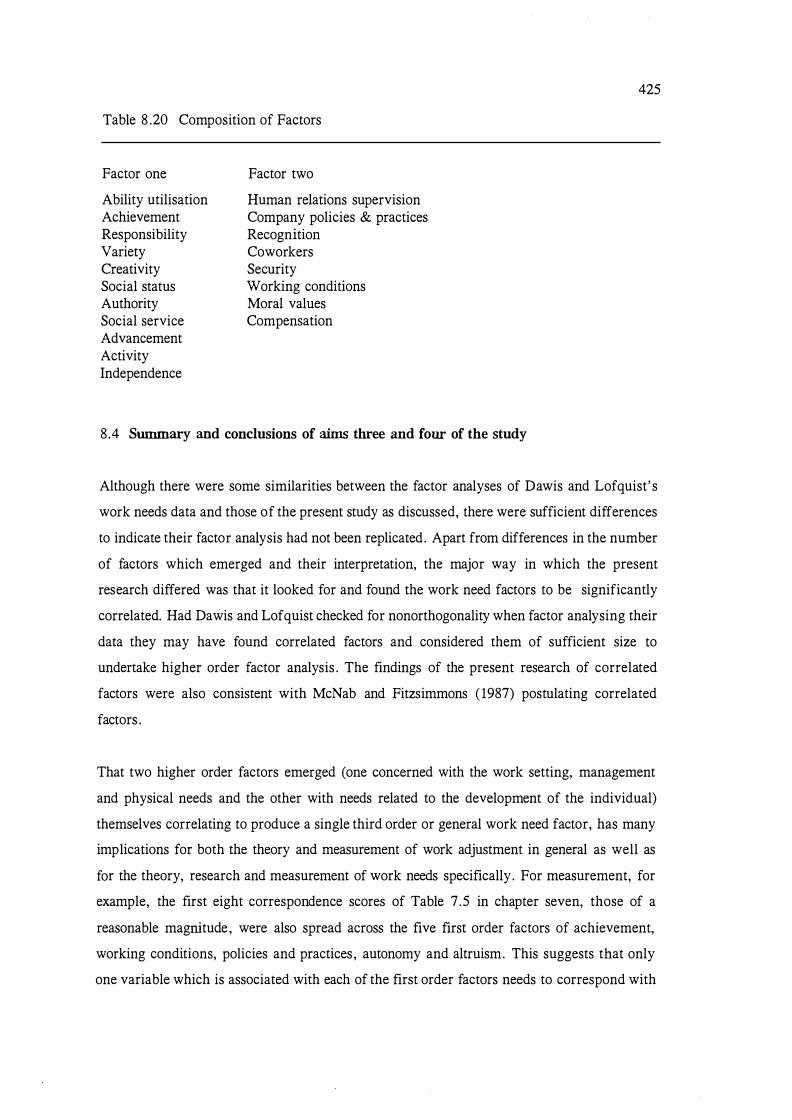
Table 8 .20 Composition of Factors
Factor one
Ability utilisation Achievement Responsibility Variety Creativity Social status Authority Social service Advancement Activity Independence
Factor two
Human relations supervision Company policies & practices Recognition Coworkers Security Working conditions Moral values Compensation
8 .4 Summary and conclusions of aims three and four of the study
425
Although there were some similarities between the factor analyses of Dawis and Lofquist' s
work needs data and those of the present study as discussed, there were sufficient differences
to indicate their factor analysis had not been replicated. Apart from differences in the number
of factors which emerged and their interpretation, the major way in which the present
research differed was that it looked for and found the work need factors to be significantly
correlated. Had Dawis and Lofquist checked for nonorthogonality when factor analysing their
data they may have found correlated factors and considered them of sufficient size to
undertake higher order factor analysis . The findings of the present research of correlated
factors were also consistent with McNab and Fitzsimmons ( 1987) postulating correlated
factors .
That two higher order factors emerged (one concerned with the work setting, management
and physical needs and the other with needs related to the development of the individual)
themselves correlating to produce a single third order or general work need factor, has many
implications for both the theory and measurement of work adjustment in general as well as
for the theory, research and measurement of work needs specifically . For measurement, for
example, the first eight correspondence scores of Table 7 .5 in chapter seven, those of a
reasonable magnitude, were also spread across the five first order factors of achievement,
working conditions, policies and practices , autonomy and altruism. This suggests that only
one variable which is associated with each of the first order factors needs to correspond with
426
its relevant reinforcer in order for satisfaction to occur. Such a conclusion would mean that
as few as five key reinforcers may need to be present for satisfaction to occur.
Therefore, it would appear to be necessary to gather correspondence scores for five needs ,
choosing those to represent one of the five need factors . Needs which would meet such
criteria are variety, achievement (or ability utilisation, but both may not be necessary) ,
responsibility (or creativity) , human relations supervision and moral values . The latter
accounted for only 8 % of the variance common to need-reinforcer correspondence and
satisfaction. As such it would be expected to contribute less to the relationship . Another
possibility would be to obtain correspondence scores for the needs and reinforcers which
share the greatest amount of variance with satisfaction scores , defining a particular cutoff
point for the amount of variance considered reasonable.
The correspondence of as few as five needs and reinforcers is the likely minimum
requirement for satisfaction to occur but not all of these would be expected to contribute to
satisfaction equally . The relative contribution of each could be expected to vary among
individuals . On average, achievement and ability utilisation were found to contribute equally,
and variety and technical supervision contributed less but to a similar degree to each other.
Human relations supervision, recognition, responsibility and creativity all contributed a
similar amount. That the achievement need plays such a frequent and major role is consistent
with the importance placed on achievement in Nach motivation theory (Murray, 1938 ;
McClelland, 1958) discussed in chapter one.
The magnitude of the correlations between (a) the single item of satisfaction used in the
present research, "All things considered, how satisfied are you with your job? Which number
comes closest to how satisfied or dissatisfied you feel? " (the scale used was 1 = dissatisfied
to 7 = satisfied) (Campbell , Converse and Rodgers, 1976) , and work needs and (b) the multi
item measure of the M.S .Q . and work needs were similar at . 6 1 and . 64, respectively. The
single-item measure could be considered the easiest and most economical to administer where
specificity of needs is not required (where an overall measure of satisfaction is suitable and
the individual aspects of job satisfaction are not of interest for the purpose at hand) . It may
also be valid to substitute the single-item measure because of the apparent existence of higher
order need factors, two at a second level and one at a third (a general work need factor) level .
Such a single-item measure may be an operationalisation of the general work need factor. The
conceptualisation and measurement of work needs with respect to which level of factors are
important raises questions of reliability of replication of factors and their operationalisation.
427
Lower order factors would be of particular use where there is a need to differentiate more
fully among many work needs . But at all levels the reliability issues will determine which is
the best model not only for different circumstances but overall .
Questioning the factor structure of work needs has implications for the use of the original six
factors to represent work reinforcers . Finding a different number of factors , in this case
fewer, represents an inability to replicate Dawis and Lofquist 's factors in this sample at least.
Some of the lack of replication of the number of factors will relate to differences in factor
analytic results as computer programmes have become increasingly sophisticated. However,
of more concern is the doubt cast on the overall validity of the factor structure of Dawis and
Lofquist' s factor findings because of their failure to consider a nonorthogonal approach. This
could be particularly serious in the light of their expectation that because factors represent
common components, their measurement would be more stable than that of skills and needs .
Therefore, more importance might b e attached to measurements which are considered to be
the more stable, that is , values (the factors) in this case rather than the individual needs .
However, if the values are not replicated they may be no more stable than individual needs
measurements .
That five rather than six factors were found for the data of this study, tends to suggest that
a more parsimonious description of the reinforcer preferences of individuals has greater
validity . Doubt about the validity of instruments based upon Dawis and Lofquist ' s factor
analyses could also result because their factors were found to be correlated.
The presence of any underlying factors has implications for the use of any of the instruments
which were designed on the basis of a six first order factor model . Dawis and Lofquist' s
representation of work reinforcers providing a basis for the taxonomy of work environments ,
the Minnesota Occupational Classification System II, may not therefore be a meaningful way
of differentiating among occupational groups via reinforcer characteristics . The Minnesota
Satisfaction Questionnaire (M.S .Q .) was designed to measure job satisfaction dimensions that
parallel dimensions of needs as measured by the Minnesota Importance Questionnaire
(M.I .Q . ) . However, when factor analyzed two factors (extrinsic and intrinsic satisfaction)
emerged for Dawis and Lofquist rather than the six of their MSQ factor analysis. In the case
of the present research for the MSQ and MIQ the parallel measurement of the dimensions of
need and job satisfaction is closer to being achieved because the factor structure of the data
from both was very similar. The common variance might be better described by the higher
428
order factors , but the measuring instruments or the system for scoring them would need to
reflect this .
The instruments of Dawis and Lofquist's work adjustment theory may need more than just
refining, as their authors had suggested; they may need a complete redesign. The applications
of querying the validity of the instruments in the counselling setting may be that their use to
enhance an individual's understanding of self and the environment may be limited if either
is not being described accurately. With respect to the use of the instruments in training, the
development of skills to achieve and maintain work adjustment, may be different if the work
valued is viewed differently . And finally, in the area of environmental design, the
restructuring of the work environment to increase work adjustment may take a different form
in the knowledge of a different structure of work needs .

429
CHAPTER NINE
CONCLUSIONS OF FINDINGS
The main conclusions to be drawn from the findings of the present research are concerned
with the nature of the respondent group, the descriptive findings of the work adjustment
related variables , the similarities and differences among the academic groups, and the validity
of aspects of the Dawis and Lofquist model of work adjustment which were under
investigation and the considerations of the expanded model .
9 . 1 The nature of the respondent group.
The respondent group were homogenous with respect to much of their own background data,
such as age and marital status . The parents ' qualifications, fathers ' occupations and incomes
were also very similar. Typically students were between 19 and 25 (this represents one
standard deviation either side of the mean age of 22) , were single, had no children, were
Caucasian or classified themselves as New Zealanders , had received five years of secondary
schooling and at least Higher School Certificate (a year of schooling beyond that required for
entry into University) . Typically parents received moderate incomes and nearly a quarter of
them had attended university,
Fathers were more likely to be in professional occupations and more fathers than mothers
were in administrative and managerial type of positions. Most of the sample described
themselves as in excellent health, as engaging in one to two leisure activities usually in the
company of one or two others . The greatest percentage lived in a flat with others . Most had
been in employment at some time previously. There was an improvement in satisfaction with
living circumstances by stage two of the study. The respondents would probably have a
greater degree of choice about where they might live. Their salaries were similar with only
the Horticulture group reporting high salaries . Veterinarians and Business Studies groups were
not represented in the low salaries group. The respondents on average appeared to have a
high absenteeism rate . They had been absent for about a month in the first six to 'nine months
of employment. This rate may be similar to that found in the general population. The rate

430
may be similar to that of high school students taking up their first jobs . The rate may reflect
adjusting to the transition from the work patterns of study to those of a job .
The differences among academic groups to do with qualifications and numbers of years
schooling were as might be expected. With the intense competition associated with entry to
some programmes, one group, that of Veterinary Science, was over-represented among those
with higher school qualifications (such as A Bursaries and University Scholarships) .
Agriculture and teaching groups showed differences in level of mother's income. Differences
in accommodation arrangements related to the type of degree or diploma being undertaken.
Where students were to be on campus for a year only they were more likely to be living in
a hostel on campus itself. The levels of salaries of the respondents were commensurate with
their qualifications when they were employed in the area for which they were qualified. With
respect to the salary level of friends only the Humanities group had friends from all salary
groups .
9 .2 Findings on work adjustment and related variables
With respect to work adjustment and related variables , correspondence between work needs
and reinforcers occurred. However, this correspondence affected job satisfaction only in the
case of certain needs. These needs are achievement, ability utilisation, variety and technical
supervision. Social status work needs on the other hand were not met to the same extent,
possibly because social status could be expected to be less for incumbents who have just taken
up a position. The Social Sciences group having their social status needs met to a lesser extent
may have to do with the social status of the type of job that group tended to occupy. Many
of the social service and helping professions have not received top social status ratings
(Montague-Brown, 1976) .
Respondents were less satisfied in the areas which might be expected in the early stages of
employment, areas such as authority and recognition. Respondents were more confident about
having their work needs met (higher self-efficacy) once employed. Employment could be
expected to allow them the opportunity to realistically appraise the extent to which the work
needs that are important to them would be able to be met. Those academic groups
demonstrating high self-efficacy for job/lifestyle compatibility tended to do so for all work
needs and their subjective well-being was correspondingly high. The academic groups
43 1
reporting a lower subjective well-being were the Business studies, Agriculture and Social
Sciences groups.
The quality of life measures showed that a degree of satisfaction was achieved in all the
domains relating to satisfaction, but to a lesser extent for savings and living standards .
Satisfaction was, therefore, less in those domains which could not be expected to provide
satisfaction in the initial employment stage. In most cases , leisure activities were regarded by
respondents as at least as important and generally more so, than · their job . This finding
highlights the need to consider leisure in relation to work.
9 . 3 Level of support for the Dawis and Lofquist model
With respect to the variables of the work adjustment model, the work needs which were not
reinforced in this sample related to those reinforcers less likely to be present in the earlier
stages of employment (for example, social status and authority) . This was the case primarily
for the Social Sciences and Science groups. However, all respondents appeared to regard their
jobs as short-term and as a transition to what they hoped to be doing in the longer term. For
this respondent group (and probably also for others where a number of job changes are likely)
satisfaction and satisfactoriness may affect job attachment and tenure less in the early stages
of employment (where lower levels of both are probably more acceptable) but more in the
later stages of employment where higher levels of both might be expected.
In this sample, the results show that tenure and job attachment are separate constructs . Both
the Dawis and Lofquist model and the expanded version support the involvement of j ob
attachment. However, it would appear that changing organisational and work conditions,
mean that in general , tenure expectations are minimally related to work adjustment. Job
satisfaction and job attachment are now better predictors of work adjustment. In many
instances , the important factor might be that individuals achieve a certain degree of
satisfaction overall, not which specific work needs and reinforcers are involved. There may
be certain reinforcers identifiable as more likely to exist in specific occupations but this is not
revealed from the present study.
432
The needs of the individual and the employer with respect to the levels of satisfaction and
satisfactoriness may not be the same. If each places their own needs first, this does not
necessarily mean their needs are incompatible, but just that each may have different priorities .
Employees could well be more interested in and motivated towards achieving and increasing
satisfaction, whilst employers may treat satisfactoriness as a greater priority.
In looking at the level of support for those aspects of Dawis and Lofquist 's model studied,
the strongest relationships in the Dawis and Lofquist model were those of Proposition I,
where satisfaction and satisfactoriness as operationalised, predicted work adjustment. Tenure
was shown to be a joint function of satisfactoriness and satisfaction; but the relationship was
greater when the construct of job attachment was substituted for expected tenure . One of the
weaker relationships of the model was satisfaction as a function of need-reinforcer
correspondence. Although satisfactoriness operated as a moderator of this relationship only
a small amount of the variance of the relationship was accounted for by it. Flexibility acted
as a slight moderator in the same relationship. The use of adjustment modes, although
inversely related to satisfaction for many of the adjustment styles , was able to account for
only a small percentage of the variance.
9.4 Level of support for the expanded model
The expanded model accounted for a greater proportion of the total variance than did the
original . It was especially strong in showing expected tenure to be a function of use of an
active adjustment style, flexibility and perseverance. The model was strongest in the effect
of j ob satisfaction on well-being. The relative importance of work was found to moderate the
job satisfaction/well-being relationship. When work was more important, job satisfaction
affected subjective well-being. Subjective well-being was found to be a function of social
support, leisure satisfaction and health .
Other aspects of the expanded model able to account for small to moderate amounts of
variance were the Holland personality types (the enterprising, artistic and status scales) and
the Dawis and Lofquist adjustment styles (especially the reactive style) as a function of locus
of control and self-efficacy.
1 and these constructs were not relatively independent .
433
Self-efficacy in terms of workers ' confidence to obtain work needs and to be satisfactory, was
high. Those individuals who regarded themselves as efficacious reported higher levels of
subjective well-being. For this sample the domains where satisfaction was lower were those
which, on reflection, employees are least likely to feel will be satisfied (for example, savings
and standard of living) . For this sample the general importance of both savings and
housework was low.
Of the variables emerging as having a role to play in job attachment the social reference
group appeared as important. Those respondents viewing themselves as more satisfied in their
j obs than their friends, were more attached to their jobs. The level of social support of the
respondents appeared to be reasonable. Not surprisingly the sample (at a peer-oriented age)
favoured their friends over relatives and workmates as confidants. Neighbours were regarded
as more distant than bosses and workmates . Relationships with neighbours could alter as the
respondents emerge from the transition from university to work stage. The sample was often
evenly divided in their willingness to talk about their problems with others and in their fears
about a loss of respect as a result. Only about 1 % of individuals had nobody outside their
close partner or spouse to talk to.
The inclusion of additional variables in the model was justified because the relevant correlates
showed them to be as important to the model as many of those in Dawis and Lofquist's
original formulation. Personal competence (locus of control), subjective well-being, job
importance, leisure satisfaction, social reference group factors , j ob-lifestyle compatibility and
general adjustment all had roles to play in predicting work adjustment.
The findings did indicate the work need factor structure to be different from that of the
original model and more like that suggested in the expanded model . Its hierarchical nature
with the second order factors, reflecting extrinsic and intrinsic aspects of work needs, is
commensurate with the extrinsic and intrinsic factors found in this and other research. The
finding of a different factor structure has implications for the measurement of work needs
and, therefore, their correspondence with work reinforcers . The work needs which load on
more than one first level factor, to produce second order factors, might be considered the
most important in the sense that they provide the most information about the work needs
overall. However, the presence of second order needs implies that not all work needs must
be reinforced for satisfaction to occur. A shorter instrument than the MIQ might measure the
434
importance of a smaller number of needs which can be represented by the work factors at a
higher order factor level . The highest order factor (the general work need factor) may be too
general for most purposes . However, it does need to be acknowledged in interpreting the two
second order needs because of course its very existence indicates these are correlated.
Because the first level factors are correlated, not all may need to be individually represented.
The significant correlation between the single-item satisfaction measure and the items of the
MSQ, suggests that the single-item measure may be measuring needs at a higher factor level.
This has implications for both the measurement of job satisfaction and of need-reinforcer
correspondence, in that a single-item global measure of job satisfaction (and even a single
item measure of needs-reinforcer correspondence) may be sufficient, if specificity is not of
concern. A single-item measure would have the added advantage of being more economical
to administer compared with even the short versions of Dawis and Lofquist's instruments.
However, when the aim of an investigation required the individual consideration of needs,
the MIQ would be more appropriate.
In addressing the question of what level of generality of work need factors might be
appropriate with respect to work needs, consideration of the need hierarchy and the criteria
of generality and specificity would obviously need to be decided for each task at hand.
However, the validity and reliability of each factor would play a role in its usefulness . Even
if for many purposes the single underlying factor might be too general, the second order
factors identifying a division between the physical work characteristics (an extrinsic factor)
and those to do with the individual' s own development (an intrinsic factor) may be the most
useful with respect to need-reinforcer correspondence and its affect on job satisfaction.
9 . 5 Directions for future research
In general terms, the findings have implications for the applicability and operationalisation
of Dawis and Lofquist' s theory of work adjustment. The results increase understanding of the
process of work adjustment by expanding Dawis and Lofquist's model to include other
variables of importance and by illustrating the existence of a hierarchical work need factor
structure. The findings have implications for the application of the theory of work adjustment
(and its measurement) to the workplace. Dawis and Lofquist' s instruments continue to be used
widely and their theory, on the whole, continues to be accepted without criticism. Further

435
research seems appropriate to help further clarify constructs. A redesign of the work need
instrument may be required if the work need factor structure found here is replicated
elsewhere.
More specifically, the findings in relation to Dawis and Lofquist's key concepts of their
paradigm, showed job satisfaction not to be dependent upon the correspondence of all work
needs thus leading us to ask which work needs are likely to be involved for different
individuals and occupations and how these might be best measured. The purpose to which j ob
satisfaction measures are to be put will help determine how much detail about them is
required, for example, details about which need reinforcer correspondence terms influence
job satisfaction.
Questions of when and if work needs stabilise and whether satisfaction and satisfactoriness
have the same effects over different stages of employment are important. The question about
whether the needs of the individual and the employer with respect to the levels of satisfaction
and satisfactoriness are the same could be considered. The priorities of each need in specific
situations could be identified and the correspondence between them assessed. Further research
could investigate the effect of any correspondence found.
In general, in order to increase our understanding of work adjustment we need to develop
theories which more closely approximate what occurs in the applied setting . More complex
theories are probably more likely to approximate reality, but in the interests of parsimony,
need to be continually compared with simpler models and investigated carefully. The present
research fits within the guidelines Holland ( 1987) gave for increasing the amount of variance
which might be explained. In general terms, Holland (op. cit . ) recommended using a theory
of congruence with a good track record, identifying moderator variables , giving the
environmental assessment its share of attention and using the more recent methods of
congruence estimation. He also recommended research comparing different person
environment congruence estimation methods. He favoured the development of theoretical
models which looked beyond personality theory and outside the individual subdisciplines of
Industrial/Organisational Psychology, Social Psychology and Vocational Psychology.
One way of addressing these issues generally which was used in the present research and
which is consistent with Hage's expectation, is to add a variable or variables from another

436
paradigm to raise the amount of variance explained (as discussed in chapter 5 , section 5 . 9) .
The addition of further variables of a cognitive and social nature , which made up the
expanded model of the present research, enabled more of the variance in work adjustment to
be explained. The breaking of the 50 % barrier for some of the variables may have occurred,
in part, because variables from different paradigms and theoretical orientations were included.
Certainly, the expanded work adjustment model and the recognition of the existence of a
hierarchical structure of work needs, with multiple levels of work need factors, appeared to
better represent what might be occurring in the work adjustment process .
436i
9.6 Further implications of applying the Expanded Model
Commonly learned lessons , important here also, have been the value of applying what might
be a well-accepted theory critically and considering the implications of findings for a theory's
instrumentation. For the occupational practitioner the expanded model might be applied more
effectively with work adjustment theory's inconsistencies reconciled, its scope extended
(through the addition of important cognitive and social variables and moderators) and the
work need factor structure revised. It will be important to ascertain whether those work needs
identified as important and the findings concerning which work needs affect satisfaction for
this sample will be replicated elsewhere. It may help alleviate the concern expressed herein
and elsewhere (for example, O'Brien, 1986) that person-environment measures suffer from
a lack of theory about which needs and abilities are the most important.
It would be of use to investigate whether the factor structure is replicated and if work needs
can be described generally as being of an extrinsic or intrinsic nature (as represented by the
second order factors of work setting management and physical needs and individual
development needs, respectively) . Practitioners may find it informative to factor analyse their
own work needs and job satisfaction data from administering the MIQ and MSQ, in particular
investigating whether the factor structure is nonorthogonal . They would need to consider
whether other factors (of a social, cognitive, or economic nature, for example) influence a
work adjustment model . Where factor analysis indicated that gathering information about all
the work needs was redundant for certain purposes, the design of shorter, simpler
questionnaires would be recommended. Using LISREL to look at factor structure and causal
relationships among variables can be of assistance, not only to provide another technique for
comparison purposes with factor analytic results but also as a way of addressing validity and
reliability issues in instrument development .
A concern about a lack of a uniform inclusive set of variables to describe the relevant
dimensions (O'Brien op. cit . ) also might be met by basing measures on the higher order
needs . This would further respond to the difficulty employees are believed to encounter in
describing their job, abilities and needs accurately. O 'Brien's solution was to first have
individuals identify the degree to which jobs use their skills and match their needs and then
to determine empirically what these abilities and needs are. Needs could also be inferred (in
the way Dawis and Lofquist suggested) from the available reinforcers in the job given they
436ii
can be easily and accurately measured. In the case of the MIQ, when respondents are
confronted with a long list of needs and are asked to rate in absolute terms whether they are
important or not, the tendency might be for most, if not all , of the needs to be rated as
important. However, this tells us little about which actually affect work adjustment variables .
For some purposes a high degree of detail and specificity concerning work needs is necessary.
However, irrespective of the amount of detail required, instruments could be developed on
the basis of an extrinsic/intrinsic dichotomy in the factor structure of work needs . Computer
software could be continued to be developed to assist in the administration and scoring of
work needs and job satisfaction instruments (and in the identification of their underlying
factor structure) .
In applying work adjustment theory some other specific issues arise. There is the need to
examine the stability of work needs and to look at any gender based differences while
considering the implications of these for work adjustment . A relationship between satisfaction
and satisfactoriness would need to be recognised, the two constructs themselves and variables
such as job attachment need to be given greater credence in predicting work adjustment than
the seemingly outmoded outcome variable of tenure . The search for other possible important
moderators affecting key causal relationships could continue. In assessing whether important
variables might still be missing, we not only need to consider other models within an
individual psychological approach (such as one which includes cognitive and self-concept
factors as here) but also how to broaden the focus to other paradigms. Factors more
associated with groups and the environmental context (such as the social and economic
context) and the relationship between contexts (like work and non-work) could be considered .
. O 'Brien understood the main reason advanced by Dawis and Lofquist in support of their
ambitious research effort was that the field of rehabilitation had badly needed objective
instruments that could measure the utility of training programmes designed to help disabled
individuals re-enter the work force. Dawis and Lofquist 's measures are convenient measures
of vocational potential which improve upon the traditional reliance on performance data as
a measure of obtaining and remaining in a job . The measures can show the changes in
attitudes and behaviour which may have contributed to such outcomes . Their approach can
enable the selection of more promising candidates , compare treatment effectiveness and
ascertain why certain individual are more successful . However, the Minnesota data has been
credited (O'Brien, 1986) with only modest success in devising such instruments with large

436iii
domains of possible error left unaccounted for . Although the present research has reduced
some of this error, mental testing as an approach for assessing the vocational potential of
seriously disabled people might still be regarded as limited (Neff, 1985).
Dawis and Lofquist (1964) have, in describing extensively the applications of their theory and
its implications for other areas of psychology, emphasised that none of these have as yet been
empirically tested. In applying the theory to non-work the relevant qualifier is substituted for
work (such as social needs rather than work needs and so on) . In some instances the
environment portion of the model will be another individual or group of individuals . The
findings of the present research could improve the application of work adjustment theory
through considering cognitive, social and other-environment (such as non-work) influences
in all the areas suggested. A summary of the various areas to which work adjustment theory
and modified versions such as the expanded theory could be applied, follows .
Work adjustment theory provides one model for individual vocational assessment . Empirically
derived scoring keys which relate biographical items to measured abilities and needs could
be revised if necessary to account for a different need factor structure. The aim of basing
clinical-prediction of the best possible career choices (by aiming for optimal satisfaction and
satisfactoriness) on the client's subjective appraisal and the counsellor's clinical experience
is made explicit in the expanded model . Dawis and Lofquist identified constraints that the real
world places on the career planning of a client to make the best choices as being financial
resources , availability of training, individual and family mobility and societal expectation. The
expanded theory considers many of these constraints. A more subjective appraisal through
constructs such as self-efficacy, subjective well-being and locus of control can be obtained.
In job adjustment problems (such as feeling "burned out") the expanded model can assist by
broadening the framework in exploring the bases and extent of job adjustment problems .
Where work adjustment has not occurred despite being predicted because personality and
environment have corresponded, other factors (such as those of the expanded model) can be
considered. In counselling for job change and searching for job environments which are more
likely to be correspondent, the expanded model is likely to account for more of the influences
on work adjustment. The employer can benefit from recognising when modifying the job
environment will have an effect upon satisfaction and satisfactoriness and the role of
previously largely ignored influences, such as those of non-work. In unemployment

436iv
counselling some of the consequences of loss of employment, such as loss of self-esteem, loss
of identity and depression may be addressed through highlighting the individual 's potential
for re-employment and translating counselee's skills and previous work experience into
appropriate job possibilities , while taking the impact of leisure activities , the self-concept and
social factors such as social support into account.
In vocational rehabilitation counselling, the theory conceptualises disability in psychological
terms and adds vocationally relevant information to basic medical and physical information.
Looking at degree of ability remaining and client perception of it can be more informative
than looking at absolute loss of ability when comparing the potential of different individuals .
The theory can identify kinds of information needed for vocational assessment and can
suggest procedures that might be used in counselling. Work environments can be described
in psychological terms that relate to an individual's work adjustment. The theory can provide
outcome criteria to evaluate the effectiveness of vocational rehabilitation counselling. The
expanded model would be expected to be as helpful to the other areas of personal counselling
where Dawis and Lofquist suggested their theory be applied, that is in marriage, family,
stress, addiction, self-esteem, dependency and adjustment to retirement counselling .
In organisational and societal development work adjustment theory has applicability to
selection and training of personnel, employee development and training, employee motivation
and morale, job analysis and job design. The traditional equations which predict ability to
perform and which were extended by work adjustment theory to attend to the need-satisfaction
aspects of individual-environment correspondence, could be further extended to accommodate
the expanded model . Extrinsic and intrinsic needs could be focused upon and the congruence
of employee and employer interests, goals and priorities in this respect investigated. As well
as training programmes based on knowledge of abilities and values, client's could be trained
in developing better knowledge of self-concepts and social relationships. In training and
practising tasks which approximate the reinforcer system of the job, other aspects like self
efficacy and subjective well-being could be enhanced through training. The choice of modes
of training might alter such that group interactive techniques might be more appropriate for
trainees with a strong preference for social reinforcers (Dawis and Lofquist suggest high
scores on altruism and social status may indicate this) . Alternatively, techniques based on
individual initiative might be more suitable for trainees with strong preferences for self
reinforcers .
436v
Job analysis might be improved by including further information important to the
understanding and prediction of employee satisfaction and to the continuing process of
adjustment to work. Information on adjustment styles could be included thus enhancing job
analysis as an important tool in employee selection, placement, transfer, promotion,
performance evaluation and compensation.
The model could be applied to social issues . Where problems resulting, for example, from
lack of career planning or unemployment involve many individuals they can be viewed in the
larger context as social problems, the solution of which requires information on which to base
the development and implementation of public policy. National statistics on the distribution
of skills/abilities and needs/values and the reinforcers available in present and future j obs (as
advocated by Dawis and Lofquist) would also be of use in the New Zealand context . A
computer-based system could make such information available to educational institutions and
social agencies providing counselling and vocational guidance services . Similarly, a
nationwide programme to facilitate the rapid assessment of ability requirements and reinforcer
patterns in new or emerging jobs in order to achieve the most effective societal adaptation to
technological change would also be of relevance to New Zealand.
In the area of education the model can further contribute to the goal of bringing out the latent
potential of individuals and providing opportunities for the learning of behaviour and skills
in a wide range of activities by sampling various combinations of abilities and providing
experience with various combinations of reinforcers . Dawis and Lofquist have advocated the
identification of Educational Reinforcer Patterns (ERPS) along the same lines as Occupational
Reinforcer Patterns have been established. The vocational training implications are that
individuals could be selected not only with respect to requisite abilities and effective
reinforcer systems of occupations but also with respect to cognitive and social aspects . Skill
training could make use of all the relevant facets .
The revised model , like work adjustment theory, has implications for other areas of
psychology being similarly useful in the study of such topics as motivation, learning, human
development, social behaviour and abnormal behaviour. An individual 's position on the
flexibility dimension, for example, can provide an index of motivation through their tolerance
for discorrespondence and their motivation to maintain correspondence. Flexibility might be
predicted by variables such as locus of control and self-efficacy. Large changes in motivation
436vi
brought about by the onset of a disability, for example, has been identified by Dawis and
Lofquist as one of the most promising areas of research. They also suggested the motivation
factor in a learning experiment could be controlled by manipulating the environmental
reinforcer system to produce different target levels of correspondence and the different initial
levels of motivation. In human development the approach of the model provides a more
precise specification of the origin and stabilisation of personality . Dawis and Lofquist ( 1984)
have described how work adjustment theory meets Hall and Lindzey's ( 1970) criteria for a
personality theory. The expanded model adds to their focus on a more objective reality, a
perceived (subjective) reality, for example in the form of perceived satisfactoriness and
measures of self-efficacy and subjective well-being. Unlike Dawis and Lofquist's theory this
requires the introduction of a self-concept . The expanded or revised model in investigating
similarities and differences among certain groups is not as strongly focused on uniqueness and
individuality.
Social behaviour can be studied, like other non-work areas, in work adjustment theory terms
by (as previously mentioned) substituting the relevant qualifier which is social in this case,
for the qualifier work in the model . Personality constructs can be used as likely moderators
of the social interaction between individual and environment . The model can be applied to
abnormal behaviour which can be defined as remaining in a discorrespondent environment
or as leaving a correspondent one. Other abnormal behaviour might be the possible distortion
of self-perception and difficulties with social factors such as social reference group
identification and/or social support. The task becomes one of bringing about correspondence
or improving the perception of it. Not only can the prior history of the individual be used as
normative behaviour but also individuals ' expectations and their comparisons of self with
others can be used.
One of the apparent strengths of work adjustment theory is the number of different contexts
to which it can be applied, all of which could benefit from the increased validity a modified
version can provide. The revised model still has the correspondence principle central to it,
but is more internally consistent, is less reliant on tenure as an indicator of work adjustment,
recognises the importance of social and cognitive factors and will allow the integration of
other relevant constructs and paradigms . The application of the principles of work adjustment
theory and modifications to it appear limited only by the skills and degree of imagination of
the researcher and practitioner in various fields .

437
REFERENCES
Abbott, M . , & Koopman-Boyden, P. G. (1981) . Expectations and predictions of the division
of labour within marriage . New Zealand Psychologist, 10, 24-32.
Abdel-Halim, A. A. (1982) . Social support and managerial affective responses to job stress .
Journal of Occupational Behaviour, �'
281 -295.
Abrams , M. & Hall, J . F. (1972). The condition of the British People: Report on a Pilot
Survey Using Self-rating Scales . London: Survey Unit, British Social Science
Research Council, mimeograph, 1972.
Adams, J. S . (1965) . Inequity in social exchange . In L. Berkowitz (Ed.) , Advances in
Experimental Social Psychology (Vol . 2, pp. 267-299). New York: Academic Press .
Adams-Webber, J . R. (1979) . Personal construct theory: concepts and applications .
Chichester: John Wiley & Sons .
Albright, L . E . (1978). In Buros, 0. K. , The eighth mental measurements yearbook (Vol .
2 , pp 1671-1673) . New Jersey: The Grypton Press.
Alderfer, C . P . (1969) . An empirical test of a new theory of human needs . Organisational
Behavior and Human Performance, :!:, 142-175 .
Allen, L. R. (1980) . Leisure and its relationship to work and career guidance. The Vocational
Guidance Quarterly, 28, 257-262.
Allport, G . W. (1937) . Personality: A psychological interpretation. New York: Holt,
Rhinehart and Winston.
Allport, G . W . (1961) . Pattern and growth in personalitv . New York: Holt, Rhinehart and
Winston.

438
Allport, G . W . , Vernon, P . G . , & Lindzey, G . (1970) . Manual: Study of values . Boston:
Houghton Miffin.
American Psychological Association (1983). Publication manual of the American
Psychological Association (3rd ed. ) . Washington, D .C . : American Psychological
Association.
Anastasi, A . ( 1958) . Differential psychology. (3rd ed. ) . New York: Macmillan.
Anastasi , A. ( 1964) . Fields of applied psychology. New York: McGraw-Hill.
Anderson, C. D . , Warner, J. L . , & Spencer, C. C. ( 1984) . Inflation biases in self-assessment
examination: Implications for valid employee selection. Journal of Applied
Psychology, 69, 574-580.
Anderson, J. C . , & Gerbing, D. W. ( 1984) . The effect of sampling error on convergence,
improper solutions and goodness-of-fit indices for maximum likelihood confirmatory
factor analysis . Psychometrika, 49, 155-173 .
Anderson, V. V . (1929) . Psychiatry in industry, New York: Harper.
Andrews , F. M . , & Withey, S . B . (1976) . Social indicators of well-being: America's
perception of life quality. New York: Plenum Press .
Aneshensel, C . S . , & Stone, J . D . ( 1982) . Stress and depression: A test of the buffering
model of social support. Archives of General Psychiatry, 39, 1392-1396.
Argyris, C . ( 1972) . The applicability of organizational sociology. Cambridge, England:
Cambridge University press .
Atkinson, J . W . (1964). An introduction to motivation. New York: Van Nostrand Reinhold.
Auden, W. H. ( 1972). Culture and Leisure. In G. Bell & J. Tyrwhitt (Eds .) , Human identity
in the urban environment. Harmondsworth: Penguin.

439
Bacon, A. W. (1975) . Leisure and the alienated worker: A critical reassessment of three
radical theories of work and leisure. Journal of Leisure Research, 1. 179-190 .
Baehr, M. E. ( 1953) . A simplified procedure for the measurement of employee attitudes .
Journal of Applied Psychology, 37, 163-167.
Baird, L . S . ( 1977) . Self and superior ratings of performance: As related to self-esteem and
satisfaction with supervision. Academy of Management Journal, 20, (2), 291-300.
Bakke, E. W. ( 1953) . The fusion process . New Haven, Conn. : Labor and Management
Center, Yale University .
Bandura, A. (1963) . Imitation of film-mediated aggressive models . Journal of Abnormal
Social Psychology, 66, 3- 1 1 .
Bandura, A . (1977) . Self-efficacy: Toward a unifying theory of behavioural change .
Psychological Review, 84, 191-215 .
Bandura, A. ( 1977b) . Social learning theory. Englewood Cliffs , N.J . : Prentice-Hall .
Bandura, A . (1982) . Self-efficacy mechanism in human agency. American Psychologist, 37,
122- 147.
Bandura, A. , Adams, N. E . , & Beyer, J. ( 1977) . Cognitive processes mediating behavioral
change . Journal of Personality and Social Psychology, 35, 125-139.
Barrera, M. , Sandler, I . N. , & Ramsey, T. B . (1981) . Preliminary development of a scale
of social support: Studies on college students . American Journal of Community
Psychologv, �. 435-447.
Bar-Tal , D . , & Frieze, I . H. (1977) . Achievement motivation for males and females as a
determinant of attributions for success and failure . Sex Roles, J, 301-3 1 3 .

440
Beehr, T . A . , & Newman, J. E. ( 1978) . Job stress , employee health, and organizational
effectiveness : A facet analysis , model and literature review . Personnel Psychology,
3 1'
665-699.
Beiser, M . ( 1974) . Components and correlates of mental well-being. Journal of Health and
Social Behaviour. 15 , 320-327.
Bentler, P . M . ( 1980) . Multivariate analysis with latent variables : Causal modelling. Annual
Review of Psychology, 3 1 , 419-456.
Bentler, P. M . , & Weeks, D . G . ( 1979) . Interrelations among models for the analysis of
moment structures . Multivariate Behavioral Research, 14, 169-1 85 .
Bentz, V . J . ( 1953) . A test-retest experiment o n the relationship between age and mental
ability. American Psychologist, �. 3 1 9-320.
Berkman, L. F. ( 1986) . Social networks , support and health: Taking the next step forward.
American Journal of Epidemiology, 123 , 559-562.
Best, F . ( 1980) . Exchanging earnings for leisure: Findings of an exploratory national
survey on work time preferences . Washington D . C. : U .S . Government Printing
Office.
Betz, E. L. ( 1969) . Need reinforcer correspondence as a predictor of job satisfaction.
Personnel and Guidance Journal , 47, 878-883 .
Betz, N . E. , & Fitzgerald, L . F . ( 1987) . The career psychology of women. San Diego, CA:
Academic Press .
Betz, N . E . , & Hackett, G . ( 1981) . The relationship of career-related self-efficacy
expectations to perceived career options in college women and men. Journal of
Counselling Psychology, 28, 399-410 .

441
Betz, N. E. , & Hackett, G. (1983). The relationship of mathematics self-efficacy expectations
to the selection of science-based college majors . Journal of Vocational Behavior, 23 ,
329-345 .
Betz, N. E. , & Hackett, G . (1986) . Applications of self-efficacy theory to understanding
career choice behavior. Journal of Social and Clinical Psychology, :!:. 279-289.
Bhagat, R. S . ( 1983). Effects of stressful life events upon individual performance
effectiveness and work adjustment processes within organizational settings : A research
model. Academy of Management Review, �, (4) , 660-671 .
Binswanger, L. (1963) . Being-in-the-world : Selected papers of Ludwig Binswanger . New
York: Basic Books.
Birnbaum, M. H. (1983) . Perceived equity of salary policies . Journal of Applied Psychology,
68, 49-59.
Blalock, H. M. ( 1964). Causal inferences in nonexperimental research. North Carolina:
University of North Carolina Press.
Blalock, H. M. (1982) . Conceptualization and measurement in the social sciences . B everly
Hills : Sage.
Blau, G. (198 1) . An empirical investigation of job stress, social support, service length, and
job strain. Organizational Behaviour and Human Performance, 27, 279-302.
Blauner, R. (1969) . Work satisfaction and industrial trends. In A. Etzioni, A sociological
reader on complex organizations (2nd ed.) . London: Holt, Rinehart & Winston.
Bloom, R. , & Barry, J. R. (1967) . Determinants of work attitudes among negroes . Journal
of Applied Psvchology, 5 1 , 291-294.
Blum, M. , & Naylor, J. (1968) . Industrial psychology. New York: Harper & Row.
442
Back, R . D . , & Bargmann, R. E . ( 1966) . Analysis of covariance structures . Psychometrika,
n, so7-s34.
Bordin, E . S . , Nachmann, B . , & Segal, S . J. ( 1963) . An articulated framework for vocational
development. Journal of Counselling Psychology, 10, 107-1 16 .
Borgen, F. H. , Weiss, D. J . , Tinsley, H. E. A. , Dawis, R. V. , & Lofquist, L . H. (1968).
The measurement of occupational reinforcer patterns . Minnesota Studies in Vocational
Rehabilitation, XXV.
Borgen, F . H . , Weiss, D . J . , Tinsley, H. E. A . , Dawis, R. V. and Lofquist, L. H. ( 1972).
Occupational Reinforcer Patterns (First Volume), Revised Edition, Minneapolis ,
Minn. : Vocational Psychology Research, University of Minnesota.
Borgen, F. H . , Weiss, D. J . , Tinsley, H. E. A . , Dawis, R. V. and Lofquist, L. H. (1972) .
Occupational Reinforcer Patterns (Second Volume), Revised Edition, Minneapolis ,
Minn. : Vocational Psychology Research, University of Minnesota.
Boss , M . (1963). Psychoanalysis and daseinanalysis . New York: Basic Books.
Boucher, J . , & Osgood, C. E . ( 1969) . The Pollyanna hypothesis . Journal of Verbal Learning
and Verbal Balance, li, 1-8.
Bradburn, N. M. , (1969). The structure of psychological well-being. Chicago: Aldine.
Bradburn, N . M. & Caplovitz, D . ( 1965) . Reports on happiness. Chicago: Aldine.
Brayfield. A . H . , & Crockett, W. H. ( 1955) . Employee attitudes and employee performance.
Psychological Bulletin, 52, 396-424.
Brayfield, A . H . , & Rothe, H. F . ( 1951 ) . An index of job satisfaction. Journal of Applied
Psychology, 35 , 307-3 1 1 .
443
Brenner, M. H. (1977) . Health costs and benefits of economic policies. International Journal
of Health Services, 1 (4) , 581-623 .
Brenner, M. H . (1979) . Mortality and the national economy: A review and the experience
of England and Wales , 1936-1976. Lancet, 15 , 568-573 .
Brief, A. P . , Aldag, R. J . , & Van Sell, M . ( 1977) . Moderators of the relationship between
self and superior evaluations of job performance. Journal of Occupational
Psychology, 50, 129-134.
Brief, A . P. , Stumpf, S . A. , & Hartman, K. (1983) . Self-efficacy and coping with a job
interview. New York: Graduate School of Business Administration. New York
University .
Brigante, T . R. (1958) . Fromm's marketing orientation and the values of the counsellor .
Journal of Counselling Psychology. 2, 83-87.
Brinker, P . A. (1955) . Supervisors' and foremen's reasons for frustration. Personnel Journal ,
34, 101-103 .
Broadbent, D . E . ( 1954) . Some effects of noise on visual performance. Quarterly Journal of
Experimental Psychology, .Q, 1-5 .
Broadbent , D . E. (1971 ) . Decision and Stress . New York: Academic Press.
Broadhead, W. E. , Kaplan, B. H . , Shermon, A. J . , Wagner, E. H . , Schoenback, V . J . ,
Grimson, R. , Heyden, S . , Tibbling G . , & Gehlbach, S . H . (1983) . The
epidemiological evidence for a relationship between social support and health.
American Journal of Epidemiology, 1 17, 521-537.
Brook, J. A. , Kesha, C . , and George, D. (1987) . A bibliography of work and leisure .
Occasional Papers in Psychology. Massey University . No. 12..

444
Brooks, L . , (1990) . Recent developments in theory building. In D . Brown, L. Brooks &
Associates (Eds.) , Career choice and development (2nd ed. pp. 364-394). San
Francisco: Jossey-Bass.
Brown, D. (1990) . Issues and trends in career development: Theory and practice . In D .
Brown, L . Brooks, & Associates (Eds.) , Career choice and development (2nd ed. pp.
506-518) . San Francisco: Jossey-Bass .
Bryant, F . B . , & Veroff, J . ( 1982) . The structure of psychological well-being: A socio
historical analysis . Journal of Personality and Social Psychology, 43, 653-673 .
Burke, R. J. ( 1989) . Career stages, satisfaction, and well-being among Police Officers,
Psychological Reports , 65, 3-12.
Burke, R. J . and Greenglaus , E . R. ( 1987) . In C . L. Cooper and L.T. Roberston (Eds .) ,
International Review of Industrial and Organisational Psychology. Chichester: John
Wiley & Sons.
Byrne, B . (1983) . Investigating measures of self-concept. Measurement and Evaluation in
Guidance, 16, 1 15- 123 .
Cammock, P. , & Inkson, K. (1985) . The aspirations of trade apprentices and their
implications for apprenticeships . Journal of Occupational Psychology, 58, 49-56 .
Campbell, A. Converse , P. E . & Rodgers , W . L . (1976). The quality of American life.
perceptions. evaluations, and satisfactions . New York: Russell Sage Foundation.
Campbell, D. P. ( 1971) . Handbook for the Strong Vocational Interest Blank. Standford,
California: Stanford University Press .
Campbell, D . P . , & Hansen, J .C. (1981) . Manual for the SVIB-SCII Strong-Campbell
Interest Inventory: Form T325 of the Strong Vocational Interest Blank (3rd ed. For
use with the revised and expanded, 198 1 , profile) . Stanford, California: Standford
University Press .
445
Campbell , D . T . , & Fiske, D . W. (1959) . Convergent and discriminant validation by the
multitrait-multimethod matrix. Psychological Bulletin, 56, 8 1-105 .
Campbell, J . P . , Dunnette, M. D . , Lawler, E. E . , & Weick, K. E. (1970) . Managerial
behavior, performance. and effectiveness . New York: McGraw-Hill .
Campbell, J . P . , & Pritchard, R. D . (1976) . Motivation theory in industrial and
organizational psychology. In M. D. Dunnette (Ed. ) , Handbook of industrial and
organizational psychology. Chicago: Rand McNally .
Caplan, R. D . ( 1987) . Person-environment fit theory and organizations: Commensurate
dimensions, time perspectives, and mechanisms. Journal of Vocational Behavior, lL 248-267.
Carmines, E. and Mclver, J. ( 1981) . Analyzing models with unobserved variables : Analysis
of covariance structures . In G. Bohrnstedt and E. Borgatta (Eds), Social
Measurement: Current Issues . Beverly Hills : Sage.
Carsten, J. M. , & Spector, P. E. ( 1987) . Unemployment, job satisfaction, and employee
turnover: A meta-analytic test of the Munchinsky model . Journal of Applied
Psychology. 72 (3), 374-381 .
Cattell, R. B . (1966) . Higher order factor structures and reticular vs hierarchical formulae
for their interpretation. In C. Banks & P. L. Broadhurst (Eds .) , Studies in
Psychology. London: University of London Press, Ltd.
Centers , R. (1948) . Motivational aspects of occupational stratification. Journal of Social
Psychology, 28, 1 87-217 .
Centers , R. J. & Bugental, D . E. (1966) . Intrinsic and extrinsic job motivations among
different segments of the working population. Journal of Applied Psychology, 50,
193-197 .

446
Chadwick-Jones, J . K. , Nicholson, N . , & Brown, C. ( 1982) . The social psychology of
absenteeism. New York: Praeger.
Chamberlain, K. ( 1984) . Theoretical issues in well-being. Paper presented at the annual
conference of the New Zealand Psychological Society, Palmerston North, New
Zealand.
Champoux, J. E . ( 1978). Perceptions of work and nonwork: A re-examination of the
compensating and spillover model. Sociology of Work and Occupations, .2_, 402-422 .
Champoux, J. E. ( 1980). The world of nonwork: Some implications for job redesign effort.
Personnel Psychology, 33, 61 -75 .
Champoux, J . E. ( 1981a) . A sociological perspective on work involvement. International
Review of Applied Psychology, 30, 65-86.
Champoux, J . E . ( 1981b) . An exploratory study of the role of job scope, need for
achievement and social status in the relationship between work and nonwork. Social
Science Research, 65 , 1 53-176.
Cherry, N. ( 1974) . Do career officers give good advice? British Journal of Guidance and
Counselling, �. 27-40.
Clark, R . E . ( 1953) Psychoses: Income and occupational prestige. In R. Bendix and S . M.
Lipset (Eds . ) , Class status and power. Glencoe, Ill . : Free Press . 333-340.
Clement, S . ( 1987) . The self-efficacy expectations and occupational preferences of females
and males . Journal of Occupational Psychology, 60, 257-265 .
Cook, J . , Hepworth, S . , Wall, T. , & Warr, P . ( 1981) . The experience of work: A
compendium and review of 249 measures and their use. New York: Academic Press.
447
Cook, J . D . , & Wall, T . ( 1990) . New York attitude measures of trust, organizational
commitment and personal need non-fulfilment. Journal of Occupational Psychology,
53 . 39-52 .
Cooper, G . L. , & Robertson, I . T. (1986) . (Eds) . International Review of Industrial and
Organizational Psychology. London: John Wiley & Sons .
Costa, P . T . , Jr. & McCrae, R. R. (1980) . Influence of extraversion and neuroticism on
subjective well-being: Happy and unhappy people. Journal of Personality and Social
Psychology. 38, 668-678.
Costner, H. L. (1985). Theory deduction and rules of correspondence. In H. M. Blalock
(Ed. ) , Causal models in the social sciences (pp. 229-250) . New York: Aldine.
Cramer, D . (1990) . Self-esteem and closer relationships : A statistical refinement. British
Journal of Social Psychology, 29, 189- 19 1 .
Crites, J . 0 . (1969) . Vocational psvchology: The study of vocational behavior and
development. New York: McGraw-Hill.
Crites, J . 0 . (1973) . Career Maturity Inventory: Theory and research handbook, California:
CTB/McGraw-Hill .
Crites, J . 0 . ( 1976). Work and careers . In R. Dubin (Ed), Handbook o f work organization
and society. Chicago : Rand McNally .
Crites, J. 0 . (1978) . Theory and research handbook for the Career Maturitv Inventory.
Monterey, CA: CTB, McGraw-Hill .
Cromie, S. ( 198 1) . Women as managers in Northern Ireland. Journal of Occupational
Psychology, 54, 87-9 1 .
Crouter, A . C . (1984) . Spillover from family to work: The neglected side of the work-family
interface. Human Relations, 37, 425-442 .
448
Danskin, D .G . (1955) . Occupational Sociology in occupational exploration. Personnel and
Guidance Journal, 34, 1 34-136.
Dashiell , J. F . (1949) . Fundamentals of general psychology. (3rd ed. ) Boston: Houghton
Mifflin.
Dawis, R. V . , England, G . W. , & Lofquist, L. H . ( 1964). A theory of work adjustment.
Minnesota Studies in Vocational Rehabilitation, 1 5 .
Dawis, R . V . , & Lofquist, L. H. ( 1974) . Minnesota Occupational Classification System.
Work Adjustment Project, Department of Psychology, Minneapolis : University
of Minnesota Press.
Dawis, R. V . , & Lofquist, L. H. ( 1976) Personality style and the process of work
adjustment. Journal of Counselling Psychology, 23, 55-59.
Dawis , R. V . , & Lofquist, L. H. ( 1978) . A note on the dynamics of work adjustment.
Journal of Vocational Behavior, 12, 76-79 .
Dawis, R . V . & Lofquist, L. H . (1984) . A psychological theory of work adjustment: An
individual differences model and its applications . Minneapolis: University of
Minnesota Press.
Dawis , R . V . , Lofquist, L. H . , Henly , G . A . , & Rounds , J. B . Jr . ( 1979/1982) . Minnesota
Occupational Classification System II. Vocational Psychology Research, Department
of Psychology, University of Minnesota, Minneapolis . .
Dawis, R . V . , Lofquist, L. H . , & Weiss, D . J . ( 1968) . A theory of work adjustment (rev . ) .
Minnesota studies in Vocational Rehabilitation, 23 .
DeLeo, P . J . , & Protchard, R. D . (1974) . An examination of some methodological problems
in testing expectancy-valence models with survey techniques . Organizational Behavior
and Human Performance , 12, 143-148.

449
Department of Statistics ( 1980) . New Zealand Census of Population and Dwellings ,
1976: Incomes and Social Security Benefits , (Vol 5 . pp . 6-9) .
Department of Statistics ( 1976) . New Zealand standard classification of occupations manual .
New Zealand: Department of Statistics .
Desmond, R. E. , & Weiss, D . J. ( 1970). Measurement of ability requirements of
occupations . Proceedings of the 78th Annual Convention of the American
Psychological Association, 149-150.
Diener, E. (1984) . Subjective well-being. Psychological Bulletin, 95 , 542-575 .
Dipboye, R. L . ( 1977) . A critical review of Korman's self-consistency theory of work
motivation and occupational choice. Organizational Behavior and Human
Performance , 28 , 108-126. ·
Doering, M . , Rhodes , S . R. , & Kaspin, J. ( 1988) . Factor structure comparison of
occupational needs and reinforcers . Journal of Vocational Behavior, 32 (2), 127-13 8 .
Dolliver, R . H . ( 1978) . In Buros, 0 . K . (Ed) , The eighth mental measurements yearbook
(Vol .2 , pp. 1 624-1 627) . New Jersey: The Grypton Press.
Dreher, G. F. ( 1980) . Individual needs as correlates of satisfaction and involvement with a
modified Scanlon plan company. Journal of Vocational Behavior, 17 , 89-94.
Driver, M. J. ( 1979) . Career concepts and career management in organizations . In C. L .
Cooper (Ed.) , Behavioral problems in organizations. Englewood Cliffs , NJ: Prentice
Hall.
Dubin, R. ( 1976) . Work in modern society . In K. Dubin (Ed.) , Handbook of work
organization and society.Chicago: Rand McNally.
Dunette, M. D . ( 1976) . Handbook of industrial and organizational psychology. Chicago : Rand
McNally College Publishing Company.

450
Dunnette, M. D. (1983). Work and non-work in the year 200 1 . Monterey, California:
Brooks/Cole .
Baton, W.H . ( 1952). Hypotheses relating to worker frustration. Journal of Social Psychology,
35, 59-68.
Eberly, R. E. , Rounds , J . B . , Jr . , Dawis , R. V. , & Williams, R. (1976) . Vocational needs
of three adult male groups : Neuropsychiatric patients, rehabilitation clients,
and college students . Unpublished research paper. Work Adjustment Project,
Department of Psychology, University of Minnesota.
Elizur, D . , & Tziner, A . ( 1977) . Vocational needs, job rewards, and satisfaction: A canonical
analysis . Journal of Vocational Behavior, 10 , 205-2 1 1 .
Emery, F . , & Trist, E . L . ( 1965) . The causal texture of organizational environments . Human
Relations, 18 , 2 1-32.
Endler, N. S . ( 1981) . Persons, situations , and their interactions . In A. I. Rabin, J, Aaronoff,
A. M . , Barclay, R . A. Zucker (Eds . ) , Further explorations in personality. New
York: John Wiley.
England, G. W. (1967). Personal value systems of American Managers . Academy of
Management Journal, 10 , 53-68.
England, G. W., & Lee, R. (1974). The relationship between managerial values and
managerial success in the United States , Japan, India, and Australia. Journal of
Applied Psychology, 59, 41 1-419.
English, H. R . , & English, A . C. (1958) . A comprehensive dictionary of psvchological and
psychoanalytic terms . New York: McKay.
Epstein, S . ( 1979) . Explorations in personality today: A tribute to Henry A. Murray.
American Psychologist, 34, 649-653 .
45 1
Erikson, E. H. (195 1) . Childhood and society. New York: Norton.
Erikson, E. H. (1959). Identity and the life cycle. Psychological Issues, l, (Monograph No.
1) .
Erikson, E. H. (1963). Childhood and society (2nd ed.) . New York: Norton.
Evans, P. , & Bartlome, F. (1980) . The changing nature of the relationship between career
and family. Journal of Occupational Behaviour, �'
9-21 .
Evans, P. , and Bartolome, F. (1986) . The dynamics of work-family relationships in
managerial lives. International Review of Applied Psychology, 35, 371-395 .
Farrell , D . ( 1983) . Exit, voice, loyalty, and neglect as responses to job dissatisfaction: A
multidimensional scaling study. Academy of Management Journal , 26 (4), 596-607.
Farris , G. F. (1971) . A predictive study of turnover. Personnel Psychology, 24, 3 1 1-328.
Feather, N. , & Davenport, P. (1981) . Unemployment and depressive affect: A motivational
and attributional analysis. Journal of Personality and Social Psychology, 4 1 , 422-436 .
Feather, N. T . , & O 'Brien, G . E. (1986) . A longitudinal analysis of the effects of different
patterns of employment and unemployment on school leavers . British Journal of
Psychology, 77, 459-479.
Fergusson, D. M . , & Horwood, L. J. (1986) . The uses and limitations of structural equation
models of longitudinal data. Unpublished. N.Z. : The Christchurch Child
Development Study, Department of Paediatrics , Christchurch School of Medicine.
Festinger, L. (1950) . Informal social communication. Psychological Review, 57, 271 -292.
Festinger, L. (1957) . A theory of cognitive dissonance. Standford, CA: Standford University
Press .
452
Fiedler, F. E. (1958) . Leader attitudes and group effectiveness. University of Illinois Press :
Urbana.
Fincham, R. , & Rhodes , P. S . ( 1980) . The individual. work and organization: Behavioural
studies for business and management studies . London: Weidenfeld and Nicholson.
Fine, S. A. (1955) . A structure of worker function. Personnel and Guidance Journal, 34, 66-
73 .
Finkleman, J. M . , Zietlin, L. R. , Filippi, J . A . , & Friend, M. A. (1977) . Noise and driver
performance . Journal of Applied Psychology, 62, 713-718 .
Fisher, V. E . , & Hanna, J. V. ( 193 1 ) . The dissatisfied worker. New York: Macmillan.
Fitzgerald, L. F . , & Betz, N. E . ( 1983) . In Walsh, W. B . & Osipow, S . H. (Eds .) ,
Handbook of Vocational Psychology, Vol . 1 . Lawrence Erlbaum Associates: New
Jersey.
Fitzgerald, L. F . , & Rounds , J. B . ( 1989) . Vocational behavior, 1988: A critical analysis .
Journal of Vocational Behavior, 35, 105-163 .
Fleishman, E. A. ( 1954) . Dimensional analysis of psychomotor abilities . Journal of
Experimental Psychology, 48, 437-454.
Floderus-Myrhed, B . , Pedersen, N . , & Rasmusson, I. ( 1980) . Assessment of heritability of
personality, based on a short form of the Eysenck Personality Inventory: A study of
12,898 twin pairs. Behavior Genetics , 10 , 153-162 .
Folkman, S . , & Lazarus , R . S . ( 1980) . An analysis o f coping in a middle-aged community
sample. Journal of Health and Social Behaviour, 2 1 , 219-239.
Forer, B . R. (1957) . Manual for the Forer Vocational Survey. Los Angeles : Western
Psychological Services .

453
Forer, B . R. (1953). Personality factors in occupational choice. Education and Psychological
Measurement. U, 361-366.
Fouad, N. A . , & Hansen J. C. (1987) . Cross-cultural predictive accuracy of the Strong
Campbell Interest Inventory. Measuring and Evaluation in Counselling and
Development, 20, 3-10.
French, J . , Rogers , W . , & Cobb, F. (1974) . Adjustment as person-environment fit. In G. V .
Coelho, D . A. Hamburg, & J . E. Adams (Eds . ) , Coping and adaptation (pp . 3 1 6-
333) . New York: Basic Books .
Freud, S . ( 1915) Instincts and their vicissitudes . In James Strachey (Ed.) , Standard edition
of the complete psychological works of Sigmund Freud, Vol. XIV. London: Hogarth
Press, 1957.
Freud, S. ( 1962) . Civilization and its discontents . New York: Norton.
Friedlander, F . , & Greenberg, S. (1971) . Effect of job attitudes, training, and organization
climate on performance of the hard-core unemployed. Journal of Applied Psychology,
55 (4), 287-295.
Friedeman, C. J . , & Gladden, J . W. (1964) . Objective measurement of social role concepts
via the semantic differential . Psychological Reports , 14, 239-247.
Friedman, M . , & Rosenman, R. H. (1974) . Type A behavior and your heart. New York:
Alfred A. Knopf.
Friedmann, E . A . , & Havighurst, R. J. ( 1954). The meanin2: of work and retirement.
Chicago: University of Chicago Press .
Friend, J . G. , & Haggard, E. A . (1948) . Work adjustment in relation to family background.
Applied Psychology Monographs, 16 .
454
Fromm, E. (1941) . Escape from freedom. New York: Holt, Rhinehart & Winston.
Fromm, E. (1947) . Man for himself. Rinehart: New York.
Furnham, A. (1984) . Work values and beliefs . British Journal of Occupational Psychology,
�. 281-291 .
Ganellan, R . J . , & Blaney, P . H. ( 1984) . Hardiness and social support as moderators of the
effects of life stress . Journal of Personality and Social Psychology, 47, 156-163 .
Gay, E . G. , Weiss, D . J . , Hendel, D . D . , Dawis R. V. , & Lofquist, L. H. (1971) . Manual
for the Minnesota Importance Questionnaire. Minnesota Studies in Vocational
Rehabilitation, 28 .
Gay, E . G. , Weiss, D. J . , Hendel, D . D . , Dawis, R. V. , & Lofquist, L. H. (1971) . Manual
for the Minnesota Satisfaction Scales. Minnesota Studies in Vocational Rehabilitation,
28 .
Gelatt, H. B . ( 1962) . Decision-making: A conceptual framework for counselling. Journal of
Counselling Psychology, 2, 240-245 .
Gellman, W. (1953) . Components of vocational adjustment. Personnel and Guidance Journal,
3 1 ' 536-539 .
George, D . A. (1988). An evaluation of self-assessment for personnel selection in New
Zealand. Unpublished doctoral thesis , Massey University, Palmerston North, New
Zealand.
Georgopoulos , B . S . , Mahoney, G. M. , & Jones, N. W. (1957) . A path-goal approach to
productivity. Journal of Applied Psychology, 41 , 345-353.
Ghiselli, E. E. (1966) . The validity of occupational aptitude tests . New York: Wiley.

455
Gibson, D. L . , Weiss, D. J . , Dawis , R. V. , & Lofquist, L. H. (1970) . Manual for the
Minnesota Satisfactoriness Scales. Minnesota Studies in Vocational Rehabilitation,
XVII.
Ginzberg, E . (1962) . Man and his work. California Management Review. _2, 21-28 .
Ginzberg, E . , Ginsburg, Axelrod, S . & Herma (1951) . An approach to a general theory. New
York: Columbia University Press.
Glass, D . C . , & Singer, J . E. (1972) . Urban stress . New York: Academic Press.
Glowinkowski, S . , & Nicholson, N. (1984) . The promotion pathology: A study of British
police inspectors . Medical Research Council/Economic and Social Research Council
Social and Applied Psychology Unit Memo 659: Sheffield.
Goodman, P. S . , & Friedman, A. (1971) . An examination of Adam's theory of inequity.
Administrative Science Quarterly, 16 , 271-288 .
Gore, S . ( 1981 ) . Stress-buffering functions of social supports : An appraisal and clarification
of research models . In Dohrenwend, B. P. (Ed.) , Stress life events and their contexts
(pp. 202-222) . New York: Prodist.
Gorsuch, R. L. (1983), (2nd ed. ) , Factor Analysis . New Jersey: Lawrence Erlbaum
Associates .
Gottfredson, G . D . , & Lipstein, D . (1975) . Using personal characteristics to predict parolee
and probationer employment stability. Journal of Applied Psychology, 60, 644-648 .
Gottfredson, L . S . (1981) . Circumscription and compromise . : A developmental theory of
occupational aspirations . Journal of Counselling Psychology Monograph, 28 , 545-
579.
Gottfredson, L. S . ( 1983) . Creating and criticizing theory. Journal of Vocational Behavior,
23 , 203-212.
456
Gottfredson, L. S . ( 1985). Role of self-concept in vocational theory. Journal of Counselling
Psychology, 32, 159-1 62.
Gottlieb, B . H. (1983). Support as a focus of integrative research in psychology. American
Psychologist, 38, 278-287.
Gould, S . ( 1979) . Age, job complexity, satisfaction, and performance . Journal of Vocational
Behavior, 14, 209-223 .
Gould, S . , & Hawkins , B . ( 1 978). Organisational career stage as a moderator of the
satisfaction-performance relationship. Academy of Management Journal, 2 1 , 434-450 .
Gowler, D . (1969) . Determinants of the supply of labor to the firm. Journal of Management
Studies , §., 73-95 .
Gowler, D . , & Legge, K. ( 1982) . The integration of disciplinary perspectives and levels of
analysis in problem-oriented organizational research. In Nicholson, N . & Wall, T . D . ,
The theory and practice of organizational psychology: A collection of original essays .
London: Academic Press Inc.
Graen, G. ( 1969) . Instrumentality theory of work motivation. Journal of Applied Psychology
Monograph, 53 vol 2, Part 2.
Grainger, J. ( 1985) . A theoretical and methodological analysis of social support, life events
and subjective well-being. Unpublished Master's thesis , Massey University,
Palmerston North, New Zealand.
Greenhaus, J. H . , Bedeian A . G . , & Mossholder, K. W. (1987) . Work experiences, j ob
performance , and feelings of personal and family well-being. Journal of Vocational
Behavior, 3 1 , 200-215 .
Greenhaus, J . H . , & Beutell , N. J . ( 1985) . Sources of conflict between work and family
roles . Academy of Management Review, 10, 76-88.
457
Greenhaus , J. H . , & Parasuraman, S. (1986) . Vocational and organizational behavior 1985 :
A review. Journal of Vocational Behavior, 29, 1 15-176.
Guilford, J . P . ( 1954) . Psychometric methods (2nd ed. ) . New York: McGraw-Hill .
Guilford, J . P . (1959) . Personalitv. New York: McGraw-Hill .
Guilford, J . P . ( 1965) . Fundamental statistics in psychology and education (4th ed. ) . New
York: McGraw-Hill Book Company
Guilliksen, H . ( 1958) . Comparatal dispersion, a measure of accuracy judgement.
Psychometrika, 23 , 137-1 50.
Guion, R. M. (1978) In Buros , 0. K. (Ed.) , The eighth mental measurements yearbook (Vol .
2 , pp . 1679-1680) . New Jersey: The Grypton Press.
Gupta, N . , & Beehr, T.A. (198 1) . Relationships among employees ' work and nonwork
responses . Journal of Occupational Behaviour, 2_, 203-209 .
Gurin, G . , Veroff, J . , & Feld, S . (1960) . Americans view their mental health. · New York:
Basic Books .
Gurney, R. M. ( 1980a) . Does unemployment affect the self-esteem of school leavers .
Australian Journal of Psychology, 1980a, 32 (3) , 175-1 82 .
Gurney, R . M . ( 1980b) . The effects of unemployment on the psychosocial development of
school-leavers . Journal of Occupational Psvchology, 53, 205-213 .
Hackett, G . , & Betz, N .E . (198 1) . A self-efficacy approach to career development of women.
Journal of Vocational Behavior, 18 , 326-339.
Hackett, G . , Betz, N . E . , & Doty, M. S . (1985) . The development of a taxonomy of career
competencies for professional women. Sex Roles, 12, 393-409.
458
Hackett, G. , Lent, R. W. , & Greenhaus. J . H. (1991) . Advances in Vocational theory and
research: A 20-year retrospective. Journal of Vocational Behavior, 38 , 3-38.
Hage, J . ( 1982). Theory-building. In N. Nicholson & T. D . Wall (Eds . ) , The theorv and
practice of organizational psychology: A collection of original essays . London:
Academic Press .
Haines, H . , & Macky, K. ( 1982) . Employed and unemployed school leavers in New Zealand
Community: A psychological study. In M. Abbott (Ed.), Mental Health Foundation
of New Zealand/New Zealand Psychological Society Symposium on Unemployment.
Auckland: Mental Health Foundation.
Hall, C. S . , & Lindzey, G. (1970) . Theories of personality. New York: Wiley.
Hall, C. S . , Lindzey, G . , Loehlin, J. C . , & Manosevitz, M. ( 1985) . Introduction to theories
of personality. New York: John Wiley & Sons .
Hall , D . T . , & Nougaim, K. E. (1968). An examination of Maslow's need hierarchy in an
organizational setting. Organizational Behavior and Human Performance, ,2, 12-35 .
Hansen, J . C . ( 1984) . User's guide for the SVIB-SCII Strong-Carnpbell Interest Inventory:
Form T325 of the Strong Vocational Interest Blank, Consulting Psychologists Press:
California.
Hansen, J. C . ( 1985) . The 1 985 revision of the Strong Vocational Interest Blank: Form T325,
Strong-Carnpbell Interest Inventory. California: Stanford University Press.
Harding, S .D . ( 1982) . Psychological well-being in Great Britain: an evaluation of the
Bradbum Affect Balance Scale. Personality and Individual Differences, ,2, 167-175 .
Harrower, G. F . , & Cox, K. J. ( 1 942) . The results obtained from a number of occupational
groupings on the professional level with the Rorschach group method. Bulletin of
Canadian Psychological Association, J, 31-33.
459
Hart, H. ( 1947) . Work as integration. Medical Records, 160, 735-739.
Hartley, J. F . (1980) . The impact of unemployment upon the self-esteem of managers .
Journal of Occupational Psychology, 53 , 147-155.
Havighurst, R. J . ( 1968) . Stages of vocational development. In D. G. Zytowski (Ed . ) ,
Vocational Behavior: Readings in theory and research. New York: Holt, Rinehart,
and Winston.
Hayduk, L. A. ( 1987) . Structural equation modelling with LISREL: Essentials and advances .
Baltimore and London: The John Hopkins University Press .
Henderson & Argyle, A . ( 1985) . Social support by four categories of work colleagues :
Relationships between activities, stress , and satisfaction. Journal of Occupational
Behaviour, §., 229-239.
Hendrick, I. ( 1943) . Work and the pleasure principle. Psychoanalytic Quarterly, 12, 3 1 1-329 .
Heneman, H. G. ( 197 4) . Comparison of self- and superior-ratings in managerial performance .
Journal of Applied Psychology, 59, 638-642.
Hepworth, S . J . ( 1980) . Moderating factors of the psychological impact of unemployment.
Journal of Occupational Psychology, 53, 139- 145 .
Heron, A . ( 1952a) . The establishment for research purposes of the two criteria of
occupational adjustment. Occupational Psychology, 26, 78-85.
Heron, A. (1952b) . A psychological study of occupational adjustment. Journal of Applied
Psvchology, 36, 385-387.
Heron, A. ( 1954) . Satisfaction and satisfactoriness : complementary aspects of occupational
adjustment . Occupational Psychology, 28, 140-153 .
460
Heron, A. (1955) . Personality and occupational adjustment: a cross-validation study.
Canadian Journal of Psychology, .2, 15-20.
Hershenson, D. B . , & Roth, R. M. ( 1966) . A decisional process model of vocational
development. Journal of Counselling Psychology, ll, 368-370 .
Hesketh, B. L. ( 1982). Psychological aspects of unemployment: Attributions about the causes
of success and failure in job seeking. Unpublished doctoral thesis , Massey University,
Palmerston North, New Zealand.
Hesketh, B . L. ( 1985) . Unpublished teaching notes , Massey University, Palmerston North,
New Zealand.
Herzberg, F. (1966) . Work and the nature of man. Cleveland: World Publishing.
Herzberg, F . , Mausner, B . , Peterson, R. 0 . , & Capwell, D . F. (1957) . Job attitudes : Review
of research and opinion. Pittsburgh: Psychological Service of Pittsburg.
Herzberg, F. , Mausner, B . , & Snyderman, B . B . ( 1959) . The motivation to work. New
York: Wiley.
Hoelter, J. W. ( 1983) . The analysis of covariance structures : Goodness-of-fit indices.
Sociological Methods and Research, 11, 325-344.
Holland, J. L . (1959) . A theory of vocational choice. Journal of Counselling Psychology, Q.,
35-45 .
Holland, J. L. (1960) . The prediction of college grades from personality and aptitude
variables . Journal of Educational Psychology, 5 1 , 245-254.
Holland, J. L . (1965) . Manual for the Vocational Preference Inventory, Palo Alto, California:
Consulting Psychologists Press.
Holland, J. L. (1971 ) . A theory-ridden, computerless, impersonal vocational guidance system.
Journal of Vocational Behavior, l, 167-176.

461
Holland, J . L. (1973) . Making vocational choices : A theory of careers . Englewood Cliffs ,
New Jersey: Prentice-Hall .
Holland, J . L. ( 1987) . Some speculation about the investigation of person-environment
transactions . Journal of Vocational Behavior, 3 1 , 337-340.
Holland, J . L . , & Astin, A. W. (1962) . The prediction of the academic, artistic, scientific,
and social achievement of undergraduates of superior scholastic aptitude . Journal of
Educational Psychology, 53 , 132-143 .
Holmes, T . H . , & Rahe, R. H . (1967) . Social readjustment scale. Journal of Psychosomatic
Research, 11, 2 13-218 .
Hoppock, R. ( 1935) . Job satisfaction. New York: Harper & Row, 1935 .
Hoppock, R. ( 1957) . Occupational Information. New York: McGraw-Hill .
Hoppock, R. (1963) . Occupational Information (2nd ed. ) . New York: McGraw-Hill .
Homey, K . ( 1947) . Inhibitions in work. American Journal of Psychoanalysis, ] , 18-25 .
Homey, K. (1950) . Neurosis and human growth. New York: Norton.
House, J . S . ( 198 1) . Work stress and social support. Reading, Mass . : Addison-Wesley.
House, J. S . , & Kahn, R. L. (1985) . Measures and concepts of social support. In Cohen, S . ,
& Syme, L . (Eds . ) , Social support and health. New York: Academic Press.
Hughes, E . C . (1958). Men and their work. Glencoe. Ill . : Free Press.
Hunt, E. P . , & Smith, P . (1945) . Vocational psychology and choice of employment.
Occupational Psychology, 19, 109-1 16 .

462
Hurrell, J. J. Jr. , Murphy, L. R. , Sauter, S . L. , & Cooper, C. L. (Eds .) . ( 1988),
Occupational stress : Issues and developments in research. London: Taylor &
Francis .
Iaffaldano, M. T . , & Muchinsky, P. M. (1985). Job satisfaction and job performance: A
meta-analysis. Psychological Bulletin, 97 (2), 251 -273 .
Icheiser, G . (1940) . On certain conflicts in occupational life. Occupational Psychology, 14,
107-1 1 1 .
ligen, D . R. , Nebeker, D . M. , & Pritchard, R. D . (198 1 ) . Expectancy theory measures: An empirical comparison in an experimental simulation. Organizational Behavior and
Human Performance, 12, 335-350.
Inkson, J . H. K . , & Gidlow, R. (1981) . Waterfront workers as traditional proletarians : A
New Zealand study. Australian and New Zealand Journal of Sociology, 17, 10-20.
Jackson, S . E . , Zedeck, S . , & Summers, E. ( 1985) . Family life disruptions : Effects of job
induced structural and emotional interference. AcadP'lW of Management Journal, 28,
574-586.
Jahoba, M. ( 1979) . The impact of unemployment in the 1930's and the 1970's . Bulletin of
the British Psychological Society, 32, 309-3 14.
James, W. ( 1890). The principles of psychology. New York: Holt.
Jaques , E . , & Crook, I. (1946) . The personality makeup of emotionally unstable soldiers in
relation to occupational adjustments . Journal of Clinical Psychology, 2_, 221 -230.
Jerison, H. J . (1957). Performance on a simple vigilance task in noise and quiet. Journal of
the Accoustical Society of America, 29, 1 163-1 1 65 .
Johnson, G . H. ( 1955) . :�n instrument for the measurement of job satisfaction. Personnel
Psychology, �. 27-37 .

463
Johnson, R. W. (1977) . Relationships between female and male scales for the same
occupations . Journal of Vocational Behavior, 11 (2), 239-252.
J6reskog, K. G. (1973) . A general model for estimating a linear structural equation system.
In A. S . Goldberger, & 0. D . Duncan (Eds.) , Structural equation models in the
social sciences (pp. 85-1 12) . New York: Seminar.
Joreskog, K. G. , & Sorbum, D . ( 1984) . LISREL VI: Analysis of linear structural
relationships by the method of Maximum Likelihood. Mooresville, Indiana: Scientific
Software Inc.
Kabanoff, B . ( 1980) . Work and nonwork: A review of models methods and findings .
Psychological Bulletin, 88, 60-77.
Kammann, R. ( 1983) . Objective circumstances, life satisfactions, and sense of well-being:
Consistencies across time and place. New Zealand Journal of Psychology, 12, 1 4-22 .
Kammann, R. , Parry, M . , & Herbison, P. ( 1982) . The analysis and the measurement of the
sense of well-being. Manuscript submitted for publication.
Kammann, R. , & Flett, R. (1983) . Affectometer 2:A scale to measure current level of general
happiness . Australian Journal of Psychologv, 35, 259-265 .
Kammann, R. , Christie, D . , Irwin, R. , & Dixon, G. (1979) . Properties of an inventory to
measure happiness (and psychological health) . New Zealand Psychologist, �. 1-9.
Kanter, R. M. (1977) . Work and family in the United States . New York: Russell Sage
Foundation.
Karasek, R. A. , Jr. ( 1979). Job demands , job decision latitude, and mental strain:
Implications of job redesign. Administrative Science Quarterlv, 24, 285-308.
Karasek, R. A. (1982) . Stress at work and cardiovascular disease. Mimeograph. New York:
Columbia University, Department of Industrial Engineering and Operations Research.
464
Katzell, R. A. ( 1964) . Personal values , job satisfaction, and job behavior. In Borrow (Ed.) ,
Man in a world at work. Boston: Houghton Mifflin.
Katzell, R . , Barret, R. , & Parker, T. (1961) . Job satisfaction, job performance and s ituational
characteristics . Journal of Applied Psychology, 45, 65-72.
Keeling, B . , & Tuck, B . F. ( 1982). The Self-directed Search New Zealand Revision: A guide
to educational and vocational planning by John L. Holland. N.Z: N.Z. Council for
Educational Research.
Kelly, G . A. (1955). The psychology of personal constructs . Vols . 1 & 2. New York:
Norton.
Kerr, W. A. (1948) . On validity and reliability of the j ob satisfaction tear ballot. Journal of
Applied Psychology, 32, 275-281 .
Kessler, R. C . , Price, R. H . , & Wortman, B . B . (1985) . Social factors in psychopathology:
Stress, social support and coping processes . Annual Review of Psychology, 36, 531-
572.
Kirchner, ( 1965) . Relationship between supervisory and subordinate ratings for technical
personnel . Journal of Industrial Psychology, l, 57-60.
Klein, H . A. , Tatone, C . L . , & Lindsay, N. B . (1989) . Correlates of life satisfaction among
military wives . The Journal of Psychology, 123 (5) , 465-475 .
Kobassa, S . C . , & Pucetti, M. C . (1983) . Personality and social resources in stress
resistance. Journal of Personality and Social Psychology, 45, 839-850.
Komaki, J. L . , Collins , R. L . , & Penn, P. ( 1982) . The role of performance antecedents and
consequences in work motivation. Journal of Applied Psychology, 67, 334-340.
Korman, A. K. (1968a) . Task success , task popularity, and self-esteem as influences on task
liking. Journal of Applied Psychology, 52, 484-490.
465
Korman, A. K. ( 1968b). Self-esteem, social influence and task performance: some tests of
a theory, Proceedings of the 76th annual convention of the American Psychological
Association, J, 567-568.
Korman, A. K. (1970). Toward a theory of work behavior. Journal of Applied Psychology.
54, 32-4 1 .
Korman, A . K . (1971a) . Expectancies as determinants of performance. Journal of Applied
Psychology, 55, 2 18-222.
Korman, A. K. (197 1b). Organizational achievement, aggression, and creativity: Some
suggestions toward an integrated theory. Organizational Behavior and Human
Performance, .Q, 593-613 .
Korman, A . K . ( 1971c) . Industrial and organizational psychology. Englewood Cliffs , New
Jersey: Prentice-Hall .
Korman, A. K. (1976) . Hypotheses of work behavior revisited and an extension, Academy
of Management Review, 1. 56-63 .
Korman, A. K. (1980) . Career success and work performance. Paper presented at meetings
of the American Psychological Association, Montreal , Canada.
Kremer, Y . , & Hapaz, I . ( 1982). Leisure patterns among retired workers : Spillover or
compensatory trends . Journal of Vocational Behavior, 2 1 , 183-195.
Kuhn, T. S. (1962) . The structure of scientific revolutions . Chicago: University of Chicago
Press.
Kulik, C . T. , Oldham, G. R. , & Hackman, R. R. ( 1987) . Work design as an approach to
person-environment fit. Journal of Vocational Behaviour, Jl, 278-296.
466
Lackey, A. ( 1975) . An annotated bibliography for Holland's theory, the Self-Directed
Search, and the Vocational Preference Inventory ( 1972-1975) . JSAS Catalog of
Selected Documents in Psychology, �. 352 (MS no. 1 149) .
Landy, F. J . ( 1985) . Psychology of work behavior (3rd ed.) . Homeward, Illinois : The Dorsey
Press .
Landy, F. J . ( 1989). Psychology of work behaviour (4th ed.) . California: Brooks/Cole
Publishing Company.
Landy, F. J . , & Trumbo, D . A. ( 1980) . The psychology of work behaviour. (revised
edition) . Homewood, Illinois : The Dorsey Press .
Lantos, B. ( 1952) . Metapsychological considerations o n the concept of work. International
Journal of Psycho-analysis , 33 . 439-443 .
LaRocco, J. M . , House, J. S . , & French, J . R. P. ( 1980) . Social support, occupational stress ,
and health. Journal of Health and Social Behaviour, 2 1 , 202-218 .
LaRocco, J . M. , & Jones, A. P. (1978) . Coworker and leader support as moderators of
stress-strain relationships in work situations . Journal of Applied Psychology, 63 , 629-
634.
Lassen, C . (1978) . Adjustment in retirement, Unpublished master's thesis, Massey
University, New Zealand.
Latack, J. C . ( 1984) . Career transitions within organisations : An exploratory study of work,
nonwork and coping strategies . Organizational Behavior and Human Performance,
34, (3) , 296-322.
Lawler, E. E. ( 1967) . Multitrait-multirater approach to measuring managerial performance.
Journal of Applied Psychology, 5 1 , 369-381 .
Lawler, E. E. ( 1971) . Pay and organizational effectiveness . New York: McGraw-Hill.

467
Lawler, E. E. (1973). Motivation in work organisations . Monterey, Calif. : Brooks/Cole
Publishing.
Lawler, E. E. , & Suttle, J. L. ( 1972). A causal correlational test of the need hierarchy
concept. Organizational Behavior and Human Performance,, 1, 265-287.
Lawrence, P. R. , & Lorsch, J. ( 1967). Organization and environment. Cambridge, Mass :
Harvard University Press .
Lazarus, R . S . ( 1966) . Psychological stress and the coping process. New York: McGraw-Hill.
Leavy, R. L. ( 1983). Social support and psychological disorder: A review. Journal of
Community Psychology, 11, 3-21 .
Legge, K. (1970) . The operation of the "regressive spiral" in the labor market. Journal of
Management Studies , 1, 1-22.
Lent. R. W. , Brown, S. D . , & Larkin, K. C. (1986) . Self-efficacy in the prediction of
academic performance and perceived career options . Journal of Counseling
Psychology, 33 , 265-269.
Lent, R. W. , & Hackett, G. ( 1987) . Monograph. Career self-efficacy: Empirical status and
future directions . Journal of Vocational Behaviour, 30, 347-382.
Lean, F. R. (1981) . The role of positive and negative outcomes in the causation of
motivational forces . Journal of Applied Psychology, 66, 45-53 .
Levenson, H . , (1972) . Distinctions within the concept of internal-external control :
development of a new scale. Proceedings of the 80th Annual Convention of the
American Psychological Association, 1, 259-268.
Levine, E. L. , Flory, A. , & Ash, A. A. ( 1977) . Self-assessment in personnel selection.
Journal of Applied Psychology, 62, 428-435 .

468
Levinson, D. J . , Darrow, C. N . , Klein, E. B . , Levinson, M. H. , & McKee, B. ( 1978) .
Seasons of a man's life. New York: Knopf.
Lewin, K. ( 1948) . Resolving social conflicts . New York: Harper.
Litwin, G. H . , & Stringer, R. ( 1966) . The influence of organisational climate on human
motivation. Paper presented at a conference on organizational climate, Foundation for
Research on Human Behavior. Ann Arbor, Michigan: March.
Locke, E. A. (1969) . What is job satisfaction? Organizational Behavior and Human
Performance, 1 (4) , 309-336.
Locke, E. A. (1970) . Job satisfaction and job performance: A theoretical analysis .
Organizational Behavior and Human Performance, �' 484-500.
Locke, E. A. (1976) . The nature and causes of job satisfaction. In M.D. Dunnette (Ed.) ,
Handbook of industrial and organizational psychology. Rand McNally: Chicago.
Locke, E. A. ( 1980) . Latham versus Komaki: A tale of two paradigms . Journal of Applied
Psychology, 65 , 16-23 .
Locke, E. A. , Frederick, E . , Bobko, P . , & Lee, C . ( 1984) . Effect of self-efficacy, goals and
task strategies on task performance. Journal of Applied Psychology, 69, 241-251 .
Locke, E. A . , Mento, A . J . , & Katcher, B . L . ( 1978) . The interactions of ability and
motivation in performance . An exploration of the meaning of moderators . Personnel
Psychology, 3 1 , 269-280.
Locke, E . A . , Shaw, K. N. , Saari, L. M . , & Latham, G. P. (1981 ) . Goal setting and task
performance: 1969-1 980. Psychological Bulletin, 90, 125-152.
Lofquist, L . H. , & Dawis, R. V. ( 1969) . Adjustment to work: A psychological view of man's
problems in a work-oriented society. Appleton-Century-Crofts : New York.

469
Loehlin, J. C . , & Nichols , R. C. (1976) . Heredity, environment. and personality: A study
of 850 sets of twins . Austin: University of Texas press.
London, M. , Crandall, R. , & Seals , G. W. (1977) . The contribution of job and leisure
satisfaction to quality of life. Journal of Applied Psychology, 62, 328-334.
Long, N. R. , Shouksmith, G. A. , Roache, S . , & Voges , K. E. (1986) . Perception of stress
in prison personnel : An occupational study. Criminology, 24, 331-345 .
Long, J . S . ( 1983a) . Confirmatory factor analysis : A preface to LISREL. Sage University
papers series : Quantitative applications in the social sciences . Sage Publications :
Beverly Hills .
Long, J. S . ( 1983b) . Covariance structure models : An introduction to LISREL. Sage
University papers series : Quantitative applications in the social sciences . Sage
Publications: Beverly Hills .
Lundberg, G. A. , Schrag, C . C. , Larsen, 0. N. , & Catton, W. R. Jr. (1968). Sociology.
Fourth Edition. New York: Harper & Row.
Lunneberg, C . E. ( 1982) . Systematic biases in brief self-ratings of vocational qualifications .
Journal of Vocational Behavior, 20, 255-275 .
Lurie, W.A. ( 1942) . The concept of occupational adjustment. Educational and Psycholo�Zical
Measurement, £, 3-14.
Lurie, W.A. , & Weiss, A. (1942). Analyzing vocational adjustment. Occupation, 2 1 , 138-
142 .
Lurie, W.A. , & Weiss, A. ( 1954) . Analyzing vocational needs . Jewish Social Service
Quarterlv, 30, 363-372.
Mabe, P. A. , & West, S . G. (1982). Validity of self-evaluation of ability: A review and
meta-analysis . Journal of Applied Psvcholo�Zy, 67, 280-296 .
470
Macdonald, M . , Pearce, N. , Salter, D . , & Smith, A. H . ( 1982) . Health consequences of
unemployment -will effects of recent rises in New Zealand unemployment become
apparent in national health statistics? In M. Abbot (Ed.), Mental Health Foundation
of New Zealand/New Zealand Psychological Society Symposium on Unemployment.
Auckland: Mental Health Foundation.
Mackay, C. J . , & Cooper, G. L. ( 1987) . Occupational stress and health: Some current issues .
In C. L. Cooper & I . T . Robertson (Eds. ) , International Review of Industrial and
Organizational Psychology. Chichester: John Wiley & Sons .
MacN ab, D . , & Fitzsimmons, G. W. ( 1 987) . A Multitrait -multimethod study of work related
needs, values, and preferences . Journal of Vocational Behaviour, 30, 1 -15 .
Magnusson, D. , & Endler, N S . (Eds . ) . ( 1977). Personality at the crossroads . Hillsdale, N.J :
Erlbaum.
Maher, B . A. (Ed.) . ( 1969). Clinical psychology and personality: The selected papers of
George Kelly . New York: Wiley.
Mahoney, M. J. ( 1974) . Cognition and behavior modification. Cambridge, Mass . : Ballinger,
Mansfield, R. , & Evans G. E. ( 1975) . Work and non-work in two occupational groups.
Industrial Relations Journal, §, 48-54.
Marks , S . R. ( 1977) . Multiple roles and role strain: Some notes on human energy, time, and
commitment. American Sociological Review, 42, 921-936.
Marsh, H . W . , & Richards, G. E. (1990) . Self-other agreement and self-other differences on
multidimensional self-concept ratings. Australian Journal of Psychology, 42, 3 1-45 .
Marziller, J . , & Eastman, C . (1984) . Continuing problems with self-efficacy theory: A reply
to Bandura. Cognitive Therapy and Research,_(3) , 257-262.
Maslow, A. H. (1943) . A theory of motivation. Psychological Review, 50, 370-396.
471
Maslow, A. H. (1954), Motivation and personality. New York: Harper & Row.
Matsui, T . , Okada, A. , & Inoshita, 0. (1983) . Mechanism of feedback affecting task
performance, Organizational Behavior and Human Performance, 3 1 , 1 14-122.
Matsui, T . , Okada, A. , & Mizuguchi, R. (1981) . Expectancy theory prediction of the goal
theory postulate "the harder the goals , the higher the performance" . Journal of
Applied Psychology, 66, 54-58 .
McCormick, E. J . ( 1957). Human engineering. New York: McGraw-Hill.
McDaniels , C. (1977) . Leisure and career development in mid-life: A rationale. Vocational
Guidance Quarterly, 25 , 344-350.
McFarland, K. (1984) . A three-mode factor analytic study of psychological well-being.
Manuscript submitted for publication. Massey University .
McGrath, J. E. (1970) . A conceptual formulation for research on stress. In J . E. McGrath
(Ed.) , Social psychological factors in stress . New York: Holt, Rhinehart & Winston.
McGregor, D . (1960) . The human side of enterprise. New York: McGraw-Hill .
McGregor, D . ( 1967) . The professional manager. New York: McGraw-Hill.
McKennell, A.C. , & Andrews , F.M. (1983) . Components of perceived life quality . Journal
of Communitv Psychologv, ll, 98- 1 10 .
McLelland, D . C . (1955). Some social consequences of achievement motivation. In M . R .
Jones (Ed.), Nebraska symposium on motivation. Lincoln: University of Nebraska
Press .
Meissner, M. (1971) . The long arm of the job: A study of work and leisure. Industrial
Relations , 10, 2390-260.

472
Melamed, S . , & Eichanan, I . M. (1981) . The relationship between interests-job congruity and
the selection of vocational activity. Behaviour, 1 8 , 3 1 0-325 .
Mellers , B . A. (1982) . Equity judgement: A revision of Aristotleian views. Journal of
Experimental Psychology: General , 1 1 1 , 242-270 .
Meltzer, H. (1945) . Frustration, expectation and production in industry, American Journal
of Orthopsychiatry, 15 , 329-342.
Menlo , A. J . , Cartledge, N. D . , & Locke, E. A. ( 1980). Maryland vs . Michigan vs .
Minnesota: Another look at the relationship of expectancy and goal difficulty
to task performance. Organizational Behavior and Human Performance, 25 ,
419-440.
Menninger, K.A. (1942) . Work as a sublimation. Bulletin of Menninger Clinic, .Q, 170-182 .
Miles, R . H. , & Perreault, W. D . ( 1976) . Organizational role conflict: Its antecendents and
consequences . Organizational Behavior and Human Performance, 17, 1 9-44.
Miller, D . C . , & Form W. H. (195 1). Industrial Sociology. New York: Harper & Row.
Miller, D . C . , & Form, W. H. ( 1964) . Industrial Sociology (2nd ed.) . New York: Harper
& Row.
Miller, N. E . , & Dollard, J. ( 1941) . Social learning and imitation. New Haven, Connecticut:
Yale University Press .
Mischel, W. (1968). Personality and assessment, New York: John Wiley & Sons .
Mischel , W. (1973) . Toward a cognitive social learning reconceptualization of personality .
Psychological Review, 80, 252-283 .
Mischel , W. (1976) . Introduction to personality (2nd ed.) . New York: Halt, Rinehart &
Wins ton.
473
Mischel, W. ( 1977). On the future of personality measurement. American Psychologist, 32 ,
246-254.
Mitchell , T. R. (1974) . Expectancy model of job satisfaction, occupational preference, and
effort: A theoretical, methodological , and empirical approach. Psychological Bulletin,
8 1 , 1053-1077.
Mitchell, T. R. , & Beach, L. R. ( 1976). A review of occupational preference and choice
research using expectancy theory and decision theory. Journal of Occupational
Psychology, 49, 231-248.
Mobley, W. H. ( 1982). Employee turnover: Causes. consequences and control . Reading,
Massachusetts : Addison-Wesley.
Mobley, W. H. , Homer, S . 0 . , & Hollingsworth, A. T. ( 1978) . An evaluation of precursors
of hospital employee turnover. Journal of Applied Psychology, 63, 408-414.
Montague-Brown, M. J . ( 1976) . Occupational prestige: A scale of occupational prestige in
New Zealand. Unpublished master's thesis, University of Canterbury, New Zealand.
Moore, W. E . ( 1955). Economy and Society. New York: Random House, 1955 .
Moos, R. H. ( 1987) . Person-environment congruence in work, school, and health care
settings . Journal of Vocational Behavior, 3 1 , 23 1-247 .
Morrow, P. ( 1983) . Concept redundancy in organizational research: The case of work
commitment . Academy of Management Review, �. 486-500.
Morrow, P. C . , & McElroy, J. C . ( 1987). Work commitment and job satisfaction over
three career stages . Journal of Vocational Behavior, 30, 330-346 .
Morse, N. C . (1953). Satisfactions in the white-collar job. Ann Arbor: University of
Michigan.
474
Morse, N . C . , & Weiss, R. S . ( 1968). The function and meaning of work and the job . In D.
C . Zywtoski (Ed.) , Vocational Psychology, New York: Halt, Rinehart and Winston.
Mount, M. K. , & Muchinsky, P . M. (1978) . Person-environment congruence and employee
job satisfaction: A test of Holland's theory. Journal of Vocational Behavior, 1 3 , 84-
100.
Muchinsky, P. M. (1976) . An assessment of the Litwin and Stringer organization climate
questionnaire: An empirical and theoretical extension of the Sims and LaFollette
study. Personnel Psychology, 29, 371-392 .
Muchinsky, P . M . , & Monahan, C . J . ( 1987). What i s person-environment congruence?
Supplementary versus complementary models of fit. Journal of Vocational Behaviour,
3 1 ' 268-277.
Muchinsky, P. M . , & Morrow, P. C. ( 1980) . A multidisciplinary model of voluntary
employee turnover. Journal of Vocational Behavior, 17, 263-290.
Muchinsky, P. M . , & Tuttle, M. L. (1979) . Employee turnover: An empirical and
methodological assessment. Journal of Vocational Behavior, 14, 43-47.
Murray, H . A . (1938). Explorations in personality. New York: Oxford University Press .
Naylor, J . C . , Pritchard, R. D . , & ligen, D . R. (1980) . A theory of behavior in
organizations . New York: Academic Press .
Near, J . P . , Rice, R. W. , & Hunt, R. G. ( 1978) . Work and extra-work correlates of life and
job satisfaction. Academy of Management Journal , 21 , 248-264.
Neff, W . S . ( 1965) . Psychoanalytic concepts of the meaning of work. Psychiatry, 28, 323-
333 .
Neff, W . S . ( 1985) . Work and human behavior (3rd ed.). New York: Aldine Publishing
Company.

475
Nevill, D. D . , & Super, D. E. (1986) . Manual for the salience inventorv: Theory, application
and research. Palo Alto, CA: Consulting Psychologists Press .
Nevill, D . D . , & Super, D. E . (1988) . Career maturity and commitment to work in university
students . Journal of Vocational Behavior, 32, 139- 15 1 .
Newman, 0 . , (1976), Leisure and life style. The Ontario Psychologist, �' 28-34.
Newman, 0. (1983) . The coming of a leisure society? Leisure Studies, 2, 97- 109.
Nichols , R. C . , & Holland, J. L. (1963) . Prediction of the first year college performance of
high aptitude students . Psychological Monographs, 77, (7) , Whole No. 570.
Nicholson, N. (1984) . A theory of work role transitions . Administrative Science Quarterly,
29, 172-191 .
Nicholson, N . , Brown, C . A. , & Chadwick-Jones . J . K. (1976) . Absence from work and job
satisfaction. Journal of Applied Psychologv, 6 1 , 728-737 .
Nicholson, N. , & Wall T. D . (Eds. ) . (1982) . The theory and practice of organizational
psychology: A collection of original essavs .London: Academic Press .
Nieva, V . F . (1979) . The family's impact on job-related attitudes of men and women: Report
of work in progress . Presented at the American Psychological Association Annual
Meeting, New York, August.
Nieva, V. F. ( 1984). Work and family roles . In M. D. Lee and R. N. Kanungo (Eds . ),
Management of work and personal life : Problems and opportunities . New York:
Praeger.
Nieva, V. F. (1985) . Work and family linkages . In L. Larwood, A. H. Stromberg, and B .
A . Gutek (Eds.) , Women and work: An annual review. Beverly Hills , Cal . : Sage
Publications .

476
Norusis , M. J ./SPSS Inc. Illinois (1990) . SPSS/PC + 4.0 Base Manual for the IBM
PC/XT I AT. SPSS statistical data analysis . Chicago: SPSS Inc.
Oates , W. E . ( 1971) . Confessions of a workaholic. Cleveland: World.
Oberndorf, C. P . (195 1) . Psychopathology at work. Bulletin of the Menninger Clinic, 15 . 77-
84.
O'Brien, G. E . ( 1986) . Psychology of work and unemployment. Chichester: John Wiley &
Sons .
O'Brien, G. E. , Dowling, P . , & Kabanoff, B . ( 1978) . Work. health and leisure. Working
paper No. 28. National Institute of Labour Studies : Adelaide.
O'Brien, G. E. , & Kabanoff, B . (1979), Comparison of unemployed and employed workers
on work values , locus of control and health variables . Australian Psychologist, 14,
(2), 143-154 .
O'Brien, G. E. , & Kabanoff, B . ( 1981) . Australian norms and factor analysis of Ratter' s
internal-external scale. Australian Psychologist , 16, 184-202 .
O,Brien, G. E. , & Pere, T. ( 1985) . The effects of ability, self-esteem and task difficulty on
performance and task satisfaction. Australian Journal of Psychology, 37, 309-323 .
Oliver, N. (1990) . Rewards, investments , alternatives and organizational commitment:
Empirical evidence and theoretical development. Journal of Occupational Psychology,
63 (1) , 1 9-3 1 .
Orpen, C . (1978) . Work and nonwork satisfaction: A causal-correlational analysis . Journal
of Applied Psychology, 63 , 530-532.
Osipow, S. H. (1975) . Editorial . Journal of Vocational Behavior, l, 1 6 1 .
477
Osipow, S . H. ( 1987) . Applying person-environment theory to vocational behavior. Journal
of Vocational Behavior, lL 333-336.
O'Reilly, C . A. ( 1977) . Personality-job fit: Implications for individual attitudes and
performance. Organizational Behavior and Human Performance, li, 36-46 .
Osgood, C . E . , Suci, G. J . , & Tanenbaum, P. H. (1957) . The measurement of meaning.
Urbana: University of Illinois Press .
Osipow, S . H. (1969) . Some revised questions for vocational psychology. The Counselling
Psychologist, 1, 17-19 .
Osipow, S . H. (1973) . Theories of career development (2nd ed.) . Englewood Cliffs , New
Jersey: Prentice-Hall.
Osipow, S . H. (1983) . Theories of career development (3rd ed.) . Englewood Cliffs , NJ:
Prentice-Hall.
Ouchi, W. (1981) . Theory Z: How American business can meet the Japanese challenge.
Reading, Mass . : Addison-Wesley Publishing.
Palmer, G. L. (1954) . Labor mobility in six cities . New York: Social Science Research
Council.
Parke, J . W. , Taylor, E. K. , Barrett, R. S . , & Martens, ( 1959) . Rating scale content: Ill. Relationship between supervisory and self-ratings . Personnel Psychology, 12, 49-63 .
Parker, S . (1971) . The future of work and leisure. London: MacGibbon & Kee.
Parker, S . (1983) . Leisure and Work, London: George Alien and Unwin.
Parker, S . R. , & Smith, M. A. (1976). Work and Leisure. In R. Dubin (Ed.) , Handbook of
work organization and society. Chicago: Rand McNally.
478
Parnes, H. S. ( 1954) . Research on labor mobility. New York: Social Science Research
Council .
Parsons , F. (1902) . Choosing a vocation. Boston: Houghton Mifflin.
Patchen, M. ( 1961) . The choice of wage comparisons . New Jersey: Englewood Cliffs .
Paterson, D . G. , & Daley, J . C . (1936). Men, women, and jobs . Minneapolis : University of
Minnesota Press , 1 936.
Paterson, D . G. , Gerken, C . d'A. , & Hahn, M. E. (1953) . Revised Minnesota Occupational
Rating Scales . (1941 Scale Revised) Minneapolis : University of Minnesota
Press .
Payne, R. L . (1979) . Demands, supports . constraints, and psychological health. Memo No.
302 . Sheffield, England: Department of Psychology, University of Sheffield.
Payne, R. , & Pugh, D . S (1976) . Organizational structure and climate. In M. D . Dunnette
(Ed.) , Handbook of Industrial and Organizational Psychology. Chicago: Rand
McNally.
Payton-Miyazaki, M. , & Brayfield, A. H . (1976) . The good job and the good life:
Relationship of characteristics of employment to general well-being. In A. D .
Biderman and T . F . Drury (Eds .) , Measuring work quality for social reporting (pp.
105-150) . New York: Sage Publications .
Pearson, J. E . ( 1983) . The definition and measurement of social support. Journal of
Counseling and Development, 64, 390-395 .
Pearson, J. E. ( 1987) . The Interpersonal Network Questionnaire: A tool for social network
assessment . Measurement and Evaluation in Counseling and Development, 20, 99-
105.
479
Perrewe, P. L. ( 1987). The moderating effects of activity level and locus of control in the
personal control-job stress relationship. International Journal of Psychology, 22, 179-
193 .
Pervin, L . A . (1968) . Performance and satisfaction as a function of environmental fit.
Psychological Bulletin, 69, 56-68.
Peters , L . H . , Terborg, J . R., & Taynor, J. ( 1974) . Women as Managers Scale (W AMS):
A measure of attitudes towards women in management positions . JSAS Catalog of
Selected Documents in Psychology, (MS No. 585) .
Pettigrew, T. F. ( 1967). Social evaluation theory: Convergence and applications . In D .
Levine (Ed.) . Nebraska Symposium on motivation, (pp. 241-3 1 1) . Lincoln:
University of Nebraska Press .
Phillips , B . S . (1971) . Social research: Strategy and tactics (2nd ed.) . New York:
Macmillan.
Phillips, S . D . , Cairo, P. C . , Blustein, D . L. , & Myers, R. A. (1988) . Career development
and vocational behavior, 1987: A review. Journal of Vocational Behavior, 3 3 , 1 19-
184.
Popper, K. R. (1959) . The logic of scientific discoverv. London: Hutchinson.
Popper, K. R. (1961) . The poverty of historicism. Reprint of the second edition (with some
corrections). Londen: Routledge and Kegan Paul .
Porter, L. W. , & Lawler, E. E. (1968) . Managerial attitudes and performance . Homeward,
Illinois : Dorsey.
Porter, L. W. , & Steers , R. M. (1973) . Organizational , work, and personal factors in
employee turn-over and absenteeism. Psvchological Bulletin, 80, 151-176 .
480
Post-Kammer, P . , & Smith, P. L. ( 1985). Sex differences in career self-efficacy,
consideration, and interests of eighth and ninth graders . Journal of Counseling
Psychology, 32, 551-559.
Poulton, E. C . ( 1970) . Environment and human efficiency. Springfield, Illinois : Charles C
Thomas .
Pritchard, R. D . , Hollenback, J . , & DeLeo, P.J. ( 1980) . The effects of continuous and partial
schedules of reinforcement on effort, performance, and satisfaction. Organizational
Behavior and Human Performance, 25, 336-353 .
Pruette, L. , & Fryer, D. ( 1923) . Affective factors in vocational maladjustment. Mental
Hygiene, l, 102-1 18 .
Pryor, R . G. L . ( 1979) In search of a concept: Work values . The Vocational Guidance
Quarterly, 27, 250-258 .
Pryor, R. G. L . ( 1985). Toward exorcising the self-concept from psychology: Some
comments on Gottfredson's circumscription/compromise theory. Journal of
Counselling Psychology, 32, 154-158.
Quinn, R.P . , Seashore, S .E . , Mangione, T.W. , Campbell , D .B . , Staines, G.L. , &
McCullough, M.R. (1971). Survey of working conditions : final report on univariate
and bivariate tables . U.S . Govt. Printing Office: Washington D .C .
Rabinowitz, S . , & Hall, D . T. ( 1977). Organizational research on job involvement.
Psychological Bulletin, 84, 265-288 .
Rahman, M. ( 1989) . Job stress , satisfaction and mental health of factory workers in
Bangladesh. Work Stress, l, 1 55-1 62.
Reynolds, G. S . ( 1968) . A primer of operant conditioning, Glenview, Illinois: Scott,
Foresman and Company.

481
Rice, A. K. (1958) . Productivity and social organisation: The Ahmedabad experiment.
London: Tavistock Publications .
Rice, R. W. , Near, J . P . , & Hunt, R. G. (1979). Unique variance in job and life satisfaction
associated with work-related and extra-workplace variables . Human Relations, 32,
605-623 .
Rice, R. W. , Bender, L. R. , & Villers , A. G. (1980) . Leader sex, follower attitudes toward
women, and leadership effectiveness : A laboratory experiment. Organizational
Behavior and Human Performance, 25, 46-78.
Riesman, D. (1950) . The lonely crowd: A study of the changing American character. New
Haven Conn. : Yale University press.
Riley, M. W. (1964) . Sources and types of sociological data. In R. L. Faris (Ed.) , Handbook
of modern sociology. Chicago: Rand McNally.
Roberts, K. H. , Hulin, C. L. & Rousseau, D. M. (1978) . Developing an interdisciplinary
science of organizations . San Francisco : Jossey-Bass.
Robbins, B. S. (1939) . Neurotic Disturbances in work. Psychiatry, _f, 333-342.
Robbins, S. B. (1985) . Validity estimates of the Career Decision-Making Self-Efficacy Scale.
Measurement and Evaluation in Counseling and Development, 18 , 64-71 .
Robertson, L . (1990) . Prediction of job satisfaction from characteristics of person work goals .
Journal of Organizational Behavior, ll, 29-41 .
Roe, A. (1946) . A Rorschach study of a group of scientists and technicians . Journal of
Consulting Psychology, 10, 3 17-327.
Roe, A. (1950) . Analysis of group Rorschach's of psychologists and anthropologists . Journal
of Projective Techniques, 14, 385-398.
482
Roe, A. ( 1956). The psychology of occupations . Wiley: New York.
Roe, A. , & Siegelman, M. ( 1964) . The origin of interests . Washington D .C . : American
Personnel and Guidance Association.
Rogers, C . R. ( 1959) . A theory of therapy , personality and interpersonal relationships , as
developed in the client-centered framework. In S . Koch (Ed.), Psychology: A study
of science, Vol 3 . New York: McGraw-Hill.
Rokeach, M. ( 1973) . The nature of human values . New York: Free Press .
Rook, K. (1990) . Saying goodbye to simple models of social support. Contemporary
Psychology: A Journal of Reviews, 35 , 430-43 1 .
Rotter, J . B . (1966) . Generalized expectancies for internal versus external control of
reinforcement. Psychological Monographs , 80, 1 , Whole number 609.
Rounds, J . B . , Jr. , Dawis, R. V. , & Lofquist. , L H . (1979) . Life history correlates of
vocational needs for a female adult sample. Journal of Counseling Psychology, 26,
487-496.
Rounds , J . B . , Dawis, R. V. , & Lofquist, L . H. ( 1987) . Measurement of person-environment
fit and prediction of satisfaction in the theory of work adjustment. Journal of
Vocational Behavior, 3 1 , 297-3 18 .
Rounds , J . B . , Jr. , Henley, G . A . , Dawis, R . V. , Lofquist, L . H. , & Weiss, D . J . (1981) .
Manual for the Minnesota Importance Questionnaire: A measure of vocational needs
and values . Minneapolis : Department of Psychology, University of Minnesota.
Rousseau, D. M. (1977) . Technological differences in job characteristics , employee
satisfaction and motivation: a synthesis of job design research and socio-technical
systems theory. Organizational Behavior and Human Performance, 19, 18-42 .

483
Rousseau, D. M. ( 1978). Relationship of work to non-work. Journal of Applied Psychology,
63 , 5 13-5 17 .
Sandler, I . N. , & Lakey, B . ( 1982) . Locus of control as a stress moderator. American
Journal of Community Psychology, 10, 65-80.
Sarason, I. G . , Levine, H. M . , Basham, R. B. & Sarason, B. R. (1983) . Assessing social
support: The social support questionnaire. Journal of Personality and Social
Psychology, 44, 127-139.
Saris, W. E. , & Stronkhorst. , L. H. ( 1984) . Causal modelling in nonexperimental research:
An introduction to the LISREL approach. Amsterdam, The Netherlands: Sociometric
Research Foundation.
Schaffer, R. H. (1953). Job satisfaction as related to need satisfaction in work. Psvchological
Monographs , 67, (Whole no. 364) .
Schein, E . H . (1978) . Career Dynamics : Matching Individuals and Organizational Needs .
Reading, Massachusetts : Addison Wesley.
Schlenker, B . R. ( 1980) . Impression management: The self-concept. social identity. and
interpersonal relations . Belmont, CA: Brooks Cole.
Schmidt, F. L. (1973) . Implications of a measurement problem for expectancy theory
research. Or2:anizational Behavior and Human Performance, 10, 243-25 1 .
Schneider, E.V. (1957) . Industrial sociology. New York: McGraw-Hill .
Schwab, D . , Olian-Gottlieb, J. , & Heneman, H. , Ill. (1979). Between subjects expectancy
research: A statistical review of studies predicting effort and performance .
Psychological Bulletin, 86, 139-147.
Scott, T. B . , Dawis, R. V . , England, G. W. , & Lofquist, L. H. (1960) . A definition of work
adjustment . Minnesota Studies in Vocational Rehabilitation, X.

484
Scott , W . D . , & Clothier, R. C. (1925) . Personnel Management. New York: Shaw.
Scott, W. D . , Clothier, R. C . , & Spriegel, W. R. ( 1954) . Personnel Management, (5th ed.)
New York: McGraw-Hill.
Scott, W. E . , Jr. ( 1966). Activation theory and task design. Organizational Behavior and
Human Performance. 1 (1), 3-30.
Seaburg, D. J . , Rounds, J. B . Jr. , Dawis, R. V. , & Lofquist, L. H. (1976). Values as second
order needs . Paper presented at the 84th annual meeting of the American
Psychological Association, Washington, D . C . , September.
Seers , A . , McGee, G. W. , Serey, T. T . , & Graen, G. B. (1983) . The interaction of job
stress and support: A strong inference investigation. Academy of Management
Journal , 26, 273-284.
Shaffer, L. F. , & Schoben, E. J . , Jr. (1956) . The psychology of adjustment: A dynamic
approach to personality and mental hygiene. (2nd ed.) Boston: Houghton Mifflin.
Shamir, B . , & Ruskin, H. (1983) . Types of community as a moderator of work-leisure
relationships : A comparative study of Kibbutz residents and urban residents . Journal
of Vocational Behavior, 1, 209-22 1 .
Shapiro, G. L . , & Desler, G. (1985). Are self-appraisals more realistic among professionals
or nonprofessionals in health care? Public Personnel Management, 14, 285-291 .
Sheldon, W.H . , & Stephens , S .S . (1942) . The varieties of temperament. New York: Harper .
Shirom, A. ( 1982) . What is organisational stress? A facet of analytical conceptualization.
Journal of Occupational Behavior, �' 21-38 .
Shore, L . M. , & Thornton, G. C. (1986) . Effects of gender on self-and supervisory ratings .
Academy of Management Journal, 29, 1 15-129.

485
Shouksmith, G. (1987) . Emerging personnel values in changing societies. In Bass, B. M. &
Drenth, P. J . D . , Advances in organisational psychology: An international review.
Sage Publications : California.
Shouksmith, G. , & Hesketh, B (1986) . Changing horses in mid-stream: Job and life
satisfactions for veterinarians . New Zealand Veterinary Journal .
Shubsachs , A. P. W. , Rounds, J. B . , Jr. , Dawis, R. V. , & Lofquist, L. H. ( 1978) .
Perception of work reinforcer systems : Factor structure . Journal of Vocational
Behavior, .U, 54-62.
Sieber, S . D . (1974). Toward a theory of role accumulation. American Sociological Review,
39, 567-578.
Simon, J . G. , & Feather, N. T. (1973) . Causal attributions for success and failure at
university examinations . Journal of Educational Psychology, 64, 46-56.
Sims, H. P . , & LaFollette, W. ( 1975) . An assessment of the Litwin and Stringer organization
climate questionnaire. Personnel Psychology, 28, 19-38 .
Skinner, B . F . (1953) . Science and human behaviour. New York. Macmillan.
Slaney, R. B . , & Russell, J. E . A. (1987) . Perspectives on vocational behavior, 1 986: A
review. Journal of Vocational Behavior, 3 1 , 1 1 1-173 .
Slocum, J . W. , & Cron, W . L . (1985) . Job attitudes and performance during three career
stages . Journal of Vocational Behavior, 26, 126-145 .
Smart, J . C . , & Elton, C . F . ( 1986). Person-environment congruence and job satisfaction.
Journal of Vocational Behavior, 29, 216-225 .
Schmitt, N . , & Mellon, P. M. ( 1980) . Life and job satisfaction. Is the job central? Journal
of Vocational Behavior, 16, 51-58.

486
Smith, K. U. ( 1962) . Work theory and economic behavior. Bloomington. Indiana: Foundation
for Economic and Business Studies .
Smith, P . C . , Kendall , L. M . , & Hulin, C . L . ( 1969) . The measurement of satisfaction in
work and retirement. Chicago: Rand McNally.
Snyder, E . E . , & Spreitzer, E. ( 1974). Orientations towards work and leisure as predictors
towards sports involvement. Research Quarterly, 45, 398-406.
Solby, B. (1944) . The role concept in job adjustment. Sociometry, 1. 222-229.
Spokane, A. R. ( 1987) . Person-environment fit research. Introduction: Conceptual and
methodological issues in person-environment fit research. Journal of Vocational
Behavior, 11. 217-22 1 .
Stafford, E . M . , Jackson, P . R . & Banks, M. H. ( 1980) . Employment, work involvement
and mental health in less qualified young people. Journal of Occupational Psychology,
53, 291-304.
Staines, G. ( 1980) . Spillover versus compensation: A review of the literature on the
relationship between work and nonwork. Human Relations, 33 , 1 1 1-129 .
Staub, E. ( 1979) . Positive social behaviour and morality, Vol . 2 : Socialization and
Development. New York: Academic Press , 1 978 .
Staub, E . (Ed.) ( 1980) . Personality: Basic aspects and current research. Englewood Cliffs,
N.J. : Prentice-Hall Inc.
Staw, B . M. ( 1984). Organizational behavior: A review and reformulation of the field's
outcome variables. Annual Review of Psychology, 35, 627-666.
Steers , R. M. (1975) . Effects of need for achievement on the job performance-job attitude
relationship . Journal of Applied Psychology, 60, 678-682.
487
Steers , R. M . , & Rhodes, S. R. (1978) . Major influences on employee attendance: A process
model . Journal of Applied Psychology, 63 , 391-407 .
Steers , R. M. , & Spencer, D . G. (1977) . The role of achievement motivation in job design.
Journal of Applied Psychology, 62, 472-479.
Steiner, M. E. (1948) The use of projective techniques in industry. Rorschach Research
Exchange, 12, 171-174.
Steinhauer J. C . (1978) . In The eighth mental measurement vearbook (Vol 2 , p . 1630) . New
Jersey: The Grypton Press .
Stevens, G. E. , & DeNisi, A. S . (1980) . Women as managers : Attitudes and attributions for
performance by men and women. Academy of Management Journal, �' 355-361 .
Stothart, R. A. ( 1984). The place of leisure in people' s live. N.Z. Parks and Recreation, .§,
462-466.
Strong, E. K. Jr. ( 1927) Vocational Interest Blank. California: Stanford University Press .
Strong, E . K. Jr. ( 1943) . Vocational interests of men and women. Standford, California:
Standford University press .
Strong, E . K. Jr. (1955) . Vocational interests 18 years after college. University of Minnesota
Press: Minneapolis .
Stumpf, S . A. , & Brief, A. P . , & Hartman, K. ( 1987). Self-efficacy expectations and
coping with career-related events . Journal of Vocational Behavior, 3 1 , 91- 9 1-108 .
Stumpf, S . A. , & Hartman, K. ( 1984) . Individual exploration to organizational commitment
or withdrawal . Academy of Management Journal, 27, 308-329 .
Sullivan, H. S . (1953). The interpersonal theory of psvchiatry. New York: W. W. Norton.
488
Super, D. E . (1940) . Avocational interest patterns . Palto Alto: Stanford University Press .
Super, D . E . ( 1941) . Avocation and vocational adjustment. Character and Personality, 10,
5 1-61 .
Super, D . E . (1949) . Appraising vocational fitness . New York: Harper & Row.
Super, D . E. (195 1) . Vocational adjustment: implementing a self-concept. Occupations, 30,
88-92.
Super, D . E. (1953). A theory of vocational development. American Psychologist, �' 1 85-
190.
Super, D. E. ( 1957) . The psychology of careers . New York: Harper & Row.
Super, D. E. (1958) . The use of multifactor tests in guidance. Washington D .C . : American
Personnel and Guidance Association.
Super, D . E. (1963) . The definition and measurement of early career behavior: A first
formulation. Personnel and Guidance Journal, 4 1 , 775-780.
Super, D . E. (1970) . Work Values Inventory. Boston: Houghton Mifflin.
Super, D . E. (1973). The work values inventory. In D . G. Zytowski (Ed.) , Contemporary
approaches to interest measurement. University of Minnesota Press : Minneapolis .
Super, D . E . ( 1980) . A life-span, life-space approach to career development. Journal of
Vocational Behavior, 16 , 282-298 .
Super, D . E . , & Crites , J. 0 . ( 1962). Appraising vocational fitness (Revised ed.) . Harper &
Row: New York.
489
Super, D. E. , Crites , J . 0 . , Hummel, R. C . , Maser, H. P. , Overstreet, P. L. , & Warnath,
C . F. (1957) . Vocational development: A framework for research. New York:
Teachers College Press .
Super, D . E . , & Kidd, J. M. (1979) . Vocational maturity in adulthood: Toward turning a
model into a measure. Journal of Vocational Behavior, 14, 255-270.
Super, D . E . , Starishevsky, R. , Matlin, K. , & Jordan, J. P. (1967). Career development:
self-concept theory. New York: College Entrance Board.
Sutherland, V. J . , & Cooper, G. L. (1988). Sources of work stress . In Hurrell, J. J . Jr. ,
Murphy, L. R. , Sauter, S . L. & Cooper, C . L . (Eds .) , Occupational stress : Issues
and developments in research. London: Taylor & Francis .
Swinburne, P. ( 1981) . The psychological impact of unemployment on managers and
professional staff. Journal of Occupational Psychology, 54, 47-64.
Swindle, R. W. Jr. , Cronkite, R. C . , & Moos , R. H. (1989) . Life stressors , social resources,
coping, and the 4-year course of unipolar depression. Journal of Abnormal
Psychology, 98, 468-477.
Tanuka, J . S . , & Huba, G. J . ( 1984). Structures of psychological distress: Testing
confirmatory hierarchical models . Journal of Consulting and Clinical Psychology, 52,
719-72 1 .
Taylor, F . W . (191 1) . The principles of scientific management. New York: Harper.
Taylor, K. D . , & Weiss, D . J. ( 1972) . Prediction of individual job termination from
measured job satisfaction and biographical data. Journal of Vocational Behavior, 2, 123-132.
Taylor, K. F . , Kelso, G. 1 . , Cox, G. N. , Alloway, W. J. , & Matthews, J. P . ( 1979) .
Applying Holland's vocational categories to leisure activities . Journal of Occupational
Psychology, 52, 199-207.

490
Taylor, K. M . , & Betz, N. E. (1983) . Application of self-efficacy theory to the understanding
and treatment of career indecision. Journal of Vocational Behavior, 22, 63-8 1 .
Teichner, W. H . , Arees, E . , & Reilly, R. (1963) . Noise and Human performance: A
psychophysiological approach. Ergonomics, Q., 83-97.
Thoits, P . A. ( 1982) . Conceptual, methodological, and theoretical problems in studying social
support as a buffer against life stress . Journal of Health and Social Behaviour, 23,
145-159.
Thoits , P . A. ( 1983) . Dimensions of life events that influence psychological distress: An
evaluation and synthesis of the literature. In H. B . Kaplan (Ed.) , Pyschosocial stress :
Trends in theory and research. New York: Academic Press .
Thomas, L. G. ( 1956). The occupational structure and education, Englewood Cliffs , N.J . :
Prentice-Hall.
Thoresen, C. E . , & Mahoney, M. J. ( 1974). Behavioral self-control . New York: Halt,
Rhinehart & Winston.
Thorndike, R. L. & Hagen, E. (1959). 10,000 careers . New York: Wiley.
Thorndike, R. M . , Weiss , D . J . , & Dawis, R. V. ( 1968). The canonical correlation of
vocational interests and vocational needs . Journal of Counseling Psychology, 15 , 101-
106.
Thornton, G. C . (1968) . The relationship between supervisory and self-appraisals of executive
performance. Personnel Psychology, 2 1 , 441-445 .
Tiedeman, D . V. , & Miller, A. L. ( 1974) . Technology and guidance: The challenge to more
elastic existence amid accelerating obsolescence. In E. L. Herr (Ed.), Vocational
guidance and human development. Boston: Houghton Mifflin.

491
Tiedeman, D . V. , O'Hara, R. P . , & Baruch, R. W. (1963) . Career development: Choice and
adjustment. Princeton, New Jersey: College Entrance Examination Board.
Tiedeman, D . V . , & Willis , M. B . , (Eds . ) . ( 1972) . Career education and the technology of
career development. Palo Alto, California: American Institutes of Research.
Tiffany, D . W. , Cowan, J. R. , & Tiffany, P. M. (1970) . The unemployed: A social
psychological portrait. Englewood Cliffs : Prentice-Hall .
Tinsley, H. E. , & Weiss, D . J. ( 1974) . A multivariate investigation of the reinforcer structure
of occupations . Journal of Vocational Behavior, 1,, 97- 1 1 3 .
Trist, E . L. , & Bamforth, K . W . (1951) . Some social and psychological consequences of
the long-wall method of coal getting. Human Relations, 1,, 3-38.
Tukey, J. W. (1950) . Some sampling simplified. Journal of American Statistical Asscociation,
45, 501-5 19.
Twery, R . , Schmid, J . , & Wrigley, C . (1958) . Some factors in job satisfaction: A
comparison of three methods of analysis . Educational and Psychological
Measurement, 18 , 189-202 .
Tyler, L. E. (1965) . The psychology of individual differences . (3rd ed.) New York:
Appleton-Century Crofts .
Tziner, A. (1983) . Correspondence between occupational rewards and occupational needs and
work satisfaction: A canonical redundancy analysis . Journal of Occupational
Psvchology, 56, 49-56.
Tziner, A. ( 1984) . A fairer examination of rating scales when used for performance appraisal
in a real organizational setting. Journal of Occupational Behavior, � (2), 103 - 1 12.
Uhrbock, R. S . (1934) . Attributes of 4430 employees . Journal of Social Psychologv, � . 365-
377 .
492
Underwood, B . J. ( 1949) . Experimental psychology. New York: Appleton-Century-Crofts.
U.S . Department of Labor ( 1970) . Manual for the USES General Aptitude Test Battery.
Washington D .C . : U .S . Government Printing Office.
U.S . Department of Labor ( 1977) . Dictionary of occupational titles . (4th ed.) . Washington
D .C. : U .S . Government Printing Office.
U.S . Department of Labor ( 1979) . Manual for the USES General Aptitude Test Battery.
Section IT: Occupational Aptitude Pattern Structure, Washington, D . C . : U .S .
Government Printing Office.
Vaitenas, R. & Weiner, Y . ( 1977). Developmental, emotional, and interest factors, in
voluntary mid-career change. Journal of Vocational Behavior, 11, 291-304.
Van Sell , M. , Brief, A. P . , & Schuler, R. S . ( 1981) . Role conflict and role ambiguity:
Integration of the literature and directions for future research. Human Relations, 34
(1) , 43-71 .
Vander Noot, T . , Kunde, T . , & Heneman, H. G. , Jr. (1958). Comparability of absence rates .
Personnel Journal, 36, 380-382.
Vaux, A. ( 1988). Social support theory, research, and intervention. New York: Praeger.
Veroff, J. & Feld, S . ( 1970) . Marriage and work in America: A study of motives and roles.
London: Van Nostrand Reinhold.
Viet, C. T . , & Ware, J. E. (1983) . The structure of psychological distress and well-being in
general populations . Journal of Consulting and Clinical Psychology, 5 1 , 730-742 .
Viteles , M. S . (1932) . Industrial psychology. New York: Norton.
493
Vocational Psychology Research (1975 Revision) . Minnesota Importance Questionnaire.
Ranked form. University of Minnesota. In Dawis and Lofquist (1984) , A
psychological theory of work adjustment: An individual differences model and its
applications . University of Minnesota Press : Minneapolis .
Voges, K. E. ( 1983) . The effects of occupational stress on the family in five occupations :
Unpublished doctoral thesis , Massey University, Palmerston North, New Zealand.
Vondracek, F. W. ( 1987) . Comments with a focus on Pervin's paper. Journal of Vocational
Behavior, 3 1 , 341-436 .
Vondracek, F. W. , Lerner, R. M. , & Schulenberg, J. E. ( 1983) . The concept of career
development in vocational theory and intervention. Journal of Vocational Behavior,
23 , 179-202.
Vondracek, F. W. , Lerner, R. M. , & Schulenberg, J. E. (1986) . Career development: A
life-span developmental approach. Hillsdale, New Jersey: Erlbaum.
Vroom, V. H. (1964) . Work and motivation. New York: Wiley.
Wahba, M. A . , & Bridwell, L . B . (1976). Maslow reconsidered: A review of research on
the need hierarchy theory. Organizational Behavior and Human Performance, 15 ,
212-240.
Walsh, W. B . (1978) In Buros , 0 . K. (Ed.), The eighth mental measurements yearbook (Vol .
2, p. 1641) . New Jersey: The Grypton Press .
Wanous, J . P. , Keon, T. L. , & Latack, J. C . ( 1983) . Expectancy theory and occupational!
organizational choices : A review and test. Organizational Behavior and Human
Performance, 32, 66-86.
Warr, P. B . (1981) . Some studies ofpsvchological well-being and unemplovment. Social and
Applied Psychology Unit, Memo No 43 1 .
494
Warr, P. B . , Barter, J . , & Brownbridge, G . (1983) . On the independence of positive and
negative affect. Journal of Personality and Social Psychology, 44, 644-65 1 .
Warr, P . B . , & Knapper, C . (1968). The perception of people and events . John Wiley &
Sons : London.
Weber, M. (1947). The theory of social and economic organization. Translated and edited
by A. M. Henderson & Talcott Parsons. New York: Oxford University Press .
Weick, K. E. , Bougon, M. G. , & Maruyama, G. ( 1976) . The equity context. Organizational
Behavior and Human Performance, 15 , 32-65 .
Weiner, A. I . , & Hunt, S . L . (1983). Work and leisure orientation among university students :
Implications for college and university counsellors . The Personnel and Guidance
Journal, 6 1 , 537-542.
Weiner, Y . , & Klein, K. L. ( 1978) . The relationship between vocational interests and job
satisfaction: A reconciliation of divergent results . Journal of Vocational Behavior, 1 3 ,
298-304.
Weiner, Y . , & Vardi, Y . (1980) . Relationships between job, organization, and career
commitments and work outcomes: An integrative approach. Organizational Behavior
and Human Performance, 26, 81 -96.
Weiss, D. J . , Dawis, R. V . , England G. W. , & Lofquist, L . H. ( 1965) . An inferential
approach to occupational reinforcement. Minnesota Studies in Vocational
Rehabilitation, 19.
Weiss , D. J . , Dawis, R. V. , England, G. W., & Lofquist, L . H. (1967) . Manual for the
Minnesota Satisfaction Questionnaire. Minnesota Studies on Vocational Rehabilitation,
22.
Weiss, D . J . , Dawis, R. V. , Lofquist, L. H . , & England, G. W. ( 1966) . Instrumentation for
the theory of work adjustment, Minnesota Studies in Vocational Rehabilitation, 2 1 .

495
Wheaton, B . , Muthen, B . , Alwin, D . , & Summers, G. ( 1977) . Assessing reliability and
stability in panel models . In D . Heise (Ed.) , Sociological Methodology 1977. San
Francisco: Jossey-Bass .
Wheeler, A . E . , & Knoop, H. R. ( 1982) . Self, teacher, and faculty assessments of student
teaching performance. Journal of Educational Research, 75, 178-181 .
Wheeler, K. G . (1983) . Comparisons of self-efficacy and expectancy models of occupational
preferences for college males and females . Journal of Occupational Psychology, 56 ,
73-78.
White, K. D . , & Austin, D . A. (1983). Factor analysis and norms for an 18-item version
of Reid and Ware's Internal-External scale. Canadian Journal of Behavioural
Sciences , 15 , 259-265 .
Wiggens , J . D . , Lederer, D . A. , Salkowe, A. , & Rys , G. (1983). Job satisfaction related to
tested congruence and differentiation. Journal of Vocational Behavior, 23, 1 12-12 1 .
Wilensky, H . L . ( 1960) . Work, careers and social integration. International Social Science
Journal , 12, 543-560.
Wilensky, H. L. (1964) . Varieties of work experience. In H. Borow (Ed.), Man in a world
at work (pp. 125-154) . Boston: Houghton Mifflin.
Wilkinson. R. T . ( 1963). Interaction of noise with knowledge of results and sleep deprivation.
Journal of Experimental Psychology, 66, 332-337.
Wilkinson, R. T . , Fox, R. H. , Goldsmith, R. , Hampton, I . F. G. , & Lewis , H. E. ( 1964) .
Psychological and physiological responses to raised body temperature. Journal of
Applied Psychology, 19 , 287-291 .
Wilson, D . , & Chiwakata, L . (1989) . Locus of control and burnout among nurses in
Zimbabwe. Psychological Reports , 65 , 426 .
496
Woodward, J. ( 1958). Management and technology. London: Her Majesty's Stationery
Office.
Work Importance Study ( 1980) . Report of the fourth working conference of the Work
Importance Study. Dubrovnik, Jugoslavia: WIS .
Wylie, R. C . (1979) . The self-concept: Vol 2. Lincoln: University of Nebraska Press .
Young, P. A . , Eaves, L. J . , & Eysenck, H. J . ( 1980). Intergenerational stability and change
in the causes of variation in personality . Personality and Individual Differences , l ,
35-55 .
Zajonc, R. B . (1968) . The attitudinal effects of mere exposure. Journal of Personality and
Social Psychology, .2, 1968 (monograph supplement) .
Zedeck, S . ( 1978) In Buros, 0 . K. (Ed.) , The eighth mental measurement yearbook (Vol. 2 .
pp. 1 673-1675). New Jersey: The Grypton Press .
Zuzanek, J . , & Mannell, R. ( 1983) . Work-leisure relationships from a sociological and social
psychological perspective. Leisure Studies , .£ (3) , 327-344.
Atkinson, J. W. , & Raynor, J. 0. (Eds .) . ( 1974) . Motivation and achievement. Washington:
V. H. Wins ton & Sons .
de Charms , R. (197 6). Enhancing motivation: Change in the classroom. New York: Irvington.
Homer, M. S . (1974) . The measurement and behavioral implications of fear of success in
women. In J. W. Atkinson & J . 0. Raynor (Eds .) . Motivation and
achievement. Washington D . C . : Winston.
McClelland, D . C. (1961). The achieving society Princeton, N J. : Van Nostrand.
McClelland, D . C. (1975). Power: The inner experience. New York: Irvington.
McClelland, D . C . , Atkinson, J . W. , Clark, R. W. , & Lowell, E. L. ( 1953). The
achievement motive. New York: Appleton-Century-Crofts .
Winter, D. G. (1973) . The power motive. New York: Free Press.

APPENDIX A
A. l Request for Respondents
A.2 Questionnaire for Preliminary Study
A.3 Modifications to Adjustment Style Rating Form
A.4 Modifications to Personality Style Rating Form
497

498
A. l Request for respondents
I am asking students in their final year from the different subject areas and faculties at Massey University to take part in a longitudinal study which I am doing for a Doctorate in Psychology.
This research is looking at students in their transition from university to employment. I am interested in how people fit into their jobs. In order to do this I need to collect some background information and administer questionnaires relating to what people expect from their jobs before they are employed and then administer further questionnaires to find out how they are getting on in their work.
Some of the information is of a personal nature, for example your academic record and your parents' income, but this sort of information is needed because such factors have been shown to be important in research of this kind.
I want to emphasise that all the information from you will be kept in the strictest confidence. No one individual will be identifiable in the published results and to maintain confidentiality throughout all stages of the research only a number and not your name will appear on your questionnaire.
Because I will be making comparisons among students from different subject areas and faculties, the more who are included from each area the better the results will be in terms of their accuracy and reliability. I am therefore hoping you will agree to take part in this study so that the conclusions drawn from it are as accurate as possible.
In summary, participating in the study will involve: 1 . Taking home questionnaires to complete (about an hour to an hour and a half of your time) and 2 . Being followed up early next year to complete a questionnaire about various aspects of your job. Some of you may also be individually interviewed.
On the form where I have asked for your consent to take part in the study, I have asked for a name and address of both a relative and a friend. This is only to ensure I can contact you next year because you will not obviously know at this stage where you will be. All this information will be kept confidential and will be destroyed on completion of the research.
I thank you for considering taking part in my study, the results of which may be of use to you personally and to your university staff in relation to their teaching programmes.
Monica Skinner (Dept. of Psychology, Massey University) .

499
A.2 Multiple choice questions for preliminary study
Multiple-choice questions in the preliminary questionnaire were,
"If my job did not allow me to further develop my talents and skills (important/not important)) , I would . . .
a. do something myself b. expect my employer to do something c. influence my employer to do something d. change the way I view this e. leave things as they are f. do something else (please specify) "
The a. category were designed to represent an active response which involved self only, b.
represented perseverance and an environmental response, c. represented an active response
involving the environment, d. represented a reactive response and therefore involved self, e.
represented a response which was of a flexible style, neither active nor reactive and involving
neither self nor the environment and f. provided the opportunity to make a response not
allowed for or represented by any of the preceding alternatives. At the end of both forms of
the questionnaire respondents were presented with a general item postulating a situation where
they were not suited to their job. This was an attempt to gain an indication of their flexibility
and perseverance. Dawis and Lofquist's experimental rating scales (for adjustment styles)
were placed at the end of each form.
The instructions for the respondents were, "This is an exploratory study to develop categories
of responses in relation to work problems. Please give some indication of what you may or
may not do in response to each item, even if it is not important nor relevant to you in your
job. Please 1 . indicate if that particular aspect of a job is "important" or "not important " .
2 . complete each sentence (we are interested in what you would DO or NOT DO rather than
in how you FEEL about the items).
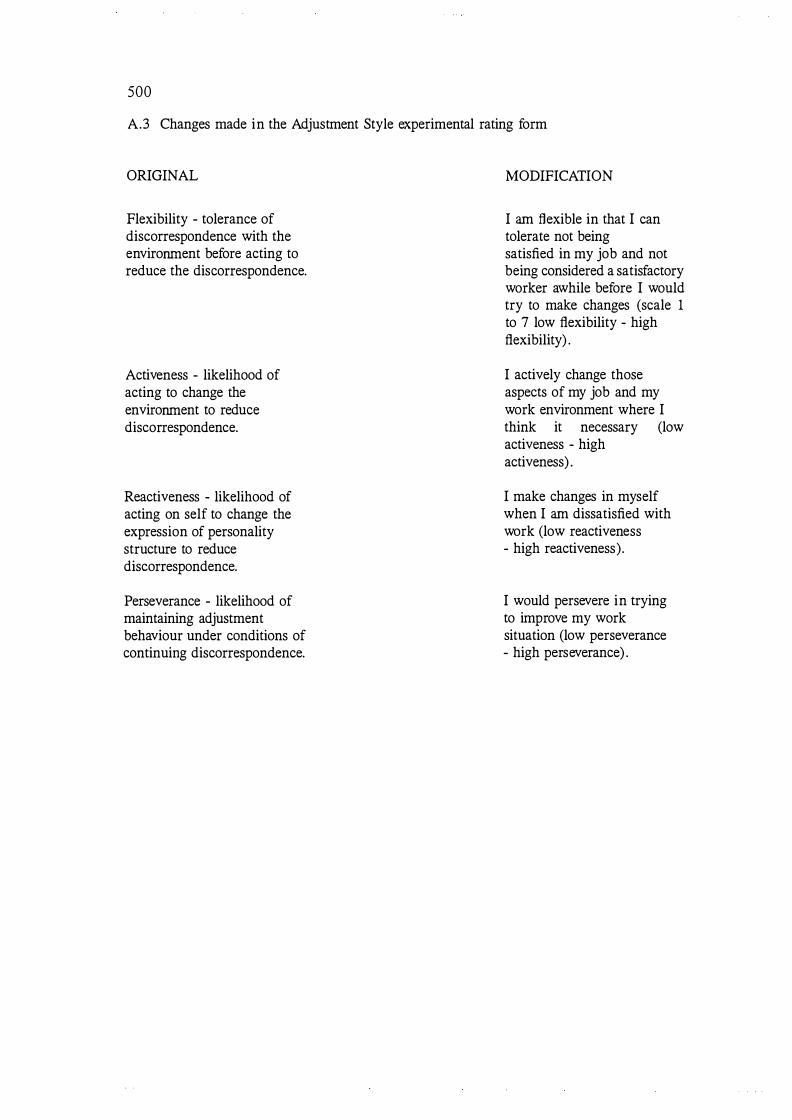
500
A.3 Changes made in the Adjustment Style experimental rating form
ORIGINAL
Flexibility - tolerance of discorrespondence with the environment before acting to reduce the discorrespondence.
Activeness - likelihood of acting to change the environment to reduce discorrespondence.
Reactiveness - likelihood of acting on self to change the expression of personality structure to reduce discorrespondence.
Perseverance - likelihood of maintaining adjustment behaviour under conditions of continuing discorrespondence.
MODIFICATION
I am flexible in that I can tolerate not being satisfied in my job and not being considered a satisfactory worker awhile before I would try to make changes (scale 1 to 7 low flexibility - high flexibility) .
I actively change those aspects of my job and my work environment where I think it necessary (low activeness - high activeness) .
I make changes in myself when I am dissatisfied with work (low reactiveness - high reactiveness).
I would persevere in trying to improve my work situation (low perseverance - high perseverance) .
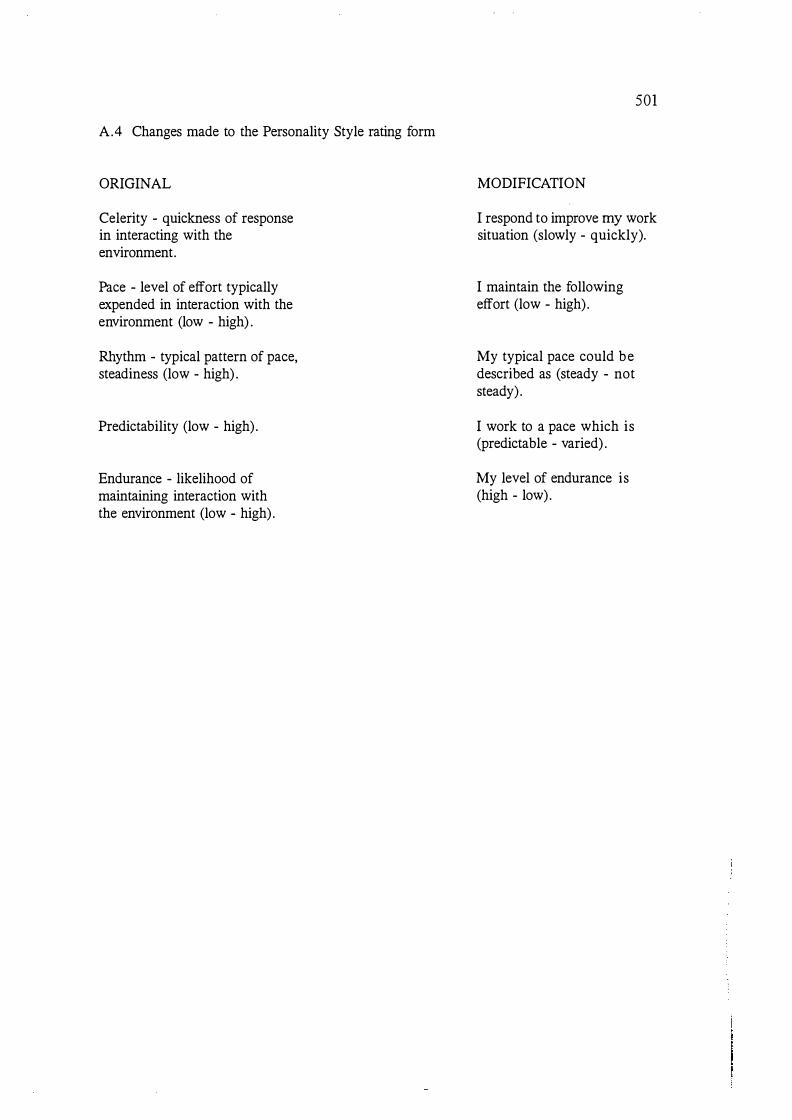
A.4 Changes made to the Personality Style rating form
ORIGINAL
Celerity - quickness of response in interacting with the environment.
Pace - level of effort typically expended in interaction with the environment (low - high) .
Rhythm - typical pattern of pace, steadiness (low - high) .
Predictability (low - high) .
Endurance - likelihood of maintaining interaction with the environment (low - high) .
501
MODIFICATION
I respond to improve my work situation (slowly - quickly).
I maintain the following effort (low - high) .
My typical pace could be described as (steady - not steady) .
I work to a pace which is (predictable - varied) .
My level of endurance is (high - low).
502
A.5 Reliability and validity estimates for Campbell, Converse and Rodger's ( 1976) measures
Happiness and life satisfaction items correlated .50. Intercorrelations of 8 items (easy vs hard,
tied down vs free excluded) ranged from .40 to . 6 1 with an average of over . 50 . The two odd
items showed an average correlation with the other eight of about .27 . Principle Components
Analysis of the correlation among the 1 0 adjective pairs showed the first principal component
explained about 48 .7 % of the total variance of the 1 0 items and the first two explained
59.4 % . For Varimax rotation, 8 of the pairs gave loadings on one factor in the range . 65 to
.79, the hard vs easy loaded . 07 and tied down vs free loaded .24. The latter two items had
loadings of . 85 and . 7 1 on the second rotated factor and loadings on other items ranged from
.00 - .39 . For the global measures, multiple regression showed all 1 0 scales explained 33 %
of the variance in the life satisfaction item (equivalent to a multiple correlation of . 57) and
29 % of the variance in the happiness item (equivalent to a multiple correlation of . 54) .
The Index of General Affect (eight items averaged) correlated . 55 with the overall satisfaction
item which was almost as large as the . 57 multiple correlation between all ten items and the
overall satisfaction scale and .52 with the happiness measure (as compared to the multiple
correlation of .54 for the ten items) . The reliability of the index (Cronbach's alpha and
omega) was estimated at . 89 as based on correlations among 8 items. Using the reliability
measure as an estimate of validity, validity was placed at .94 but thought to be an
overestimate because of a possible method factor. The similar format to questions might result
in respondents choosing particular points on the scale regardless of the question content.
The test-retest measures (the interview repeated eight months later) were really stability
measures. The longer than usual interval permitted real change to occur in respondents . The
Index of General Affect had a stability index of .56 for the same period but was believed to
be an underestimate. The stability measure for life satisfaction was .43 (but true change may
have been involved also) . For the Happiness item the stability figure was . 38 . The Composite
Index of Well-being (the Index of General Affect plus the single satisfaction item) had a
stability coefficient of .53 . The Index of Personal Competence correlated .35 with the Index
of Well-being. For the Domain Satisfaction Measures, stability estimates (correlations at 8
months) varied from .42 for neighbours and friendships to . 67 for health. Nearly half the
single-item measures showed greater stability than the Index of Well-being and were more
stable than the satisfaction and happiness global measures .
B. l Questionnaire One
B.2 Questionnaire Two
503
APPENDIX B

T RAN S ITI O N TO
E M PLOYM E N T
M O N I CA J S K I N N ER D EPARTMENT OF PSYCHOLO GY MASSEY U N IVERSITY
505

TRANSITION TO EMP LOYMENT STUDY
Thi s que s t io nn a i r e has b e e n d e s igned for f i n a l y e a r Un i v ersity
stude n t s . We a r e i n t e r es t e d in gathering i n format i o n from d i fferent
groups of s t u d e n t s in order to look at the trans i t ion f rom u n i v ersity
to wor k . The ques t i o n s i n S e c t i o n A , for e x ample , a s k about things
such a s your p a r e n t s ' qual i f i c a t ions and income b e c a u s e p r evious
stud i es in this area h a v e shown t h e s e to b e impo rtant factor s .
No p e r so n o t h e r than the r e s e a r cher will e v e r s e e your comp leted
que s t i o n n a i r e ( as you can s e e your name does not a p p e a r a n ywhe r e on i t )
t o e n s u r e that a b s o l ut e con fi d e n t i a l i t y can b e m a i n t a i n e d at a l l times .
No i n d i v idual w i l l b e ident i fi a b l e in any pub l i s h ed r e s u l t s .
PLEASE NOTE :
Thi s que s t i o n n a i r e must b e r e turned even
con t a i n s psycholo g i c a l ins truments which for
r e a s o n s mus t not b e g e n e r a l l y a v a i l ab l e . We
coo p e r a t i o n i n th i s .
i f uncomp leted as it
eth i c a l and copyri ght
would a p p r e c i at e your
A f t e r we h a v e c o n t acted you n e x t year , you will be s e n t a summar y
o f t h e r e su lt s o f t h e s tu d y . I can be contacted through t h e P s ychology
D e p artme n t if you w i s h to d i s cu s s your ind i v idual r e s u l t s a t any time .
Thank you for t a k i n g p a r t in this study .
Mon i c a J . Skinner
506
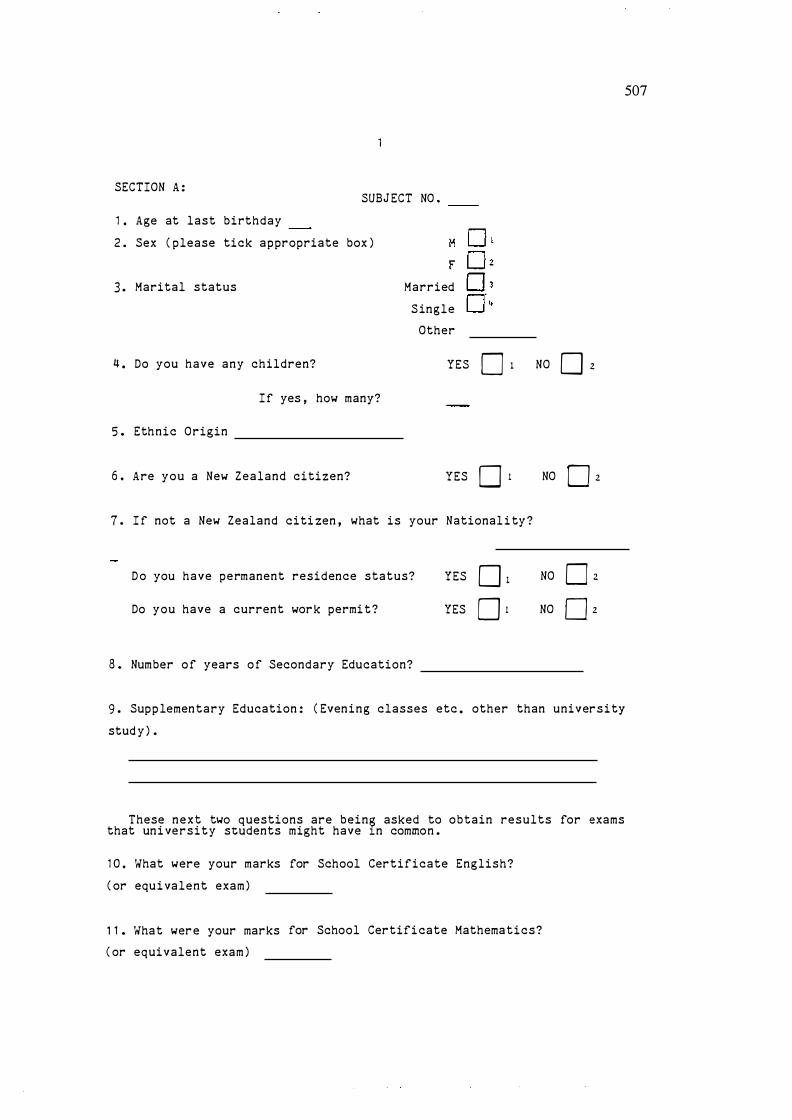
SECTION A : SUBJ ECT NO .
1 . Age at last birthday
2 . Sex ( please tick a p propriate box )
3 . Marital status Married
S ingle
Other
4 . Do you have any children? YES D 1 I f yes , how many?
5 . Ethnic Origin
6 . Are you a New Zealand citizen? YES 0 1 7 . I f not a New Zealand citi zen , what is your National i ty ?
D o you have permanent residence status?
Do you have a current wor k permi t ?
8 . Number o f years o f Secondary Education?
YES 0 1 YES 0 1
NO 0 z
NO O z
NO D 2
NO D z
9 . Supp lementary Education : ( Even i n g classes etc . other than univer s i ty
stud y ) .
These n e x t two questions are being asked to obtain results for exams that uni versity students might have 1n common .
1 0 . What were your marks for School Certificate English?
( or equ i valent exam )
1 1 . What wer e your marks for School Certifi cate Mathematics?
( or equivalent exam )
507
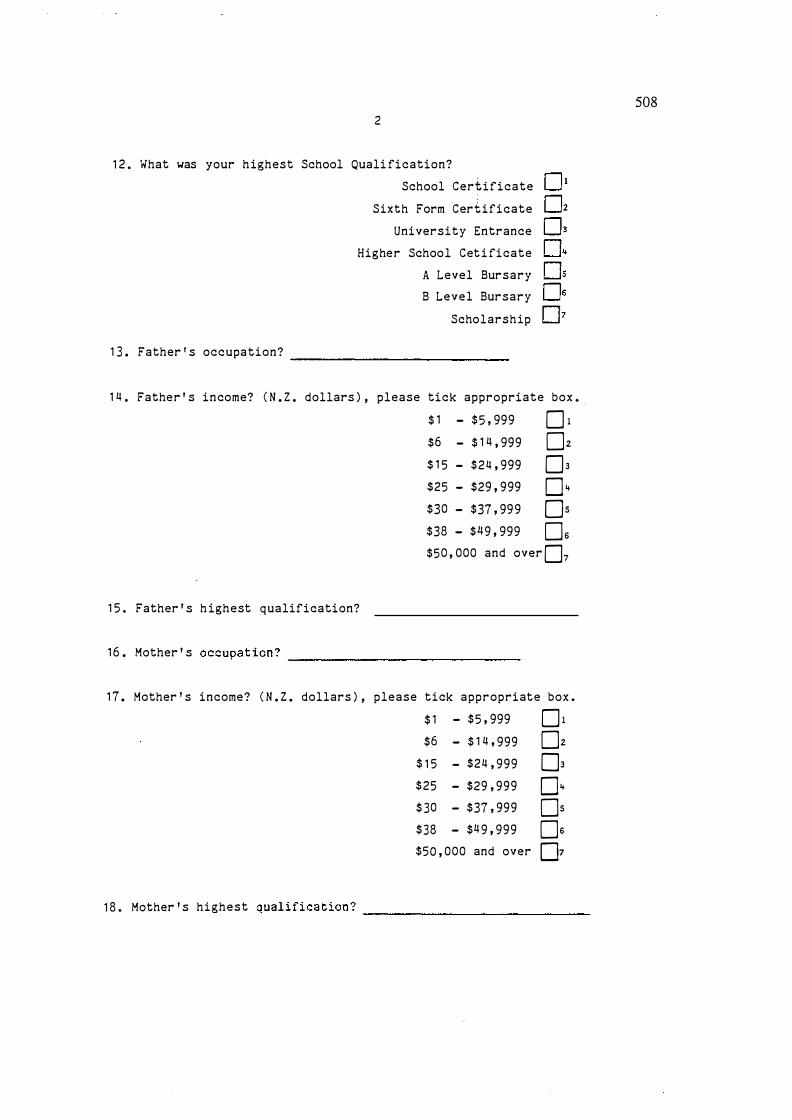
2
1 2 . What was your h ighest School Quali fication?
1 3 . Father ' s occupation?
School Certificate
Sixth Form Certificate
University Entrance
Higher School Cet i ficate
A Level Bursary
B Level Bursary
Scholarship
----------------------------
1 4 . Father ' s i n come? ( N . Z . dollars ) , please tick appropriate box • .
$ 1 - $ 5 , 999 0 1 $6 - $ 1 4 , 999 Oz $ 1 5 - $24 , 999 03 $25 - $29 , 999 04 $30 - $37 , 99 9 Os $38 - $49 , 999 Os $50 , 000 and over 07
1 5 . Father ' s h ighest qualification?
1 6 . Mother ' s occupation?-----------------------------
1 7 . Mother ' s income? ( N . Z . dollars ) , please tick appropriate box .
$ 1 - $ 5 ' 999 $6 - $ 1 4 , 999
$ 1 5 - $24 , 999 $25 - $29 , 999 $ 30 - $37 , 999 $38 - $4 9 , 999
01 Oz 03 04 Os Os
$50 , 000 and over c=]1 1 8 . Mother ' s hi ghest qualification?
----------------------------
508

3
1 9 . P lease l i s t all previous employment in chronological ord e r , starti n g with your �i r s t job ( include vacat ion and part-time work ) .
�ame o f employer Pos ition Length Part- Reason ( sp e c i fy if of time or leaving
vacation wor k ) employment full-time
20 . Which of your jobs did you like the best?
2 1 . Which of your jobs d i d you like the least?
509
for

4
22 . Describe your general state o f health ( inc lude details o f any
disabilities or maj o r ailments likely to a ffect employment )
23 . What kind o f organisations or clubs have you been a member of in
the last five year s ? ( state any o ffices held )
24 . How do you spend your free time? ( please tick G2J a p propriate box )
1 • mostly alone
2 . mostly wi th one or two others
3 . mostly in groups of three or more
25 . List the acti vities you do , o ther then university study :
a . At uni ver s i ty b . outside university
26 . Do you l i v e ( please tick appropriate box )
a . in a Hostel? 0 1 b . with your family? 02 c . i n a house/flat with others? 0 3 d . on your own? 04
21 . On the whol e how satisfied are you with your above living
circumstances? ( please circle the number which comes closest to how
you feel about your p resent living circumst ances ) .
comt>letely sat1sfied
2 3 4 5 6 7 completely dissat isfied
Dl 02 03
5 1 0
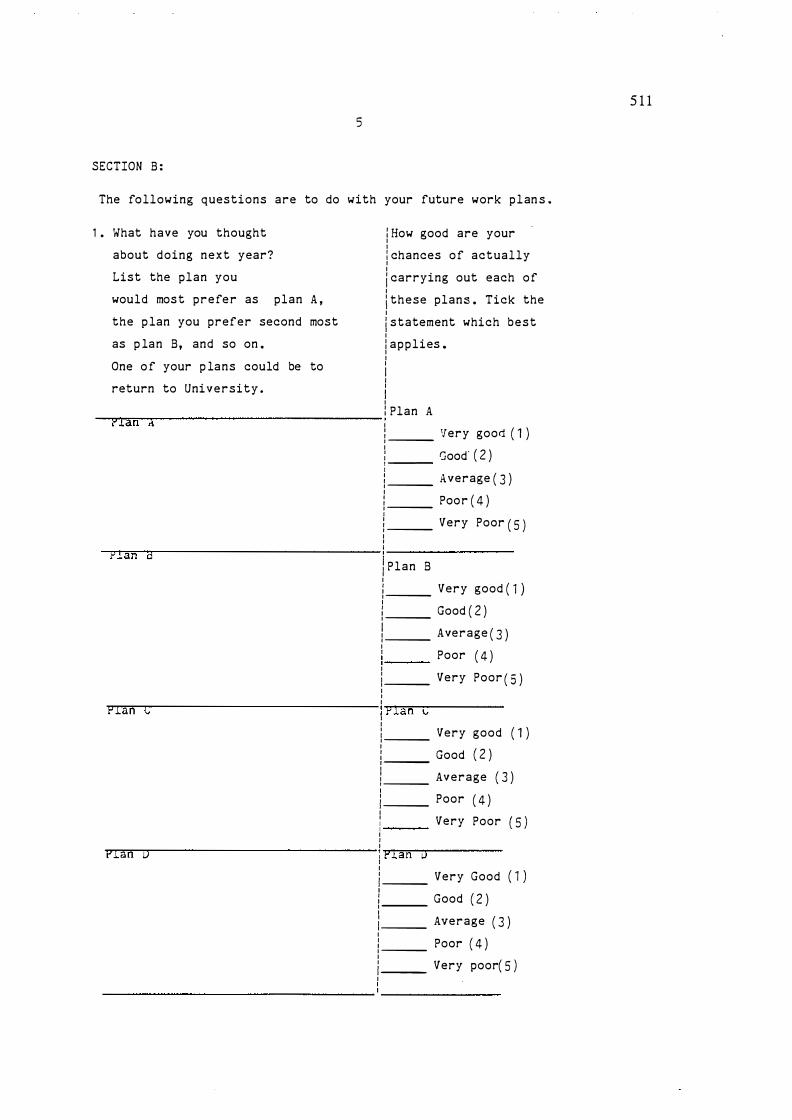
5
SECTION 8 :
The following questions are to do with your future work p l an s .
1 . What have you thought
about doing n e x t year?
List the plan you
would mos t prefe r as plan A ,
the p lan you prefer second most
as p lan 8, and so on .
One o f your p lans could be to
return to University .
I How good are your I I : chances o f actually I I j carrying out each o f I i these plans . Tick the I ! statement which best I I applies . I I I I I I I I I Plan A
--���---------------------------- · I J --- Very good ( 1 ) I : Good· ( 2 ) 1 ---1 J --- Average ( 3 ) I J --- Poor ( 4 ) I J --- Very Poor ( 5 ) I '
��a�n�o�--------------------------- 1----------------I Plan 8 I 1--- Very good ( 1 ) I 1 --- Good ( 2 ) I i --- Average ( 3 ) I 1 Poor ( 4 ) , __ _ I i--- Very Poor ( 5 ) I ' I ��.---------------------------- : �p�r�an��----------1 I 1 --- Very good ( 1 ) I I Good ( 2 ) � ---1 i--- Average ( 3 ) I l --- Poor ( 4 ) I 1 Very Poor ( 5 ) , __ _ I I I
���--------------------------- : �PTI�an�u�--------1 I l --- Very Good ( 1 ) I 1--- Good ( 2 ) I l--- Average ( 3 ) I 1 --- Poor ( 4 ) I l--- Very poor( 5 ) I I
---------------------------------- � ---------------
5 1 1
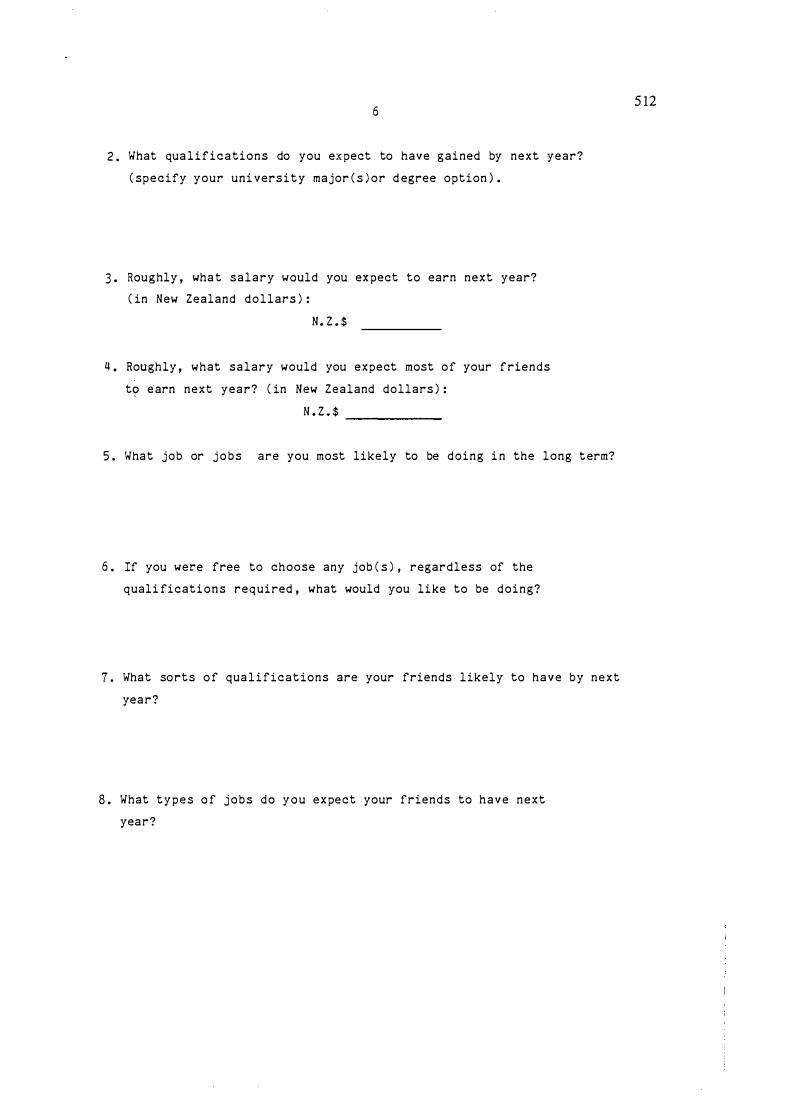
6
2 . What qua l i f i c a tions do you ex pect to have gained by next year?
( sp e c i fy your uni vers i t y major ( s ) or d egree option ) .
3 . Rou g hly , wha t salary would you ex pect to earn next year?
( in New Zealand dollars ) :
N. Z . $
4 . Roughly , what salary would you expect most o f your friends
t9 �arn next year? ( in New Zealand dollars ) :
N . Z . $ -------------
5 . What job or j o b s are you most likely to be doing i n the long t erm?
6 . If you were free to choose any job ( s ) , regardless of the
quali ficati o n s required , what would you like to be doing?
7 . What sorts o f qua l i ficat ions are your friends l ikely to have by next
yea r ?
8 . What t y p e s o f j o b s do y o u expect your friends to have next
year?
5 12

7 5 1 3
9 . ? le a s e respond t o the fo llowin g b y ratin g how confident you are
about each statemen t . Circle one of the numbers on the scale from 0
to 8 ( Circle 0 i f you have no con f idence at all about a statemen t ,
circle 8 i f you have complete confidence about it , otherwi s e c ircle the
appro p r i a t e numbe r i n between ) .
In my j o b next year , I am confident I can :
-use to
and develop my skills and abilities my s a t i s faction • • • • • . • . • • • . • . • � • • . . 0
-get a feeling o f accompli s hment . . . . . . . . 0
-tell people wha t to do , i f needed . . . . . . 0
-make d e c i s i o n s on my own , if necessary . 0
-activel y change aspects o f my j o b a n d t h e work environmen t , if needed • • • • 0
-keep myse l f busy • • • • • • • • • • • • • • • • • • • • • • • • 0
-follow s t andard wor k rules and procedures to my employer ' s sati s faction . O
-receive s a t i s factory pay • • • • • • • • • • • • • • • • 0
-change my v iews and a t t i tudes , i f required . . . . . . . . . . . . . . . . . . . . . . . . . . . . . . 0
-pe r fo rm repeti t i ve tasks when necessa r y . • • • • • . • • • • • • • • • • . • • . . • • . • • . • 0
-be promot a b l e . . . . . . . . . . . . . . . . . . . . . . . . . . 0
-be secure in my empl o yment • • • • • • • • • • • • • 0
-tolerate d i s s a t i s faction with my job for sometime before acting • • • • • • • • • . • . 0
-work alone , i f necessary • . . . . . . . . . . . . . . 0
-perform t asks requ i r i n g variety in procedures and methods • • • • • • • • • • • • • 0
-be well thou ght o f in the community because o f 1 t • • • • • • • • • • • • • • • • • • • • . • • • • 0
-tr-y to imorov e my work si tuation rathe!" than leavin g . . . . . . . . . . . . . . . . . . 0
I
2 3 4 5 6 7 8
2 3 4 5 6 7 8
2 3 4 5 6 7 8
2 3 4 5 6 7 8
2 3 4 5 6 7 8
2 3 4 5 6 7 8
2 3 4 5 6 7 8
2 3 4 5 6 7 8
2 3 4 5 6 7 8
2 3 4 5 6 7 8
2 3 4 5 6 7 8
2 3 4 5 6 7 8
2 3 4 5 6 7 8
2 3 4 5 6 7 8
2 3 4 5 6 7 8
2 3 4 5 6 7 8
2 3 4 5 6 7 8
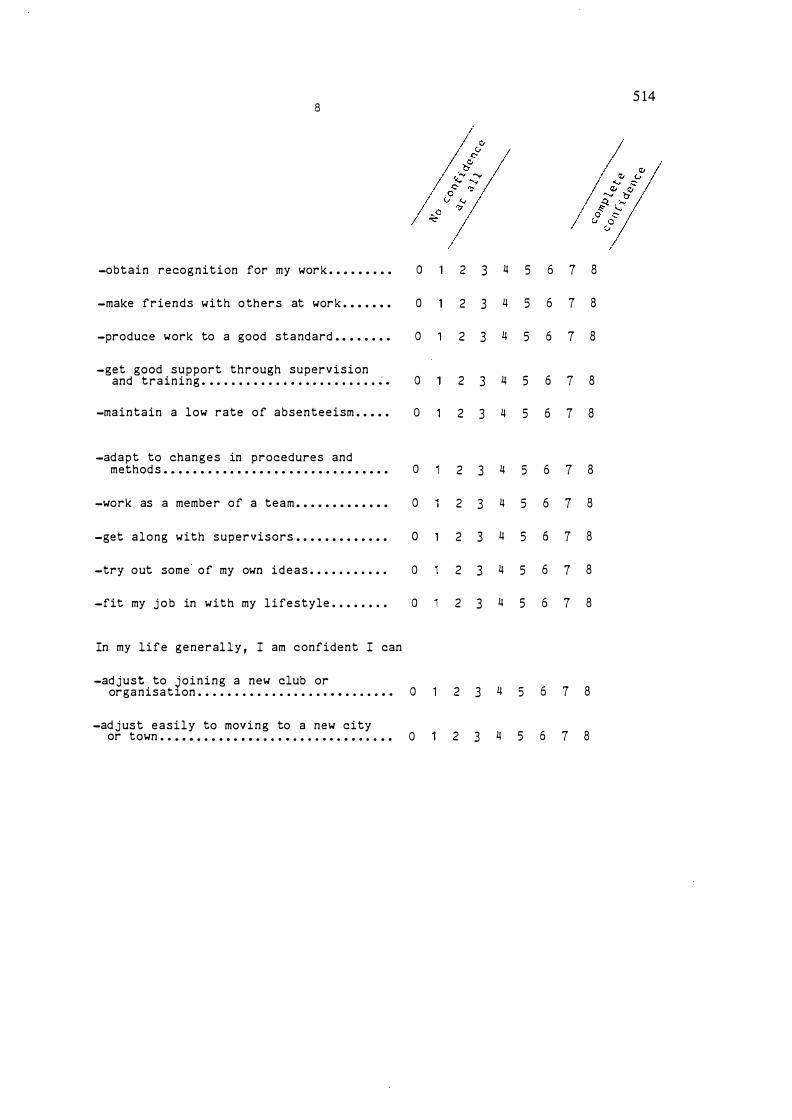
8
-obtain recognition for my work . . . . . . . . . 0
-make friends with o thers at work . . . . . . . 0
-produce work to a good standard . . . . . . . . 0
-get good support through supervision and training • • • • • • • • • • • • . • • • • • • . • • • • � . 0
-maintain a low rate o f absenteeism . . . . . 0
-adapt to chang e s in procedures and method s . . . . . . . . . . . . . . . . . . . . . . . . . . . . . . . 0
-work as a membe r o f a team . . . . . . . . . . . . . 0
-get along with supervisors . . . . . . . . . . . . . 0
-try out some o f my own i d e a s • • • • • • • • • • • 0
-fit my j o b in with my l i fe s tyle • • • • • • • • 0
In my life general l y , I am confident I can
-ad just to Joining a new club or organisat�on • • • • • . • • • • • • • • • • • . . . • • • • • . . 0
-ad j us t easily to mov i n g to a new city or town . . . . • . • . . • . . . • . • . . • . . . . . • . . . . • . . 0
5 14
2 3 4 5 6 7 8
2 3 4 5 6 7 8
2 3 4 5 6 7 8
2 3 4 5 6 7 8
2 3 4 5 6 7 8
2 3 4 5 6 7 8
2 3 4 5 6 7 8
2 3 4 5 6 7 8
2 3 4 5 6 7 8
2 3 4 5 6 7 8
2 3 4 5 6 7 8
2 3 4 5 6 7 8
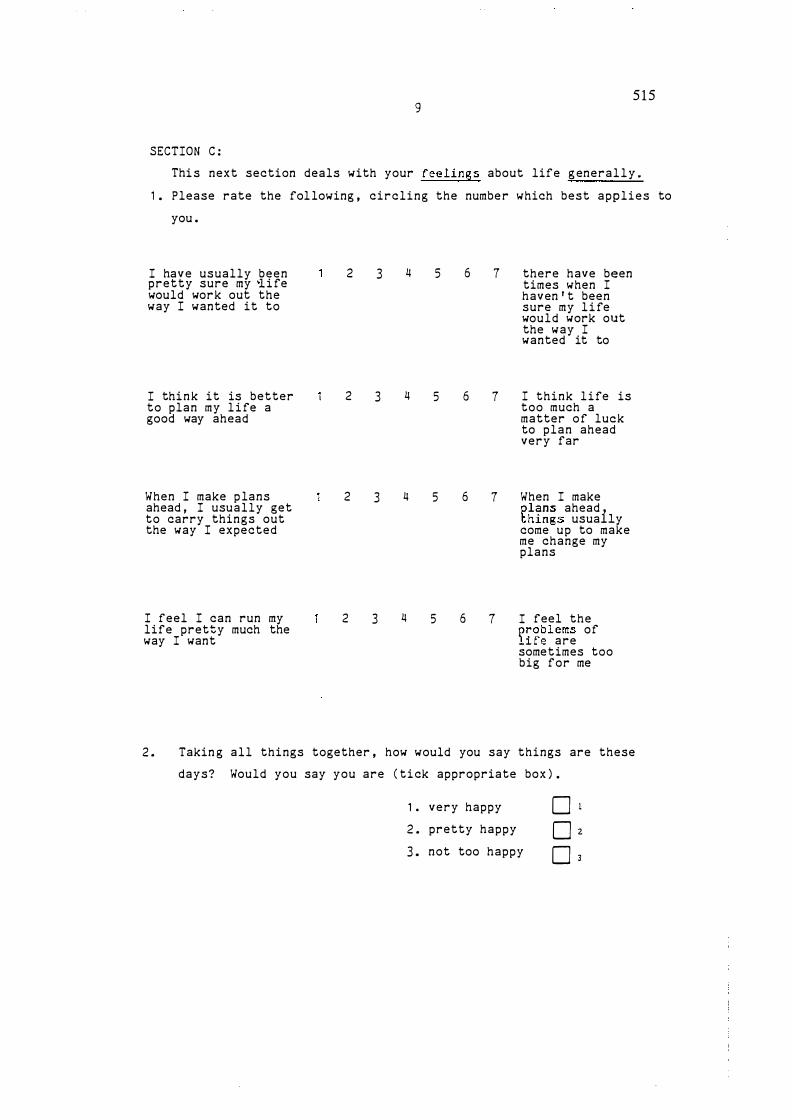
5 1 5 9
SECTION C :
Thi s next section deals with your feelings about life g eneral l y .
1 . Please rate the fol lowing , circling the numbe r which best a p p l i e s to
you .
I hav e usually been pretty sure my � i fe would work out the way I wanted it to
I thi n k it is better to plan my l i fe a good way ahead
When I make p lans ahead , I usually get to carry thin g s out the way I expected
I feel I can run my life pretty much the way I want
2 3 4 5 6 7 there have been times when I haven ' t been sure my l i fe would work out the way I wanted it to
2 3 4 5 6 7 I think l i fe is too much a matter o f luck to plan ahead very far
2 3 4 5 6 7 When I make plans ahead things usuahy come u p to make me change my plans
2 3 4 5 6 7 I feel the problems of l i fe are sometimes too big for me
2 . Takin g a l l things together , how would you say things are these
days? Would you say you are ( ti ck appropriate box ) .
1 • very happy [] 1
2 . pretty happy [] z
3 . not too happy [] 3
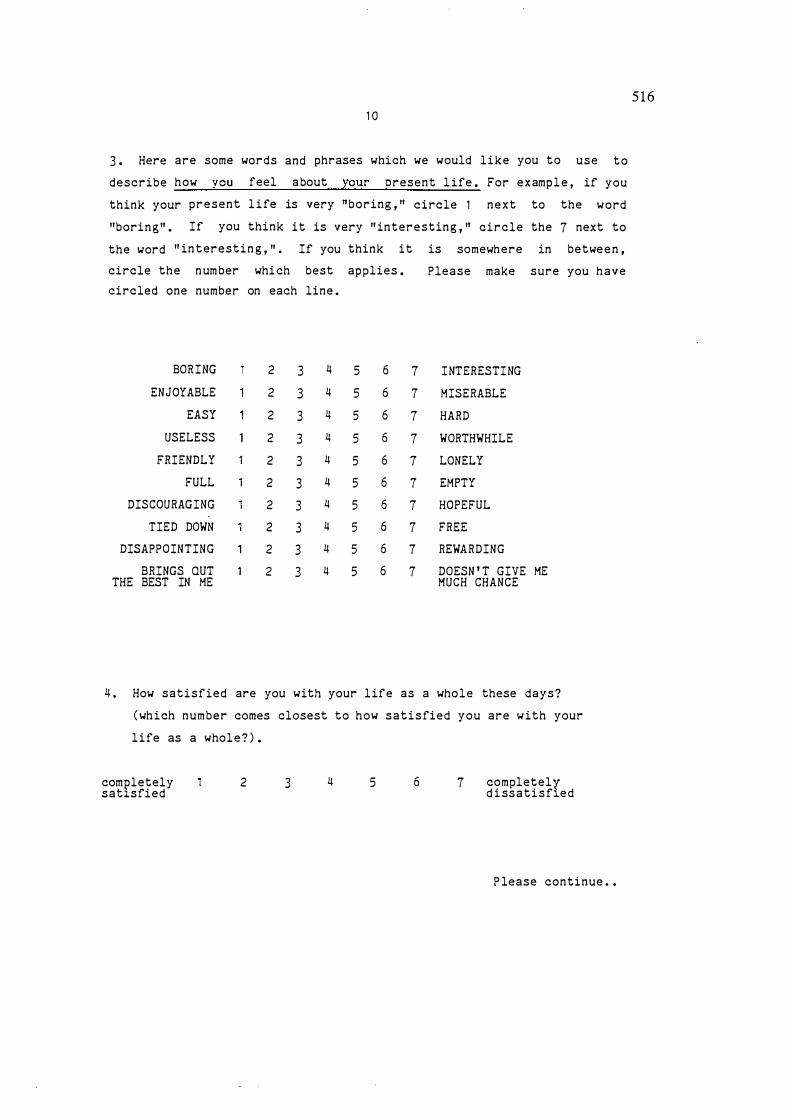
1 0
3 . Here are some words and phrases which we would like you to use to
describe how you feel a bout zour oresent l ife . For e x amp l e , if you
think your present l i fe is very "boring , " circle 1 n e x t to the word
"borin g " . I f you think it is very " interestin g , " circle the 7 next to
the word " in t erestin g , " . If you think it
circle the number whi ch best applies .
circled one number on each line .
BOR I NG 2 3 4 5 6 ENJOYABLE 2 3 4 5 6
EASY 2 3 4 5 6 USELESS 2 3 4 5 6
FRIENDLY 2 3 4 5 6 FULL 2 3 4 5 6
DISCOURAGING 2 3 4 5 6 TIED DOWN 2 3 4 5 6
DISAPPOINTING 2 3 4 5 6 BRINGS OUT 2 3 4 5 6
THE BEST IN ME
7 7 7 7 7 7 7 7 7 7
is somewhere in betwe e n ,
Please make sure you have
I NTERESTI NG
MISERABLE
HARD
WORTHWHILE
LONELY
EMPTY
HOPEFUL
FREE
REWARDING
DOESN ' T GIVE ME MUCH CHANCE
4 , How satisfied are you with your life as a whole these days?
( wh i ch number comes closest to how satisfied you are with your
life as a whol e ? ) .
completely satlsfied
2 3 4 5 6 7 completelr d i ss a t i s f e d
P lease continue • •
5 1 6

T RAN S I TI O N TO
E M PLOYM ENT
THIS I S YO U R S ECO N D QU ESTI O NNAI RE. THAN K Y O U VERY M UCH FOR RETURNING THE FI RST O N E .
TO MAKE ALL YO U R EFFO RTS WORTHW H I LE C O U LD YO U PLEAE C O MPLETE AND RETURN TH I S PART.
M O N ICA J S K I N N ER DEPARTM ENT OF PSYCH OLOGY MASSEY U N IVERSITY
517


i
TRANSITION TO EMPLOYMENT STUDY
PART TWO
Remember me from last year ? - Mon i ca . You completed
for my transition from university to work study .
part of that study .
a questionnaire
Here i s the second
THE IMPORTANCE OF COMPLETING THIS QUESTIONNAIRE
Your completing this quest ionnaire is crucial to the success of the
stud y . The result s should be of benefit to yoursel f and future
students in relation to occupational choice and employmen t . If you d i d
not return this second questionnaire it would be a pity to see your
efforts involved in completing and returning the first one wasted and
your chance to personally add to our knowledge in this area los t .
One o f the practical outcomes of this study wil l be a booklet for
students aimed at providing information and ass i s tance for the
transition from university and for early employment . Also the staff
and Departments at Massey whose students took part i n the study will
receive a summary of the o verall findings . Hopefully this will be o f
some u s e t o them i n whatever role they might play in preparing students
for employment .
PREVIOUS QUESTIONNAIRES RETURNED
I wish to thank you for agreeing to take part in the study . Last year
more returned their questionnaires than can usually be expect ed . This
will help improve the usefulness of the results for yoursel f , for
students in the future , and for my res earch which is of course so
dependent upon the return o f your questionnaires .
CONFIDENTIALITY OF YOUR ANSWERS
Remember that only mysel f and others d i rectly invol ved in analysing the
findings will see your questionnaire . Its con fidentiality will be
519

520
ii
maintained by your name not appearing on the questionnair e . No one
individual will be recognisable or identifiable through any published
results .
THIS QUESTIONNAIRE
Parts o f this questionnair e are the same as the previous one . I ask
you to please have patience in thi s regard as it will b e helpful to
make comparisons between this and last year .
According to what you are doing this year ( whether you are employed or
otherwise , or have returned to university , for example ) d ifferent
sections of the questionnaire will be applicable to you . The
questionnaire is lengthy if you need to complete all the section s . I
once again ask that you be pati ent with this . You may answer the
questionnaire in sections . You don ' t have to do it in one s ittin g .
AFTER YOU R QUESTIONNAIRE IS RETURNED
You may be asked along with others to agree to be
all the results will be analysed . After this
summary of the overall fin d ings as promised . Those
interviewed . Then
you will receive a
of you who have
asked for your individual results will receive them at thi s stag e .
Even i f you d o not complete thi s questionnaire please return it a s it
contains psychologi cal inst ruments which for both ethical and copyright
reasons must not be gene rall y availabl e . Your cooperation i n this
would once again be appreci ated .
I look forward to your completed questionnaire .
for i t s return is e nclosed .
A prepaid enveloppe
I can be contacted at the Psychology Department ( Private Bag , Massey
Uni versity or telephoned there ) should you have any comments or queries
about the stud y , or if you wish to discuss your individual results .
Thank you ,
Mon ica J . Skinner
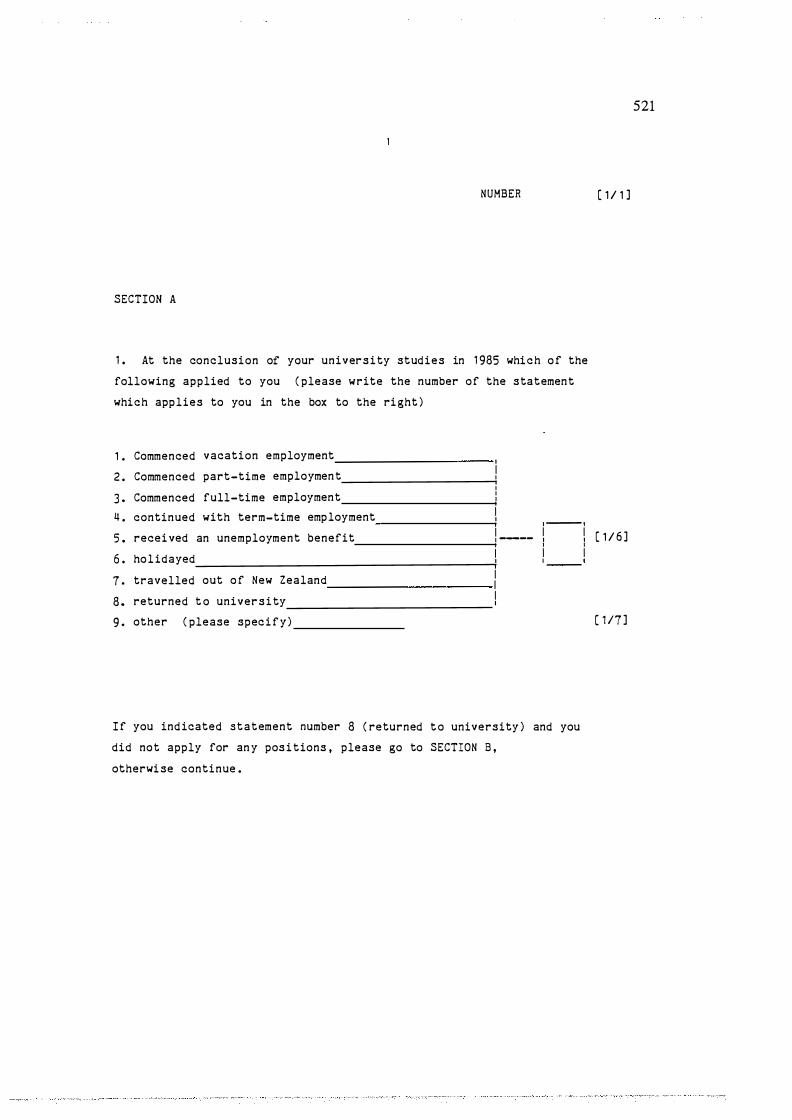
NUMBER
SECTION A
1 . At the conclusion of your univer s i ty studies in 1 985 whi c h o f the
following applied to you ( please write the number of the statement
which applies to you in the box to the ri ght )
1 . Commenced vacation employment '
2 . Commenced part-time employmen t I ' ' ' 3 . Commenced full-time employment ' ' ' 4 . continued with term-time employment I ' ' · --- ·
5 . recei ved an unemployment benefit I I � ---- ' ' '
6 . hol idayed I I ' I '
7 . travelled out o f New Zealand I I
8 . returned t o univer s i ty I I 9 . other ( please spec i f y )
I f you ind icated statement number 8 ( returned t o university ) and you
did not apply for an y pos i tions , please go to SECTION 8 , otherwi se continue .
I ' ' I I
521
[ 1 / 1 ]
[ 1 / 6 ]
[ 1 17 ]
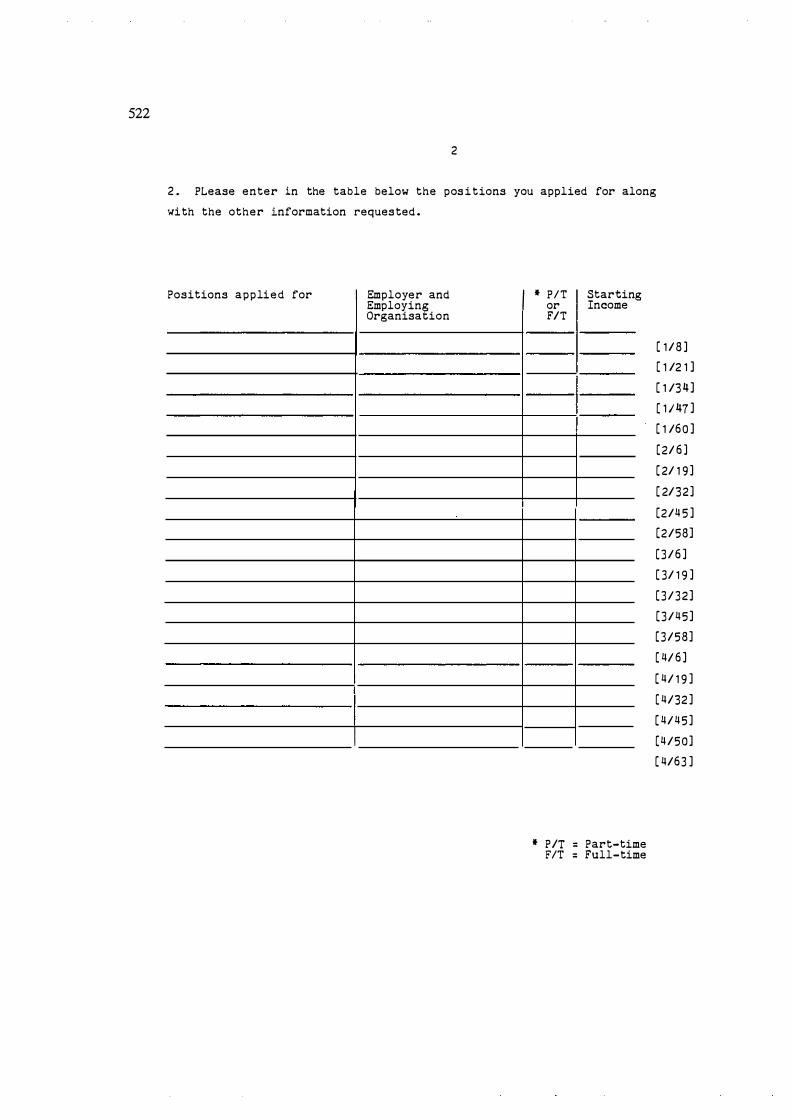
522
2
2 . PLease enter in the table below the pos i tions you applied for along
wi th the other information reques ted .
Positions appli e d for I Employer and I Employin� Organisa ion
I I I
* P/T Star tin or Income
g
F/T
I
I
* P/T = Part-time F/T = Full-time
[ 1 / 8 ]
[ 1 /2 1 ]
[ 1 /3 4 ]
[ 1 I 47 ]
[ 1 /6 0 ]
[ 2/ 6 ]
[ 2/ 1 9 ]
[ 2/32]
[2/4 5 ]
[2/58]
[ 3 / 6 ]
[ 3/ 1 9 ]
[ 3 / 3 2 ]
[ 3 / 4 5 ]
[3/58]
[ 4/ 6 ]
[ 4/ 1 9 ]
[ 4/32 ]
[ 4/ 4 5 ]
[4/50]
[ 4/63 ]

3 . Please complete the table below.
Positions offered I Employer and Emp loying Organisation
I
3
I l I
I * PIT I Starting I
I
or Income F/T
l
* P/T = Part-time F' IT = Full-time
[ 4/66 ]
[ 4179 ]
[ 5/ 6 ]
[ 5/ 1 9 ]
[ 5/32 ]
[ 5/45 ]
[ 5/ 58 ]
[ 5/6 1 ]
[ 6!7 4 ]
[ 6/6 ]
[ 6/ 1 9 ]
[6/32]
[ 6 /4 5 ]
[ 6 / 5 8 ]
[ 6 /6 1 ]
[ 6 !74 ]
[ 7/ 6 ]
[ 7/ 1 9 ]
[ 7/32 ]
[7/4 5 ]
[ 7/58 ]
523
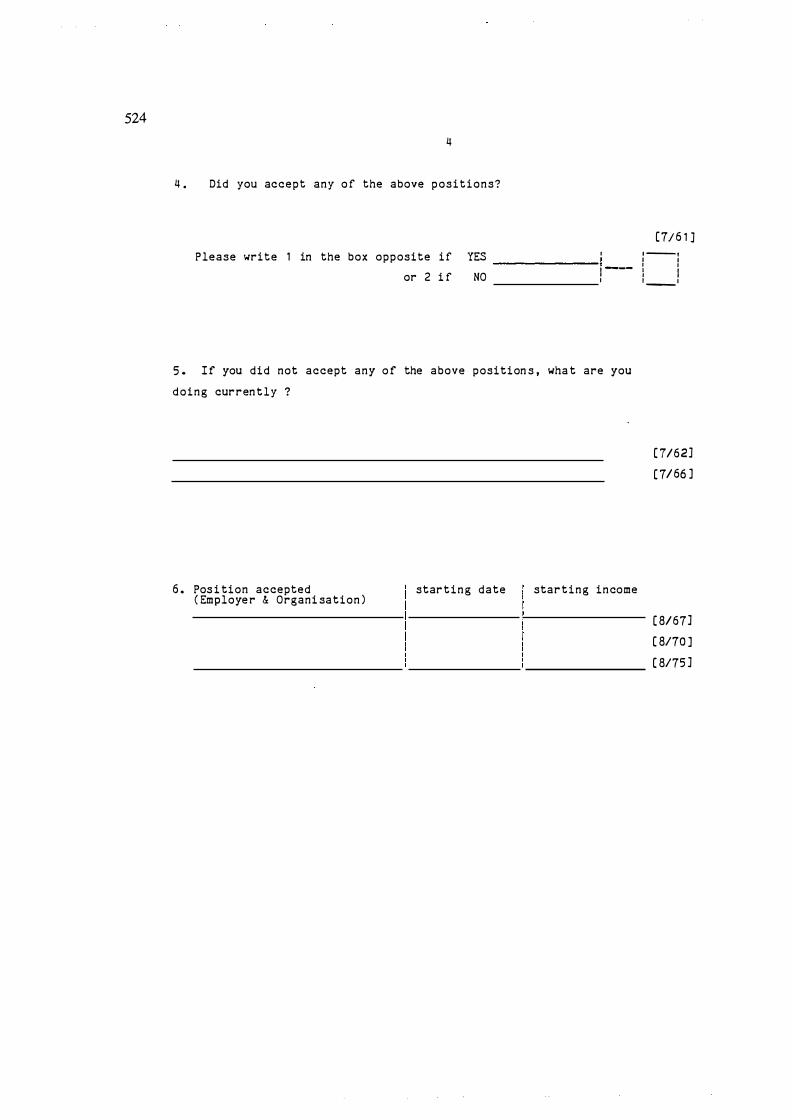
524
4
4 . Did you accept any o f the above positions?
[7/6 1 1 Please write 1 in the box opposite i f YES ' • ----·
------- 1 I I or 2 i f NO ! --- !
____ !
5 . I f you did not accept any o f the above position s , wha t are you
doing currently ?
6 . Pos i tion accepted ( Employe r & Organi sation )
star t i n g date starting income
[ 7/621
[ 7/ 66 ]
[ 8/671
[ 8170 ]
[ 8175 1

5
1 . If you have had more then one j o b since completing unive rsity in
1 985 , please list these in CHRONOLOGICAL order ( indicating e . g . if they
were par t- time or full-time ) finishing with your current position.
Please no te if a particular posi tion was vacation employment .
Posi tions I Employer ( jo b titles ) I and
Employing _ Organ�sat�on I I
I
I
I * P / T I length I reason/s or of for F/T employ- leaving
ment I I l
I I I
I
I I I I l I
* P / T = Part- time F/T = Full- time
[ 8 / 6 ]
[ 8/20 ]
[ 8/ 3 4 ]
[ 8/48 ]
[ 8/62 ]
[ 8176 ]
[ 9/ 6 ]
[ 9/20 ]
[ 9/ 3 4 ]
[ 9/48 ]
[ 9/62 ]
[ 91 7 6 ]
[ 1 0/6 ]
[ 1 0/20 ]
[ 1 0/ 3 4 )
[ 1 0/48 ]
[ 1 0/62 ]
[ 1 0/7 6 ]
[ 1 1 / 6 ]
[ 1 1 /20 ]
[ 1 1 /3 4 ]
525
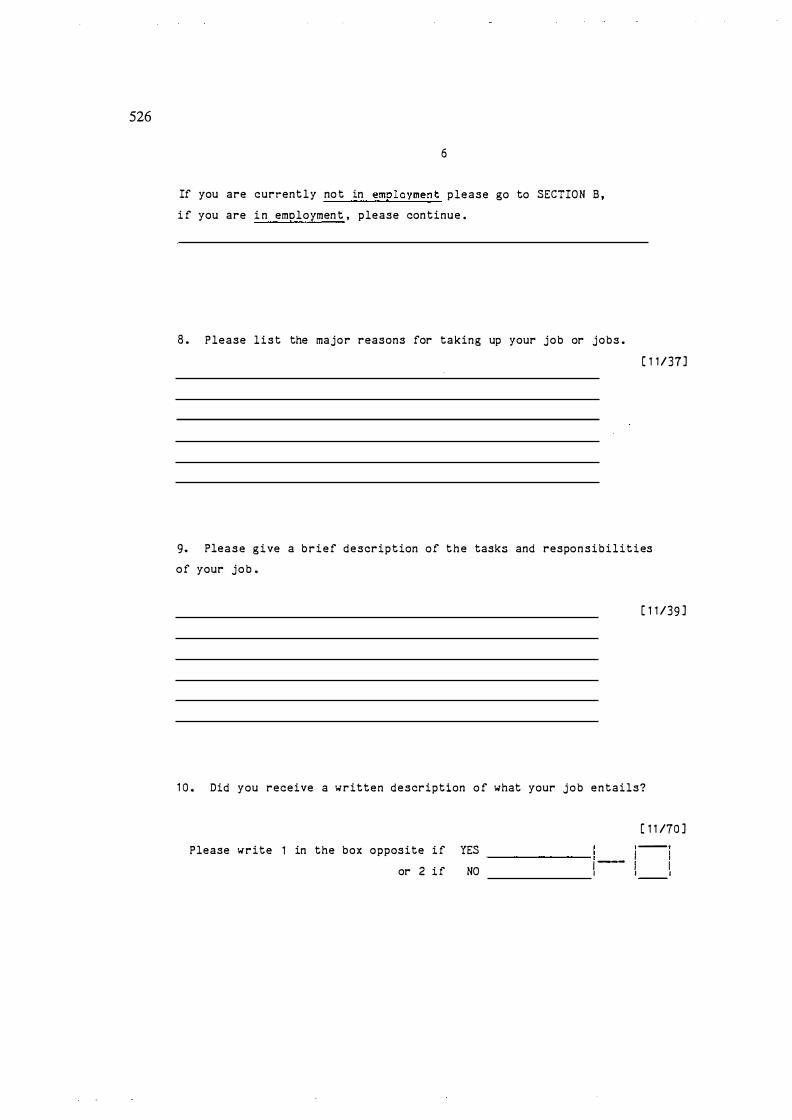
526
6
If you are currently no t in employment please go to SECTION B ,
i f you are i n emoloymen t , please continue .
8 . Please l i s t the major reasons for taking up your job or jobs .
( 1 1 / 3 7 ]
9 . Plea s e g i ve a b r i e f description o f t h e tasks and responsibilities
o f your j o b .
( 1 1 /39 ]
1 0 . Did you receive a written description o f what your j o b entails?
( 1 1 /70 ]
Please write 1 in the box opposite i f YES ------- ! �--� � --- I I or 2 i f NO 1 1 1

7
1 1 . Please respond to the following by rating how con fident you are
about each statemen t . Circle one o f the numbers on the scale from 0
to 8 ( Ci rcle 0 if you have no con fidence at all about a statement ,
circle 8 if you have complete con fidence about i t , otherwis e circle the
appropriate number in between ) .
In my job ! am con fident ! :
-use to
and d evelop my ski l l s and a b i l ities my satis faction • • • • • • . • • . • • • • • . • • • . • 0
-get a feeling o f accomplishment . . . . . . . . . 0
-tell people what to do i f needed • • • • • • • • 0
-make decisions on my own , i f necessary • • 0
-actively change asoects of my job and the work environment , if needed • • • • 0
-keep mys e l f busy • • • • • • . • • • • • • • • • • • • • • • • • 0
-follow standard wor k rules and procedures to my employer ' s satisfaction • • • • • • • • • • 0
-receive satisfactory pay . . . . . . . . . . . . . . . 0
-change my views and attitudes , i f required . . . . . . . . . . . . . . . . . . . . . . . . . . . . . . 0
-perform repetitive tasks when necessa r y . • • • • • • • • • • • • • • . • • • • • • • • • • • • • 0
-am promotable . . . . . . . . . . . . . . . . . . . . . . . . . . 0
-am secure in my employment . . . . . . . . . . . . . 0
-tolerate d i ssatisfaction with my job for sometime before acti n g . . . . . . . . . . . . 0
-work alone , i f necessary • • • • • • • • • • • • • • • 0
2 3 5 6 7 8 ( 1 3/ 6 ]
2 3 4 5 6 7 8
2 3 4 5 6 7 8
2 3 4 5 6 7 8
2 3 4 5 6 7 8
2 3 4 5 6 7 8
2 3 4 5 6 7 8
2 3 4 5 6 7 8
2 3 4 5 6 7 8
2 3 4 5 6 7 8
2 3 4 5 6 7 8
2 3 4 5 6 7 8
2 3 4 5 6 7 8
2 3 4 5 6 7 8 [ 1 3/ 1 9 ]
527

528
-perform tasks requ�rlng variety in procedures and methods • • • • • • • • • • • • •
-am well thought o f in the community because of my job • • • • • • • • • • • • • • • • • • • • •
-try to improve my work situation rather than leaving • • • • • • • • • • • • • • • • • • •
-obtain recogni t ion for my work • • • • • • • • •
-make fri ends with others at wor k • • • • • • •
-produce work to a good standard • • • • • • • •
-get good support through supervision and training • • • • • • • • . • • • • • • • • • • . . • • • . •
-maintain a low rate of absenteeism • • • • •
-adapt to changes in procedures and method s • • • • • • • • • • • • • • • • • • • • • • • • • • • • • • •
-can work as a member of a team • • . • . • • • •
-get alon g with superv isors • • • . • • . • • • . • •
-try out some of my own ideas • • • . • . . • • . •
-fit my job in with my lifestyle • • • • • • • •
8 I I I / IQ I Cl I I IQ� / /�"'�/ / o� /
I Cl "-> I I t!r I /�0 / I I
I I I I I
0
0
0
0
0
0
0
0
0
0
0
0
0
2
2
2
2
2
2
2
2
2
2
2
2
2
3
3
3
3
3
3
3
3
3
3
3
3
3
1 2 . In my l i fe generally , I am confident I
-ad just to toining a new club or organisat on • • • • • • • • • • • • • . • • • • • • • . • • • • • 0 2 3
-adjust easily to moving to a new city or town • . . . . . . . . . . . . . . • . . . . • . . . . . • • . . . . 0 2 3
I I
4 5 6 7
4 5 6 7
4 5 6 7
4 5 6 7
4 5 6 7
4 5 6 7
4 5 6 7
4 5 6 7
4 5 6 7
4 5 6 7
4 5 6 7
4 5 6 7
4 5 6 7
4 5 6 7
4 5 6 7
I I I I I I I I I I I I I I IQ I I IQ Cl I / ;;' ,§' /
/ �,_,� / I §;' I / c_.O
c_.O� / / /
I /
8 [ 1 3/20 ]
8
8
8
8
8
8
8
8
8
8
8
8 c 1 3/ 32 ]
[ 1 3/ 34 ]
8
[ 1 3/ 3 5 ]
8
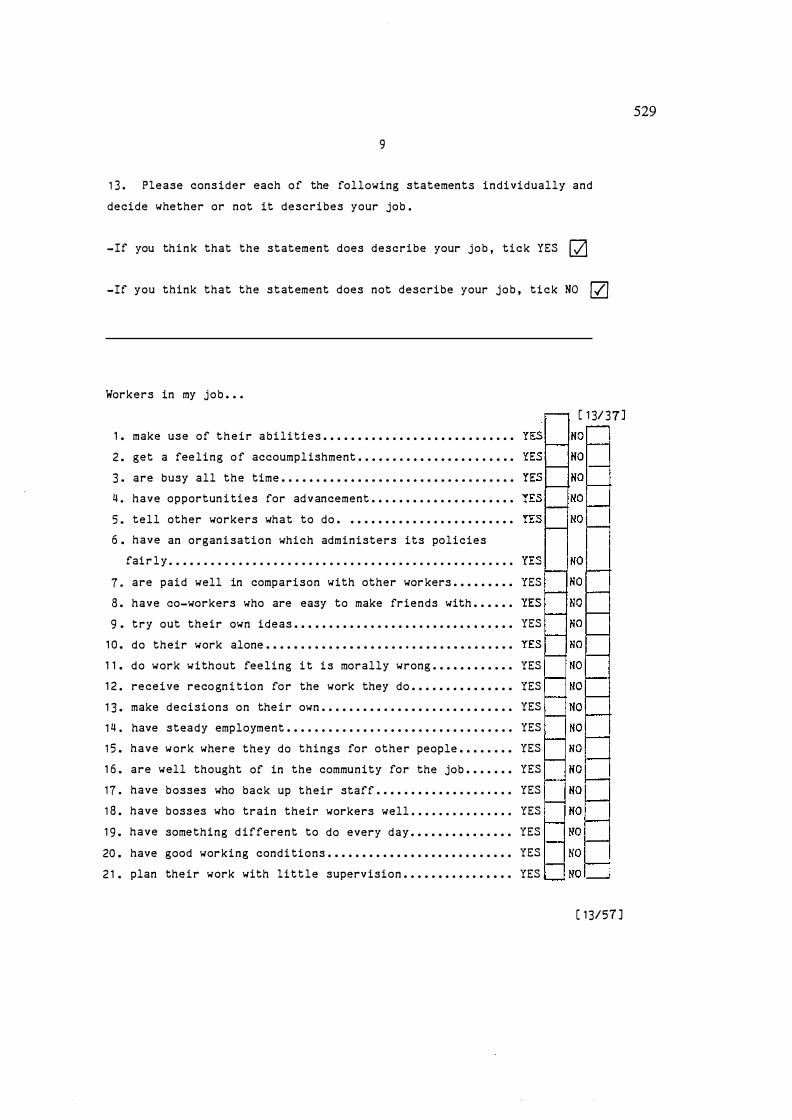
9
1 3 . ?lease cons ider each o f the following statements individually and
decide whether or not it describes your job .
-If you think that the statement does describe your job , tick YES G2j
-If you think that the statement does not describe your job , tick NO G2J
Workers in my job • • •
[ 1 3/ 3 7 ]
1 . make use of t h e i r abilities • • • • • • • • • • • • • • • • • • • • • • • • • • • •
2 . get a feeling o f accoumpl ishment • • • • • • • • • • • • • • • • • • • • • • •
3 . are busy all the time • • • • • • • • • • • • • • • • • • • • • • • • • • • • • • • • • •
4 . have opportun i ti e s for advancement • • • • • • • • • • • • • • • • • • • • •
5 . tell other workers what to do • • • • • • • • • • • • • • • • • • • • • • • • •
6 . have an organi sation which administers its policies
fai r l y . . . . . . . . . . . . . . . . . . . . . . . . . . . . . . . . . . . . . . . . . . . . . . . . . .
7 . are paid well in comparison with other wor kers • • • • • • • • • YES
8 . have eo-workers who are easy to make friends with • • • • • •
9 . try out their own ideas • • • • • • • • • • • • • • • • • • • • • • • • • • • • • • • • YES
1 0 . do their work alone • • • • • • • • • • • • • • • • • • • • . • • • • • • • • • • • • • • •
1 1 . do work without feeling i t i s morally wrong • • • • • • • • • • • • YES
1 2 . receive reco gn i t ion for the work they do • • • • • • • • • • • • • • • YES
1 3 . make decisions on the i r own • • • • • • • • • • • • • • • • • • • • • • • • • • • • YES
1 4 . have steady employment • • • • • • • • • • • • • . • • • • • • • • • • • • • • • • • • • YES
1 5 . have work where they do things for other people • • • • • • • • YES
1 6 . are well thought of in the community for the job • • • • • • • YES
1 7 . have bosses who back up their staff • • • • • • • • • • • • • • • • . • • • YES
1 8 . have boss es who train their workers well . . . . . . . . . . . . . . . YES
1 9 . have something d ifferent to do every day • • • • • • • • • • • • • • • YES
20 . have good working condi tions • • • • • • • • • • • • • • • • • • • • • • • • • • • YES
2 1 . plan the i r work with little supervision • • • • • • • • • • • • • • • • YES
[ 1 3/57 ]
529
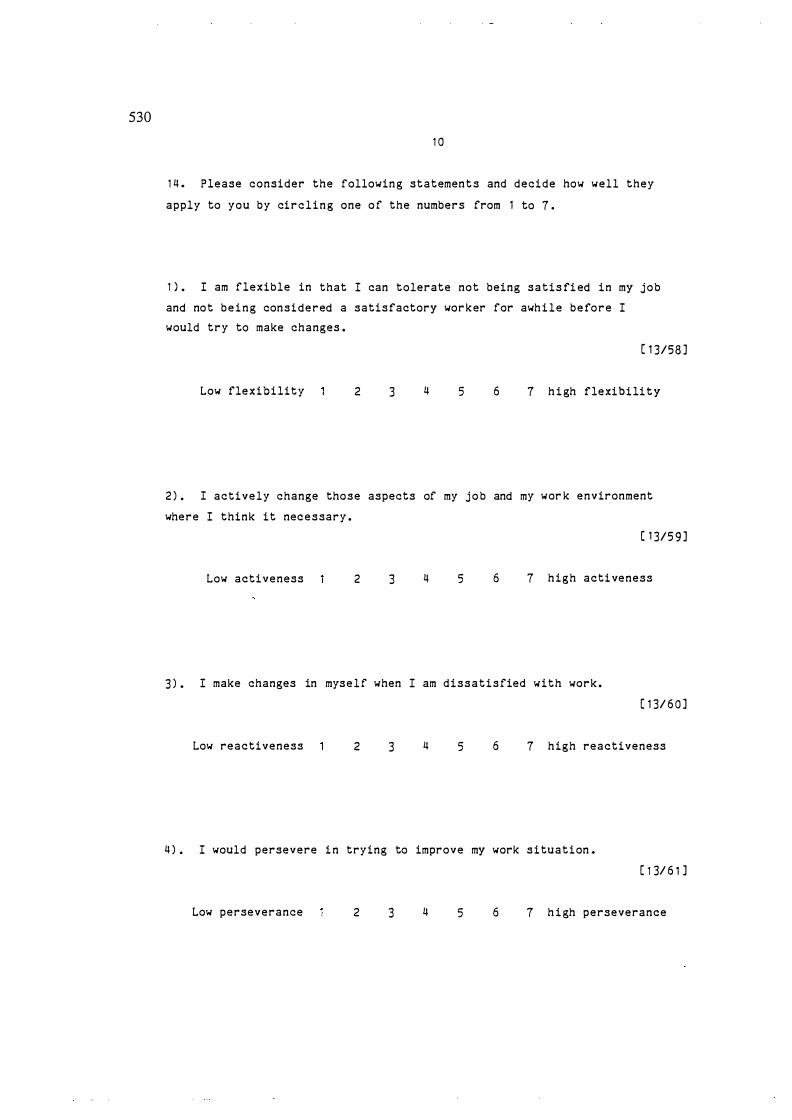
530
1 0
1 4 . Please consider the followin g statement s and decide how well they
apply to you by cir c l i n g one o f the numbers from 1 to 7 .
1 ) . I am flexible in that I can tolerate not being satis fi ed in my j o b
and not b e i n g considered a satisfactory worker for awh i l e b e fo r e I
would try to make changes .
[ 1 3/58 ]
Low flexibility 2 3 4 5 6 7 h i gh flexibili t y
2 ) . I actively change those aspects of my j o b and my wor k environment
where I think it nec e s sary .
[ 1 3/5 9 ]
Low activeness 2 3 4 5 6 7 high acti veness
3 ) . I make changes in myse l f when I am d i s s a t i s fied with work .
[ 1 3/ 6 0 ]
Low reactiveness 2 3 4 5 6 7 high reactiveness
4 ) . I would persevere i n trying to improve my work s i tuation .
[ 1 3/ 6 1 ]
Low perseverance 2 3 4 5 6 7 h i gh perseverance
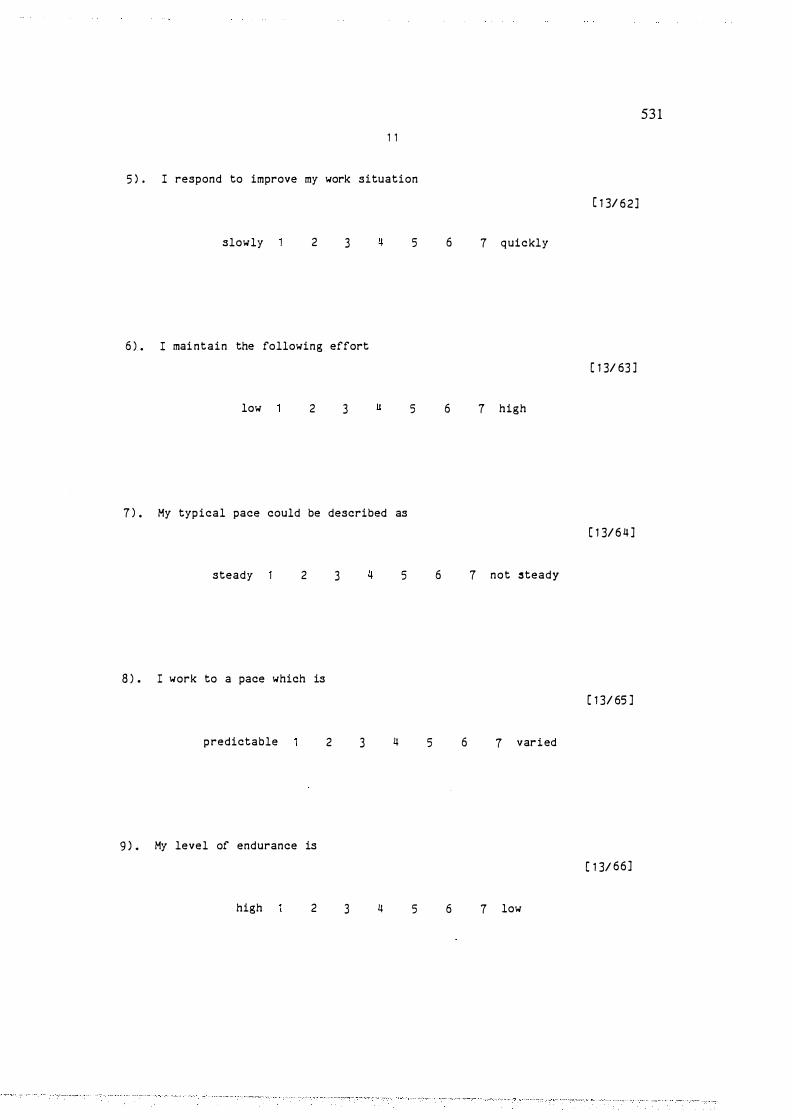
1 1
5 ) . I respond to improve my work situation
slowly 2 3
6 ) . I mai ntain the following effort
low 2 3
7 ) . My typical pace could be described as
steady 2
8 ) . I work to a pace which is
predictable
9 ) . My level of endurance is
high 2
3 5
2 3 4
3 4
5
5
53 1
[ 1 3/ 6 2 ]
6 7 quickly
[ 1 3/ 63 ]
6 7 high
[ 1 3/ 6 4 ]
6 7 not �teady
[ 1 3/ 65 ]
5 6 7 var i ed
[ 1 3/ 6 6 ]
5 6 7 low

532
1 2
1 5 . How attached to your job would you rate yourself on a scale o f 1
to 7? ( please wri t e the appropriate number in the box to the r i ght ) .
Completely
at tached
2 3 4 5 6 7 not at all
attached
( 1 3/ 67 ] · -- · I I , __ ,
1 6 . How long to you think people in your job should remai n in your job?
( please wri te the numb e r of years in the box to the right ) .
1 7 . How long do you expect to remain in your current job?
( 1 3/68 ] · -- · I I I I
c 1 3/ 69 ]
1 8 . Approxi mately how many d ays have you been absent from your presen t
j o b ? ( please write number in the b o x to the right ) .
( 1 3170 ] ·--· I I I I

20
P l ease complete SECTION a only if you have returned to university
ful l -time , otherwise please continue from SECTION C .
SECTION B
1 . What Degree or Diploma course you have enrolled i n for 1 986?
2. What were your reasons for returning to university?
[ 1 5/3 4 ]
[ 1 5/ 3 8 ]
3 . L i s t the occupations you expect to b e interested i n upon completing
your stud i es .
PLEASE CONTINUE ( to section C ) • • • . • • • •
[ 1 5/ 4 0 ]
[ 1 5/44 ]
[ 1 5 / 4 8 ]
( 1 5 / 5 2 ]
( 1 5/ 5 6 ]
533

534
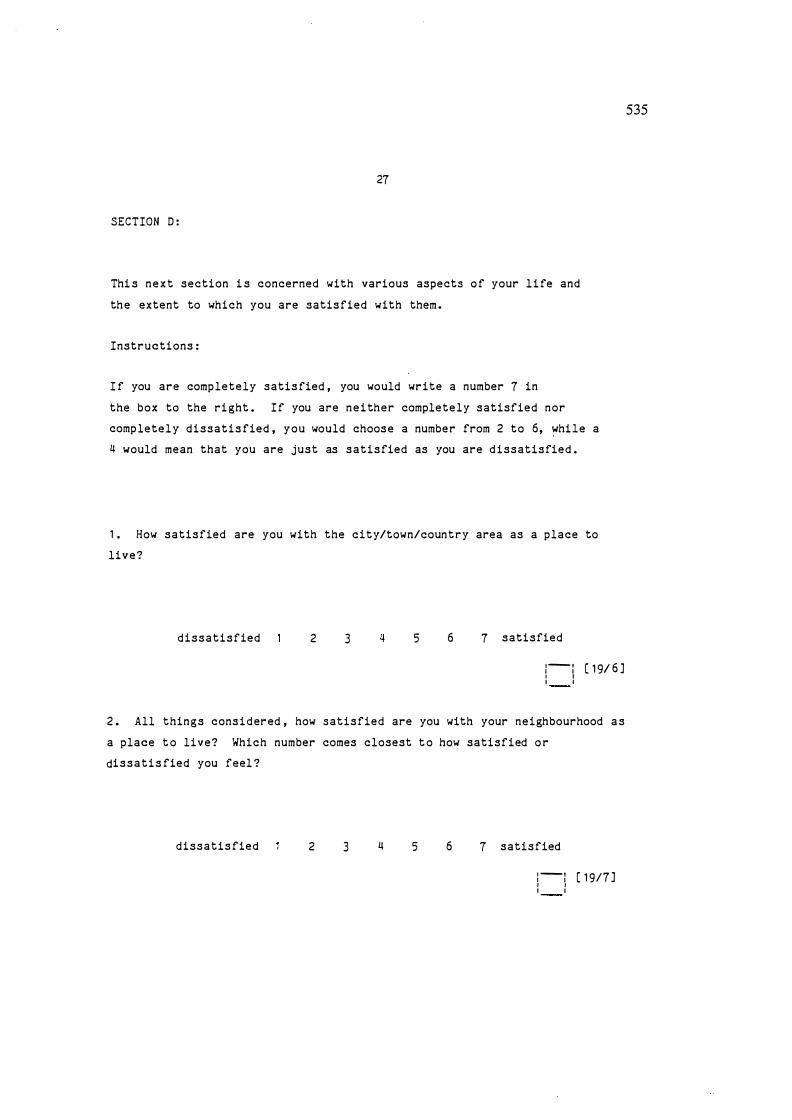
27
SECTION D :
Thi s n e x t section i s concerned with various aspects o f your l i fe and
the extent to which you are satisfied with them .
Instructions :
I f you are completely satis fied , you would write a number 7 in
the box to the ri ght . I f you are n e i ther completely satisfied nor
completel y dissatis fied , you would choos e a number from 2 to 6, while a
4 would mean that you are just as satisfied as you are d issatisfied .
1 . How satisfied are you with the city/town/country area as a place to
live?
dissatisfied 2 3 5 6 7 satisfied
� -- 1 I I I I I I [ 1 9/ 6 ]
2 . All thin g s cons i d ered , how satisfied are you with your neighbourhood a s
a place t o live? Which number comes closest t o how satisfied o r
di s s a t i s fied you feel ?
dissatis fied 2 3 4 5 6 7 satisfied
1 -- 1 I I I I I I [ 1 917 ]
535
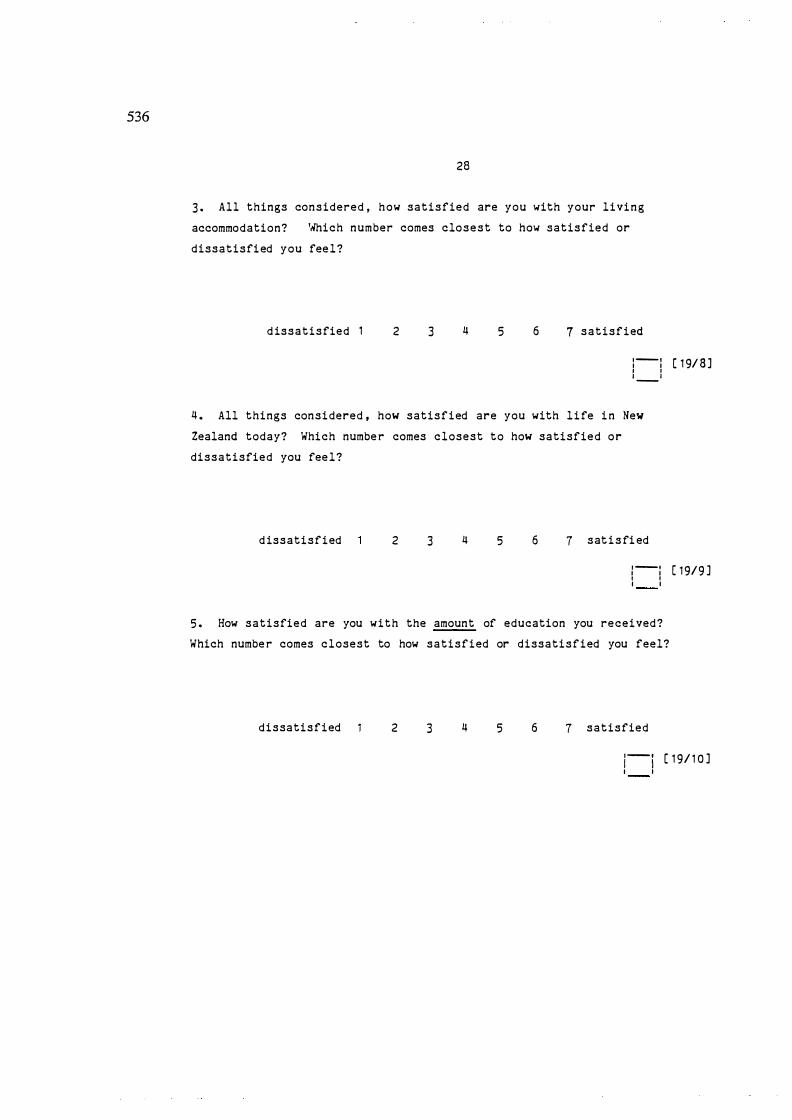
536
28
3 . All things considered , how satisfied are you with your livi n g
accommodation? 'Nhich number comes clo s e s t to how satisfied or
dissatisfi ed you fee l ?
d issatisfied 1 2 3 4 5 6 7 satisfied
1 -- 1 I I I I 1 __ 1
4 . All things considered , how satisfied are you with l i fe i n New
Zealand today? Which numbe r comes closest to how satisfied o r
dissatisfied you fee l ?
d issatisfied 2 3 4 5 6 7 sat i s fi ed
1 -- 1 I I I I I I
5 . How satisfied are you with the amount of education you received?
Which numbe r comes closest to how satisfied or dissatisfied you feel?
dissatisfied 2 3 4 5 6 7 satisfied
( 1 9/ 8 ]
[ 1 9/9 ]
i-i ( 1 9/ 1 0 ] I I

29
6. All things considered , how useful do you think your education was
for you personally? Which number comes closest to how satisfied or
dissatisfied you fee l ?
dissatisfied 2 3 4 5 6 7 sati s fied
537
·--· I I ( 1 9 / 1 1 ] I I , __ 1
1 . All things considered , how satisfied are you with your job? Whi ch
numbe r comes closest to how satisfied or dissatisfied you feel ?
d issatisfied 2 3 4 5 6 7 satis fied
,- , ( 1 9 / 1 2 ] I I
8 . Overall , how satisfied are you with the ways you spend your free time?
Which number comes closest to how satisfied or dissatisfied you feel?
dissatisfied 2 3 4 5 6 7 satisfied
,-; ( 1 9/ 1 3 ] I I
9 . Of course mos t people get sick now and then , but overall how
satisfied are you with your own health? Which number comes closest to
how satisfied or dissati sfied you fee l ?
d i ssatisfied 2 3 4 5 6 7 satisfied
I- I [ 1 9/ 1 4 ] I I 1 __ 1
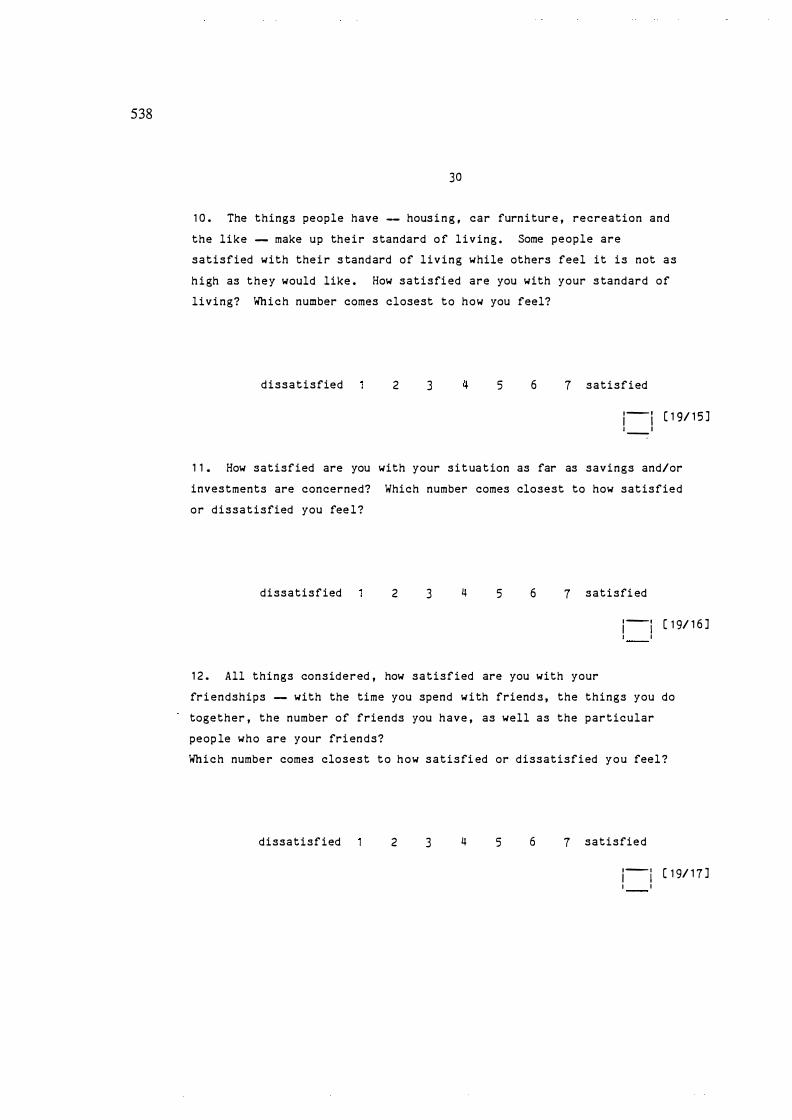
538
30
1 0 . The things people have -- hous i n g , car furnitur e , recreation and
the like -- make up the i r standard o f l i v ing . Some people are
satisfied with thei r s tandard of living while others feel it is not as
h i gh as they would like . How satisfi ed are you with your s tandard of
living? Which number comes closest to how you feel?
dissatisfied 2 3 5 6 7 satisfied
,-, [ 1 9/ 1 5 ] 1 __ 1
1 1 . How satisfied are you with your s i t ua t ion as far as savings and/or
investments are concerned? Which number comes closest to how satisfied
or dissatisfied you fee l ?
dissatisfied 2 3 4 5 6 7 satisfi ed
,-, [ 1 9/ 1 6 ] I I
1 2 . All things considered , how satisfied are you with your
fri endships -- with the time you spend w i th friend s , the things you do
together , the number of friends you have , as well as the particular
peop le who are your fri ends?
Which numbe r comes closest to how satisfi ed or dissatisfied you feel ?
dissatisfied 2 3 4 5 6 7 satisfied
,-1 [ 1 9/ 1 7 ] I I
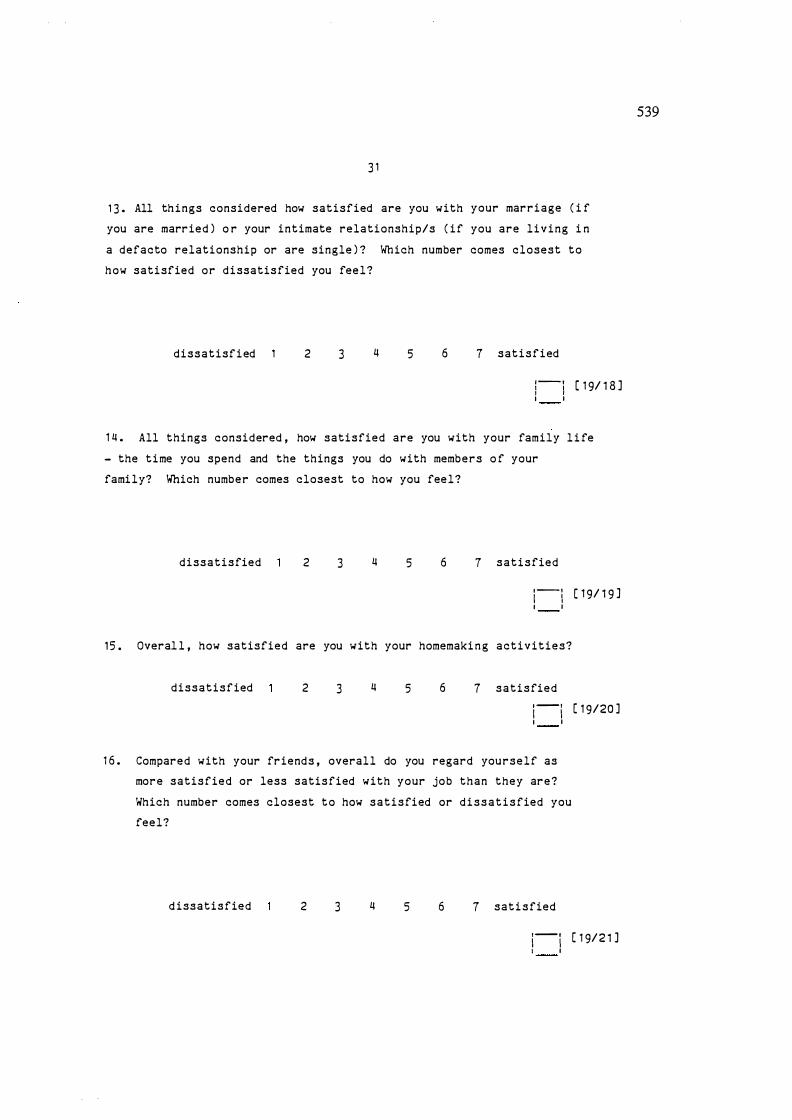
3 1
1 3 . All things considered how satisfied are you with your marriage ( i f
you are married ) o r your intimate relationship/s ( if you are living i n
a defacto relationship or are single ) ? Which number comes closest to
how satisfied or dissatisfied you feel?
dissatisf i ed 2 3 4 5 6 7 satisfied
!-i ( 1 9/ 1 8 ] I I
1 4 . All things considered , how satisfied are you with your family l i fe
- the time you spend and the things you do with members o f your
family? Which number comes closest to how you feel?
dissatisfied 2 3 4 5 6 7 satisfied
,- ; [ 1 9/ 1 9 ] I I
1 5 . Overal l , how satisfied are you with your homemaki n g activities?
dissatisfied 2 3 4 5 6 7 satisfied
,-i [ 1 9/20 ] I I
1 6 . Compared with your friends , overall do you regard yourself as
more satisfied or less satisfied with your job than they are?
Which number comes closest to how satisfied or d i s s a t i s fied you
feel?
d issatisfied 2 3 4 5 6 7 sati sfied
i-l [ 1 9/2 1 ] I I
539

540
32
1 7 . Please consider how important each o f the following aspects o f
your l ife are t o you , giving them a number from 1 t o 7 with
meani n g very important and 7 meani n g not at all i mportant .
( please write the number you choose i n the box to the r i gh t )
1 • The kind o f city/town / or countr y area you l i ve i n
ExtremelK 2 3 4 5 6 7 not a t all import an important
� -- · I I I I
2 . The kind o f neighbourhood you live in
Extremelr 2 3 4 5 6 7 not at all importan important
� -- · I I I I
3 . Your living accommodation
ExtremelK 2 3 4 5 6 7 not at all import an important
� -- · I I I I I 4 . The quali ty o f l i fe in New Zealand
Extremely 2 3 4 5 6 7 not at all important important
� -- 1 I I I I
5 . The amount of education you rece i v e
Extremely 2 3 4 5 6 7 not at all important important
� -- 1 I I I I I I
[ 1 9/ 22 ]
c 1 9/ 23 ]
[ 1 9/24 ]
[ 1 9/25 ]
[ 1 9/26 ]
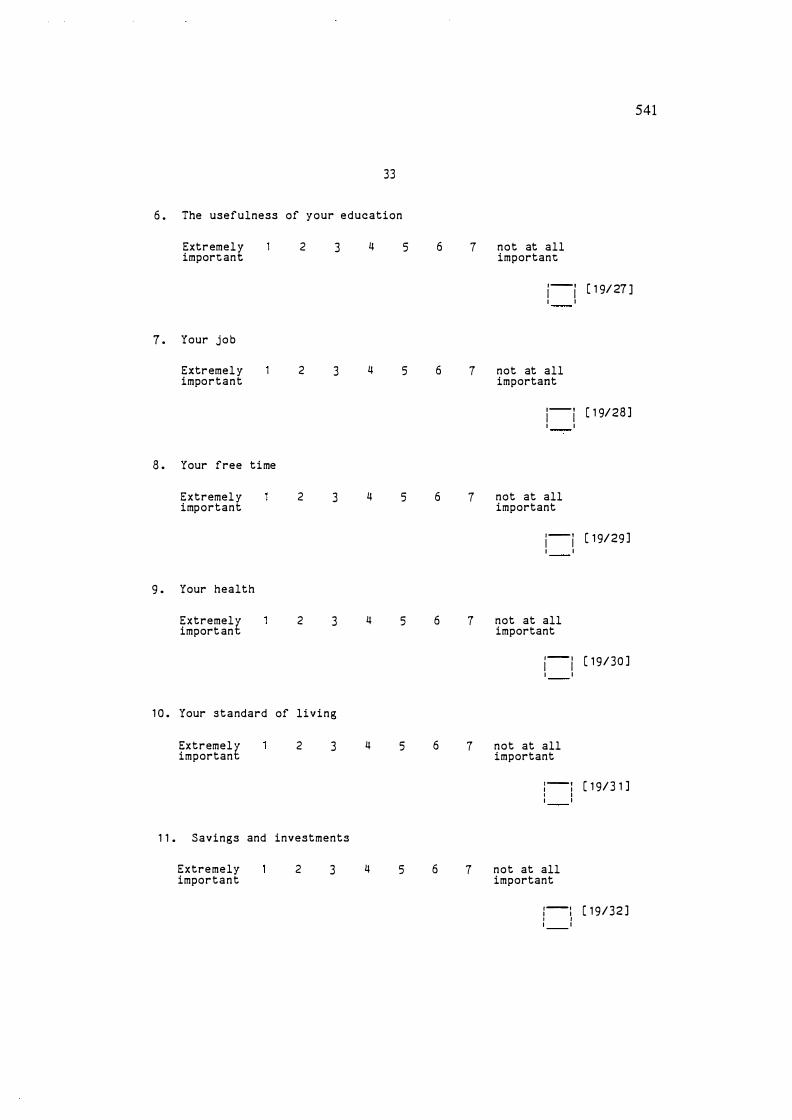
541
33
6 . The usefulness of your education
Extremel£ 2 3 4 5 6 7 not at all import an important
�--· [ 1 9/ 27 ] I I I I
7 . Your job
Extremel y 2 3 4 5 6 7 not at all important important
�--· [ 1 9/28 ] I I I I
8 . Your free time
Extremel y 2 3 4 5 6 7 not at all important important
1--· [ 1 9/29 ] I I I I
9 . Your health
Extremelf 2 3 4 5 6 7 not at all import an important
�-- 1 [ 1 9/30 ] I I I I
1 0 . Your standard of living
Extremelf 2 3 4 5 6 7 not at all importan important
� -- · [ 1 9/3 1 ] I I I I I I
1 1 . Savings and investments
Extremely 2 3 4 5 6 7 not at all important important
�--1 [ 1 9/32 ] I I I I I I
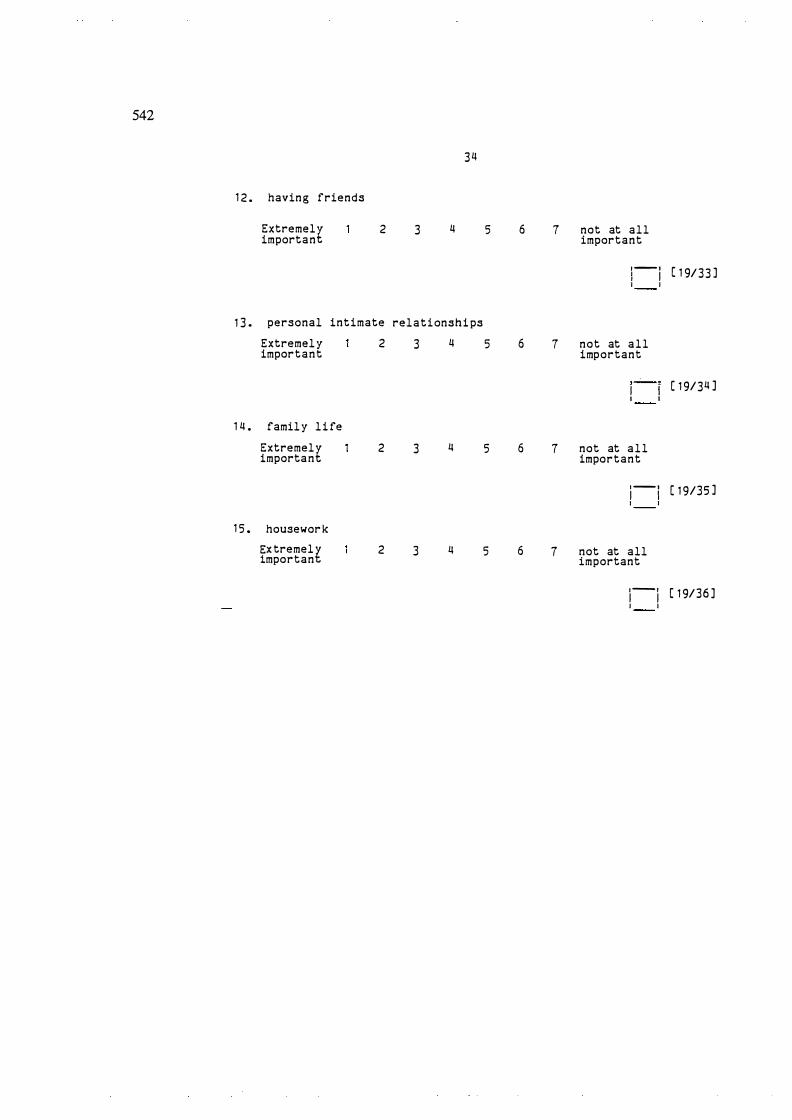
542
3 4
1 2 . having friends
Extremel£ 2 3 4 5 6 7 not at all import an important
· -- · [ 1 9/ 3 3 ] I I I I I
1 3 . personal intimate relationshi ps
Extremel y 2 3 4 5 6 7 not at all important important
�-·-1 [ 1 9/34 ] I I I I
1 4 . famil y l i fe
Extremel£ 2 3 4 5 6 7 not at all import an important
1 -- · [ 1 9/35 ] I I I I
1 5 . housewor k
�x tremelt 2 3 4 5 6 7 not at all 1mportan important
� -- 1 [ 1 9/36 ] I I I I
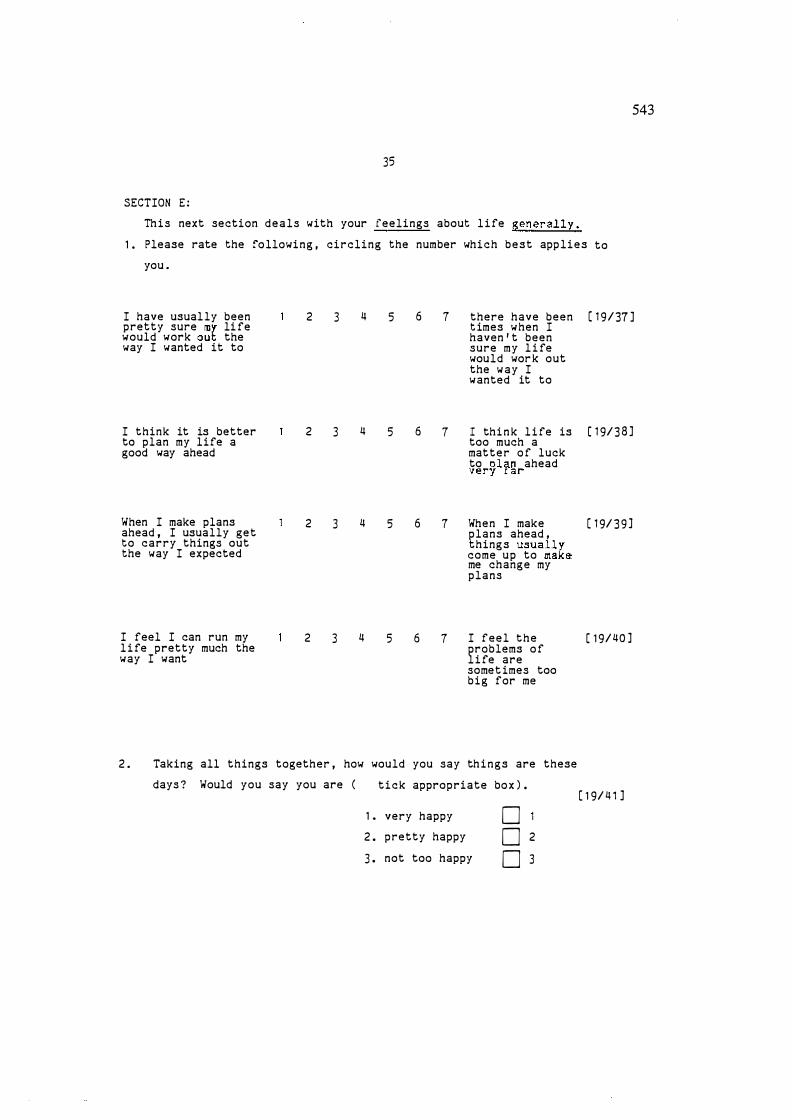
35
SECTION E :
This next section deals with your feelings about l i fe general l y .
1 . Please rate the following , circling the number which best applies to
you .
543
I have usually been pretty sure my li fe would work out the way I wanted it to
2 3 4 5 6 7 there have been [ 1 9 / 37 ] t imes when I
I think it is better to plan my life a good way ahead
When I make plans ahead , I usually get to carry things out the way I expected
I feel I can run my l i fe pretty much the way I want
haven ' t been sure my l i fe would wor k out the way I wanted it to
2 3 4 5 6 7 I thi n k l i fe is ( 1 9/3 8 ] too much a matter o f luck to Blan ahead very rar
2 3 4 5 6 7 When I make [ 1 9/ 3 9 ] plans ahead , thing s usually come up to make me change my plans
2 3 4 5 6 7 I feel the ( 1 9/40 ] problems o f l i fe are somet imes too big for me
2 . Taking all things together , how would you say things are these
days ? Would you say you are ( tick appropriate box ) . [ 1 9/ 4 1 ]
1 • very happy D 2 . pretty happy D 2
3 . not too happy D 3
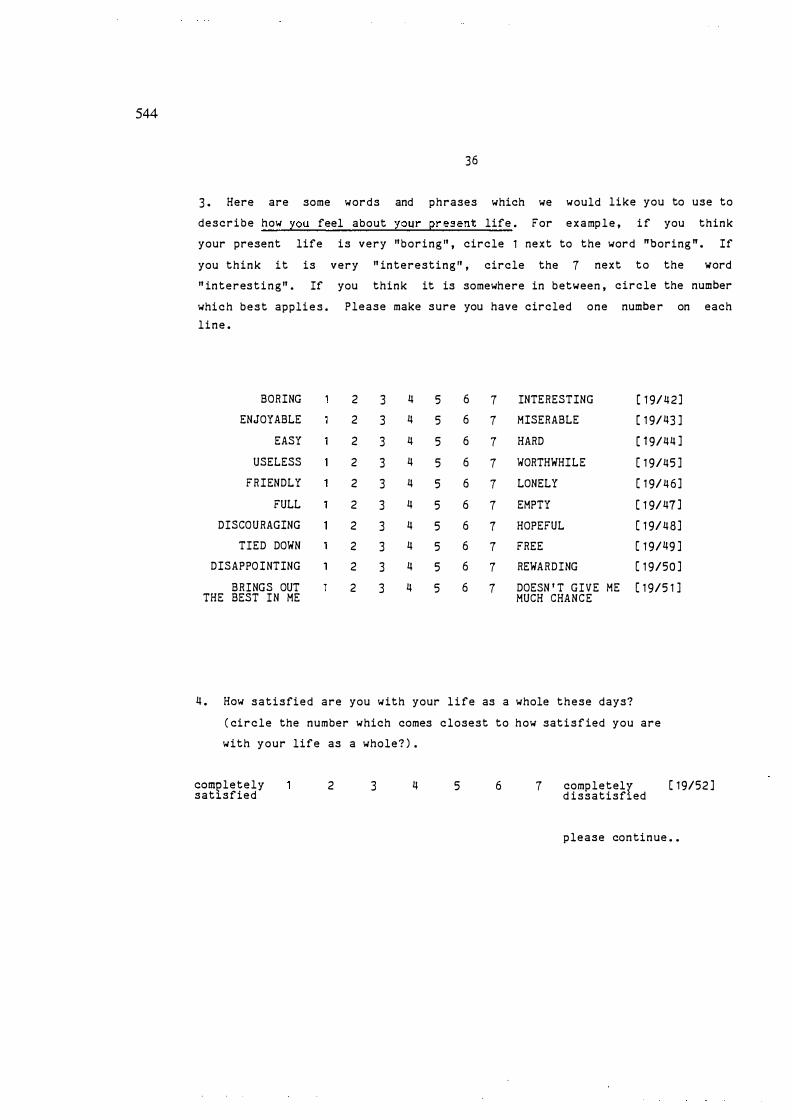
544
36
3 . Here are some words and phrases which we would like you to use to
describe how you feel about your present life . For examp l e , i f you think
your present life is very "boring " , circle 1 next to the word "boring " . If
you think it is very " interesting " , circle the 7 next to the word
" interes t i n g " . If you think it is somewhere in between , circle the number
whi c h best appli e s . Please make sure you have circled one numbe r on each
line .
BORING 2 3 4 5 6 7 INTERESTING ( 1 9/ 4 2 ]
ENJOYABLE 2 3 4 5 6 7 MISERABLE ( 1 9/43 ]
EASY 2 3 4 5 6 7 HARD ( 1 9/44 ]
USELESS 2 3 4 5 6 7 WORTHWHILE [ 1 9/45 ]
FRIENDLY 2 3 4 5 6 7 LONELY [ 1 9/ 4 6 ]
FULL 2 3 4 5 6 7 EMPTY [ 1 9/47 ]
DISCOURAGING 2 3 4 5 6 7 HOPEFUL [ 1 9/ 4 8 ]
TIED DOWN 2 3 4 5 6 7 FREE [ 1 9/49 ]
DISAPPOINTING 2 3 4 5 6 7 REWARDING [ 1 9/50 ]
BRINGS OUT 2 3 4 5 6 7 DOESN ' T GIVE ME [ 1 9/5 1 ] THE BEST IN ME MUCH CHANCE
4 . How satisfied are you with your l i fe as a whole these days?
( circle the number which comes closest to how sati s f ied you are
with your life as a whole? ) .
COMt>letely satlsfied
2 3 4 5 [ 1 9/52 ] 6 7 completelr d issatisf ed
please continue • •
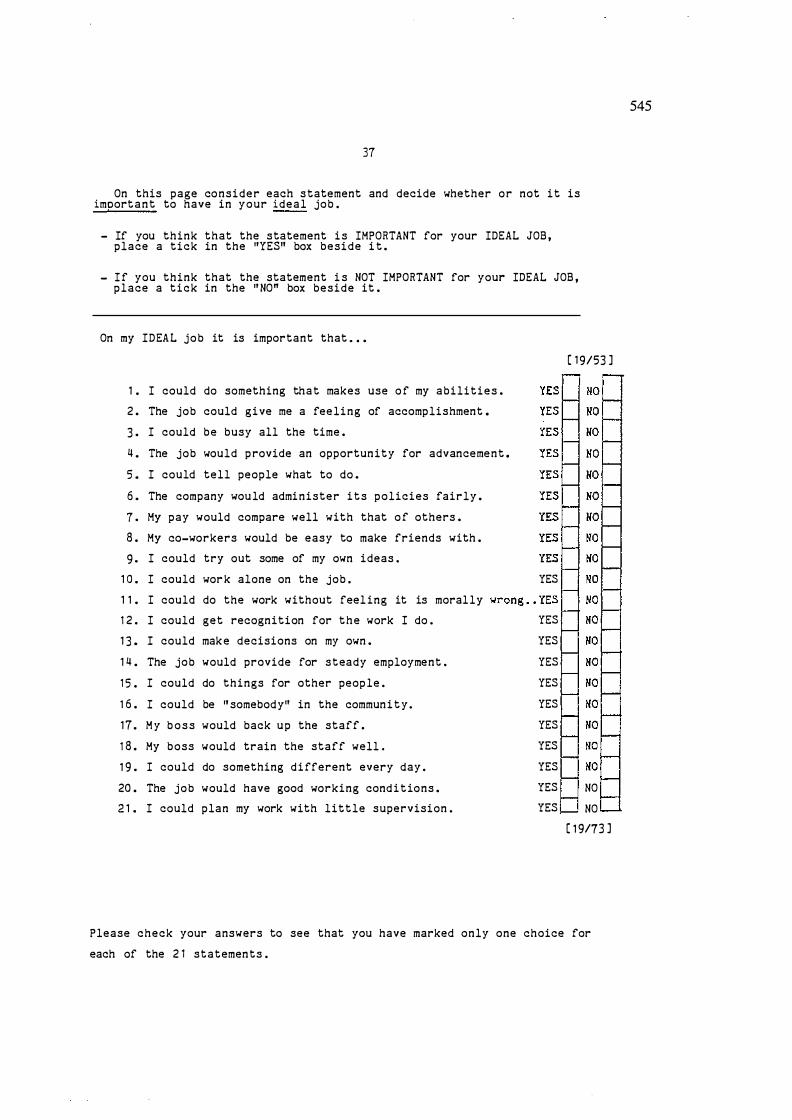
37
On this page consider each s tatement and decide whether or not it is imoortant to have in your ideal job .
- If you think that the statement i s IMPORTANT for your IDEAL JOB , place a tick in the �YES" box beside i t .
- I f you think that the statement i s NOT IMPORTANT for your IDEAL JOB , place a tick in the � NO" box beside it .
On my IDEAL job it is important that • • •
1 . I could do something that makes use o f my abilities .
2 . The job could give me a feeling of accomplishment .
3 . I could be busy all the time .
4 . The job would provide an opportunity for advancement .
5 . I could tell people what to do .
6 . The company wou ld administer i t s policies fairly .
7 . My pay would compare well with that o f others .
8 . My eo-workers would be easy to make friends with .
9 . I could try out some of my own ideas .
1 0 . I could wor k alone on the job .
1 1 . I could do the work without feel ing it is morally
1 2 . I could get recognition for the work I do .
1 3 . I could mak e decisions on my own .
1 4 . The job would provide for steady employment .
1 5 . I could do things for other people .
1 6 . I could be " somebody� in the communi t y .
1 7 . M y b o s s would back u p the staff .
1 8 . My boss would train the staff well .
1 9 . I could do something different every day .
20 . The job would have good working cond i t ions .
2 1 . I could plan my work with little supervision .
YES
YES
YES
YES
YES
YES
YES
YES
YES
( 1 9/53 ]
YES NO
YES NO
( 1 9/73 ]
Please check your answers to see that you have marked only one choice for
each of the 2 1 statements .
545
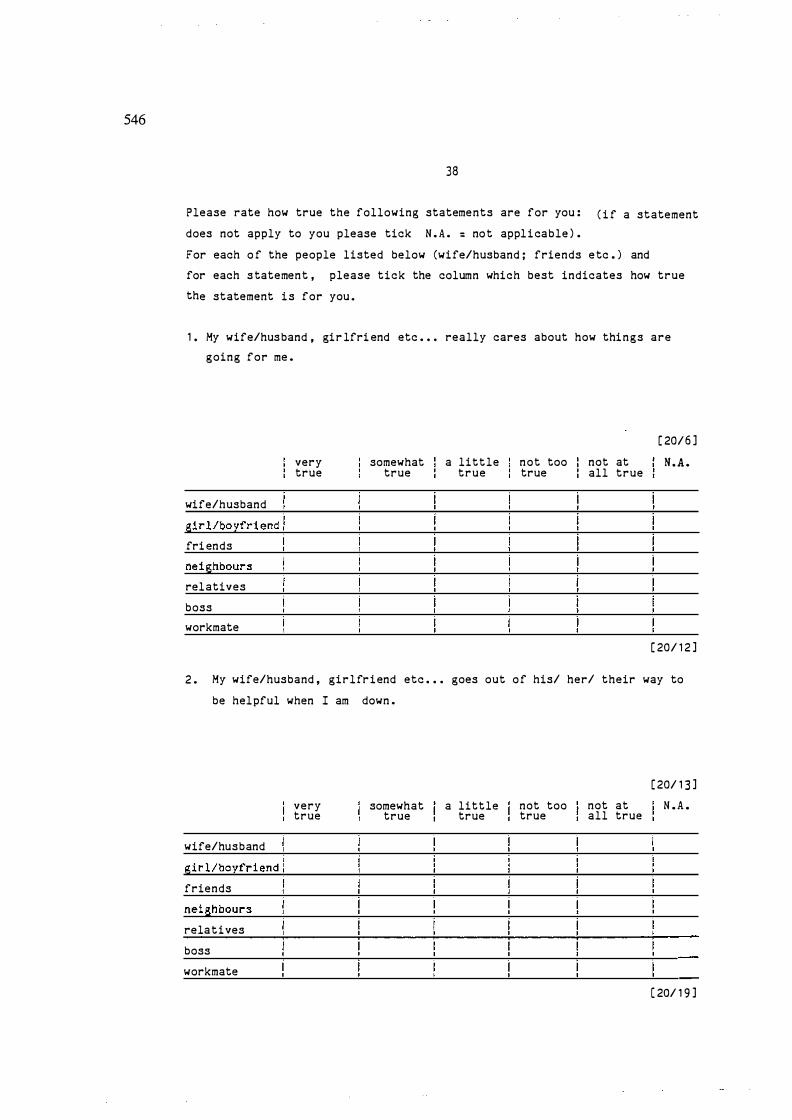
546
38
Please rate how true the following statements are for you : ( i f a statement
does not apply to you please tick N . A . : no t appl i cable ) .
For each o f the people listed below (wife/husband ; friends e tc . ) and
for each s tatement , please tick the column which best indicates how true
the statement i s for you .
1 . My wife/husband , gir lfri end etc • • • really cares about how things are
going for me .
wife/husband
girl/boyfriend ! fri ends
neighbours
relatives
boss
workmate
very true
somewhat true
a little true
not too true
not at all true
( 20/6 ]
N . A .
( 20/ 1 2 ]
2 . My wife/husband , girlfr i end etc • • • goes out o f his/ her/ their way to
be helpful when I am down .
wife/husband I
girl/boyfriend :
friends
neighbours
relatives
boss
workmate
very true
somewhat true
a little true
not too true
not at all true
( 20/ 1 3 ]
N . A .
[ 20/ 1 9 ]
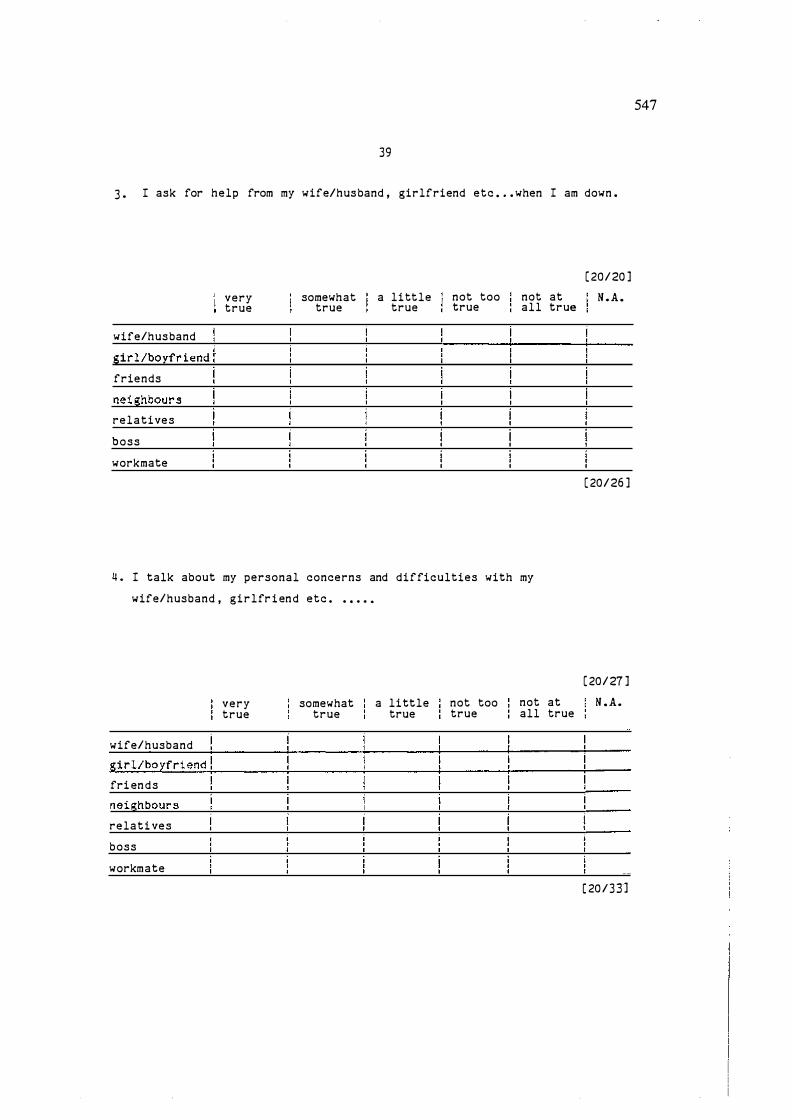
39
3 . I ask for help from my wife/husband , girlfriend etc • • • when I am down .
wife/husband
girl/boyfriend
friends
neighbours
relatives
boss
workmate
very true
somewhat true
a little true
not too true
not at all true
4 . I talk about my personal concerns and difficulties with my
wife/husband , girlfr i end etc • • • • • •
wife/husband
girl/boyfriend ! fri en d s
neighbours
relati ves
boss
workmate
very true
somewhat true
a little true
not too true
not at all true
[ 20/20 ]
N . A .
[ 20/26 ]
[ 20/27 ]
N . A.
( 20 /3 3]
547

548
40
s . I talk to my wife/husband , girlfr i end etc . • • • about p ressures and
strains in my l i fe .
wife/husband
girl/boyfriend ! friends
neighbours
relatives
boss
wor kmate
very true
somewhat true
I f . I
a little true
not too ' not at true ! all true
' · I I
6 . I can rely on my wi fe/husband , girlfriend etc • • • for help when
things get tough .
wife/husband I
girl/boyfriend '
fri end s
nei ghbours
relatives
boss
wor kmate
very true
somewha t true
a li ttle true
not too true
not at all true
[ 20/3lJ ]
N . A .
[ 20/40 ]
[ 20/4 1 ]
N . A .
[ 20/47 ]
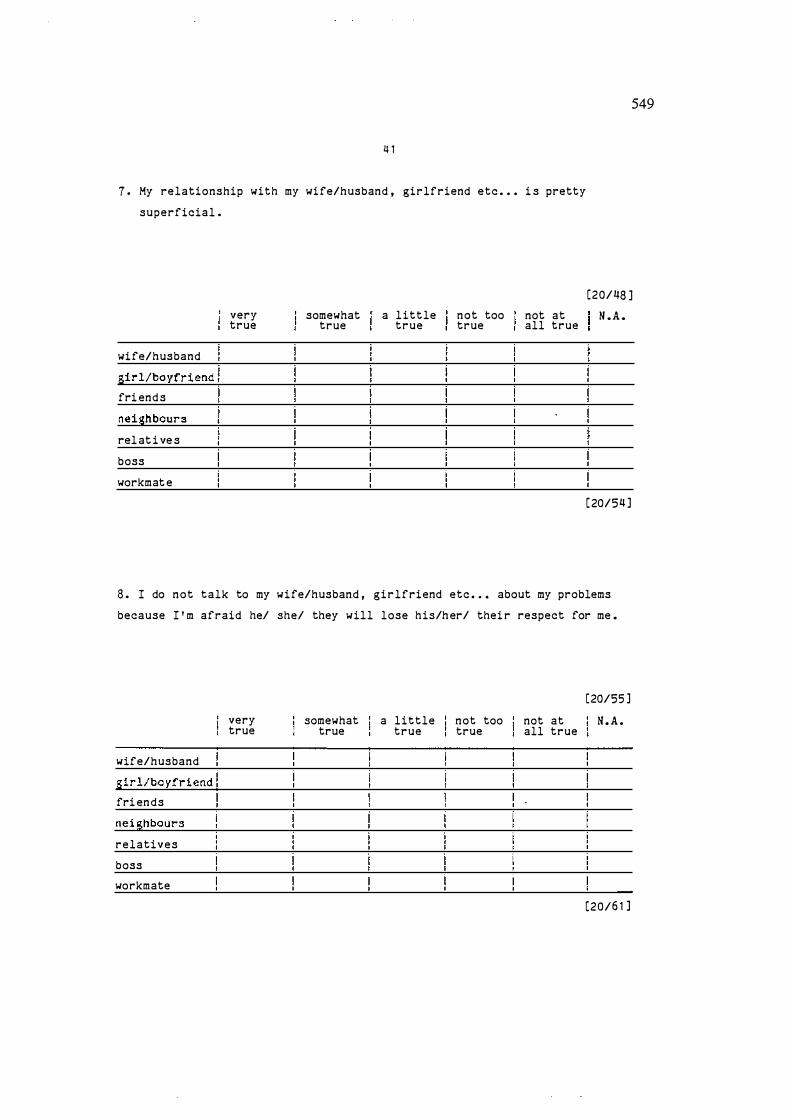
4 1
1 . My relationship with my wife/husband , girlfriend etc • • • i s pretty
superficial .
wife/husband
girl/boyfriend ! fri end s
neighbours
rel at i ve s
boss
workmat e
very true
somewhat true
a l ittle true
not too true
not at all true
549
[20/48 ]
N . A .
[ 20/54 ]
8 . I do not talk to my wife/husband , girlfriend etc • • • about my problems
because I ' m afraid he/ she/ they will lose his/h er/ thei r respect for me .
wife/husband
girl/boyfri end ! fri ends
neighbours
relatives
boss
workmate
very true
somewhat true
a l ittle true
not too true
not at all true
[20/55 ]
M . A .
[20/6 1 ]
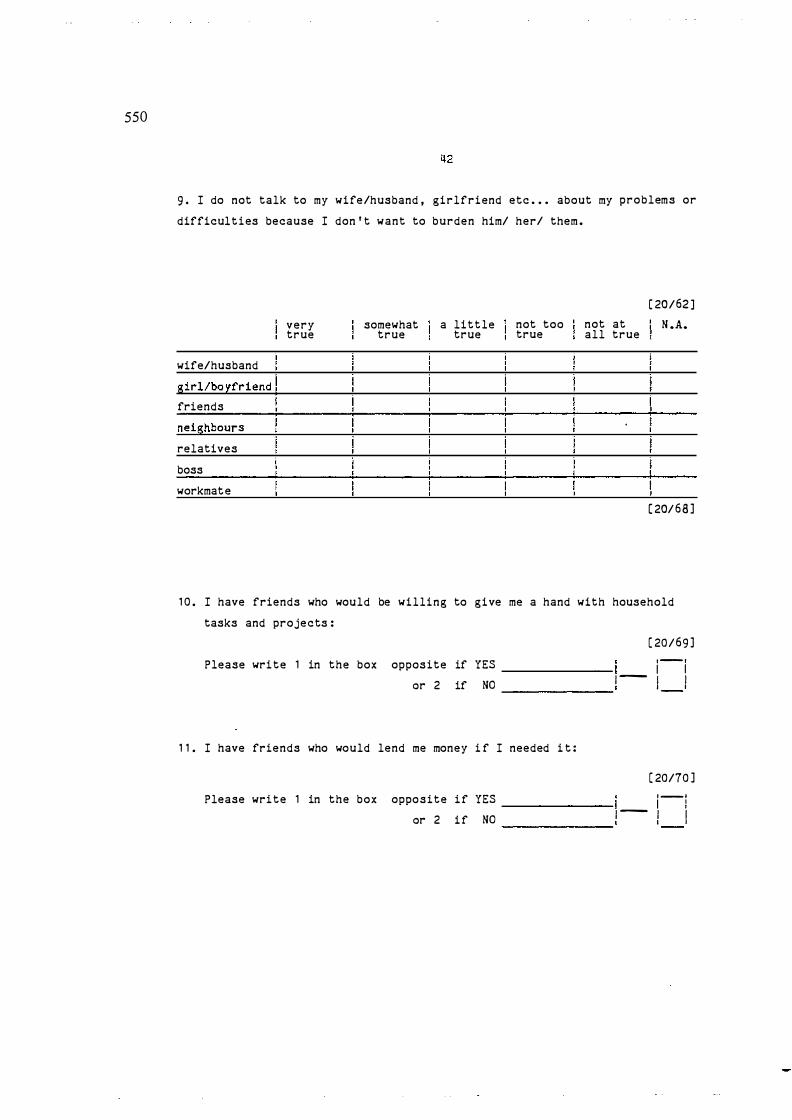
550
g . I do not talk to my wife/husband , girlfriend etc • • • about my problems or
difficulties because I don ' t want to burden him/ her/ them .
wife/husband
girl/boyfri end ! friends
neighbours
relatives
boss
workmat e
very true
somewhat true
a little true
not too true
not at all true
( 20/62 ]
n .A.
[ 20/ 6 8 ]
1 0 . I have friends who would be willing to give me a hand with household
tasks and projects :
[ 20/69 ]
Please wri t e 1 in the box opposite if YES --------------- 1 �---� 1 - 1 I Or 2 if no ------------- 1 1 ___ I
1 1 . I have friends who would lend me money i f I needed i t :
[ 20/70 ]
Please wri t e 1 in the box opposite i f YES -------------- 1 �---� 1 - 1 I Or 2 i f no -------------- 1 1 I
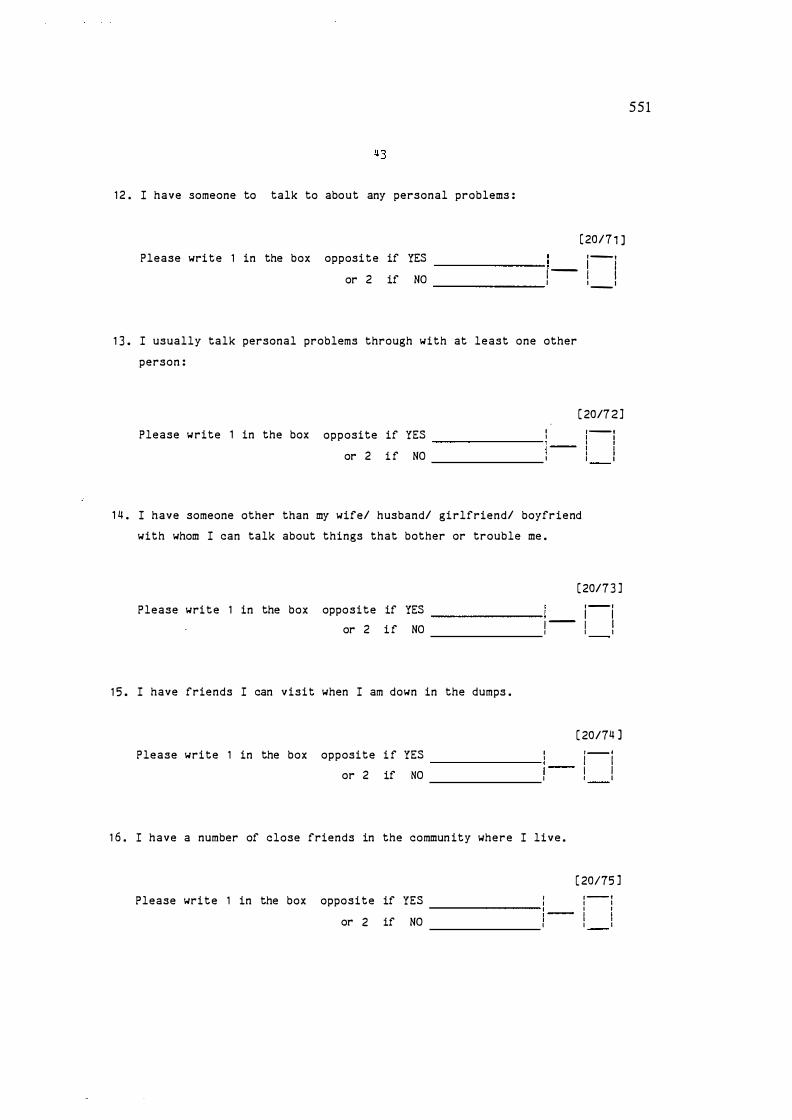
1 2 . I have someone to talk to about any personal problems :
[ 20/7 1 J Please wri t e 1 in the box opposi t e if YES ---------------- ! �---�
or 2 if NO 1 - I I
________________ I 1 ___ 1
1 3 . I usually talk personal problems through with at least one other
person :
Please write 1 in the box opposite if YES I
----------------
� ---or 2 i f NO 1
[ 20/7 2 ] 1 ---· I I I I I I I I I I
1 4 . I have someone other than my wife/ husband/ girlfriend/ boyfriend
with whom I can talk about things that bother or trouble me .
[ 20/7 3 ]
Please wri t e 1 in the box opposite if YES ---------------- 1 �---� � --- I I or 2 i f NO , , ,
1 5 . I have friends I can visit when I am down in the dumps .
[ 20174 J Please write 1 in the box opposite i f YES I 1•--- •1
----------- ,· ---or 2 if NO , ! !
1 6 . I have a number of close friends in the commun ity where I live .
[ 20175 )
Please wri t e 1 in the box opposite if YES I : -- ; ---------------- � --- i I or 2 if NO , , '
551
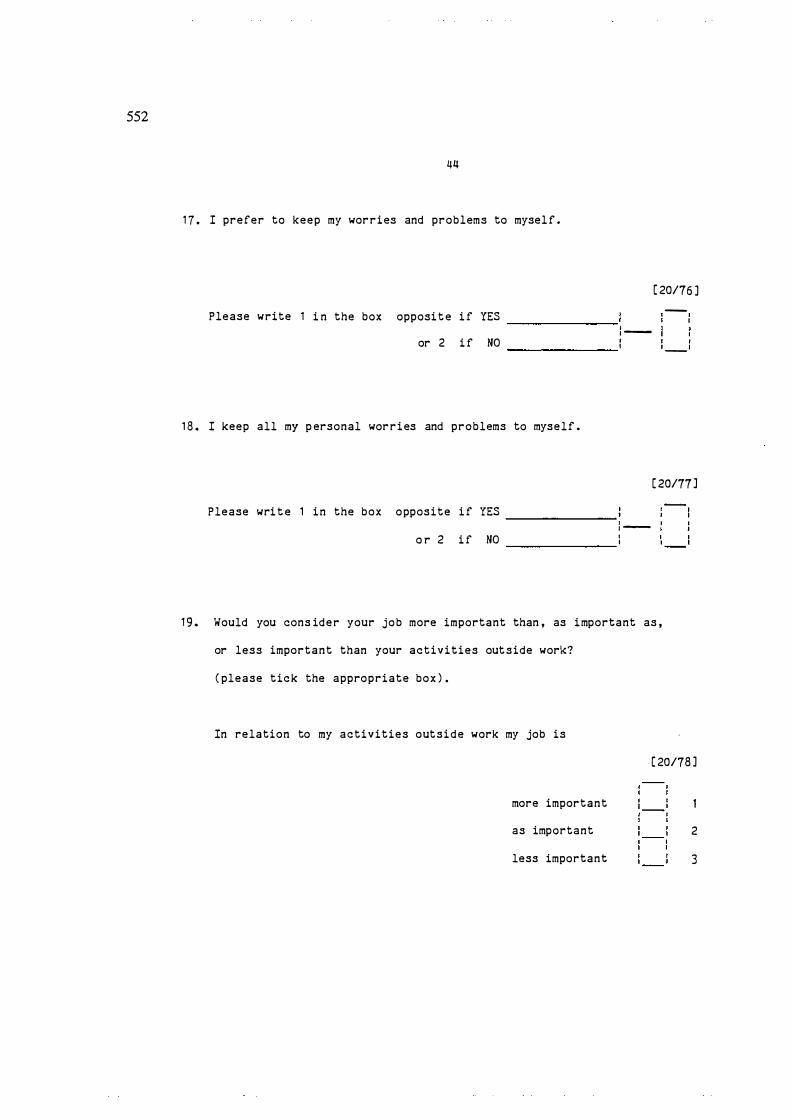
552
44
1 7 . I prefer to keep my wor r i es and problems to mysel f .
( 20176 ]
Please write 1 i n the box opposi t e i f YES ------- I · -
-- , I
or 2 i f NO • • ________ , __ ,
1 8 . I keep all my p ersonal wor r i es and problems to myself .
( 20177 ]
Please wri t e 1 i n the box opposite i f YES ------- I · -o r 2 i f NO ________ I
1 9 . Would you cons ider your job more important than , as important as ,
or less important than your activities out side work?
( please tick the appropriate box ) .
In relation to my activities out s i d e work my job is
( 20178 ]
more important
as important 2
less important 3

45
THANK YOU FOR THE TIME AND EFFORT INVOLVED IN COMPLETING THIS
QUESTIONNAIRE .
PLEASE DO NOT FORGET TO INCLUDE THE STRONG VOCATIONAL INTEREST BLANK
AND ITS ANSWER SHEET .
AS A CHECK OF WHAT YOU SHOULD HAVE COMPLETED , PLEASE NOTE :
All but SECTION B - i f you are employed
SECTION A page
SECTIONS B, C , D , & E . - if returned to Universi t y and d i d not apply
for any posi t ion s .
SECTION A to page 6
SECTIONS 8 , C , D , & E . - i f returned to university but applied for
pos itions or worked fi rst .
Everybo d y should have completed the STRONG VOCATIONAL INVENTORY BLANK
THANK YOU
553


APPENDIX C
C. l Modifications to the Vocational Preference Inventory
C.2 Modifications to the Minnesota Importance Questionnaire
555

556
C. 1 Modification of Vocational Preference Inventory
Table C. 1 Modification of the Vocational Preference Inventory
ORIGINAL
2. Private Investigator 5. Post Office Clerk 6. Route Salesman
10. Interplanetary Scientist 1 1 . Airplane Mechanic 15 . Speculator 19 . Nursery School Teacher 29. Elementary School Teacher 33 . Juvenile Delinquency Expert
35. Stock and Bonds Salesman 37. Prize Fighter 44. Traffic Manager 46. Author 47. Fireman 48. Army General 5 1 . Power Shovel Operator 60. Automobile Mechanic 67. Stunt Man (Motion Picture) 72. Chemist 73 . Playground Director 84. Tax Expert 85. Restaurant Manager 88 . Police Judge 89. Referee (Sporting Events) 90. Truck Gardener 9 1 . Filling Station Attendant 92 . Writer of Scientific or
technical articles 94. Inventory Controller 95 . Master of Ceremonies 100. Sales Manager 102 . Editor of a Scientific Journal 104 . IBM Equipment Operator 105 . Travelling Salesman 107. F.B.I . Agent 108. Prosecuting Attorney 109 . Factory Foreman 1 10 . College Professor 1 1 1 . Tool Designer 1 13 . Asst . City School
Superintendent
(Continued)
REPLACEMENT
Medical Laboratory Technician Salesperson Commercial salesperson Space Scientist Aircraft Engine Mechanic Radio or T.V. Announcer Kindergarten Teacher Primary School Teacher Social Worker (youth activities)
Stockbroker Boxer Commercial Teacher Author/ Authoress Fire Fighter General in Army Excavating Machine Operator Motor Mechanic Stunt Person Research Chemist Playground Supervisor Tax Consultant Restaurant Manager/ ess District Court Judge Referee Market Gardener Petrol Station Attendant Writer - Scientific/Technical
Stock Controller (clerical) Personnel Manager/ess Sales Manager/ess Editor - Scientific Journal Business Machine Operator Travelling Salesperson C.I .D. Investigator Prosecuting Lawyer Factory Foreperson University Professor Tool Designer/Pattern Maker Education Board Member
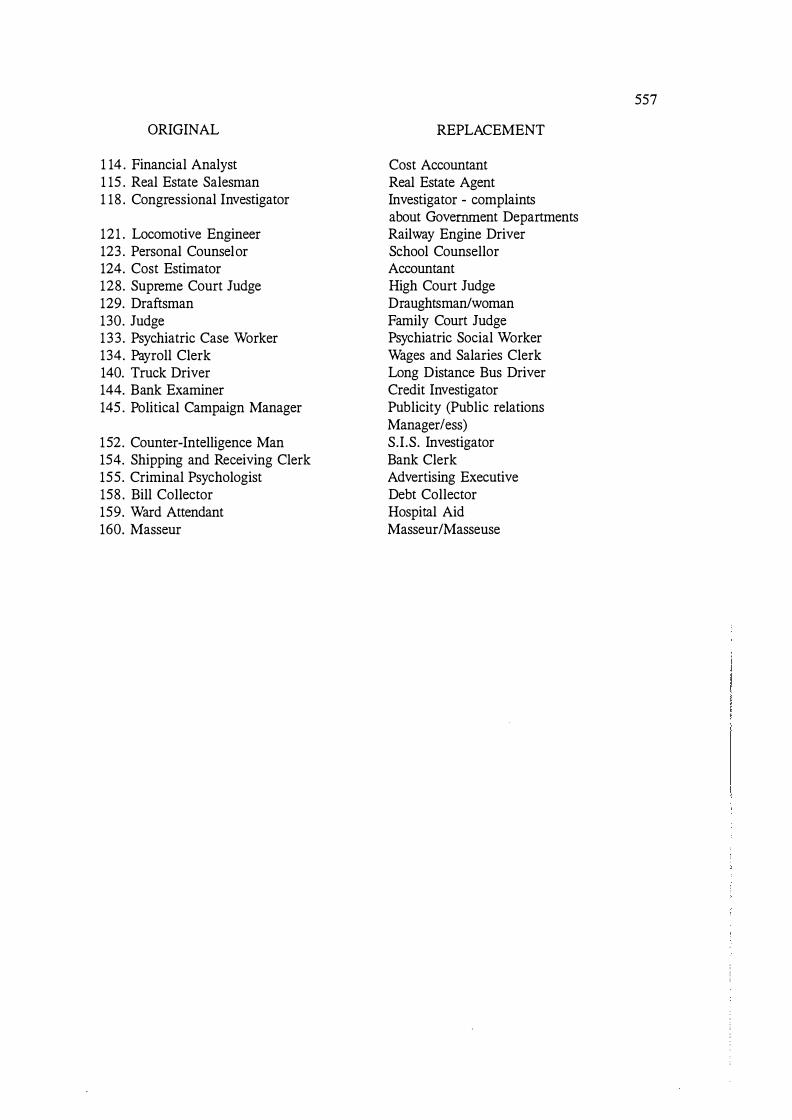
ORIGINAL
1 14 . Financial Analyst 1 15 . Real Estate Salesman 1 18 . Congressional Investigator
121 . Locomotive Engineer 123 . Personal Counsel or 124. Cost Estimator 128. Supreme Court Judge 129. Draftsman 130. Judge 133 . Psychiatric Case Worker 134. Payroll Clerk 140. Truck Driver 144. Bank Examiner 145 . Political Campaign Manager
152. Counter-Intelligence Man 154. Shipping and Receiving Clerk 155. Criminal Psychologist 158 . Bill Collector 159. Ward Attendant 160. Masseur
REPLACEMENT
Cost Accountant Real Estate Agent Investigator - complaints about Government Departments Railway Engine Driver School Counsellor Accountant High Court Judge Draughtsman/woman Family Court Judge Psychiatric Social Worker Wages and Salaries Clerk Long Distance Bus Driver Credit Investigator Publicity (Public relations Manager less) S.I.S. Investigator Bank Clerk Advertising Executive Debt Collector Hospital Aid Masseur/Masseuse
557

558
C.2 Modification of The Minnesota Importance Questionnaire
There were minor changes made to the instructions. The instruction "No ties allowed" was
included in the list under the heading of DIRECfiONS rather than just being implied. What
no ties meant was described and it was explained that if two statements were really of equal
ranking then this would show up in the averaging of results later. These changes were made
in an attempt to lessen any frustration on the part of a respondent resulting from not being
permitted to rank statements equally.
Similarly in anticipation of any impatience resulting from the repetitiveness of statements a
sentence was included explaining that to enable comparisons among statements they would
appear in more than one group but that each statement would be grouped with each other
statement only once.
The words which appeared in the original in bold type were underlined for emphasis because
when in bold type they did not stand out as much as in the original .
Only two changes were made in the wording of statements to retain consistency of meaning
between cultures. These involved statements 17, and 18 , as below.
17. My boss would back up the workers (with top management) . was changed to:
17. My boss would back up the staff.
1 8 . My boss would train the workers well. was changed to :
1 8 . My boss would train the staff well.
These changes involved substituting the words staff for workers, while extending the support
to all level of workers . The word workers did not seem to fit as well into the New Zealand
culture in that it has been associated with non-management level. The students studied in the
present research once employed did not always fit into such specific categories.
APPENDIX D
D. l Informal statement of Dawis and Lofquist's Theory (1984)
559
560
D. l Informal Statement of Dawis and Lofquist's Theory of Work Adjustment
" Work is an interaction between an individual and a work environment in which each has
requirements of the other.
The work environment requires certain tasks to be performed and the individual brings skills
to perform the tasks.
The individual, in exchange, requires compensation for work performance and additional
conditions of work such as a safe environment, a comfortable place to work, congenial eo
workers, a competent supervisor, and an opportunity to achieve.
As long as the environment and the individual continue to meet each other's requirements,
their interaction is maintained.
When the requirements are not met, the individual or the environment moves to change or
terminate the interaction.
The mutual responsiveness of the individual and the work environment to each other's
requirements is a continuing process called work adjustment. The degree to which the
requirements of either or both are met is described on a dimension called correspondence.
The basic motive of work behaviour is seeking to achieve and maintain correspondence.
Two primary indicators of work adjustment are the satisfaction of the individual with the
work environment and the satisfaction of the work environment with the individual, or the
individual's satisfactoriness.
Both satisfaction and satisfactoriness are required for the individual to remain and be retained
on the job. Tenure is the outcome of work adjustment.
The principal characteristics of the individual in relation to work adjustment may be
collectively called the individual's work personality.

561
The work personality consists of at least two sets of characteristics : status characteristics
(personality structure) and process characteristics (personality style) .
Personality structure may be described in terms of the individual's skills and needs or in
terms of the reference dimensions for skills (abilities) and the reference dimensions for need
(values) .
Personality style describes the individual's typical ways of interacting with the environment
(given a particular personality structure) on such dimensions as celerity (quickness or
slowness in interacting with the environment) , pace (level of activity typically exhibited in
interaction with the environment) , rhythm (typical pattern of pace in interaction with the
environment) , and endurance (duration of interaction with the environment) .
The work environment may be described in terms commensurate with the description of work
personality. Work environment structure may be described in terms of skill requirements and
need reinforcers (classes of stimulus conditions the presence or absence of which is associated
with the satisfaction of needs). Work environment structure may also be described in terms
of reference dimensions for skill requirements (ability requirements) and reference dimensions
for need reinforcers (reinforcer factors) . The characteristic patterns of ability requirements
and of reinforcer factors for the work environment of an occupation may be respectively
referred to as an occupational ability pattern and an occupational reinforcer pattern.
The style of the work environment may be described in terms of its requirements for celerity
(speed of response), pace (level of activity) , rhythm (typical pattern of pace) and endurance
(duration of response) .
Work adjustment can be predicted from the correspondence of the work personality and the
work environment" (Dawis and Lofquist, 1984. pp. 56-57) .

563
APPENDIX E
E. l Respondent Consent Form

564
E. l Respondent Consent form
Subj e c t Number :
CONSENT FORM - For part i cipation in a longitudinal s tudy of f inal year univer s i ty s tudent s , Monica S k inne r , ( Department o f Psychology , Mas s ey Univers ity) .
NAME :
LOCAL ADDRESS : PERMANENT ADDRESS :
LOCAL PHONE NUMBER : PERMANENT PHONE NUMBER :
1 . I agree to part i c ipate in this study .
2 . I agree to the res earcher having acc e s s t o my univers i ty academic records for the purposes o f this s tudy .
3 . I unders tand that all the information obtained wi ll be kept con f i dent ial and that pub l i s he d reports will not contain data that could identify any individual s personal l y .
Name o f relative :
addres s :
Name of friend :
addre s s :
Thes e names and addres s e s wi ll be used only t o ensure contact for fol l ow-up .
S IGNATURE :
APPENDIX F
F. l Scale Interpretation for the Vocational Preference Inventory (Holland, 1965)
565

566
F. 1 Scale Interpretation for the Vocational Preference Inventory (Holland, 1965)
The Realistic scale
The realistic orientation is characterised by aggressive behaviour, active interests , the use of .
physical skills, a preference for acting out problems and an avoidance of interpersonal and
verbal activities . Thinking is said to be more concrete than abstract, problems tend to be
approached by the objective manipulations of things, animals, tools and machines, and stress
is reduced by avoiding tasks requiring subjectivity, intellectualism, artistic expression, and
social sensitivity. The values involved are thought to be of a conventional nature while
aesthetic ones are of little importance.
Typical realistic occupations include, the skilled trades, technical jobs, factory work, some
service and outdoor work and engineering vocations . The usual types of activities involve the
use of motor skills . This orientation means the avoidance of being the centre of attention and
involves a self-concept which is mature, practical, persistent, unsociable, shows a narrow
range of interest, is rugged and robust, practical and mechanical .
Achievements are made in technical rather than social, artistic, or academic areas but they
are not made in a creative way. Aptitudes tend to be more mechanical than verbal but
psychomotor skills are good.
The investigative type (known as the intellectual type in the Vocational Preference Inventory
of 1 965) . The orientation described as investigative is characterised by thinking organising,
and understanding rather than by acting or persuading. Problems are solved through the use
of intelligence and the manipulation of ideas, words and symbols. Stress is reduced by
avoiding physical activities and those which are repetitive. It involves theoretical values and
to a lesser degree aesthetic problems are valued. The occupations tend to be scientific in
nature. The worker tends to be independent (neither giving or receiving support) and to be
task oriented. Other people and repetitive tasks tend to be avoided. The concept of self is one
of being unsociable, persistent, self-controlled, analytical, independent, scholarly, introverted,
original and achieving. Characterised by knowledge and intellectual achievement with indirect
control over others . The distinctive aptitudes are said to be in the verbal and mathematical
areas .

567
The artistic orientation is represented by self-expression, expression of emotion and a dislike
of structure. Problems are usually solved through the use of feelings, intuition and
imagination to create art forms or products . Stress is reduced by avoiding matters of a
political and economic nature and by avoiding direct relationships with others . Values tend
to be, musical, artistic, literary and aesthetic. The occupations involved tend to be artistic,
musical or to do with writing or the arts . The activities are usually creative and athletic
activities are avoided. The typical self-concept is complex, original, independent, sociable,
sensitive, impulsive, flexible, achieving, unpopular but friendly. Achievement occurs in the
artistic fields and verbal aptitude exceeds mathematical ability while perceptual and fine motor
skills are well developed.
The social orientation is characterised by a desire for close interpersonal situations .
Interpersonal interactions are skilled, but situations involving intellectual problem-solving and
the use of physical skills are avoided. Problems are solved by relying on emotions rather than
intellect, and roles which require motor skills are avoided. Typical values held are of a social,
ethical and/or religious character. The typical occupations described as falling within this
orientation are of an educational (teaching) , therapeutic (social work and other service jobs
for example) and/or religious disposition. The activities undertaken would include, social
service ones which involve training, imparting information, tend to be enlightening, or
involve curing or developing others . Physical danger is avoided as is the use of tools or
machinery. The self-concept would typically be described as humanistic, having social
presence, dominant, sociable, achieving, popular and friendly. Achievement would be in the
area of leadership and scholarship. Aptitudes would include, verbal skills (for example those
suited to selling) but mathematical skills would not be expected to be high.
Enterprising as an orientation is said to be represented by the use of verbal skills to
manipulate and to dominate others and to have power and status as a primary concern.
Problems are usually solved through the use of wit, humour and persuasion. The reduction
of stress would occur through displaying oral aggression and self-aggrandizement. The
common values would be of a political and economic nature with a low value placed on
aesthetics and a high emphasis placed on values which are status oriented. Typical occupations
include sales, supervisory and leadership vocations . Activities generally involve, persuasive,
powerful roles with a drive to attain organisational goals or personal economic success. Areas
involved include all things scientific, non-social activities , confining activities and activities
568
involving extended concentration. The typical self-concept would centre upon being dominant,
cheerful, adventurous, conservative, desirous of high status power and money, ambition,
extraversion and persuasion. Achievement would occur in the area of speaking, leadership
and athletics . The main aptitude would be leadership skills.
The conventional orientation would be typified by a concern for rules and regulations, self
control, and an identification with power and status as distinct from personally seeking power.
Structured work and interpersonal situations would be preferred. Problems would usually be
solved by conforming to cultural norms and values . Stress would be reduced by avoiding
persuasive and expressive activities . Economic values would be seen as pre-eminent.
Occupations high in this orientation would be those involving clerical and computational tasks
and those which are rule-oriented (office, clerical and accountancy work for example) . The
activities preferred would be of a passive, systematic and structured type. Aggressive or
spontaneous activities would be avoided along with ambiguous tasks . The self-concept would
usually involve making a good impression, being well controlled, persevering, being
inflexible, conservative, conscientious, stable, sociable, a perfectionist and concerned about
prestige. In the area of achievement there would be little potential for creativity and speaking
skills would not be a strength. Aptitudes would include precision and attention to detail with
a mathematical rather than a verbal orientation.

APPENDIX G
G . 1 Operationalisation of constructs
569

570
G . 1 Summary of operationalisation of constructs
The following list of the operationalisation of the constructs includes those represented by the
research propositions and hypotheses and those relating to background data with the time they
were measured noted. All of the variables measured by the questionnaires are included in the
list whether or not they were reported upon, focused upon, or were part of the research
hypotheses and analyses .
The time when the measurement of each variable occurred in the longitudinal study is
indicated by stage one of the research being referred to as time 1 and stage two, as time 2 .
The operationalisations below are of those constructs which were examined within Dawis and
Lofquist's original model and the expanded model . Not all of Dawis and Lofquist's
propositions were researched in the present study. However the way in which Dawis and
Lofquist suggested they be operationalised is included here.
In relation to the operationalisation of the constructs or latent variables where they are seen
as underlying factors , Figure 3 . 8 indicates the way operationalisation was recommended by
Dawis and Lofquist. The present study at times adopted in full Dawis and Lofquist
operationalisation and at others alternative methods were used, methods which were more
practicable within the research design and setting. Justification for the way in which the
constructs were operationalised can be found within the discussion concerning the design of
the research. Below is a list of the ways in which constructs were operationalised. As can be
observed multiple indicators were used wherever practicable in preparation in particular for
any analyses involving models concerned with linear structural relationships .
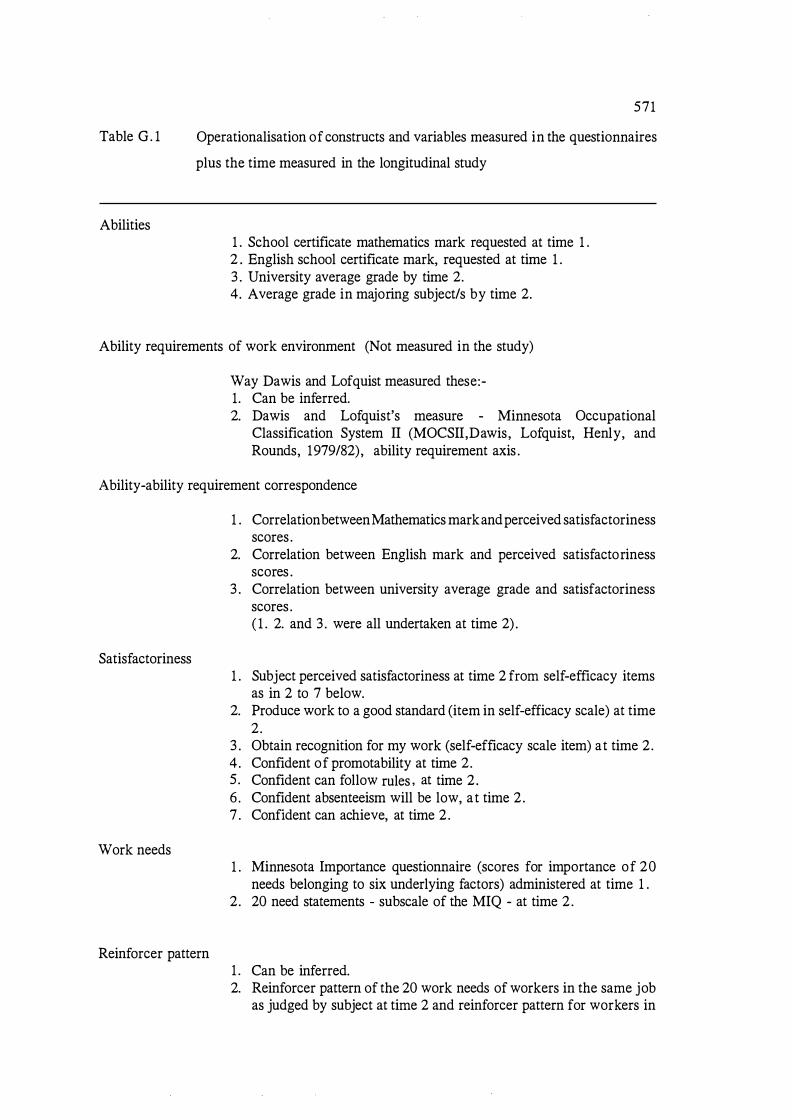
Table G. 1
Abilities
571
Operationalisation of constructs and variables measured in the questionnaires
plus the time measured in the longitudinal study
1 . School certificate mathematics mark requested at time 1 . 2 . English school certificate mark, requested at time 1 . 3 . University average grade by time 2. 4. Average grade in majoring subject/s by time 2.
Ability requirements of work environment (Not measured in the study)
Way Dawis and Lofquist measured these:-1. Can be inferred. 2. Dawis and Lofquist's measure - Minnesota Occupational
Classification System II (MOCSII,Dawis, Lofquist, Henly, and Rounds, 1979/82) , ability requirement axis .
Ability-ability requirement correspondence
Satisfactoriness
Work needs
Reinforcer pattern
1 . Correlation between Mathematics mark and perceived satisfactoriness scores .
2. Correlation between English mark and perceived satisfactoriness scores .
3 . Correlation between university average grade and satisfactoriness scores . ( 1 . 2. and 3 . were all undertaken at time 2) .
1 . Subject perceived satisfactoriness at time 2 from self-efficacy items as in 2 to 7 below.
2. Produce work to a good standard (item in self-efficacy scale) at time 2.
3 . Obtain recognition for my work (self-efficacy scale item) at time 2. 4 . Confident of promotability at time 2. 5 . Confident can follow rules , at time 2 . 6 . Confident absenteeism will be low, at time 2 . 7 . Confident can achieve, at time 2 .
1 . Minnesota Importance questionnaire (scores for importance of 20 needs belonging to six underlying factors) administered at time 1 .
2. 20 need statements - subscale of the MIQ - at time 2 .
1 . Can be inferred. 2. Reinforcer pattern of the 20 work needs of workers in the same job
as judged by subject at time 2 and reinforcer pattern for workers in
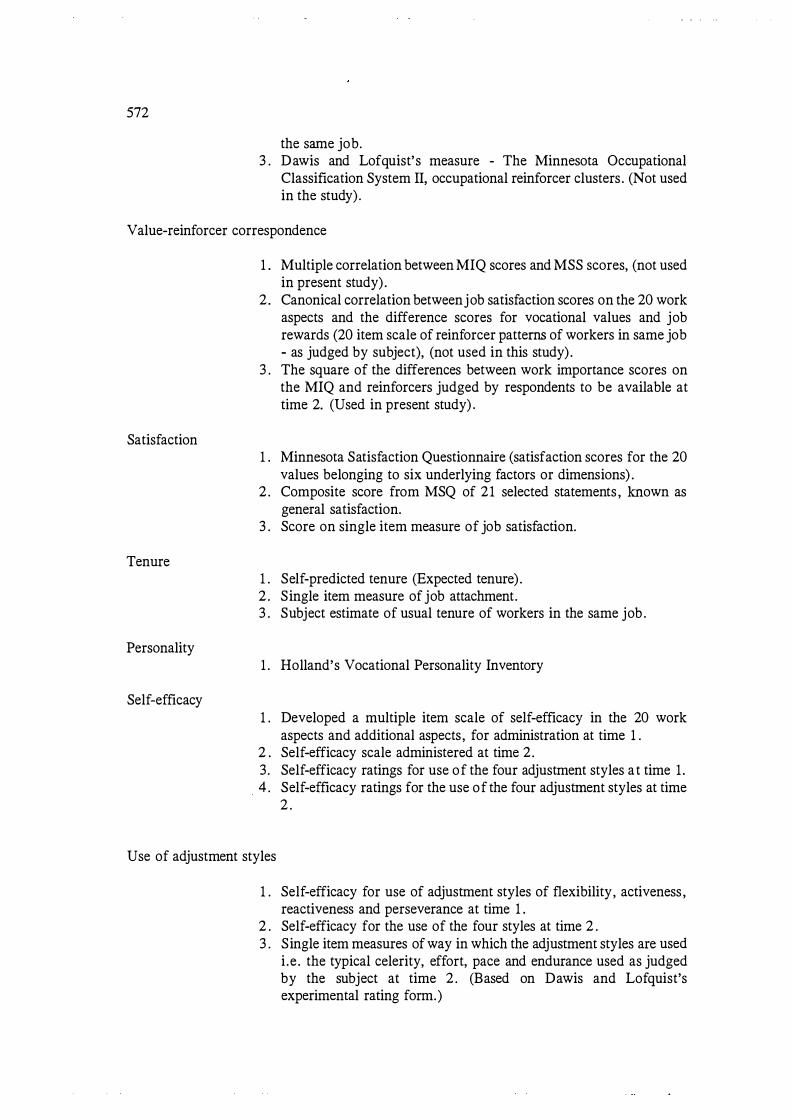
572
the same job. 3 . Dawis and Lofquist' s measure - The Minnesota Occupational
Classification System IT, occupational reinforcer clusters . (Not used in the study) .
Value-reinforcer correspondence
Satisfaction
Tenure
Personality
Self-efficacy
1 . Multiple correlation between MIQ scores and MSS scores, (not used in present study) .
2. Canonical correlation between job satisfaction scores on the 20 work aspects and the difference scores for vocational values and job rewards (20 item scale of reinforcer patterns of workers in same job - as judged by subject), (not used in this study) .
3 . The square of the differences between work importance scores on the MIQ and reinforcers judged by respondents to be available at time 2. (Used in present study) .
1 . Minnesota Satisfaction Questionnaire (satisfaction scores for the 20 values belonging to six underlying factors or dimensions) .
2 . Composite score from MSQ of 21 selected statements , known as general satisfaction.
3 . Score on single item measure of job satisfaction.
1 . Self-predicted tenure (Expected tenure) . 2 . Single item measure of job attachment. 3 . Subject estimate of usual tenure of workers in the same job .
1 . Holland's Vocational Personality Inventory
1 . Developed a multiple item scale of self-efficacy in the 20 work aspects and additional aspects , for administration at time 1 .
2 . Self-efficacy scale administered at time 2. 3. Self-efficacy ratings for use of the four adjustment styles at time 1 . 4 . Self-efficacy ratings for the use of the four adjustment styles at time
2 .
Use of adjustment styles
1 . Self-efficacy for use of adjustment styles of flexibility, activeness , reactiveness and perseverance at time 1 .
2 . Self-efficacy for the use of the four styles at time 2 . 3 . Single item measures of way in which the adjustment styles are used
i .e . the typical celerity, effort, pace and endurance used as judged by the subject at time 2 . (Based on Dawis and Lofquist's experimental rating form.)

Locus of control
573
1 . Four-item Personal Competence Scale (Campbell, Converse and Rodgers, 1976), at time 1 .
2 . The same four-item locus of control scale at time 2.
Vocational preference 1 . Holland's Vocational Preference Inventory at time 1 . 2 . Stated preference at time 1 . 3 . Job expect to do in the long term - at time 1 . 4 . Alternative future work plans -at time 1 . 5 . Vocational Preference Inventory at time 2. 6 . Vocational interests at conclusion of study for students -at time 2 .
Vocational training 1 . University and other qualifications and training.
Vocational preference I vocational training correspondence
1 . Match between vocational preference and training.
Relative importance of work
Subjective well-being
Satisfaction
1 . A rating of the importance of work relative to activities outside work (single item measure) at time 2.
1 . Single item measure of life satisfaction. 2 . Index of well-being (Campbell, Converse and Rodgers, 1976) . 3 . Single-item measure of happiness (Bradburn Happiness Scale) . 4 . Single-item measurement of satisfaction with living circumstances .
( 1 . to 4 . measures at both time 1 and 2.) 5 . Quality of life measures in relation to the importance of and the
with the domains of: country live in, neighbourhood, accommodation, education, employment, free time, health, standard of living, s avings and investments, friendships , personal relationships , family life and housework at time 2 Campbell, Converse and Rodgers (1976) .
Number of leisure activities
1 . Actual number of activities at university and outside university at time 1 .
2 . Type of leisure activities (as categorised using the Revised Classification of Types of Recreation Activity of The Department of Internal Affairs , New Zealand, 1977) at time 1 .
3 . Number and type of activities outside work at time 2.
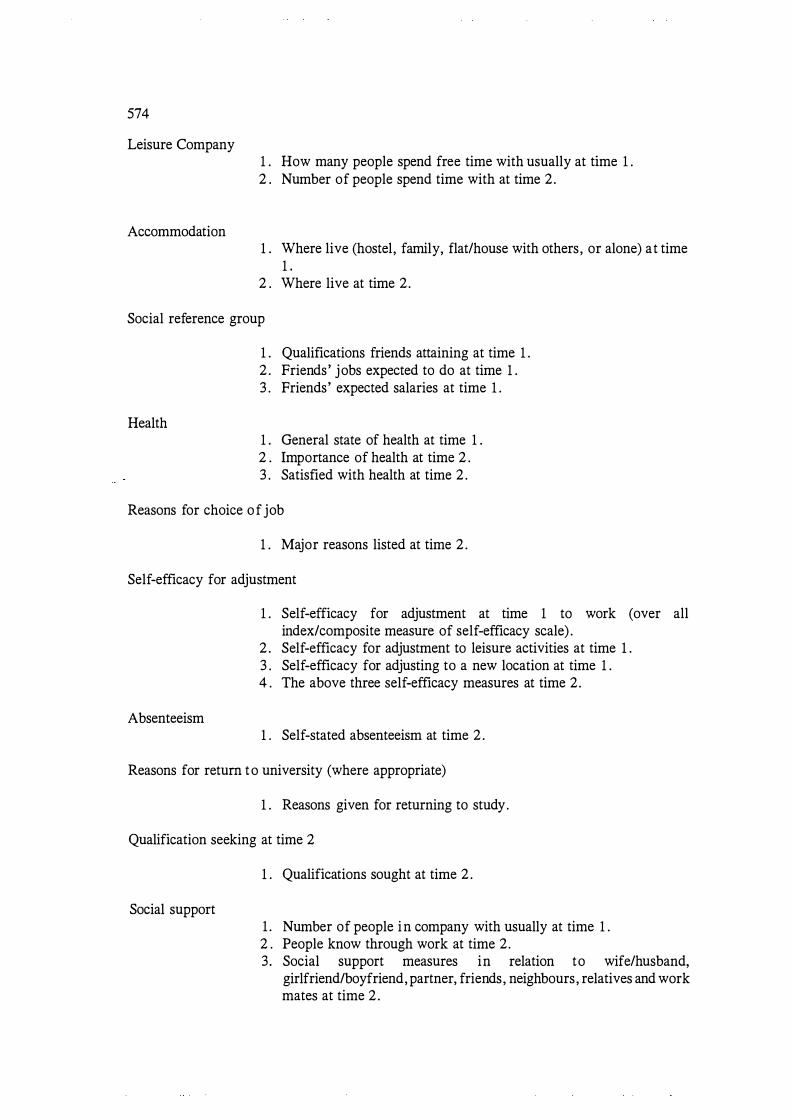
574
Leisure Company
Accommodation
1 . How many people spend free time with usually at time 1 . 2 . Number of people spend time with at time 2.
1 . Where live (hostel, family, flat/house with others, or alone) at time 1 .
2 . Where live at time 2.
Social reference group
1 . Qualifications friends attaining at time 1 . 2 . Friends' jobs expected to do at time 1 . 3 . Friends' expected salaries at time 1 .
Health 1 . General state of health at time 1 . 2 . Importance of health at time 2 . 3 . Satisfied with health at time 2 .
Reasons for choice of job
1 . Major reasons listed at time 2 .
Self-efficacy for adjustment
1 . Self-efficacy for adjustment at time 1 to work (over all index/composite measure of self-efficacy scale) .
2 . Self-efficacy for adjustment to leisure activities at time 1 . 3 . Self-efficacy for adjusting to a new location at time 1 . 4 . The above three self-efficacy measures at time 2.
Absenteeism 1 . Self-stated absenteeism at time 2 .
Reasons for return to university (where appropriate)
1 . Reasons given for returning to study.
Qualification seeking at time 2
Social support
1 . Qualifications sought at time 2 .
1 . Number of people in company with usually at time 1 . 2 . People know through work at time 2. 3 . Social support measures in relation to wife/husband,
girlfriend/boyfriend, partner, friends, neighbours, relatives and work mates at time 2 .
APPENDIX H
H. l The 20 psychological needs of Dawis and Lofquist (1984)
575
H.2 The work needs from the Minnesota Satisfaction Scale (MSS) used in the self-efficacy
scale

576
H . l . The Psychological needs
Ability utilization Achievement Activity Advancement Authority Company policies and practices Compensation eo-workers Creativity Independence Moral values Recognition Responsibility Security Social service Social status Supervision (human relations) Supervision (technical) Variety Working conditions
H.2 . The work needs from the MSS used in the self-efficacy scale
Following company policies and practices Accepting direction from a supervisor Following standard work rules and procedures Accepting the responsibility associated with the job Adapting to changes in procedures Respecting the authority of a supervisor Working as a member of a team Getting along with supervisors Performing repetitive tasks Getting along with eo-workers Performing tasks requiring variety and change in methods
Other items of the MSS
The quality and quantity of the work Rate of absenteeism Worthy of a pay rise Worthy of transfer to a job at a higher level Worthy of promotion to a position of more responsibility Late for work? Becomes overexcited? Becomes upset and unhappy? Needs disciplinary action? Stays absent from work? Seems bothered about something? Complains about physical ailments? Says 'odd' things? Seems to tire easily? Acts as if not listening when spoken to? Wanders from subject to subject when talking?
APPENDIX I
I. l Items used in employee satisfactoriness ratings
577
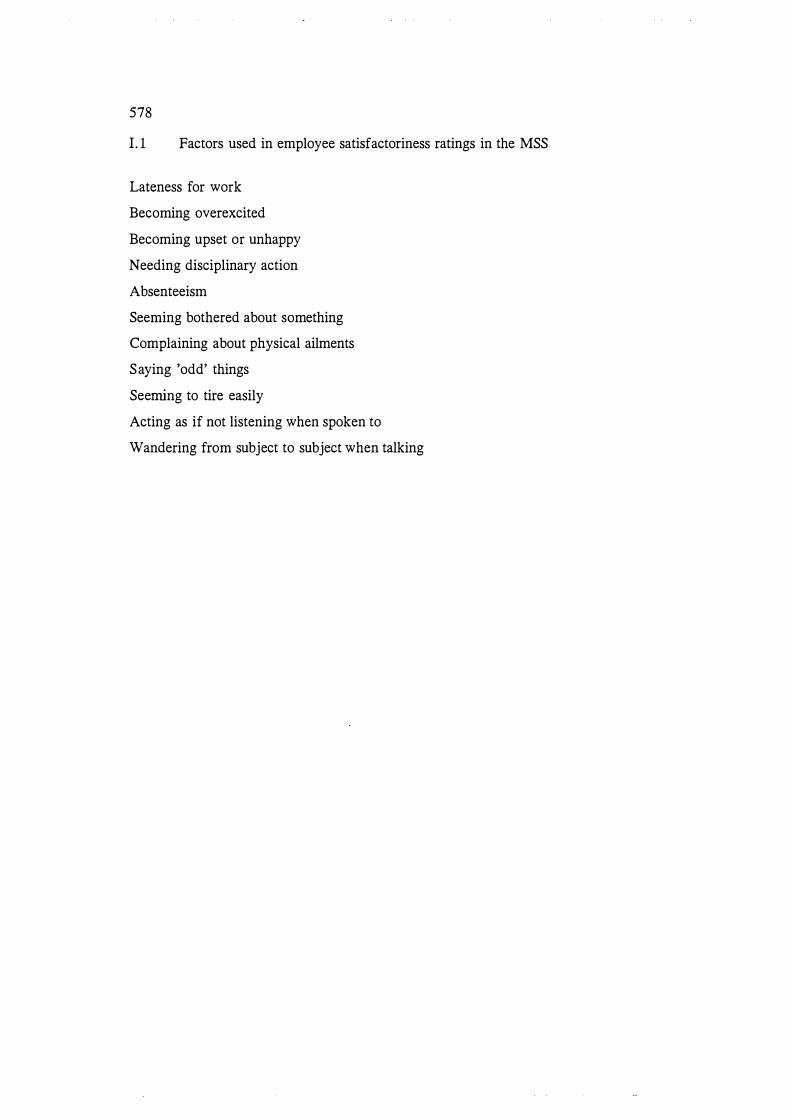
578
I. l Factors used in employee satisfactoriness ratings in the MSS
Lateness for work
Becoming overexcited
Becoming upset or unhappy
Needing disciplinary action
Absenteeism
Seeming bothered about something
Complaining about physical ailments
Saying 'odd' things
Seeming to tire easily
Acting as if not listening when spoken to
Wandering from subject to subject when talking

J . l
J .2
J .3
1 .4
J .S
1 .6
J .7
J .8
APPENDIX J
PRELIMINARY STUDY OF RANGE AND MEASUREMENT OF WORK
ADJUSTMENT STYLES
Introduction
Aims
Subjects
Measurement Instruments
Procedure
Results
Discussion
Conclusion
579

580
J . 1 Introduction
It was because that part of Dawis and Lofquist's theory relating to adjustment styles was the
more recent and that they regarded their adjustment styles and the measurement of them in
particular as experimental that a small study was undertaken prior to measuring adjustment
styles in the present research. The focus of this exercise was to assess what adjustment styles
there might be and how they might be best measured. Dawis and Lofquist's exploratory
instruments were compared with other ways of measuring adjustment styles devised for this ·
this preliminary study.
Within Dawis and Lofquist's Work Adjustment Theory, work adjustment is viewed as a
process where there are personality style differences in an individual's level of tolerance for
discorrespondence. Personality style is believed to affect the degree of flexibility and the
extent to which discorrespondence is reduced. The methods of reducing discorrespondence
proposed by the theory oinvolved changing need structure, that is using a reactive mode of
adjustment, or changing the environment, using an active mode. These are the adjustment
modes which belong to Dawis and Lofquist's specific set of personality style variables which
also include flexibility and perseverance. This is distinct from their generic set of personality
style variables derived from the terminology of behavioural psychology and consisting of
celerity (latency), pace (intensity), rhythm (pattern) and endurance (duration) . The sets of
personality style variables are the process characteristics of Dawis and Lofquist's work
personality in contrast to the status characteristics described by their personality structure
variables of skills or needs and their respective reference dimensions of abilities and values .
1 .2 Aims
In preparation for designing the questionnaires for the main study the aims of the pilot study
were to:
1. See if the full range of Dawis and Lofquist's adjustment styles could be identified.
Dawis and Lofquist ( 1984) defined these styles on their Adjustment Style Rating Form in the
following way: "Flexibility - tolerance for discorrespondence with the environment before
acting to reduce the discorrespondence. Activeness - likelihood of acting to change the
environment to reduce discorrespondence. Reactiveness - likelihood of acting to change the

581
expression of personality structure to reduce discorrespondence. Perseverance - likelihood of
maintaining adjustment behavior under conditions of continuing discorrespondence. " (p .216)
2. Examine adjustment styles evident in responses to hypothetical work problems Dawis and
Lofquist's theory would predict such as unfulfilled work needs, mismatched abilities and job
requirements .
3 . Examine use of adjustment styles made to hypothetical problems based upon other sources
of conflict and frustration suggested in the literature.
4. Estimate the importance to individuals of the different work problems generated.
5 . Assess the appropriateness of Dawis and Lofquist's experimental rating forms , their
Adjustment Style Rating (Experimental form) and their Personality Style Rating (Experimental
form) , in particular the ease with which items were understood and answered.
6. On the basis of findings choose an appropriate form for the adjustment style items for the
questionnaires .
J .3 Subjects
A convenience sample of part-time extramural or distance learning university students in full
time employment and undertaking postgraduate study in vocational psychology was used. All
of the twenty students taking the course volunteered to take part in the preliminary study
while at the university for the on campus part of their study.
J .4 Measurement instruments
The measurement instruments consisted of a 45 item Questionnaire in two forms, multiple
choice and open-ended, see Appendix A. A counterbalanced design was used in the order of
presentation of the form and content of questionnaire items, multiple-choice or open-ended
and their content, were reversed for half the subjects. Form A had half of the items in a
closed (multiple choice) format first and the other half in an open-ended format. For form B
582
items were reversed in both format and order such that the content of the multiple choice
items of form A became the open-ended questions of form B and vice versa.
The items were concerned with potential work problems relating to each of the work needs
and how an individual would probably respond if faced with such a problem. The instruments
included Dawis and Lofquist's experimental form rating individual use of adjustment styles.
Their two rating forms, for the generic and specific adjustment variables, defined the
adjustment variables and asked individuals to rate themselves on a scale of 1 to 5 for each.
A measure of the importance of the work problems was obtained in order to establish which
problems were potentially the object of work adjustment attempts and to use in the
interpretation of responses . For example, not making an adjustment response to a work
problem could be interpreted as the result of an indifference to that problem, if it lacked
importance, rather than as a failure to respond or response delay which might be the case
with a problem rated important. On the other hand, a response to a problem rated
unimportant was considered an example of whatever adjustment style it represented because
of the fact a response was at least being made. When a respondent did nothing in response
to a problem rated as important this type of, lack of, response was counted because the work
problem was regarded as a problem to that individual, therefore some adjustment to it might
be required. In this case an adjustment response of doing nothing, initially could be indicative
of perseverance and later regarded as a failure to respond. Noting that a problem was of no
importance to the respondent was used to help understand any other uncharacteristic
responses .
Potential work adjustment problems were generated by considering the needs of workers in
relation to themselves and their environment and other sources of conflict and frustration. The
assumption made was that if the needs of workers are thwarted in any way this may pose a
problem for them, some adjustment may be required in order to reduce discorrespondence.
Some of the generated problems were based upon differences between the abilities and the
ability requirements of the environment in order to reflect this aspect of Dawis and Lofquist' s
theory. Others were based upon other potential problems, such as lack of communication
among workers within an organisation and the potential influence of an individual's social
reference group.
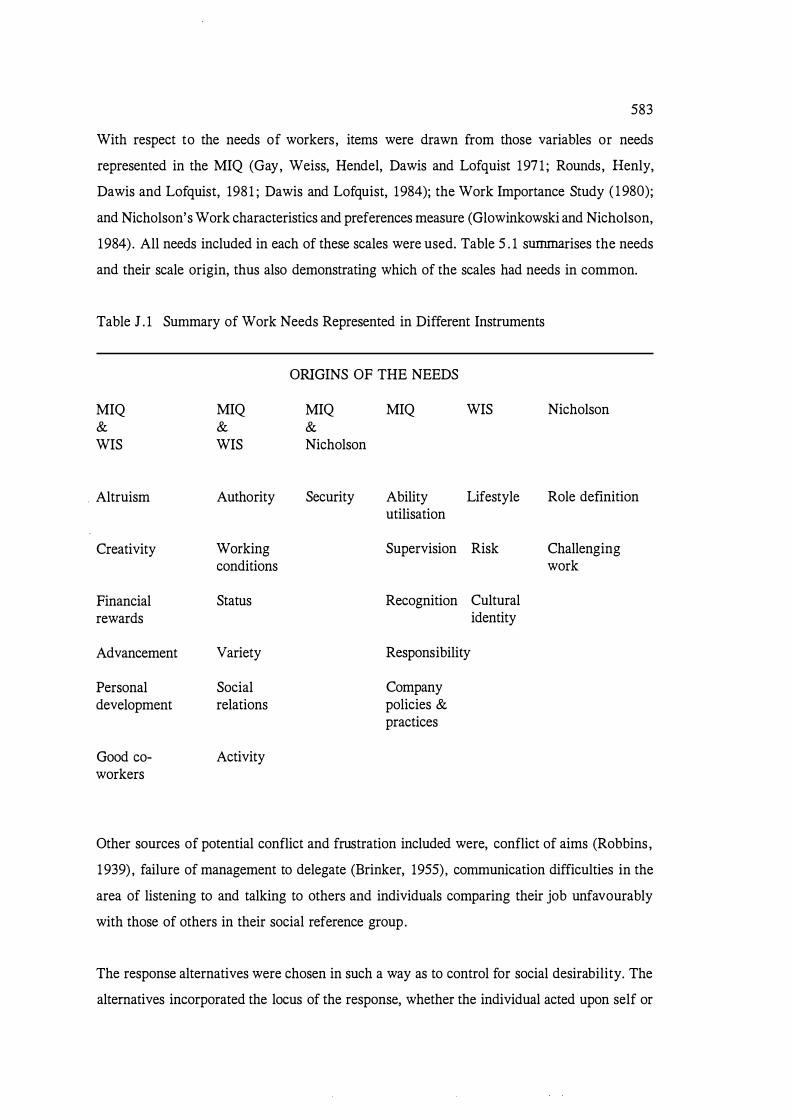
583
With respect to the needs of workers, items were drawn from those variables or needs
represented in the MIQ (Gay, Weiss, Hendel, Dawis and Lofquist 1971 ; Rounds, Henly,
Dawis and Lofquist, 1981 ; Dawis and Lofquist, 1984); the Work Importance Study ( 1 980);
and Nicholson' s Work characteristics and preferences measure (Glowinkowski and Nicholson,
1984) . All needs included in each of these scales were used. Table 5 . 1 summarises the needs
and their scale origin, thus also demonstrating which of the scales had needs in common.
Table J . 1 Summary of Work Needs Represented in Different Instruments
MIQ & WIS
Altruism
Creativity
Financial rewards
Advancement
Personal development
Good eo-workers
MIQ & WIS
Authority
Working conditions
Status
Variety
Social relations
Activity
ORIGINS OF THE NEEDS
MIQ MIQ & Nicholson
Security Ability utilisation
Supervision
Recognition
WIS
Lifestyle
Risk
Cultural identity
Responsibility
Company policies & practices
Nicholson
Role definition
Challenging work
Other sources of potential conflict and frustration included were, conflict of aims (Robbins ,
1939) , failure of management to delegate (Brinker, 1955) , communication difficulties in the
area of listening to and talking to others and individuals comparing their job unfavourably
with those of others in their social reference group.
The response alternatives were chosen in such a way as to control for social desirability. The
alternatives incorporated the locus of the response, whether the individual acted upon self or
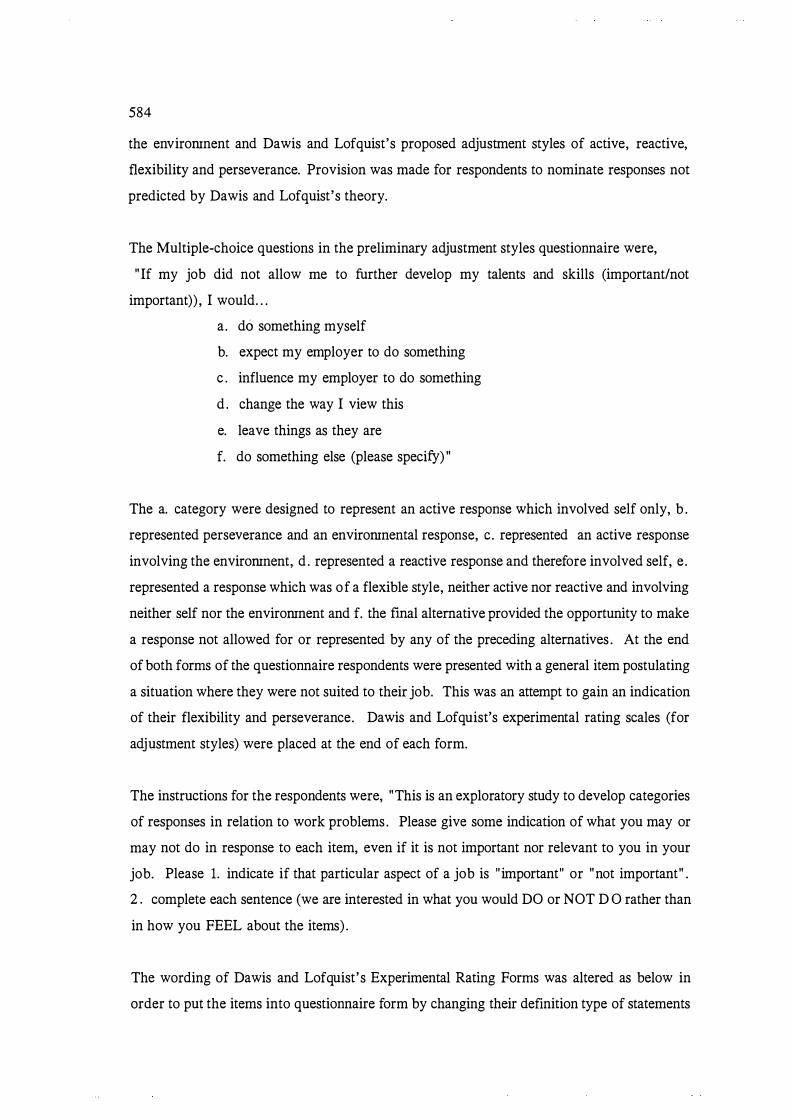
584
the enviromnent and Dawis and Lofquist's proposed adjustment styles of active, reactive,
flexibility and perseverance. Provision was made for respondents to nominate responses not
predicted by Dawis and Lofquist's theory.
The Multiple-choice questions in the preliminary adjustment styles questionnaire were,
" If my job did not allow me to further develop my talents and skills (important/not
important)) , I would . . .
a . do something myself
b. expect my employer to do something
c . influence my employer to do something
d . change the way I view this
e. leave things as they are
f. do something else (please specify) "
The a. category were designed to represent an active response which involved self only, b .
represented perseverance and an enviromnental response, c. represented an active response
involving the enviromnent, d . represented a reactive response and therefore involved self, e .
represented a response which was of a flexible style, neither active nor reactive and involving
neither self nor the enviromnent and f. the fmal alternative provided the opportunity to make
a response not allowed for or represented by any of the preceding alternatives . At the end
of both forms of the questionnaire respondents were presented with a general item postulating
a situation where they were not suited to their job. This was an attempt to gain an indication
of their flexibility and perseverance. Dawis and Lofquist's experimental rating scales (for
adjustment styles) were placed at the end of each form.
The instructions for the respondents were, "This is an exploratory study to develop categories
of responses in relation to work problems . Please give some indication of what you may or
may not do in response to each item, even if it is not important nor relevant to you in your
job. Please 1. indicate if that particular aspect of a job is " important" or "not important" .
2 . complete each sentence (we are interested in what you would DO or NOT D O rather than
in how you FEEL about the items) .
The wording of Dawis and Lofquist's Experimental Rating Forms was altered as below in
order to put the items into questionnaire form by changing their definition type of statements
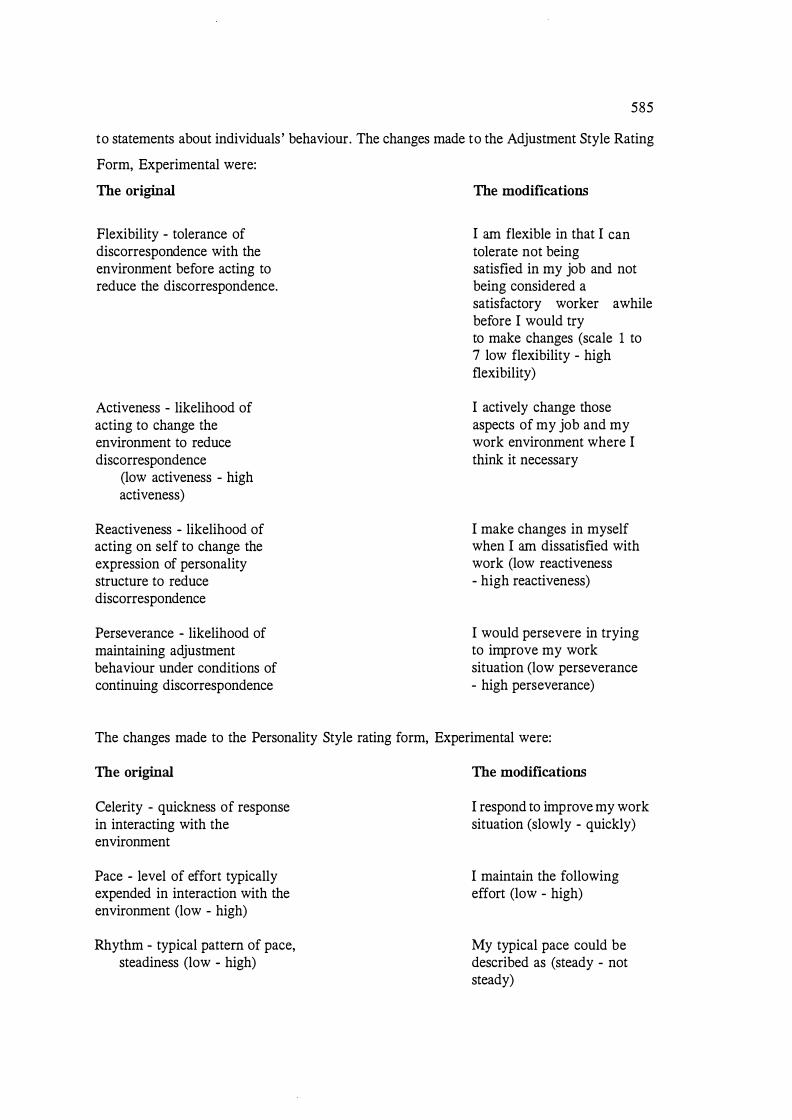
585
to statements about individuals ' behaviour. The changes made to the Adjustment Style Rating
Form, Experimental were:
The original
Flexibility - tolerance of discorrespondence with the environment before acting to reduce the discorrespondence.
Activeness - likelihood of acting to change the environment to reduce discorrespondence
(low activeness - high activeness)
Reactiveness - likelihood of acting on self to change the expression of personality structure to reduce discorrespondence
Perseverance - likelihood of maintaining adjustment behaviour under conditions of continuing discorrespondence
The modifications
I am flexible in that I can tolerate not being satisfied in my job and not being considered a satisfactory worker awhile before I would try to make changes (scale 1 to 7 low flexibility - high flexibility)
I actively change those aspects of my job and my work environment where I think it necessary
I make changes in myself when I am dissatisfied with work (low reactiveness - high reactiveness)
I would persevere in trying to improve my work situation (low perseverance - high perseverance)
The changes made to the Personality Style rating form, Experimental were:
The original
Celerity - quickness of response in interacting with the environment
Pace - level of effort typically expended in interaction with the environment (low - high)
Rhythm - typical pattern of pace, steadiness (low - high)
The modifications
I respond to improve my work situation (slowly - quickly)
I maintain the following effort (low - high)
My typical pace could be described as (steady - not steady)
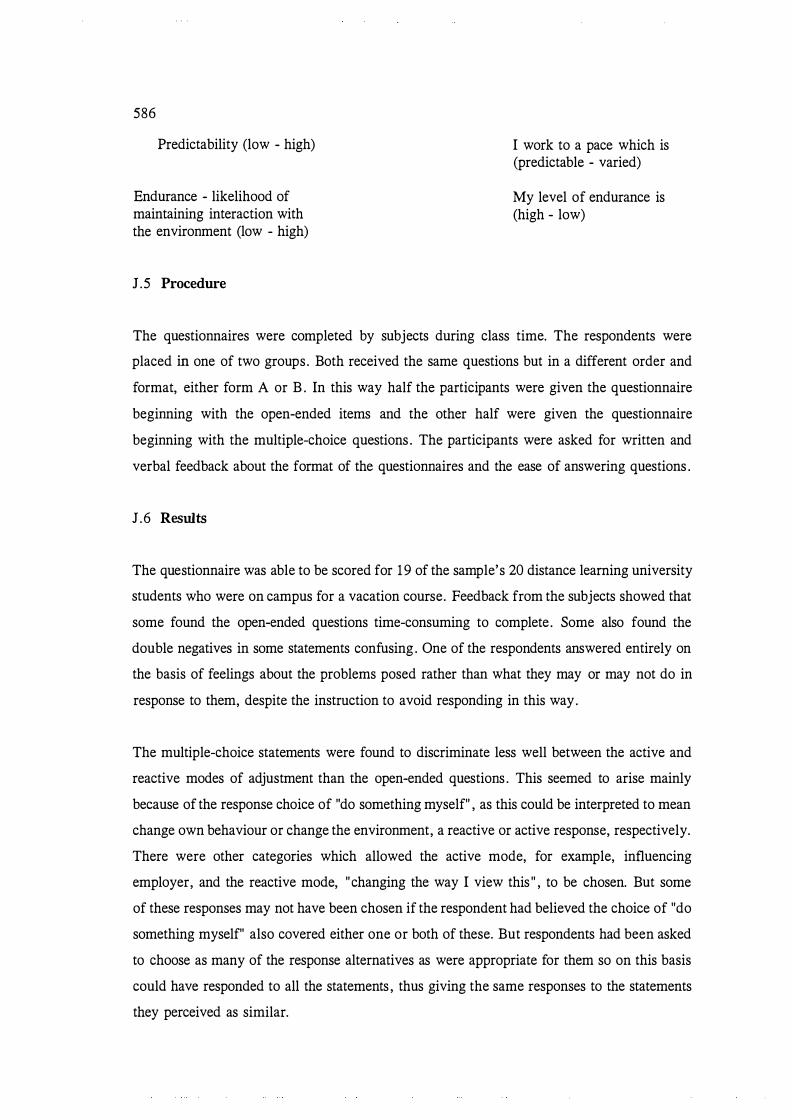
586
Predictability (low - high)
Endurance - likelihood of maintaining interaction with the environment (low - high)
J . 5 Procedure
I work to a pace which is (predictable - varied)
My level of endurance is (high - low)
The questionnaires were completed by subjects during class time. The respondents were
placed in one of two groups. Both received the same questions but in a different order and
format, either form A or B . In this way half the participants were given the questionnaire
beginning with the open-ended items and the other half were given the questionnaire
beginning with the multiple-choice questions . The participants were asked for written and
verbal feedback about the format of the questionnaires and the ease of answering questions .
1 .6 Results
The questionnaire was able to be scored for 19 of the sample's 20 distance learning university
students who were on campus for a vacation course. Feedback from the subjects showed that
some found the open-ended questions time-consuming to complete . Some also found the
double negatives in some statements confusing . One of the respondents answered entirely on
the basis of feelings about the problems posed rather than what they may or may not do in
response to them, despite the instruction to avoid responding in this way.
The multiple-choice statements were found to discriminate less well between the active and
reactive modes of adjustment than the open-ended questions . This seemed to arise mainly
because of the response choice of "do something myself" , as this could be interpreted to mean
change own behaviour or change the environment, a reactive or active response, respectively.
There were other categories which allowed the active mode, for example, influencing
employer, and the reactive mode, "changing the way I view this " , to be chosen. But some
of these responses may not have been chosen if the respondent had believed the choice of "do
something myself" also covered either one or both of these. But respondents had been asked
to choose as many of the response alternatives as were appropriate for them so on this basis
could have responded to all the statements , thus giving the same responses to the statements
they perceived as similar.

587
The open-ended statements seemed to distinguish more easily between the active and reactive
modes, although a smaller range of responses were made under this format. However, this
may not be a l imitation of this format but a strength . The open-ended format response range
may more accurately reflect the responses perceived to be available in the actual work
situation, that is a smaller range than represented by the multiple choice alternatives . Whereas
the multiple-choice format , by providing most of the available alternative responses , may
increase the range of responses but b ias them towards the researcher 's l isted response
alternatives .
The open-ended responses were grouped into the responses of activeness, reactiveness,
flexibil ity , leaving work , and doing something outside work instead . Sometimes respondents
said they would leave their job if another alternative did not work. Such a response could also
be interpreted as an example of persevering, at least initially .
The only responses in the f. category "do something else" which could not be categorised
according to work adjustment theory adjustment styles were those which involved doing
something outside work, unless this could be categorised as doing nothing about the problem
at work. This could be interpreted either as leaving the s i tuation as it is at work, that is being
flexible and tolerating discorrespondence with the environment, or as an active response
external to the job.
In relation to the multiple-choice statements responses were categorised as in Table J .2.
However, a response was categorised as flexible only if it was rated as an important i tem to
that particular respondent. Because if it was not of importance and no response occurred, it
could be reinterpreted s imply as no response due to indifference, rather than a delayed
response or a flexible reaction .
The frequency with which the adjustment styles were used differed . A predominant
adjustment style was able to be identified for each of the respondents . Table J . 3 orders each
subject' s adjustment style according to its frequency of use, frequency represented as a
proportion of thei r total responses .
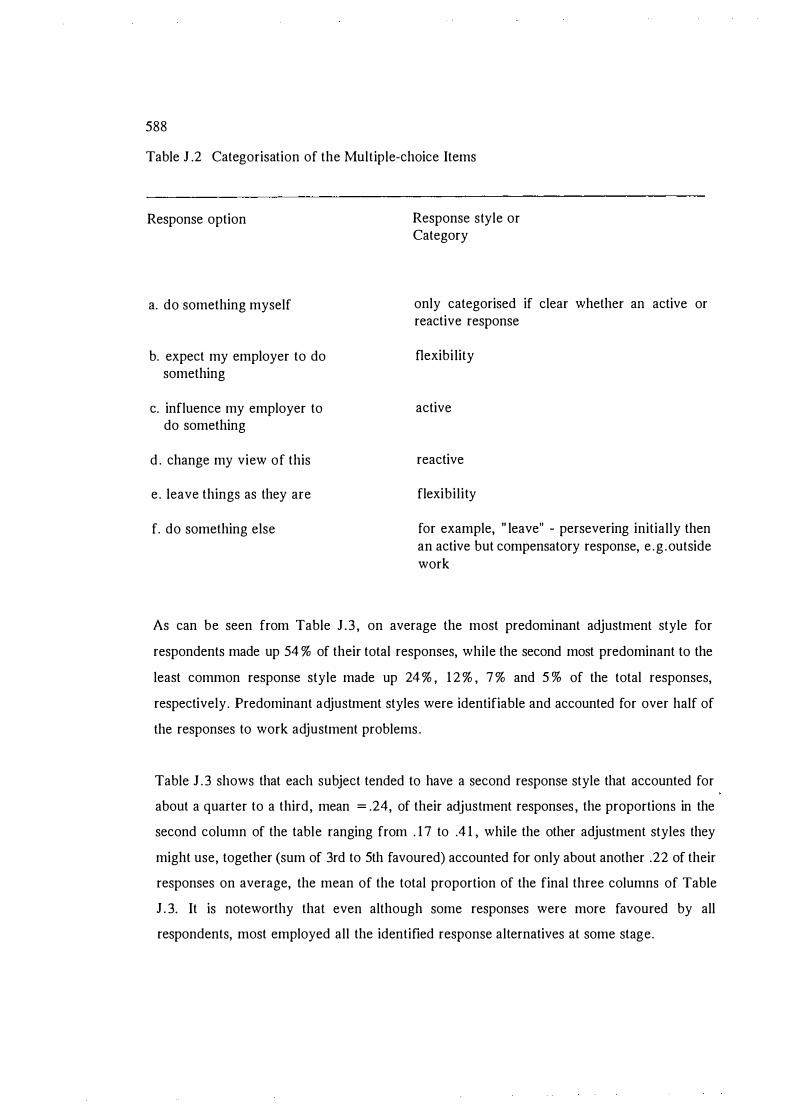
588
Table J .2 Categorisation of the Multiple-choice Items
Response option
a. do something myself
b. expect my employer to do something
c. influence my employer to do something
d . change my view of this
e . leave things as they are
f. do something else
Response style or Category
only categorised if clear whether an active or reactive response
flexibi lity
active
reactive
flexibi l i ty
for example, " leave" - persevering initially then an active but compensatory response, e .g .outside work
As can be seen from Table J .3 , on average the most predominant adjustment style for
respondents made up 54 % of their total responses, while the second most predominant to the
least common response style made up 24 % , 1 2 % , 7 % and 5 % of the total responses,
respectively . Predominant adjustment styles were identifiable and accounted for over half of
the responses to work adjustment problems .
Table J . 3 shows that each subject tended to have a second response style that accounted for
about a quarter to a third, mean = .24, of their adjustment responses , the proportions in the
second column of the table ranging from . 1 7 to .4 1 , while the other adjustment styles they
might use, together (sum of 3rd to 5th favoured) accounted for only about another .22 of their
responses on average, the mean of the total proportion of the final three columns of Table
J . 3. It is noteworthy that even although some responses were more favoured by all
respondents, most employed all the identified response alternatives at some stage.
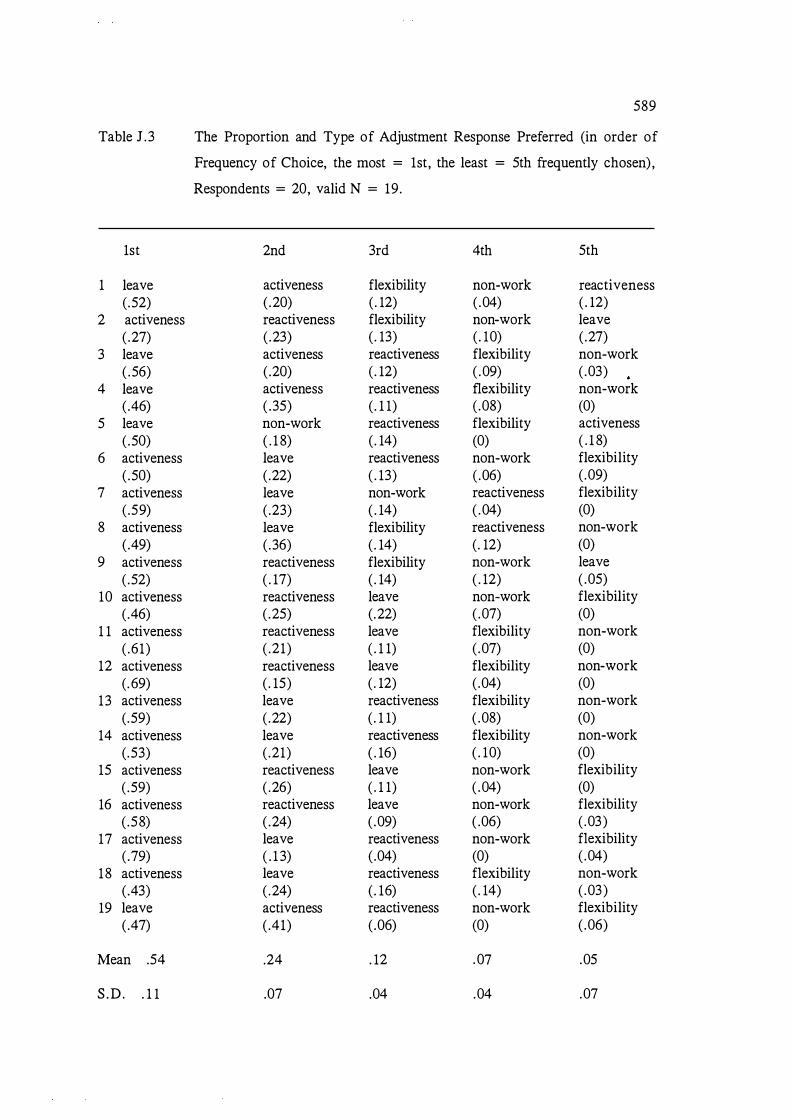
Table J .3
1st
1 leave (.52)
2 activeness ( .27)
3 leave ( .56)
4 leave (.46)
5 leave ( .50)
6 activeness ( .50)
7 activeness ( .59)
8 activeness ( .49)
9 activeness ( .52)
10 activeness ( .46)
1 1 activeness ( .61)
12 activeness (. 69)
13 activeness (.59)
14 activeness (.53)
15 activeness ( .59)
16 activeness ( .58)
17 activeness ( .79)
18 activeness ( .43)
19 leave ( .47)
Mean .54
S .D . . 1 1
589
The Proportion and Type of Adjustment Response Preferred (in order of
Frequency of Choice, the most = 1st, the least = 5th frequently chosen),
Respondents = 20, valid N = 19 .
2nd 3rd 4th 5th
activeness flexibility non-work reactiveness ( .20) ( . 12) ( .04) ( . 12) reactiveness flexibility non-work leave ( .23) ( . 13) ( . 10) ( .27) activeness reactiveness flexibility non-work ( .20) ( . 12) ( .09) ( .03) .
activeness reactiveness flexibility non-work ( .35) ( . 1 1) ( .08) (0) non-work reactiveness flexibility activeness ( . 1 8) ( . 14) (0) ( . 1 8) leave reactiveness non-work flexibility (.22) ( . 13) ( .06) ( .09) leave non-work reactiveness flexibility ( .23) ( . 14) ( .04) (0) leave flexibility reactiveness non-work ( .36) ( . 14) (. 12) (0) reactiveness flexibility non-work leave ( . 17) ( . 14) ( . 12) ( .05) reactiveness leave non-work flexibility ( .25) (.22) ( .07) (0) reactiveness leave flexibility non-work ( .21) ( . 1 1) ( .07) (0) reactiveness leave flexibility non-work ( . 15) ( . 12) ( .04) (0) leave reactiveness flexibility non-work ( .22) ( . 1 1) ( .08) (0) leave reactiveness flexibility non-work ( .21) ( . 16) ( . 10) (0) reactiveness leave non-work flexibility ( .26) ( . 1 1) ( .04) (0) reactiveness leave non-work flexibility ( .24) ( .09) ( .06) ( .03) leave reactiveness non-work flexibility ( . 1 3) ( .04) (0) ( .04) leave reactiveness flexibility non-work ( .24) ( . 16) ( . 14) ( .03) activeness reactiveness non-work flexibility ( .41) ( .06) (0) ( .06)
.24 . 12 .07 .05
.07 .04 .04 .07
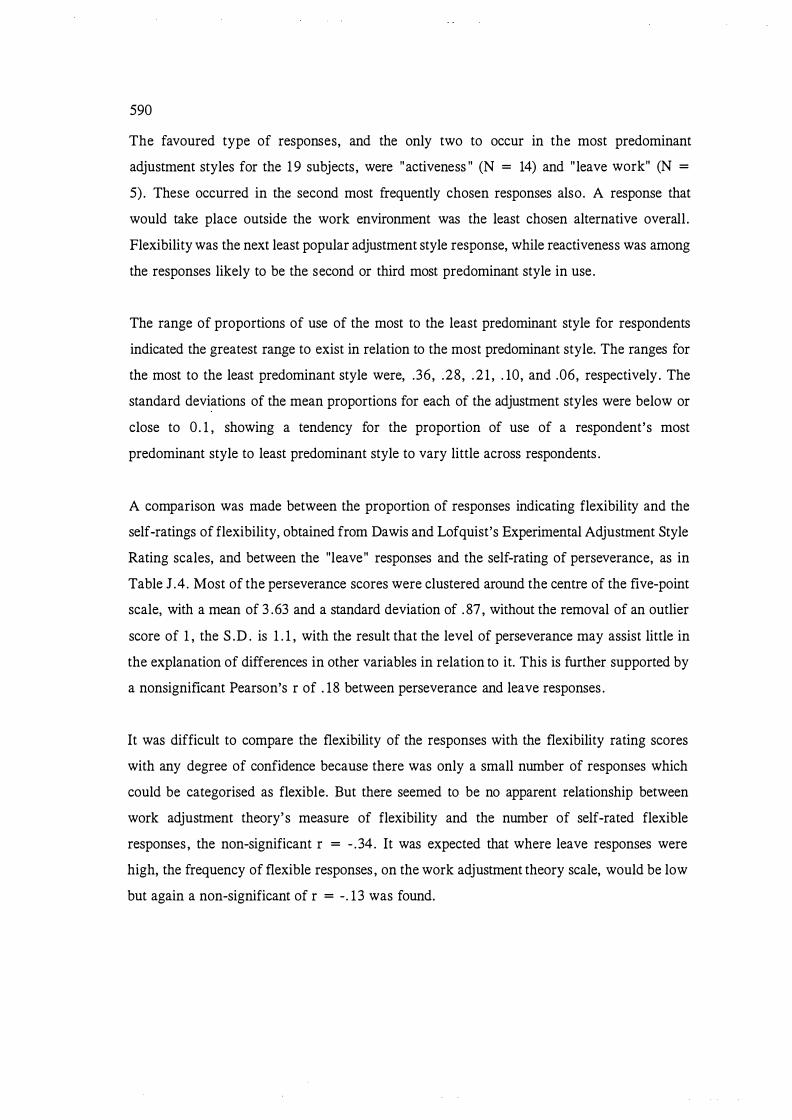
590
The favoured type of responses, and the only two to occur in the most predominant
adjustment styles for the 1 9 subjects , were "activeness " (N = 14) and " leave work" (N =
5) . These occurred in the second most frequently chosen responses also. A response that
would take place outside the work environment was the least chosen alternative overall .
Flexibility was the next least popular adjustment style response, while reactiveness was among
the responses likely to be the second or third most predominant style in use .
The range of proportions of use of the most to the least predominant style for respondents
indicated the greatest range to exist in relation to the most predominant style. The ranges for
the most to the least predominant style were, .36, .28, . 2 1 , . 10, and .06, respectively. The
standard deviations of the mean proportions for each of the adjustment styles were below or
close to 0 . 1 , showing a tendency for the proportion of use of a respondent's most
predominant style to least predominant style to vary little across respondents .
A comparison was made between the proportion of responses indicating flexibility and the
self-ratings of flexibility, obtained from Dawis and Lofquist's Experimental Adjustment Style
Rating scales, and between the "leave" responses and the self-rating of perseverance, as in
Table J .4 . Most of the perseverance scores were clustered around the centre of the five-point
scale, with a mean of 3 .63 and a standard deviation of . 87 , without the removal of an outlier
score of 1 , the S . D . is 1 . 1 , with the result that the level of perseverance may assist little in
the explanation of differences in other variables in relation to it. This is further supported by
a nonsignificant Pearson's r of . 18 between perseverance and leave responses .
It was difficult to compare the flexibility of the responses with the flexibility rating scores
with any degree of confidence because there was only a small number of responses which
could be categorised as flexible. But there seemed to be no apparent relationship between
work adjustment theory's measure of flexibility and the number of self-rated flexible
responses , the non-significant r = - . 34 . It was expected that where leave responses were
high, the frequency of flexible responses , on the work adjustment theory scale, would be low
but again a non-significant of r = - . 1 3 was found.
591
Table J .4 The Proportion of Respondents ' Responses to Dawis and Lofquist ' s Scale and the
Items of the Preliminary Study Classified as Representing Flexibility and
Perseverance
Mean ratings on Dawis and Lofquist 's Adjustment Style Rating Form ( 1984) (1 = low, 5 = high)
Mean rating
Flexibility
1 2 .0 2 4 .5 3 1 .0 4 3 . 9 5 3 . 9 6 2 .9 7 4.0 8 3 .0 9 3 . 5 10 3 .0 1 1 1 .0 12 4.0 1 3 3 .0 14 4.0 15 4.0 16 5 .0 17 2 .5 18 1 .2 19 5 .0
3 .2
1 .2
Note. a. S = Subjects
Perseverance
3 . 5 3 . 9 4 .0 4.2 3 . 9 4 .6 3 .2 3 .0 2 .3 2 .0 4.0 2 .9 4 .0 5 .0 4 .0 5 .0 3 . 5 1 .0 5 .0
3 . 6
1 . 1
Proportion of responses in each category for multiple choice and open-ended questions of the preliminary study
Proportion
Flexibility Leave
. 12 .52
. 13 .27
.09 .56
.08 .46 0 .50
.09 .22 0 .23
. 14 .36
. 14 .05 0 .22
.07 . 1 1
.04 . 12
.08 .22 . 10 .21 0 . 1 1
.03 .09
.04 . 13
. 14 .24
.06 .47
.07 .27 Mean
.05 . 16 S .D .
The relationship between Dawis and Lofquist's flexibility and their perseverance ratings, in
first two columns of able J .4, were not significant. High flexibility on the work adjustment
theory measure did not seem to be associated with perseverance as measured on the same
rating form. When perseverance was correlated with the work problem questionnaire measure
of flexibility it was also not significant. On the work problem questionnaire the proportion
of flexibility responses correlated with the leave work responses only . 14.
592
No response bias on the 5-point scale was found. Some subjects found the definitions of the
adjustment styles on Dawis and Lofquist's rating form too difficult to understand.
J . 7 Discussion
Dawis and Lofquist 's modes were all able to be identified as in use but another category to
include an outside work response seemed to be required. Although adjustment responses made
out of the work context might be able to be categorised in the same way as those occurring
in the work setting (as active or reactive etc.) they might be better regarded as compensatory
adjustment responses . To adopt Dawis and Lofquist' s categorisation such responses would
have to be regarded as examples of flexibility (not acting to reduce discorrespondence) .
That neither types of measures of flexibility and perseverance correlated significantly within
or between the two instruments , Dawis and Lofquist's rating forms and the pilot study work
problem questionnaire, may be related to construct rather than measurement validity issues .
The flexibility and perseverance constructs may not be as independent as they appear at
first sight. One could be flexible, that is , tolerate discorrespondence with the environment
before acting but not necessarily maintain adjustment behaviour (persevere) under conditions
of continuing discorrespondence. Alternatively one could demonstrate low flexibility by acting
quickly to reduce discorrespondence and also demonstrate perseverance by maintaining such
adjustment behaviour under continuing discorrespondence.
J . 8 Conclusions
Any implications the results may have for the construct validity of the adjustment styles may
need to be treated with caution because of the small number in this preliminary study. But
in relation to its aims, all the subjects appear to expect to use a variety of adjustment styles .
The styles were able to be categorised using Dawis and Lofquist's classification system. Non
work compensatory adjustment also occurred and such responses are not covered explicitly
in Dawis and Lofquist's work unless they are regarded as the same type of adjustment
responses but ones which are simply made in a different context. In this way they could be
either active, or reactive compensatory adjustment responses .

593
The Experimental Adjustment Style Rating form may be of use when compared with data
from sentence completion tasks for work adjustment problems, and/or with data from other
sources such as supervisor ratings . Similarly, the Experimental Personality Style Rating form
may be of use when compared with results from sources such as a personality inventory.
However, the wording as it stands would be better simplified because subjects criticised
Dawis and Lofquist's Rating Forms for their complexity.
For use in the present study it was concluded that, the questionnaire could be shortened by
generating work problems not from the 20 separate work needs but from the six underlying
values (or reference dimensions) of Gay, Weiss, Hendel, Dawis and Lofquist 's (1971) factor
analyses . However, this would have validity only if these factors were replicated in the
present study. Although a multiple-choice format would enable quicker administration of a
questionnaire it would need to discriminate better among the different adjustment styles .
Needs other than those of Dawis and Lofquist could be included. A measure of the likelihood
of a respondent using a particular style would be useful . This information could be obtained
through questions such as the degree to which each style is used. But in order to use the
multiple-choice format the degree to which questions were able to discriminate among
adjustment styles would need to be determined empirically .
An investigation of adjustment styles formed only a small part of the present research,
consequently the development of an empirically determined adjustment style instrument was
not attempted. It seemed that a questionnaire similar to that of Dawis and Lofquist's
experimental rating forms but with different more simple definitions could be used.
It was decided that the locus of a response could be identified in advance with a statement
preceding the rating task. This would indicate that the statements and rating task apply to the
work setting. Rather than creating specific work problems, the rating forms could just assess
in general the degree to which each of the rating styles are favoured by the respondent.
Definitions or descriptions of the adjustment styles were arrived at and their ease of
understanding assessed by asking a small number of individuals to rate their own degree of
flexibility, activeness , reactiveness, and perseverance, as well as their celerity, effort, pace
and endurance according to these definitions . No difficulty was expressed in understanding

594
the definitions or in completing the rating task itself. It was concluded such an instrument
would be appropriate for the main study.
K. l The General LISREL Model
APPENDIX K
K.2 Work need factor analysis matrices
595
K.3 LISREL confirmatory factor analysis of the correlated factor (oblique) model of work
needs
K.4 The LISREL modelling history
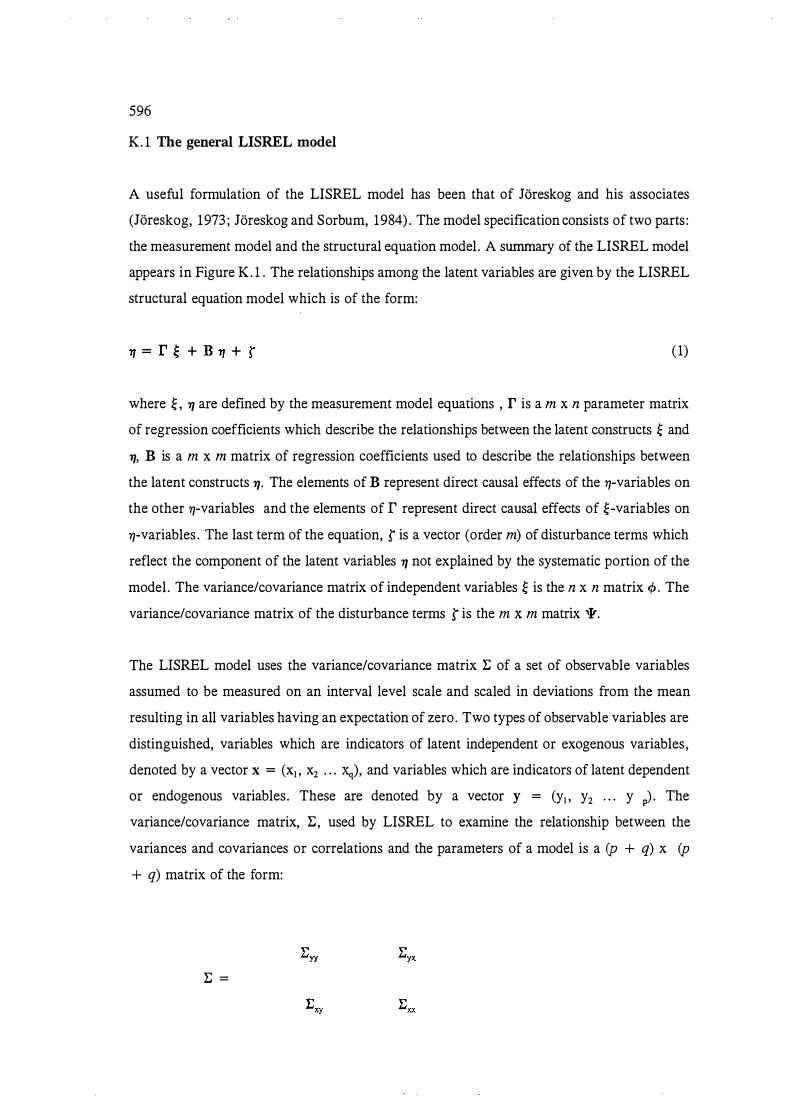
596
K. 1 The general LISREL model
A useful formulation of the LISREL model has been that of Joreskog and his associates
(Joreskog, 1973 ; Joreskog and Sorbum, 1984) . The model specification consists of two parts :
the measurement model and the structural equation model . A summary of the LISREL model
appears in Figure K. 1 . The relationships among the latent variables are given by the LISREL
structural equation model which is of the form:
( 1)
where � , 11 are defined by the measurement model equations , r is a m x n parameter matrix
of regression coefficients which describe the relationships between the latent constructs � and
17, B is a m x m matrix of regression coefficients used to describe the relationships between
the latent constructs 11· The elements of B represent direct causal effects of the 17-variables on
the other 17-variables and the elements of r represent direct causal effects of �-variables on
17-variables . The last term of the equation, 5" is a vector (order m) of disturbance terms which
reflect the component of the latent variables 11 not explained by the systematic portion of the
model . The variance/covariance matrix of independent variables � is the n x n matrix </J . The
variance/covariance matrix of the disturbance terms r is the m X m matrix V.
The LISREL model uses the variance/covariance matrix E of a set of observable variables
assumed to be measured on an interval level scale and scaled in deviations from the mean
resulting in all variables having an expectation of zero. Two types of observable variables are
distinguished, variables which are indicators of latent independent or exogenous variables ,
denoted by a vector x = (x1 , x2 • • • Xq), and variables which are indicators of latent dependent
or endogenous variables . These are denoted by a vector y = (y1 , y2 • • • y p) . The
variance/covariance matrix, E, used by LISREL to examine the relationship between the
variances and covariances or correlations and the parameters of a model is a (p + q) x (p
+ q) matrix of the form:
E =

597
where I:YY is the variance/covariance matrix of the endogenous variables y, Exx is the
variance/covariance matrix of the exogenous variables x, and I:xy = I: yx is the covariance
matrix of the x and y variables .
In the general LISREL model the x, and y, variables are assumed to be indicators of latent
constructs which are less in number. The latent constructs which correspond to the x variables
are denoted by the vector � = (�1 . . .� ;) and the latent constructs which correspond to the y
variables are denoted by the vector 1J = (1J1 . . . 1Jm) . A set of linear equations (equations 2 and
3) which define the LISREL measurement model link the observed variables x, y , to the
theoretical constructs .
The measurement model for the x variables is :
(2)
where Ax is a q x n parameter matrix of regressions coefficients describing the relationship
between the observed variables x and the latent constructs � and o is a vector (order q) of
disturbance terms. These disturbance terms reflect the x variables ' errors of measurement.
These are derived by estimating the percentage of the variance terms estimated to be due to
measurement error. The variance/covariance matrix of the disturbance o is the (qxq) matrix
9,;. The disturbances o are assumed to be uncorrelated with the latent constructs � .
The y variables measurement model is :
(3)
where AY is a p x m parameter matrix of regression coefficients which describes the
relationship between the observed variables y and their corresponding latent constructs 1J, and
E is a vector of the order p of the disturbance terms representing the errors of measurement
in the y variables . The variance/covariance matrix of the terms E is the (pxp) matrix e,�The
disturbance terms E are assumed to be uncorrelated with latent variables 11·
A summary of the LISREL model appears in Figure K. l . where each of the three equations
in the General model are given also in matrix form and notation.
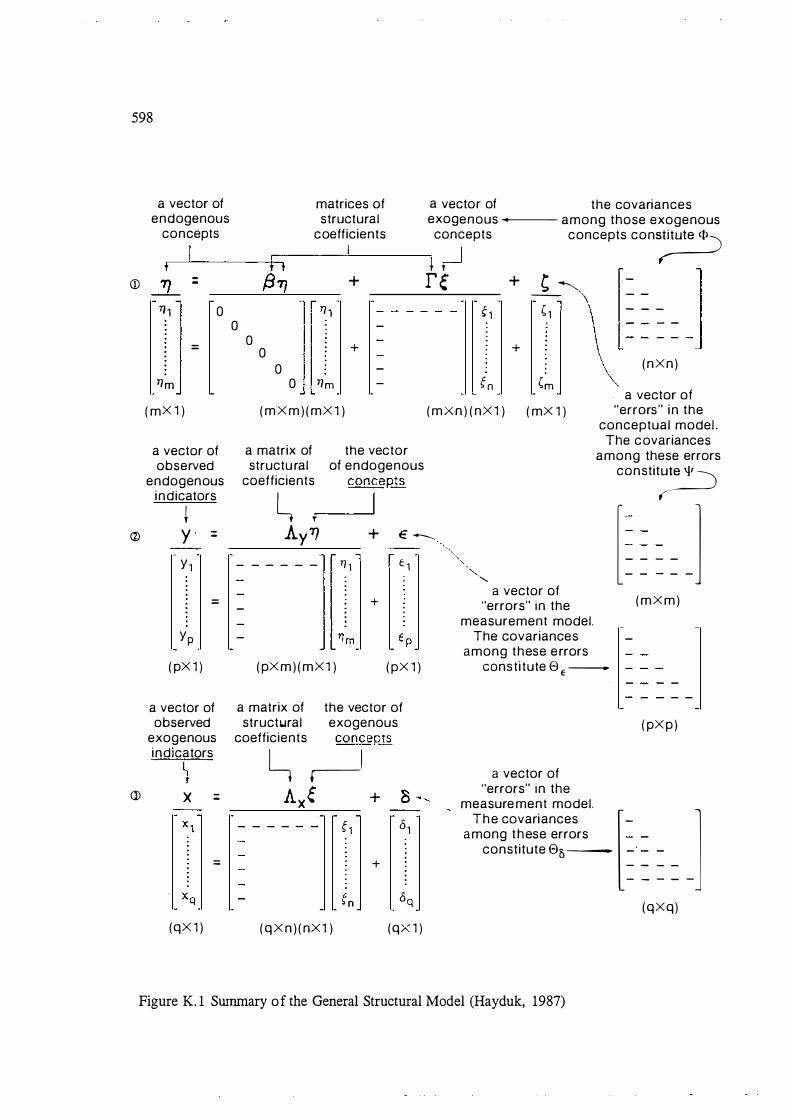
598
<D
�
a vector of end ogenous
concepts
_!1_ :
7]1 0
=
1Jm
( mX 1 )
a vector of observed
endogen ous i n d icators
i y · Y,
Yp
( pX 1 )
=
=
a vector of observed
exogenous i n dicators
1 Q) X :
=
(qX 1 )
0 0
0 0
matrices of structural
c oefficients
0 1Jm
+
+
( m X m ) ( m X 1 )
a matrix of the vector structu ral of endogenous
coefficients conceP.tS
L. I t
a vector of exogenous
concepts
_j '
re-
the covariances ...--- among those exogenous
c oncepts c o ns� +
+
c �. -
-- \ - -� , - - -. - - - -
; ( n X n )
�n ( m X n ) ( n X 1 )
�m "" a vector of
( mX 1 ) "errors" i n the conceptual modeL
The c ovariances among these errors
cons t i t� AyTJ + € ............._ l= = = = J - - - - - - 77 1 t ,
+
( pX m ) ( m X 1 ) ( pX 1 )
a matrix of structural
coefficients
the vector of exogenous
conceP.tS
L. .---J Axt +
- - - - - - �1 61
+
( q X n ) ( nX 1 )
bq
(q X 1 )
'"" '
'"-" a vector of
"errors" in the measurement model.
The covariances among t h ese e rrors
COnS t i tute 0 E �
a vector of "errors" in the
measure ment model.
( m X m )
( pX p )
T h e covari ances [ l a mong t h ese errors
-
const i tute e5 --- - - - -- -
-.,._
-
( q X q )
Figure K. l Summary o f the General Structural Model (Hayduk, 1987)
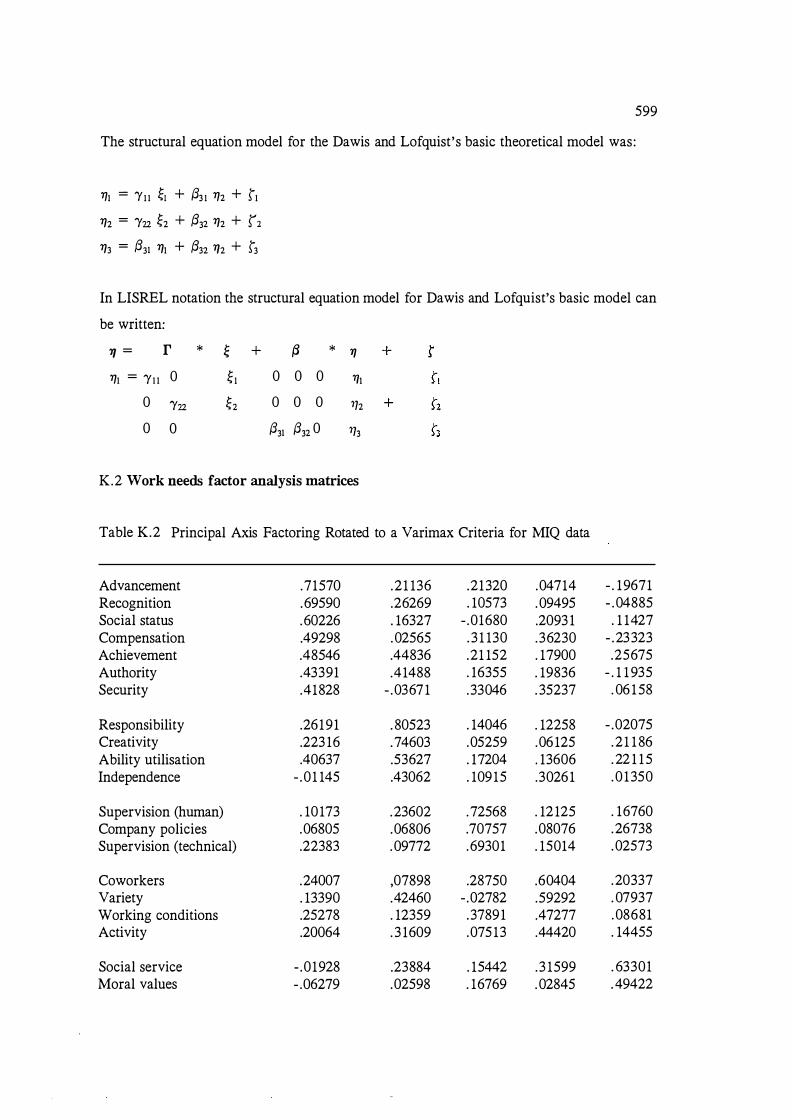
599
The structural equation model for the Dawis and Lofquist's basic theoretical model was:
1J1 = 'Y11 �I + {331 1J2 + r1
rr2 = 'Y22 �2 + f332 rr2 + r2 rr3 = f331 rr1 + f332 112 + r3
In LISREL notation the structural equation model for Dawis and Lofquist's basic model can
be written:
rr = r * � + {3 * 11
1J1 = 'Yu 0 �I 0 0 0 711 0 'Y22 �2 0 0 0 712 0 0 {331 {332 0 713
K.2 Work needs factor analysis matrices
Table K.2 Principal Axis Factoring Rotated to a Varimax Criteria for MIQ data
Advancement .71570 .21 136 .21320 .04714 - . 19671 Recognition .69590 .26269 . 10573 .09495 - .04885 Social status .60226 . 16327 - .01680 .2093 1 . 1 1427 Compensation .49298 .02565 . 3 1 130 .36230 - .23323 Achievement .48546 .44836 .21 152 . 17900 .25675 Authority .43391 .41488 . 16355 . 19836 - . 1 1 935 Security .41828 - .0367 1 .33046 . 35237 . 06 1 58
Responsibility .26191 . 80523 . 14046 . 12258 - .02075 Creativity .223 16 .74603 .05259 .06 125 .2 1 1 86 Ability utilisation .40637 .53627 . 17204 . 13606 . 22 1 1 5 Independence - .01 145 .43062 . 10915 .30261 . 0 1350
Supervision (human) . 10173 .23602 .72568 . 12 125 . 16760 Company policies .06805 .06806 .70757 .08076 .26738 Supervision (technical) .22383 .09772 .69301 . 15014 .02573
Coworkers .24007 ,07898 .28750 .60404 .20337 Variety . 13390 .42460 -.02782 .59292 . 07937 Working conditions .25278 . 12359 .37891 .47277 .08681 Activity .20064 . 3 1609 .07513 .44420 . 14455
Social service - .01928 .23884 . 15442 .3 1599 . 63301 Moral values - .06279 .02598 . 16769 .02845 . 49422
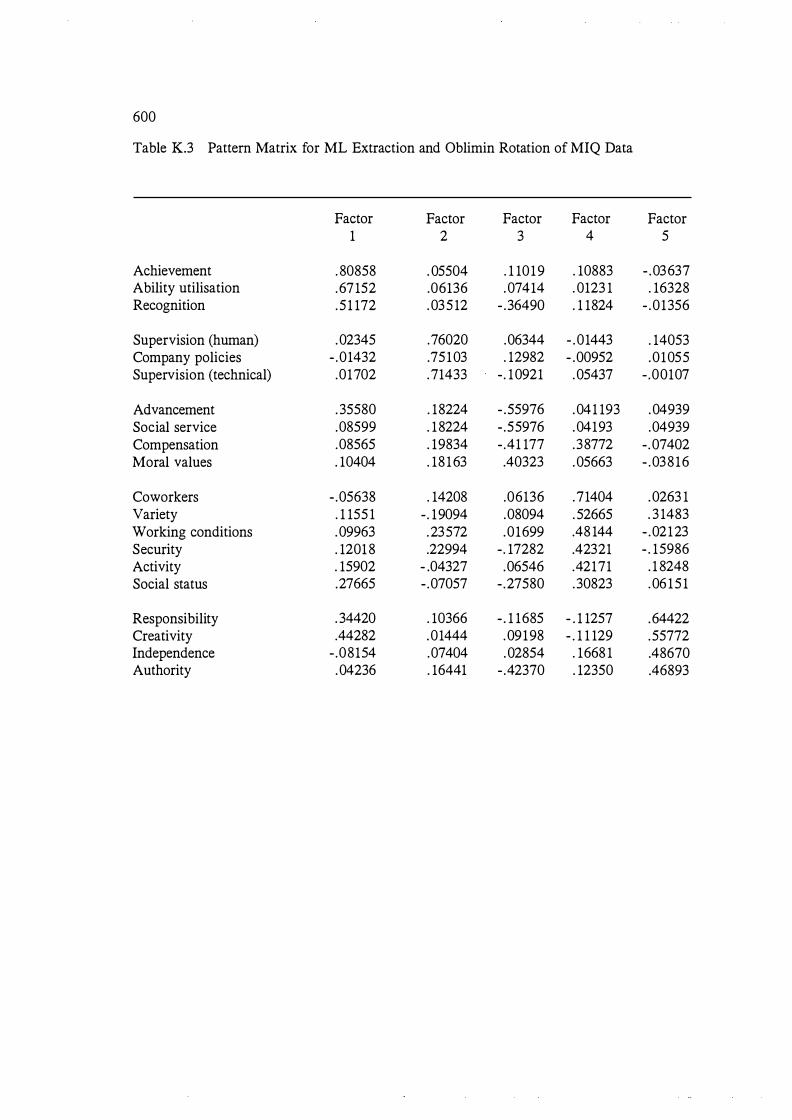
600
Table K.3 Pattern Matrix for ML Extraction and Oblimin Rotation of MIQ Data
Factor Factor Factor Factor 1 2 3 4
Achievement . 80858 . 05504 . 1 1019 . 10883 Ability utilisation .67152 .06136 .07414 . 0123 1 Recognition . 5 1 172 .03512 - .36490 . 1 1824
Supervision (human) .02345 .76020 .06344 - .01443 Company policies - .01432 .75103 . 12982 - .00952 Supervision (technical) .01702 .71433 - . 10921 .05437
Advancement . 35580 . 18224 - .55976 .041 193 Social service .08599 . 18224 - .55976 .04193 Compensation .08565 . 19834 - .41 177 .38772 Moral values . 10404 . 18 163 .40323 .05663
Coworkers - .05638 . 14208 .06136 .71404 Variety . 1 155 1 - . 19094 .08094 . 52665 Working conditions .09963 .23572 .01699 .48 144 Security . 1201 8 .22994 -. 17282 .42321 Activity . 15902 - .04327 .06546 .42171 Social status .27665 - .07057 - .27580 .30823
Responsibility . 34420 . 10366 - . 1 1685 - . 1 1257 Creativity .44282 .01444 .09198 - . 1 1 129 Independence - .08154 .07404 .02854 . 1668 1 Authority .04236 . 16441 - .42370 . 12350
Factor 5
- .03637 . 16328
- .01356
. 14053
.01055 - .00107
.04939
.04939 - .07402 - .03816
.0263 1
. 3 1483 - .02123 - . 15986 . 1 8248 .06 15 1
.64422
.55772
.48670
.46893
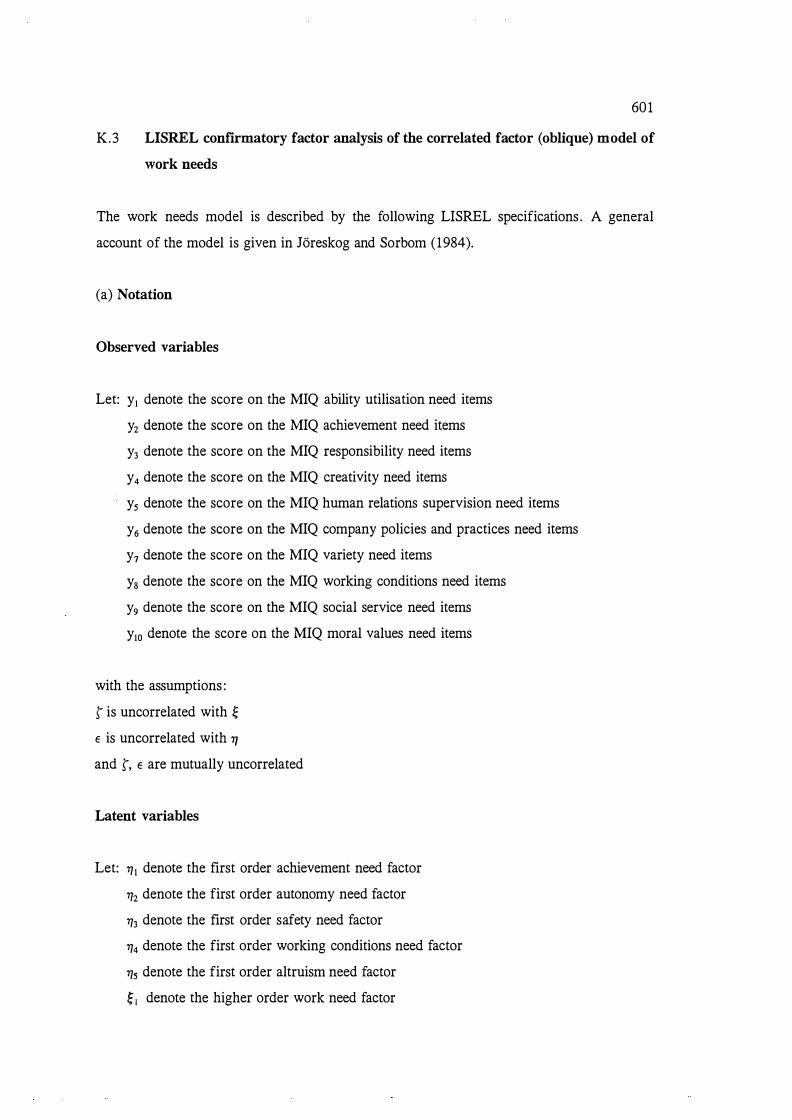
601
K.3 LISREL confirmatory factor analysis of the correlated factor (oblique) model of
work needs
The work needs model is described by the following LISREL specifications . A general
account of the model is given in Joreskog and Sorbom (1984).
(a) Notation
Observed variables
Let: y1 denote the score on the MIQ ability utilisation need items
y2 denote the score on the MIQ achievement need items
y3 denote the score on the MIQ responsibility need items
y4 denote the score on the MIQ creativity need items
y5 denote the score on the MIQ human relations supervision need items
y6 denote the score on the MIQ company policies and practices need items
y7 denote the score on the MIQ variety need items
y8 denote the score on the MIQ working conditions need items
y9 denote the score on the MIQ social service need items
y10 denote the score on the MIQ moral values need items
with the assumptions :
s is uncorrelated with �
E is uncorrelated with 'Y/
and S, E are mutually uncorrelated
Latent variables
Let: 'Y/1 denote the first order achievement need factor
'Y/2 denote the first order autonomy need factor
'Y/3 denote the first order safety need factor
'Y/4 denote the first order working conditions need factor
'Y/s denote the first order altruism need factor
� 1 denote the higher order work need factor
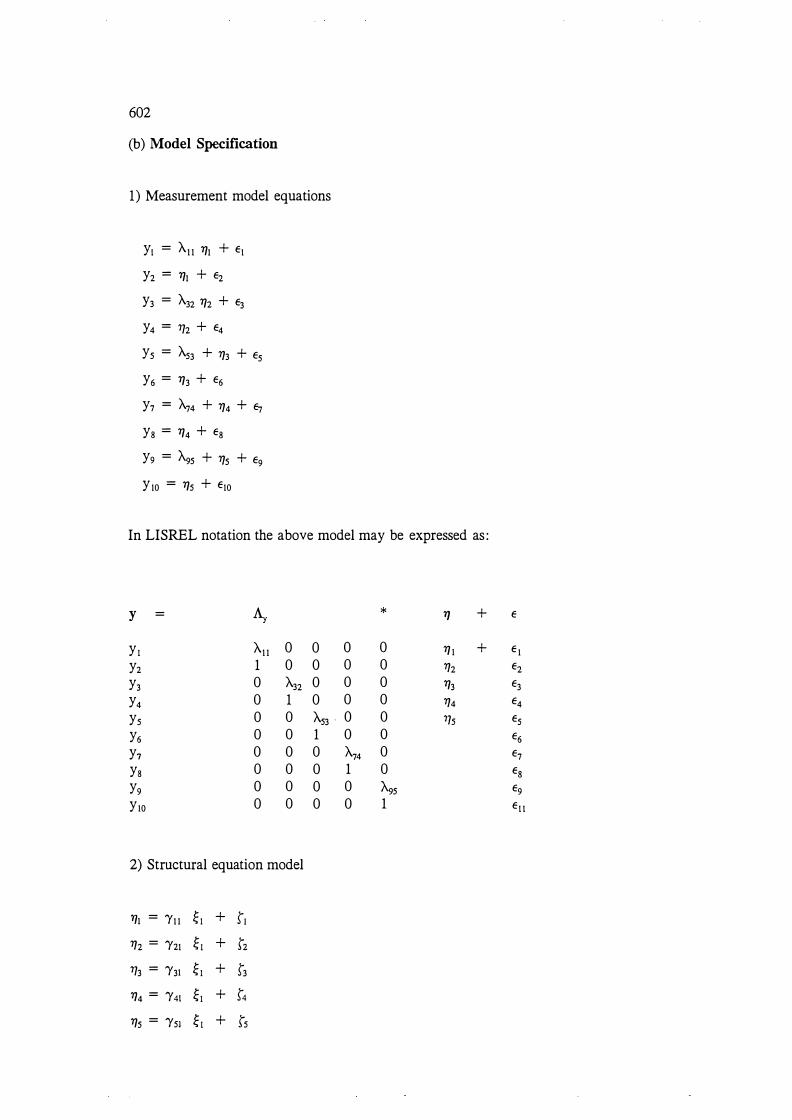
602
(b) Model Specification
1) Measurement model equations
Y1 = Au 111 + E1
Y2 = 111 + E2 y 3 = A32 112 + E3
Y4 = 112 + E4
Y 5 = As3 + 173 + E5 Y6 = 113 + E6
Y7 = A74 + 174 + E7
Ys = 114 + Es
Y9 = �5 + 175 + E9
Yw = 11s + Ew
In LISREL notation the above model may be expressed as :
y = Ay * 11 +
YI Au 0 0 0 0 11! + Y2 1 0 0 0 0 172 Y3 0 A32 0 0 0 113 Y4 0 1 0 0 0 174 Ys 0 0 A53 · 0 0 115 Y6 0 0 1 0 0 Y1 0 0 0 A74 0 Ys 0 0 0 1 0 Y9 0 0 0 0 �5 Yw 0 0 0 0 1
2) Structural equation model
"11 = 'Yu �I + r�
172 = 'Y2! � I + tz
113 = 'Y3! � I + r3
'f74 = 'Y41 �I + r4
115 = 'Ys1 � I + ts
E
E l E2 E3 E4 Es E6 E7 Eg E9 E1 1
603
In LISREL notation these equations may be written as:
rJ = r � + 5
'Y/i I'll � I 5, 'Y/2 1'21 52 'Y/3 1'31 53 Y/4 1'41 54 YJs 1'51 5s
c) Identification
The model is over-identified. This can be seen from the fact there are 55 variances and
covariances (distinct equations) of the 10 observed variables and these variances and
covariances are reproduced from 30 model parameters , leaving a model with 25 degrees of
freedom (55-30 = 25) . These 30 parameters are:
1) 5 coefficients 'Yi
2) 5 coefficients \
3) 5 variances of the disturbances 5i
4) 2 covariances 5, 52 and 53 5s 5) 10 variances of the error terms ei
6) 3 covariances of the error terms e3 e10, e4 e9 and e6 e8
d) Estimation
The model was solved by using maximum likelihood estimation from the 10 x 10 correlation
matrix of the observed variables . The likelihood-ratio chi-square calculated by LISREL is
defined in detail in Hayduk (1987) .
e) Significance tests
Tests of significance of the model parameters were from t statistics based upon the ratio of
the estimated parameter to the estimated asymptotic standard error. Tests of significance are
in Table K.4 .3 .
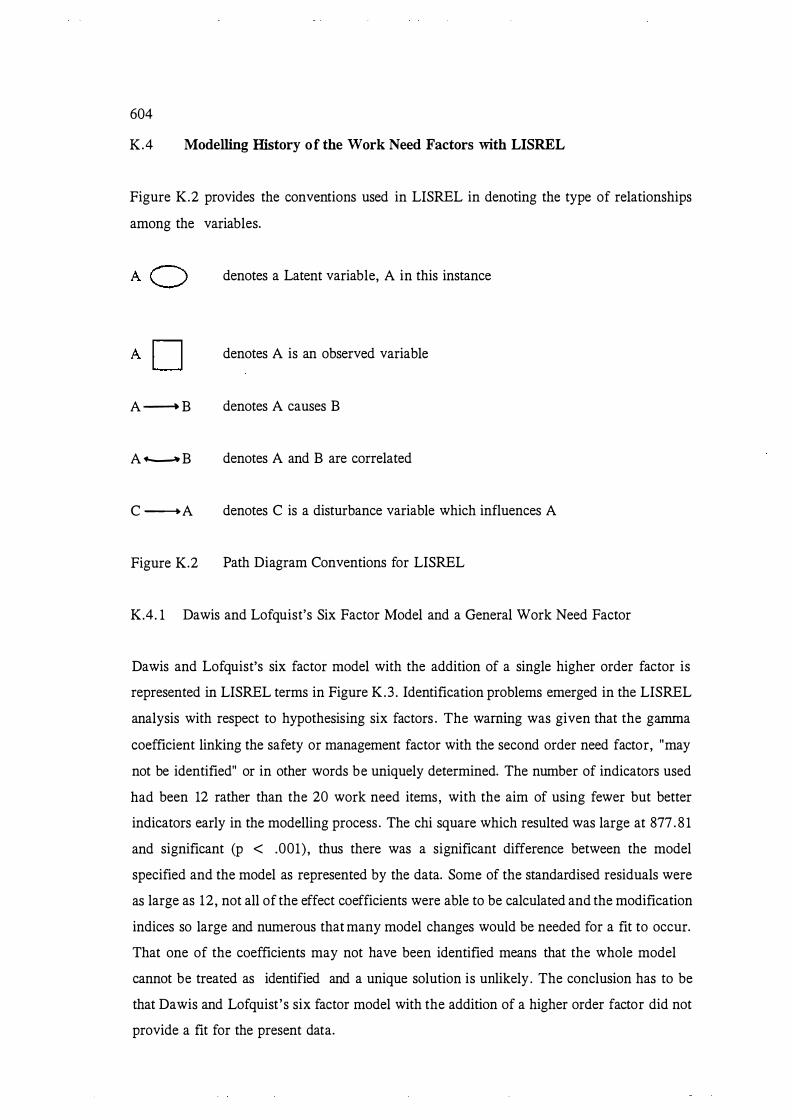
604
K.4 Modelling History of the Work Need Factors with LISREL
Figure K.2 provides the conventions used in LISREL in denoting the type of relationships
among the variables.
denotes a Latent variable, A in this instance
denotes A is an observed variable
A----+ B denotes A causes B
A - B denotes A and B are correlated
C ----+ A denotes C is a disturbance variable which influences A
Figure K.2 Path Diagram Conventions for LISREL
K.4. 1 Dawis and Lofquist's Six Factor Model and a General Work Need Factor
Dawis and Lofquist's six factor model with the addition of a single higher order factor is
represented in LISREL terms in Figure K.3 . Identification problems emerged in the LISREL
analysis with respect to hypothesising six factors . The warning was given that the gamma
coefficient linking the safety or management factor with the second order need factor, "may
not be identified" or in other words be uniquely determined. The number of indicators used
had been 12 rather than the 20 work need items, with the aim of using fewer but better
indicators early in the modelling process . The chi square which resulted was large at 877 .8 1
and significant (p < .001), thus there was a significant difference between the model
specified and the model as represented by the data. Some of the standardised residuals were
as large as 12, not all of the effect coefficients were able to be calculated and the modification
indices so large and numerous that many model changes would be needed for a fit to occur.
That one of the coefficients may not have been identified means that the whole model
cannot be treated as identified and a unique solution is unlikely. The conclusion has to be
that Dawis and Lofquist 's six factor model with the addition of a higher order factor did not
provide a fit for the present data.
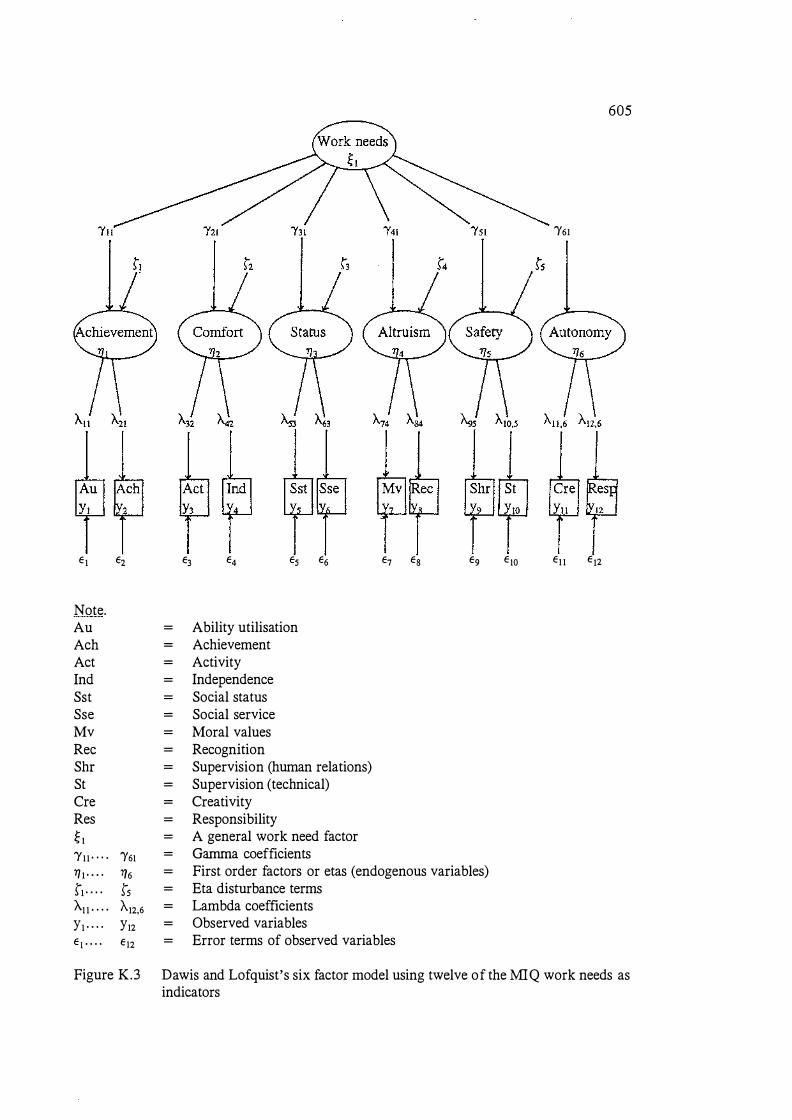
605
'¥61
El €2 €3 €4 Es €6 €7 Eg Eg Ew Eu €12
Note. Au = Ability utilisation Ach = Achievement Act = Activity Ind = Independence Sst = Social status Sse = Social service Mv = Moral values Rec = Recognition Shr = Supervision (human relations) St = Supervision (technical) Cre = Creativity Res = Responsibility � I = A general work need factor 'Yll · . . . '¥61 = Gamma coefficients 171 · • • • 176 = First order factors or etas (endogenous variables) s-1 · · · · S"s = Eta disturbance terms Au · · · · )\12,6 = Lambda coefficients Yl · · · · Y12 = Observed variables EJ · · · · €12 = Error terms of observed variables
Figure K.3 Dawis and Lofquist's six factor model using twelve of the MIQ work needs as indicators
606
K.4.2 Five Factor Model with No Observed Error
A five factor, plus one higher order factor, model with no observed variable error terms as
depicted in Figure K.4, produced a X: of 139.5 (p < .001). The suggested modification of
that model which would produce the greatest change in the fit was to link the observed
variable or indicator of working conditions to the management factor (introduce a A-8•3). This
could be justified substantively, because supervision and company policies (the items which
make up the management factor) could also be considered to be working conditions . Because
the observed variables were measured by items of the same instrument, the MIQ, some
correlation among them could be expected. At the very least the items of the MIQ would have
common method variance. However, one would expect the method variance to affect all MIQ
items equally . Some of the items may have been more interrelated than others conceptually.
The working condition statement in the MIQ "The j ob would have good working conditions "
in particular could be regarded as being related to and subsuming many of the other items .
It is not surprising that a better fit of the model is attained by treating it as an indicator of
another latent factor. That the factors are correlated, suggesting the presence of a higher
factor or factors leads to the expectation that some indicators will influence more than one
work need factor.
In examining the modelling history to this point, the differences between the X:s , itself
distributed as X:, for the different models were themselves significant, demonstrating an
improvement in fit for each model. Introducing a link between the working conditions
indicator and the management factor for the five factor model with no specification of error
terms produced a significant difference in X: (139.50-109 .94) of 29.56, with (30-29) = 1 d .f
> X: crit = 10 .827, p < . 00 1 . Factor analysis showed working conditions and management
factors to be significantly correlated (see Figures 8.4 and 8 .5 . ) . Without freeing the
coefficient linking working conditions to the management factor but introducing the large
sample size correction of specifying an N of 200, x2 was reduced by a similar amount, the
difference was ( 139 .50 - 105 .00) = 34.67 with 1 . d .f. p, < .00 1 , (d.f = d.f. 2 - d.f. I > i .e .
30 - 29 = 1) . Both changes to the model produced similar chi-squares . The working
conditions indicator and management factor link was suspected to be one of many such links,
the exploration of which was better pursued using the full set of work needs through the
factor analyses and higher order factor analyses reported in chapter eight. Therefore, the
effect of modelling just a single higher order work need and correlated error terms were
focused upon in the remaining LISREL analyses .

607
'Yu A.s,
Note. A eh = Achievement Aut = Autonomy Mgte = Management We = Working conditions Alt = Altruism Au = Ability utilisation A eh = Achievement Res = Responsibility Cre = Creativity Shr = Supervision (human relations) Cpp = Company policies and practices Var = Variety We = Working conditions Sse = Social service Mv = Moral values � I = A general work need factor "fll · . . . 'Ys1 = Gamma coefficients 171 · · . . TJs = First order factors (endogenous variables) r, . . . . ts = Eta disturbance terms A.u . . . . 11.10,5 = Lambda coefficients y, . . . . Yw = Observed variables
Figure K.4 Five factor model with no observed variable error
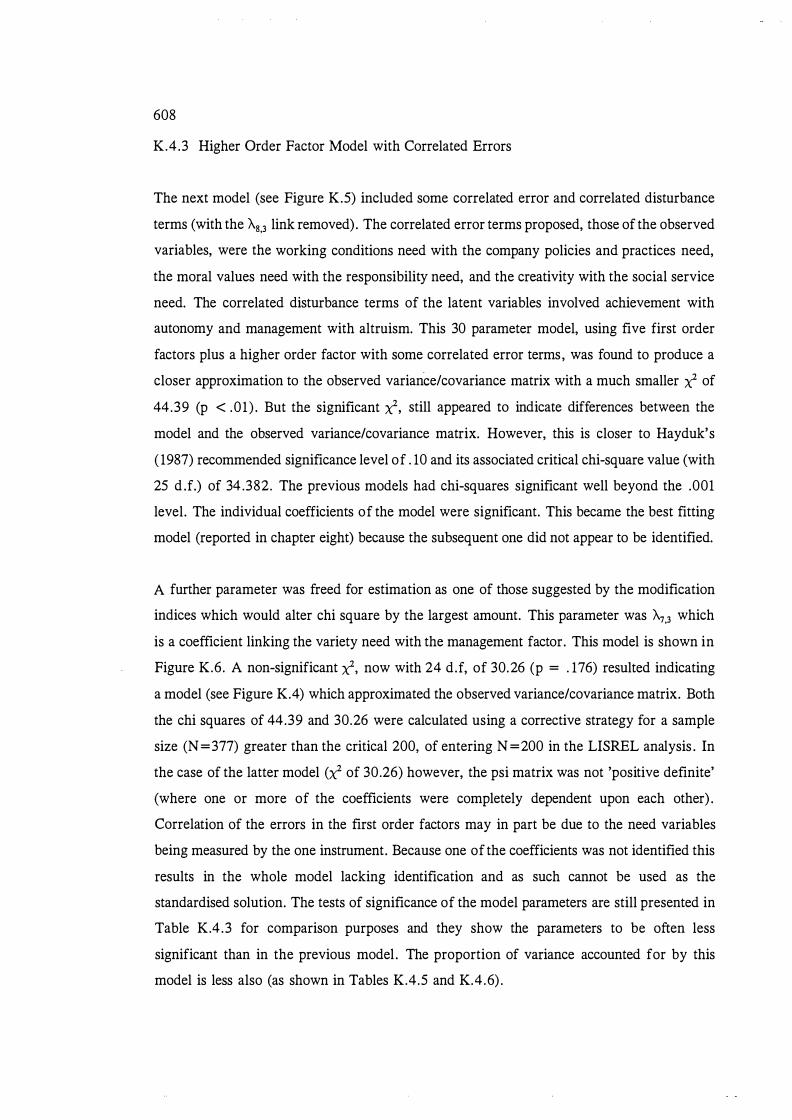
608
K.4.3 Higher Order Factor Model with Correlated Errors
The next model (see Figure K.5) included some correlated error and correlated disturbance
terms (with the A.8,3 link removed). The correlated error terms proposed, those of the observed
variables, were the working conditions need with the company policies and practices need,
the moral values need with the responsibility need, and the creativity with the social service
need. The correlated disturbance terms of the latent variables involved achievement with
autonomy and management with altruism. This 30 parameter model, using five first order
factors plus a higher order factor with some correlated error terms, was found to produce a
closer approximation to the observed variance/covariance matrix with a much smaller X: of
44.39 (p < .01 ) . But the significant X:. still appeared to indicate differences between the
model and the observed variance/covariance matrix. However, this is closer to Hayduk's
( 1987) recommended significance level of . 10 and its associated critical chi-square value (with
25 d .f.) of 34 .382. The previous models had chi-squares significant well beyond the .001
level. The individual coefficients of the model were significant. This became the best fitting
model (reported in chapter eight) because the subsequent one did not appear to be identified.
A further parameter was freed for estimation as one of those suggested by the modification
indices which would alter chi square by the largest amount. This parameter was A.7,3 which
is a coefficient linking the variety need with the management factor. This model is shown in
Figure K.6. A non-significant X:. now with 24 d.f, of 30.26 (p = . 176) resulted indicating
a model (see Figure K.4) which approximated the observed variance/covariance matrix. Both
the chi squares of 44.39 and 30.26 were calculated using a corrective strategy for a sample
size (N =377) greater than the critical 200, of entering N =200 in the LISREL analysis . In
the case of the latter model (X: of 30.26) however, the psi matrix was not 'positive definite'
(where one or more of the coefficients were completely dependent upon each other) .
Correlation of the errors in the first order factors may in part be due to the need variables
being measured by the one instrument. Because one of the coefficients was not identified this
results in the whole model lacking identification and as such cannot be used as the
standardised solution. The tests of significance of the model parameters are still presented in
Table K.4 .3 for comparison purposes and they show the parameters to be often less
significant than in the previous model . The proportion of variance accounted for by this
model is less also (as shown in Tables K.4.5 and K.4.6) .

609
I' l l
E l Ez E3 E4 Es E6 E7 Eg E9 E IO i i r I l r 8E3 10 8E4 9 �E6,8 I . I .
Note. A eh = Achievement
Aut Autonomy
Mgte Management
We = Working conditions
Alt Altruism
Au = Ability utilisation
A eh = Achievement
Res = Responsibility
Cre = Creativity
Shr = Supervision (human relations)
Cpp Company policies and practices
Var = Variety We Working conditions
Sse = Social service
Mv Moral values
� � = A general work need factor
'Yt l " " 'Yst = Gamma coefficients
71t · . . . 71s = First order factors (endogenous variables)
s1 . . . . Ss Eta disturbance terms ( 1/; = covariances among these errors)
"-t t " " "-to.5 Lambda coefficients
Yt . . . . Yto Observed variables Et" " € 12 = Error terms of observed variables
ee l . . . . 0,3 = Covariances among error terms of observed variables
Figure K.5 Higher order factor model with correlated errors
6 1 0
'Yll A.s,
E l E2 E3 E4 Es E6 E7 Eg E9 Ew i i t J I I 8E3 10 8E4 9 eiJ6.a , . I '
Note. A eh = Achievement
Aut = Autonomy
Mgte Management
We Working conditions
Alt Altruism
Au = Ability utilisation
A eh = Achievement
Res = Responsibility
Cre Creativity
Shr Supervision (human relations)
Cpp Company policies and practices
Var = Variety
We Working conditions
Sse Social service
Mv Moral values
� 1 A general work need factor
'Yl 1 · · . . 'Ys1 = Gamma coefficients
1] , . . . . TJs First order factors (endogenous variables)
r, . . . . rs Eta disturbance terms (if; = covariances among these errors)
f..u . . . . f..w.s = Lambda coefficients
y, . . . . Yw = Observed variables
e , . . . . E Jz = Error terms of observed variables
(J" • • • • 0,3 = Covariances among error terms of observed variables
Figure K.6 The addition of a variety work need/management factor link
6 1 1
The modification of the model was guided more by psychological theory than the modification
indices themselves. There is little theoretical impetus to have variety as an indicator of the
safety/management factor. Other modification indices suggested by LISREL involved the
variety need in relation to achievement and autonomy, and the working conditions need in
relation to achievement and safety. Freeing any of these parameters may also achieve a non
significant chi square, but the choice among them as to which may be the more appropriate
may have no clear theoretical rationale (although achievement and safety might be expected
to be more related to working conditions than variety is to achievement and autonomy).
Sections K.4 . 1 to K.4.3 (inclusive) have described the series of models run in order to arrive
at the one which approximated the data best by modifying the model according to the LISREL
programme's modification indices . Having completed this modelling process the various
models are compared overall in section K.4.4.
K.4.4 Comparing LISREL Models
The resulting X2 indicated that modelling correlation among error and disturbance terms was
moving in a direction which improved the fit of the model, a difference between the resulting
x2 and that of the previous model being (105 .00 - 44.39) 60.6 with 30 - 25 = 5 d .f > crit
x2 20.5 (p < .001). The difference between the �s of the last two models estimated where
the working conditions indicator was linked to the management factor, was (44.39 - 30 .6) =
13 .79 with (25 - 24) = 1 d.f. > crit � 10 .83 (p < . 001) .
In comparing the LISREL models in accordance with Hayduk's ( 1987) preference for the use
of several indicators of the quality of model fit, the significance of individual coefficients (T -
values) to test the null hypothesis that the true parameter is zero, the residuals , and the
partial derivatives were also examined. In the case of the latter, large or negative partial
derivatives show that increasing or decreasing a particular coefficient's value is l ikely to
improve the model fit and decrease the model �. The partial derivatives , reported as "first
order derivatives " , are the partial derivatives of the fit function taking into account all of the
coefficients estimated in the model whether fixed or free. The partial derivatives provide the
slope of the fit function at the current coefficients values and indicate the rate at which the
fit would alter if the coefficients were permitted to take on slightly larger values . It is because
large or negative partial derivatives show that increasing or decreasing a certain coefficient
612
i s likely to greatly improve the fit of the model and the model X:, that they are a source of
useful diagnostic information for improving models . However because partial derivatives
reflect the real metrics of the relevant variables, such that a unit change on a scale with many
scale points is likely to produce little change in the fit and therefore a small partial derivative,
judgements about what a large or small partial derivative is , must consider the variables ' real
metrics . Also because a partial derivative gives the slope at the current value of a coefficient,
the slope of the fit function could change if the coefficient increases or decreases slightly. A
coefficient with a small partial derivative is capable of radically altering the fit if that slope
persisted over a large change in the coefficient's value. On the other hand a small change in
the fit would result when there is a large partial derivative but the slope flattens out after a
minor change in the coefficient's value.
The LISREL programme's modification indices are produced in response to the problems
associated with partial derivatives . The way in which these 11 modification indices 11 are defined
has altered from time to time. Hayduk ( 1987) describes them as being based on the partial
derivatives, and as being designed to adjust for both scales on which the variables are
measured and the rates of change of the partial derivatives . The modification index in
LISREL VI, the version used in the present analyses , for any given coefficient is N/2 times
the ratio of the squared first-order partial derivative to the second-order partial derivative
(Joreskog and Sorbom, 1984: 1 -42) . The dependence of the indices on N is said to parallel
that of x2 on N, (Hayduk, 1987) .
In the case of the successive models , beginning with the five factor hierarchical model with
no error terms, the individual coefficients or factor loadings were all significant (p < .001) .
These T- values ranged from 19 .09 (p < . 001) for the relationship between the achievement
indicator or observed variable and the achievement latent variable or factor, down to 4 .71 (p
< . 001) for the link between the observed variable of moral values and the altruism factor.
There were six residuals > 2 in the matrix of normalized residuals (estimates of the number
of standard deviations observed residuals are away from zero that would be provided by a
perfect model) . The normalised residual matrix revealed that overall it did not meet the
criteria that the errors were likely to be random, that is that almost all but 5 % of the residuals
fall within two standard deviations . In this case 6/45 = . 13 or 13 % were > two standard
deviations . Four of these were around two and involved discrepancies between the observed

613
covariances and the model-implied covariances for human relations supervision with working
conditions, with social service, and with moral values, and for company policies/practices
with social service. Two of the residuals were greater than 4, for the company policies/variety
covariance and the company policies/moral values covariance residuals . This means that the
covariances among these observed variables were greater than the zero implied by the
proposed model .
This model also produced significant gamma T - values, that is the coefficients linking the
five work factors with the higher order need factor were all significant at the . 001 level . The
T - values for the factors were, 17.08 for achievement, 15 for autonomy, 9 for management,
10 .5 for working conditions and 8 .7 for altruism. The correlation matrix for the five work
need factors, Table K.4.2, reflected the need for higher order factor analysis . All but one
were above .40, the point at which the correlations are of a sufficient size to warrant looking
for another factor level .
By examining PSI shown in Table K.4. 1 , the variance for each factor, and 1 - 1/; (the
proportion of variance in the factors explained by the model) it was found that the model was
less able to explain the variance in the management and altruism factors with 1 - 1{1 of . 3 1 and
. 32 , respectively.
Table K.4. 1 Proportion of Variance (using 1 - 1{1) in the Factors Explained by the Five
Factor Hierarchical Model with No Error Terms
Factor
Achievement Working conditions Autonomy Altruism Management
Proportion of Variance 1 - 1{1
. 89
.77
.76
.32
. 3 1
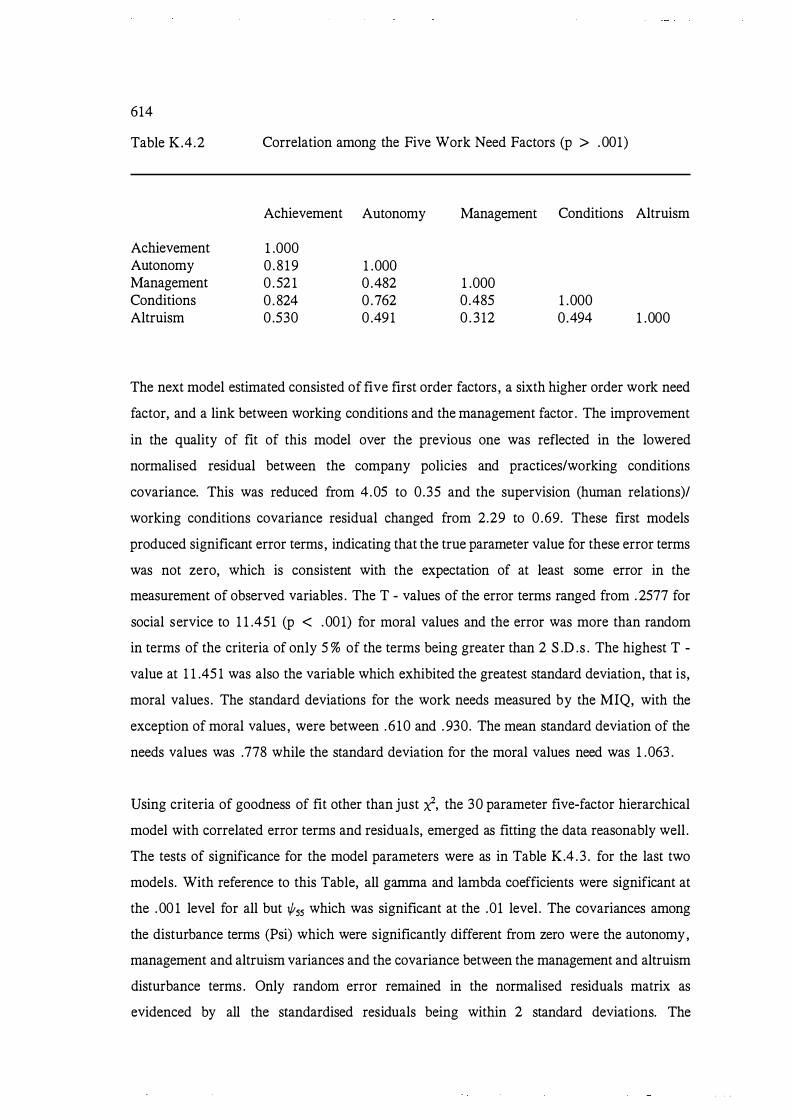
614
Table K.4.2 Correlation among the Five Work Need Factors (p > . 001)
Achievement Autonomy Management Conditions Altruism
Achievement 1 .000 Autonomy 0 .819 1 .000 Management 0 .52 1 0 .482 1 .000 Conditions 0 .824 0 .762 0.485 1 .000 Altruism 0 .530 0 .491 0 . 3 12 0 .494 1 .000
The next model estimated consisted of five first order factors , a sixth higher order work need
factor, and a link between working conditions and the management factor . The improvement
in the quality of fit of this model over the previous one was reflected in the lowered
normalised residual between the company policies and practices/working conditions
covariance. This was reduced from 4 .05 to 0 .35 and the supervision (human relations)/
working conditions covariance residual changed from 2.29 to 0 .69. These first models
produced significant error terms, indicating that the true parameter value for these error terms
was not zero, which is consistent with the expectation of at least some error in the
measurement of observed variables . The T - values of the error terms ranged from . 2577 for
social service to 1 1 .451 (p < . 001) for moral values and the error was more than random
in terms of the criteria of only 5 % of the terms being greater than 2 S .D .s . The highest T -
value at 1 1 .45 1 was also the variable which exhibited the greatest standard deviation, that is,
moral values . The standard deviations for the work needs measured by the MIQ, with the
exception of moral values , were between .610 and . 930. The mean standard deviation of the
needs values was .778 while the standard deviation for the moral values need was 1 .063 .
V sing criteria of goodness of fit other than just X:, the 30 parameter five-factor hierarchical
model with correlated error terms and residuals, emerged as fitting the data reasonably well .
The tests of significance for the model parameters were as in Table K.4 . 3 . for the last two
models. With reference to this Table, all gamma and lambda coefficients were significant at
the .00 1 level for all but 1/;55 which was significant at the .01 level . The covariances among
the disturbance terms (Psi) which were significantly different from zero were the autonomy,
management and altruism variances and the covariance between the management and altruism
disturbance terms . Only random error remained in the normalised residuals matrix as
evidenced by all the standardised residuals being within 2 standard deviations. The
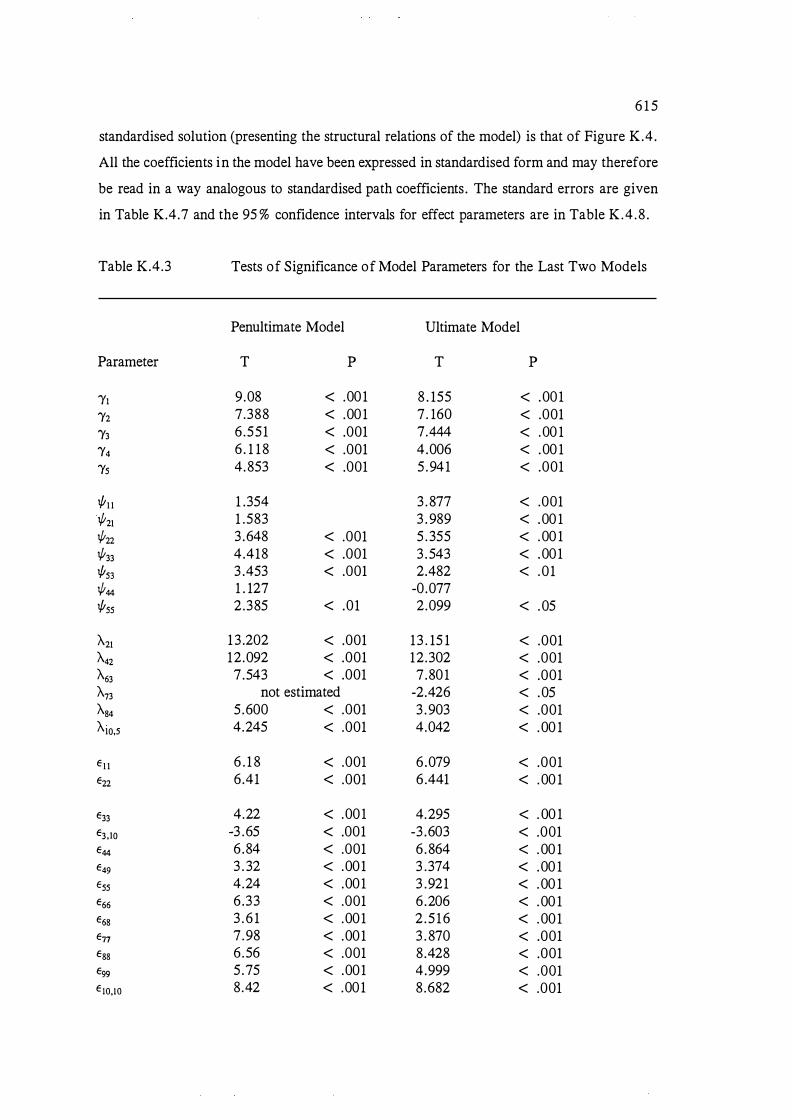
6 1 5
standardised solution (presenting the structural relations of the model) is that of Figure K.4 .
All the coefficients in the model have been expressed in standardised form and may therefore
be read in a way analogous to standardised path coefficients . The standard errors are given
in Table K.4.7 and the 95 % confidence intervals for effect parameters are in Table K .4 .8 .
Table K.4.3 Tests of Significance of Model Parameters for the Last Two Models
Penultimate Model Ultimate Model
Parameter T p T p
'Yt 9.08 < .001 8 . 155 < . 001 1'2 7.388 < .001 7 . 160 < .001 1'3 6.551 < .001 7.444 < . 00 1 1'4 6 . 1 18 < .001 4 .006 < . 00 1 'Ys 4.853 < .001 5 .941 < .001
1/lu 1 .354 3 . 877 < .001 1/;21 1 .583 3 . 989 < . 00 1 1/;22 3 .648 < .001 5 . 355 < . 00 1 1/;33 4.418 < .001 3 . 543 < . 001 1/ls3 3 .453 < .001 2.482 < . 0 1 1/;44 1 . 127 -0 .077 1/lss 2.385 < .01 2 .099 < . 05
A.21 1 3 .202 < .001 13 . 15 1 < .001
A.42 12 .092 < .001 12 .302 < .001
A.63 7.543 < .001 7 .801 < .001
A.73 not estimated -2.426 < . 05
A.84 5.600 < .001 3 . 903 < .001
A.l0,5 4.245 < .001 4.042 < . 00 1
Eu 6 . 1 8 < .001 6 .079 < .001 E22 6.41 < .001 6 .441 < . 00 1
E33 4.22 < .001 4.295 < . 00 1 E3,10 -3 .65 < .001 -3 .603 < .001 E44 6.84 < .001 6 .864 < . 00 1 E49 3 . 32 < .001 3 .374 < . 00 1 Ess 4.24 < .001 3 .921 < . 00 1 E66 6.33 < .001 6 .206 < . 00 1 E68 3 .6 1 < .001 2 .5 16 < . 001 En 7.98 < .001 3 . 870 < .001 Egg 6.56 < .001 8.428 < .001 E99 5.75 < .001 4.999 < .001 EIO,IO 8.42 < .001 8 .682 < .001
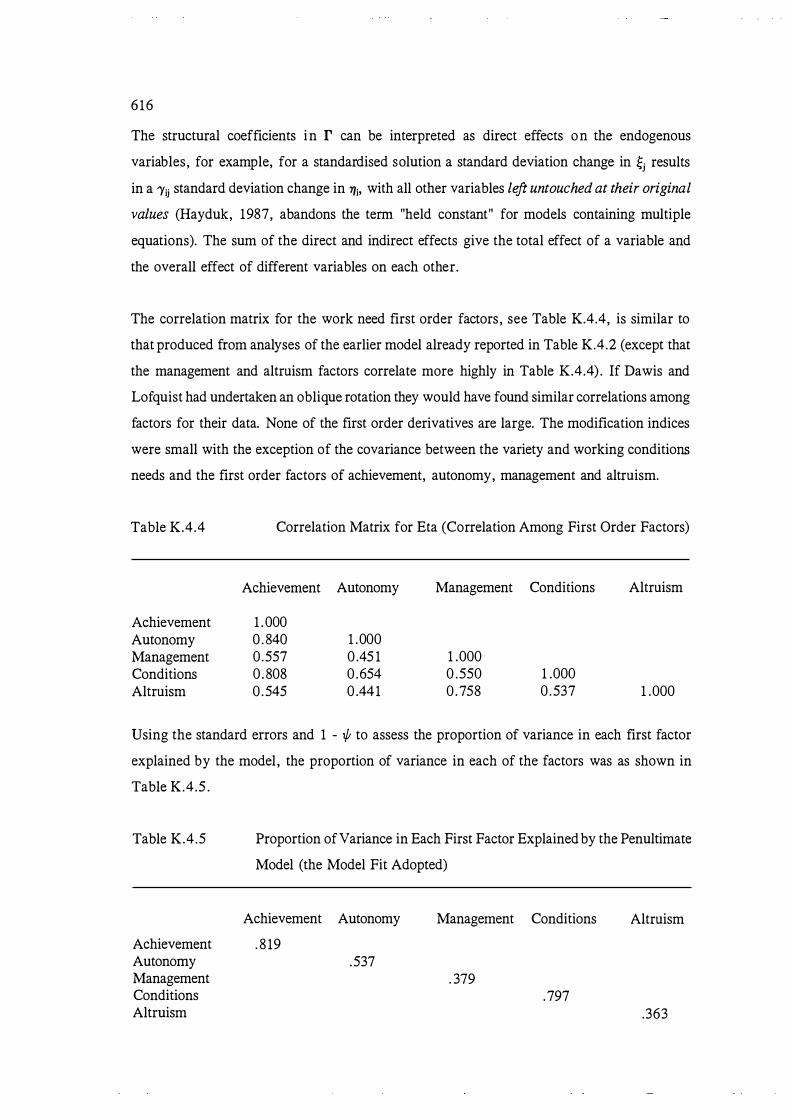
616
The structural coefficients in r can be interpreted as direct effects on the endogenous
variables , for example, for a standardised solution a standard deviation change in �i results
in a 'Yii standard deviation change in 1/i> with all other variables left untouched at their original
values (Hayduk, 1987, abandons the term "held constant" for models containing multiple
equations). The sum of the direct and indirect effects give the total effect of a variable and
the overall effect of different variables on each other.
The correlation matrix for the work need first order factors , see Table K.4.4, is similar to
that produced from analyses of the earlier model already reported in Table K.4.2 (except that
the management and altruism factors correlate more highly in Table K.4.4) . If Dawis and
Lofquist had undertaken an oblique rotation they would have found similar correlations among
factors for their data. None of the first order derivatives are large. The modification indices
were small with the exception of the covariance between the variety and working conditions
needs and the first order factors of achievement, autonomy, management and altruism.
Table K.4.4 Correlation Matrix for Eta (Correlation Among First Order Factors)
Achievement Autonomy Management Conditions Altruism
Achievement 1 .000 Autonomy 0 .840 1 .000 Management 0 .557 0 .45 1 1 .000 Conditions 0 .808 0 .654 0 .550 1 .000 Altruism 0 .545 0 .441 0 .758 0 .537 1 .000
Using the standard errors and 1 - if; to assess the proportion of variance in each first factor
explained by the model , the proportion of variance in each of the factors was as shown in
Table K.4.5 .
Table K.4.5
Achievement Autonomy Management Conditions Altruism
Proportion of Variance in Each First Factor Explained by the Penultimate
Model (the Model Fit Adopted)
Achievement Autonomy Management Conditions Altruism
. 8 19 .537
. 379 .797
.363
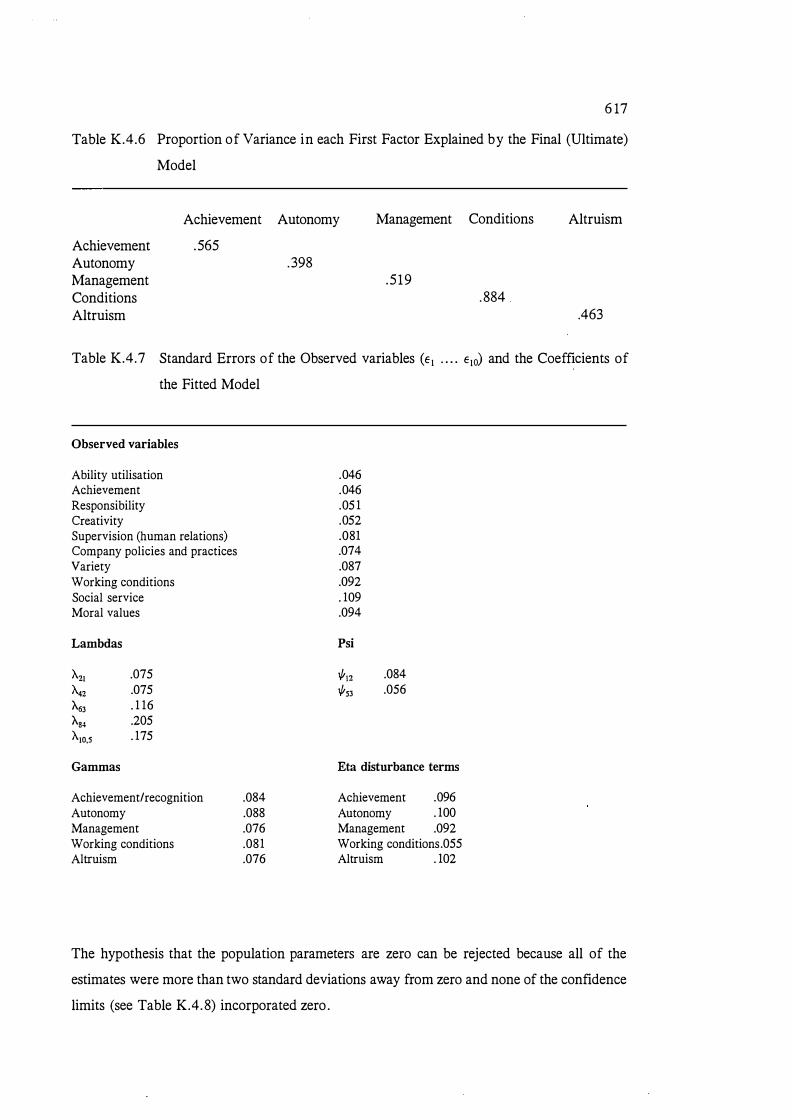
6 17
Table K.4.6 Proportion of Variance in each First Factor Explained by the Final (Ultimate)
Model
Achievement Autonomy Management Conditions Altruism
Achievement
.565
Autonomy
.398
Management Conditions Altruism
.519 .884
.463
Table K.4.7 Standard Errors of the Observed variables (E 1 . • • • E10) and the Coefficients of
the Fitted Model
Observed variables
Ability utilisation Achievement Responsibility Creativity Supervision (human relations) Company policies and practices Variety Working conditions Social service Moral values
Lambdas
A21 .075
A42 .075
t.63 . 1 16
t.84 .205
A10,5 . 175
.046
.046
.05 1
.052
.081
.074
.087
.092
. 109
.094
Psi
Vttz .084
Vts3 .056
Gammas Eta disturbance terms
Achievement/recognition Autonomy Management Working conditions Altruism
.084
.088
.076
.081
.076
Achievement . 096 Autonomy . 100 Management .092 Working conditions.055 Altruism . 102
The hypothesis that the population parameters are zero can be rejected because all of the
estimates were more than two standard deviations away from zero and none of the confidence
limits (see Table K.4.8) incorporated zero .

618
Table K.4.8 Confidence Intervals (95 %) for the Effect Parameters
Parameter Estimate Standard error Confidence Interval
'Yl .91 .084 0.081 1 . 075
'Yz .73 .088 0.558 0.902
'¥3 .62 .076 0.475 0.765
'Y4 .89 .081 0.73 1 1 .049
'Ys .60 .076 0.455 0.745
�I . 85 .075 0 .693 0 .987
A.tz .81 . 075 0 .663 0.957
�3 .71 . 1 16 0.483 0.937
� .64 .205 0.238 1 .042
'-to,s .46 . 175 0. 1 17 0.635
On a more general note, the conceptual model and that reflected by the data became similar
(the criterion of similarity being the likelihood of S , the observed covariances, arising as a
sampling fluctuation around, the model-implied covariances) , however, at least two
independent changes were able to achieve this . These changes were made separately to
examine their different effects . The working conditions need/management factor link did not
decrease the gap between the models sufficiently on its own. Allowing for correlated errors
and ignoring the extra sensitivity (which can be erroneous by capitalising on chance
fluctuations) provided by more than 200 cases also brought the models closer. Different
combinations of the various changes could have been analysed (one example being the
correlated errors model using the true sample size). However, keeping in mind these analyses
were all being performed on a reduced data set (not the full twenty work needs) such an
exercise could not be conclusive. It was also preferable to use exploratory factor analysis at
that point to locate the factor structure of work needs .
Despite the limitations of using the LISREL model, important lessons were learned from its
application. The different methods of achieving increased model fit all pointed to the factors
being more related to each other than Dawis and Lofquist's model predicted and to difficulties
with their measurement model. This supported the expectation of the present research that a
nonorthogonal work needs model would be more appropriate, such that the work need factors
would be correlated perhaps even to the extent of producing more that one level of higher
order factors . That some of the disturbance terms were larger than others suggested that one
or more of the Saris and Stronkhorst ( 1984) notions1 about what disturbances can represent
were more in operation for certain factors .
1 " ( 1) the effect of unknown variables , (2) the effect of known but omitted variables, (3) the
randomness of human behaviour, and (4) measurement error" (Saris and Stronkhorst, 1984, p 34) .

6 1 9
APPENDIX L
L . l Higher order factor analysis of work needs : Principal Axis Factoring, varirnax
rotation
L.2 Higher order factor analysis of work needs: Principal Axis factoring, oblirnin rotation
L.3 Higher Order Factor analysis : Maximum Likelihood extraction, oblirnin rotation.

620
L. 1 Higher order factor analysis of work needs: Principal Axis Factoring, varimax
rotation
Factor matrix:
Factor 1
Achievement .77172 Management .62872 Moral Values - . 10440 Comfort .65298 Autonomy .47718
Final statistics :
Variable Communality *
Achievement .66396 *
Management .63766 *
Moral Values .02028 *
Comfort .42889 *
Autonomy .30227 *
Varimax rotated factor matrix:
Achievement Management Moral Values Comfort Autonomy
Factor 1
.37585
.79452 - .00830 .50595 . 15533
Factor
1 2
Factor 2
.72298
.07994 - . 14217 .41582 . 52739
Factor 2
- .26157 .4923 1 .09685 .0501 6
-.27308
Eigenvalue % of Cum Variance Variance
1 . 65581 33 . 1 33 . 1 .39726 7.9 4 1 . 1
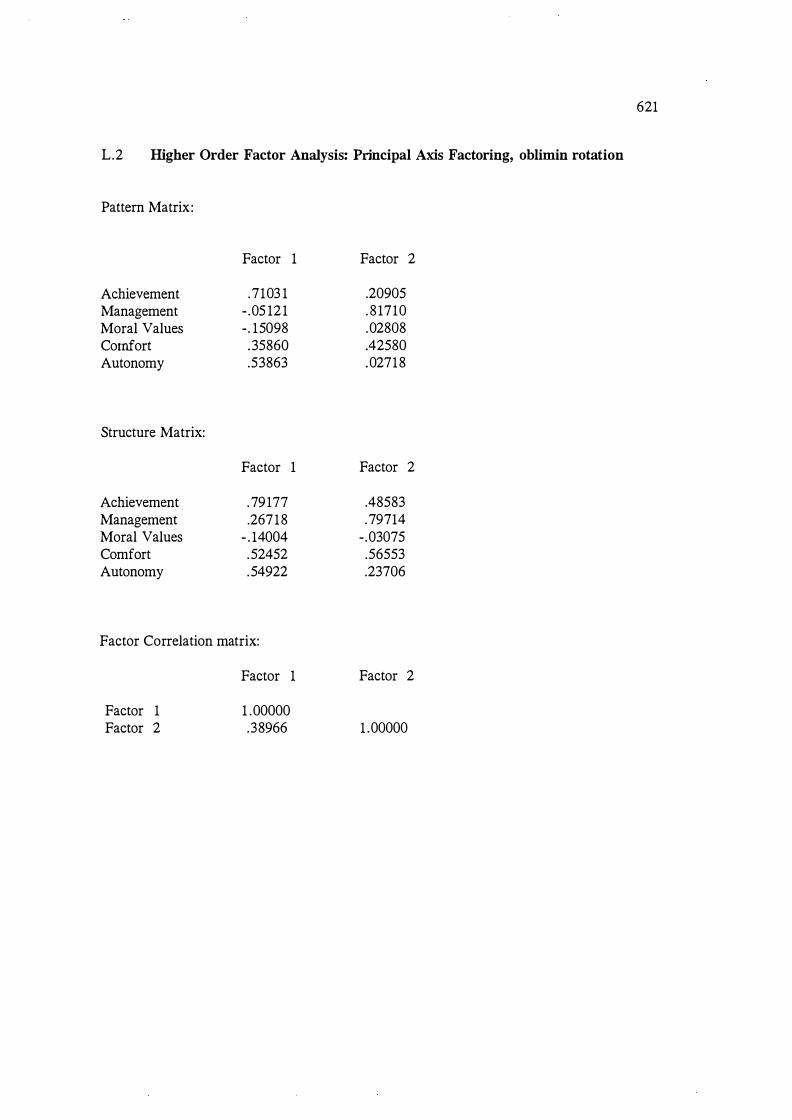
L.2 Higher Order Factor Analysis: Principal Axis Factoring, oblimin rotation
Pattern Matrix:
Factor 1
Achievement .7103 1 Management - .05 12 1 Moral Values - . 15098 Comfort . 35860 Autonomy .53863
Structure Matrix:
Factor 1
Achievement .79177 Management .26718 Moral Values - . 14004 Comfort .52452 Autonomy .54922
Factor Correlation matrix:
Factor 1 Factor 2
Factor 1
1 .00000 .38966
Factor 2
.20905
. 8 1710
.02808
.42580
.02718
Factor 2
.48583
.79714 - .03075 .56553 .23706
Factor 2
1 .00000
621
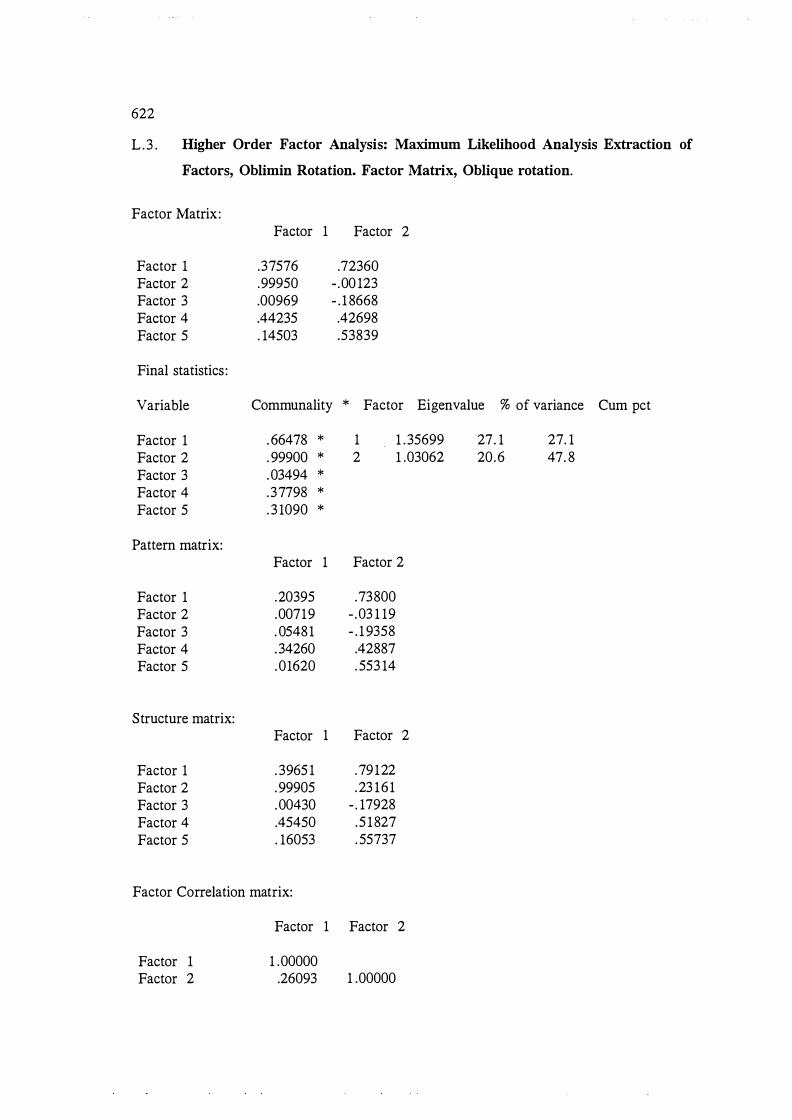
622
L .3 . Higher Order Factor Analysis: Maximum Likelihood Analysis Extraction of
Factors, Oblimin Rotation. Factor Matrix, Oblique rotation.
Factor Matrix:
Factor 1 Factor 2 Factor 3 Factor 4 Factor 5
Final statistics :
Factor
.37576
.99950
.00969
.44235
. 14503
1 Factor 2
.72360 - .00 123 - . 1 8668 .42698 .53839
Variable Communality * Factor Eigenvalue % of variance Cum pet
Factor 1 Factor 2 Factor 3 Factor 4 Factor 5
Pattern matrix:
Factor 1 Factor 2 Factor 3 Factor 4 Factor 5
Structure matrix:
Factor 1 Factor 2 Factor 3 Factor 4 Factor 5
. 66478 *
. 99900 *
. 03494 *
. 37798 *
. 3 1090 *
Factor 1
.20395
.00719
. 05481
.34260
.01620
Factor 1
. 3965 1
.99905
.00430
.45450
. 16053
Factor Correlation matrix:
Factor 1
Factor 1 1 .00000 Factor 2 .26093
1 2
1 . 35699 1 .03062
Factor 2
.73800 - .03 1 19 - . 1 9358 .42887 . 553 14
Factor 2
.79122
.23 161 - . 17928 .5 1827 . 55737
Factor 2
1 .00000
27. 1 20.6
27. 1 47. 8
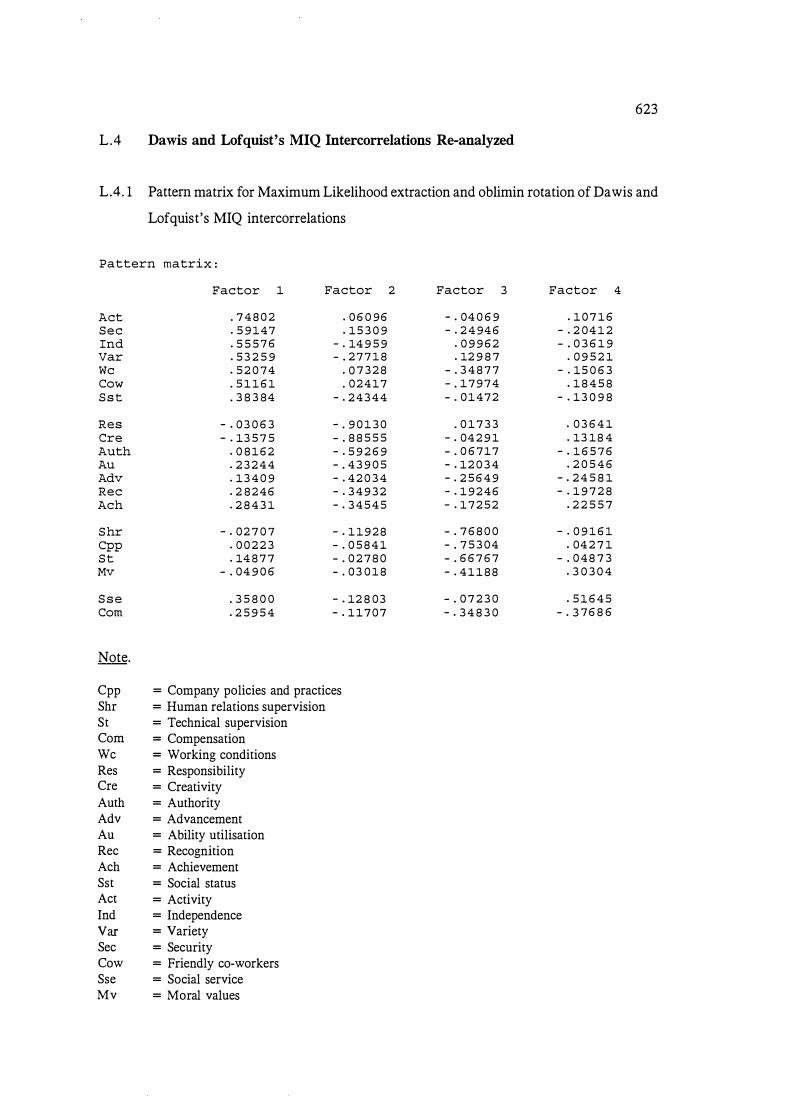
L.4 Dawis and Lofquist's MIQ Intercorrelations Re-analyzed
623
L.4. 1 Pattern matrix for Maximum Likelihood extraction and oblimin rotation of Dawis and
Lofquist's MIQ intercorrelations
Pattern matrix :
Factor 1 Factor
Act . 7 4 8 0 2 . 0 6 0 9 6 S e c . 5 9 1 4 7 . 1 5 3 0 9 Ind . 5 5 5 7 6 - . 14 9 5 9 Var . 5 3 2 5 9 - . 2 7 7 1 8 We . 5 2 0 7 4 . 0 7 3 2 8 Cow . 5 1 1 6 1 . 0 2 4 1 7 S s t . 3 8 3 8 4 - . 2 4 3 4 4
Res - . 0 3 0 6 3 - . 9 0 1 3 0 ere - . 13 5 7 5 - . 8 8 5 5 5 Auth . 0 8 1 6 2 - . 5 9 2 6 9 Au . 2 3 2 4 4 - . 4 3 9 0 5 Adv . 1 3 4 0 9 - . 4 2 0 3 4 Rec . 2 8 2 4 6 - . 3 4 9 3 2 A eh . 2 8 4 3 1 - . 3 4 5 4 5
S hr - . 0 2 7 0 7 - . 1 1 9 2 8 Cpp . 0 0 2 2 3 - . 0 5 8 4 1 S t . 14 8 7 7 - . 0 2 7 8 0 Mv - . 0 4 9 0 6 - . 0 3 0 1 8
S s e . 3 5 8 0 0 - . 12 8 0 3 Corn . 2 5 9 5 4 - . 1 1 7 0 7
Note.
Cpp = Company policies and practices
Shr = Human relations supervision St = Technical supervision Corn = Compensation W c = Working conditions Res = Responsibility Cre = Creativity Auth = Authority Adv = Advancement Au = Ability utilisation Rec = Recognition Ach = Achievement Sst = Social status Act = Activity Ind = Independence
V ar = Variety
Sec = Security Cow = Friendly eo-workers Sse = Social service Mv = Moral values
2 Factor 3 Factor 4
- . 04 0 6 9 . 1 0 7 1 6 - . 2 4 94 6 - . 2 0 4 1 2
. 0 9 9 6 2 - . 0 3 6 1 9
. 12 9 8 7 . 0 9 5 2 1 - . 3 4 8 7 7 - . 1 5 0 6 3 - . 1 7 9 7 4 . 1 8 4 5 8 - . 0 1 4 7 2 - . 1 3 0 9 8
. 0 1 7 3 3 . 0 3 6 4 1 - . 04 2 9 1 . 13 1 8 4 - . 0 6 7 1 7 - . 1 6 5 7 6 - . 1 2 0 3 4 . 2 0 5 4 6 - . 2 5 6 4 9 - . 2 4 5 8 1 - . 1 9 2 4 6 - . 1 9 7 2 8 - . 1 7 2 5 2 . 2 2 5 5 7
- . 7 6 8 0 0 - . 0 9 1 6 1 - . 7 5 3 0 4 . 04 2 7 1 - . 6 6 7 6 7 - . 0 4 8 7 3 - . 4 1 1 8 8 . 3 0 3 0 4
- . 0 7 2 3 0 . 5 1 6 4 5 - . 3 4 8 3 0 - . 3 7 6 8 6

624
L.4.2 Pattern matrix for Principal Factors extraction and oblimin rotation of Dawis and
Lofquist's MIQ intercorrelations
Factor 1 Factor
Cpp Shr St Corn We
R e s ere Aut h Adv Au R e c A e h S s t
Act Ind Var S e c Cow
S s e Mv
Note.
. 7 3 5 0 6
. 72 1 0 8
. 6 3 7 94
. 5 1 7 5 7
. 4 7 9 9 3
- . 0 7 8 4 3 - . 0 5 8 9 7
. 0 9 0 8 3
. 3 7 5 7 6
. 0 9 9 12
. 3 0 1 2 8
. 1 6 3 5 9
. 1 1 8 5 5
. 0 7 3 1 6 - . 0 4 7 2 2 - . 1 3 8 0 1
. 4 2 6 7 4
. 1 9 5 8 8
- . 0 4 8 6 1 . 3 0 6 0 7
. 0 6 6 0 8
. 1 1 5 6 5
. 04 6 2 7
. 1 3 7 6 1 - . 0 6 1 9 5
. 8 7 1 9 1
. 8 4 9 3 8
. 5 9 6 0 1
. 4 9 9 2 0
. 4 9 6 4 4
. 4 2 3 8 8
. 4 1 1 4 7
. 3 0 6 5 8
- . 0 6 1 1 9 . 12 3 3 9 . 2 6 3 7 5
- . 12 8 4 9 - . 0 0 5 0 6
. 1 5 4 9 9
. 0 3 3 8 5
Cpp = Company policies and practices Shr = Human relations supervision
St = Technical supervision Corn = Compensation
W c = Working conditions
Res = Responsibility
Cre = Creativity Auth = Authority Adv = Advancement
Au = Ability utilisation
Rec = Recognition
Ach = Achievement
Sst = Social status
Act = Activity Ind = Independence
V ar = Variety Sec = Security
Cow = Friendly eo-workers Sse = Social service
Mv = M oral values
2 Factor 3 Factor 4
- . 0 5 3 5 6 . 2 2 2 7 2 - . 0 2 6 3 4 . 0 6 7 0 1
. 1 2 9 1 5 . 0 7 3 7 5
. 1 5 4 2 7 - . 2 7 6 6 4
. 4 3 4 3 3 - . 0 8 0 8 1
. 0 1 1 3 2 . 0 4 4 8 4 - . 0 8 3 2 5 . 1 4 8 3 9
. 0 7 8 5 8 - . 1 4 2 2 5 - . 0 0 8 1 7 - . 1 8 8 1 5
. 14 9 5 8 . 2 2 7 5 8
. 1 6 3 3 1 - . 1 5 6 2 3
. 1 8 0 6 3 . 2 6 9 4 2
. 2 8 5 0 0 - . 1 1 3 8 9
. 7 4 8 8 1 . 0 9 0 3 5
. 5 7 6 3 6 - . 0 7 2 5 2
. 5 7 4 1 4 . 0 4 9 0 9
. 4 7 0 0 8 - . 1 4 4 1 3
. 4 6 2 3 4 . 2 2 3 3 0
. 3 4 8 7 8 . 5 1 6 2 2 - . 0 5 3 4 0 . 3 9 9 2 4

M. l Statistics for the key variables
APPENDIX M
M.2 Frequency distribution for expected tenure
625
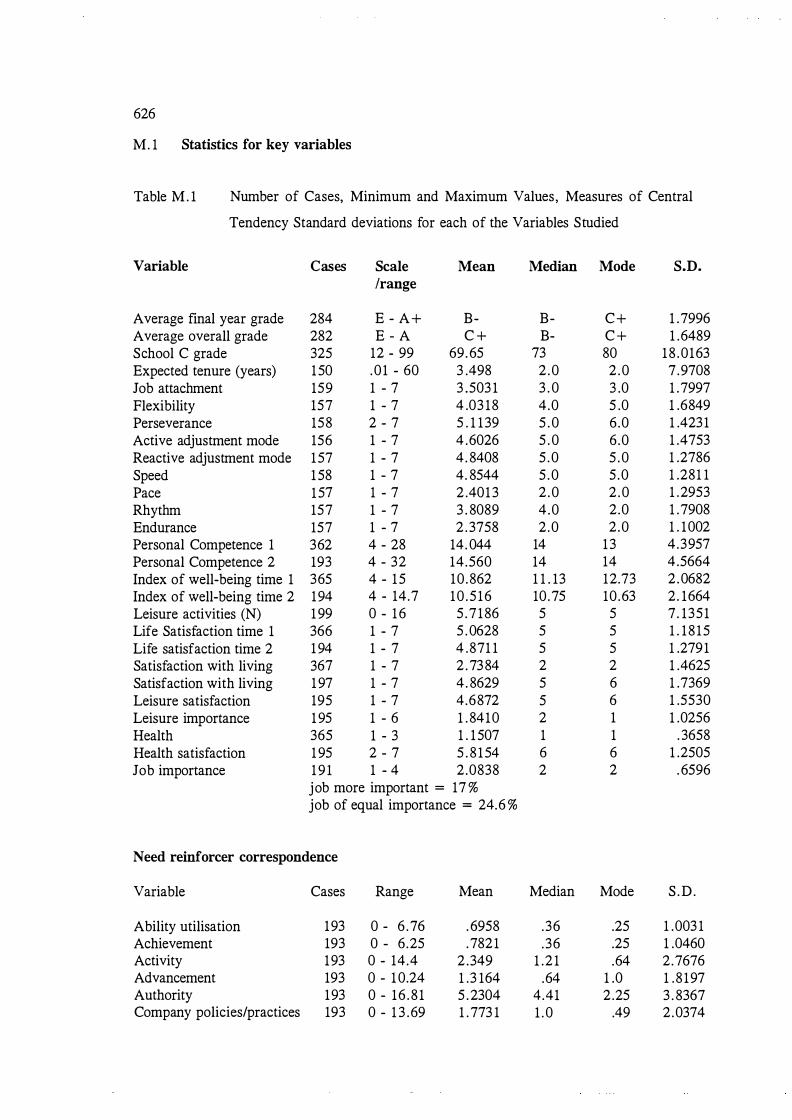
626
M. 1 Statistics for key variables
Table M. 1 Number of Cases, Minimum and Maximum Values, Measures of Central
Tendency Standard deviations for each of the Variables Studied
Variable Cases Scale Mean Median Mode S.D. /range
Average final year grade 284 E - A+ B- B- C+ 1 .7996 Average overall grade 282 E - A C + B- C + 1 .6489 School C grade 325 12 - 99 69. 65 73 80 18 .0163 Expected tenure (years) 1 50 .01 - 60 3 .498 2 .0 2 .0 7 .9708 Job attachment 159 1 - 7 3 .503 1 3 . 0 3 .0 1 .7997 Flexibility 157 1 - 7 4 .03 18 4.0 5 .0 1 .6849 Perseverance 158 2 - 7 5 . 1 1 39 5 . 0 6 .0 1 .4231 Active adjustment mode 156 1 - 7 4 .6026 5 . 0 6 .0 1 .4753 Reactive adjustment mode 1 57 1 - 7 4 . 8408 5 .0 5 .0 1 .2786 Speed 1 58 1 - 7 4. 8544 5 .0 5 .0 1 .281 1 Pace 1 57 1 - 7 2 .401 3 2 .0 2 .0 1 .2953 Rhythm 157 1 - 7 3 . 8089 4 .0 2 .0 1 .7908 Endurance 157 1 - 7 2 . 3758 2 .0 2 .0 1 . 1002 Personal Competence 1 362 4 - 28 14. 044 14 1 3 4 .3957 Personal Competence 2 193 4 - 32 14.560 14 14 4 .5664 Index of well-being time 1 365 4 - 1 5 10 .862 1 1 . 13 12.73 2 .0682 Index of well-being time 2 194 4 - 14.7 10 .5 16 10 .75 10 .63 2 . 1664 Leisure activities (N) 1 99 0 - 1 6 5 .7186 5 5 7 . 1351 Life Satisfaction time 1 366 1 - 7 5 . 0628 5 5 1 . 18 15 Life satisfaction time 2 1 94 1 - 7 4 .871 1 5 5 1 .2791 Satisfaction with living 367 1 - 7 2 .7384 2 2 1 .4625 Satisfaction with living 1 97 1 - 7 4 . 8629 5 6 1 .7369 Leisure satisfaction 195 1 - 7 4.6872 5 6 1 .5530 Leisure importance 1 95 1 - 6 1 . 8410 2 1 1 .0256 Health 365 1 - 3 1 . 1 507 1 1 . 3658 Health satisfaction 1 95 2 - 7 5 . 8 1 54 6 6 1 .2505 Job importance 1 9 1 1 - 4 2 .0838 2 2 . 6596
job more important = 17 % job of equal importance = 24.6 %
Need reinforcer correspondence
Variable Cases Range Mean Median Mode S .D .
Ability utilisation 193 0 - 6 .76 . 6958 .36 .25 1 .003 1 Achievement 193 0 - 6.25 .7821 .36 .25 1 .0460 Activity 193 0 - 14.4 2 .349 1 .2 1 .64 2 .7676 Advancement 193 0 - 1 0.24 1 .3 164 .64 1 .0 1 .8 197 Authority 193 0 - 16 .81 5 .2304 4.41 2 .25 3 . 8367 Company policies/practices 193 0 - 1 3 .69 1 .773 1 1 . 0 .49 2 .0374

627
Compensation 193 0 - 15 .2 1 2 .2847 1 .44 1 .0 2 .5783 Coworkers 193 0 - 7 .29 . 8503 .49 .04 1 . 1 64 1 Creativity 193 0 - 13 .69 1 .2367 .64 .25 1 .7221 Independence 193 0 - 16 .81 2 .9203 .96 4 .0 2.9686 Moral values 193 0 - 12.96 1 .4904 .80 .49 2 .0081 Recognition 193 0 - 9.00 1 .3848 .49 1 .0 1 . 8649 Responsibility 193 0 - 9 .61 1 .0067 .36 .04 1 . 5438 Security 193 0 - 8 .41 1 .4579 .64 .04 1 .7819 Social services 193 0 - 13 . 69 1 . 8423 1 .0 .25 2 .2165 Social status 193 0 - 17.64 4.6055 4.0 1 . 0 3 .9707 Supervision (human) 193 0 - 10.24 1 .6378 1 .0 . 04 1 . 8727 Supervision (technical) 193 0 - 10.24 1 . 8624 1 .2 1 .49 1 . 9 144 Variety 193 0 - 12.25 2 . 1801 1 .44 4 .0 2 .3402 Working conditions 193 0 - 9 .61 1 . 1 105 4 .9 16 .4 1 .5053
Work needs (MIQ)
Cases Range Mean Median Mode S .D .
Ability utilisation 355 - .7 to 3 . 5 1 .5068 1 .5 1 .5 . 6349 Achievement 355 -.5 to 3 . 5 1 .6837 1 .7 1 .5 . 6105 Activity 355 - . 19 to 3 . 0 .3527 .3 0 .8910 Advancement 355 -1 .2 to 3 . 5 .9997 1 .0 .6 .8718 Authority 355 -2 . 1 to 2 .5 - .483 1 - .6 - . 8 . 8225 Company policies 355 -2. 1 to 2 . 3 .4366 .5 0 . 6954 Compensation 355 - 1 .9 to 2 . 3 .3763 .4 0 .7819 Coworkers 355 - 1 .4 to 3 .2 .9487 .9 . 8 .73 12 Creativity 355 - 1 .7 to 3 . 0 .9020 .9 .6 .7 122 Independence 355 -2 . 1 to 2 .3 . 1028 0 0 . 80 10 Moral values 355 - 1 . 8 to 3 . 5 .9076 1 .0 2 .0 1 .0627 Recognition 355 -1 .0 to 3 . 0 .9239 1 . 0 1 . 1 .7924 Responsibility 355 -1 . 1 to 3 . 0 .9687 1 .0 1 . 1 . 7074 Security 355 - 1 .6 to 3 . 0 . 5 141 .5 . 3 . 8078 Social service 355 -2 .4 to 3 . 0 .5310 . 83 0 .9 108 Social status 355 -2.2 to 2 .2 - .38 1 1 - .5 - . 8 . 9302 Supervision (human) 355 - 1 . 8 to 2 . 1 .3924 .4 0 . 6324 Supervision (technical) 355 - 1 .2 to 2 .5 .4096 .4 0 .63 18 Variety 355 - 1 . 5 to 3 . 0 .5727 . 5 0 .7895 Working conditions 355 - 1 . 1 to 2 .8 .8501 .9 .9 .6906
Workers in the same job
Cases Mean Mode Percentages S .D .
Yes No
Ability utilisation 199 1 .3618 yes 63 .8 36 .2 .4817 Achievement 199 1 .3668 yes 63 .3 36 .7 .4832 Activity 199 1 .4623 yes 53 .8 46.2 .4998

628
Promotability 199 1 .4472 yes 55.3 44.7 .4985 Authority 199 1 .5075 no 49.2 50 .8 .5012 Company policies/practices 199 1 . 3719 yes 62. 8 33 .2 .4845 Compensation 199 1 . 5377 no 46.2 53 . 8 .4998 Friendly workers 199 1 .2613 yes 73 .9 26. 1 .4405 Creativity 199 1 .4623 yes 53 .8 46 .2 .4998 Independence 199 1 .4623 yes 53 .8 46 .2 .4998 Moral values 199 1 .3 166 yes 68.3 3 1 .7 .4663 Recognition 199 1 .3869 yes 6 1 . 3 38 .7 .4883 Responsibility 199 1 .3970 yes 60.3 39 .7 .4905 Security 199 1 .2814 yes 71 .9 28 . 1 .4508 Social service 199 1 .3417 yes 65 .8 34 .2 .4755 Social status 199 1 .4121 yes 58 .8 4 1 .2 .4934 Supervision (human relations) 199 1 . 3 166 yes 68.3 3 1 .7 .4663 Supervision (technical) 199 1 .4673 yes 53 .3 46. 7 . 5002 Variety 199 1 .5779 no 42 .2 57 .8 .495 1 Working conditions 199 1 .3668 yes 63 .3 36 .7 .4832 Autonomy 158 1 . 1899 yes 82.3 17 . 1 .4393
Satisfaction (MSQ) Cases Range Mean Median Mode S . D .
Ability utilisation 162 0 - 25 14 .5185 15 1 1 5 . 1284 Achievement 1 62 0 - 25 1 6 . 1235 16 15 4.7270 Activity 162 0 - 25 1 6 .4198 16 15 4 .8310 Advancement 1 63 0 - 25 14 .6687 15 15 5 .6820 Authority 162 0 - 30 14 .0432 15 15 4 .2926 Company policies/practices 162 0 - 25 14.2840 15 15 4 .8792 Compensation 1 62 0 - 25 1 4.5309 15 15 4 .9 144 Coworkers 162 1 - 25 17 .2654 18 19 4 .5 133 Creativity 162 0 - 25 14 .5247 15 15 4 . 8802 Independence 162 0 - 25 1 6 .7469 17 15 4. 1915 Moral values 162 0 - 26 17 .5741 17.5 15 4 . 3750 Recognition 162 0 - 25 14.5000 15 15 4 .7786 Responsibility 162 0 - 25 5 .7222 16 15 4 .5441 Security 162 0 - 25 1 6 .4691 16 15 4 .6628 Social service 162 0 - 25 15 .2840 15 15 4.6244 Social status 162 0 - 25 14. 3333 15 15 4 .3639 Supervision (human relations) 162 0 - 30 16 .3827 17 15 5 .0735 Supervision (technical) 162 0 - 30 1 6 .4074 17 20 4 .8564 Variety 162 0 - 25 1 5 . 3765 16 15 4 .9670 Working conditions 162 0 - 25 1 5 . 6975 16 15 5 .4054
General (Composite) satisfaction score (MSQ)
General job satisfaction 162 0 - 94 62.4568 63 69 15 .0 164 Job satisfaction compared 190 1 - 7 4 .5947 5 6 1 . 5933 with friends
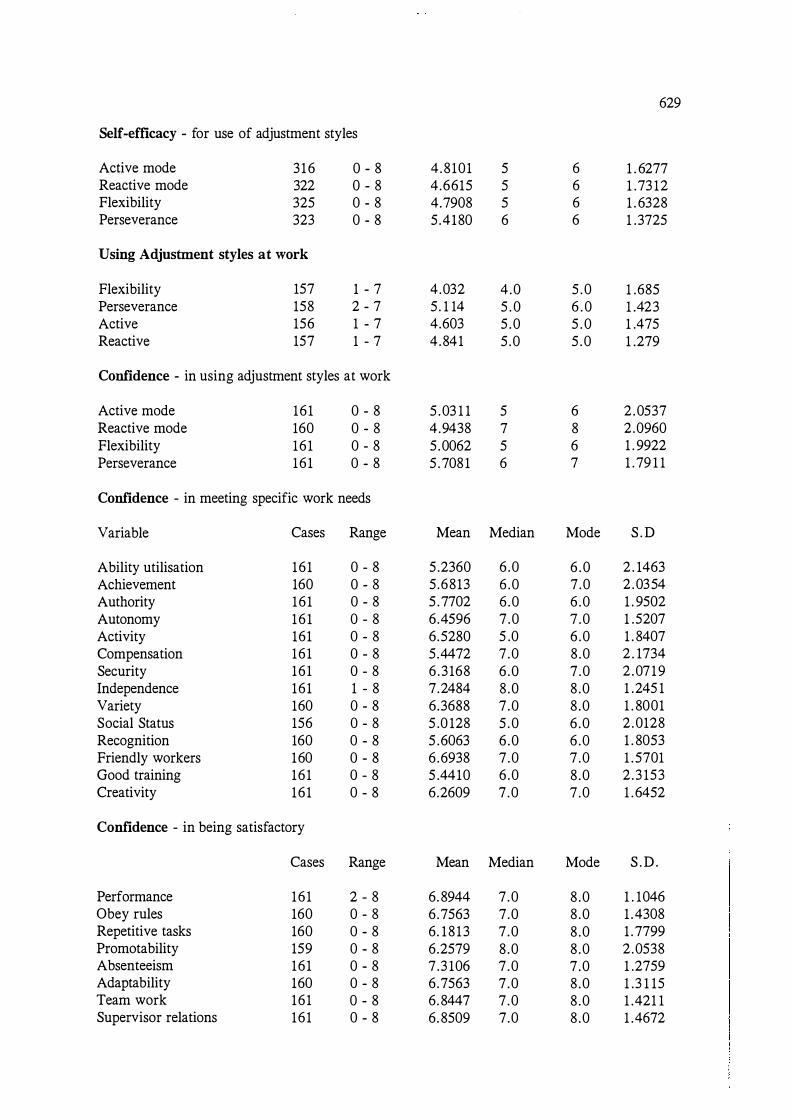
629
Self-efficacy - for use of adjustment styles
Active mode 3 16 0 - 8 4 .8101 5 6 1 . 6277 Reactive mode 322 0 - 8 4.6615 5 6 1 .73 12 Flexibility 325 0 - 8 4.7908 5 6 1 . 6328 Perseverance 323 0 - 8 5 .4180 6 6 1 .3725
Using Adjustment styles at work
Flexibility 157 1 - 7 4.032 4 .0 5 .0 1 .685 Perseverance 158 2 - 7 5 . 1 14 5 . 0 6 . 0 1 .423 Active 156 1 - 7 4.603 5 .0 5 . 0 1 .475 Reactive 157 1 - 7 4 .841 5 .0 5 .0 1 .279
Confidence - in using adjustment styles at work
Active mode 161 0 - 8 5 .03 1 1 5 6 2 .0537 Reactive mode 160 0 - 8 4.9438 7 8 2 .0960 Flexibility 161 0 - 8 5 .0062 5 6 1 . 9922 Perseverance 161 0 - 8 5 .7081 6 7 1 .79 1 1
Confidence - in meeting specific work needs
Variable Cases Range Mean Median Mode S . D
Ability utilisation 161 0 - 8 5 .2360 6 .0 6 .0 2 . 1463 Achievement 160 0 - 8 5 .6813 6 .0 7 .0 2 .0354 Authority 161 0 - 8 5 .7702 6 .0 6 .0 1 . 9502 Autonomy 161 0 - 8 6.4596 7 .0 7 .0 1 .5207 Activity 161 0 - 8 6.5280 5 .0 6 .0 1 . 8407 Compensation 161 0 - 8 5.4472 7 .0 8 .0 2 . 1734 Security 161 0 - 8 6 .3 168 6 .0 7 .0 2 .0719 Independence 161 1 - 8 7.2484 8 .0 8 .0 1 .245 1 Variety 160 0 - 8 6.3688 7 .0 8 .0 1 . 8001 Social Status 156 0 - 8 5 .0 128 5 .0 6 .0 2 .0128 Recognition 160 0 - 8 5 .6063 6 .0 6 .0 1 . 8053 Friendly workers 160 0 - 8 6 .6938 7 .0 7 .0 1 . 5701 Good training 161 0 - 8 5 .4410 6 .0 8 .0 2 .3 153 Creativity 161 0 - 8 6.2609 7 .0 7 .0 1 . 6452
Confidence - in being satisfactory
Cases Range Mean Median Mode S . D .
Performance 161 2 - 8 6.8944 7 .0 8 .0 1 . 1046 Obey rules 160 0 - 8 6.7563 7.0 8 .0 1 .4308 Repetitive tasks 160 0 - 8 6. 18 13 7 .0 8 .0 1 .7799 Promotability 159 0 - 8 6.2579 8 .0 8 .0 2 .0538 Absenteeism 161 0 - 8 7 .3 106 7 .0 7 .0 1 .2759 Adaptability 160 0 - 8 6.7563 7 .0 8 .0 1 .3 1 15 Team work 161 0 - 8 6.8447 7 .0 8 .0 1 .421 1 Supervisor relations 161 0 - 8 6.8509 7.0 8 .0 1 .4672

630
Confidence - adjusting generally
Cases Range Mean Median Mode S .D .
Lifestyle compatability 161 0 - 8 6 . 0373 6 .0 8 .0 1 .9 167 Adjust to clubs 161 0 - 8 5 . 8944 6 .0 6 .0 1 .6606 Adjust to location 160 0 - 8 5 .3688 6 .0 6 .0 1 .9703
Social Support Variables Cases Median Mode YES NO N.A.
Support outside wife 193 yes yes 83 . 9 % 16. 1 % Close friends 193 yes yes 7 1 . 5 % 28.5 % Friends to help in the house 193 yes yes 86. 0 % 14. 0 % Friends would lend money 192 yes yes 9 1 .7 % 8 .3 %
Cases Mean Median Percentage
Don't burden wife 189 N.A. N.A. 88 % Don't burden girlfriend 189 N.A N.A. 55 % Don't burden friends 188 4 4
Social support 193 YES/NO YES = 9 1 .7 % NO = 8 .3 %
Keep worries to self 192 YES/NO YES = 55 .7% NO =44.3 %
Satisfaction with Quality of Life Measures
Cases Mean Median Mode Std Dev Range
Location 194 4.79 5 5 1 .7 1 1 - 7 Neighbourhood 194 4 .933 5 6 1 .67 1 - 7 Accommodation 195 5 . 1 54 6 6 1 .546 1 - 7 Education amount 195 5 .585 6 6 1 .409 1 - 7 Education usefulness 195 5 .441 6 6 1 .272 1 - 7 Health 195 5 . 8 15 6 6 1 .250 2 - 7 Savings 195 3 .964 4 2 1 . 873 1 - 7 Friendship 194 4.876 5 6 1 .741 1 - 7 Intimate relationship 188 4.830 5 7 1 .963 1 - 7 Family life 195 4.990 5 6 1 .492 1 - 7 Homemaking 190 5 .042 5 5 1 . 194 1 - 7
Importance of Quality of Life measures (1 = Eextremely im,gortant, 7 = Not at all im,gortant)
Cases Mean Median Mode Std Dev Range
Location 195 2 .626 2 2 1 .388 1 - 7 Accommodation 195 2 .482 2 2 1 .352 1 - 7 New Zealand way of life 193 2.238 2 2 1 . 179 1 - 7

63 1
Education amount 194 2.294 2 2 1 . 188 1 - 7 Health 195 1 .544 1 1 .845 1 - 6 Savings 195 2 .887 3 2 1 .5 15 1 - 7 Friends 195 1 .703 1 1 1 . 052 1 - 6 Intimate relationship 195 2.005 2 1 1 .254 1 - 7 Family life 195 2.062 2 1 1 . 182 1 - 6 Housework 195 4.036 4 4 1 .473 1 - 6
M.2 Frequency distribution for expected tenure
Years Valid Cum Value Frequency Percent Percent Percent
.0 1 .3 .7 .7
. 1 3 . 8 2 .0 2 .7
. 3 2 .5 1 .3 4 .0
.3 7 1 . 8 4.7 8.7
.3 1 .3 .7 9 .3
.4 1 .3 .7 10.0 .5 13 3 .4 8 .7 18 .7 .7 1 .3 .7 19 .3 . 8 2 .5 1 .3 20.7
1 . 0 3 3 8.7 22.0 42.7 1 .3 1 .3 .7 43 .3 1 .5 5 1 .3 3 . 3 46.7 2 .0 38 10.0 25 .3 72.0 2 .5 1 .3 .7 72.7 3 . 0 2 1 5 .5 14.0 86.7 4.0 4 1 . 1 2.7 89.3 5 . 0 4 1 . 1 2.7 92.0 8 .0 1 .3 .7 92.7
10 .0 4 1 . 1 2 .7 95 .3 15 .0 1 .3 .7 96.0 20.0 2 .5 1 .3 97. 3 40. 0 1 .3 .7 98.0 45 . 0 2 .5 1 .3 99.3 60.0 1 . 3 . 7 100.0
180 47 .5 Missing 49 12.9 Missing
Total 379 100.0 100.0
Mean 3 .498 Std err .65 1 Median 2.000 Mode 2.000 Std dev 7.971 Variance 63.533 Range 59.990 Minimum .010 Maximum 60.000
Valid cases 150 Missing cases 229

APPENDIX N
CORRELATES OF KEY VARIABLES
N . 1 Need-reinforcer correspondence correlates
N.2 Job satisfaction correlates
N.3 Intercorrelations of job satisfaction terms
N.4 Dawis and Lofquist's intercorrelations of MIQ adjusted scale scores
N . 5 Correlates of the general job satisfaction scale (MSQ composite measure)
N.6 Correlates of perceived job satisfactoriness
N.7 Correlates of job attachment
N.8 Correlates of adjusting to a new location and organisation
633
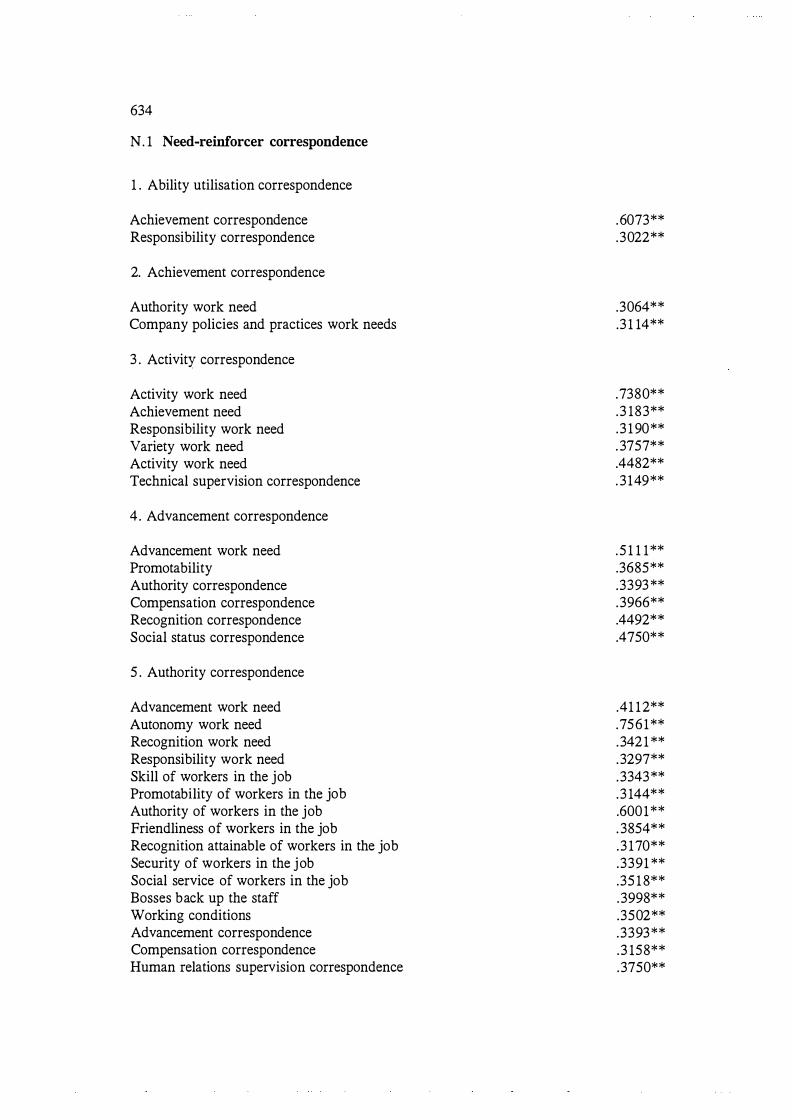
634
N . 1 Need-reinforcer correspondence
1 . Ability utilisation correspondence
Achievement correspondence Responsibility correspondence
2. Achievement correspondence
Authority work need Company policies and practices work needs
3 . Activity correspondence
Activity work need Achievement need Responsibility work need Variety work need Activity work need Technical supervision correspondence
4 . Advancement correspondence
Advancement work need Promotability Authority correspondence Compensation correspondence Recognition correspondence Social status correspondence
5 . Authority correspondence
Advancement work need Autonomy work need Recognition work need Responsibility work need Skill of workers in the job Promotability of workers in the job Authority of workers in the job Friendliness of workers in the job Recognition attainable of workers in the job Security of workers in the job Social service of workers in the job Bosses back up the staff Working conditions Advancement correspondence Compensation correspondence Human relations supervision correspondence
.6073**
.3022**
.3064**
.3 1 14**
.7380**
.3 183**
.3 1 90**
. 3757**
.4482**
. 3 149**
.5 1 1 1 **
.3685**
.3393 **
.3966**
.4492**
.4750**
.41 12**
.7561 **
.3421 **
.3297**
.3343**
.3 144**
.6001 **
. 3854**
.3 170**
.3391 **
.35 1 8**
.3998**
.3502**
.3393**
.3 158**
.3750**
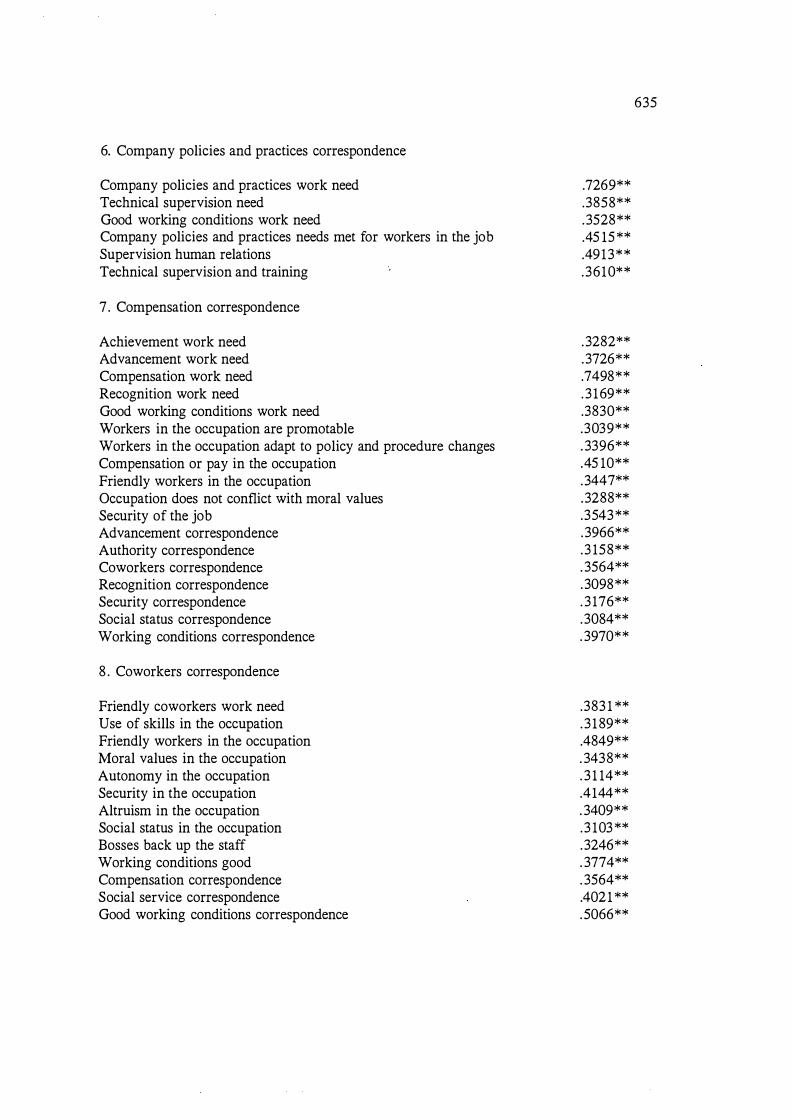
6. Company policies and practices correspondence
Company policies and practices work need Technical supervision need Good working conditions work need Company policies and practices needs met for workers in the job Supervision human relations Technical supervision and training
7 . Compensation correspondence
Achievement work need Advancement work need Compensation work need Recognition work need Good working conditions work need Workers in the occupation are promotable Workers in the occupation adapt to policy and procedure changes Compensation or pay in the occupation Friendly workers in the occupation Occupation does not conflict with moral values Security of the job Advancement correspondence Authority correspondence Coworkers correspondence Recognition correspondence Security correspondence Social status correspondence Working conditions correspondence
8 . Coworkers correspondence
Friendly coworkers work need Use of skills in the occupation Friendly workers in the occupation Moral values in the occupation Autonomy in the occupation Security in the occupation Altruism in the occupation Social status in the occupation Bosses back up the staff Working conditions good Compensation correspondence Social service correspondence Good working conditions correspondence
.7269**
.3858**
.3528**
.45 15 **
.4913**
.3610**
.3282**
.3726**
.7498**
. 3 169**
.3830** .3039** . 3396** .45 10** .3447** .3288** .3543** .3966** .3 158** . 3564** .3098** . 3 176** .3084** . 3970**
.383 1 **
. 3 189**
.4849** . 3438** . 3 1 14** .4144** . 3409** .3 103 ** .3246** . 3774** . 3564** .4021 ** .5066**
635

636
9 . Creativity correspondence
Creativity work need Responsibility work need Confident can be creative Responsibility correspondence Social service correspondence Variety correspondence
10 . Independence correspondence
Creativity work need Independence work need Use of skill in the occupation Achievement in the occupation Friendly workers in the occupation Independence in the occupation Security in the occupation Altruism in the occupation Bosses back up staff in the occupation
1 1 . Moral values correspondence
Moral values work need
12. Recognition correspondence
Recognition work need Perseverance Active adjustment style Skill use in the occupation Achievement in the occupation Promotability Recognition in the occupation Social status in the occupation Bosses back up staff in the occupation Confident can achieve recognition Advancement correspondence Compensation correspondence Social status correspondence
1 3 . Responsibility correspondence
Creativity work need Responsibility work need Number of leisure activities
.6206**
.4049**
. 3748**
.6704**
.3928**
. 3261 **
. 3 1 10**
.7553**
.3097**
. 3 12 1 **
. 3036**
.5500**
.3268**
.3578**
. 3429**
.5249**
.5922**
.3046**
. 3053**
. 3033**
.3060**
. 3 1 19**
.5200**
.33 14**
. 3237**
. 3410**
.4492**
.3098**
.4733**
.4069**
.5 148**
. 3335**

Friendly workers in the occupation Recognition in the occupation Autonomy in the occupation Altruism in the occupation Confident are creative in the job Ability utilisation correspondence Creativity correspondence
14. Security correspondence
Security work need Adapting to policies and procedures in the occupation Independence in the occupation Security in the occupation Altruism in the occupation Bosses back up workers in the occupation Good training and supervision Good working conditions Security satisfaction Compensation correspondence Get along with supervisors Training needs and training correspondence Working conditions correspondence
15 . Social Service correspondence
Compensation work need Friendly coworkers work need Social service work need Altruism in the job Friendly coworkers correspondence Creativity correspondence Social status correspondence Get along with supervisors
16 . Social Status correspondence
Advancement work need Recognition work need Social status work need Use of skill in the occupation Achievement in the occupation Promotability in the occupation Adapting to policies and practice changes in the occupation Friendly workers in the occupation Creativity in the occupation Recognition in the occupation
.3877**
.3245**
.4239**
.3734**
. 3 190**
.3022**
.6704**
.6321 **
.3638**
.3003**
.4857**
.3 146**
.4234**
.4287**
.3433**
.3482**
.3098**
.3263**
.3916**
.3 196**
.3 170**
.3247**
.6288**
.45 15**
.4021 **
. 3928**
.3076**
.3006**
.3853**
.4710**
.7669**
.4078**
.3927**
.5227**
.3689**
.4188**
.3347**
.4107**
637

638
Security in the occupation Altruism in the occupation Social status in the occupation Get along with supervisors in the occupation Good training and supervision in the occupation Variety in the occupation Good working conditions in the occupation Confident have good social status Advancement correspondence Compensation correspondence Recognition correspondence Social service correspondence Working conditions correspondence
17. Get along with supervisors correspondence
Achievement work need Company policies and practices work need Supervision (human relations) Skill in the occupation Achievement in the occupation Activity in the occupation Promotability in the occupation Adapt to policy and practice changes in the occupation Workers friendly in occupation Moral values in the occupation Recognition in the occupation Autonomy in the occupation Security in the occupation Altruism in the occupation Get along with supervisors in the occupation Good training and supervision Working conditions in the occupation Recognition satisfaction Activity correspondence Autonomy correspondence Company policies and practices correspondence Security correspondence Social service correspondence Technical supervision correspondence
18 . Technical supervision correspondence
Security work need Supervision (human relations) work need Technical supervision need Activity in the occupation Adapting to policy and practice changes Altruism in the occupation
.3790**
.4274**
.6407**
.3357**
.3 176**
.3612**
.3821 **
.3875**
.4750**
.3084**
.4733**
.3076**
.3614**
. 3 173**
.3 1 1 1**
.69 1 1 **
.3940**
.3991 **
.3560**
.3015**
.4260**
.3925**
.3409**
.375 1 **
.3432**
.4651 **
.3698**
.65 18**
.3330**
. 3625**
.3018**
.3040**
. 3750**
.491 3**
.3263**
.3006**
. 3778**
.33 1 8**
.3569**
.6907**
.3005**
.3367**
. 3 1 86**

Technical supervision in the occupation Working conditions in the occupation Get along with supervisors Activity correspondence Company policies and practices correspondence Security correspondence Human relations supervision correspondence
19 . Variety correspondence
Creativity work need Variety work need Variety in the occupation Activity correspondence Creativity correspondence
20. Working conditions correspondence
Working conditions work need Pay in the occupation Friendly workers in the occupation Creativity in the occupation Autonomy in the occupation Security in the occupation Altruism in the occupation Social status in the occupation Get along with supervisors Working conditions in the occupation Compensation correspondence Coworkers correspondence Security correspondence Social status correspondence
Note. ** = p < . 0 1
N .2 Significant correlates of individual job satisfaction terms
Ability Achievement Activity
Job attachment .6 185** .6 181 ** .4361 ** Perseverance .4041 ** .3542** NS Speed . 3444** .3598** NS Personal
competence (2) NS NS NS
. 5998**
.3734**
.4155**
. 3 149**
.361 0**
.3916**
.3778**
.3257**
.7323**
.4928**
.3370**
.3261 **
.5410**
.3053**
. 3930**
. 3435**
.304 1 **
.4009**
. 3732**
.3407**
. 3 1 89**
. 5642**
.3970**
. 5066**
. 3 196**
.3614**
639
Advancement Authority
.4212** .4306**
. 3595** .3828** NS NS
. 3406** NS
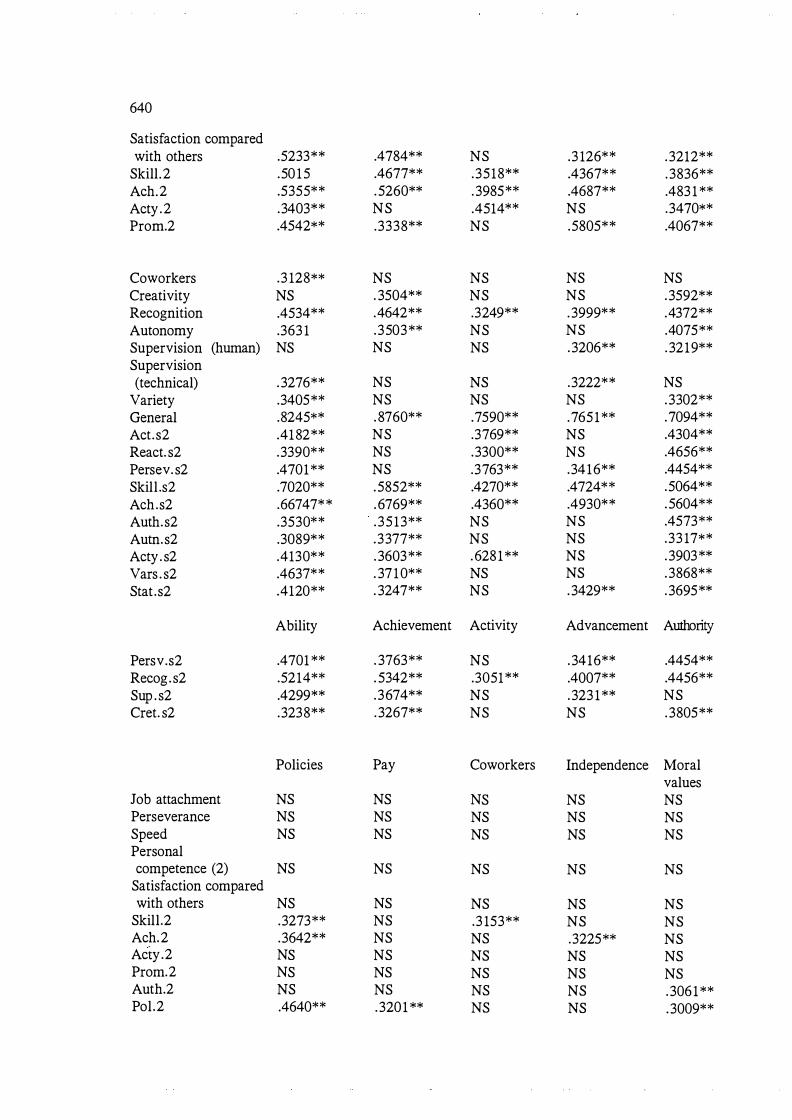
640
Satisfaction compared with others .5233** .4784** NS .3 126** . 3212**
Skill.2 .50 1 5 .4677** .3518** .4367** . 3836** Ach.2 .5355** . 5260** . 3985** .4687** .483 1 ** Acty.2 .3403** NS .4514** NS .3470** Prom.2 .4542** .3338** NS .5805** .4067**
Coworkers .3 128** NS NS NS NS Creativity NS . 3504** NS NS . 3592** Recognition .4534** .4642** .3249** . 3999** .4372** Autonomy .363 1 .3503** NS NS .4075** Supervision (human) NS NS NS . 3206** . 3219** Supervision (technical) . 3276** NS NS .3222** NS
Variety .3405** NS NS NS . 3302** General .8245** . 8760** .7590** .7651 ** .7094** Act. s2 .4182** NS .3769** NS .4304** React. s2 .3390** NS .3300** NS .4656** Persev. s2 .4701 ** NS .3763** .3416** .4454** Skill .s2 .7020** . 5852** .4270** .4724** .5064** Ach.s2 .66747** .6769** .4360** .4930** . 5604** Auth.s2 .3530** . 3513** NS NS .4573** Autn.s2 .3089** .3377** NS NS .33 17** Acty. s2 .4130** . 3603** .6281 ** NS . 3903** Vars . s2 .4637** . 37 1 0** NS NS . 3868** Stat .s2 .4120** . 3247** NS . 3429** . 3695**
Ability Achievement Activity Advancement Authority
Persv.s2 .4701 ** . 3763** NS . 3416** .4454** Recog. s2 .5214** . 5342** .3051 ** .4007** .4456** Sup . s2 .4299** .3674** NS . 323 1 ** NS Cret. s2 .3238** . 3267** NS NS . 3805**
Policies Pay Coworkers Independence Moral values
Job attachment NS NS NS NS NS Perseverance NS NS NS NS NS Speed NS NS NS NS NS Personal competence (2) NS NS NS NS NS
Satisfaction compared with others NS NS NS NS NS
Skill.2 .3273** NS .3 153** NS NS Ach.2 .3642** NS NS .3225** NS Acty.2 NS NS NS NS NS Prom.2 NS NS NS NS NS Auth.2 NS NS NS NS . 3061 ** Pol .2 .4640** . 3201 ** NS NS . 3009**
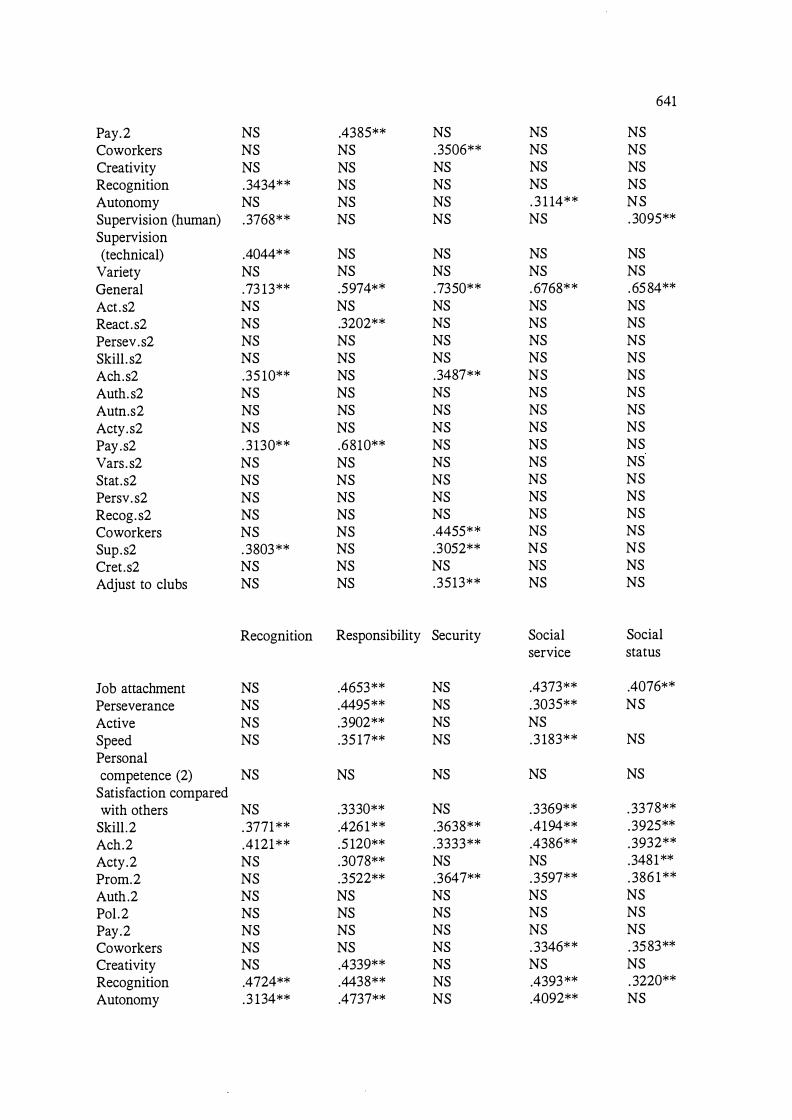
641
Pay.2 NS .4385** NS NS NS Coworkers NS NS .3506** NS NS Creativity NS NS NS NS NS Recognition .3434** NS NS NS NS Autonomy NS NS NS . 3 1 14** NS Supervision (human) .3768** NS NS NS . 3095** Supervision (technical) .4044** NS NS NS NS
Variety NS NS NS NS NS General .73 13** .5974** .7350** . 6768** . 6584** Act .s2 NS NS NS NS NS React .s2 NS .3202** NS NS NS Persev.s2 NS NS NS NS NS Skill . s2 NS NS NS NS NS Ach.s2 .35 10** NS .3487** NS NS Auth. s2 NS NS NS NS NS Autn.s2 NS NS NS NS NS Acty.s2 NS NS NS NS NS Pay.s2 . 3 130** .6810** NS NS NS Vars . s2 NS NS NS NS NS Stat.s2 NS NS NS NS NS Persv. s2 NS NS NS NS NS Recog. s2 NS NS NS NS NS Coworkers NS NS .4455** NS NS Sup.s2 . 3803** NS .3052** NS NS Cret.s2 NS NS NS NS NS Adjust to clubs NS NS .3513** NS NS
Recognition Responsibility Security Social Social service status
Job attachment NS .4653** NS .4373** .4076** Perseverance NS .4495** NS .3035** NS Active NS .3902** NS NS Speed NS .35 17** NS .3 183** NS Personal competence (2) NS NS NS NS NS
Satisfaction compared with others NS .3330** NS .3369** . 3378**
Skill .2 . 3771** .4261 ** .3638** .4194** .3925** Ach.2 .4121 ** .5 120** .3333** .4386** .3932** Acty.2 NS .3078** NS NS .3481** Prom.2 NS .3522** .3647** .3597** . 386 1 ** Auth.2 NS NS NS NS NS Pol .2 NS NS NS NS NS Pay.2 NS NS NS NS NS Coworkers NS NS NS . 3346** . 3583** Creativity NS .4339** NS NS NS Recognition .4724** .4438** NS .4393** . 3220** Autonomy .3 134** .4737** NS .4092** NS

642
Sec.2 NS NS . 3810** NS NS Alt.2 NS NS NS .3904** NS Stat .2 NS NS NS NS . 3755** Supervision (human) NS NS NS NS . 3 198** Supervision (technical) NS NS . 3 163** NS NS
Variety NS NS NS NS . 3217** General .8077** . 8423** . 7370** . 6768** .7505** Act . s2 .3846** .4261 ** NS NS NS React. s2 . 3839** . 3922** NS NS .3715** Persev.s2 .3 148** .4692** NS NS . 3 143** Skill. s2 .443 1** . 5754** NS NS .4679** Ach.s2 .5 133** .6 148** NS NS .4939** Auth. s2 NS . 3586** NS NS . 3666** Autn. s2 NS .4372** NS NS NS Acty. s2 .3846** . 3892** NS NS .3250** Pay.s2 NS NS NS NS NS Sec.s2 NS NS . 5683** NS NS Vars . s2 NS . 3709** NS NS . 3925** Stat . s2 NS . 3202** NS NS . 5455** Persv.s2 NS .4692** NS NS .3 143** Recog.s2 .5321 ** .4615** NS NS .4279** Coworkers NS NS NS NS .3077** Sup . s2 .3642** NS .3884** NS . 3309** Cret . s2 .3354** .4726** NS NS NS Adjust to clubs NS NS NS NS NS
Supervision Supervision Variety Working General (human) (technical) Conditions satisf-
action
Job attachment NS NS . 5462** .2416** .5073* Perseverance NS NS . 3623** NS .3913** Active NS NS NS NS NS Speed NS NS . 3497** . 3460** Personal competence (2) NS NS NS NS NS
Satisfaction compared with others NS NS .4692** NS .3486**
Skill. 2 NS .4191 ** . 3975** .3502** .4795** Ach.2 NS . 3 191 ** .4838** NS .5067** Acty. 2 NS NS . 3462** . 3239** Prom.2 NS NS . 3958** NS .4001 ** Auth. 2 NS NS NS NS .3022** Pol. 2 .3697** . 3768** NS NS . 3496** Pay.2 NS NS NS NS NS Coworkers NS NS NS NS . 3 169** Creativity NS NS . 3200** NS NS Recognition NS . 3 100** . 3367** NS .4540** Autonomy NS NS NS NS . 3634** Sec.2 NS NS NS NS NS
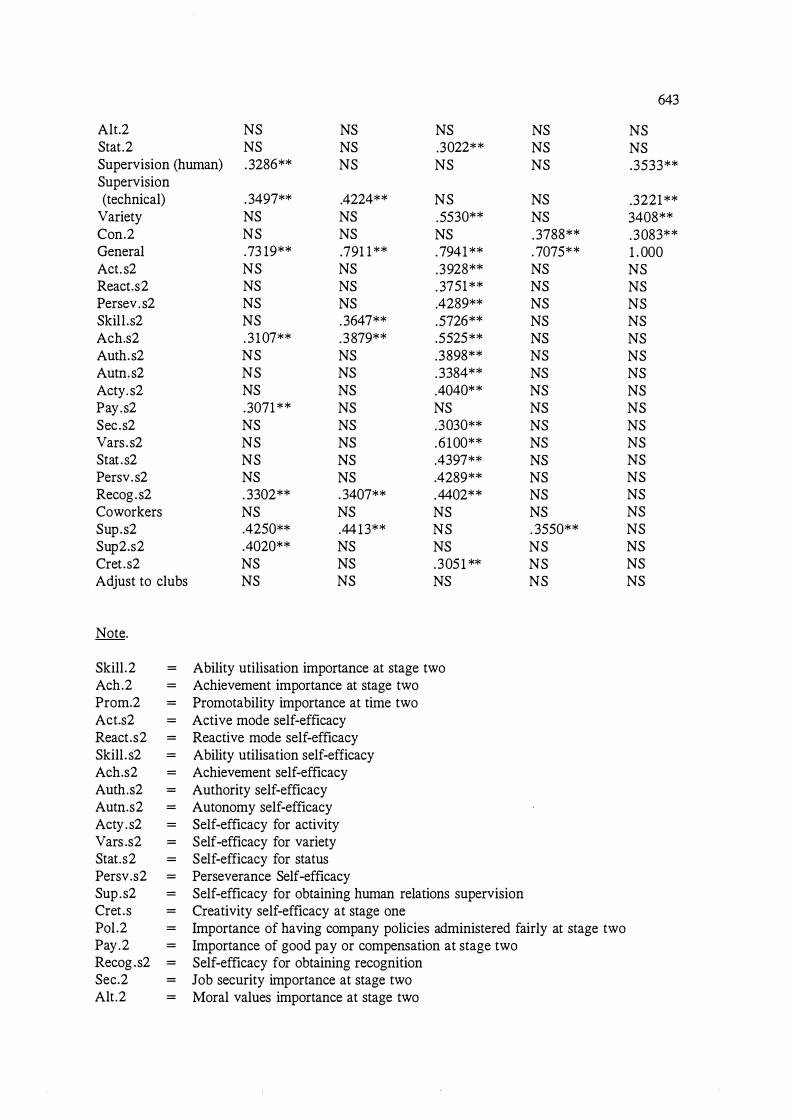
Alt.2 NS NS NS NS Stat.2 NS NS .3022** NS Supervision (human) . 3286** NS NS NS Supervision (technical)
Variety Con.2 General Act. s2 React.s2 Persev. s2 Skill .s2 Ach.s2 Auth.s2 Autn.s2 Acty. s2 Pay.s2 Sec.s2 Vars . s2 Stat .s2 Persv.s2 Recog.s2 Coworkers Sup.s2 Sup2.s2 Cret.s2 Adjust to clubs
Note.
Skill.2 =
Ach.2 =
Prom.2 =
Act.s2 =
React.s2 =
Skill . s2 =
Ach.s2 =
Auth.s2 =
Autn.s2 =
Acty .s2 =
Vars .s2 =
Stat.s2 =
Persv.s2 =
Sup .s2 =
Cret.s =
Pol .2 =
Pay.2 =
Recog .s2 =
Sec.2 =
Alt.2 =
. 3497** .4224** NS NS NS .5530** NS NS NS .73 19** .791 1 ** .7941 ** NS NS .3928** NS NS . 3751 ** NS NS .4289** NS .3647** .5726** . 3 107** .3879** .5525** NS NS .3898** NS NS .3384** NS NS .4040** .3071 ** NS NS NS NS .3030** NS NS .6100** NS NS .4397** NS NS .4289** . 3302** . 3407** .4402** NS NS NS .4250** .4413** NS .4020** NS NS NS NS .3051 ** NS NS NS
Ability utilisation importance at stage two Achievement importance at stage two Promotability importance at time two Active mode self-efficacy Reactive mode self-efficacy Ability utilisation self-efficacy Achievement self-efficacy Authority self-efficacy Autonomy self-efficacy Self-efficacy for activity Self-efficacy for variety Self-efficacy for status Perseverance Self-efficacy Self-efficacy for obtaining human relations supervision Creativity self-efficacy at stage one
NS NS .3788** .7075** NS NS NS NS NS NS NS NS NS NS NS NS NS NS NS . 3550** NS NS NS
Importance of having company policies administered fairly at stage two Importance of good pay or compensation at stage two Self-efficacy for obtaining recognition Job security importance at stage two Moral values importance at stage two
643
NS NS .3533**
.3221 ** 3408** .3083** 1 . 000 NS NS NS NS NS NS NS NS NS NS NS NS NS NS NS NS NS NS NS
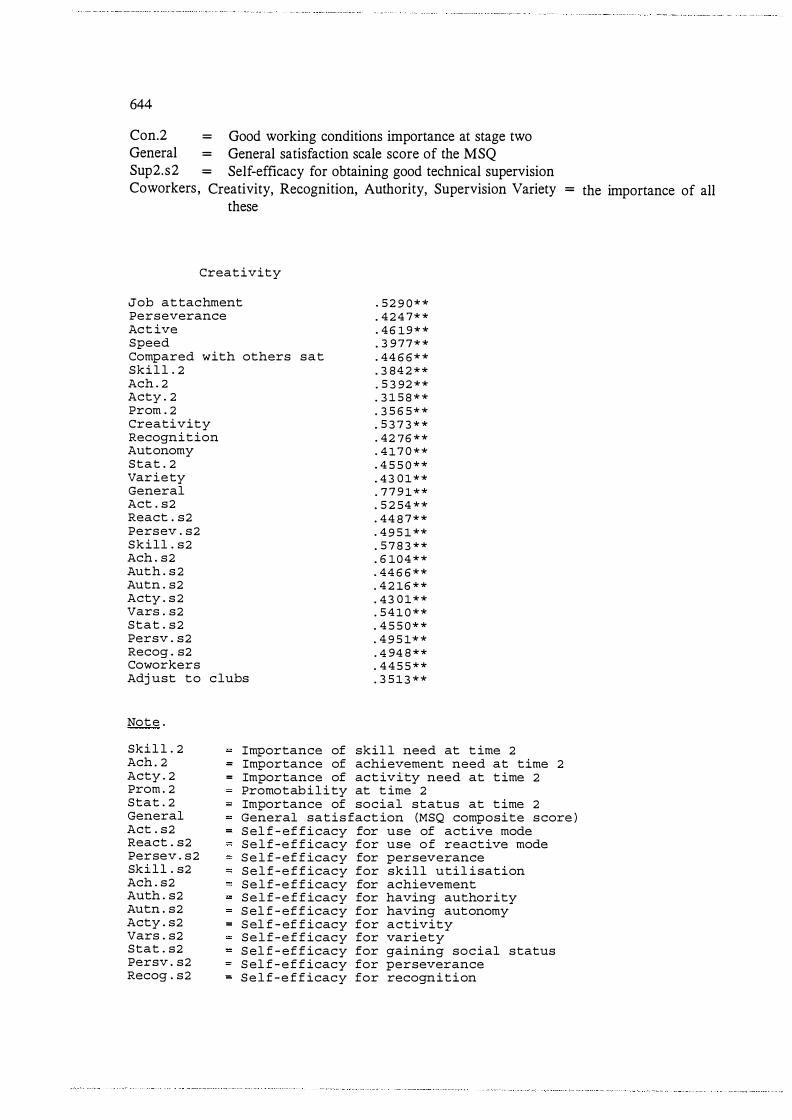
644
Con.2 General Sup2.s2 Coworkers ,
= Good working conditions importance at stage two = General satisfaction scale score of the MSQ = Self-efficacy for obtaining good technical supervision Creativity, Recognition, Authority, Supervision Variety =
these
Creat ivity
Job at tachment Pers everance Act ive Speed Compared with others s a t Ski l l . 2
. 5 2 9 0 * *
. 4 2 4 7 * *
. 4 6 1 9 * *
. 3 9 7 7 * *
. 4 4 6 6 * *
. 3 8 4 2 * *
. 5 3 9 2 * *
. 3 1 5 8 * *
. 3 5 6 5 * *
. 5 3 7 3 * *
. 4 2 7 6 * *
. 4 1 7 0 * *
. 4 5 5 0 * *
. 4 3 0 1 * *
. 7 7 9 1 * *
. 5 2 54 * *
. 4 4 8 7 * *
. 4 9 5 1 * *
. 5 7 8 3 * *
. 6 1 0 4 * *
. 4 4 6 6 * *
. 4 2 1 6 * *
. 4 3 0 1 * *
. 5 4 1 0 * *
. 4 5 5 0 * *
. 4 9 5 1 * *
. 4 94 8 * *
. 4 4 5 5 * *
. 3 5 1 3 * *
Ach . 2 Acty . 2 Prom . 2 Creativity Recognit ion Autonomy Stat . 2 Var i e ty General Act . s 2 React . s 2 Pers ev . s 2 S k i l l . s 2 Ach . s 2 Auth . s 2 Autn . s 2 Acty . s 2 Vars . s 2 Stat . s 2 Persv . s 2 Recog . s2 Coworkers Adj ust t o c lubs
Not e .
Ski l l . 2 Ach . 2 Acty . 2 Prom . 2 Stat . 2 General Act . s 2 React . s 2 Persev . s 2 Ski l l . s 2 Ach . s 2 Auth . s 2 Autn . s 2 Acty . s 2 Vars . s 2 Stat . s 2 Persv . s 2 Recog . s 2
Importance of skil l need at t ime 2 Importance of achi evement need at time 2 Importance of act ivity need at t ime 2 Promotab i l i ty at t ime 2 Importance of social s tatus at t ime 2 General s a t i s fact ion (MSQ composite s core ) S el f - ef f i cacy for use of act ive mode S e l f - e f f icacy for use o f reactive mode S e l f - ef f icacy for perseverance S e l f - e f f icacy for s k i l l uti l i sation S e l f - e f f icacy for achievement S e l f - e f f icacy for having authority S el f - ef f icacy for having autonomy S el f - ef f i cacy for a c t ivity S e l f - e f f icacy for variety S el f - ef f icacy for gaining s o c ial s tatus S el f - e f f icacy for perseverance S e l f - e f f icacy for recogn i t i on
the importance of all
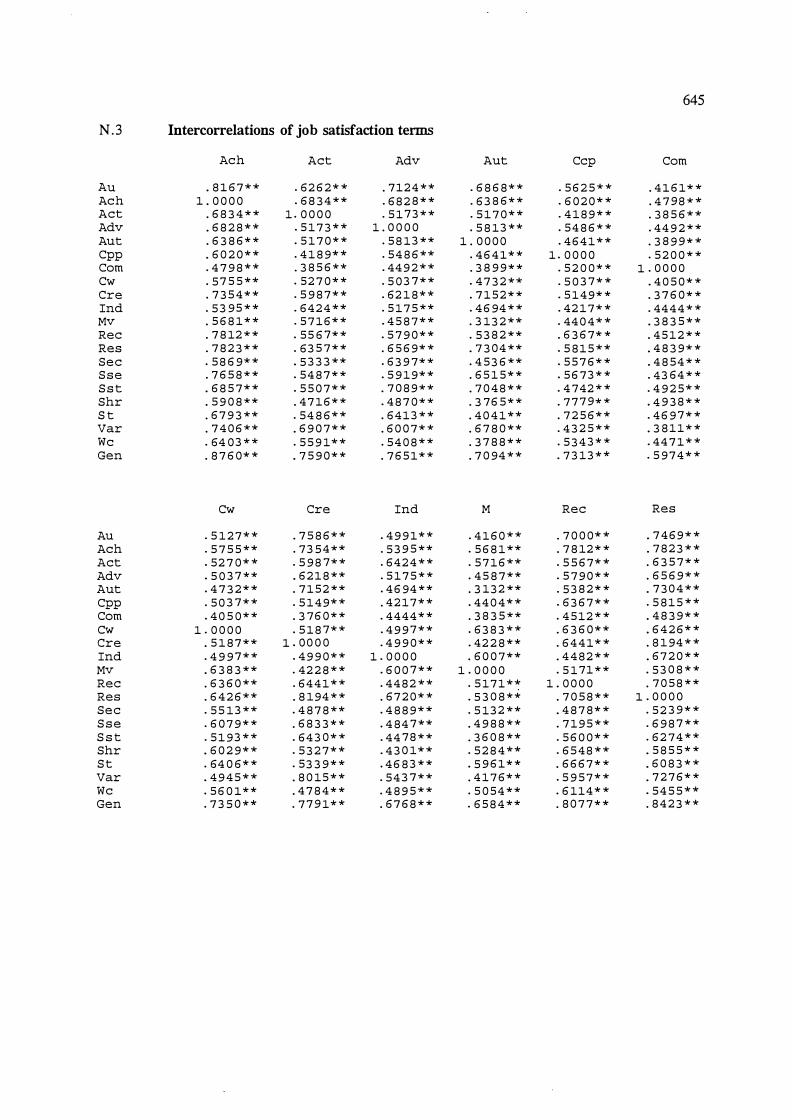
645
N.3 Intercorrelations of job satisfaction terms
A eh Act Adv Aut Ccp Corn
Au . 8 l 6 7 * * . 6 2 6 2 * * . 7 1 2 4 * * . 6 8 6 8 * * . 5 6 2 5 * * . 4 l 6 1 * * A eh 1 . 0 0 0 0 . 6 8 3 4 * * . 6 8 2 8 * * . 6 3 8 6 * * . 6 0 2 0 * * . 4 7 9 8 * * Act . 6 8 3 4 * * 1 . 0 0 0 0 . 5 1 7 3 * * . 5 1 7 0 * * . 4 1 8 9 * * . 3 8 5 6 * * Adv . 6 8 2 8 * * . 5 1 7 3 * * 1 . 0 0 0 0 . 5 8 1 3 * * . 5 4 8 6 * * . 4 4 9 2 * * Aut . 6 3 8 6 * * . 5 1 7 0 * * . 5 8 1 3 * * 1 . 0 0 0 0 . 4 6 4 1 * * . 3 8 9 9 * *
Cpp . 6 0 2 0 * * . 4 1 8 9 * * . 5 4 8 6 * * . 4 6 4 l * * 1 . 0 0 0 0 . 5 2 0 0 * * Corn . 4 7 9 8 * * . 3 8 5 6 * * . 44 9 2 * * . 3 8 9 9 * * . 5 2 0 0 * * l . O O O O Cw . 5 7 5 5 * * . 5 2 7 0 * * . 5 0 3 7 * * . 4 7 3 2 * * . 5 0 3 7 * * . 4 0 5 0 * *
ere . 7 3 5 4 * * . 5 9 8 7 * * . 6 2 1 8 * * . 7 1 5 2 * * . 5 1 4 9 * * . 3 7 6 0 * *
Ind . 5 3 9 5 * * . 6 4 2 4 * * . 5 1 7 5 * * . 4 6 94 * * . 4 2 1 7 * * . 44 4 4 * *
Mv . 5 6 8 1 * * . 5 7 1 6 * * . 4 5 8 7 * * . 3 1 3 2 * * . 44 0 4 * * . 3 8 3 5 * *
Rec . 7 8 12 * * . 5 5 6 7 * * . 5 7 9 0 * * . 5 3 8 2 * * . 6 3 6 7 * * . 4 5 1 2 * *
Res . 7 8 2 3 * * . 6 3 5 7 * * . 6 5 6 9 * * . 7 3 0 4 * * . 5 8 1 5 * * . 4 8 3 9 * *
S e c . 5 8 6 9 * * . 5 3 3 3 * * . 6 3 9 7 * * . 4 5 3 6 * * . 5 5 7 6 * * . 4 8 5 4 * * S s e . 7 6 5 8 * * . 5 4 8 7 * * . 5 9 1 9 * * . 6 5 1 5 * * . 5 6 7 3 * * . 4 3 6 4 * *
S s t . 6 8 5 7 * * . 5 5 0 7 * * . 7 0 8 9 * * . 7 0 4 8 * * . 4 7 4 2 * * . 4 9 2 5 * *
Shr . 5 9 0 8 * * . 4 7 1 6 * * . 4 8 7 0 * * . 3 7 6 5 * * . 7 7 7 9 * * . 4 9 3 8 * *
S t . 6 7 9 3 * * . 5 4 8 6 * * . 6 4 1 3 * * . 4 0 4 1 * * . 7 2 5 6 * * . 4 6 9 7 * *
Var . 7 4 0 6 * * . 6 9 0 7 * * . 6 0 0 7 * * . 6 7 8 0 * * . 4 3 2 5 * * . 3 8 1 1 * *
We . 64 0 3 * * . 5 5 9 1 * * . 5 4 0 8 * * . 3 7 8 8 * * . 5 3 4 3 * * . 4 4 7 l * *
Gen . 8 7 6 0 * * . 7 5 9 0 * * . 7 6 5 l * * . 7 0 94 * * . 7 3 1 3 * * . 5 9 7 4 * *
Cw ere Ind M Rec Res
Au . 5 1 2 7 * * . 7 5 8 6 * * . 4 9 9 l * * . 4 1 6 0 * * . 7 0 0 0 * * . 7 4 6 9 * *
A eh . 5 7 5 5 * * . 7 3 5 4 * * . 5 3 9 5 * * . 5 6 8 1 * * . 7 8 12 * * . 7 8 2 3 * *
Act . 5 2 7 0 * * . 5 9 8 7 * * . 6 4 2 4 * * . 5 7 1 6 * * . 5 5 6 7 * * . 6 3 5 7 * *
Adv . 5 0 3 7 * * . 6 2 l 8 * * . 5 1 7 5 * * . 4 5 8 7 * * . 5 7 9 0 * * . 6 5 6 9 * *
Aut . 4 7 3 2 * * . 7 1 5 2 * * . 4 6 94 * * . 3 1 3 2 * * . 5 3 8 2 * * . 7 3 0 4 * *
Cpp . 5 0 3 7 * * . 5 1 4 9 * * . 4 2 1 7 * * . 4 4 0 4 * * . 6 3 6 7 * * . 5 8 1 5 * *
Corn . 4 0 5 0 * * . 3 7 6 0 * * . 4 4 4 4 * * . 3 8 3 5 * * . 4 5 1 2 * * . 4 8 3 9 * *
Cw 1 . 0 0 0 0 . 5 1 8 7 * * . 4 9 9 7 * * . 6 3 8 3 * * . 6 3 6 0 * * . 6 4 2 6 * *
ere . 5 1 8 7 * * l . O O O O . 4 9 9 0 * * . 4 2 2 8 * * . 6 4 4 1 * * . 8 1 94 * *
Ind . 4 9 9 7 * * . 4 9 9 0 * * 1 . 0 0 0 0 . 6 0 0 7 * * . 4 4 8 2 * * . 6 7 2 0 * *
Mv . 6 3 8 3 * * . 4 2 2 8 * * . 6 0 0 7 * * 1 . 0 0 0 0 . 5 1 71 * * . 5 3 0 8 * *
Rec . 6 3 6 0 * * . 6 4 4 1 * * . 4 4 8 2 * * . 5 1 7 1 * * 1 . 0 0 0 0 . 7 0 5 8 * *
Res . 6 4 2 6 * * . 8 1 94 * * . 6 7 2 0 * * . 5 3 0 8 * * . 7 0 5 8 * * l . O O O O S e c . 5 5 1 3 * * . 4 8 7 8 * * . 4 8 8 9 * * . 5 1 3 2 * * . 4 8 7 8 * * . 5 2 3 9 * *
S s e . 6 0 7 9 * * . 6 8 3 3 * * . 4 8 4 7 * * . 4 9 8 8 * * . 7 1 9 5 * * . 6 9 8 7 * *
S s t . 5 l 9 3 * * . 6 4 3 0 * * . 4 4 7 8 * * . 3 6 0 8 * * . 5 6 0 0 * * . 6 2 7 4 * *
Shr . 6 0 2 9 * * . 5 3 2 7 * * . 4 3 0 1 * * . 5 2 8 4 * * . 6 5 4 8 * * . 5 8 5 5 * *
S t . 64 0 6 * * . 5 3 3 9 * * . 4 6 8 3 * * . 5 9 6 l * * . 6 6 6 7 * * . 6 0 8 3 * *
Var . 4 9 4 5 * * . 8 0 1 5 * * . 5 4 3 7 * * . 4 1 7 6 * * . 5 9 5 7 * * . 7 2 7 6 * *
We . 5 6 0 l * * . 4 7 8 4 * * . 4 8 9 5 * * . 5 0 5 4 * * . 6 1 1 4 * * . 5 4 5 5 * *
Gen . 7 3 5 0 * * . 7 7 9 1 * * . 6 7 6 8 * * . 6 5 8 4 * * . 8 0 7 7 * * . 8 4 2 3 * *
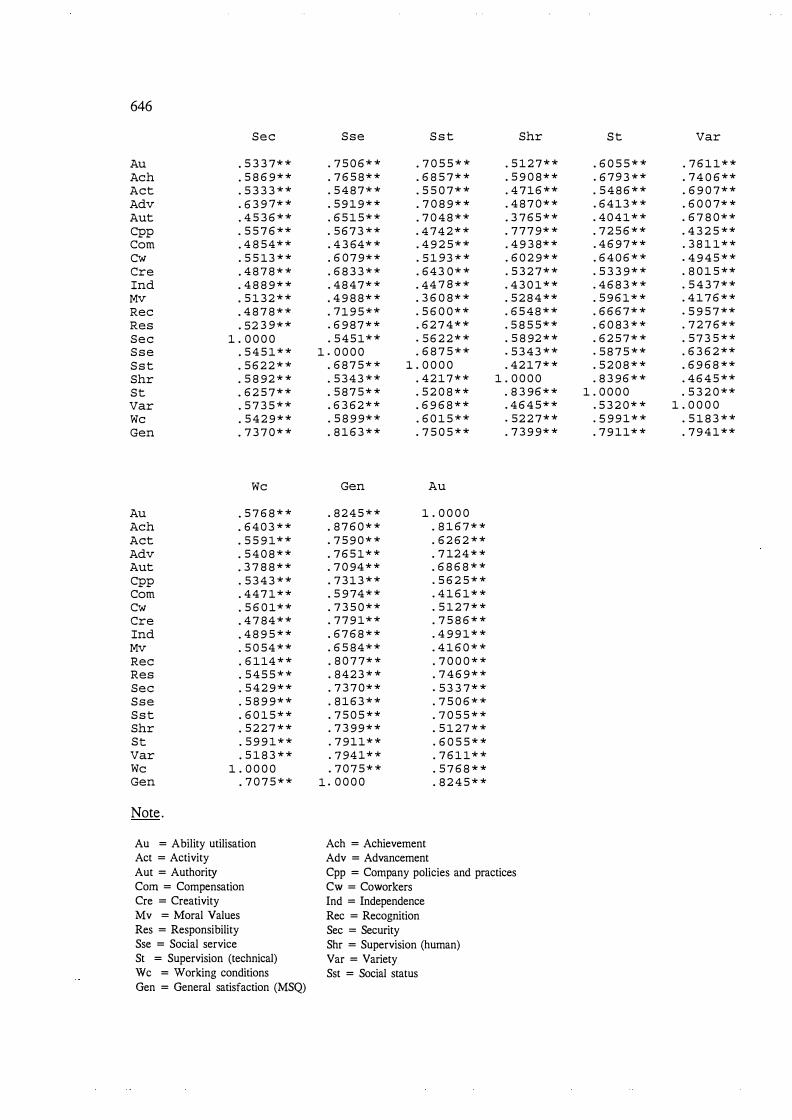
646
S e c
Au . 5 3 3 7 * *
A eh . 5 8 6 9 * *
Act . 5 3 3 3 * *
Adv . 6 3 9 7 * *
Aut . 4 5 3 6 * *
Cpp . 5 5 7 6 * *
Corn . 4 8 5 4 * *
Cw . 5 5 1 3 * *
ere . 4 8 7 8 * *
Ind . 4 8 8 9 * *
Mv . 5 1 3 2 * *
Rec . 4 8 7 8 * *
Res . 5 2 3 9 * *
S e c 1 . 0 0 0 0 S s e . 5 4 5 1 * *
S s t . 5 6 2 2 * *
Shr . 5 8 9 2 * *
St . 6 2 5 7 * *
Var . 5 7 3 5 * *
We . 5 4 2 9 * *
Gen . 7 3 7 0 * *
We
Au . 5 7 6 8 * *
A eh . 6 4 0 3 * *
Act . 5 5 9 1 * *
Adv . 5 4 0 8 * *
Aut . 3 7 8 8 * *
Cpp . 5 3 4 3 * *
Corn . 4 4 7 1 * *
Cw . 5 6 0 1 * *
ere . 4 7 8 4 * *
Ind . 4 8 9 5 * *
Mv . 5 0 5 4 * *
Rec . 6 1 14 * *
Res . 5 4 5 5 * *
Sec . 5 4 2 9 * *
S s e . 5 8 9 9 * *
S s t . 6 0 1 5 * *
Shr . 5 2 2 7 * *
St . 5 9 9 1 * *
Var . 5 1 8 3 * * We 1 . 0 0 0 0 Gen . 7 0 7 5 * *
Note .
Au = Ability utilisation
Act = Activity
Aut = Authority
Corn = Compensation
Cre = Creativity
Mv = Moral Values
Res = Responsibility
Sse = Social service
St = Supervision (technical)
W c = Working conditions
Gen = General satisfaction (MSQ)
S s e S s t
. 7 5 0 6 * * . 7 0 5 5 * *
. 7 6 5 8 * * . 6 8 5 7 * *
. 5 4 8 7 * * . 5 5 0 7 * *
. 5 9 1 9 * * . 7 0 8 9 * *
. 6 5 1 5 * * . 7 0 4 8 * *
. 5 6 7 3 * * . 4 7 4 2 * *
. 4 3 64 * * . 4 9 2 5 * *
. 6 0 7 9 * * . 5 1 9 3 * *
. 6 8 3 3 * * . 6 4 3 0 * *
. 4 8 4 7 * * . 4 4 7 8 * *
. 4 9 8 8 * * . 3 6 0 8 * *
. 7 1 9 5 * * . 5 6 0 0 * *
. 6 9 8 7 * * . 6 2 7 4 * *
. 5 4 5 1 * * . 5 6 2 2 * *
1 . 0 0 0 0 . 6 8 7 5 * *
. 6 8 7 5 * * 1 . 0 0 0 0
. 5 3 4 3 * * . 4 2 1 7 * *
. 5 8 7 5 * * . 5 2 0 8 * *
. 6 3 6 2 * * . 6 9 6 8 * *
. 5 8 9 9 * * . 6 0 1 5 * *
. 8 1 6 3 * * . 7 5 0 5 * *
Gen Au
. 8 2 4 5 * * 1 . 0 0 0 0
. 8 7 6 0 * * . 8 1 6 7 * *
. 7 5 9 0 * * . 6 2 6 2 * *
. 7 6 5 1 * * . 7 12 4 * *
. 7 0 94 * * . 6 8 6 8 * *
. 7 3 1 3 * * . 5 6 2 5 * *
. 5 9 74 * * . 4 1 6 1 * *
. 7 3 5 0 * * . 5 1 2 7 * *
. 7 7 9 1 * * . 7 5 8 6 * *
. 6 7 6 8 * * . 4 9 9 1 * *
. 6 5 8 4 * * . 4 1 6 0 * *
. 8 0 7 7 * * . 7 0 0 0 * *
. 8 4 2 3 * * . 7 4 6 9 * *
. 7 3 7 0 * * . 5 3 3 7 * *
. 8 1 6 3 * * . 7 5 0 6 * *
. 7 5 0 5 * * . 7 0 5 5 * *
. 7 3 9 9 * * . 5 1 2 7 * *
. 7 9 1 1 * * . 6 0 5 5 * *
. 7 94 1 * * . 7 6 1 1 * *
. 7 0 7 5 * * . 5 7 6 8 * *
1 . 0 0 0 0 . 8 2 4 5 * *
Ach = Achievement
Adv = Advancement
Shr
. 5 1 2 7 * *
. 5 9 0 8 * *
. 4 7 1 6 * *
. 4 8 7 0 * *
. 3 7 6 5 * *
. 7 7 7 9 * *
. 4 9 3 8 * *
. 6 0 2 9 * *
. 5 3 2 7 * *
. 4 3 0 1 * *
. 5 2 8 4 * *
. 6 5 4 8 * *
. 5 8 5 5 * *
. 5 8 92 * *
. 5 3 4 3 * *
. 4 2 1 7 * *
1 . 0 0 0 0 . 8 3 9 6 * *
. 4 6 4 5 * *
. 5 2 2 7 * *
. 7 3 9 9 * *
Cpp = Company policies and practices
Cw = Coworkers
Ind = Independence
Rec = Recognition
Sec = Security
Shr = Supervision (human)
Var = Variety
Sst = Social status
S t Var
. 6 0 5 5 * * . 7 6 1 1 * *
. 6 7 9 3 * * . 7 4 0 6 * *
. 5 4 8 6 * * . 6 9 0 7 * *
. 6 4 1 3 * * . 6 0 0 7 * *
. 4 0 4 1 * * . 6 7 8 0 * *
. 7 2 5 6 * * . 4 3 2 5 * *
. 4 6 9 7 * * . 3 8 1 1 * *
. 6 4 0 6 * * . 4 9 4 5 * *
. 5 3 3 9 * * . 8 0 1 5 * *
. 4 6 8 3 * * . 5 4 3 7 * *
. 5 9 6 1 * * . 4 1 7 6 * *
. 6 6 6 7 * * . 5 9 5 7 * *
. 6 0 8 3 * * . 7 2 7 6 * *
. 6 2 5 7 * * . 5 7 3 5 * *
. 5 8 7 5 * * . 6 3 6 2 * *
. 5 2 0 8 * * . 6 9 6 8 * *
. 8 3 9 6 * * . 4 6 4 5 * *
1 . 0 0 0 0 . 5 3 2 0 * *
. 5 3 2 0 * * 1 . 0 0 0 0
. 5 9 9 1 * * . 5 1 8 3 * *
. 7 9 1 1 * * . 7 9 4 1 * *
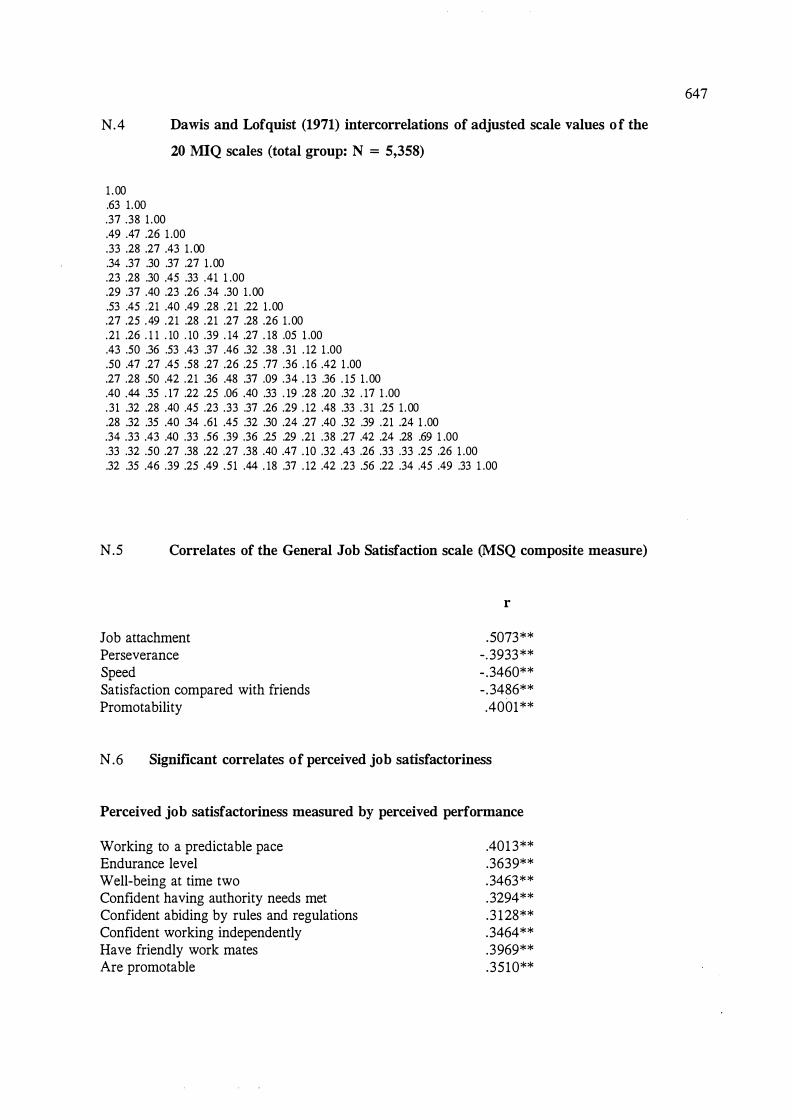
N .4 Dawis and Lofquist (1971) intercorrelations of adjusted scale values of the
20 MIQ scales (total group: N = 5,358)
1 . 00 .63 1.00 .37 .38 1 .00 .49 .47 .26 1 .00 .33 .28 .27 .43 1 .00 .34 .37 .30 .37 .27 1 .00 .23 .28 .30 .45 .33 .41 1 .00 .29 .37 .40 .23 .26 .34 .30 1 .00 .53 .45 .21 .40 .49 .28 .21 .22 1 .00 .27 .25 . 49 .21 .28 .21 .27 .28 .26 1 .00 .21 .26 . 1 1 . 10 . 10 .39 . 14 .27 . 18 .05 1 .00 .43 .50 .36 .53 .43 .37 .46 .32 .38 . 3 1 . 12 1 .00 .50 .47 .27 .45 .58 .27 .26 .25 .77 .36 . 16 .42 1 .00 .27 .28 .50 .42 .21 .36 .48 .37 .09 .34 . 13 .36 . 15 1 .00 .40 .44 .35 . 17 .22 .25 .06 .40 .33 . 19 .28 .20 .32 . 17 1 .00 . 3 1 .32 .28 .40 .45 .23 .33 .37 .26 .29 . 12 .48 .33 . 3 1 .25 1 .00 .28 .32 .35 .40 .34 .61 .45 .32 .30 .24 .27 .40 .32 .39 .21 .24 1 .00 .34 .33 .43 .40 .33 .56 .39 .36 .25 .29 .21 .38 .27 .42 .24 .28 .69 1 .00 .33 .32 .50 .27 .38 .22 .27 .38 .40 .47 . 10 .32 .43 .26 .33 .33 .25 .26 1 .00 .32 .35 .46 .39 .25 .49 .51 .44 . 18 .37 . 12 .42 .23 .56 .22 .34 .45 .49 .33 1 .00
N.5 Correlates of the General Job Satisfaction scale (MSQ composite measure)
Job attachment Perseverance Speed Satisfaction compared with friends Promotability
r
.5073** - . 3933** - .3460** - . 3486** .4001 **
N .6 Significant correlates of perceived job satisfactoriness
Perceived job satisfactoriness measured by perceived performance
Working to a predictable pace Endurance level Well-being at time two Confident having authority needs met Confident abiding by rules and regulations Confident working independently Have friendly work mates 1\re promotable
.401 3**
.3639**
.3463**
.3294**
.3 128**
.3464**
.3969**
.3510**
647
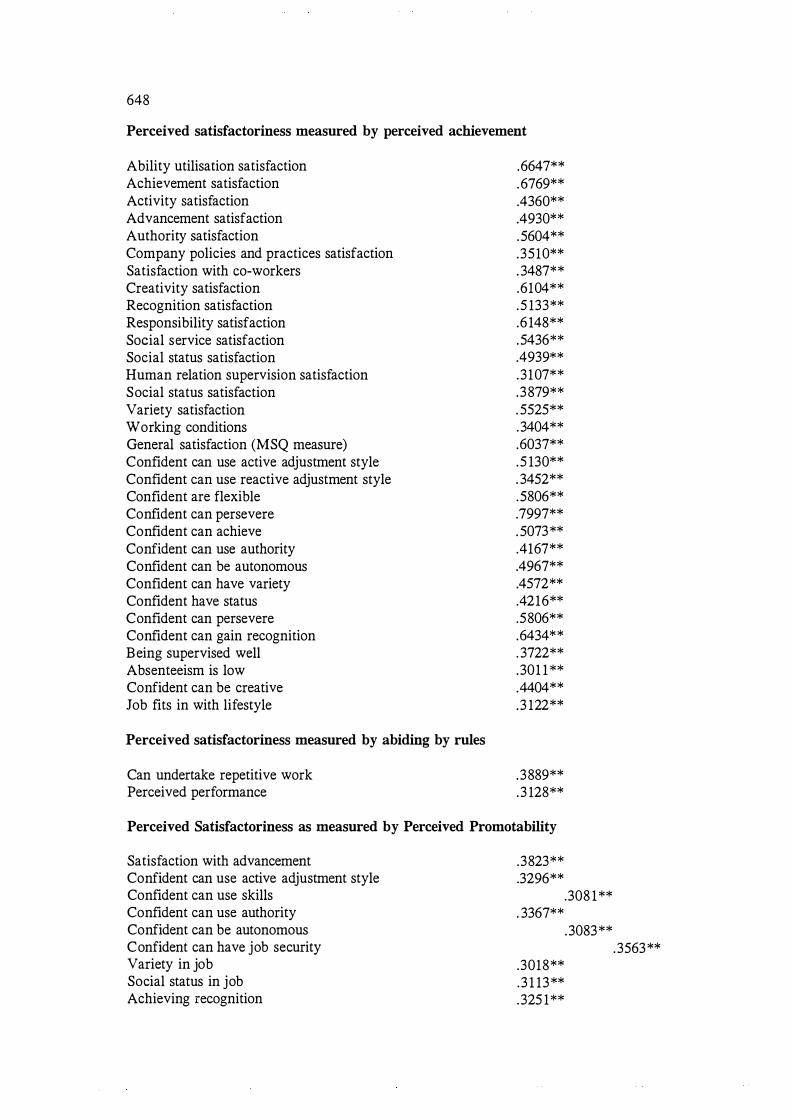
648
Perceived satisfactoriness measured by perceived achievement
Ability utilisation satisfaction Achievement satisfaction Activity satisfaction Advancement satisfaction Authority satisfaction Company policies and practices satisfaction Satisfaction with eo-workers Creativity satisfaction Recognition satisfaction Responsibility satisfaction Social service satisfaction Social status satisfaction Human relation supervision satisfaction Social status satisfaction Variety satisfaction Working conditions General satisfaction (MSQ measure) Confident can use active adjustment style Confident can use reactive adjustment style Confident are flexible Confident can persevere Confident can achieve Confident can use authority Confident can be autonomous Confident can have variety Confident have status Confident can persevere Confident can gain recognition Being supervised well Absenteeism is low Confident can be creative Job fits in with lifestyle
Perceived satisfactoriness measured by abiding by rules
Can undertake repetitive work Perceived performance
.6647**
.6769**
.4360**
.4930**
.5604**
.3510**
. 3487**
.6104**
.5 133**
.6 148**
.5436**
.4939**
.3107**
.3879**
. 5525** .3404** .6037** .5 130** . 3452** .5806** .7997** . 5073** .4167** .4967** .4572** .4216** .5806** .6434** . 3722** . 301 1 ** .4404** . 3 122**
.3889**
.3 128**
Perceived Satisfactoriness as measured by Perceived Promotability
Satisfaction with advancement Confident can use active adjustment style Confident can use skills Confident can use authority Confident can be autonomous Confident can have job security Variety in job Social status in job Achieving recognition
.3823**
.3296** .308 1 **
. 3367**
.3018**
.3 1 13**
.325 1 **
.3083** .3563**

Satisfactoriness measured by adapting to changes (in procedures and methods)
Endurance Secure job Variety in job Friendly eo-workers Performance Absenteeism low Can work in a team Get along w ith supervisors
.3348**
.2486**
.3 127**
.4219**
.35 10**
.3605**
.4782**
.4892**
Satisfactoriness measured by ability to work as a member of a team
Confident can use active adjustment style Variety in job Friendly eo-workers Perceived promotabil ity Get along with supervisors
. 3015**
. 3656**
. 3844**
.4782**
. 4774**
Satisfactoriness measured by ability to get along with supervisors
Workers in this job get along with supervisors Satisfaction w ith human relations supervision Job security Obtaining recognition Supervision and training is good Adapt to procedures and method changes Work as a member of a team
N . 7 Correlates of Job Attachment
Expected Tenure Perseverance Speed Personal competence post-employment Satisfaction compared with friends Job importance Workers use their abil ities in this j ob Workers achieve i n this j ob Workers achieve recognition Abi lity util isation satisfaction Achievement satisfaction Activity satisfaction Advancement satisfaction Creativity satisfaction
. 3081 **
.4020**
. 3466**
. 3339**
.4445**
.4892**
.4774**
Pears on r . 3232** .4254** .4 146**
- .3026** .6445** . 3259** . 3578** .4437** . 3525** . 6 1 85** . 6 1 8 1 ** .436 1 ** .4212**
- . 5290**
649

650
Recognition satisfaction Responsibil ity satisfaction Social service satisfaction Social status sat isfaction
Supervision technical Variety satisfaction
General satisfaction (MSQ) Active flexibil ity Self-efficacy for perseverance Self-efficacy for abil ity ut il isat ion Self-efficacy for achievement Authority self-efficacy Autonomy self-efficacy Active mode sel f-efficacy Activity self-efficacy Variety self-efficacy Social status self-efficacy Perseverance self-efficacy Recognition self-efficacy
N . 8 Significant correlates of general adjustment
1 . Adjustment to j oining a new organisation
Perseverance Predictability of pace U sing a reactive adjustment style Speed of response to improve work situation Wel l -being (time one) Well -be ing (time two) Life satisfaction (time two) Satisfaction with eo-workers Confident can use active adjustment style Adjust to a new town or l ocation
2. Adjustment to a new town or location
Speed of response to improve work s ituation Life satisfaction (time two) Adjust to joining a new organisation
.4237**
.4653**
.4373* *
.4076**
.4076**
.5462* *
. 5073**
. 3883**
.4649**
.5807**
.660 1 **
. 3 892* *
.3592**
. 3883**
.354 1 * *
.509 1 * *
.3576**
.4649** .5470* *
. 3259**
. 3 122**
.3 1 60**
.4332**
. 3306**
.3477**
. 3 1 12**
. 35 1 3**
.3693* *
.4508**
.324 1 **
. 304 1 **
.4508**
Related Documents