1 Relationship stability and supplier commitment to quality Kee-hung Lai 1 , T. C. E. Cheng and A. C. L. Yeung Department of Logistics, The Hong Kong Polytechnic University Abstract This study explores the link between relationship stability and supplier commitment to quality, and the contingency of the link on characteristics of transactions within the framework of transaction cost analysis (TCA). Data collected from 358 suppliers of a globalized firm suggest that supplier firms regard a stable relationship as being positively linked to their commitment to quality for the focal buyer firm. It was also found that the link is stronger when the suppliers’ perceptions of a certainty of supply with the buyer firm are greater, while asset specificity and transaction frequency have no impact on the link. A discussion of the results and of the implications of the findings is provided. Keywords: Buyer-supplier relationships, transaction cost analysis, commitment, quality assurance, supplier management 1 Corresponding Author. Department of Logistics, The Hong Kong Polytechnic University, Hung Hom, Kowloon, Hong Kong. Tel.: +852-2766-7920; fax: +852-2330-2704; Email address: [email protected] This is the Pre-Published Version.

Welcome message from author
This document is posted to help you gain knowledge. Please leave a comment to let me know what you think about it! Share it to your friends and learn new things together.
Transcript
1
Relationship stability and supplier commitment to quality
Kee-hung Lai1, T. C. E. Cheng and A. C. L. Yeung
Department of Logistics, The Hong Kong Polytechnic University Abstract
This study explores the link between relationship stability and supplier commitment to
quality, and the contingency of the link on characteristics of transactions within the framework
of transaction cost analysis (TCA). Data collected from 358 suppliers of a globalized firm
suggest that supplier firms regard a stable relationship as being positively linked to their
commitment to quality for the focal buyer firm. It was also found that the link is stronger when
the suppliers’ perceptions of a certainty of supply with the buyer firm are greater, while asset
specificity and transaction frequency have no impact on the link. A discussion of the results and
of the implications of the findings is provided.
Keywords: Buyer-supplier relationships, transaction cost analysis, commitment, quality
assurance, supplier management
1 Corresponding Author. Department of Logistics, The Hong Kong Polytechnic University, Hung Hom, Kowloon, Hong Kong. Tel.: +852-2766-7920; fax: +852-2330-2704; Email address: [email protected]
This is the Pre-Published Version.

2
1. Introduction
During the last decade, supply chain management (SCM), a management approach that
emphasizes the importance of building and managing relationships among partner firms in a
supply chain, has received considerable attention in research and practice. SCM is concerned
with managing the upstream and downstream relationships between suppliers and customers, to
deliver superior customer value at the least cost to the chain as a whole (Christopher 1998). On
the other hand, the importance of quality and its associated benefits such as improvements in
customer satisfaction and in the bottom-line have been well acknowledged (e.g., Hendricks and
Singhal 1997). For instance, the quality of logistics services has been recognized as an area in
which firms can attain a competitive edge (Mentzer, Flint and Hult 2001). Given the growing
trend towards developing and maintaining mutually beneficial exchanges in buyer-supplier
relationships, the aspect of quality management of the supply chain is receiving increased
attention in the literature (e.g., Forker 1997; Stanley and Wisner 2001).
The success of a supply chain depends not only on efficiency from optimizing resources,
but also on the effectiveness of partner firms in carrying out mutually beneficial activities, i.e.,
meeting customer requirements at the lowest possible cost (Lai, Ngai and Cheng 2002). To
achieve business success, it is imperative for firms to excel in quality, on which the efficient and
effective flows of goods and information in the supply chain depend. We therefore attempt to fill
this gap in the research by developing and testing a framework that looks into how relationship
stability is linked to the supplier’s commitment to quality for the buyer firm in a two-stage
supply chain within the framework of transaction cost analysis (TCA). The impact of various

3
transaction characteristics that take place between the supplier and buyer firms and how they
might affect the strength of the link are empirically examined.
2. Theoretical framework and hypotheses
2.1 Quality and the supply chain
The successful implementation of SCM requires integrating internal functions of a firm
and effectively linking them with the external operations of its partner firms in the supply chain
(Holmberg 2002). To ensure quality in these processes, it is necessary to understand the meaning
of quality because different parties in the supply chain might view quality differently. Garvin
(1984) suggested that definitions of quality could be classified into the following categories:
transcendent, product-based, user-based, manufacturing-based, and value-based. Reeves and
Bednar (1994) viewed quality differently as excellence, value, conformance, and meeting and/ or
exceeding the buyer’s expectations. Although there are different interpretations of quality, they
are all geared towards the goal of meeting the customer’s requirements. Stanley and Wisner
(2001) examined the association between the implementation of cooperative purchasing/supplier
relationships, the quality of internal services, and an organization’s ability to provide quality
products and services to its customers. Their study found support for the view that strengthening
the relationship between the buyer and the supplier improves an organization’s ability to deliver
quality to customers. They suggested that managers should assess buyer-supplier relationships
and take action where necessary to increase communication, solve problems, and increase
general awareness of the relationship between internal and external services and product quality.
From this perspective, quality in the supply chain can be defined as conformance to mutually
agreed-upon requirements among the partner firms with the aim of improving the performance of

4
the transactions taking place in the chain. It involves agreements on specifications, exchanges of
information, coordination and control between the buyer and supplier firm at the inter-
organizational level that could affect the quality (conformance to requirements) of the delivery of
the product or service, and the ability to achieve quality in the supply chain.
2.2 Relationship stability and supplier commitment to quality
As a supply chain consists of a network of suppliers, their input is essential to ensuring
the quality of the products/services desired by the customers. The main challenge for the buyer
firm is to develop dependable buyer-supplier relationships and to elicit the commitment of
suppliers to assure the quality of the products/services they provide. Because stability in the
buyer-supplier relationship affects a supplier’s commitment to quality, it is important that such a
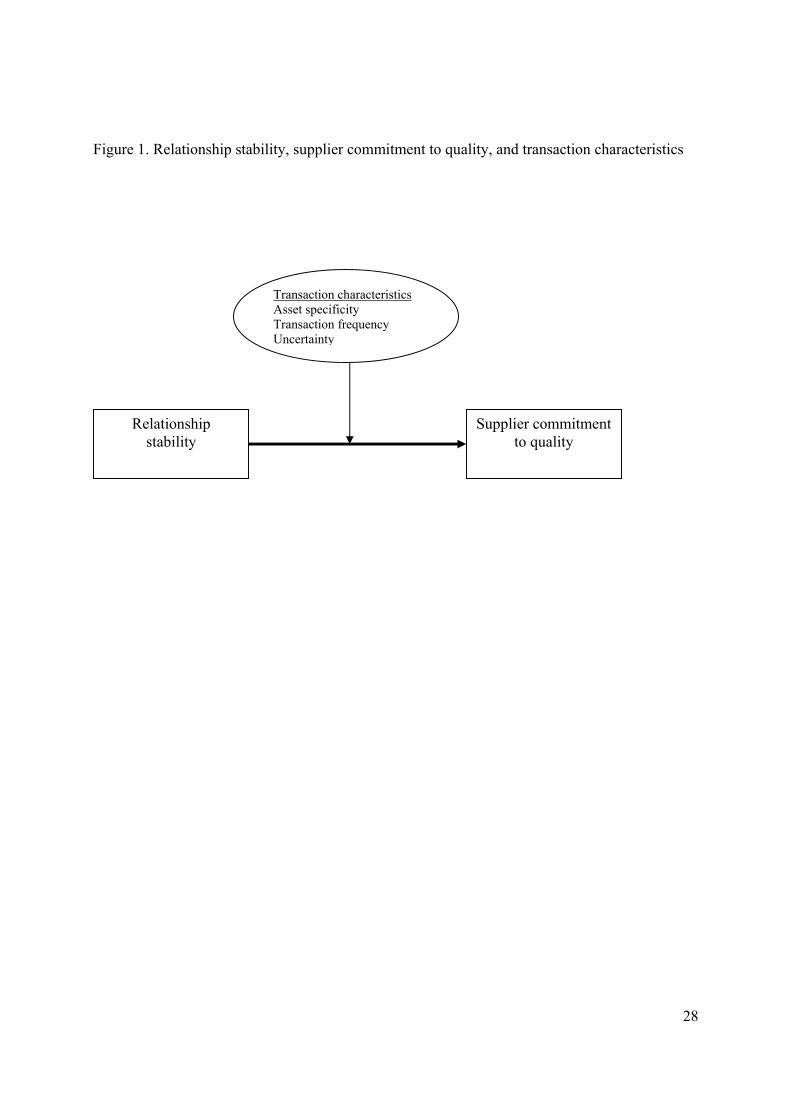
relationship be properly understood. The link between relationship stability and supplier
commitment to quality and the contingencies of the strength of the link to transaction
characteristics are illustrated in Figure 1 and are detailed below.
< Insert Figure 1 about here >
The importance of interorganizational relationships to achieving cost and service
advantages has been widely acknowledged in the literature (e.g., Cannon and Homburg 2001).
For instance, in his concept of lean supply, Lamming (1993) emphasized closer working
relationships and transparent flows of information along the supply chain such that buyers can
obtain the right quality of products/services at the right price, while suppliers can provide a
quality supply profitably. Maloni and Benton (2000) tested a model on the influence of power in

5
the supply chain. Their findings suggest that a stronger buyer-supplier relationship boosts
performance throughout the supply chain. Recently, Fynes and Voss (2002) found that the buyer-
supplier relationship has a moderating effect on quality practices and design quality. Their results
suggested that it is desirable for suppliers to cultivate closer links with buyers to improve the
quality of designs and related measures of quality performance.
To attain quality in the supply chain, it is essential to develop a stable buyer-supplier
relationship, which requires the firms involved work beyond organizational boundaries to
improve performance throughout the supply chain. The stability of relationships goes beyond a
simple, positive evaluation of the other party based on considerations of the current benefits and
costs associated with the relationship. It implies the adoption of a long-term orientation towards
the relationship – a willingness to make short-term sacrifices to realize the long-term benefits of
the relationship (Dwyer, Schurr and Oh 1987). Therefore, for the buyer firm, the supplier’s
commitment to quality can be viewed as a long-term orientation in the buyer-supplier
relationship. It requires a stable buyer-supplier relationship that will last long enough for the
supplier firm to invest in a quality improvement system to meet the buyer’s requirements and for
both parties to realize the long-term benefits. Firms that form strong relationships with suppliers
can better align their interests and goals with those of their suppliers (Lamming and Hampson
1996). Accordingly, a stable relationship instils confidence in the supplier firm and engages its
commitment to meet the buyer’s requirements through mutually beneficial exchanges. We
therefore envisage that:
Hypothesis 1: The relationship stability as perceived by supplier firms is positively related to
their commitment to quality for their buyer firms.

6
2.3 Transaction characteristics and supplier commitment to quality
The basic premise of TCA is that the costs of conducting transactions, i.e. the costs of
economic exchange, could be too high under certain conditions. In such cases, organizing an
economic transaction within the firm (or hierarchy) is a better alternative than organizing it using
the market mechanism. While TCA has been instrumental in economic theory for explaining the
choice of governance mechanism for organizing economic transactions, i.e., hierarchy vs. market,
it is useful to SCM research in predicting buyer-supplier relationships and the associated
performance outcomes. The TCA approach to economic exchange posits that three critical
dimensions characterize transactions: 1) the degree to which specific assets are incurred; 2) the
frequency with which transactions recur, and 3) uncertainty (Williamson 1979). Two key
assumptions characterize TCA: bounded rationality and opportunism (Rindfleisch and Heide
1997). The existence of bounded rationality and opportunism gives rise to transaction costs in the
form of monitoring behaviour, safeguarding assets, and ensuring that the other party does not
engage in opportunistic behaviour. When transactions recur, involve high transaction-specific
investments, or entail opportunistic behaviour, transaction costs will be likely (Grover and
Malhotra 2003). Therefore, we argue that the strength of the link between relationship stability
and the supplier’s commitment to quality is affected by the transaction characteristics and the
potential transaction costs that will be incurred. In particular, we suggest that the relationship
stability – supplier commitment to quality (RSTAB-SCQUA) link may not remain the same in
strength under different transaction characteristics. The contingencies of the link on transaction
characteristics are elaborated on below.
Asset specificity may serve to tie partner firms together by subverting the flexibility of

7
pursuing other alternatives in the supply chain. Asset specificity encompasses specialized
equipment and facilities (e.g., electronic data interchange systems), as well as specialized
training and experience (e.g., management procedures), which have little or no value outside the
focal exchange relationship (Williamson 1985) and cannot be transferred easily to another chain
(Anderson and Weitz 1986). As specific assets lose value upon transfer, exchange partners may
become committed to making the existing relationships succeed (Parkhe 1993). As a result, a
supplier may become locked into a relationship with a buyer firm if it devotes specific assets to
the relationship. One major reason for supplier firms to invest in specific assets is to signal their
loyalty with respect to the exchange relationship with their buyer firms (Mishra, Heide and Cort
1998). In other words, supplier firms invest in specific assets to ensure a continued relationship
with the buyer firms by demonstrating their loyalty to the relationship of exchange. However, as
specific assets are difficult to redeploy, suppliers may also request protective clauses to prevent
buyer firms from prematurely terminating the relationship of exchange. By investing in specific
assets, supplier firms can show the buyer firms that the former can be counted upon to fulfill
supply functions that are essential to the relationship, that the relationship will continue, and that
they are committed to the relationship (Buchanan 1992). Similarly, specific investment
commitments by buyer firms will also signify a more stable relationship and motivate suppliers
to assure quality for their buyer firms. Therefore, we predict that:
Hypothesis 2: The greater the asset specificity between the suppliers and buyers, the stronger is
the positive relationship between the relationship stability as perceived by supplier firms and
their commitment to quality for their buyer firms.

8
The frequency of transactions is one characteristic of transactions that might lead to the
incurring of transaction costs because, in the case of few and non-recurring transactions, it is
difficult to recover the cost of the specialized governance structures of the hierarchies
(Williamson 1979). This notion suggests that, as transactions increase in frequency, supplier
firms have more of an incentive to invest and to commit themselves to a strong, long-term
relationship with their buyer firms, and vice versa. This is because the investments in hierarchies
that reduce the costs of transactions can be justified by the frequent transactions in the supply
relationship. The willingness to develop a long-term relationship will reinforce stability in the
relationship and provide incentives for supplier firms to commit to quality for buyer firms in the
supply relationship. This logic leads us to conjecture that:
Hypothesis 3: The higher the transaction frequency between the suppliers and buyers, the
stronger is the positive relationship between the relationship stability as perceived by supplier
firms and their commitment to quality for their buyer firms.
Uncertainty is a function of the ability to reliably predict future events that might create
problems with information in the exchange (Williamson 1985). Suppliers face two types of
uncertainty: external and internal. External uncertainty is concerned with variability in the
market such as rapidly changing technology, frequent changes in price, or variance in service and
demand requirements (Achrol, Reve and Stem 1983). Internal uncertainty is about task
ambiguity, i.e. the difficulty of obtaining or understanding information regarding a task or
function; e.g., the ambiguity associated with determining a buyer’s service and demand
requirements for a product or service (Williamson 1985). Previous research has shown that
external uncertainty makes it more difficult to predict future contingencies (Aldrich 1979) and

9
internal uncertainty makes it more difficult to specify outcomes and measure performance
(Alchian and Demsetz 1972). As such, uncertainty of supply is likely to create transaction costs,
and therefore discourage suppliers from committing to the buyer-supplier relationship. Put in
another way, certainty of supply reduces transaction costs and fosters stability in the buyer-
supplier relationship; as a result, it encourages supplier firms to assure quality for buyer firms.
Consequently, we anticipate that:
Hypothesis 4: The higher the certainty of supply between the suppliers and buyers, the stronger
is the positive relationship between the relationship stability as perceived by supplier firms and
their commitment to quality for their buyer firms.
3. Methodology
3.1 Population and samples
To test the four hypotheses without the potential confounding effects of variation in
organizational practices, we focus on buyer-supplier relationships involving one buyer company
in a two-stage supply chain. Studying suppliers with a common buyer can help to minimize
extraneous sources of variance. We collected data from a sample of supplier organizations
reporting on their relationship with a particular buyer, a global container port terminal operator
(referred to below as the Terminal Operator). The unit of analysis in this study was chosen to
assess the vertical relationship between the buyer and supplier firms in a two-stage supply chain,
rather than the purchasing and supply practices of a particular firm. We selected this particular
vertical supply relationship because the buyer firm, i.e. the Terminal Operator, has a global
supplier network and has demonstrated leadership in purchasing and supply practices. The

10
population was the Terminal Operator’s supplier base consisting of (N = 1,348) suppliers, which
covered a variety of supply relations.
A key informant approach was used to collect data for the supply relations under study
(Phillips and Bagozzi 1986). The informants selected were executives at the supplier firms
(identified by the Terminal Operator) handling the supply relations with the Terminal Operator.
By definition, an informant’s role is to report on organizational processes, events, or outcomes
that are aggregate in nature; thus, informants should be sampled according to their knowledge of
or involvement with the focal firm (Heide and Miner 1992). Accordingly, the informants
sampled were heavily involved in the supply relations with the Terminal Operator. Furthermore,
because of the sensitive nature of the information provided in the survey responses, a single key
informant affords the advantage of anonymity, which therefore provides the respondent with a
sense of reduced risk and increases the likelihood that he or she will respond in a candid manner
(Kohli 1989).
3.2 Measures
Although the focal constructs in this study are, to a large extent stimulated by previous
theories and research, the scales were developed specifically for this study. Multi-item scales
were generated based on conceptual definitions, a review of literature, and expert interviews. In
this study, relationship stability refers to the extent to which the buyer-supplier relationship is
steady and both parties are engaged in an active and long-term working relationship. To measure
perceived relationship stability from the suppliers’ perspective, we developed five items to
operationalize the theoretical variable on the basis of interviews with experts in relationship

11
management and a review of the related literature (Davies et al. 1995, Leung, Wong and Tam
1995; Luo 1997).
As a container port terminal is a service-based business, the specific assets that require
investment from suppliers are primarily intangible (e.g., time and effort in developing procedures
and routines for supplying a particular product or service). For the most part, tangible assets
(e.g., equipment and facilities) can be used in other supply relationships; therefore, they are not
asset-specific. For this reason, our measures of the asset specificity of supply center on intangible
assets. On the basis of previous research (Stump and Heide 1996), we developed five items to
measure the asset specificity between the suppliers and the Terminal Operator. For the other
transaction characteristics, we adopted the established measures developed by Klein (1989) and
Heide and John (1990) to measure transaction frequency and certainty of supply with four items
respectively for each. Suppliers’ commitment to quality can be viewed as the extent to which the
suppliers have invested in quality-improvement measurement systems to assure the quality of
their supply to the buyer. These include the preventive measures employed by supplier firms to
ensure the quality (conformance of requirements) of the product and service delivered to buyer
firms. On the basis of Lai and Cheng (2003), we developed four items to measure the suppliers’
commitment to quality for the buyer firm.
The measurement items for the theoretical variables were put into a survey questionnaire,
which was initially designed in English and translated into Chinese. To validate the equivalence
of the translation, one person translated the questionnaire into Chinese and another back-
translated it into English (Douglas and Craig 1983). The original and back-translated versions
were compared for conceptual equivalence and refined where necessary. The wording of specific

12
items was refined in response to feedback from a panel discussion with purchasing and supply
academics and professionals. Further refinement of the survey questionnaire was conducted in a
pilot test with a convenient sample of 30 suppliers of the Terminal Operator. The results from the
assessment of item and scale reliability in the pilot test indicated that the questionnaire items
were valid and reliable. The finalized measurement items are provided in Appendix A.
In addition to the focal theoretical variables, three control variables were included in the
study, namely relationship age, company size, and transaction volume, to examine the RSTAB-
SCQUA link and its hypothesized contingencies. The rationale for these control variables is
explained briefly as follows. First, to account for the possibility that a long duration of the buyer-
supplier relationship may influence supplier behavior, we included relationship age as a control.
Second, size of the supplier companies can influence their commitment to their buyer firms
because this may give the suppliers a better bargaining position. We included the size of the
supplier companies to control for this possibility. Third, a supplier’s commitment to quality can
be derived from the volume of its transactions with the buyer firm. Therefore, transaction volume
was included as the third control variable. The measures of these variables were categorized with
insights from the Terminal Operator and entered as covariates in this study as follows:
relationship age – short = “less than 4 years” and long = “4 years or more” (dummy code: short =
0; long = 1); company size - small = “less than 500 employees” and large = “500 employees or
more” (dummy code: small = 0; large = 1); business volume – small = “less than 1 million HK$”
and large = “1 million HK$ or more” (dummy code: small = 0; large =1).
3.3 Data collection
13
Both the Chinese and English versions of the final questionnaire were sent to the 1,348
supplier firms in the population. For each supplier firm, we solicited only one response and the
target respondents were the managers who handle the supply relations with the Terminal
Operator. The supplier firms were provided with a self-addressed pre-paid envelope to return the
questionnaire. A follow-up questionnaire was mailed to the non-respondents four weeks after the
initial mailing, followed by a letter of reminder two weeks after the follow-up mailing. To
increase the survey response rate, several steps were undertaken. A cover letter from the
purchasing director of the Terminal Operator supporting the research and requesting that
suppliers cooperate with the survey was included with each questionnaire. Furthermore, the
target respondents were assured that the study was being conducted independently by the
researchers, and that all responses were treated confidentially and only analyzed in aggregate.
Finally, another letter from the researchers promised the supplier firms that the individual
responses of a supplier would never be divulged to the Terminal Operator.
After the two mailings, 365 completed questionnaires were received - 164 in the first and
201 in the second mailings - for a response rate of 27%. The quality of the informants was
evaluated by a series of questionnaire items to ascertain that the target respondents met the
criteria of being knowledgeable about the supply relations under study (Campbell 1955). This
procedure avoided the potential bias of selection, and assured that the key informants had
sufficient knowledge of and involvement with the Terminal Operator (Phillips 1981).
Three items were used to assess the quality of the informants (c.f. Cusumano and
Takeishi 1991). These items included “the knowledge you have about the supply relationship of
your company with the Terminal Operator,” “the knowledge you have about the requirements of

14
the Terminal Operator for the items supplied by your company,” and “your involvement in the
supply relationship of your company with the Terminal Operator is” on a five-point scale from 1
= extremely low to 5 = extremely high. If a respondent had answered with a 4 or 5 to at least one
of the three questions and had interacted with the supplier’s organization for more than one year,
the respondent was considered qualified to complete the questionnaire. This rule resulted in the
exclusion of two completed surveys from further analysis. The remaining responses to the
informant qualification items were uniformly high, as suggested by mean ratings of 3.60, 3.82,
and 3.88 on a five-point scale. In addition, we excluded five respondents because an excessive
amount of data was missing on the theoretical constructs in their completed surveys. Thus, 358
qualified responses were obtained and subsequently used for assessing the non-response bias and
for testing the hypotheses.
3.4 Non-response bias and common method variance
We took several steps to check for non-response bias in our sample. First, using a
systematic sampling of the original sampling frame, we made telephone calls to thirty non-
responding supplier firms. Each of these non-respondents was asked a random selection of items
from the original questionnaire covering each facet of the study. No significant differences in
these questions (p > 0.10) were found between the original respondents and our sample of thirty
non-respondents. Second, using the database provided by the Terminal Operator, we were able to
obtain archival data concerning sample characteristics such as the size of the company and the
age of its relationship with the Terminal Operator. The mean differences between the responding
and non-responding companies along these dimensions were examined using a t-test. The results
demonstrated that all t-statistics were insignificant (p > 0.10). Finally, we examined the non-

15
response bias using the procedures recommended by Armstrong and Overton (1977), whereby
we compared the responses from the first mailing with the responses from the second mailing by
testing for mean differences on all of the multiple-item scales in the study. No significant
differences (p > 0.10) in the variable means between early responders and late responders were
detected. On the basis of all of this evidence, we concluded that the non-response bias did not
appear to be a problem with the data collected.
The data collected were also checked for common method variance. Podsakoff and Organ
(1986) suggested that if the variables in a study all load on one factor or if there is one factor that
explains the majority of the variance, then common method variance may be a problem. An
exploratory factor analysis was performed on all of the measurement items. The analysis yielded
five significant factors (eigenvalues greater than one) explaining 73.8% of the variance (31.2%,
14.4%, 11.6%, 9.0%, and 7.6%, respectively, for each factor), suggesting that the data were not
explained by a single common method factor. Therefore, there appeared to be no problem with
common method variance in the data collected.
4. Results
4.1 Validity and reliability
To validate the measurement scales, a confirmatory factor analysis (CFA) was performed,
hypothesizing that the five theoretical constructs, i.e. relationship stability (RSTAB), asset
specificity (ASPEC), transaction frequency (TFREQ), certainty of supply (CERTS), and supplier
commitment to quality assurance (SCQUA), would adequately fit the data collected. The results
in Table 1 show that a five-factor measurement model fits the data acceptably. The chi-square

16
goodness-of-fit statistic was statistically significant, indicating that the model was significantly
different from the data. However, because large samples are likely to lead the chi-square statistic
to reject valid models (Bagozzi and Yi 1988), we relied more heavily on other statistics of fit: the
Comparative Fit Index (CFI), Goodness-of-Fit Index (GFI), Normed Fit Index (NFI), Tucker-
Lewis Index (TLI), and the Root Mean Square Residual (RMR). These statistics suggested that
the data fit the measurement model reasonably well (χ2 = 442.50; df = 199; CFI = 0.95; GFI =
0.90; NFI; 0.92; TLI = 0.95; RMR = 0.05). All of the measurement items also significantly
loaded on the constructs on which they were hypothesized to load. The composite reliability
coefficient (CR) for each of these multi-item constructs, ranging from 0.84 to 0.95, exceeded the
threshold of 0.60 necessary to measure reliability (Bagozzi and Yi 1988). In addition, the
average variance extracted (AVE) for each construct surpassed the 0.50 threshold for adequate fit
(Bagozzi and Yi 1988). As the largest correlation between the constructs was 0.43, which was
significantly less than unity; this finding provided evidence of the discriminant validity of these
measures (Phillips 1981). All these results give us confidence that the measures are indeed valid
and reliable.
< Insert Table 1 about here >
To further assess discriminant validity, we assessed pairs of scales in a series of two-
factor confirmatory models. Following the procedure described by Joreskog (1971), we specified
the two-factor models by restricting the factor intercorrelations to unity and then performed χ2
difference tests (with 1 degree of freedom on the values obtained for the constrained and
unconstrained models. A significantly lower χ2 value for the unconstrained model would indicate
that the traits are not perfectly correlated, and that discriminant validity is achieved (Bagozzi and

17
Phillips 1982). The results in Table 2 show that the five constructs were significantly different
from one another, providing further evidence of discriminant validity for the measures. The
summary statistics and intercorrelations for all of the five constructs are given in Table 3.
<Insert Tables 2 and 3 about here >
4.2 Regression Analysis
Hierarchical regression analysis was used to test the hypotheses, including the
hypothesized effects of transaction characteristics on the RSTAB-SCQUA link. To reduce the
problem of multicollinearity between the predictors and the interaction terms containing these
predictors, we employed the mean centering technique in model 3; i.e., the raw score minus the
mean of the independent variables (Aiken and West 1991). We also examined variance inflation
factors (VIF) to determine the existence of multicollinearity. The largest of the resulting VIF
scores in all of the models given in Table 4 was 1.57; i.e., well below the maximum level of 10.0
suggested by Mason and Perreault (1991), indicating that multicollinearity should not be a
problem with our data.
Proceeding with the hierarchical models, we first predicted SCQUA using only RSTAB.
The results are shown in Table 4. As expected, a highly significant positive effect was observed.
Next, we added the three variables, i.e., ASPEC, TFREQ, and CERTS. Recall that we refrained
from offering main effect hypotheses for these variables. Nevertheless, to be conservative, we
included them in the empirical specifications. The results showed that R2 increased significantly
from Model 1 to Model 2, indicating a significant main effect. However, the interpretation of
these main effects was ambiguous because our theory specifies interaction effects. The third

18
estimated model, Model 3, included the interaction effects of the transaction characteristics on
the RSTAB-SCQUA link. The increase in R2 from Model 2 to Model 3 was marginally
significant with the addition of the hypothesized interactions of CERTS with RSTAB on
SCQUA. Each of the hypotheses and the test results are discussed below.
< Insert Table 4 about here >
The results in Table 4 show that RSTAB as perceived by supplier firms is positively
related to SCQUA. This evidence lends support to Hypothesis 1 and provides support for the role
of relationship stability in fostering the commitment of suppliers to providing quality for the
buyer firm. Contrary to our hypotheses, both asset specificity and transaction frequency do not
significantly interact with RSTAB on the link. The results reject Hypotheses 2 and 3, and seem
to suggest that, once established and maintained, the strength of the RSTAB-SCQUA link
remains unchanged regardless of asset specificity and transaction frequency. The next
contingency we proposed, i.e. certainty of supply, was found to interact significantly with
RSTAB, and this interaction was positively linked to SCQUA (p < 0.05, Model 3). This provides
evidence to support Hypothesis 4. The results show that RSTAB plays a stronger role in
increasing SCQUA if suppliers’ perceived certainty of supply with the buyer firm is greater.
5. Discussion and implications
This study represents one of the first empirical studies to explore the link between
relationship stability and supplier commitment to quality. It contributes to the literature in several
important ways. First, this study examines quality management in a supply chain, a critical yet
under-explored subject in SCM research. This issue is of particular interest from the standpoint

19
of the development of theories for the disciplines of both quality management and SCM.
Although buyer-supplier relationship is a well-established research area, there is a lack of
empirical research in the SCM literature examining buyer-supplier relationship and the
associated performance implications. The results of this study shed light on the importance of
managing relationships with suppliers in terms of ensuring their commitment to quality, and on
how transaction characteristics will affect the strength of the RSTAB-SCQUA link. In this regard,
we examined the contingencies of the RSTAB-SCQUA link on transaction characteristics using
a TCA framework. The theoretical lens of the TCA framework is extended to quality
management and SCM research.
In sum, this study has addressed whether relationship stability as perceived by supplier
firms is related to their commitment to quality for their buyer firms. In addition to providing
evidence of the RSTAB-SCQUA link, this study aids the understanding of the subtleties of how
the strength of the link varies with transaction characteristics. We view this as an important issue
because it helps advance our understanding of the circumstances under which the relationship
stability becomes more critical to a supplier’s commitment to quality. Taking a contingency
perspective, this study proposes transaction characteristics within a TCA framework that affect
the strength of the RSTAB-SCQUA link. With respect to our principal hypothesis, we found
strong empirical support for a positive cross-sectional relationship between RSTAB and
SCQUA. When RSTAB is high, SCQUA is likely to be enhanced. We also found some empirical
evidence that this RSTAB-SCQUA link is affected by CERTS in a positive manner, but not by
ASPEC and TFREQ. One plausible reason for the lack of impact from ASPEC on the link is that
investment in specific assets, although possibly helpful in allowing both buyer and supplier firms
to signal their loyalty to the supply relationship, provides no further clues for supplier firms to

20
understand the requirements of the buyer firms and, therefore, ensure the quality of their supply.
The insignificant impact of TFREQ on the link is possibly due to the ambiguity of the factor of
transaction frequency for supplier firms to conform to buyer requirements and quality
improvement in the supply relationship. Nevertheless, the presence of certainty of supply
enhances the strength of the link. Suppliers facing a higher level of certainty of supply exhibit a
stronger relationship between their perceived relationship stability and their commitment to
quality for their buyer firms. One effect of certainty of supply is that it heightens a supplier’s
interest in understanding the buyer’s requirements, which will motivate the supplier to make
greater efforts to ensure quality in the supply relationship. By removing the issue of uncertainty
of supply, the buyer firms gives suppliers a strong incentive to perform well, so the latter will be
more committed to quality. SCQUA appears to be shaped by relationship stability with the buyer
firm, which is attenuated by increased CERTS in the supply relationship.
There are several managerial implications from the study findings. First, buyers can use
our research framework as a check on the adequacy of the stability of their relationship with their
suppliers. In doing so, they are advised to foster stability in the buyer-supplier relationship. It
may make sense for buyer firms to establish policy guidelines to increase the certainty of supply
for suppliers and to build relationships with them, thereby increasing the latter’s commitment to
quality. This study strongly suggests that buyer firms need to make concerted efforts to develop a
stable relationship with their suppliers in order to encourage a commitment to quality on the part
of the suppliers. This implies that when a firm desires to assure the quality of supplier inputs,
there is a need to develop a stable relationship with suppliers. Not only is it important for a firm
to focus on relationship stability with suppliers, which has a direct impact on the supplier’s

21
commitment to quality, a firm must also recognize the contingency of certainty of supply on the
RSTB-SCQUA link.
6. Directions for further research
There are several limitations to this study that should be taken into consideration and we
leave them as topics for further research. First, because of its cross-sectional design, the RSTAB-
SCQUA link on a temporal dimension cannot be established from this study. A longitudinal
study is needed to complement this study. Second, as we collected data only from supplier firms,
the data offered might have a self-reported, one-dimensional focus. Although we provided a
reasonable test of the potential existence of the common method bias, it is at best post hoc and its
results should not be interpreted unequivocally (Podsakoff and Organ 1986). Therefore, further
research should be attempted to obtain data on the RSTAB-SCQUA link and its contingent
variables from multiple sources, using various methods. For instance, the success of emerging
paradigms like SCM depends on a firm’s ability to collaborate with different parties in the
supply chain. It is desirable to conduct further research employing a dyadic methodology and to
collect data from different parties in a supply chain. It is also useful to examine the RSTAB-
SCQUA link beyond a two-stage vertical relationship and to collect data from different echelons
of a supply chain (e.g., suppliers’ suppliers). Finally, this study represents an important step in
the direction of seeking an understanding of the buyer-supplier relationship and its effects on
quality management in SCM research. To enhance the generalizability of the results to other
industrial settings, further research should be conducted to investigate the contingency of the
RSTAB-SCQUA link in other business contexts; e.g., wholesaling and retailing.

22
Acknowledgments: This study was partially supported under a research grant (project code:
A630) from the Area of Strategic Development in China Business Services (Logistics and
Maritime Studies) by The Hong Kong Polytechnic University. We are grateful to Rui Sousa and
two referees for their constructive comments on an earlier version of this paper.

23
Appendix A - Measurement items
RSTAB Relationship Stability; 1 = strongly disagree to 5 = strongly agree 1 We attempt to maintain harmony with the Terminal Operator. 2 Our frequent cooperation with the Terminal Operator reduces most business misunderstandings. 3 We maintain a good relationship with the Terminal Operator to obtain more business. 4 We maintain a good relationship with the Terminal Operator to build up our reputation/ image. 5 We maintain a good relationship with the Terminal Operator for smooth contractual
arrangements. ASPEC Asset Specificity; 1 = strongly disagree to 5 = strongly agree
1 The procedures and routines we have developed for the items supplied to the Terminal Operator are tailored to the Terminal Operator’s particular situation.
2 The Terminal Operator has some tailor-made norms that have required extensive adaptation by us.
3 We have spent significant resources to ensure that the specifications of the items supplied to the Terminal Operator fit well with the Terminal Operator’s operational capability.
4 Our people and facilities have been tailored to provide the items sold to the Terminal Operator. 5 Most of the training we have undertaken to meet the Terminal Operator’s requirements cannot be
easily adapted for use by another customer. TFREQ Transaction Frequency; 1 = extremely low to 5 = extremely high
1 Compared to other large customers, the average number of orders by the Terminal Operator is 2 Compared to other large customers, the average number of shipments to the Terminal Operator is 3 Compared to other large customers, the average number of items sold to the Terminal Operator is 4 Compared to other large customers, the average size of an order sold to the Terminal Operator is
CERTS Certainty of Supply; 1 = extremely difficult to 5 = extremely easy (reverse code) 1 Forecasting our sales volume to the Terminal Operator is 2 Forecasting the Terminal Operator’s demand requirements for the items we supply is 3 Forecasting the Terminal Operator’s order size is 4 Forecasting the Terminal Operator’s order cycle is
SCQUA Supplier Commitment to Quality; 1 = strongly disagree to 5 = strongly agree 1 We continually evaluate and improve the products/ services we supply to the Terminal Operator. 2 We continually evaluate and improve our business processes to meet the requirements of the
Terminal Operator. 3 We continually manage data/ information to support efforts to improve the quality of our supplies
to the Terminal Operator. 4 We employ procedures to ensure reliability, consistency, and rapid access to data and
information for our supplies to the Terminal Operator.

24
References: Achrol, R. S., Reve, T. and Stem., L. W., 1983. The environment of marketing channel dyads: a framework for comparative analysis. Journal of Marketing. 47 (4), 55-67. Alchian, A. and Demsetz, H., 1972. Production, information costs, and economic organization. American Economic Review. 62 (5), 777-795. Aldrich, Howard E, 1979. Organizations and Environments. Englewood Cliffs, NJ: Prentice Hall. Anderson, E. and Weitz, B. A., 1986. Make-or-buy decisions: vertical integration and marketing productivity. Sloan Management Review. 27 (3), 3-20. Armstrong, J. S. and Overton, T. S., 1977. Estimating Nonresponse Bias in Mail Surveys. Journal of Marketing Research. 14 (3), 396-402. Bagozzi, R. P. and Phillips, L. W.,1982. Representing and testing organizational theories: a holistic construal. Administrative Science Quarterly. 27 (3), 459-489. Bagozzi, R. P. and Yi, Y.,1988. On the evaluation of structural equation models. Journal of the Academy of Marketing Science. 16 (1), pp.74-94. Buchanan, L., 1992. Vertical trade relationships: the role of dependence and symmetry in attaining organizational goals. Journal of Marketing Research. 29 (1), 65-75. Campbell, D.T., 1955. The informant in quantitative research. American Journal of Sociology. 60 (4), 339-342. Cannon, J. P. and Homburg, C., 2001. Buyer-supplier relationships and customer firm costs. Journal of Marketing. 65 (1), 29-43. Cusumano, M. A. and Takeishi, A., 1991. Supplier relations and management: a survey of Japanese, Japanese-transplant, and U.S. auto plants. Strategic Management Journal. 12 (8), 563-588. Christopher, M., 1998. Logistics and Supply Chain Management: Strategies for Reducing Costs and Improving Services. Pitman Publishing, London. Davies, H. A., Leung, T. K. P., Luk, S. T. K. and Wong, Y. H., 1995. The benefits of guanxi, Industrial Marketing Management. 24 (3), 207-214. Douglas, S.P. and Craig, C.S., 1983. International Marketing Research. Englewood Cliffs, NJ: Prentice Hall.

25
Dwyer, F. R., Schurr, P. H. and Oh, S., 1987. Developing buyer-seller relationships. Journal of Marketing. 51 (2), 11-28. Forker, L. B., 1997. Factors affecting supplier quality performance. Journal of Operations Management. 15 (4), 243-269. Fornell, C. and Larcker, D. F., 1981. Evaluating structural equation models with unobservable variables and measurement error. Journal of Marketing Research. 18 (1), 39-50. Fynes, B. and Voss, C., 2002. The moderating effect of buyer-supplier relationships on quality practices and performance. International Journal of Operations & Production Management. 22 (6), 589-613. Garvin, D. A., 1984. What does product quality really mean?. Sloan Management Review. 26 (1), 25-43. Gerbing, D. and Anderson, J., 1988. An updated paradigm for scale development incorporating unidimensionality and its assessment. Journal of Marketing Research. 25 (2), 186-192. Grover, V. and Malhotra, M. K., 2003. Transaction cost framework in operations and supply chain management research: theory and measurement. Journal of Operations Management. 21 (4), 457-473. Heide, J. B. and Miner, A. S., 1992. The shadow of the future: effects of anticipated interaction and frequency of contact on buyer-seller cooperation. Academy of Management Journal. 35 (2), 265-291. Heide, J. B. and John, G., 1990. Alliances in industrial purchasing: the determinants of joint action in buyer-seller relationships. Journal of Marketing Research. 27 (1), 24-36. Hendricks, K. B. and Singhal, V. R. 1997. Does implementing an effective TQM program actually improve operating performance? Empirical evidence from firms that have won quality awards. Management Science. 43 (9), 1258-1274. Holmberg, S., 2000. A system perspective on supply chain measurements. International Journal of Physical Distribution and Logistics Management. 30 (10), 847-868. Klein, S., 1989. A transaction cost explanation of vertical control in international markets, Journal of the Academy of Marketing Science. 17 (3), 253-260. Kohli, A., 1989. Determinants of Influence in Organizational Buying: A Contingency Approach, Journal of Marketing. 53(3), 50-65. Joreskog, K. G., 1971. Statistical analysis of sets of congeneric tests. Psychometrika. 36 (2), 109-133.

26
Lai, K. H. and Cheng, T. C. E., 2003. Initiatives and outcomes of quality management implementation across industries. Omega – The International Journal of Management Science. 31 (2), 141-154. Lai, K. H., Ngai, E. W. T. and Cheng, T. C. E., 2002. Measures for evaluating supply chain performance in transport logistics. Transportation Research Part E: Logistics and Transportation Review. 38 (6), 439-456. Lamming, R., 1993. Beyond partnership – strategies for innovation and lean supply, Prentice-Hall, New York. Lamming, R. and Hampson, J., 1996. The environment as a supply chain management issue, British Journal of Management. 7 (1), 45-62. Leung, T. K. P., Wong, Y. H. and Tam, J. L. M., 1995. Adaptation and the relationship building process in the People’s Republic of China (PRC). Journal of International Consumer Marketing. 8 (2), 7-26. Luo, Y., 1997. Guanxi and performance of foreign-invested enterprise in China: an empirical inquiry. Management International Review. 37 (1), 51-70. Mentzer, J. T., Flint, D. J. and Hult, G. T. M., 2001. Logistics service quality as a segment-customized process. Journal of Marketing. 65 (4), 82-104. Maloni, M. and Benton, W. C., 2000. Power influences in the supply chain. Journal of Business Logistics. 21 (1), 49-73. Phillips, L. W., 1981. Assessing measurement error in key informant reports: a methodological note on organizational analysis in marketing. Journal of Marketing Research. 18 (4), 395-415. Phillips, L. W. and Bagozzi, R. P., 1986. On measuring the organizational properties of distribution channels: methodological issues in the use of key informants. In: Sheth, J. (Ed.), Research in Marketing, Vol.8. JAI Press, Greenwich, CT, 313-369. Mason, C. and Perreault, W. D., 1991. Collinearity, Power, and Interpretation of Multiple Regression Analysis. Journal of Marketing Research. 28 (3), 268-280. Mishra, D. P. Heide, J. B. and Cort, S. G., 1998. Information asymmetry and levels of agency relationships. Journal of Marketing Research. 35 (3), 277-295. Parkhe, A., 1993. Strategic alliance structuring: a game theoretic and transaction cost examination of interfirm cooperation. Academy of Management Journal. 36 (4), 794-829. Reeves, C. A. and Bednar, D. A., 1994. Defining quality: alternatives and implications. Academy of Management Review. 19 (3), 419-445.

27
Rindfleisch, A. and Heide, J. B., 1997. Transaction cost analysis: past, present, and future applications. Journal of Marketing. 61 (4), 30-45. Stanley, L. L. and Wisner, J. D., 2001. Service quality along the supply chain: implications for purchasing. Journal of Operations Management. 19 (3), 287-306. Stump, R. L. and Heide, J. B., 1996. Controlling supplier opportunism in industrial relationships. Journal of Marketing Research. 33 (4), 431-441. Williamson, O. E., 1979. Transaction-cost economics: The governance of contractual relations. Journal of Law and Economics. 22 (October), 233-262. Williamson, O. E., 1985. The Economic Institutions of Capitalism. Free Press, New York.
28
Figure 1. Relationship stability, supplier commitment to quality, and transaction characteristics
Relationship stability
Supplier commitment to quality
Transaction characteristics Asset specificity Transaction frequency Uncertainty

29
Table 1. Results of confirmatory factor analysis Constructs Measurement items
RSTAB ASPEC TFREQ CERTS SCQUA
RSTAB1 0.57 a RSTAB2 0.55 RSTAB3 0.92 RSTAB4 0.89 RSTAB5 0.88 ASPEC1 0.69 a ASPEC2 0.72 ASPEC3 0.81 ASPEC4 0.81 ASPEC5 0.51 TFREQ1 0.91 a TFREQ2 0.90 TFREQ3 0.82 TFREQ4 0.80 CERTS1 0.76 a CERTS2 0.75 CERTS3 0.88 CERTS4 0.87 SCQUA1 0.85 a SCQUA2 0.88 SCQUA3 0.95 SCQUA4 0.94 Alpha 0.87 0.83 0.92 0.89 0.95 CR 0.88 0.84 0.92 0.89 0.95 AVE 0.61 0.50 0.74 0.67 0.82
Note: All of the estimated standardized loadings are significant at p < 0.01. The composite reliability (CR) of the construct is calculated using the following formula: CRη = (Σλyi)2/[(Σλyi)2
+ (Σεi)], where λyi is the standardized loading for scale item yi, and εi is the measurement error for the scale item yi (Fornell and Larcker 1981); whereas the average variance extracted (AVE) for each construct is calculated using the following formula: Vη = Σλyi
2/(Σλyi2 + Σεi) (Gerbing
and Anderson 1988).
a Initially fixed at 1.0 for the purpose of estimation.

30
Table 2. Discriminant validity checks: Chi-square differences
Constructs RSTAB ASPEC TFREQ CERTS ASPEC 197.60 FREQ 217.65 75.18 CERTS 211.63 136.57 89.11 SCQUA 220.18 152.93 152.10 165.14 Note: All of the Chi-sqaure differences between fixed and free two-factor confirmatory measurement models (all tests = 1 df) are significant at p < 0.01.

31
Table 3. Means, standard deviations, and intercorrelations
Variable Mean S.D. RSTAB ASPEC TFREQ CERTS SCQUA RSTAB 4.17 0.74 1.00 ASPEC 3.03 0.92 0.28 1.00 TFREQ 2.13 0.89 0.19 0.43 1.00 CERTS 2.65 0.89 0.28 0.17 0.37 1.00 SCQUA 4.27 0.76 0.43 0.25 0.24 0.28 1.00
Note: All of the constructs are measured on a five-point scale. All correlation coefficients are significant at p < 0.01.

32
Table 4. Results of Hierarchical Regression Analysis
Dependent variable: SCQUA Independent Variables Model 1 Model 2 Model 3 Main Effect RSTAB 0.413*** 0.358*** 0.374*** Moderators ASPEC 0.050 0.056 TFREQ 0.059 0.066 CERTS 0.136*** 0.132*** Interaction Terms RSTAB х ASPEC -0.020 RSTAB х TFREQ -0.020 RSTAB х CERTS 0.123** Control variables Relationship age 0.088* 0.063 0.052 Company size -0.028 -0.034 -0.034 Business volume 0.104** 0.058 0.049 Model F 21.802 14.463 10.729 R2 0.206 0.233 0.245 ∆ R2 -- 0.027*** 0.012*
Note: The entries in the table are standardized regression coefficients. The mean centering technique was used in Model 3 to remove multicollinearity between the predictors and the interactions containing these predictors. Coefficient significant at * p < 0.10; ** p < 0.05; *** p < 0.01.
Related Documents