The Third Joint Seminar of Japan and Indonesia Environmental Sustainability and Disaster Prevention (3 rd ESDP-2015) Institut Teknologi Bandung, Indonesia – November 25 th , 2015 113 RELATIONSHIP POPULATION DENSITY OF AQUATIC SEDIMENT MACROZOOBENTHOS TO RIVER WATER QUALITY PARAMETERS (Case Study: Citarum Upstream, Subdistrict Kertasari, Bandung Regency) Barti Setiani Muntalif 1*† , Nurul Chasanah 2 and Mohammad Faiz Faza 3 Master Program of Environmental Engineering Faculty of Civil and Environmental Engineering, Institut Teknologi Bandung, Jl. Ganesha No. 10 Bandung 40132 Email: 1 [email protected] and 2 [email protected] * Presenter; † Corresponding author. Abstract: The increase in anthropogenic activities that occur along the Citarum river basin upstream segment, District Kertasari, Bandung regency, have a negative impact on water quality of the river with the presence of input waste into the water body which is the remainder of the result of human activity, and also cause disruption to the aquatic biota that live in it. The purpose of this study was to determine the relationship of the changes conditions of water and sediment parameters on macrozoobenthos populations. The results showed that based on the Pearson correlation analysis are known parameters COD, TOC and silt have the highest correlation value of the macrozoobenthos population density of 0.966, 0.865 and 0.576. In addition, with the use of PCA analysis known that water temperature, TSS, turbidity, TOC, COD, BOD and water pH is a major component of water parameters that affect the density of macrozoobenthos. Whereas, for the parameters of sediment obtained that parameter silt substrat, clay substrat, total phosphate sediment and gravel that affect the density of macrozoobenthos. The results also showed that based on biotic index (BMWP-ASPT) water conditions were in polluted condition of mild to severe, and from the pollution index (IP) shows the light polluted conditions. Keywords: Citarum upstream, macrozoobenthos population density, water quality, correlation INTRODUCTION The increase in anthropogenic activities in Citarum has a negative impact on water quality of the river. In the upstream segment CRB has a lot of land use around the river as a residential location, industry, agriculture and livestock. Even in areas close to the Citarum river springs located in Situ Cisanti, has seen the disposal of waste from livestock activities are discharged through the sewers that flow into water bodies subsidiary of Citarum River (Cita Citarum, 2011). As a result of the increase in the load of waste that goes into the water body, besides a decline in water quality, also lead to the disruption of aquatic biota that live in it (Ishaq and Khan, 2013). One of the biotic components waters often studied the impact of anthropogenic activity in the river is macrozoobenthos. Aquatic biota is an important component in the biological assay (bioassessment) in order to evaluate the overall quality of water resources, ecological functions, as well as the specific influence of anthropogenic activities. Disruption that occurred in the biota due to contamination toxic pollutants may be physiological disorders, such as increased respiration, defect morphology, and there is a larger scale ecological balance disturbance (Sudarso, 2009). Chopra et al. (2012) says that the river has brought the role of industrial waste, urban sewage, fertilizer runoff from agriculture and water carried by the current, and one organism to be affected from such pollution is macrozoobenthos. Research has been done by Muntalif et al. (2008), shows that there has been a decline in water quality in the upper Citarum river flowing along with the flow in the downstream direction that passes through residential areas, dairy farming and agriculture,

Welcome message from author
This document is posted to help you gain knowledge. Please leave a comment to let me know what you think about it! Share it to your friends and learn new things together.
Transcript
The Third Joint Seminar of Japan and Indonesia Environmental
Sustainability and Disaster Prevention (3rd ESDP-2015)
Institut Teknologi Bandung, Indonesia – November 25th, 2015
113
RELATIONSHIP POPULATION DENSITY OF AQUATIC SEDIMENT
MACROZOOBENTHOS TO RIVER WATER QUALITY
PARAMETERS (Case Study: Citarum Upstream, Subdistrict Kertasari, Bandung Regency)
Barti Setiani Muntalif 1*†, Nurul Chasanah2 and Mohammad Faiz Faza3
Master Program of Environmental Engineering
Faculty of Civil and Environmental Engineering, Institut Teknologi Bandung,
Jl. Ganesha No. 10 Bandung 40132 Email: [email protected] and [email protected]
* Presenter; † Corresponding author.
Abstract: The increase in anthropogenic activities that occur along the Citarum river basin upstream segment,
District Kertasari, Bandung regency, have a negative impact on water quality of the river with the presence of
input waste into the water body which is the remainder of the result of human activity, and also cause disruption
to the aquatic biota that live in it. The purpose of this study was to determine the relationship of the changes
conditions of water and sediment parameters on macrozoobenthos populations. The results showed that based on
the Pearson correlation analysis are known parameters COD, TOC and silt have the highest correlation value of
the macrozoobenthos population density of 0.966, 0.865 and 0.576. In addition, with the use of PCA analysis
known that water temperature, TSS, turbidity, TOC, COD, BOD and water pH is a major component of water
parameters that affect the density of macrozoobenthos. Whereas, for the parameters of sediment obtained that
parameter silt substrat, clay substrat, total phosphate sediment and gravel that affect the density of
macrozoobenthos. The results also showed that based on biotic index (BMWP-ASPT) water conditions were in
polluted condition of mild to severe, and from the pollution index (IP) shows the light polluted conditions.
Keywords: Citarum upstream, macrozoobenthos population density, water quality, correlation
INTRODUCTION
The increase in anthropogenic activities in Citarum has a negative impact on water
quality of the river. In the upstream segment CRB has a lot of land use around the river as a
residential location, industry, agriculture and livestock. Even in areas close to the Citarum
river springs located in Situ Cisanti, has seen the disposal of waste from livestock activities
are discharged through the sewers that flow into water bodies subsidiary of Citarum River
(Cita Citarum, 2011). As a result of the increase in the load of waste that goes into the water
body, besides a decline in water quality, also lead to the disruption of aquatic biota that live
in it (Ishaq and Khan, 2013).
One of the biotic components waters often studied the impact of anthropogenic
activity in the river is macrozoobenthos. Aquatic biota is an important component in the
biological assay (bioassessment) in order to evaluate the overall quality of water resources,
ecological functions, as well as the specific influence of anthropogenic activities. Disruption
that occurred in the biota due to contamination toxic pollutants may be physiological
disorders, such as increased respiration, defect morphology, and there is a larger scale
ecological balance disturbance (Sudarso, 2009). Chopra et al. (2012) says that the river has
brought the role of industrial waste, urban sewage, fertilizer runoff from agriculture and
water carried by the current, and one organism to be affected from such pollution is
macrozoobenthos. Research has been done by Muntalif et al. (2008), shows that there has
been a decline in water quality in the upper Citarum river flowing along with the flow in the
downstream direction that passes through residential areas, dairy farming and agriculture,
The Third Joint Seminar of Japan and Indonesia Environmental
Sustainability and Disaster Prevention (3rd ESDP-2015)
Institut Teknologi Bandung, Indonesia – November 25th, 2015
114
which contributes to advise the burden of residual waste community activity results in a
stream.
This study was conducted to determine the distribution of macrozoobenthos
populations that occur along the Citarum River upstream of the conditions that have not been
polluted waters up polluted waters, which include population density, species composition
and keanekeragaman types of macrozoobenthos. The results of this study are expected to be
useful as information for the parties concerned in decision-making according to the
conditions existing in the Citarum River management efforts for the welfare of the population
and the sustainability of both the living biota in the Citarum River and the people whose lives
depend in flow Citarum River.
METHODOLOGY
The study was conducted in the upper reaches from Mount Wayang Citarum River up
to Wangisagara village with 7 specified sampling locations , where the station 1 to 4 with the
surrounding natural conditions and station 5 to 7 to ambient conditions there has been human
activity. The measurement of physical and chemical parameters of water conducted in situ
and in the laboratory. For the measurement of the parameters in the laboratory, water samples
taken by the composite sampling method + 2 liters from each sampling location, then water
samples are stored in a cool box. Water parameters to be measured is the flow velocity,
turbidity, brightness, TDS, TSS, temperature, DO, BOD, COD, pH, total N and total P.
Macrozoobenthos Sampling was conducted using random sampling using a Surber net
with a mesh size of 500 lm. Then do the preservation of the macrozoobenthos samples with
administration of 4% formalin solution. Sediment sampling as much as + 500 grams each
sampling location. Sediment samples then will be analyzed to determine the distribution of
sediment particles, total organic carbon content (%), total nitrogen (%), and phosphate (mg /
kg).
Then proceed with the analysis of data begins, to the calculation the number of
population density of macrozoobenthos. Furthermore, the calculation of the value of diversity
index (H ') in each station. The use of biotic index (BMWP-ASPT) to determine the quality
of the waters (Mandaville, 2002) as well as the pollution index (IP) as a comparison (Decree
LH, 2003). Pearson correlation analysis is used to predict the relationship between the
parameters of water, sediment and sediment particle distribution of the biological parameters.
The test is used to determine the relationship between the parameters of water, sediment and
sediment particle distribution (% gravel,% sand,% silt and% clay) on the abundance of
macrozoobenthos. Principle Component Analysis or principal component analysis to
determine the relationship between the density of macrozoobenthos with water and sediment
quality parameters in the upstream Citarum River. The calculation of the statistical analysis
performed using SPSS software ver. 20:00
The Third Joint Seminar of Japan and Indonesia Environmental
Sustainability and Disaster Prevention (3rd ESDP-2015)
Institut Teknologi Bandung, Indonesia – November 25th, 2015
115
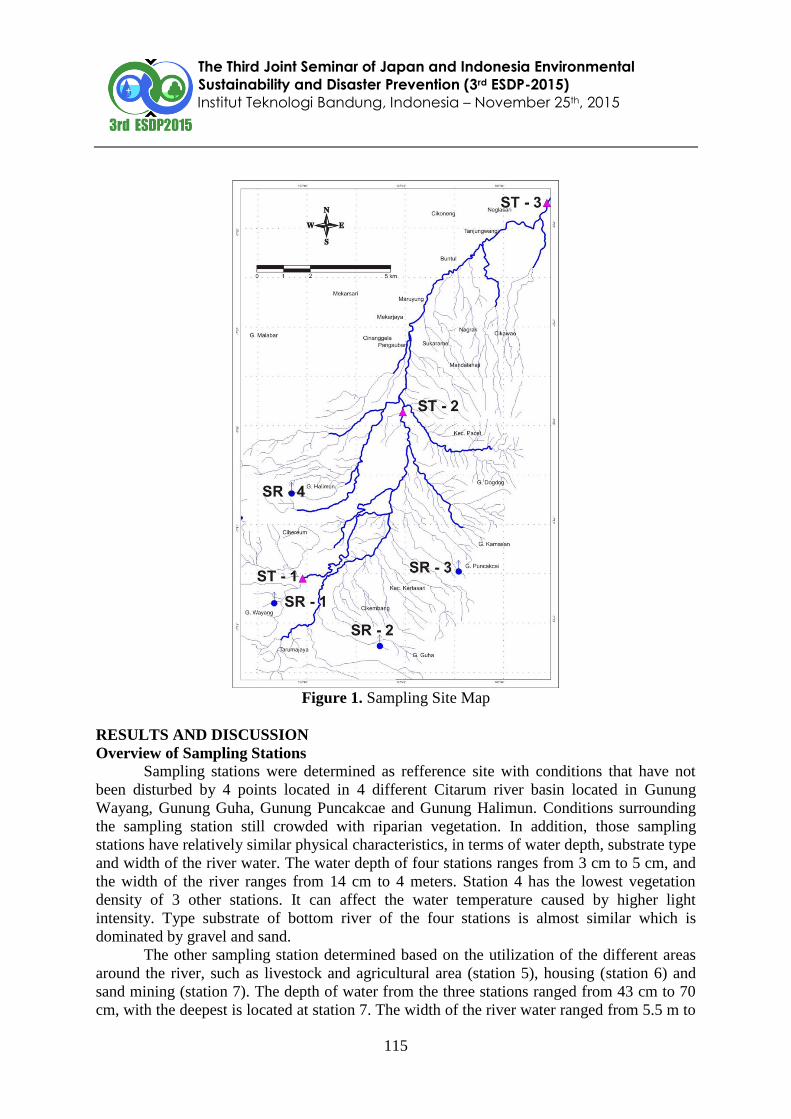
Figure 1. Sampling Site Map
RESULTS AND DISCUSSION
Overview of Sampling Stations
Sampling stations were determined as refference site with conditions that have not
been disturbed by 4 points located in 4 different Citarum river basin located in Gunung
Wayang, Gunung Guha, Gunung Puncakcae and Gunung Halimun. Conditions surrounding
the sampling station still crowded with riparian vegetation. In addition, those sampling
stations have relatively similar physical characteristics, in terms of water depth, substrate type
and width of the river water. The water depth of four stations ranges from 3 cm to 5 cm, and
the width of the river ranges from 14 cm to 4 meters. Station 4 has the lowest vegetation
density of 3 other stations. It can affect the water temperature caused by higher light
intensity. Type substrate of bottom river of the four stations is almost similar which is
dominated by gravel and sand.
The other sampling station determined based on the utilization of the different areas
around the river, such as livestock and agricultural area (station 5), housing (station 6) and
sand mining (station 7). The depth of water from the three stations ranged from 43 cm to 70
cm, with the deepest is located at station 7. The width of the river water ranged from 5.5 m to
The Third Joint Seminar of Japan and Indonesia Environmental
Sustainability and Disaster Prevention (3rd ESDP-2015)
Institut Teknologi Bandung, Indonesia – November 25th, 2015
116
17 meters, where the station 7 with the largest width of the river water. The water
temperature was measured range between 22,2 °C to 22,7 °C. The narrow temperature range
around the river due to similar conditions with lack of riparian vegetation that grows around
the river flow. Substrate types were observed in the different stations with two other stations,
namely rocky and sandy, while the other station types of substrates such as hard rock and
muddy.
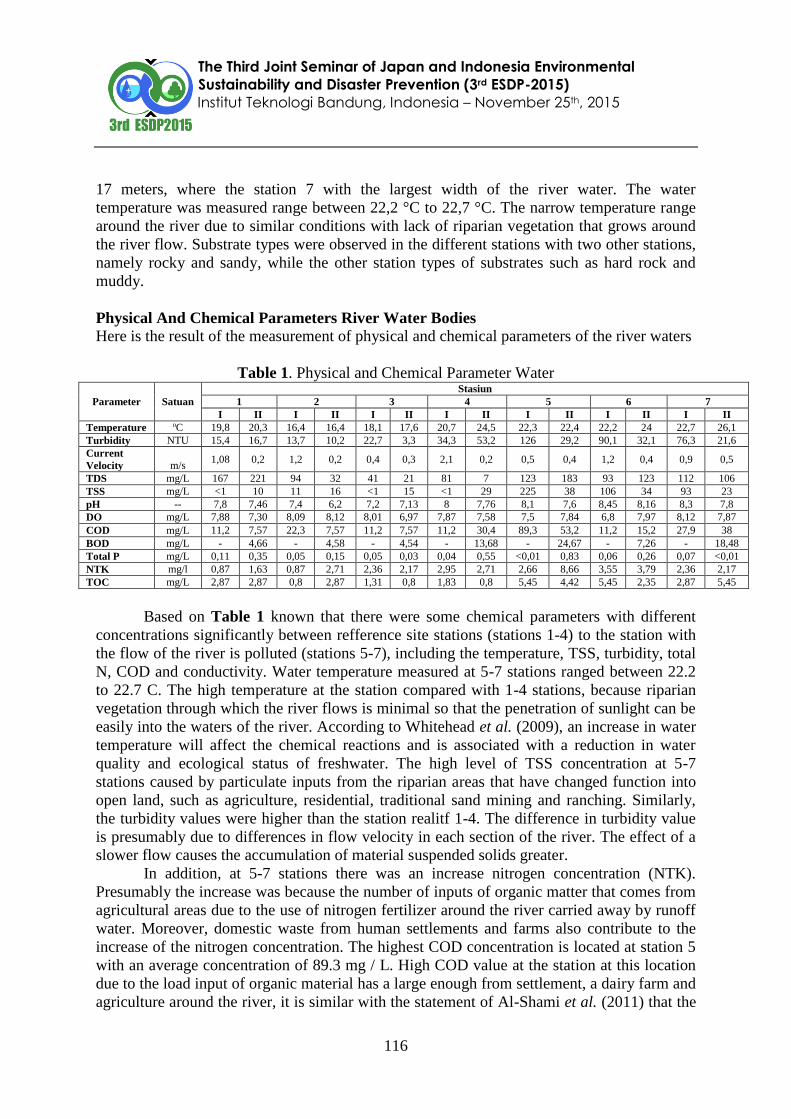
Physical And Chemical Parameters River Water Bodies
Here is the result of the measurement of physical and chemical parameters of the river waters
Table 1. Physical and Chemical Parameter Water
Parameter Satuan
Stasiun
1 2 3 4 5 6 7
I II I II I II I II I II I II I II
Temperature oC 19,8 20,3 16,4 16,4 18,1 17,6 20,7 24,5 22,3 22,4 22,2 24 22,7 26,1
Turbidity NTU 15,4 16,7 13,7 10,2 22,7 3,3 34,3 53,2 126 29,2 90,1 32,1 76,3 21,6
Current
Velocity m/s 1,08 0,2 1,2 0,2 0,4 0,3 2,1 0,2 0,5 0,4 1,2 0,4 0,9 0,5
TDS mg/L 167 221 94 32 41 21 81 7 123 183 93 123 112 106
TSS mg/L <1 10 11 16 <1 15 <1 29 225 38 106 34 93 23
pH -- 7,8 7,46 7,4 6,2 7,2 7,13 8 7,76 8,1 7,6 8,45 8,16 8,3 7,8
DO mg/L 7,88 7,30 8,09 8,12 8,01 6,97 7,87 7,58 7,5 7,84 6,8 7,97 8,12 7,87
COD mg/L 11,2 7,57 22,3 7,57 11,2 7,57 11,2 30,4 89,3 53,2 11,2 15,2 27,9 38
BOD mg/L - 4,66 - 4,58 - 4,54 - 13,68 - 24,67 - 7,26 - 18,48
Total P mg/L 0,11 0,35 0,05 0,15 0,05 0,03 0,04 0,55 <0,01 0,83 0,06 0,26 0,07 <0,01
NTK mg/l 0,87 1,63 0,87 2,71 2,36 2,17 2,95 2,71 2,66 8,66 3,55 3,79 2,36 2,17
TOC mg/L 2,87 2,87 0,8 2,87 1,31 0,8 1,83 0,8 5,45 4,42 5,45 2,35 2,87 5,45
Based on Table 1 known that there were some chemical parameters with different
concentrations significantly between refference site stations (stations 1-4) to the station with
the flow of the river is polluted (stations 5-7), including the temperature, TSS, turbidity, total
N, COD and conductivity. Water temperature measured at 5-7 stations ranged between 22.2
to 22.7 C. The high temperature at the station compared with 1-4 stations, because riparian
vegetation through which the river flows is minimal so that the penetration of sunlight can be
easily into the waters of the river. According to Whitehead et al. (2009), an increase in water
temperature will affect the chemical reactions and is associated with a reduction in water
quality and ecological status of freshwater. The high level of TSS concentration at 5-7
stations caused by particulate inputs from the riparian areas that have changed function into
open land, such as agriculture, residential, traditional sand mining and ranching. Similarly,
the turbidity values were higher than the station realitf 1-4. The difference in turbidity value
is presumably due to differences in flow velocity in each section of the river. The effect of a
slower flow causes the accumulation of material suspended solids greater.
In addition, at 5-7 stations there was an increase nitrogen concentration (NTK).
Presumably the increase was because the number of inputs of organic matter that comes from
agricultural areas due to the use of nitrogen fertilizer around the river carried away by runoff
water. Moreover, domestic waste from human settlements and farms also contribute to the
increase of the nitrogen concentration. The highest COD concentration is located at station 5
with an average concentration of 89.3 mg / L. High COD value at the station at this location
due to the load input of organic material has a large enough from settlement, a dairy farm and
agriculture around the river, it is similar with the statement of Al-Shami et al. (2011) that the
The Third Joint Seminar of Japan and Indonesia Environmental
Sustainability and Disaster Prevention (3rd ESDP-2015)
Institut Teknologi Bandung, Indonesia – November 25th, 2015
117
high value of COD in water is caused by a number of contaminants that enter the waters,
especially organic pollutants from household waste, industrial, rice fields and aquaculture.
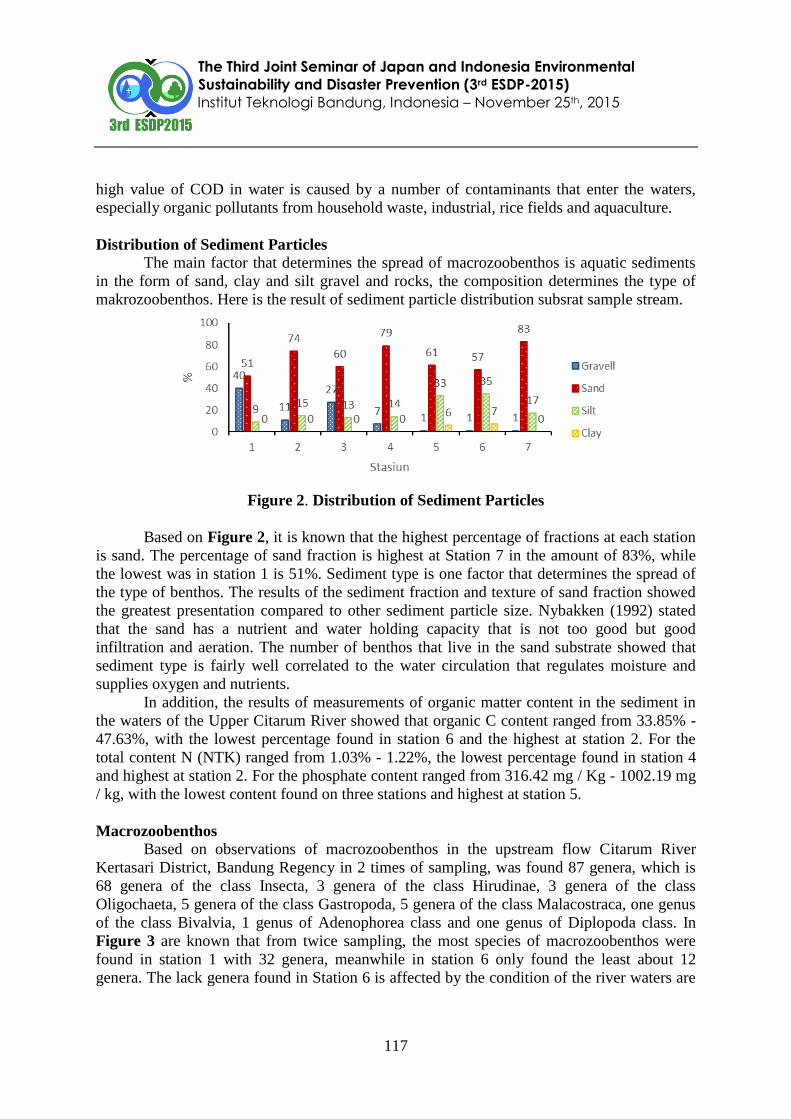
Distribution of Sediment Particles
The main factor that determines the spread of macrozoobenthos is aquatic sediments
in the form of sand, clay and silt gravel and rocks, the composition determines the type of
makrozoobenthos. Here is the result of sediment particle distribution subsrat sample stream.
Figure 2. Distribution of Sediment Particles
Based on Figure 2, it is known that the highest percentage of fractions at each station
is sand. The percentage of sand fraction is highest at Station 7 in the amount of 83%, while
the lowest was in station 1 is 51%. Sediment type is one factor that determines the spread of
the type of benthos. The results of the sediment fraction and texture of sand fraction showed
the greatest presentation compared to other sediment particle size. Nybakken (1992) stated
that the sand has a nutrient and water holding capacity that is not too good but good
infiltration and aeration. The number of benthos that live in the sand substrate showed that
sediment type is fairly well correlated to the water circulation that regulates moisture and
supplies oxygen and nutrients.
In addition, the results of measurements of organic matter content in the sediment in
the waters of the Upper Citarum River showed that organic C content ranged from 33.85% -
47.63%, with the lowest percentage found in station 6 and the highest at station 2. For the
total content N (NTK) ranged from 1.03% - 1.22%, the lowest percentage found in station 4
and highest at station 2. For the phosphate content ranged from 316.42 mg / Kg - 1002.19 mg
/ kg, with the lowest content found on three stations and highest at station 5.
Macrozoobenthos
Based on observations of macrozoobenthos in the upstream flow Citarum River
Kertasari District, Bandung Regency in 2 times of sampling, was found 87 genera, which is
68 genera of the class Insecta, 3 genera of the class Hirudinae, 3 genera of the class
Oligochaeta, 5 genera of the class Gastropoda, 5 genera of the class Malacostraca, one genus
of the class Bivalvia, 1 genus of Adenophorea class and one genus of Diplopoda class. In
Figure 3 are known that from twice sampling, the most species of macrozoobenthos were
found in station 1 with 32 genera, meanwhile in station 6 only found the least about 12
genera. The lack genera found in Station 6 is affected by the condition of the river waters are

The Third Joint Seminar of Japan and Indonesia Environmental
Sustainability and Disaster Prevention (3rd ESDP-2015)
Institut Teknologi Bandung, Indonesia – November 25th, 2015
118
dominated by rocky substrate, so that only certain types of macrozoobenthos are able to live
on the substrate.
Figure 3. Number of Species Macrozoobenthos
The most species of macrozoobenthos were found at station 1 indicates that water
conditions at the station can be said to be in good condition, so it can support the life of the
various species of aquatic biota. Meanwhile, the least were found at station 6, describing the
condition of the water is bad, because it is only able to support life in some kind of
macrozoobenthos were tolerant to the water conditions.
Based on Figure 4, shows that the highest population is macrozoobenthos at station 5
and station 7. A large number of species found at station 1 does not show the number of
higher population density. Another case with the five stations that have the highest population
density among the six other stations. That is because there are two species of
macrozoobenthos that dominates at the station, that Chironomus and Polypedilum. Both
species are known to go into the family Chironomidae, which the family is known to have the
ability to adapt to the condition of waters with high pollution levels. In addition, it is also
supported by the ability to form colonies, increase the chances of reproducing are higher than
with other species of family (Zaha and Mazumdar, 2013).
Figure 4. Population Density of Macrozoobenthos
The highest diversity index (H ') value, was found at station 1, that is equal to 2.48.
This value is influenced by many different species was found and the population density of
each species. Known in advance that station 1 is the station with the largest genus that found
July

The Third Joint Seminar of Japan and Indonesia Environmental
Sustainability and Disaster Prevention (3rd ESDP-2015)
Institut Teknologi Bandung, Indonesia – November 25th, 2015
119
of 32 genus. In addition, there were no genus dominating the population density, which is
population density of each genus is almost evenly. As with the stations 6 and 7, which has a
diversity index value of 0.49 and 0.4. There was a genus of the family Chironomidae who
have abundant population density compared to other genus, and also the amount of genus are
found relatively few, which is only 12 genera.
River Water Quality Assessment
Biotic indices used in the assessment of water quality status Citarum River upstream,
District Kertasari, Bandung Regency is an index Biological Monitoring Working Party-
Average Score Per Taxon. Based on the value of ASPT, Citarum River upstream have ASPT
values range between 2.91 to 5.86. It shows that the condition of river water into the level of
light pollution to heavy pollution. Lowest index value was obtained at station 5 by 2.91. The
low value of the biotic index because there is genus with a low scoring rate, which comes
from the family Chironomidae, Hirudinae, Oligochaeta and Gastropoda. The family belongs
to the group of macrozoobenthos that kind of cosmopolitan or can adapt to various
environmental conditions (Zeybek et al. 2014).
Pollution Index (IP) obtained from the seven stations ranged from 1.62 to 4.13. The
highest IP value obtained at station 5 and the lowest at station 3. The high value of IP at
station 5 is because there is some water parameters that exceed water quality standards, such
as BOD and COD. Sewage that comes from around the waters had a major contribution to the
concentration of these two parameters, especially the waste that comes from a dairy farm.
However, the value of IP is still included in the group lightly polluted.

The Third Joint Seminar of Japan and Indonesia Environmental
Sustainability and Disaster Prevention (3rd ESDP-2015)
Institut Teknologi Bandung, Indonesia – November 25th, 2015
120
Relationship Between Biological Parameters to Water and Sediment Parameters
Based on Pearson correlation analysis between the diversity of macrozoobenthos to
water and sediment parameters within two sampling times (Table 2 and Table 3) was
obtained parameters with the highest positive correlation value was the total phosphate
(+0.33), TDS (+0.78) and substrate gravel (+0.91), while the parameters with the highest
negative correlation value is pH (-0.75), DO (-0.5) and the sand substrate (-0.69).
At the first sampling, it is known that the total phosphate is the parameter with the
highest positive correlation value. However, when viewed from the significance value which
is more than 0.05 can be said that these parameters haven’t significant relationship to
diversity of macrozoobenthos. Another case in the second sampling, TDS is known as the
parameter with the highest correlation value, has a significance which is less than 0.05, so it
can be said that these parameters have a significant and strong relationship to diversity of
macrozoobenthos. Correlation value of gravel whether on the first and second sampling is the
highest, and the significance value of 0.05 so that it can be said that the relationship between
the diversity of macrozoobenthos to gravel parameters are very strong and significant.
Table 2. Results of Pearson Correlation Analysis Betweem Diversity of Macrozoobenthos to
Water Parameters
Flo
w
Temperatur
e
TD
S TSS pH DO
Turbidit
y
NT
K P
CO
D
TO
C
BO
D
Diversity
(1)
-
0,14 -0,57 0,02
-
0,42
-
0,75 0,31 -0,54
-
0,54
0,3
3
-
0,17
-
0,34
sig. (1) 0,77 0,18 0,96 0,36 0,05 0,50 0,22 0,21 0,4
7 0,72 0,45
Diversity
(2)
-
0,06 -0,08 0,78
-
0,38 0,17
-
0,50 -0,19
-
0,05
0,2
3
-
0,14 0,10
-
0,12
sig. (2) 0,89 0,86 0,04 0,41 0,71 0,25 0,68 0,92 0,6
3 0,77 0,83 0,80
Table 3. Results of Pearson Correlation Analysis Betweem Diversity of Macrozoobenthos to
Sediment Parameters
C-Organic NTK Phosfat pH Gravel Sand Silt Clay
Diversity (1) 0,34 0,01 -0,56 0,12 0,91 -0,64 -0,50 -0,34
sig. (1) 0,45 0,98 0,19 0,80 0,01 0,12 0,25 0,45
Diversity (2) 0,67 -0,63 0,70 -0,32 0,73 -0,69 -0,25 -0,06
sig. (2) 0,10 0,13 0,08 0,48 0,06 0,09 0,59 0,90
Pearson correlation analysis between population density of macrozoobenthos to water
and sediment parameters was obtained parameters with the highest positive correlation
values, which is COD (+0.96), TOC (+0.89) and mud substrates (+0.58), while the
parameters with values The highest negative correlation is the total phosphate (-0.69), pH (-
0.85) and gravel substrate (-0.59).
Correlation value, either COD or TOC, to population density of macrozoobenthos
showed a very strong relationship, and the significance of each value of less than 0.05 can be
considered as a significant relationship. In addition, the negative correlation value of pH
The Third Joint Seminar of Japan and Indonesia Environmental
Sustainability and Disaster Prevention (3rd ESDP-2015)
Institut Teknologi Bandung, Indonesia – November 25th, 2015
121
sediment have a very strong relationship to population density of macrozoobenthos and the
significance value of 0.05 resulted in a significant relationship.
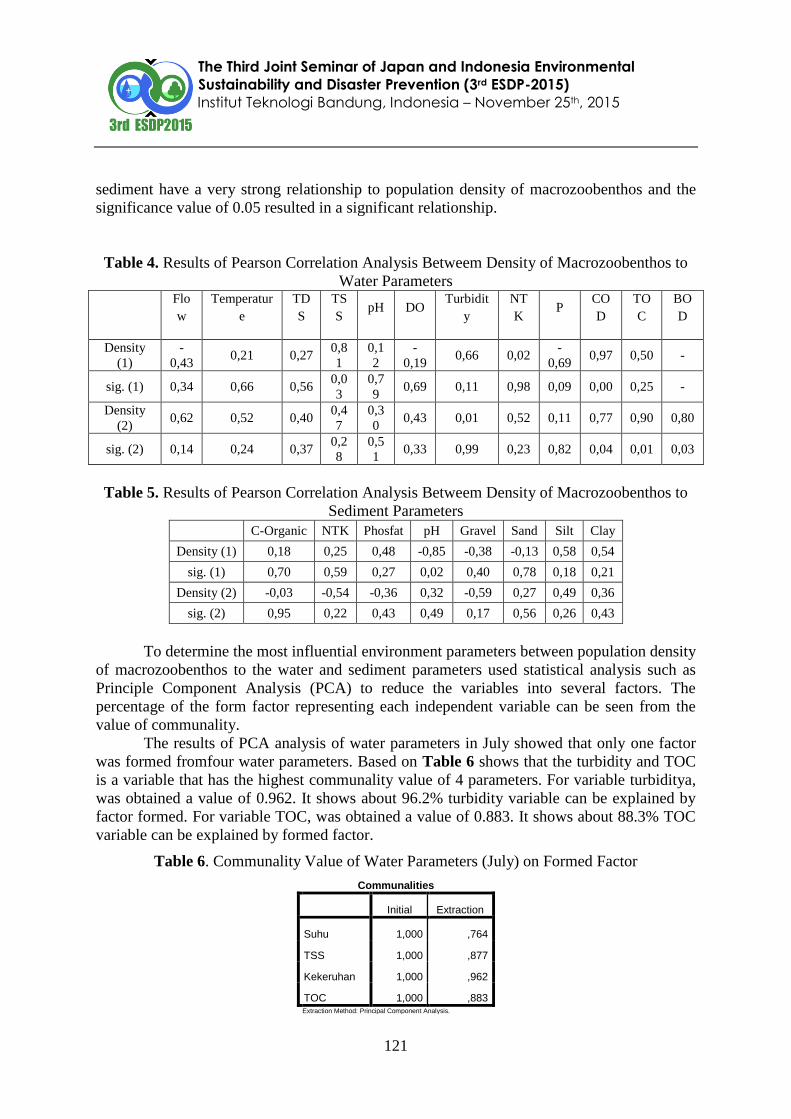
Table 4. Results of Pearson Correlation Analysis Betweem Density of Macrozoobenthos to
Water Parameters
Flo
w
Temperatur
e
TD
S
TS
S pH DO
Turbidit
y
NT
K P
CO
D
TO
C
BO
D
Density
(1)
-
0,43 0,21 0,27
0,8
1
0,1
2
-
0,19 0,66 0,02
-
0,69 0,97 0,50 -
sig. (1) 0,34 0,66 0,56 0,0
3
0,7
9 0,69 0,11 0,98 0,09 0,00 0,25 -
Density
(2) 0,62 0,52 0,40
0,4
7
0,3
0 0,43 0,01 0,52 0,11 0,77 0,90 0,80
sig. (2) 0,14 0,24 0,37 0,2
8
0,5
1 0,33 0,99 0,23 0,82 0,04 0,01 0,03
Table 5. Results of Pearson Correlation Analysis Betweem Density of Macrozoobenthos to
Sediment Parameters
C-Organic NTK Phosfat pH Gravel Sand Silt Clay
Density (1) 0,18 0,25 0,48 -0,85 -0,38 -0,13 0,58 0,54
sig. (1) 0,70 0,59 0,27 0,02 0,40 0,78 0,18 0,21
Density (2) -0,03 -0,54 -0,36 0,32 -0,59 0,27 0,49 0,36
sig. (2) 0,95 0,22 0,43 0,49 0,17 0,56 0,26 0,43
To determine the most influential environment parameters between population density
of macrozoobenthos to the water and sediment parameters used statistical analysis such as
Principle Component Analysis (PCA) to reduce the variables into several factors. The
percentage of the form factor representing each independent variable can be seen from the
value of communality.
The results of PCA analysis of water parameters in July showed that only one factor
was formed fromfour water parameters. Based on Table 6 shows that the turbidity and TOC
is a variable that has the highest communality value of 4 parameters. For variable turbiditya,
was obtained a value of 0.962. It shows about 96.2% turbidity variable can be explained by
factor formed. For variable TOC, was obtained a value of 0.883. It shows about 88.3% TOC
variable can be explained by formed factor.
Table 6. Communality Value of Water Parameters (July) on Formed Factor
Communalities
Initial Extraction
Suhu 1,000 ,764
TSS 1,000 ,877
Kekeruhan 1,000 ,962
TOC 1,000 ,883 Extraction Method: Principal Component Analysis.

The Third Joint Seminar of Japan and Indonesia Environmental
Sustainability and Disaster Prevention (3rd ESDP-2015)
Institut Teknologi Bandung, Indonesia – November 25th, 2015
122
The results of PCA analysis of water parameters in September showed that the water
of 5 variable parameters only formed one factor. Based on Table 7 is known that the BOD
and COD variable is the variable with the highest commonality value with the formed factor.
For BOD variables, was obtained a value of 0.789. It shows about 78.9% BOD variable can
be explained by formed factor. For COD variables, was obtained a value of 0.818. It shows
about 81.8% COD variable can be explained by formed factor.
Table 7. Communality Value of Water Parameters (September) on Formed Factor
Communalities
Initial Extraction
Suhu 1,000 ,762
COD 1,000 ,818
BOD 1,000 ,789
pH 1,000 ,567
TSS 1,000 ,726
Extraction Method: Principal Component Analysis.
The results of PCA analysis of sediment parameters in July indicates that from 5
variable of sediment parameters were only formed one factor. Based on Table 8 is known
that variable silt and clay is the variable with the highest commonality value to the formed
factor. For variable silt, was obtained a value of 0.966. It shows about 96.6% mud variable
can be explained by factors that are formed. For variable clay, was obtained a value of 0.968.
It shows about 96.8% TOC variable can be explained by factors that are formed.
Tabel 8. Communality Value of Sediment Parameters (July) on Formed Factor
Communalities
Initial Extraction
COrganik 1,000 ,541
pHsedimen 1,000 ,416
Lumpur 1,000 ,966
Liat 1,000 ,968
Extraction Method: Principal Component Analysis.
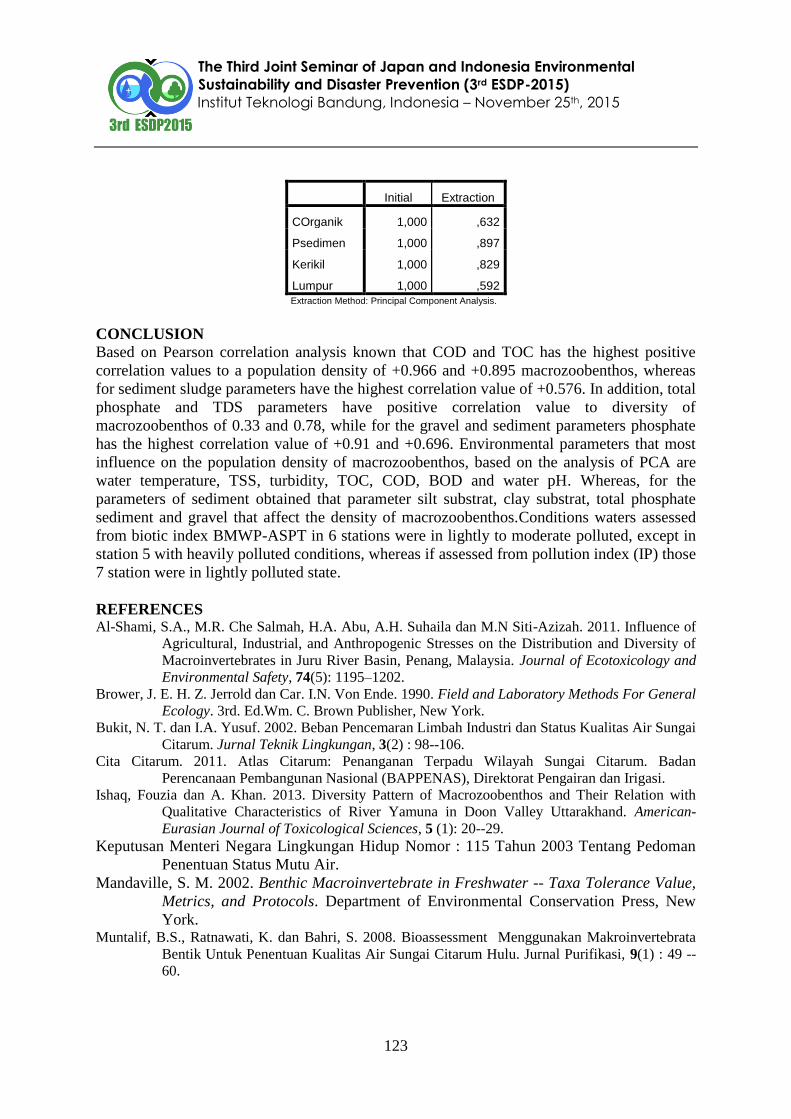
The results of PCA analysis of sediment parameters in September showed that from 4
variable of sedimen parameters were only formed one factor. Based on Table 9 it is known
that the total phosphate and gravel variable is the variable with the highest commonality
value do the formed factor. For variable total phosphate, bas obtained a value of 0.897. It
shows about 89.7% of total variable phosphate can be explained by factors that are formed.
For variable gravel, was obtained a value of 0.829. It shows about 82.9% gravel variable can
be explained by factors that are formed.
Tabel 9. Communality Value of Sediment Parameters (September) on Formed Factor
Communalities
The Third Joint Seminar of Japan and Indonesia Environmental
Sustainability and Disaster Prevention (3rd ESDP-2015)
Institut Teknologi Bandung, Indonesia – November 25th, 2015
123
Initial Extraction
COrganik 1,000 ,632
Psedimen 1,000 ,897
Kerikil 1,000 ,829
Lumpur 1,000 ,592
Extraction Method: Principal Component Analysis.
CONCLUSION
Based on Pearson correlation analysis known that COD and TOC has the highest positive
correlation values to a population density of +0.966 and +0.895 macrozoobenthos, whereas
for sediment sludge parameters have the highest correlation value of +0.576. In addition, total
phosphate and TDS parameters have positive correlation value to diversity of
macrozoobenthos of 0.33 and 0.78, while for the gravel and sediment parameters phosphate
has the highest correlation value of +0.91 and +0.696. Environmental parameters that most
influence on the population density of macrozoobenthos, based on the analysis of PCA are
water temperature, TSS, turbidity, TOC, COD, BOD and water pH. Whereas, for the
parameters of sediment obtained that parameter silt substrat, clay substrat, total phosphate
sediment and gravel that affect the density of macrozoobenthos.Conditions waters assessed
from biotic index BMWP-ASPT in 6 stations were in lightly to moderate polluted, except in
station 5 with heavily polluted conditions, whereas if assessed from pollution index (IP) those
7 station were in lightly polluted state.
REFERENCES Al-Shami, S.A., M.R. Che Salmah, H.A. Abu, A.H. Suhaila dan M.N Siti-Azizah. 2011. Influence of
Agricultural, Industrial, and Anthropogenic Stresses on the Distribution and Diversity of
Macroinvertebrates in Juru River Basin, Penang, Malaysia. Journal of Ecotoxicology and
Environmental Safety, 74(5): 1195–1202.
Brower, J. E. H. Z. Jerrold dan Car. I.N. Von Ende. 1990. Field and Laboratory Methods For General
Ecology. 3rd. Ed.Wm. C. Brown Publisher, New York.
Bukit, N. T. dan I.A. Yusuf. 2002. Beban Pencemaran Limbah Industri dan Status Kualitas Air Sungai
Citarum. Jurnal Teknik Lingkungan, 3(2) : 98--106.
Cita Citarum. 2011. Atlas Citarum: Penanganan Terpadu Wilayah Sungai Citarum. Badan
Perencanaan Pembangunan Nasional (BAPPENAS), Direktorat Pengairan dan Irigasi.
Ishaq, Fouzia dan A. Khan. 2013. Diversity Pattern of Macrozoobenthos and Their Relation with
Qualitative Characteristics of River Yamuna in Doon Valley Uttarakhand. American-
Eurasian Journal of Toxicological Sciences, 5 (1): 20--29.
Keputusan Menteri Negara Lingkungan Hidup Nomor : 115 Tahun 2003 Tentang Pedoman
Penentuan Status Mutu Air.
Mandaville, S. M. 2002. Benthic Macroinvertebrate in Freshwater -- Taxa Tolerance Value,
Metrics, and Protocols. Department of Environmental Conservation Press, New
York. Muntalif, B.S., Ratnawati, K. dan Bahri, S. 2008. Bioassessment Menggunakan Makroinvertebrata
Bentik Untuk Penentuan Kualitas Air Sungai Citarum Hulu. Jurnal Purifikasi, 9(1) : 49 --
60.

The Third Joint Seminar of Japan and Indonesia Environmental
Sustainability and Disaster Prevention (3rd ESDP-2015)
Institut Teknologi Bandung, Indonesia – November 25th, 2015
124
Nybakken, J. W. 1992. Biologi Laut: Suatu Pendekatan Ekologi. Terj. Dari Marine biology: An
ecological approach oleh Eidman, M., Koesoebiono, D.G. Bengen, M. Hutomo & S.
Sukardjo. Penerbit Gramedia, Jakarta.
Sudarso, Y. 2009. Pengaruh Aktivitas Antropogenik di Sungai Cikaniki (Jawa Barat) Terhadap
Komunitas Fauna Makrobentik. Limnotek, 16 (2): 153--166.
Whitehead, P.G., R.L. Wilby, R.W. Battarbee, M. Kernan dan A. J. Wade. 2009. A Review of The
Potential Impacts of Climate Change on Surface Water Quality. Journal Sciences
Hydrological, 54(1): 101-121.
Zaha, D. dan A. Mazumdar. 2013. Deformities of Chironomus sp. Larvae (Diptera: Chironomidae) as
Indicator of Pollution Stress in Rice Fields of Hooghly District, West Bengal. Journal of
Today’s Biological Sciences: Research & Review, 2(2) : 44--54.
Zeybek, M., H. Kalyoncu, B. Karakaş dan S. Özgül. 2014. The use of BMWP and ASPT indices for
evaluation of water quality according to macroinvertebrates in Değirmendere Stream
(Isparta, Turkey). Turkish Journal of Zoology, 38: 603--613.
Related Documents