1 RELATIONSHIP BETWEEN TEACHERS’ ATTRITION, TRANSFERS AND STUDENTS’ MOBILITY FROM PUBLIC TO PRIVATE SECONDARY SCHOOLS IN BAYELSA AND DELTA STATES,NIGERIA OFOYEJU, Peter Tobore DEPARTMENT OF EDUCATIONAL MANAGEMENT AND FOUNDATIONS, DELTA STATE UNIVERSITY, ABRAKA, NIGERIA. AUGUST, 2021.

Welcome message from author
This document is posted to help you gain knowledge. Please leave a comment to let me know what you think about it! Share it to your friends and learn new things together.
Transcript
1
RELATIONSHIP BETWEEN TEACHERS’ ATTRITION,
TRANSFERS AND STUDENTS’ MOBILITY FROM PUBLIC TO
PRIVATE SECONDARY SCHOOLS IN BAYELSA AND DELTA
STATES,NIGERIA
OFOYEJU, Peter Tobore
DEPARTMENT OF EDUCATIONAL MANAGEMENT AND
FOUNDATIONS, DELTA STATE UNIVERSITY, ABRAKA, NIGERIA.
AUGUST, 2021.
2
RELATIONSHIP BETWEEN TEACHERS’ ATTRITION,
TRANSFERS AND STUDENTS’ MOBILITY FROMPUBLIC TO
PRIVATE SECONDARY SCHOOLS IN BAYELSA AND DELTA
STATES, NIGERIA
OFOYEJU, Peter Tobore
PG/11/12/205204
NCE, Warri; B.Sc. Ed (Hons); ME&PE (Hons); M. Ed. Admin., Abraka.
A Thesis Written in the Department of Educational Management and
Foundations, Faculty of Education and Submitted to Post Graduate
School, Delta State University, Abraka in Partial Fulfillment of the
Requirements for the Award of Doctor of Philosophy (Ph.D.) in
Educational Administration.
AUGUST, 2021.
3
DECLARATION
I hereby declare that this thesis was written by me in the Department of Educational
Management and Foundations, Faculty of Education, Delta State University, Abraka and
has not been submitted either in part or in full by any other in this University or any other
institution for the award of a certificate, diploma or degree.
______________________ _______________
OFOYEJU Peter Tobore Date
Student name
4
CERTIFICATION
We certify that this thesis was written by OFOYEJU Peter Tobore in the Department of
Educational Management and Foundations, Faculty of Education under our supervision.
___________________ ________________
Prof. N.E. Akpotu Date
Supervisor
___________________ ________________
Prof. (Mrs.) E.J. Egwunyenga Date
Supervisor
__________________ ________________
Dr. I. Obielumani Date
(Acting Head of Department)
Educational Management and Foundations
___________________ ________________
Prof. E. Kpangban Date
(Dean of Faculty of Education)
5
DEDICATION
This research is dedicated to the Lord God Almighty for his enduring grace and love that
powers my life through Christ Jesus.
6
ACKNOWLEDGEMENTS
It is the sincere desire of the researcher to express his profound gratitude to the following
people whose support and cooperation made this study possible. Special thanks go to his
supervisors, Professor N. E. Akpotu and Professor (Mrs.) E. J. Egwunyenga for their
professional guidance, constructive criticism, advice and encouragement.
Great thanks go to the V.C. Professor Andy Egwunyenga for his benevolence,
godliness; kind heart and understanding that sustained this programme. Also recognized is
the Dean of Post Graduate School, Professor E. E. Akporhonor; the Dean, Faculty of
Education, Professor E. Kpangba; the Head of Department, Educational Management and
foundations Dr. (Mrs.) R.I. Asiyai and other lecturers of the Department including
Professor E. A. Arubayi, Professor V. F. Peretomode, Professor P. O. Ikoya, Professor E.
P. Oghuvbu, Professor D. Onoyase, Professor E. D, Nakpodia, Dr. J. E Anho and Dr. I.
Obielumani. Others are Dr. R.O. Obata, Dr. (Mrs.) T. E Atakpo, Dr. B. O Biokoro, Dr.
(Mrs.) D.A. Akporehe, Dr. (Mrs.) M. P. Omonefe, Dr. B. Chukwuemeka, and Dr. V. N.
Nkedishu and Mrs. A. N Obed-Chukwuka for their moral support.
The researcher also appreciates course mates like Mr. Patrick Odozi, Navy Captain
Mrs. Elizabeth Iloba, Rev Sister Dr. Antoinette Okpara, Dr. Mrs. E Ifeta, Rev. Brown
Ashegbare, Rev. Father Emmanuel Onyekwe and Dr. Mrs. P. Obakpolo for their support.
Thanks also go to Mr. D. Otuisi, Mr. Tule Steve and Mr. O. Eyiyere for the supply
of data and Mr. OriakuEze for typing the work.
Engr. Christian OseremoOkitiakpe, Mrs R. N. Usiayo, Comrade, OlumamiOyibo
and Mr. Michael E. Akporehe are appreciated for their benevolence that kept him in the
programme. Others include Rev. and Mrs. G. R. Doyah, Rev. Gabriel Alao; Rev. Lawson
Odeh; Rev. Felix Omojefe; Elder Martin Ojoh, Mrs. M. Ajobo and all the principals he
served under while the programme lasted for their support and understanding.
His sisters, Elizabeth Erih, Efe Evelyn Ofoyeju and his brother Mitchel Ofoyeju are
appreciated for their support. A special posthumous appreciation goes to his mother
Midwifery Sister Esther AyeboOfoyeju for laying the foundation of education in him. His
father W. B. Ofoyeju, his maternal grandmother Mrs. EmeteOkwese, elder brother Paul
Ofoyeju, his twin brother EruesekeOfoyeju, Rev. Emmanuel Ofou and Mr. Ogbeda
Benson are appreciated for their contributions.
The researcher is indebted to his wife Mrs. Eseroghene Blessing Peter-Ofoyeju for
her tireless efforts, relentless sacrifices, and support. He is grateful to his children Obama
Peter, Jesuyovie Emmanuel and Treasure Jesuganor.
7
TABLE OF CONTENTS
COVER PAGE I
TITLE PAGE II
DECLARATION III
CERTIFICATION IV
DEDICATION V
ACKNOWLEDGEMENTS VI
LIST OF TABLES IX
LIST OF FIGURES XI
ABSTRACT XII
CHAPTER ONE: INTRODUCTION
Background to the Study 1
Statement of the Problem 6
Research Questions 7
Hypotheses 8
Purpose of the Study 9
Significance of the Study 10
Scope and Delimitation 11
Definition of Terms 12
CHAPTER TWO: REVIEW OF RELATED LITERATURE
Theoretical Framework 13
Relevance of the Theory to the Study 14
Teachers‘ Attrition in Public Secondary Schools 14
The Rate of Teachers‘ Attrition 24
The Rate of Teachers‘ Transfers 38
Teachers‘ Transfers and Students‘ Mobility from the Public to Private
Secondary Schools 40
The Rates of Students‘ Mobility from the Public to Private Secondary Schools 46
Reasons for Students‘ Mobility from the Public to Private Secondary Schools in
Bayelsa and Delta States 50
The Influence of Teachers‘ Demographic Factors: Age, Gender and Marital Status
onTeachers‘ Transfers 53
The Pattern of Students‘ Mobility between Public and Private Secondary Schools 55
Teachers‘ Attrition, Transfers and Students‘ Mobility to Private Secondary
Schools 57
8
Teachers‘ Compensation and Attrition 71
Reasons for Teachers‘ Attrition 79
Appraisal of Reviewed Literature 81
CHAPTER THREE: RESEARCH METHOD AND PROCEDURE
Research Design 82
Population of the Study 82
Sample and Sampling Technique 85
Research Instrument 87
Validity of the Instruments 88
Reliability of the Instrument 89
Administration of the Instrument 90
Method of Data Analysis 90
CHAPTER FOUR: PRESENTATION OF RESULTS AND DISCUSSION
Demographic Presentation of Respondents (principals) 91
Answering the Research Questions 95
Discussion of Results 128
CHAPTER FIVE: SUMMARY, CONCLUSION AND RECOMMENDATIONS
Summary of the Study 143
Summary of the Research Findings 144
Conclusion 145
Recommendations 145
Contributions to Knowledge 146
Suggestions for Further Studies 146
REFERENCES 147
APPENDICES 174
9
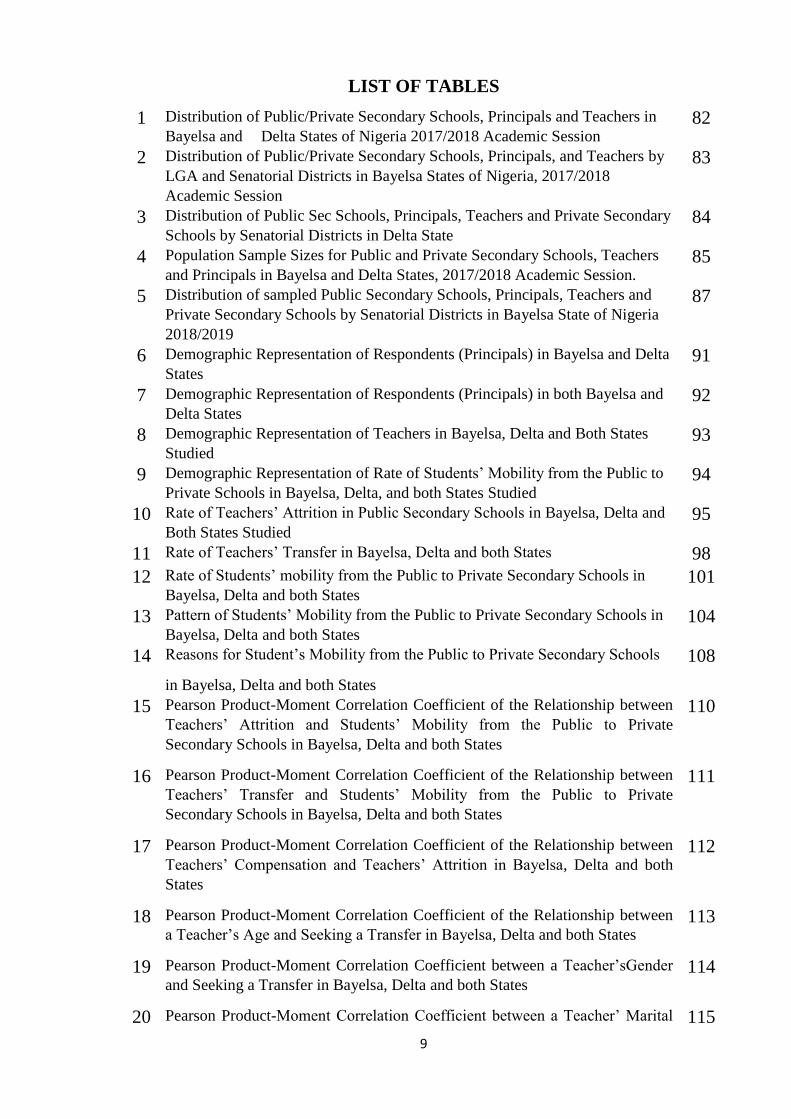
LIST OF TABLES
1 Distribution of Public/Private Secondary Schools, Principals and Teachers in
Bayelsa and Delta States of Nigeria 2017/2018 Academic Session 82
2 Distribution of Public/Private Secondary Schools, Principals, and Teachers by
LGA and Senatorial Districts in Bayelsa States of Nigeria, 2017/2018
Academic Session
83
3 Distribution of Public Sec Schools, Principals, Teachers and Private Secondary
Schools by Senatorial Districts in Delta State 84
4 Population Sample Sizes for Public and Private Secondary Schools, Teachers
and Principals in Bayelsa and Delta States, 2017/2018 Academic Session. 85
5 Distribution of sampled Public Secondary Schools, Principals, Teachers and
Private Secondary Schools by Senatorial Districts in Bayelsa State of Nigeria
2018/2019
87
6 Demographic Representation of Respondents (Principals) in Bayelsa and Delta
States 91
7 Demographic Representation of Respondents (Principals) in both Bayelsa and
Delta States 92
8 Demographic Representation of Teachers in Bayelsa, Delta and Both States
Studied 93
9 Demographic Representation of Rate of Students‘ Mobility from the Public to
Private Schools in Bayelsa, Delta, and both States Studied 94
10 Rate of Teachers‘ Attrition in Public Secondary Schools in Bayelsa, Delta and
Both States Studied 95
11 Rate of Teachers‘ Transfer in Bayelsa, Delta and both States 98
12 Rate of Students‘ mobility from the Public to Private Secondary Schools in
Bayelsa, Delta and both States 101
13 Pattern of Students‘ Mobility from the Public to Private Secondary Schools in
Bayelsa, Delta and both States 104
14 Reasons for Student‘s Mobility from the Public to Private Secondary Schools
in Bayelsa, Delta and both States
108
15 Pearson Product-Moment Correlation Coefficient of the Relationship between
Teachers‘ Attrition and Students‘ Mobility from the Public to Private
Secondary Schools in Bayelsa, Delta and both States
110
16 Pearson Product-Moment Correlation Coefficient of the Relationship between
Teachers‘ Transfer and Students‘ Mobility from the Public to Private
Secondary Schools in Bayelsa, Delta and both States
111
17 Pearson Product-Moment Correlation Coefficient of the Relationship between
Teachers‘ Compensation and Teachers‘ Attrition in Bayelsa, Delta and both
States
112
18 Pearson Product-Moment Correlation Coefficient of the Relationship between
a Teacher‘s Age and Seeking a Transfer in Bayelsa, Delta and both States 113
19 Pearson Product-Moment Correlation Coefficient between a Teacher‘sGender
and Seeking a Transfer in Bayelsa, Delta and both States 114
20 Pearson Product-Moment Correlation Coefficient between a Teacher‘ Marital 115
10
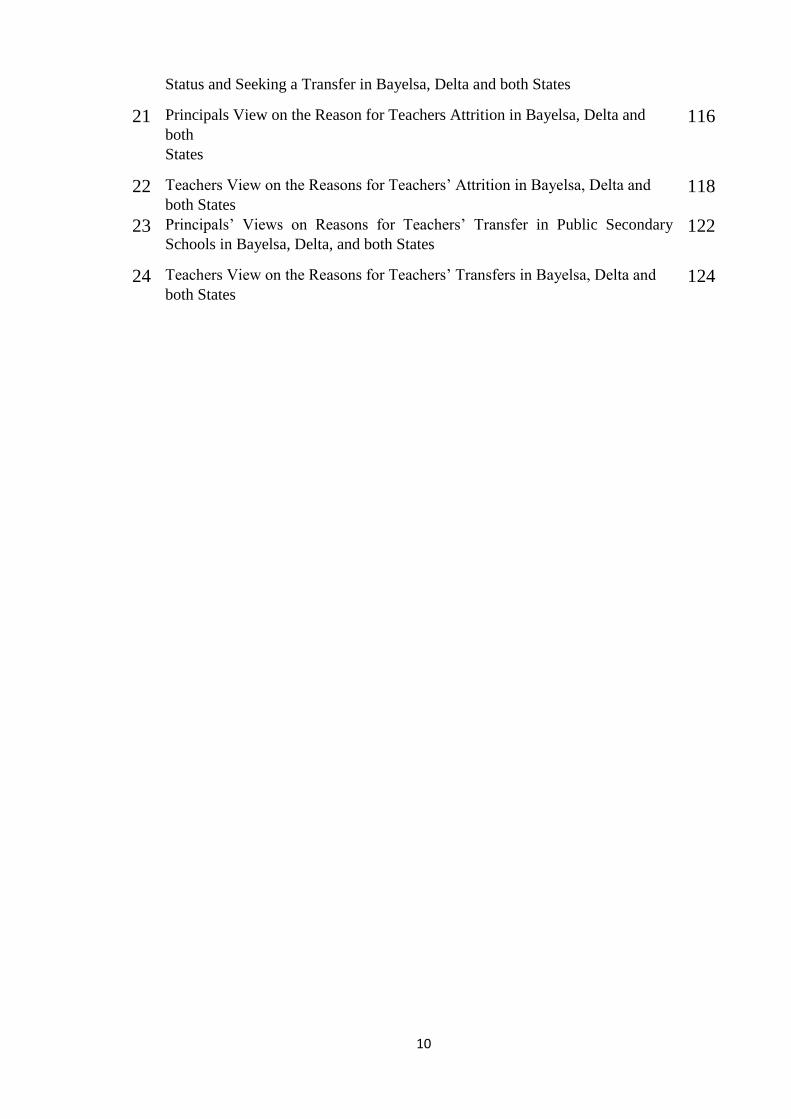
Status and Seeking a Transfer in Bayelsa, Delta and both States
21 Principals View on the Reason for Teachers Attrition in Bayelsa, Delta and
both
States
116
22 Teachers View on the Reasons for Teachers‘ Attrition in Bayelsa, Delta and
both States 118
23 Principals‘ Views on Reasons for Teachers‘ Transfer in Public Secondary
Schools in Bayelsa, Delta, and both States 122
24 Teachers View on the Reasons for Teachers‘ Transfers in Bayelsa, Delta and
both States 124
11
LIST OF FIGURES
1 Comparison of Teachers‘ Attrition rates Between Bayelsa and Delta States
from 2015 to 2019 97
2 Comparison of Teachers‘ Transfer Rates in Bayelsa and Delta States 100
3 Rates of Students‘ Mobility from the Public to Private Secondary Schools in
Bayelsa and Delta States 101
4 Comparison of total students‘ mobility pattern from the public to private
secondary schools in Bayelsa and Delta States from 2015-2019 107
5 Comparison of Principals‘ and Teachers‘ views on reasons for teachers‘
attrition in Bayelsa and Delta States 121
6 Comparison of Principals‘ views on reasons for teachers‘ transfers in public
Secondary Schools in Bayelsa and Delta States 123
7 Comparison of teachers‘ views on reasons for teachers‘ transfers in public
Secondary Schools in Delta and Bayelsa States from 2015- 2019 126
12
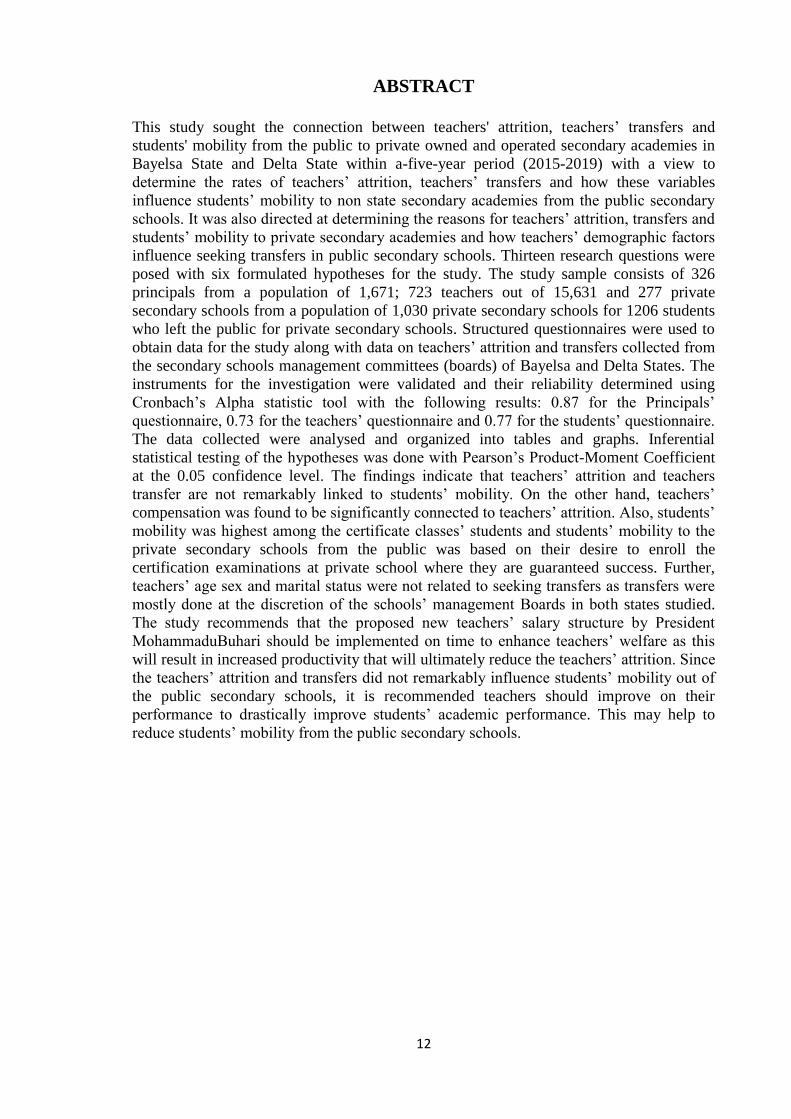
ABSTRACT
This study sought the connection between teachers' attrition, teachers‘ transfers and
students' mobility from the public to private owned and operated secondary academies in
Bayelsa State and Delta State within a-five-year period (2015-2019) with a view to
determine the rates of teachers‘ attrition, teachers‘ transfers and how these variables
influence students‘ mobility to non state secondary academies from the public secondary
schools. It was also directed at determining the reasons for teachers‘ attrition, transfers and
students‘ mobility to private secondary academies and how teachers‘ demographic factors
influence seeking transfers in public secondary schools. Thirteen research questions were
posed with six formulated hypotheses for the study. The study sample consists of 326
principals from a population of 1,671; 723 teachers out of 15,631 and 277 private
secondary schools from a population of 1,030 private secondary schools for 1206 students
who left the public for private secondary schools. Structured questionnaires were used to
obtain data for the study along with data on teachers‘ attrition and transfers collected from
the secondary schools management committees (boards) of Bayelsa and Delta States. The
instruments for the investigation were validated and their reliability determined using
Cronbach‘s Alpha statistic tool with the following results: 0.87 for the Principals‘
questionnaire, 0.73 for the teachers‘ questionnaire and 0.77 for the students‘ questionnaire.
The data collected were analysed and organized into tables and graphs. Inferential
statistical testing of the hypotheses was done with Pearson‘s Product-Moment Coefficient
at the 0.05 confidence level. The findings indicate that teachers‘ attrition and teachers
transfer are not remarkably linked to students‘ mobility. On the other hand, teachers‘
compensation was found to be significantly connected to teachers‘ attrition. Also, students‘
mobility was highest among the certificate classes‘ students and students‘ mobility to the
private secondary schools from the public was based on their desire to enroll the
certification examinations at private school where they are guaranteed success. Further,
teachers‘ age sex and marital status were not related to seeking transfers as transfers were
mostly done at the discretion of the schools‘ management Boards in both states studied.
The study recommends that the proposed new teachers‘ salary structure by President
MohammaduBuhari should be implemented on time to enhance teachers‘ welfare as this
will result in increased productivity that will ultimately reduce the teachers‘ attrition. Since
the teachers‘ attrition and transfers did not remarkably influence students‘ mobility out of
the public secondary schools, it is recommended teachers should improve on their
performance to drastically improve students‘ academic performance. This may help to
reduce students‘ mobility from the public secondary schools.
13
CHAPTER ONE
INTRODUCTION
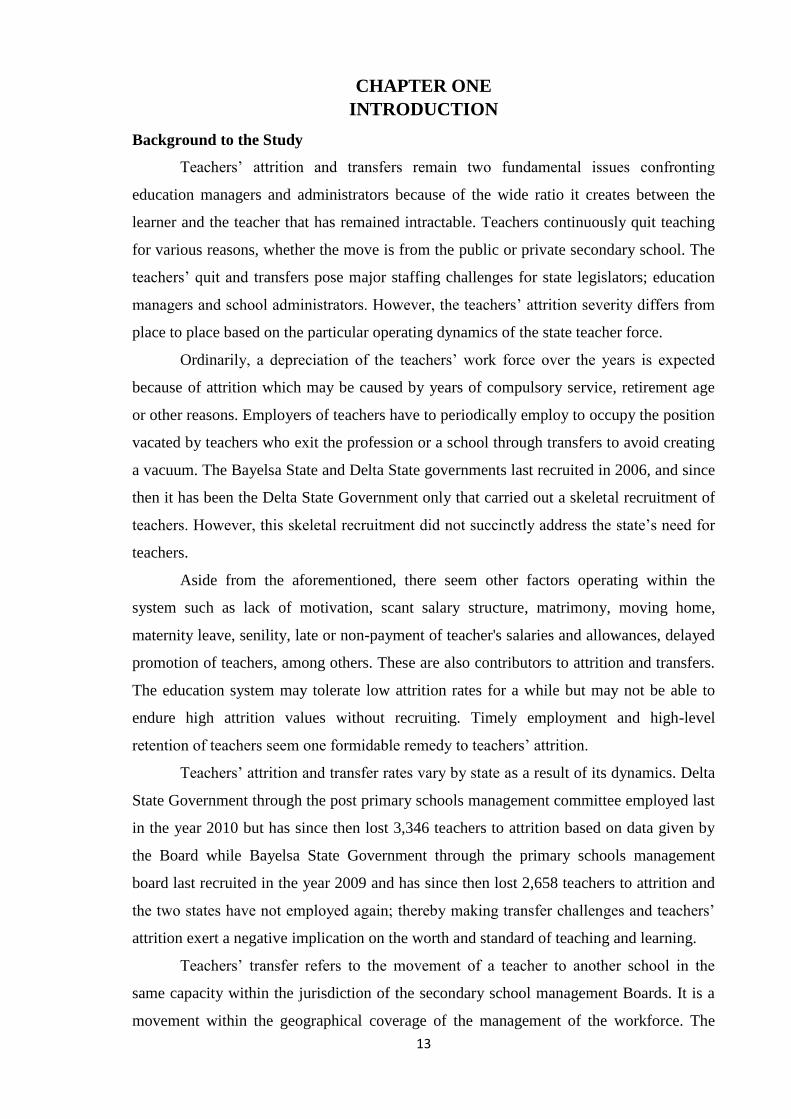
Background to the Study
Teachers‘ attrition and transfers remain two fundamental issues confronting
education managers and administrators because of the wide ratio it creates between the
learner and the teacher that has remained intractable. Teachers continuously quit teaching
for various reasons, whether the move is from the public or private secondary school. The
teachers‘ quit and transfers pose major staffing challenges for state legislators; education
managers and school administrators. However, the teachers‘ attrition severity differs from
place to place based on the particular operating dynamics of the state teacher force.
Ordinarily, a depreciation of the teachers‘ work force over the years is expected
because of attrition which may be caused by years of compulsory service, retirement age
or other reasons. Employers of teachers have to periodically employ to occupy the position
vacated by teachers who exit the profession or a school through transfers to avoid creating
a vacuum. The Bayelsa State and Delta State governments last recruited in 2006, and since
then it has been the Delta State Government only that carried out a skeletal recruitment of
teachers. However, this skeletal recruitment did not succinctly address the state‘s need for
teachers.
Aside from the aforementioned, there seem other factors operating within the
system such as lack of motivation, scant salary structure, matrimony, moving home,
maternity leave, senility, late or non-payment of teacher's salaries and allowances, delayed
promotion of teachers, among others. These are also contributors to attrition and transfers.
The education system may tolerate low attrition rates for a while but may not be able to
endure high attrition values without recruiting. Timely employment and high-level
retention of teachers seem one formidable remedy to teachers‘ attrition.
Teachers‘ attrition and transfer rates vary by state as a result of its dynamics. Delta
State Government through the post primary schools management committee employed last
in the year 2010 but has since then lost 3,346 teachers to attrition based on data given by
the Board while Bayelsa State Government through the primary schools management
board last recruited in the year 2009 and has since then lost 2,658 teachers to attrition and
the two states have not employed again; thereby making transfer challenges and teachers‘
attrition exert a negative implication on the worth and standard of teaching and learning.
Teachers‘ transfer refers to the movement of a teacher to another school in the
same capacity within the jurisdiction of the secondary school management Boards. It is a
movement within the geographical coverage of the management of the workforce. The
14
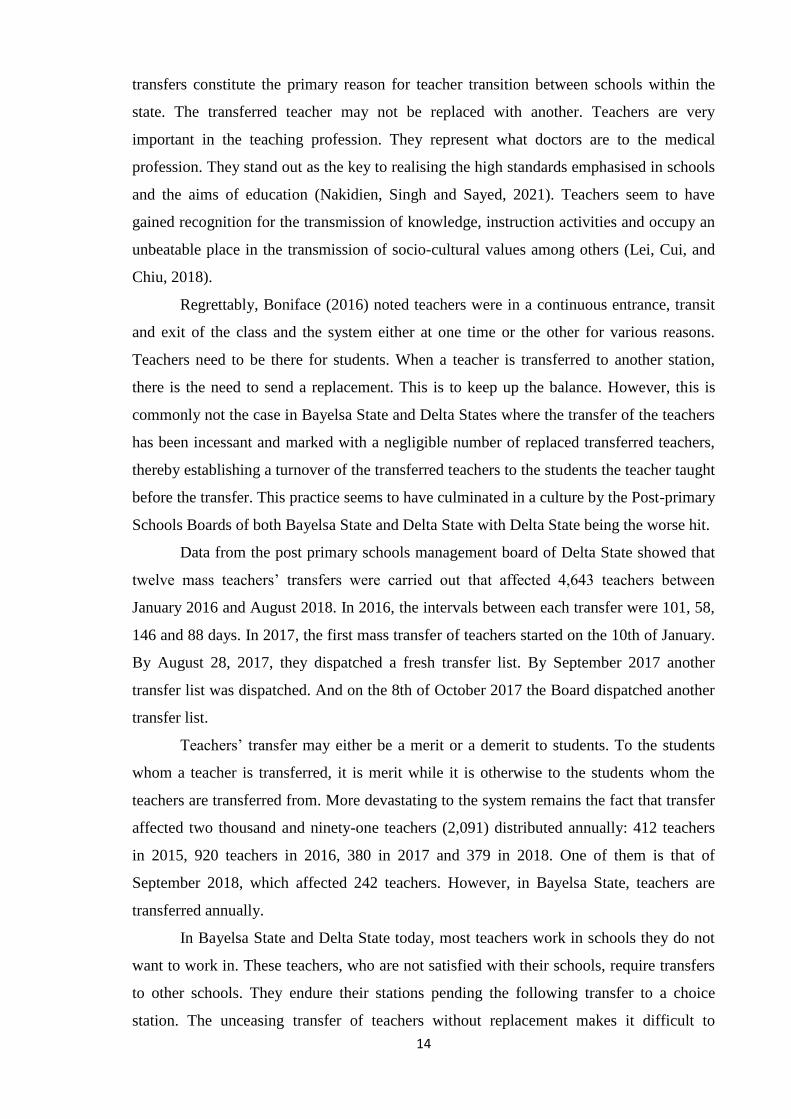
transfers constitute the primary reason for teacher transition between schools within the
state. The transferred teacher may not be replaced with another. Teachers are very
important in the teaching profession. They represent what doctors are to the medical
profession. They stand out as the key to realising the high standards emphasised in schools
and the aims of education (Nakidien, Singh and Sayed, 2021). Teachers seem to have
gained recognition for the transmission of knowledge, instruction activities and occupy an
unbeatable place in the transmission of socio-cultural values among others (Lei, Cui, and
Chiu, 2018).
Regrettably, Boniface (2016) noted teachers were in a continuous entrance, transit
and exit of the class and the system either at one time or the other for various reasons.
Teachers need to be there for students. When a teacher is transferred to another station,
there is the need to send a replacement. This is to keep up the balance. However, this is
commonly not the case in Bayelsa State and Delta States where the transfer of the teachers
has been incessant and marked with a negligible number of replaced transferred teachers,
thereby establishing a turnover of the transferred teachers to the students the teacher taught
before the transfer. This practice seems to have culminated in a culture by the Post-primary
Schools Boards of both Bayelsa State and Delta State with Delta State being the worse hit.
Data from the post primary schools management board of Delta State showed that
twelve mass teachers‘ transfers were carried out that affected 4,643 teachers between
January 2016 and August 2018. In 2016, the intervals between each transfer were 101, 58,
146 and 88 days. In 2017, the first mass transfer of teachers started on the 10th of January.
By August 28, 2017, they dispatched a fresh transfer list. By September 2017 another
transfer list was dispatched. And on the 8th of October 2017 the Board dispatched another
transfer list.
Teachers‘ transfer may either be a merit or a demerit to students. To the students
whom a teacher is transferred, it is merit while it is otherwise to the students whom the
teachers are transferred from. More devastating to the system remains the fact that transfer
affected two thousand and ninety-one teachers (2,091) distributed annually: 412 teachers
in 2015, 920 teachers in 2016, 380 in 2017 and 379 in 2018. One of them is that of
September 2018, which affected 242 teachers. However, in Bayelsa State, teachers are
transferred annually.
In Bayelsa State and Delta State today, most teachers work in schools they do not
want to work in. These teachers, who are not satisfied with their schools, require transfers
to other schools. They endure their stations pending the following transfer to a choice
station. The unceasing transfer of teachers without replacement makes it difficult to
15
collaborate, develop standard norms of practice and support the progress of common goals.
This situation can lead to disjointed instructional programmes and professional
development plans that can cause students to move schools.
Some teachers seem to prefer serving in urban but not rural and riverine
settlements to draw from the pool of infrastructure, social amenities and facilities. This
then causes many applications of transfer. Often, the transfer list is dispatched in the
middle of a running term. Replacement of transferring teachers may take a long time.
Therefore, the transfer of teachers to other schools often leaves learners unattended to for
sometimes. This repeatedly led to poor students' academic performance because of poor
syllabus coverage. This may cause parents to contemplate and approve the movement of
their children and wards to private secondary schools.
It appears that teachers‘ demography such as age, sex and orientation influence a
teacher‘s choice of place of service and residence. Most transfer requests are to urban areas
as indicated by the transfer lists of the Post Primary School Boards. However, while some
teachers prefer transfers of urban areas, a few others prefer the rural areas. They may be
different reasons for that variation. We may clearly explain teacher preference for urban
areas by the wish to enjoy infrastructure, amenities and facilities benefits. Postings in rural
areas may be justified by a phobia of the enormous workload associated with populated
schools; high cost of living in urban areas among others. These reasons may profoundly
influence seeking a transfer of service to other stations (OECD, 2017).
It seems schools in communities with influential politicians, particularly those in
government in the two states studied, are unduly overly staffed. The secondary schools in
such communities are with too many teachers who end up being redundant. In addition, the
data from the post primary schools management committee shows there are more women
than men teaching in Delta State. Male teachers are 3,786 while females are 8,050. Some
of these women are wives to some prominent names in the state, and they live in the major
cities of the state. These women are not transferred without considering their families.
Therefore, they are not transferred far away from the major cities and towns where their
husbands live in. They are recycled within the cosmopolitan. By this practice, the services
of some female teachers are centralised and concentrated on a particular geographical area.
This creates a subtle vicious circle of uneven teacher distribution that can start a student‘s
mobility to private secondary schools (Jerkins, 2019).
The learners (students) represent the primary consumers of education as a good
which before now was delivered by the Government with intervention from the
missionaries in a systematic evangelism baited with education. Again, in larger
16
communities with few public schools, private schooling thrives as found by (Martinez-
Vazquez and Seaman, 1985 and Hamilton and Macauley, 1991) who averred that in
communities of various populations having comparatively few schools; there is a high
marginal propensity for the emergence of more private schools. Evidence indicates private
enrolments are increased when public schools discourage varying options; consequently,
greater numbers of investors‘ schools provide more exit chances for requesters.
The recent surge of different private schools in the Nigerian education space over
the years has challenged the government (Ajayi, 2006). This has established a healthy and
welcome competition between the Government and private investors. The students now
have a wider choice. Parents who have lost confidence in the state secondary academies
comprise the bulk of private secondary school clientele (Onyedinefu, 2019). In some
public secondary schools, however, teachers appear insufficient for all the subjects offered.
Granted that the learner is helpless without the teacher, and parents' awareness has
increased, the marginal propensity to move their children and wards to private secondary
schools is on the increase.
Each academic year, most principals experience the challenge of student loss to
private secondary schools (Onyedinefu, 2019). There is the perception that there is a high
rate of students‘ mobility in the studied states. Students‘ mobility, also known as
transience or churn, includes any change of school other than grade promotion such as
from the Junior Secondary school for the Senior Secondary School. This may come with a
price. Parents whose wards and children moved schools received the gains and or pains
associated with moving schools. Whether the mobility is voluntary or involuntary, the time
of the term when the move occurs is both crucial and critical and a major determinant of
the effects of the move on the student.
Kolawole (2019) reported students‘ mobility is prevalent with conspicuous
negative influences on both academic and behavioural outcomes for mobile students and
the school. Resolutions to move schools may take its toll on the average child and
adolescent development by distorting the coherence, unity and sequence of established
relationships with the entire school system and re-configuring a student‘s academic
pathway. In most cases, the more obvious and glaring ones show up in test scores and
examination grades. The more devastating consequences are for those who have moved
schools more than once. However, moves to a high-performing school from a low one may
improve students‘ academic performance and take no toll on the moving students.
In Bayelsa State and Delta State, teachers‘ compensation remains an issue. There
are no programmes for attracting and keeping teachers. The pay for a new teacher is not
17
encouraging. A starter pay package of forty-two thousand naira is pathetically inadequate.
On the other hand, a senior teacher in the secondary school system in Bayelsa State and
Delta State on salary grade level 14 step 11 who has devoted 23 years of meritorious
services, receives less than one hundred and forty-five thousand Naira as a monthly salary
based on the approved Teacher Salary Structure of 2019 in Delta State as applicable to
Bayelsa State. Poor salaries do not engage and retain teachers in class.
In Nigeria, teachers' salary is scant and cannot attract and retain excellent hands in
the secondary school system. Teaching seems not attractive to those in the job and to those
coming in to it. In addition, some public secondary school environments in the studied
states are an eye-saw. The situation is terrible for schools in rural and riverine areas. The
school plant and structure are unsightly and dilapidated with sports facilities and
equipment if present in terrible shape. Many secondary schools do not offer boarding
facilities; therefore, they are ‗day schools.‘ Where boarding facilities exist, most of the
structures are dilapidated with not functional libraries and laboratories. When teachers are
transferred to such schools, they do not report for duty and, if they do, they move with the
next transfer (Adamu, 2010).
Also, losing the confidence imposed on government secondary schools on
delivering to the purpose of secondary education by the public in Bayelsa State and Delta
State seems to have increased. The ability to deliver to the purpose of secondary education
explains the quality and quantum of numerous experienced subject teachers present in a
school at a time and how committed to duty they are.
Another reason for teacher retention is how well school principals can manage
teachers and administer the school to discourage teacher transfer. A research report (Peter,
Treves, Shmis, Ambasz and Ustinova, 2019) averred that schools in the rural areas,
especially riverine communities like in Bayelsa State and southern Delta State lack
sufficient infrastructure and experienced teachers for most of the subjects taught. When
teachers are posted or transferred to the rural areas, some do not report on their duty posts.
In preference, they go to the School Board to influence the transfers to schools they choose
to work in. This leaves the rural and riverine schools with inadequate teachers and may
lead students to contemplate moving and to private secondary schools (Luschei and
Chudgar, 2017).
Abumere, Tolorunloju and Sadoh, 2018 and Vignesh, and Sarojini (2018) studies
revealed teachers‘ attrition and transfers can cripple a school. This happens if transfers and
attrition are not followed by the immediate employment and engagement of fresh hands.
Attrition is one of the ways experienced teachers with better qualifications constantly
18
abandon the system. Teachers are critically significant people in the lives of learners and
their families, especially to students in the Junior Secondary School.
When a child‘s teacher leaves either through attrition, transfer or for any other
reason, a range of attendant consequences are frequently experienced. Students may not be
comfortable with the sudden transfer of their teachers (Boniface, 2016). It may mark the
break of the established bonds. Some parents value the intimate relationships children
maintain with their teachers; they are interested in their children‘s responses to teachers‘
absence.
The fear is that some core subjects have no teachers and where teachers are present,
some teachers are low-performing and do not win the confidence of students. This could
lead to students‘ fear of failure and attendant mobility to schools perceived and confirmed
as high performing with adequate staff (Ntamu, 2017). The associated fear is that some of
these students‘ moves follow the phobia of personal intellectual deficiencies, academic
inadequacies and the wish to register for the final examinations in schools where
examination ethics and practices are compromised for guaranteed success (Ntamu, 2017).
It equally appears students‘ mobility is often more urban to rural than otherwise.
The sway of teachers‘ attrition and transfers on students may have been well
examined. The general impact of exceptional rates of teachers‘ attrition and transfers on
the state of general academic well-being of the school and its components such as different
subject areas, staff, students, and the larger community is usually neglected. An extended
period of teachers‘ attrition and incessant transfers can negatively impact school
professional development, class size, scheduling on school routine and ways, not minding
curriculum planning and general staff relationships and other vital, subtle aspects of the
school (Madumere-Obike, Ukala and Nwabueze, 2019). These have the potentials to
distort student learning and start a student move to a private secondary school. Therefore,
there is the need to take teachers‘ attrition and transfer seriously. If teachers‘ attrition and
transfer are not addressed now, it may continue over time to become a complex and
difficult one to resolve.
Statement of the Problem
It is a fact that a piece of the teacher workforce in Bayelsa State and Delta State
experiences attrition and the only way to keep the number of teachers fairly constant is to
keep employing to fill the space created by the teachers who leave. The Bayelsa and Delta
State governments have not employed a new set of teachers for some years now and the
teacher population is in continuous attrition. This has left most schools without teachers in
19
some subject areas. The inadequate number of teachers for the subjects offered in a school
can start students‘ mobility and increase the marginal propensity of students to seek
alternative schools that the private sector readily provides. Outside those that left teaching
through retirement and transfers of service, there are others who left for no stated reasons.
Teachers‘ transfer details in Bayelsa State and Delta State as shown in the transfer
data obtained from the secondary academies management committee indicated transfers
were fewer but massive. These cast doubt on the States owned and operated secondary
schools management committees' position that those transfers are not done haphazardly. In
Delta State, for instance, the secondary schools management committee carried out thirty-
one transfers of teachers affecting 220 principals, 850 teachers and eight (8) Vice
Principals between January 2015 and August 2017. Bayelsa State did less teacher transfer.
A total of 1,498 teachers was transferred between 2015 and 2018. These cast doubts on the
claims of the state secondary schools management board that teachers are transferred
based on needs and fairness in distributing teachers by subjects taught across the state
(Appendix v page 210).
The secondary school management committees claim that upon employment if the
employees cannot show up in the stations posted to, the new teachers risk losing the job
offers. However, youthful teachers would not like to stay in rural and riverine stations.
Besides that, young ladies seem to prefer urban to rural settlements (Wei, 2016).
As regards teachers‘ compensation, teachers‘ salaries or take-home cannot take
them home. Teacher pay is not competitive. The salary is scant, and the prices of
commodities are skyrocketing. Living with a teacher‘s pay is difficult. The salaries are not
attractive. In another development, some argued that demographic variables such as age,
sex, marital status, matrimony and its attendant implications like caring for a child by child
nursing teachers and health status may influence the choice of lace of service which then
starts to make teachers seek transfers.
Students‘ mobility to private secondary schools from public secondary schools is
now common. This suggests a drop in the level of confidence imposed in public secondary
schools. School principals now contend with students moving schools annually and doing
all they can to keep their students. If the public secondary schools have met the needs of
their students, they may not have considered moving. The study seeks to find out if
students‘ mobility to private secondary schools is caused by teachers‘ attrition and
transfers. The problem this study seeks to address is 'do state secondary academy teachers‘
attrition and transfers influence students‘ mobility to private secondary schools?‘
20
Research Questions
These research questions were asked to guide the enquiry.
1. What is the rate of teachers‘ attrition in public secondary schools in Bayelsa and
Delta States?
2. What is the rate of teachers‘ transfer in public secondary schools in Bayelsa and
Delta States?
3. What is the rate of students‘ mobility from the public to private secondary schools in
Bayelsa and Delta States?
4. What is the pattern of students‘ mobility from the public to private secondary schools
in Bayelsa and Delta States?
5. What are the reasons for students‘ mobility from the public to private secondary
schools in Bayelsa and Delta States?
6. What is the relationship between teachers‘ attrition and students‘ mobility from the
public to private secondary schools in Bayelsa and Delta States?
7. What is the relationship between teachers‘ transfers and students‘ mobility from the
public to private secondary schools in Bayelsa and Delta States?
8. What is the relationship between teachers‘ compensation and teachers‘ attrition in
Bayelsa and Delta States?
9. What is the relationship between a teacher‘s age and seeking a transfer in Bayelsa
and Delta States?
10. What is the relationship between a teacher‘s sex and seeking a transfer in Bayelsa
and Delta States?
11. What is the relationship between a teacher‘s marital status and seeking a transfer in
Bayelsa and Delta States?
12. What are the reasons for teachers‘ attrition in public secondary schools in Bayelsa
and Delta States?
13. What are the reasons for teachers‘ transfers in public secondary schools in Bayelsa
and Delta States?
Hypotheses
These following hypotheses were formulated to guide this study.
1. There is no significant relationship between teachers‘ attrition and students‘
mobility from the public to private secondary schools in Bayelsa and Delta States.
2. There is no significant relationship between teachers‘ transfers and students‘
mobility from the public to private secondary schools in Bayelsa and Delta States.
21
3. There is no significant relationship between teachers‘ compensation and teachers‘
attrition in public secondary schools in Bayelsa and Delta States.
4. There is no significant relationship between a public teacher‘s age and seeking a
transfer in Bayelsa and Delta States.
5. There is no significant relationship between teachers‘ gender and seeking transfers
in Bayelsa and Delta States.
6. There is no significant relationship between a teacher‘s marital status and seeking a
transfer in Bayelsa and Delta States.
Purpose of the Study
The purpose of the study is to analyze how teachers‘ attrition and transfer influence
students‘ mobility from the public to private secondary schools in Bayelsa and Delta states
of Nigeria. Specifically, the study seeks to:
1. Determine the rate of teachers‘ attrition in public secondary schools in Bayelsa and
Delta States.
2. Find out the rate of teachers‘ transfers in public secondary schools in Bayelsa and
Delta States.
3. Determine the rate of students‘ mobility from the public to private secondary
schools in Bayelsa and Delta States.
4. Find out the pattern of students‘ mobility from the public to private secondary
schools in Bayelsa and Delta States.
5. Find out the reasons for students‘ mobility from the public to private secondary
schools in Bayelsa and Delta States.
6. Find out the relationship between teachers‘ attrition and students‘ mobility from the
public to private secondary schools in Bayelsa and Delta States.
7. Establish the relationship between teachers‘ transfers and students‘ mobility from
the public to private secondary schools in Bayelsa and Delta States.
8. Find out the relationship between teachers‘ compensation and teachers‘ attrition
among public secondary school teachers in Bayelsa and Delta States.
9. Determine the relationship between teacher age and seeking a transfer among
secondary school teachers in Bayelsa and Delta States.
10. Establish the relationship between a teacher‘s sex and seeking a transfer among
secondary school teachers in Bayelsa and Delta States.
11. Determine the relationship between teacher marital status and seeking a transfer
among secondary school teachers in Bayelsa and Delta States.
22
12. Find out the reasons for teachers‘ attrition in public secondary schools in Bayelsa
and Delta States.
13. Determine the reasons for teachers‘ transfers in public secondary schools in
Bayelsa and Delta States.
Significance of the Study
The outcome of this study shall be of benefit to the Federal and State Governments,
Ministries, Boards and Departments of Education. Given the importance of teachers to the
education system that values stability, it is necessary and important that data on teachers‘
attrition, transfer, and students‘ mobility to private secondary be collected and analyzed by
the Federal, State and Local Governments to include State Ministries of Education and the
Post Primary Education Management Committees for inclusion in policy development
because the teachers‘ attrition, transfer and students‘ mobility form part of a complex
teacher staffing issues that need attention from education managers and policymakers.
It shall enable the Federal, State and Local Governments; State Ministries of
Education and the Post Primary Schools Management Board in the Nigeria education
system to maintain exact knowledge of the rate of teachers‘ attrition in Bayelsa State and
Delta State to solve teachers‘ attrition problems and make sure teachers are kept in the
state secondary school systems. In this light, the importance of timely teacher staffing of a
school, retention and development through improved working conditions may reduce the
rate of teachers‘ attrition considerably. Precisely, this research may aid administrators and
policymakers in keeping experienced teachers in classrooms to improve student retention
and achievement.
It will help the secondary schools management Boards to appreciate the rate and
effect of teachers‘ transfers on the system. This will help school boards to avoid the
practice of draining one school of teachers to fill another in the form of incessant mass
transfer of teachers. With this, education administrators and policymakers will have to set
up the rule of considering a teacher‘s data before approving any transfer to prevent uneven
teacher distribution and the drift of public secondary school students to private secondary
schools. This will keep up a balance in teachers‘ distribution and allocation in the state and
as well help to cut students‘ mobility.
This study also hopes to sensitise other employers of labour such as the public and
private sectors to release their transfers as at when secondary schools vacate at the end of
the term or session so that the effect on parents, children and wards are cushioned.
The study shall provide the rate of students‘ mobility to private secondary schools.
The outcomes of the study will spur public secondary school managers, administrators,
23
and stakeholders to formulate practical recommendations that will assist stakeholders in
identifying management and institutional causes of students‘ mobility to private secondary
schools and help to formulate measures and policies that will remedy the situation.
It will capture and draw the attention of the Post Primary Schools Management
Committees to the pattern of students‘ mobility to private secondary schools. With such
data available to education managers, they will be propelled to adopt proactive measures
for reducing public secondary school students‘ mobility, thereby increasing students‘
retention in the state secondary academies.
To the government, it shall highlight and emphasise the need to regularly recruit
teachers; underplay frequent teacher transfer, start teacher retention programmes and
improve teachers‘ welfare. By that, the teachers, students, government and the public will
benefit, and that will help to cut down the problem of teachers‘ attrition in the public
secondary schools and the attendant problem of students‘ mobility by maintaining and
sustaining a robust number of students in state secondary academies.
It shall guide the board on teacher transfers regarding teachers‘ age, sex, marital
status and location of the workplace. Also, the fear that the state government stands to lose
confidence in the state university as the state government's research arm for not foreseeing
and notifying the government of the problem of students‘ mobility to private secondary
schools coming and for not directing government focus on it on time would have been
eliminated.
To the above effect, the State University stands to justify and exonerate itself from
blames that could arise from the state government‘s university not seeing it coming and to
have sensitized and notified the state government and also made recommendations to the
government on the way forward on the problem of teacher transfer, attrition and students‘
mobility to private secondary schools.
Ultimately, students stand to gain from the study as it will lead to improvement and
maintenance of teachers in classes: Higher performance and retention of teachers and
students in schools. This is because the state governments are expected to implement the
recommendations which are supposed to reduce teachers‘ attrition, transfer and students‘
mobility.
Scope and Delimitation of the Study
The scope of this study encompassed teachers‘ attrition, transfer of teachers and
movement of students from the state to private secondary schools. It covered the 5,869
public secondary school teachers who left the system, 641 serving public secondary school
24
principals, and 6236 private secondary school students who moved from the state to
private secondary schools between 2015 and 2019. The following variables; the rate of
teachers‘ attrition and transfers, the relationship between teachers transfer within the
public secondary school system, the pattern of students‘ mobility among secondary school
students and students‘ mobility to private secondary schools. Others are compensation and
keeping of teachers in schools; the rate of students‘ mobility in public secondary schools
and teachers‘ demography and seeking transfers by state secondary school teachers. The
study is delimited to Bayelsa and Delta States of Nigeria.
Operational Definition of Terms
The following terms are defined as used in this study.
Teachers‘ Attrition: The loss of teachers from the teaching occupation.
Teachers‘ Attrition Rate: The frequency of loss of teachers from the teaching occupation.
Teachers‘ Transfer: The official movement of a teacher from one school to another by the
school board.
Teachers Retention: Remaining as a teacher.
Students‘ Mobility: Moving from one school to another to continue a student‘s education.
Students‘ Retention: A school‘s capability to admit and keep students.
Students‘ Mobility Rate: The percentage of students who change schools when the school
programme at a particular school is still running.
Pattern of students‘ mobility: The classes and terms the students move schools in.
Public Secondary School: State-owned and operated secondary academies.
Private Secondary School: Private investors‘ secondary academies.
Rural Secondary School: A secondary school in a small town or village.
Urban Secondary Schools: Secondary Schools in towns and cities.
Suburban Secondary Schools: Secondary Schools in places that are midway between rural
and urban.
Teachers‘ Compensation: The salary and other benefits a teacher gets for teaching from the
employer.
25
CHAPTER TWO
REVIEW OF RELATED LITERATURE
The concern of this chapter is basically the review of related literature. This study
will The concern of this chapter is basically the review of related literature. This study will
investigate teachers‘ attrition, transfer and students‘ mobility between state and investors
secondary academies in Bayelsa State and Delta State of Nigeria. The researcher will
review the related literature with a focus on the following areas.
Theoretical Framework
Relevance of the Theory to the Study
Teachers‘ attrition in public secondary schools
The Rate of Teachers‘ attrition
The Rate of Teachers‘ Transfer
Teachers‘ Transfers and Students‘ Mobility from the Public to Private Secondary Schools
The Rate of Students‘ Mobility from the Public to Private Secondary Schools
Reasons for students‘ mobility from the public to private secondary schools
The Influence of Teachers‘ Demographic Factors: Age, Sex and Marital Status on Transfer
The Pattern of Students‘ mobility between Public and Private Secondary Schools
Reasons for students‘ mobility from the public to Private Secondary Schools
The Influence of teachers‘ demographic factors: Age, sex and marital status on Teachers‘
Transfers
Teachers‘ attrition, Transfer and Students Mobility to Private Secondary Schools
Teachers‘ compensation and Attrition
Reasons for Teachers‘ attrition
Reasons for Teachers‘ Transfer
Theoretical Framework
This study is premised on the Reasoned Action theory postulated by Fishbein and
Ajzen (1975). The theory proposes people undergo a causal chain of using their
knowledge, attitudes, beliefs, and intentions to arrive at a particular decision and action.
The theory is concerned with explaining the interconnection between attitudes and
behaviours within the confines of human activity. The Reasoned Action theory predicts
individual subsequent behaviours based on their earlier attitudes and behavioural
intentions. Reasoned Action theory believes that an individual's resolution to undertake a
26
specific behaviour (like teaching) is a function of the attendant result hoped for by
performing the behaviour (teaching).
Relevance of the Theory to the Study
The theory maintains that the rational person uses his or her knowledge, attitudes,
beliefs, and intentions to arrive at a particular decision to take to teaching, for instance, as
a job based on the individual‘s expected outcome (the ability of the teaching job to meet
his or her needs). If the job cannot provide for the teacher‘s needs in the form of poor and
irregular salaries, delayed promotions as against expected regular promotions, the teacher
may resign from the job if there is an alternative. This is the point of teachers‘ attrition.
It is the wish of most workers to serve and live in a place that provides them with
reference to the quality of environment defined by social amenities, worth and standard of
education present and desired for their children and wards. Where the aforementioned is
available, the teacher will definitely stay in that place and school and if otherwise, the
teacher will seek a transfer elsewhere. This is the point of teacher transfer.
Equally, parents will agree with their children and wards remaining at a school
based on their anticipated outcome (enough teachers in all subjects and increased students‘
academic performance). As long as these needs are met, parents will keep their children
and wards (the students) at the school. If the school cannot meet the needs of the parents to
a worrying level, the parents are likely to withdraw their children and wards to other
schools. This is the point of students‘ mobility to other schools. Moreover, a similar
condition applies to students. It is the wish of every student to study at a school with
qualified and experienced teachers who work hard delivering interesting lessons. As long
as this condition prevails, the students will stay at that school; however, if the reverse is
the case, the marginal propensity to move becomes exceptionally high, and it starts the
process of moving.
Teachers’ Attrition in Public Secondary Schools
There are mixed reports on the concept of employee attrition and employee
turnover (Risannen, 2017). While some researchers regard the two concepts as the same
and apply them interchangeably (Carver-Thomas and Darling-Harmond, 2017) others
recognize a distinction. The study (Kaur and Vijay, 2016) averred that ‗attrition stands for
a slow and piecemeal decrease in the workforce without sacking, exemplified as in when
workers resign or retire and are not replaced. Attrition is defined by the business dictionary
online as ‗the unpredictable and uncontrollable but normal reduction in workforce for
resignation, retirement, sickness or death.
27
It is a gradual but deliberate reduction in staff numbers that occur as employees
retire or resign and are not replaced. Employee attrition represents the reduction of staff for
voluntary or involuntary reasons. These may be through formal means like retirement,
resignation, termination of the contract or when an organisation declares a position
redundant. Attrition describes a situation wherein a teacher is transferred within the state
public school system and the teacher is not replaced (referred to as ―attrition‖) as opposed
to those who transfer to another location within the state and are replaced (referred to as
―transfer‖).
Attrition remains one of the ways an organisation can decrease labour costs. To this
effect, the organisation awaits its employees to leave at retirement and freezes hiring.
Waiting for attrition naturally is usually better for an organisation‘s morale. It may also
negatively influence the employees that remain if they transfer the duties of the eliminated
positions to them with no pay increase. It can also limit promotions within the organisation
if they cut these jobs, which can cause further attrition and transfer (Kaur and Vijay,
2016).
Attrition means an employee resigning from his or her current job without being
replaced. Attrition occurs when an employee‘s expectations in return for services provided
or given to an organisation are not satisfactory. It may be employee initiated or otherwise.
The workload, salary package, allowances, and job input or performance are determining
and indicative indices of employees quit (Mabaso and Dlamini, 2017). Changes in
management style, organisation structure, or other aspects of the organisation might cause
employees to leave the organisation voluntarily, resulting in a higher attrition rate
(Bahtilla, 2018). Another cause of attrition is the absolute elimination of a job position
from an organisation.
Mabaso and Dlamini (2017) study ‗Impact of compensation and benefits on job
satisfaction,‘ used an empirical probe method approach to investigate the connection
between rewards and talent enticement and hold back with a sample of 279 teachers. The
study reported that whatever may be the reasons for leaving a job, if the vacancy is filled,
there is no job attrition. This can occur when employees relinquish their current positions
for other jobs, leave the workforce entirely, or retire. The reasons for leaving an
organisation may vary from personal reasons, such as desiring career advancement or
moving to another community, organisation-based reasons, such as an undesirable change
in organisation structure or management.
Attrition represents a drop in the worker population caused by retirement or
resignation, without plans to replace that vacant job position. One way to protest low
28
wages is a strike, and the other option is to quit. The marginal propensity for core subject
teachers to transfer or job quit is higher than that of other teachers as reported by the study
of (Darling-Hammond, Furger, Shields and Sutcher, 2016) ‗Addressing California‘s
emerging teacher shortage: An analysis of sources and solutions.‘ Core subjects are often
taught with fewer teachers across the country. The concept of attrition is reductive in
strength, which is likely the reason it has a negative connotation, even when it can have
beneficial outcomes.
While low attrition rates may be tolerated, high attrition values exert devastating
and intolerable effects on the system considering the fact that timely employment and high
retention of employees seem the only formidable remedy to teachers‘ attrition. Teachers‘
attrition rate ‗is a calculation of the number of persons that vacate or move out of a larger,
collective group of teachers over a specified time frame. Attrition rates vary and are likely
to vary over time because of its propelling endemic dynamics. Delta State Government
through the secondary schools management Board mass-employed teachers last in the year
2010 but has since then lost over 3,346 teachers to attrition based on data provided by the
Board while Bayelsa State Government through the Post Primary schools Board last
employed teachers in the year 2009 and has since then lost some 2,658 teachers to attrition
and the two states have not employed.
The problem of inadequate teacher workforce is universal. In California, the
teachers‘ shortage compounded three folds in the last three years. In 2014–15, some seven
thousand seven hundred teachers who were not ready to teach were certified. This is just
over one-third of the credentials and permits issued that year. They went to teachers who
were not fully ready for their teaching assignments (Darling-Hammond, Furger, Shields
and Sutcher, 2016). The situation in Arizona is not contrary. Some 62% of school district
teacher posts were advertised three months after school years had started between 2013
and 14 (Educator Recruitment and Retention Task Force, 2015). Within this period, many
teachers were engaged as substitutes. Up to 29% increase from the previous year (Educator
Recruitment and Retention Task Force, 2015). The study of (Nix, 2016) found that in
Oklahoma, imbalances in supply and demand in the southern half of the state have caused
a tenfold increase in the number of emergency credentials issued to under-prepared
teachers, from 98 in 2010–11 to over 900 by 2015–16.
Kaur and Vijay (2016) reported that keeping a workforce is comparatively more
economical than recruiting new employees. Organisations must retain more than they hire
or employ to keep the remaining employees. Retention management is retaining the
existing staff, specifically the competent and talented ones and to encourage others to enter
29
the organisation. High attrition leads to increase costs to the organisation. Therefore, the
managers of an organisation should either maintain a proper policy to retain the employees
or plan the exit to prevent the loss that occurs due to attrition. Through attrition, people are
not merely leaving the organisation but are equally taking the company resources in the
form of expenses incurred in recruiting and the training provided to them; the knowledge
they have gained, time and many more. The high attrition rates affect the productivity of
the organisation. Therefore, it is essential to control attrition, not only for one organisation
but also for the entire industry.
Ayşegül, Dilek, Hava, Melahat, Salih, Murat and Kamile (2018) study ‗Evaluation
of Employee Exit Rates and Leaving Reasons for Nurses Working in the Intensive Care
Units‘ reported resignation of an employee with high work performance to represent a
disadvantageous situation for the organisation. Even if a new employee has replaced the
retired, time is required for the current employee to get used to the work environment and
carry out the job at the same pace as the disengaged. The study found equally that in
Norway organisational and contextual factors, including dissatisfaction with the job, exert
much influence on beginning secondary school teachers‘ intentions to remain in the
profession.
The same is true of Australia, where (Burke, Schuck, Aubusson, Buchanan,
Louviere and Prescott, 2013) study titled ‗Why do new teachers remain in the profession?‘
Using best–Worst scaling to quantify key factors found similar results except for
developing countries like Namibia and Nigeria where the nexus between job contentment
and resignation is extraordinarily significant. Similarly (Janik and Rothmann, 2015)
examined the interrelatedness between job contentment and attrition similar to the research
on dissatisfaction and job resignation in Latin America by (Weinstein, 2016 and Ramirez
and Viteri, 2016) who sourced information and relied on data obtained from a Latin
American across nations study by (TERCE) and conducted under the control of the Latin
American Laboratory for Assessing of Education Quality (LLECE). They descriptively
examined the variables related to teachers‘ satisfaction with their jobs. They reported high
teachers‘ satisfaction with their profession, but not with their salaries.
Madero (2019) study ‗Secondary teacher‘s dissatisfaction with the teaching
profession in Latin America: The case of Brazil, Chile and Mexico. The descriptive and
comparative study analyzed teachers‘ dissatisfaction with their profession in Chile, Brazil,
and Mexico with 10,846 sampled respondents. Data from the 2013 International Survey of
teaching and learning (TALIS) and multiple logistic regression analyses were used. It was
discovered that Mexico has the least number of unsatisfied teachers compared to Brazil
30
and Chile. That teacher cooperation and culture of participation in the school are key
characteristics associated with fewer unsatisfied teachers.
These results are dissonant with the scarce literature available. They do not indicate
a variation among the three countries in the studies by (Weinstein, 2016; Ramirez and
Viteri, 2016). The study did not apply the specific variables Madero used in the 2019
study. Both studies found no germane discrepancy among Mexican, Chilean and Brazilian
teachers on the general satisfaction of teachers (Ramirez and Viteri, 2016) and salaries
(Weinstein, 2016).
It is understood from the study of (Mizala and Ñopo, 2016) entitled ‗How much are
teachers receiving compared to other professionals in Latin America? Is teachers‘
underpayment more pronounced in certain segments of the labour markets?‘ The study
employed data for thirteen countries of Latin America. The analysis revealed that
dissatisfaction propensity with teaching follows the order of how different teachers
compared their salaries they earn to other professions in their countries. There has been a
fall in the earnings gap over the decade attributed to a general trend in gap reduction and
not because of teachers‘ improvements in their observable characteristics and the salary
differentials revealed an important heterogeneity across countries and along with the
earnings distributions. Moreover, Mexico remains the country where those differences are
the lowest, followed by Chile, and then Brazil.
Swati and Archana (2019) study entitled ‗Role of organisational reputation in
employee engagement and performance‘ and Gore, Lloyd, Smith, Bowe, Ellis and Lubans
(2019) study ‗Effects of professional development on the quality of teaching: Results from
a randomized test of Quality Teaching Rounds‘ asserted that dissatisfaction and the
intention to abandon teaching has its roots in both extrinsic and intrinsic elements of the
academic system. However, of them all, salary, safety, perceived support from school
principals, chances of professional development, healthy school culture and adequate
school resources remain the core elements. Intrinsic elements include classroom activities,
student characteristics and teacher control over the class.
Mkheimer and Mjlae (2020) study entitled ‗Factors of Employee Engagement and
Organisational Development: Are They Linked?‘ The enquiry probed the nexus between
employee commitment features and the organization development on the one hand and
growth on the other hand with a view to ascertain that employee engagement factors
impact organisational development. The study sampled 250 firms‘ employees representing
different private firms operating in the industrial zone of Sahab City, Jordan. Pearson
correlation, linear regression and Confirmatory Factor Analysis, CFA, were used to test the
31
relationships among the variables. The results showed that the factors of engagement
implemented in the organisations yielded a significant level of growth and development
and that there was a remarkable interconnection between workers‘ involvement and
commitment factors and organisational advancement and progress.
In a bid to identify the factors of workers commitment and its interconnection with
the emotive perpetuity to employee engagement and its association with the affective,
continuance and normative modules of organisational commitment among Indian ship
officers (Rameshkumar, 2020) investigated the correlation if any, between work and
organisational engagement variables with three aspects of organisational commitment:
Employee productivity, involvement and rivalry advantage. The study confirmed workers‘
involvement is remarkably interrelated with emotive and normative aspects whereas
engagement is not considerably tied to the continuance aspect of organisational
involvement which indicates a contradictory outcome from existing reports that perpetual
involvement has reported a remarkable incompatibility with engagement.
McInerney, King, Marsh, Ganotice and Morin (2015) had similar findings with
(Ávalos and Valenzuela, 2016) study ‗Education for all, attrition and retention of new
teachers: A Trajectory study in Chile revealed that teacher characteristics count in teacher
stay in schools. The study used interviews, surveys, narratives and econometric analyses of
existing databases. The report averred that dissatisfaction was in teachers‘ demographic
factors like sex and career stage. The study was consistent with the reports from the ten-
year analysis of teacher discount studies and job satisfaction in Chile. It concluded that job
satisfaction was a function of school characteristics spelled out in school culture and
climate. Also (Fuller, Pandola and Young, 2018) policy brief and (Aeschlimann, Herzog
and Sander, 2019) reports are in line with the study of (McInerney et al., 2015).
In Latin America (Farrelly, 2016) has found that the lack of recognition of teachers
was one of the core elements that contribute to teacher dissatisfaction. Similarly (Yousef,
2016) work on how teachers are less committed to the teaching profession and become
dissatisfied with their work. The probe reported job dissatisfaction was one reason next to
low esteem and regards most cited for attrition and attrition intent.
Klimek (2019) study on teacher esteem, status, job prestige and the teacher
discount investigated 1,127 undergraduate perceptions of teachers‘ self-esteem, prestige
and status in the USA with 302 senior teacher trainees and 825 education undergraduates.
The analysis revealed that U.S. teacher trainees and education undergraduate perceptions
of teaching‘s fiscal part of prestige were negative compared to their status. Correlations
and regression analysis revealed that the perceptions of teachers‘ status support
32
considering careers in teaching. However, the perceptions of esteem yielded a contrary
effect. The analysis shows that the perceptions of teachers‘ esteem may not inspire
teachers to consider teaching.
A recent study in Nigeria (Ajayi and Olatunji, 2019) entitled ‗Turnover causation
among secondary school teachers used regression modeling and t-test to analyze 96
causation factors of a teacher quit. The research shows that dissatisfaction among Nigeria
teachers was a major quit factor. Next to job dissatisfaction was personal health issues.
That aside, work and family life conflict and the attendant desire to quit teaching for
better-paying jobs were prominent among the issues that triggered the intention of
Nigerian secondary school teachers to resign their jobs voluntarily.
Kafumbu (2019) study ‗Job Satisfaction and Teacher Quit Intention in Malawi: A
quantitative assessment‘ sought the nexus between differential levels of job contentment
with quit intent among teachers with the purpose of widening the knowledge base as
regards teachers‘ welfare in state secondary academies in Malawi. The study used a
sample of 120 secondary school teachers and correlation analysis. The report concluded
that some teachers possessed an average level of satisfaction with their work. That
satisfaction with the job, among teachers, was also related to their intentions to quit and
that demographics count and largely influences attrition except for school type. This is
consistent with the report of (Tshukudu, 2020) entitled ‗Employee Engagement and Staff
Turnover and Its Implication on the Organizational Performance: Case of AON
Botswana.‘
Johnson, Nguyen, Geoth, and White (2018) study ‗Workplace aggression and
organisational effectiveness: The mediating role of employee engagement probed the link
between the high rate of workplace aggression, and employee engagement and
organisational effectiveness. Based on social capital theory, the enquiry proposes that the
extent of employee engagement in the organisation which seems missing in the teaching
profession accounts for the connection between workplace aggression and organisational
effectiveness. Using secondary survey data and data from 101 hospitals in NSW,
Australia; the enquiry reported that employee engagement represented a vital mechanism
that helped explain these effects. These findings underscore the inherent merits of
management practices and policies aimed at stopping workplace aggression and support
greater employee engagement.
Another study, Perangin-Angin, Lumbanraja and Absah (2020) entitled ‗The effect
of quality of work-life and work engagement on employee performance with job
satisfaction as an intervening variable,‘ sought to the influence of quality of work-life and
33
work engagement on employee performance with job satisfaction as an intervening
variable. The researcher used the path analysis method to ascertain the influence of each
variable to be studied on 70 respondents. The results indicated the quality of work-life
exerted a beneficial and remarkable influence on job contentment; quality of work-life
exerts a favourable and considerable effect on workers performance; work engagement has
a positive and significant effect on employee performance, and quality of work-life has a
positive and significant effect on job satisfaction.
The studies of (McInerney, King, Ganotice, and Morin Marsh, 2015; Tiplic,
Brandmo and Elstad, 2015 and Aeschlimann, Herzog and Sander, 2019) reported
collaboration between teachers and a culture of participation in the school activities are
key characteristics linked with stopping teachers from being dissatisfied with teaching.
With all three countries, it is vital to support policies that favour intrinsic and extrinsic
conditions linked to job satisfaction, as it is in Brazil where there was a decrease by 27%
of teachers when the school is perceived to be collaborative and participative.
In line with what the literature shows (Geiger and Pivovarova, 2018) study used
three years of Arizona public schools‘ teachers‘ keep data, qualitative and quantitative
working conditions survey facts to find the relationship among the pattern of attrition,
perceived service conditions at schools and the characteristics of the school they were
posted to serve in. The study found that the overwhelming workload, poor pays and
remunerations, low standards of teachers training programs, principals‘ leadership and
poor working conditions were the main factors.
Contrary to the aforesaid (Madero, 2019), in a study that did not associate the
extrinsic condition of work overload with dissatisfaction with teaching, found there was a
high level of work overload in the three countries (Brazil, Mexico and Chile). Participation
and collaboration among teachers seem to count more than the work overload in Mexico,
Chile and Brazil. However, the work overload has grown into an alarming proportion that
policies should note or consider it. Having extended hours in a class is linked to other vital
factors related to the life of the school organisation.
Madero (2019) study ‗Secondary teacher‘s dissatisfaction with the teaching
profession in Latin America: The case of Brazil, Chile, and Mexico,‘ did a comparative
and descriptive analysis of teachers dissatisfaction with teaching, with 10,846 sample and
data from the 2013 TALIS survey to ascertain if intrinsic and extrinsic school organisation
elements in teachers personal characteristics are linked with their satisfaction. A simple
logic regression analysis showed that the conditions for staying in teaching are situational,
professional and personal factors.
34
In support of the above (Grissom and Bartanen, 2018) study ‗Strategic retention:
Principal effectiveness and the teacher quit in multiple-measure of teacher evaluation
systems,‘ examined strategic teacher keeping factors with longitudinal information from
Tennessee. Analysis of differential effectiveness between principals and teachers was
carried out. The result revealed that principal effectiveness is connected to low teacher
exit. However, principals are advised not to target every teacher in the bid to keep teachers
in school. Instead, principals should influence the components of their schools strategically
by keeping the hardworking teachers and retrenching low performers. On average, more
effective principals experience insignificant rates of teacher quit.
Similarly, Maxwell, Reynolds, Lee, Subasic and Bromhead (2017) study titled ‗the
impact of school climate and school identification on academic achievement: Multilevel
modeling with student and teacher data.‘ Integrated multiple sources into a multilevel
model of self-reports of staff and school academic records, students and socio-economic
demographics using the socio-identity approach. The national numerical and literacy tests
were conducted to assess the performance of 760 staff and 2,257 students sampled from 17
secondary schools. The link between achievement and school climate was probed. The
predictions revealed among others that some students perceive school climate as the
determinant of achievement, and this is moderated by students' psychological identification
with the school. The school climate is linked to the leadership pattern and administrative
format of the school principal.
Dulay and Karadağ (2017) study on school climate influence on students‘ academic
outcomes performed a meta-analysis of 90 enquiries of a comprehensive range of reviewed
related literature with a sample of 148,504. The analysis indicated model schools‘ climate
had a moderate-level positive influence on a student‘s achievement, and the school climate
is determined by the leadership of the principal (Horton, 2018). That employee
engagement brings about increased performance, and output is not arguable. A school
climate that does not support students‘ retention leads students to move to private
secondary schools.
The administration provided by the school principal counts (Sitienei, Koech, and
Cheboi, 2018) study entitled ‗An Empirical Analysis of Employee Engagement on
Employee Performance in Technical Institutions in Kenya.‘ The study adopted a
regression model to investigate how employee engagement influences employee
productivity. The finding shows that there is a beneficial and marked nexus between
workers involvement and workers‘ productivity. Engaged teachers are bound to perform
above board and impede students‘ mobility to other schools.
35
Principals are indispensable in teachers retention as reported by the study of
(Murrtedjo and Suharningsih, 2018) entitled ‗The role of principals in optimizing school
climate in primary schools.‘ The study of (Holme, Jabbar, Germain, and Dinning, 2018)
entitled ‗Rethinking Teacher Turnover: Longitudinal Measures of Instability in Schools‘
and (Richards, Hemphill and Templin, 2018) study entitled ‗Personal and contextual
factors related to teachers‘ experience with stress and burnout,‘ found that there is one
reason for leaving that stand out above all other reasons; dissatisfaction with the
profession. The relationship between absolute absence and inadequate satisfaction and
leaving the profession has been studied elsewhere (Kraft, Marinell and Yee, 2016). Also
(Marinell and Yee, 2016) finding supports dissatisfaction with the profession as the
primary quit factor.
Ryan, von Der, Pendergast, Saeki, Segool and Schwing (2017) study probed the
relationship between quit intention and test-based accountability policy, teacher test stress
and burnout intentions,‘ controlled for teacher service years with data from 1,866 teachers.
The investigation showed accountability predicted significantly higher test-stress, attrition
and burnout. Greater teacher experience was significantly linked to a lower teacher
transition between schools. The findings showed across several states that greater teacher
resignation intent and a higher teacher stress level are a function of the policy of
accountability. The study established the link between test accountability practice, teacher
test stress and burnout and quit intents with data-structural equation models. They reported
that test accountability policies may account for the greater teacher resignation intent and
greater stress records.
Similar results were reported by a study (Ravalier, 2018) entitled ‗The influence of
worker engagement in social workers in England‘ examined a section of English social
work unit staff engagement levels using Utrecht Work Engagement Scale to analyze the
perceived stress scale and single-item measures of job satisfaction, quit intent and
engagement. The findings included that better-engaged social workers had lower stress and
quit intentions; less presence at the workplace for more hours than required and higher
records of job satisfaction. There were perceived stress and exit intentions where employee
engagement was exceptionally low.
Human capital represents a critical success factor for organisations (Rodríguez-
Sánchez, González-Torres, Montero-Navarro and Gallego-Losada, 2020) study aimed at
attracting and retaining the most talented workers to obtain the anticipated results used an
integrated model of work life balance strategies, including various policies influence and
practices on keeping exceptional Human Resource which can constitute a basis for further
36
academic developments on this subject, and a roadmap for managers analyze a case study
carried out in multinational organisations. The study found that organisations that fail to
recognise, attract, retain and reward their talented workers stand the chance of losing them.
Satisfied and dissatisfied teachers enjoy or endure for a long time, either staying in
the same school or moving from one school to another. Also, satisfied and dissatisfied
teachers either leave their service station or the service. What is relevant for the study of
teachers‘ dissatisfaction with their profession is to understand the factors connected to the
dissatisfaction; insofar that dissatisfaction is related to quit and keep process (Yee, Kraft
and Marinell, 2016).
Kini, Tara and Podolsky (2016) study entitled ‗Does teaching experience enhance
teacher efficacy? A review of the research reported a shortage of teachers to harm students,
teachers and the public education system. There is teacher inadequacy. Those on the
ground are unmotivated. Unlicensed teaching, none teaching staff and staff instability
combine to threaten the students‘ effective learning. This undermines and reduces teacher
effectiveness. The high teacher quit consumes financial resources that could find better
alternatives elsewhere. One of the problems facing learning and teaching is the low
number of teachers in schools. This affects creating concrete integrity for teachers and
professionalizing teaching. This further contributes to perpetuate the shortage.
After attrition, the rest of the teachers are unequally and unevenly posted and
transferred among students of differential socioeconomic class, disposition and challenges.
The nation‘s education is unified with a common curriculum system. The goal of giving
qualitative education equitably to all learners as reported by (Kini, Tara and Podolsky,
2016; Ladd and Sorensen, 2016; Sorensen and Ladd, 2018 and García and Weiss, 2019)
lies in the proper and equitable distribution of teachers. The teacher shortage exerts
adverse consequences. Inadequate teachers remain a potential threat to the learners.
The literature has shown the practice of attrition is of no significant advantage to
organisations whether a school or a business firm except that it affords younger skills and
talents, the opportunities for recognition and self-expression.
The Rates of Teachers’ Attrition
Attrition describes ‗the number of teachers at a specific education system and or a
sub-system leaving teaching in a year expressed over a hundred (UNESCO Institute of
Statistics, 2019).‘ It may be described as the intractable and incalculable but normal
dwindles in the workforce due to resignations, retirement, sickness or death. Teacher quit
rate represents the frequency of a teacher quit expressed as a percentage of the sum of
37
teachers in the system by year (Schreiner, 2017). While the sum of the teachers by the
percentage who leave the teaching board and are then replaced by new teachers. In simpler
terms, turnover among employees is the act of providing a replacement for a worker who
has left the organisation (Bhasin, 2018). This definition describes what happens when the
school boards transfer teachers and send other teachers to fill vacancies created by such
transfers.
The rate of teachers‘ attrition has become an issue to state education stakeholders.
This has attracted a series of research in both first and third world nations. As an example,
a research study carried out in four of the United States (Meyer et al., 2019) namely
Colorado, Missouri, Nebraska and South Dakota titled ‗Teacher retention, mobility, and
attrition in Colorado, Missouri, Nebraska, and South Dakota,‘ reported that 12% of public
teachers left classroom teaching positions in the same school. However, the study did not
find any difference in attrition rates between teachers of schools located outside town and
cities and those in towns and cities. The enquiry recorded a marked discrepancy in attrition
rate figures across districts within states.
Meyer et al (2019) reported some of the teachers transferred in the same district
while the other half left their districts. Between 2015 and 2017, some 82 percent of
teachers in Missouri, Colorado, South Dakota and Nebraska did not change schools. Only
eight (8) were transferred to other schools as teachers within and outside the districts and
10% of the teachers out rightly quitted their jobs and profession (Meyer et al 2019). The
centre for education statistics school and staffing survey carried out between 2011 and
2014 for the entire USA found teachers‘ attrition rate of 24% annually in Arizona and an
alarming 23% in New Mexico. These attrition readings tapered to an end steadily
diminishing to 10% recorded in the state of Utah. While there might be a concatenation of
reasons for exiting the teaching profession, over 20% of those that leave, cite meagre
salaries as the greatest push reason (Learning Policy Institute, 2014).
From the Education and Training monitor (2019) it was clear Denmark had her fair
share of teachers‘ attrition, shortage and class size swell challenges. About 45% of lower
secondary teachers are 50 or older. Teacher numbers underwent a chronic shortage
between 2009 and 2018, dropped by 11.8% more sharply than the concurrent reduction in
pupil numbers of 7% (Danmarks Lærerforening, 2018). The national teachers‘ inadequacy
is made obvious by the surge in average sizes of classrooms in primary and secondary
schools between 2005 and 2016 respectively by 10% and 9% to 21% pupils per class
(OECD, 2018a). The needs to enthrall teachers among other reasons have driven several
employers to enter their own memorandum of understandings with teachers‘ unions.
38
Unions have now ceded parts of their salaries and can now be negotiated with each trade
union and schools. This has resulted in differentials between schools and regional
authorities paying varying salaries (Representative, 2019).
According to Sutcher, Darling-Hammond and Carver-Thomas (2019), many have
cast doubt on whether or not the growing teacher scarcity exists (e.g., Aldeman, 2016;
Antonucci, 2016). However, life pointers show convincing proof of macro teacher
shortages. States reported shortages in certain subject teachers and most are resorting to
engaging low-quality academics. No fewer than 40 states reported shortages in several
alternative fields like mathematics, science and special education. Also, there are over 30
reports of shortages in a number of other fields ranging from career technical education to
bilingual education (U.S. Department of Education Office of Postsecondary Education,
2017).
Adnot, Katz, Dee and Wyckoff (2017) ‗Teacher turnover, teacher quality and
student achievement research‘ found that high transfer among teachers in public school
classrooms undermines school stability, serves as an impediment to academic reform and
hurts student achievement. A Carnegie Foundation for the Advancement of Teaching study
on new classroom teachers titled ―What the dynamic demographics of teaching are for
schools, students and the society‖ (Headden, 2014) averred that new teachers exit in
massive numbers as a result of the light career development they receive, poor emotional
backing and performance report. The study concluded that between 1988 and 2008,
teacher exit rates grew exponentially to 41 percent. In many urban school districts, over
half of the currently employed teachers exited within five years.
In 2016-17, more than two-thirds of surveyed districts (69%) reported not having
enough candidates for open positions as ―a big challenge.‖ This was more than double the
rate from the 2013-14 survey by the American Association for Employment in Education
(AAEE, 2017). School districts contending with the challenge of qualified, certified
teachers have troubles filling vacant positions, a sign of labour market imbalances in those
fields or locations is confirmed.
Based on the aforementioned, it is cognitive to conclude that the teacher's
resignation is place-specific. The Swedish case is, however, not an exception. In Sweden
(Lindqvist, Nordanger and Carlsson, 2014a) study based on a longitudinal examination of
87 Swedish teachers' career trajectories with a comparison between quantitative and
qualitative data within the cohort related the same to the general statistics on teacher exit.
The analysis showed teachers‘ attrition was more non-linear and intricate than what is
typically supposed; individuals do not merely leave, but also shuttle the profession over
39
time and their out-of-school experiences may be interpreted as personal efforts to improve
teaching ability in the long run and that 16% of teacher graduates abandoned teaching in
2010.
The study Nor, Muda, Embong, Yunus and Nor (2019) ‗Effects of teachers
teaching competences on students achievement mediated by holistic centered learning
style based on SUMUR program at secondary religious schools‘ reported that several
researchers (Katharina, 2016; Jayaron and Mohamma, 2016 and Adnot, Dee, Katz, and
Wyckoff, 2017) agree on the influence of teaching on student achievement. These studies
showed that students show more comprehension and are more impressed when exposed to
a student-centered learning programme. This shows that students taught by experienced
teachers recorded higher academic achievement against those taught by novice teachers
using the traditional spoon-feeding approach. Teachers are absolutely vital for student
academic growth and development and the realisation of the goal and purpose of
secondary education.
Attrition rates are higher in poor schools serving a considerable number of colour
students. It is 80% higher for teachers of atypical education and 150 higher for teachers
with alternative qualifications as found by the study. It equally found that 25% of quitters
were on the ground of dissatisfaction, 55% for no opportunity for career advancement,
25% for dissatisfaction, accountability and pressure. For mathematics and science teachers,
the value was 37%. The 27% that left were for financial dissatisfaction and the most
percentage (52%) cited personal reasons as an excuse (Educator Recruitment and
Retention Task Force, 2015).
Teachers‘ attrition appears higher for the rural teacher than the urban one. A study
(Wei and Zhou, 2019) entitled ‗Are Better Teachers More Likely to Move? Examining
Teacher Mobility in Rural China,‘ probed the movement of teachers in rural settlements
with institution and teaching staff level data of both middle and primary schools in
Western China to determine the way teacher personal characteristics and schools influence
teacher mobility. Analysis revealed they located proximity to home among others
remained a consistent factor for teacher resignation and transfer. The connection between
higher pay, teachers‘ compensation and exit diminished as district and wave fixed effects
were factored in, and the propensity of a teacher resigning was higher for teachers with
superior administrative positions and teachers who were teaching away from home
initially.
The rate of teachers‘ attrition and transfers is so high that UNESCO Statistics
(2016) reported that about a million teachers are needed if the universal primary education
40
programme must be successful. About 22 million will replace resigned teachers. The
leftover 3.4 million is others whose fundamental function will be to make the number
needed to increase teachers in school and guarantee quality education by a drastic
reduction of the numbers of pupil enrolment to a maximum of 40 per class. The need to
surge the teachers is bigger at the secondary schools with a requisition of 44.4 million
teachers by 2030. Some 27.6 million are to replace deserters with another 16.7 million to
maintain every pupil is in a classroom with no more than a mean value of 25 students per
teacher.
Gais, Backstrom, Malatras and Park (2018) study entitled ―the State of the New
York Teacher Workforce‖ reported New York State‘s annual teachers‘ attrition rate
dropped from 11% in 2015 to 9.57% in 2018. Data show that annual teachers‘ attrition
rates are mostly consistent across Central, Western New York, and Upstate, only
marginally higher in Upper Hudson regions and the Big Four cities at closer to 11 percent.
Consistent with national literature, the highest attrition rates were found in high-need rural
districts and elementary schools in the 2018 reporting year.
Fenske (2017) investigated teachers‘ perceptions of school-associated factors
related to attrition in Southwestern Minnesota school districts. The enquiry reported
support from principals, working conditions, salaries; administration and relationships with
colleagues are perceived as exerting a significant influence on teachers‘ attrition. The
study found Administrative support as the most crucial factor in possible attrition next to
working conditions, salary/benefits and lastly, relationships with colleagues. The
demographic factors exerted an insignificant influence on how teachers rate the importance
of the attrition factors, outside of district enrolment and the higher the qualification of the
teachers, the lower the chances of quitting the profession or school district.
Collins and Schaaf (2020) study entitled ‗Teacher retention in Tennessee,‘
conducted snapshots in time between the 2017-18 and 2018-19 school years; critically
analyzed the movement, retention of teachers and teachers resignation in Tennessee‘s
public schools. The study found Tennessee‘s public school teacher retention rate is similar
to other states. For every 10 teachers, 9 remained teaching and eight of ten continued their
job in the same school. Urban districts had reduced teacher keep rates than other districts,
and a handful of teachers transferred into urban districts from the 2017-18 school years to
the 2018-19 school years.
Tennessee kept 90 percent of its school tutors. Since a teacher‘s resignation and
classroom exit translate into the school employing another, teachers ought to be motivated
to stay. Three percent of Tennessee teachers moved roles like an instructional coach,
41
interventionist, counsellor, or administrator and are not included as retained, though they
remain educators. In addition, first five-year academics appear to move or leave than
already serving teachers between 2017 and 2018. Below 70 percent of fresh tutors
remained at their schools as against 85 percent of more proficient teachers.
The OECD Teaching and Learning International Survey (TALIS, 2020) used the
intention of teachers to remain in teaching to determine teacher exit rate. The enquiry
found in Denmark, 26% of teachers reported they would like to leave teaching within the
next five years (25% OECD average). Teachers who are older than 50 constitute 20% in
Denmark. These tutors are due for retirement in the next five years. This percentage is
higher than the OECD average of fourteen percent (14%). This could be traced to stress.
Carver-Thomas and Darling-Harmond (2017) research concluded that leaver and
mover reports shed some light on reasons for the exit, they possess a limited capacity to
definitively predict transfer or resignation since the federal Teacher Follow-up Survey
cited here sought responses from only those who resigned for their reasons for resigning
since teachers who choose to stay in their classrooms and at their schools may experience
many of the same challenges and frustrations as those who decide to transfer or resign. In
addition, the issues raised by transferring and quitting teachers do not offer the opportunity
for teachers to speak to the role of their preparation or other key factors associated with
teacher exit in their decision to quit.
Lynch, Worth, Bamford and Wespieser (2016) study ‗Engaging Teachers: NFER
Analysis of Teacher Retention Slough‘ reported that some characteristics are linked to a
higher likelihood of considering leaving, but this is largely explained by a lower level of
engagement. The marginal propensity to leave teaching by the youthful and currently
employed teachers tends to be more likely than that of senior administrative staff.
However, there is no difference once their low level of engagement is factored in. This
implies that their lower retention rates could, therefore, be improved upon by identifying
and addressing the root causes of their lower engagement levels. The analysis revealed
some teacher characteristics are related to a high risk of leaving, especially after
accounting for how engaged those teachers are.
Ryan, von der, Pendergast, Saeki, Segool and Schwing (2017) study probed the
nexus between test-linked state level stewardship schemes. Results indicate teacher test
linked pressure, teacher weariness and teacher resignation plan while guiding for teaching
experience. Structural equation modelling of data from 1,866 teachers across three states
showed that state-specific accountability predicted significantly exceptional rates of test-
stress, attrition and burnout. Greater teacher experience was significantly linked to a lower
42
teacher transition between schools. The findings showed across several regions that test-
linked stewardship policies accounted for increased teachers‘ quit intents and higher
teachers‘ stress levels.
There is also the likelihood that teacher engagement culminates into significant
retention developments. However, ambient from the mentioned factors at work is that for
the finding that even for two groups of equally engaged teachers, one expresses greater
intention to abandon the job than the other. These groups may require targeted attention
beyond the school level to address their increased likelihood of considering resigning over
and above their level of engagement (Lynch, Worth, Bamford and Wespieser, 2016).
The teachers‘ attrition drama in the Netherlands is similar. A study (den Brok,
Wubbels and van Tartwijk, 2017) entitled ‗Exploring beginning teachers‘ attrition and
reasons for attrition in the Netherlands‘ reviewed recent studies and reports in the
Netherlands among beginning teachers reasons for teachers‘ attrition and compared the
outcome with studies on this topic conducted abroad. The findings suggest that the quit
rate of beginning teachers was 14% lower than in the USA, Australia and the U K. The
causes of attrition are similar to those found elsewhere. However, teachers‘ attrition
appears reduced for graduate teachers suggesting teacher education may play a part in
decreasing quits.
The UK education committee in the House of Commons (2017) cautioned that
while recruiting teachers, the government should focus on teacher retention to alleviate the
problems of teacher professional drift and job abortion. In Australia, one in every ten
teachers quit the teaching job within five years of service (Moor, 2019). Also (Mack,
Johnson, Jones‐Rincon, Tsatenawa and Howard, 2019) study entitled ‗Why do teachers
leave? A comprehensive occupational health study evaluated intent‐to‐quit by public
school teachers‘ sampled 2,588 teachers from 46 Texas schools in a comprehensive health
survey. The enquiry found health; demographic and occupational factors are linked to the
intent to quit teaching within one year.
In Norway, the story was similar. The study (With, 2017) entitled ‗Are Teachers
Increasingly Leaving the Profession?‘ Using superior quality data from the Norwegian
administrative registers to examine the direction of attrition across thirty years and
allowing a comprehensive investigation of dynamics in attrition, used teachers‘ education
demographic features and considered school-level characteristics. The study revealed early
career attrition had been falling over time, while the incidence of premature retirement
increased.
43
In New Zealand, Brinck and Maher (2019) in a paper that studied the rates of new
teachers quitting employment in New Zealand state and state-integrated schools in the
years following their first employment; long-term retention rates for Initial Teacher
Education (ITE) domestic graduates, how these rates vary by school sector: Comparison of
these rates to those for teachers who arrive from overseas, retention differentials by the
type of employment status (fixed, permanent, or day relief term) a new teacher starts
employment on and how these new teachers move from fixed term and day relief roles to
permanent or secured positions. The enquiry found Domestic ITE graduates have a high
level of retention, with 78% of the teachers employed in 2014 still serving as in 2018.
Over 60% of domestic ITE trained teachers starting in 2004 were still employed 15 years
later.
Also, Brinck and Maher (2019) study reported new teachers that subsequently quit
teaching did so within five years of service than in the subsequent years. The rates of
retention of locally-educated tutors have been getting better. The five-year non-resignation
rates for the 2004 group grew to 71% similar to 74% for the 2011 group and 78% for the
2014 group. Retention quotient for foreign-schooled teachers was lesser for ITE graduates
with 59% of newly engaged foreign-schooled tutors of 2014 still serving in 2018.
Studies reported that in Nigeria, the rate of teachers‘ attrition varied from one geo-
political zone to another. National statistics for teachers‘ attrition in Nigeria are lacking.
What is handy is not national data but a few states teachers‘ attrition rate records.
However, in the South-South political geographic division where most of the states are
educationally rapidly growing, the case is milder with about 10-15% compared to the
Northern part where almost all the states are rarely developed and educationally
disadvantaged with some 15-20% teachers‘ attrition rate as found by (Adamu, 2010). Also
(Oragwu and Nwabueze, 2017) study entitled ‗Effect of Compensation on Basic School
Teachers‘ Job Satisfaction in the Northern Zone: The study (Madumere-Obike, Ukala and
Nwabueze, 2019) ‗Managing teachers‘ attrition rate for quality education in Rivers State
senior secondary academies in Nigeria,‘ agreed there is teachers‘ attrition problem but did
not indicate the rate in their studies.
In Delta State, the data obtained from the Post Primary Education Board, Asaba
revealed that 1,801 male teachers and 1,144 female teachers exited the teaching service
between 2015 and 2019. Voluntary retirement accounted for 138 exits. Only one teacher
resigned based on ill health and only one teacher absconded within the period. Inter-
service transfers saw 14 teachers abandon the service while the death toll amounted to 165.
Teachers that resigned voluntarily increased the number of exits to 3,346.
44
The situation described above accounts for the teacher‘s quit within a few years of
entering the profession. Some studies posited that teachers‘ attrition presented a critical
challenge that cannot be underestimated as it results in a reduction of personnel in schools.
This is increasingly evident in the fact that almost half of all new teachers relinquish the
job in less than five years from start. This early quit compound the already complex
manpower condition where more teachers quit compared to those coming into the
profession (Oke, Ajagbe, Ogbari and Adeyeye, 2016).
Harmsen, van Veen, Maulana and Helms-Lorenz (2018) study on the nexus
between fresh teachers‘ pressure factors, tension reactions, teaching behaviour and
resignation investigated with structural equation modeling of 143 Beginning Teachers. The
probe reported fresh teachers‘ perceived negative earner aspects related positively to the
perceived stress responses, tension, discontent and negative emotions which in turn, are
negatively associated with observed teaching behaviours. Dissatisfaction with the salary
relates to the teachers‘ quit.
The above drew the attention of stakeholders to the issue of why beginning
teachers resign their jobs within a few years of entering the profession (Cyril, Ugwandu
and Bello, 2015 and Yinon and Orland-Barak, 2017) studies averred that teachers‘ attrition
remains a critical and increasing evident challenge as nearly half of all new teachers
resigned the job in less than five years of resumption of duty. The result has always come
back to new teachers deserting the profession abortively to further compound the already
complex condition of abortive new teachers quit and insufficient teachers compared to
those who have lasted in the profession (Oke, Ajagbe, Ogbari and Adeyeye, 2016 and
Ajayi and Adedeli, 2019).
Carlsson, Lindqvist and Nordänger (2019) study ‗Is teachers‘ attrition a poor
estimate of the value of teacher education?‘ A Swedish case contended that attrition is not
always permanent as generally supposed and that care must be taken when interpreting and
making use of general statistics. They cautioned that general statistical figures are
necessary and useful as they are all ‗true‘ in one sense. But how they should be understood
and explained must vary. A recent example is a repeatedly painted picture of Swedish
teachers fleeing the profession.
With arguments drawn from statistics, leading politicians and experts have
introduced this ‗truth‘ in the school debate. The picture is somewhat misleading. The same
statistics used in another way, on the contrary, showed that Swedish teachers stay longer in
the profession today than before and that they also stay longer than comparable professions
(DN, 2016). However, between 2011 and 2013, the average attrition rate among Swedish
45
teachers was 4.7% per year. Among civil engineers, economists and legal practitioners.
They were two times more difficult to change occupations (11.2%, 9.2% and 8.2%
respectively). The data shows that teachers‘ attrition is described as an alarming academic
issue in Sweden.
Carlsson, Lindqvist and Nordänger (2019) study also maintained that the evident
purpose of teacher education seems simple enough: ‗To enable individuals to work as
competent and skilled teachers.‘ This study focused on the words ‗work as teachers‘ and
ignored the words ‗competent‘ and ‗skilled.‘ To the latter, we could include words such as
passionate, appreciated, autonomous and professionally satisfied. Not all teachers quit can
be predicated on the absence of resilience (Smith and Ulvik, 2017) or are even negative,
but some of it genuinely is. Some teachers resign from the job as a result of high
accountability demands. This may lead to a loss of collegiality, poor leadership or other
operating conditions that have the capacity to affect the system.
Kelchtermans (2017) study used randomly chosen multinational data on a single
shot-basis to establish ‗crisis scenarios‘ to address nationwide teachers‘ challenges on
teachers‘ quit and recommended that future research on teachers‘ quit should include
matters of context, teacher worth and standard and causes of resignation. It reported
teacher retentiveness and discount refers to the need to prevent good teachers from
abandoning the job for flimsy reasons.
The Educator Policy Innovation Centre study (EPIC, 2016) reported plenty of
anecdotal evidence supports the troubled reputation attached to teaching as a career.
Ample resources speak to the de-professionalization of education. However, one of the
more illuminating pieces of evidence comes from the Quality of Work-life Survey
conducted in 2015 by the American Federation of Teachers. Most responded to questions
was the one on the quality of their work environments. The results present a dismal set of
facts that must be addressed by all states. 89% of the teachers responded positively to
being enthusiastic about their profession at the start of their career. However, only 15%
was able to sustain that enthusiasm as time passed on the job.
The EPIC (2016) study equally found that 79% of public school teachers reported
feeling some level of disrespect from elected officials, and 31% of the teachers perceive a
similar level of disrespect from the communities in which they work. The report shows
that some teachers quit their engagements for being physically and emotionally exhausted.
Some 18% of all the despondence had experienced physical threats in the workplace in the
past year. These numbers do not portray an attractive picture of this important profession.
46
These numbers do not attract new applicants (EPIC, 2016 and Teuscher and Makarova,
2018).
Teuscher and Makarova (2018) study ‗Students‘ School Engagement and Their
Truant Behavior: Do Relationships with Classmates and Teachers Matter?‘ They reported
intricate comprehension of school involvement and skiving by dwelling on students'
peculiar features and their interconnectivity in schools, especially the rapport between
teachers and students with the students peers. It revealed that the circumstance of
migration was critical for school engagement and age counted for students‘ mobility. Also,
peer rapport is positively related to school engagement, and it is negatively linked to
students‘ mobility. Also, a rapport between students impacts engagement and negatively
linked to truancy; while engagement mediates its path. From the above, it is explicit that
inadequate and transient teachers cannot meaningfully engage the students. Therefore,
relocating to schools with a perceived stable teacher force is likely.
Foster (2018) briefing paper No 7222 of the British House of Commons titled
‗Teacher recruitment and retention in England‘ reported that in England, 50,110 qualified
teachers left the state-funded sector in the 12 months to November 2016, a ‗wastage rate‘
of 10.5%. This rate was similar to that of the previous two years (10.4% in 2014 and
10.5% in 2015) and has increased from 9.9% in 2011. In 2015, the number of teachers
abandoning the profession compared to recent entrants was a far cry when related to the
value for the first time recruits. By November 2016, 2,620 more teachers fled the
profession than joined it. Only 21% of newly qualified entrants to the sector in 2014 were
not recorded as employed and working in the state sector two years later. The five-year
out-of-service-rate for 2011 entrants was 31%, the ten-year rate for 2007 entrants‘
represents 40%. Neither rate has shown much dynamic over time. Around 244,000
qualified teachers of about 60 years had worked in state schools in England, and 105,000
qualified teachers have not started teaching.
There is a consensus among researchers as to the kaleidoscopic nature of teachers‘
attrition rates. The value is relatively modest in some countries as against others as
moderated by differential demographic patterns, labour market situations, dynamics and
differentials. There are issues with teachers‘ attrition rates in Africa. Believable figures are
lacking. Where available, it is suggestive of between 2% and 10% annually. Where the rate
is reasonably modest, there is the marginal propensity of transience moderated by a
temporary ban on retirement like in Eritrea or an unusually young teaching force and few
chances of gaining employment outside the teaching profession. The need to retain
students in class in Africa has informed the recent increase in educational enrolment
47
opportunities following the fact that many countries maintain a substantial number of
junior teachers that have led to low teachers‘ attrition internationally (Education For
Africa, 2010).
In a study of newly employed teacher exit and transfer with data from 2007 and
2008, found that of new teachers in 2007 and 2008, 10 percent did not teach in 2008–09,
12 percent did not teach in 2009–10, 15 percent did not teach in 2010–11 and 17 percent
did not teach in 2011–2012. In 2008 and 2009, seventy-four (74) percent of beginning
teachers taught as they did the previous year. About 16 percent taught in another school
and 10 percent had abandoned teaching. During their fifth year between 2011 and 2012),
70 percent of newly engaged teachers retained their teaching station as the previous year.
Ten percent taught in various schools, three percent had returned to teaching after
absconding the previous year and 17 percent also fled teaching (Gray, and Taie, 2015).
Newly engaged teachers currently teaching were more among teachers under a
first-year mentor. They numbered grew to 92 percent and 84 percent, respectively in 2000
and 2009; 91 percent and 77 percent, respectively in 2009 and 2010; 88 percent and 73
percent, respectively between 2010 and 2011; then 86 percent and 71 percent, respectively
in between 2011 and 2012. Some reports emphasized that content and the substance of
preparation matter when it comes to attrition. Graduates with more pedagogy in their
education appear less disposed to remain teaching after the first year on the job. Other
reports claim quit rates are less for teachers in the South, while they are lowest in the
higher-paying North-Eastern states, with fewer students in a class. Mathematics, science,
exceptional education and English language teachers with teaching qualifications and
proven competence in teaching than for teachers without teaching certificates and
qualifications (den Brok, Wubbels and van Tartwijk, 2017).
Carver-Thomas and Darling-Hammond (2017) study on teacher exit; why it is
important and solution, analyzed 2012 Schools Staffing and subsequent studies. The result
found among others that the toll of attrition and transfer is dynamic and differs clearly
across the country: Total attrition rates are highest in the South (16.7%) and lowest in the
Northeast (10.3%) as moderated by higher pay, better funding and fewer class sizes.
Science teachers, mathematics, English language, foreign languages and some other
subjects have a higher marginal propensity to quit their profession or school: quit rates are
70% higher for teachers in schools with a more considerable number of Negroes. The
reasons cited by several deserters between 2012 and 2013 were dissatisfactions with
accountability and testing; dissatisfactions with teaching; administrative support absence;
48
the dearth of opportunities for progress below par operating conditions. About 55% of
quitters and 66% of those on transfer cited dissatisfaction as the reason.
Worth and De Lazzari (2017) study ‗Teacher Retention and Turnover Research
Update 1: Teacher Retention by Subject Slough,‘ found the movement of teachers within
the system has been long unaddressed. That generally, teachers‘ attrition rates are greater
for science and core subjects teachers. Quit rates are higher for teachers of core science
subjects, English language and technology. However, subtle differences in leaving rates
are critical as they mount up over time: to illustrate, a ten-percent attrition rate per year
compared to an eight-percent attrition rate per year may merely be a 2% point difference,
but leads to a 7% point difference in the number of teachers still in the profession after 5
years. The marginal propensity for a trained specialist to be employed outside teaching
also constitutes a formidable threat to teacher instability and exit.
According to the Task Force on Teachers for Education 2030, strategic plan 2018
to 2021, teacher shortage is more serious in some areas than in others, such as Southern
Asia and some countries within Sub-Saharan Africa alone. It requires as much as 76% of
teachers for some countries to meet up with the minimum standard set for basic and post
primary education as reported by the UNESCO Institute of Statistics. Based on the
aforementioned report, the African sub region, with an alarming 70% need of a primary
teacher and a whopping 90% secondary teachers discount, is worse hit.
International Task Force for Education for All (2010) reported that voluntary
resignation remains the single most dominant cause of a teacher quit in most African states
where data were present. The report for South Africa was that those who voluntarily
resigned were about half of all teachers‘ attrition. Attrition drama in Lesotho in 2004
witnessed 55% of voluntary teachers‘ attrition with involuntary causes including death,
illness and retirement as the raisons d‘être for more than half of the teacher quit. The report
concluded that the case of Zambia was noteworthy in 2007. In 2008, statistics showed that
resignation accounted for almost one-third of all quits. The retirement, illness and death
figure amounted to 24% of the teachers‘ abortions.
UNESCO Statistics (UIS, 2016) study ‗The World requires about 70 million new
teachers to meet the year 2030 education targeted goal. Fact sheets No 39 reported that
Sub-Saharan Africa and Southern Asia would gulp 14.6 million newly absolved teachers.
The aforementioned data is what is needed to meet the need for underdeveloped nations
with regard to the target of global primary and secondary learning and teaching by the year
2030. Thereafter, the leftover 4.6 million is distributed across the other underdeveloped
regions with South-Eastern Asia and Western Asia covering 1 million each. About
49
seventy-eight percent of countries face crisis-level teacher discount to a disturbing 90% at
the secondary school level. The most alarming teacher discounts are in this region. The
region requires about 17 million teachers to meet its deficiency to hit 2030 universal basic
and lower secondary education targets.
About 6.3 million primary school tutors are required alongside another 2.4 million
required to occupy current teaching posts to take care of all children as well as a whopping
3.9 million to fill vacancies generated by those expected to abandon the profession. The
region requires and must employ the services of not fewer than 10.8 million academics by
2030 into the secondary level. This will include 7.1 million teachers earmarked to fill
teacher vacancies and another 3.7 million to fill the vacancies created by quitters.
Regional, deficiency amounts to over 70% and rising to 90% for secondary education
(UIS, 2016).
The aforementioned calls for an urgent and sustained precaution geared towards
avoiding compounding an already complex and dire condition of inadequate schools and
teachers. These areas experience by far a rapid-growing school-age population. It is on
record that for every 100 children of primary age and every 100 of secondary age in 2014,
there will be about one hundred and fifty schools respectively in 2030 to cater to them. The
region must urgently start building new schools even though there are scanty resources
(UIS, 2016).
The report equally discovered tutors and students across the region often contend
with overcrowded schoolrooms and often lack the basic amenities. Findings from the
(UIS) divulged the typical pupil-teacher relationship at the primary level is forty two and
rises to over sixty in countries like Chad Republic (62), Ethiopia (64), Republic of Central
African (80), and Malawi (69). This ratio is comparatively smaller at the secondary level
(25) which may be caused by the low entry mean value of forty three.
Worth and De Lazzari (2017) concluded from their study ‗Teacher Retention and
Turnover Research Analysis: Research Update One,‘ that a rapid rise in the rate of teachers
quitting their schools in contrast to a fast upshot in retirees from their colleges could cause
a divergence between systems linked factors of replacement and attrition perspectives on
the current teacher demand and supply situation. The two are vital for understanding the
teacher labour market, but exerts dissimilar consequences for policy formulation. The
speed of teachers‘ transfers inside the system does have implications for the provision of
teachers and students‘ mobility rate. These have effects on the teachers‘ distribution within
the system. These have implications that may disproportionally have an effect on students‘
mobility. However, the Post Primary Education Boards seem to have devoted far less
50
concern to retaining teachers presently working in state colleges and grammar schools than
recruiting new ones.
Carver-Thomas and Darling-Hammond (2017) study and Valerie (2017) study
―Teacher Shortages Affecting Every State As 2017–18 Academic Year Begins,‘ reiterated
a high rate of tutors‘ resigning. That is, teachers abandoning teaching remain the primary
contributor to world teacher inadequacy. The teaching profession suffers a national quit
rate of about 8% annually, and research reveals the number of teachers quitting each year
accounts for close to 90% of the annual teacher demand in the US. Furthermore, less than
a third of national teachers‘ attrition results from retirement. By the foregoing, schools
must contend with permanent and temporary teachers in the process of replacing quit
hands.
Policymakers are operating indefatigably to stem the matter of tutors resigning by
implementing induction programs for newly engaged academics. The extant proof of the
results of induction on quit is mixed. Based on data from the Schools, staffing and tutors
surveys, and beginning tutors longitudinal survey (Carver-Thomas and Darling-Hammond,
2017) investigated and found different kinds of induction support, predict teacher quit
among samples of first-year teachers. The policy brief (Fuller, Pandola and Young, 2018)
also reported that receiving induction supports in the first year predicts less teacher
migration and attrition, suggesting that induction be used to reduce the rate of newly
employed teachers quitting. However, it is just a promising policy trend. The report also
indicated that levels of induction support received by new teachers are relatively constant
for diverse kinds of teachers in various types of schools.
Bahtilla (2018) study ‗The Impact of Working Conditions on Teachers Attrition;‘
CooperGibson Research (2018) ‗Factors affecting teacher retention: qualitative
investigation research report‘ and (Castro, Daniel, Quinn, Fuller and Barnes, 2018) policy
brief ‗Addressing the U.S. Teacher Shortage,‘ reported that about 1/3 of secondary
teachers in phase two (out of 56) quitted teaching. However, while addressing the
Importance and Scale of the U.S. Teacher Shortage (Castro et al., 2018), the Policy Brief
reported that those who have taught for over ten years reported perceived lack of support
or trust from the Senior Leadership Team, ineffective school management and policies as
key contributors in their decision to resign. There was a range of underlying themes:
Perceived lack of Senior Leadership Team help. Some secondary school teachers
experienced an absence of Senior Leadership Team support for workloads; pupil behaviour
and progress and did not feel they had access to other sources of advice and support. A few
secondary school teachers perceived that the more experienced teachers had not constantly
51
listened to their views and solutions to addressing school problems or that they were
unsympathetic towards workload issues.
Drawing down on the rate of teachers‘ attrition and its effect (Sutcher, Darling-
Harmond and Carver-Thomas, 2019), reported quitting the profession has not considerably
changed over the years; it constitutes the lion‘s share of demand, representing anywhere
from two-thirds to nearly 100% of the demand for teachers in any given year. Therefore,
the most important driving factor of teacher shortages is high teachers‘ attrition.
The Rate of Teachers’ Transfers
There is a dearth of data on teachers‘ transfer in Nigeria, and the focus of the scant
research is on the effect of teachers‘ transfer on students. Most of the Education Ministries
Information Services lack data on teachers‘ transfer over the years. The transfer of a
teacher refers to the formal move of a teacher from one school to another within the state
by the Post Primary Schools Management.
Research on the transition of teachers who entered teaching through alternative
pathways (that is teachers who did not read education initigenerally relatively rarely stable
in a school compared to those who studied education (Whitford, Zhang and Katsiyannis,
2017; Clark et al. 2017.) and have a higher marginal propensity to transit school or quit
teaching (Redding and Smith, 2016). The study of (Coenen, Johan, Ilja, Wim, Henriette
and Klaveren, 2017) showed that credentials matter for teacher effectiveness and stay at a
particular school.
Hascher and Hadjar (2018) showed that teachers‘ transfer distorted the already
present instituted relationship between students and their teachers. This alienates the
students with the current teacher. This alienation requires time and psychological capacity
to cope, adjust and readjust to current teachers. Where the student fails to make the
necessary alterations to adapt to the current teacher, the student initiates dropout which
research on school dropout established is not a sudden or immediate one (Alfonso,
Antelm-Lanzat, Cacheiro-González and Pérez-Navío, 2018).
Duran and Kösterelioğlu (2017) study entitled ‗Why does a teacher change his/her
School? Using a content analysis technique to sort out the views of the respondents; the
findings indicated that teachers transfer schools primarily for a new working environment
or to be closer home. Teachers first consider their position and stand with the school
principal before transferring schools. Most of the teachers long for a new school
environment and set of students with better academic performance, school principals,
professional and personal development, school transportation and school physical
52
conditions. The study spelled out the reasons for teacher transfers to include but not
limited to dissatisfaction with school, searching for a new working environment, school
away from home, needing a change in life, dissatisfaction with the students and parent
profile, chances of professional development. Others are access to the school, the student
population and their willingness to learn.
Extant researches have proven that teachers leaving the class are a subtle causative
factor of student dropout and students‘ mobility. Studies like (Morinaj, Hascher, Grecu,
Scharf, Hadjar and Marcin, 2017) ‗School Alienation: A Construct Validation Study.
Frontline learning research,‘ revealed that teachers‘ attrition and transfer causes breaks in
the flow of learning and leads to alienation and school alienation domains were negatively
associated with favourable attitudes to comfort, enjoyment and social problems in school
and positively related to alienation from classmates and teachers.
Roorda, Jak, Zee, Oort and Koomen (2017) in agreement with previous discreet
studies which were not meta-analyzed, revealed a direct interconnection between a
positive student-teacher rapport or teacher support and school engagement (Doumen,
Verschueren and Buyse, 2015; Garcia-Reid, Peterson and Reid, 2015; Papadopoulou and
Gregoriadis, 2017). Also (Cadima, Doumen, Verschueren and Buyse, 2015; Gregoriadis
and Papadopoulou, 2017) in support of the foregoing averred that when a teacher is
transferred, the relationship and rapport with students are destroyed. This is not without a
toll.
Studies reported the negative effects of how teacher exit takes its toll on students‘
academic achievements in schools (Wei and Zhou, 2019). A little outcome is known about
the influence of teachers‘ loss during regular school transfers. However, the condition of
incessant teachers‘ transfers is more devastating with rippled effects. A change in
instruction staff that is not tied to an institutional recommendation as promotion may deny
students of quality class times and may also disrupt normative school learning.
The study (Aeschlimann, Herzog and Sander, 2019) ‗Teacher Turnover and
Student Academic Achievement in High Schools: A Study in the Subjects Mathematics,
German, French and History‘ found that temporary irregular teacher exit could be the
aftermath of leave, breaks, childbirth leave, civilian or military obligation, ailments or
accidents. The irregular teacher exit may be initiated by a change of job or profession, a
drop in the amount of labour, school establishment operations and procedures, resignations
or loss of life.
From the teacher exit data obtained from the post primary schools management
committee of Bayelsa and Delta States, teacher transfers seem to be done without the
53
slightest regards for replacement in spite of the claim by the Boards that a high premium is
placed on teacher replacement in teacher transfers. It has been observed severally for
example, that a Biology teacher may be transferred from a school and replaced with a Fine
Art teacher. This kind of mismatch transfer replacements poses a problem to the system.
Teachers’ Transfers and Students’ Mobility from the Public to Private Secondary
Schools
Vonm der Embse, Nathaniel and Pendergast, Laura and Segool, Natasha and Saeki,
Elina and Ryan, Shannon (2016) on the sway of tests related to stewardship practice on
school climate and pressure predictors in four US states probed the link between test-based
stewardship programmes on teachers‘ stress and school climate typology in the United
States. Structural equation modelling of data from 6,428 teachers revealed an important
finding that teacher experience significantly predicted teachers‘ migration/transfer, but did
not predict a teacher's intent to exit the profession. This outcome suggests early career
teachers may not be more vulnerable to leaving the profession. Early career teachers may
be more likely to transfer schools until they find a permanent school placement. The
finding reflects a departure from previous studies that indicated early career teachers are
susceptible to abortive attrition. Teacher experience was not a significant determinant of
teacher career quit (-0.005) but was a significant predictor of school transfer (-0.211).
Teacher experience was significantly linked to school transfer, but not attrition overall.
In a bid to solve the matter of teachers‘ transfer in China (Wei, Zhou and Liu,
2020) study established a link between the initial job placements known as posting in the
Federal Republic of Nigeria and teachers‘ transfers‘ status with models of constant fixed
effects and standard errors with district-level cluster. The coefficient of the first job
placement shows non-local tutors were 2.4 times prone to moving schools compared to
local teachers. Male teachers were 1.3 times more likely to transfer schools than their
counterparts females. As for teachers assigned to colleges outside their local district, there
was no distinction in the probability of transfer between male and female tutors. Single
academics with higher tutorial certificates working in middle schools are more likely to
additionally reduce the chances of transferring schools. This is a digression from the status
quo that tutors with higher academic qualifications are linked to higher transfers and quit
rates (Harmsen, Helms-Lorenz, Maulana and van Veen, 2018 and Aeschlimann, Herzog
and Sander, 2019).
A plausible rationalization is that academics with a university degree tend to have
more choices when local governments make a deployment decision. These teachers are
54
also sent to colleges of their choice; places with quality environments. On the other hand,
academics with lower certificates have fewer alternatives and are often assigned to schools
in remote rural areas. As a result, these academics maintain a stronger motivation to hunt
transfers.
UNESCO (2015) averred that it had been evident teacher shortages cannot be
alleviated simply by providing additional tutors, but that various incentives and approaches
must be given to encourage teachers to settle in rural settlements. Incentive regimes for
recruitment, deployment and retention are multiple and vary. Some South-east Asian
Nations (SEAMEO) have adopted a number of creative incentives measures to ensure
teachers are deployed where they are required; the creation of special teacher positions for
extremely remote areas like the mobile teacher programme in the Philippines; award
systems or other incentives to attract teachers to underserved communities.
Darling-Hammond (2017) reported teachers‘ attrition and transfers exerts a
disjointed, non-coherent and non-sequential flow of lessons. However (Aeschlimann,
Herzog and Sander, 2019) empirical study ‗Irregular Teacher Turnover and Student
Academic Achievement in High Schools: A Study in the Subjects Mathematics, German,
French and History,‘ reported students lessons are prematurely aborted at the point where
the teacher is abruptly transferred or misses out of the system by an exit. This disrupts the
coherence and sequential flow of operations by terminating the knowledge, experiences
and concepts, projects of allied subjects and topics that enable students to sustain and
maintain learning in a competitive environment.
Coenen, Johan, Cornelisz, Groot, van den Brink and Van Klaveren (2017) study
‗Teacher Characteristics and Their Effects on Student Test Scores: A Systematic Review,‘
found the primary problem caused by a teacher‘s irregular and incessant transfer includes
the wastage of teaching time for students among others. The measure of direct
instructional time is a standout among the most vital components in student learning next
to an irregularity with the capacity to initiate higher levels of pupil dropout. Parents
convinced that teachers‘ attrition and transfer are prompting low-quality instruction, may
contemplate changing schools. Teacher shortage exerts dire consequences. Insufficient,
qualified teachers are a threat to students‘ capacity to learn. Similarly (Ladd and Sorensen,
2016) averred that instability in a school‘s teacher workforce (i.e., high transfer and/or
high quit) has gloomy effects on student efficacy and success. It diminishes teacher
efficacy and quality (Sorensen and Ladd, 2018).
Hansson and Gustafsson (2020) study on school mobility and achievement for
children placed on home care and outside home care reported that school mobility and
55
achievement for children had gloomy links to school outcomes, and also that there was an
increasing gloomy effect when a change of school happened simultaneously with a
placement change. They estimated that one placement change followed by a school churn
had a gloomy effect on academic growth in the reading of -3.7 percentile points, in which
the placement change caused 2.0 – 2.5 percentile points based on the subject matter.
However, another study, ‗The influence of positioning and school balance on academic
growth trajectories of students in foster care‘ found that for each month outside home Care
School, there was a beneficial effect on the performance of about six percentile points,
meaning that 3–4 months, outside home care, would counter the negative impact of one
placement transition (Clemens, Klopfenstein, Lalonde and Tis, 2018).
Sparks (2016) posted that research has found that student change of school and
voluntary transfer, especially multiple changes may cause a loss of some three months of
reading and mathematics learning per school switch and voluntary transfers, which are
more likely to happen during the summer. These results in less academic disjunction and
may be linked with academic improvement if they lead to better student services. Also,
teacher mobility can be exceptionally difficult for children in the early school years, as
they grapple with foundational dexterity. A 2015 New York University study reported that
of 381 poor, mainly ethnic-minority students in Chicago, 327 transited schools at least
once from kindergarten through 4th grade, and 40 transferred three or more times. The
higher students changed, the more vulnerable and worse hit they are.
Teacher employment is based on need and it is moderated by the structure of the
school-age population, the percentage of repeaters and the average number of students per
teacher in each classroom. Relying on children and adolescents‘ data could aid in
forecasting the demand for teachers to decide and ensure the workforce required to
accomplish the global primary and secondary education. From the supply side, the most
common influencing factors are the entry into the profession (recruitment), keeping and
thinning out. Inadequate teachers translate into either high-class size or insufficient
teachers because of increased enrolment or inability to replace teachers who have
abandoned the system (UNESCO Institute for Statistics, 2016).
Atteberry, Loeb and Wyckoff (2016) reported some 42 percent of teachers
received new assignments in some way during a typical school year. Of that number, over
a half (54 percent) are transiting duties in the same school. Much of that change seems to
be caused by teachers who exit a school or the profession, thereby constraining school
authorities to shuffle teachers around and employ some more to make sure all classes are
filled. But some schools tended to have far more changes than others. Black, Hispanic, and
56
English students were likely to be assigned to a teacher moving to a new grade or subject
in his or her school. However, the difference was generally negligible.
Besides students‘ mobility to an alternative school, education managers are also
interested in how exposure of students to new or new-to-school teachers. However, even
when teachers stay in the same school, they may replace duties by transferring
grades/classes and/or subjects. Based on data from New York City on a comparative study
of four ways by which teachers that are new to the job; new to teaching, new to the place,
new to the school, or new to the subject/grade affect students, they discovered negative
effects of retaining a transiting teacher of some 1/3 of the effect of a new teacher. In
addition, the average student is assigned to a transiting teacher four times more often than
to new teachers and that poorly served students are slightly more likely to be assigned to
mobile teachers (Atteberry, Loeb and Wyckoff, 2017).
Darling-Hammond and Carver-Thomas (2016) study reported that the costs of
teacher exits are comparatively high for students in schools with few teachers, especially
those serving primarily Negro students and secondary students in poor suburbs that depend
on uncertified teachers who are often engaged when a better option is unavailable. In 2013
and 2014, the quarter of schools enrolling most students of colour all over the states had
four times higher uncridentialed tutors than the quarter of schools enrolling the fewest
black students. Novice teachers without requisite teaching certification were also reported
to be denizens of schools serving the highest number of students eligible for free and
reduced-price lunch than in those with the fewest.
As a result of teacher posting patterns and transfers, the impact of teacher shortages
tends to exert a more devastating effect in schools. Remote rural schools and schools
serving indigents suffer greater teacher shortages, lengthier delays in replacing teachers
and a greater proportion of inexperienced teachers (Gray, and Tie, 2015). Incessant teacher
transfers take a toll on the deprived and vulnerable students. Teachers‘ attrition and
transfer result in a loss of experienced teachers, and a selective loss of the teachers with
higher academic qualifications, and those with expertise in mathematics and the sciences.
Schools without adequate facilities suffer a dearth of requisite teachers. A recent study
suggests that in addition to the issue of the lack of teachers, parents equally devote
tremendous attention to the quality of schools (Fitchett, McCarthy, Lambert and Boyle,
2018).
The study (Mutegi, 2014) argued that transfers can negatively impact students‘
learning as it affects non-completion of syllabuses In Nigeria and Kenya, weaknesses in
planning have affected the training, employment, and deployment of teachers and thus
57
distorted their equitable distribution and usage. Consequently, there is disparity in the
spread of teachers, teacher dearth, teacher glut in a few schools and incompetent use of
teachers as found by the Ministry of Education Science and Technology (MOEST, 2006).
The transfer of a teacher influences the quality of academics offered at a school.
Where shortages exist, available resources (teachers and finances) are spread thinly to
achieve even distribution. This compels schools to engage part-time teachers in the place
of acquiring learning personnel. Research has established that frequent transfers of
teachers destabilise learning and hinder good coverage of the syllabus (Mutegi, 2014 and
Gatemi and Thinguri, 2018). These studies averred that transfer and attrition of employees
'cause destabilisation and it is imperative that every organisation seeks ways of stabilising
their personnel by avoiding quits because of its negative impact on organisational
operations. According to (Mutegi, 2014) teachers are an important resource and usually
stand out as the key to realizing the high standards emphasized in schools. It is also a fact
that the standard is regulated by the school syllabus implemented in the school curriculum.
This means the highest standards can only be maintained if the teacher is present in order
to cover the stipulated syllabus.
Mulwa and Mbaluka (2016) study entitled ‗Factors influencing the timely syllabus
coverage in public secondary schools in Kenya' analysed the impact of the frequent
teachers‘ transfer on the syllabus coverage in secondary schools in Kenya using qualitative
and specifically an in-depth examination of the problem. The enquiry confirmed that
performance improves through adequate syllabus coverage among other factors like
management of quality teaching time by teachers and the input of the leaders and the
community who provide an enabling environment. The sway of the tutors‘ resignation and
transfers on syllabus coverage is of grave concern. It seems that the standards of academic
performance are regulated by the school syllabus implemented through the school
curriculum.
Holme, Jabbar, Germain and Dinning (2018) reported in their study of teachers‘
attrition in Texas schools, a record of over a 10-year period that teachers‘ attrition should
be unseen as a negative scarecrow. It may present as an advantage (e.g., the exit of
nonperforming teachers who disagree with the school‘s mission.) Some exits may also
present negative effects, including the loss of experienced and effective teachers; the loss
of essential subjects teachers with academic excellence and knowledge; truncating teacher-
teacher and teacher-student social-academic established ties and support networks;
impeding leaders‘ efforts to build coherent, sequential and collective vision and mission;
thereby causing a vicious cycle that leads to a further teacher quit with negative effects on
58
student achievement. The loss endured when good teachers leave and are not replaced with
teachers of similar quality then creates rippled effects.
Feng and Sass (2016) study ‗Teacher quality, and teacher mobility‘ examined the
effects of a statewide program designed to increase the supply of teachers in ―hard-to-
staff‖ areas of Florida using a difference-in-difference estimator. The study revealed that
the loan forgiveness program reduced teacher quit in shortage places though the effects
varied with subjects. Factoring variation in the proportion of payments, that study showed
the effects grew with loan forgiveness payments.
The above report also showed there were growing concerns between post-primary
school managers and parents over the quality of the teacher workforce in general and the
spread of effective teachers across schools. The outcome of a teacher‘s quitting the job
depends on overall teacher quality, depends on the efficacy of teachers who leave the
profession. Likewise, teachers‘ transfers may soothe or worsen inequities in the equitable
distribution of teachers, depending on what quality of teachers exits teaching and what
qualities of teachers replace them. The teacher discount consequences are even more
devastating in high-poverty schools serving the most vulnerable.
Worth and De Lazzari (2017) study found that not much attention has been devoted
to the movement of teachers within the system. Predominantly, teacher quit rates are
higher for science teachers. The resignation is common with tutors of core science
subjects, the English language and technology. However, subtle differences in quitting
rates are vital as they accumulate with time: to illustrate, a ten-percent attritions rate per
year compared to an eight-percent attrition rate per year may merely be a 2% point
difference, but leads to a 7% point difference in the number of teachers still in the
profession after 5 years. The marginal propensity for a trained specialist in the sciences
and mathematics to be employed outside teaching also constitutes a formidable threat and
challenge to teacher stay.
Atteberry, Loeb and Wyckoff (2016) study ‗Teacher Churning: Reassignment
Rates and Implications for Student Achievement,‘ conducted a comparative analysis of
New York City panel data for four ways teachers who are new to the assignment; new to
teaching, new to the district, new to a school, or new to a subject/grade impact their
students. The study employed quasi-experimental and secondary data analysis. The study
revealed the gloomy effects of a transient and transiting teacher of about a third of the
magnitude of the effect of a new teacher. It contended that the average learner is allocated
to transiting teachers four times more often than to a new teacher; based on the observation
that from time to time, teachers move within the school and within the system.
59
Teachers may move within their schools to a new grade-level assignment or a new
subject. Similarly, a study (Sawchuck, 2016) entitled ‗Churn Among Teachers Seem to
Affect Learning." Teacher Churning: Reassignment Rates and Implications for Student
Achievement." The study reported teacher quits, transfers and reassignment exerts
detrimental effects on students. Each year, some proportion of teachers leave the service
by retirement, others by death, ill health, resignation and even transfer of service.
The literature shows that the public secondary education system is seriously teacher
deficient. Private schooling remains clearly one option for parents who are dissatisfied
with public secondary schools. Therefore, private schools‘ enrolments may inversely
influence state school achievement since private run academies outperform public schools
in examination results. Studies on some private and public schools reported after holding
other factors that might influence teacher output that public secondary school performance
is inversely connected to private school enrolments (Onyedinefu, 2019).
The Rates of Students’ Mobility from the Public to Private Secondary Schools
In recent times, there have been indications that school principals contend without
success with a growing incidence of student annual mobility (Onyedinefu, 2019). A
practice wherein students change one school for another one other than that in which they
are promoted from one school level/grade to another and when students have to move from
primary to colleges and grammar schools.
The concept of moving school is quite different from what is referred to as inter-
school transfer. In the latter, the ―transferring student was accepted when the receiving
school is satisfied not only with the academic performance of the student who is moving‖
but also gets a good transfer certificate from the principal of the student‘s previous school.
In the former, that is inter-school movement, such transfers from one school to another do
not require these essential transfer credentials. Mobile students can change between school
years, such as during the term or during the school year (Rumbeger, 2015).
The forms of students‘ mobility are defined by (Spencer, 2017) as follows.
Structural mobility: ‗It is the mobility consequent upon graduating from one school to
attend a higher one (e.g., from elementary and middle school).‘ Nonstructural: ‗mobility
not based on graduating from school.‘ Voluntary: ‗students‘ move of school initiated by a
student or the student‘s family.‘ Involuntary: ‗students‘ mobility that is mandated by a
school or policy, e.g., expulsions or school closures.‘
Strategic: mobility made to access better schools initiated by a student or parents.
Reactive: these are moves done in response to negative dynamics in the circumstances of
60
parents that have effects on the students like loss of work leading to relocation (Spencer,
2017).
Exit: mobility out of a school, i.e., a student not enrolling at a school. Entrance:
mobility into a school, i.e., a student enrolling in a new school. Dropout: when a student
exits a school and fails to continue schooling, i.e., the mobility incident includes an exit,
but no entrance. Between-year: mobility that occurs after the completion of one school
year and before the start of the next. Within-year: mobility that occurs in the midst of a
school year (Spencer, 2017).
Strategic: mobility made to access better schools initiated by a student or parents.
Reactive: these are moves done in response to negative dynamics in the circumstances of
parents that have effects on the students like loss of work leading to relocation (Spencer,
2017).
Exit: mobility out of a school, i.e., a student not enrolling at a school. Entrance:
mobility into a school, i.e., a student enrolling in a new school. Dropout: when students
leave school and they fail to continue schooling, i.e., the mobility incident includes an exit,
but no entrance. Between-year: mobility that occurs after the completion of one school
year and before the start of the next. Within-year: mobility that occurs in the midst of a
school year (Spencer, 2017).
Structural and non-structural mobility are common place. Structural mobility
occurs when a student graduates from school and must proceed to a school serving higher
grade levels. Nonstructural/non-promotional, mobility is presented by (Thomas B.
Fordham Institute report, 2012). The school mobility is not caused by graduating from
school. Much of students‘ mobility is structural, a feature of the way schooling is
organised, but frequently this movement is not of interest in studies of mobility (Spencer,
2017).
In spite of the fact that public secondary school principals often experience
unpleasant high students‘ mobility, especially at the beginning of current academic
sessions and the fact that student's mobility exerts both negative and beneficial academic
outcomes, the literature has not sufficiently captured the phenomenon. There is the
absence of a well-conceptualized framing of relationships between diverse types of
students‘ mobility; what motivates students‘ mobility and the various associated outcomes
(Almazan and Marshall, 2016). A concatenation of reasons may inform students‘ mobility.
It could be students or parents wish to move schools arising from an increase in income
61
resulting in access to private schools that were hitherto expensive, by expulsion parents
relocating towns. (Rumberger, 2015 and Rumberger, 2017).
Studies have shown that the school environment significantly influence students‘
performance (Reynolds, Lee, Turner, Bromhead and Subasic, 2017: Maxwell, Reynolds,
Lee, Subasic and Bromhead, 2017). Also (Reynolds, Lee, Turner, Bromhead and Subasic,
2017) study used different data and multiple level model, workers self-reports, scholars
self-reports, school records of tutorial gains and socio-economic demographics to access
scholars‘ perception of learning environments and climate as they affect learning gains.
The enquiry divulged students' perceptions of school climate remarkably explain writing
and numeracy tutorial gains, and this is moderated by students' psychologically identifying
with the school. In addition, tutors perceptions of school climate explain students' gains on
numeracy, writing and reading tests. Staff‘s school identification did not carry out a
significant role.
The opposing non-functional, ill-equipped, unattractive school plant that
characterises state secondary schools has offered a place to plant with modern superior
lighting, attractive decoration, functional, suitable furniture and equipment, more
comfortable seats and seating arrangements. Modern service facilities like equipped
libraries, common rooms, functional playgrounds, and classrooms with marker and bulletin
boards, sinks, work areas, filing and storage facilities with pupils‘ lockers are no longer
spectacular in present-day private schools for their abundance. Public secondary schools
are more or opposite of private schools.
Umar and Samuel (2019) probed the influence of types of school and facilities on
Senior Secondary science students‘ tutorial outcome in Nasarawa State on 300 students.
The findings include that there was a substantial sway of school facilities on science
students‘ academic performance in urban and rural schools, and there was a significant
influence of school facilities on science students‘ academic performance in private and
public schools. The case for private schools reported the situation of the poor school
environment prevalent in most government secondary schools. The result also revealed
that privately owned and financed schools have a better school environment than the aided
government schools. This was attributed to the fact that some private schools offer more
facilities for effective learning as a bait to attract more admission. This means students will
move if the school environment does not support learning.
A vicious cycle of the yearly exit and transfer is felt most in disadvantaged schools,
where the most disadvantaged students often receive instruction from new or
inexperienced educators based on the studies of (Ingersoll, 2004; Darling-Hammond,
62
2017) and the Policy Brief of (Fuller, Pandola and Young, 2018). Teachers serving
considerable concentrations of low-income students frequently work with few resources,
adverse working conditions, and the added stress of engaging with students and families
who maintain a broad range of social, emotional, and economic needs (Darling-Hammond,
Flook, Cook-Harvey, Barron and Osher, 2020). Therefore, educational leaders must place
more considerable emphasis on improving operating conditions and building relationships
with teachers to increase retention rates to stall students‘ mobility to private secondary
schools.
Rumberger (2015) study noted each of the potential precursors of students‘
mobility would result in diverse types of students‘ mobility—Voluntary, structural and
involuntary mobility. In turn, these different mobility circumstances, arising in various
types of mobility, may ultimately result in numerous consequences. The student
transferring to private schools, as well as those who involuntarily moved from low-
performing schools into ostensibly higher-performing ones, may experience a boost in the
quality of their schools, their peers, and their access to services and programs that may
ultimately improve their academic performance. These examples demonstrate that
students‘ mobility type, motivation, and consequences are all interrelated, and taking into
account variation across these domains is important for establishing nuanced
understanding of students‘ mobility (Rumberger, 2015).
Over time, there has been a shift in the operation paradigm and grade of schools at
all levels with the introduction of privately owned and operated schools. Hitherto, when a
student is expelled from a state secondary school (up to the late 1970s) in the defunct
Bendel State of Nigeria, for instance, such a student will not be admitted into any other
public school in the entire state. Currently, it is different. As soon as a student is expelled
from a public secondary school; the student is given automatic admission into a private
secondary school without requesting any document of previous academic or behavioural
records.
Welsh, Duque and McEachin (2016) investigated students‘ mobility from one
school to another and from one department or session of the school to another using a
multinomial framework. Also, students‘ mobility is widespread and often an unheralded
problem opposing global schooling. Many primary and secondary school students make at
least one non-promotional school move in their course of schooling, with many others
engaging in many transitions. This is carried out for many reasons. Moving schools often
result from the students‘ parents and guidance often emanates from job mobility induced
residences change.
63
Students‘ expulsion and school closure may result in students moving to various
schools. The research literature suggests that attending diverse schools can harm the
average learner and adolescent development by altering relationships with peers, teachers
and changing a student‘s academic programme. The worse damages are often broken
homes connected (Welsh, Duque and McEachin, 2016).
The research has also established that as schools celebrate improving incoming
students, they equally pay its toll. Schools that receive a number of incoming students
during the year also face difficulties. Integrating new students into the classroom can
disrupt instruction and reduce teacher morale. The attempt to identify new entrants‘ needs
could be enough detraction for the new school tutors and other students. Also, significant
quit and transfers can undermine the efforts of teachers and administrators to implement a
reform agenda in a school (Welsh, 2017).
Conventionally, students‘ mobility from public secondary schools to private
secondary schools is high and not new many students have started experiencing school
mobility and until the issues feeding this practice are taken care of by the authorities; there
may not be an end to the exodus. There is the dearth of data on the rate of students‘
mobility to private secondary schools as a research report (Mann and Quintero, 2017)
posited that states should lead the way in private school choice Programme Expansions
since patronage is high. Other studies such as (Ceng and Peterson, 2017; Erickson, 2017;
Prothero, 2017; Suppramaniam, Kularajasingam and Sharmin, 2019 and EdChoice, 2019)
support the choice of private schools against their government‘s counterparts.
Reasons for Students’ Mobility from the Public to Private Secondary Schools in
Bayelsa and Delta States
Rose (2016); Welch, 2017; Dixon, 2018 and Lenhoff, Pogodzinski, Singer and
Cook, 2019) averred that students moved between schools for numerous reasons. Four
primary categories of a move have been recognised: Structural moves: Such moves as
occur due to school system requirements, such as moving from a primary school to an
intermediate or secondary school. Transitions prompted by residential issues or by parents
relocating work stations for any reason, or the consequence of relationship fracture, job
switch or dynamics associated with housing.
Besides, students make moves to other schools for the fear of their inability to pass
examinations without assistance and non-connivance of the examination center teachers.
The study of (Okoye and Onwuzuruoha, 2020) reported that many students in Awka South
L.G.A of Anambra State secondary school during the senior secondary certification
64
examination and other external certification examinations are often disoriented by
associated strain, phobia and stress. These factors force some students to drift from the
public secondary schools to enrol in miracle centres for examination malpractices.
This finding is supported by a study (John and Gilbert, 2020) that posited some
students have abandoned their books with the mindset to engage in examination
malpractice with the hope that they can outsmart examination officials during an
examination. This is why examination fraud has been condemned; instead of learning to
get good grades, students choose to play with their time and hope to pass with the required
grades. Similarly (Jerinde, 2007) lamented that despite the conscientious and frantic efforts
of the West African Examination Council (WAEC) to curb special centres, agents,
candidates and examiners have continued unhindered in the act.
A study ‗Student exit, mobility, and attendance in Detroit‘ (Lenhoff, Pogodzinski,
Singer and Cook, 2019) posited that the issues of student exit, mobility and absenteeism
are only a manifestation of the challenges associated with managing large government
schools in urban school districts. In line with the above (Kolawole, 2019) averred that in
the Nigerian school system, numerous types of fraud are recognised. They include the
entrance examinations, the terminal and promotion examinations, junior and senior school
examinations and the diploma and degree examinations.
The Fordham Institute (2012) study supported by (Masci, Ieva, Agasisti and
Paganoni, 2016) reported a distinct class differential between voluntary and involuntary
students‘ mobility. Thomas B. Thomas B. While voluntary students‘ mobility is student or
parents‘ initiated, involuntary students‘ mobility is mandated by a school or a more
considerable agent of policy. Examples of voluntary mobility include mobility resulting
from a student‘s residential move or from the decision to seek alternate school choices.
However, students may voluntarily move to schools perceived to guarantee
examination success. The study of (Okoye and Onwuzuruoha, 2020) averred the
emergence of syndicates with innovations in fraudulent and criminal techniques for
examination malpractices across the country called the miracle centre. Earlier
(Airahuobhor, 2007) reported the emergence of seemingly very powerful but small
organizations heavy in examination malpractices that have survived the years in the face of
unhidden large-scale examination fraud. The operators of these centres gather all the
resources their clients need in their illicit escapades to fraudulently acquire good grades.
These include fiscal inducement of examination supervisors, invigilators and security
agents to cooperate with them. Most times, the syndicates are proprietors of private
secondary schools who manipulate the system for good results. These syndicates guaranty
65
success and the ease of acquiring school certificates. In some cases the candidate does not
need to be present during the examination yet gets a result; the concept of offshore student
candidature.
This explains why some students do not enrol the JSS examinations and the SSCE
in the schools they attend, especially if it was a public secondary school. Instead, they
become miracle centre candidates where they pay expensive fees to fraudulently pass the
examinations. It is evidence to note the fees paid by these moving students are by far
higher than the state schools‘ tuition and enrolment charges. The must-pass examination
centres are often unsightly with fewer certificated and poorly-paid academics yet with a
greater number of students (Okoye and Onwuzuruoha, 2020).
Igwe, Ogadi and Uche (2020) reported that the special centre adopted various
dubious means like registering a candidate and contracting another person to seat for the
examination while the registered candidate stays at home only to get a good result later.
This is referred to as ‗nonappearance‘ in the fraudulent business parlance. A candidate
may also register, sit for the examination himself or herself but would be aided by
machinery in the examination halls. These miracle centres are patronized by many
Many of these centres tend to organise teaching and learning activities in order to
assist students with deficiencies in some subject areas but, on the contrary, aid and abate
examination malpractice with impunity. They are found all over Nigeria. These centres
offer a better alternative to the conventional educational centres as they possess the magic
wand to fraudulently pass examinations. While some call them a tutorial centre, others call
them the Agency for Mass Education Special Centre; yet for others who had experienced
the wonders of this learning centre, they simply prefer to call them the 'miracle centre.
Their motive, according to them, is to help advance the course of learning even though
they are a big-time academic business centre (Igwe, Ogadi and Uche, 2020).
The Influence of Teachers’ Demographic Factors: Age, Sex and Marital Status on
Teachers’ Transfers
The literature has some support for age, marital status and sex as significant factors
of teacher transfer. Both extinct and extant pieces of research contain some empirical
evidence as to the role of age and sex in transferring schools by teachers. The factors that
predict teachers‘ transfer decisions are conventionally studied using surveys asking
teachers to rate their preferences or through qualitative methods. Adaptive Conjoint
Analysis (ACA) survey design has currently been adopted from the field of marketing for
in-depth comprehension of teachers‘ transfers decision making (Robinson, 2012).
66
Koopman, Thurlings and den Brok (2017) study examined different teacher
characteristics for which influence student proficiency development regarding fractions in
Grade 5 of Dutch primary education factors influencing students‘ proficiency development
in the fraction domain: the role of teacher cognition and behaviour. Student fraction
proficiency was examined simultaneously using multilevel analyses. The analysis revealed
that teachers‘ age and experience in the superior grades, their pedagogical content
knowledge and the degree of student participation in their lessons yielded beneficial
effects.
Therefore, students must not be separated from their teachers abruptly. However,
the report did not indicate any connection between demographics like age, sex and
teachers. Another study (Wei, Zhoue and Liu, 2020) reported that a male teacher was
likely to transfer once more than a female one. Single teachers and low-certificated
teachers are less likely to transfer more than once than their counterparts.
Carver-Thomas and Darling-Hammond (2019) study ‗the trouble with teacher
transfer: How teachers‘ attrition affects students and schools,‘ reported teacher
characteristics such as teacher age as expected is related to resignation rates, with the
youngest and most senior categories of teachers enjoying higher rates than those who were
mid-career. After controlling for age, experience levels did not have an effect on the exit.
With controls for other student and teacher characteristics, the teacher‘s race did not
influence exit. This is in line with the report of (Kumar and Arora, 2012) who found that
the rate of attrition among young professionals (20-25 years) is exceptionally high with the
following reasons: slow rate of career growth, terrible relationship with colleagues,
seniors, supervisors, work-life imbalance, taking up higher studies, etc.
The policy briefs of Fuller, Pendola and Young (2018) did not include any
relationship between a teacher‘s age and sex on mobility. Extant researches (Grissom,
Viano and Selin, 2015: U.S. Department of Education, 2016 and Podgursky, Ehlert,
Lindsay and Wan 2016) did not report a relationship between age and sex on teachers‘
attrition. The research (Henry and Redding, 2018) entitled ‗The state of racial diverse
workforce‘ did not detect any relationship between teacher age and sex and teacher
transfer. However (Lynch, Worth, Bamford and Wespieser, 2016) study entitled 'retaining
working-age teachers is becoming harder' found until 2015 the proportion of teachers
quitting for reasons other than compulsory retirement increased by two percent from six
percent. The trade-off is balanced in the number of teachers retiring.
Luschei and Chudgar (2017) examined the gender difference for the connection
between initial job placement and teacher mobility. They found no differences between
67
female and male teachers in the likelihood to transfer schools and the frequency. For
reasons for transfer, generally, male teachers were less likely to apply for transfer
themselves when their first job placements were outside their home districts. However, for
the sake of family, male teachers seek transfers more relative to their female counterparts.
The marginal propensity to seek transfers falls with years of service (Sutcher,
Darling-Hammond and Carver-Thomas, 2016) and (Elfers, Plecki and Van Windekens,
2017) study averred that novice teachers (0-4 years of experience) and veteran teachers (25
or more years of experience) stay in their schools at more moderate rates (47% and 48%,
respectively) than moderately experienced teachers 60%, and those with about 15-14 years
of experience 64%. Elfers et al (2017) used administrative data set to investigate
demographic information about teachers over the last 20 years. The study examined
mobility and retention trends over time to resolve the issue ―what variables consistently
explain teachers‘ retention and mobility patterns in Washington State.‘ High school
teachers were reported as being more marginally prone to regional transfers and rarely
resign the job or move out of the district than transient teachers serving as auxiliary.
It is reasonable to think that while more junior teachers may want to look
elsewhere for better job offers, the more senior teachers may have given up on seeking
other jobs. The age distributions between teachers missing from the census and all teachers
from the TPS in 2010 and 2015 were similar, except teachers in primary and secondary
schools in 2015 where missing teachers possess a slightly more elderly population (U K.
Department for Education, 2017). The teaching and Learning International Survey (2018)
showed that in 2018, 68% of all teachers are female across the OECD countries and over
half the teachers are women in all participating countries and economies but Japan. Studies
have not reported a balance in gender proportion among teachers in Latvia, where some
90% of teachers are female. In Israel, Italy and some Balkans and Baltic region states,
Central Asia and Eastern Europe, where over 75% of teachers are females (TALIS, 2018).
The study did not report female gender-motivated transfer.
TALIS (2018) report further suggested that the patterns of teachers‘ gender
proportion have remained reasonably stable over time with negligible discrepancy for most
states and economies. The ration of women tutors to men has surged in Croatia, Japan and
Romania since 2013. Portugal, Australia, Mexico, Malta, Austria, Iceland, Norway and
Spain ever since 2008 have also recorded surges in female tutors‘ composition by at least 2
percentage points. On the contrary, the gender frequency of tutors has leveled up in
Finland, Bulgaria and Brazil since 2013. The study of (Wei, Zhou and Liu, 2020) reported
that among teachers who have switched at least once, local teachers tended to stay at their
68
first school longer than non-local teachers. Their analysis indicated that although the non-
local teachers were not more likely to move schools within the first 5 years of a teaching
career, they tended to teach at the first school for a shorter period.
The Pattern of Students’ Mobility between Public and Private Secondary Schools
Not so much interest and attention has been directed at students‘ mobility in
developing countries relative to that paid to students‘ mobility in advanced nations like the
US and Britain. However, some studies in Africa focused on student change of school. For
example, there are reports of students school switching in Uganda, Malawi and Kenya
(Taniguchi, 2017). In Kenya, the number of students switching schools and especially to
private primary schools grew from 4.8% in 2004 to 12.2% in 2007 (Nishimura and
Yamano, 2008). In Uganda, the number of students that switched schools grew to 67.8%
and 55.5%, respectively, of Grade 3 and 6 students. Students who have transited more than
once were not less than 39.0%. Those who transited more than two times were 34.7%
(Taniguchi, 2015).
Secondary School Students‘ Mobility does not seem to be strongly related to
family income and socioeconomic status, but it does appear to be related to family
structure: families without both biological parents have experienced increased school
churn. Most of the reasons for school churn have been linked with the students themselves,
low school performance (grade point average), behaviour problems, absenteeism, and
reduced academic expectations all predicting factors. High density colleges with many
vulnerable and deprived students have negligible rates of mobility even after accounting
for the differences in student factors, while colleges and grammar schools with higher
teacher salaries and better teachers have lowered mobility than other schools (Taniguchi,
2017).
Students‘ mobility may be voluntary, in which case it may be a student or family
initiated. The student may decide on the choice of the school. Parents or family relocation
may cause a switch of schools, then it is involuntary. The second scenario involves parents
and compulsory mobility. This may be a compulsory move arising from family relocation
occasioned by a job loss, loss of home, relocation for any reason such as a student
changing school because of the death of parents or guardian, divorce, foster, incarceration,
and from the school‘s angle; school closure, overcrowding, and disciplinary actions like
expulsions (Rumberger, 2015).
At the beginning of every academic session, most government secondary schools
experience students‘ mobility more than at any other time of the academic session
69
(Onyedinefu, 2019). This, however, seems to be occasioned by many factors. First, no
parents desire their children and or wards to study in a school wanting of teachers since
research has established the performance of learners is primarily a function of the quality
and quantity of the learner‘s teachers (Fuller, Young and Pandola, 2018). Secondly, those
who could not pass the certification examination at the seating constitute a fraction of the
bulk of people enrolling for either the WASSCE or NECO Examination whether private or
otherwise. Thirdly, parents are traditionally not in support of their children and wards
moving schools midway into the term.
The research literature suggests that switching schools can hurt a child and
adolescent development by truncating and undermining existing relationships with the
school community, thereby affecting a student‘s learning. The worst outcomes reflect in
tutorial gain measures and tests gains, including high school successful finishing with
fewer consistent reports on the scholars‘ attitude (Welsh, 2017).
In the USA (O‘Donnell and Gazos, 2010) executive summary entitled ‗A
Revolving Door: Challenges and Solutions to Educating Mobile Students‘ reported that in
the 2008–2009 school years, 101,013 students statewide moved in or out of the school a
minimum of once, making the statewide mobility rate approximately 10 percent.
Consistent with the research, students‘ mobility in Massachusetts affected disadvantaged
students more than other groups. Quite half (53.1%) of scholars who moved schools were
classified as low-income. Nearly 1/4, (24.1 percent) were students with exceptional needs
and about 16 percent had issues with the English language. Hispanic and African
American students also made up a more sizable share of the mobile student population
than of the overall student population. From 2008 to 2009, 14.3% of all students were
Hispanic and 8.2 percent were African Americans, while these two groups made up 28.6
percent and 15.6 percent of the mobile student population, respectively.
70
Teachers’ Attrition, Transfers and Students’ Mobility to Private Secondary Schools
Contemporary educational managers postulated that unsatisfactory academic
performance was the result of failure to adequately fill classes with effective teachers. The
issue of workers also holds that this challenge is due to inadequate teachers. This, in turn,
is mainly caused by the ongoing upsurge in teachers‘ resignation rate and low level of
students enrolments (Tsai and Yang, 2015; Jones, 2016 and Garcia and Weiss, 2019).
Hirschfeld (2016); Li and Konstantopoulos (2017); Filges, Sonne-Schmidt and
Nielsen (2018) and the UNESCO (2018) independent empirical studies confirmed that
inadequate teachers during a school session or term remains a formidable challenge and
there is the necessity to retain enough teachers for learners based on the fact that the
availability of teachers in a school determines the teacher-student ration. The research
studies have also found a nexus between the size of a class and improved student academic
performance. Online learning research studies have highlighted the importance of contacts
(between students and the teacher and with the content) and its beneficial influence on
student academic performance (Kurucay and Inan, 2017). Contact between and among
teachers and learners strengthen collegiality (Luo, Zhang and Qi, 2017) and, consequently,
a sense of cohesion.
Also, other researchers like (Nandrup, 2015; Watson, Handal and Maher, 2016 and
Leuven and Løkken, 2017) gathered a body of evidence that those teachers available
during a school term determines the size of its classes and students' academic performance.
Size matters if students must experience optimal learning in classes across schools
(Wekesa, Simatwa and Okwach, 2016). The smaller the dimension of its classes, the better
it is for the learner (Li and Konstantopoulos, 2017).
Granted the aforementioned, it is both cognitive and intellectual to infer that
students of schools with inadequate teacher populations are vulnerable to move schools as
they are sure having problems with the enhancement of subject knowledge based on large
class sizes. Research reports confirm that teachers matter of school-related variables.
Teachers wield the best preponderance influence on students reading and mathematics
proficiency estimated to be up to three times the effect of all other school factors and
variables whether it is leadership, school services, environment, facilities and amenities
(Cowana and Goldhaber, 2018).
Ajayi, Audu and Ajayi (2017) study examined a sample of 128 senior secondary
school teachers from 16 purposely selected secondary schools out of a population of 4529
senior secondary teachers was used for the study. The study revealed that class size had a
huge influence on senior secondary classroom discipline, engagement and communication.
71
Similarly, Adimonyemma, Akachukwu and Igboabuchi (2018) study ‗Impact of
Class Size on Students‘ Academic Performance in Biology‘ reported that in Nigeria, the
school class unit size is fast becoming overly large and unmanageable, putting teachers in
an impossible position of giving the individual student the required attention. This has
deprived state school students of the teacher's eye contact within the students‘ class. Where
it nonetheless exists, it has been drastically reduced that some poorly motivated students
can easily form a variety of committees at the rear of the class as teaching is ongoing to
engage in non-school and non-academic discussions. Teachers fear incessant home works
and assignments stemming from the staggering number of books and papers to mark and
record. Under the above condition, it is apparent that parents' propensity to contemplate
and switch or move schools regardless of the time and period of the term is heightened.
Similarly, Obiakor and Oguejioffor (2020) study sought to look at the influence of
classroom size on the academic outcome of secondary school students in Enugu State. The
study obtained data from seven hundred and sixty-one (761) state secondary academy
teachers in Enugu North Local Government Area. The information was analyzed and
interpreted. The findings include that enormous class-size contributes to poor academic
performance; it results in poor teaching, inadequate instructional materials and teacher
difficulty to point out the scholars who are following up and doing with insufficient
instructional materials. Finally, these cause poor academic outcomes.
The aforesaid shows those teachers are comparatively briefly supplied to students.
Some research suggests that, compared with teachers, individual and family characteristics
may exert four to eight times the impact on student achievement. However, policy
discussions focus on teachers because it is arguably easier for public policy to reinforce
teaching than to vary students' personal characteristics or family circumstances (Hansson
and Gustafsson, 2020).
Coenen, Cornelisz, Groot, Maassen van den Brink and Van Klaveren (2017) study
―Teacher Characteristics and Their Effects on Student Test Scores: A Scientific System
Review,‖ noted that teachers are both crucial critical and indispensable to students learning
and there are attempts by many empirical studies to elucidate the differentials in student
performance by evaluating the impact of particular teacher characteristics without
systematic review for over a decade. The study gave an up‐to‐date review, with supportive
empirical findings from several countries and distinguishing between acquired and socio-
demographic teacher characteristics that certification and mastery of disciplinary subject
matter and not general teacher certifications, are positively associated with students
performance and particularly so for Master's degrees in mathematics and science.
72
Moreover, teacher experience contributes to student test scores throughout a teacher's
career, rather than the earliest few years.
The workload has presented over the years as a prominent factor of teachers‘
attrition. The fewer the present teachers in a school, are the heavier the workload for the
teachers Consistent with (David, Albert and Vizmanos, 2019), in the Philippines, two
teachers were reported to have taken their lives (suicide) as a result of workload pressure
(Meteo, 2018). Following the sad occurrence of the death of two state school tutors in
2018, the Department of Education vowed to scale back the workload of teachers. Within
the Philippines, teachers' workload appears to be terrible. Outside the traditional six hours
(at 8 am – 2 pm) daily mandatory classroom instruction time, teachers work extends to
other non-teaching tasks. Given the challenging workload, effective instruction or teaching
time is increasingly abandoned by the plurality and concourse of other roles and duties
teachers perform. The heavy workload could initiate a quit or a transfer among teachers,
especially the newly employed teachers.
Carver-Thomas and Darling-Hammond (2017) analytical study concluded from the
2012 Schools and Staffing Survey and the 2013 Teacher Follow-up Survey that the
severity of quits with replacements varies markedly across the country: Teacher quit rates
are highest in the South to some 16.7%. The Northeast of the USA experiences some
10.3% attrition. Where states tend to offer higher pay, support more compact class sizes,
and make greater investments in education. Exit rates are higher for Title I school teachers
serving in poor schools.
Welsh (2017) study entitled ‗School Hopscotch: A Comprehensive Review of K-12
Student USA student transience review of contemporary literature of K-12 student churn
reported that students‘ mobility is widespread with significant policy implication. The
examination revealed that churning schools were related to a negative influence on
students' academic outcomes; however, transferring to higher-quality schools may offset
and outweigh the churning costs of relocating schools.
Henry and Redding (2018) enquiry for quit the consequences for early school quit:
The effects of within the year and end of the year teacher exit used North Carolina
administrative data that separated classroom teacher exit during the school year from the
end of the year quit. The study submitted that students who lost their teachers during the
school year had significantly lower test scores than those students whose teachers stayed.
Moreover, midsection teacher exit leads to underperformance. At the end of the session,
the teacher quit appears to exert unimportant consequences on the outcome. The
detrimental results of within-session teacher exit cannot be explained by other extraneous
73
outcomes or the quality of quitting teachers. Deserting teachers between December and
April unleash a catastrophic outcome on performance. However, these vary with schools
and subjects.
Researchers and policymakers commonly measure teacher exit using an annual quit
rate. While this measure can be helpful in flagging schools that have experienced recent
staff transfer, it does not describe whether schools may be suffering from temporary (or
even healthy) exit or whether they have struggled with deeper transfer problems for years.
Longer run steps help illuminate the nuances and severity of the transfer problems that
schools face over time (Holme, Jabbar, Germain and Dining, 2018).
Coenen, Cornelisz, Groot, Maassen van den Brink and Van Klaveren (2017) study
―Teacher Characteristics and Their Effects on Student Test Scores: A Scientific System
Review,‖ noted that teachers are both crucial critical and indispensable to students learning
and there are attempts by many empirical studies to elucidate the differentials in student
performance by evaluating the impact of particular teacher characteristics without
systematic review for over a decade. The study gave an up‐to‐date review, with supportive
empirical findings from several countries and distinguishing between acquired and socio-
demographic teacher characteristics that certification and mastery of disciplinary subject
matter and not general teacher certifications, are positively associated with students
performance and particularly so for Master's degrees in mathematics and science.
Moreover, teacher experience contributes to student test scores throughout a teacher's
career, rather than the earliest few years.
The workload has presented over the years as a prominent factor of teachers‘
attrition. The fewer the present teachers in a school, are the heavier the workload for the
teachers Consistent with (David, Albert and Vizmanos, 2019), in the Philippines, two
teachers were reported to have taken their lives (suicide) as a result of workload pressure
(Meteo, 2018). Following the sad occurrence of the death of two state school tutors in
2018, the Department of Education vowed to scale back the workload of teachers. Within
the Philippines, teachers' workload appears to be terrible. Outside the traditional six hours
(at 8 am – 2 pm) daily mandatory classroom instruction time, teachers work extends to
other non-teaching tasks. Given the challenging workload, effective instruction or teaching
time is increasingly abandoned by the plurality and concourse of other roles and duties
teachers perform. The heavy workload could initiate a quit or a transfer among teachers,
especially the newly employed teachers.
Carver-Thomas and Darling-Hammond (2017) analytical study concluded from the
2012 Schools and Staffing Survey and the 2013 Teacher Follow-up Survey that the
74
severity of quits with replacements varies markedly across the country: Teacher quit rates
are highest in the South to some 16.7%. The Northeast of the USA experiences some
10.3% attrition. Where states tend to offer higher pay, support more compact class sizes,
and make greater investments in education. Exit rates are higher for Title I school teachers
serving in poor schools.
Welsh (2017) study entitled ‗School Hopscotch: A Comprehensive Review of K-12
Student USA student transience review of contemporary literature of K-12 student churn
reported that students‘ mobility is widespread with significant policy implication. The
examination revealed that churning schools were related to a negative influence on
students' academic outcomes; however, transferring to higher-quality schools may offset
and outweigh the churning costs of relocating schools.
Henry and Redding (2018) enquiry for quit the consequences for early school quit:
The effects of within the year and end of the year teacher exit used North Carolina
administrative data that separated classroom teacher exit during the school year from the
end of the year quit. The study submitted that students who lost their teachers during the
school year had significantly lower test scores than those students whose teachers stayed.
Moreover, midsection teacher exit leads to underperformance. At the end of the session,
the teacher quit appears to exert unimportant consequences on the outcome. The
detrimental results of within-session teacher exit cannot be explained by other extraneous
outcomes or the quality of quitting teachers. Deserting teachers between December and
April unleash a catastrophic outcome on performance. However, these vary with schools
and subjects.
Researchers and policymakers commonly measure teacher exit using an annual quit
rate. While this measure can be helpful in flagging schools that have experienced recent
staff transfer, it does not describe whether schools may be suffering from temporary (or
even healthy) exit or whether they have struggled with deeper transfer problems for years.
Longer run steps help illuminate the nuances and severity of the transfer problems that
schools face over time (Holme, Jabbar, Germain and Dining, 2018).
Amadi and Ezeugo (2017) study ‗Physical Resources Availability and the
Academic Performance of Students in the Universal Basic Education Scheme, Rivers
State‘ revealed that both students and teachers need facilities such as good buildings,
libraries, classrooms, laboratories, good water supply, toilet facilities, security, etc., for
teaching and learning to take place. Regrettably, education facilities at all levels of public
learning institutions are in terrible shape; schools are littered with battered structures;
worn-out equipment (where they are available); rickety and unserviceable vehicles;
75
raggedly classroom buildings; overcrowded classrooms; inadequate manpower in quantity
and quality; instability in the academic calendar owing to strikes; exceptionally low
teacher (staff) morale due to poor remuneration and working conditions as earlier reported
by (Undie and Nike, 2016) in a study ‗Teachers class size, job satisfaction and morale in
Cross River State secondary schools, Nigeria.
In support of the foregoing, the World Bank‘s World Development Report (WDR,
2018) entitled ―Learning to Realize Education‘s Promise‖ reported that education is a
fundamental way to achieve development and growth. Therefore, it is important and
necessary to structure school infrastructure to maximise the availability and efficiency of
the education provided. The report averred that education innate benefits are realized if
education policies are evidence-based and targeted properly focused on high-quality.
The study of Okafor, Maina, Stephen and Ohambele (2016) the ‗Impact of School
Environments on Academic Performance: Feedback from Senior Secondary School
Students,‘ revealed the performance of students would be better if the learning milieu is
made adequately comfortable as per facilities such as schoolrooms and conveniences. The
report presented good indoor air quality, visual comfort and adequate space as
determinants of good learning environments. Unfortunately, these are not in most state
secondary schools.
Contrarily, Wunti, Hafsat and Igbagi (2017) studied ‗the impact school facilities
have on academic achievement of students in Senior Secondary Schools in Bauchi State,
Nigeria,‘ did not find a statistically relevant connection in the areas of school plant and
facilities and student academic achievement. This may be because the study did not use
sufficient contrasting samples and subjects. Contrary to the studies of (Chowa, Masa,
Ramos and Ansong, 2015 and Wunti, Hafsat and Igbaji, 2017), the study of (Ahmodu,
Lateef and Sheu, 2018) examined the relationship between amenities, facilities and
scholars‘ tutorial outcome in Oshodi-Isolo, Lagos State. The finding was that facilities and
their components were connected to students‘ academic outcomes and performance.
Ezike (2018) study on how the classroom milieu influences tutorial interest as it
relates to tutorial gains in senior secondary chemistry in Ibadan, Oyo State found the
classroom environment to be a primary force capable of influencing the tutorial outcome
of scholars. The schoolroom environment has the potential to dictate the level of interest,
motivation and subsequent commitment in any activity and students‘ academic interest
was found to be equally crucial and critical since it positively affects achievement. While
most public secondary schools located in urban areas have a proper and conducive
environment for learning, most located in rural areas are not.
76
A study ‗Student exit, mobility, and attendance in Detroit‘ (Lenhoff, Pogodzinski,
Singer and Cook, 2019) posited that the issues of student exit, mobility and absenteeism
are only a devolution of the challenges linked with administering state secondary
education facilities in large-size urban districts. Endogenous factors show special
confronting issues in Detroit. For example, Detroit gave a whopping 17% as the recorded
rate for all resident students schools switched between 2016-17 and 2017-18, when they
could have stayed at their previous school. On average, school moves are detrimental to
students‘ academic and social outcomes, and they negatively affect other students.
A critical finding is that students experiencing high teachers‘ transfers do less well
in their end of school exams (Gerritsen, Plug and Webbink, 2017) study ‗Teacher Quality
and Student Achievement: Evidence from a Sample of Dutch Twins.‘ The enquiry
indicated test scores of all students were better with teacher experience; teacher experience
also counts for student performance after the beginning years in the job; the teacher
experience effect is most crucial and conspicuous in earlier years..
The aforementioned effects are incomparable to the ambient effects of quit on other
dimensions of the school systems that have been examined in line with the externalities
from the exit of students in schools (Gibbons and Telhaj, 2016). Also (Gibbons, Silva and
Weinhardt, 2015) study reported a body of evidence supporting teachers employment and
quitting the classroom counts, but it is not more disruptive to teaching and learning than
exit between and among students‘ peers. The teacher quit rubs students of their required
services and benefits. This causes parents to contemplate and approve their mobility to
private schools.
Cook-Harvey, Darling-Hammond, Flook, Barron and Osher (2020) study on the
effect for college and classroom practices of an incipient and nascent general agreement on
the techniques of learning and development, analyzed and interpreted evidence from the
learning and teaching of the sciences and a number of other branches of academic research
on well examined and scrutinize steps in favour of the link and learning chances required
to step up learners‘ academic health and well-being. In addition, they reviewed studies
regarding practices that can encourage educators to answer back to learner‘s idiosyncratic
peculiarities, address challenges, and assist resiliency. The study concluded that good
schooling allows for continuity in relationships, consistency in practices, and predictability
in routines that reduce anxiety and support engaged learning; relational trust and respect
between and among staff, students and parents. A system wherein teachers are inadequate
and are frequently transferred cannot guarantee meaningful learning. Learners in this
condition are prone to seek transfers to other schools.
77
Many parents move their children and wards. Students‘ mobility is common and
mostly abrupt. Many students make one or more not promotional switches of schools
before graduating. They do so for multiple reasons. School switches most often arise from
parents. Transferred parents may move with their families as many times as they are
transferred. Such transfers may be voluntary (for example, changing jobs or relocating to
better accommodation) or involuntary (for example, eviction or a family disjunction such
as a separation). However, schools can also initiate school changes, such as when students
are expelled or when schools are closed (Welch, 2017).
Erickson (2018) and EdChoice (2019) studies found that most parents favour
private secondary schools citing a better learning environment, better education, smaller
class sizes, more individual attention, religious education and better preparation for college
as main reasons (Moja, 2000) study for the World Bank titled ‗Nigeria Education Sector
Analysis: An Analytical Synthesis of Performance and Main Issues‘ found that the existing
school buildings are enduring decay caused by neglect of maintenance and repair. The
present conditions of buildings impact negatively on the standard of education offered.
Such conditions have encouraged a brain drain of teaching and administrative personnel
out of the education professionals. The ramshackle school surroundings lead to the high
dropout of learners from school. The fund needed for new buildings is high, and the
projected cost of rehabilitating existing infrastructure is even higher. The need for the
provision of adequate education facilities at all levels of education is urgent.
Rhinesmith (2017) study entitled ‗A Review of the Research on Parent
Satisfaction: Private School Choice Programs' analysis showed that guardians with parents
who choose private schools were more satisfied with their children's schools. Higher
satisfaction for folks with children in privately run schools was reported. School selection
process studies show that private secondary school facility choice is primarily a function of
socio-economic factors like race and income (Sattin-Bajaj, 2015). On what factors
influence the selection of privately owned schools for youngsters (Choi, Moon and Ridder,
2017) research, ‗Within-District School Lotteries, District Selection and Average Partial
Effects of School Inputs‘ and (Suppramaniam, Kularajasingam and Sharmin, 2019) study
entitled ‗Factors Influencing Parents Decision in Selecting Private Schools in Chittagong
City, Bangladesh,‘ supports school popularity, school quality, future option and parents‘
income levels have a link with private schools selection but parents‘ educational levels is
not connected with private secondary school facilities selection.
A preponderance of studies reported that the private schools outperformed public
secondary schools in spite of the government‘s deliberate efforts to enhance the standard
78
of state secondary schools (World Health Organization, 2015 and Rong‘uno, 2017)
studies. The study of (Bonsu, 2016) in Ghana reported that non-public schools were better
funded and so were prone to better academic results as shown by Junior High School
students‘ results compared to their counterpart state secondary schools. The research also
reaffirmed most parents leaving above the average constitute the bulk of their patronage
holding on to student-teacher ratio, accreditation, curriculum and courses, college
acceptance rate, religious instruction and standardized test results. Also, public schools
have better-qualified teachers who are less motivated and more dissatisfied. The research
acknowledges the need to sustain the interest of teachers in the work.
The empirical report (Bukari and Abra, 2017) showed that senior secondary
scholars outperformed their counterparts in economics. Also, there was a statistic mean
performance disparity of students in economics between high school students of the state
and private schools. The state secondary school facilities have better structures and better-
furnished libraries than their private counterparts. State secondary school tutors are more
extrinsically motivated. Teaching and learning materials in most private secondary schools
were rarely used in senior secondary schools.
Kalagbor (2016) reaffirmed private secondary school teachers are supervised more
efficacious than those of state secondary institutions because the teachers are directly and
promptly checked and monitored by their respective principals and proprietors to enhance
student‘s academic performance and teacher service delivery. Teachers‘ absence in private
secondary schools may be intolerable. In state secondary schools, teachers could decide to
be absent from school even without permissions.
According to a research study (Dixon, 2018), students move between schools for
varying reasons and the effects of the move may differ consistently with the rationale. Four
primary categories of a move are distinguished: Structural moves, such moves that occur
due to establishment requirements, like moving from a primary school to an intermediate
one. Transitions prompted by residential issues or by parents relocating for any reason may
have been the consequence of relationship fracture, job switch or negative dynamics
related to housing; ‗Strategic‘ moves include that caused by parents, seeking better
learning institution or match for his or her children and moves resulting from a child‘s
misconduct, such as a new school enrolment following an expulsion.
In its broadest definition, students‘ school mobility describes a transfer of an
academic institute or a learning facility. The literature addressing students‘ mobility
employs different terminology to explain such movements. Student shuttle, attrition,
retention, dropout, school switches, exits, and entrances are all terms applied to denote
79
students‘ movement to and from a learning facility. Some studies employ one or more of
these terms additionally to, or rather than the term ―mobility‖ to describe the phenomenon.
These differences in nomenclature are frequently linked to variation in how mobility is
defined and operated. In most studies, the broad definition of students‘ mobility provided
above is tailored to the particularities of a given study (Dixon, 2018).
Structural and non-structural mobility is about the common distinction researchers
make when studying students‘ mobility. Structural mobility occurs when a student
completes the terminal grade at his or her school and must, therefore, advance to a special
school that serves a higher grade level. A satisfactory general definition of nonstructural or
no promotional, mobility is presented by (Thomas B. Fordham Institute 2012).
Nonstructural students‘ mobility is the phenomenon of students in grades K–12 changing
schools aside from the customary and conventional promotion from elementary school to
middle school or from middle to high school.
The Fordham Institute (2012) averred that students‘ mobility may be structural; a
feature of the way schooling is organised. Thomas B. This movement is not of interest in
studies of mobility. Researchers are often curious about studying non-structural mobility
rather than examining the built into the institutional structure of the education system. This
sort of mobility is more directly influenced by the behaviour and quality of the learners. It
is connected to other outcomes of interest.
Another key distinction as opined by the Thomas B. Fordham Institute (2012)
study and supported by (Masci, Ieva, Agasisti and Paganoni, 2016) study is that there is a
distinct class differential between voluntary and involuntary students‘ mobility. Voluntary
students‘ mobility is instigated by a student and his or her family. Involuntary students‘
mobility is mandated by a school or a more considerable agent of policy. Examples of
voluntary mobility include mobility that results from a student‘s residential move or from
the decision to seek alternate schooling choices.
Mobility that is occasioned by expulsion or the closure of a school would be
examples of involuntary mobility. Involuntary mobility does not give students and their
parents the privilege to remain in their schools. Structural mobility is unavoidably
involuntary, while non-structural mobility may be either voluntary or involuntary (Dauter
and Fuller, 2011 and Thomas B. Fordham Institute, 2012). Strategic and reactive mobility
forms a further distinction between types of mobility. When families initiate students‘
mobility (that is, make a voluntary move), these school changes can be either strategic or
reactive (Dauter and Fuller, 2011 and Dixon, 2019).
80
Strategic moves are those school changes motivated by a desire to seek out better
learning opportunities, e.g., mobile students who made a residential move or transferred to
a private school for higher-order academic activities. Strategic moves ought to ostensibly
result in enrolment in a school that is an improvement over the sending school in some
way, e.g., the presence of adequate teachers, academic achievement or safety deemed
important to the student and his or her family.
Reactive moves are school changes that follow from circumstances unrelated to the
pursuit of higher-quality educational options, e.g., students who made a residential move
that was necessitated by a job loss in the family or parental divorce. This form of students‘
change of school is not for improved schooling options; rather, it is for a neutral change in
school quality and less likely to lead to a positive quality change than a strategic move
(Dixon, 2019).
Rose (2016) study reported that school transfers can be stratified in accordance
with changes occurring in the student‘s life that could initiate moving schools. The extent
of additional changes occurrence is a manifestation of the level of stability of these
learners‘ lives at the time of moving schools. As the level of instability becomes
increasingly worrying, students ―arenas of comfort‖ to aid coping with school and other
challenges change.
The taxonomy of student mobility into residential and non-residential moves was
introduced by (Rumberger, 2015). However (Rose, 2016) separated non-resident moves
into those that occur without any marked change (type 1), those that occur with a change in
school operation (type 2), and those that occur with changes in the educational setting
(types 3 and 4), and residential transfers into those that occur without an unavoidable
change in a family structure (type 5) and such changes that takes place due to sudden
changes in the family structure (types 6 and 7). Types 1 and 2 occur without any change in
the child‘s social group; the remaining types occur when the child transfers alone and thus
does experience change in the social group. Types 3 and 4 occur without any change in the
child‘s residential environment but with changes in the type of educational setting; types 5,
6, and 7 occur with changes in the child‘s residential environment.
Rose (2016) study further breaks down non-residential transfers into those that
occur with no change. Type 1 is those that occur with a change in school organisation and
type 2. Those that occur with a change in an academic setting (types 3 and 4), and
residential switches without remarkable change in a family structure (type 5) and those that
takes place with marked variation in the family structure (types 6 and 7).
81
A study in Detroit found that besides geographic indicators, a more considerable
number of Black students moved schools compared to Latinos or white students. Also,
transient students had lower mathematics achievement scores. Eleven (11%) of students
changed residence between school years, 44% of transiting students had changed
residence. Based on the foregoing, 56% of students that moved schools did not move in the
prior year. This suggests that, outside residential issues, parents often choose schools and
students appear to move to poor performing academies for the higher achieving without
records of long-time teacher or student absenteeism rates (Lenhoff, Pogodzinski, Singer
and Cook, 2019).
Rose (2016) study concluded that in contrast to the school changes that an entire
group of students‘ experiences together, there is an individual change. It involves changes
in a social group and school environments. A number of these ―solo‖ changes involve a
change in the educational setting such as the case when students transfer from the private
sector to the state schools and the other way round or from regular education setting to a
specialized program or school. Other personal changes may be consequent upon changes
in the student‘s residence. Residential changes can further affect other family-based
changes. A substantial portion of the considerable number of school changes is often
caused by either parents or school-starting placement decisions.
Parent-initiated transfers occur when families remain at the one residence, but their
children transfer to schools (e.g., private schools or public magnet or charter schools).
School-initiated transfers happen when school heads place learners in a different
educational setting (e.g., atypical educational placement). Institutional and parent-driven
mobility entails a scholar decision that is based on moving (with a view to improve) the
academic setting for the learner. While these students are in school and enjoy the luxury of
security and comfort of the home and neighbourhoods, there may be a differential in the
quality of the schools‘ environments (Rose, 2016).
The Selya Engel-Rebitzer, Dierker, Stephen, Rose, Coffman and Otis (2016) study
found that parents can choose to transfer their children from the public to private schools
(or vice versa) or, where local district and state policies allow, to a magnet, charter, or
other public schools. Further, parents of children at low-performing Title I schools were
provided with the option to transfer to district-designated higher-performing schools. The
available evidence suggests that there may not be any effect on achievement for students in
Title I choice as reported by the (Zimmer, Gill, Razquin, Booker and Lockwood, 2007)
study. However, there has not been much research on the impact of these kinds of transfers
on student achievement.
82
According to Rose (2016) 'type 3 and 4 moves could be made on behalf of the
scholar with the aim of enhancing the scholar‘s academic milieu.‖ Although disruptive, a
change in schools can afford an important opportunity to enhance the worth of a student‘s
education. In particular, a different school may provide a new learning environment that
conforms more closely to a family‘s educational value and expectations or better
accommodates the academic needs of a specific student.
Rose (2016) and Lleras and McKillip (2017) studies found that learners
experiencing these kinds of transfers can be understood as experiencing a more drastic
change than that involved in Type 1 transfer. In addition, these students are not
transferring with a group and thus lose relationships not only with teachers but also with
peers. The academic structures and expectations at the receiving school are likely more
different from those in Type 1. The process of adapting to the new school settings is often
expected to be somewhat harder and challenging. Similarly (Welsh, 2017) study reported
that on average, school moves are harmful to individual students‘ academic and social
outcomes and that they have the potential to negatively affect other students.
Many researchers investigated the tutorial outcomes related to students‘ mobility as
it is linked to both changes in residence and changes during school. Some school mobility,
in particular, are linked to declines in academic results (Friedman-Krauss and Raver, 2015)
and a rise in behavioral challenges (McNerney, Hill and Pellicano, 2015; Salisu, Chinyio
and Suresh, 2015; Rumberger, 2015; Long, 2017 and Welsh, 2017); an increased chance
that the learner‘s educational needs could also be hidden and unattended to. The conditions
related to school mobility can limit communication between schools and parents, as well
as between school personnel who may fail to transfer and process school records timely.
Studies on mobility effects on academic aftermath reported that highly transiting
students perform poorly in school, with a high marginal propensity to repeat a grade and
not graduate (Hansson and Gustafsson, 2020). Also (Welsh, 2017) study reported that
school and residential changes cut the chances that a student would graduate by more than
half. Also (Welsh, 2017 and Hansson and Gustafsson, 2020) reported that students who
transferred more than once have a slim chance to be proficient in reading like their stable
peers. Mobile third-grade students performed less in mathematics relative to their stable
counterparts. Behavioural problems are also associated with mobile students. Mobile
students display violent attitudes and are more withdrawn than stable students.
Richard, Matthew and Andrew (2015) study entitled ‗School Choice, Students‘
mobility and School Quality: Evidence from post-Katrina New Orleans,‘ examined
students‘ mobility between and within the various sectors and school types with a
83
multinomial framework. The students‘ mobility rate in post-Katrina New Orleans was
almost like those of other traditional urban school districts. The finding revealed a format
in which high-achieving students relocate to high-quality schools whereas low-achieving
students transfer to low-quality schools.
Rumberger (2015) study found that students who change elementary schools
several times are 20% more likely to exhibit violent behaviour in high school. Mobility
also affects stable students. With the entrance of a new student into a class, instruction
lesson time is often lost as teachers struggle to integrate the new student. Teachers in the
new school, without the advantage of familiarity with the students‘ patterns of
achievement and behaviours over time, may not recognise the need to refer such a student
for gifted identification. This may be particularly true if the student exhibits the declines in
achievement and behaviour often associated with moving schools, even if the declines are
temporary (Selya Engel-Rebitzer, Dierker, Stephen, Rose, Coffman and Otis 2016 and
Welsh, 2017).
The availability of motivated teachers who work hard in school helps define a
functional school. What is a school without teachers? If for any reason a school has no
teachers for the subjects offered in it, it becomes obvious it has failed. Consequently, the
students who are negatively affected by the shortage of teachers must seek refuge and
solace by moving to others that can provide the requisite teachers. Since all public schools
are owned, operated and managed by the Government who has so far and well showed
ineffectiveness, corruption, mismanagement, managerial mediocrity, gross unpardonable
and impregnable irresponsibility, then one public secondary school may not be that
different from the other. Therefore, the only available option for those not satisfied with
the public secondary school services is a private secondary school alternative.
In a seeming academic debate for and against the private schools‘ patronage
(McTighe, 2017), advocated the choice of private schools‘ against public schools in a
study entitled ‗The case for private schools after considering the school environment,
teacher and other factors. However (Powers and Potterton, 2017) countered the report of
(McTighe, 2017) in a study entitled ‗The case against private schooling.‘ It is believed that
location has a preponderance influence on the quality of private schools for obvious
reasons. An urban private school may not measure with a rural private school.
Obviously, the report is mixed on whether the private secondary schools are better
than their counterpart publics. While in some respects, they may seem better and in some
places only, in other respects, they may not be as good. The public secondary schools may
obviously be better in more aspects. It may also be true that private secondary schools may
84
never be any formidable rival to public schools. This may not be absolutely true and at all
times.
Teachers’ Compensation and Attrition
An ideal compensation practice should propel workers to double their efforts with
increased zeal and zest. This is a method of offering monetary remuneration in exchange
for work done (Jean, Ungui and Robert, 2017). It has been found that there is a
considerable nexus between compensation strategies and employee performance (Singh,
2019). For example (Inés and Pedro, 2015), reported sales personals‘ salaries system led to
a vital development on personal salesperson outcome and aggregate organisation outcome.
On the other hand (Mayson and Barret, 2016) found that an organisation is able to attract
its employee, motivate, retain and sustain the employees by offering competitive salaries
and matching remuneration. An organisation‘s growth, expansion and development are
largely a function of service matching employee compensation.
Compensation is not centered on regular workers‘ pay only but also salaries paid to
ensure employee retention. It goes above salary transcending pay limits to include other
remuneration and inducements. In this category there are gratis payments, concessions and
bonuses. In Canada, organisations reward staff direct and indirect with monetary
compensation and benefits to motivate and, ultimately, get better performances. Financial
compensation like wages, salaries, performance-related inducements are strictly
maintained in many organisations in order to sustain employees and outplay rivals (Long,
2017).
Employee compensation is both crucial and critical as it determines the prognostic
performance and consequent sustainability of the employee in the organisation whether it
be a profit or non-profit-oriented organisation. The studies (Pepra-Mensah, Adjei and
Agyei, 2017; Sutcher, Darling-Hammond and Carver, 2019; Lavdrim and Altan, 2019) are
consistent with that. The studies reported that while the most working condition variables
in the study models lacked statistically significant relationships with quit, compensation
and administrative support, significantly. The studies found that beginning teacher pay did
not predict teachers quitting in the models; however, the district‘s largest salary package
was related to teacher exit. The studies also found the absence of management support;
scant teacher salaries and remuneration-linked factors are connected to higher quit rates.
Education Week (2018) posted that macro statistics give the notion that the US has
many issues with attrition, but the reality remains at the state levels. Almost all the states
85
have issues with teachers‘ attrition which have been confirmed to be more serious in rural
areas. The report revealed that the poor pay package underlined all the cases of sparing
teacher presence. School climate, level of autonomy to teach, leadership, school funding
and benefits were cited as the next crucial to salaries. This affirms the fact that pay
increase is the one solution to teachers‘ attrition issues. Another report (Staufenberg, 2018)
averred in the school‘s weekly publication of 23 March 2018 that a 5% pay supplement for
early-career science and mathematics teachers could have avoided the increased shortages
of teachers‘ years back.
Darling-Hammond and Carver-Thomas (2019) averred that the pay package of
beginning teachers is not the reason teachers‘ resign their jobs after controlling for the size
of school class rooms, district type, and other school factors. However, the highest possible
district salary was related to teachers‘ resignation. That is, teachers who were likely to earn
more than $78,000 at the highest end of their district salary schedules (the top quintile of
teachers) had an estimated quit rate of 31% lower than those with maximum district
salaries of less than $60,000 at the bottom quintile of teachers. Teachers in districts that
offered salaries up to $72,000 to $78,000 were 20% less likely to quit than those in the
bottom quintile.
In a study conducted in Kenya, secondary school teachers were reportedly highly
discontented with every facet of their remunerations. Basic salaries, inducement and
workplace conditions largely affected teachers‘ job satisfaction (Muguongo, Muguna and
Muriithi, 2015). The report provided strong evidence supporting the connection between
salaries and workers‘ job satisfaction. Also (Sutcher, Darling-Hammond, and Carver-
Thomas, 2016) research had seen a significant and positive correlation between
compensation design and employee satisfaction. The report indicated that compensation
served an important role in staff management. It suggested, therefore, that if the design and
management of a compensation system are appropriate, employees are likely to be
motivated to give their best and shun attrition.
In some states in America, teachers take home is meagre, and that qualifies the
teachers for public benefits. Tutors who are mid-way in to the service have put in up to ten
years of service and are responsible for families of four or more were considered for
benefit programs like the Children‘s Health Insurance Program and the National School
Lunch Scheme (Boser and Straus, 2014). Following tutors scant pay, mid-career teachers
qualified for up to several benefit programmes in Arizona, Colorado, Maine, Minnesota,
Montana, North Carolina, North Dakota, and South Dakota in the year 2014, The enquiry
indicated about 1/2 of state secondary academy tutors were contented with their salaries;
86
45 percent of teachers who reported dissatisfaction offered to quit as soon as they find a
better job offer (NCESS, 2018).
Compensation management is a programme designed to maximise employee
productivity. The concept of employee benefits is treated with regard to other factors.
Several researchers (Bode, Singh and Rogan, 2015 and Cloutier, Felusiak, Hill and
Pemberton-Jones, 2015) have established that compensation and job satisfaction are
positively inter-connected. Job contention is a function of a worker‘s motivation which in
turn brings about higher job performance and organisational engagement.
Singh (2019) study also averred that compensation quality determines the hiring
and retention of employees to attain the objectives of an organization and is the basis of
involvement of individuals to reinforce the performance of employees. Employee
satisfaction is workers‘ contention with their jobs. Compensation is all the benefits and
rewards workers get for their services to the organisation (Salisu, Chinyio and Suresh,
2015). Therefore, employees will be contented (Satisfied) following an adequate
compensation for the services they offer. For most people, the pay is the primary reason
they work.
European Commission/EACEA/Eurydice (2018) reported that in the majority of
European countries, there is a clear statutory salary divide between education levels.
Primary and especially pre-primary teachers receive fewer salaries than secondary level
teachers. Within the secondary education system, secondary education teachers get higher
statutory pay than in lower secondary education. Salaries increase with increasing
education except for Western Europe where salaries are relatively poorer. In Bulgaria and
Romania, starter salary packs are about 1/3 of the EU average salary. At the highest salary
echelons, many countries with lower starting salaries fare less than the EU average
including Malta, Italy, Finland, Sweden, the United Kingdom, Norway and Iceland.
However, in 2016/17, there was a general salary upgrade for teachers in most EU
member countries. A reform in policy on remunerations brought a change in the pay
structure and scales of about 4 % or more (as against salaries in 2015/16) in Ireland and
eight other Member States from Central and Eastern Europe (specific Estonia, Bulgaria,
the Czech Republic, Hungary, Austria, Romania, Latvia and Slovakia). Collective
negotiation led to a salary surge of over 3 % in Denmark, Malta, Sweden, Iceland and
Montenegro (European Commission/EACEA/Eurydice, 2018).
Darling-Hammond and Carver-Thomas (2016) research suggested that many policy
decisions can be considered to relieve teacher shortages. Transient measures may not
resolve the predicament of empty classrooms, but they can often complicate the challenge.
87
For example, if unsuitable, ill-prepared teachers are employed, the much higher quit rates
that result in are costly. Money and time are spent on the process of replacing quitters; a
fall in student achievement in high-teacher quit schools becomes an attendant. Long-term
solutions directed at employing and retaining may relieve shortages while also prioritizing
student learning and a strong teacher workforce. For the aforesaid to be in place, the policy
should provide district incentives to raise teacher salaries statewide.
Dulay and Karadağ (2017) study on the sway of school climate on student
academic achievement performed a meta-analysis of 90 studies of a wide range of
reviewed related literature with a sample of 148,504. The analysis indicated that a school
climate had a moderate-level positive influence on a student‘s achievement, and the school
climate is determined by the leadership of the principal (Horton, 2018). The study
concludes employee engagement brings about increased performance, and an attendant
increase in output is not arguable.
The administration of schools by principals counts. A study (Sitienei, Koech and
Cheboi, 2018) entitled ‗An Empirical Analysis of Employee Engagement on Employee
Performance in Technical Institutions in Kenya‘ showed a beneficial and meaningful
association between employee involvement and employee productivity. The study
concluded that engaged teachers perform above board and discourage students‘ mobility to
other schools.
Principals are indispensable in teacher retention (Murrtedjo and Suharningsih,
2018) study entitled ‗The role of the principal in optimizing school climate in primary
schools,‘ the study of (Holme, Jabbar, Germain, and Dinning, 2018) entitled ‗Rethinking
teacher turnover: measures of teachers‘ attrition in schools‘ and (Hemphill, Richards and
Templin, 2018) study entitled ‗Personal and contextual factors related to teachers‘
experience with stress and burnout,‘ found one reason most cited for exits; dissatisfaction
with the profession. The relationship between the absolute absence of satisfaction,
inadequate satisfaction and leaving the profession has been studied elsewhere with similar
results (Kraft, Marinell and Yee, 2016 and Marinell and Yee, 2016).
Ryan, von Der, Pendergast, Saeki, Segool and Schwing (2017) study probed the
connection between quit intention and test-based accountability policy, teacher test stress
and burnout intentions.‘ The enquiry controlled for experience with data from 1,866
teachers. The investigation showed that accountability predicted significantly higher test-
stress, attrition and burnout. Greater teacher experience was significantly linked to a lower
teacher transition between schools. The findings showed across several states that greater
88
teacher quit intent and a higher teacher stress level are a function of the policy of
accountability.
The aforementioned study and that of (Rodriguez, Springer and Swain, 2018)
entitled ‗Sorting through Performance Evaluations: The Effects of Performance Evaluation
Reform on Teachers‘ attrition and Mobility‘ established the link between test stewardship
practice, teacher test stress, burnout and quit intents with data and structural equation
models. They reported that test accountability policies may account for the higher teacher
stress records and quit intent.
Von der Embse, Nathaniel and Pendergast, Laura and Segool, Natasha and Saeki,
Elina and Ryan, Shannon (2016) study entitled ‗The influence of test-based accountability
policy on school climate and teacher stress across four states,‘ examined the relationship
between teacher test stress accountability and school climate in four states of the United
States. Structural data analysis of 6,428 tutors shows higher stewardship strain predicts
stress surges in the environment, curriculum-related tension, teacher tension in general,
and teacher strains specific to testing. Pressures build up with more negative intra student
relationships connected to cumulative teacher strains and stresses. The study averred test-
based accountability programmes are not favourably linked with school conditions and
teacher pressure and strains.
Jonyo and Jonyo (2017) in a conceptual paper titled ‗Teacher Management:
Emerging Issues in Kenya,‘ assessed emerging issues on tutors management in Kenya. The
review focused on the Act establishing the commission of teacher‘s service in the
constitution of Kenyan, 2010; its transformation into an independent commission and the
implication of its improved mandate. The review found a concatenation of emerging
education challenges like teacher inadequacy, teacher conduct and provision of qualitative
education, professionalizing teaching, litigation, teacher performance, information,
promotion of teachers, communication and technology-driven HIV and AIDS,
management, industrial disputes, and promotion of teachers into leadership positions.
The primary school teachers‘ association of New Zealand‘s (NZPPTA, 2016)
narrative is not different. It averred the secondary school teacher supply discount reflected
the non-financial benefits or disadvantages of the job. It recognised salaries alternatives
expected in jobs outside teaching in exchange for non-financial benefits perceived to be
part of teaching. In a job with a high vocational component, employees will be willing to
forego salaries they could earn in the other sectors. Teacher pay also fared very poor in the
international scene. American teachers worked more hours than teachers in some Member
89
Countries of the (OECD) countries but receive less pay relative to other educated workers
at par with them (OECD, 2017).
In line with the above, the (NZPPTA, 2016) Secondary school teacher supply
report submitted that the factors affecting the rate of teacher discount in the profession
among secondary school teachers included the heavy workload, large class sizes, job-
related stress, teacher morale, health issues, student-teacher rapport, support, societal
value, job satisfaction, work-life balance and employee security. Quit may be a critical
integral of recruitment and retention for teachers of subject areas with fewer teachers.
Non-financial factors, along with the economic choices made by teachers, interact to
determine how many teachers continue to make themselves, available to schools each year.
Carver-Thomas and Darling-Hammond (2017) research study reported most
teachers often cite dissatisfaction as a critically significant reason for resigning from the
profession. The most occurred area of dissatisfaction shown by voluntary quitters in 2012–
13 was tests and accountability records (25%), followed by unhappiness with the school
management (21%) and dissatisfaction with the teaching job (21%), which could have
been a factor of many variables. Some of these teachers may be among those who left to
pursue another job (31%) and those who left for financial reasons (13%) as teachers could
cite multiple reasons for leaving.
The second largest bulk of quitters consist of tutors who left for personal reasons or
family. This includes moving to a more conveniently located job or accommodation,
health reasons and caring for family members. A research study had reported the stress of
the heavy workload and no support of teachers remains the primary predictor of teacher
exit of the profession much faster than they can be replaced in England. However, schools
with dwindling budgets that are facing inflation may not improve the welfare condition of
teachers (Carver-Thomas and Darling-Hammond, 2017).
The findings of (Stanley, 2018) study entitled ‗Teachers are at breaking point. It's
time to push wellbeing up the agenda‘ supported the stress factor. Teachers seeking mental
health support have risen by 35% in the past 12 months. Many of them are in crisis. This is
also supported by (Tapper, 2018) paper entitled ‗burned out: why are so many teachers
quitting or off sick with stress? Between April 2017 and March 2018, there was a 35%
surge of support seeking teachers from to 3,136 from 2,321. Teachers are struggling with
the task of greater accountability, increasing testing culture and workload. The study noted
that growth in demand for mental health support underlines the 2017 health survey in
which a third of education professionals said their job had made them feel stressed most or
all of the time in the past few weeks, compared to a paltry 18% of the UK workforce. A
90
staggering 53% had also contemplated leaving teaching within the past two years under
health pressures.
Geiger and Pivovarova (2018) policy brief reported the causes of a teacher quit
worldwide include poor salaries, poor teacher preparation programmes, a massive
workload and poor service conditions. Qualitative and quantitative public schools‘
teachers‘ data analysis and working conditions survey reports were used to determine the
link between quit patterns, perceived working conditions at their schools and the
characteristics of their employers‘ schools.
It is obvious that private school operators, whether pre-primary, primary or
secondary, generally do not pay better salaries than the public except in very few and
extraordinary instances. There are no pension schemes and opportunities for in-service
training, which, of course, influence reasons for attrition. Observation shows that on the
average, the entry-point salary for a university graduate and HND holders is between 30
and 35 thousand Naira monthly. In better-paying schools, the average pay is between 25
and 30 thousand Naira without a significant increase over time. This is a pittance
compared to the stable average of 45 thousand Naira the Delta State Government pays for
now.
In the face of this glaring salary differential, the teachers serving in the private
secondary schools keep hoping to secure a civil service job. As soon as these hopefuls get
the public service teaching or other jobs, they move; leaving the private secondary schools
without enough teachers. Most of the private school teachers are, however, not members of
the Teachers Registration Council (TRC); therefore, they are not paid as teachers ought to
be paid. The Nigeria Union of Teachers (NUT) has not been able to achieve a uniform
salary for her teachers. Private secondary school teachers registered with the Teacher
Registration Council are paid less than their state civil servant counterparts in some of the
private schools.
Geiger and Pivovarova (2018) policy brief also indicated that three rigorous studies
of the effects of programs designed to increase the supply of teachers in high‐need schools
supported better remuneration for teachers. It is obvious that the teacher exit is usually
initiated by a concatenation of factors ranging from the three main components of the
teacher working conditions; principal effectiveness, such as teaching aid, professional
development and salaries. Other are school characteristics like enrolment, geographic
location, and student characteristics.
Also (Partelow and Konoske-Graf, 2017) reporting for the American Centre for
Progress in a study entitled ‗Starting Strong: How to Improve Teachers‘ Entry into the
91
Profession,‘ reported that many residency programmes require teacher candidates to spend
part of their time delivering lessons to students under the guidance of a mentor teacher
who provides feedback on both the delivery and management of classes. Also (Scharp,
2019) study had noted that an induction period similarly allows new teachers to ease into
the profession with help from more experienced mentors.
Scharp (2019) study entitled ‗Impact of New Teacher Induction on Beginning
Teachers,‘ examined new teachers‘ perceptions of induction programmes created by the
Federation of Related Christian Churches school system to help new teachers and increase
retention rates in their schools. Professional development opportunities, mentoring and
principal engagement were considered the best of the NTI to teacher self-efficacy support.
Fresh graduates of private teacher training schools of a three-year period that participated
in the NTI program comprised the sample. The study found both pragmatic and gloomy
perceptions of the NTI program on the trainees. Some new teachers were not satisfied with
the programme. They recommended the development of the procedure, mentor proximity
and policies. There was no perceived link between the programme and intentions to quit
teaching.
The Selya Engel-Rebitzer, Dierker, Stephen, Rose, Coffman and Otis (2016) study
used 2010 public high school data of 319 10th graders to estimate how students‘ mobility
affects numerals, science and writing scores in an academic performance test. After
matching mobility against qualification for free or low-cost lunches; students on gender,
race, ethnicity, analyses indicated lower performers were not eligible for free, reduced
lunches, and they moved more but not among eligible students. Also, mobile students
performed poorly in science examinations. The study concluded that mobility had a
negative impact on test performance.
Tonda (2019) in a study entitled ‗The Effects of Alternative Certification Program
Type on Teacher Self-Efficacy: A Causal-Comparative Study‘ analysed each domain of
teacher self-efficacy statistically with a one-way test of mean differences among teacher‘s
efficacy scores. The study found statistically remarkable disparity in teachers‘ average
scores in three domains of teacher self-efficacy and recommended further testing with
mixed methods continue. The study concluded that comprehending different teachers‘
perception training experiences of sense of efficacy gives program developers a realistic
view on methods that support teachers more as the basis for teacher retention.
However, there are mixed views as regards the causes of teachers‘ attrition as there
are writers on it. Each of these three components of the teacher working condition of
service, like school resources, and other school characteristics has some influence on
92
teachers‘ attrition and transfer, principal effectiveness has the strongest influence on
teachers‘ retention (Fuller, Pendola and Young, 2018). In the same vein, it is important to
note that the factors of teachers‘ attrition are strongly endogenous, kaleidoscopic, volatile
and largely moderated by government policies and actions. This is basically because of
endemic, differential, prevailing conditions, situations and circumstances. Therefore,
attrition and transfer predictors in Bayelsa and Delta States may differ in nearby and
surrounding states.
Reasons for Teachers’ Transfer
The Delta State of Nigeria Public service rules revised to 1st July 2001, defined
transfer as the rather permanent drafting of officers from some scheduled teaching
assignments to another or from one class in a school to another within the same work
jurisdiction. In all countries, there are provisions for the transfer of teachers. These
transfers are usually involuntary or voluntary. Voluntary transfers are requested by
teachers‘ consequent upon personal or family situations, circumstances or probably to
obtain wider teaching experience. A significant number of transfers in Botswana, Malawi
and Uganda are granted to allow wives to follow their spouses. These transfers, while
helpfully to the teachers generally, do little to correct the imbalance or disparity between
schools districts or regions (Göttelmann-Duret and Hogan, 1996).
Göttelmann-Duret, and Hogan (1996) study entitled ‗The Utilization, deployment
and management of teachers in Botswana, Malawi, South Africa and Uganda: synthesized
report of a sub-regional workshop and publications. The analyses averred compulsory
teachers‘ transfers appeared to only occasionally help level up the number of teachers both
qualitatively and quantitatively hence the overall effect is that marked discrepancies in
workers distribution between similar-sized schools. In Botswana, the compulsory transfer
is not only legal but also actually implemented with the help of certain compensatory
measures, e.g. transportation and other special allowances. In Bayelsa and Delta States,
regrettably, teachers do not enjoy such compensatory transportation and special benefits
because the policies of the school‘s management Boards do not guarantee that. When a
teacher is transferred, a deadline is given for the teacher to resume in the new posting or
risk a query.
Yi and Sen (2019) study entitled ‗Are Better Teachers More Likely to Move?
Examining Teacher Mobility in Rural China‘ probed teacher mobility in China as a critical
issue in China education with the aid of teacher-level and school-level data from Gansu
93
province middle and primary schools in western China. The investigation indicated that of
the school-level factors, the location of a school was the most consistent factor for teachers
in western China. The link between higher salaries diminished with the factoring in of
districts and effects of the fixed wave. In addition, the probe discovered that higher
professional ranks had a connection with a higher probability of teacher mobility. Also
failing the annual teacher evaluation popped up the chances of quitting the school. It could
be deduced that the desire to work nearer home was the most potent factor of teachers‘
transfer in China.
Luschei and Chudgar (2017) in their study entitled ‗Teacher distribution in
developing countries: Teachers of marginalized students in India, Mexico, and Tanzania,‘
found the absence of facilities, the heavy work load, demanding teaching conditions,
constrained chances for professional development and involuntary transfer by the
education bureau were explanation for teacher mobility inadequate or irregular
compensation were the major factors of teachers‘ transfers in Tanzania, India and
Mexico. These conditions conflict with the conventional teachers‘ preferences for work
in pleasant environments and to be closer home.
In addition (Luschei and Chudgar, 2017) study indicated how a teacher‘s age
(experience), gender and marital status influence teachers‘ preferences and decisions as
to where they teach. The investigation also indicated there was no dissimilarity in the
propensity to move between both genders of teachers. Also, possessing a college degree at
entering teaching, being single and teaching in middle schools were associated with a
lower chance of transferring schools. This does not conform to prior findings that teachers
with a higher level of education tend to have higher mobility rates.
Engel and Cannata (2015) found next to teachers‘ residence choices and work
locations that national and local policies on employment, posting and transferring teachers
affect teachers‘ flexibility in choosing a teaching location. The American teachers market
is small and local consequently the resolution to engage teachers is sectional and not
centralized. It is decided by local school administrators unlike in both states studied where
school principals lack control over teachers‘ transfers. The position of Korean and
Japanese teachers are those of civil servants employed at the national or local level. The
regional governments draft tutors to institutions in need and circulate teachers among
schools to guarantee even spread of teachers as in many European countries, where
teachers are also civil servants and could be assigned to particular schools or compelled to
move between schools as the need arises (Robinson and Yi, 2008).
94
OECD (2020) reported that as per the movement of teachers in Denmark, 10% of
teachers prefer changing schools where possible (20% OECD average). On average, the
teachers transiting schools are mostly dissatisfied teachers who are not teachers from the
start and did not choose to teaching as a first-choice career and are fairly youthful without
significant experience in their current school. They are also more likely to work full-time
and to report teaching in a target class with a moderately higher concentration of
disadvantaged students, modest academic achievers and students with behavioural
problems.
Appraisal of Reviewed Literature
The researcher reviewed the literature in the study covering the following areas.
The Theory of Reasoned Action (TRA), the implication of the theory for teachers‘
attrition, transfers and students‘ mobility to private schools. Secondary school teachers‘
attrition rate; the rate of secondary school students‘ mobility from state secondary schools
to private-owned secondary schools; the pattern of students‘ mobility to private secondary
schools; reasons for students‘ mobility from the state schools to the privates; the link
between teachers‘ attrition and students‘ mobility from the public to private secondary
schools; the link between teachers‘ transfers within the public secondary school system
and students‘ mobility to private secondary schools; the link between teachers‘ transfers
within the public secondary school system and teachers‘ attrition link with students‘
mobility to private secondary schools. Others are teachers‘ demographic factors and
seeking transfers, causes of teachers‘ attrition in public and reasons teacher seek transfers
in state schools.
The reviewed literature focused on teachers‘ attrition and transfer. There is a
paucity of research on the connection between teachers‘ attrition, transfers and students‘
mobility from the public to private secondary schools in Bayelsa and Delta States of
Nigeria. Research has not devoted much attention to secondary school students‘ mobility
in Bayelsa and Delta States. However, there is the perception that students‘ mobility exists
at high rates among candidates entering Junior Secondary School III and Senior Secondary
School III. Also, a better proportion of students‘ mobility appears to take place in the first
terms which is the beginning of new academic sessions. The researcher could not find
any. This gap is what this study seeks to fill by examining the relationship between
teachers‘ attrition, transfer and public secondary schools students‘ mobility from the public
to private secondary schools.

95
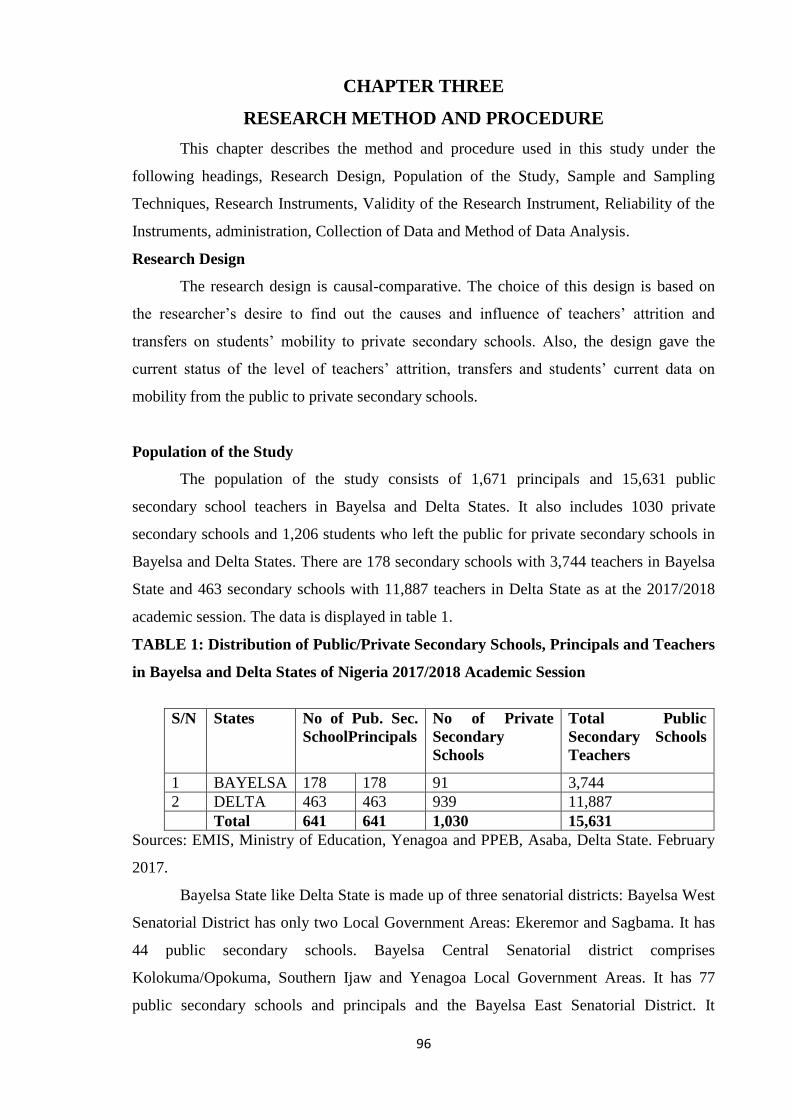
96
CHAPTER THREE
RESEARCH METHOD AND PROCEDURE
This chapter describes the method and procedure used in this study under the
following headings, Research Design, Population of the Study, Sample and Sampling
Techniques, Research Instruments, Validity of the Research Instrument, Reliability of the
Instruments, administration, Collection of Data and Method of Data Analysis.
Research Design
The research design is causal-comparative. The choice of this design is based on
the researcher‘s desire to find out the causes and influence of teachers‘ attrition and
transfers on students‘ mobility to private secondary schools. Also, the design gave the
current status of the level of teachers‘ attrition, transfers and students‘ current data on
mobility from the public to private secondary schools.
Population of the Study
The population of the study consists of 1,671 principals and 15,631 public
secondary school teachers in Bayelsa and Delta States. It also includes 1030 private
secondary schools and 1,206 students who left the public for private secondary schools in
Bayelsa and Delta States. There are 178 secondary schools with 3,744 teachers in Bayelsa
State and 463 secondary schools with 11,887 teachers in Delta State as at the 2017/2018
academic session. The data is displayed in table 1.
TABLE 1: Distribution of Public/Private Secondary Schools, Principals and Teachers
in Bayelsa and Delta States of Nigeria 2017/2018 Academic Session
S/N States No of Pub. Sec.
SchoolPrincipals
No of Private
Secondary
Schools
Total Public
Secondary Schools
Teachers
1 BAYELSA 178 178 91 3,744
2 DELTA 463 463 939 11,887
Total 641 641 1,030 15,631
Sources: EMIS, Ministry of Education, Yenagoa and PPEB, Asaba, Delta State. February
2017.
Bayelsa State like Delta State is made up of three senatorial districts: Bayelsa West
Senatorial District has only two Local Government Areas: Ekeremor and Sagbama. It has
44 public secondary schools. Bayelsa Central Senatorial district comprises
Kolokuma/Opokuma, Southern Ijaw and Yenagoa Local Government Areas. It has 77
public secondary schools and principals and the Bayelsa East Senatorial District. It
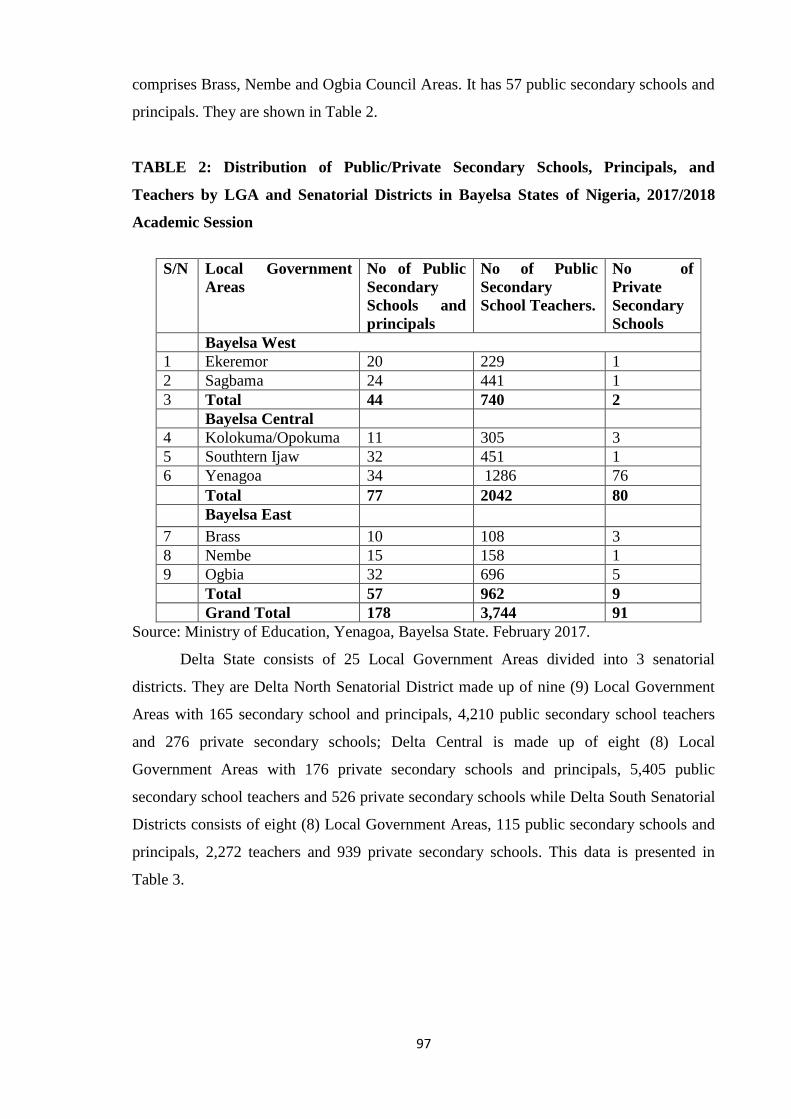
97
comprises Brass, Nembe and Ogbia Council Areas. It has 57 public secondary schools and
principals. They are shown in Table 2.
TABLE 2: Distribution of Public/Private Secondary Schools, Principals, and
Teachers by LGA and Senatorial Districts in Bayelsa States of Nigeria, 2017/2018
Academic Session
S/N Local Government
Areas
No of Public
Secondary
Schools and
principals
No of Public
Secondary
School Teachers.
No of
Private
Secondary
Schools
Bayelsa West
1 Ekeremor 20 229 1
2 Sagbama 24 441 1
3 Total 44 740 2
Bayelsa Central
4 Kolokuma/Opokuma 11 305 3
5 Southtern Ijaw 32 451 1
6 Yenagoa 34 1286 76
Total 77 2042 80
Bayelsa East
7 Brass 10 108 3
8 Nembe 15 158 1
9 Ogbia 32 696 5
Total 57 962 9
Grand Total 178 3,744 91
Source: Ministry of Education, Yenagoa, Bayelsa State. February 2017.
Delta State consists of 25 Local Government Areas divided into 3 senatorial
districts. They are Delta North Senatorial District made up of nine (9) Local Government
Areas with 165 secondary school and principals, 4,210 public secondary school teachers
and 276 private secondary schools; Delta Central is made up of eight (8) Local
Government Areas with 176 private secondary schools and principals, 5,405 public
secondary school teachers and 526 private secondary schools while Delta South Senatorial
Districts consists of eight (8) Local Government Areas, 115 public secondary schools and
principals, 2,272 teachers and 939 private secondary schools. This data is presented in
Table 3.
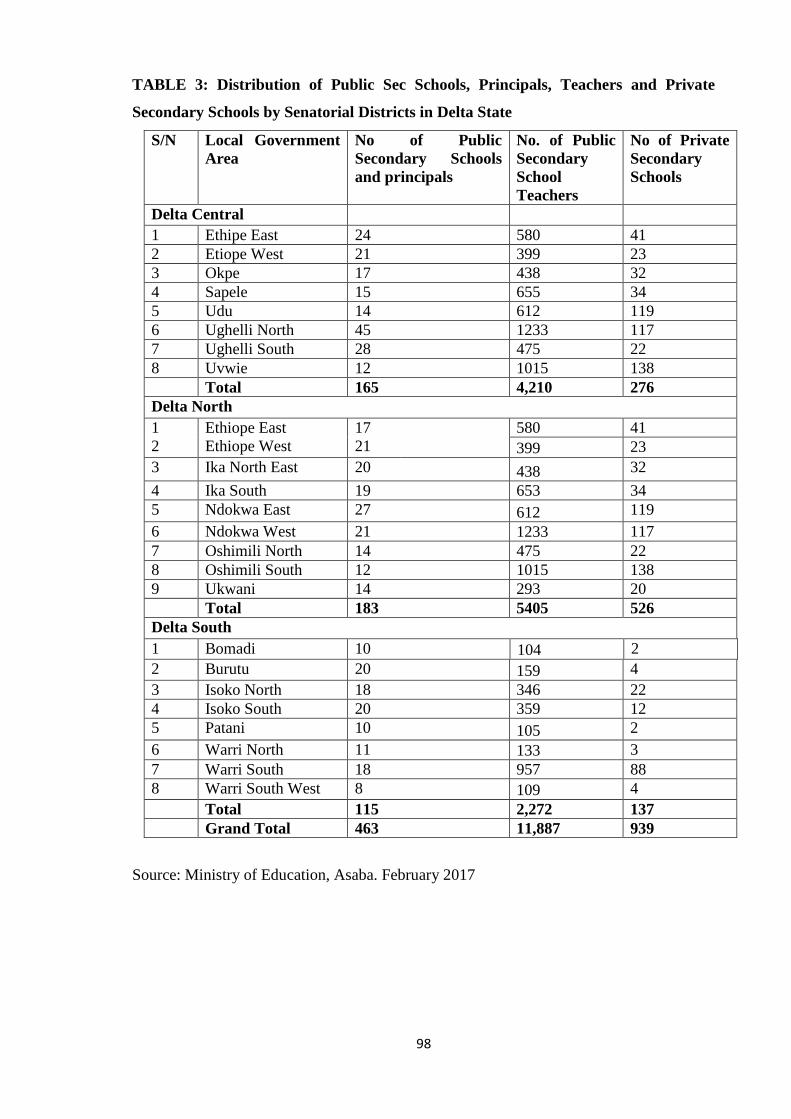
98
TABLE 3: Distribution of Public Sec Schools, Principals, Teachers and Private
Secondary Schools by Senatorial Districts in Delta State
S/N Local Government
Area
No of Public
Secondary Schools
and principals
No. of Public
Secondary
School
Teachers
No of Private
Secondary
Schools
Delta Central
1 Ethipe East 24 580 41
2 Etiope West 21 399 23
3 Okpe 17 438 32
4 Sapele 15 655 34
5 Udu 14 612 119
6 Ughelli North 45 1233 117
7 Ughelli South 28 475 22
8 Uvwie 12 1015 138
Total 165 4,210 276
Delta North
1
2
Ethiope East
Ethiope West
17
21
580 41
399 23
3 Ika North East 20 438 32
4 Ika South 19 653 34
5 Ndokwa East 27 612 119
6 Ndokwa West 21 1233 117
7 Oshimili North 14 475 22
8 Oshimili South 12 1015 138
9 Ukwani 14 293 20
Total 183 5405 526
Delta South
1 Bomadi 10 104 2
2 Burutu 20 159 4
3 Isoko North 18 346 22
4 Isoko South 20 359 12
5 Patani 10 105 2
6 Warri North 11 133 3
7 Warri South 18 957 88
8 Warri South West 8 109 4
Total 115 2,272 137
Grand Total 463 11,887 939
Source: Ministry of Education, Asaba. February 2017
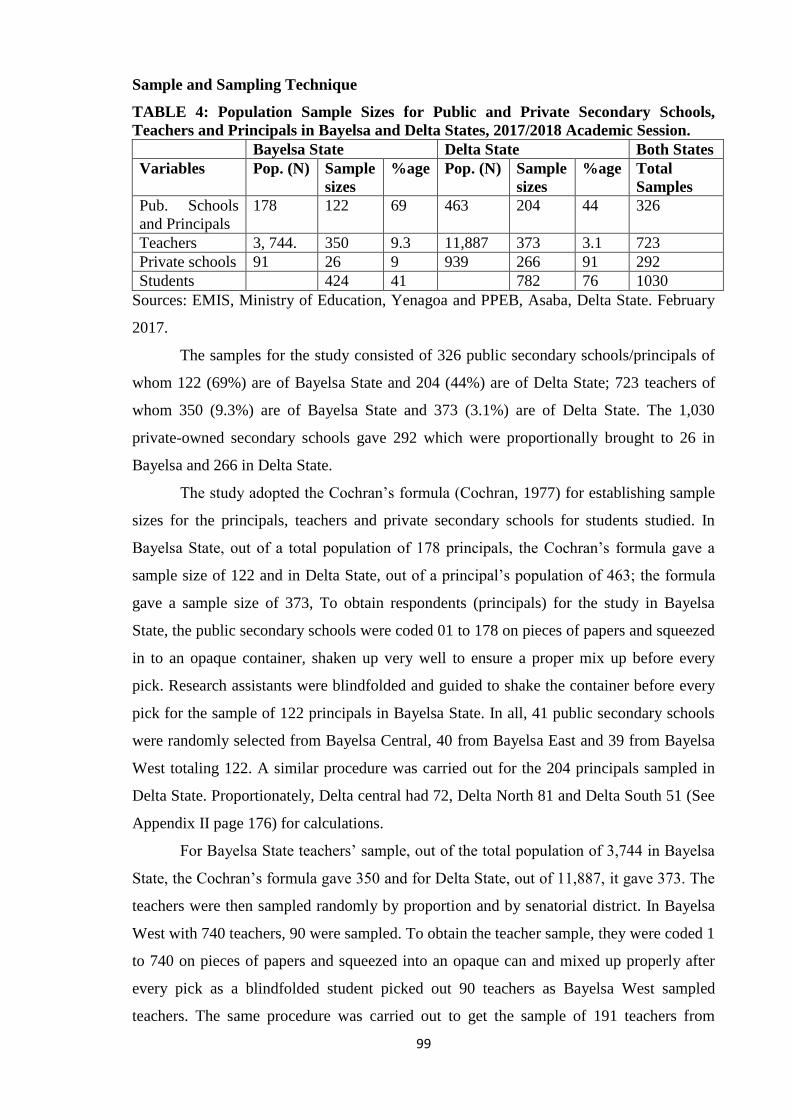
99
Sample and Sampling Technique
TABLE 4: Population Sample Sizes for Public and Private Secondary Schools,
Teachers and Principals in Bayelsa and Delta States, 2017/2018 Academic Session.
Bayelsa State Delta State Both States
Variables Pop. (N) Sample
sizes
%age Pop. (N) Sample
sizes
%age Total
Samples
Pub. Schools
and Principals
178 122 69 463 204 44 326
Teachers 3, 744. 350 9.3 11,887 373 3.1 723
Private schools 91 26 9 939 266 91 292
Students 424 41 782 76 1030
Sources: EMIS, Ministry of Education, Yenagoa and PPEB, Asaba, Delta State. February
2017.
The samples for the study consisted of 326 public secondary schools/principals of
whom 122 (69%) are of Bayelsa State and 204 (44%) are of Delta State; 723 teachers of
whom 350 (9.3%) are of Bayelsa State and 373 (3.1%) are of Delta State. The 1,030
private-owned secondary schools gave 292 which were proportionally brought to 26 in
Bayelsa and 266 in Delta State.
The study adopted the Cochran‘s formula (Cochran, 1977) for establishing sample
sizes for the principals, teachers and private secondary schools for students studied. In
Bayelsa State, out of a total population of 178 principals, the Cochran‘s formula gave a
sample size of 122 and in Delta State, out of a principal‘s population of 463; the formula
gave a sample size of 373, To obtain respondents (principals) for the study in Bayelsa
State, the public secondary schools were coded 01 to 178 on pieces of papers and squeezed
in to an opaque container, shaken up very well to ensure a proper mix up before every
pick. Research assistants were blindfolded and guided to shake the container before every
pick for the sample of 122 principals in Bayelsa State. In all, 41 public secondary schools
were randomly selected from Bayelsa Central, 40 from Bayelsa East and 39 from Bayelsa
West totaling 122. A similar procedure was carried out for the 204 principals sampled in
Delta State. Proportionately, Delta central had 72, Delta North 81 and Delta South 51 (See
Appendix II page 176) for calculations.
For Bayelsa State teachers‘ sample, out of the total population of 3,744 in Bayelsa
State, the Cochran‘s formula gave 350 and for Delta State, out of 11,887, it gave 373. The
teachers were then sampled randomly by proportion and by senatorial district. In Bayelsa
West with 740 teachers, 90 were sampled. To obtain the teacher sample, they were coded 1
to 740 on pieces of papers and squeezed into an opaque can and mixed up properly after
every pick as a blindfolded student picked out 90 teachers as Bayelsa West sampled
teachers. The same procedure was carried out to get the sample of 191 teachers from
100
Bayelsa Central and 69 from Bayelsa East totaling 350 (See Appendix II page 175) for
calculations.
For Delta State, the same procedure was carried out to get proportion samples of
373. For Delta North, a proportion of 132 teachers were obtained; 170 from Delta Central
and 71 from Delta South Senatorial District, totaling 373 sampled teachers. To obtain the
sampled teachers in Delta State states, the teachers were coded oo1 to 081 for Delta
Central, 72 for Delta North and 54 for Delta South. Assistants were blindfolded to pick the
subjects after every mix in an opaque container.
To obtain the schools whose students will be used for the study, the Cochran‘s
formula gave a sample size of 277 out of which Bayelsa has 24 and Delta 253. For Bayelsa
State, the Bayelsa senatorial district gave 3 schools, Bayelsa Central 20 and Bayelsa West
1 only (See Appendix II page 176) for calculations.
For the students, a proportional sample size of 277 private secondary schools was
obtained from a total population of 1,030. Proportionally, it gave 24 for Bayelsa State and
253 for Delta State. To obtain student subjects, 26 private secondary schools were sampled
randomly from the 91. The schools were coded 1 to 90 and squeezed into a container. An
assistant was blind folded to do the picking of the private secondary schools whose
students who have left the state-owned and operated secondary schools were sampled. The
same was done for the Senatorial Districts of Delta State to obtain 20 private schools for
Delta Central, 3 from Delta North and 1 from Delta South (See Appendix II page 176) for
calculations. A proportional random sampling technique was, therefore, used in selecting
principals, teachers and students from each of the three senatorial districts in the two states
studied.
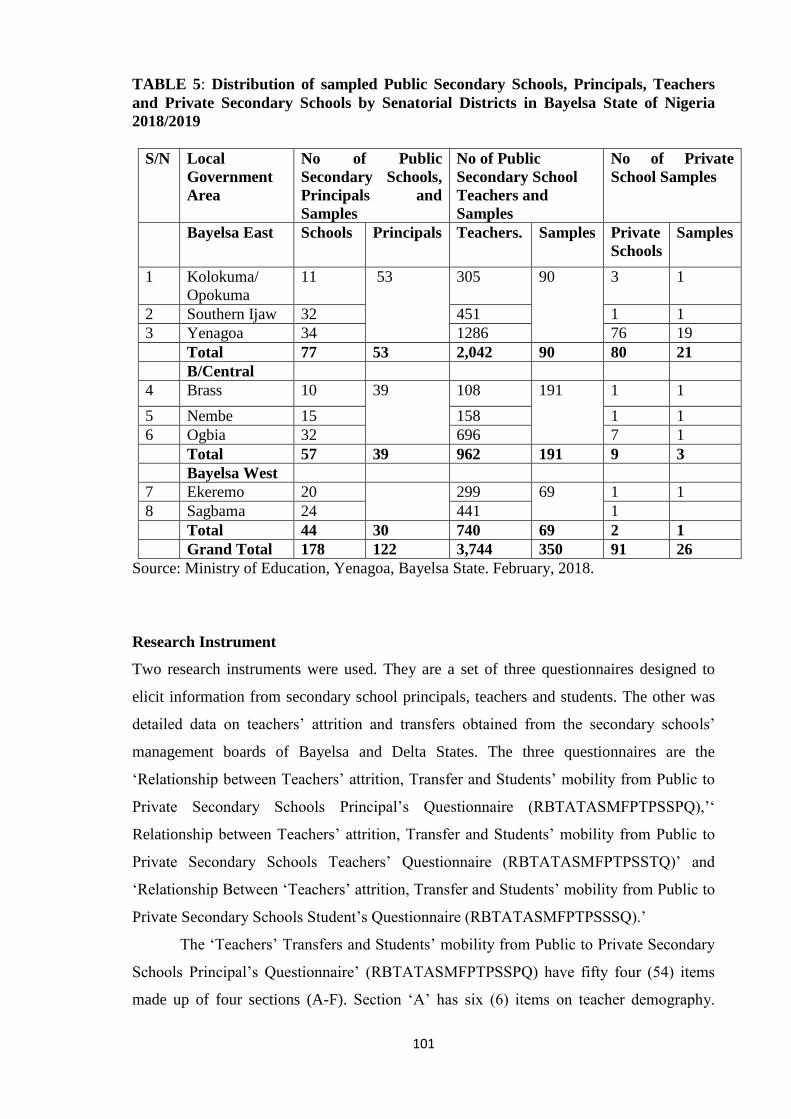
101
TABLE 5: Distribution of sampled Public Secondary Schools, Principals, Teachers
and Private Secondary Schools by Senatorial Districts in Bayelsa State of Nigeria
2018/2019
S/N Local
Government
Area
No of Public
Secondary Schools,
Principals and
Samples
No of Public
Secondary School
Teachers and
Samples
No of Private
School Samples
Bayelsa East Schools
Principals Teachers. Samples Private
Schools
Samples
1 Kolokuma/
Opokuma
11 53 305 90 3 1
2 Southern Ijaw 32 451 1 1
3 Yenagoa 34 1286 76 19
Total 77 53 2,042 90 80 21
B/Central
4 Brass 10 39 108 191 1 1
5 Nembe 15 158 1 1
6 Ogbia 32 696 7 1
Total 57 39 962 191 9 3
Bayelsa West
7 Ekeremo 20 299 69 1 1
8 Sagbama 24 441 1
Total 44 30 740 69 2 1
Grand Total 178 122 3,744 350 91 26
Source: Ministry of Education, Yenagoa, Bayelsa State. February, 2018.
Research Instrument
Two research instruments were used. They are a set of three questionnaires designed to
elicit information from secondary school principals, teachers and students. The other was
detailed data on teachers‘ attrition and transfers obtained from the secondary schools‘
management boards of Bayelsa and Delta States. The three questionnaires are the
‗Relationship between Teachers‘ attrition, Transfer and Students‘ mobility from Public to
Private Secondary Schools Principal‘s Questionnaire (RBTATASMFPTPSSPQ),‘‗
Relationship between Teachers‘ attrition, Transfer and Students‘ mobility from Public to
Private Secondary Schools Teachers‘ Questionnaire (RBTATASMFPTPSSTQ)‘ and
‗Relationship Between ‗Teachers‘ attrition, Transfer and Students‘ mobility from Public to
Private Secondary Schools Student‘s Questionnaire (RBTATASMFPTPSSSQ).‘
The ‗Teachers‘ Transfers and Students‘ mobility from Public to Private Secondary
Schools Principal‘s Questionnaire‘ (RBTATASMFPTPSSPQ) have fifty four (54) items
made up of four sections (A-F). Section ‗A‘ has six (6) items on teacher demography.
102
Section ‗B‘ a table of students who left the school; section C carried eighteen (18) items on
the principal‘s report on teachers‘ attrition factors and factors that could encourage a
teacher to stay in secondary schools in the two states studied. Section ‗D‘ comprised ten
(10) items on principals‘ views on students‘ mobility requests in secondary schools in 2
states under study. Section ‗E‘ contains eleven (11) items on principals‘ reports on the
extent to which teachers transfer influence on students‘ mobility to private secondary
schools. Section ‗F‘ has nine items on the extent to which teachers‘ transfers influences
students‘ mobility to private secondary schools. The items in sections C to E are a-4-point
numerical rating scale.
The second questionnaire, ‗Relationship between Teachers‘ attrition, Transfer and
Students‘ mobility from Public to Private Secondary Schools Teachers‘ Questionnaire‘
(RBTATASMFPTPSSTQ) comprises sixty nine (69) items of four sections A - D. Section
‗A‘ contained eight items on teacher demography. Section ‗B‘ carried 18 items on
teachers‘ attrition factors. Sections ‗C‘ carried 35 items and Section D 9 items. Sections B-
D carried a 4-point numerical rating scale. The third questionnaire is the ‗Relationship
between Teachers‘ attrition, Transfers and Students‘ mobility from ublic to rivate
Secondary Schools Student‘s Questionnaire (RBTATASMFPTPSSSQ). It has 25 items
with two sections (A and B). Section ‗A‘ sought data on teacher demography with seven
items while Section ‗B‘ elicited information on factors with 18 items of the Likert scale.
Validity of the Instruments
The instruments were subjected to Content, Face and Construct Validation
procedures. Specifically, Principal Component Analysis, Varimax Rotation Method and
Kaiser Normalization were applied. The instrument administered on the Principals consists
of 54 items. Six sought principals‘ demography, 18 factors of teachers quit; 10 items
sought principals‘ view on reasons for teachers transfer request, 11 items on principals‘
views on students‘ mobility request and 9 items on principals‘ views on the extent to
which teachers' transfers influence students mobility. All the items were treated to
Principal Component Analysis and Varimax Rotation Method, with Kaiser Normalization.
Content validity readings showed that factors of teacher quit had a 76.41% variance.
Principals‘ view on reasons for teachers transfer recorded a 71.48% variance; principals‘
view on reasons for teachers transfer scaled 65.23% variance while principals‘ views on
the extent to which teachers transfer influence students‘ mobility accounted for 59.64%
variance.
103
The instrument administered on teachers was 70 items of instrument of 4 sections.
Section A sought teachers‘ demography with 8 items while section B had 18 items on the
teachers‘ report on attrition factors and 35 items on the teachers‘ report on reasons for
transfer while 9 items probed the personal reason for teachers‘ transfers. Principal
Component Analysis and Varimax Rotation Method, with Kaiser Normalization Content
validity readings indicated item on teachers report on Attrition factors accounted for
74.65% variance; items on teacher report on reasons for transfer showed an 80.43%
variance while the items focused on personal reason for teachers transfer accounted for
77.43% variance.
The instrument administered to students carried 26 items. Seven probed
demographic characteristics while 19 sought students‘ mobility factors. They were treated
to Principal Component Analysis and Varimax Rotation Method, with Kaiser
Normalization Content validations. The analysis showed that items on students‘ mobility
factors accounted for a 78.71% variance. The construct validity of the instrument
administered on the students was determined using the Factor Matrixes with a reading
ranging from .63 to .74, principals‘ report on teachers quitting the job factors ranged from
.61 to .79. Principals‘ views on reasons for teachers transfer ranged from .59 to .71,
Principals‘ view on students‘ mobility request scale ranged between .76.43 and 85.66
while the overall construct validity of principals report on the extent to which teachers
transfer influence students mobility to private schools ranged from .59 to .70.
The construct validity of the instrument administered on the teachers was
determined using the Factor Matrixes for teachers report on teacher attrition factors
ranging from .71 to .88, teacher report on reasons for teacher transfer, and teachers quitting
the job factors ranging from .61 to .79. Principals‘ views on reasons for teachers transfer
ranged from .59 to .71, Principals‘ view on students‘ mobility request scale ranged
between .76.43 and 85.66 while the overall construct validity of principals report on the
extent to which teachers transfer influence students mobility to private schools ranged
from .59 to .70. On the whole, the validity of the instruments was determined using
Principal component Analysis, Factor Matrixes, Varimax Rotation Method, with Kaiser
Normalization Content validations test; therefore, the instruments were considered valid.
Reliability of the Instrument
A set of three questionnaires was administered to 90 respondents (30 principals, 30
teachers and 30 students) who were not part of the sampled population in Delta State only.
The reliability values were determined using Cronbach‘s alpha statistical tool. The choice
104
of Cronbach‘s alpha was informed by the fact that the items are not dichotomously scored,
and it is a case of attitude instruments that used the Likert Rensis scale with scores that fell
along a continuum. Cronbach‘s alpha reliability readings indicated 0.87 for the principals‘
questionnaire: 0.73 for the teacher‘s questionnaire and 0.77 for the student‘s questionnaire.
The values exceeded the Benchmark of 0.7. Therefore, the instruments were considered
reliable.
Administration of the Instrument
The researcher with ten (10) trained assistants visited the sampled schools,
administered 122 questionnaires to principals in Bayelsa State and 350 to the teachers. The
researcher retrieved 120 principals‘ questionnaires and 346 teachers‘ questionnaires in
Bayelsa State. In Delta State, 204 questionnaires were administered to principals and 373
to teachers. Two hundred and one (201) of the principals‘ questionnaires were retrieved,
while 370 only of the teachers‘ questionnaires were retrieved. The questionnaires were
collated for further statistical applications.
Method of Data Analysis
The data analysis was based on the research questions and hypotheses formulated
for the study. The data were analysed and expressed using descriptive statistical tools such
as frequencies, means and percentages for research questions 1 to 5, 12 and 13.
Specifically, the testing of hypotheses was done using Pearson‘s Product Moment
Coefficient statistics after any other variance was accounted for at the 0.05 level of
significance; meaning the results will have a 95% chance of being true and will be 5%
only due to chance.
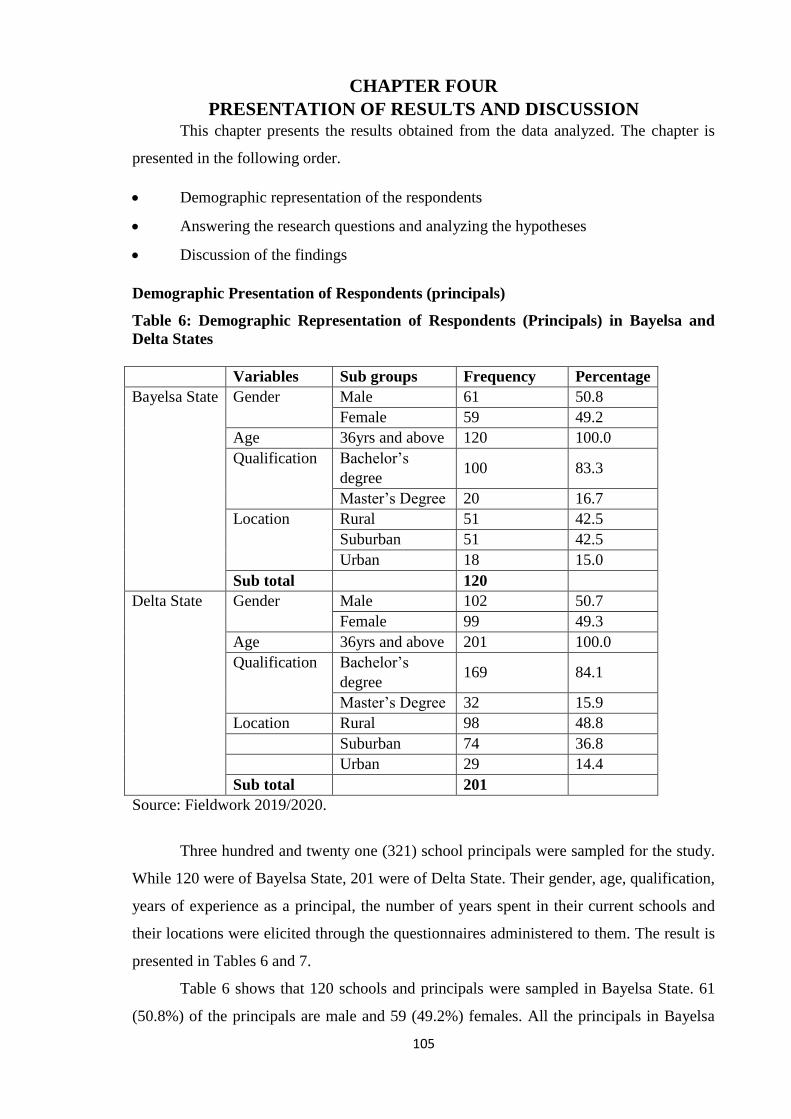
105
CHAPTER FOUR
PRESENTATION OF RESULTS AND DISCUSSION This chapter presents the results obtained from the data analyzed. The chapter is
presented in the following order.
Demographic representation of the respondents
Answering the research questions and analyzing the hypotheses
Discussion of the findings
Demographic Presentation of Respondents (principals)
Table 6: Demographic Representation of Respondents (Principals) in Bayelsa and
Delta States
Variables Sub groups Frequency Percentage
Bayelsa State Gender Male 61 50.8
Female 59 49.2
Age 36yrs and above 120 100.0
Qualification Bachelor‘s
degree 100 83.3
Master‘s Degree 20 16.7
Location Rural 51 42.5
Suburban 51 42.5
Urban 18 15.0
Sub total 120
Delta State Gender Male 102 50.7
Female 99 49.3
Age 36yrs and above 201 100.0
Qualification Bachelor‘s
degree 169 84.1
Master‘s Degree 32 15.9
Location Rural 98 48.8
Suburban 74 36.8
Urban 29 14.4
Sub total 201
Source: Fieldwork 2019/2020.
Three hundred and twenty one (321) school principals were sampled for the study.
While 120 were of Bayelsa State, 201 were of Delta State. Their gender, age, qualification,
years of experience as a principal, the number of years spent in their current schools and
their locations were elicited through the questionnaires administered to them. The result is
presented in Tables 6 and 7.
Table 6 shows that 120 schools and principals were sampled in Bayelsa State. 61
(50.8%) of the principals are male and 59 (49.2%) females. All the principals in Bayelsa
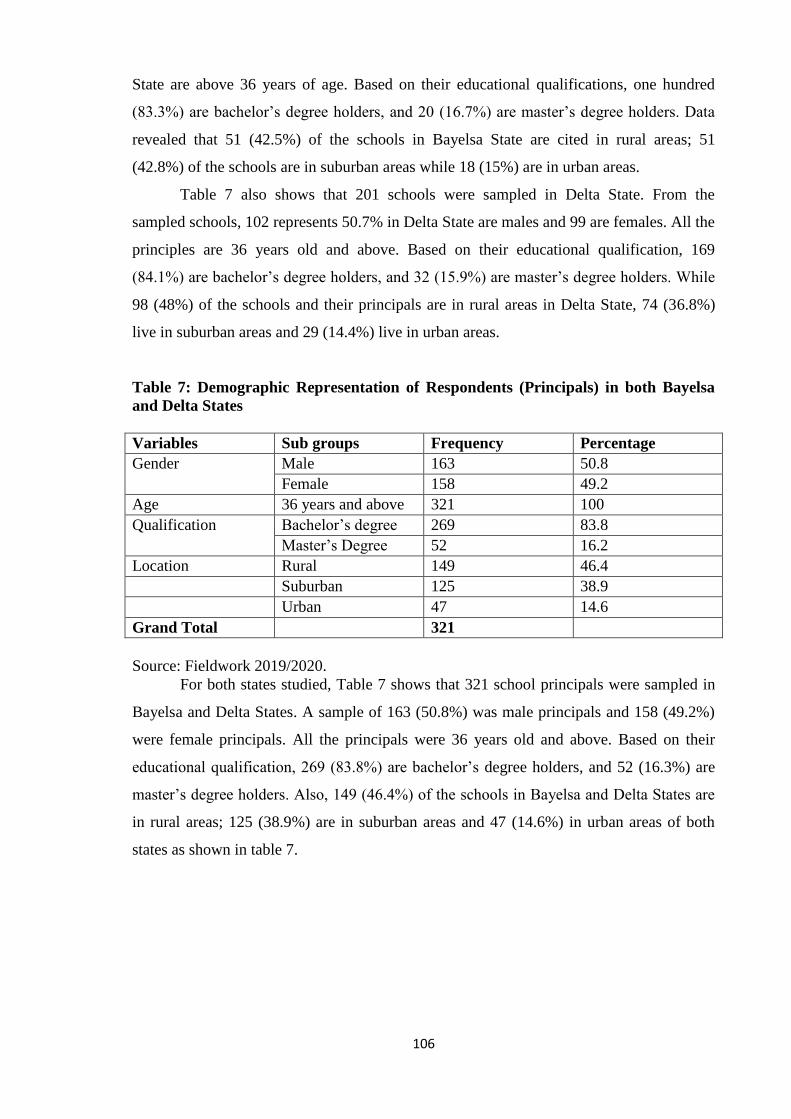
106
State are above 36 years of age. Based on their educational qualifications, one hundred
(83.3%) are bachelor‘s degree holders, and 20 (16.7%) are master‘s degree holders. Data
revealed that 51 (42.5%) of the schools in Bayelsa State are cited in rural areas; 51
(42.8%) of the schools are in suburban areas while 18 (15%) are in urban areas.
Table 7 also shows that 201 schools were sampled in Delta State. From the
sampled schools, 102 represents 50.7% in Delta State are males and 99 are females. All the
principles are 36 years old and above. Based on their educational qualification, 169
(84.1%) are bachelor‘s degree holders, and 32 (15.9%) are master‘s degree holders. While
98 (48%) of the schools and their principals are in rural areas in Delta State, 74 (36.8%)
live in suburban areas and 29 (14.4%) live in urban areas.
Table 7: Demographic Representation of Respondents (Principals) in both Bayelsa
and Delta States
Variables Sub groups Frequency Percentage
Gender Male 163 50.8
Female 158 49.2
Age 36 years and above 321 100
Qualification Bachelor‘s degree 269 83.8
Master‘s Degree 52 16.2
Location Rural 149 46.4
Suburban 125 38.9
Urban 47 14.6
Grand Total 321
Source: Fieldwork 2019/2020.
For both states studied, Table 7 shows that 321 school principals were sampled in
Bayelsa and Delta States. A sample of 163 (50.8%) was male principals and 158 (49.2%)
were female principals. All the principals were 36 years old and above. Based on their
educational qualification, 269 (83.8%) are bachelor‘s degree holders, and 52 (16.3%) are
master‘s degree holders. Also, 149 (46.4%) of the schools in Bayelsa and Delta States are
in rural areas; 125 (38.9%) are in suburban areas and 47 (14.6%) in urban areas of both
states as shown in table 7.
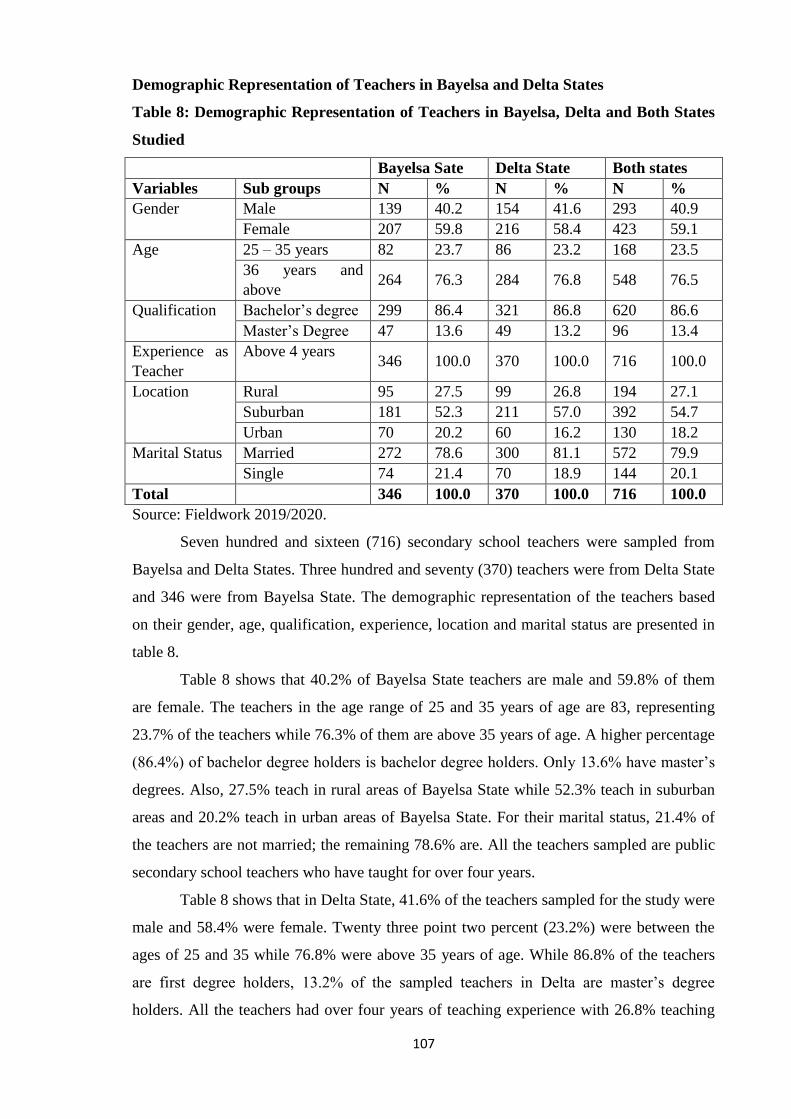
107
Demographic Representation of Teachers in Bayelsa and Delta States
Table 8: Demographic Representation of Teachers in Bayelsa, Delta and Both States
Studied
Bayelsa Sate Delta State Both states
Variables Sub groups N % N % N %
Gender Male 139 40.2 154 41.6 293 40.9
Female 207 59.8 216 58.4 423 59.1
Age 25 – 35 years 82 23.7 86 23.2 168 23.5
36 years and
above 264 76.3 284 76.8 548 76.5
Qualification Bachelor‘s degree 299 86.4 321 86.8 620 86.6
Master‘s Degree 47 13.6 49 13.2 96 13.4
Experience as
Teacher
Above 4 years 346 100.0 370 100.0 716 100.0
Location Rural 95 27.5 99 26.8 194 27.1
Suburban 181 52.3 211 57.0 392 54.7
Urban 70 20.2 60 16.2 130 18.2
Marital Status Married 272 78.6 300 81.1 572 79.9
Single 74 21.4 70 18.9 144 20.1
Total 346 100.0 370 100.0 716 100.0
Source: Fieldwork 2019/2020.
Seven hundred and sixteen (716) secondary school teachers were sampled from
Bayelsa and Delta States. Three hundred and seventy (370) teachers were from Delta State
and 346 were from Bayelsa State. The demographic representation of the teachers based
on their gender, age, qualification, experience, location and marital status are presented in
table 8.
Table 8 shows that 40.2% of Bayelsa State teachers are male and 59.8% of them
are female. The teachers in the age range of 25 and 35 years of age are 83, representing
23.7% of the teachers while 76.3% of them are above 35 years of age. A higher percentage
(86.4%) of bachelor degree holders is bachelor degree holders. Only 13.6% have master‘s
degrees. Also, 27.5% teach in rural areas of Bayelsa State while 52.3% teach in suburban
areas and 20.2% teach in urban areas of Bayelsa State. For their marital status, 21.4% of
the teachers are not married; the remaining 78.6% are. All the teachers sampled are public
secondary school teachers who have taught for over four years.
Table 8 shows that in Delta State, 41.6% of the teachers sampled for the study were
male and 58.4% were female. Twenty three point two percent (23.2%) were between the
ages of 25 and 35 while 76.8% were above 35 years of age. While 86.8% of the teachers
are first degree holders, 13.2% of the sampled teachers in Delta are master‘s degree
holders. All the teachers had over four years of teaching experience with 26.8% teaching
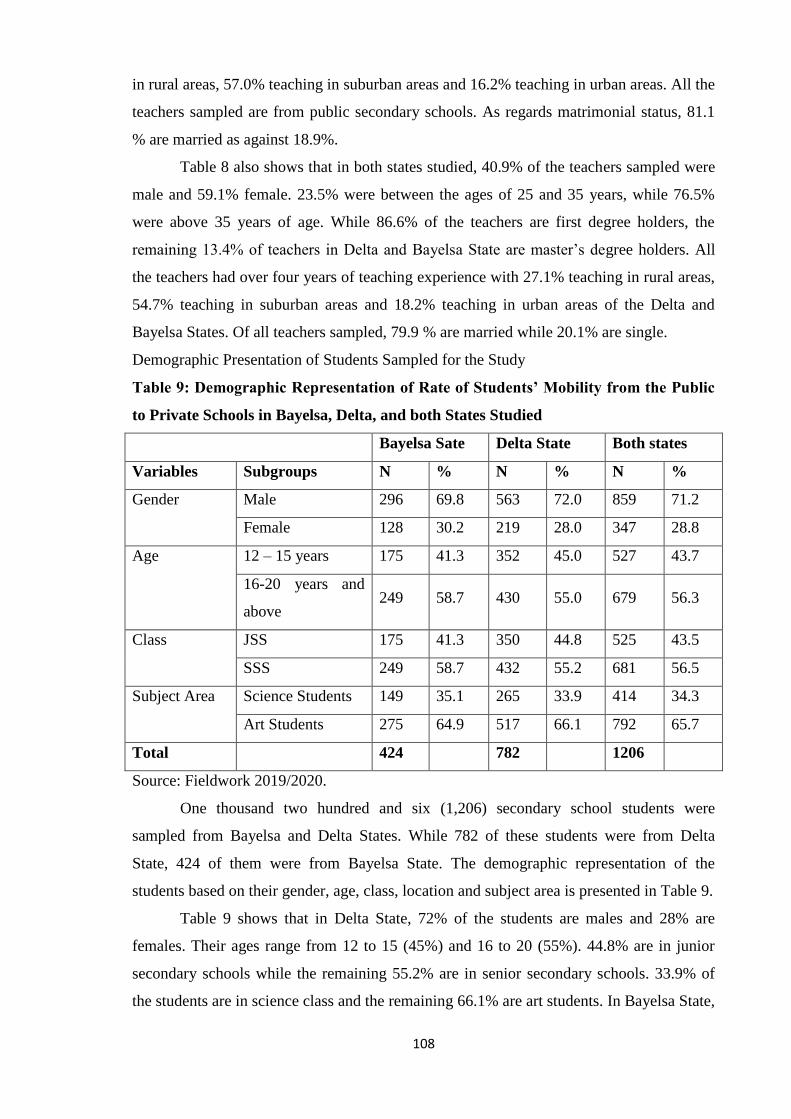
108
in rural areas, 57.0% teaching in suburban areas and 16.2% teaching in urban areas. All the
teachers sampled are from public secondary schools. As regards matrimonial status, 81.1
% are married as against 18.9%.
Table 8 also shows that in both states studied, 40.9% of the teachers sampled were
male and 59.1% female. 23.5% were between the ages of 25 and 35 years, while 76.5%
were above 35 years of age. While 86.6% of the teachers are first degree holders, the
remaining 13.4% of teachers in Delta and Bayelsa State are master‘s degree holders. All
the teachers had over four years of teaching experience with 27.1% teaching in rural areas,
54.7% teaching in suburban areas and 18.2% teaching in urban areas of the Delta and
Bayelsa States. Of all teachers sampled, 79.9 % are married while 20.1% are single.
Demographic Presentation of Students Sampled for the Study
Table 9: Demographic Representation of Rate of Students’ Mobility from the Public
to Private Schools in Bayelsa, Delta, and both States Studied
Bayelsa Sate Delta State Both states
Variables Subgroups N % N % N %
Gender Male 296 69.8 563 72.0 859 71.2
Female 128 30.2 219 28.0 347 28.8
Age 12 – 15 years 175 41.3 352 45.0 527 43.7
16-20 years and
above 249 58.7 430 55.0 679 56.3
Class JSS 175 41.3 350 44.8 525 43.5
SSS 249 58.7 432 55.2 681 56.5
Subject Area Science Students 149 35.1 265 33.9 414 34.3
Art Students 275 64.9 517 66.1 792 65.7
Total 424 782 1206
Source: Fieldwork 2019/2020.
One thousand two hundred and six (1,206) secondary school students were
sampled from Bayelsa and Delta States. While 782 of these students were from Delta
State, 424 of them were from Bayelsa State. The demographic representation of the
students based on their gender, age, class, location and subject area is presented in Table 9.
Table 9 shows that in Delta State, 72% of the students are males and 28% are
females. Their ages range from 12 to 15 (45%) and 16 to 20 (55%). 44.8% are in junior
secondary schools while the remaining 55.2% are in senior secondary schools. 33.9% of
the students are in science class and the remaining 66.1% are art students. In Bayelsa State,
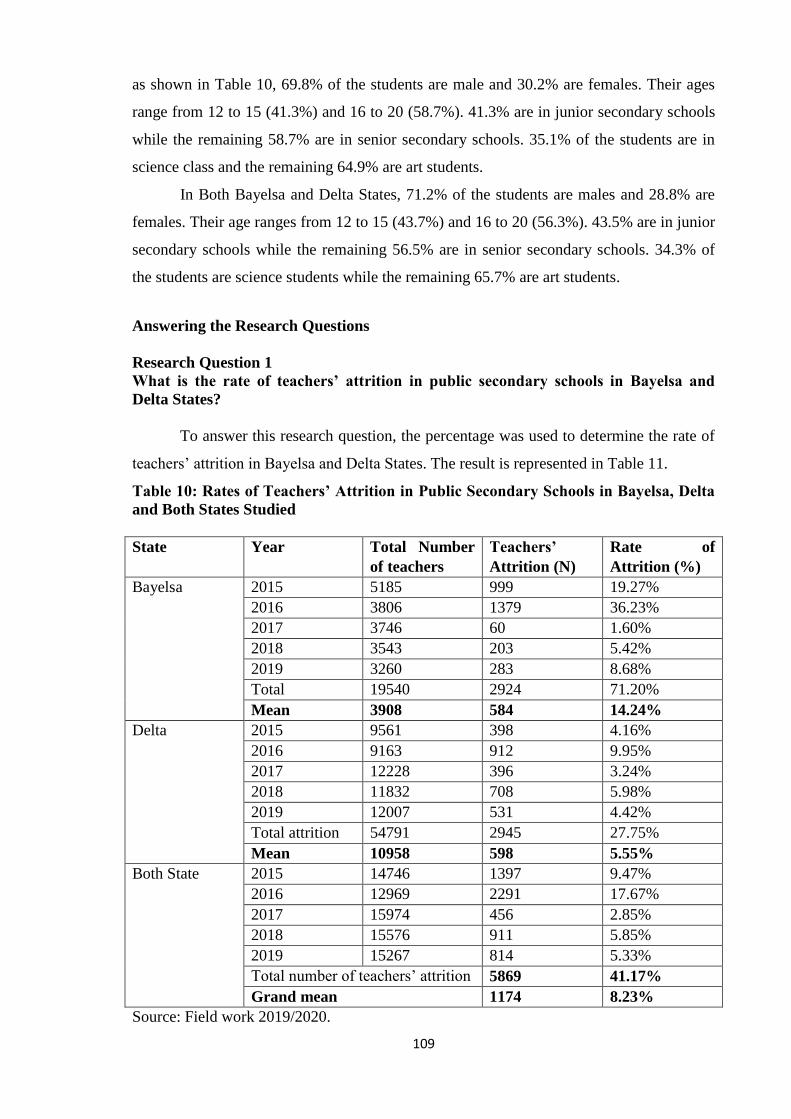
109
as shown in Table 10, 69.8% of the students are male and 30.2% are females. Their ages
range from 12 to 15 (41.3%) and 16 to 20 (58.7%). 41.3% are in junior secondary schools
while the remaining 58.7% are in senior secondary schools. 35.1% of the students are in
science class and the remaining 64.9% are art students.
In Both Bayelsa and Delta States, 71.2% of the students are males and 28.8% are
females. Their age ranges from 12 to 15 (43.7%) and 16 to 20 (56.3%). 43.5% are in junior
secondary schools while the remaining 56.5% are in senior secondary schools. 34.3% of
the students are science students while the remaining 65.7% are art students.
Answering the Research Questions
Research Question 1
What is the rate of teachers’ attrition in public secondary schools in Bayelsa and
Delta States?
To answer this research question, the percentage was used to determine the rate of
teachers‘ attrition in Bayelsa and Delta States. The result is represented in Table 11.
Table 10: Rates of Teachers’ Attrition in Public Secondary Schools in Bayelsa, Delta
and Both States Studied
State Year Total Number
of teachers
Teachers’
Attrition (N)
Rate of
Attrition (%)
Bayelsa 2015 5185 999 19.27%
2016 3806 1379 36.23%
2017 3746 60 1.60%
2018 3543 203 5.42%
2019 3260 283 8.68%
Total 19540 2924 71.20%
Mean 3908 584 14.24%
Delta 2015 9561 398 4.16%
2016 9163 912 9.95%
2017 12228 396 3.24%
2018 11832 708 5.98%
2019 12007 531 4.42%
Total attrition 54791 2945 27.75%
Mean 10958 598 5.55%
Both State 2015 14746 1397 9.47%
2016 12969 2291 17.67%
2017 15974 456 2.85%
2018 15576 911 5.85%
2019 15267 814 5.33%
Total number of teachers‘ attrition 5869 41.17%
Grand mean 1174 8.23%
Source: Field work 2019/2020.
110
Table 10 shows the rate of teachers‘ attrition between 2015 and 2019 for the states
studied. In Bayelsa State, the rate of attrition in 2015 was 19.23%. The attrition rate
increased to 36.23% in 2016; fell to 1.6% in 2017 and increased in 2018 to 5.42% and
8.68% in 2019. The mean rate of attrition across the years of study in Bayelsa State is
14.24%.
In Delta State, it shows that in 2015, the rate of teachers‘ attrition was 4.16%. In
2016, the attrition rate was 9.95%. The rate dropped in 2017 to 3.24% and increased to
5.98% in 2018. It further dropped to 4.98% in 2019. The mean rate of attrition across the
years of study in Delta State is 5.55%. Both states of the study recorded an attrition rate of
9.47% in 2015, 17.67% in 2016, 2.85% in 2017, 5.85% in 2018 and 5.33% in 2019, and a
mean attrition rate of 8.23%.
A graphic comparison of both states Table 10 shows that Bayelsa State had a
higher attrition rate than Delta State in 2015, 2016 and 2019. Delta State recorded a higher
attrition rate in 2017 and 2018.The graph is presented in Figure 1.
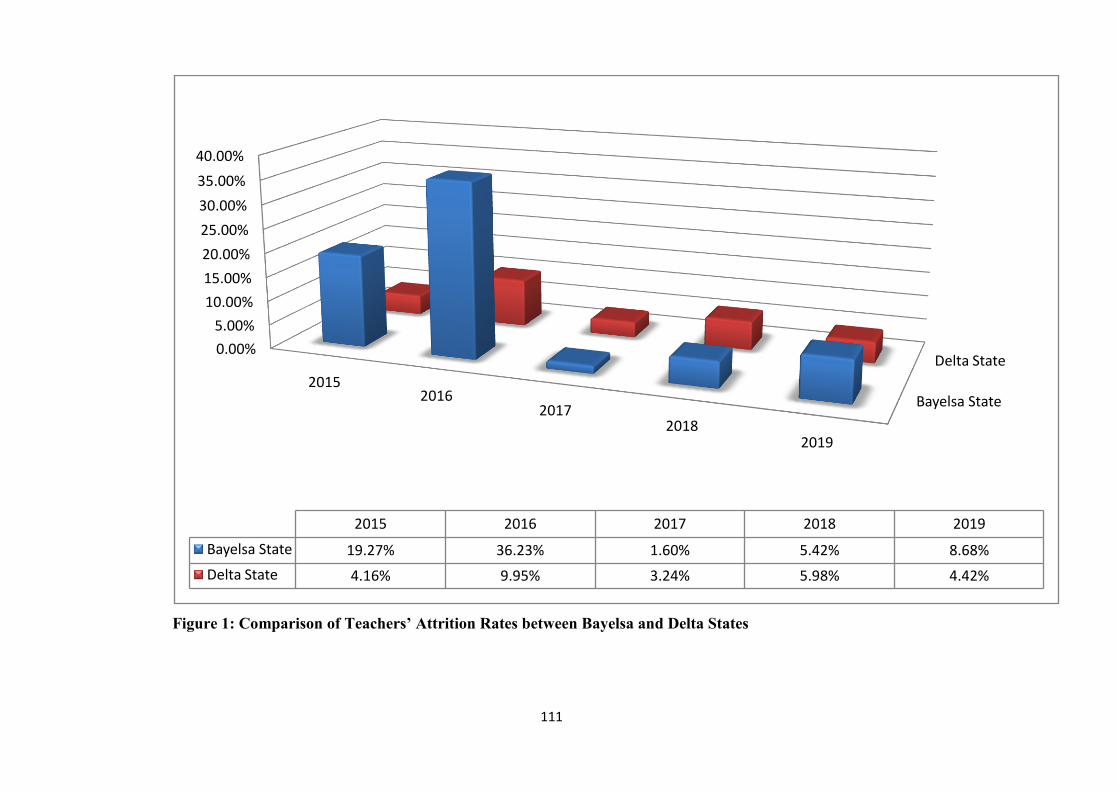
111
Figure 1: Comparison of Teachers’ Attrition Rates between Bayelsa and Delta States
Bayelsa State
Delta State0.00%
5.00%
10.00%
15.00%
20.00%
25.00%
30.00%
35.00%
40.00%
20152016
20172018
2019
2015 2016 2017 2018 2019
Bayelsa State 19.27% 36.23% 1.60% 5.42% 8.68%
Delta State 4.16% 9.95% 3.24% 5.98% 4.42%
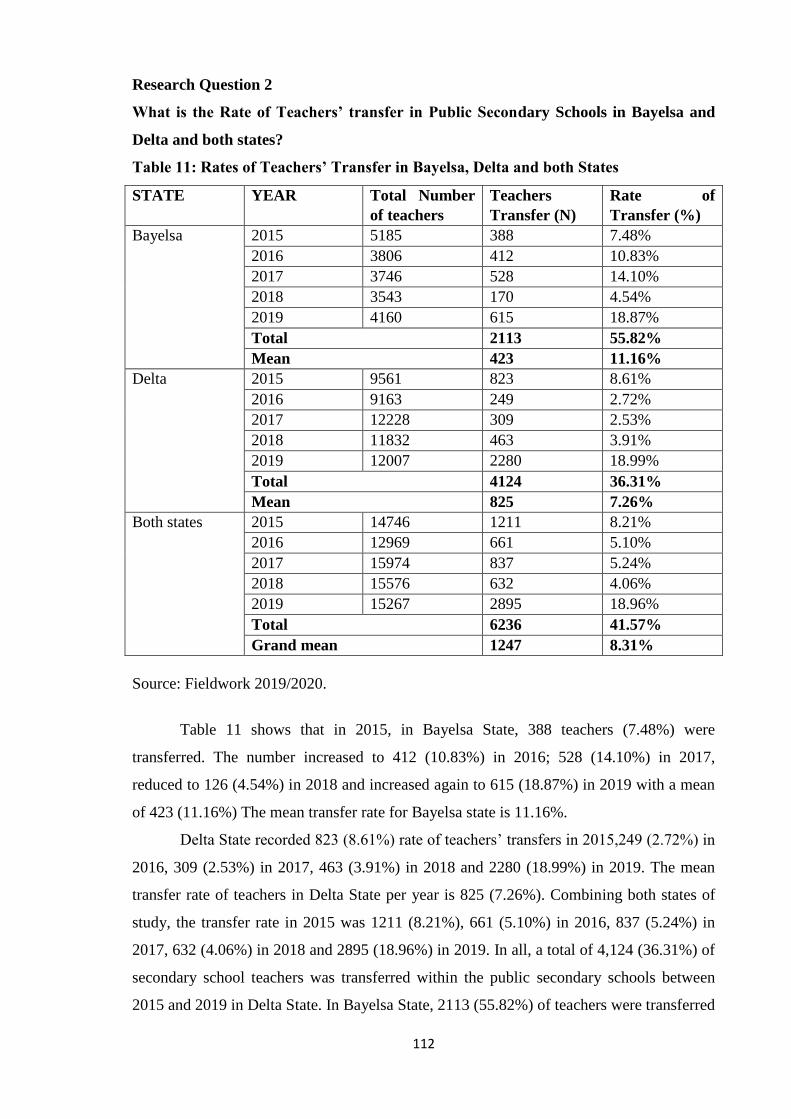
112
Research Question 2
What is the Rate of Teachers’ transfer in Public Secondary Schools in Bayelsa and
Delta and both states?
Table 11: Rates of Teachers’ Transfer in Bayelsa, Delta and both States
STATE YEAR Total Number
of teachers
Teachers
Transfer (N)
Rate of
Transfer (%)
Bayelsa 2015 5185 388 7.48%
2016 3806 412 10.83%
2017 3746 528 14.10%
2018 3543 170 4.54%
2019 4160 615 18.87%
Total 2113 55.82%
Mean 423 11.16%
Delta 2015 9561 823 8.61%
2016 9163 249 2.72%
2017 12228 309 2.53%
2018 11832 463 3.91%
2019 12007 2280 18.99%
Total 4124 36.31%
Mean 825 7.26%
Both states 2015 14746 1211 8.21%
2016 12969 661 5.10%
2017 15974 837 5.24%
2018 15576 632 4.06%
2019 15267 2895 18.96%
Total 6236 41.57%
Grand mean 1247 8.31%
Source: Fieldwork 2019/2020.
Table 11 shows that in 2015, in Bayelsa State, 388 teachers (7.48%) were
transferred. The number increased to 412 (10.83%) in 2016; 528 (14.10%) in 2017,
reduced to 126 (4.54%) in 2018 and increased again to 615 (18.87%) in 2019 with a mean
of 423 (11.16%) The mean transfer rate for Bayelsa state is 11.16%.
Delta State recorded 823 (8.61%) rate of teachers‘ transfers in 2015,249 (2.72%) in
2016, 309 (2.53%) in 2017, 463 (3.91%) in 2018 and 2280 (18.99%) in 2019. The mean
transfer rate of teachers in Delta State per year is 825 (7.26%). Combining both states of
study, the transfer rate in 2015 was 1211 (8.21%), 661 (5.10%) in 2016, 837 (5.24%) in
2017, 632 (4.06%) in 2018 and 2895 (18.96%) in 2019. In all, a total of 4,124 (36.31%) of
secondary school teachers was transferred within the public secondary schools between
2015 and 2019 in Delta State. In Bayelsa State, 2113 (55.82%) of teachers were transferred
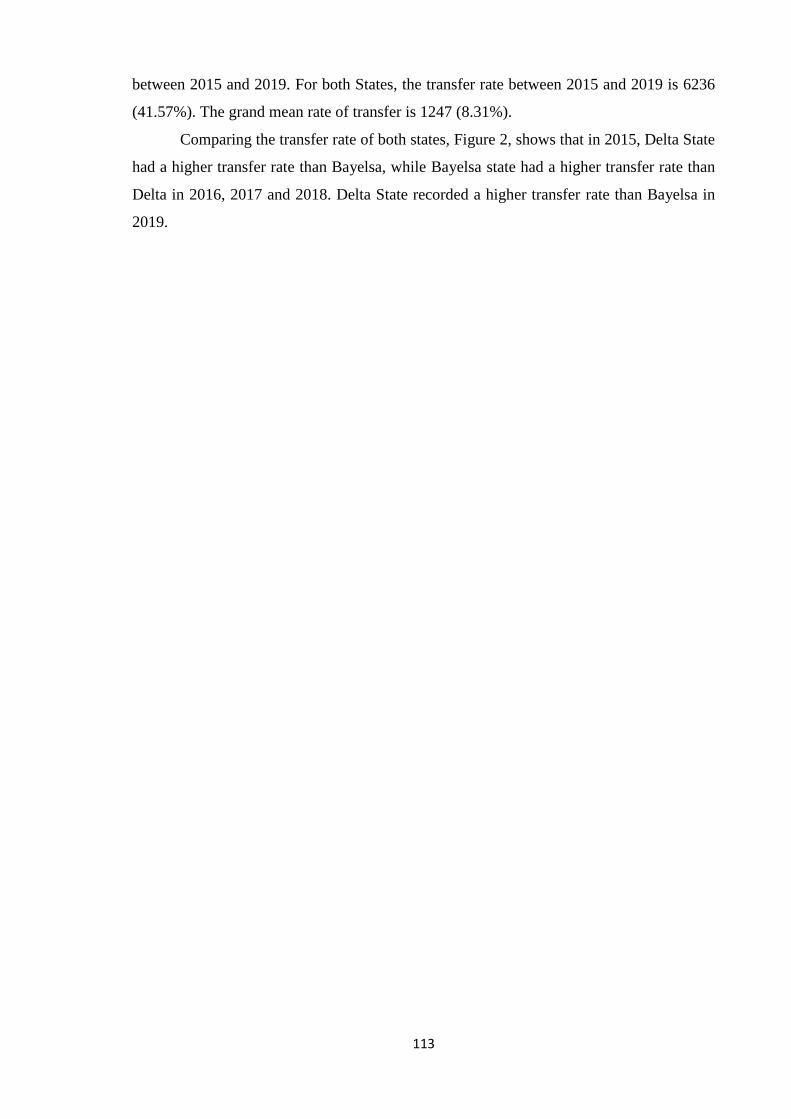
113
between 2015 and 2019. For both States, the transfer rate between 2015 and 2019 is 6236
(41.57%). The grand mean rate of transfer is 1247 (8.31%).
Comparing the transfer rate of both states, Figure 2, shows that in 2015, Delta State
had a higher transfer rate than Bayelsa, while Bayelsa state had a higher transfer rate than
Delta in 2016, 2017 and 2018. Delta State recorded a higher transfer rate than Bayelsa in
2019.
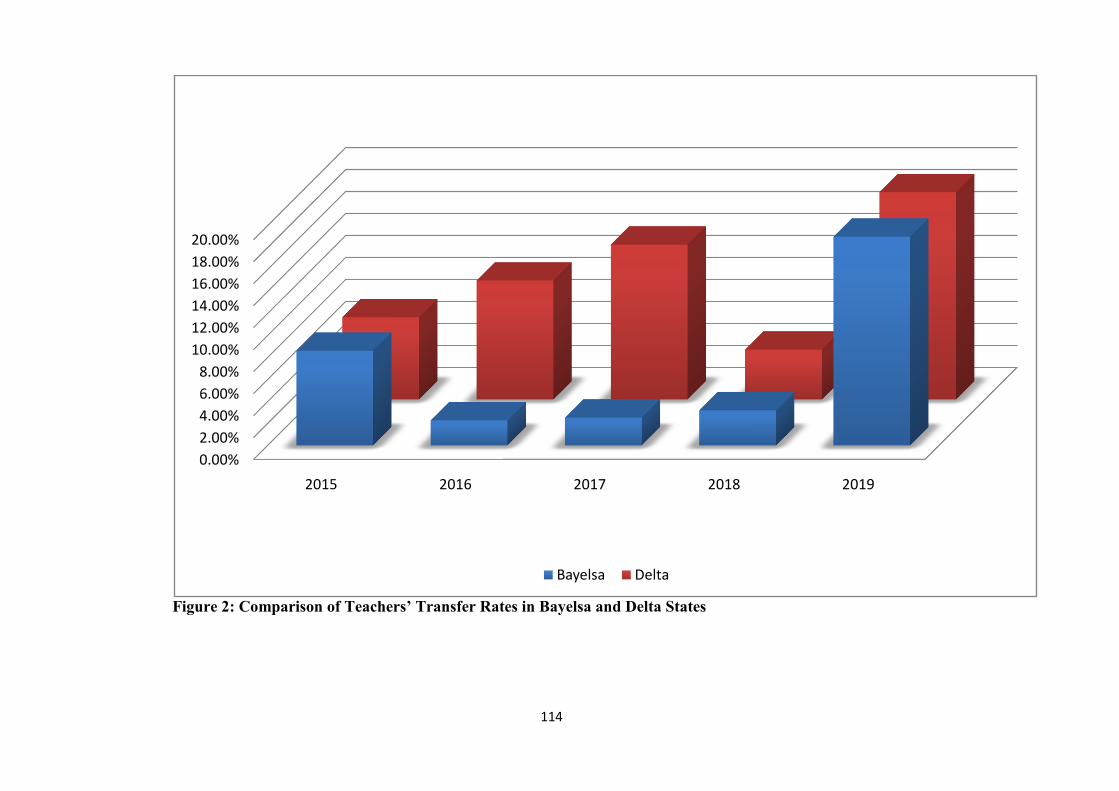
114
Figure 2: Comparison of Teachers’ Transfer Rates in Bayelsa and Delta States
0.00%
2.00%
4.00%
6.00%
8.00%
10.00%
12.00%
14.00%
16.00%
18.00%
20.00%
2015 2016 2017 2018 2019
Bayelsa Delta
115
Research Question 3
What is the rate of students’ mobility from the public to private secondary schools in
Bayelsa and Delta States?
To answer this research question, a descriptive statistic was conducted using a
frequency count and percentage. The information used to answer this research question
was based on the students‘ and principals‘ responses.
Table 12: Rate of Students’ Mobility from the Public to Private Secondary Schools in
Bayelsa, Delta and both States
State Year Total Number
of Students
Number of
Students that
Moved to Private
Schools (N)
Rate of
Students’
mobility (%)
Bayelsa 2015 52,727 71 0.13
2016 53,510 97 0.18
2017 52,190 122 0.23
2018 50,871 109 0.21
2019 47,117 135 0.29
Total 534 1.04%
Mean 107 0.21%
Delta 2015 124,849 166 0.13
2016 132,333 192 0.15
2017 127,947 241 0.19
2018 124,057 266 0.21
2019 130,090 307 0.24
Total 1174 0.92%
Mean 235 0.18%
Both states 2015 177,576 237 .13
2016 185,843 289 .16
2017 180,137 363 .20
2018 174,928 375 .21
2019 177,207 442 .25
Total 1708 0.95%
Grand mean 342 0.19%
Source: Fieldwork 2019/2020.
Table 12 and Figure 3 show that in Bayelsa State, 71 (0.13%) of students moved
from the pubic to private schools in the year 2015; 97 (0.18%) moved in 2016, 122
(0.23%) moved in 2017, 109 (0.21%) moved in 2018 and 135 (0.29%) moved in 2019. A
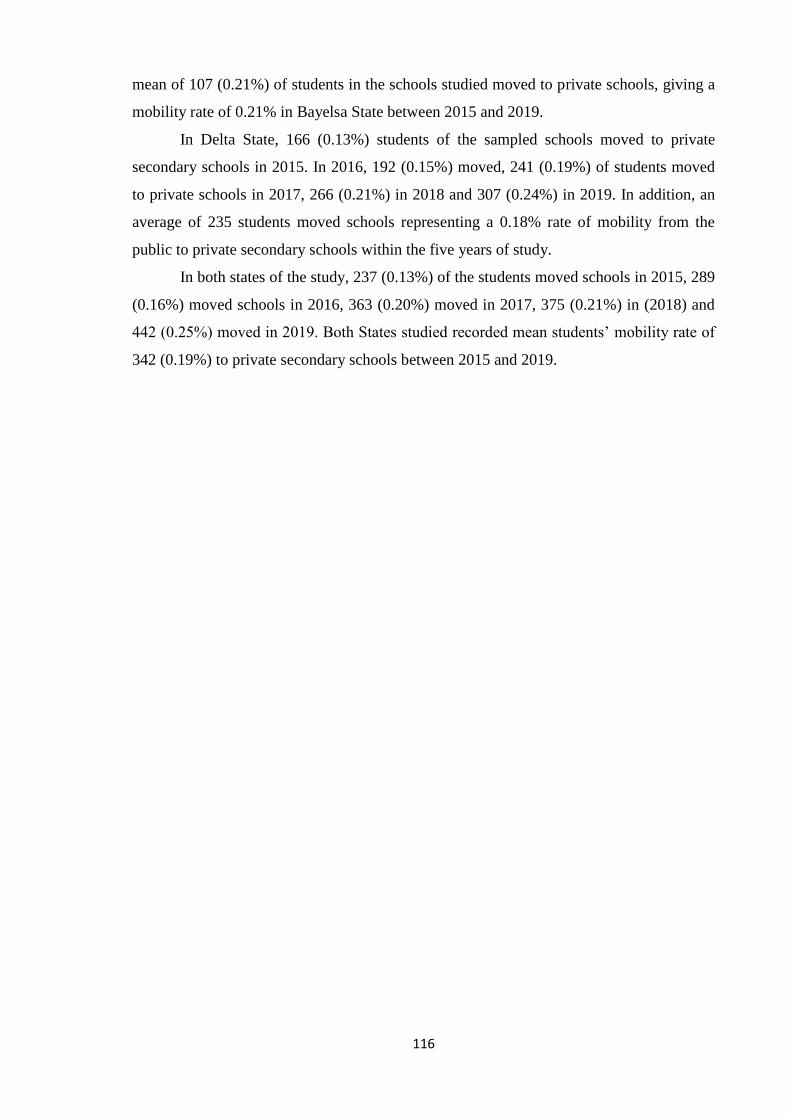
116
mean of 107 (0.21%) of students in the schools studied moved to private schools, giving a
mobility rate of 0.21% in Bayelsa State between 2015 and 2019.
In Delta State, 166 (0.13%) students of the sampled schools moved to private
secondary schools in 2015. In 2016, 192 (0.15%) moved, 241 (0.19%) of students moved
to private schools in 2017, 266 (0.21%) in 2018 and 307 (0.24%) in 2019. In addition, an
average of 235 students moved schools representing a 0.18% rate of mobility from the
public to private secondary schools within the five years of study.
In both states of the study, 237 (0.13%) of the students moved schools in 2015, 289
(0.16%) moved schools in 2016, 363 (0.20%) moved in 2017, 375 (0.21%) in (2018) and
442 (0.25%) moved in 2019. Both States studied recorded mean students‘ mobility rate of
342 (0.19%) to private secondary schools between 2015 and 2019.
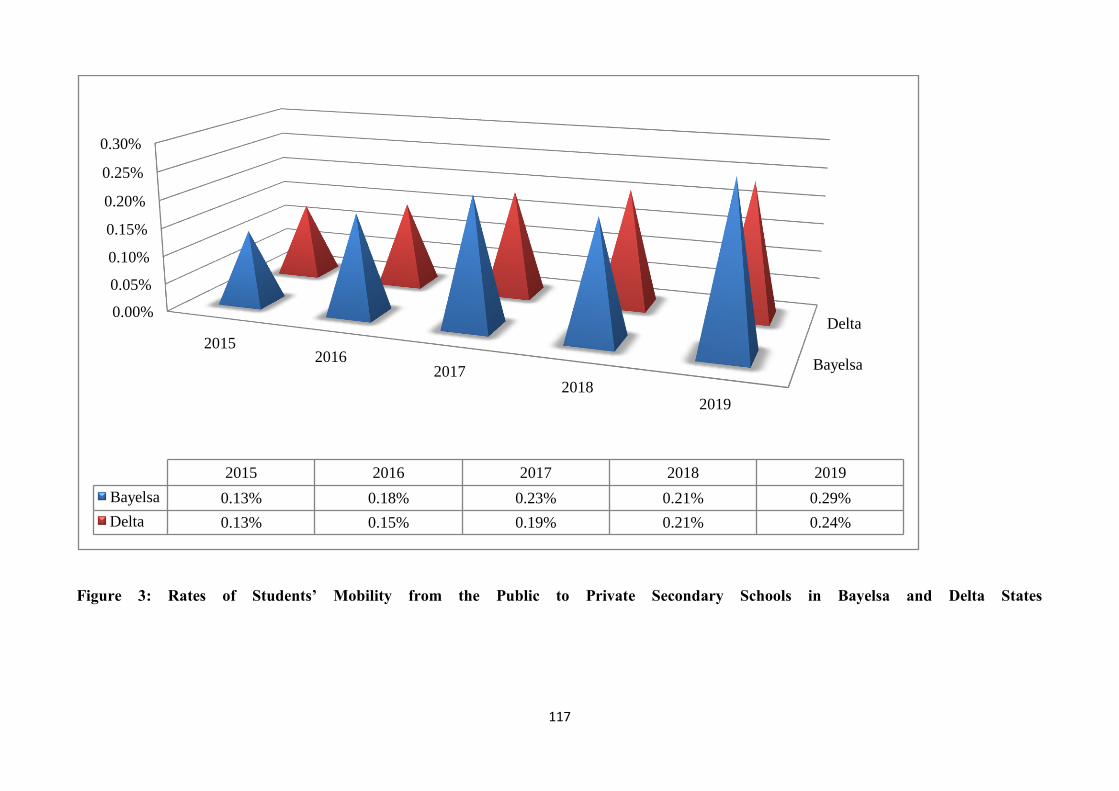
117
Figure 3: Rates of Students’ Mobility from the Public to Private Secondary Schools in Bayelsa and Delta States
Bayelsa
Delta0.00%
0.05%
0.10%
0.15%
0.20%
0.25%
0.30%
20152016
20172018
2019
2015 2016 2017 2018 2019
Bayelsa 0.13% 0.18% 0.23% 0.21% 0.29%
Delta 0.13% 0.15% 0.19% 0.21% 0.24%
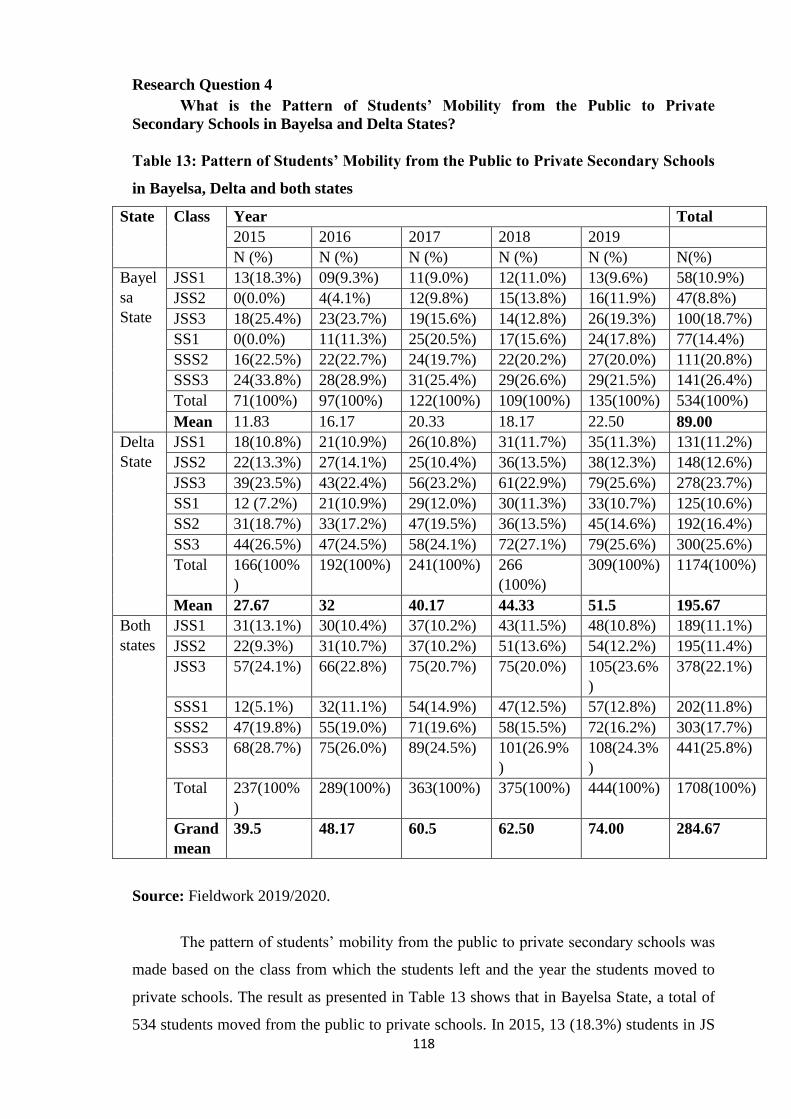
118
Research Question 4
What is the Pattern of Students’ Mobility from the Public to Private
Secondary Schools in Bayelsa and Delta States?
Table 13: Pattern of Students’ Mobility from the Public to Private Secondary Schools
in Bayelsa, Delta and both states
State Class Year Total
2015 2016 2017 2018 2019
N (%) N (%) N (%) N (%) N (%) N(%)
Bayel
sa
State
JSS1 13(18.3%) 09(9.3%) 11(9.0%) 12(11.0%) 13(9.6%) 58(10.9%)
JSS2 0(0.0%) 4(4.1%) 12(9.8%) 15(13.8%) 16(11.9%) 47(8.8%)
JSS3 18(25.4%) 23(23.7%) 19(15.6%) 14(12.8%) 26(19.3%) 100(18.7%)
SS1 0(0.0%) 11(11.3%) 25(20.5%) 17(15.6%) 24(17.8%) 77(14.4%)
SSS2 16(22.5%) 22(22.7%) 24(19.7%) 22(20.2%) 27(20.0%) 111(20.8%)
SSS3 24(33.8%) 28(28.9%) 31(25.4%) 29(26.6%) 29(21.5%) 141(26.4%)
Total 71(100%) 97(100%) 122(100%) 109(100%) 135(100%) 534(100%)
Mean 11.83 16.17 20.33 18.17 22.50 89.00
Delta
State
JSS1 18(10.8%) 21(10.9%) 26(10.8%) 31(11.7%) 35(11.3%) 131(11.2%)
JSS2 22(13.3%) 27(14.1%) 25(10.4%) 36(13.5%) 38(12.3%) 148(12.6%)
JSS3 39(23.5%) 43(22.4%) 56(23.2%) 61(22.9%) 79(25.6%) 278(23.7%)
SS1 12 (7.2%) 21(10.9%) 29(12.0%) 30(11.3%) 33(10.7%) 125(10.6%)
SS2 31(18.7%) 33(17.2%) 47(19.5%) 36(13.5%) 45(14.6%) 192(16.4%)
SS3 44(26.5%) 47(24.5%) 58(24.1%) 72(27.1%) 79(25.6%) 300(25.6%)
Total 166(100%
)
192(100%) 241(100%) 266
(100%)
309(100%) 1174(100%)
Mean 27.67 32 40.17 44.33 51.5 195.67
Both
states
JSS1 31(13.1%) 30(10.4%) 37(10.2%) 43(11.5%) 48(10.8%) 189(11.1%)
JSS2 22(9.3%) 31(10.7%) 37(10.2%) 51(13.6%) 54(12.2%) 195(11.4%)
JSS3 57(24.1%) 66(22.8%) 75(20.7%) 75(20.0%) 105(23.6%
)
378(22.1%)
SSS1 12(5.1%) 32(11.1%) 54(14.9%) 47(12.5%) 57(12.8%) 202(11.8%)
SSS2 47(19.8%) 55(19.0%) 71(19.6%) 58(15.5%) 72(16.2%) 303(17.7%)
SSS3 68(28.7%) 75(26.0%) 89(24.5%) 101(26.9%
)
108(24.3%
)
441(25.8%)
Total 237(100%
)
289(100%) 363(100%) 375(100%) 444(100%) 1708(100%)
Grand
mean
39.5 48.17 60.5 62.50 74.00 284.67
Source: Fieldwork 2019/2020.
The pattern of students‘ mobility from the public to private secondary schools was
made based on the class from which the students left and the year the students moved to
private schools. The result as presented in Table 13 shows that in Bayelsa State, a total of
534 students moved from the public to private schools. In 2015, 13 (18.3%) students in JS
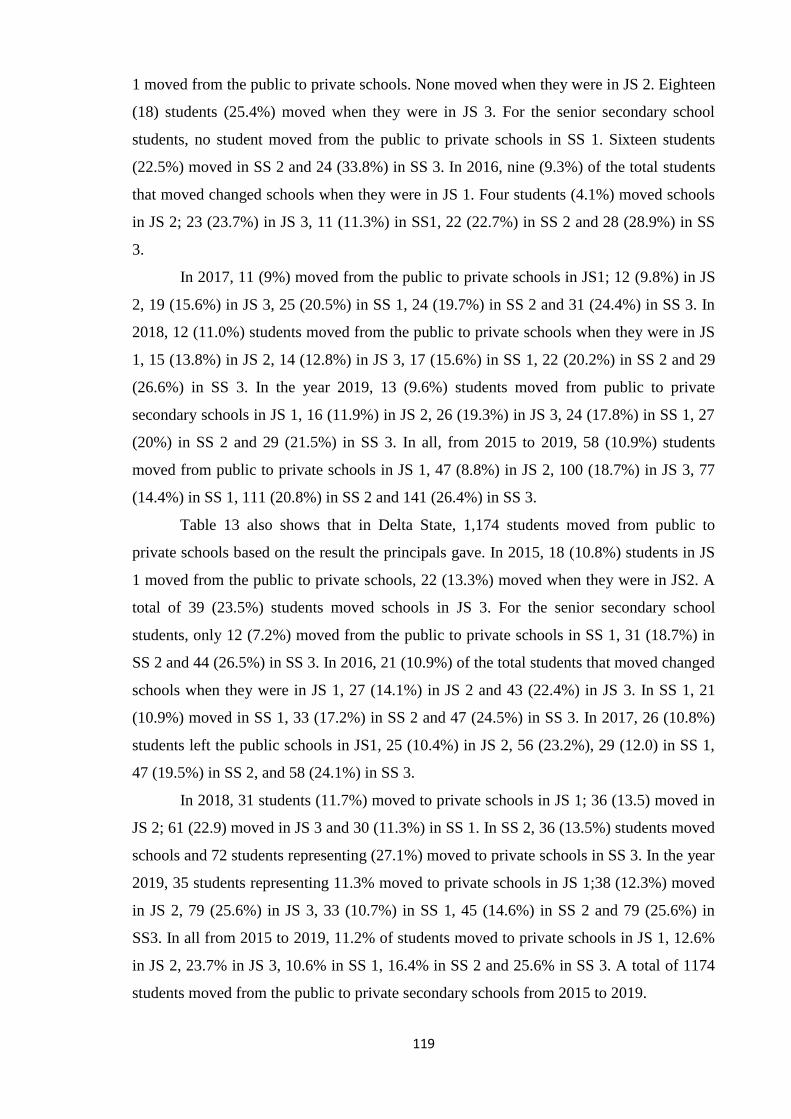
119
1 moved from the public to private schools. None moved when they were in JS 2. Eighteen
(18) students (25.4%) moved when they were in JS 3. For the senior secondary school
students, no student moved from the public to private schools in SS 1. Sixteen students
(22.5%) moved in SS 2 and 24 (33.8%) in SS 3. In 2016, nine (9.3%) of the total students
that moved changed schools when they were in JS 1. Four students (4.1%) moved schools
in JS 2; 23 (23.7%) in JS 3, 11 (11.3%) in SS1, 22 (22.7%) in SS 2 and 28 (28.9%) in SS
3.
In 2017, 11 (9%) moved from the public to private schools in JS1; 12 (9.8%) in JS
2, 19 (15.6%) in JS 3, 25 (20.5%) in SS 1, 24 (19.7%) in SS 2 and 31 (24.4%) in SS 3. In
2018, 12 (11.0%) students moved from the public to private schools when they were in JS
1, 15 (13.8%) in JS 2, 14 (12.8%) in JS 3, 17 (15.6%) in SS 1, 22 (20.2%) in SS 2 and 29
(26.6%) in SS 3. In the year 2019, 13 (9.6%) students moved from public to private
secondary schools in JS 1, 16 (11.9%) in JS 2, 26 (19.3%) in JS 3, 24 (17.8%) in SS 1, 27
(20%) in SS 2 and 29 (21.5%) in SS 3. In all, from 2015 to 2019, 58 (10.9%) students
moved from public to private schools in JS 1, 47 (8.8%) in JS 2, 100 (18.7%) in JS 3, 77
(14.4%) in SS 1, 111 (20.8%) in SS 2 and 141 (26.4%) in SS 3.
Table 13 also shows that in Delta State, 1,174 students moved from public to
private schools based on the result the principals gave. In 2015, 18 (10.8%) students in JS
1 moved from the public to private schools, 22 (13.3%) moved when they were in JS2. A
total of 39 (23.5%) students moved schools in JS 3. For the senior secondary school
students, only 12 (7.2%) moved from the public to private schools in SS 1, 31 (18.7%) in
SS 2 and 44 (26.5%) in SS 3. In 2016, 21 (10.9%) of the total students that moved changed
schools when they were in JS 1, 27 (14.1%) in JS 2 and 43 (22.4%) in JS 3. In SS 1, 21
(10.9%) moved in SS 1, 33 (17.2%) in SS 2 and 47 (24.5%) in SS 3. In 2017, 26 (10.8%)
students left the public schools in JS1, 25 (10.4%) in JS 2, 56 (23.2%), 29 (12.0) in SS 1,
47 (19.5%) in SS 2, and 58 (24.1%) in SS 3.
In 2018, 31 students (11.7%) moved to private schools in JS 1; 36 (13.5) moved in
JS 2; 61 (22.9) moved in JS 3 and 30 (11.3%) in SS 1. In SS 2, 36 (13.5%) students moved
schools and 72 students representing (27.1%) moved to private schools in SS 3. In the year
2019, 35 students representing 11.3% moved to private schools in JS 1;38 (12.3%) moved
in JS 2, 79 (25.6%) in JS 3, 33 (10.7%) in SS 1, 45 (14.6%) in SS 2 and 79 (25.6%) in
SS3. In all from 2015 to 2019, 11.2% of students moved to private schools in JS 1, 12.6%
in JS 2, 23.7% in JS 3, 10.6% in SS 1, 16.4% in SS 2 and 25.6% in SS 3. A total of 1174
students moved from the public to private secondary schools from 2015 to 2019.
120
For both states studied, Table 13 shows that a total of 1708 students moved to
private schools. In 2015, 31 (13.1%) of students in JS 1 moved to private schools, 22
(9.3%) moved when they were in JS 2. A total of 57 (24.1%) moved when they were in JS
3. For the senior secondary school students, 12 (5.1%) of the student moved to private
schools in SS 1, 47 (19.8%) in SS 2 and 68 (28.7%) in SS 3. In 2016, 30 (10.4%) students
moved schools when they were in JS 1; 31 (10.7%) moved in JS 2 and 66 (22.8%) in JS 3.
In SS 1, 32 (11.1%) students moved to private schools. In SS 2, 55 (19.0%) moved and 75
(26%) moved to private schools in SS 3. In 2017, 37 (10.2%) students moved to private
schools in JS 1; another 37 (10.2%) moved in JS 2, 75 (20.7%) in JS 3, 54 (14.9%) in SS
1, 71 (19.6%) in SS 2 and 89 (24.5%) in SS 3.
In 2018, 43 (11.5%) students moved from public to private schools when they were in JS
1, 51 (13.6%) in JS 2, 75 (20.0%) in JS 3, 47 (12.5%) in SS 1, 58 (15.5%) in SS 2 and 101
(26.9%) in SS 3. In the year 2019, 48 (10.8%) students moved from the public to private
schools in JS 1; 54 (12.2%) in JS 2, 105 (23.6%) in JS 3, 57 (12.8%) in SS 1, 72 (16.2%)
in SS 2 and 108 (24.3%) in SS 3. In all, from 2015 to 2019, 189 (11.1%) of students
moved from public to private schools in JS 1, 195 (11.4%) in JS 2, 378 (22.1%) in JS 3,
202 (11.8%) in SS 1, 303 (17.7%) in SS 2 and 441 (25.8%) in SS 3.
The graphic presentation of the pattern of students‘ mobility from the public to
private secondary school results is presentedfor comparison in figure 4 for Bayelsa
andDelta States.
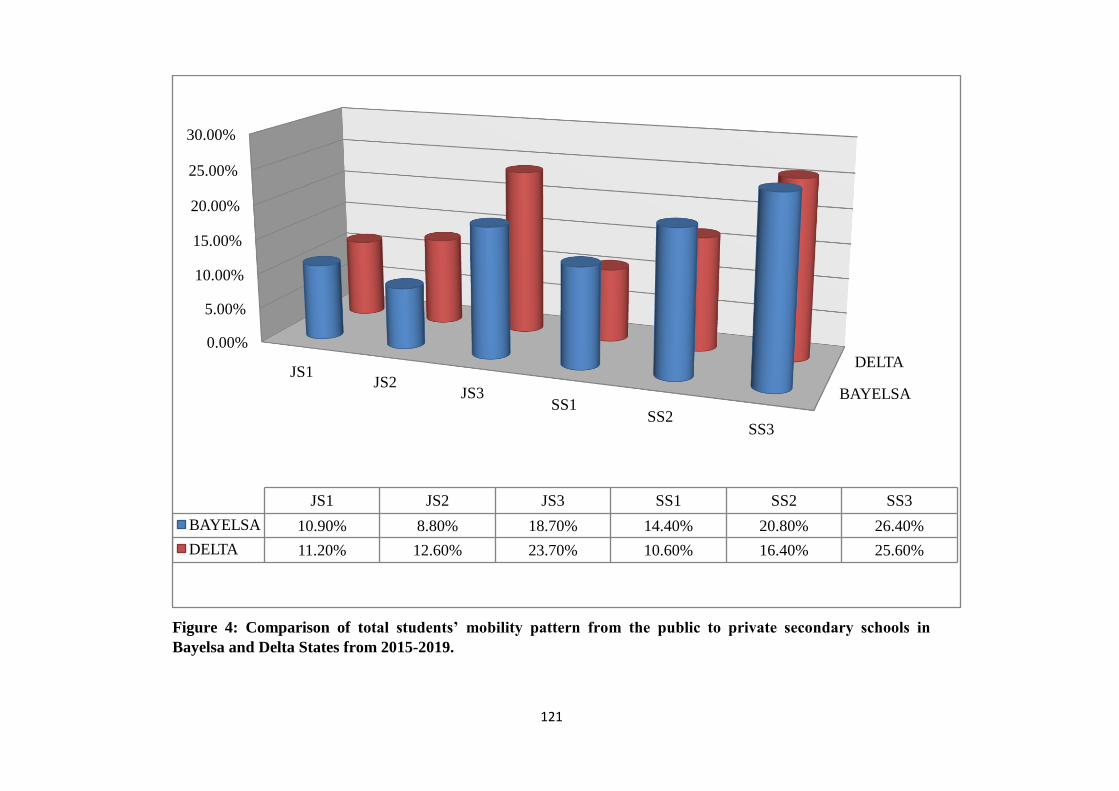
121
Figure 4: Comparison of total students’ mobility pattern from the public to private secondary schools in
Bayelsa and Delta States from 2015-2019.
BAYELSA
DELTA
0.00%
5.00%
10.00%
15.00%
20.00%
25.00%
30.00%
JS1JS2
JS3SS1
SS2SS3
JS1 JS2 JS3 SS1 SS2 SS3
BAYELSA 10.90% 8.80% 18.70% 14.40% 20.80% 26.40%
DELTA 11.20% 12.60% 23.70% 10.60% 16.40% 25.60%
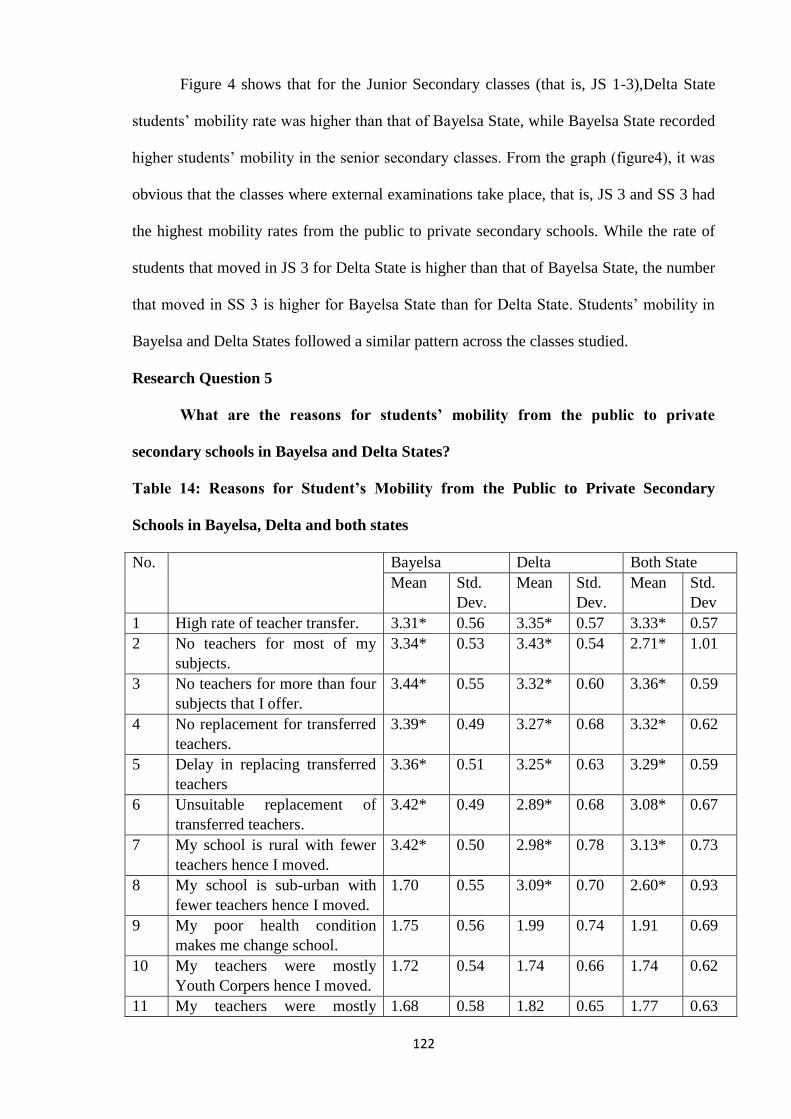
122
Figure 4 shows that for the Junior Secondary classes (that is, JS 1-3),Delta State
students‘ mobility rate was higher than that of Bayelsa State, while Bayelsa State recorded
higher students‘ mobility in the senior secondary classes. From the graph (figure4), it was
obvious that the classes where external examinations take place, that is, JS 3 and SS 3 had
the highest mobility rates from the public to private secondary schools. While the rate of
students that moved in JS 3 for Delta State is higher than that of Bayelsa State, the number
that moved in SS 3 is higher for Bayelsa State than for Delta State. Students‘ mobility in
Bayelsa and Delta States followed a similar pattern across the classes studied.
Research Question 5
What are the reasons for students’ mobility from the public to private
secondary schools in Bayelsa and Delta States?
Table 14: Reasons for Student’s Mobility from the Public to Private Secondary
Schools in Bayelsa, Delta and both states
No. Bayelsa Delta Both State
Mean Std.
Dev.
Mean Std.
Dev.
Mean Std.
Dev
1 High rate of teacher transfer. 3.31* 0.56 3.35* 0.57 3.33* 0.57
2 No teachers for most of my
subjects.
3.34* 0.53 3.43* 0.54 2.71* 1.01
3 No teachers for more than four
subjects that I offer.
3.44* 0.55 3.32* 0.60 3.36* 0.59
4 No replacement for transferred
teachers.
3.39* 0.49 3.27* 0.68 3.32* 0.62
5 Delay in replacing transferred
teachers
3.36* 0.51 3.25* 0.63 3.29* 0.59
6 Unsuitable replacement of
transferred teachers.
3.42* 0.49 2.89* 0.68 3.08* 0.67
7 My school is rural with fewer
teachers hence I moved.
3.42* 0.50 2.98* 0.78 3.13* 0.73
8 My school is sub-urban with
fewer teachers hence I moved.
1.70 0.55 3.09* 0.70 2.60* 0.93
9 My poor health condition
makes me change school.
1.75 0.56 1.99 0.74 1.91 0.69
10 My teachers were mostly
Youth Corpers hence I moved.
1.72 0.54 1.74 0.66 1.74 0.62
11 My teachers were mostly 1.68 0.58 1.82 0.65 1.77 0.63
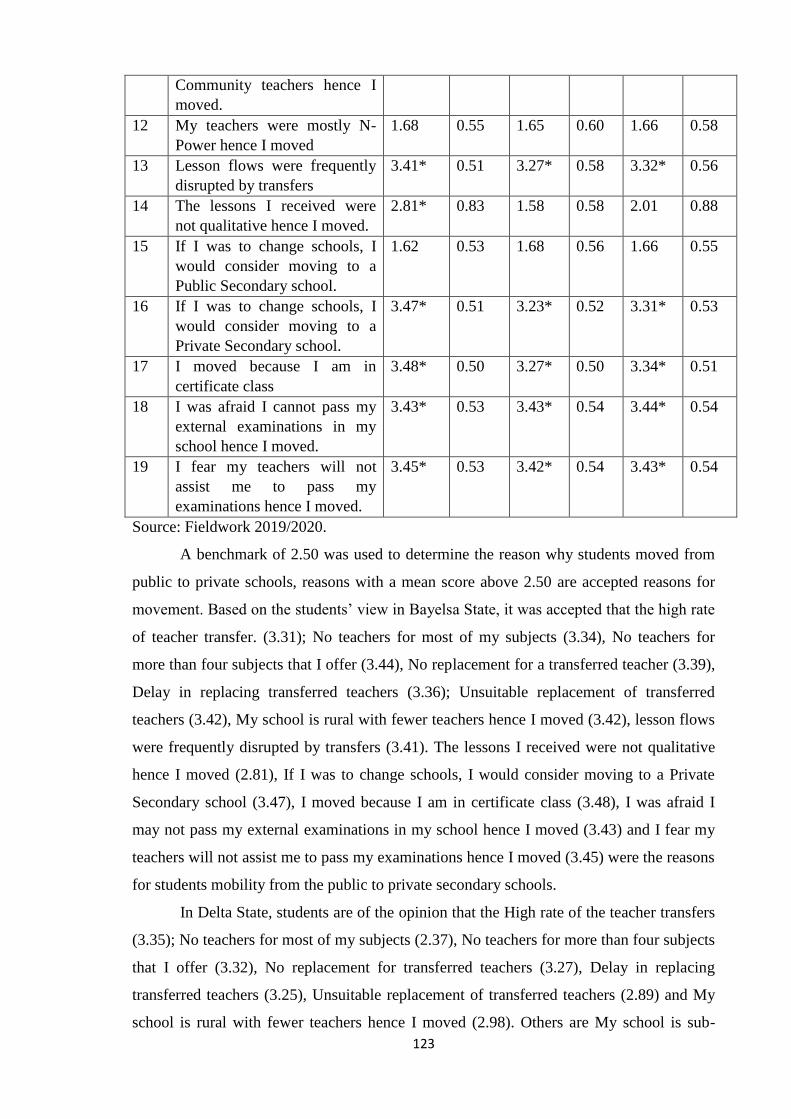
123
Community teachers hence I
moved.
12 My teachers were mostly N-
Power hence I moved
1.68 0.55 1.65 0.60 1.66 0.58
13 Lesson flows were frequently
disrupted by transfers
3.41* 0.51 3.27* 0.58 3.32* 0.56
14 The lessons I received were
not qualitative hence I moved.
2.81* 0.83 1.58 0.58 2.01 0.88
15 If I was to change schools, I
would consider moving to a
Public Secondary school.
1.62 0.53 1.68 0.56 1.66 0.55
16 If I was to change schools, I
would consider moving to a
Private Secondary school.
3.47* 0.51 3.23* 0.52 3.31*
0.53
17 I moved because I am in
certificate class
3.48* 0.50 3.27* 0.50 3.34* 0.51
18 I was afraid I cannot pass my
external examinations in my
school hence I moved.
3.43* 0.53 3.43* 0.54 3.44*
0.54
19 I fear my teachers will not
assist me to pass my
examinations hence I moved.
3.45* 0.53 3.42* 0.54 3.43* 0.54
Source: Fieldwork 2019/2020.
A benchmark of 2.50 was used to determine the reason why students moved from
public to private schools, reasons with a mean score above 2.50 are accepted reasons for
movement. Based on the students‘ view in Bayelsa State, it was accepted that the high rate
of teacher transfer. (3.31); No teachers for most of my subjects (3.34), No teachers for
more than four subjects that I offer (3.44), No replacement for a transferred teacher (3.39),
Delay in replacing transferred teachers (3.36); Unsuitable replacement of transferred
teachers (3.42), My school is rural with fewer teachers hence I moved (3.42), lesson flows
were frequently disrupted by transfers (3.41). The lessons I received were not qualitative
hence I moved (2.81), If I was to change schools, I would consider moving to a Private
Secondary school (3.47), I moved because I am in certificate class (3.48), I was afraid I
may not pass my external examinations in my school hence I moved (3.43) and I fear my
teachers will not assist me to pass my examinations hence I moved (3.45) were the reasons
for students mobility from the public to private secondary schools.
In Delta State, students are of the opinion that the High rate of the teacher transfers
(3.35); No teachers for most of my subjects (2.37), No teachers for more than four subjects
that I offer (3.32), No replacement for transferred teachers (3.27), Delay in replacing
transferred teachers (3.25), Unsuitable replacement of transferred teachers (2.89) and My
school is rural with fewer teachers hence I moved (2.98). Others are My school is sub-
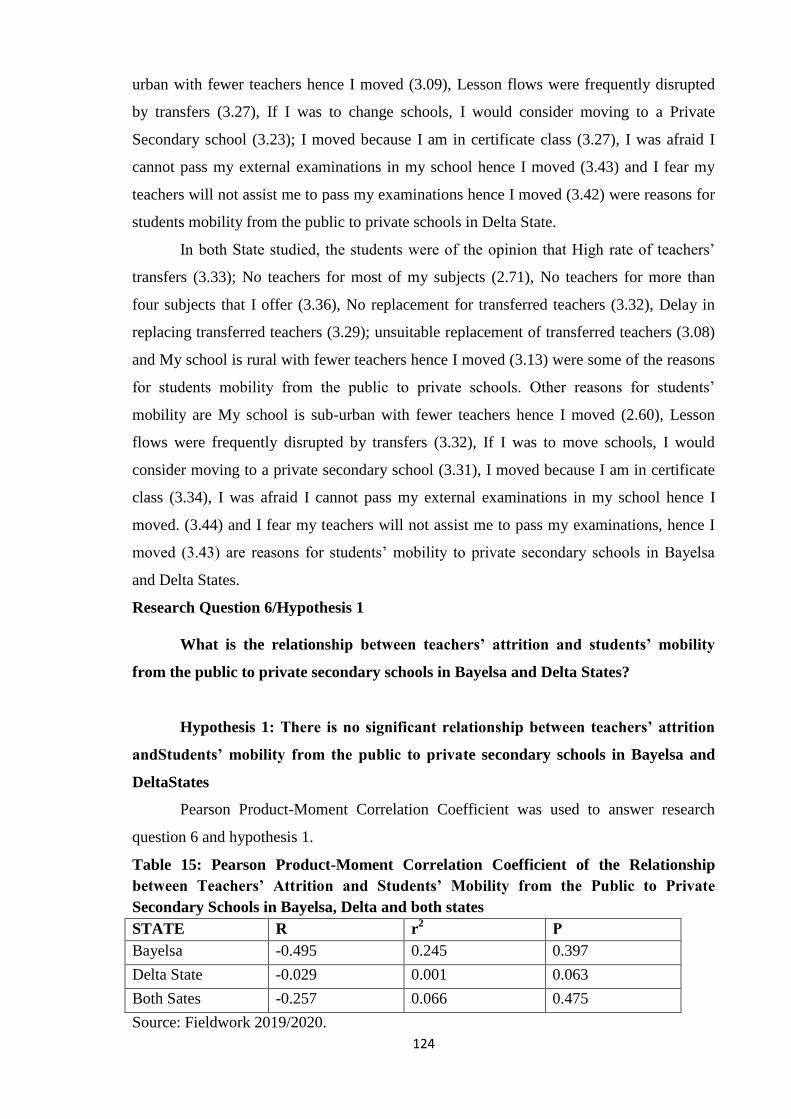
124
urban with fewer teachers hence I moved (3.09), Lesson flows were frequently disrupted
by transfers (3.27), If I was to change schools, I would consider moving to a Private
Secondary school (3.23); I moved because I am in certificate class (3.27), I was afraid I
cannot pass my external examinations in my school hence I moved (3.43) and I fear my
teachers will not assist me to pass my examinations hence I moved (3.42) were reasons for
students mobility from the public to private schools in Delta State.
In both State studied, the students were of the opinion that High rate of teachers‘
transfers (3.33); No teachers for most of my subjects (2.71), No teachers for more than
four subjects that I offer (3.36), No replacement for transferred teachers (3.32), Delay in
replacing transferred teachers (3.29); unsuitable replacement of transferred teachers (3.08)
and My school is rural with fewer teachers hence I moved (3.13) were some of the reasons
for students mobility from the public to private schools. Other reasons for students‘
mobility are My school is sub-urban with fewer teachers hence I moved (2.60), Lesson
flows were frequently disrupted by transfers (3.32), If I was to move schools, I would
consider moving to a private secondary school (3.31), I moved because I am in certificate
class (3.34), I was afraid I cannot pass my external examinations in my school hence I
moved. (3.44) and I fear my teachers will not assist me to pass my examinations, hence I
moved (3.43) are reasons for students‘ mobility to private secondary schools in Bayelsa
and Delta States.
Research Question 6/Hypothesis 1
What is the relationship between teachers’ attrition and students’ mobility
from the public to private secondary schools in Bayelsa and Delta States?
Hypothesis 1: There is no significant relationship between teachers’ attrition
andStudents’ mobility from the public to private secondary schools in Bayelsa and
DeltaStates
Pearson Product-Moment Correlation Coefficient was used to answer research
question 6 and hypothesis 1.
Table 15: Pearson Product-Moment Correlation Coefficient of the Relationship
between Teachers’ Attrition and Students’ Mobility from the Public to Private
Secondary Schools in Bayelsa, Delta and both states
STATE R r2
Ρ
Bayelsa -0.495 0.245 0.397
Delta State -0.029 0.001 0.063
Both Sates -0.257 0.066 0.475
Source: Fieldwork 2019/2020.
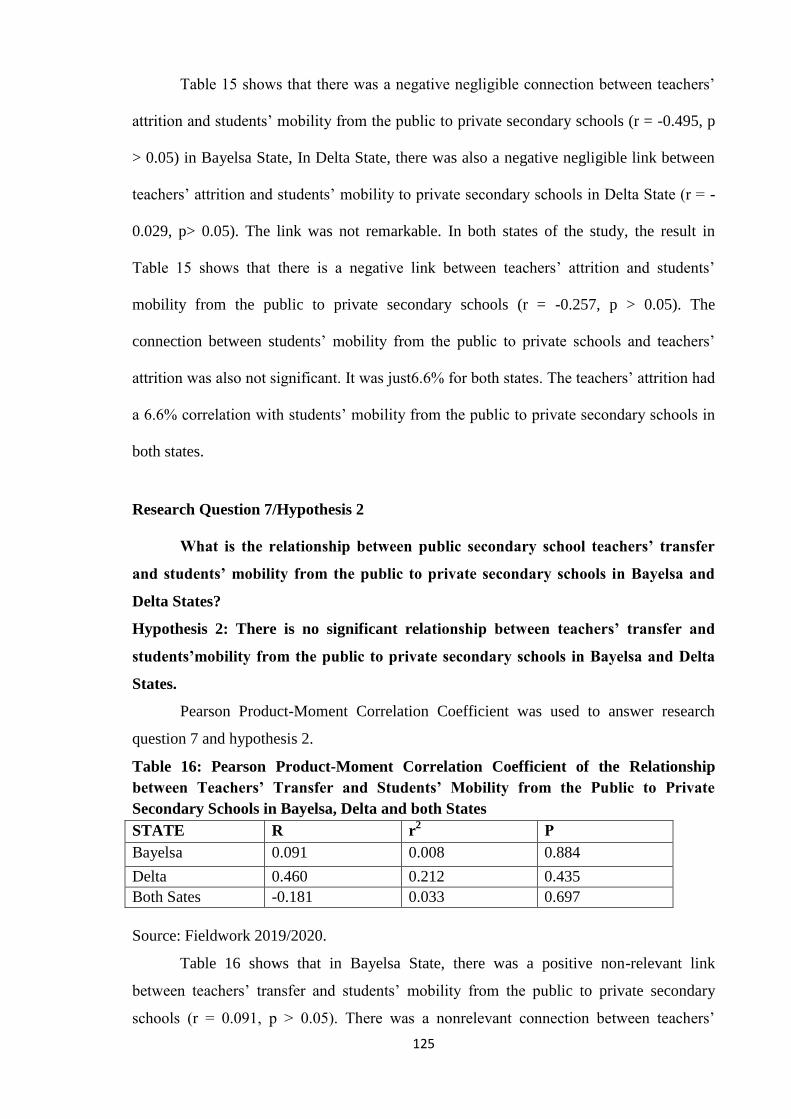
125
Table 15 shows that there was a negative negligible connection between teachers‘
attrition and students‘ mobility from the public to private secondary schools (r = -0.495, p
> 0.05) in Bayelsa State, In Delta State, there was also a negative negligible link between
teachers‘ attrition and students‘ mobility to private secondary schools in Delta State (r = -
0.029, p> 0.05). The link was not remarkable. In both states of the study, the result in
Table 15 shows that there is a negative link between teachers‘ attrition and students‘
mobility from the public to private secondary schools (r = -0.257, p > 0.05). The
connection between students‘ mobility from the public to private schools and teachers‘
attrition was also not significant. It was just6.6% for both states. The teachers‘ attrition had
a 6.6% correlation with students‘ mobility from the public to private secondary schools in
both states.
Research Question 7/Hypothesis 2
What is the relationship between public secondary school teachers’ transfer
and students’ mobility from the public to private secondary schools in Bayelsa and
Delta States?
Hypothesis 2: There is no significant relationship between teachers’ transfer and
students’mobility from the public to private secondary schools in Bayelsa and Delta
States.
Pearson Product-Moment Correlation Coefficient was used to answer research
question 7 and hypothesis 2.
Table 16: Pearson Product-Moment Correlation Coefficient of the Relationship
between Teachers’ Transfer and Students’ Mobility from the Public to Private
Secondary Schools in Bayelsa, Delta and both States
STATE R r2
Ρ
Bayelsa 0.091 0.008 0.884
Delta 0.460 0.212 0.435
Both Sates -0.181 0.033 0.697
Source: Fieldwork 2019/2020.
Table 16 shows that in Bayelsa State, there was a positive non-relevant link
between teachers‘ transfer and students‘ mobility from the public to private secondary
schools (r = 0.091, p > 0.05). There was a nonrelevant connection between teachers‘
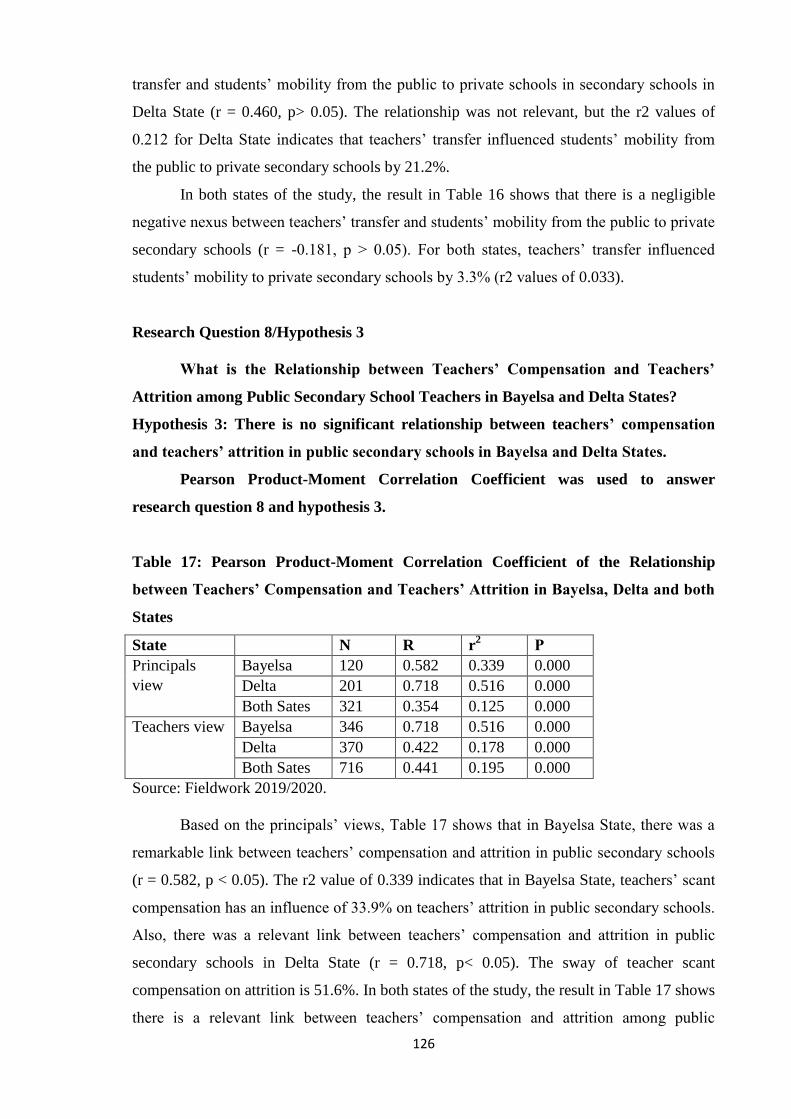
126
transfer and students‘ mobility from the public to private schools in secondary schools in
Delta State (r = 0.460, p> 0.05). The relationship was not relevant, but the r2 values of
0.212 for Delta State indicates that teachers‘ transfer influenced students‘ mobility from
the public to private secondary schools by 21.2%.
In both states of the study, the result in Table 16 shows that there is a negligible
negative nexus between teachers‘ transfer and students‘ mobility from the public to private
secondary schools (r = -0.181, p > 0.05). For both states, teachers‘ transfer influenced
students‘ mobility to private secondary schools by 3.3% (r2 values of 0.033).
Research Question 8/Hypothesis 3
What is the Relationship between Teachers’ Compensation and Teachers’
Attrition among Public Secondary School Teachers in Bayelsa and Delta States?
Hypothesis 3: There is no significant relationship between teachers’ compensation
and teachers’ attrition in public secondary schools in Bayelsa and Delta States.
Pearson Product-Moment Correlation Coefficient was used to answer
research question 8 and hypothesis 3.
Table 17: Pearson Product-Moment Correlation Coefficient of the Relationship
between Teachers’ Compensation and Teachers’ Attrition in Bayelsa, Delta and both
States
State N R r2
Ρ
Principals
view
Bayelsa 120 0.582 0.339 0.000
Delta 201 0.718 0.516 0.000
Both Sates 321 0.354 0.125 0.000
Teachers view Bayelsa 346 0.718 0.516 0.000
Delta 370 0.422 0.178 0.000
Both Sates 716 0.441 0.195 0.000
Source: Fieldwork 2019/2020.
Based on the principals‘ views, Table 17 shows that in Bayelsa State, there was a
remarkable link between teachers‘ compensation and attrition in public secondary schools
(r = 0.582, p < 0.05). The r2 value of 0.339 indicates that in Bayelsa State, teachers‘ scant
compensation has an influence of 33.9% on teachers‘ attrition in public secondary schools.
Also, there was a relevant link between teachers‘ compensation and attrition in public
secondary schools in Delta State (r = 0.718, p< 0.05). The sway of teacher scant
compensation on attrition is 51.6%. In both states of the study, the result in Table 17 shows
there is a relevant link between teachers‘ compensation and attrition among public
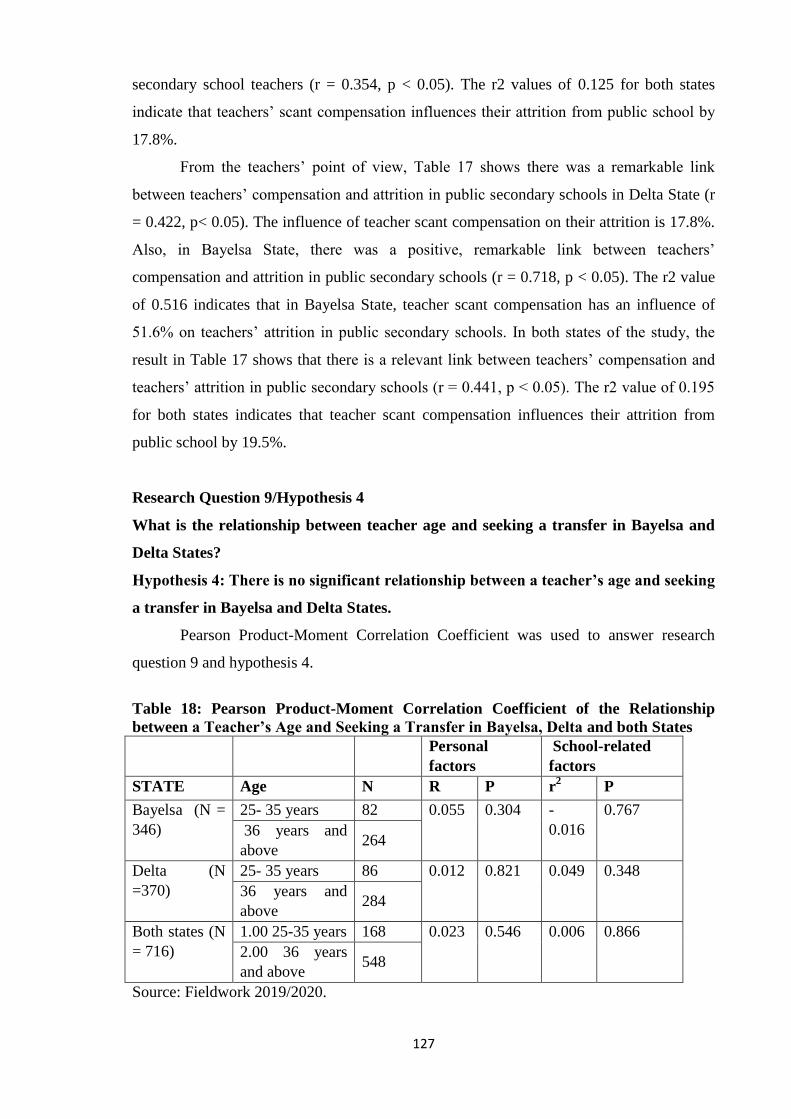
127
secondary school teachers (r = 0.354, p < 0.05). The r2 values of 0.125 for both states
indicate that teachers‘ scant compensation influences their attrition from public school by
17.8%.
From the teachers‘ point of view, Table 17 shows there was a remarkable link
between teachers‘ compensation and attrition in public secondary schools in Delta State (r
= 0.422, p< 0.05). The influence of teacher scant compensation on their attrition is 17.8%.
Also, in Bayelsa State, there was a positive, remarkable link between teachers‘
compensation and attrition in public secondary schools (r = 0.718, p < 0.05). The r2 value
of 0.516 indicates that in Bayelsa State, teacher scant compensation has an influence of
51.6% on teachers‘ attrition in public secondary schools. In both states of the study, the
result in Table 17 shows that there is a relevant link between teachers‘ compensation and
teachers‘ attrition in public secondary schools (r = 0.441, p < 0.05). The r2 value of 0.195
for both states indicates that teacher scant compensation influences their attrition from
public school by 19.5%.
Research Question 9/Hypothesis 4
What is the relationship between teacher age and seeking a transfer in Bayelsa and
Delta States?
Hypothesis 4: There is no significant relationship between a teacher’s age and seeking
a transfer in Bayelsa and Delta States.
Pearson Product-Moment Correlation Coefficient was used to answer research
question 9 and hypothesis 4.
Table 18: Pearson Product-Moment Correlation Coefficient of the Relationship
between a Teacher’s Age and Seeking a Transfer in Bayelsa, Delta and both States
Personal
factors
School-related
factors
STATE Age N R P r2 P
Bayelsa (N =
346)
25- 35 years 82 0.055
0.304
-
0.016
0.767
36 years and
above 264
Delta (N
=370)
25- 35 years 86 0.012 0.821 0.049 0.348
36 years and
above 284
Both states (N
= 716)
1.00 25-35 years 168 0.023 0.546 0.006 0.866
2.00 36 years
and above 548
Source: Fieldwork 2019/2020.
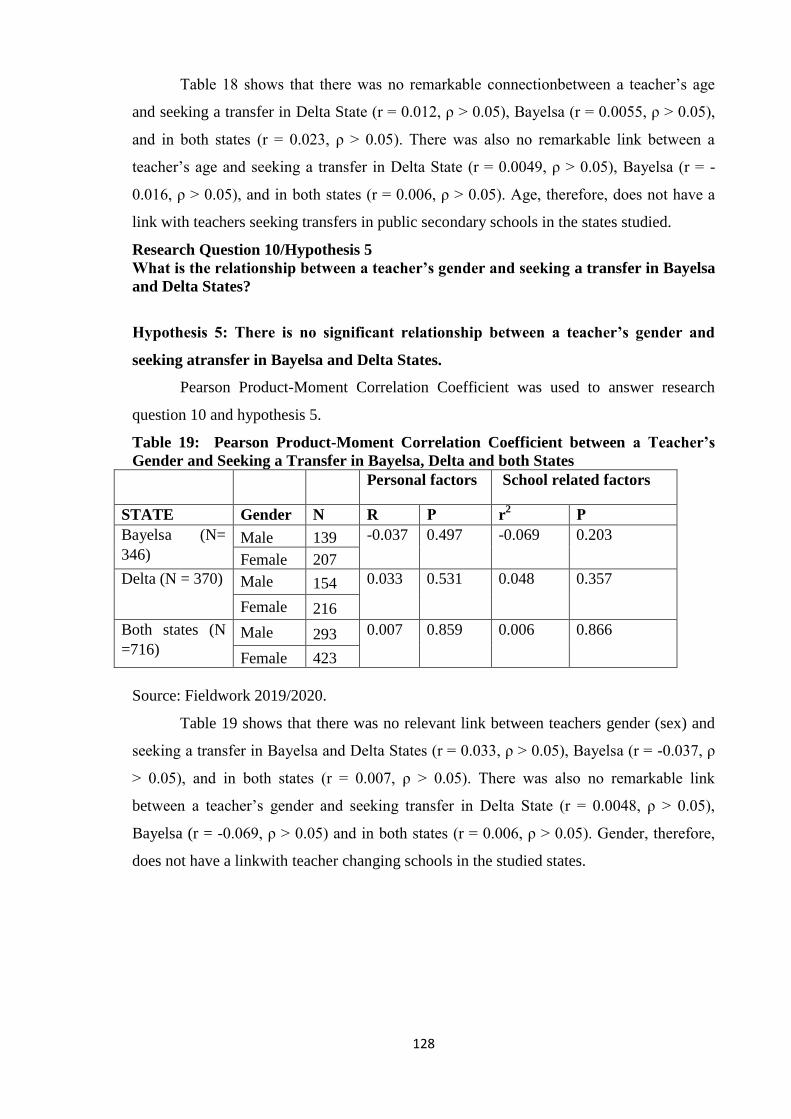
128
Table 18 shows that there was no remarkable connectionbetween a teacher‘s age
and seeking a transfer in Delta State (r = 0.012, ρ > 0.05), Bayelsa (r = 0.0055, ρ > 0.05),
and in both states (r = 0.023, ρ > 0.05). There was also no remarkable link between a
teacher‘s age and seeking a transfer in Delta State (r = 0.0049, ρ > 0.05), Bayelsa (r = -
0.016, ρ > 0.05), and in both states (r = 0.006, ρ > 0.05). Age, therefore, does not have a
link with teachers seeking transfers in public secondary schools in the states studied.
Research Question 10/Hypothesis 5
What is the relationship between a teacher’s gender and seeking a transfer in Bayelsa
and Delta States?
Hypothesis 5: There is no significant relationship between a teacher’s gender and
seeking atransfer in Bayelsa and Delta States.
Pearson Product-Moment Correlation Coefficient was used to answer research
question 10 and hypothesis 5.
Table 19: Pearson Product-Moment Correlation Coefficient between a Teacher’s
Gender and Seeking a Transfer in Bayelsa, Delta and both States
Personal factors School related factors
STATE Gender N R Ρ r2 Ρ
Bayelsa (N=
346) Male 139 -0.037 0.497 -0.069 0.203
Female 207
Delta (N = 370) Male 154 0.033 0.531 0.048 0.357
Female 216
Both states (N
=716) Male 293 0.007 0.859 0.006 0.866
Female 423
Source: Fieldwork 2019/2020.
Table 19 shows that there was no relevant link between teachers gender (sex) and
seeking a transfer in Bayelsa and Delta States (r = 0.033, ρ > 0.05), Bayelsa (r = -0.037, ρ
> 0.05), and in both states (r = 0.007, ρ > 0.05). There was also no remarkable link
between a teacher‘s gender and seeking transfer in Delta State (r = 0.0048, ρ > 0.05),
Bayelsa (r = -0.069, ρ > 0.05) and in both states (r = 0.006, ρ > 0.05). Gender, therefore,
does not have a linkwith teacher changing schools in the studied states.
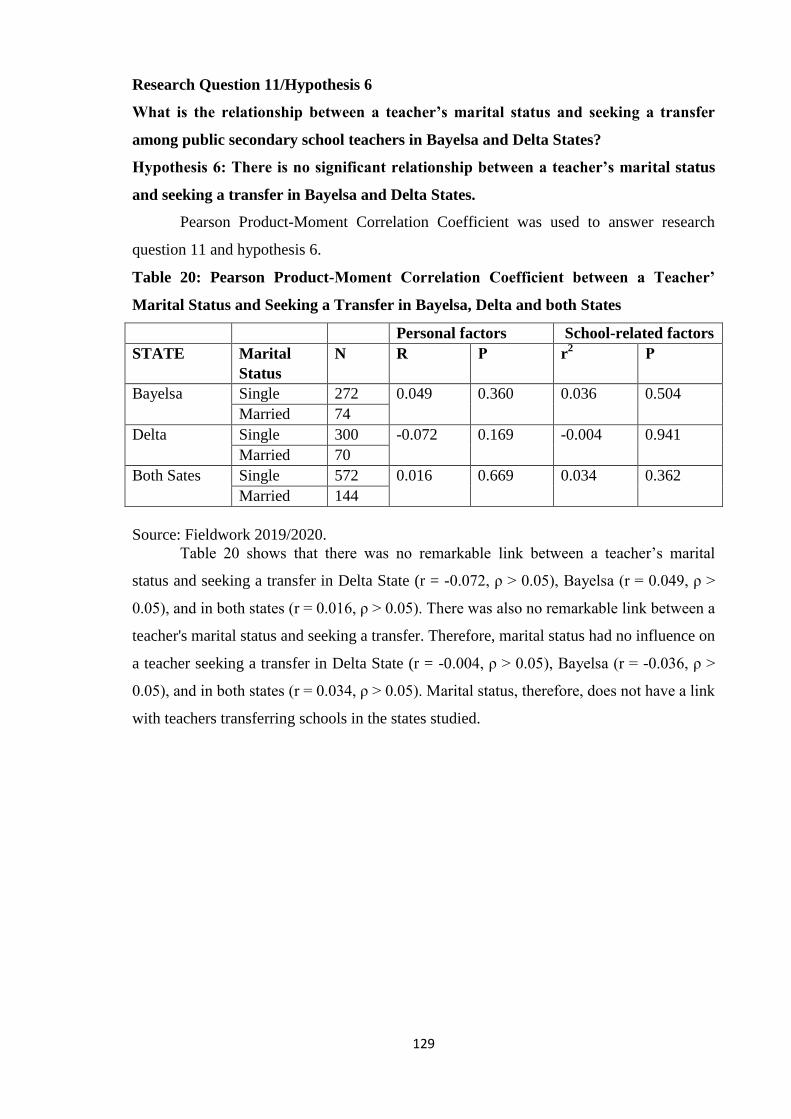
129
Research Question 11/Hypothesis 6
What is the relationship between a teacher’s marital status and seeking a transfer
among public secondary school teachers in Bayelsa and Delta States?
Hypothesis 6: There is no significant relationship between a teacher’s marital status
and seeking a transfer in Bayelsa and Delta States.
Pearson Product-Moment Correlation Coefficient was used to answer research
question 11 and hypothesis 6.
Table 20: Pearson Product-Moment Correlation Coefficient between a Teacher’
Marital Status and Seeking a Transfer in Bayelsa, Delta and both States
Personal factors School-related factors
STATE Marital
Status
N R Ρ r2 Ρ
Bayelsa Single 272 0.049 0.360 0.036 0.504
Married 74
Delta Single 300 -0.072 0.169 -0.004 0.941
Married 70
Both Sates Single 572 0.016 0.669 0.034 0.362
Married 144
Source: Fieldwork 2019/2020.
Table 20 shows that there was no remarkable link between a teacher‘s marital
status and seeking a transfer in Delta State (r = -0.072, ρ > 0.05), Bayelsa (r = 0.049, ρ >
0.05), and in both states (r = 0.016, ρ > 0.05). There was also no remarkable link between a
teacher's marital status and seeking a transfer. Therefore, marital status had no influence on
a teacher seeking a transfer in Delta State (r = -0.004, ρ > 0.05), Bayelsa (r = -0.036, ρ >
0.05), and in both states (r = 0.034, ρ > 0.05). Marital status, therefore, does not have a link
with teachers transferring schools in the states studied.
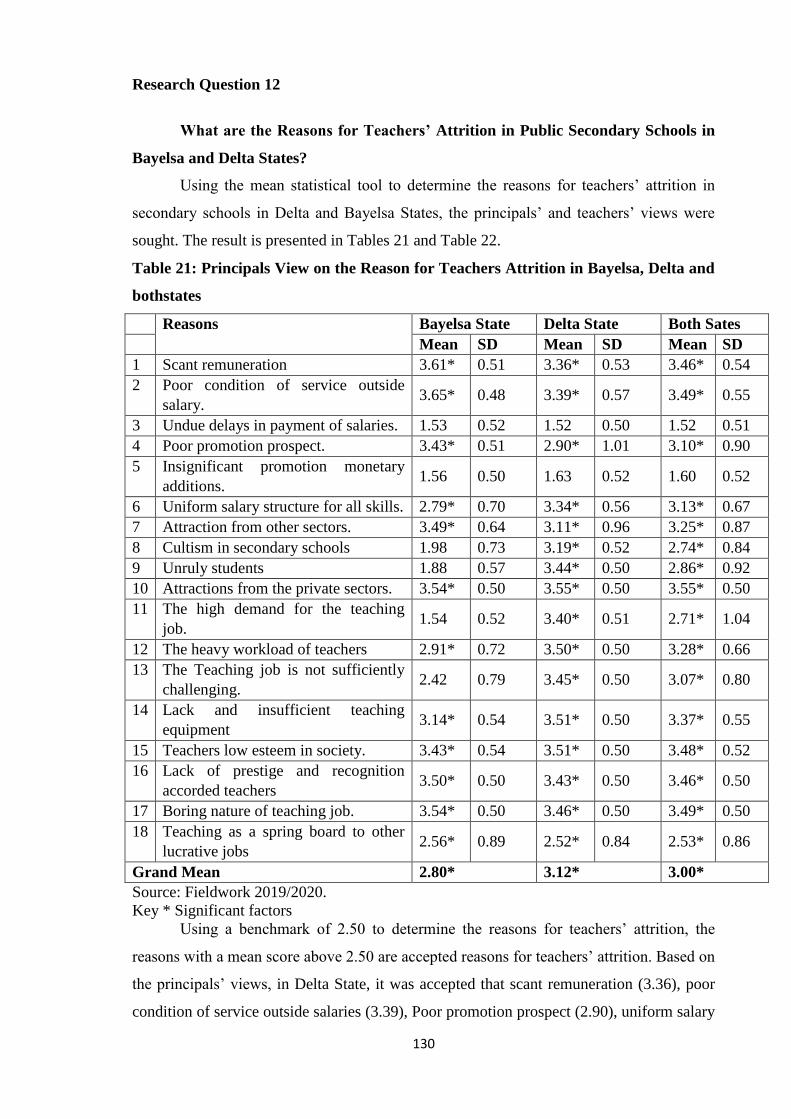
130
Research Question 12
What are the Reasons for Teachers’ Attrition in Public Secondary Schools in
Bayelsa and Delta States?
Using the mean statistical tool to determine the reasons for teachers‘ attrition in
secondary schools in Delta and Bayelsa States, the principals‘ and teachers‘ views were
sought. The result is presented in Tables 21 and Table 22.
Table 21: Principals View on the Reason for Teachers Attrition in Bayelsa, Delta and
bothstates
Reasons Bayelsa State Delta State Both Sates
Mean SD Mean SD Mean SD
1 Scant remuneration 3.61* 0.51 3.36* 0.53 3.46* 0.54
2 Poor condition of service outside
salary. 3.65* 0.48 3.39* 0.57 3.49* 0.55
3 Undue delays in payment of salaries. 1.53 0.52 1.52 0.50 1.52 0.51
4 Poor promotion prospect. 3.43* 0.51 2.90* 1.01 3.10* 0.90
5 Insignificant promotion monetary
additions. 1.56 0.50 1.63 0.52 1.60 0.52
6 Uniform salary structure for all skills. 2.79* 0.70 3.34* 0.56 3.13* 0.67
7 Attraction from other sectors. 3.49* 0.64 3.11* 0.96 3.25* 0.87
8 Cultism in secondary schools 1.98 0.73 3.19* 0.52 2.74* 0.84
9 Unruly students 1.88 0.57 3.44* 0.50 2.86* 0.92
10 Attractions from the private sectors. 3.54* 0.50 3.55* 0.50 3.55* 0.50
11 The high demand for the teaching
job. 1.54 0.52 3.40* 0.51 2.71* 1.04
12 The heavy workload of teachers 2.91* 0.72 3.50* 0.50 3.28* 0.66
13 The Teaching job is not sufficiently
challenging. 2.42 0.79 3.45* 0.50 3.07* 0.80
14 Lack and insufficient teaching
equipment 3.14* 0.54 3.51* 0.50 3.37* 0.55
15 Teachers low esteem in society. 3.43* 0.54 3.51* 0.50 3.48* 0.52
16 Lack of prestige and recognition
accorded teachers 3.50* 0.50 3.43* 0.50 3.46* 0.50
17 Boring nature of teaching job. 3.54* 0.50 3.46* 0.50 3.49* 0.50
18 Teaching as a spring board to other
lucrative jobs 2.56* 0.89 2.52* 0.84 2.53* 0.86
Grand Mean 2.80* 3.12* 3.00*
Source: Fieldwork 2019/2020.
Key * Significant factors
Using a benchmark of 2.50 to determine the reasons for teachers‘ attrition, the
reasons with a mean score above 2.50 are accepted reasons for teachers‘ attrition. Based on
the principals‘ views, in Delta State, it was accepted that scant remuneration (3.36), poor
condition of service outside salaries (3.39), Poor promotion prospect (2.90), uniform salary
131
structure for all skill (3.34), Attraction from other sectors (3.11), Cultism in secondary
schools (3.12), Unruly students (3.44), Attractions from the private sectors (3.55), High
demand of the teaching job (3.40), Heavy workload of teachers (3.50), Teaching job is not
sufficiently challenging (3.45), Lack and insufficient teaching equipment (3.51), Teachers
low esteem in the society (3.51), Lack of prestige and recognition accorded teachers
(3.43), Boring nature of teaching job (3.46), Teaching as a spring board to other lucrative
jobs (2.52) are all reasons for teachers attrition in secondary schools.
In Bayelsa State, the principals are of the opinion that scant remuneration (3.61),
poor condition of service outside the salaries (3.65), Poor promotion prospect (3.42),
uniform salary structure for all skill (2.79), Attraction from other sectors (3.49),
Attractions from the private sectors (3.54), Heavy workload of teachers (2.91), Lack and
insufficient teaching equipment (3.14), Teachers low esteem in the society (3.43), Lack of
prestige and recognition accorded teachers (3.50), Boring nature of teaching job (3.54) and
Teaching as a spring board to other lucrative jobs (2.56) are all reasons for teachers
attrition in secondary schools.
In both states of the study, the principals were of the opinion that scant
remuneration (3.46), poor condition of service outside salary (3.49), Poor promotion
prospect (3.10), uniform salary structure for all skill (3.13), Attraction from other sectors
(3.25), Cultism in secondary schools (2.74), Unruly students (2.86), Attractions from the
private sectors (3.55), High demand of the teaching job (2.71), Heavy workload of teachers
(3.28), Teaching job is not sufficiently challenging (3.07), Lack and insufficient teaching
equipment (3.37), Teachers low esteem in the society (3.48), Lack of prestige and
recognition accorded teachers (3.46), Boring nature of teaching job (3.49), Teaching as a
spring board to other lucrative jobs (2.53) are all reasons for teachers attrition in secondary
schools.
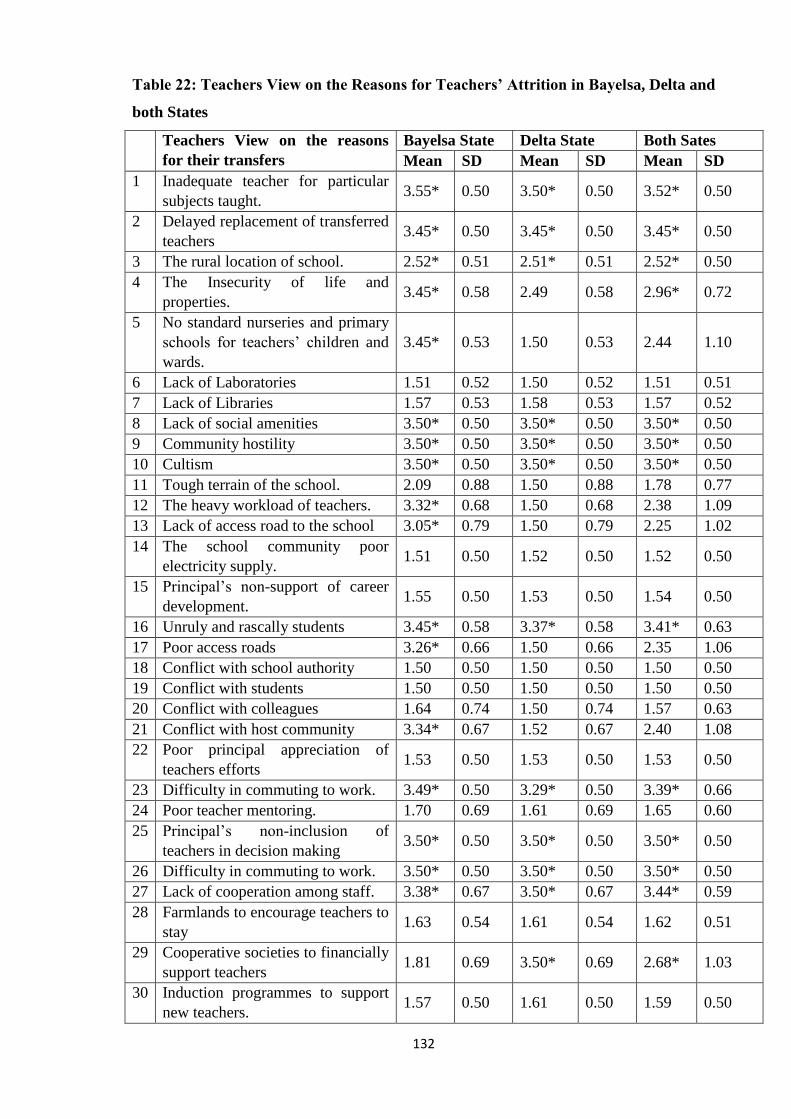
132
Table 22: Teachers View on the Reasons for Teachers’ Attrition in Bayelsa, Delta and
both States
Teachers View on the reasons
for their transfers
Bayelsa State Delta State Both Sates
Mean SD Mean SD Mean SD
1 Inadequate teacher for particular
subjects taught. 3.55* 0.50 3.50* 0.50 3.52* 0.50
2 Delayed replacement of transferred
teachers 3.45* 0.50 3.45* 0.50 3.45* 0.50
3 The rural location of school. 2.52* 0.51 2.51* 0.51 2.52* 0.50
4 The Insecurity of life and
properties. 3.45* 0.58 2.49 0.58 2.96* 0.72
5 No standard nurseries and primary
schools for teachers‘ children and
wards.
3.45* 0.53 1.50 0.53 2.44 1.10
6 Lack of Laboratories 1.51 0.52 1.50 0.52 1.51 0.51
7 Lack of Libraries 1.57 0.53 1.58 0.53 1.57 0.52
8 Lack of social amenities 3.50* 0.50 3.50* 0.50 3.50* 0.50
9 Community hostility 3.50* 0.50 3.50* 0.50 3.50* 0.50
10 Cultism 3.50* 0.50 3.50* 0.50 3.50* 0.50
11 Tough terrain of the school. 2.09 0.88 1.50 0.88 1.78 0.77
12 The heavy workload of teachers. 3.32* 0.68 1.50 0.68 2.38 1.09
13 Lack of access road to the school 3.05* 0.79 1.50 0.79 2.25 1.02
14 The school community poor
electricity supply. 1.51 0.50 1.52 0.50 1.52 0.50
15 Principal‘s non-support of career
development. 1.55 0.50 1.53 0.50 1.54 0.50
16 Unruly and rascally students 3.45* 0.58 3.37* 0.58 3.41* 0.63
17 Poor access roads 3.26* 0.66 1.50 0.66 2.35 1.06
18 Conflict with school authority 1.50 0.50 1.50 0.50 1.50 0.50
19 Conflict with students 1.50 0.50 1.50 0.50 1.50 0.50
20 Conflict with colleagues 1.64 0.74 1.50 0.74 1.57 0.63
21 Conflict with host community 3.34* 0.67 1.52 0.67 2.40 1.08
22 Poor principal appreciation of
teachers efforts 1.53 0.50 1.53 0.50 1.53 0.50
23 Difficulty in commuting to work. 3.49* 0.50 3.29* 0.50 3.39* 0.66
24 Poor teacher mentoring. 1.70 0.69 1.61 0.69 1.65 0.60
25 Principal‘s non-inclusion of
teachers in decision making 3.50* 0.50 3.50* 0.50 3.50* 0.50
26 Difficulty in commuting to work. 3.50* 0.50 3.50* 0.50 3.50* 0.50
27 Lack of cooperation among staff. 3.38* 0.67 3.50* 0.67 3.44* 0.59
28 Farmlands to encourage teachers to
stay 1.63 0.54 1.61 0.54 1.62 0.51
29 Cooperative societies to financially
support teachers 1.81 0.69 3.50* 0.69 2.68* 1.03
30 Induction programmes to support
new teachers. 1.57 0.50 1.61 0.50 1.59 0.50
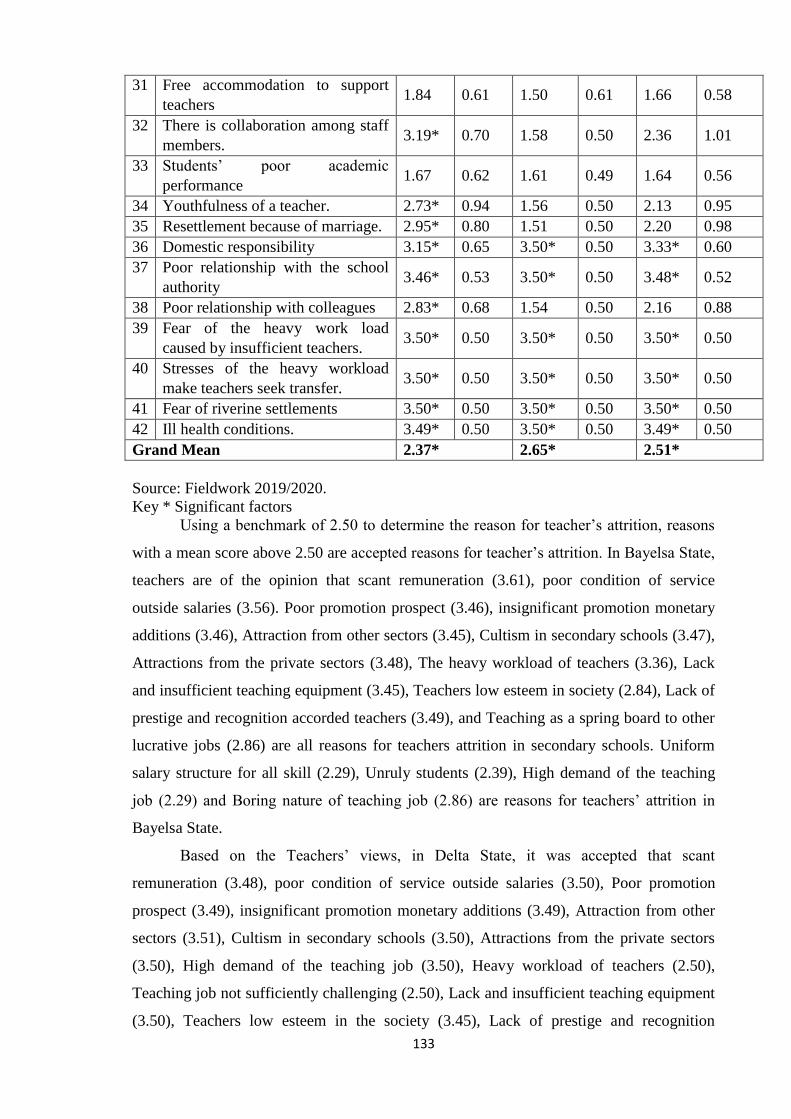
133
31 Free accommodation to support
teachers 1.84 0.61 1.50 0.61 1.66 0.58
32 There is collaboration among staff
members. 3.19* 0.70 1.58 0.50 2.36 1.01
33 Students‘ poor academic
performance 1.67 0.62 1.61 0.49 1.64 0.56
34 Youthfulness of a teacher. 2.73* 0.94 1.56 0.50 2.13 0.95
35 Resettlement because of marriage. 2.95* 0.80 1.51 0.50 2.20 0.98
36 Domestic responsibility 3.15* 0.65 3.50* 0.50 3.33* 0.60
37 Poor relationship with the school
authority 3.46* 0.53 3.50* 0.50 3.48* 0.52
38 Poor relationship with colleagues 2.83* 0.68 1.54 0.50 2.16 0.88
39 Fear of the heavy work load
caused by insufficient teachers. 3.50* 0.50 3.50* 0.50 3.50* 0.50
40 Stresses of the heavy workload
make teachers seek transfer. 3.50* 0.50 3.50* 0.50 3.50* 0.50
41 Fear of riverine settlements 3.50* 0.50 3.50* 0.50 3.50* 0.50
42 Ill health conditions. 3.49* 0.50 3.50* 0.50 3.49* 0.50
Grand Mean 2.37* 2.65* 2.51*
Source: Fieldwork 2019/2020.
Key * Significant factors
Using a benchmark of 2.50 to determine the reason for teacher‘s attrition, reasons
with a mean score above 2.50 are accepted reasons for teacher‘s attrition. In Bayelsa State,
teachers are of the opinion that scant remuneration (3.61), poor condition of service
outside salaries (3.56). Poor promotion prospect (3.46), insignificant promotion monetary
additions (3.46), Attraction from other sectors (3.45), Cultism in secondary schools (3.47),
Attractions from the private sectors (3.48), The heavy workload of teachers (3.36), Lack
and insufficient teaching equipment (3.45), Teachers low esteem in society (2.84), Lack of
prestige and recognition accorded teachers (3.49), and Teaching as a spring board to other
lucrative jobs (2.86) are all reasons for teachers attrition in secondary schools. Uniform
salary structure for all skill (2.29), Unruly students (2.39), High demand of the teaching
job (2.29) and Boring nature of teaching job (2.86) are reasons for teachers‘ attrition in
Bayelsa State.
Based on the Teachers‘ views, in Delta State, it was accepted that scant
remuneration (3.48), poor condition of service outside salaries (3.50), Poor promotion
prospect (3.49), insignificant promotion monetary additions (3.49), Attraction from other
sectors (3.51), Cultism in secondary schools (3.50), Attractions from the private sectors
(3.50), High demand of the teaching job (3.50), Heavy workload of teachers (2.50),
Teaching job not sufficiently challenging (2.50), Lack and insufficient teaching equipment
(3.50), Teachers low esteem in the society (3.45), Lack of prestige and recognition
134
accorded teachers (3.49), Boring nature of teaching job (3.50) and teaching as a spring
board to other lucrative jobs (3.50) are all reasons for teachers attrition in secondary
schools.
In both states studied, the teachers were of the opinion that scant remuneration
(3.53), poor condition of service outside salaries (3.53), Poor promotion prospect (3.47),
insignificant promotion monetary additions (3.46), Attraction from other sectors (3.50),
Cultism in secondary schools (3.48), Attractions from the private sectors (3.49), High
demand of the teaching job (2.91), Heavy workload of teachers (2.91), Lack and
insufficient teaching equipment (3.47), Teachers low esteem in the society (3.15), Lack of
prestige and recognition accorded teachers (3.49), Boring nature of teaching job (2.60),
Teaching as a spring board to other lucrative jobs (3.19) are all reasons for teachers
attrition in secondary schools in Bayelsa and Delta States. Teachers in both states of the
study did not see undue delays of payment in salaries (1.51), uniform salary structure for
all skill (1.93), Unruly students (1.93) and Teaching job is not sufficiently challenging
(2.21) as reasons for teachers‘ attrition in both State.
Comparing the principals‘ and teachers‘ views on the reasons for teachers‘ attrition
in secondary schools in the States studied, a graph (Figure 5) was plotted using the mean
values for the various reasons and numbers one to 18 to represent each reason as presented
in Tables 21 and 22.
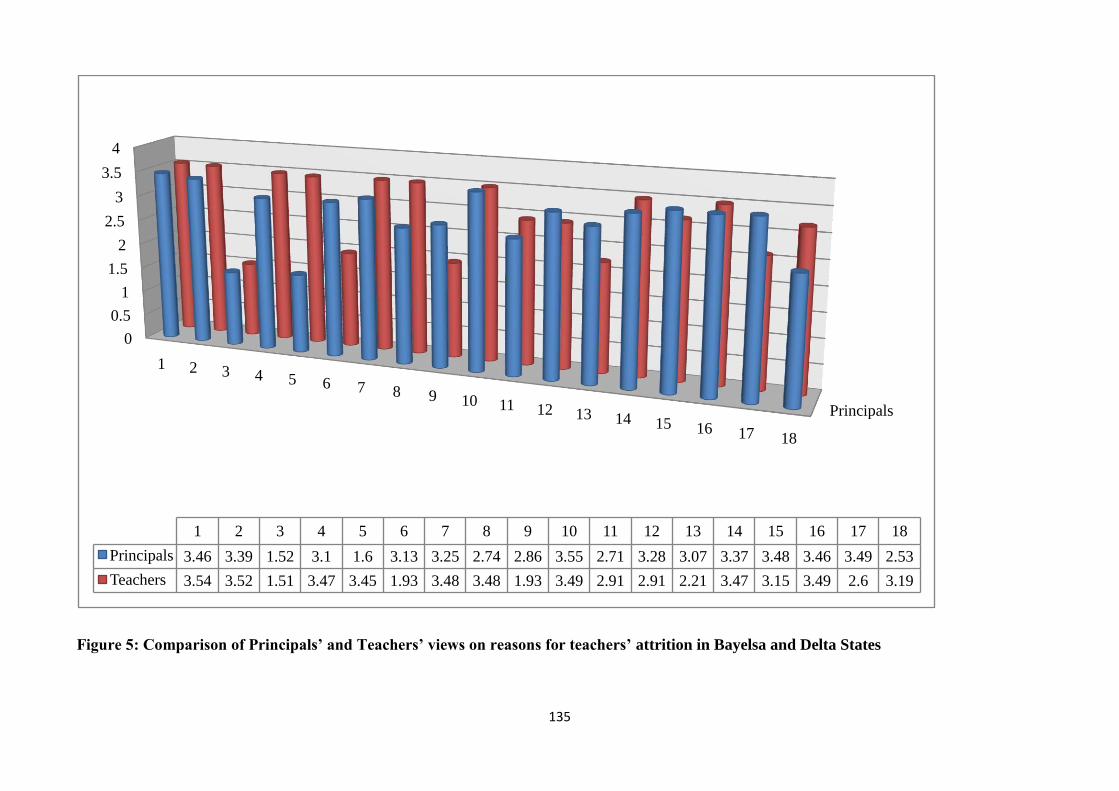
135
Figure 5: Comparison of Principals’ and Teachers’ views on reasons for teachers’ attrition in Bayelsa and Delta States
Principals
0
0.5
1
1.5
2
2.5
3
3.5
4
1 2 3 4 5 6 7 8 9 10 11 12 13 14 15 16 17 18
1 2 3 4 5 6 7 8 9 10 11 12 13 14 15 16 17 18
Principals 3.46 3.39 1.52 3.1 1.6 3.13 3.25 2.74 2.86 3.55 2.71 3.28 3.07 3.37 3.48 3.46 3.49 2.53
Teachers 3.54 3.52 1.51 3.47 3.45 1.93 3.48 3.48 1.93 3.49 2.91 2.91 2.21 3.47 3.15 3.49 2.6 3.19
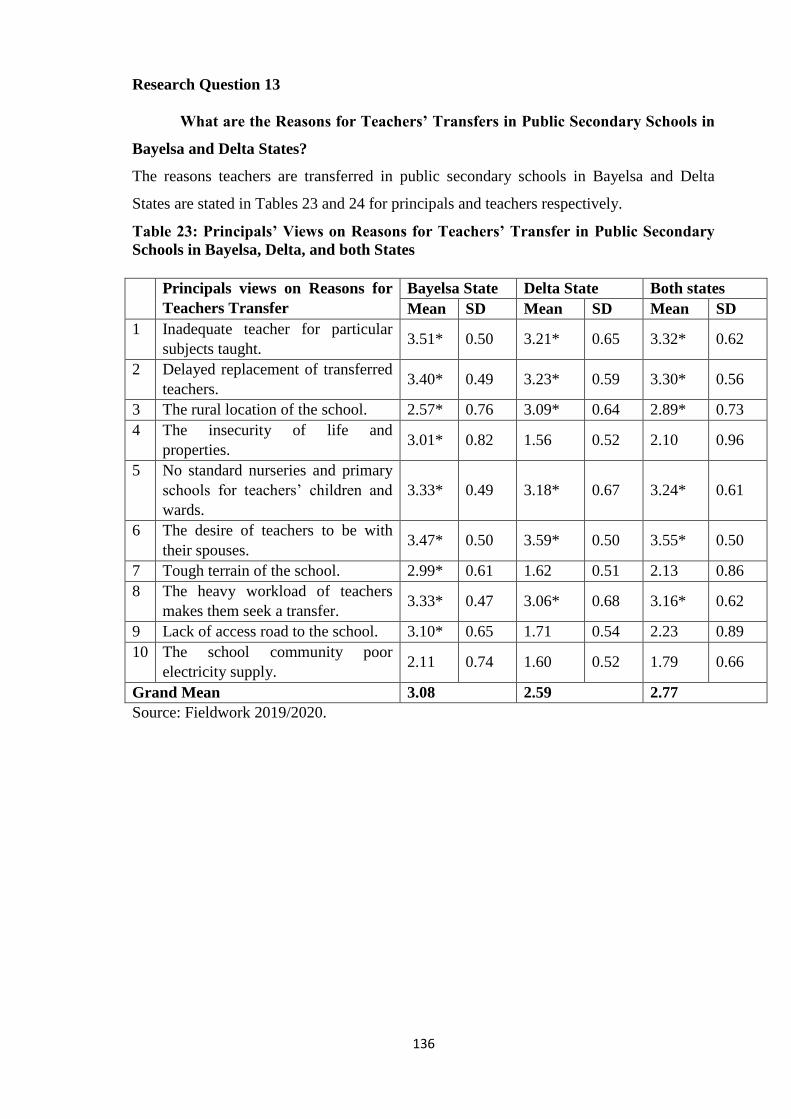
136
Research Question 13
What are the Reasons for Teachers’ Transfers in Public Secondary Schools in
Bayelsa and Delta States?
The reasons teachers are transferred in public secondary schools in Bayelsa and Delta
States are stated in Tables 23 and 24 for principals and teachers respectively.
Table 23: Principals’ Views on Reasons for Teachers’ Transfer in Public Secondary
Schools in Bayelsa, Delta, and both States Principals views on Reasons for
Teachers Transfer
Bayelsa State Delta State Both states
Mean SD Mean SD Mean SD
1 Inadequate teacher for particular
subjects taught. 3.51* 0.50 3.21* 0.65 3.32* 0.62
2 Delayed replacement of transferred
teachers. 3.40* 0.49 3.23* 0.59 3.30* 0.56
3 The rural location of the school. 2.57* 0.76 3.09* 0.64 2.89* 0.73
4 The insecurity of life and
properties. 3.01* 0.82 1.56 0.52 2.10 0.96
5 No standard nurseries and primary
schools for teachers‘ children and
wards.
3.33* 0.49 3.18* 0.67 3.24* 0.61
6 The desire of teachers to be with
their spouses. 3.47* 0.50 3.59* 0.50 3.55* 0.50
7 Tough terrain of the school. 2.99* 0.61 1.62 0.51 2.13 0.86
8 The heavy workload of teachers
makes them seek a transfer. 3.33* 0.47 3.06* 0.68 3.16* 0.62
9 Lack of access road to the school. 3.10* 0.65 1.71 0.54 2.23 0.89
10 The school community poor
electricity supply. 2.11 0.74 1.60 0.52 1.79 0.66
Grand Mean 3.08 2.59 2.77
Source: Fieldwork 2019/2020.
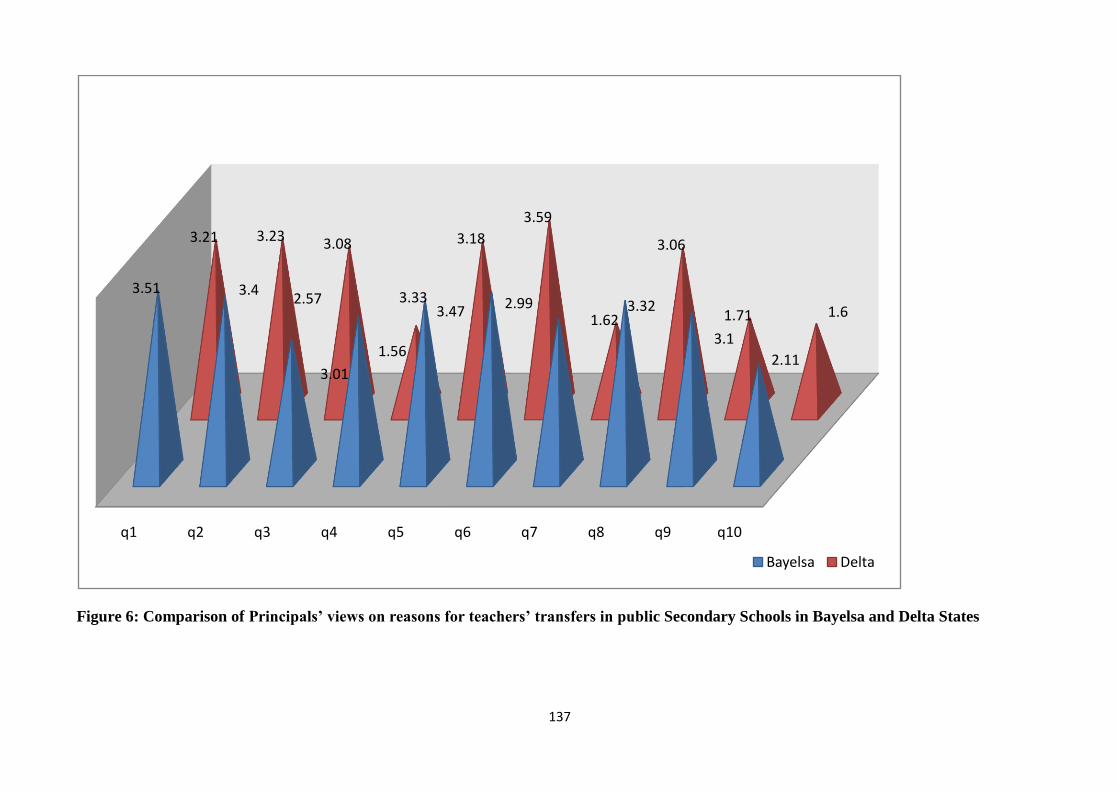
137
Figure 6: Comparison of Principals’ views on reasons for teachers’ transfers in public Secondary Schools in Bayelsa and Delta States
q1 q2 q3 q4 q5 q6 q7 q8 q9 q10
3.51 3.42.57
3.01
3.333.47
2.99 3.32
3.1
2.11
3.21 3.23 3.08
1.56
3.18
3.59
1.62
3.06
1.71 1.6
Bayelsa Delta
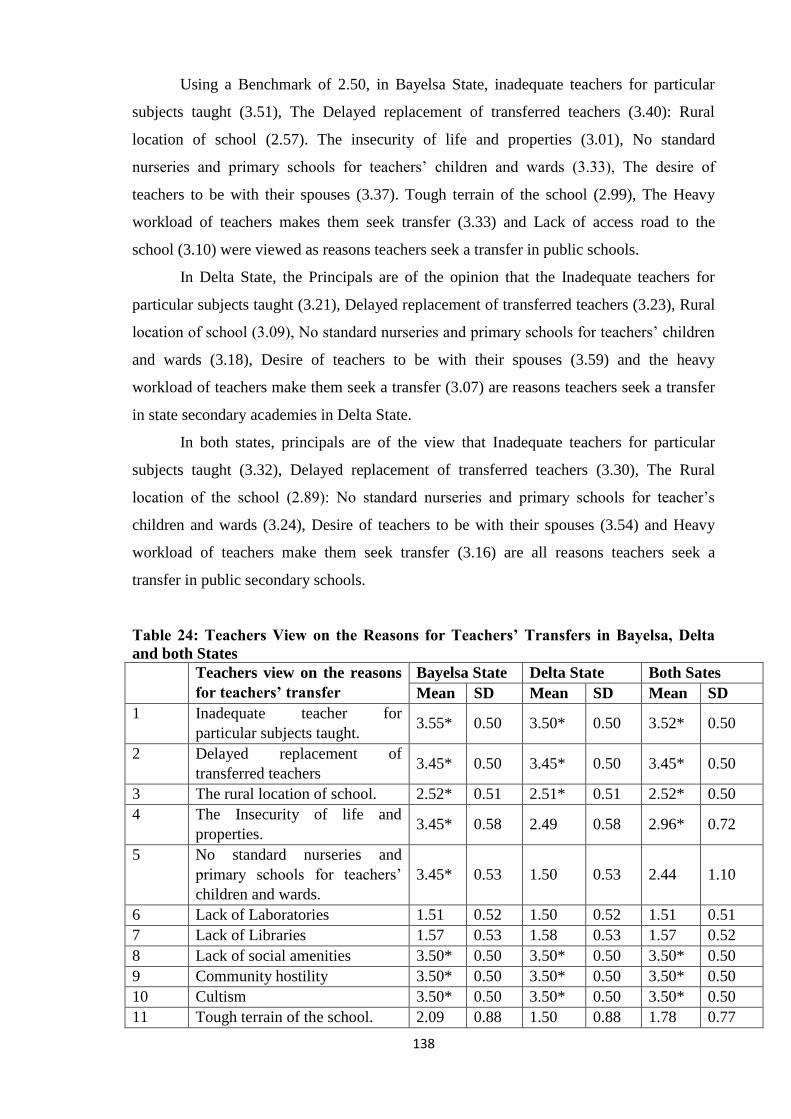
138
Using a Benchmark of 2.50, in Bayelsa State, inadequate teachers for particular
subjects taught (3.51), The Delayed replacement of transferred teachers (3.40): Rural
location of school (2.57). The insecurity of life and properties (3.01), No standard
nurseries and primary schools for teachers‘ children and wards (3.33), The desire of
teachers to be with their spouses (3.37). Tough terrain of the school (2.99), The Heavy
workload of teachers makes them seek transfer (3.33) and Lack of access road to the
school (3.10) were viewed as reasons teachers seek a transfer in public schools.
In Delta State, the Principals are of the opinion that the Inadequate teachers for
particular subjects taught (3.21), Delayed replacement of transferred teachers (3.23), Rural
location of school (3.09), No standard nurseries and primary schools for teachers‘ children
and wards (3.18), Desire of teachers to be with their spouses (3.59) and the heavy
workload of teachers make them seek a transfer (3.07) are reasons teachers seek a transfer
in state secondary academies in Delta State.
In both states, principals are of the view that Inadequate teachers for particular
subjects taught (3.32), Delayed replacement of transferred teachers (3.30), The Rural
location of the school (2.89): No standard nurseries and primary schools for teacher‘s
children and wards (3.24), Desire of teachers to be with their spouses (3.54) and Heavy
workload of teachers make them seek transfer (3.16) are all reasons teachers seek a
transfer in public secondary schools.
Table 24: Teachers View on the Reasons for Teachers’ Transfers in Bayelsa, Delta
and both States
Teachers view on the reasons
for teachers’ transfer
Bayelsa State Delta State Both Sates
Mean SD Mean SD Mean SD
1 Inadequate teacher for
particular subjects taught. 3.55* 0.50 3.50* 0.50 3.52* 0.50
2 Delayed replacement of
transferred teachers 3.45* 0.50 3.45* 0.50 3.45* 0.50
3 The rural location of school. 2.52* 0.51 2.51* 0.51 2.52* 0.50
4 The Insecurity of life and
properties. 3.45* 0.58 2.49 0.58 2.96* 0.72
5 No standard nurseries and
primary schools for teachers‘
children and wards.
3.45* 0.53 1.50 0.53 2.44 1.10
6 Lack of Laboratories 1.51 0.52 1.50 0.52 1.51 0.51
7 Lack of Libraries 1.57 0.53 1.58 0.53 1.57 0.52
8 Lack of social amenities 3.50* 0.50 3.50* 0.50 3.50* 0.50
9 Community hostility 3.50* 0.50 3.50* 0.50 3.50* 0.50
10 Cultism 3.50* 0.50 3.50* 0.50 3.50* 0.50
11 Tough terrain of the school. 2.09 0.88 1.50 0.88 1.78 0.77
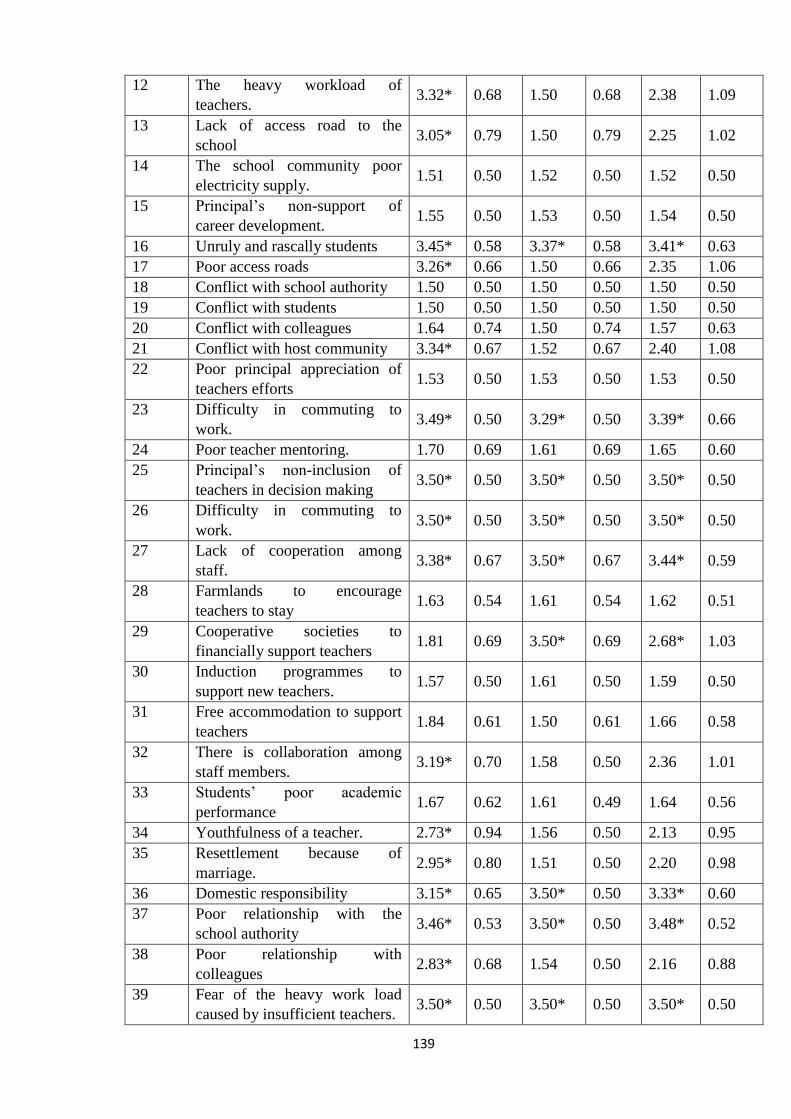
139
12 The heavy workload of
teachers. 3.32* 0.68 1.50 0.68 2.38 1.09
13 Lack of access road to the
school 3.05* 0.79 1.50 0.79 2.25 1.02
14 The school community poor
electricity supply. 1.51 0.50 1.52 0.50 1.52 0.50
15 Principal‘s non-support of
career development. 1.55 0.50 1.53 0.50 1.54 0.50
16 Unruly and rascally students 3.45* 0.58 3.37* 0.58 3.41* 0.63
17 Poor access roads 3.26* 0.66 1.50 0.66 2.35 1.06
18 Conflict with school authority 1.50 0.50 1.50 0.50 1.50 0.50
19 Conflict with students 1.50 0.50 1.50 0.50 1.50 0.50
20 Conflict with colleagues 1.64 0.74 1.50 0.74 1.57 0.63
21 Conflict with host community 3.34* 0.67 1.52 0.67 2.40 1.08
22 Poor principal appreciation of
teachers efforts 1.53 0.50 1.53 0.50 1.53 0.50
23 Difficulty in commuting to
work. 3.49* 0.50 3.29* 0.50 3.39* 0.66
24 Poor teacher mentoring. 1.70 0.69 1.61 0.69 1.65 0.60
25 Principal‘s non-inclusion of
teachers in decision making 3.50* 0.50 3.50* 0.50 3.50* 0.50
26 Difficulty in commuting to
work. 3.50* 0.50 3.50* 0.50 3.50* 0.50
27 Lack of cooperation among
staff. 3.38* 0.67 3.50* 0.67 3.44* 0.59
28 Farmlands to encourage
teachers to stay 1.63 0.54 1.61 0.54 1.62 0.51
29 Cooperative societies to
financially support teachers 1.81 0.69 3.50* 0.69 2.68* 1.03
30 Induction programmes to
support new teachers. 1.57 0.50 1.61 0.50 1.59 0.50
31 Free accommodation to support
teachers 1.84 0.61 1.50 0.61 1.66 0.58
32 There is collaboration among
staff members. 3.19* 0.70 1.58 0.50 2.36 1.01
33 Students‘ poor academic
performance 1.67 0.62 1.61 0.49 1.64 0.56
34 Youthfulness of a teacher. 2.73* 0.94 1.56 0.50 2.13 0.95
35 Resettlement because of
marriage. 2.95* 0.80 1.51 0.50 2.20 0.98
36 Domestic responsibility 3.15* 0.65 3.50* 0.50 3.33* 0.60
37 Poor relationship with the
school authority 3.46* 0.53 3.50* 0.50 3.48* 0.52
38 Poor relationship with
colleagues 2.83* 0.68 1.54 0.50 2.16 0.88
39 Fear of the heavy work load
caused by insufficient teachers. 3.50* 0.50 3.50* 0.50 3.50* 0.50
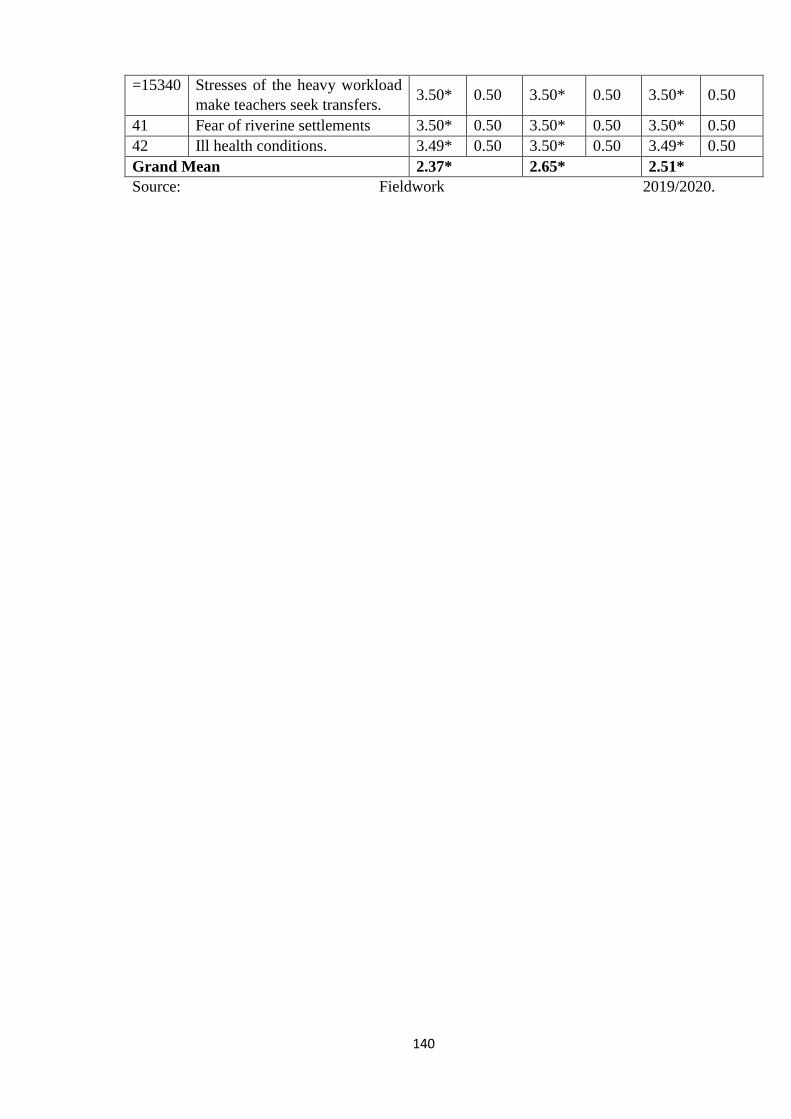
140
=15340 Stresses of the heavy workload
make teachers seek transfers. 3.50* 0.50 3.50* 0.50 3.50* 0.50
41 Fear of riverine settlements 3.50* 0.50 3.50* 0.50 3.50* 0.50
42 Ill health conditions. 3.49* 0.50 3.50* 0.50 3.49* 0.50
Grand Mean 2.37* 2.65* 2.51*
Source: Fieldwork 2019/2020.
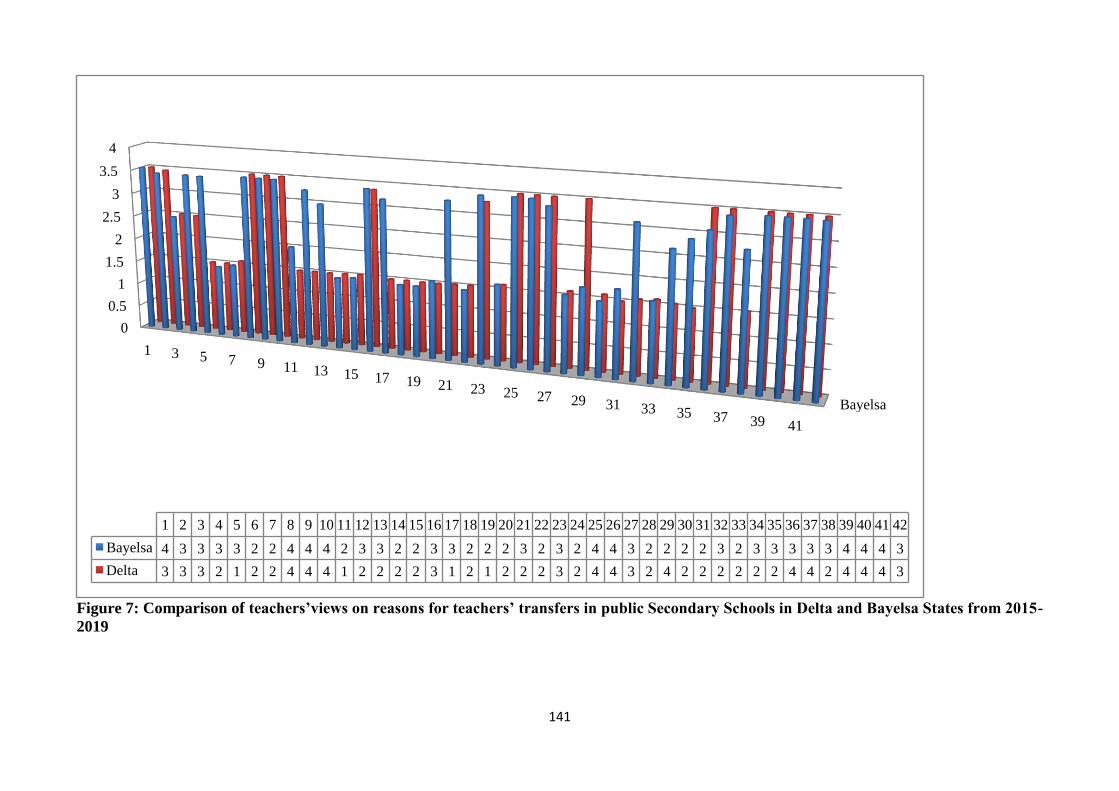
141
Figure 7: Comparison of teachers’views on reasons for teachers’ transfers in public Secondary Schools in Delta and Bayelsa States from 2015-
2019
Bayelsa
0
0.5
1
1.5
2
2.5
3
3.5
4
1 3 5 7 9 11 13 15 17 19 21 23 25 27 29 31 33 35 37 39 41
1 2 3 4 5 6 7 8 9 10 11 12 13 14 15 16 17 18 19 20 21 22 23 24 25 26 27 28 29 30 31 32 33 34 35 36 37 38 39 40 41 42
Bayelsa 4 3 3 3 3 2 2 4 4 4 2 3 3 2 2 3 3 2 2 2 3 2 3 2 4 4 3 2 2 2 2 3 2 3 3 3 3 3 4 4 4 3
Delta 3 3 3 2 1 2 2 4 4 4 1 2 2 2 2 3 1 2 1 2 2 2 3 2 4 4 3 2 4 2 2 2 2 2 2 4 4 2 4 4 4 3
Teachers‘ views were grouped into two: School-related factors and personal
factors. Table 24 shows that the school-related factors that could necessitate the transfer of
tutors in state secondary academies in Delta State are Inadequate teachers for particular
subjects taught (3.50), Delayed replacement of transferred teachers (3.45), Rural location
of school (2.51), Insecurity of life and properties (2.50), Lack of social amenities (3.50),
Community hostility (3.50), Cultism (3.50), Unruly and rascally students (3.37), Difficulty
in commuting to work (3.29), Principal‘s non-inclusion of teachers in decision making
(3.50), Difficulty in commuting to work (3.50), Lack of cooperation among staff (3.50)
and Cooperative societies to financially support teachers (3.50) are the factors that could
lead a teacher to seek a transfer. The following personal factors are reasons teachers seek a
transfer in Delta State. Domestic responsibility (3.50): Poor relationship with the school
authority (3.50): Fear of the heavy workload caused by insufficient teachers (3.50),
Stresses of the heavy workload make teachers to seek transfers (3.50). Fear of riverine
settlements (3.50) and ill-health conditions (3.50).
For teachers in Bayelsa State, Inadequate teachers for particular subjects taught
(3.55), Delayed replacement of transferred teachers (3.45), Rural location of school (2.52)
Insecurity of life and properties (3.45), No standard nurseries and primary schools for
teachers‘ children and wards (3.45), Lack of social amenities (3.50), Community hostility
(3.50), Cultism (3.50), the Heavy workload of teachers (3.32), Lack of access road to the
school (3.06), Unruly and rascally students (3.45), Poor access roads (3.26), Conflict with
host community (3.34), Difficulty in commuting to work (3.50): Principals‘ non-inclusion
of teachers in decision making (3.50), Difficulty in commuting to work (3.50), Lack of
cooperation among staff. (3.37); and there is a collaboration among staff members (3.19).
The personal reasons for seeking transfer are Domestic responsibility (3.15), Poor
relationship with the school authority (3.46), Poor relationship with colleagues (2.83), Fear
of the heavy workload caused by insufficient teachers (3.50), Stresses of the heavy
workload make teachers seek transfer (3.50), Fear of riverine settlements (3.50) and Ill
health conditions (3.49).
For teachers in both states, Inadequate teachers for particular subjects taught
(3.52), Delayed replacement of transferred teachers (3.45), Rural location of school (2.52)
Insecurity of life and properties (3.00), Community hostility (3.50), Cultism (3.50), Unruly
and rascally students (3.41), Difficulty in commuting to work (3.50): Principal‘s non-
inclusion of teachers in decision making (3.50), Difficulty in commuting to work (3.39),
Lack of cooperation among staff (3.37); Principals non-inclusion of teachers in decision
making (3.50), the Lack of cooperation among staff (3.44), Cooperative societies to
cxliii
financially support teachers (2.68). The personal reasons for seeking transfer are Domestic
responsibility (3.33), Poor relationship with the school authority (3.48), Fear of the heavy
workload caused by insufficient teachers (3.50), Stresses of the heavy workload make
teachers seek transfer (3.50), Fear of riverine settlements (3.50) and Ill health conditions
(3.49) remain factors of the transfer. These findings are consistent with that of (Luschei
and Chudgar, 2017) who reported conflict with the management, that the absence of
fundamental school amenities, huge and difficult workloads, compelling teaching
circumstances, constrained chances for occupational advancement, desire to work closer
home were the primary determinants of teachers transfer.
Discussion of Results
The first research question sought to find out teachers‘ attrition rates in public
secondary schools for Bayelsa and Delta States for 5 years between 2015 and 2019. The
findings showed an average attrition rate of 5.55% for Delta State. Bayelsa had a mean
attrition rate of 14.24% while the average attrition rate for both states is 8.23%. The study
further revealed that Bayelsa State recorded a higher attrition rate than Delta State in 2015,
2016 and 2019, while Delta State recorded a higher attrition rate in 2017 and 2018. This
finding agrees with that of (Meyer et al., 2019) who reported 12% attrition in state
secondary academies in four states of America.
Also, the ‗Centre for Education Statistics School and Staffing survey (2014) found
incredible teachers‘ attrition rate of 24% annually in Arizona. Similarly, there was an
alarming 23% in New Mexico (Learning Policy Institute, 2014). The rates reported in this
present study in Nigeria are relatively lower than those of the U.S. The results differentials
may have been the outcome of disparities in the levels of societal development which may
have a relationship with the economic status of the teachers.
Here in Nigeria (Adamu, 2010) reported that the rate of teachers‘ attrition varied
from one geographical and political divide to another. In the South-South political
division, teachers‘ attrition is milder with about 10-15% compared to the Northern part
with between 15 and 20% teachers‘ attrition rate (Adamu, 2010). The variations between
the rates obtained in the present study and that reported by (Adamu, 2010) are probably
due to the time or period of study. While the finding of Adamu was reported in 2010, the
present study is from 2015 to 2019.
It is both vital and necessary to note that between the year 2010 and 2019; the
economy of Nigeria has been unstable with a growing inflation rate; crashing crude oil
price, currency devaluation and the falling value of money, the rising cost of living, falling
cxliv
standard of living, unemployment and corruption that has negatively affected the economy
in spite of a six percent rate of growth for six years period from 2004 to 2010 (Jaiyeola
and Bayat, 2020). The outcome is dissatisfied teachers with no alternative than to remain
in teaching in support of the findings of the New Zealand Post Primary Teacher
Association (NZPPTA, 2016) that reported alternative salaries in jobs outside teaching is
part of the problems of teachers‘ attrition. Also (Thorpe, 2016) reported for many teachers,
higher wages and easier work available outside teaching accounted for up to 30% of the
teacher quit rate. This is consistent with the finding (Mumtaz and Hasan, 2018) that
lucrative job opportunities outside the school organisation are a major distraction for
teachers,especially the newly employed. This is the likely reason for the relatively low rate
of attrition reported in this study.
However, against popular findings that beginning teachers salaries are a major
determinant of their retention in the job (Darling-Harmond and Thomas, 2019) study
reported beginning teachers‘ pay did not predict teachers quitting; instead, compensation
and administrative support did. This is also compactable with the study (Makarova, 2018)
that found scant salaries constitute the primary reason for teachers‘ job resignation.
The second research question was posed to find out the rate of public secondary
school teachers‘ transfer for Bayelsa and Delta States for 5 years between 2015 and 2019.
The findings showed an average transfer rate of 11.6% for Bayelsa State, 7.26% for Delta
State and 8.31% for both States studied. In both states, the transfer rates were highest in
2019, 18.87% in Bayelsa State and 18.99% in Delta State. Comparison of transfers in both
states of the study shows in 2015, Delta State had a higher transfer rate than Bayelsa State,
while Bayelsa State had a higher transfer rate than Delta in 2016, 2017 and 2018. Delta
State recorded a higher transfer rate than Bayelsa State in 2019. However, on average, the
rate of transfer was low (less than 10%) in both states.
The Institute for Statistics of the (UNESCO, 2016) reported earlier that the rate of
teacher‘s transfer was so high. This is not in agreement with the findings in the present
study. The UIS added that up to 24.4 million teachers are required for the UBE
programme. Also (Adnot et al. 2017) found that teachers‘ transfers exert a disastrous
impact on the education sector of the affected states. Similarly (Mack et al., 2019) found
that high transfer rates among teachers in public school classrooms undermine school
stability, impedes educational reform and hurts student achievement.
cxlv
The third research question sought to determine the rates of students‘ mobility
from the public to private secondary schools in Bayelsa and Delta States in the years
studied. The findings revealed a low rate of students‘ mobility from the public to private
secondary schools was low in both states. Average students‘ mobility rate of 11.16% was
found for Bayelsa State students, 7.26% for Delta State and 8.35% for both States. Delta
State reported a lower rate than Bayelsa State. However, for both states, the rate was
higher in 2019, 26.1% in Delta and 21.5% in Bayelsa, students‘ mobility is a constant
occurrence in life.
The reasons for students‘ mobility may include the following: Students and their
families opting to move a student‘s school with an increase in income resulting in access
to private schools that were previously not affordable because of the high cost of tuition.
Schools can initiate students‘ mobility through the expulsion of students. Parents may be
transferred to a faraway town across local government areas or states boarders for federal
employees. That may lead to students‘ mobility to other learning facilities (Rumberger,
2015, 2017).
Consistent with the report of this study (Welsh et al., 2016) reported that students‘
mobility is widespread and unheralded and those other reasons for school mobility are
often caused by families and comes from the change of residences attendant to sudden and
impromptu occurrences such as job changes or relocation to better homes, eviction or
complicated family conflicts with cataclysmic outcomes such as a divorce.
The lower students‘ mobility rate reported in Delta State probably suggest that
some schools are disproportionately affected by transfers and the economic status of some
parents in Delta State may have been better than those of parents in Bayelsa State. Also,
the higher transfer rate reported in 2019 in both states probably suggests that there was a
slacked compliance with strict students transfer policy, ethics and practise in 2018 than in
previous years; hence, parents backed their children‘s movement from the public
secondary schools to private secondary schools is significant, but not on the high side,
neither is it a new phenomenon. Since the loss of the glory of state secondary academies in
Nigeria, a lot of students have started schools mobility and until the issues responsible for
this practice are resolved by the authorities, there may not be an end to the drift (Jerinde,
2007; Agwu, et al., 2020 and Okoye and Onwuzuruoha).
Obviously, most public secondary schools, especially in the urban areas, are better
than the private ones judged by school plant; quality of teachers, available amenities, and
different equipment to mention only a few. Also, the public secondary schools pay better
salaries than the private ones. In spite of this, there has been a continuous drift of students
cxlvi
out of public secondary schools to the privates. The obvious reason is some moving
students do so for better results obtained by examination malpractices based on the fear of
failing because they may not be aided to pass their examinations by fraudulent means.
The fourth research question was asked to determine the pattern of students‘
mobility from the state to private secondary academies in both states studied between 2015
and 2019. The findings revealed that the majority of students moved in the first term when
they were in JS 3 and SS 3 in the two states studied. This agrees with the findings of
Taniguchi (2015), who reported that in Uganda, the number of students that switched
schools grew to 67.8% and 55.5%, respectively, of Grade 3 and 6 students. Students who
transited more than one time were not less than 39.0%. Those who moved more than two
times were 34.7%. It is obvious most of the students moving schools do so in the first term
to catch up with certificate examination enrolments.
The fifth research question was posed to know the explanation for students‘
mobility from the public to private secondary academies in both states studied. The
findings showed that a high rate of students‘ mobility, absence of tutors for many subjects,
the untimely replacement for the transferred teacher and unsuitable replacement of
transferred teachers were some reasons students moved from the public to private schools.
Others were the rural location of the school with fewer teachers, frequently disrupted
lessons flow by teacher transfers and low-quality lessons that caused a dislike of public
schools and a move to private secondary schools. However, most moves to private
secondary schools were made in certificate classes because the students knew they would
not be assisted to pass the examinations and the worry of failing the examinations in their
previous schools accounted for students‘ mobility from the public to private secondary
schools. For Delta State, the results were similar.
It is reasonable to move schools lacking in adequate tutors. However, moving to a
worse school with fewer qualified tutors, inadequate materials resources in certificate
classes is questionable. Students‘ mobility from better state schools to poor ill-equipped
private secondary schools with poorly paid teachers negated the findings of (Chowa,
Masa, Ramos and Ansong, 2015; Wunti, Hafsat and Igbaji, 2017 and Ahmodu, Lateef and
Sheu, 2018) that there is a nexus between a school‘s amenities and learners‘ academic
output.
In keeping with the outcomes of this investigation (Jerinde, 2007; Jekayinfa,
Omosewo, Yusuf and Ajidagba, 2011; Onyedinefu, 2019; and Okoye and Onwuzuruoha,
cxlvii
2020) reported the manifestation of syndicates with innovations in fraudulent and criminal
techniques for examination malpractices across the country called Examination Miracle
Centre. This is often the reason some candidates move schools to take the JSSCE and
SSCE outside the colleges they attend, especially if they were state schools. In the place of
their schools, they prefer enrolling in private schools charging unreasonably high fees for
guaranteed success called miracle centre in the local parlance in order to perpetrate
examination malpractice. In these fraudulent examination centers, answers to exam
questions are solved and shared with students (Omoniyi, 2019; Agwu, et al. 2020; Okoye
& Onwuzuruoha, 2020). It is proposed that adequate staffing of schools, an improvement
of the quality of secondary school environments, friendly principal management and
leadership style, flexible schools dress code as regards female students‘ hairdos and
footwear might present as remedy to the challenges of students‘ mobility to non state
secondary school facilities.
The sixth research question and Hypothesis 1 sought the connection between
teachers‘ attrition and students‘ mobility from the public to private secondary academies
in the studied states. The findings showed that there was no relevant nexus between
teachers‘ attrition and students‘ mobility from the public to private secondary schools in
Bayelsa State. In Delta State, there was also a negative negligible link between teachers‘
attrition and students‘ mobility to private secondary schools. In both states of the study,
the findings indicated a negative relationship between teachers‘ attrition and students‘
mobility from the state to private secondary academies. This report is probably as a result
of the fact that fewer students moved schools for lack of teachers for some subjects offered
in their schools while the bulk of students‘ mobility to the private secondary schools from
government schools was for guaranteed success through examination malpractices
(Jerinde, 2007 and Okoye and Onwuzuruoha, 2020).
Also, inadequate public schools may be the reason for students mobility as found
by Martinez-Vazquez and Seaman (1985) and Hamilton and Macauley (1991) who
revealed that when communities of various populations have comparatively few schools;
there is a high marginal propensity for the emergence of more private schools. Evidence
indicates private enrolments are increased when public schools discourage varying
options; consequently, greater numbers of investors schools provide more exit chances for
requesters.
Hirschfeld (2016); Li and Konstantopoulos (2017); Filges, Sonne-Schmidt and
Nielsen (2018) and the education unit of the United Nations Agency (2018) independent
cxlviii
studies stressed the necessity to retain enough tutors for learners because the availability of
teachers in a school spell the teacher-student ratio, class size, learners‘ comfort and
academic performance. Additionally,(Sieberer-Nagler, 2016; Jayaron and Mohamma,
2016 and Adnot et al. 2017) agreed on the positive influence of teachers on student
achievement. These studies revealed that learners with the requisite teachers registered
higher academic achievements against those with few teachers. The marginal propensity to
move schools is higher for students of public secondary schools with inadequate teachers.
The seventh research question and Hypothesis 2 sought the connection between
teachers‘ transfer and students‘ mobility from the public to non-state secondary schools in
Bayelsa and Delta States. The findings indicated a positive, non-relevant link between
teachers‘ transfer and students‘ mobility to personal secondary school facilities with
0.08% in Bayelsa State and 21.2% in Delta State. For both States studied, teachers‘
transfer influenced a student‘s mobility to personal secondary schools by 3.3%. There was
a negligible nexus between teachers‘ transfer and students‘ mobility from the state to
private-owned secondary facilities. This is so because students switch to private schools
that run Miracle Examination Centers during SSCE and NECO registrations (Onyedinefu,
2019). This situation exerts an unfortunate impact on the education sector of the affected
states (Adnot, 2017). Similarly (Mack et al., 2019) found that high transfer rates among
tutors of state school classrooms undermine school stability, hinder educational reforms
and hurt student achievement.
In support of the findings of this study (Taniguchi, 2017) research averred that
school-related factors like insufficient academics and constant teachers transfers
additionally predict students‘ mobility. Equally (Von der Embse et al. 2016) showed that
early career academics could be more likely to transfer schools until they notice a
permanent college placement. The previous finding reflects a departure from previous
studies that indicated early career academics are at risk of transferring schools.
Also (Adnot, Katz, Dee and Wyckoff, 2017) reported that prime transfers among
teachers of state school classrooms wear away school stability, hinders academic reform
and hurts student achievement. This negates the report of (Darling-Hammond, Flook,
Cook-Harvey, Barron and Osher, 2020) that good schooling permits continuity in links,
consistency in practices, and predictability in routines that scale back anxiety and support
engaged learning; relative trust and respect between and among workers, students and
parents. A system wherein academics are deficient and are frequently transiting cannot
cxlix
assure meaningful learning. Learners in this condition are prone and susceptible to moving
schools.
Henry and Redding (2018) reported the consequences for the interval and the end
of the year teachers‘ loss that students who lost their tutors during the school year had
considerably lower test scores than those students whose academics stayed. Moreover,
midsection teachers‘ transfers caused students‘ underperformance. At the tip of the
session, teachers appear to exert unimportant consequences of the outcome. The
detrimental results of within-session teacher exit cannot be explained by other extraneous
outcomes or the quality of quitting teachers. Transiting teachers between December and
April exerts a catastrophic outcome on performance. However, these vary with schools
and subjects.
A key finding is that students experiencing high teachers‘ transfers do less well in
their end of term examinations (Gerritsen et al., 2017). The study found that the test
performance of all students improves with knowledgeable tutors. It was also consistent
with (Gerritsen et al., 2017) and (Aeschlimann et al., 2019) who reported in Switzerland
that irregular teacher loss affected each category on the average. Irregular teacher losses
have a more or less pronounced undesirable outcome on students‘ academic and
educational outcomes. Also (Wei, et al., 2020) reported teachers who have swapped
colleges at least once and indigenous teachers tended to stay at their first schools of
posting longer than non-local teachers. Their analysis indicated that the non-local teachers
were not more likely to transfer schools within the first 5 years of a teaching career; they
tended to teach at the first school for a shorter period.
There are indications that the fundamental drawback is not a shortage of academics
returning into the system since there are several other idle graduate academics. The
particular downside appears to be government employment embargoes and plenty of the
contemporary graduate tutors offering not to teach at all or quitting after just a few years
(Carvar-Thomas, 2016).
The eighth research question and Hypothesis 3 sought to establish the link between
teachers‘ compensation and teachers‘ quit in Bayelsa and Delta States. The findings
supported the principals‘ views that in Bayelsa State, there was a positive vital connection
between teachers‘ compensation and attrition in public secondary schools.
Teachers‘ scant compensation had an influence measure of 33.9% on teachers‘ exit and
there was a vital worthwhile link between teachers‘ compensation and quit in state
secondary academic facilities in Delta State. The sway of teacher scant compensation on
cl
attrition is 51.6% in Delta State. In both states of the study, there is a notable bond
between teachers‘ compensation and attrition among public secondary school teachers.
The r value of 0.354 indicates that teachers‘ compensation correlated with teachers‘
attrition by 12.5% in both states as perceived by the principals.
From the teachers‘ point of view, in Bayelsa State, there was a remarkable link
between teachers‘ compensation and quit in state secondary school facilities. In Bayelsa
State, teacher scant compensation has an influence of 51.6% on teachers‘ attrition in
public secondary schools. There was a remarkable helpful connection between teachers‘
compensation and attrition in public secondary schools in Delta State. The influence of
teacher scant compensation on their attrition is 17.8%. In both states studied, the result
shows that there is a vital link between teachers‘ compensation and teachers‘ attrition in
public secondary schools. For both states, the study indicates that teacher scant
compensation governed their attrition from state school by 19.5%. This is in agreement
with the report of Singh (2019) who noted that compensation quality spelled the
engagement and retention of employees to attain the objectives of an organisation. Also, it
is the basis of involvement of individuals in reinforcing the performance of workers.
Two studies (Kaur and Vijay, 2016 and Aeschlimann et al., 2019) also reported
that retention is more economical than recruiting new employees; therefore, organisations
ought to have a good retention policy to keep their existing workers. Similar to the
findings of this study (Gemeda et al., 2015), a similar study showed in Ethiopia that poor
salary and failure to reward performance demotivated teachers. The implications of
demotivated workers‘ exit on schools include poor syllabus coverage as the school Boards
may not immediately replace transferred academics. Also (Mulwa and Mbaluka, 2016)
study divulged that timely syllabus coverage was critical to learners as it enables students
to perform well at the end of their studies.
Confirming the findings of this study (Education Week, 2018) disclosed that the
scant pay package underlined all the cases of sparing teacher presence in the USA. Other
factors were cited as the next crucial factor to salaries. Confirming that pay increase is the
one solution, another report (Staufenberg, 2018) was unveiled in the school‘s weekly
publication of 23 March 2018 that a 5% pay supplement for early-career science and
mathematics teachers could have eschewed the incremental dwindle of teachers‘ years
back. The report of the Education week agrees with the position of (Pepra-Mensah et al.,
2017; Lavdrim and Altan, 2019 and Sutcher et al. 2019) that worker‘ compensation is both
crucial and critical as it determines the prognostic performance and consequent
sustainability of the employee in the organisation.
cli
Similarly (Carver-Thomas and Darling-Hammond, 2017) reported 13% of teachers
left the profession for financial reasons. The (Kuensel Cooperation 2018) averred teachers
are quitting the profession not because they are unhappy with their jobs but for greener
pastures and better opportunities in the private sector and abroad. While this may be true
for greener pasture search by the teacher, the report that teachers quit teaching for better
opportunities outside teaching is, however, contrary to the findings of this study.
Consistent with the study of (Kuensel Cooperation 2018), a report (Goldstein,
2018) averred that paying teachers as the professionals they are remains the only solution
to the issue of teachers‘ attrition. Similarly, a recent New York Times poll posited nearly
three-fourths of U.S. adults agreed that teacher remuneration is scant and 2/3 support
raising taxes to improve the pay of public school teachers (Goldstein and Casselman,
2018). In addition, an unprecedented number of teachers have been fighting for increased
education funding, higher teacher pay and fully funded pensions. In line with the finding
of this study (Lavdrim and Altan, 2019), compensation was related significantly to
attrition and the district‘s largest salary package was related to teacher exit. A study
(Singh, 2019) averred that compensation quality determined the employment and retention
of employees.
Also (Sutcher et al., 2018) found that teachers‘ attrition is worse in states paying
scant salaries. Arizona, New Mexico, and Louisiana, where the average teacher salary is
$50,000 or less, have higher teacher quit rates. Only a few young people join teaching.
This may be the reason for the youthfulness of a teacher not counting for reasons for
teachers‘ compensation significantly. Similarly (Mumtaz and Hasan, 2018) posited that
lucrative job opportunities outside the school organisation serve as a major distraction for
employees, especially the new employees. This is not true for the states studied as there is
no vacancy outside teaching for the teachers.
Forty five percent (45%) of teachers who agreed were discontented with their
remunerations claimed they would quit the service as soon as possible if they could find a
better offer (the Center for National Education Statistics survey, 2018). This is most likely
one reason for poor student tutorial performance among middle school students. The
teachers quitting the teaching profession had also increased in the last 25 years. The
academics quitting the job had additionally risen over the years in the USA as it is in many
other sovereign states. This includes high-performing nations such as Singapore and
European nations (Carver-Thomas and Darling-Hammond, 2018).
Pay could also be among the primary problems with our teachers when weighed
against the enormous workload that they have to endure (Lam, 2016). It has been
clii
projected that a hike in the teacher inducement allowance from the current 27.5% of the
teacher inducement allowance to at least 70% may help the issue of teachers‘ resignation
and absconds. Consistent with this study, Harmsen, van Veen, Maulana and Helms-Lorenz
(2018) reported dissatisfaction with the salary related to teachers quitting.
The ninth research question and Hypothesis 4 sought after the relationship between
a teacher‘s age and seeking a transfer in Bayelsa and Delta States. The findings indicate a
teacher‘s age was not considerably connected as a personal factor to a transfer in Bayelsa
State (-1.6%) and Delta states (4.9%). Also, a teacher‘s age was not sufficiently linked
with school-related factors predicting teachers‘ seeking transfers in Bayelsa and Delta
States. These results most likely imply that age has no relationship with academics
transferring schools at intervals in the state secondary school facilities in Bayelsa and
Delta States. However (Collins and Schaaf, 2020) study reported first-year tutors were
more likely to move or leave than intimate with long-standing teachers. Between 2017-
2018 and 2018-2019 tutorial sessions, less than 70 percent of novice academics stayed at
their school compared to 85 percent of more experienced and veteran academics.
Contrarily (Fuller et al., 2018) did not report any relationship between a teacher‘s
age, gender and seeking a transfer, which agrees with the findings of this study. Some
studies (Sutcher et al., 2016 and Elfers et al., 2017) reported that novice teachers (0-4
years of experience) and veteran teachers (25 or more years of experience) stay in their
schools at lower rates (47% and 48%, respectively) than moderately experienced teachers
60%, and those with about 15-14 years of experience 64%, implying that age has an
influence on teachers‘ transfer. A report (Ryan et al., 2017) supported greater teacher
experience was significantly linked to lower teachers‘ transfers between schools.
(Koopman et al., 2017) reported that teachers‘ age and skills in the superior
grades, their education content, data and thereafter the degree of student participation in
their lessons yielded helpful effects. The study established that tutors‘ experiences
contributed to student test scores throughout a teacher's career, rather than the first few
years. However, the study did not show how tutors experiences predicted their transfers.
Contrarily (Vonm der Embse et al., 2016) reported that teachers experience primarily
predicted tutors‘ transfers, but did not predict the teacher's intent to exit the profession.
This is in contrast with the findings of this study. Similarly, some studies (Sutcher,
Darling-Hammond and Carver-Thomas, 2016 and Elfers et al., 2017) averred that age had
an influence on teachers‘ seeking transfers. Also (Mack et al. 2019) reported demographic
cliii
and occupational factors are linked to quit intent within one year against the finding of this
study.
The tenth research question and Hypothesis 5 sought to find out the relationship
between teachers‘ gender and seeking transfers in Bayelsa and Delta States. The findings
indicate a teacher‘s gender was not remarkably related to teachers‘ seeking a transfer in
Bayelsa (-6.9%) and Delta States (4.8%). A teacher‘s gender was also not related as a
school-related factor influencing teachers‘ transfer in Bayelsa and Delta States (0.06%).
Summarily, gender, therefore, does not correlate with teachers transferring schools in
Bayelsa and Delta State. Marital status also has no link with academics seeking transfers
in state secondary school facilities in Bayelsa and Delta States.
Again, the long period of employment embargo and skeletal employment of over
10 years in the states studied may have been responsible for the non-significant
relationships between gender, and seeking a transfer observed in this study. Contrary to
the finding of this study (Koopman et al., 2017), the report did not indicate there was any
connection between demographics like age, gender and teachers seeking transfers.
However, another study (Wei et al., 2020) reported that a male teacher was likely to
transfer once more than females. Single teachers and low certificated teachers are less
likely to transfer more than once than their counterparts. However, a study (Luschei and
Chudgar, 2017) found no differences between female and male teachers in the likelihood
to transfer schools and the frequency of transfers.
The eleventh research question and Hypothesis 6 sought to establish the link
between tutors‘ marital status and seeking transfers in Bayelsa and Delta States. The
findings indicate there was no remarkable link between the marital status of a teacher and
seeking a transfer in Delta State (r = -0.072, ρ > 0.05), Bayelsa (r = 0.049, ρ > 0.05) and in
both states (r = 0.016, ρ > 0.05). Therefore, from the coefficient, marital status had no
influence on a teacher seeking a transfer in Bayelsa and Delta States. Marital status,
therefore, does not have a link with teachers transferring schools in Bayelsa and Delta
States as against the finding of the study (Mocheche et al., 2018) that marital status
influences job satisfaction with married teachers less much transferring schools.
A teacher‘s gender also did not correlate with a school-related factor influencing
teachers‘ transfer in Bayelsa and Delta States. Marital status had no relationship with
teachers changing schools in state secondary colleges in Bayelsa and Delta States.
Summarily, gender, therefore, does not correlate with tutors transferring colleges in
cliv
Bayelsa and Delta State. This finding is contrary to that of (Mocheche et al., 2018) that
reported marital status influences job satisfaction with fewer married tutors transferring
schools. Against the finding of this study (Luschei and Chudgar, 2017), reported that a
teacher‘s age, gender and experience influence teachers‘ preference and decision as to
where they live and teach.
The twelfth research question sought the explanation for teachers‘ attrition in
Bayelsa and Delta States. The findings indicated that for teachers in Bayelsa and Delta
States, the heavy workload was a component of attrition as found by (Smith and Ulvik,
2017) study. That some teachers resign the job as a result of high accountability
requirements; the Insufficient teachers for particular subjects that could make the only
available tutors of a particular subject teach across all the classes in a school (that is JS I to
SS 3), disruptive delayed replacement of transferred tutors and rural setting of the school,
insecurity of life and properties, absence of standard nurseries and primary schools for
teachers‘ children/wards.
The others are the desire of teachers to be with their spouses and tough terrain of
the schools were the factors that predicted teacher transfer, heavy workload and lack of
access roads to the school was viewed as the reason teachers seek transfers in public
schools. The school-related and personal factors in Bayelsa and Delta States include
inadequate teachers for a particular subject, delayed replacement of transferred teachers,
rural location of the school, insecurity of life and properties, lack of social amenities,
community hostility and cultism.
The others are the desire of teachers to be with their spouses and tough terrain of
the school. The factors that predicted teacher transfer include heavy workload and lack of
access roads to the school. These were the reasons teachers sought transfers in public
schools. The school-related and personal factors in Bayelsa and Delta States include
inadequate teachers for a particular subject, delayed replacement of transferred teachers,
rural location of the school, insecurity of life and properties, lack of social amenities,
community hostility and cultism.
The others are domestic responsibility, poor relationship with the school authority,
fear of the heavy workload caused by large student population and insufficient teachers,
stresses of the heavy workload, fear of riverine settlements unruly and rascally students,
difficulty in commuting to work, principals‘ exclusion of teachers from decision making,
difficulty in commuting to work lack of cooperation among staff and the presence of
cooperative societies to financially support teachers and Ill health conditions remain
clv
factors of the transfer. Responses given in both states studied were similar. What varied
was the degree of acceptance of each item.
The findings of this study supports that of (Stanley, 2018) who reported that stress
of the heavy workload and lack of support for teachers remains the primary predictor of
teacher exit of schools and the profession much faster than they can be replaced in
England. This finding subsumes the finding that the number of teachers seeking mental
health support has raised by 35% in the past 12 months. Many of them are in crisis. This
finding is also supported by (Tapper, 2018) report that stress of the heavy workload and
burned out are reasons many teachers are quitting or off sick with stress. Annual
employment of teachers to replace the exited as regards subjects may help to a larger
extent.
The thirteenth research question was raised to determine the reasons for teachers‘
transfers in public secondary schools in Bayelsa and Delta States. The findings indicate
that the reasons for teachers‘ transfers as perceived by principals in Bayelsa State include
but not limited to inadequate teachers, delayed replacement of transferred teachers, rural
location of the college, insecurity of life and properties, absence of standard nurseries and
primary schools for teachers‘ children/wards and the desire of teachers to be with their
spouses. Others are the tough terrain of the school, the heavy workload of teachers and the
lack of access to the school. These were viewed as reasons teachers look for transfers in
state school facilities.
In Delta State, the principals are of the thinking that the scant teachers, retarded
replacement of transferred teachers, rural location of the school, absence of standard
nurseries and primary schools for teachers‘ children and wards, the desire of teachers to be
with their spouses and the heavy workload of teachers are reasons teachers seek transfers
in public secondary schools in Delta State. In both states, principals are of the notion that
inadequate teachers, retarded replacement of transferred teachers, the rural location of the
school, lack of standard nurseries and primary schools for teacher‘s children and wards,
the desire of teachers to be with their spouses and the heavy workload of teachers are
reasons teachers seek a transfer in public secondary schools consistent with the findings
(Luschei and Chudgar, 2017).
Both states principals are of the view that inadequate teachers for particular
subjects taught, delayed replacement of transferred teachers, the rural location of the
school, no standard nurseries and primary schools for teacher‘s children and wards, the
desire of teachers to be with their spouses and heavy workload of teachers are reasons
clvi
teachers seek transfers in public secondary schools. This finding is not consistent with the
findings of (Luschei and Chudgar, 2017) that involuntary transfer by the education boards
was the commonest for teacher mobility.
According to the teachers, school-related factors and personal factors influence
teachers‘ transfers in Bayelsa State. For the teachers, the school-related factors of
teachers‘ transfers included inadequate teachers for particular subjects taught, delayed
replacement of transferred teachers, rural location of the school, insecurity of life and
properties, No standard nurseries and primary schools for teachers‘ children and wards,
lack of social amenities, community hostility, cultism, difficulty in commuting to work
and the heavy workload of teachers.
Also, lack of access road to the school, unruly and rascally students, poor access
roads, conflict with the host community and principals‘ exclusion of teachers from
decision making were the reasons for teachers‘ transfers in Bayelsa State. Other issues are
the lack of cooperation between members of staff and the absence of collaboration
between staff members. The personal reasons for seeking transfers are domestic
responsibility, poor relationship with the school authority, poor relationship with
colleagues, fear of the heavy workload caused by insufficient teachers; stresses of the
heavy workload, fear of riverine settlements and ill-health conditions.
The school-related factors that could prompt the transfer of teachers in public
secondary schools in Delta State are inadequate teachers for particular subjects taught,
delayed replacement of transferred teachers, rural location of the school, insecurity of life
and properties, lack of social amenities and community hostility and cultism. Others are
unruly and rascally students, difficulty in commuting to work, principal‘s exclusion of
teachers from decision making, lack of cooperation between members of staff and absence
of cooperative societies to financially support teachers. The following personal factors are
reasons teachers seek a transfer in Delta State: Domestic responsibility, poor relationship
with the school authority, fear of the heavy workload caused by insufficient teachers,
stress of the heavy workload, fear of riverine settlements and ill-health conditions.
For teachers in both states, inadequate teachers for particular subjects taught,
delayed replacement of transferred teachers, rural location of the school, insecurity of life
and properties, community hostility, cultism, unruly and rascally students, principal‘s
exclusion of teachers from decision making and difficulty in commuting to work were
cited as reasons teachers seek a transfer. Also, principals ‗exclusion of teachers from
decision making, absence of cooperation between members of staff and the absence of
cooperative societies to financially support teachers were factors of teachers‘ attrition.
clvii
Others are personal reasons for seeking a transfer. They include domestic responsibility,
poor relationship with school authority, and fear of the heavy workload caused by
insufficient teachers; stress of the heavy workload; fear of riverine settlements and ill-
health conditions.
Some findings of this study such as the curiosity of a teacher to teach at a different
school level, the academic success of the school, the school being far away from home and
the socio-economic level of the school environment are contrary to the report of (Duran
and Kösterelioğlu, 2017) as regards the reasons for teachers‘ transfers in secondary
schools. The rest of the reasons for teachers‘ transfer in this study are consistent with the
report of (Duran and Kösterelioğlu, 2017). The finding of this study is also consistent with
the report of (Luschei and Chudgar, 2017) that those involuntary transfers by the
education boards were the commonest reason for teachers‘ transfers.

clviii
clix
CHAPTER FIVE
SUMMARY, CONCLUSION AND RECOMMENDATIONS
Summary of the Study
This study was carried out to search out how teachers‘ attrition and transfers
influence students‘ mobility from the state to non-state secondary schools in Bayelsa and
Delta states of Nigeria. The design is ex-post facto. It used proportionate and simple
random probability sampling techniques. A sample of 321 principals was drawn in
Bayelsa and in Delta States, of which 163 were male principals and 158 were females.
Also, a total sample of 716 tutors was drawn from Bayelsa and Delta States. Two hundred
and ninety three (293) were male tutors and 423 were female tutors. To guide the
researcher in the course of the study, 13 research questions were asked and six hypotheses
developed. The research questions were geared towards finding out how teachers‘ attrition
and transfer influence students‘ mobility from the public to private secondary schools.
Precisely, this study has unveiled the amount and frequency of teachers‘ quit in the years
of study (between 2015 and 2019) for state schools in both Bayelsa and Delta States was
moderately low with 8.23%. The attrition rate is expected to vary with time/year. Also, the
teachers‘ transfer rate was largest in 2019, and the rate of movement of students from
public to private schools was low in both states. The majority of students moved colleges
when they were in JS 3 and SS 3 in both Bayelsa and Delta States. Teachers‘ quits and
transfers did not remarkably influence students‘ mobility to non-state secondary schools;
however, it was found from the students that the primary reason for students‘ mobility was
to enrol in the citification examinations in private schools where success is guaranteed
through examination malpractice. Teachers‘ exit did not exert a remarkable influence on a
student‘s mobility from the public to private schools. Also, the teachers‘ compensation
exerted a modest influence on teachers‘ attrition. The compensation of teachers
determined their attrition significantly in both Bayelsa and Delta States. Teachers‘ scant
compensation influences their attrition from state schools. In conclusion, age, gender and
marital status had a negligible nexus with teachers transferring public schools in Bayelsa
and Delta States within the period studied as transfers are mainly at the discretion of the
schools‘ management boards.
clx
Summary of the Research Findings
The data analysis and interpretation of the results of the study revealed the
following findings:
1. The mean rate of teachers‘ attrition for the years studied for Bayelsa and Delta
States was 8.23%. Bayelsa State recorded teachers' attrition man rate of 14.24%,
while Delta State recorded a 5.55% average teachers‘ attrition rate.
2. The mean rate of teachers‘ transfered for the states studied was 8.31%. Average
teachers transfer rate was 11.16% for Bayelsa State and 7.26% in Delta State. The
teachers‘ transfers‘ rate was highest in 2019 with 18.99% in Delta State and
18.87% in Bayelsa State.
3. The average rate of students‘ mobility from the public to private schools was low
in both states with a mean of 0.19%. It was 0.21% in Bayelsa State and 0.18% in
Delta State.
4. The majority of students‘ mobility was made by students in the certificate classes
i.e. JS 3 and SS 3 in both Bayelsa and Delta States.
5. Students‘ mobility to private secondary schools is not influenced by teachers‘
attrition and transfer; instead, it is influenced by students‘ desire and intensions to
enroll in the certification examinations in private secondary schools where they
fraudulently pass.
6. Teachers‘ attrition did not significantly influence students‘ mobility to private
secondary schools in Bayelsa and Delta States. The teachers‘ attrition influenced
students‘ mobility from the public to private schools by an insignificant mean
record of 6.6%.
7. Teachers‘ transfers did not significantly influence students‘ mobility from the
public to private secondary schools in Bayelsa State. The transfers of teachers had
an influence of 3.3% on students‘ mobility to private secondary schools.
8. Teachers‘ scant remuneration had an influence of 12.5% on teachers‘ attrition in
both states in the view of principals and 19.5% influence on teachers‘ attrition in
the view of teachers.
9. A teacher‘s age had no significant relationship with seeking a transfer in public
secondary schools in Bayelsa and Delta States.
10. The gender of a teacher had no significant relationship with seeking a transfer in
public secondary schools in Bayelsa and Delta States.
11. The marital status of a teacher also had no significant relationship with seeking a
transfer in public secondary schools in Bayelsa and Delta States.
clxi
12. The reasons given for attrition in Bayelsa and Delta states by both principals and
teachers include but not limited to poor remuneration, poor condition of service
outside the salaries, poor promotion prospect, attraction from other sectors, cultism
in secondary schools in Delta State only, attractions from the private sectors, high
demand for the teaching job.
13. The reasons given for teachers‘ transfers in both states studied include but not
limited to inadequate teachers for particular subjects taught, delayed replacement
of transferred teachers, rural location of the school, insecurity of life and properties,
community hostility, cultism, unruly and rascally students, principal‘s exclusion of
teachers from decision making and difficulty in commuting to work.
Conclusion
Based on the findings of the study, it was concluded that the rate of teachers‘
attrition and transfer of teachers varied with time and year, and it has been increasing over
the years. Hence, it is anticipated to shoot up in the upcoming years. Teachers‘ quits had a
non-outstanding negative influence on students‘ mobility from the public to private
secondary schools in Bayelsa and Delta states of Nigeria. The rate of scholars‘ mobility
from the state to non-state secondary schools varied and was influenced by teachers‘
attrition and transfer rates. However, it is primarily driven by the guaranteed success
promised by some private secondary school operators in the studied states. Compensation
of teachers determines their attrition to a remarkably large extent, and teachers‘ transfers
are uninfluenced by a teacher‘s age, gender and marital status in Bayelsa and Delta States.
Recommendations
Based on the findings, it is recommended that:
1. Teacher remuneration and condition of service should be improved upon not only
to attract teachers to the profession but also to retain and encourage teachers to put
their best into the profession.In this regard, the 2020 Teachers Day proposed new
Teachers‘ Salary Structure by President Mohammadu Buhari should be
implemented speedily to enhance teachers‘ welfare as this will result in increase
productivity that will ultimately reduce the teachers‘ attrition. This will help to
discourage students‘ mobility to private secondary schools.
2. Teachers' employment should not be politicised. The state governments should
employ teachers annually with regards to subject area vacancies and should
discontinue the practice of waiting for a lengthy period before employing teachers.
clxii
3. Teachers‘ transfers disproportionally affect the equitably distribution of teachers if
not properly done, it is recommended that transfers be done in a way that no school
will be disadvantaged.
4. There should be a federal government policy that the private and public sector
transfers should be synchronized to coincide with students‘ holidays to ensure the
fewest effects on learners since the transfer of parents influence students‘ mobility.
5. Transferred teachers should be replaced promptly with teachers of the same
subjects to keep teachers in class to ultimately maintain students in public
secondary schools.
6. The state government should do more to maintain the school plant and structure to
attract students and parents. In this regard, libraries should be stocked with recent
prints and publications and should be conducive to learners. Also, hostel facilities
should be in order and meet standards.
7. The state governments should improve on the quality and standard of teaching and
learning by optimal use of instructional time by the supply of mowers to keep
fields clean to save instruction time. This will give teachers and students more time
to teach and learn.
Contributions to Knowledge
The findings from the study have contributed to knowledge in the following ways:
1. The study established that public secondary school teachers‘ attrition is fairly
moderate in Bayelsa and Delta States of Nigeria.
2. The study has averred again that the teachers‘ attrition and transfers in public
secondary schools are not the cause of students‘ mobility to private secondary
schools.
3. The enquiry reaffirmed that the majority of students‘ mobility is done by certificate
class students.
4. The study again ascertained that students‘ mobility from the public to private
secondary schools in Bayelsa and Delta States is caused by the desire to enroll in the
certification examinations in private secondary schools.
Suggestion for Further Studies
1. This study could be extended to cover a broader scope. This is to enable the
geographic, political divisions or zones of the country to have teachers‘ attrition
records, and by implication, aid the entire nation to establish national teacher
attrition transfer data.
clxiii
REFERENCES
Abari, O. A., Mohammed, B. O. and Oyetola, O. I. (2012) ‗Organizational identity and
effectiveness of public and private senior secondary schools in southwest Nigeria‘,
Problems of Education in the 21st Century 40: 7-16. Pp 1- 10.
Abumere C.O, Tolorunloju, R.H. and Sadoh, A.O. (2018). Effects of Teachers‘ Transfer
on School System and the Implication for Restructuring in Nigeria. International
Journal of Progressive and Alternative Education, Volume 5 No. 1. Pp 134-142,
Adamu, A. (2010) A Techniques on improving Staff Morale in Public Secondary Schools
in Bauchi State. Unpublished Master thesis, Bayero University Kano, Nigeria.
Adimonyemma, N. F., Akachukwu, E. E. and Igboabuchi, N. E., (2018). Impact of Class Size on Students’ Academic Performance in Biology in Idemili North Local Government Area of Anambra State. International Journal of Education and Evaluation Vol. 4 No. 8. Pp 22-32.
Adnot, M., Dee, T., Katz, V., and Wyckoff, J. (2016). Teacher turnover, teacher quality,
and student achievement in DCPS. Center for Educational Policy Analysis Working
Paper No. 16-03. Retrieved from http://cepa.stanford.edu/wp16-03 Accessed 23-4-19.
Aeschlimann, B, Herzog, W. and Sander, F. (2019). Irregular Teacher Turnover and
Student Academic Achievement in High Schools: A Study in the Subjects
Mathematics, German, French and History. Journal of Education and Learning;
Vol. 8, No. 2. Pp 25-36.
Agwu, P., Orjiakor, T., Aloysius Odii, A., Onalu, C., Nzeadibe, C., and Okoye, U. (2020).
Nature and Drivers of ‗Miracle Examination Centres‘ in Private Schools in Nigeria:
A systematic review of literatures on examination malpractice. Anti Corruption
Evidence Working paper. 026.
Ahmodu, O., Lateef, A. L and Sheu, A. A. (2018). Impact of School Facilities on Students
Academic Performannce in Oshodi-Isolo Local Government Area Seniour
Secondary School, Lagos State.
Airahuobhor, A. (2007)‗Fraud incorporated.‘ Newswatch Magazine. 46(24): pp 34-36.
Ajayi, O. S and Olatunji, O. A. (2019). Turnover causation amongst secondary school
teachers in noted that job dissatisfaction among Nigeria teachers. Africa Education
Review. Vol 27(1), pp 62 – 87.
Ajayi, S. A (2006). Christian Missions and Evolution of the Culture of Mass Education in
Western Nigeria. Journals of Philosophy and culture Pp 33-54.
Ajayi, O. V., Audu, T. C and Ajayi, E. E. (2017). Influence of class size on students‘
classroom
discipline, engagement and communication: A study of senior secondary schools in
Ekiti state, Nigeria. Sky Jornal of Education Research. Vol 5(5). Pp. 034-041.
clxiv
Aldeman, C. (2016). There‘s a huge flaw in the ‗teacher shortage‘ data. EducationNext.
http://educationnext.org/theres-a-huge-flaw-in-the-teacher-shortage-data/.
Alfonso, J. G., Antelm-Lanzat, A. M., Cacheiro-González, M. L. and Pérez-Navío, E.
(2019) School dropout factors: a teacher and school manager perspective. Educational
Studies, 45:6, pp 756-770.
Almazan, S., and Marshall, D. S. (2016). School vouchers and students with disabilities.
Towson, MA: Council of Parent Attorneys and Advocates.
American Association for Employment in Education. (2017). Educator supply and
demand report 2016–17. Slippery Rock, PA: American Association for
Employment in Education.
Antonucci, M. (2016). Analysis: New warnings of teacher shortage sound like déjà vu all
over again. The74.
https://www.the74million.org/article/analysis-new-warnings-of-teachershortage-
sound- like-deja-vu-all-over-again/
Aslami, H. (2013). Teacher Attrition: Why Secondary School Teachers Leave the
Profession in Afghanistan. Master's Capstone Projects University of Massachusetts
Amherst
ScholarWorks @ UMass Amherst
Asadu, I. and Abonyi, S. E. (2020) ‗Examination mismanagement and national
development in Nigeria: Towards a credible cum non-fraudulent examination
process‘, International Journal of Research and Innovation in Social Science 4(1):
191-204.
Atteberry, A. Loeb, S. and Wyckoff, J. (2016). Teacher Churning: Reassignment Rates
and Implications for Student Achievement. Educational Evaluation and Policy Analysis.
39.
Ávalos, B., and Valenzuela, J. P. (2016). Education for all and attrition/retention of new
teachers: A trajectory study in Chile. International Journal of Educational
Development, 49, pp 279–290.
Ayşegül, E., Dilek Ö, Hava Y, Melahat Y, Salih M, Murat A, Kamile S. (2018).
Evaluation of Employee Turnover Rates and Leaving Reasons of Nurses Working in the
Intensive Care Units. JOJ Nurse Health Care. 6(3): 555688.
Bahtilla, M. (2018). The Impact of Working Conditions on Teachers Attrition.
International Journal of Construction Education and Research. Vol.5 pp 59- 78
Balingit, M. (2018) ―From the classroom to the campaign trail: Emboldened teachers run
for office,‖ The Washington Post, June 2, 2018, available at
https://www.washingtonpost
clxv
Ball, S. (2003). The teacher‘s soul and the terrors of performativity. Journal of Education
Policy, 18(2), Pp 215–228.
Bhasin, H. (2018). Difference between Employee Turnover and Employee Attrition.
Marketing 91 https://www.marketing91.com/employee-turnover-and-employee-
attrition/
Blazar, D and Kraft, M. A. (2017). Teacher and Teaching Effects on Students‘ Attitudes
and Behaviors Educational Evaluation and Policy Analysis.Journal:
journals.sagepub.com/doi/abs/10.3102/0162373716670260:SAGE Publication.
Bode, C. Singh, J., Rogan, M. (2015). Corporate Social Initiatives and Employee Retention. Working paper series. Revised version: 2015/34/STR/EFE
Boniface, R. (2016). Teachers‘ Retention in Tanzanian Remote Secondary Schools -
Exploring Perceived Challenges and Support, Linnaeus University Dissertation No
240/2016
Bonsu, H. D. (2016). A Comparative Analysis Of Academic Performance of Public And
Private Junior High Schools In The Basic Education Certificate In
Sekondi/Takoradi, European Journal of basic and applied Sciences. Vol 3, No 1. Pp 21-
32.
Brinck, L. and Maher, K. (2019). New teachers retention rate in New Zealand.Education Insight paper looks at retention of new teachers/kaiako in New Zealand schools and kura. He Whakaaro Education insight. Ministry of Education New Zealand.
Burroughs, N., Gardner, J., Lee, Y., Guo, S., Touitou, I., Jansen, K, and Schmidt, W.
(2019). Teaching for Excellence and Equity Analyzing Teacher Characteristics,
Behaviors and Student Outcomes with TIMSS. International Association for the
Evaluation of Educational Achievement (IEA) 2019. Volume 6.
Boser, U. and Straus, C. (2014). Mid- and Late-Career Teachers Struggle with Paltry
Incomes. Center for American Progress.
https://cdn.americanprogress.org/wp-content/uploads/2014/.../teachersalaries-
brief.pdf
Bukari, C., and Amenuku, A .M (2017). Difference in academic performance of
economics
students in public and private senior high schools within Cape Coast Metropolis in
Ghana. Inter. J. Acad. Res. Educ. Rev. 5(1): pp 1- 14.
Burke, P. F., Schuck, S., Aubusson, P., Buchanan, J., Louviere, J. J., and Prescott, A.
(2013). Why do early career teachers choose to remain in the profession? The use of
best–Worst scaling to quantify key factors. International Journal of Educational
Research, 62, pp 259–268.
Business Dictionary online http://www.businessdictionary.com/attrition
Cannata M. (2010). Understanding the teacher job search process: Espoused preferences
and preferences in use. Teach Coll Rec; v112 (n12): 2 pp 889–934.
clxvi
Carlsson, R., Lindqvist, P., and Nordänger, U. K. (2019). Is teacher attrition a poor
estimate of the value of teacher education? A Swedish case. European Journal of
Teacher Education. Volume 42, Issue 2.Pp 243-257.
Carrasqueira, K and Koslinski, M. C. Associated Factors to Teacher Mobility in the
Municipality Of Rio De Janeiro. Cad. Pesqui. [online]. Vol.49, n.173, pp.106-130.
Carver-Thomas, D. and Darling-Hammond, L. (2017). Teacher turnover: Why it matters
and what we can do about it. Palo Alto, CA: Learning Policy Institute.
Carver-Thomas, D. (2016). National trends in teacher attrition: An analysis of 2011–12—
2012– 13 stayers, movers, and leavers. Palo Alto, CA: Learning Policy Institute.
Carver-Thomas, D., and Darling-Hammond, L. (2019). The trouble with teacher turnover:
How teacher attrition affects students and schools. Education Policy Analysis
Archives, 27(36).
Castro, A. Quinn, D. J., Fuller, E, and Barne, M. (2018). Addressing the Importance and
Scale of the U.S. Teacher Shortage. Policy Brief 2018-1.
https://files.eric.ed.gov/fulltext/ED579971.pdf
Catt, A. D. and Cheng, A. (2019). Families‘ Experiences on the new Frontier of
Educational Choice. Findings from a Survey of K–12 Parents in Arizona.
EdChoice.
Ceng, A and Peterson, P. E. (2017). ―How Satisfied Are Parents with Their Children‘s
Schools?‖
Education Next, Spring.
Chapman, D. (2009). Teacher Motivation Incentives and Working Conditions Policy Brief
#
8 (Final Draft).
http://siteresources.worldbank.org/INTSOUTHASIA/Resources/PolicyBrief8.pdf
Chepkemboi, J., Kiriago, A. N., and Iravo, D. (2013). Factors influencing teacher‘s
turnover in West Pokot District, Kenya. International Journal of Academic Research in
Business and Social Sciences. Vol. 3(9). Pp 206-213.
Chinyani, H. (2013). Exploring the feasibility of school-based curriculum development in
Zimbabwe. International Journal Repository in Progressive Education Dew, pp 58-
64.
Choi, E. J., Moon, H. R., and Ridder, G. (2017). Within-District School Lotteries, District
Selection and the Average Partial Effects of School Inputs. USC Dornsife Institute
for New Economic Thinking Working Paper No. 17 – 11
Clark, M. A., Eric, Albert Y. Liu, L., Makowsky and Zukiewicz., M. (2017). Impacts of
the Teach for America Investing in Innovations Scale-Up. Mathematica Policy
Research.
Clemens, E., Klopfenstein, K., Lalonde, T. L., and Tis, M. (2018). The effects of
placement and school stability on academic growth trajectories of students in foster
care. Children and Youth Services Review, 87, pp 86–94.
clxvii
Cloutier, O., Felusiak, L., Hill, C. and Pemberton-Jones, E. J. (2015). The Importance of
Developing Strategies for Employee Retention. Journal of Leadership,
Accountability\and Ethics, 12(2). Pp 119-129.
Coenen, Johan, Ilja, Cornelisz, Wim Groot, Henriette Maassen, H., van den Brink and
Chris Van Klaveren. (2017). ‗Teacher Characteristics and Their Effects on Student Test
Scores: A Systematic Review.‘ Journal of Economic Surveys 32, no. 3: pp 848–
877.
Collins, E., and Schaaf, K. (2020). Teacher retention in Tennessee. Tennessee Department
of Education.
https://www.tn.gov/content/dam/tn/education/reports/TeacherRetentionReportFINAL
CooperGibson Research, (2017). Factors affecting teacher retention: qualitative investigation Research report. [email protected]
Cyril, M. U., Ugwandu, O. R., and Bello, A. S. (2015). Causes of science and technical
Teachers attrition and strategies for retention in Adamawa State Secondary Schools.
Intertnational Journal of Vocational anf Technical Education. Vol. 7 (4), pp.33-39.
Danmarks Lærerforening (2018).
https://www.dlf.org/media/11780393/faerre-laerere-i-folkeskolen.pdf
Darling-Hammond, L. (2003). Keeping good teachers: Why it matters, what leaders can
do?
Educational Leadership, 60(8), pp 6-13.
Darling-Hammond, L. (2017). We Can Solve Teacher Shortage: Here Is How.Well tested
solutions exist.
www.huffingtonpost.com/entry/we-can-solve-teacher-shortages-heres-
how_us_59114ac7e4b056aa2363d899
Darling-Hammond, L., Furger, R., Shields, P. M., and Sutcher, L. (2016). Addressing
California‘s emerging teacher shortage: An analysis of sources and solutions. Palo
Alto, CA: Learning Policy Institute.
Darling-Hammond, L., Flook, L., Cook-Harvey, C., Barron, B and Osher, D. (2020)
Implications for educational practice of the science of learning and development,
Applied Developmental Science, 24:2, pp 97-140.
Fuller, B. (2011). How diverse schools affect student mobility – Charter, magnet, and
newly built campuses in Los Angeles. Stanford, Calif.: Policy Analysis for California
Education.
Dee, T. S. and Wyckoff, J. (2015). Incentives, selection and teacher performance:
Evidence from IMPACT. Journal of Policy Analysis and Management, Vol. 34, No.
2, pp 267-297.
Delta State Government, 2001). Delta State Government of Nigeria Public service rules.
Revised to 1st July 2001, Asaba. Government Printer.
clxviii
den Brok, P., Wubbels, T. and van Tartwijk, J. (2017) Exploring beginning teachers‘
attrition in the Netherlands. Teachers and Teaching: Theory and Practice, 23 (8), pp
881–895.
Department for Education, (2017). School workforce in England: November 2016, last
updated 20 July 2017,
Dixon, S. (2018). Student Mobility across Schools and its Links to Underachievement.
https://treasury.govt.nz/publications/wp/wp-18-
01Persistent.http://purl.oclc.org/nzt/p- 2015
DN (2016). ―Lärarflykten En Modern Myt [Teachers Fleeing the Job - a Modern Myth].‖
November 2017 https://www.dn.se/nyheter/sverige/lararflykten-en-modern-myt/
Doumen, S., Koomen, H. M., Buyse, E., Wouters, S., and Verschueren, K. (2015).
Teacher and observer views on student–teacher relationships: Convergence across
kindergarten and relations with student engagement. Journal of School Psychology,
50(1), pp 61-76.
Dulay, S. and Karadağ, E, (2017). ‗The Effect of School Climate on Student
Achievement,‘ Psychology. Pp 199-213.
Duran, A. and Kösterelioğlu, M. (2017). Why does a teaher change his/her school? In
book: Proceedings of MAC 2017 www.researchgate.net>330686488.
EdChoice (2019), The ABCs of School Choice: The Comprehensive Guide to Every
Private School Choice Program in America, 2019 Edition, pp. 87–94.
EDOREN, 2016, Developing Effective Private Education Nigeria. Baseline Report Abuja:
Education, Data, Research and Evaluation in Nigeria. Education 5:839-848.
Education Economics 1-24 (January 2011).
Education Week. (2000). ―Quality Counts: Who Should Teach.‖ Educational Leadership,
60(8), 6-13. Educational Strategies, Issues and Ideas, 84(1), pp 1-8.
Educator Policy Innovation Center, EPIC, (2016). Smart Solutions to Minnesota‘s
Teacher Shortage: Developing and Sustaining a Diverse and Valued Educator
Workforce Recruitment- Retention- Report. EPIC.
Educator Recruitment and Retention Task Force. (2015) Educator retention and
recruitment report.Phoenix, AZ: Arizona Department of Education.
Efanga, S. I., .Ikpe, U. G. and Idanta, G. O. (2014).Influence of Demographic Variables on
Teachers‘ Willingness to Stay on the Teaching Professionin Akwa Ibom State of
Nigeria. International Journal of Humanities, Social Sciences and Education.
Volume 1, Issue 10, Pp 41-46.
Eger, A. (2015). Teachers struggle with low pay, working conditions: Teachers turn to
extra jobs, soup kitchens to get by. Tulsa World.
clxix
Ekperi, P. l. and Onwuka, U and Wike Y. N. (2019). Teachers‘ Attitude as a Correlate of
Students‘ Academic Performance. International Journal of Research and Innovation
in Social Science (IJRISS) | Volume III, Issue I pp 2323-2705
Elfers M. L., Plecki, A. and Van Windekens, (2017). Understanding Teacher Retention
and Mobility in Washington State.
Engel M, Cannata M. (2015) Localism and Teacher Labor Markets: How Geography and
Decision Making May Contribute to Inequality. Peabody J Educ. 28; 90(1): pp 84–
92.
European Commission/EACEA/Eurydice, (2018). Teachers' and School Heads' Salaries
and
Allowances in Europe – 2016/17. Eurydice Facts and Figures. Luxembourg:
Publications Office of the European Union.
Ezike, B. U. (2018). Classroom Environment and Academic Interest As Correlates of
Achievement in Senior Secondary School Chemistry in Ibadan South West Local
Government Area, Oyo State, Nigeria. Global Journal of Educational Research.
Vol. 17, pp 61-71.
Fajar, S., Hussain, M. Sarwar, H., Afzal, M. Gilani, S. A. (2019). Factors Affecting
Academic Performance of Undergraduate Nursing Students. Int. J. Soc. Sc.
Management. Vol. 6, Issue-1: pp 7-16.
Farrelly, J. (2016). ‗Lack of recognition‘ the main reason new teachers change careers.
Education improving initial teacher education. Criterion conferences blog.
www.criterionconfrences.com
Feng, L. (2005). Hire Today, Gone Tomorrow: The determinants of attrition among Public
School Teachers. Tallahassee: Department of economic 288 Bellamy Buildings,
Florida State University.
Feng, L., and Sass, T. R. (2016). Teacher Quality and Teacher Mobility. Education
Finance and Policy 12(3): pp 1-4.
Fenske, C. (2017). "Perceived School-Associated Factors Contributing to Teacher
Attrition in Southwest Minnesota" Culminating Projects in Education Administration
and Leadership. 27. https://repository.stcloudstate.edu/edad_etds/27
Filges, T., Sonne-Schmidt, C. S., Nielsen, B. C. V. (2018). Small class sizes for improving
student achievement in primary and secondary schools. Campbell Systematic
Reviews 10
Fishbein, M., and Ajzen, I. (1975). Belief, attitude, intention, and behavior. Reading, MA: Addison-Wesley.
Fitchett, P. G., McCarthy, C. J., Lambert, R. G., and Boyle, L. (2018). An examination of
US first-year teachers‘ risk for occupational stress: Associations with professional
preparation and occupational health. Teachers and Teaching, 24, pp 99–118.
clxx
Foster, D. (2018). Teacher recruitment and retention in England. Briefing Paper No.7222. House of Commons Library. Intranetintranet.parliament.uk/commons-library|[email protected]|@commonslibrary www.parliament.uk/commons-library
Friedman-Krauss, A. H. and Raver, C.C. (2015). Does school mobility place elementary
school children at risk for lower math achievement? The mediating role of
cognitive dysregulation. Dev Psychol. 2015 Dec; 51(12). Pp 1725-1739.
Fuller, E. .J., Pendola, .A. and Young, M. D. (2018). The Role of Principals in Reducing
Teacher Turnover and the Shortage of Teachers. University Council for Educational
administration. Quality Leadership Matters. Policy Brief 2018-2.
Gais, T., Backstrom, B., Malatras, J. and Park, Y.J. (2018). “The State of the New York Teacher Workforce.” Albany, NY: Rockefeller Institute of Government. Retrieved from: https://rockinst.org/wp-content/uploads/2018/03/03-22-18-Teacher-Work-Force.pdf
Garcia,. E. and Weiss, E. (2019). The teacher shortage is real, large and growing, and
worse than we thought The first report in ―The Perfect Storm in the Teacher Labor
Market‖ series. Economic Policy Institute. pp 1-30.
Garcia-Reid, P., Peterson, C. H., and Reid, R. J. (2015). Parent and teacher support among
Latino immigrant youth: Effects on school engagement and school trouble
avoidance. Education and Urban Society, 47(3), pp 328-343
Gaotlhobogwe, M. (2017). The Impact of Lack of Resources on Declining Students‘
Enrolments in Design and Technology in Botswana Junior Secondary Schools. Design
and Technology Education: An International Journal 17.1.
Gatemi, N. M., and Thinguri, R. W. (2018). A Critical Analysis of the Impact of Frequent Teachers Turnover on the Syllabus Coverage in Schools in Kenya. European Journal of Education Studies. Vol. 4. Issue 2. Pp 245-255. Geiger, T., and Pivovarova, M. (2018). The effects of working conditions on teacher
retention.
Teachers and Teaching, 24(6), pp 604–625.
Gemeda, Fekede, T., and Tynjala, P. (2015). Exploring Teachers' Motivation for Teaching
and Professional Development in Ethiopia: Voices from the Field. Journal Studies of
Education, 5(2). Pp 169-186.
Gerritsen, S., Plug, E., and Webbink, D. (2017). Teacher quality and student achievement:
Evidence from a sample of Dutch twins. Journal of Applied Econometrics, 32(3), pp
643- 660.
Gershenson, S. (2016). Linking teacher quality, student attendance, and student
achievement. Education Finance and Policy, 11, pp 125–149,
clxxi
Mabeya, M. T., Gikuhi, M. and Anyona, N. J. (2019). Effect of Teacher Attrition on
Academic Performance of Students in Uasin GishuCounty, Kenya. IJRDO - Journal
of Educational Research. Volume 4. Issue 8. Pp 1-13.
Goldring, R., Taie, S., and Riddles, M. (2014). Teacher attrition and mobility: Results
from the 2012–13 teacher follow-up survey. Washington, DC: National Center for
Education Statistics. Retrieved from http://nces.ed.gov/pubs2014/2014077.pdf
Golsdtein, D.. and Casselman, B. (2018). Teachers Find Public Support as Campaign for
Higher Pay Goes to Voters. The NewYork Times.
https://www.nytimes.com/2018/05/31/us/politics/teachers-campaign.html
Gore, J. Lloyd, A., Smith, M., Bowe, J., Ellis, H. and Lubans, D. (2019). Effects of
professional development on the quality of teaching: Results from a randomized
controlled trial of Quality Teaching Rounds. Teaching and Teacher Education. 68
(2017) 99-113 journal homepage: www.elsevier.com/locate/tate
Göttelmann-Duret, G. and Hogan, J. (1996). The Utilization, deployment and management
of teachers in Botswana, Malawi, South Africa and Uganda: synthesis report of a sub-
regional workshop and four country monographs. Sub-regional Workshop on the
Utilization, Deployment and Management of Teachers, IIEP/S.146, Magaliesburg,
South Africa.
Gray, L., and Tie, S. (2015). Public School Teacher Attrition and Mobility in the First
Five
Years: Results from the First Through Fifth Waves of the 2007–08 Beginning
Teacher
Longitudinal Study (NCES 2015-337). U.S. Department of Education. Washington,
DC: National Center for Education Statistics. Retrieved from
http://nces.ed.gov/pubsearch
.
Grissom, J. A. (2011). Can Good Principals Keep Teachers in Disadvantaged Schools?
Linking Principal Effectiveness to Teacher Satisfaction and Turnover in Hard-to-
Staff Environments. Teachers College Record. 113. 2552-2585. ResearchGate
Grissom, J. A., and Bartanen, B. (2018). Strategic retention: Principal effectiveness and
teacher turnover in multiple-measure teacher evaluation systems. American
Educational Research Journal. 56: 2 , pp 514-555.
Grissom, J. A., Viano, S. L., and Selin, J. L. (2015). Understanding employee turnover in
the public sector: Insights from research on teacher mobility. Public Administration
Review, No. 76(2). Pp 241-251.
Guglielmi, Dina, Bruni, I. Simbula, S., Fraccaroli, F and Depolo. F. (2016). What drives
teacher engagement: A study of different age cohorts. European Journal of
Psychology of Education 31: pp 323–40.
Guzmán, V.E., Muschard,B., Gerolamo., M, Holger Kohl, Rosenfeld, H. (2020). Characteristics and Skills of Leadership in the Context of Industry. Procedia Manufacturing
43.pp 543 – 550.
clxxii
Hamilton, B.W. and Macauley, M. K. (1991). Determinants to consequences of public-
private school choice. Journal of Urban Economics. 3, 282–94.
Hansson, A. and Gustafsson, J. (2020) School Mobility and Achievement for Children
Placed and Not Placed in Out-of-home Care. Scandinavian Journal of Educational
Research, 64:2, pp 167-180.
Harmsen, R., Helms-Lorenz, M., Maulana, R and van Veen, K. (2018). The relationship
between . beginning teachers‘ stress causes, stress responses, teaching behaviour and
attrition. Teachers and Teaching, 24:6, pp 626-643,
Harris, D. and Sass, T. (2011). Teacher Training, Teacher Quality, and Student
Achievement. Journal of Public Economics, 95, pp 798–812.
Hascher, T. and Hadjar, A. (2018). School alienation – Theoretical approaches and
educational research, Educational Research, 60:2, pp 171-188.
Haugan, T and Myhr, A. (2019). Residential Mobility, Family Structure, and Completion
of Upper Secondary Education – A Registry-Based Cohort Study of the Norwegian
Adolescent Population. Front. Psychol. 10:2311. Doi: 10.3389/fpsyg.2019.02311
Headden, S. (2014). Beginners in the classroom: What the changing demographics of
teaching
mean for schools, students, and society. Carnegie Foundation for the Advancement
of Teaching.
http//www.carnegiefoundation.org
Henry, G. T., and Redding, C. (2018). The Consequences of Leaving School Early: The
Effects of within-Year and End-of-Year Teacher Turnover. Education Finance and
Policy.
Herrmann, M., Clark, M., James-Burdumy, S., Tuttle, C.,Kautz, T Knechtel, V., Dotter,
D., Smither, C., John, W and Mathematic, D. (2019). The Effects of a Principal
Professional Development Program Focused on Instructional Leadership‘
Institute of Education Science. National Center for Education Evaluation and
Regional Assistance for the U.S. Department of Education.
Hirschfeld, H. (2016). Class Size in Relation to Student Achievement and Behavioral
Issues.
(Master Thesis, Goucher College, Baltimore).
Holme, J. J., Jabbar, Germain, E Dinning, J. (2018). Rethinking Teacher Turnover:
Longitudinal Measures of Instability in Schools. Sage Publishers, Volume: 47 issue: 1,
pp 62-75.
Horton, J. A. Jr. (2018). "A Descriptive Study of School Climate and School Culture in
Selected Public Secondary Schools in New Jersey and New York" (2018).Seton Hall
University Dissertations and Theses (ETDs).
2562.https://scholarship.shu.edu/dissertations/2562
Idika, E. O., Onuoha, J. C., Nji, I. A and Eze, E. (2018). ‗Determinants of Academic
Achievement in Economics in Public Secondary Schools in Nsukka Local
clxxiii
Government Area, Enugu State, Nigeria‘. International Journal of Economics Education
Research (IJEER). Vol. 1 Issue 1. Pp 75-92.
Ines, K., and Pedro, C. (2015). Compensation and control sales policies and sales
performance: the field sales manager's points of view. Journal of Business and Industrial
Marketing. 26(4), pp 273-285.
International Labour Office; Centre for International Teacher Education, (2016). Rural
teachers in Africa: a report for ILO / International Labour Office; - Geneva: ILO.
International Task Force for Education For All. (2010). Teacher Attrition in Sub-Saharan
Africa The Neglected Dimension of the Teacher Supply Challenge. A New Review of
Literature. Meeting of the High-level Group on Education for All; 9th; Teacher
attrition in Sub- Saharan Africa: the neglected dimension of the teacher supply
challenge; a review of literature. ISSN: 2354-2160 Review.
International Task Force on Teachers for Education, (2018) International Task Force on
Teachers for Education, 2030: strategic plan 2018-2021; 2018 - TF.pdf
http://www.unesco.org/new/fileadmin/MULTIMEDIA/FIELD/Beirut/video/TF.pdf
www.unesco.org
Janik, M., and Rothmann, S. (2015). Meaningful work and secondary school teachers‘
intention to leave. South African Journal of Education, 35(2), pp 01–13.
Jaiyeola, A. O. and Bayat, A. (2020). Status of living Standards in Nigeria between 2010
and 2013. Journal of poverty. Vol, 24. Issue 1.
Jayaron, J. and Mohammed, J. (2016). A Pedagogical Perspective on Promoting English as
a Foreign Language Writing through Online Forum Discussions. English Language
Teaching; Vol. 9, No. 2. Pp 84-101.
Jean, K. N., Ngui, K and Robert, A. (2017). Effect of Compensation Strategies on
Employee Performance: A Case Study of Mombasa Cement Limited. International
Journal of Innovative Social Sciences and Humanities Research 5(3): pp 25-42.
Jekayinfa, A. A.,Omosewo, O. E., Yusuf, A. A. & Ajidagba, A. U. (2011). Curbing
examination dishonesty in Nigeria through value education. Educational Research 6(2),
161-167. Jerinde, D. (2007). Students‘ perception of causes and effects of examination malpractice
in
Nigeria. Journal of Psychology. 1(2): pp 1-10.
Jerkins, R. (2019). Why we need more female teachers across all levels of education.
https://blogs.unicef.org/blog/need-more-female-teachers-across-levels-education/
Johnson, A; Nguyen, H., Geoth, M. and White, L. (2018). Workplace aggression and
organisational effectiveness: The mediating role of employee engagement.
Australian Journal of Management. Vol. 43(4) pp 614–631.
Jones, S. (2016). How does classroom composition affect learning outcomes in Ugandan
primary schools?. International Journal of Educational Development, 48, pp 66-78.
clxxiv
Jonyo, D and Jonyo, B. (2017). Teacher Management: Emerging Issues in Kenya. The
European Journal of Educational Sciences. Vol 4 (1) 04. Pp 18-44.
Kafumbu, D.F.T. (2019). Job Satisfaction and Teacher Turnover Intention in Malawi: A
quantitative Assessment. Research Article. Volume: 28 issue: 2, pp 207-226.
Kalagbor, L.D. (2016). An Analysis of Factors Influencing Students‘ Academic
Performance in Public and Private Secondary Schools in Rivers State-Nigeria.
Journal of Education and Practice. Vol.7, No.28.pp 96-101.
Kameshwari J. and Vimala R. ( 2015). Why Women Teachers Matter in Secondary
Education, EPW Economic & Political Weekly. Vol. l no 32.Pp 48-54.
Kang, N. H. and Hong, M. (2008). Achieving Excellence in Teacher Workforce and
Equity in Learning Opportunities in South Korea. Educ Res (HW Wilson—EDUC).
37(4). Pp 200- 207.
Kaur. S. and Vijay, R. (2016). Job Satisfaction – A Major Factor Behind Attrition or Retention in Retail Industry. Imperial Journal of Interdisciplinary Research (IJIR). Vol-2, Issue-8.
Kelchtermans, G. (2017). ―Should I Stay or Should I Go?‖ Unpacking Teacher
attrition/Retention as an Educational Issue.‖ Teachers and Teaching: Theory and
Practice 23 (8): pp 961–977.
Kini, T, and Podolsky, A. (2016). Does Teaching Experience Increase Teacher
Effectiveness? A Review of the Research. Learning Policy Institute.
Klimek, S. G. (2019). Prestige, Status, and Esteem and the Teacher Shortage. Journal of
Education and Learning; v8 n4 p185-213.
Kolawole, O. P. (2019). The Causes and Effects of Examination Malpractices on Educatiotan standard. A Case Study of Selected Secondary Schools in Oyun Local Goverment Area of Kwara State). International Journal of Social, Politics and Humanities. Volume 3, Issue 1, pp 51 – 72. Kolawole, W. S. (2019). Effects of Teachers‘ Transfer on Students‘ Academic
Performance in Senior Secondary Schools Abuja Nigeria. International Journal of
Research and Innovation in Social Science (IJRISS) |Volume III, Issue XI,
Koopman, M., Marieke Thurlings, M and den Brok, P. (2019) Factors influencing students
‘ proficiency development in the fraction domain: the role of teacher cognitions and
behavior. Research Papers in Education, 34:1, pp 14-37
Kraft, M. A., Marinell, W. H., and Shen-Wei Y. D. (2016). School organizational
contexts, teacherturnover, and student achievement: Evidence from panel data.
American Educational Research Journal, 53(5), pp 411–1449.
Kuensel Cooperation, (2018). Teacher Attrition rate is a national concern.
____ https://kuenselonline.com/teacher-attrition-rate-is-a-national-concern/
clxxv
Kumar, R. and Arora, R. (2012). Determinants of talent retention in BPO industry. Indian
Journal of Industrial Relations, Vol. 48 no 2 pp 259-273.
Kurucay, M., and Inan, A. (2017). Examining the effects of learner-learner interactions on
satisfaction and learning in an online undergraduate course. Computers and
Education, 115, pp 20-37.
Ladd, H. F., and Sorensen, L.C.. (2016). ―Returns to Teacher Experience: Student
Achievement and Motivation in Middle School.‖ Education Finance and Policy 12,
no. 2: pp 241–279.
Lam, C. (2016). 11 Rewards of being a Teacher. Edutopia.
https://www.edutopia.org/discussion/11-rewards-being-teacher
Lavdrim, F. R and Altan, D. (2019). The Relationship between Job Satisfaction,
Organizational Trust and Intention to leave the Job: A Comparative Study between
Kosovo and Turkey. AUDOE. Vol. 15, No. 2.
Learning Policy Institute, (2017). What’s the Cost of Teacher Turnover? (calculator).
Lei, H., Cui, Y and Chiu. M.M. (2018). ―The Relationship between Teacher Support and
Students‘ Academic Emotions: A Meta-analysis.‖ Frontiers in Psychology 8: 1–12.
Lenhoff, S. W., Pogodzinski, B., Singer, J., and Cook, W. (2019). Student Exit, Mobility,
and Attendance in Detroit. Retrieved from Wayne State University website:
____ http//www.go.wayne.edu/DetEdResearch
Leuven, E., and Løkken, S. A. (2017). Long Term Impacts of Class Size in Compulsory
School.
IZA Discussion Papers No. 10594.
Levin, H. M. (1985). Solving the shortage of mathematics and science
teachers. Educational Evaluation and Policy Analysis, 7(4), pp 371–382.
Li, W. (2015). Two essays on educational research:(1) Using maximum class size rules to
evaluate the causal effects of class size on mathematics achievement: Evidence from
TIMSS
2011; (2) Power considerations for models of change. (Dissertation. Michigan State
University).
Lindqvist, P., Nordanger, U. K. and Carlsson, R. (2014a) Teacher attrition the first five
years – a multifaceted image, Teaching and Teacher Education, 40 (1), pp 94–103.
Lindqvist, P., Nordanger, U. K.and Carlsson, R. (2014b). Already elsewhere: A study of
(skilled) teachers' choice to leave teaching. Longitudinal Data in Education
Research. Teaching and Teacher Education 54. Pp 88-97.
Lleras, C., and McKillip, M. (2017). When children move: Behavior and achievement
outcomes during elementary school. The Journal of Educational Research, 110(2), pp
177-187.
clxxvi
Loeb, S., Darling-Hammond, L., and Luczak, J. (2005). How teaching conditions predict
teacher turnover in California schools. Peabody Journal of Education, 80(3), pp 44–
70.
Long, R. J. (2017). Strategic Compensation in Canada (3rd ed.), Toronto: Thomson
Nelson.
Luo, N., Zhang, M., and Qi, D. (2017). Effects of different interactions on students‘ sense
of community in e-learning environment. Computers. and Education,115, pp 153-160,
Luschei T. F. and Chudgar A. (2017). Teacher distribution in developing countries:
Teachers of marginalized students in India, Mexico, and Tanzania. New York: Palgrave
Macmillan,
Lynch, S., Worth, J., Bamford, S. and Wespieser, K. (2016). Engaging Teachers: NFER
Analysis of Teacher Retention Slough: NFER.
Mabaso C.M. and Dlamini, B.I. (2017). Impact of compensation and benefit on job
satisfaction. Research Journal of Business Management.Vol, 11 (2) pp 80-90.
Mack J. C., Johnson, A., Jones‐Rincon, A., satenawa, V. and Howard, K. (2019).Why do
teachers leave? A comprehensive occupational health study evaluating intent‐to‐quit
in public school teachers. Journal of Applied Biobehavioural Research. Vol. 24. Issue
1.77- 88,
Madero, C. (2019): Secondary teacher‘s dissatisfaction with the teaching profession in
Latin America: the case of Brazil, Chile, and Mexico, Teachers and Teaching, DOI:
10.1080/13540602.2019.1587402
Madumere-Obike C. U., Ukala, C. C and Nwabueze, A. I. (2019). Managing teacher
attrition rate for quality education in public senior secondary schools in rivers state,
Nigeria. Eeducational Planning. vol. 25, No. 4. Pp 47-58.
Makovec, D. (2018). The teacher‘s Role and Professional Development. International
Journal of Cognitive Research in Science, Engineering and Education. Vol. 6, No.
2, Pp 33-45.
Malar, Mathi, K. and Malathi, G. (2015). Analyzing the causes of attrition in IT industries-
opinion of employee and employer. Asia Pacific Journal of Research, Vol. No. 1.
Issue 4, pp 6, 18, 19.
Mann, E and Quintero, D. (2017). States Could Lead the Way in Private School Choice
Program Expansions.Brown Center Chalkboard.
https://www.brookings.edu/blog/brown-center-chalkboard/2017/04/05/states-
could-lead- the-way-in-private-school-choice-program-expansions.
Marlow, M. (2010). The Influence of Private School Enrollment on Public School
Performance. Applied Economics 42(1).
Martinez-Vazquez, J.S.B. A. (1985). Private schooling and the tie bout hypothesis, Public
Finance Quarterly, 13, 293–318.
clxxvii
Masci, C., Ieva, F., Agasisti, T. and Paganoni, A. M. (2016). Does class matter more than
school? Evidence from a multilevel statistical analysis on Italian junior secondary
school students. Socio-Economic Planning Sciences, 54, pp 47-57.
Mateo, J. (2018). DepED probes teacher suicides. The Philippine Star. August 30.
https://www
. philstar.com/other-sections/education-and-home/2018/08/30/1846977/deped-
probes- teacher-suicides (accessed on April 12, 2020).
Maxwell, S., Reynolds, K. J., Lee, E., Subasic, E., and Bromhead, D. (2017). The impact
of school climate and school identification on academic achievement: Multilevel
modeling with student and teacher data. Frontiers in Psychology, 8, Article 2069.
Mayson, S, and Barrett, R. (2016). Getting and keeping good staff: An analysis of human
resource Management ―problems‖ in small firms. Report to CPA Australia , 23(4),
pp 56 - 78.
McInerney, D. M., Ganotice Jr., F. A., King, R. B., Marsh, H. W., and Morin, A. J. S.
(2015).
Exploring commitment and turnover intentions among teachers: What we can learn
from
Hong Kong teachers. Teaching and Teacher Education, 52, pp 11–23.
McNerney, C., Hill, V., and Pellicano, E. (2015). Choosing a secondary school for young
people on the autism spectrum: A multi-informant study. International Journal of
Inclusive Education, 3116 , pp 1–21.
McTighe, J. (2017). The Case for Private Schools. In R.A Fox and N. K. Buchanan (Eds).
The Wiley handbook of school choice. Pp117-130. Chickester, UK: Wiley Blackwell
Meyer, S. J., Espel, E. V., and Weston-Sementelli, J. L., (2019). Teacher retention,
mobility, and attrition in Colorado, Missouri, Nebraska, and South Dakota. (REL
2019– 001). Washington, DC: U.S. Department of Education, Institute of Education
Sciences, National Center for Education Evaluation and Regional Assistance,
Regional Educational Laboratory Central.
Mizala, A., and Ñopo, H. (2016). Measuring the relative pay of school teachers in Latin
America
1997–2007. International Journal of Educational Development, 47, pp 20–32.
Mkheimer, I., and Mjlae, S. A. (2020) study ‗Factors of Employee Engagement and
Organizational Development: Are they Linked?‘ International Journal of Recent
Technology and Engineering (IJRTE). Volume 8 Issue-5. Pp 232-242.
Mocheche, E. K., Raburu, P. A., and Bosire, J. (2018). ‗Is marital status a predictor of job
satisfaction of Public secondary school teachers?‘ International Journal of
Psychology band Behavioural Sciences. 8(3) pp 51-58.
Moja, T. (2000). Nigeria Education Sector Analysis: An Analytical Synthesis of
Perfomance and Main Issues. New York: World Bank.
clxxviii
Moor, T. (2019). One in three Australian teachers leaves teaching I first five years,
inquiry hears. Brisbane Times. February 25.
Morinaj, J., Scharf, J. Grecu, A., Hadjar, A. Hascher, T. and Marcin. (2017). School
Alienation: A Construct Validation Study. Frontline Learning Research. Vol.5 No. 2
pp 36-59.
Morris, T., Manley, D., and Sabel, C. E. (2018). Residential mobility: towards
progress in mobility health research. Prog. Hum. Geography. 42, pp 112–133.
Muguongo, M. M., Muguna, A. T., and Muriithi, D. K. (2015). Effects of Compensation
on Job Satisfaction among Secondary School Teachers in Maara Sub-County of
Tharaka Nithi County, Kenya. Journal of Human Resource Management. Vol. 3, No.
6, 2015, pp. 47-59
Mulei, Waita, Mueni, Mutune and Kalai, (2016). Factors Influencing Teacher Attrition in
Public Secondary Schools in Mbooni- East Sub-County Kenya. International Jornal of
Education and Research, Vol. 4. No. 3. Pp 367-382.
Mulkeen, A and Crowe-Taft, N. (2010). Teacher Attrition in Sub-Saharan Africa: The
neglected dimension of the teacher supply challenge. A review of literature.
International Task Force on Teachers for EFA.
www.teachersforefa.unesco.org/v2/phocadownload/teacher_attrition.pdf
Mulwa, D. M., and Mbaluka, P. M. (2016). Factors influencing timely syllabus coverage
in public secondary schools. Journal of Educational Policy and Entrepreneurial
Research, Vol. 3, N0.6. 2016. Pp 81 - 96.
Mumtaz, R., Hasan S. S. (2018). Determinants of Employee Turnover: A Survey of
Employee Intentions. Trend in Urban Societies of the Region. Bus Eco J 9: 356. Doi:
10.4172/2151- 6219.1000356
Murrtedjo, and Suharningsih, (2018). The role of principal in optimizing school climate in
primary schools. Journal of Physics: Conference Series. 953. 012179. 10.1088/1742-
6596/953/1/012179.
Mutegi, T. (2014). Factors affecting coverage of syllabus in secondary schools in Kenya:
A Case study of Langata District schools in Nairobi County. Retrieved from
Repository:
http://repository.mua.ac.ke/282/1/FACTORS%20AFFECTING%20COVERAGE%2
0OF% 2
0SYLLABUS%20IN%20SECONDARY%20SCHOOLS%20IN%20KENYA.pdf
Nandrup, A. B. (2015). Do class size effects differ across grades?. Economic Working
Papers 2015-07 Aarhus University.
National Center for Education Statistics, (2018). Teacher Satisfaction With Salary and
Current Job (U.S. Department of Education, 2018),
https://nces.ed.gov/pubs2018/2018116.pdf. Accessed 09/07/2019.
clxxix
New Zealand Post Primary Teacher‘ Association (NZPPTA), (2016). Theory of secondary
teacher demand and supply. An NZPPTA paper to the Secondary Teacher Supply.
Working Party.
Nishimura, M., and Yamano, T. (2008). School choice between public and private primary schools under the free primary education policy in rural Kenya. GRIPS Discussion Paper, 08-02. Tokyo, Japan: Graduate Institute for Policy Studies.
Nix, N. (2015). Why Oklahoma is racing to put nearly 1000 uncertified teachers in its
classrooms. The 74. Retrieved 26/06/2019 from http/
/wwwthe74million.org/article/why- oklahoma-is-racing-to-put-nearly-1000-uncertified-
teacher-inits-classrooms
Nor, N. M., Embong, R., Muda, H., Yunus, K., and Nor, J. M. (2019). Effects of Teachers‘
Teaching Competencies on Students‘ Academic Performance Mediated by Holistic
Centered Learning Style Based on SUMUR Program at Secondary Religious
Schools. International journal of Academic Research in Progressive Education and
Development 8 (2), pp 25–38.
Ntamu, B. A. (2017) Rational Emotive Behavioural Therapy, fear of failure and
examination malpractice behaviour among secondary school students in Calabar
municipality. Journal of Education and Practice, 8 (20), 129 – 138.
Nunnery, J. A., Ross, S. M. and Reilly, J. M. (2016). ―An Evaluation of the National
Institute for School Leadership: Executive Development Program in Milwaukee
Public Schools.‖ Norfolk, VA: Old Dominion University, Center for Educational
Partnerships.
Nyakundi, E. N., Raburu, P.A and Okwara, M.O. (2019). Influence of Teacher Motivation
to Academic Performance of Pupils in Primary Schools in Kenya. International
Journal of Applied Psychology. Doi:10.5923/j.ijap.20190902.04
Nyamibo, K. (2006). The role of christian education in alleviating poverty in Nigeria in
Ortyoyande, J.H. Senwua, H. M. Tarpael, U. Nguaigba, S.A.(eds) Education for
Poverty, Alleviation in Nigeria, A book of readings, Chap four 38-55, Katsina Ala,
School of education, College of Education.
NYSED Personnel Master Files Report_20160518_Final.pdf Obiakor, M. I., and Oguejioffor, C. N. (2020). Impact of Classroom Size on Academic
Performance of Secondary School Students in Enugu North Local Government Area
of Enugu State, Nigeria. African Journal of Educational Management, Teaching and
Entrepreneurship Studies, 1(1), pp 51-59.
O’Donnell R. and Gazos, A. (2010). Student mobility in Massachusetts. Education Research Brief. Office of Strategic Planning, Research and Evaluation, Massachusetts Department of Elementary and Secondary Education.
OECD, (2015). Students, Computers and Learning: Making the Connection. Paris: OECD Publishing.
OECD, (2017). ―Education at a Glance: OECD Indicators‖ (2017), available
clxxx
at http://dx.doi.org/10.1787/eag-2017-en accessed14/03/2019
OECD, (2017). Trends Shaping Education in 2017.
OECD, (2018a). The Future of Education and skills. Education 2030. The future we need.
www.oecd.org/2030report
OECD, (2018). Effective Teacher Policies: Insights from PISA, PISA, Paris: OECD
Publishing.
https://www.oecd-ilibrary.org/docserver/9789264301603-
en.pdf?expires=1567085842andid=idandaccname=oid031827andchecksum=E900A0
044C 6C19480FA8A5DE47458B93
OECD, (2019), Teaching And Learning International Survey. (2018). Results (Volume I):
Teachers and School Leaders as Lifelong Learners, TALIS, OECD Publishing, Paris.
https://doi.org/10.1787/1d0bc92a-en
OECD, (2020), TALIS 2018 Results (Volume II): Teachers and School Leaders as Valued
Professionals, TALIS, OECD Publishing, Paris, https://doi.org/10.1787/19cf08df-en
Okafor, C. A., Maina, J. J., Stephen, H.1. and Ohambele, C. C. (2016) Impact of School
Environments on Academic Performance: Feedback from Senior Secondary School
Students. Conference paper.
https://www.researchgate.net/publication/319505462
Oke, A. O., Ajagbe, M. A.. Ogbari, M. E. and Adeyeye, J. O. (2016). Teacher Retention
and Attrition: A Review of the Literature. Mediterranean Journal of Social Sciences.
Vol. 7. No 2.SI.
Okeke, I., Okaforcha, C., and Ekwesianya, A (2019). Attrition and strategies for teacher
retention in secondary schools in anambra state. Global Journal of Education.
Humanities and Management Sciences (GOJEHMS); Vol.1. No.1, pp 148 – 156.
Okoye, F. O. and Onwuzuruoha, O. A. (2020). Clamping Down the Activities of SSCE
Miracle
Centres for Quality Secondary Education in Anambra State, Nigeria. Asian Journal
of Advanced Research and Reports. 11(2): pp 29-36,
Omoniyi, K. (2019) ‗Kano Miracle Centres: I don‘t know the location of school where I
passed my WAEC -Housewife confesses‘. Solacebase.com, 30 September
(https://www.solacebase.com/2019/09/30/kano-miracle-centres-i-dont-know-the-
location- of-school-where-i-passed-my-waec-housewife-confesses/).
Onyedinefu, G. (2019) ‗How unchecked special centres foster examination malpractices‘.
Business Day, 29 October (https://businessday.ng/education/article/how-unchecked-
special-centres-foster-examination-malpractices/).
Oragwu, A. A., and Nwabueze, A. I. (2017). Perceived impact of teacher attrition on
teaching and learning in secondary schools. International Journal of Educational
Research and Policy Making, 1(1), pp 43-51.
clxxxi
Papadopoulou, E., and Gregoriadis, A. (2017). Young children‘s perceptions of the quality
of teacher–child interactions and school engagement in Greek kindergartens.
Journal of Early Childhood Research, 15(3), pp 323-335,
Partelow and Konoske-Graf, (2017). Starting Strong: How to Improve Teachers‘ Entry
into the Profession. Center for American Progress.
https://cdn.americanprogress.org/content/uploads/2017/01/04075403/TeacherReside
ncy- report.pdf
Pepra-Mensah, J., Adjei, L.N. and Agyei, A. (2017). Effect of Compensation on Basic
School Teachers‘ Job Satisfaction in the Northern Zone: The Case of Ghana.
Global Journal of Management and Business Research: Volume 17 Issue 3 Version
1.0 Interdisciplinary. Volume 17 Issue 3 Version 1.0.
Perangin-Angin, M. R, Lumbanraja P. and Absah Y. (2020). The effect of quality of work
life and work engagement to employee performance with job satisfaction as an
intervening variable in PT. Mopoly Raya Medan. International Journal of Research
and Review. 7(2): pp 72-78.
Peretomode, V.F. and Iggue, O.E.(2013). Students‘Mobility and the Impact on the
Administration of Secondary Schools in Nigeria. Journal of Research & Method in
Education Volume 2, Issue 3. Pp 06-12.
Peter, B., Treves, A .,Shmis, T., Ambasz, D. and Ustinova M. (2019). The Impact of
School Infrastructure on Learning: A Synthesis of the Evidence. International
Development in Focus. Washington, DC: World Bank.
Pham, D Lam and Nguyen, Tuan and Springer, Matthew. (2020). Teacher Merit Pay and
Student Test Scores: A Meta-Analysis.
https://doi.org/10.3102/0002831220905580
Pitsoe, V. J. and. Machaisa, P. R, (2012). ―Teacher Attrition Catastrophe in Sub-saharan
Africa: A Hurdle in the Achievement of Upe, Efa Policy Goals and Mdgs.‖ Science
Journal of Sociology & Anthropology, Volume 2012, Article ID sjsa-215, 7 Pages,
Podgursky, M., Ehlert, M., Lindsay, J., and Wan, Y. (2016) An examination of the
movement of
educators within and across three Midwest Region states. (REL 2017–185),
Washington, DC: U.S. Department of Education, Institute of Education Sciences,
National Center for Education Evaluation and Regional Assistance, Regional
Educational Laboratory Midwest.
Power, J .M and Potterson, A. U. (2017). The Case against Private Schooling. In R.A Fox
and N. K. Buchanan (Eds). The Wiley handbook of school choice pp117-130. Chickester,
UK: Wiley Blackwell.
Prothero, A. (2017). ―Setback for Ground-breaking School Choice Program Could Have
Broader Fall Out,‖ Education Week, June 20.
clxxxii
Rameshkumar, M. (2020). Employee engagement as an antecedent of organizational
commitment: A study on Indian seafaring officers. The Asian Journal of Shipping
and Logistics. Vol. 36(3). Pp 105-112.
Ramirez, M. J., and Viteri, A. (2016). Third and sixth grade teachers in Latin American
and the Caribbean: Characteristics, perceptions and relationship with student
learning achievement. Santiago: OREALC/UNESCO.
Rankings of the States 2018 and Estimates of School Statistics 2019 (2019). Washington, D.C.: National Education Association. http://www.nea.org/assets/docs/2019%20Rankings%20and%20Estimates%20Report.pdf See also: NEA Interactive Map of Individual Data and Findings from 2017-18
Ravalier, J. M. (2018). The influence of work engagement in social workers in
England..Occupational Medicine, Volume 68, Issue 6, PP. 399–404,
Raymond, B. (2016). Teachers‘ Retention in Tanzanian Remote Secondary Schools -
Exploring Perceived Challenges and Support, Linnaeus University Dissertation No
240/2016, ISBN: 978-91-87925-97-9.
Representative, T. U. (2019), Lønvilkår for lærere [Interview - 6 january 2019].
Reynolds, K. J., Lee, E., Turner, I., Bromhead, D., and Subasic, E. (2017). How
does school climate impact academic achievement? An examination of social
identity processes. Sch. Psychol. Int. 38, pp 78–97.
Redding, C and. Smith, T.M.. (2016). ―Easy In, Easy Out: Are Alternatively Certified
Teachers Turning Over at Increased Rates?‖ American Educational Research
Journal. Vol. 53, no. 4: Pp 1086–1125.
Rhinesmith E. (2017). A Review of the Research on Parent Satisfaction in Private School
Choice Programs. Journal of School Choice. V11 n4, pp 585-603.
Richards, K. A. R., Hemphill, M. A., and Templin, T. J. (2018). Personal and contextual
factors related to teachers‘ experience with stress and burnout. Teachers and Teaching,
24(7), pp 768–787.
Rissanan, A. (2017). An Investigation into Voluntary Employee Turnover and Retention Factors in Sport Organizations. Master’s Thesis, Jyväskylä University School of Business and Economics.
Robinson B, and Yi W. (2008). The role and status of non-governmental (‗daike‘) teachers
in China‘s rural education. Int J Educ Dev. ;28(1): pp 35–54.
Rodrigues, L. D. A. D., de Pietri, E., Sanchez, H. S., & Kuchah, K. (2018). The role of
experienced teachers in the development of pre-service lan-guage teachers‘
professional identity: Revisiting school memories and constructing future teacher selves.
International Journal of Educational Research, 88, 146-155.
clxxxiii
Rong‘uno, S.K. (2017). A Comparison of Academic Performance between Public and
Private Secondary Schools in Wareng District, Kenya. British Journal of
Education. Vol.5, No.11, pp. 58 – 67.
Rodriguez, L. A., Springer, M. G., and Swain, W. A. (2018). Sorting through Performance
Evaluations: The Effects of Performance Evaluation Reform on Teacher Attrition
and Mobility. (Working Paper). Nashville, Tennessee.
Rodríguez-Sánchez, J., González-Torres, T., Montero-Navarro, A. and Gallego-Losada, R.
(2010). Investing Time and Resources for Work–Life Balance: The Effect on Talent
Retention. International Journal of Environmental Research and Public Health. 17,
1920;
Roorda, D. L., Jak, S., Zee, M., Oort, F. J., and Koomen, H. M. (2017). Affective
Teacher– Student Relationships and Students‘ Engagement and Achievement: A
Meta-Analytic Update and Test of the Mediating Role of Engagement. School
Psychology Review, 46(3), pp 239-261.
Rose, B.A. (2016). The effect of school mobility and concurrent changes on students‘
academic performance.
https://jscholarship.library.jhu.edu/bitstream/.../ROSE-DISSERTATION-2016.
Rumberger, R. (1985). The shortage of mathematics and science teachers: A review of the
evidence. Educational Evaluation and Policy Analysis, 7(4), 355–369.
Rumberger, R. W. (2015) ―Student mobility: Causes, consequences, and solutions,‖
National Education Policy Center, Boulder, CO.
Sa'ad, T. and Dahiru, A.H. (2018) ‗Examinationmalpractice: The hydra-headed monster
and virus in Nigerian education system‘, KIU Journal of Humanities 3(1): 255-264.
Salisu, J. B., Chinyio, E., and Suresh, S. (2015). The impact of compensation on the job
satisfaction of public sector construction workers of Jigawa state of Nigeria. The
Business and Management Review, 6 (4), pp 282-296.
Sawchuk, S. (2016). 'Churn' Among Teachers Seen to Affect Learning‘. Education Week.
Vol. 36, Issue 01. Pp 5.
Scharp, G L. (2019). "Impact of New Teacher Induction on Beginning Teachers"
(2019).Ed.D. Dissertations. 261.https://commons.cu-portland.edu/edudissertations/261
Schmidt,W., Burroughs, N., Zoido, P., and Houang, R. (2015). The role of schooling in
perpetuating educational inequality: An international perspective. Education
Researcher, 44(4), pp 371–386.
Schreiner, E. (2017). What is a healthy employee turnover rate? Retrieved on May 13
2018 from
www. smallbusiness chrou.com/healthyemployee tum-over-rate. 12145. html.
Selya, A. S., Engel-Rebitzer, E., Dierker, L., Stephen, E., Rose, J., Coffman, D. L., and
Otis, M. (2016). "The Causal Effect of Student Mobility on Standardized Test
clxxxiv
Performance: A Case Study with Possible Implications for Accountability Mandates
within the Elementary and Secondary Education Act" (2016). Faculty Scholarship. 2.
Shamaki, T. A. (2015). Influence of Learning Environment on Students‘ Academic
Achievement in Mathematics: A Case Study of Some Selected Secondary Schools in
Yobe State – Nigeria. Journal of Education and Practice. Vol.6, No.34. Pp 40-44.
Sieberer-Nagler, K. (2016). Effective Classroom-Management and positive Teaching.
English Language Teaching; Vol. 9, No. 1; pp 161-172.
Singh, D. (2019). A Literature Review on Employee Retention with Focus on Recent
Trends IJSRST. Vol 6 Issue 1. Pp 425-431.
Sorensen, L. C., and Helen Ladd. (2018). ―The Hidden Costs of Teacher Turnover.‖
National Center for Analysis of Longitudinal Data in Education Research
(CALDER) Working Paper No. 203-0918-1.
Sparks, S. (2016). Student Mobility: How It Affects Learning. Education Week. Retrieved
03/10/20/from http://www.edweek.org/ew/issues/student-mobility/
Spencer, K. L. (2017). "An Examination Of Student Mobility In U.S. Public Schools"
(2017). Publicly Accessible Penn Dissertations.
https://repository.upenn.edu/edissertations/2591
Stanley, J. (2018). Teachers are at breaking point. It's time to push wellbeing up the
agenda. www.plas.princeton.eddu
Staufenberg, J. (2018). Maths and science teachers ‗need 5% more pay‘ to end shortage
https://schoolsweek.co.uk/maths-and-science-teachers-need-5-more-pay-to-end-
shortage/23rd March
Suppramaniam, S., Kularajasingam, J. and Sharmin, N. (2019). Factors Influencing
Parents Decision in Selecting Private Schools in Chittagong City, Bangladesh.
International Journal of Recent Technology and Engineering. Volume-7 Issue-5S. pp 1-
72,
Sutcher, L., Darling-Hammond, L., and Carver-Thomas, D. (2016). Coming Crisis in
Teaching? Teacher Supply, Demand, and Shortages in the U.S. (research brief). Palo
Alto, CA: Learning Policy Institute.
Sutcher, L., Darling-Hammond, L., and Carver-Thomas, D. (2019). Understanding teacher
shortages: An analysis of teacher supply and demand in the United States. Education
Policy Analysis Archives, 27(35). 1-40.
Swati, D and Archana, S. (2019). Role of organizational image in employee engagement
and performance. Benchmarking An International Journal. Vol. 26 No. 3, 2019 pp. 971-
989.
Swedish Government. (2010). Tillgången på beh€origa l€arare (Supply of certified
teachers)
clxxxv
Taniguchi, K. (2015). Multiple Indicators of School Effectiveness in Rural Malawi: A
Multilevel Event History Analysis. Unpublished doctoral dissertation, Hiroshima
University, Japan.
Taniguchi, K. (2017). Determinants of Student Mobility in Primary School in Rural
Malawi: An Event History Analysis. World Jornal of Education. Vol.7, No 2. Pp 14-19.
Tapper, J. (2018). Burned out: why are so many teachers quitting or off sick with stress?
Guardian News and Media Limited.recruitment-problems-budget-cuts. Teacher
Mobility,‖Economics of Education Review.26(2), pp 145-159.
Teuscher, S., and Makarova, E. (2018). Students‘ School Engagement and Their Truant
Behavior: Do Relationships with Classmates and Teachers Matter? Journal of
Education and Learning, 7, pp 124–137.
Thomas, B. Fordham Institute. (2012). Student nomads: Mobility in Ohio’s schools.
Washington, D.C.: Thomas B. Fordham Institute.
Thompson, J. D. and Ansoglenang, G. (2020). Why Do Students Engage in Examination
Malpractice? The University for Development Studies Experience. Journal of Social
Science Studies. Vol. 7, No. 1.
Tiplic, D., Brandmo, C., and Elstad, E. (2015). Antecedents of Norwegian beginning
teachers‘
turnover intentions. Cambridge Journal of Education, 45(4), 451–474.
Toch, T. (2016). Grading the Graders: A report on Teacher Evaluation Reform in Public
Education Reform. Futre Ed, George Town University.
https://www.future-ed.org/wp-
content/uploads/2017/02/TeacherEval_170105_v2.pdf
Tonda, H. (2019). "The Effects of Alternative Certification Program Type on Teacher
Self- Efficacy: A Causal-Comparative Study." Ed.D. Dissertations. 359.
https://commons.cu-portland.edu/edudissertations/359
Toropova, A., Myrberg, E., and Johansson, S. (2020). Teacher job satisfaction: the
importance of school working conditions and teacher characteristics, Educational Review,
Tsai, L. T., and Yang, C. C. (2015). Hierarchical effects of school-, classroom-, and
student-level
factors on the science performance of eighth-grade Taiwanese students. International
Journal of Science Education. 37(8), 1166-1181.
Tshukudu, T. T. (2020). Employee Engagement and Staff Turnover and Its Implication on
the Organisational Performance: Case of AON Botswana. International Journal of
Economic Behavior and Organization. Vol. 8, No. 1, 2020, pp. 1-11.
U K Department of Education, (2018). Analysis of teacher supply, retention and mobility.
U.S. Department of Education Office of Post secondary Education. (2015). Teacher
Shortage Areas Nationwide Listings 1990-1991 through 2015-16. Washington, DC:
U.S. Department of Education.
clxxxvi
Tshukudu, T. T. (2020). Employee Engagement and Staff Turnover and Its Implication on
the Organisational Performance: Case of AON Botswana. International Journal of
Economic Behavior and Organization. Vol. 8, No. 1, 2020, pp. 1-11.
U K. Department for Education. (2017) Recruitment and Retention of Teachers (London,
House of Commons). Education Committee.
U.S. Department of Education National Center for Education Statistics, (2017).
―Monitoring Quality: An Indicators Report,‖ Figure 2.3. Washington, DC.
U.S. Department of Education Office of Postsecondary Education, (2015). Teacher
Shortage Areas Nationwide Listings 1990-1991 through 2015-16. Washington, D.C.:
U.S. Department of Education.
Umar, U. S. and Samuel, R. I. (2019). Influence of School Facilities and School Types on
Senior Secondary School Science Students‘ Academic Performance in Nasarawa State,
Nigeria. Impact Factor 3.582 Case Studies Journal. Volume 8, Issue 1.
Undie, J. A., and Nike, J.A. (2016). Teachers class size, job satisfaction and morale in
Cross River State secondary schools, Nigeria. Annals of Modern Education 8: pp
6–26.
UNESCO Institute for Statistics (UIS) (2016). The World needs almost 69 million new
teachers to reach the 2030 education goal. Fact sheets No 39.
UNESCO, (2015). Education for all Global Monitoring Report. The challenge of teacher
shortage and quality: Have we succeeded in getting enough quality teachers into
classrooms? Policy Paper19.
UNESCO, (2018). Migration, Displacement and Education – Building Bridges, not Walls.
Paris, UNESCO.
Vagi, R. and Pivovarova, M. (2016). ‗Theorizing teacher mobility‘: A critical review of
literature. Teacher and Teaching. 23:7, pp 781-793b,
Valerie, S. (2017). ―Teacher Shortages Affecting Every State As 2017–18 School Year
Begins,‖ Washington Post, August 28, 2017.
Von der Embse, Nathaniel, and Pendergast, Laura and Segool, Natasha and Saeki, Elina
and Ryan, Shannon. (2016). The influence of test-based accountability policies on school
climate and teacher stress across four states. Teaching and Teacher Education. 59.
Pp 492- 502,
Vignesh, S.G and Sarojini, S.V. (2018). Employee Attrition and Employee Retention
Challenges and Suggestions. Conference papper, January.
https://www.researchgate.net/publication/322896996_Employee_Attrition_and_Emp
loye e_Retention-Challenges_Suggestions/link/5a74897baca2720bc0de13b6/download
Watson, K., Watson, K., Handal, B., Handal, B., Maher, M., and Maher, M. (2016). The
influence of class size upon numeracy and literacy performance. Quality Assurance
in Education, 24(4), pp 507-527.
clxxxvii
Wei Y (2016) Teacher mobility in rural China: Evidence from Northwest China.
d.lib.msu.edu › etd › datastream › OBJ › download › T
Wei, Y. and Zhou, S. (2019). Are Better Teachers More Likely to Move? Examining
Teacher Mobility in Rural China. Asia-Pacific Education Researcher. V28, N2. pp
171-179.
Wei Y, Zhou, S., and Liu, Y. (2020) The draw of home: How does teacher‘s initial job
placement relate to teacher mobility in rural China? PLoS ONE 15(1): e0227137.
https://doi.org/10.1371/journal.
Weinstein, J. (2016). ¿Cómo vivencian los docentes latinoamericanos su trabajo y su
escuela?
Nuevos antecedentes a partir del estudio TERCE/How Latin American Teachers
Experienced their Work and their School? New Information from TERCE Study.
REICE, Revista Iberoamericana Sobre Calidad, Eficacia y Cambio En Educación,
14.4.
Wekesa, E., Simatwa, E., and Okwach, T. (2016). Influence of teacher factors on students‘
academic performance in secondary school education: A Case Study of Kakamega
County Kenya. Greener journal of Educational Research, Vol. 5(2).pp 245-256.
Welsh, R., Duque, M. and Mceachin, A. (2015) School Choice, Student Mobility, and
School Quality: Evidence from post-Katrina New Orleans. Education Finance and
Policy. 11. pp 1- 27.
Welsh, R. O. (2017). School hopscotch: A comprehensive review of K–12 student
mobility in the United States. Review of Educational Research, 87(3), pp 475–511.
Whitford, D. K., Zhang, D. and Katsiyannis, A. (2017). Preparation Programs: A Meta-
Analysis.‖ Journal of Child and Family Studies 27, no. 3: pp 671–685.
With, M. L. (2017). Are Teachers Increasingly Leaving the Profession? Professions and
Professionalism, 7(2), e1723.
World Bank, (2018). World Development Report 2018: Learning to Realize Education‘s
Promise. Washington, DC: World Bank. © World Bank.
https://openknowledge.worldbank.org/handle/10986/28340
World Health Organization, (2015). School Environment: Policies and Current Status.
Copenhagen: WHO Regional Office for Europe.
Worth, J. and De Lazzari, G. (2017). Teacher Retention and Turnover Research. Research
Update 1: Teacher Retention by Subject. Slough: NFER [online]. Available:
https://www.nfer.ac.uk/publications/NUFS01.
Wunti, Y. I., Hafsat, A. U. and Igbaji, C. (2017). Impact of school facilities on students
academic achievement. Int. J. Adv. Res. 5(12), pp 878-889.
Yamane, T. (1967). Statistics, An IntroductoryAnalysis, 2nd Ed., New York: Harper and
Row.
clxxxviii
Yilmaz, B, and Halici, A, (2010). İşgücü Devir Hızını Etkileyen Etmenler: Sekreterlik
Mesleğinde Bir Araştırma. International Journal of Economic and Administrative
Studies Year 2(4): pp 93-108.
Yinon, H., and L. Orland-Barak. L. (2017). ―Career Stories of Israeli Teachers Who Left
Teaching: A Salutogenic View of Teacher Attrition.‖ Teachers and Teaching:
Theory and Practice 23 (8): pp 914–927.
Yousef, D. A. (2016). Organizational commitment, job satisfaction and attitudes toward
organizational change: A study in the local government. International Journal of
Public
Administration, Vol. 40, (1) pp 77–88.
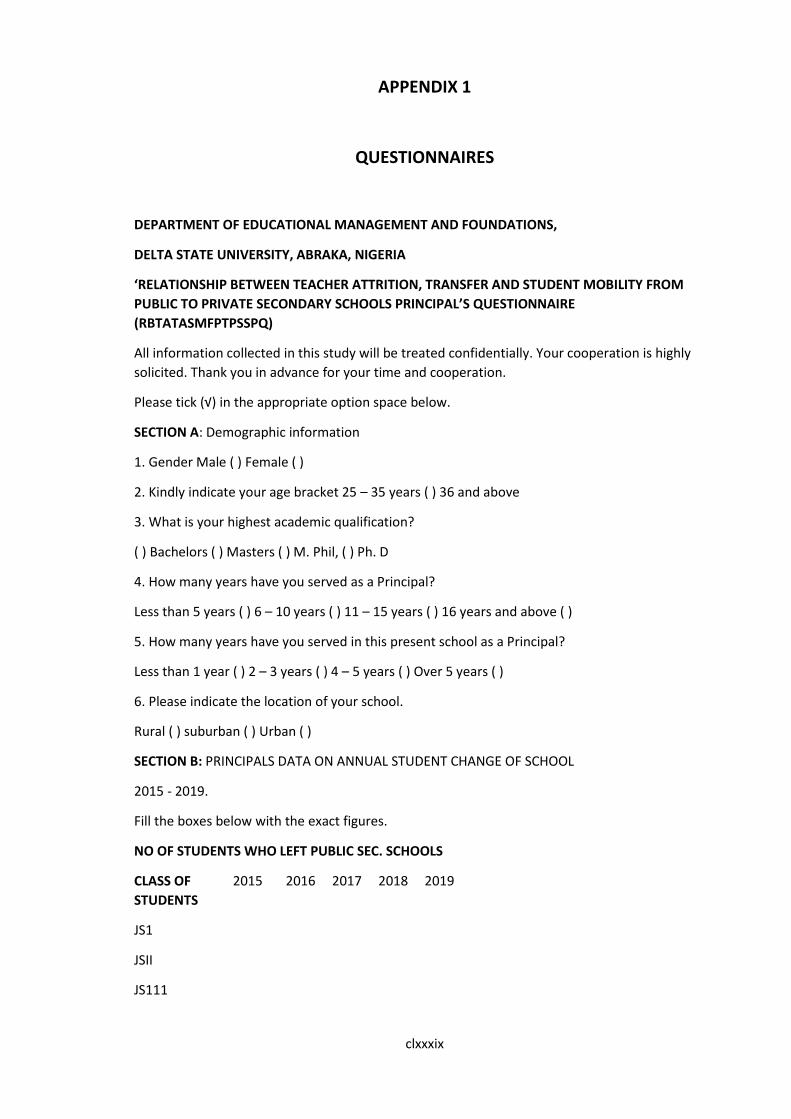
clxxxix
APPENDIX 1
QUESTIONNAIRES
DEPARTMENT OF EDUCATIONAL MANAGEMENT AND FOUNDATIONS,
DELTA STATE UNIVERSITY, ABRAKA, NIGERIA
‘RELATIONSHIP BETWEEN TEACHER ATTRITION, TRANSFER AND STUDENT MOBILITY FROM
PUBLIC TO PRIVATE SECONDARY SCHOOLS PRINCIPAL’S QUESTIONNAIRE
(RBTATASMFPTPSSPQ)
All information collected in this study will be treated confidentially. Your cooperation is highly
solicited. Thank you in advance for your time and cooperation.
Please tick (√) in the appropriate option space below.
SECTION A: Demographic information
1. Gender Male ( ) Female ( )
2. Kindly indicate your age bracket 25 – 35 years ( ) 36 and above
3. What is your highest academic qualification?
( ) Bachelors ( ) Masters ( ) M. Phil, ( ) Ph. D
4. How many years have you served as a Principal?
Less than 5 years ( ) 6 – 10 years ( ) 11 – 15 years ( ) 16 years and above ( )
5. How many years have you served in this present school as a Principal?
Less than 1 year ( ) 2 – 3 years ( ) 4 – 5 years ( ) Over 5 years ( )
6. Please indicate the location of your school.
Rural ( ) suburban ( ) Urban ( )
SECTION B: PRINCIPALS DATA ON ANNUAL STUDENT CHANGE OF SCHOOL
2015 - 2019.
Fill the boxes below with the exact figures.
NO OF STUDENTS WHO LEFT PUBLIC SEC. SCHOOLS
CLASS OF
STUDENTS
2015 2016 2017 2018 2019
JS1
JSII
JS111
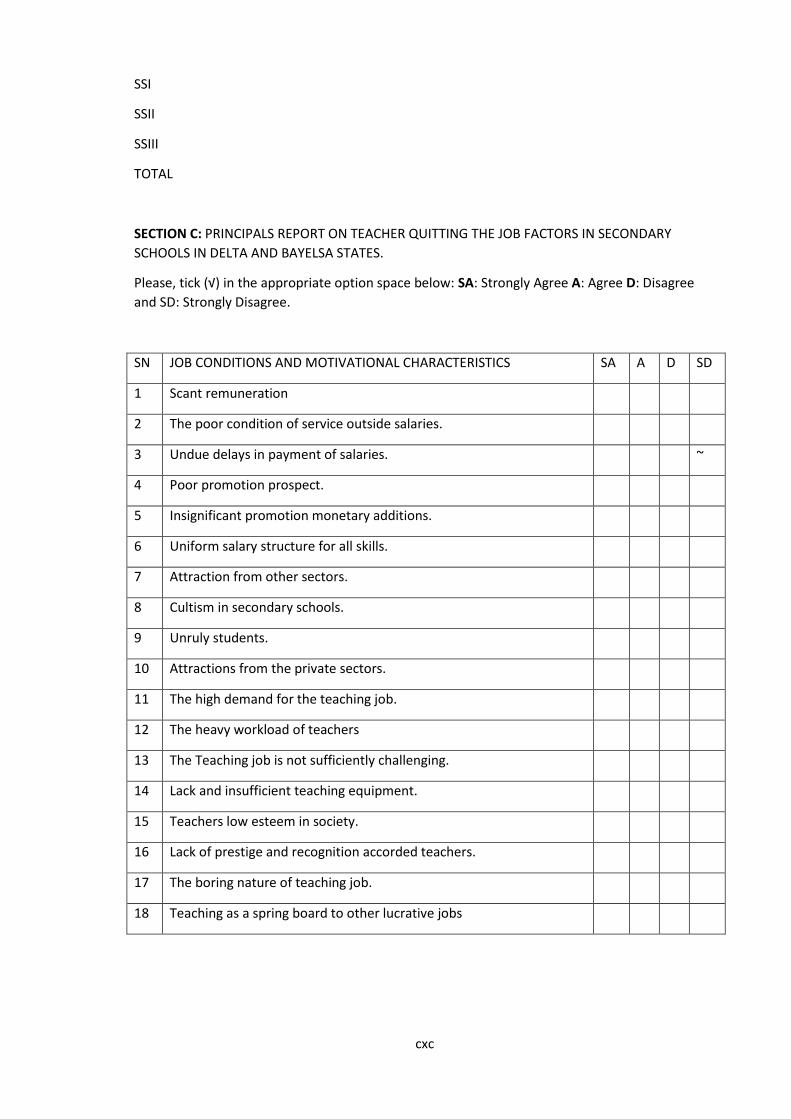
cxc
SSI
SSII
SSIII
TOTAL
SECTION C: PRINCIPALS REPORT ON TEACHER QUITTING THE JOB FACTORS IN SECONDARY
SCHOOLS IN DELTA AND BAYELSA STATES.
Please, tick (√) in the appropriate option space below: SA: Strongly Agree A: Agree D: Disagree
and SD: Strongly Disagree.
SN JOB CONDITIONS AND MOTIVATIONAL CHARACTERISTICS SA A D SD
1 Scant remuneration
2 The poor condition of service outside salaries.
3 Undue delays in payment of salaries. ~
4 Poor promotion prospect.
5 Insignificant promotion monetary additions.
6 Uniform salary structure for all skills.
7 Attraction from other sectors.
8 Cultism in secondary schools.
9 Unruly students.
10 Attractions from the private sectors.
11 The high demand for the teaching job.
12 The heavy workload of teachers
13 The Teaching job is not sufficiently challenging.
14 Lack and insufficient teaching equipment.
15 Teachers low esteem in society.
16 Lack of prestige and recognition accorded teachers.
17 The boring nature of teaching job.
18 Teaching as a spring board to other lucrative jobs
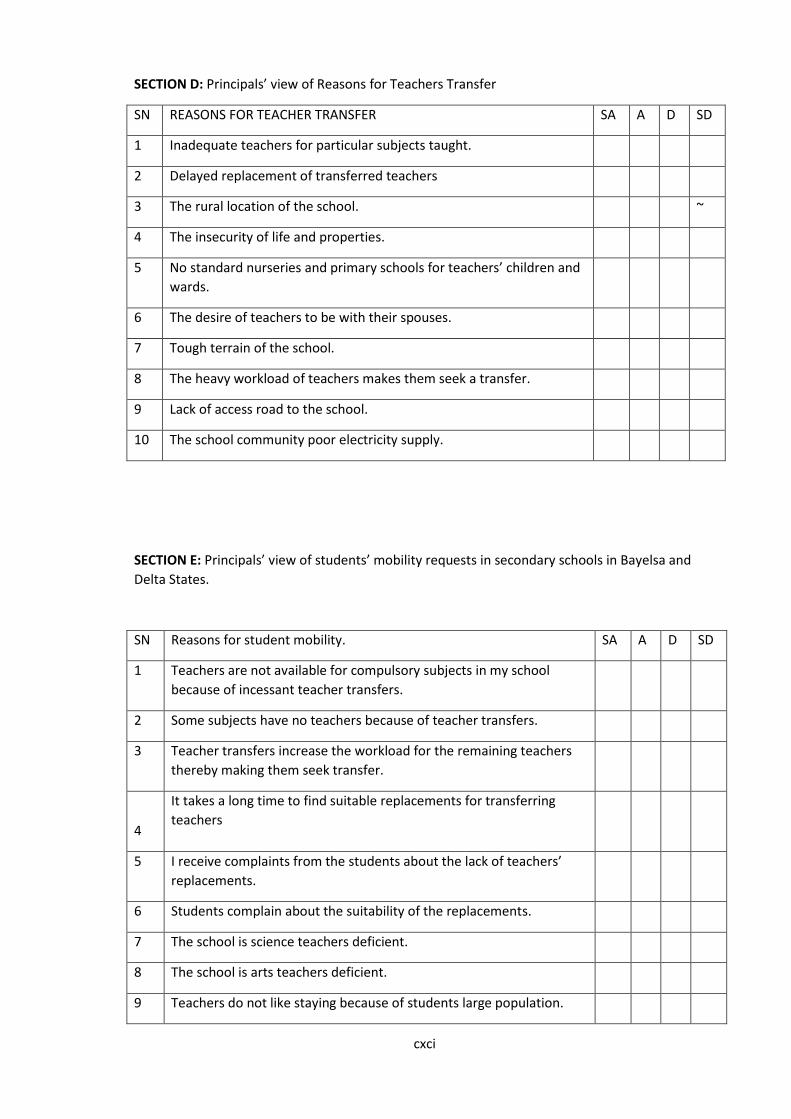
cxci
SECTION D: Principals’ view of Reasons for Teachers Transfer
SN REASONS FOR TEACHER TRANSFER SA A D SD
1 Inadequate teachers for particular subjects taught.
2 Delayed replacement of transferred teachers
3 The rural location of the school. ~
4 The insecurity of life and properties.
5
No standard nurseries and primary schools for teachers’ children and
wards.
6 The desire of teachers to be with their spouses.
7 Tough terrain of the school.
8 The heavy workload of teachers makes them seek a transfer.
9 Lack of access road to the school.
10 The school community poor electricity supply.
SECTION E: Principals’ view of students’ mobility requests in secondary schools in Bayelsa and
Delta States.
SN Reasons for student mobility. SA A D SD
1 Teachers are not available for compulsory subjects in my school
because of incessant teacher transfers.
2 Some subjects have no teachers because of teacher transfers.
3 Teacher transfers increase the workload for the remaining teachers
thereby making them seek transfer.
4
It takes a long time to find suitable replacements for transferring
teachers
5 I receive complaints from the students about the lack of teachers’
replacements.
6 Students complain about the suitability of the replacements.
7 The school is science teachers deficient.
8 The school is arts teachers deficient.
9 Teachers do not like staying because of students large population.
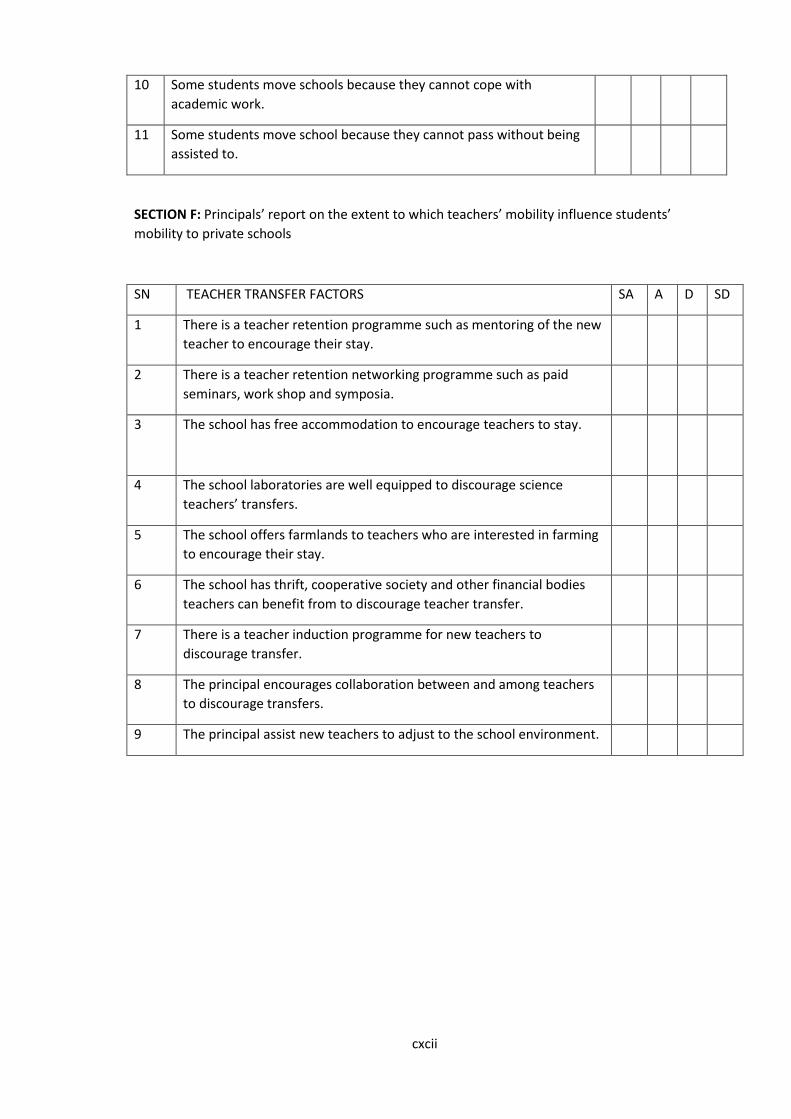
cxcii
10 Some students move schools because they cannot cope with
academic work.
11 Some students move school because they cannot pass without being
assisted to.
SECTION F: Principals’ report on the extent to which teachers’ mobility influence students’
mobility to private schools
SN TEACHER TRANSFER FACTORS SA A D SD
1 There is a teacher retention programme such as mentoring of the new
teacher to encourage their stay.
2 There is a teacher retention networking programme such as paid
seminars, work shop and symposia.
3
The school has free accommodation to encourage teachers to stay.
4 The school laboratories are well equipped to discourage science
teachers’ transfers.
5 The school offers farmlands to teachers who are interested in farming
to encourage their stay.
6 The school has thrift, cooperative society and other financial bodies
teachers can benefit from to discourage teacher transfer.
7 There is a teacher induction programme for new teachers to
discourage transfer.
8 The principal encourages collaboration between and among teachers
to discourage transfers.
9 The principal assist new teachers to adjust to the school environment.

cxciii
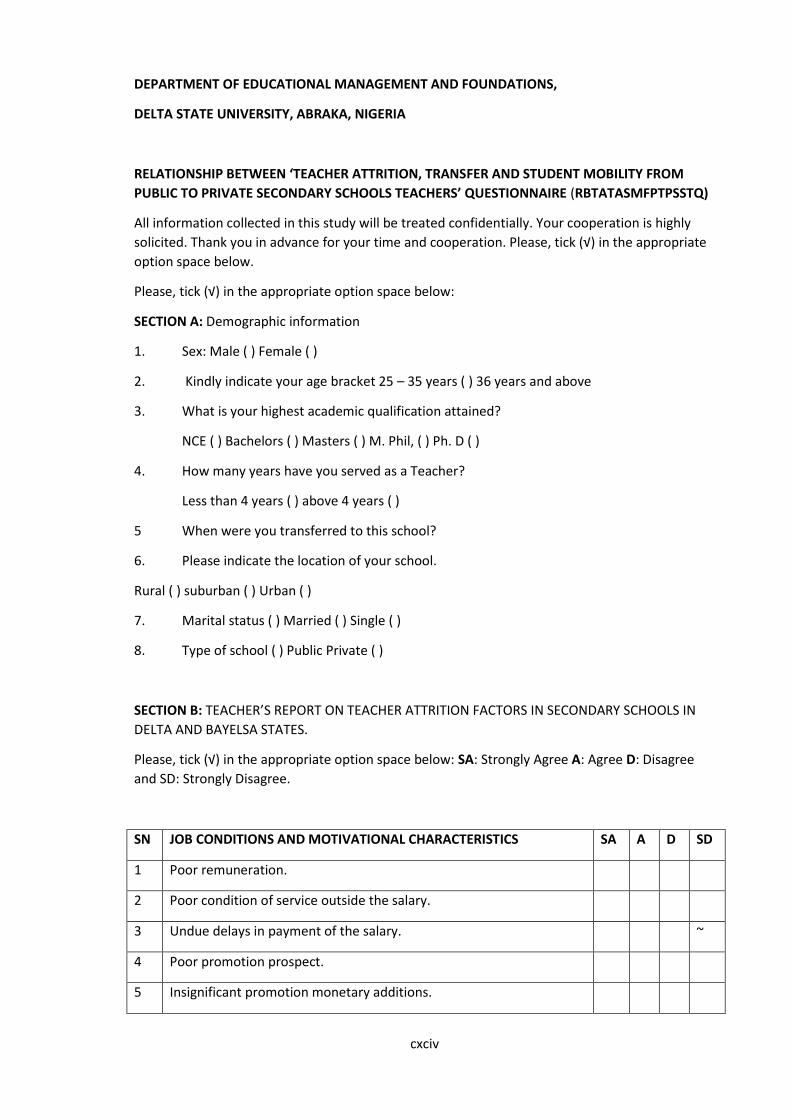
cxciv
DEPARTMENT OF EDUCATIONAL MANAGEMENT AND FOUNDATIONS,
DELTA STATE UNIVERSITY, ABRAKA, NIGERIA
RELATIONSHIP BETWEEN ‘TEACHER ATTRITION, TRANSFER AND STUDENT MOBILITY FROM
PUBLIC TO PRIVATE SECONDARY SCHOOLS TEACHERS’ QUESTIONNAIRE (RBTATASMFPTPSSTQ)
All information collected in this study will be treated confidentially. Your cooperation is highly
solicited. Thank you in advance for your time and cooperation. Please, tick (√) in the appropriate
option space below.
Please, tick (√) in the appropriate option space below:
SECTION A: Demographic information
1. Sex: Male ( ) Female ( )
2. Kindly indicate your age bracket 25 – 35 years ( ) 36 years and above
3. What is your highest academic qualification attained?
NCE ( ) Bachelors ( ) Masters ( ) M. Phil, ( ) Ph. D ( )
4. How many years have you served as a Teacher?
Less than 4 years ( ) above 4 years ( )
5 When were you transferred to this school?
6. Please indicate the location of your school.
Rural ( ) suburban ( ) Urban ( )
7. Marital status ( ) Married ( ) Single ( )
8. Type of school ( ) Public Private ( )
SECTION B: TEACHER’S REPORT ON TEACHER ATTRITION FACTORS IN SECONDARY SCHOOLS IN
DELTA AND BAYELSA STATES.
Please, tick (√) in the appropriate option space below: SA: Strongly Agree A: Agree D: Disagree
and SD: Strongly Disagree.
SN JOB CONDITIONS AND MOTIVATIONAL CHARACTERISTICS SA A D SD
1 Poor remuneration.
2 Poor condition of service outside the salary.
3 Undue delays in payment of the salary. ~
4 Poor promotion prospect.
5 Insignificant promotion monetary additions.

cxcv
6 Uniform salary structure for all skills.
7 Attraction from other sectors.
8 Cultism in secondary schools.
9 Unruly students.
10 Attractions from the private sectors.
11 High demand of the teaching job.
12 Heavy work load of teachers.
13 Teaching job is not sufficiently challenging.
14 Lack and insufficient teaching equipment.
15 Teachers low esteem in the society.
16 Lack of prestige and recognition accorded teachers.
17 Boring nature of teaching job.
18 Teaching as a spring board to other lucrative jobs.
SECTION C: TEACHER’S REPORT ON REASONS FOR TEACHER TRANSFER.
SN REASONS FOR TEACHER TRANSFER (SCHOOL RELATED FACTORS) SA A D SD
1 Inadequate teachers for particular subjects taught.
2 Delayed replacement of transferred teachers.
3 Rural location of school.
4 Insecurity of life and properties.
7 No standard nurseries and primary schools for teachers’ children and
wards.
6 Lack of Laboratories.
8 Lack of Libraries.
9 Lack of social amenities.
10 Community hostility.
11 Cultism.
12 The difficult terrain of the school.
13 Heavy work load of teachers.
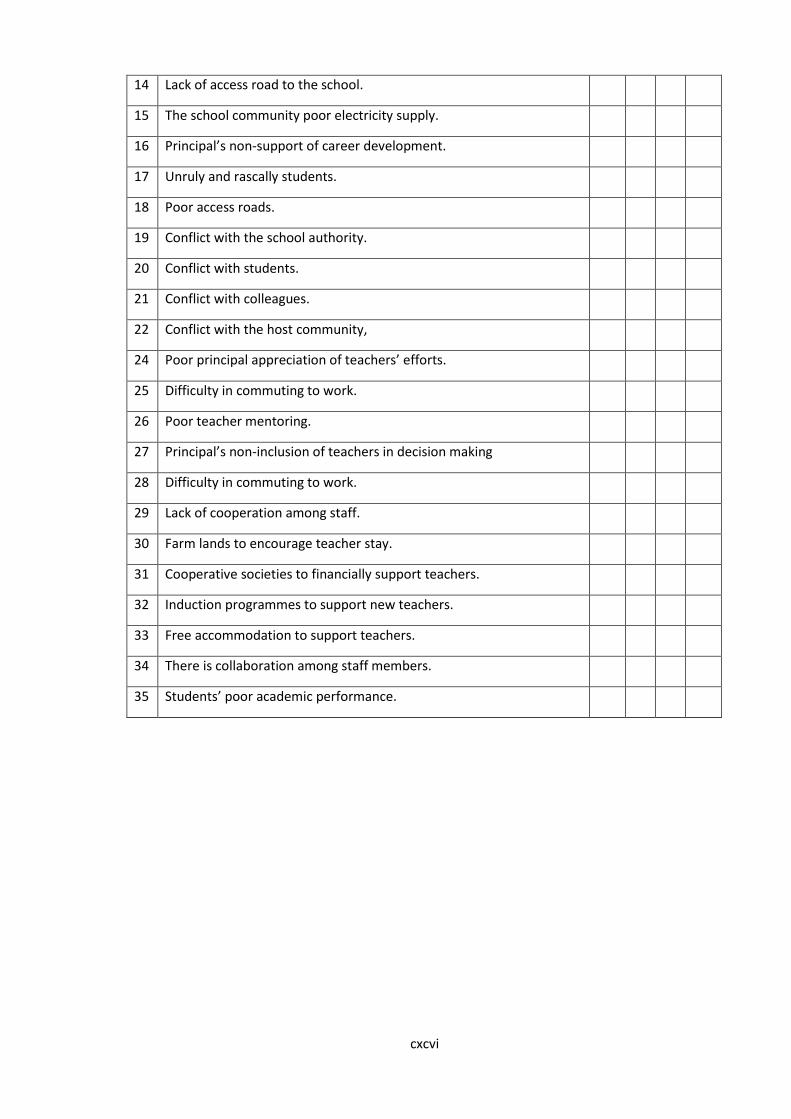
cxcvi
14 Lack of access road to the school.
15 The school community poor electricity supply.
16 Principal’s non-support of career development.
17 Unruly and rascally students.
18 Poor access roads.
19 Conflict with the school authority.
20 Conflict with students.
21 Conflict with colleagues.
22 Conflict with the host community,
24 Poor principal appreciation of teachers’ efforts.
25 Difficulty in commuting to work.
26 Poor teacher mentoring.
27 Principal’s non-inclusion of teachers in decision making
28 Difficulty in commuting to work.
29 Lack of cooperation among staff.
30 Farm lands to encourage teacher stay.
31 Cooperative societies to financially support teachers.
32 Induction programmes to support new teachers.
33 Free accommodation to support teachers.
34 There is collaboration among staff members.
35 Students’ poor academic performance.
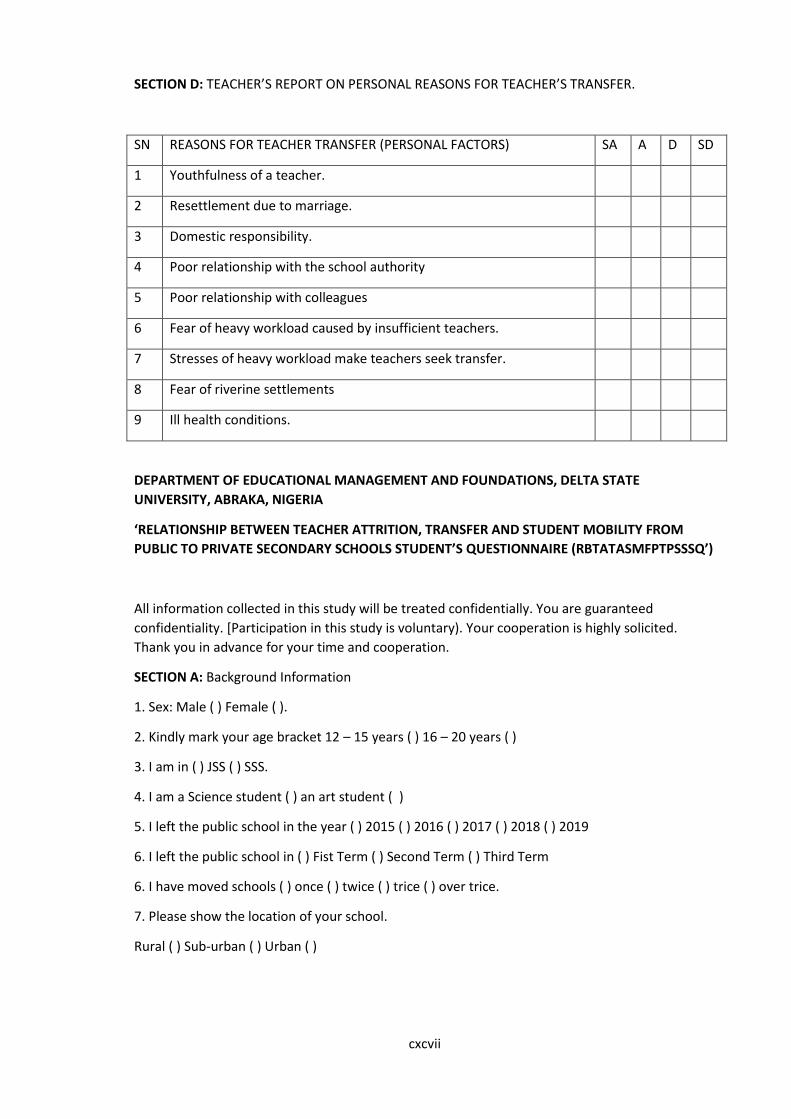
cxcvii
SECTION D: TEACHER’S REPORT ON PERSONAL REASONS FOR TEACHER’S TRANSFER.
SN REASONS FOR TEACHER TRANSFER (PERSONAL FACTORS) SA A D SD
1 Youthfulness of a teacher.
2 Resettlement due to marriage.
3 Domestic responsibility.
4 Poor relationship with the school authority
5 Poor relationship with colleagues
6 Fear of heavy workload caused by insufficient teachers.
7 Stresses of heavy workload make teachers seek transfer.
8 Fear of riverine settlements
9 Ill health conditions.
DEPARTMENT OF EDUCATIONAL MANAGEMENT AND FOUNDATIONS, DELTA STATE
UNIVERSITY, ABRAKA, NIGERIA
‘RELATIONSHIP BETWEEN TEACHER ATTRITION, TRANSFER AND STUDENT MOBILITY FROM
PUBLIC TO PRIVATE SECONDARY SCHOOLS STUDENT’S QUESTIONNAIRE (RBTATASMFPTPSSSQ’)
All information collected in this study will be treated confidentially. You are guaranteed
confidentiality. [Participation in this study is voluntary). Your cooperation is highly solicited.
Thank you in advance for your time and cooperation.
SECTION A: Background Information
1. Sex: Male ( ) Female ( ).
2. Kindly mark your age bracket 12 – 15 years ( ) 16 – 20 years ( )
3. I am in ( ) JSS ( ) SSS.
4. I am a Science student ( ) an art student ( )
5. I left the public school in the year ( ) 2015 ( ) 2016 ( ) 2017 ( ) 2018 ( ) 2019
6. I left the public school in ( ) Fist Term ( ) Second Term ( ) Third Term
6. I have moved schools ( ) once ( ) twice ( ) trice ( ) over trice.
7. Please show the location of your school.
Rural ( ) Sub-urban ( ) Urban ( )
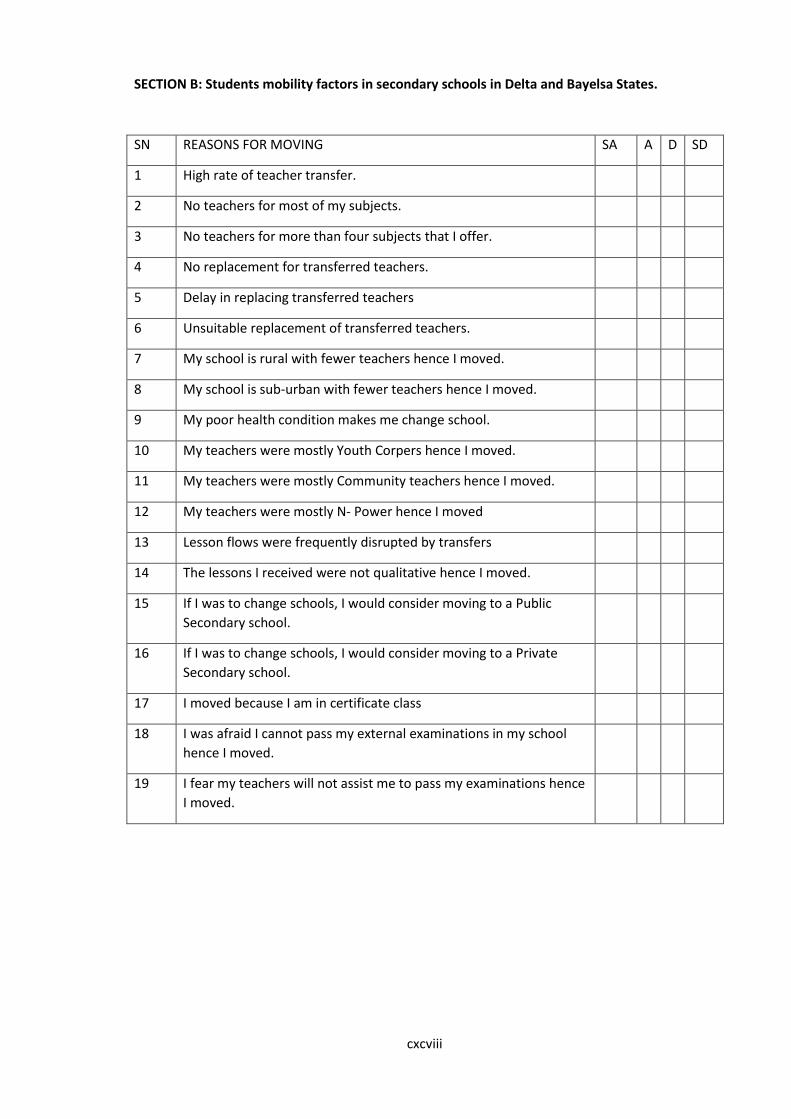
cxcviii
SECTION B: Students mobility factors in secondary schools in Delta and Bayelsa States.
SN REASONS FOR MOVING SA A D SD
1 High rate of teacher transfer.
2 No teachers for most of my subjects.
3 No teachers for more than four subjects that I offer.
4 No replacement for transferred teachers.
5 Delay in replacing transferred teachers
6 Unsuitable replacement of transferred teachers.
7 My school is rural with fewer teachers hence I moved.
8 My school is sub-urban with fewer teachers hence I moved.
9 My poor health condition makes me change school.
10 My teachers were mostly Youth Corpers hence I moved.
11 My teachers were mostly Community teachers hence I moved.
12 My teachers were mostly N- Power hence I moved
13 Lesson flows were frequently disrupted by transfers
14 The lessons I received were not qualitative hence I moved.
15 If I was to change schools, I would consider moving to a Public
Secondary school.
16 If I was to change schools, I would consider moving to a Private
Secondary school.
17 I moved because I am in certificate class
18 I was afraid I cannot pass my external examinations in my school
hence I moved.
19 I fear my teachers will not assist me to pass my examinations hence
I moved.
cxcix
APPENDIX 11
SAMPLE SIZES DETEMINATION FORMULA
COCHRAN’S FORMULA FOR DETERMINING SAMPLE SIZE FOR SMALL POPULATIONS
To calculate the sample size, the (Cochran, 1977) formula stated below was applied.
Where e is the desired level of precision (that is the error margin)
P is the estimated proportion of the population which has the attribute in question and
q is 1– p
The Z value is found in a Z table (1.96)
With p = 0.5 at 95% confidence level giving a Z value of 1.96 we get
((1.96)2 (0.5) (0.5)) / (0.05)2 = 385
Therefore a random sample of 385 should give us the confidence level we need.
Modifying the above for small sample size in smaller population, the following formula
recommended by Cochran, (1977) is applied
Here n0 is Cochran’s sample size recommendation 385, N is the population size, and n is
the new, adjusted sample size. By this formula, an N of 178 for Bayelsa State public Secondary
Schools, N 178 for the private secondary schools, N of 463 for Delta state public secondary
schools and an N of 913 for private secondary school will give the following sample sizes worked
below.
For 178 which is N for Bayelsa state public schools the sample (n) is as follows.
= 385/1 + 385-1/178
= 385/1+ 2.16
= 385/3.16
= 121.8 Approximately = 122
N for Bayelsa State public secondary school teachers is 3,744.The sample (n) is as follows.
For 3,744 which is N for Bayelsa State public secondary school teachers (n) will be
385/1+385/3,744
= 385/ 1+0.102
=385/1.10
= 350
SAMPLE PROPORTION DETERMINATION FOR BAYELSA STATE PRINCIPALS.
cc
N for Bayelsa State Principals = 122. Bayelsa Central Senatorial District Secondary school
principals’ population = 77Bayelsa Central Senatorial District Secondary school principals’
population = 57.Bayelsa South Senatorial District Secondary school population = 44.
Bayelsa East Senatorial District =122÷178×77 = 52.77 = 53
Bayelsa Central Senatorial District = 122÷178×57 = 39.06.
Delta West Senatorial District = 122÷178×44 = 30.15 =30.
Therefore, 53+39+30 = 122
SAMPLE PROPORTION DETERMINATION FOR DELTA STATE PRINCIPALS.
N for Delta State Principals = 204. Delta North Senatorial District Secondary school population =
165 Delta Central Senatorial District Secondary school population = l83, Delta South Senatorial
District Secondary school population = 115..
The proportions are as follows
Delta Central Senatorial District = 204÷463×165 = 72.6 = 72
Delta North Senatorial District = 204÷463×183 = 72.6 = 80.6 = 81
Delta South Senatorial District = 204÷463×115 = 50.6 = 51
Therefore, 72+81+51 = 204
SAMPLE PROPORTION DETERMINATION FOR BAYELSA STATE TEACHERS
Total number of teachers = 3744 Sample size = 350
Bayelsa East Senatorial District = 962 proportion = 350 ÷ 3744 × 962 = 90
Bayelsa Central Senatorial District = 2042 proportion = 350 ÷ 3744 × 2042 = 191
Bayelsa West Senatorial District = 740 proportion = 350 ÷ 3744 × 740 = 69..
Therefore, 90 + 190 + 69 = 350
SAMPLE PROPORTION DETERMINATION FOR DELTA STATE TEACHERS
Total number of teachers = 11887 Sample size = 373
Delta Central Senatorial District = 5405 proportion = 373 ÷ 11887 × 5405 = 170
Delta Central Senatorial District = 4210 proportion = 373 ÷ 11887 × 4210 =132
Delta South Senatorial District = 2272 proportion = 373 ÷ 11887 × 2272= 71
Therefore, 170 + 132 +71 = 373
SAMPLE PROPORTION DETERMINATION FOR BAYELSA AND DELTA STATES PRIVATE
SECONDARY SCHOOLS
Cochran’s formula for sample size determination
cci
Total private secondary school N =1030
385/1+ 385-1 ÷ 1030
= 385÷1 + 38÷ 1 + 0.38
= 385 ÷ 1.39
= 277.
Total number of private secondary schools N = 1030
Bayelsa State private secondary schools = 91
The proportion sample for Bayelsa State = 277÷1030 ×91 = 24.
Proportion for Delta State = 277÷1030 ×939 = 253.
BAYELSA STATE PRIVATE SCHOOLS SAMPLE PROPORTIONS
Therefore sample proportion for Bayelsa Central senatorial district = 24 ÷ 91 × 80 = 21
Therefore sample proportion for Bayelsa East senatorial district = 24 ÷ 91 × 9 = 2
21 Therefore sample proportion for Bayelsa West senatorial district = 24 ÷ 91 × 2 = 0.52 = 1
253 + 21 + 2 +1 = 277.
SAMPLE PROPORTION DETERMINATION FOR DELTA STATE PRIVATE SCHOOLS
Total number of private secondary schools N = 1030
Delta State private secondary schools = 939
Sample proportions
The Delta State private secondary schools proportions by senatorial district are as follows
Delta Central Senatorial District = 253 ÷ 939 × 526 = 142
Delta North Senatorial District = 253 ÷ 939 × 276 = 74
Delta South Senatorial District = 253 ÷ 939 × 137 =37
Therefore, the samples per senatorial district are 141 + 73 +37 = 253.
DELTA STATE
N for Delta state public schools is 429.
For 429 which is N for Delta state public schools the sample (n) is as follows.
= 385/ 1+ (385- 1/429)
= 385/1+ 384/429
= 385/1+0.89
ccii
= 385/1.89
= 204
N for Delta State public secondary school teachers is 11,887.
For 11, 887 which is N for Delta State public secondary school teachers (n) will be
385/1+385/11,887
= 385/1+0.032
=385/1.032
= 373.02
= 373
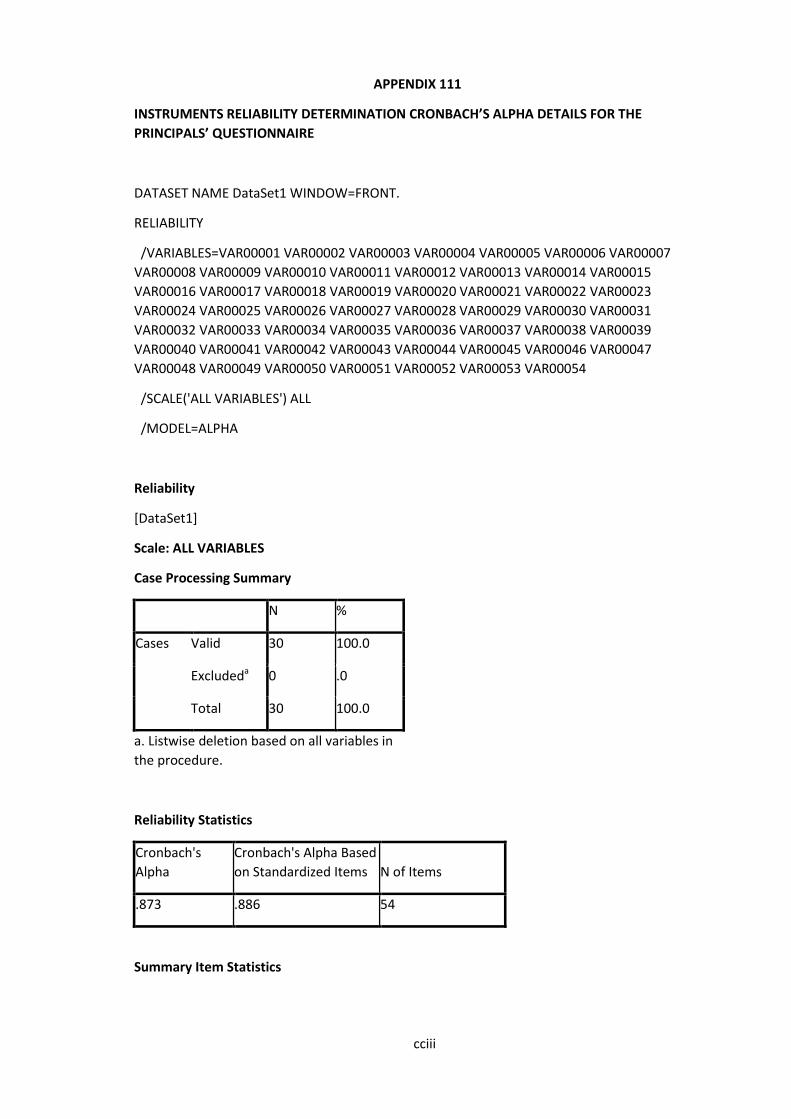
cciii
APPENDIX 111
INSTRUMENTS RELIABILITY DETERMINATION CRONBACH’S ALPHA DETAILS FOR THE
PRINCIPALS’ QUESTIONNAIRE
DATASET NAME DataSet1 WINDOW=FRONT.
RELIABILITY
/VARIABLES=VAR00001 VAR00002 VAR00003 VAR00004 VAR00005 VAR00006 VAR00007
VAR00008 VAR00009 VAR00010 VAR00011 VAR00012 VAR00013 VAR00014 VAR00015
VAR00016 VAR00017 VAR00018 VAR00019 VAR00020 VAR00021 VAR00022 VAR00023
VAR00024 VAR00025 VAR00026 VAR00027 VAR00028 VAR00029 VAR00030 VAR00031
VAR00032 VAR00033 VAR00034 VAR00035 VAR00036 VAR00037 VAR00038 VAR00039
VAR00040 VAR00041 VAR00042 VAR00043 VAR00044 VAR00045 VAR00046 VAR00047
VAR00048 VAR00049 VAR00050 VAR00051 VAR00052 VAR00053 VAR00054
/SCALE('ALL VARIABLES') ALL
/MODEL=ALPHA
Reliability
[DataSet1]
Scale: ALL VARIABLES
Case Processing Summary
N %
Cases Valid 30 100.0
Excludeda 0 .0
Total 30 100.0
a. Listwise deletion based on all variables in
the procedure.
Reliability Statistics
Cronbach's
Alpha
Cronbach's Alpha Based
on Standardized Items N of Items
.873 .886 54
Summary Item Statistics
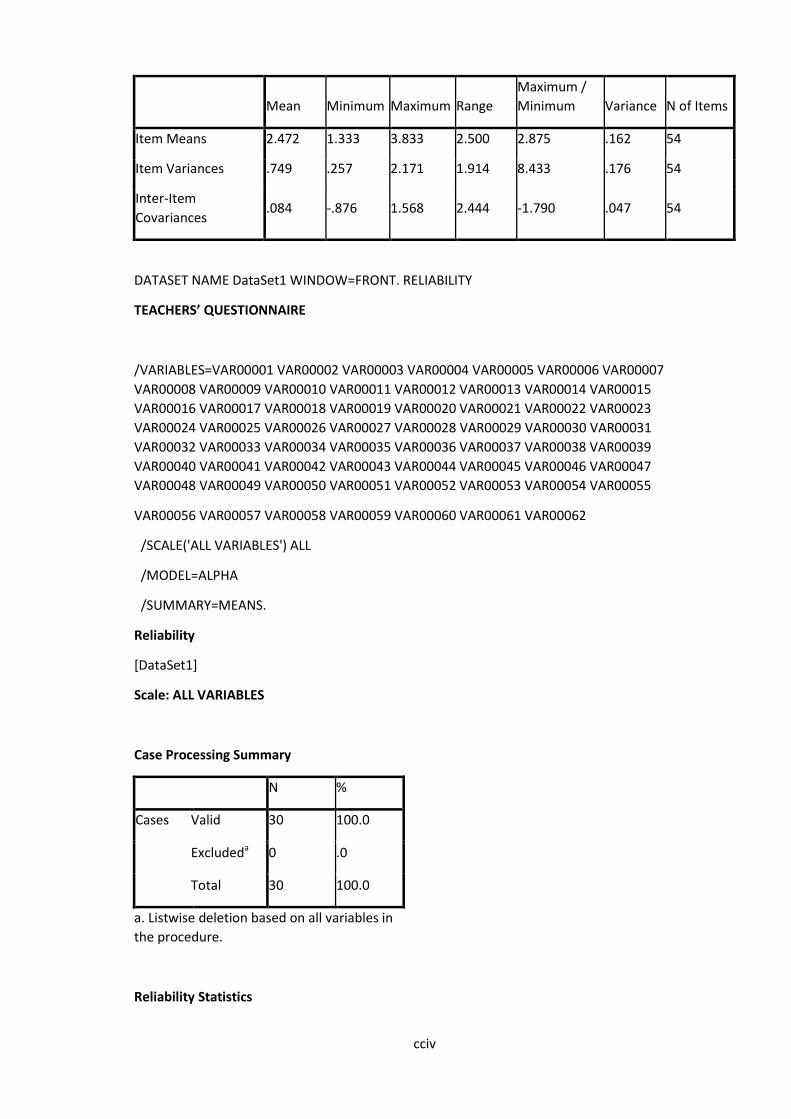
cciv
Mean Minimum Maximum Range
Maximum /
Minimum Variance N of Items
Item Means 2.472 1.333 3.833 2.500 2.875 .162 54
Item Variances .749 .257 2.171 1.914 8.433 .176 54
Inter-Item
Covariances .084 -.876 1.568 2.444 -1.790 .047 54
DATASET NAME DataSet1 WINDOW=FRONT. RELIABILITY
TEACHERS’ QUESTIONNAIRE
/VARIABLES=VAR00001 VAR00002 VAR00003 VAR00004 VAR00005 VAR00006 VAR00007
VAR00008 VAR00009 VAR00010 VAR00011 VAR00012 VAR00013 VAR00014 VAR00015
VAR00016 VAR00017 VAR00018 VAR00019 VAR00020 VAR00021 VAR00022 VAR00023
VAR00024 VAR00025 VAR00026 VAR00027 VAR00028 VAR00029 VAR00030 VAR00031
VAR00032 VAR00033 VAR00034 VAR00035 VAR00036 VAR00037 VAR00038 VAR00039
VAR00040 VAR00041 VAR00042 VAR00043 VAR00044 VAR00045 VAR00046 VAR00047
VAR00048 VAR00049 VAR00050 VAR00051 VAR00052 VAR00053 VAR00054 VAR00055
VAR00056 VAR00057 VAR00058 VAR00059 VAR00060 VAR00061 VAR00062
/SCALE('ALL VARIABLES') ALL
/MODEL=ALPHA
/SUMMARY=MEANS.
Reliability
[DataSet1]
Scale: ALL VARIABLES
Case Processing Summary
N %
Cases Valid 30 100.0
Excludeda 0 .0
Total 30 100.0
a. Listwise deletion based on all variables in
the procedure.
Reliability Statistics
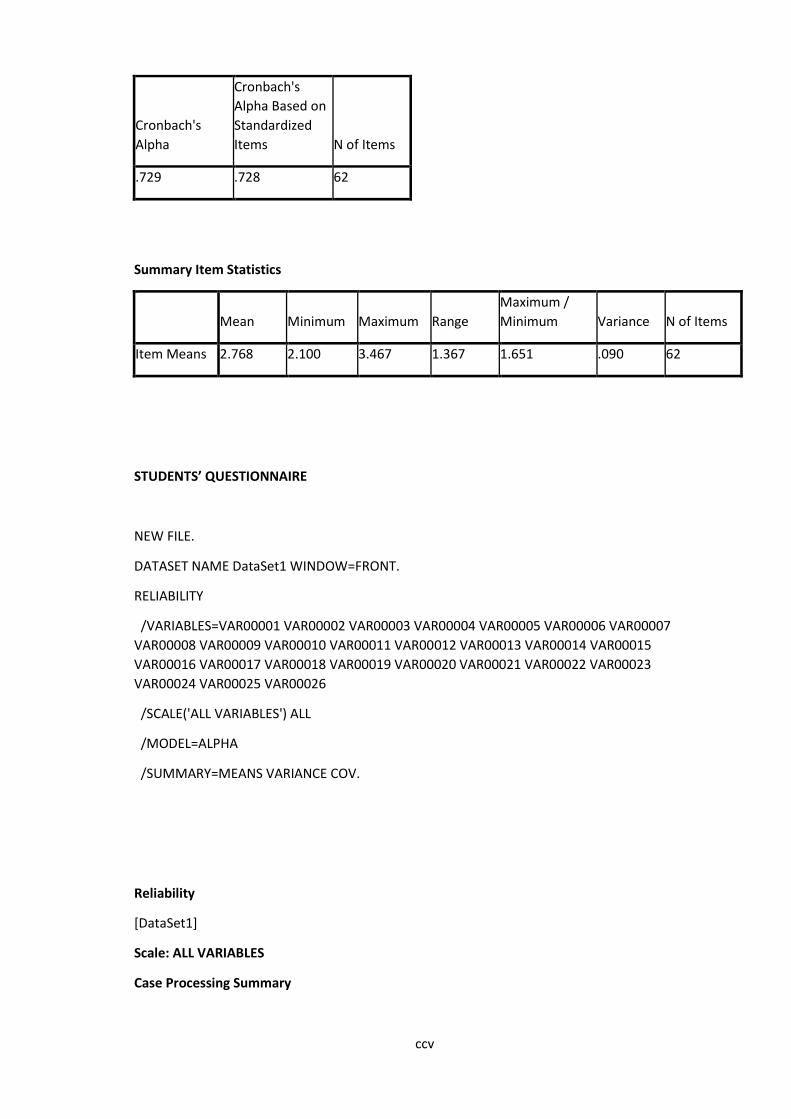
ccv
Cronbach's
Alpha
Cronbach's
Alpha Based on
Standardized
Items N of Items
.729 .728 62
Summary Item Statistics
Mean Minimum Maximum Range
Maximum /
Minimum Variance N of Items
Item Means 2.768 2.100 3.467 1.367 1.651 .090 62
STUDENTS’ QUESTIONNAIRE
NEW FILE.
DATASET NAME DataSet1 WINDOW=FRONT.
RELIABILITY
/VARIABLES=VAR00001 VAR00002 VAR00003 VAR00004 VAR00005 VAR00006 VAR00007
VAR00008 VAR00009 VAR00010 VAR00011 VAR00012 VAR00013 VAR00014 VAR00015
VAR00016 VAR00017 VAR00018 VAR00019 VAR00020 VAR00021 VAR00022 VAR00023
VAR00024 VAR00025 VAR00026
/SCALE('ALL VARIABLES') ALL
/MODEL=ALPHA
/SUMMARY=MEANS VARIANCE COV.
Reliability
[DataSet1]
Scale: ALL VARIABLES
Case Processing Summary
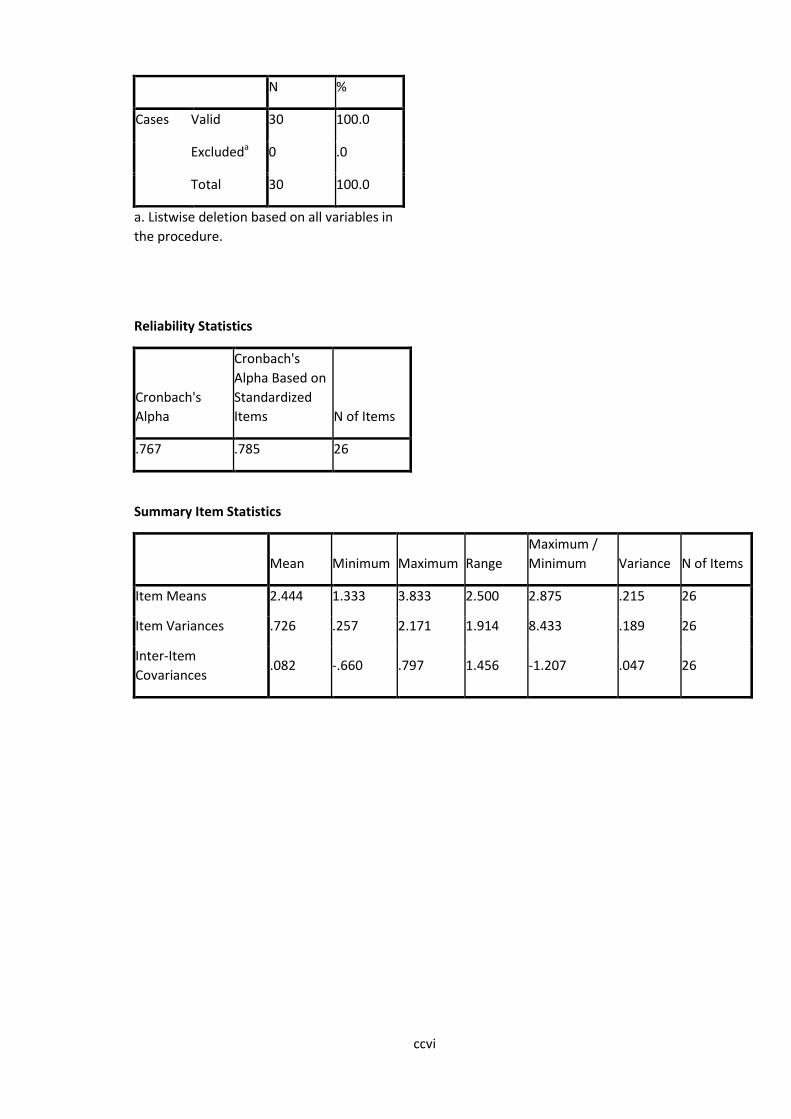
ccvi
N %
Cases Valid 30 100.0
Excludeda 0 .0
Total 30 100.0
a. Listwise deletion based on all variables in
the procedure.
Reliability Statistics
Cronbach's
Alpha
Cronbach's
Alpha Based on
Standardized
Items N of Items
.767 .785 26
Summary Item Statistics
Mean Minimum Maximum Range
Maximum /
Minimum Variance N of Items
Item Means 2.444 1.333 3.833 2.500 2.875 .215 26
Item Variances .726 .257 2.171 1.914 8.433 .189 26
Inter-Item
Covariances .082 -.660 .797 1.456 -1.207 .047 26
ccvii
APPENDIX 1V
TEACHERS EXIT AND TRANSFERS DATA FROM BAYELSA AND DELTA STATES SCHOOLS
MANAGEMENT BAORDS
BAYELSA STATE TEACHERS EXIT DATA
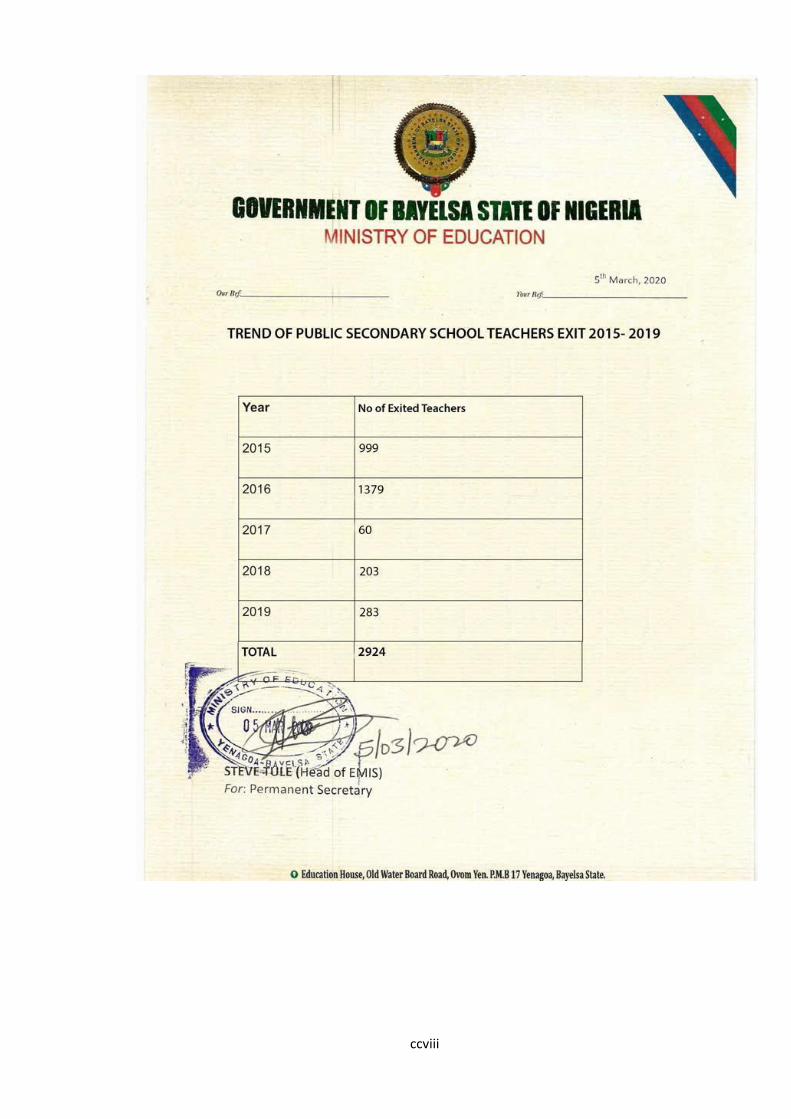
ccviii

ccix
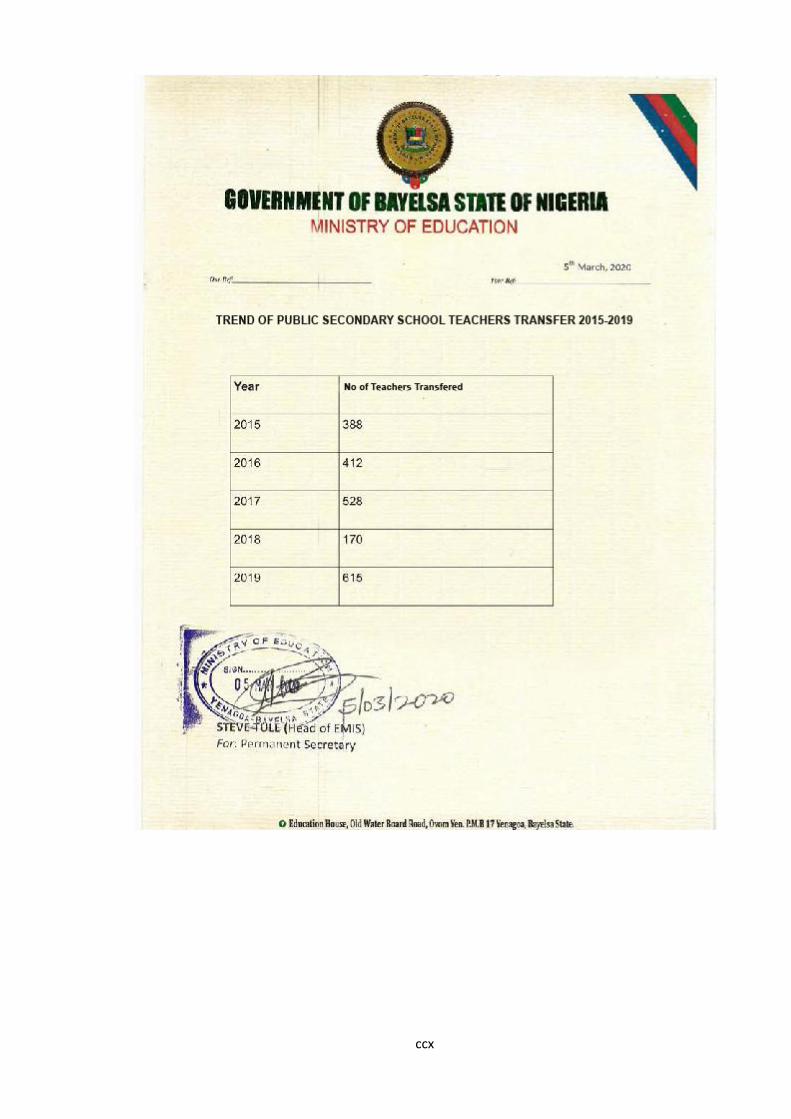
ccx
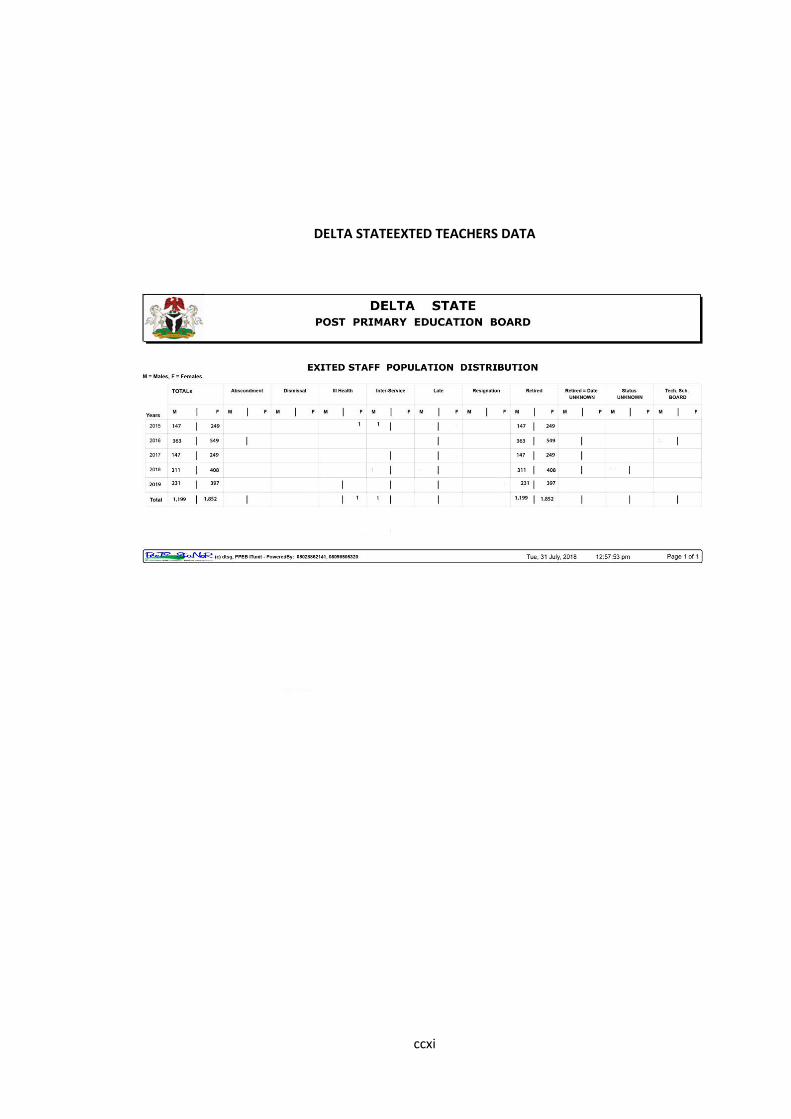
ccxi
DELTA STATEEXTED TEACHERS DATA

ccxii
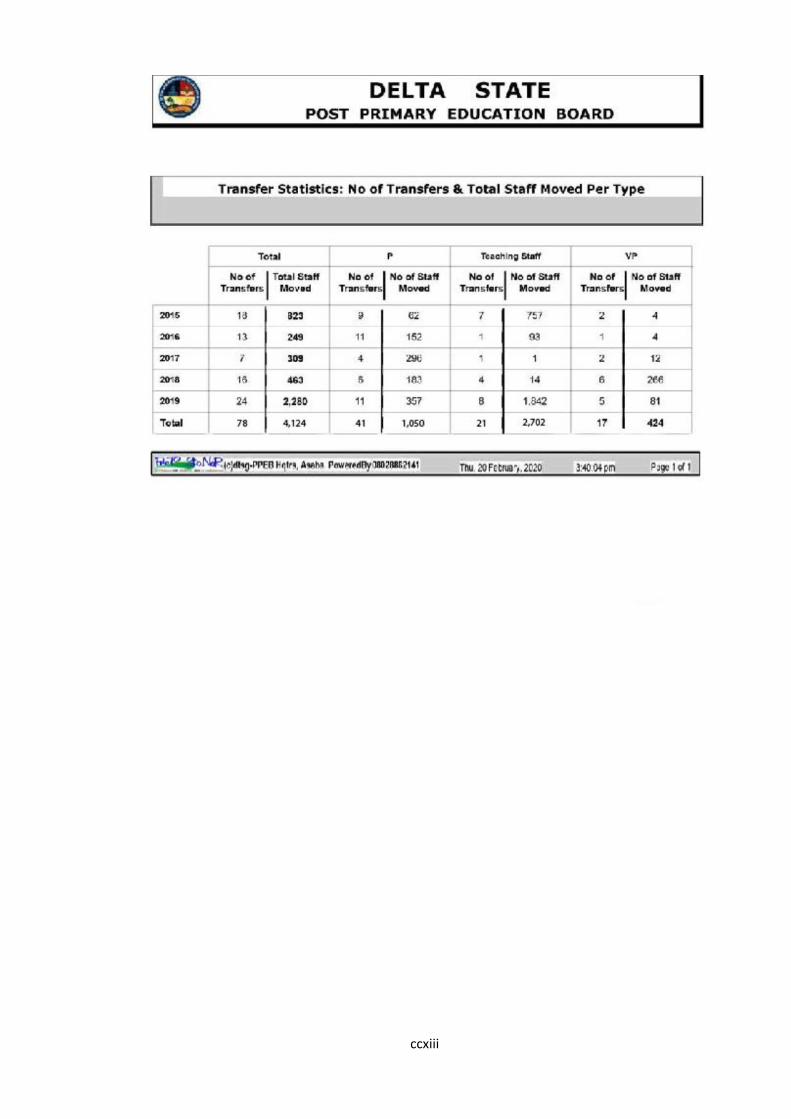
ccxiii
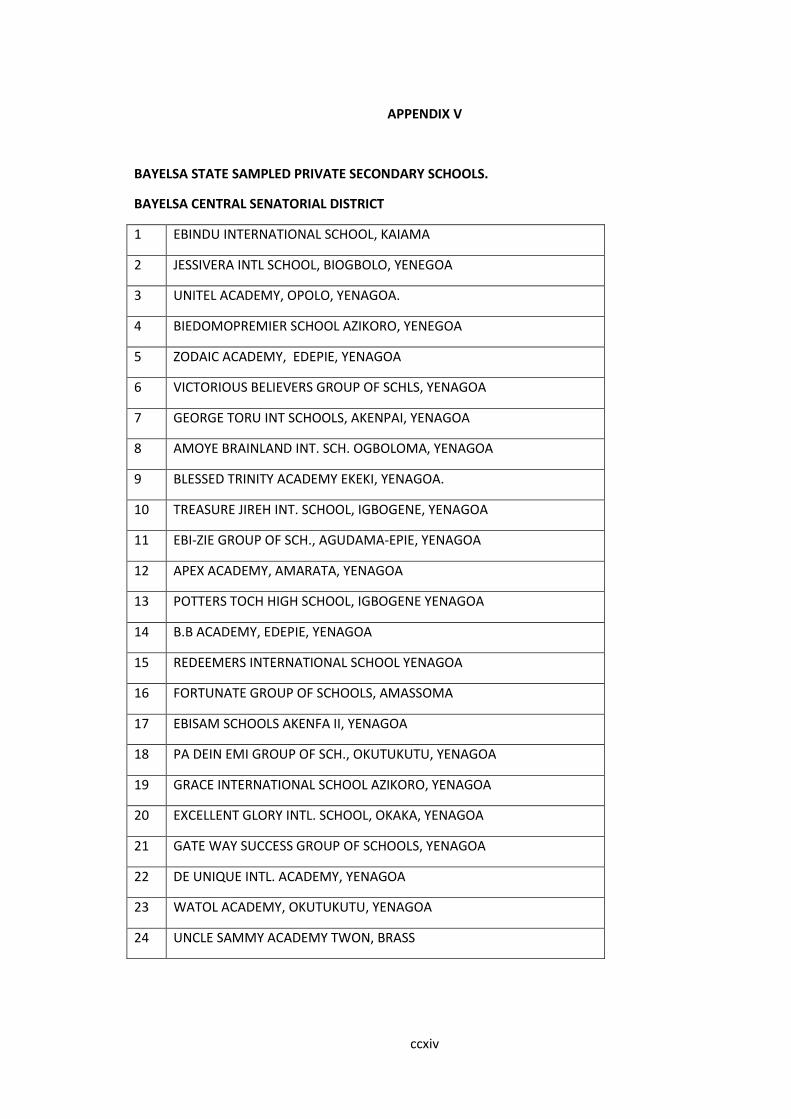
ccxiv
APPENDIX V
BAYELSA STATE SAMPLED PRIVATE SECONDARY SCHOOLS.
BAYELSA CENTRAL SENATORIAL DISTRICT
1 EBINDU INTERNATIONAL SCHOOL, KAIAMA
2 JESSIVERA INTL SCHOOL, BIOGBOLO, YENEGOA
3 UNITEL ACADEMY, OPOLO, YENAGOA.
4 BIEDOMOPREMIER SCHOOL AZIKORO, YENEGOA
5 ZODAIC ACADEMY, EDEPIE, YENAGOA
6 VICTORIOUS BELIEVERS GROUP OF SCHLS, YENAGOA
7 GEORGE TORU INT SCHOOLS, AKENPAI, YENAGOA
8 AMOYE BRAINLAND INT. SCH. OGBOLOMA, YENAGOA
9 BLESSED TRINITY ACADEMY EKEKI, YENAGOA.
10 TREASURE JIREH INT. SCHOOL, IGBOGENE, YENAGOA
11 EBI-ZIE GROUP OF SCH., AGUDAMA-EPIE, YENAGOA
12 APEX ACADEMY, AMARATA, YENAGOA
13 POTTERS TOCH HIGH SCHOOL, IGBOGENE YENAGOA
14 B.B ACADEMY, EDEPIE, YENAGOA
15 REDEEMERS INTERNATIONAL SCHOOL YENAGOA
16 FORTUNATE GROUP OF SCHOOLS, AMASSOMA
17 EBISAM SCHOOLS AKENFA II, YENAGOA
18 PA DEIN EMI GROUP OF SCH., OKUTUKUTU, YENAGOA
19 GRACE INTERNATIONAL SCHOOL AZIKORO, YENAGOA
20 EXCELLENT GLORY INTL. SCHOOL, OKAKA, YENAGOA
21 GATE WAY SUCCESS GROUP OF SCHOOLS, YENAGOA
22 DE UNIQUE INTL. ACADEMY, YENAGOA
23 WATOL ACADEMY, OKUTUKUTU, YENAGOA
24 UNCLE SAMMY ACADEMY TWON, BRASS
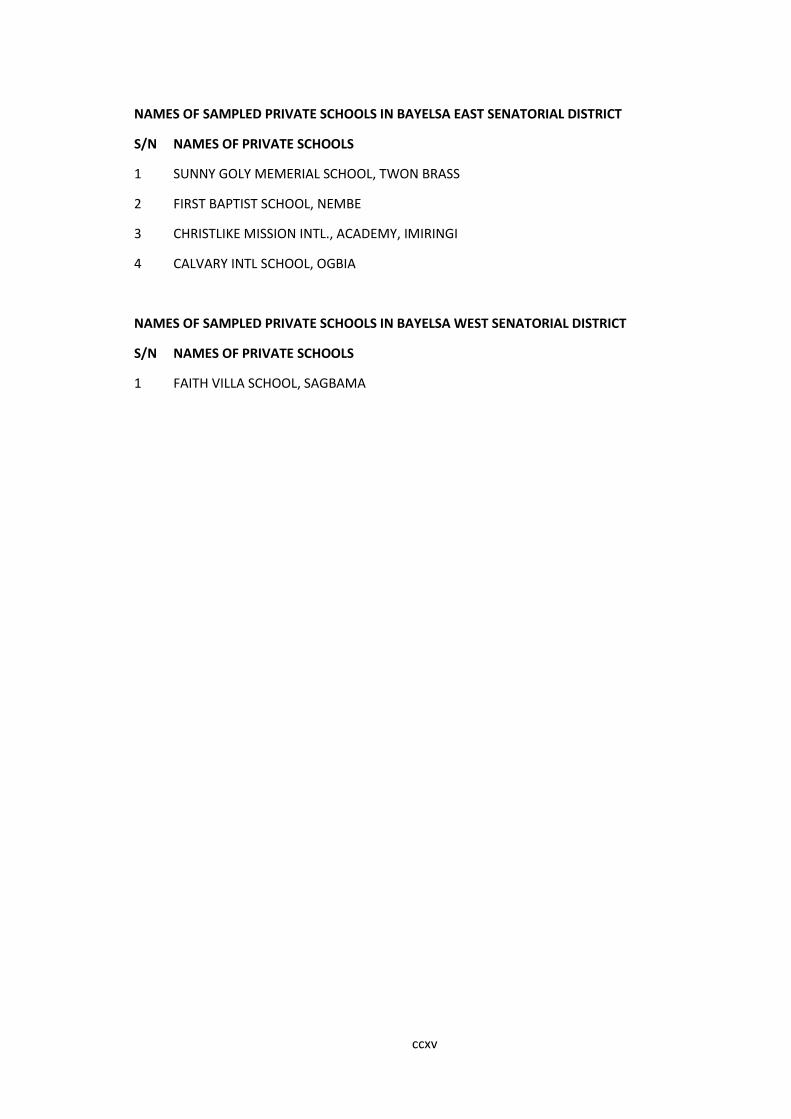
ccxv
NAMES OF SAMPLED PRIVATE SCHOOLS IN BAYELSA EAST SENATORIAL DISTRICT
S/N NAMES OF PRIVATE SCHOOLS
1 SUNNY GOLY MEMERIAL SCHOOL, TWON BRASS
2 FIRST BAPTIST SCHOOL, NEMBE
3 CHRISTLIKE MISSION INTL., ACADEMY, IMIRINGI
4 CALVARY INTL SCHOOL, OGBIA
NAMES OF SAMPLED PRIVATE SCHOOLS IN BAYELSA WEST SENATORIAL DISTRICT
S/N NAMES OF PRIVATE SCHOOLS
1 FAITH VILLA SCHOOL, SAGBAMA
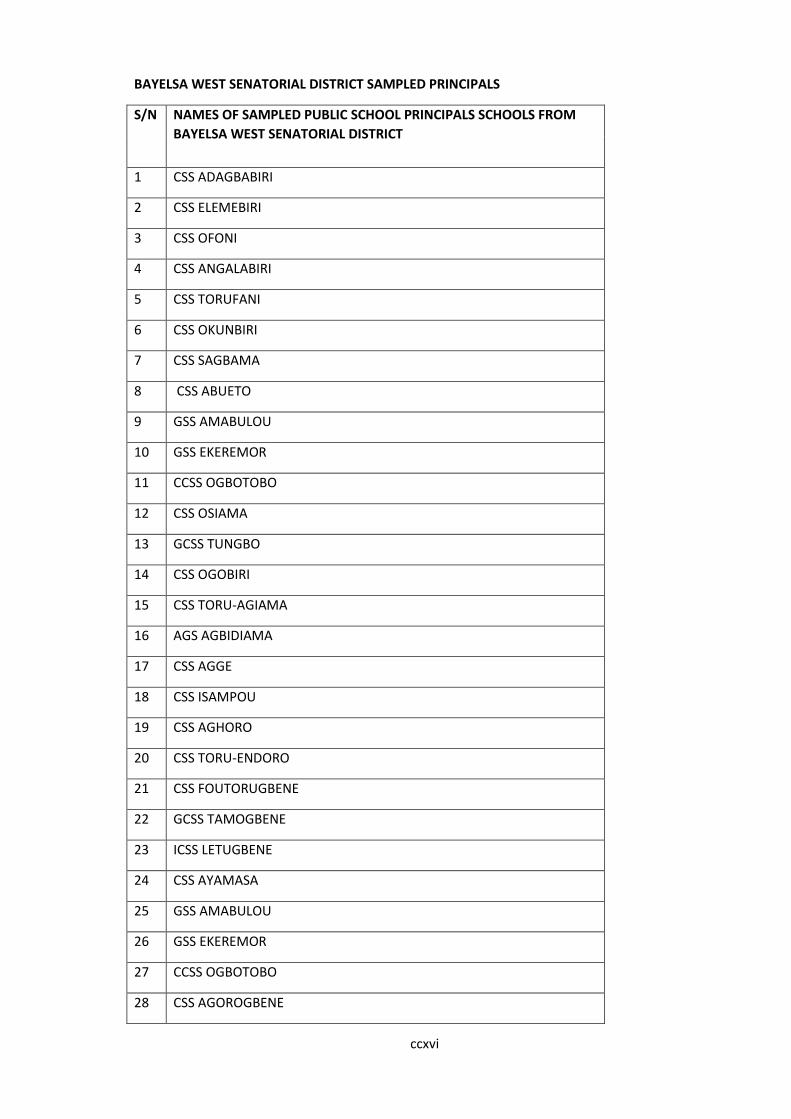
ccxvi
BAYELSA WEST SENATORIAL DISTRICT SAMPLED PRINCIPALS
S/N NAMES OF SAMPLED PUBLIC SCHOOL PRINCIPALS SCHOOLS FROM
BAYELSA WEST SENATORIAL DISTRICT
1 CSS ADAGBABIRI
2 CSS ELEMEBIRI
3 CSS OFONI
4 CSS ANGALABIRI
5 CSS TORUFANI
6 CSS OKUNBIRI
7 CSS SAGBAMA
8 CSS ABUETO
9 GSS AMABULOU
10 GSS EKEREMOR
11 CCSS OGBOTOBO
12 CSS OSIAMA
13 GCSS TUNGBO
14 CSS OGOBIRI
15 CSS TORU-AGIAMA
16 AGS AGBIDIAMA
17 CSS AGGE
18 CSS ISAMPOU
19 CSS AGHORO
20 CSS TORU-ENDORO
21 CSS FOUTORUGBENE
22 GCSS TAMOGBENE
23 ICSS LETUGBENE
24 CSS AYAMASA
25 GSS AMABULOU
26 GSS EKEREMOR
27 CCSS OGBOTOBO
28 CSS AGOROGBENE

ccxvii
29 MGS OGOBIRI
30 CSS KABEAMA
DELTA CENTRAL SENATORIAL DISTRICT
SAMPLED PRINCIPALS
S/N NAMES OF SAMPLED PUBLIC SCHOOL PRINCIPALS SCHOOLS FROM
DELTA CENTRAL SEN. DISTRICT
1 ALEGBON SEC. SCHOOL, EFFURUN
2 OGINIBO GRAMMAR SCHOOL OGINIBO
3 ARMY DAY SECONDARY SCHOOL II EFFURUN
4 OGBE SEC. SCHOOL EFFURUN
5 PETE SEC SCHOOL, OPETE
6 URHOBO MODEL COLLEGE, EFFURUN
7 ITEREGBI SEC SCHOOL ITEREGBI
8 UGBOMRO SEC SCHOOL UGBOMRO
9 EKPAN SEC SCHOOL EKPAN
10 OVWOR SECONDARY SCHOOL OVWOR
11 EKAKPAMRE GRAMMAR SCHOOL, EKAKPAMRE
12 EGBO SEC. SCHOOL EGBO-UHURHIE
13 GOVERNMENT SECONDARY SCHOOL, OGINIBO
14 OGBAVWENI GRAMMAR SCHOOL, USIEFFURUN
15 ORERE GRAMMAR SCHOOL, ORERE
16 OLOMU SECONDARY SCHOOL, OLOMU
17 OKPARE GRAMMAR SCHOOL OKPARE
18 UMOLO SECONDARY SCHOOL UMOLO-OLOMU
19 OTOKUTU SECONDARY SCHOOL OTOKUTU
20 AFIESERE SECONDARY SCHOOL, AFIESERE
21 IBRU COLLGE AGBARHA OTOR
ccxviii
22 GIRLS MODEL SECONDARY SCHOOL, EVWRENI
23 OFUOMA SECONDARY SCHOOL OFUOMA
24 EDHEKOTA SECONDARY SCHOOL EDJEKOTA
25 OHARISI SECONDARY SCHOOL UGHELLI
26 EMERAGHA SECONDARY SCHOOL EMERAGHA
27 EBOR GRAMMAR SCHOOL EBOH-OROGUN
28 AGADAMA SECONDARYV SCHOOL, AGADAMA
29 GOVERNMENT MODEL COLLEGE UGHELLI
30 AFIESERE SECONDARY SCHOOL, AFIESERE
31 IBRU COLLGE AGBARHA OTOR
32 IDJERE SECONDARY SCHOOL, JESSE
33 OGHAREFE SECONDARY SCHOOL, OGHARA-JUNCTION
34 OVADE SECONDARY SCHOOL OVADE
35 IGHOYOTA SEC SCHOOL, OBAKPA-MOSOGAR
36 IDJERE SECONDARY SCHOOL, JESSE
37 OGHAREFE SECONDARY SCHOOL, OGHARA-JUNCTION
38 OVADE SECONDARY SCHOOL OVADE
39 IGHOYOTA SEC SCHOOL, OBAKPA-MOSOGAR
40 OVWIAN SEC SCHOOL, OVWIAN
41 OGHIOR SECONDARYSCHOOL, OGHIOR
42 OKPAKA SECONDARY SCHOOL, OKPAKA
43 EGINI GRAMMAR SCHOOL, EGINI
44 EKETE SECONDARY SCHOOL, EKETE
45 OWHRODE MIXED SECONDARY SCHOOL, OWHRODE.
46 UJEVWU SEC SCHOOL, UJEVWU
47 OLERI SECONDARY SCHOOL, OLERI
48 OTOR-UDU SECONDARY SCHOOL, UDU
49 UBOGO SECONDARY SCHOOL UBOGO
50 ADEJE SEC SCHOOL ADEJE
51 ERADAJAYE SEC. SCHOOL ADAGBRASA UGONO
52 OHA SECONDARY SCHOOL OHA
ccxix
53 OSUBI SECONDARY SCHOOL, OSUBI
54 OREROKPE SEC, SCHOOL OREROKPE
55 AGHALOKPE MIXED SEC SCHOOL
56 ARAGBA SEC SCHOOL ARHAGBA.
57 OKENE MIXED SEC. SCHOOL, OKENE
58 ORHUE SEC. SCHOOL MEREJE
59 OVIRI-OKPE SECONDARY SCHOOL OVIRI-OKPE
60 EGBUDU MIXED SEC SCHOOL, EGBUDU-AKAH
61 OKWEGUMA SECONDARY SCHOOL OKWEGUMA
62 OGIEDI MIXED SEC SCOOL, OGIEDI ELUME
63 ALADJA SECONDARY SCHOOL, ALADJA
64 ORHUHWORUN HIGH SCHOOL ORHUWHORUN
65 ORODHE GRAMMAR SCHOOL SAPELE
66 UDURHIE SECONDARY SCHOOL UDURHIE
67 UGBENU SECONDARY SCHOOL
68 UGBEVWE SEC. SCHOOL
69 UKAVBE SECONDARY SCHOOL UKEVBE
70 EJERA SECONDARY SCHOOL EJERA
71 OSOGUO SECONDARY SCHOOL OSOGWO
72 ORHUWHORUN HIGH SCH.
73 OTOR-UDU SEC. SCH.
74 OVWIAN SEC. SCH.
75 OWHRODE MIXED SEC. SCH.
76 OKPAKA SEC. SCH.
77 UBOGO SEC. SCH.
78 UJEVWU SEC. SCH.
70 UGHELLI MIXED SEC SCH.
80 ADAGWE SEC. SCH.
81 EDJEKOTA SECONDARY SCHOOL EDJEKOTA
ccxx
DELTA NORTH SENATORIAL DISTRICT
S/N NAMES OF SAMPLED PUBLIC SCHOOL PRINCIPALS SCHOOLS IN DELTA
NORTH SENATORIAL DISTRICT
1 ABAH-UNOR SEC. SCHOOL, ABAH-UNOR
2 ADAIGBO SEC. SCH. ADAIGBO
3 ADONTE MIXED SEC. SCHOOL, ADIONTE
4 AGULU SEC SCHOOL ASABA
5 COMPREHENSIVE SEC. SCH.
6 EGBUDU MIXED SEC. SCH.
7 ODIANI MIXED SEC. SCH.
8 OKALETE SEC. SCH.
9 OLONA MIXED SEC. SCH.
10 ONICHA-UGBO GIRLS GRAM. SCH.
11 PILGRIM BAPTIST GRAM. SCH.
12 UBULUBU SECONADRY SCH.
13 AKUMAZI SEC. SCH.
14 COMPREHENSIVE HIGH SCH.
15 EDE GRAM. SCH.
16 EKWUOMA SEC. SCH.
17 ELUGU SEC. SCH.
18 ERUMU SEC.SCH.
19 IDUMUESAH SEC.SCH.
20 MBIRI MIXED SEC. SCH.
21 OTOLOKPO MIXED SEC. SCH.
22 OWA SEC. SCH.
23 OWA-ALERO COMMERCIAL SEC. SCH.
24 NGWU MIXED SEC. SCH.
25 NSHIAGU COLLEGENSHIAGU
26 NSUKWA GRAM. SCHOOL NSUKWA
27 OKITI MIXED SEC. SCHOOLMOKITI
ccxxi
28 ST. ANTHONYS MODEL SEC. SCH.
29 UBULU-UNOR MIXED SEC. SCH.
30 OLLOH MIXED SEC. SCH.
31 OTULU MIXED SEC. SCH.
32 AZAGBA MIXED SEC SCHOOL.
33 ABOR MIXED SEC. SCHOOL
34 AKUMAZI SEC. SCHOOL
35 COMPREHENSIVE HIGH SCH. IGBODO
36 OWA-ALIZOMOR MIXED SEC. SCH.
37 OWA-NTA SEC. SCH.
38 OWERRE OLUBOR SEC. SCH.
39 UMUNEDE MIXED SEC. SCH.
40 UTE-OGBEJE SEC. SCH.
41 UTE-OKPU SEC. SCH.
42 OWA-OFIE SEC. SCH.
43 OWA MODEL SEC. SCH.
44 EFEIZOMOR SEC. SCH.
45 ABORODE SEC. SCH.
46 OLIOGO GRAM, SEC SCH.
47 EBENDO SEC. SCH. EMU-EBENDO
48 UTUE SEC. SCHOOL UTUE
49 EMU SEC SCH0OOL, EMU-UNO
50 IBUSA GIRLS GRAM
51 EBU GRAM. SCH
52 BASIC SEC. SCH
53 OKWE SEC. SCH
54 AGULU SEC SCH, AGULU
55 ASHAMA COMP SEC. SCH.
56 IFITE SEC. SCH.
57 NSUKWA GRAM. SEC. SCH.
58 OLIOGO GRAMMAR SCHOOL OLIOGO
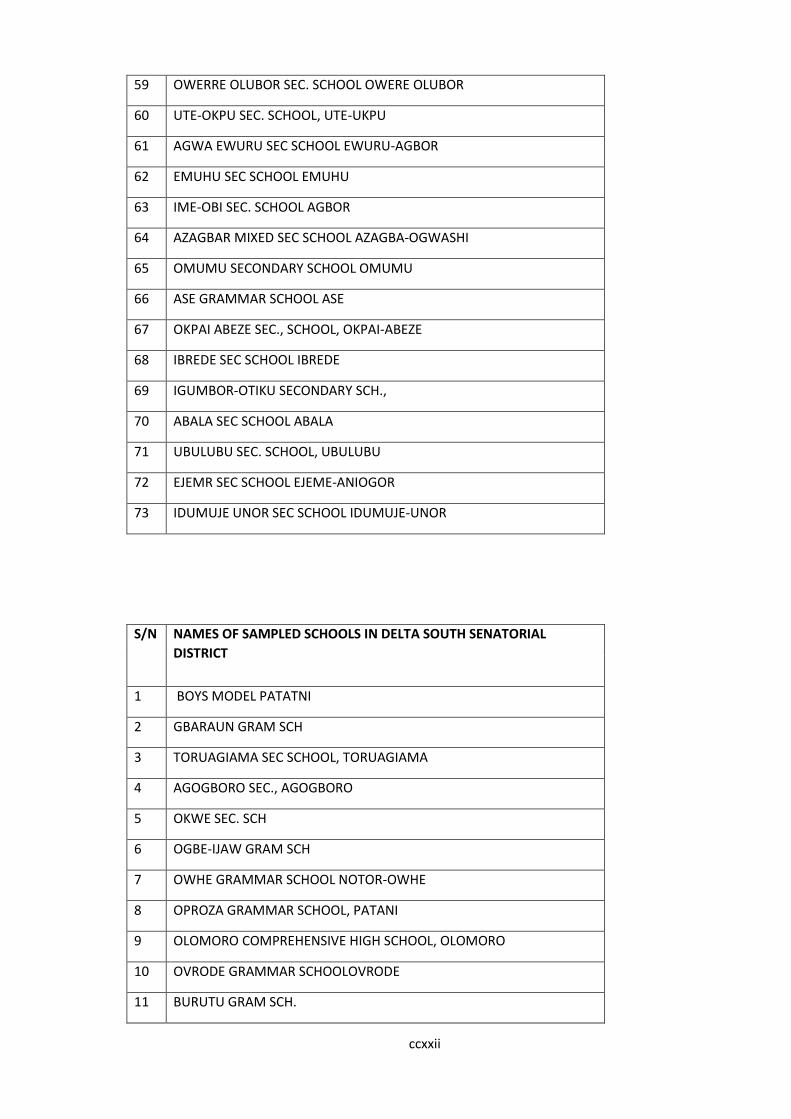
ccxxii
59 OWERRE OLUBOR SEC. SCHOOL OWERE OLUBOR
60 UTE-OKPU SEC. SCHOOL, UTE-UKPU
61 AGWA EWURU SEC SCHOOL EWURU-AGBOR
62 EMUHU SEC SCHOOL EMUHU
63 IME-OBI SEC. SCHOOL AGBOR
64 AZAGBAR MIXED SEC SCHOOL AZAGBA-OGWASHI
65 OMUMU SECONDARY SCHOOL OMUMU
66 ASE GRAMMAR SCHOOL ASE
67 OKPAI ABEZE SEC., SCHOOL, OKPAI-ABEZE
68 IBREDE SEC SCHOOL IBREDE
69 IGUMBOR-OTIKU SECONDARY SCH.,
70 ABALA SEC SCHOOL ABALA
71 UBULUBU SEC. SCHOOL, UBULUBU
72 EJEMR SEC SCHOOL EJEME-ANIOGOR
73 IDUMUJE UNOR SEC SCHOOL IDUMUJE-UNOR
S/N NAMES OF SAMPLED SCHOOLS IN DELTA SOUTH SENATORIAL
DISTRICT
1 BOYS MODEL PATATNI
2 GBARAUN GRAM SCH
3 TORUAGIAMA SEC SCHOOL, TORUAGIAMA
4 AGOGBORO SEC., AGOGBORO
5 OKWE SEC. SCH
6 OGBE-IJAW GRAM SCH
7 OWHE GRAMMAR SCHOOL NOTOR-OWHE
8 OPROZA GRAMMAR SCHOOL, PATANI
9 OLOMORO COMPREHENSIVE HIGH SCHOOL, OLOMORO
10 OVRODE GRAMMAR SCHOOLOVRODE
11 BURUTU GRAM SCH.
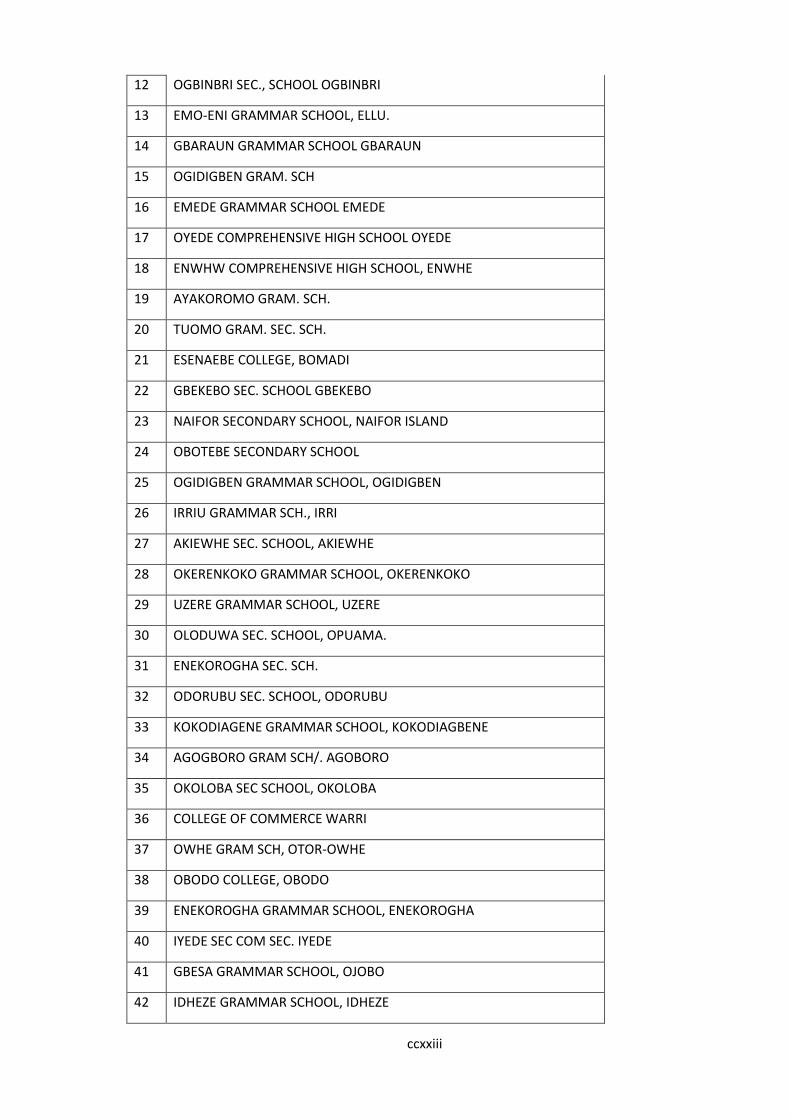
ccxxiii
12 OGBINBRI SEC., SCHOOL OGBINBRI
13 EMO-ENI GRAMMAR SCHOOL, ELLU.
14 GBARAUN GRAMMAR SCHOOL GBARAUN
15 OGIDIGBEN GRAM. SCH
16 EMEDE GRAMMAR SCHOOL EMEDE
17 OYEDE COMPREHENSIVE HIGH SCHOOL OYEDE
18 ENWHW COMPREHENSIVE HIGH SCHOOL, ENWHE
19 AYAKOROMO GRAM. SCH.
20 TUOMO GRAM. SEC. SCH.
21 ESENAEBE COLLEGE, BOMADI
22 GBEKEBO SEC. SCHOOL GBEKEBO
23 NAIFOR SECONDARY SCHOOL, NAIFOR ISLAND
24 OBOTEBE SECONDARY SCHOOL
25 OGIDIGBEN GRAMMAR SCHOOL, OGIDIGBEN
26 IRRIU GRAMMAR SCH., IRRI
27 AKIEWHE SEC. SCHOOL, AKIEWHE
28 OKERENKOKO GRAMMAR SCHOOL, OKERENKOKO
29 UZERE GRAMMAR SCHOOL, UZERE
30 OLODUWA SEC. SCHOOL, OPUAMA.
31 ENEKOROGHA SEC. SCH.
32 ODORUBU SEC. SCHOOL, ODORUBU
33 KOKODIAGENE GRAMMAR SCHOOL, KOKODIAGBENE
34 AGOGBORO GRAM SCH/. AGOBORO
35 OKOLOBA SEC SCHOOL, OKOLOBA
36 COLLEGE OF COMMERCE WARRI
37 OWHE GRAM SCH, OTOR-OWHE
38 OBODO COLLEGE, OBODO
39 ENEKOROGHA GRAMMAR SCHOOL, ENEKOROGHA
40 IYEDE SEC COM SEC. IYEDE
41 GBESA GRAMMAR SCHOOL, OJOBO
42 IDHEZE GRAMMAR SCHOOL, IDHEZE
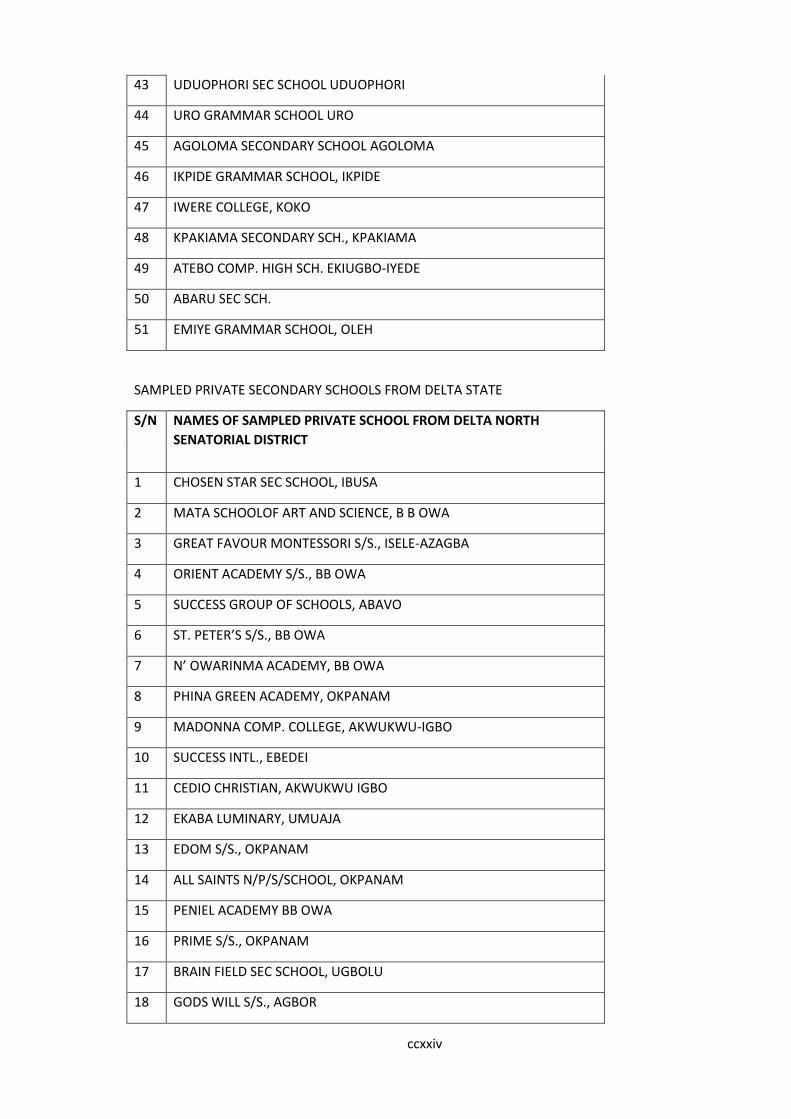
ccxxiv
43 UDUOPHORI SEC SCHOOL UDUOPHORI
44 URO GRAMMAR SCHOOL URO
45 AGOLOMA SECONDARY SCHOOL AGOLOMA
46 IKPIDE GRAMMAR SCHOOL, IKPIDE
47 IWERE COLLEGE, KOKO
48 KPAKIAMA SECONDARY SCH., KPAKIAMA
49 ATEBO COMP. HIGH SCH. EKIUGBO-IYEDE
50 ABARU SEC SCH.
51 EMIYE GRAMMAR SCHOOL, OLEH
SAMPLED PRIVATE SECONDARY SCHOOLS FROM DELTA STATE
S/N NAMES OF SAMPLED PRIVATE SCHOOL FROM DELTA NORTH
SENATORIAL DISTRICT
1 CHOSEN STAR SEC SCHOOL, IBUSA
2 MATA SCHOOLOF ART AND SCIENCE, B B OWA
3 GREAT FAVOUR MONTESSORI S/S., ISELE-AZAGBA
4 ORIENT ACADEMY S/S., BB OWA
5 SUCCESS GROUP OF SCHOOLS, ABAVO
6 ST. PETER’S S/S., BB OWA
7 N’ OWARINMA ACADEMY, BB OWA
8 PHINA GREEN ACADEMY, OKPANAM
9 MADONNA COMP. COLLEGE, AKWUKWU-IGBO
10 SUCCESS INTL., EBEDEI
11 CEDIO CHRISTIAN, AKWUKWU IGBO
12 EKABA LUMINARY, UMUAJA
13 EDOM S/S., OKPANAM
14 ALL SAINTS N/P/S/SCHOOL, OKPANAM
15 PENIEL ACADEMY BB OWA
16 PRIME S/S., OKPANAM
17 BRAIN FIELD SEC SCHOOL, UGBOLU
18 GODS WILL S/S., AGBOR
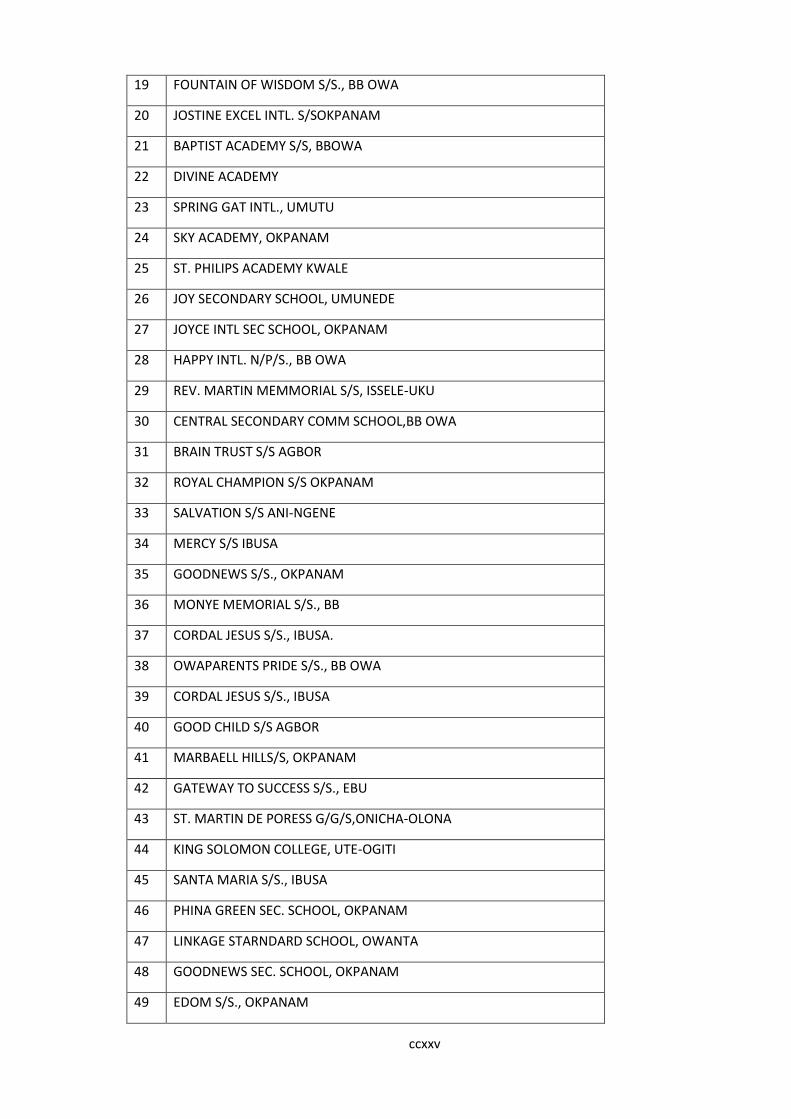
ccxxv
19 FOUNTAIN OF WISDOM S/S., BB OWA
20 JOSTINE EXCEL INTL. S/SOKPANAM
21 BAPTIST ACADEMY S/S, BBOWA
22 DIVINE ACADEMY
23 SPRING GAT INTL., UMUTU
24 SKY ACADEMY, OKPANAM
25 ST. PHILIPS ACADEMY KWALE
26 JOY SECONDARY SCHOOL, UMUNEDE
27 JOYCE INTL SEC SCHOOL, OKPANAM
28 HAPPY INTL. N/P/S., BB OWA
29 REV. MARTIN MEMMORIAL S/S, ISSELE-UKU
30 CENTRAL SECONDARY COMM SCHOOL,BB OWA
31 BRAIN TRUST S/S AGBOR
32 ROYAL CHAMPION S/S OKPANAM
33 SALVATION S/S ANI-NGENE
34 MERCY S/S IBUSA
35 GOODNEWS S/S., OKPANAM
36 MONYE MEMORIAL S/S., BB
37 CORDAL JESUS S/S., IBUSA.
38 OWAPARENTS PRIDE S/S., BB OWA
39 CORDAL JESUS S/S., IBUSA
40 GOOD CHILD S/S AGBOR
41 MARBAELL HILLS/S, OKPANAM
42 GATEWAY TO SUCCESS S/S., EBU
43 ST. MARTIN DE PORESS G/G/S,ONICHA-OLONA
44 KING SOLOMON COLLEGE, UTE-OGITI
45 SANTA MARIA S/S., IBUSA
46 PHINA GREEN SEC. SCHOOL, OKPANAM
47 LINKAGE STARNDARD SCHOOL, OWANTA
48 GOODNEWS SEC. SCHOOL, OKPANAM
49 EDOM S/S., OKPANAM
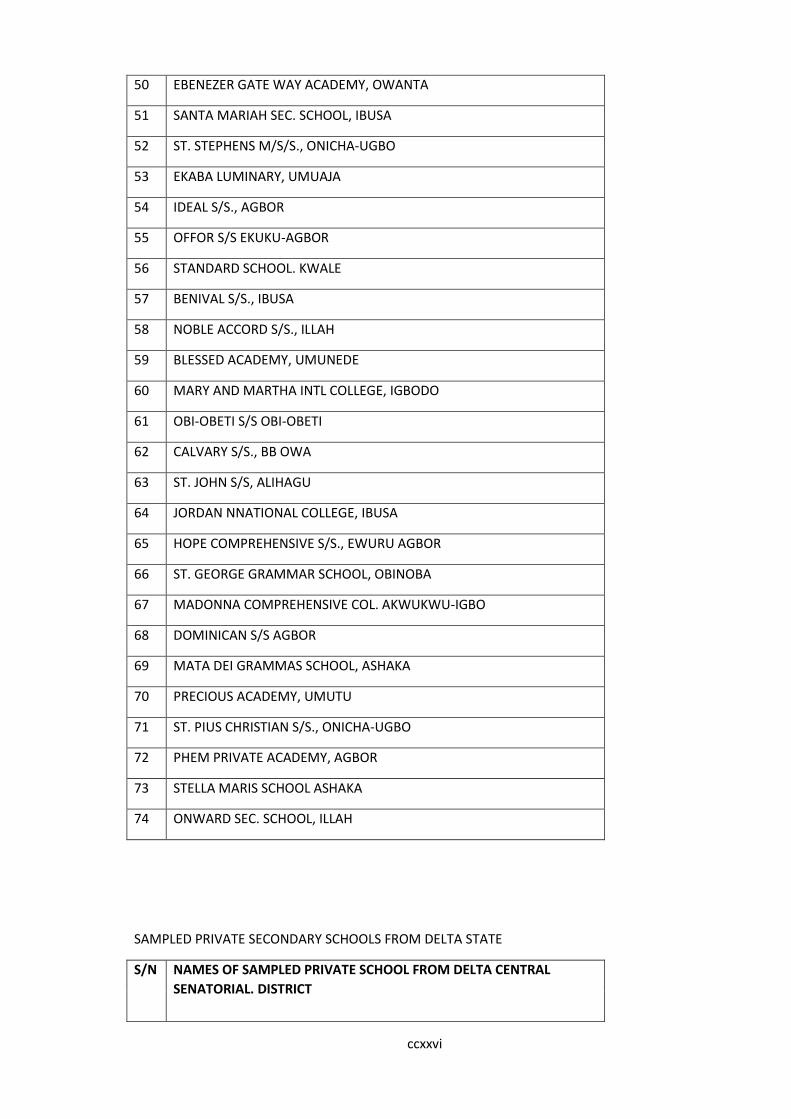
ccxxvi
50 EBENEZER GATE WAY ACADEMY, OWANTA
51 SANTA MARIAH SEC. SCHOOL, IBUSA
52 ST. STEPHENS M/S/S., ONICHA-UGBO
53 EKABA LUMINARY, UMUAJA
54 IDEAL S/S., AGBOR
55 OFFOR S/S EKUKU-AGBOR
56 STANDARD SCHOOL. KWALE
57 BENIVAL S/S., IBUSA
58 NOBLE ACCORD S/S., ILLAH
59 BLESSED ACADEMY, UMUNEDE
60 MARY AND MARTHA INTL COLLEGE, IGBODO
61 OBI-OBETI S/S OBI-OBETI
62 CALVARY S/S., BB OWA
63 ST. JOHN S/S, ALIHAGU
64 JORDAN NNATIONAL COLLEGE, IBUSA
65 HOPE COMPREHENSIVE S/S., EWURU AGBOR
66 ST. GEORGE GRAMMAR SCHOOL, OBINOBA
67 MADONNA COMPREHENSIVE COL. AKWUKWU-IGBO
68 DOMINICAN S/S AGBOR
69 MATA DEI GRAMMAS SCHOOL, ASHAKA
70 PRECIOUS ACADEMY, UMUTU
71 ST. PIUS CHRISTIAN S/S., ONICHA-UGBO
72 PHEM PRIVATE ACADEMY, AGBOR
73 STELLA MARIS SCHOOL ASHAKA
74 ONWARD SEC. SCHOOL, ILLAH
SAMPLED PRIVATE SECONDARY SCHOOLS FROM DELTA STATE
S/N NAMES OF SAMPLED PRIVATE SCHOOL FROM DELTA CENTRAL
SENATORIAL. DISTRICT

ccxxvii
1 GLORY LAND SEC. SCHOOL EFFURUN
2 PROMINENT SECONDARY SCHOOL,OVWIAN
3 SUPREME ACADEMY OSUBI
4 REAGENT SEC SCHOOL, JEDDO
5 PETERA ACADEMY, UGHELLI
6 HILLROCK GROUP OF SCHOOLS DSC
7 TECO SECONDARY SCHOOL, OSUBI
8 JONES SEC SCHOOL, UGHOTON
9 ST. AMBROSE COLLEGE USIEFFRUN
10 WEST VIEW S/S., ORHUWHORUN
11 PLAYPEN SEC. SCHOOL, OKUOKOKO
12 SHELTERING ARMS COLLEGE ORHUWHORUN
13 EMMANUEL COLLEGE OTOKUTU
14 DELIGHT ACADEMY, ORHUWHORUN
15 AMAZING GRACE SEC. SCHOOL ALADJA
16 ST. BENEDICT SCHOOL, ORHUWHORUN
17 RAPID GROWTH ACADEMU, UGHELLI
18 DEEPER LIFE HIGH SCHOOL OPETE
19 JET BOMBER ACADEMY, ORHUWHORUN
20 DOMINIUN MODEL SECONDARY SCHOOL, DSC
21 CLIMAX INTL S/S UGHELLI
22 SPRING TIDE SEC. SCHOOL OREROKPE
23 KEY TO LIFE SEC. SCHOOL, OYEDE.
24 CHRIST THE REDEEMER S/S., ALADJA
25 GRACEVILLE ACADEMY, OTOVWODO
26 HOSSANA COMPREHENSIVE S/S ALADJA
27 GREAT ACHIEVERS SCHOOL, UGHELLI
28 TOP GRACE SCHOOLS , UGHELLI
29 STEP FORWARD INTL. SCHOOL, ORHUWHORUN
30 VICTORY ACADEMY EMEVOR
31 LLYOD SEC. SCHOOL, OVWIAN
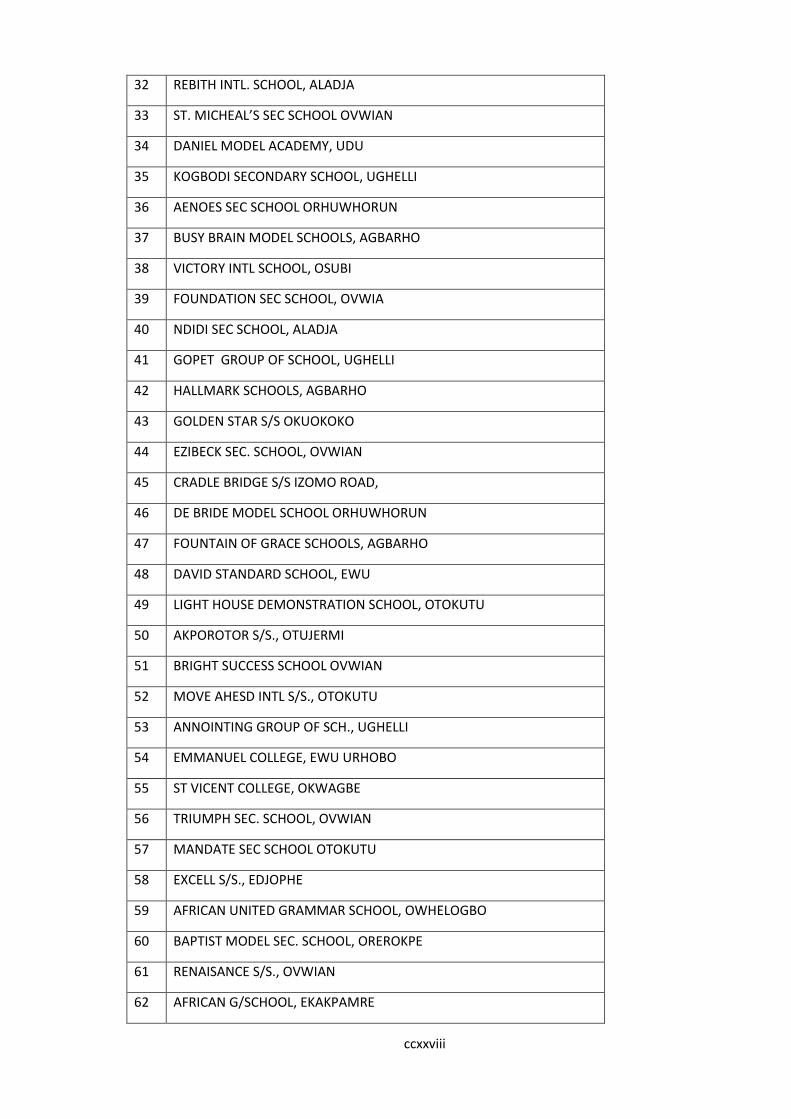
ccxxviii
32 REBITH INTL. SCHOOL, ALADJA
33 ST. MICHEAL’S SEC SCHOOL OVWIAN
34 DANIEL MODEL ACADEMY, UDU
35 KOGBODI SECONDARY SCHOOL, UGHELLI
36 AENOES SEC SCHOOL ORHUWHORUN
37 BUSY BRAIN MODEL SCHOOLS, AGBARHO
38 VICTORY INTL SCHOOL, OSUBI
39 FOUNDATION SEC SCHOOL, OVWIA
40 NDIDI SEC SCHOOL, ALADJA
41 GOPET GROUP OF SCHOOL, UGHELLI
42 HALLMARK SCHOOLS, AGBARHO
43 GOLDEN STAR S/S OKUOKOKO
44 EZIBECK SEC. SCHOOL, OVWIAN
45 CRADLE BRIDGE S/S IZOMO ROAD,
46 DE BRIDE MODEL SCHOOL ORHUWHORUN
47 FOUNTAIN OF GRACE SCHOOLS, AGBARHO
48 DAVID STANDARD SCHOOL, EWU
49 LIGHT HOUSE DEMONSTRATION SCHOOL, OTOKUTU
50 AKPOROTOR S/S., OTUJERMI
51 BRIGHT SUCCESS SCHOOL OVWIAN
52 MOVE AHESD INTL S/S., OTOKUTU
53 ANNOINTING GROUP OF SCH., UGHELLI
54 EMMANUEL COLLEGE, EWU URHOBO
55 ST VICENT COLLEGE, OKWAGBE
56 TRIUMPH SEC. SCHOOL, OVWIAN
57 MANDATE SEC SCHOOL OTOKUTU
58 EXCELL S/S., EDJOPHE
59 AFRICAN UNITED GRAMMAR SCHOOL, OWHELOGBO
60 BAPTIST MODEL SEC. SCHOOL, OREROKPE
61 RENAISANCE S/S., OVWIAN
62 AFRICAN G/SCHOOL, EKAKPAMRE
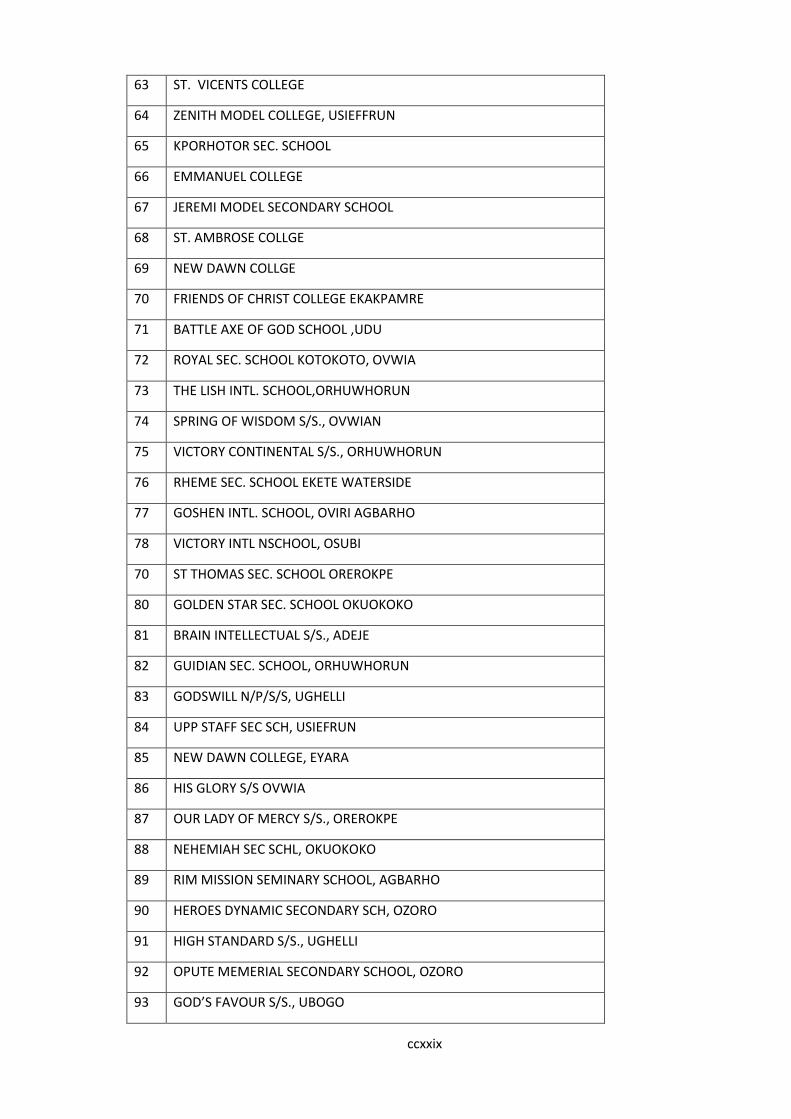
ccxxix
63 ST. VICENTS COLLEGE
64 ZENITH MODEL COLLEGE, USIEFFRUN
65 KPORHOTOR SEC. SCHOOL
66 EMMANUEL COLLEGE
67 JEREMI MODEL SECONDARY SCHOOL
68 ST. AMBROSE COLLGE
69 NEW DAWN COLLGE
70 FRIENDS OF CHRIST COLLEGE EKAKPAMRE
71 BATTLE AXE OF GOD SCHOOL ,UDU
72 ROYAL SEC. SCHOOL KOTOKOTO, OVWIA
73 THE LISH INTL. SCHOOL,ORHUWHORUN
74 SPRING OF WISDOM S/S., OVWIAN
75 VICTORY CONTINENTAL S/S., ORHUWHORUN
76 RHEME SEC. SCHOOL EKETE WATERSIDE
77 GOSHEN INTL. SCHOOL, OVIRI AGBARHO
78 VICTORY INTL NSCHOOL, OSUBI
70 ST THOMAS SEC. SCHOOL OREROKPE
80 GOLDEN STAR SEC. SCHOOL OKUOKOKO
81 BRAIN INTELLECTUAL S/S., ADEJE
82 GUIDIAN SEC. SCHOOL, ORHUWHORUN
83 GODSWILL N/P/S/S, UGHELLI
84 UPP STAFF SEC SCH, USIEFRUN
85 NEW DAWN COLLEGE, EYARA
86 HIS GLORY S/S OVWIA
87 OUR LADY OF MERCY S/S., OREROKPE
88 NEHEMIAH SEC SCHL, OKUOKOKO
89 RIM MISSION SEMINARY SCHOOL, AGBARHO
90 HEROES DYNAMIC SECONDARY SCH, OZORO
91 HIGH STANDARD S/S., UGHELLI
92 OPUTE MEMERIAL SECONDARY SCHOOL, OZORO
93 GOD’S FAVOUR S/S., UBOGO
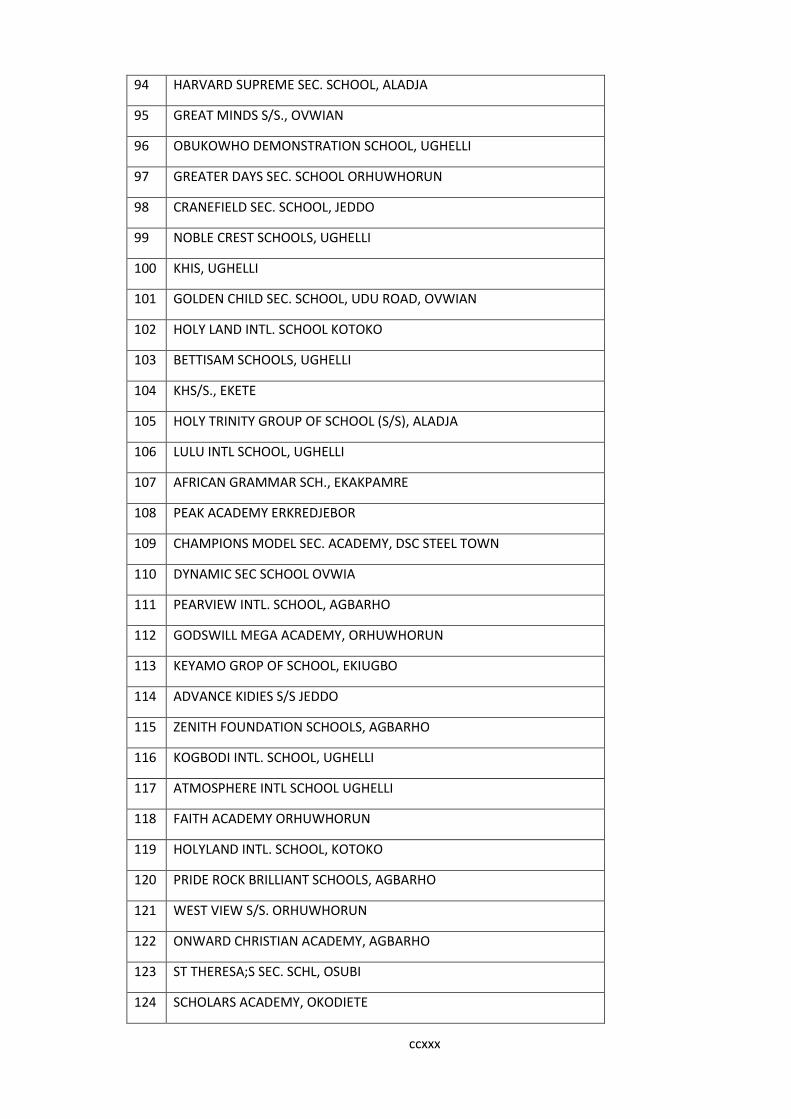
ccxxx
94 HARVARD SUPREME SEC. SCHOOL, ALADJA
95 GREAT MINDS S/S., OVWIAN
96 OBUKOWHO DEMONSTRATION SCHOOL, UGHELLI
97 GREATER DAYS SEC. SCHOOL ORHUWHORUN
98 CRANEFIELD SEC. SCHOOL, JEDDO
99 NOBLE CREST SCHOOLS, UGHELLI
100 KHIS, UGHELLI
101 GOLDEN CHILD SEC. SCHOOL, UDU ROAD, OVWIAN
102 HOLY LAND INTL. SCHOOL KOTOKO
103 BETTISAM SCHOOLS, UGHELLI
104 KHS/S., EKETE
105 HOLY TRINITY GROUP OF SCHOOL (S/S), ALADJA
106 LULU INTL SCHOOL, UGHELLI
107 AFRICAN GRAMMAR SCH., EKAKPAMRE
108 PEAK ACADEMY ERKREDJEBOR
109 CHAMPIONS MODEL SEC. ACADEMY, DSC STEEL TOWN
110 DYNAMIC SEC SCHOOL OVWIA
111 PEARVIEW INTL. SCHOOL, AGBARHO
112 GODSWILL MEGA ACADEMY, ORHUWHORUN
113 KEYAMO GROP OF SCHOOL, EKIUGBO
114 ADVANCE KIDIES S/S JEDDO
115 ZENITH FOUNDATION SCHOOLS, AGBARHO
116 KOGBODI INTL. SCHOOL, UGHELLI
117 ATMOSPHERE INTL SCHOOL UGHELLI
118 FAITH ACADEMY ORHUWHORUN
119 HOLYLAND INTL. SCHOOL, KOTOKO
120 PRIDE ROCK BRILLIANT SCHOOLS, AGBARHO
121 WEST VIEW S/S. ORHUWHORUN
122 ONWARD CHRISTIAN ACADEMY, AGBARHO
123 ST THERESA;S SEC. SCHL, OSUBI
124 SCHOLARS ACADEMY, OKODIETE
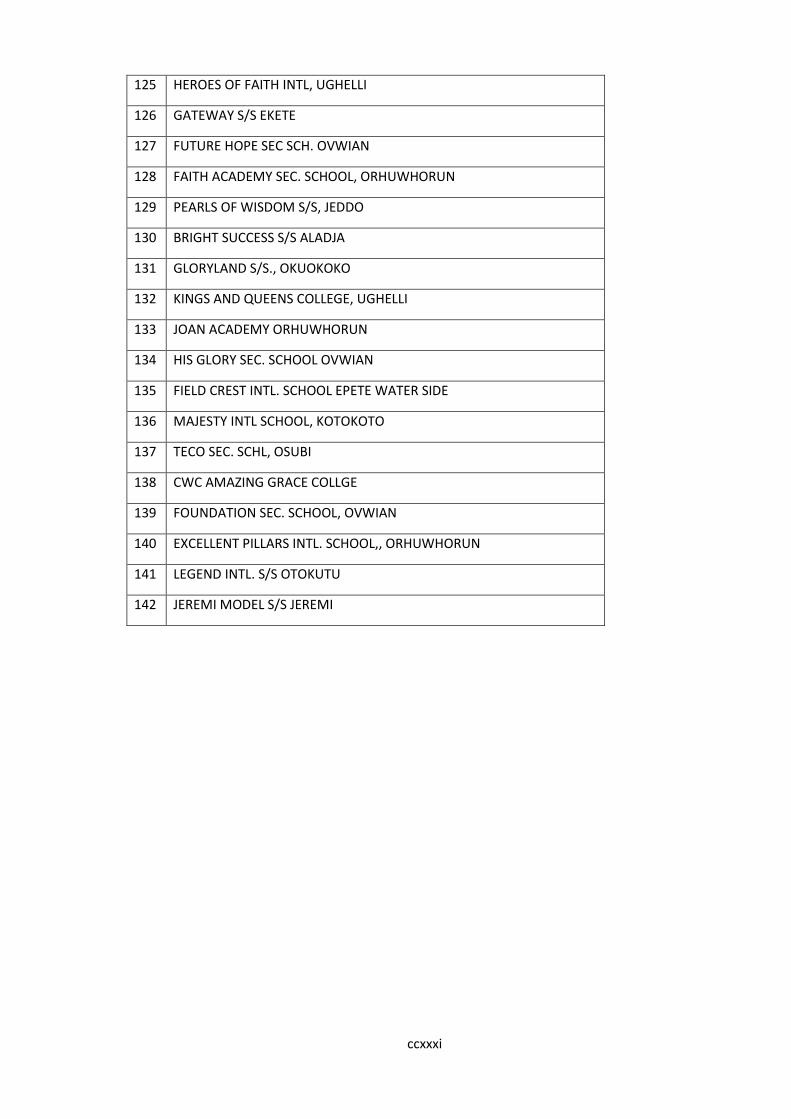
ccxxxi
125 HEROES OF FAITH INTL, UGHELLI
126 GATEWAY S/S EKETE
127 FUTURE HOPE SEC SCH. OVWIAN
128 FAITH ACADEMY SEC. SCHOOL, ORHUWHORUN
129 PEARLS OF WISDOM S/S, JEDDO
130 BRIGHT SUCCESS S/S ALADJA
131 GLORYLAND S/S., OKUOKOKO
132 KINGS AND QUEENS COLLEGE, UGHELLI
133 JOAN ACADEMY ORHUWHORUN
134 HIS GLORY SEC. SCHOOL OVWIAN
135 FIELD CREST INTL. SCHOOL EPETE WATER SIDE
136 MAJESTY INTL SCHOOL, KOTOKOTO
137 TECO SEC. SCHL, OSUBI
138 CWC AMAZING GRACE COLLGE
139 FOUNDATION SEC. SCHOOL, OVWIAN
140 EXCELLENT PILLARS INTL. SCHOOL,, ORHUWHORUN
141 LEGEND INTL. S/S OTOKUTU
142 JEREMI MODEL S/S JEREMI
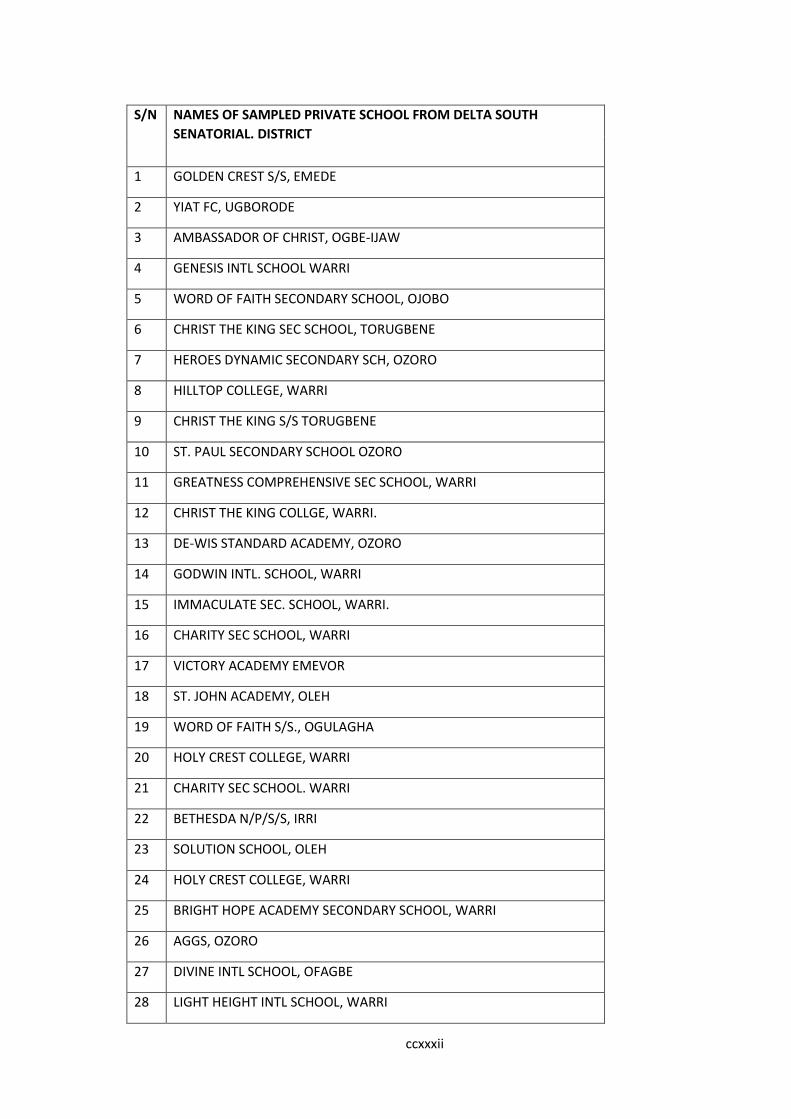
ccxxxii
S/N NAMES OF SAMPLED PRIVATE SCHOOL FROM DELTA SOUTH
SENATORIAL. DISTRICT
1 GOLDEN CREST S/S, EMEDE
2 YIAT FC, UGBORODE
3 AMBASSADOR OF CHRIST, OGBE-IJAW
4 GENESIS INTL SCHOOL WARRI
5 WORD OF FAITH SECONDARY SCHOOL, OJOBO
6 CHRIST THE KING SEC SCHOOL, TORUGBENE
7 HEROES DYNAMIC SECONDARY SCH, OZORO
8 HILLTOP COLLEGE, WARRI
9 CHRIST THE KING S/S TORUGBENE
10 ST. PAUL SECONDARY SCHOOL OZORO
11 GREATNESS COMPREHENSIVE SEC SCHOOL, WARRI
12 CHRIST THE KING COLLGE, WARRI.
13 DE-WIS STANDARD ACADEMY, OZORO
14 GODWIN INTL. SCHOOL, WARRI
15 IMMACULATE SEC. SCHOOL, WARRI.
16 CHARITY SEC SCHOOL, WARRI
17 VICTORY ACADEMY EMEVOR
18 ST. JOHN ACADEMY, OLEH
19 WORD OF FAITH S/S., OGULAGHA
20 HOLY CREST COLLEGE, WARRI
21 CHARITY SEC SCHOOL. WARRI
22 BETHESDA N/P/S/S, IRRI
23 SOLUTION SCHOOL, OLEH
24 HOLY CREST COLLEGE, WARRI
25 BRIGHT HOPE ACADEMY SECONDARY SCHOOL, WARRI
26 AGGS, OZORO
27 DIVINE INTL SCHOOL, OFAGBE
28 LIGHT HEIGHT INTL SCHOOL, WARRI
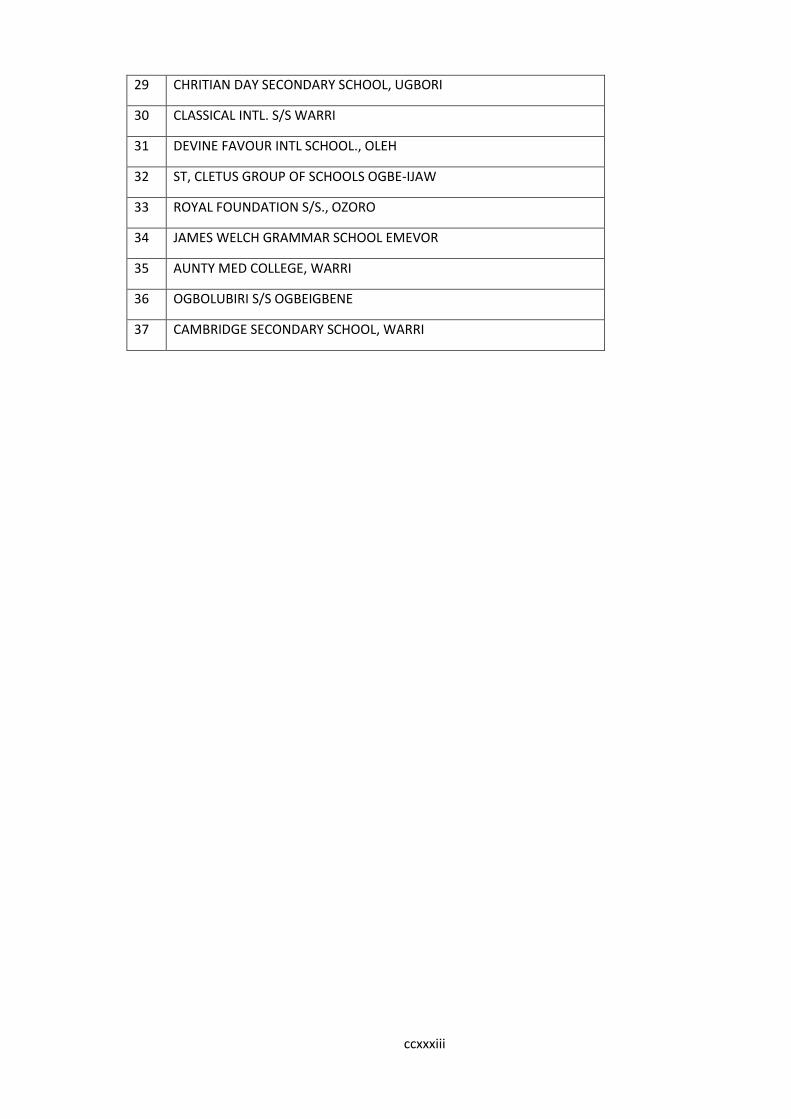
ccxxxiii
29 CHRITIAN DAY SECONDARY SCHOOL, UGBORI
30 CLASSICAL INTL. S/S WARRI
31 DEVINE FAVOUR INTL SCHOOL., OLEH
32 ST, CLETUS GROUP OF SCHOOLS OGBE-IJAW
33 ROYAL FOUNDATION S/S., OZORO
34 JAMES WELCH GRAMMAR SCHOOL EMEVOR
35 AUNTY MED COLLEGE, WARRI
36 OGBOLUBIRI S/S OGBEIGBENE
37 CAMBRIDGE SECONDARY SCHOOL, WARRI
Related Documents