ORIGINAL PAPER Relationship Between Petrographic Characteristics and the Engineering Properties of Jurassic Sandstones, Hamedan, Iran M. Heidari • A. A. Momeni • B. Rafiei • S. Khodabakhsh • M. Torabi-Kaveh Received: 16 June 2012 / Accepted: 12 November 2012 / Published online: 4 December 2012 Ó Springer-Verlag Wien 2012 Abstract To study the relationship between engineering properties and petrographic characteristics, 20 rock sam- ples were collected from Jurassic sandstones in the Hamedan region, western Iran. The specimens were tested to determine uniaxial compressive strength, point load strength index, tangent modulus, porosity, and dry and saturated unit weights. Samples were also subjected to petrographic examination, which included the observation of 11 parameters and modal analysis. Based on the results of a statistical analysis, polynomial prediction equations were developed to estimate physical and mechanical properties from petrographic characteristics. The results show that textural characteristics are more important than mineral compositions for predicting engineering charac- teristics. The packing density, packing proximity and grain shape are the petrographic properties that significantly affect the engineering properties of samples. Multivariate linear regression analysis was performed, employing four steps comprising various combinations of petrographic characteristics for each engineering parameter. The optimal equation, along with the relevant combination of petro- graphic characteristics for estimating the engineering properties of the rock samples is proposed. Keywords Jurassic sandstone Petrographic characteristics Texture Iran 1 Introduction Sandstones include a wide range of rock types with variable mineralogy, petrographic characteristics and mechanical properties. Large variations in the physical and mechanical properties of sandstones have been attributed to variations in petrographic characteristics (Bell 1978a; Howarth and Rowlands 1986; Shakoor and Bonelli 1991). Thus, in addition to the values of engineering indexes, petrographic characteristics that are known to affect physical and mechanical properties can be used to predict the engineer- ing properties of sandstones. These properties include grain size and shape, degree of interlocking, types of contacts, packing density, packing proximity, mineral composition and amount and type of cement and matrix. These proper- ties can be readily measured in the laboratory and are commonly determined from analyses of thin sections. Jurassic sandstone is widely exposed in the Hamedan region of western Iran, where they are a source of barrow material. According to the definition of Pettijohn et al. (1987), most of the sandstones in the Hamedan region are sublitharenites, quartzarenites and subarkoses, making them suitable for geomechanical studies. The petrographic parameters studied here include: (1) grain and matrix mineral composition; (2) degree of packing of sandstone, which can be expressed in terms of packing density (Pd), packing proximity (Pp), porosity (n), dry unit weight (c d ) and satu- rated unit weight (c sat ); and (3) the types of grain contacts. In addition to linear regression, multivariate linear regression analyses were performed to obtain best-fit curves between petrographic parameters and engineering properties. Empirical predictive models, based on multivariate statisti- cal analysis and thin section data, correlated strongly with physical and mechanical properties, and, thus, can be used to estimate the engineering properties of the sandstones. M. Heidari (&) B. Rafiei S. Khodabakhsh M. Torabi-Kaveh Department of Geology, Faculty of Sciences, Bu-Ali Sina University, Mahdieh Ave., 65175-38695 Hamedan, Iran e-mail: [email protected] A. A. Momeni Department of Geology, Shahrood University of Technology, Shahrood, Iran 123 Rock Mech Rock Eng (2013) 46:1091–1101 DOI 10.1007/s00603-012-0333-z

Welcome message from author
This document is posted to help you gain knowledge. Please leave a comment to let me know what you think about it! Share it to your friends and learn new things together.
Transcript
ORIGINAL PAPER
Relationship Between Petrographic Characteristicsand the Engineering Properties of Jurassic Sandstones,Hamedan, Iran
M. Heidari • A. A. Momeni • B. Rafiei •
S. Khodabakhsh • M. Torabi-Kaveh
Received: 16 June 2012 / Accepted: 12 November 2012 / Published online: 4 December 2012
� Springer-Verlag Wien 2012
Abstract To study the relationship between engineering
properties and petrographic characteristics, 20 rock sam-
ples were collected from Jurassic sandstones in the
Hamedan region, western Iran. The specimens were tested
to determine uniaxial compressive strength, point load
strength index, tangent modulus, porosity, and dry and
saturated unit weights. Samples were also subjected to
petrographic examination, which included the observation
of 11 parameters and modal analysis. Based on the results
of a statistical analysis, polynomial prediction equations
were developed to estimate physical and mechanical
properties from petrographic characteristics. The results
show that textural characteristics are more important than
mineral compositions for predicting engineering charac-
teristics. The packing density, packing proximity and grain
shape are the petrographic properties that significantly
affect the engineering properties of samples. Multivariate
linear regression analysis was performed, employing four
steps comprising various combinations of petrographic
characteristics for each engineering parameter. The optimal
equation, along with the relevant combination of petro-
graphic characteristics for estimating the engineering
properties of the rock samples is proposed.
Keywords Jurassic sandstone �Petrographic characteristics � Texture � Iran
1 Introduction
Sandstones include a wide range of rock types with variable
mineralogy, petrographic characteristics and mechanical
properties. Large variations in the physical and mechanical
properties of sandstones have been attributed to variations
in petrographic characteristics (Bell 1978a; Howarth and
Rowlands 1986; Shakoor and Bonelli 1991). Thus, in
addition to the values of engineering indexes, petrographic
characteristics that are known to affect physical and
mechanical properties can be used to predict the engineer-
ing properties of sandstones. These properties include grain
size and shape, degree of interlocking, types of contacts,
packing density, packing proximity, mineral composition
and amount and type of cement and matrix. These proper-
ties can be readily measured in the laboratory and are
commonly determined from analyses of thin sections.
Jurassic sandstone is widely exposed in the Hamedan
region of western Iran, where they are a source of barrow
material. According to the definition of Pettijohn et al.
(1987), most of the sandstones in the Hamedan region are
sublitharenites, quartzarenites and subarkoses, making them
suitable for geomechanical studies. The petrographic
parameters studied here include: (1) grain and matrix mineral
composition; (2) degree of packing of sandstone, which can
be expressed in terms of packing density (Pd), packing
proximity (Pp), porosity (n), dry unit weight (cd) and satu-
rated unit weight (csat); and (3) the types of grain contacts. In
addition to linear regression, multivariate linear regression
analyses were performed to obtain best-fit curves between
petrographic parameters and engineering properties.
Empirical predictive models, based on multivariate statisti-
cal analysis and thin section data, correlated strongly with
physical and mechanical properties, and, thus, can be used to
estimate the engineering properties of the sandstones.
M. Heidari (&) � B. Rafiei � S. Khodabakhsh �M. Torabi-Kaveh
Department of Geology, Faculty of Sciences, Bu-Ali Sina
University, Mahdieh Ave., 65175-38695 Hamedan, Iran
e-mail: [email protected]
A. A. Momeni
Department of Geology, Shahrood University of Technology,
Shahrood, Iran
123
Rock Mech Rock Eng (2013) 46:1091–1101
DOI 10.1007/s00603-012-0333-z
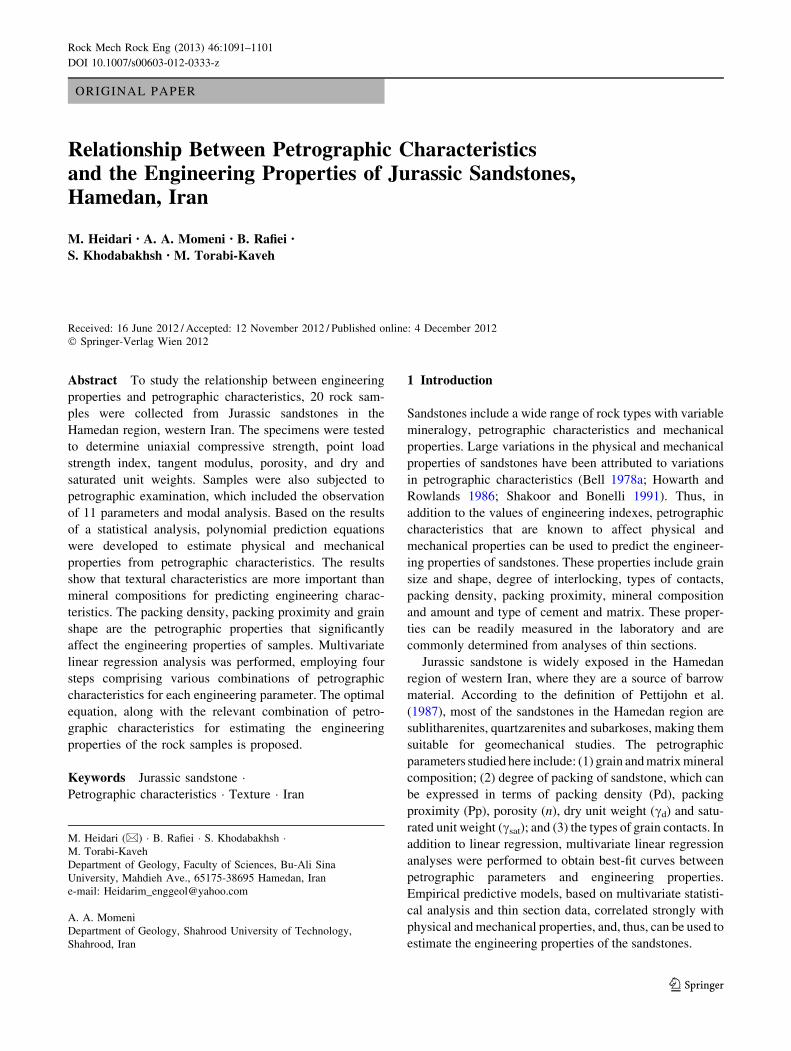
2 Geological Setting
The study area is located in the Sanandaj–Sirjan struc-
tural zone in western Iran, between longitudes of
48�3503700E and 48�3504800E, and latitudes of 34�4502000Nand 34�4503900N (Fig. 1). Samples were collected from
the Ekbatan Dam site, 5 km east of Hamadan city. The
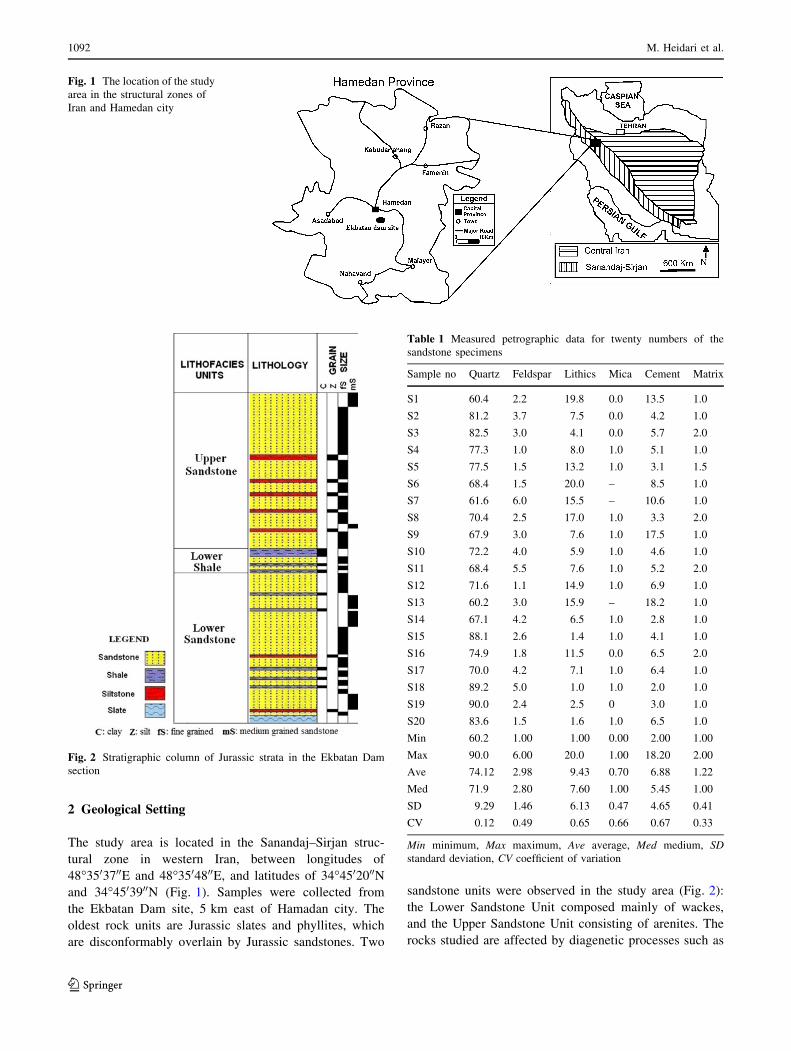
oldest rock units are Jurassic slates and phyllites, which
are disconformably overlain by Jurassic sandstones. Two
sandstone units were observed in the study area (Fig. 2):
the Lower Sandstone Unit composed mainly of wackes,
and the Upper Sandstone Unit consisting of arenites. The
rocks studied are affected by diagenetic processes such as
Fig. 1 The location of the study
area in the structural zones of
Iran and Hamedan city
Fig. 2 Stratigraphic column of Jurassic strata in the Ekbatan Dam
section
Table 1 Measured petrographic data for twenty numbers of the
sandstone specimens
Sample no Quartz Feldspar Lithics Mica Cement Matrix
S1 60.4 2.2 19.8 0.0 13.5 1.0
S2 81.2 3.7 7.5 0.0 4.2 1.0
S3 82.5 3.0 4.1 0.0 5.7 2.0
S4 77.3 1.0 8.0 1.0 5.1 1.0
S5 77.5 1.5 13.2 1.0 3.1 1.5
S6 68.4 1.5 20.0 – 8.5 1.0
S7 61.6 6.0 15.5 – 10.6 1.0
S8 70.4 2.5 17.0 1.0 3.3 2.0
S9 67.9 3.0 7.6 1.0 17.5 1.0
S10 72.2 4.0 5.9 1.0 4.6 1.0
S11 68.4 5.5 7.6 1.0 5.2 2.0
S12 71.6 1.1 14.9 1.0 6.9 1.0
S13 60.2 3.0 15.9 – 18.2 1.0
S14 67.1 4.2 6.5 1.0 2.8 1.0
S15 88.1 2.6 1.4 1.0 4.1 1.0
S16 74.9 1.8 11.5 0.0 6.5 2.0
S17 70.0 4.2 7.1 1.0 6.4 1.0
S18 89.2 5.0 1.0 1.0 2.0 1.0
S19 90.0 2.4 2.5 0 3.0 1.0
S20 83.6 1.5 1.6 1.0 6.5 1.0
Min 60.2 1.00 1.00 0.00 2.00 1.00
Max 90.0 6.00 20.0 1.00 18.20 2.00
Ave 74.12 2.98 9.43 0.70 6.88 1.22
Med 71.9 2.80 7.60 1.00 5.45 1.00
SD 9.29 1.46 6.13 0.47 4.65 0.41
CV 0.12 0.49 0.65 0.66 0.67 0.33
Min minimum, Max maximum, Ave average, Med medium, SD
standard deviation, CV coefficient of variation
1092 M. Heidari et al.
123
compaction, cementation, precipitation of dolomite cement,
fracturing, vein formation and pyrite formation.
3 Materials and Methods
Eighty-four samples were obtained from Jurassic Sand-
stone at the Ekbatan Dam site (Fig. 1). The engineering
properties of the samples (dry unit weight, saturated
unit weight, point load strength index, porosity, uniaxial
compressive strength and tangent modulus) were deter-
mined in accordance with methods suggested by the
International Society for Rock Mechanics (ISRM) (1981).
Sample textures were observed under an optical polarizing
microscope. The relative percentages of three types of
grain-to-grain contacts (i.e., concave–convex, long and
sutured) were determined along traverses in each thin
section. The number of grain-to-grain, grain-to-void, grain-
to-cement and grain-to-matrix contacts was counted along
the same traverses. The field of observation was set to
include 100–150 grains per image, enabling the observa-
tion of textural features for each area.
More than 100 randomly selected grains were studied
per thin section to determine the mean grain size. The
average of measurements along two perpendicular tra-
verses, passing through the centre of each grain, provided
the average size of the grains in each thin section. Five
random fields of view per thin section were used to eval-
uate the average grain size. Grain shape, measured in term
of roundness, was quantified for 100 randomly selected
grains per thin section. The degree of clastic particle
roundness, determined by the sharpness of particle edges
and corners, was determined using the scale developed by
Powers (1953). Packing density and packing proximity
were quantified according to Kahn’s (1956) method.
Packing density and packing proximity were determined
along ten traverses per thin section. Modal analyses were
based on 150 randomly selected points per thin section,
using the point-counting method described by Hutchinson
(1974). Quartz, feldspar, rock fragments, mica, calcite,
matrix and cement contents were determined for each thin
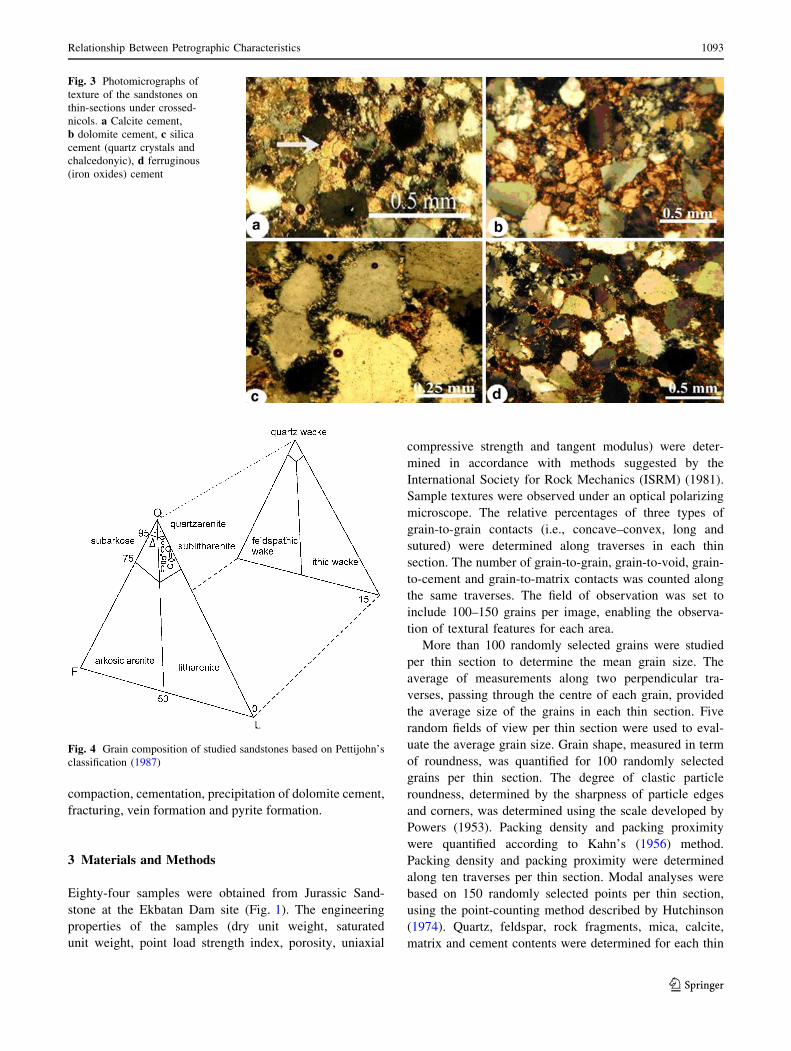
Fig. 3 Photomicrographs of
texture of the sandstones on
thin-sections under crossed-
nicols. a Calcite cement,
b dolomite cement, c silica
cement (quartz crystals and
chalcedonyic), d ferruginous
(iron oxides) cement
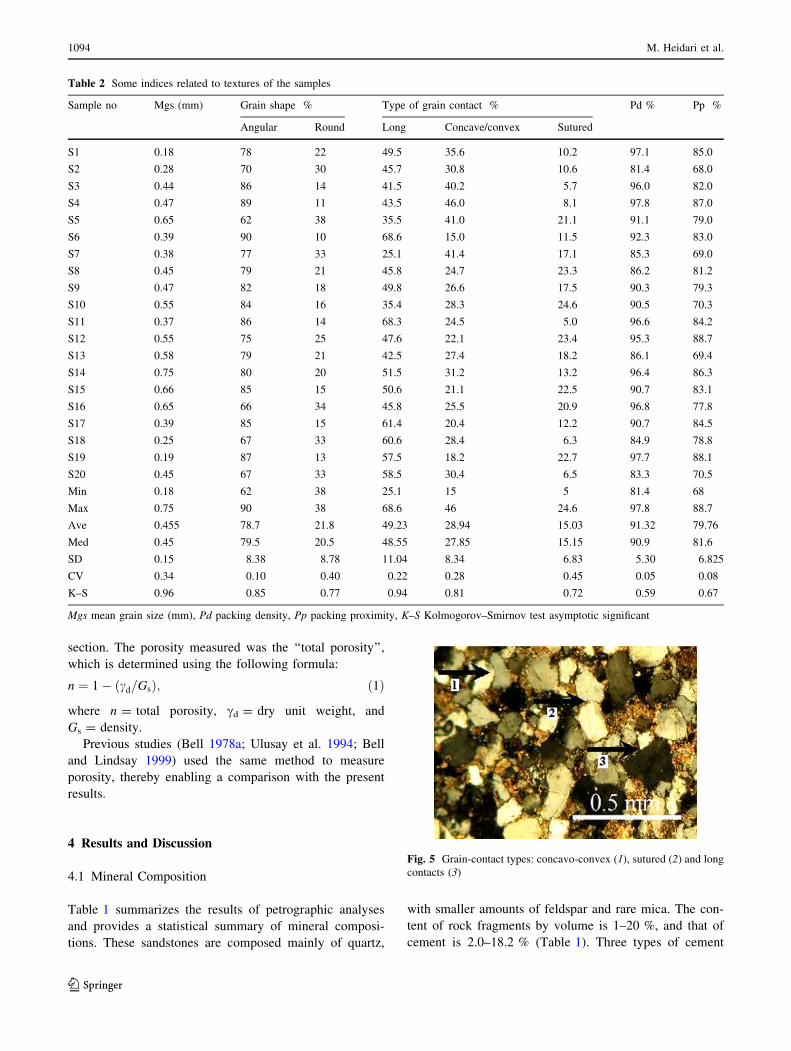
Fig. 4 Grain composition of studied sandstones based on Pettijohn’s
classification (1987)
Relationship Between Petrographic Characteristics 1093
123
section. The porosity measured was the ‘‘total porosity’’,
which is determined using the following formula:
n ¼ 1� cd=Gsð Þ; ð1Þ
where n = total porosity, cd = dry unit weight, and
Gs = density.
Previous studies (Bell 1978a; Ulusay et al. 1994; Bell
and Lindsay 1999) used the same method to measure
porosity, thereby enabling a comparison with the present
results.
4 Results and Discussion
4.1 Mineral Composition
Table 1 summarizes the results of petrographic analyses
and provides a statistical summary of mineral composi-
tions. These sandstones are composed mainly of quartz,
with smaller amounts of feldspar and rare mica. The con-
tent of rock fragments by volume is 1–20 %, and that of
cement is 2.0–18.2 % (Table 1). Three types of cement
Table 2 Some indices related to textures of the samples
Sample no Mgs (mm) Grain shape % Type of grain contact % Pd % Pp %
Angular Round Long Concave/convex Sutured
S1 0.18 78 22 49.5 35.6 10.2 97.1 85.0
S2 0.28 70 30 45.7 30.8 10.6 81.4 68.0
S3 0.44 86 14 41.5 40.2 5.7 96.0 82.0
S4 0.47 89 11 43.5 46.0 8.1 97.8 87.0
S5 0.65 62 38 35.5 41.0 21.1 91.1 79.0
S6 0.39 90 10 68.6 15.0 11.5 92.3 83.0
S7 0.38 77 33 25.1 41.4 17.1 85.3 69.0
S8 0.45 79 21 45.8 24.7 23.3 86.2 81.2
S9 0.47 82 18 49.8 26.6 17.5 90.3 79.3
S10 0.55 84 16 35.4 28.3 24.6 90.5 70.3
S11 0.37 86 14 68.3 24.5 5.0 96.6 84.2
S12 0.55 75 25 47.6 22.1 23.4 95.3 88.7
S13 0.58 79 21 42.5 27.4 18.2 86.1 69.4
S14 0.75 80 20 51.5 31.2 13.2 96.4 86.3
S15 0.66 85 15 50.6 21.1 22.5 90.7 83.1
S16 0.65 66 34 45.8 25.5 20.9 96.8 77.8
S17 0.39 85 15 61.4 20.4 12.2 90.7 84.5
S18 0.25 67 33 60.6 28.4 6.3 84.9 78.8
S19 0.19 87 13 57.5 18.2 22.7 97.7 88.1
S20 0.45 67 33 58.5 30.4 6.5 83.3 70.5
Min 0.18 62 38 25.1 15 5 81.4 68
Max 0.75 90 38 68.6 46 24.6 97.8 88.7
Ave 0.455 78.7 21.8 49.23 28.94 15.03 91.32 79.76
Med 0.45 79.5 20.5 48.55 27.85 15.15 90.9 81.6
SD 0.15 8.38 8.78 11.04 8.34 6.83 5.30 6.825
CV 0.34 0.10 0.40 0.22 0.28 0.45 0.05 0.08
K–S 0.96 0.85 0.77 0.94 0.81 0.72 0.59 0.67
Mgs mean grain size (mm), Pd packing density, Pp packing proximity, K–S Kolmogorov–Smirnov test asymptotic significant
Fig. 5 Grain-contact types: concavo-convex (1), sutured (2) and long
contacts (3)
1094 M. Heidari et al.
123
were recognized: siliceous, carbonate and ferruginous
(Fig. 3).
The studied sandstones can be classified as sublithare-
nites, quartzarenites and subarkoses (Fig. 4), based on the
scheme proposed by Pettijohn et al. (1987).
4.2 Sandstone Texture
The results of the textural analysis are summarized in
Table 2. Mean grain size ranged from 0.18 to 0.75 mm,
indicating that the majority of samples were medium-
grained sands. Most of the sandstones were moderately
sorted, and more than 78 % of grains were angular in
shape. Table 2 shows that for all parameters, the mean and
average values are similar among all the samples. All the
data sets have a normal distribution (Table 2), as revealed
by the Kolmogorov–Smirnov test (Kolmogorov 1933;
Smirnov 1939).
Grain contacts were classified as tangential, long,
concavo–convex, sutured or floating. In well-sorted sand-
stone, the presence of three or more inter-grain contacts per
grain suggests that porosity has been reduced by pressure
solution (Bell 1978a). Therefore, the presence of large
numbers of long, concavo-convex and sutured contacts in
the present samples (Fig. 5) reflects the influence of pres-
sure solution. The most common types of contacts are long
and concavo–convex. A reduction in pore space due to
pressure solution is also indicated by the presence of sec-
ondary quartz overgrowths around primary quartz grains.
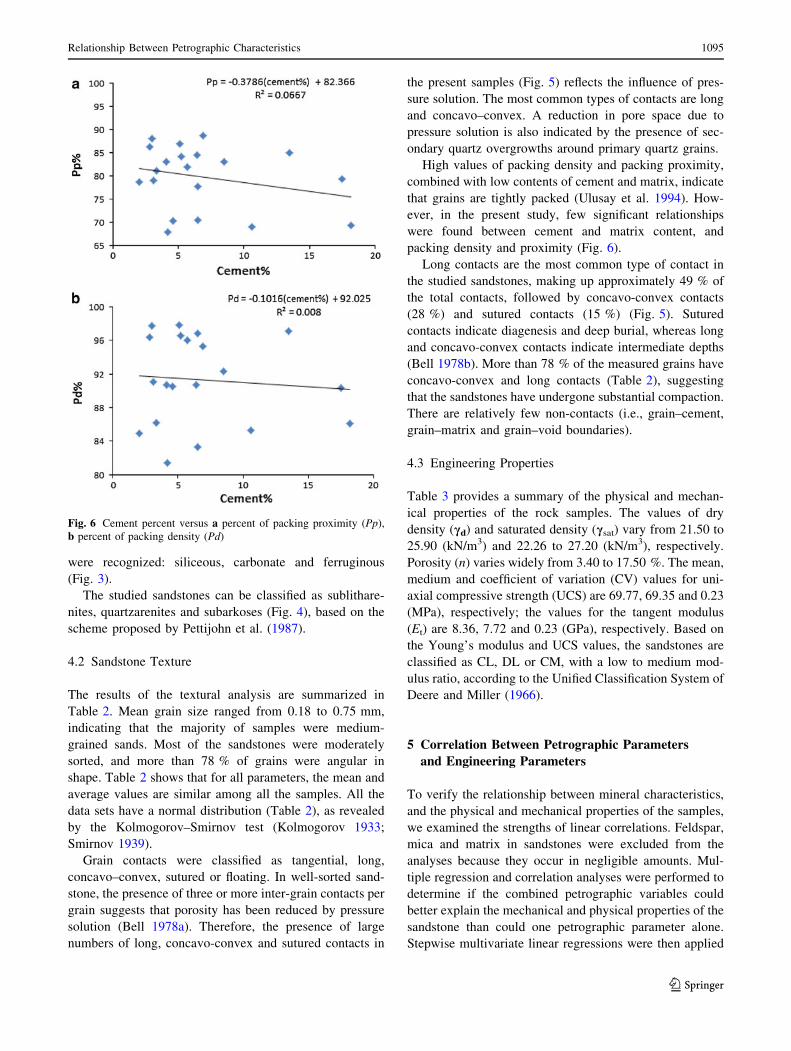
High values of packing density and packing proximity,
combined with low contents of cement and matrix, indicate
that grains are tightly packed (Ulusay et al. 1994). How-
ever, in the present study, few significant relationships
were found between cement and matrix content, and
packing density and proximity (Fig. 6).
Long contacts are the most common type of contact in
the studied sandstones, making up approximately 49 % of
the total contacts, followed by concavo-convex contacts
(28 %) and sutured contacts (15 %) (Fig. 5). Sutured
contacts indicate diagenesis and deep burial, whereas long
and concavo-convex contacts indicate intermediate depths
(Bell 1978b). More than 78 % of the measured grains have
concavo-convex and long contacts (Table 2), suggesting
that the sandstones have undergone substantial compaction.
There are relatively few non-contacts (i.e., grain–cement,
grain–matrix and grain–void boundaries).
4.3 Engineering Properties
Table 3 provides a summary of the physical and mechan-
ical properties of the rock samples. The values of dry
density (cd) and saturated density (csat) vary from 21.50 to
25.90 (kN/m3) and 22.26 to 27.20 (kN/m3), respectively.
Porosity (n) varies widely from 3.40 to 17.50 %. The mean,
medium and coefficient of variation (CV) values for uni-
axial compressive strength (UCS) are 69.77, 69.35 and 0.23
(MPa), respectively; the values for the tangent modulus
(Et) are 8.36, 7.72 and 0.23 (GPa), respectively. Based on
the Young’s modulus and UCS values, the sandstones are
classified as CL, DL or CM, with a low to medium mod-
ulus ratio, according to the Unified Classification System of
Deere and Miller (1966).
5 Correlation Between Petrographic Parameters
and Engineering Parameters
To verify the relationship between mineral characteristics,
and the physical and mechanical properties of the samples,
we examined the strengths of linear correlations. Feldspar,
mica and matrix in sandstones were excluded from the
analyses because they occur in negligible amounts. Mul-
tiple regression and correlation analyses were performed to
determine if the combined petrographic variables could
better explain the mechanical and physical properties of the
sandstone than could one petrographic parameter alone.
Stepwise multivariate linear regressions were then applied
Fig. 6 Cement percent versus a percent of packing proximity (Pp),
b percent of packing density (Pd)
Relationship Between Petrographic Characteristics 1095
123

Table 3 The physical and mechanical properties of the twenty samples of the Ekbatan sandstones
Sample no cd (kN/m3) csat (kN/m3) n (%) Is(50) (MPa) UCS (MPa) Et (GPa)
S1 24.82 25.91 3.40 4.34 92.5 11.5
S2 21.5 22.7 17.50 4.08 53.4 6.1
S3 24.52 25.4 8.84 4.1 88.7 –
S4 25.31 25.80 4.10 5.56 89.4 8.42
S5 25.50 26.42 7.30 4.48 61.3 8.20
S6 25.11 26.29 6.40 4.89 85.2 7.78
S7 21.70 22.26 14.98 3.66 44.9 12.36
S8 24.91 26.1 6.65 3.98 75.8 7.66
S9 24.52 25.77 8.60 4.71 73.3 7.30
S10 21.68 23.36 15.86 3.17 54 6.25
S11 25.6 27.2 10.58 3.99 68.2 6.22
S12 25.9 26.65 6.26 4.69 90.4 7.33
S13 24.50 25.6 9.33 3.30 45.2 7.28
S14 24.92 25.3 5.62 5.02 65.3 7.41
S15 25.67 27.03 6.11 3.85 59.7 8.10
S16 23.54 24.92 8.28 3.72 68.8 8.38
S17 25.50 26.8 5.87 4.42 70.7 –
S18 22.46 24.65 9.21 3.35 46.3 12.31
S19 25.52 26.8 5.36 5.5 92.5 10.36
S20 23.11 25.5 11.42 3.88 69.9 7.65
Min 21.50 22.26 3.40 3.17 44.90 6.10
Max 25.90 27.20 17.50 5.56 92.50 12.36
Ave 24.31 25.52 8.58 4.23 69.77 8.36
Med 24.86 25.78 7.79 4.09 69.35 7.72
SD 1.45 1.37 3.85 0.67 16.18 1.95
CV 0.05 0.05 0.44 0.16 0.23 0.23
K–S 0.16 0.49 0.59 0.90 0.90 0.15
cd Dry density, csat saturated density, n porosity, Is(50) point load strength index, UCS uniaxial compressive strength, Et tangent modulus,
K–S Kolmogorov–Smirnov test asymptotic significant
Table 4 The linear relationships between petrographical characteristics with physical and mechanical properties
Petrographical characteristics Physical properties Mechanical properties
cd (kN/m3) csat (kN/m3) N (%) Is(50) (MPa) UCS (MPa) Et (GPa)
Mean grain size (mm) 0.19 0.08 -0.08 -0.09 -0.23 0.17
Angular 0.38 0.23 -0.27 0.38 0.41 0.19
Round -0.48 -0.34 0.36 -0.41 -0.48 -0.26
Pd 0.62 0.48 -0.63 0.57 0.69 0.71
Pp 0.82 0.74 -0.84 0.70 0.74 0.69
Long 0.38 0.53 -0.34 0.25 0.30 -0.04
Concavo-convex -0.26 -0.33 0.14 0.00 -0.09 0.24
Sutured 0.09 0.00 -0.03 -0.05 -0.08 0.00
Quartz (%) -0.05 0.12 0.01 0.07 0.04 0.07
Lithics (%) 0.15 -0.03 -0.17 0.04 0.22 0.05
Cement (%) 0.00 -0.03 0.00 -0.12 -0.12 0.03
1096 M. Heidari et al.
123
to reduce the number of variables in the multivariate linear
regression equation without reducing predictability.
5.1 Linear Regression and Correlation Analysis
Eleven petrographic variables were analysed separately for
correlations with mechanical and physical parameters. The
results are set out in Table 4, which clearly shows a distinct
correlation for some parameters.
Most petrographic characteristics are only weakly rela-
ted to dry and saturated unit weight, probably due to the
limited range in unit weight (Table 3). Dry density was
inversely related to the percentage of round grains (r =
-0.48) and showed a significant correlation with packing
proximity (r = 0.82). The saturation density showed a
statistically significant correlation with packing proximity
(r = 0.74). The packing proximity, packing density and
long contacts all showed a statistically significant correla-
tion with unit weight (95 % confidence level). We also
found a statistically significant inverse correlation between
porosity and each of packing proximity (r = -0.84) and
packing density (r = -0.63) (Table 4).
Uniaxial compressive strength has a statistically signif-
icant correlation with packing proximity (r = 0.74),
packing density (r = 0.69) and grain roundness (r =
-0.48). Similar results were obtained for the point load
strength index. Samples tend to show an increase in
strength with increasing packing proximity and packing
density (Table 4), as also noted by Bell (1978a) for the Fell
sandstones, Northumberland, England. The petrographic
characteristics with the greatest impact on the tangent
modulus were packing density (r = 0.71), packing prox-
imity (r = 0.69), concavo-convex contacts (r = 0.26) and
roundness (r = -0.26).
5.2 Multiple Linear Regression and Stepwise Multiple
Regression
Significant variables in multi-variable linear relationships
were considered using a multiple regression and correlation
analysis performed with the EViews 5 software, to deter-
mine if multiple variables would define stronger relation-
ships than single variables. The performance of the
stepwise method developed in this study was assessed
using standard criteria for evaluating statistical perfor-
mance, including the correlation coefficient (r), the root
mean square error (RMSE) and the mean absolute error
(MAE). These three criteria were calculated with the fol-
lowing equations:
R ¼Pn
i¼1 Xi � X� �
Yi � Y� �
ffiffiffiffiffiffiffiffiffiffiffiffiffiffiffiffiffiffiffiffiffiffiffiffiffiffiffiffiffiffiffiffiffiffiffiffiffiffiffiffiffiffiffiffiffiffiffiffiffiPn
i¼1 Xi � X� �2
Yi � Y� �q 2
ð2Þ
RMSE ¼
ffiffiffiffiffiffiffiffiffiffiffiffiffiffiffiffiffiffiffiffiffiffiffiffiffiffiffiffiffiffiffiPn
i¼1 Xi � Yið Þ2
n
s
ð3Þ
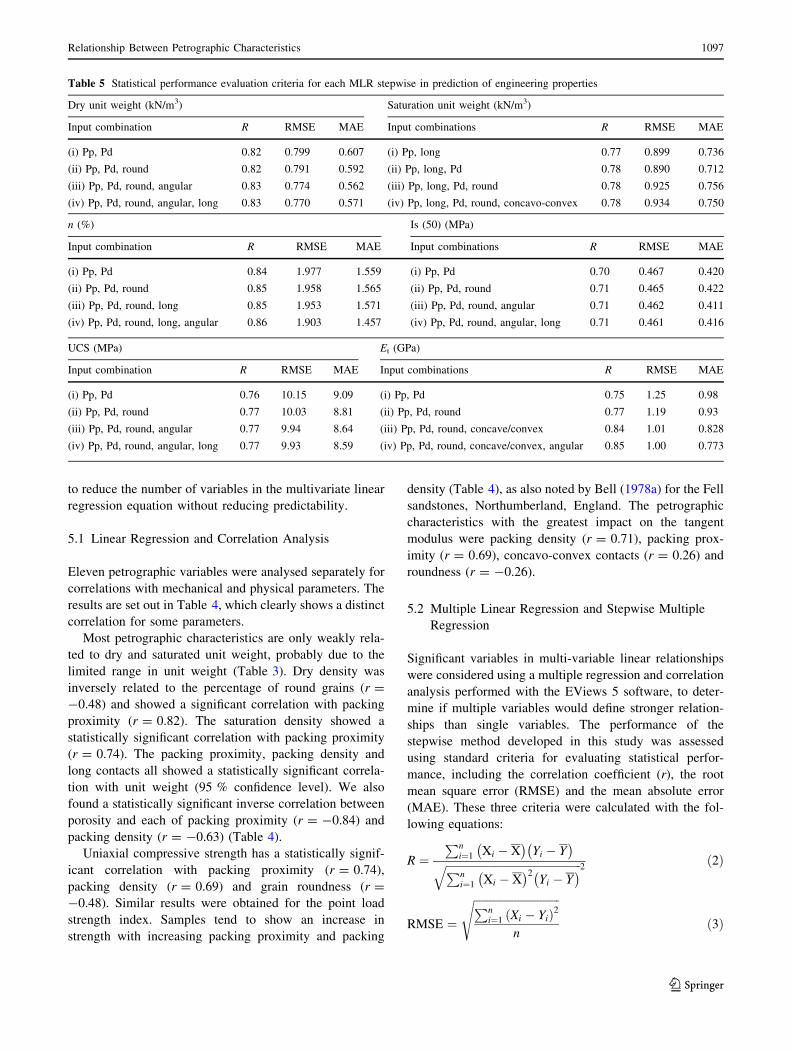
Table 5 Statistical performance evaluation criteria for each MLR stepwise in prediction of engineering properties
Dry unit weight (kN/m3) Saturation unit weight (kN/m3)
Input combination R RMSE MAE Input combinations R RMSE MAE
(i) Pp, Pd 0.82 0.799 0.607 (i) Pp, long 0.77 0.899 0.736
(ii) Pp, Pd, round 0.82 0.791 0.592 (ii) Pp, long, Pd 0.78 0.890 0.712
(iii) Pp, Pd, round, angular 0.83 0.774 0.562 (iii) Pp, long, Pd, round 0.78 0.925 0.756
(iv) Pp, Pd, round, angular, long 0.83 0.770 0.571 (iv) Pp, long, Pd, round, concavo-convex 0.78 0.934 0.750
n (%) Is (50) (MPa)
Input combination R RMSE MAE Input combinations R RMSE MAE
(i) Pp, Pd 0.84 1.977 1.559 (i) Pp, Pd 0.70 0.467 0.420
(ii) Pp, Pd, round 0.85 1.958 1.565 (ii) Pp, Pd, round 0.71 0.465 0.422
(iii) Pp, Pd, round, long 0.85 1.953 1.571 (iii) Pp, Pd, round, angular 0.71 0.462 0.411
(iv) Pp, Pd, round, long, angular 0.86 1.903 1.457 (iv) Pp, Pd, round, angular, long 0.71 0.461 0.416
UCS (MPa) Et (GPa)
Input combination R RMSE MAE Input combinations R RMSE MAE
(i) Pp, Pd 0.76 10.15 9.09 (i) Pp, Pd 0.75 1.25 0.98
(ii) Pp, Pd, round 0.77 10.03 8.81 (ii) Pp, Pd, round 0.77 1.19 0.93
(iii) Pp, Pd, round, angular 0.77 9.94 8.64 (iii) Pp, Pd, round, concave/convex 0.84 1.01 0.828
(iv) Pp, Pd, round, angular, long 0.77 9.93 8.59 (iv) Pp, Pd, round, concave/convex, angular 0.85 1.00 0.773
Relationship Between Petrographic Characteristics 1097
123
MAE ¼Pn
i¼1 Xi � Yij jn
; ð4Þ
wherethere are the means of the observed and pre-
dicted data, respectively; and n is the number of data
points.
A standard t test was used to assess the confidence level
of the regression analysis. The formula used for the t test is
a ratio where the numerator is simply the difference
between the two means or averages, and the denominator is
a measure of the variability or dispersion among scores
(Sharma et al. 2011). The formula for calculating the t test
is as follows:
t ¼ M1 �M2ffiffiffiffiffiffiffiffiffiffiffiffiffiffiffiffiffiffi
S2p
n1þ S2
p
n2
� �r ! S2p ¼
SS1 þ SS2
df1 þ df2
; ð5Þ
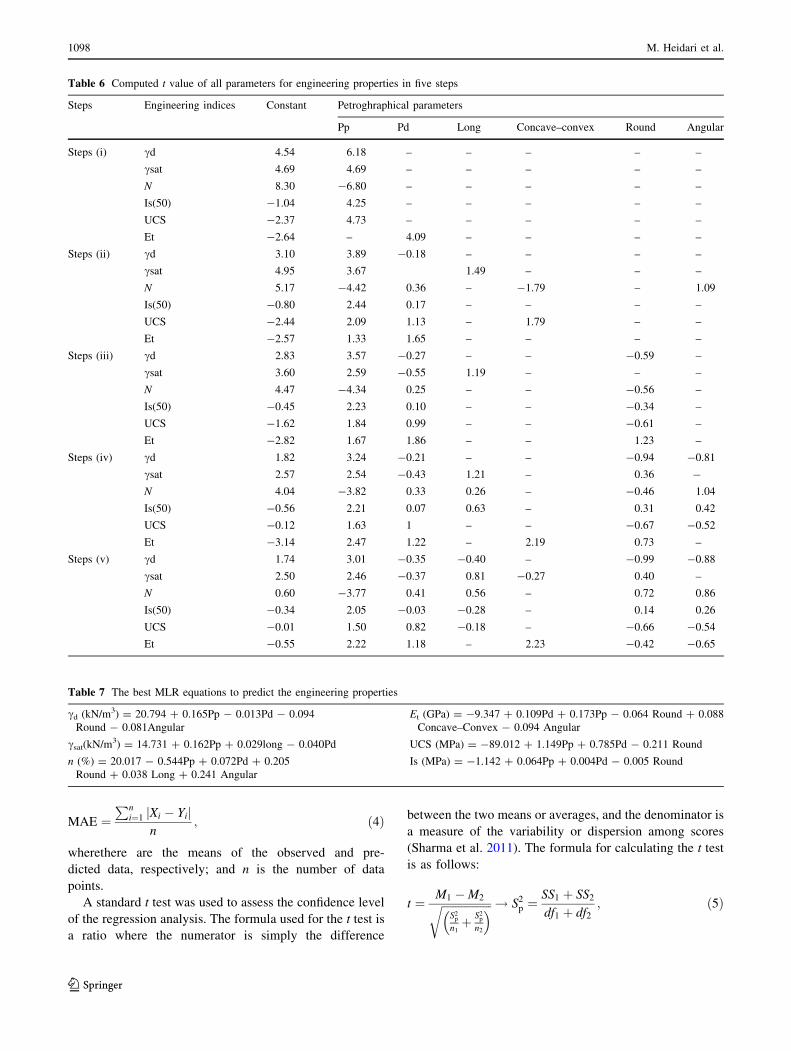
Table 6 Computed t value of all parameters for engineering properties in five steps
Steps Engineering indices Constant Petroghraphical parameters
Pp Pd Long Concave–convex Round Angular
Steps (i) cd 4.54 6.18 – – – – –
csat 4.69 4.69 – – – – –
N 8.30 -6.80 – – – – –
Is(50) -1.04 4.25 – – – – –
UCS -2.37 4.73 – – – – –
Et -2.64 – 4.09 – – – –
Steps (ii) cd 3.10 3.89 -0.18 – – – –
csat 4.95 3.67 1.49 – – –
N 5.17 -4.42 0.36 – -1.79 – 1.09
Is(50) -0.80 2.44 0.17 – – – –
UCS -2.44 2.09 1.13 – 1.79 – –
Et -2.57 1.33 1.65 – – – –
Steps (iii) cd 2.83 3.57 -0.27 – – -0.59 –
csat 3.60 2.59 -0.55 1.19 – – –
N 4.47 -4.34 0.25 – – -0.56 –
Is(50) -0.45 2.23 0.10 – – -0.34 –
UCS -1.62 1.84 0.99 – – -0.61 –
Et -2.82 1.67 1.86 – – 1.23 –
Steps (iv) cd 1.82 3.24 -0.21 – – -0.94 -0.81
csat 2.57 2.54 -0.43 1.21 – 0.36 -
N 4.04 -3.82 0.33 0.26 – -0.46 1.04
Is(50) -0.56 2.21 0.07 0.63 – 0.31 0.42
UCS -0.12 1.63 1 – – -0.67 -0.52
Et -3.14 2.47 1.22 – 2.19 0.73 –
Steps (v) cd 1.74 3.01 -0.35 -0.40 – -0.99 -0.88
csat 2.50 2.46 -0.37 0.81 -0.27 0.40 –
N 0.60 -3.77 0.41 0.56 – 0.72 0.86
Is(50) -0.34 2.05 -0.03 -0.28 – 0.14 0.26
UCS -0.01 1.50 0.82 -0.18 – -0.66 -0.54
Et -0.55 2.22 1.18 – 2.23 -0.42 -0.65
Table 7 The best MLR equations to predict the engineering properties
cd (kN/m3) = 20.794 ? 0.165Pp - 0.013Pd - 0.094
Round - 0.081Angular
Et (GPa) = -9.347 ? 0.109Pd ? 0.173Pp - 0.064 Round ? 0.088
Concave–Convex - 0.094 Angular
csat(kN/m3) = 14.731 ? 0.162Pp ? 0.029long - 0.040Pd UCS (MPa) = -89.012 ? 1.149Pp ? 0.785Pd - 0.211 Round
n (%) = 20.017 - 0.544Pp ? 0.072Pd ? 0.205
Round ? 0.038 Long ? 0.241 Angular
Is (MPa) = -1.142 ? 0.064Pp ? 0.004Pd - 0.005 Round
1098 M. Heidari et al.
123
where M1 and M2 are the means of groups 1 and 2,
respectively; Sp2 is the pooled variance; SS1 and SS2 are the
sum of squares for each group; n1 and n2 are the number of
scores in each group; and df1 and df2 are the degrees of
freedom for each group (df1 = n1 - 1 and df2 = n2 - 1).
The t value is positive if the first mean is larger than the
second, and vice versa. Once the t value is computed, it is
compared with the tabulated value. If the computed value
is larger than the one tabulated, this indicates a strong and
significant correlation. A risk is set to test the significance.
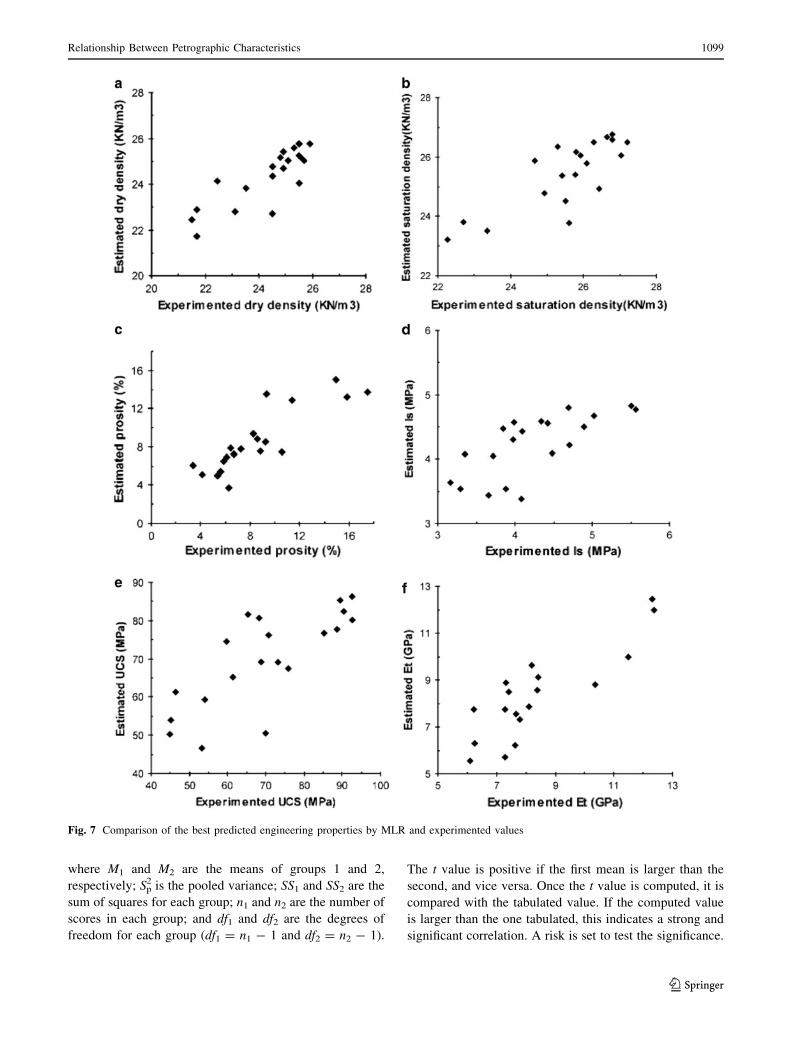
Fig. 7 Comparison of the best predicted engineering properties by MLR and experimented values
Relationship Between Petrographic Characteristics 1099
123
In most cases, the ‘‘rule of thumb’’ is to set the alpha level
at 0.05 (i.e., a 95 % confidence interval).
The results of stepwise multiple regression and the
computed t value for each engineering property are listed in
Tables 5 and 6, respectively. The coefficient of multiple
determinations (R) for the relationships with dry density,
saturated density, tangent modulus and porosity is high
when compared with those obtained for other relationships.
The relationship between Is(50) and UCS is characterized by
a moderate R value. Density, porosity and tangent modulus
are therefore better explained when multiple petrographic
variables are considered.
In the first step, one of the 11 variables predicted a dry
unit weight with R = 0.82 (Table 5). For the tangent
modulus, an increase from two to five variables resulted in
an increase in R of 0.10 (Table 5). When UCS was
regressed against packing proximity, packing density and
grain roundness, R was 0.77. The analysis showed that
these three variables are good predictors of the UCS. In
contrast, two variables, packing proximity and packing
density, could be used to predict UCS with R = 0.76.
Reducing the number of variables in the analysis from
three to two caused only a very small loss in predictive
capability. A similar assessment may also be made for the
other properties given in Table 5. The statistical perfor-
mance evaluation criteria of multiple linear regression
(MLR) for engineering properties are presented in Tables 5
and 6, which show that increasing the number of variables
input into the regression models improves the estimating
ability of UCS and Et. A stepwise multiple regression
performed for the point load strength index indicates that
five variables collectively predicted this mechanical prop-
erty with R = 0.71. Considerable effort can be saved, with
only a small loss in accuracy, if two variables (packing
density and packing proximity) are used (R = 0.70).
The results of the five-step t test relating to engineering
properties are shown in Table 6. Only in the first step is the
calculated t value much greater than the tabulated value at
the 95 % confidence interval. The most suitable equation,
which represents a comparison of the best predictions of
engineering properties by MLR and experimental values, is
presented in Table 7 and Fig. 7.
Based on the T-ratio probabilities, porosity had one
significant predictor (t [ 5.17), which is the regression
constant (Table 6). The calculated R values indicate that
the regression is significant (R = 0.84). Therefore, a rough
estimate of porosity can be made using the prediction
equation. The point load strength index showed moderate
predictor values, and uniaxial compressive strength had
only one significant predictor (t = –2.44), which is the
regression constant (Table 6). The calculated R values
indicate that the regression is not highly significant
(r = 0.76).
6 Conclusions
To study the relationship between petrographic character-
istics and engineering properties, selected sandstones were
quantified using a comprehensive multivariate statistical
evaluation. By quantifying the mineralogy and texture of
the sandstones, we identified the parameters that control
their engineering performance. The results of our study are
summarized below.
1. Among 11 petrographic characteristics, we found that
packing density, packing proximity and the percentage
of long contacts exhibited the most significant corre-
lations with most of the engineering properties
considered in this study. In addition, packing density
and porosity are the two key parameters that influence
UCS, with lower porosity and greater packing density
acting to enhance UCS.
2. In sandstones, which consist almost entirely of quartz,
there is no relationship between mineral composition
and density, strength, porosity or tangent modulus. As
highlighted by Bell (1978a), the engineering properties
of rocks show no relationship to their mineral compo-
sition, which is expected because textural properties
are more important than composition in this case. We
found no significant relationship between cement
content and engineering properties.
3. The use of stepwise regression statistics was important
in reducing the number of variables from 11 to only a
few. Packing proximity and packing density showed
strong correlations with dry unit weight, saturated unit
weight, UCS, point load strength index and porosity.
4. Our results raise the possibility of quantitative predic-
tions of the physical and mechanical properties of the
studied sandstones using petrographic parameters.
However, additional studies are needed to verify these
relationships. These independent variables are only
appropriate for estimating the properties of the studied
sandstones, and the resulting equations are not recom-
mended for the evaluation of sandstones from other
regions.
References
Bell FG (1978a) The physical and mechanical properties of the Fell
Sandstones, Northumberland, England. Eng Geol 12:1–29
Bell FG (1978b) Petrographical factors relating to porosity and
permeability in the Fell Sandstone. Q J Eng Geol 11(2):113–126
Bell FG, Lindsay P (1999) The petrographic and geomechanical
properties of sandstones from the Newspaper Member of the
Natal Group near Durban, South Africa. Eng Geol 53:57–81
Broch EM, Franklin JA (1972) The point load strength test. Int J Rock
Mech Min Sci 9:669–697
1100 M. Heidari et al.
123
Deere DU, Miller RP (1966) Engineering classification and index
properties for intact rock. U.S. Air Force Systems Command, Air
Force Weapons Lab., Kirtland Air Force Base, New Mexicom,
Technical Report, AFWL-TR, pp 65–116
Howarth DF, Rowlands JC (1986) Development of an index to
quantify rock texture for assessment of intact rock properties.
Geotech Testing J 9:169–179
Hutchinson CS (1974) Laboratoary handbook of petrography tech-
niques. Wiley, New York, p 527
International Society for Rock Mechanics (1981) Rock characteriza-
tion, testing and monitoring, ISRM suggested methods. In:
Brown ET (ed) Pergamon Press, Oxford, p 211
Kahn JS (1956) The analysis and distribution of the properties of
packing in sand size sediments. J Geol 64:385–395
Kolmogorov AN (1933) On the empirical determination of a
distribution function, vol 4, pp 83–91
Pettijohn FJ, Potter PE, Siever R (1987) Sand and sandstone.
Springer, Berlin, p 306
Shakoor A, Bonelli RE (1991) Relationship between petrophysical
characteristics, engineering index properties and mechanical
properties of selected sandstones. Bull Assoc Eng Geol 28:55–71
Sharma PK, Khandelwal M, Singh TN (2011) A correlation between
Schmidt hammer rebound numbers with impact strength index,
slake durability index and P-wave velocity. Int J Earth Sci
100:189–195
Smirnov NV (1939) On the estimation of the discrepency between
empirical curves of distribution for two independent samples.
Bull Moscow 2:3–16
Ulusay R, Tureli K, Ider MH (1994) Prediction of engineering
properties of a selected litharenite sandstone from its petro-
graphic characteristics using correlation and multivariable sta-
tistical techniques. Eng Geol 37:135–157
Relationship Between Petrographic Characteristics 1101
123
Related Documents


