RESEARCH ARTICLE Open Access Relationship between morphological features and kinetic patterns of enhancement of the dynamic breast magnetic resonance imaging and clinico- pathological and biological factors in invasive breast cancer Oscar Fernández-Guinea 1,2 , Alejandro Andicoechea 1,3 , Luis O González 1,4,5 , Salomé González-Reyes 1,5 , Antonio M Merino 6 , Luis C Hernández 7 , Alfonso López-Muñiz 7 , Paz García-Pravia 2 , Francisco J Vizoso 1,3,5* Abstract Background: To investigate the relationship between the magnetic resonance imaging (MRI) features of breast cancer and its clinicopathological and biological factors. Methods: Dynamic MRI parameters of 68 invasive breast carcinomas were investigated. We also analyzed microvessel density (MVD), estrogen and progesterone receptor status, and expression of p53, HER2, ki67, VEGFR-1 and 2. Results: Homogeneous enhancement was significantly associated with smaller tumor size (T1: < 2 cm) (p = 0.015). Tumors with irregular or spiculated margins had a significantly higher MVD than tumors with smooth margins (p = 0.038). Tumors showing a maximum enhancement peak at two minutes, or longer, after injecting the contrast, had a significantly higher MVD count than those which reached this point sooner (p = 0.012). The percentage of tumors with vascular invasion or high mitotic index was significantly higher among those showing a low percentage (≤ 150%) of maximum enhancement before two minutes than among those ones showing a high percentage (>150%) of enhancement rate (p = 0.016 and p = 0.03, respectively). However, there was a significant and positive association between the mitotic index and the peak of maximum intensity (p = 0.036). Peritumor inflammation was significantly associated with washout curve type III (p = 0.042). Conclusions: Variations in the early phase of dynamic MRI seem to be associated with parameters indicatives of tumor aggressiveness in breast cancer. Background Magnetic resonance imaging (MRI) plays an important role in the evaluation of the extent of breast cancer by revealing multifocal tumor growth in patients who are candidates for conservative breast surgery [1]. MRI per- mits us to explorer two concepts: First, we are able to analyze the morphologic characteristics of the lesions with high spatial resolution, such as the margin mor- phology (smooth, irregular or spiculated) or the internal architecture of the tumors (represented as internal mass enhancement: homogeneous, heterogeneous or rim enhancement) [1-3]. Second, we can also obtain dynamic data derived from the kinetic patterns of lesion enhancement after the administration of contrast mate- rial [4]. These latter MRI parameters include the beha- viour of the signal intensity in the early phase after the administration of contrast material, as well as in the late postcontrast period. Likewise, this time course may be visualized in two and three-dimensional dynamic MRI series. These time-signal intensity curves allow us to determine whether the signal intensity continues to increase after the initial upstroke, cuts off and reaches a * Correspondence: [email protected] 1 Unidad de Investigación, Hospital de Jove, Gijón-Spain Fernández-Guinea et al. BMC Cancer 2010, 10:8 http://www.biomedcentral.com/1471-2407/10/8 © 2010 Fernández-Guinea et al; licensee BioMed Central Ltd. This is an Open Access article distributed under the terms of the Creative Commons Attribution License (http://creativecommons.org/licenses/by/2.0), which permits unrestricted use, distribution, and reproduction in any medium, provided the original work is properly cited.

Welcome message from author
This document is posted to help you gain knowledge. Please leave a comment to let me know what you think about it! Share it to your friends and learn new things together.
Transcript

RESEARCH ARTICLE Open Access
Relationship between morphological features andkinetic patterns of enhancement of the dynamicbreast magnetic resonance imaging and clinico-pathological and biological factors in invasivebreast cancerOscar Fernández-Guinea1,2, Alejandro Andicoechea1,3, Luis O González1,4,5, Salomé González-Reyes1,5,Antonio M Merino6, Luis C Hernández7, Alfonso López-Muñiz7, Paz García-Pravia2, Francisco J Vizoso1,3,5*
Abstract
Background: To investigate the relationship between the magnetic resonance imaging (MRI) features of breastcancer and its clinicopathological and biological factors.
Methods: Dynamic MRI parameters of 68 invasive breast carcinomas were investigated. We also analyzedmicrovessel density (MVD), estrogen and progesterone receptor status, and expression of p53, HER2, ki67, VEGFR-1and 2.
Results: Homogeneous enhancement was significantly associated with smaller tumor size (T1: < 2 cm) (p = 0.015).Tumors with irregular or spiculated margins had a significantly higher MVD than tumors with smooth margins (p =0.038). Tumors showing a maximum enhancement peak at two minutes, or longer, after injecting the contrast, hada significantly higher MVD count than those which reached this point sooner (p = 0.012). The percentage oftumors with vascular invasion or high mitotic index was significantly higher among those showing a lowpercentage (≤ 150%) of maximum enhancement before two minutes than among those ones showing a highpercentage (>150%) of enhancement rate (p = 0.016 and p = 0.03, respectively). However, there was a significantand positive association between the mitotic index and the peak of maximum intensity (p = 0.036). Peritumorinflammation was significantly associated with washout curve type III (p = 0.042).
Conclusions: Variations in the early phase of dynamic MRI seem to be associated with parameters indicatives oftumor aggressiveness in breast cancer.
BackgroundMagnetic resonance imaging (MRI) plays an importantrole in the evaluation of the extent of breast cancer byrevealing multifocal tumor growth in patients who arecandidates for conservative breast surgery [1]. MRI per-mits us to explorer two concepts: First, we are able toanalyze the morphologic characteristics of the lesionswith high spatial resolution, such as the margin mor-phology (smooth, irregular or spiculated) or the internalarchitecture of the tumors (represented as internal mass
enhancement: homogeneous, heterogeneous or rimenhancement) [1-3]. Second, we can also obtaindynamic data derived from the kinetic patterns of lesionenhancement after the administration of contrast mate-rial [4]. These latter MRI parameters include the beha-viour of the signal intensity in the early phase after theadministration of contrast material, as well as in the latepostcontrast period. Likewise, this time course may bevisualized in two and three-dimensional dynamic MRIseries. These time-signal intensity curves allow us todetermine whether the signal intensity continues toincrease after the initial upstroke, cuts off and reaches a* Correspondence: [email protected]
1Unidad de Investigación, Hospital de Jove, Gijón-Spain
Fernández-Guinea et al. BMC Cancer 2010, 10:8http://www.biomedcentral.com/1471-2407/10/8
© 2010 Fernández-Guinea et al; licensee BioMed Central Ltd. This is an Open Access article distributed under the terms of the CreativeCommons Attribution License (http://creativecommons.org/licenses/by/2.0), which permits unrestricted use, distribution, andreproduction in any medium, provided the original work is properly cited.

plateau, or if it just washes out. It has been demon-strated that this latter curve type is a strong indicator ofmalignancy, being independent of other criteria [5].More recently, MRI appears to have an important
value in estimating other aspects of interest in breastcancer, such as the assessment of axillary lymph nodemetastasis, or the prediction of the clinicopathologicalresponse to primary chemotherapy [3,6,7]. It has alsobeen suggested that MRI might be useful in predictingthe disease-free survival in breast cancer patients [8]. Inaddition, there are studies indicating that dynamic con-trast-enhanced MRI help to predict prognostic factorsand biological activity of breast cancer by revealing mor-phological features and enhancement parameters of theprimary tumors, such as angiogenesis, degree of fibrosis[9], histological grade [10,11], negative expression ofestrogen repeptor and progesterone receptor [11], vascu-lar endothelial growth factor (VEGF) expression [9] orHER-2 overexpression [12]. In this context, the objec-tives of this study were to investigate the relationshipbetween the MRI features of breast cancer and someother of their clinicopathological and biological charac-teristics, such as vascular invasion, peritumoral inflam-mation or VEGF-receptor-1 and 2.
MethodsPatient selection and characteristicsThis study comprised 68 women consecutively diag-nosed of early invasive breast cancer (without distantmetastasis at time of initial diagnoses) and treatedbetween 1999 and 2006. Initially, the lesions weredetected by physical examination, mammography, orultrasonography. All of the women did not receive anytype of neoadjuvant therapy. In addition, for the 68cases we obtained sufficient tissue in the paraffin blocksused for manufacturing the tissue arrays (TAs). Thepatients’ age ranged from 30 to 83 years (mean, 55.5years), and the tumor size between 0.6 cm and 12 cm(mean, 2.3 cm). A total of 54 tumors were of the ductaltype, 9 of the lobular type, 2 mucinous, one medullar,one tubullar and one papilla. Other patient characteris-tics evaluated in this study are listed in Table 1. Thehistologic grade was assessed according to criteriareported by the Nottingham modification of Bloom andRichardson score (SBR) [13]. DCIS component was pre-sent in 16 cases (23.5%)Women were treated according to the International
European Guidelines. The study adhered to nationalregulations and was approved by our institution’s Ethicsand Investigation Committee.MR ImagingAll studied subjects had exactly the same MR sequencesand parameters. MRI was performed at 1.5 Teslas(Echospeed Signa; General Electric Medicale Systems,
Milwaukee, WI, USA). After the informed consent wasobtained, patients were placed in the prone position andexamined using standard dedicated bilateral breast coils.The imaging protocol consisted of an initial scout viewthat provided axial, coronal, and sagittal images of bothbreast. These images were used to exactly localize thespatial distribution of the breast parenchymal volume.The subsequent axial dynamic series were then posi-tioned to cover the whole parenchyma.Before administration of contrast material, T1-
weighted frames were acquired in the axial plane(FSPGR -fast spoiled gradient echo- 3D; FA -flip angle-,10°; TR, 9.9 milliseconds; TE, 4.2 milliseconds; NEX, 1;2-3 mm slice thickness with no gap; 512 × 192 matrix;in-plane resolution, 0.6 × 1.8; frequency was in the ante-roposterior direction). Acquisition of dynamic imagingstarted 10s after the intravenous injection of 0.2 mmolper kilogram body weight of gadopentetate dimeglumine(Gd-DTPA) (Magnevist; Schering, Madrid, Spain), fol-lowed by a 20 ml saline solution flush, at an injectionrate of 2 mL/s, following by six series, with lasted 80seach for a total imaging time of slightly over nine min-utes. The injection unit contained no magnetic compo-nents and operated with pressurized air. Imaging timewith this frame was approximately 80s for a total ima-ging time of slightly over nine minutes. Acquisition ofdynamic imaging started 10s after contrast injection, fol-lowing by six frames. Each frame had 64 slices.Image AnalysisAll images were evaluated with the Functool algorithmon the Advantage Windows Workstation (General Elec-tric Medical Systems) by consensus between two radiol-ogists (O.F.G. and P.G.P.), with a wide experience inbreast imaging.After the dynamic series were obtained, image sub-
traction was performed to suppress the fat signal, andenhancing lesions were identified on the subtractedimages. To verify the presence of a contrast-enhancinglesion and to exclude subtraction artifacts, we also re-identified the lesions on the non-subtracted images.For each suspected lesion included in the dynamic
slices, the following morphologic features were recorded:site, size, margins, and type of enhancement. To evalu-ate kinetics, a small region of interest (ROI) is placedselectively over the most intensely enhancing area of thelesion. The ROI size was always greater than three pix-els, and without upper limit. The ROI was placed in therim enhancement during the dynamic study, when thetumors showed this finding.The lesion margins were described as well-defined
(regular) or ill-defined (irregular or spiculated). Theenhancement after Gd-DTPA administration was classi-fied as homogeneous, heterogeneous, or rimenhancement.
Fernández-Guinea et al. BMC Cancer 2010, 10:8http://www.biomedcentral.com/1471-2407/10/8
Page 2 of 12

Table
1Relationsh
ipbetwee
nmorpholog
ical
features,kinetic
patternsof
enhan
cemen
tan
dclinicop
atholog
ical
characteristicsof
patients
Morpho
logical
features
N°
Kinetic
features
Margin
Enha
ncem
entinternal
Peak
ofmaxim
umen
hanc
emen
t%
ofmaxim
unen
hanc
emen
t<2’
Curve
Type
Cha
racteristics
N°*
AB
Hom
Het/Rim
<2’
≥2’
≤15
0%>15
0%I
IIIII
Totalc
ases
6468
Men
opau
sal
status
Prem
enop
ausal
264(15.4)
22(84.6)
4(15.4)
22(84.6)
295(17.2)
24(82.8)
14(48.3)
15(51.7)
2(6.9)
11(37.9)
16(55.2)
Postmen
opausal
3812
(31.6)
26(68.4)
8(21.1)
30(78.9)
3912
(30.8)
27(69.2)
25(64.1)
14(35.9)
3(7.7)
13(33.3)
23(59)
Tumor
size
p=0.01
5
T1(<2cm
)42
14(33.3)
28(66.7)
12(28.6)
30(71.4)
4310
(23.2)
33(76.8)
28(65.1)
15(34.9)
4(9.3)
13(30.2)
26(60.5)
≥T2
(≥2cm
)22
2(9.1)
20(90.9)
022
(100
)25
7(28)
18(72)
11(44)
14(56)
1(4)
11(44)
13(52)
Nod
alstatus
N(-)
359(25.7)
26(74.3)
7(20)
28(80)
3510
(28.6)
25(71.4)
20(57.1)
15(42.9)
3(8.6)
10(28.6)
22(62.8)
N(+)
298(27.6)
21(72.4)
6(20.7)
23(79.3)
338(24.2)
25(75.8)
19(57.6)
14(42.4)
2(6.1)
15(45.4)
16(48.5)
Histological
grad
e
I22
6(27.3)
16(72.7)
5(22.7)
17(77.3)
244(16.7)
20(83.3)
14(58.3)
10(41.7)
4(16.6)
10(41.7)
10(41.7)
II24
6(25)
18(75)
5(20.8)
19(79.2)
267(26.9)
19(73.1)
13(50)
13(50)
1(3.8)
8(30.8)
17(65.4)
III18
4(22.2)
14(77.8)
2(11.1)
16(88.9)
186(33.3)
12(66.7)
12(66.7)
6(33.3)
06(33.3)
12(66.7)
Vascular
invasion
p=0.01
6
Yes
278(29.6)
19(70.4)
4(14.8)
23(85.2)
296(20.7)
23(79.3)
22(75.9)
7(24.1)
2(6.9)
11(37.9)
16(55.2)
No
378(21.6)
29(78.4)
8(21.6)
29(78.4)
3911
(28.2)
28(71.8)
17(43.6)
22(56.4)
3(7.7)
13(33.3)
23(59)
Mito
ticInde
xp=0.03
6p=0.03
≤5
296(20.7)
23(79.3)
5(17.2)
24(82.8)
334(12.1)
29(87.9)
14(42.4)
19(57.6)
4(12.1)
13(39.4)
16(48.5)
>5
3510
(28.6)
25(71.4)
7(20)
28(80)
3513
(37.1)
22(62.9)
25(71.4)
10(28.6)
1(2.9)
11(31.4)
23(65.7)
Peritum
orinflammation
p=0.04
2
Yes
3610
(27.8)
26(72.2)
7(19.4)
29(80.6)
3711
(29.7)
26(70.3)
23(62.2)
14(37.8)
1(2.7)
10(27)
26(70.3)
No
286(21.4)
22(78.6)
5(17.9)
23(82.1)
316(19.4)
25(80.6)
16(51.6)
15(48.4)
4(12.9)
14(45.2)
13(41.9)
*Fo
urcasesshow
edano
n-no
dularen
hancem
ent,so
themorph
olog
ical
features
werean
alyzed
inon
ly64
cases,an
dthekine
ticfeatures
inall68
cases.Dataareexpressedas
numbe
rof
cases(percentag
e).
Abb
reviations:A
,well-d
efined
(reg
ular);B,
ill-defined
(irregu
laror
spiculated
);Hom
:hom
ogen
eous;H
et:h
eterog
eneo
us.
Fernández-Guinea et al. BMC Cancer 2010, 10:8http://www.biomedcentral.com/1471-2407/10/8
Page 3 of 12

Quantitative analysis of Gd-DTPA uptake was basedon a two-compartment model of the pharmacokineticbehaviour of contrast medium according to three para-meters: wash-in rate, wash-out rate and amplitude ofuptake. The enhancement rate was calculated accordingto the following enhancement formula: enhancementrate = [(SIpost - SIpre)/SIpre] × 100 (%), where SIpre andSIpost are the precontrast and the postcontrast signalintensities, respectively [5]. According to the most com-monly accepted criteria, signal-intensity curves wereclassified into three categories: persistent enhancement(type I), plateau (type II) and washout (type III). Plateauand wash-out curves showed the peak of enhancementwithin the early phase of contrast administration. Pla-teau curves leveled off, whereas wash-out curve demon-strated a decrease in signal intensity after reaching amaximum signal intensity value. The following para-meters of the dynamic signal before Gd-DTPA adminis-tration were also considered: peak of maximumintensity before 2 minutes, within 2 to 4 minutes(including 2 and 4 minutes), within 4 to 6 minutes (>4minutes and 6 minutes inclusived), and after 6 minutes;percentage of maximum uptake before 2 minutes (threegroups: <100%, 100%-150%, and >150%); median (range)of the maximum uptake value before 2 minutes; and themedian (range) time to reach the maximum uptake.Tissue arrays and immunohistochemistryRoutinely fixed (overnight in 10% buffered formalin),paraffin-embedded tumor samples stored in our pathol-ogy laboratory files were used in this study. Histopatho-logically representative tumor areas were defined onhaematoxylin and eosin-stained sections and marked onthe slide. Tumor tissue array blocks were obtained bypunching a tissue cylinder (core) with a diameter of 1.5mm through a histologically representative area of each‘donor’ tumor block, which was then inserted into anempty ‘recipient’ tissue array paraffin block using amanual tissue arrayer (Beecher Instruments, Sun Prairie,WI, USA). Areas of non-necrotic cancerous tissue fromtumoral center were selected for arraying by an experi-enced pathologist (L.O.G.). Two cores were used foreach case. From the 68 tumor samples available, two tis-sue array blocks were prepared, each containing morethan 30 samples, as well as internal controls includingfour normal breast tissue samples from two healthywomen that underwent reductive mammary surgery.Serial 5-μm sections were consecutively cut with a
microtome (Leica Microsystems GmbH, Wetzlar, Ger-many) and transferred to adhesive-coated slides. Onesection from each tissue array block was stained withHaematoxylyn and eosin, and these slides were thenreviewed to confirm that the sample was representativeof the original tumor. Immunohistochemistry was doneon these sections of tissue arrays (TA) using a
TechMate TM50 autostainer (Dako, Glostrup, Den-mark). Sections were then incubated with the following(all from Dako): mouse anti-ER clone 1D5 at a dilutionof 1/50, anti-PR clone PgR 636 at a dilution of 1/50,anti-Ki67 clone MIB-1 at a dilution of 1/50, anti-p53clone DO-7 at a dilution of 1/75 and rabbit policlonalanti-HER-2/neu oncoprotein at a dilution of 1/250,mouse anti-CD34 (clone QBEnd/10 at dilution 1:1) (LabVision Corporation, Fremont CA, USA), rabbit anti Flt-1/VEGFR-1 (dilution 1:1), and Flk1/KDR/VEGFR-2(dilution 1:1) (Lab Vision Corporation, Fremont, CA,USA); all the dilutions were made in Antibody Diluent,(Dako) for 30 min at room temperature.Tissue sections were deparaffinized in xylene, and
then rehydrated in graded concentrations of ethyl alco-hol (100%, 96%, 80%, 70%, then water). To enhanceantigen retrieval for some antibodies, TA sections weremicrowave-treated (H2800 Microwave Processor, EBS-ciences, East Granby, CT, USA) in citrate buffer (TargetRetrieval Solution, Dako) at 99°C for 16 min. Endogen-ous peroxidase activity was blocked by incubating theslides in peroxidase-blocking solution (Dako) for 5 min.The EnVision Detection Kit (Dako) was used as thestaining detection system. Sections were counterstainedwith hematoxilin, dehydrated with ethanol, and perma-nently coverslipped.TA analysisFor VEGFR-1 and 2, the location of immunoreactivity,as well as the percentage of stained cells and their inten-sity, were determined. All the cases were semiquantifiedfor each protein-stained area. An image analysis systemwith the Olympus BX51 microscope and Soft analysis(analySIS®, Soft imaging system, Münster, Germany)were used as follows: tumor sections were stained withantibodies according to the method explained above andcounterstained with haematoxylin. There were differentoptical thresholds for both stains. Each core wasscanned with a 400 × power objective in two fields percore. Fields were selected by searching for the higheststaining area and finally we average the staining score.The computer program selected and traced a linearound antibody-stained areas (higher optical threshold:red spots), with the remaining, non-stained areas (hae-matoxylin-stained tissue with lower optical threshold)standing out as a blue background. Each field has anarea ratio of stained (red) versus non-stained (blue). Afinal area ratio was obtained after averaging two fields.To evaluate immunostaining intensity we used anumeric score ranging from 0 to 3, reflecting the inten-sity as follows: 0, no staining; 1, weak staining; 2, mod-erate staining; and 3, intense staining. Using an Excelspreadsheet, the mean score was obtained by multiply-ing the intensity score (I) by the percentage of stainedcells [14] and the results were added together (total
Fernández-Guinea et al. BMC Cancer 2010, 10:8http://www.biomedcentral.com/1471-2407/10/8
Page 4 of 12
score: I × PC). This overall score was then averagedwith the number of cores that were analyzed for eachpatient. If there was no tumor in a particular core, thenno score was given. In addition, for each tumor, themean score of two core biopsies was calculated.Five fields per core, corresponding to areas of higher
immunostaining and without necrosis, were evaluatedfor CD34, with a final area of 1 mm2. If there was notumor in a particular core, ten fields were evaluated inanother one in order to obtain the same final area. Weobtain a total score and this is the value of MVD ineach tumor.Staining for ERs and PgRs was scored according to the
method described by Allred et al. [15]. p53 was assessedby the number of positively stained nuclei, with greaterthan 25% of stained cells indicating a positive result.The HER-2 staining was made by immunohistochemis-try with rabbit polyclonal antibody from Dako and forthe assessment we use the Herceptest scoring guidelines.According to that a tumor was reported 2+ when aweak to moderate complete membrane staining isobserved in > 10% of tumor cells. These cases were clas-sified as equivocal and required confirmation by FISHand a tumor was reported 3+ when a strong completemembrane staining is observed in > 10% of tumor cells.These cases were classified as positives and confirmationwas not required. Ki-67 (MIB-1) was assessed by thenumber of positively stained nuclei, with greater than10% of cells staining indicating a positive result. Con-trols included breast cancer tissue with known immu-noreactivity for each antibody used in the study.Negative controls had the primary antibody omitted andreplaced by Antibody Diluent (Dako, Glostrup,Denmark).Data analysis and statistical methodsPatients were subdivided into groups based on differentclinical and pathological parameters, such as age, meno-pausal status, tumor size, nodal status, histologicalgrade, desmoplastic reaction, tumor advancing ege, vas-cular invasion, perineural invasion, necrosis, mitoticindex o peritumor inflammation. Differences in percen-tages were calculated with the chi-square test and Yates’correction when necessary. For quantitative comparison,levels of these biological parameters were expressed as amean or a median (range). We analyzed the distributionof variables by the Kolmogorov-Smirnov test. On thebase of this analysis, parametric methods (unpaired Stu-dent’s and ANOVA tests) or non-parametric rank meth-ods (Mann-Whitney and Kruskal-Wallis tests) were usedfor comparison between groups of patients. The SPSS11.5 program (SPSS Inc, Chicago, IL, USA) was used forall calculations.
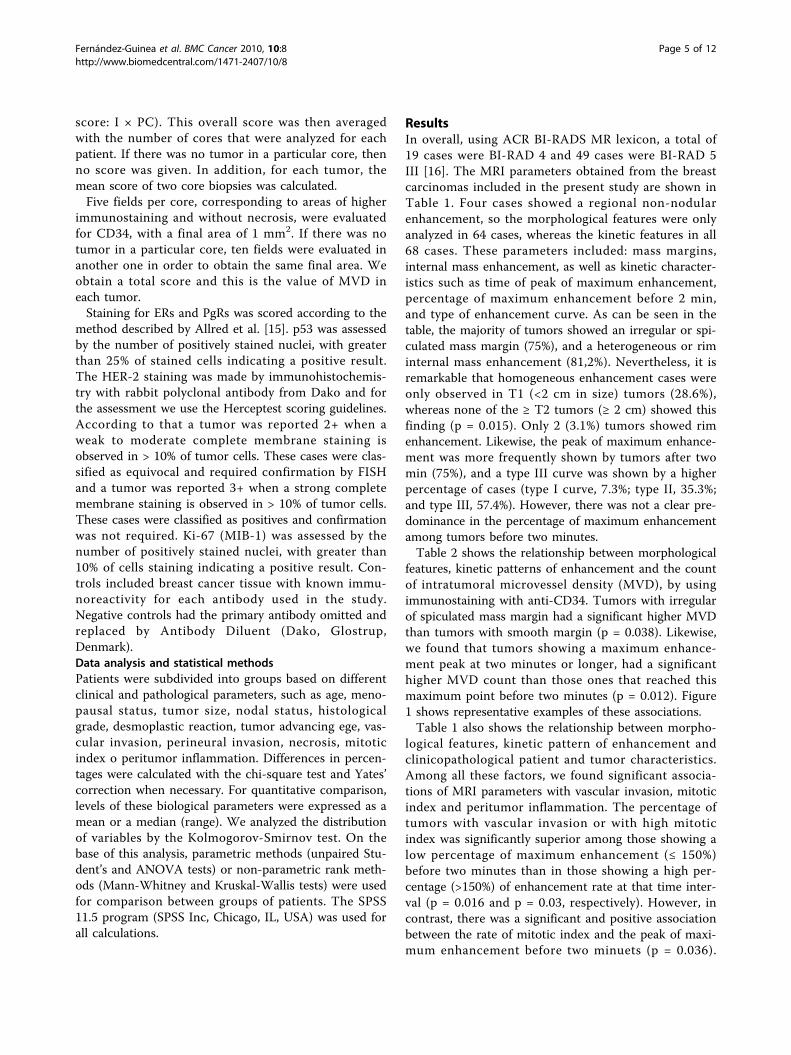
ResultsIn overall, using ACR BI-RADS MR lexicon, a total of19 cases were BI-RAD 4 and 49 cases were BI-RAD 5III [16]. The MRI parameters obtained from the breastcarcinomas included in the present study are shown inTable 1. Four cases showed a regional non-nodularenhancement, so the morphological features were onlyanalyzed in 64 cases, whereas the kinetic features in all68 cases. These parameters included: mass margins,internal mass enhancement, as well as kinetic character-istics such as time of peak of maximum enhancement,percentage of maximum enhancement before 2 min,and type of enhancement curve. As can be seen in thetable, the majority of tumors showed an irregular or spi-culated mass margin (75%), and a heterogeneous or riminternal mass enhancement (81,2%). Nevertheless, it isremarkable that homogeneous enhancement cases wereonly observed in T1 (<2 cm in size) tumors (28.6%),whereas none of the ≥ T2 tumors (≥ 2 cm) showed thisfinding (p = 0.015). Only 2 (3.1%) tumors showed rimenhancement. Likewise, the peak of maximum enhance-ment was more frequently shown by tumors after twomin (75%), and a type III curve was shown by a higherpercentage of cases (type I curve, 7.3%; type II, 35.3%;and type III, 57.4%). However, there was not a clear pre-dominance in the percentage of maximum enhancementamong tumors before two minutes.Table 2 shows the relationship between morphological
features, kinetic patterns of enhancement and the countof intratumoral microvessel density (MVD), by usingimmunostaining with anti-CD34. Tumors with irregularof spiculated mass margin had a significant higher MVDthan tumors with smooth margin (p = 0.038). Likewise,we found that tumors showing a maximum enhance-ment peak at two minutes or longer, had a significanthigher MVD count than those ones that reached thismaximum point before two minutes (p = 0.012). Figure1 shows representative examples of these associations.Table 1 also shows the relationship between morpho-
logical features, kinetic pattern of enhancement andclinicopathological patient and tumor characteristics.Among all these factors, we found significant associa-tions of MRI parameters with vascular invasion, mitoticindex and peritumor inflammation. The percentage oftumors with vascular invasion or with high mitoticindex was significantly superior among those showing alow percentage of maximum enhancement (≤ 150%)before two minutes than in those showing a high per-centage (>150%) of enhancement rate at that time inter-val (p = 0.016 and p = 0.03, respectively). However, incontrast, there was a significant and positive associationbetween the rate of mitotic index and the peak of maxi-mum enhancement before two minuets (p = 0.036).
Fernández-Guinea et al. BMC Cancer 2010, 10:8http://www.biomedcentral.com/1471-2407/10/8
Page 5 of 12

Moreover, the percentage of tumors with peritumorinflammation was considerably higher in those showingtype III curves than in those with either types I or IIcurves (p = 0.042), as well as when we compared bothtype I and type II with type III (p = 0.035). Figure 2shows representative examples of this association. Onthe other hand, our results did not show significantassociations between the different MRI parameters andmenopausal status, nodal status, histotologial grade(Table 1), patient’s age, desmoplastic reaction, tumoradvancing edge, perineural invasion, necrosis, histologi-cal type, nuclear grade or DCIS associated component(data not shown).In the present study we also analyzed the possible
relationship between morphological features, kinetic pat-terns of enhancement and some biological parameters ofinterest in breast cancer, such as ER, PgR, p53, ki67,HER2, VEGFR-1 and 2. However, as Table 3 demon-strates, our results did not show any significant associa-tion between the MRI parameters and any of thesebiological factors.
DiscussionTo evaluate the relationship between kinetic patternsand either clinical or biological variables, we chose thezones of maximum intensity of enhancement as areas ofinterest. We found significant associations of these MRIparameters with histopathological factors indicative oftumor aggressiveness, suggesting that the preoperativeMRI may provide us with clinically useful informationin invasive breast cancer.It was of note that homogeneous enhancement was
only observed in tumors smaller than 2 cm (T1),whereas none of the T2 tumors greater than 2 cm (≥T2) showed this pattern of enhancement. This findingmay be because larger size tumors (≥ T2) are biologi-cally more heterogeneous lesions than T1 tumors.Our results are in accordance with those of other
authors that reported that classical prognostic factors,such as nodal status, tumor grading or hormone recep-tor status, do not correlate with MRI parameters ininvasive breast cancer [17,18]. These findings seem toindicate that MRI could provide complementary prog-nostic to those provided by the classical factors. Like-wise, our results did not show any significantassociations between MRI findings and molecular para-meters of interest in breast cancer, such as HER2, p53,ki67, and VEGFR-1 and 2. These latter findings couldsignify that MRI reflects a biological behaviour of breastcarcinomas somehow not related to those molecular fac-tors. Nevertheless, in the present study we have foundsignificant and positive associations of MRI with severalhistopathological parameters of interest, such as MVD,peritumor inflammation, vascular invasion, and mitoticindex. Some authors reported correlation of histologicalgrade to enhancement pattern [10,19]. We also foundhigher kinetic features in grade I tumors than in gradeIII tumors, such as peak of maximum enhancement <2’of type III curve. However, the differences in these para-meters did not achieve significant differences. We con-sider that this may be due to the small size of samplefor this comparison as well as to the known inter-obser-ver variation in histological grade evaluation [20,21].It has been postulated that the rapid enhancement
demonstrated by breast carcinomas after administrationof contrast media is a direct result of tumor angiogen-esis. MVD reflects the angiogenesis activity which con-stitutes a prerequisite for the growth of malignanttumors greater than 2 millimetres. MVD is considered asignificant although weak prognostic factor in breastcancer. In the present study, we have found a variabilityof MVD among tumors, which appears to correspond totheir biological heterogeneity. In addition, our datashow that intratumor MVD was significantly associatedwith irregular mass margin as well as a maximum peak
Table 2 Relationship between morphological features,kinetic patterns of enhancement and the count ofintratumor microvessel density (MVD)
RM features N° MVDMean (range)
p
64
Morphologicalfeatures
Margin 0.038
Well defined 16 21.8 (4.9-54.4)
Irregular/Spiculated 48 32.9 (5.2-140.6)
Enhancementinternal
n.s.
Homogeneous 12 19.5 (4.9-63.2)
Heterogeneous/Rim
52 32.6 (5.2-140.6)
Kinetic features 68
Peak of maximumenhancement
0.012
< 2’ 17 20.8 (8-54.4)
≥ 2’ 51 33.6 (4.9-140.6)
% of maximunenhancement < 2’
n.s.
≤ 150% 39 31.2 (4.9-140.6)
> 150% 29 29.3 (5.2-96.5)
Curve type n.s.
I 5 36.5 (16.3-60.5)
II 24 29.6 (4.9-96.5)
III 39 30.1 (8-140.6)
* Four cases showed a non-nodular enhancement, so the morphologicalfeatures were analyzed in only 64 cases, and the kinetic features in all 68cases.Abbreviations: MVD, microvessel density; n.s, not significant.
Fernández-Guinea et al. BMC Cancer 2010, 10:8http://www.biomedcentral.com/1471-2407/10/8
Page 6 of 12

Figure 1 Breast MR image acquired in a 50-years-old patient with a palpable mass in the right inferior outer quadrant. The axialpostcontrast subtracted image (9.9/4.2; flip angle, 10°) depicts a lesion with spiculated margin of mass (arrow). The time-signal intensity curve ofthis shows a type III time course with a peak of maximal enhancement after two min. (A). Immunohistochemical staining of CD34 in the sametumor showing a high microvessel density. 100×. (B). Breast MR image acquired in a 63-years-old patient with a palpable mass in the left upperinner quadrant. The axial postcontrast subtracted image (9.9/4.2; flip angle, 10°) depicts a lesion with smooth margin of mass (arrow). The time-signal intensity curve of this shows a type III time course with a peak of maximal enhance before 2 min (C). Immunohistochemical staining ofCD34 in the same tumor showing a low microvessel density. 100×. (D).
Fernández-Guinea et al. BMC Cancer 2010, 10:8http://www.biomedcentral.com/1471-2407/10/8
Page 7 of 12

Figure 2 Breast MR image acquired in a 45-years-old patient with a palpable mass in the left upper outer quadrant. The axialpostcontrast subtracted image (9.9/4.2; flip angle, 10°) depicts a lesion with irregular margin of mass and heterogeneous enhancement (arrow).The time-signal intensity curve of this shows a type III (washout) curve. (A). Microphotography of the same tumor showing a peritumoralinflammation (arrows). 200×. (B). Breast MR image acquired in a 63-years-old patient with a palpable mass in the left upper outer quadrant. Theaxial postcontrast subtracted image (9.9/4.2; flip angle, 10°) depicts a lesion of irregular margin of mass (arrow). The time-signal intensity curve ofthis shows a type I curve. (C). Microphotography of the same tumor showing no a peritumoral inflammation. 100×. (D).
Fernández-Guinea et al. BMC Cancer 2010, 10:8http://www.biomedcentral.com/1471-2407/10/8
Page 8 of 12

Table
3Relationsh
ipbetwee
nmorpholog
ical
features,kineticspatternsof
enhan
cemen
tan
dbiological
param
eters
Biological
Parameters
Morpho
logical
features
N°
Kinetic
features
Margin
Enha
ncem
entinternal
Peak
ofmaxim
umen
hancem
ent
%of
maxim
umen
hancem
ent<2’
Curve
Type
N°*
AB
Hom
Het/Rim
<2’
≥2’
≤15
0%>15
0%I
IIIII
Totalcases
6468
Estrog
enreceptors**
Neg
ative
133(23.1)
10(76.9)
2(15.4)
11(84.6)
143(21.4)
11(78.6)
9(64.3)
5(35.7)
-9(64.3)
5(35.7)
Positive
5113
(25.5)
38(74.5)
10(19.6)
41(80.4)
5414
(25.9)
40(74.1)
30(55.6)
24(44.4)
5(9.2)
15(27.8)
34(63)
Prog
esterone
receptors**
Neg
ative
184(22.2)
14(77.8)
3(16.7)
15(83.3)
206(30)
14(70)
12(60)
8(40)
-9(45)
11(55)
Positive
4612
(26.1)
34(73.9)
9(19.6)
37(80.4)
4811
(22.9)
37(77.1)
27(56.3)
21(43.7)
5(10.4)
15(31.3)
28(58.3)
p53**
Neg
ative
5211
(21.2)
41(78.8)
9(17.3)
43(82.7)
5614
(25)
42(75)
31(55.4)
25(44.6)
5(8.9)
19(33.9)
32(57.2)
Positive
125(41.7)
7(58.3)
3(25)
9(75)
123(25)
9(75)
8(66.7)
4(33.3)
-5(41.7)
7(58.3)
HER2**
Neg
ative
3810
(26.3)
28(73.7)
8(21.1)
30(78.9)
419(22)
32(78)
23(56.1)
18(43.9)
5(12.2)
15(36.6)
21(51.2)
Positive
266(23.1)
20(76.9)
4(15.4)
22(84.6)
278(29.6)
19(70.4)
16(59.3)
11(40.7)
-9(33.3)
18(66.7)
Ki67**
6417.5
(3-85)
20(1-95)
17.5
(5-85)
20(1-95)
6820
(3-95)
15(1-85)
20(1-85)
15(1-95)
5(5-45)
15(1-85)
20(3-95)
VEGFR-1#
6459.4
(0-216.1)
54.8
(0-191)
60.7
(0-216.1)
54.2
(0-191)
6853.6
(0-216.1)
54.7
(0-191)
56.5
(0-216.1)
49.6
(0-139.5)
0(0-103.4)
50.2
(0-145.8)
56.5
(0-216.1)
VEGFR-2#
6440.9
(0-126.8)
37.7
(0-155.5)
18.8
(0-155.5)
39.7
(0-140.9)
6839.2
(0-122.1)
34.1
(0-155.5)
36.2
(0-133.6)
32.8
(0-155.5)
0(0-56.2)
34(0-155.5)
39.2
(0-140.9)
*Fo
urcasesshow
edano
n-no
dularen
hancem
ent,so
themorph
olog
ical
features
werean
alyzed
inon
ly64
cases,an
dthekine
ticfeatures
inall68
cases.
**Dataareexpressedas
numbe
rof
cases(percentag
e).
#Dataareexpressedas
med
ian(ran
ge).
Abb
reviations:A
,well-d
efined
(reg
ular);B,
ill-defined
(irregu
larospiculated
);Hom
:hom
ogen
eous;H
et:h
eterog
eneo
us.
Fernández-Guinea et al. BMC Cancer 2010, 10:8http://www.biomedcentral.com/1471-2407/10/8
Page 9 of 12

after 2 min. It seems reasonable that there is an associa-tion of high MVD with irregular margin since this mor-phology is associated with a more aggressive behaviourin breast cancer. However, the positive associationbetween MVD and delay in the maximal peak ofenhancement is a new finding. Some authors [22,23]have described a correlation of initial enhancement withMVD, but in more recent studies [24] this associationcould not be demonstrated. Nevertheless, it is importantto consider that the divergent results may be a conse-quence of differences in the techniques of microvesselquantification as well as differences in the investigatedtumor area. This latter aspect is important especially fora tumor showing heterogeneous enhancement. It isknown that there may be discrepancies in MVD estima-tion when it is evaluated in the periphery or in the cen-tre of the tumors. Thus, for example, it has beenrecently reported that the characteristic enhancement inthe periphery of breast carcinomas at MRI is not causedby an elevated MVD in the tumor periphery but ratherby a lower MVD in the tumor center [25]. We haveanalyzed the areas of higher MVD, by immunostiningwith anti-CD34, in the tumoral center, and these werecorrelated with the area that exhibits strongest enhance-ment on the first post-contrast image. Therefore, weconsider that our finding may be because the highestMVD delayed the display of the maximum enhancementcapacity of the tumors. This may be because the para-magnetic contrast spends more time in to fill in thevery vascularized tumors. Thus, this date might contri-bute to the preoperative assessment of tumor angiogen-esis, being potentially useful in selecting patients ascandidates for new therapies based on the available anti-angiogenic strategies. Nevertheless, it is also known thattumor enhancement in MRI may be influenced by sev-eral factors, in addition to the extent and pattern of vas-cularization, such as vessel permeability, cellularity,interstitial pressure, and the fraction of the extracellularspace [26]. As mentioned before, we have also analyzedthe possible relationship between MRI parameters andthe expression of both VEGFR-1 and 2 in breast carci-nomas. These two tyrosine kinase receptors are themajor mediators of the mitogenic and permeability-enhancing effects of vascular endothelial growth factor(VEGF) on cells. VEGF acts as a potent and selectiveendothelial mitogen, inducing a rapid and completeangiogenic response [27]. In addition, there are datasuggesting that VEGF expression is associated with con-trast diffusion [9]. However, our results did not showany significant associations between these growth-recep-tor expressions and MRI parameters.Angiogenesis is necessary for a tumor to grow but not
sufficient for it metastasize. There are biological differ-ences between the ability of tumors to develop advanced
neovascularization and their ability to invade blood ves-sels, this latter one being recognized as a more potentprognostic factor of poor outcome in breast cancer. Infact, in the present study we did not find any significantdifferences in MVD count between tumors with vascularinvasion (mean MVD: 29.8 (range: 4.9-66.3)) and thosewithout vascular invasion (30.9(5.2-146)). In this study,vascular invasion was defined as either the presence ofneoplastic cells with fibrin clots, erythrocytes, or bothwithin an endothelial-lined space without erythrocyteextravasation into the surrounding tissue or by the pre-sence of neoplastic cells within a smooth muscle cell-lined space. Furthermore, we confirmed additionalimmunostaining with anti-CD34 as a pan-endothelialmarker. Our results showed that the vascular invasionand a high mitotic index were significantly and posi-tively associated with a low percentage of maximumenhancement (≤ 150%) before two minutes. These asso-ciations may be explained due a lower number of func-tional vessels because the occupation of these ones bycancerous cells with high proliferate rate, which preventa fast passage of paramagnetic contrast. Even so, ourdata suggest a value for the dynamic MRI in assessingthe metastatic potential of breast carcinomas. In con-trast, there was a significant and positive associationbetween the rate of mitotic index and the peak of maxi-mum intensity before two minutes, which is in accor-dance with previous studies reporting a positiveassociation between MRI parameters and other prolif-erative parameters, such as high DNA S-phase percen-tage [28] or proliferative cellular activity as shown byproliferative nuclear antigen (PCNA) immunoreactivity[22]. Therefore our data appears to indicate that theproliferative activity and the invasive potential of cancer-ous cells could be, at least partially, unrelated processes.We also consider remarkable our finding of a signifi-
cant relationship between peritumor inflammation andsignal-intensity curves type III. Mononuclear inflamma-tory cells may account for as much as 50% of the totaltumor mass in some invasive carcinomas. Historically,tumor-infiltrating leukocytes have been considered to bemanifestations of an intrinsic defence mechanismagainst tumor development [29]. However, there aredata indicating that leukocyte infiltration might promotetumor phenotypes, such as angiogenesis, growth, andinvasion [30]. This may be because inflammatory cellsprobably influence cancer promotion by secreting cyto-kines, growth factors, chemokines and proteases, stimu-lating proliferation and invasiveness of cancerous cells[31]. This association between peritumor inflammationand a type III curve is, to the best of our knowledge, anew finding. A time course curve type III is a strongindicator of malignancy and is independent of other cri-teria [5]. In addition, the detection of a washout
Fernández-Guinea et al. BMC Cancer 2010, 10:8http://www.biomedcentral.com/1471-2407/10/8
Page 10 of 12

phenomenon suggests the presence of an increased ves-sel density and arterio-venous anastomoses with rapidoutflow and thus fading of the contrast material [23].Therefore, our finding may to contribute to the charac-terization of the possible biological influence of infiltrat-ing mononuclear inflammatory cells in breast cancer.Limitation of the present study is the difficult to asses
exactly the tumor localization evaluated by MRI and his-tologically. Nevertheless, we consider that we performeda reasonable correlation between both types of evalua-tions. Certainly there are other possible parameters forevaluating MRI and both histological and biologicalaspects of breast carcinomas, which should be investi-gated in futures studies. In addition, prospective studiesare necessary to asses the potential value of MRI para-metrers as prognostic factors in breast cancer.
ConclusionsIn conclusion, especially relevant are our findings thatvariations in the dynamic MRI parameters seem to beassociated with parameters indicatives of tumor aggres-siveness, such as high MVD count, vascular invasion,high mitotic index in breast cancer or peritumor inflam-mation. Therefore, our results are in accordance withprevious report indicating the potential value of dynamicMRI for better characterizing breast cancer.
Acknowledgementsthis work was supported by grants from: Fondo de Inversión Sanitaria delInstituto Carlos III (FIS-PI070306) (FIS-Spain).
Author details1Unidad de Investigación, Hospital de Jove, Gijón-Spain. 2Servicio deRadiodiagnóstico, Hospital de Jove, Gijón-Spain. 3Servicio de Cirugía General,Hospital de Jove, Gijón-Spain. 4Servicio de Anatomía Patológica, Hospital deJove, Gijón-Spain. 5Instituto Universitario de Oncología del Principado deAsturias, Oviedo-Spain. 6Servicio de Anatomía Patológica, Hospital deCabueñes, Gijón-Spain. 7Departamento de Morfología y Biología Celular,Universidad de Oviedo-Spain.
Authors’ contributionsguarantor of integrity of the entire study- FGO; study concepts and design-FGO, LH, LMA and VF; literature research- FGO, LH and VF; clinical studies-FGO, GPP and VF; experimental studies/data analysis-FGO, GL, GRS, AA and;statistical análisis- A and; manuscript preparation- FGO and VF; manuscriptediting- FGO and GRS. All authors read and approved the final manuscript.
Competing interestsThe authors declare that they have no competing interests.
Received: 14 April 2009Accepted: 8 January 2010 Published: 8 January 2010
References1. Orel SG, Schnall MD, Powell CM, Hochman MG, Solin LJ, Fowble BL,
Torosian MH, Rosato EF: Staging of suspected breast cancer: effect of MRimaging and MR-guided biopsy. Radiology 1995, 196:115-122.
2. Liberman L: Breast MR imaging in assessing extent of disease. MagnReson Imaging Clin N Am 2006, 14:339-349.
3. Kuhl C: Current status of breast MR imaging. Part 2. Clinical applications.Radiology 2007, 244:672-691.
4. Boetes C, Barentsz JO, Mus RD, Sluis van der RF, van Erning LJ, Hendriks JH,Holland R, Ruys SH: MR characterization of suspicious breast lesions witha gadolinium-enhanced TurboFLASH subtraction technique. Radiology1994, 193:777-781.
5. Kuhl CK, Mielcareck P, Klaschik S, Leutner C, Wardelmann E, Gieseke J,Schild HH: Dynamic breast MR imaging: are signal intensity time coursedata useful for differential diagnosis of enhancing lesions?. Radiology1999, 211:101-110.
6. Padhani AR, Hayes C, Assersohn L, Powles T, Makris A, Suckling J,Leach MO, Husband JE: Prediction of clinicopathologic response of breastcancer to primary chemotherapy at contrast-enhanced MR imaging:initial clinical results. Radiology 2006, 239:361-374.
7. Hylton N: MR imaging for assessment of breast cancer response toneoadjuvant chemotherapy. Magn Reson Imaging Clin N Am 2006, 14:383-389.
8. Bone B, Szabo BK, Perbeck LG, Veress B, Aspelin P: Can contrast-enhancedMR imaging predict survival in breast cancer?. Acta Radiol 2003, 44:373-378.
9. Matsubayashi R, Matsuo Y, Edakuni G, Satoh T, Tokunaga O, Kudo S: Breastmasses with peripheral rim enhancement on dynamic contrast-enhanced MR images: correlation of MR findings with histologic featuresand expression of growth factors. Radiology 2000, 217:841-848.
10. Tuncbilek N, Karakas HM, Okten OO: Dynamic magnetic resonanceimaging in determining histopathological prognostic factors of invasivebreast cancers. Eur J Radiol 2005, 53:199-205.
11. Hara T, Miyazaki H, Lee A, Tran CP, Reiter RE: Androgen receptor andinvasion in prostate cancer. Cancer Res 2008, 68:1128-1135.
12. Montemurro F, Martincich L, Sarotto I, Bertotto I, Ponzone R, Cellini L,Redana S, Sismondi P, Aglietta M, Regge D: Relationship between DCE-MRI morphological and functional features and histopathologicalcharacteristics of breast cancer. Eur Radiol 2007, 17:1490-1497.
13. Dixon AR, Ellis IO, Elston CW, Blamey RW: A comparison of the clinicalmetastatic patterns of invasive lobular and ductal carcinomas of thebreast. Br J Cancer 1991, 63:634-635.
14. Liu N, Lapcevich RK, Underhill CB, Han Z, Gao F, Swartz G, Plum SM,Zhang L, Green SJ: Metastatin: a hyaluronan-binding complex fromcartilage that inhibits tumor growth. Cancer Res 2001, 61:1022-1028.
15. Allred DC, Harvey JM, Berardo M, Clark GM: Prognostic and predictivefactors in breast cancer by immunohistochemical analysis. Mod Pathol1998, 11:155-168.
16. BI-RADS: American College of Radiology. Breast imaging reporting anddata system. Reston, VA: American College of Radiology, 4 2003.
17. Stomper PC, Herman S, Klippenstein DL, Winston JS, Edge SB,Arredondo MA, Mazurchuk RV, Blumenson LE: Suspect breast lesions:findings at dynamic gadolinium-enhanced MR imaging correlated withmammographic and pathologic features. Radiology 1995, 197:387-395.
18. Fischer U, Kopka L, Brinck U, Korabiowska M, Schauer A, Grabbe E:Prognostic value of contrast-enhanced MR mammography in patientswith breast cancer. Eur Radiol 1997, 7:1002-1005.
19. Lee SH, Cho N, Kim SJ, Cha JH, Cho KS, Ko ES, Moon WK: Correlationbetween high resolution dynamic MR features and prognostic factors inbreast cancer. Korean J Radiol 2008, 9:10-18.
20. Gilchrist KW, Kalish L, Gould VE, Hirschl S, Imbriglia JE, Levy WM,Patchefsky AS, Penner DW, Pickren J, Roth JA, et al: Interobserverreproducibility of histopathological features in stage II breast cancer. AnECOG study. Breast Cancer Res Treat 1985, 5:3-10.
21. Elledge RM, McGuire WL, Osborne CK: Prognostic factors in breast cancer.Semin Oncol 1992, 19:244-253.
22. Bone B, Aspelin P, Bronge L, Veress B: Contrast-enhanced MR imaging asa prognostic indicator of breast cancer. Acta Radiol 1998, 39:279-284.
23. Frouge C, Guinebretiere JM, Contesso G, Di Paola R, Blery M: Correlationbetween contrast enhancement in dynamic magnetic resonanceimaging of the breast and tumor angiogenesis. Invest Radiol 1994,29:1043-1049.
24. Szabo BK, Aspelin P, Kristoffersen Wiberg M, Tot T, Bone B: Invasive breastcancer: correlation of dynamic MR features with prognostic factors. EurRadiol 2003, 13:2425-2435.
25. Teifke A, Behr O, Schmidt M, Victor A, Vomweg TW, Thelen M, Lehr HA:Dynamic MR imaging of breast lesions: correlation with microvesseldistribution pattern and histologic characteristics of prognosis. Radiology2006, 239:351-360.
Fernández-Guinea et al. BMC Cancer 2010, 10:8http://www.biomedcentral.com/1471-2407/10/8
Page 11 of 12
26. Kuhl CK, Schild HH: Dynamic image interpretation of MRI of the breast. JMagn Reson Imaging 2000, 12:965-974.
27. Carmeliet P: VEGF as a key mediator of angiogenesis in cancer. Oncology2005, 69(Suppl 3):4-10.
28. Stomper PC, Herman S, Klippenstein DL, Winston JS, Budnick RM,Stewart CC: Invasive breast carcinoma: analysis of dynamic magneticresonance imaging enhancement features and cell proliferative activitydetermined by DNA S-phase percentage. Cancer 1996, 77:1844-1849.
29. Lin EY, Pollard JW: Role of infiltrated leucocytes in tumour growth andspread. Br J Cancer 2004, 90:2053-2058.
30. Adams TE, Alpert S, Hanahan D: Non-tolerance and autoantibodies to atransgenic self antigen expressed in pancreatic beta cells. Nature 1987,325:223-228.
31. Gonzalez LO, Pidal I, Junquera S, Corte MD, Vazquez J, Rodriguez JC,Lamelas ML, Merino AM, Garcia-Muniz JL, Vizoso FJ: Overexpression ofmatrix metalloproteinases and their inhibitors in mononuclearinflammatory cells in breast cancer correlates with metastasis-relapse. BrJ Cancer 2007, 97:957-963.
Pre-publication historyThe pre-publication history for this paper can be accessed here:http://www.biomedcentral.com/1471-2407/10/8/prepub
doi:10.1186/1471-2407-10-8Cite this article as: Fernández-Guinea et al.: Relationship betweenmorphological features and kinetic patterns of enhancement of thedynamic breast magnetic resonance imaging and clinico-pathologicaland biological factors in invasive breast cancer. BMC Cancer 2010 10:8.
Publish with BioMed Central and every scientist can read your work free of charge
"BioMed Central will be the most significant development for disseminating the results of biomedical research in our lifetime."
Sir Paul Nurse, Cancer Research UK
Your research papers will be:
available free of charge to the entire biomedical community
peer reviewed and published immediately upon acceptance
cited in PubMed and archived on PubMed Central
yours — you keep the copyright
Submit your manuscript here:http://www.biomedcentral.com/info/publishing_adv.asp
BioMedcentral
Fernández-Guinea et al. BMC Cancer 2010, 10:8http://www.biomedcentral.com/1471-2407/10/8
Page 12 of 12
Related Documents