Relationship between fMRI-identified regions and neuronal category-selectivity Andrew H. Bell 1 , Nicholas J. Malecek 1 , Elyse L. Morin 1 , Fadila Hadj-Bouziane 1 , Roger B.H. Tootell 1,2,3 , and Leslie G. Ungerleider 1 1 Laboratory of Brain and Cognition, National Institute of Mental Health, National Institutes of Health, Bethesda, Maryland, USA, 20892 2 Athinoula A. Martinos Center for Biomedical Imaging, Massachusetts General Hospital, Charlestown, Massachusetts, USA, 02129 3 Department of Radiology, Harvard Medical School, Boston, Massachusetts, USA, 02115 Abstract Functional magnetic resonance imaging (fMRI) has been used extensively to identify regions in the inferior temporal (IT) cortex that are selective for categories of visual stimuli. However, comparatively little is known about the neuronal responses relative to these fMRI-defined regions. Here, we compared in non-human primates the distribution and response properties of IT neurons recorded within vs. outside fMRI regions selective for four different visual categories: faces, body-parts, objects, and places. Although individual neurons that preferred each of the four categories were found throughout the sampled regions, they were most concentrated within the corresponding fMRI region, decreasing significantly within 1–4 mm from the edge of these regions. Further, the correspondence between fMRI and neuronal distributions was specific to neurons that increased their firing rates in response to the visual stimuli, but not to neurons suppressed by visual stimuli, suggesting that the processes associated with inhibiting neuronal activity did not contribute strongly to the fMRI signal in this experiment. Keywords face processing; object recognition; superior temporal sulcus; functional magnetic resonance imaging; body parts; non-human primate INTRODUCTION Over the past fifteen years, numerous studies have used functional magnetic resonance imaging (fMRI) to identify the neural structures involved in the perception and recognition of complex visual stimuli (Reddy and Kanwisher, 2006 for review; Op de Beeck et al., 2008; see Mahon and Caramazza, 2009). These studies have revealed a number of category- selective regions located throughout the inferior temporal (IT) cortex in both humans (e.g., Puce et al., 1995; Kanwisher et al., 1997; Epstein and Kanwisher, 1998; Downing et al., 2001; Haxby et al., 2001; Schwarzlose et al., 2005) and monkeys (e.g., Tsao et al., 2003; Pinsk et al., 2005; Bell et al., 2009; Pinsk et al., 2009; Rajimehr et al., 2009). Such regions provide a neuroanatomical basis for the behavioral (e.g., Rosch and Mervis, 1975; Rosch et al., 1976; Murphy and Brownell, 1985) and neurological (Bodamer, 1947; Damasio et al., Address Correspondence to: Andrew H. Bell Laboratory of Brain and Cognition National Institute of Mental Health 49 Convent Drive, 1B80 Bethesda, MD 20892 Office: (301) 443-8417 Fax: (301) 402-0046 [email protected]. NIH Public Access Author Manuscript J Neurosci. Author manuscript; available in PMC 2011 September 2. Published in final edited form as: J Neurosci. 2011 August 24; 31(34): 12229–12240. doi:10.1523/JNEUROSCI.5865-10.2011. NIH-PA Author Manuscript NIH-PA Author Manuscript NIH-PA Author Manuscript

Welcome message from author
This document is posted to help you gain knowledge. Please leave a comment to let me know what you think about it! Share it to your friends and learn new things together.
Transcript
Relationship between fMRI-identified regions and neuronalcategory-selectivity
Andrew H. Bell1, Nicholas J. Malecek1, Elyse L. Morin1, Fadila Hadj-Bouziane1, Roger B.H.Tootell1,2,3, and Leslie G. Ungerleider1
1Laboratory of Brain and Cognition, National Institute of Mental Health, National Institutes ofHealth, Bethesda, Maryland, USA, 208922Athinoula A. Martinos Center for Biomedical Imaging, Massachusetts General Hospital,Charlestown, Massachusetts, USA, 021293Department of Radiology, Harvard Medical School, Boston, Massachusetts, USA, 02115
AbstractFunctional magnetic resonance imaging (fMRI) has been used extensively to identify regions inthe inferior temporal (IT) cortex that are selective for categories of visual stimuli. However,comparatively little is known about the neuronal responses relative to these fMRI-defined regions.Here, we compared in non-human primates the distribution and response properties of IT neuronsrecorded within vs. outside fMRI regions selective for four different visual categories: faces,body-parts, objects, and places. Although individual neurons that preferred each of the fourcategories were found throughout the sampled regions, they were most concentrated within thecorresponding fMRI region, decreasing significantly within 1–4 mm from the edge of theseregions. Further, the correspondence between fMRI and neuronal distributions was specific toneurons that increased their firing rates in response to the visual stimuli, but not to neuronssuppressed by visual stimuli, suggesting that the processes associated with inhibiting neuronalactivity did not contribute strongly to the fMRI signal in this experiment.
Keywordsface processing; object recognition; superior temporal sulcus; functional magnetic resonanceimaging; body parts; non-human primate
INTRODUCTIONOver the past fifteen years, numerous studies have used functional magnetic resonanceimaging (fMRI) to identify the neural structures involved in the perception and recognitionof complex visual stimuli (Reddy and Kanwisher, 2006 for review; Op de Beeck et al.,2008; see Mahon and Caramazza, 2009). These studies have revealed a number of category-selective regions located throughout the inferior temporal (IT) cortex in both humans (e.g.,Puce et al., 1995; Kanwisher et al., 1997; Epstein and Kanwisher, 1998; Downing et al.,2001; Haxby et al., 2001; Schwarzlose et al., 2005) and monkeys (e.g., Tsao et al., 2003;Pinsk et al., 2005; Bell et al., 2009; Pinsk et al., 2009; Rajimehr et al., 2009). Such regionsprovide a neuroanatomical basis for the behavioral (e.g., Rosch and Mervis, 1975; Rosch etal., 1976; Murphy and Brownell, 1985) and neurological (Bodamer, 1947; Damasio et al.,
Address Correspondence to: Andrew H. Bell Laboratory of Brain and Cognition National Institute of Mental Health 49 ConventDrive, 1B80 Bethesda, MD 20892 Office: (301) 443-8417 Fax: (301) 402-0046 [email protected].
NIH Public AccessAuthor ManuscriptJ Neurosci. Author manuscript; available in PMC 2011 September 2.
Published in final edited form as:J Neurosci. 2011 August 24; 31(34): 12229–12240. doi:10.1523/JNEUROSCI.5865-10.2011.
NIH
-PA Author Manuscript
NIH
-PA Author Manuscript
NIH
-PA Author Manuscript

1982; Epstein et al., 2001) evidence suggesting that object recognition includes a stage atwhich stimuli are classified according to their semantic category. However, relatively littleis known about the neuronal characteristics of these fMRI-identified category-selectiveregions because the relationship between the fMRI signal and the firing of individualneurons is still under investigation (Logothetis, 2002; Goense and Logothetis, 2008; Lee etal., 2010).
Recently, Tsao and colleagues (Tsao et al., 2006) sampled a small number of sites within afMRI-identified face-selective region in the superior temporal sulcus (STS) of monkeys, andreported that virtually all visually-responsive neurons (97%) at those sites were stronglyface-selective. This study provided a critical piece of evidence linking the fMRI signal withthe spiking activity of individual neurons. However, a number of crucial questions remain.First, are face-selective neurons also found outside of fMRI-identified face-selective regions– and, if so, in what concentrations? Second, does the relationship between neuronalpreferences and fMRI selectivity extend to categories other than faces? Third, does therelationship differ for neurons that increase their spiking activity in response to visualstimuli, compared to those that decrease their activity? Finally, does the degree of categoryselectivity differ between neurons found inside vs. outside these fMRI-identified category-selective regions?
Here we address these questions by contrasting the distribution and response properties ofvisually-responsive neurons in IT cortex in two monkeys, both inside and outside fMRIregions selective for four stimulus categories: faces, body-parts, objects, and places.
METHODSAll procedures were approved by the National Institute of Mental Health (NIMH) AnimalCare and Use Committee and conform to all NIH guidelines. Two adult male rhesusmonkeys (Macaca mulatta) were used in this study (10–12 kg). An MR compatible headpost was implanted for training and imaging experiments. Following identification of theregions of interest using functional magnetic resonance imaging (fMRI) (see below), asecond surgery was performed during which a MR compatible recording chamber wasimplanted (centered 12–14 mm anterior to the interaural axis, left hemisphere for monkey S,right hemisphere for monkey W) over a 19-mm craniotomy. Centering the chamber thusprovided access to a portion of the relevant category-selective regions identified by fMRI.Confirmation of the placement of the recording chamber and electrodes was accomplishedby collecting additional anatomical scans post-surgery, with and without electrode(s) inplace (e.g., Fig. 2A; see below for details).
Summary of Neuroimaging TechniquesFunctional neuroimaging data described in this study were collected at the Martinos Centerfor Biomedical Imaging, at the Massachusetts General Hospital (MGH) (monkey S, single-loop send/receive coil, TR=2.5 s, TE=28 ms, 35 coronal slices) and at the NIH FMRI CoreFacility (monkey W, 8 channel phased-array coil, TR=2 s, TE=17.9 ms, 27 coronal slices).All procedures conformed to guidelines set by the MGH Center for Comparative Medicineand the NIMH Animal Care and Use Committee. Details regarding the collection offunctional neuroimaging data are described elsewhere (Bell et al., 2009). Briefly, functionalscans (1.25×1.25×1.90 mm for monkey S, 1.56×1.56×1.55 mm for monkey W) covering thetemporal lobe were collected at 3T while monkeys performed a passive fixation task.Monkeys were required to maintain stable fixation within 3 degrees of a central fixationpoint while stimuli from one of four visual categories (monkey faces, monkey body-parts,familiar objects, and familiar places) were presented foveally (Fig. 1A). Stimuli wereconverted to grayscale, matched for overall luminance, and resized without altering the
Bell et al. Page 2
J Neurosci. Author manuscript; available in PMC 2011 September 2.
NIH
-PA Author Manuscript
NIH
-PA Author Manuscript
NIH
-PA Author Manuscript
aspect ratio, such that the largest dimension (height and/or width) was 22° in size. Stimuliwere presented on a random-dot pattern (Fig. 1A; matching the control condition, see below)to produce an overall stimulus width of 40° across. The random-dot pattern was producedusing a custom Matlab (The MathWorks Inc.) program designed to match the overallluminance of the stimuli. The stimuli were presented in blocks of 15–16 images each (15 formonkey W, 16 for monkey S), selected from a set of 48 (45 in the case of monkey W, takenfrom the same pool) possible exemplars per category (stimulus presentation time: 2 s = 30-or 32-s blocks for monkey S and monkey W, respectively). Except in the case of abortedsessions, each of the exemplars was presented an equal number of times within a givensession (for further details regarding the stimuli, including an analysis of stimulus similarity,see Bell et al., 2009). Runs also included blocks of baseline fixation (blank screen + fixationpoint) as well as a random-dot pattern control block (i.e., the “scrambled” condition, Fig. 8).Runs lasted either 5m10s or 5m40s (for monkey S and W, respectively), and monkeyscompleted 18–32 runs/session. Eye position was monitored throughout, and runs in whichthe monkey failed to maintain fixation for at least 85% of the run were rejected. Short breaksin fixation lasting less than 200 ms (e.g., due to blinks) were ignored. To improve thecontrast-to-noise ratio, monkeys were injected with an iron-based contrast agent (mono-crystalline iron nanoparticle; MION) prior to every scan session (Vanduffel et al., 2001;Leite et al., 2002).
To define the category-selective regions in the fMRI data, we contrasted each category tothe other three (thresholded to at least p<0.05, corrected for multiple comparisons). Toidentify voxels selective for complex images, the output was masked with a contrast of all 4categories vs. the random dot pattern (thresholded to at least p<10−10). Note that this methodof defining category-selective (in particular, face-selective) regions in the monkey brain issubtly different from others in the literature, and likely affects the number of regionsobserved. For example, in Tsao and colleague's pioneering study (Tsao et al., 2003),contrasting faces to non-face objects produced 3 face-selective regions per hemisphere.Several years later, using a modified approach (i.e., MION and a multi-echo sequence), theyincreased this number to 6 (Moeller et al., 2008). Other laboratories, including our own,have reported between 2–6 regions per hemisphere (Pinsk et al., 2005; Bell et al., 2009;Pinsk et al., 2009). With numerous methodological advances (e.g., the use of MION,phased-array coils, and multi-echo sequences), it is likely that the ability to tease apartsubdivisions of the original 3 larger regions has been enhanced. In the context of the currentstudy, the exact number of patches is not as important as their relationship to the underlyingneuronal distributions.
Electrophysiological ExperimentsMonkeys performed a “Rapid Serial Visual Presentation” (RSVP) task (Foldiak et al., 2004)while single-unit data were recorded from the inferior temporal (IT) cortex. Monkeys wererequired to maintain stable fixation within 3° from a central fixation point while imagesfrom five semantic categories (monkey faces, monkey body-parts, fruit, familiar objects, andfamiliar places) were presented in rapid succession. Responses to fruit stimuli were collectedas part of another study, and have therefore been omitted from all further analyses. Theremaining test stimuli consisted of 80 grayscale images selected from the same stimulus setused for the fMRI experiments (see above). Stimuli were controlled for overall luminance,presented on a black background, and organized into four semantic categories of interestwith 20 individual stimuli each (e.g., Fig. 1A). Face stimuli were cropped (oval) to furthercontrol for differences in shape and aspect ratio. Each stimulus was presented 3–5 times/neuron (i.e., 60–100 repetitions per category). Each trial began with an initial fixation periodof 100–300 ms. The stimulus was then presented foveally for 300 ms, followed by anadditional 100 ms fixation interval after which time a liquid reward was given. Fixation
Bell et al. Page 3
J Neurosci. Author manuscript; available in PMC 2011 September 2.
NIH
-PA Author Manuscript
NIH
-PA Author Manuscript
NIH
-PA Author Manuscript
performance of the animal was often greater than 90%, and trials in which the monkey failedto maintain fixation throughout the entire trial were rejected. In contrast to the fMRIexperiments, stimuli were smaller (approximately 5×5°) and were presented unblocked inrandom order in order to characterize neuronal responses to individual exemplars. Given therepeated demonstrations of size invariance in IT cortex (e.g., Sato et al., 1980; Ito et al.,1995; Rust and Dicarlo, 2010), it is unlikely that the differences in stimulus size between thetwo experiments had a significant impact on the observed category selectivity.
During recording sessions, 1–4 electrodes were lowered into IT cortex, guided by transduralguidetubes held in place by a delrin grid (Crist Instruments, Hagerstown, MD). Accurate andreliable targeting of the fMRI-identified category-selective regions in IT cortex was essentialto this study. To avoid/minimize possible bending of the electrodes, which could havecompromised the alignment between electrode penetrations and the fMRI data, we usedlarger diameter electrodes (250 μm) and passed them through rigid guide tubes (55–65 mmin length) that terminated within the superior temporal gyrus, greatly reducing the distancethe electrodes had to travel without guidance. To localize our electrode penetrations relativeto the fMRI data, we collected several additional anatomical scans (at 4.7T, FLASH and/orT2-weighted 2-D sequences, 0.5×0.5×1.0 mm voxels) with electrodes positioned at strategicdepths (based on stereotaxic coordinates and activity landmarks) and locations relative to therecording grid (e.g., cardinal positions; Fig. 2A). These scans confirmed that there wasminimal bending or deviation of the electrode's trajectory upon exiting the guide tube. Theanatomical scans were first aligned to the functional data, using both automated and manualalignment procedures (see Bell et al., 2009 for details) such that the area of the fMRI-identified category-selective maps accessible from the recording chamber could beidentified. Using both the electrode scans and fixed landmarks (e.g., edges of the recordingchamber) as guides, we then extrapolated the position of each grid hole relative to thefunctional data (Fig. 2B).
The accuracy of this registration procedure depends on both the alignment between thefunctional and anatomical scans, as well as the ability to precisely localize the electrode tipon the MR images. In the case of the former, using well-established automated alignmentprocedures can minimize errors. In the case of the latter, there is an unavoidable margin oferror given the limited resolution of the in situ anatomical scans relative to the diameter ofthe electrode. In order to account for both of these sources of alignment error, we did notcompare the neuronal distributions or properties within individual penetrations to individualvoxels. Instead, we compared the distributions of all penetrations targeting a particularcategory-selective region. Further, we grouped the data from penetrations outside an area ofinterest into those within 1–4 mm (i.e., NEAR) vs. those greater than 4 mm from the givenregion (OUT, see Results).
Based on the prior fMRI, we assigned each grid hole a color corresponding to the fMRI-identified category-selectivity found at the level of the inferior bank of the STS, where allneuronal recordings were performed. The grid had holes spaced 1 mm apart, and allowed forrecordings over approximately 154 mm2 of IT cortex (5–19 mm anterior to the interauralaxis in monkey S, 7–21 mm in monkey W). Waveform data were sampled at 40 kHz andlater sorted into individual units using Offline-Sorter (Plexon Systems, Dallas TX).
Data AnalysisSpike trains were first converted to spike-density functions using a normal Gaussian kernel.Each action potential was converted to an individual Gaussian pulse having a total area of 1(spike) and a standard deviation (σ) of 10 ms. The individual pulses were summed togetherto yield a single spike density function for each trial. The magnitude of the visual responsefor each trial was defined as the mean spike density 50–300 ms following stimulus onset.
Bell et al. Page 4
J Neurosci. Author manuscript; available in PMC 2011 September 2.
NIH
-PA Author Manuscript
NIH
-PA Author Manuscript
NIH
-PA Author Manuscript

Each neuron was classified according to the following criteria: visually responsive vs. non-responsive, category-selective vs. not category-selective, and stimulus-selective vs. notstimulus-selective (within their preferred category). A neuron was classified as visuallyresponsive if the mean response to any of the 4 categories of interest (faces, body-parts,objects, or places) was significantly (Wilcoxon Rank Sum Test; P<0.05) different frombaseline (defined as the average activity 200 ms prior to 50 ms after stimulus onset). If theaverage response for a given category was less than the average baseline response, thecategory response was defined as “suppressed”. If the response was greater than the averagebaseline response, the response was defined as “excitatory”. Note that it was possible for asingle neuron to show both excitatory and suppressed responses (e.g., Fig. 3C).
To determine if a given visually responsive neuron was category-selective, we compared theaverage responses to each of the four categories using a one-way ANOVA. Neurons with amain effect of category (p<0.05) were defined as “category-selective”. The degree to whicha neuron was selective for a given category was calculated using the following formula:
where CSIa is the category selectivity index for category “a”, Ra is the response to category“a”, and Rb-Rd are the responses to the remaining categories. Note that all CSI calculationswere done using the raw firing rates of each neuron (not the normalized responsemagnitudes) to avoid artificially inflating values due to the inclusion of negative responses.A high absolute CSI value indicates a category response that is very different than theaverage response to the remaining three categories (i.e., strong category selectivity); a lowabsolute CSI value indicates a category response that is only marginally different from theaverage response to the remaining three categories (i.e., weak category selectivity). Todetermine if a given visually responsive neuron was sensitive to stimulus identity (i.e.,“stimulus-selective” neuron), we compared the average responses to each of the 20exemplars within a given category using a one-way ANOVA. Neurons with a main effect ofstimulus identity (p<0.05) were defined as “stimulus-selective”. Response latency wasdefined as the point where the average activity exceeded baseline + two standard deviationsfor a minimum of 20 ms. Values below 50 ms were discarded.
RESULTSSummary of fMRI findings
Figure 1B shows maps of the different category-selective regions identified using fMRI fortwo monkey subjects: the left hemisphere for monkey S (based on 9,916 functional volumes,74 blocks/condition), and the right hemisphere for monkey W (based on 12,580 functionalvolumes, 74 blocks/condition). As described previously (Bell et al., 2009), we identifiedregions selective for each of four categories tested: faces, body-parts, objects, and places.These category-selective regions were concentrated in the inferior bank of the STS, butextended to the ventral surface of IT cortex. In the left hemisphere of monkey S (Fig. 1B,left), we identified two face-selective regions: one was located anteriorly in area TE(centered at +17–18 mm anterior to the interaural axis) and the other was located posteriorlyin/near area TEO (centered at +5–6 mm). These regions correspond to the “anterior” and“middle” face-selective regions previously identified by Tsao and colleagues (Tsao et al.,2003; Tsao et al., 2006) and Pinsk and colleagues (Pinsk et al., 2005; Pinsk et al., 2009); andto the “anterior” and “posterior” face-selective regions of others (Hadj-Bouziane et al.,2008; Bell et al., 2009; Rajimehr et al., 2009). Also consistent with previous studies (Pinsket al., 2005; Tsao et al., 2003; Bell et al., 2009), two regions selective for body-parts were
Bell et al. Page 5
J Neurosci. Author manuscript; available in PMC 2011 September 2.
NIH
-PA Author Manuscript
NIH
-PA Author Manuscript
NIH
-PA Author Manuscript
located immediately adjacent to the face-selective regions, centered at +17 and +6 mmanterior to the interaural axis, respectively. Occupying the majority of the cortex betweenthe two face/body-part selective regions was a single, large object-selective region, spanningregions between+6 to +14 mm. A single place-selective region (not shown) was locatedalong the ventral surface of IT cortex lateral to the occipitotemporal sulcus (OTS), centeredat approximately 5 mm anterior to the interaural axis.
The data obtained from the second monkey (monkey W, Fig. 1B, right) were more variable,likely due to the increased movement observed in this subject. However, we werenonetheless able to identity several statistically significant category-selective regions withinits right hemisphere. We identified both an anterior and a posterior face-selective regionwithin the inferior bank of the STS, centered at +14–17 and +7–9 mm anterior to theinteraural axis, respectively. In addition, several smaller face-selective regions wereidentified, including one on the ventral surface of IT cortex (centered at +11 mm anterior tothe interaural axis, lateral to the OTS) and another within the STS close to the temporal pole(centered at +22–23 mm anterior to the interaural axis). It is probable that some of thesesmaller regions represent subregions of the anterior and posterior face-selective regions thatbecame isolated due to statistical thresholding. Two body-part selective regions wereidentified on the lateral edge of the STS; one was located anteriorly (centered at +12–14 mmanterior to the interaural axis) and the other was located posteriorly (centered at +5–6 mmanterior to the interaural axis). Surrounding the anterior face and body-part selective regionswas an object-selective region, spanning +10–16 mm anterior to the interaural axis. Twoanterior place-selective regions were identified, one located within the STS (centered at+20–22 mm anterior to the interaural axis) and the other located immediately ventral to this,near the anterior middle temporal sulcus.
To localize our electrode penetrations relative to the fMRI data, we collected severalanatomical scans with electrodes positioned at strategic depths (e.g., Fig. 2A, seeMETHODS for details). The approximate area accessible by our recording grid is indicatedon the flattened fMRI category maps in Fig. 1B as dashed ovals. Figure 2B shows a top-down view of the recording grid for each monkey. The colors indicate the fMRI-identifiedcategory-selectivity in the inferior bank of the STS, where all recordings were performed.The white circles indicate the grid holes from which we sampled neuronal data (26 formonkey S; 23 for monkey W). Given the shape and location of our recording grids, we wereable to access the following fMRI-identified regions: the complete anterior face-selectiveregion (in both monkeys), the anterior portion of the posterior face-selective region (in bothmonkeys), the anterior body-part selective region (in both monkeys), a large portion of theobject-selective region (in both monkeys), and an anterior place-selective region (in monkeyW).
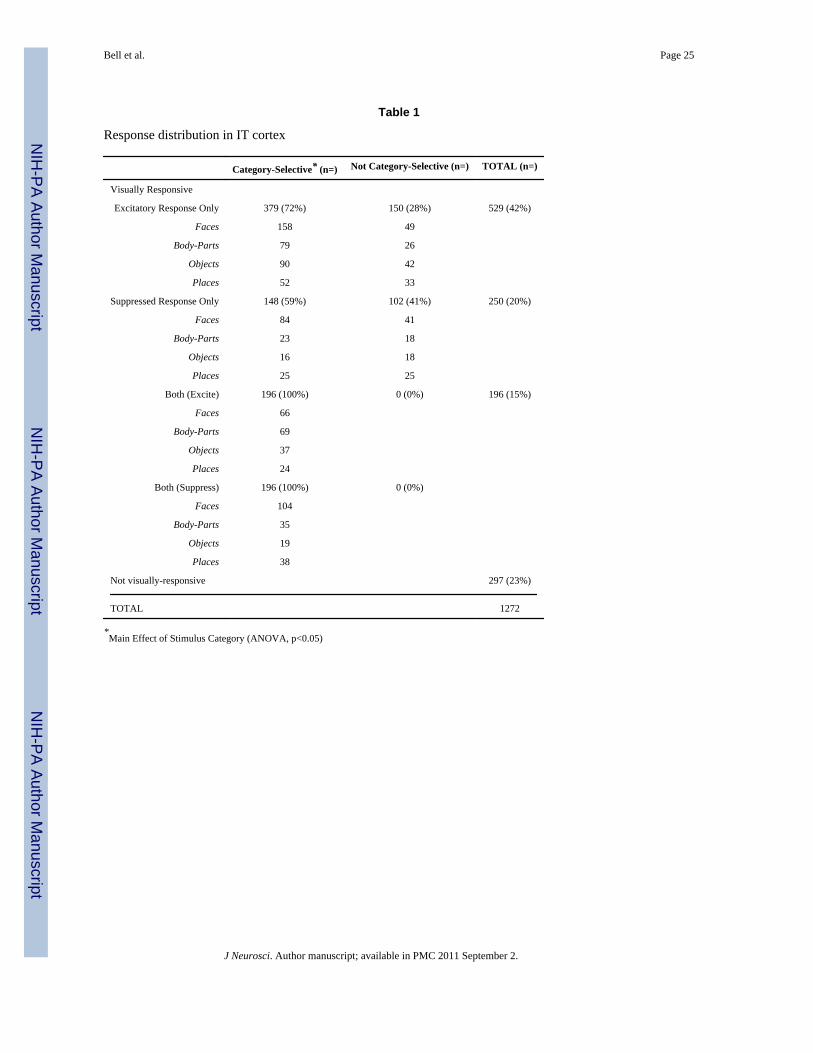
Properties of category-selective neurons in IT cortexWe recorded activity from 1,272 individual neurons in the inferior bank of the STS (areasTE/TEO; von Bonin and Bailey, 1947) from two monkeys (609 from monkey S; 663 frommonkey W). Of these, 77% (975/1272) showed a significant response to stimuli from at leastone of the four visual categories tested; only these 975 visually responsive neurons wereconsidered for further analysis. Three types of response profile were identified (Fig. 3; Table1). Most neurons significantly increased their firing rate in response to the visual stimulitested (“Excitatory Response”; e.g., Fig. 3A; 529/975, 54%). The second group decreasedtheir firing rate in response to stimuli from at least one category tested (“SuppressedResponse”; e.g., Fig. 3B; 250/975, 26%). The remaining 20% of neurons (196/975)increased their firing in response to stimuli from one (or more) category, and decreased theirfiring in response to stimuli from at least one other category (“Both Excitatory/Suppressed”;Fig. 3C).
Bell et al. Page 6
J Neurosci. Author manuscript; available in PMC 2011 September 2.
NIH
-PA Author Manuscript
NIH
-PA Author Manuscript
NIH
-PA Author Manuscript
Figure 4 shows the neuronal populations sampled from the two monkeys, separatedaccording to those neurons that exhibited significant excitatory (left) and suppressed (right)responses. Neurons exhibiting both excitatory and suppressed responses, such as thoseshown in Fig. 3C, appear in both panels. Individual rows show the responses to each of the80 different stimuli presented (20 exemplars per category) for a single neuron. Responseshave been normalized to the baseline firing rate of each neuron in order to reveal excitatoryvs. suppressed responses. Individual neurons are sorted according to which category evokedthe strongest response (or, in the case of suppressed responses, the weakest response).Below, all visually responsive neurons are referred to by their preferred category (i.e., thatwhich evoked the strongest average response across all exemplars within that category):those that responded most strongly to faces are referred to as “face neurons”, neurons thatresponded most strongly to body-parts are referred to as “body-part neurons”, and so forth.Note that this does not imply that a given neuron is ultimately “selective” for that particularcategory, merely that of the four categories tested, this category evoked the strongestresponse.
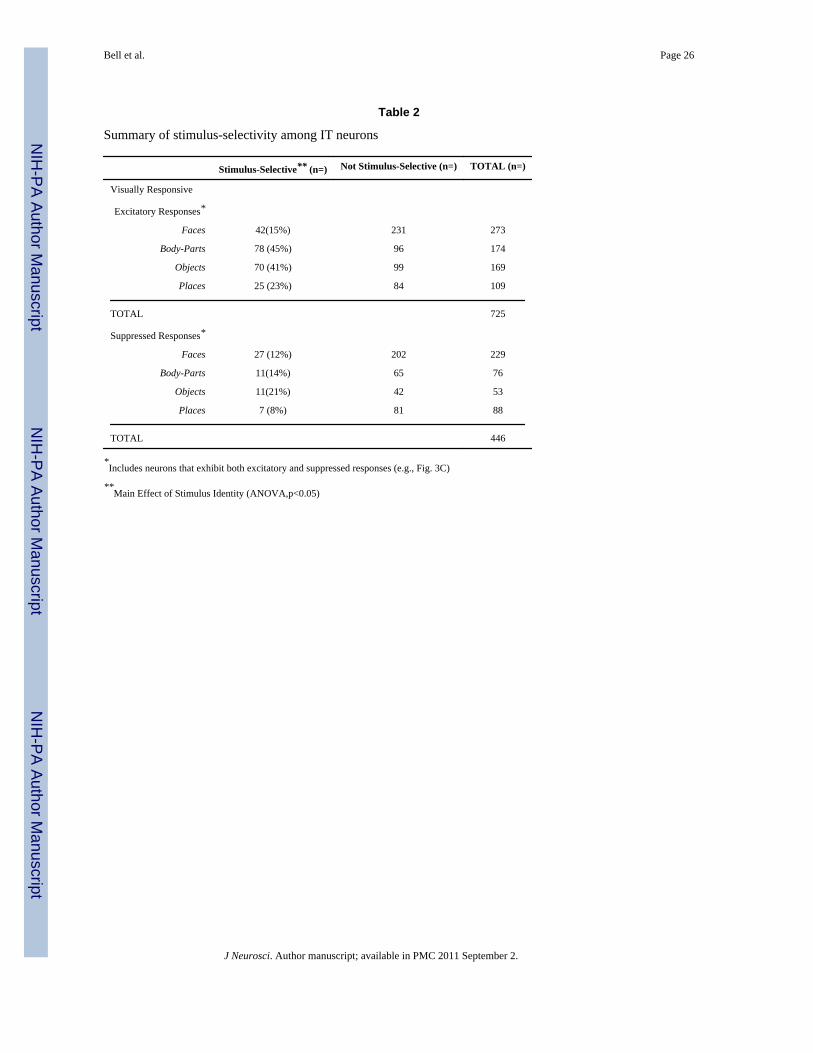
To evaluate if a given neuron exhibited significant across-category selectivity, we performeda one-way ANOVA on each neuron, with stimulus category as the factor of interest (i.e.,faces, objects, etc.). By this criterion, 73% (713/975) of visually responsive neurons werecategory-selective (main effect of category, p<0.05; Table 1). Fig. 3A illustrates one suchneuron, showing a clear bias for face stimuli. By comparison, the neuron in Fig. 3B was notcategory-selective; it showed approximately the same level of response suppression tostimuli from all four categories. A second ANOVA, using stimulus identity as the mainfactor of interest (i.e., face1, face2, etc.), revealed that only 23% of neurons exhibitedstimulus-selectivity within their preferred category (main effect of stimulus identity, p<0.05;Table 2). In other words, if a given neuron responded robustly to a face stimulus (forexample), it was very likely to respond robustly to all face stimuli. Object and body-partneurons showed the greatest proportion of neurons with significant stimulus-selectivity(Table 2; 45% and 41%, respectively vs. 17% and 23% for faces and places, respectively),which may be due to the greater variation in visual appearance across the differentexemplars within these two categories compared to faces and places (Bell et al., 2009).
We also observed significant differences in the degree to which individual neurons wereselective for their preferred category. Figure 5A and 5C show the average normalizedresponses for stimulus category for each subpopulation of neuron (i.e., face neurons, body-part neurons, etc.). In the case of the excitatory responses, face neurons had relatively weakresponses (or none at all) to stimuli from the remaining three categories (Fig. 5A, see Fig.3A for example). A similar trend was observed for place neurons (Fig. 5A). By contrast,body-part and object neurons showed relatively robust responses to certain non-preferredcategories (in particular, objects and body-parts, respectively).
To quantify these differences in category selectivity across the four subpopulations ofneurons, we calculated a category selectivity index (CSI) on the raw responses for eachneuron, which expresses the ratio of the average excitatory response to all stimuli from aneuron's preferred category to those from the remaining three categories (see METHODS).Figure 5B shows the average CSI values for all neurons that responded preferentially to eachof the four categories (i.e., face neurons, body-part neurons, etc.). Face neurons were themost selective (for their preferred category of faces), with an average CSI of 0.29±0.01(indicating that the average response to face stimuli was approximately 82% greater than theaverage response to the remaining three categories). Body-part neurons were the nextselective (for body-parts), with an average CSI of 0.24±0.01 (~63%). Place neurons had anaverage CSI of 0.22±0.02 (~56%), and object neurons were the least selective, with anaverage CSI of 0.19±0. 01 (~47%). In other words, a neuron that responded most strongly to
Bell et al. Page 7
J Neurosci. Author manuscript; available in PMC 2011 September 2.
NIH
-PA Author Manuscript
NIH
-PA Author Manuscript
NIH
-PA Author Manuscript

faces was not likely to respond strongly to stimuli from any other category, whereas aneuron that responded most strongly to objects was likely to show robust responses tostimuli from other categories.
Similar disparities were observed for the suppressed responses (Fig. 5C,D). Neurons whoseactivity was most suppressed by faces or places showed little suppression to stimuli from theremaining categories (average CSI: −0.36±0.01, ~−53% and −0.30±0.02, ~−46%,respectively). Thus these suppressive effects were strongly category-specific for these twocategories; in fact, the responses to the other categories were often above baseline. On theother hand, neurons most suppressed by body-parts or objects tended to also show decreasesin activity in response to stimuli from other categories (objects and body-parts, respectively)(average CSI: −0.28±0.02, ~−44% and −0.24±0.02, ~−39% respectively).
Finally, neurons also exhibited differences in response latency related to their categorypreferences (Fig. 5E). Face neurons had significantly shorter response latencies (averageresponse latency: 110±1 ms) compared to neurons that preferred each of the other threecategories (123±1 ms for body-part neurons; 124±2 ms for object neurons; 125±2 ms forplace neurons; P's<0.05).
These data highlight several differences among category-selective neurons in IT cortex ofmonkeys, independent of their location relative to the fMRI regions. Specifically, faceneurons were: 1) more selective, and 2) had shorter response latencies, compared to theother three neuron types. These observations, together with the disproportionately largenumber of neurons selectively suppressed by faces, suggest that faces (and face neurons)represent a special category of visual stimuli/neuron (see DISCUSSION).
Spatial distribution of category selectivity in IT cortexWe next compared the distribution of all visually responsive neurons, relative to the locationof the individual fMRI-identified category-selective regions. Figure 6 shows the fMRI-identified category maps for monkeys S and W. We subdivided the maps into 4 and 5subdivisions for monkeys S and W, respectively, corresponding to the individual fMRI-identified category-selective regions located in the inferior bank of the STS accessible fromour recording chambers. Below these are the corresponding distributions of all visuallyresponsive neurons for each subdivision, separated into excitatory and suppressed responses.We chose to include all visually responsive neurons in this analysis (as opposed to justneurons that exhibited a certain level of selectivity for a particular category) based on theassumption that the MR signal would be correlated with the overall distribution of activelyfiring neurons, and not with the distribution of a select subgroup. We conducted individualχ2 tests on each distribution to assess whether neurons that preferred each of the fourcategories were evenly distributed within each subdivision. These tests revealed that themajority of subdivisions showed a significantly biased distribution (p<0.05). In the case ofthe excitatory responses, this bias matched the category-selectivity identified by fMRI. Forexample, in the case of monkey S, the fMRI-identified body-part selective region(subdivision #1, Fig. 6) contained 56% body-part neurons. Immediately adjacent to thisregion was the anterior fMRI-identified face-selective region (subdivision #2, Fig. 6), whichcontained 52% face neurons. No such pattern was observed for the suppressed responses: inalmost all cases, neurons suppressed maximally by faces comprised the largest proportion ofsuppressed responses, regardless of the selectivity predicted by the fMRI data. Thus, unlikethe excitatory responses, the distribution of category selectivity for the suppressed responsesshowed little correspondence to the fMRI-identified regions. From these data, we cannotinfer that a relationship existed between the fMRI signal and the processes associated withsuppressed spiking responses in this experimental context. Therefore the remaining analyseswere restricted to the excitatory responses.
Bell et al. Page 8
J Neurosci. Author manuscript; available in PMC 2011 September 2.
NIH
-PA Author Manuscript
NIH
-PA Author Manuscript
NIH
-PA Author Manuscript

Figure 7 compares the proportion of neurons that preferred a given category found within(IN), near (NEAR) (located between 1–4 mm from the edge), and outside (OUT) (greaterthan 4 mm from the edge) the corresponding fMRI-identified category-selective region.These three zones are represented in the accompanying grid maps in Fig. 7 (IN: coloredaccording to the selective category; NEAR: gray boundaries; OUT: all remaining sampledlocations. Note that sites defined as OUT for the anterior face region do not include thosefound in the posterior face region, and vice-versa). In all but one case (the object-selectiveregion for monkey W), the greatest proportion of neurons that preferred a given categorywas found within recording sites that targeted the corresponding fMRI region. Further, in thecase of the face-selective regions, a greater proportion of face neurons were found in theanterior face-selective regions as compared to the posterior face-selective regions. In themajority of cases (all but the face-selective regions in both monkeys and the object-selectiveregion in monkey W), the next greatest proportion was found nearby (NEAR: gray bars),and the lowest proportion was found in recording sites located farthest from the fMRIregion. This relationship between fMRI and neuronal distribution was most pronounced forface and body-part regions (in which the proportion of face- and body-part neurons rangedfrom 41–69%), and weaker for object and place regions (which contained 20–35% objectand place neurons, respectively). As illustrated in Fig. 6, these biased distributions withinthe individual fMRI-selective region were significantly different from chance (χ2, p<0.05) inall cases except the object-selective and place-selective regions in monkey W.
Overall, these data show that category-selective voxels identified with fMRI correspond to alocal increase in the proportion of neurons that prefer that category, and that thisconcentration decreases further from the borders of these regions. This relationship wasspecific to neurons that increase their firing in response to the relevant stimuli (i.e.,excitatory responses) and was more pronounced for faces and body-parts and weaker (orabsent) for places and objects.
Contrasting fMRI and neuronal responsesFigure 8A,B shows the fMRI time-series and the corresponding spike-density functions fortwo different fMRI-identified category-selective regions. In the first example (anterior face-selective region from monkey W), the fMRI activation in response to faces was almost twicethat to the next most active category (objects). The corresponding neuronal distribution wasstrongly biased towards faces (69%) and the population response was highly selective forfaces. By contrast, in the second example (object selective region from monkey S), the fMRIactivation was only weakly selective for objects, as was the underlying neuronaldistribution. Furthermore, there was very little bias in the population response – all fourcategories evoked robust responses among the population of neurons found within thisregion.
To quantify this relationship between the selectivity of the fMRI response profiles withinindividual category-selective regions and those of the underlying neuronal populations, wecorrelated the selectivity indices for each category response within each fMRI-identifiedregion for the fMRI and neuronal populations (Fig. 8C). This analysis showed that as thestrength of the neuronal response to faces (as an example) increased relative to the responsesto non-faces, so too did the strength of the corresponding fMRI activation. Thus in thisexperiment, we might infer on the basis of this analysis that the fMRI signal predicts the“preferred-to-non-preferred” ratio of the responses of the underlying neuronal population.Note however, while this analysis revealed modest correlation values, it was only marginallysignificant (p=0.04) and failed to reach statistical significance when evaluated with a non-parametric analysis method (Spearman's Rank Correlation Coefficient).
Bell et al. Page 9
J Neurosci. Author manuscript; available in PMC 2011 September 2.
NIH
-PA Author Manuscript
NIH
-PA Author Manuscript
NIH
-PA Author Manuscript
Nonetheless, based on these examples, it is tempting to conclude that fMRI activationsmight correlate with the response magnitudes of the neuronal populations. However, cautionmust be taken when contrasting fMRI activation with spiking activity. For example, whilethe majority of neurons within a given region might respond most strongly to a particularcategory, this does not necessarily imply that the remaining neurons respond weakly tostimuli from another category (e.g., consider 100 face neurons each firing 10 sp/s to faces,compared with 10 object neurons each firing 100 sp/s to objects). Furthermore, peak-firingrate is only one method of quantifying a neuronal response. Because the haemodynamicresponse operates on a much longer time scale than neuronal activity, it is possible that weakbut sustained responses might have a greater impact on the fMRI signal. Given thesecaveats, it was not surprising that the magnitude of the fMRI response to each categorywithin a given region did not correlate significantly with the corresponding populationneuronal response (Fig. 8D).
Comparing neuronal properties inside vs. outside fMRI-identified category-selectiveregions
In addition to a correspondence between fMRI selectivity and the spatial distribution ofneurons, we also investigated whether neurons found within the fMRI-identified regions arefunctionally different from those located outside these regions. Specifically, we comparedthe average category-selectivity (CSI) for the excitatory responses of neurons found inside(IN) vs. outside (OUT) the corresponding fMRI-identified category-selective regions (Fig.9). Interestingly, both monkeys showed the identical trend: greater selectivity was foundamong face- and body-part neurons within the category-selective regions, as compared tothose found outside. This trend was statistically significant in monkey W (p<0.05), butfailed to achieve statistical significance in monkey S (p>0.05). Thus, in addition toindicating a concentration of category-selective neurons, fMRI-identified category-selectivevoxels may also reflect an increase in the selectivity of those neurons found within thosevoxels.
DISCUSSIONThis study addressed four questions about category-selective cortex. First, are face neuronsfound outside of fMRI-identified face-selective regions? Our data showed that face neuronswere located throughout the sampled area of IT cortex, but were most concentrated in fMRI-identified face-selective regions. Second, does the relationship between neuronal preferencesand fMRI selectivity extend to categories other than faces? We found that regions identifiedby fMRI as being selective for body-parts, objects (in both monkeys), and places (in monkeyW) also showed a greater proportion of neurons that respond most strongly to thesecategories. Third, does the nature of this relationship differ for neurons that increase theiractivity in response to visual stimuli, compared to those that decrease their activity? Wefound that the fMRI data reflected the distribution of excitatory but not suppressed responsesof IT neurons. Fourth, are there differences between neurons found within the fMRI regions,and those found outside? We observed a trend for greater selectivity among face- and body-part neurons found within the corresponding category-selective regions. Although notstatistically significant in both subjects, this result does raise the possibility that the observedfMRI signal might reflect both a change in the local distribution and the selectivity ofvisually responsive neurons. Below, we discuss the significance of these results to objectprocessing, and how they clarify the physiological basis of the fMRI signal.
Linking neuronal distributions with fMRI selectivityTsao and colleagues (Tsao et al., 2006) provided the first clear demonstration of asignificant bias for face neurons within fMRI-identified face-selective regions. They
Bell et al. Page 10
J Neurosci. Author manuscript; available in PMC 2011 September 2.
NIH
-PA Author Manuscript
NIH
-PA Author Manuscript
NIH
-PA Author Manuscript

sampled neurons from a single fMRI-identified face-selective region (corresponding to whatwe define as the posterior face-selective region) and reported that 97% of the visuallyresponsive neurons sampled were strongly face-selective – either significantly increasing(90%) or decreasing (7%) their firing rate in response to face stimuli. We found similartrends in both the anterior and posterior fMRI face-selective regions (Figs. 6,7). However,the proportions of face neurons found within the fMRI regions reported here are markedlyreduced compared to those reported by Tsao, Freiwald, and colleagues (Tsao et al., 2006;Freiwald and Tsao, 2010) (e.g., 90% vs. 41–69% of the excitatory responses reported here;Figs. 5 and 6). The most likely source of this discrepancy is the method by which the regionswere sampled. Tsao and colleagues (Tsao et al., 2006) sampled from a small number oflocations (6 penetration sites in two monkeys) that specifically targeted the center of a givenface-selective region. We sampled from a much larger number of locations (49 sites in twomonkeys) spanning both the center and margins of the fMRI-identified category-selectiveregions. We did find isolated penetrations that contained very high proportions of faceneurons. However, in the case of the posterior face-selective region (the site sampled byTsao and colleagues), our recording sites primarily targeted the margins of this region due tothe placement of our recording chambers. As our data demonstrate (Fig. 7), the relativeproportion can drop precipitously along the boundaries of the fMRI regions. Accordingly,the proportion observed was reduced compared to that reported previously.
Nonetheless, the critical observation here remains the same: an fMRI-identified face-selective region includes a substantial increase in the relative proportion of neurons thatincrease their firing rate in response to face stimuli. Further, we showed that this relationshipholds true for other stimulus categories, and that the proportions drop when one movesbeyond the borders of the fMRI regions. Studies in which the electrode penetrations werenot guided by fMRI data typically reported between 15–35% face neurons (e.g., Perrett etal., 1982; Desimone et al., 1984; Tanaka et al., 1991; Eifuku et al., 2004; Kiani et al., 2005,2007), which corresponds well to the proportion of face neurons we identified outside thefMRI-identified face-selective regions.
Distribution of category selectivity throughout IT cortexThere are several models of how object representations are organized in the ventral stream.One model proposes that IT cortex contains discrete patches specialized for individual visualcategories (e.g., face-processing takes place within the fMRI-identified face-selectiveregions; see Reddy and Kanwisher, 2006). Another model proposes that complex stimuli arerepresented by distributed populations of neurons organized according to their featureselectivity (Tanaka et al., 1991; Fujita et al., 1992; Tanaka, 2003; Brincat and Connor, 2004,2006). Evidence for a modular organization arises primarily from neuroimaging studies(which have a coarse spatial resolution), whereas evidence for a distributed organizationderives primarily from physiological studies (although see, for example, Haxby et al., 2001).Here, we bridge the gap between these two techniques, allowing us to gain a betterunderstanding of the organization of IT cortex as well as the relationship between these twomethodologies.
Our data confirmed that face neurons are concentrated within fMRI-identified face-selectiveregions (Tsao et al., 2006) and that this relationship extends to at least one other category,namely body-parts. However, our data also showed that neurons preferring a given categoryare found outside the fMRI-identified regions, a finding that has been previouslydemonstrated using anatomical tracers (e.g., Borra et al., 2010). Thus, although neuronsselective for a given category might be clustered into discrete patches, similarly selectiveneurons can be found throughout IT cortex, supporting a more distributed organizationalscheme. As such, we argue that object representations in IT cortex are likely organizedaccording to some hierarchical model, incorporating both modular and distributed elements
Bell et al. Page 11
J Neurosci. Author manuscript; available in PMC 2011 September 2.
NIH
-PA Author Manuscript
NIH
-PA Author Manuscript
NIH
-PA Author Manuscript
(Kriegeskorte et al., 2008; Weiner and Grill-Spector, 2010). For example, the neuralstructures responsible for categorizing stimuli (into faces, body-parts, etc.) may be organizedinto modules, whereas the processes responsible for discriminating among individual stimuliwithin a category (e.g., one face vs. another) may rely on a more distributed, yet finer-scale,organization.
This experiment was not designed to directly address the relative importance of low-levelvisual features vs. semantic relationships, as they relate to the organization of IT cortex. Ourstimuli were controlled for overall luminance and color, but not for shape or texture. It istherefore possible that the observed neuronal and/or fMRI selectivity may be due, at least inpart, to systematic variations in shape (e.g., circular faces vs. rectangular places) and nothigh-level categorical distinctions. However, the evidence suggests that differences in low-level features cannot explain all of the observed selectivity. For example, body-part neuronsresponded to all body-part stimuli, regardless of their shape (Fig. 4). On the other hand,body-part and object stimuli showed the greatest variability in terms of visual appearance(Bell et al., 2009), and body-part and object neurons exhibited the greatest proportion ofstimulus selectivity (Table 2). Nonetheless, as both experiments used very similar stimuli,the critical observation remains the same: the selectivity observed with fMRI matches theaveraged selectivity of the underlying neuronal population.
Face-processing in the primate brainWe found three interesting features among face neurons, suggesting that they may representa special class of IT neuron. First, face neurons exhibited higher selectivity (for faces) ascompared to other neurons in IT cortex (Fig. 5A). Unlike many other studies that use strictguidelines as to what constitutes a “face neuron” (e.g., response to faces must be at leasttwice the magnitude as that to non-face stimuli), we did not set any criteria for what wedefined as a face neuron (other than the greatest mean response must be to faces). Despitethis liberal definition, the vast majority of excitatory face neurons we encountered werehighly selective for faces, showing, on average, almost twice the response to faces than tonon-face stimuli (Fig. 5B).
Second, face neurons responded (to faces) with significantly shorter response latencies,compared to responses among body-part, object, and place neurons (to body-parts, objects,and places; Fig. 5C). Kiani and colleagues (Kiani et al., 2005) found a similar result andfurther demonstrated that the latency changed according to the species of face – non-primatefaces evoked longer response latencies compared to primate (human) faces. Similarly,Eifuku and colleagues (Eifuku et al., 2004) found that the response latency to faces differedaccording to viewpoint (although see Oram and Perrett, 1992). Thus, it appears thatdifferences in response latency among face neurons might be used to encode both thepresence of a face as well as certain facial features (see Tamura and Tanaka, 2001).
Finally, presentation of faces resulted in a disproportionately large number of suppressedresponses, relative to stimuli from the other three categories. The existence of suppressedresponses to specific stimuli among IT neurons has been known for some time (Gross et al.,1972; Gross et al., 1979; Desimone et al., 1984), comprising between 12–28% of the totalnumber of visually responsive neurons encountered. Freiwald and Tsao (2010) recentlyreported many more neurons suppressed by faces in the anterior face-selective regions asopposed to regions farther posterior. Unfortunately, we know relatively little about thefunction of these suppressed neurons with respect to visual processing. One possibility isthat they serve to further enhance the overall signal-to-noise ratio for faces relative to non-face stimuli in IT cortex by minimizing background activity - making faces “stand out” in acluttered visual environment. Further study will be necessary to determine the function of
Bell et al. Page 12
J Neurosci. Author manuscript; available in PMC 2011 September 2.
NIH
-PA Author Manuscript
NIH
-PA Author Manuscript
NIH
-PA Author Manuscript

these neurons but they nonetheless serve to highlight the unique nature of face processing inthe primate brain.
AcknowledgmentsThe authors would like to thank the following individuals: Wim Vanduffel, Hauke Kolster, and Leeland Ekstromfor their invaluable assistance with the imaging experiments conducted while at MGH; and Lucy Guillory for herassistance with animal training and collection of the imaging data. This work was supported by grants from theNational Institutes of Health (R01 MH67529 and R01 EY017081 (R.B.H.T.), the Athinoula A. Martinos Center forBiomedical Imaging, the National Center for Research Resources, and the National Institute of Mental HealthIntramural Research Program (A.H.B., N.J.M., E.L.M., F.H-B. and L.G.U.).
REFERENCESBell AH, Hadj-Bouziane F, Frihauf JB, Tootell RB, Ungerleider LG. Object representations in the
temporal cortex of monkeys and humans as revealed by functional magnetic resonance imaging.Journal of neurophysiology. 2009; 101:688–700. [PubMed: 19052111]
Bodamer J. Die Prosop-Agnosie (Die Agnosie des Physiognomieerkennens). Arch Psychiatr Nervenkr.1947; 179:48.
Borra E, Ichinohe N, Sato T, Tanifuji M, Rockland KS. Cortical connections to area TE in monkey:hybrid modular and distributed organization. Cereb Cortex. 2010; 20:257–270. [PubMed:19443621]
Brincat SL, Connor CE. Underlying principles of visual shape selectivity in posterior inferotemporalcortex. Nature neuroscience. 2004; 7:880–886.
Brincat SL, Connor CE. Dynamic shape synthesis in posterior inferotemporal cortex. Neuron. 2006;49:17–24. [PubMed: 16387636]
Damasio AR, Damasio H, Van Hoesen GW. Prosopagnosia: anatomic basis and behavioralmechanisms. Neurology. 1982; 32:331–341. [PubMed: 7199655]
Desimone R, Albright TD, Gross CG, Bruce C. Stimulus-selective properties of inferior temporalneurons in the macaque. J Neurosci. 1984; 4:2051–2062. [PubMed: 6470767]
Downing PE, Jiang Y, Shuman M, Kanwisher N. A cortical area selective for visual processing of thehuman body. Science (New York, NY. 2001; 293:2470–2473.
Eifuku S, De Souza WC, Tamura R, Nishijo H, Ono T. Neuronal correlates of face identification in themonkey anterior temporal cortical areas. Journal of neurophysiology. 2004; 91:358–371. [PubMed:14715721]
Epstein R, Kanwisher N. A cortical representation of the local visual environment. Nature. 1998;392:598–601. [PubMed: 9560155]
Epstein R, DeYoe EA, Press D, Kanwisher N. Neuropsychological evidence for a topographicallearning mechanism in parahippocampal cortex. Cogn Psychol. 2001; 18:481–508.
Foldiak P, Xiao D, Keysers C, Edwards R, Perrett DI. Rapid serial visual presentation for thedetermination of neural selectivity in area STSa. Progress in brain research. 2004; 144:107–116.[PubMed: 14650843]
Fujita I, Tanaka K, Ito M, Cheng K. Columns for visual features of objects in monkey inferotemporalcortex. Nature. 1992; 360:343–346. [PubMed: 1448150]
Goense JB, Logothetis NK. Neurophysiology of the BOLD fMRI signal in awake monkeys. Curr Biol.2008; 18:631–640. [PubMed: 18439825]
Gross CG, Rocha-Miranda CE, Bender DB. Visual properties of neurons in inferotemporal cortex ofthe Macaque. Journal of neurophysiology. 1972; 35:96–111. [PubMed: 4621506]
Gross CG, Bender DB, Gerstein GL. Activity of inferior temporal neurons in behaving monkeys.Neuropsychologia. 1979; 17:215–229. [PubMed: 111157]
Hadj-Bouziane F, Bell AH, Knusten TA, Ungerleider LG, Tootell RB. Perception of emotionalexpressions is independent of face selectivity in monkey inferior temporal cortex. Proceedings ofthe National Academy of Sciences of the United States of America. 2008; 105:5591–5596.[PubMed: 18375769]
Bell et al. Page 13
J Neurosci. Author manuscript; available in PMC 2011 September 2.
NIH
-PA Author Manuscript
NIH
-PA Author Manuscript
NIH
-PA Author Manuscript
Haxby JV, Gobbini MI, Furey ML, Ishai A, Schouten JL, Pietrini P. Distributed and overlappingrepresentations of faces and objects in ventral temporal cortex. Science (New York, NY. 2001;293:2425–2430.
Ito M, Tamura H, Fujita I, Tanaka K. Size and position invariance of neuronal responses in monkeyinferotemporal cortex. Journal of neurophysiology. 1995; 73:218–226. [PubMed: 7714567]
Kanwisher N, McDermott J, Chun MM. The fusiform face area: a module in human extrastriate cortexspecialized for face perception. J Neurosci. 1997; 17:4302–4311. [PubMed: 9151747]
Kiani R, Esteky H, Tanaka K. Differences in onset latency of macaque inferotemporal neuralresponses to primate and non-primate faces. Journal of neurophysiology. 2005; 94:1587–1596.[PubMed: 16061496]
Kriegeskorte N, Mur M, Ruff DA, Kiani R, Bodurka J, Esteky H, Tanaka K, Bandettini PA. Matchingcategorical object representations in inferior temporal cortex of man and monkey. Neuron. 2008;60:1126–1141. [PubMed: 19109916]
Lee JH, Durand R, Gradinaru V, Zhang F, Goshen I, Kim DS, Fenno LE, Ramakrishnan C, DeisserothK. Global and local fMRI signals driven by neurons defined optogenetically by type and wiring.Nature. 2010; 465:788–792. [PubMed: 20473285]
Logothetis NK. The neural basis of the blood-oxygen-level-dependent functional magnetic resonanceimaging signal. Philosophical transactions of the Royal Society of London. 2002; 357:1003–1037.[PubMed: 12217171]
Mahon BZ, Caramazza A. Concepts and categories: a cognitive neuropsychological perspective.Annual review of psychology. 2009; 60:27–51.
Moeller S, Freiwald WA, Tsao DY. Patches with links: a unified system for processing faces in themacaque temporal lobe. Science (New York, NY. 2008; 320:1355–1359.
Murphy GL, Brownell HH. Category differentiation in object recognition: typicality constraints on thebasic category advantage. Journal of experimental psychology. 1985; 11:70–84. [PubMed:3156953]
Op de Beeck HP, Dicarlo JJ, Goense JB, Grill-Spector K, Papanastassiou A, Tanifuji M, Tsao DY.Fine-scale spatial organization of face and object selectivity in the temporal lobe: do functionalmagnetic resonance imaging, optical imaging, and electrophysiology agree? J Neurosci. 2008;28:11796–11801. [PubMed: 19005042]
Oram MW, Perrett DI. Time course of neural responses discriminating different views of the face andhead. Journal of neurophysiology. 1992; 68:70–84. [PubMed: 1517829]
Pinsk MA, DeSimone K, Moore T, Gross CG, Kastner S. Representations of faces and body parts inmacaque temporal cortex: a functional MRI study. Proceedings of the National Academy ofSciences of the United States of America. 2005; 102:6996–7001. [PubMed: 15860578]
Pinsk MA, Arcaro M, Weiner KS, Kalkus JF, Inati SJ, Gross CG, Kastner S. Neural representations offaces and body parts in macaque and human cortex: a comparative FMRI study. Journal ofneurophysiology. 2009; 101:2581–2600. [PubMed: 19225169]
Puce A, Allison T, Gore JC, McCarthy G. Face-sensitive regions in human extrastriate cortex studiedby functional MRI. Journal of neurophysiology. 1995; 74:1192–1199. [PubMed: 7500143]
Rajimehr R, Young JC, Tootell RB. An anterior temporal face patch in human cortex, predicted bymacaque maps. Proceedings of the National Academy of Sciences of the United States of America.2009; 106:1995–2000. [PubMed: 19179278]
Reddy L, Kanwisher N. Coding of visual objects in the ventral stream. Current opinion inneurobiology. 2006; 16:408–414. [PubMed: 16828279]
Rosch E, Mervis CB. Family resemblances: Studies in the internal structure of categories. CognPsychol. 1975; 7:573–605.
Rosch E, Mervis CB, Gray WD, Johnson DM. Basic objects in natural categories. Cogn Psychol.1976; 8:57.
Rust NC, Dicarlo JJ. Selectivity and tolerance (“invariance”) both increase as visual informationpropagates from cortical area V4 to IT. J Neurosci. 2010; 30:12978–12995. [PubMed: 20881116]
Sato T, Kawamura T, Iwai E. Responsiveness of inferotemporal single units to visual pattern stimuli inmonkeys performing discrimination. Experimental brain research Experimentelle Hirnforschung.1980; 38:313–319.
Bell et al. Page 14
J Neurosci. Author manuscript; available in PMC 2011 September 2.
NIH
-PA Author Manuscript
NIH
-PA Author Manuscript
NIH
-PA Author Manuscript
Schwarzlose RF, Baker CI, Kanwisher N. Separate face and body selectivity on the fusiform gyrus. JNeurosci. 2005; 25:11055–11059. [PubMed: 16306418]
Tamura H, Tanaka K. Visual response properties of cells in the ventral and dorsal parts of the macaqueinferotemporal cortex. Cereb Cortex. 2001; 11:384–399. [PubMed: 11313291]
Tanaka K. Columns for complex visual object features in the inferotemporal cortex: clustering of cellswith similar but slightly different stimulus selectivities. Cereb Cortex. 2003; 13:90–99. [PubMed:12466220]
Tanaka K, Saito H, Fukada Y, Moriya M. Coding visual images of objects in the inferotemporal cortexof the macaque monkey. Journal of neurophysiology. 1991; 66:170–189. [PubMed: 1919665]
Tsao DY, Freiwald WA, Tootell RB, Livingstone MS. A cortical region consisting entirely of face-selective cells. Science (New York, NY. 2006; 311:670–674.
Tsao DY, Freiwald WA, Knutsen TA, Mandeville JB, Tootell RB. Faces and objects in macaquecerebral cortex. Nature neuroscience. 2003; 6:989–995.
von Bonin, G.; Bailey, P. The neocortex of Macaca mulatta. University of Illinois Press; Urbana: 1947.Weiner KS, Grill-Spector K. Sparsely-distributed organization of face and limb activations in human
ventral temporal cortex. NeuroImage. 2010; 52:1559–1573. [PubMed: 20457261]
Bell et al. Page 15
J Neurosci. Author manuscript; available in PMC 2011 September 2.
NIH
-PA Author Manuscript
NIH
-PA Author Manuscript
NIH
-PA Author Manuscript
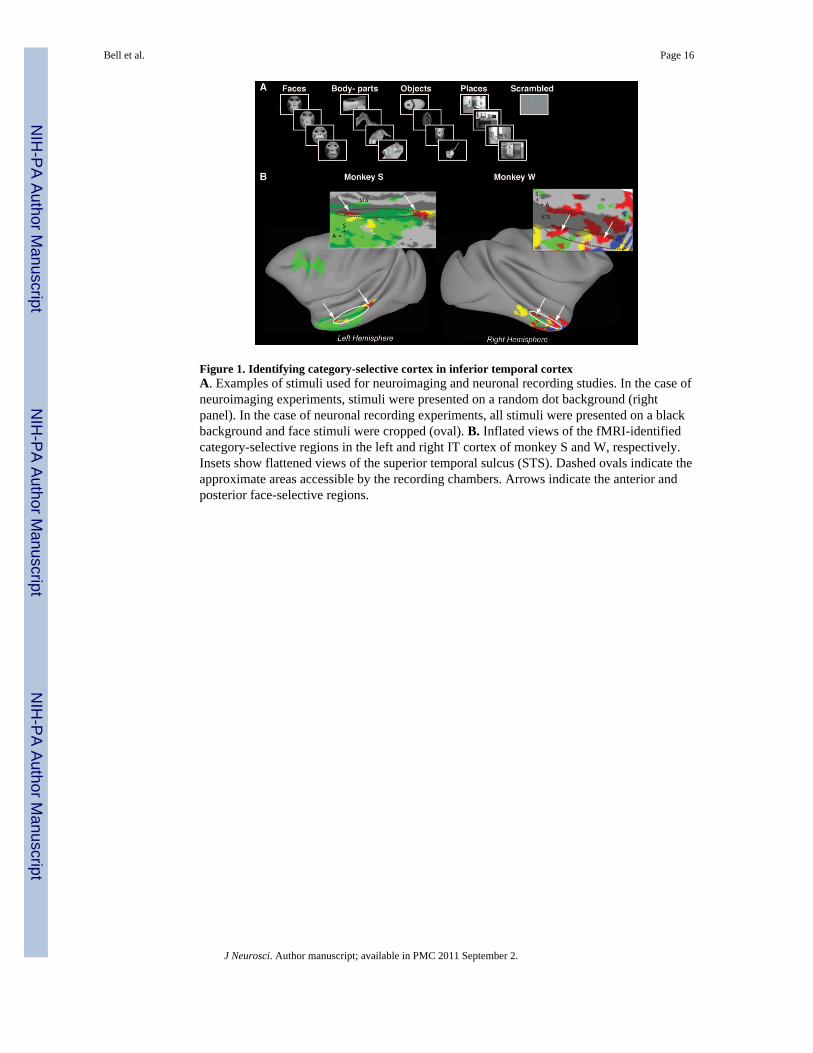
Figure 1. Identifying category-selective cortex in inferior temporal cortexA. Examples of stimuli used for neuroimaging and neuronal recording studies. In the case ofneuroimaging experiments, stimuli were presented on a random dot background (rightpanel). In the case of neuronal recording experiments, all stimuli were presented on a blackbackground and face stimuli were cropped (oval). B. Inflated views of the fMRI-identifiedcategory-selective regions in the left and right IT cortex of monkey S and W, respectively.Insets show flattened views of the superior temporal sulcus (STS). Dashed ovals indicate theapproximate areas accessible by the recording chambers. Arrows indicate the anterior andposterior face-selective regions.
Bell et al. Page 16
J Neurosci. Author manuscript; available in PMC 2011 September 2.
NIH
-PA Author Manuscript
NIH
-PA Author Manuscript
NIH
-PA Author Manuscript

Figure 2. Methods for targeted recordings of fMRI-identified category-selective cortexA. Coronal slice showing the recording chamber and a single electrode penetration(indicated by arrow) targeting category-selective cortex (left). High-resolution coronal(middle) and axial (right) slices showing a representation of the electrode tip, terminating inthe inferior bank of the STS (marked by red and indicated by arrows). B. Top-down view ofthe recording chamber with the fMRI-identified category-selectivity in the inferior bank ofthe STS indicated as a function of grid hole, for monkeys S (left) and W (right). Thick whiteoutlines indicate sampled grid locations. A: anterior, M: medial.
Bell et al. Page 17
J Neurosci. Author manuscript; available in PMC 2011 September 2.
NIH
-PA Author Manuscript
NIH
-PA Author Manuscript
NIH
-PA Author Manuscript
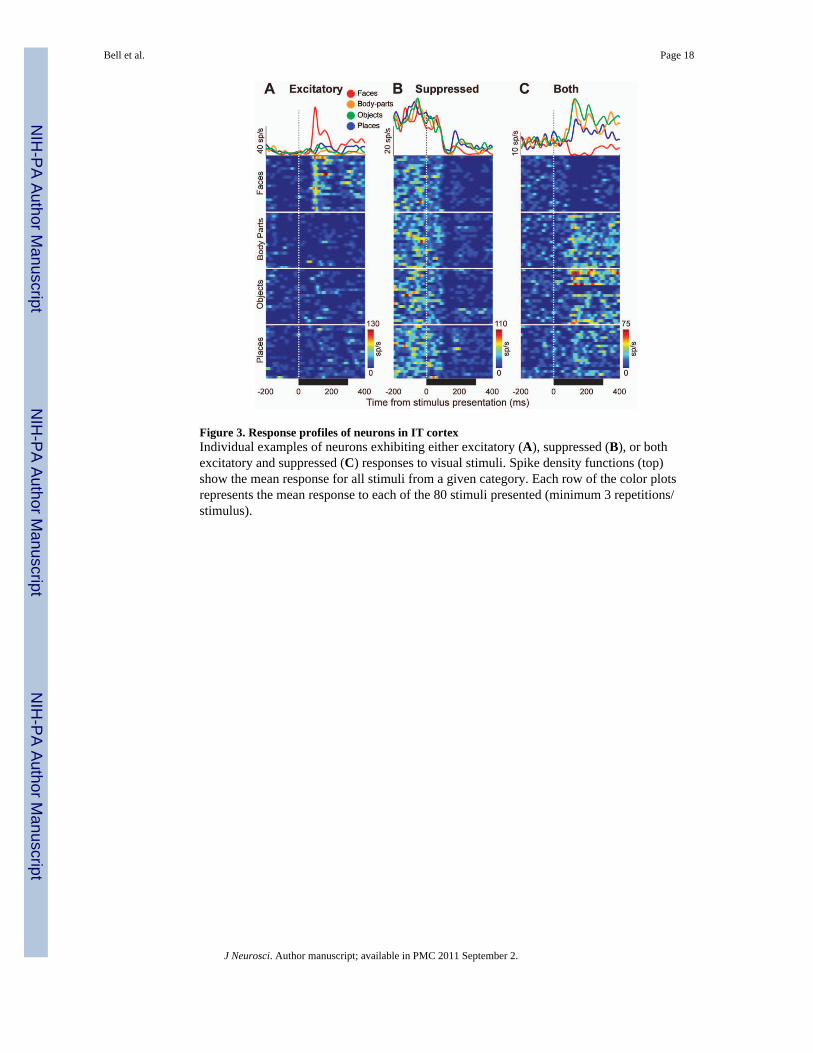
Figure 3. Response profiles of neurons in IT cortexIndividual examples of neurons exhibiting either excitatory (A), suppressed (B), or bothexcitatory and suppressed (C) responses to visual stimuli. Spike density functions (top)show the mean response for all stimuli from a given category. Each row of the color plotsrepresents the mean response to each of the 80 stimuli presented (minimum 3 repetitions/stimulus).
Bell et al. Page 18
J Neurosci. Author manuscript; available in PMC 2011 September 2.
NIH
-PA Author Manuscript
NIH
-PA Author Manuscript
NIH
-PA Author Manuscript

Figure 4. Excitatory and suppressed responses to visual stimuliNormalized excitatory (left) and suppressed (right) responses to each of the 80 visual stimulifor monkey S (A) and W (B). Each row represents an individual neuron, ordered accordingto the category of stimuli that evoked the strongest (or weakest, in the case of the suppressedresponses) response. Note that neurons that exhibited both excitatory and suppressedresponses appear in both panels. Response magnitudes were calculated by first subtractingout the baseline activity (average activity −200 to 50 ms surrounding stimulus onset) andnormalizing the activity to the neuron's maximum firing rate.
Bell et al. Page 19
J Neurosci. Author manuscript; available in PMC 2011 September 2.
NIH
-PA Author Manuscript
NIH
-PA Author Manuscript
NIH
-PA Author Manuscript

Figure 5. Properties of neurons in IT cortexA. Excitatory responses to each of the four categories tested for each subpopulation ofvisually responsive neurons (i.e., face neurons, body-part neurons, etc.). Responses arenormalized to the maximum firing rate of each neuron in order to illustrate the consistencyin the pattern of responses to the non-preferred categories. B. Average category selectivityindices (CSI) (see METHODS) for each subpopulation of neurons. This analysis comparesthe degree of selectivity for each subpopulation of neurons to the associated preferredstimulus category. CSI values reflect the degree to which a given group of neurons isselective for their preferred category (e.g., faces for face neurons, body-parts for body-partneurons, etc.). Greater CSI values indicate larger differences between the response to agiven neuron's preferred category vs. the average of the other three categories. Thus, the redbar indicates to what degree face neurons are selective for faces, the yellow bar indicates towhat degree body-part neurons are selective for body-parts, etc. Note that CSI values werecalculated for each neuron using the raw (i.e., not normalized) response magnitudes. C.Normalized suppressed responses to each of the four categories tested for eachsubpopulation of neurons (i.e., face neurons, body-part neurons, etc.). By definition,suppressed responses must have some baseline activity. Therefore, in order to show how thedifferent responses relate to one another, in this case, responses are normalized to theaverage baseline activity for each neuron. Note that neurons that exhibited both excitatoryand suppressed responses appear in both analyses. D. Average absolute category selectivityindices for each subpopulation of neurons (values presented unsigned to ease comparison toexcitatory responses). As above, CSI values were calculated using the raw responsemagnitudes. E. Average response latencies for each subpopulation of neurons to theirpreferred category (i.e., the average response latency to face stimuli for face neurons, theaverage response latency to body-part stimuli for body-part neurons, etc.). Error barsindicate standard error of the mean. * P<0.05, *** P<0.005
Bell et al. Page 20
J Neurosci. Author manuscript; available in PMC 2011 September 2.
NIH
-PA Author Manuscript
NIH
-PA Author Manuscript
NIH
-PA Author Manuscript
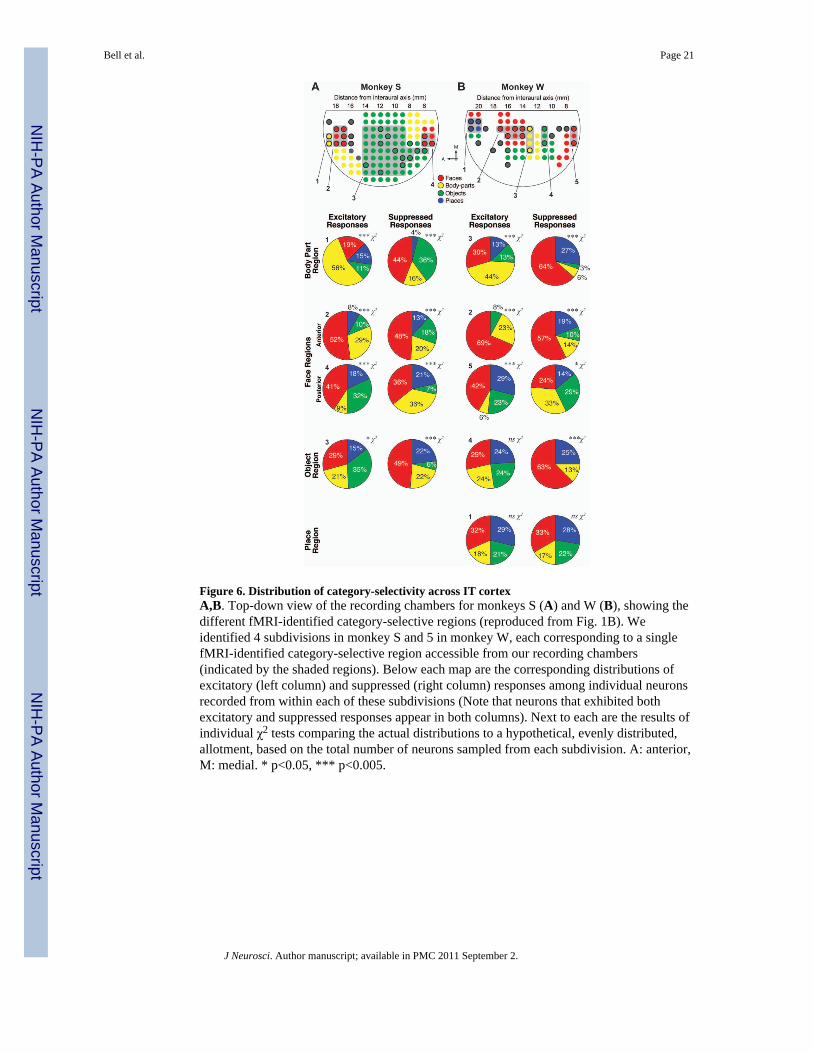
Figure 6. Distribution of category-selectivity across IT cortexA,B. Top-down view of the recording chambers for monkeys S (A) and W (B), showing thedifferent fMRI-identified category-selective regions (reproduced from Fig. 1B). Weidentified 4 subdivisions in monkey S and 5 in monkey W, each corresponding to a singlefMRI-identified category-selective region accessible from our recording chambers(indicated by the shaded regions). Below each map are the corresponding distributions ofexcitatory (left column) and suppressed (right column) responses among individual neuronsrecorded from within each of these subdivisions (Note that neurons that exhibited bothexcitatory and suppressed responses appear in both columns). Next to each are the results ofindividual χ2 tests comparing the actual distributions to a hypothetical, evenly distributed,allotment, based on the total number of neurons sampled from each subdivision. A: anterior,M: medial. * p<0.05, *** p<0.005.
Bell et al. Page 21
J Neurosci. Author manuscript; available in PMC 2011 September 2.
NIH
-PA Author Manuscript
NIH
-PA Author Manuscript
NIH
-PA Author Manuscript
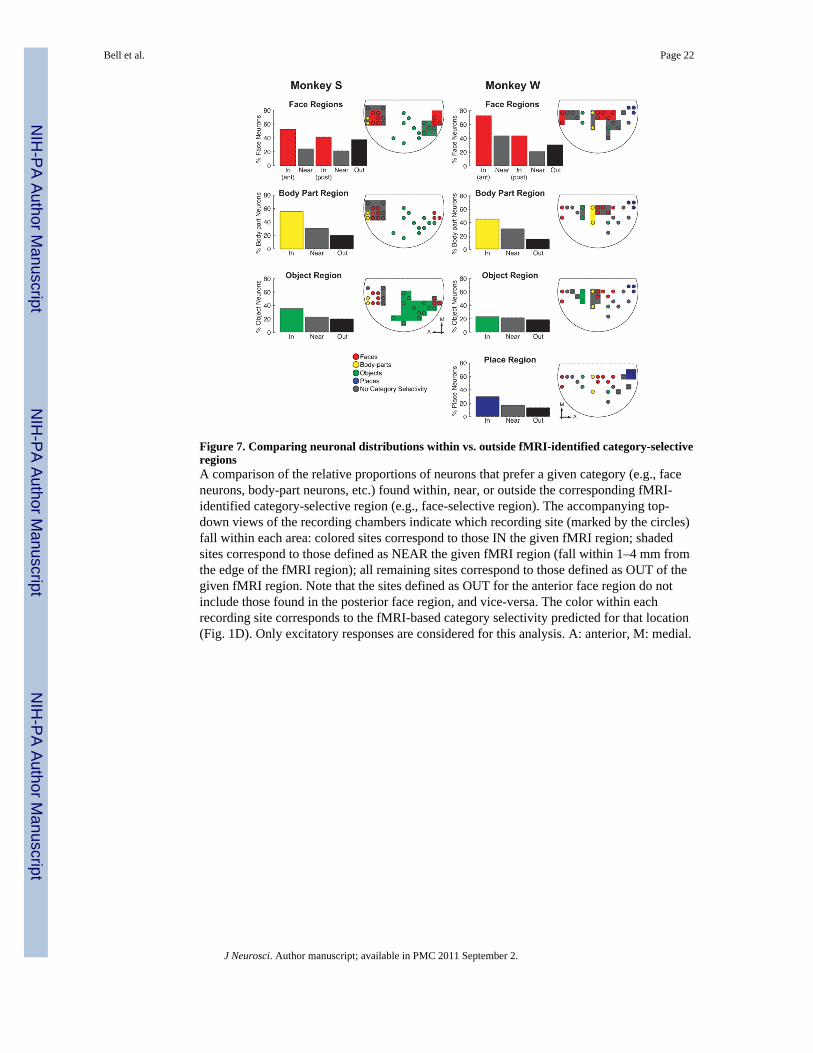
Figure 7. Comparing neuronal distributions within vs. outside fMRI-identified category-selectiveregionsA comparison of the relative proportions of neurons that prefer a given category (e.g., faceneurons, body-part neurons, etc.) found within, near, or outside the corresponding fMRI-identified category-selective region (e.g., face-selective region). The accompanying top-down views of the recording chambers indicate which recording site (marked by the circles)fall within each area: colored sites correspond to those IN the given fMRI region; shadedsites correspond to those defined as NEAR the given fMRI region (fall within 1–4 mm fromthe edge of the fMRI region); all remaining sites correspond to those defined as OUT of thegiven fMRI region. Note that the sites defined as OUT for the anterior face region do notinclude those found in the posterior face region, and vice-versa. The color within eachrecording site corresponds to the fMRI-based category selectivity predicted for that location(Fig. 1D). Only excitatory responses are considered for this analysis. A: anterior, M: medial.
Bell et al. Page 22
J Neurosci. Author manuscript; available in PMC 2011 September 2.
NIH
-PA Author Manuscript
NIH
-PA Author Manuscript
NIH
-PA Author Manuscript
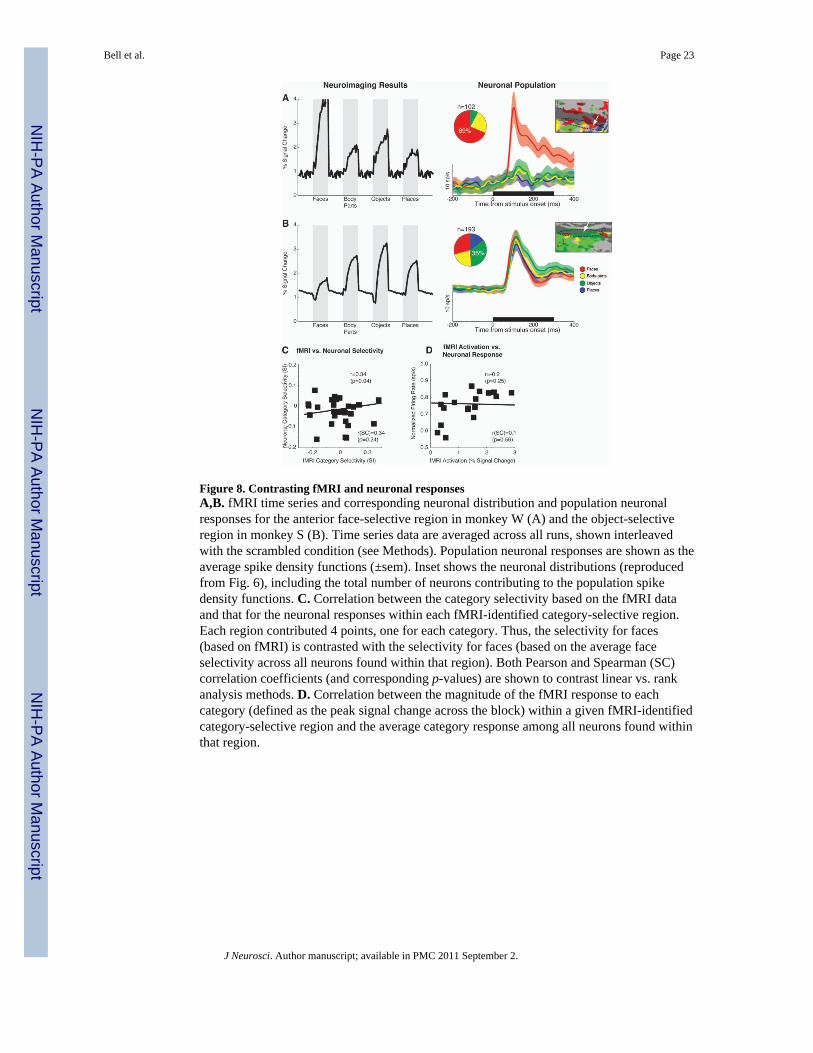
Figure 8. Contrasting fMRI and neuronal responsesA,B. fMRI time series and corresponding neuronal distribution and population neuronalresponses for the anterior face-selective region in monkey W (A) and the object-selectiveregion in monkey S (B). Time series data are averaged across all runs, shown interleavedwith the scrambled condition (see Methods). Population neuronal responses are shown as theaverage spike density functions (±sem). Inset shows the neuronal distributions (reproducedfrom Fig. 6), including the total number of neurons contributing to the population spikedensity functions. C. Correlation between the category selectivity based on the fMRI dataand that for the neuronal responses within each fMRI-identified category-selective region.Each region contributed 4 points, one for each category. Thus, the selectivity for faces(based on fMRI) is contrasted with the selectivity for faces (based on the average faceselectivity across all neurons found within that region). Both Pearson and Spearman (SC)correlation coefficients (and corresponding p-values) are shown to contrast linear vs. rankanalysis methods. D. Correlation between the magnitude of the fMRI response to eachcategory (defined as the peak signal change across the block) within a given fMRI-identifiedcategory-selective region and the average category response among all neurons found withinthat region.
Bell et al. Page 23
J Neurosci. Author manuscript; available in PMC 2011 September 2.
NIH
-PA Author Manuscript
NIH
-PA Author Manuscript
NIH
-PA Author Manuscript
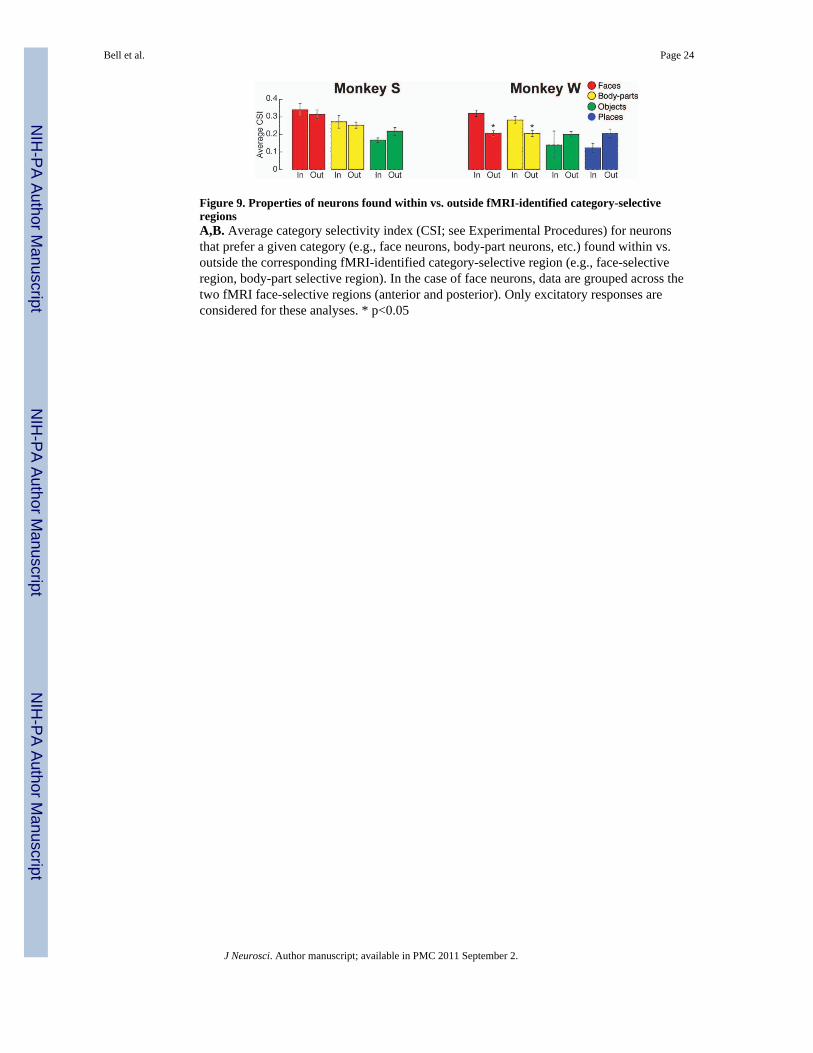
Figure 9. Properties of neurons found within vs. outside fMRI-identified category-selectiveregionsA,B. Average category selectivity index (CSI; see Experimental Procedures) for neuronsthat prefer a given category (e.g., face neurons, body-part neurons, etc.) found within vs.outside the corresponding fMRI-identified category-selective region (e.g., face-selectiveregion, body-part selective region). In the case of face neurons, data are grouped across thetwo fMRI face-selective regions (anterior and posterior). Only excitatory responses areconsidered for these analyses. * p<0.05
Bell et al. Page 24
J Neurosci. Author manuscript; available in PMC 2011 September 2.
NIH
-PA Author Manuscript
NIH
-PA Author Manuscript
NIH
-PA Author Manuscript
NIH
-PA Author Manuscript
NIH
-PA Author Manuscript
NIH
-PA Author Manuscript
Bell et al. Page 25
Table 1
Response distribution in IT cortex
Category-Selective* (n=) Not Category-Selective (n=) TOTAL (n=)
Visually Responsive
Excitatory Response Only 379 (72%) 150 (28%) 529 (42%)
Faces 158 49
Body-Parts 79 26
Objects 90 42
Places 52 33
Suppressed Response Only 148 (59%) 102 (41%) 250 (20%)
Faces 84 41
Body-Parts 23 18
Objects 16 18
Places 25 25
Both (Excite) 196 (100%) 0 (0%) 196 (15%)
Faces 66
Body-Parts 69
Objects 37
Places 24
Both (Suppress) 196 (100%) 0 (0%)
Faces 104
Body-Parts 35
Objects 19
Places 38
Not visually-responsive 297 (23%)
TOTAL 1272
*Main Effect of Stimulus Category (ANOVA, p<0.05)
J Neurosci. Author manuscript; available in PMC 2011 September 2.
NIH
-PA Author Manuscript
NIH
-PA Author Manuscript
NIH
-PA Author Manuscript
Bell et al. Page 26
Table 2
Summary of stimulus-selectivity among IT neurons
Stimulus-Selective** (n=) Not Stimulus-Selective (n=) TOTAL (n=)
Visually Responsive
Excitatory Responses*
Faces 42(15%) 231 273
Body-Parts 78 (45%) 96 174
Objects 70 (41%) 99 169
Places 25 (23%) 84 109
TOTAL 725
Suppressed Responses*
Faces 27 (12%) 202 229
Body-Parts 11(14%) 65 76
Objects 11(21%) 42 53
Places 7 (8%) 81 88
TOTAL 446
*Includes neurons that exhibit both excitatory and suppressed responses (e.g., Fig. 3C)
**Main Effect of Stimulus Identity (ANOVA,p<0.05)
J Neurosci. Author manuscript; available in PMC 2011 September 2.
Related Documents