http://www.ijssit.com © Ogero, Obere, Odada 1 RELATIONSHIP BETWEEN FOREIGN DIRECT INVESTMENT INFLOWS AND SELECTED MACROECONOMIC VARIABLES IN KENYA 1* Titus Mosoti Ogero [email protected] 2** John Almadi Obere [email protected] 3*** John Ernest Odada [email protected] 1, 2, 3 Rongo University, School of Business and Human Resource Development, Kenya Abstract: Foreign direct investment (FDI) is a key component of attaining sustainable economic growth and development in most developing economies. This is majorly through strengthening infrastructural system, information and communication technology (ICT) development, raising productivity and creation of employment opportunities, and supplementing the balance of payment by enriching exports. The purpose of the study, therefore, is to determine the relationship between foreign direct investments and selected macroeconomic variables. The study employs unit root test to determine the stationarity of individual variables. The causality of macroeconomic variables on foreign direct investment inflow is checked using granger causality test. Economic growth and exchange rates are significant in influencing the level of foreign direct investments and inflation and exchange rates are significant in influencing interest rates. Economic growth proxied by gross domestic product is positive and significant determinant of foreign direct investment inflows instantaneously. The study recommends for policies that enhance foreign direct investment through promoting the prospects of economic growth. Keywords: Foreign direct investments, economic growth, macroeconomic variables 1.0 INTRODUCTION Foreign direct investment is a kind of investment in which the foreign individuals or firms directly invest in the assets and resources of the host country. In this kind of investment, through physical presence at the investment place and taking the financial responsibilities, the foreign investor takes direct control and management of the units in the host country (Ostadi & Ashja, 2014). The united nations conference on trade and development (UNCTAD) report views FDI to be important for the future development of every country especially African nations, as it is a means of increasing the capital available for investment and the economic growth needed to reduce poverty and raise living standards in any given country. FDI is an important factor in enhancing economic growth both directly, which is through the financing of development projects, and indirectly through knowledge and technology transfers (Liargovas and Angelopoulos, 2014). Many African countries have already done much to create a more investment-friendly environment to promote local investment as well as foreign direct investment, and many have made positive progress towards political and economic stability. According to UNCTAD (2018), FDI flows to Africa slumped to $42 billion in 2017, a 21 per cent decline from 2016. Weak oil prices and harmful lingering effects from the commodity bust saw flows contract, especially in the larger commodity-exporting economies.

Welcome message from author
This document is posted to help you gain knowledge. Please leave a comment to let me know what you think about it! Share it to your friends and learn new things together.
Transcript

http://www.ijssit.com
© Ogero, Obere, Odada 1
RELATIONSHIP BETWEEN FOREIGN DIRECT INVESTMENT INFLOWS AND
SELECTED MACROECONOMIC VARIABLES IN KENYA
1* Titus Mosoti Ogero
2** John Almadi Obere
3*** John Ernest Odada
1, 2, 3 Rongo University, School of Business and Human Resource Development, Kenya
Abstract: Foreign direct investment (FDI) is a key component of attaining sustainable economic growth and
development in most developing economies. This is majorly through strengthening infrastructural system,
information and communication technology (ICT) development, raising productivity and creation of
employment opportunities, and supplementing the balance of payment by enriching exports. The purpose of
the study, therefore, is to determine the relationship between foreign direct investments and selected
macroeconomic variables. The study employs unit root test to determine the stationarity of individual
variables. The causality of macroeconomic variables on foreign direct investment inflow is checked using
granger causality test. Economic growth and exchange rates are significant in influencing the level of foreign
direct investments and inflation and exchange rates are significant in influencing interest rates. Economic
growth proxied by gross domestic product is positive and significant determinant of foreign direct investment
inflows instantaneously. The study recommends for policies that enhance foreign direct investment through
promoting the prospects of economic growth.
Keywords: Foreign direct investments, economic growth, macroeconomic variables
1.0 INTRODUCTION
Foreign direct investment is a kind of investment in which the foreign individuals or firms directly invest in
the assets and resources of the host country. In this kind of investment, through physical presence at the
investment place and taking the financial responsibilities, the foreign investor takes direct control and
management of the units in the host country (Ostadi & Ashja, 2014). The united nations conference on trade
and development (UNCTAD) report views FDI to be important for the future development of every country
especially African nations, as it is a means of increasing the capital available for investment and the economic
growth needed to reduce poverty and raise living standards in any given country. FDI is an important factor in
enhancing economic growth both directly, which is through the financing of development projects, and
indirectly through knowledge and technology transfers (Liargovas and Angelopoulos, 2014).
Many African countries have already done much to create a more investment-friendly environment to promote
local investment as well as foreign direct investment, and many have made positive progress towards political
and economic stability. According to UNCTAD (2018), FDI flows to Africa slumped to $42 billion in 2017, a
21 per cent decline from 2016. Weak oil prices and harmful lingering effects from the commodity bust saw
flows contract, especially in the larger commodity-exporting economies.

International Journal of Social Sciences and Information Technology
ISSN 2412-0294
Vol VII Issue VII, July 2021
© Ogero, Obere, Odada 2
Foreign direct investment inflows to Kenya fluctuate as from 1988 to 2017. However, a significant increase is
experienced in the period 2008 to 2011. This implies that multinationals and their subsidiaries have continued
to increase production of goods and services in Kenya.
1.1 STATEMENT OF THE PROBLEM
Developing countries, and least developed countries in specific, face considerable challenges in attracting FDI
inflows. These extend from structural stiffness, such as the lack of adequate infrastructure and scarce access to
finance, to strategic issues such as macroeconomic policies. Kenya is dependent on Foreign Direct Investment
for foreign exchange, capital and employment. Attracting FDI thus, is an important policy concern for the
Kenyan government whereby FDI inflows have shown a fluctuating trend as from 1988 to 2018.Several studies
have investigated the impact of various factors on foreign direct investment in the Kenyan context. Most studies
done have treated FDI as a dependent variable against variables like economic growth (GDP) exchange rates,
inflation, taxation and interest rates, whereas, in other studies the same variables are dependent on FDI.
However, there are no strong theories that stipulates that FDI cannot influence other macroeconomic variables
or that the macroeconomic variables cannot affect each other. Thereis need, thus, to understand the causal
relationship between FDI inflows and the selected macroeconomic variables and investigate the direction of
influence among variables.
1.1 OBJECTIVE OF THE STUDY
To determine the relationship between foreign direct investment inflows and selected macroeconomic in
Kenya.
2.0 LITERATURE RIVIEW
Theoretically, there are several models that link the selected macroeconomic variables (inflation, exchange
rates, economic growth and real interest rates being linked through the rational expectation theory, standard
trade theory, growth hypothesis and the international Fisher effect model respectively).. John F. Muth
developed the rational expectation theory in 1961. This doctrine can be used to give a clear understanding of
the anticipated inflation rates. Given high levels of inflation, risk averse investors are likely to demand high
price levels in order to offset their exposure to inflationary risks that are bound to lower the volume of
investment. According to the PPP theory, exchange rates will not be constant but adjust to match purchasing
power parity such that, the proportional change in the foreign currency should seek to maintain parity between
the new adjusted price indexes of the two given countries. This theory does not fully explain exchange rates
because the assumption that all goods are identical as well as the fact that trade barriers and transportation costs
is low are not realistic in two different countries, hence, PPP is important as it helps us to observe the ideal
situation. According to Asiedu (2008) different currency areas are responsible for the generation of FDI,
whereas, Dunning (1993) stated that higher fixed capital stakes of an investment shows the possibility that
future movements in exchange rates should be taken into account. Charkrabarti (2001) states that, the growth
hypothesis developed by Lim (1983) maintains that, a rapidly growing economy provides relatively better
opportunities for making profits than the ones growing slowly or not growing at all. The rational expectation
theory is often used to explain people’s current expectation of the economy and how they are able to influence
what the future state of the economy will be. Irving Fisher designs the International Fisher Effect (IFE) model
in the 1930s whereby, it is a theory of market expectations. Fisher provides that an unexpected increase in
interest rates would attract foreign investors who may wish to invest in the local market to take advantage of

International Journal of Social Sciences and Information Technology
ISSN 2412-0294
Vol VII Issue VII, July 2021
© Ogero, Obere, Odada 3
high interest rates. Where there is no flood of inward investment, the market must be expecting that the value
of the home currency will fall, as it should if the foreign exchange market is acting efficiently.
2.1 EMPIRICAL REVIEW
According to Vesarach (2014), who conducts a study on the role of interest rates in attracting FDI in the Asian
economies; the results shows that the determinants of FDI are interest rates, inflation, GDP, exchange rates,
labour cost, money growth and political rights. The researcher concludes that countries should offer
competitive interest rates to attract foreign direct investments in their country. Ancharaz (2003) finds a positive
effect with lagged growth for the full sample and for the non-Sub-Saharan African countries, but an
insignificant effect for the Sub-Saharan Africa sample as well, Gastanaga et al., (1998) and Schneider and Frey
(1985) find positive significant effects of growth on FDI.
Wanjala (2001), in his study, macroeconomic instability, uncertainty, high exchange rate due to depreciation
increase foreign direct investments if investors are export projected. Adding to that, Muema (2013) in analysing
FDI determinants in Kenya establishes that there is a significant positive relationship between the rate of FDI
and the exchange rate change indicating a strong link between higher FDI inflows and the weakening shilling.
This study’s conclusion is that the main factor determining changes in FDI in Kenya is the Kenyan Shilling
exchange rate to the other currencies proxied by the speed of change to the US dollar.Similarly, Njuguna (2013)
studies the relationship between exchange rates and foreign direct investments in Kenya. Exchange rates
(KES/USD), inflation determined by consumer price index and economic growth (GDP) are the independent
variables whereas FDI is used as the dependent variable for a period of 10 years. Regression analysis result
suggests that, there is a strong positive relationship between FDI, exchange rates and economic growth while
a negative relationship is exhibited between FDI and inflation rates.
Wanjiru (2013) examines the effect of economic growth and inflation volatility on FDI in Kenya. FDI are used
as the dependent variable whereas inflation and GDP are taken as independent variables. A linear regression
analysis is used on the data to determine the association between inflation, GDP and FDI flows. The results
suggest that no association exists between FDI and inflation, whereas a negative association exists between
foreign direct investment and gross domestic product. Nduati (2018) as well examines the effect of inflation
rate on FDI inflows in Kenya. The study used inflation as the independent variable while exchange rate and
GDP as control variables and FDI as the dependent variable. A multiple linear regression analysis is used to
determine the relationship between the independent variables and the dependent variable. The results suggested
that GDP and exchange rates are not significant determinants of FDI inflows while inflation is a significant
determinant which is contrary to the result of Wanjiru’s study.
Mbui (2017) did a study on the effect of interest rates on foreign direct investments inflows in the energy and
petroleum industry in Kenya. The study employs a descriptive research design and a multiple linear regression
model is used to analyze the relationship between the variables. The results of the study revealed that, interest
rate, exchange rates, economic growth and inflation rates are not significant determiners of FDI inflows into
the energy and petroleum industry in Kenya. This study recommends that there is need for central bank to
regulate the interest rate levels prevailing in the country bearing in mind that they influence FDI inflows in the
energy and petroleum industry. Different to that, Ndanu (2018) explores the effect of real interest rates,
exchange rates and competitiveness on FDI in Kenya. Regression analysis indicates that real interest rates and
exchange rates have a negative and significant influence on FDI inflows in Kenya while competitiveness had
a positive significant impact.
International Journal of Social Sciences and Information Technology
ISSN 2412-0294
Vol VII Issue VII, July 2021
© Ogero, Obere, Odada 4
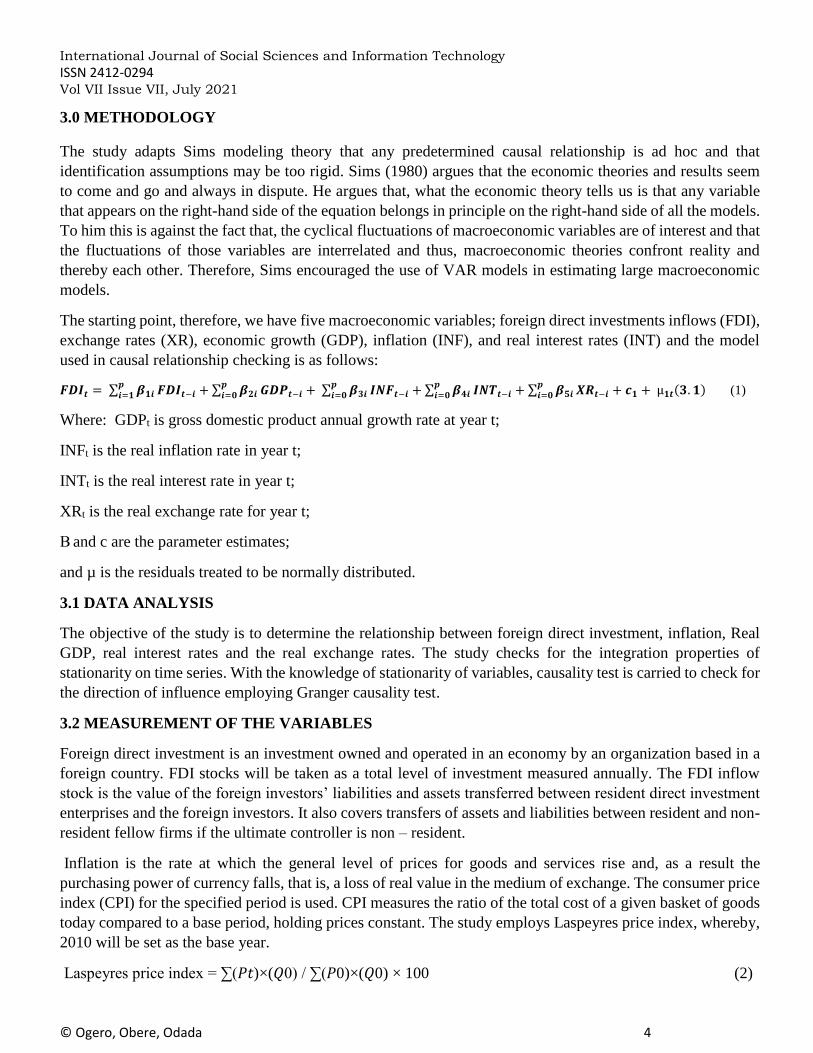
3.0 METHODOLOGY
The study adapts Sims modeling theory that any predetermined causal relationship is ad hoc and that
identification assumptions may be too rigid. Sims (1980) argues that the economic theories and results seem
to come and go and always in dispute. He argues that, what the economic theory tells us is that any variable
that appears on the right-hand side of the equation belongs in principle on the right-hand side of all the models.
To him this is against the fact that, the cyclical fluctuations of macroeconomic variables are of interest and that
the fluctuations of those variables are interrelated and thus, macroeconomic theories confront reality and
thereby each other. Therefore, Sims encouraged the use of VAR models in estimating large macroeconomic
models.
The starting point, therefore, we have five macroeconomic variables; foreign direct investments inflows (FDI),
exchange rates (XR), economic growth (GDP), inflation (INF), and real interest rates (INT) and the model
used in causal relationship checking is as follows:
𝑭𝑫𝑰𝒕 = ∑ 𝜷𝟏𝒊𝒑𝒊=𝟏 𝑭𝑫𝑰𝒕−𝒊 + ∑ 𝜷𝟐𝒊
𝒑𝒊=𝟎 𝑮𝑫𝑷𝒕−𝒊 + ∑ 𝜷𝟑𝒊
𝒑𝒊=𝟎 𝑰𝑵𝑭𝒕−𝒊 + ∑ 𝜷𝟒𝒊
𝒑𝒊=𝟎 𝑰𝑵𝑻𝒕−𝒊 + ∑ 𝜷𝟓𝒊
𝒑𝒊=𝟎 𝑿𝑹𝒕−𝒊 + 𝒄𝟏 + µ𝟏𝒕(𝟑. 𝟏) (1)
Where: GDPt is gross domestic product annual growth rate at year t;
INFt is the real inflation rate in year t;
INTt is the real interest rate in year t;
XRt is the real exchange rate for year t;
Β and c are the parameter estimates;
and µ is the residuals treated to be normally distributed.
3.1 DATA ANALYSIS
The objective of the study is to determine the relationship between foreign direct investment, inflation, Real
GDP, real interest rates and the real exchange rates. The study checks for the integration properties of
stationarity on time series. With the knowledge of stationarity of variables, causality test is carried to check for
the direction of influence employing Granger causality test.
3.2 MEASUREMENT OF THE VARIABLES
Foreign direct investment is an investment owned and operated in an economy by an organization based in a
foreign country. FDI stocks will be taken as a total level of investment measured annually. The FDI inflow
stock is the value of the foreign investors’ liabilities and assets transferred between resident direct investment
enterprises and the foreign investors. It also covers transfers of assets and liabilities between resident and non-
resident fellow firms if the ultimate controller is non – resident.
Inflation is the rate at which the general level of prices for goods and services rise and, as a result the
purchasing power of currency falls, that is, a loss of real value in the medium of exchange. The consumer price
index (CPI) for the specified period is used. CPI measures the ratio of the total cost of a given basket of goods
today compared to a base period, holding prices constant. The study employs Laspeyres price index, whereby,
2010 will be set as the base year.
Laspeyres price index = ∑(𝑃𝑡)×(𝑄0) / ∑(𝑃0)×(𝑄0) × 100 (2)

International Journal of Social Sciences and Information Technology
ISSN 2412-0294
Vol VII Issue VII, July 2021
© Ogero, Obere, Odada 5
Where: P0 is the price of the basket of goods at the base period;
Pt is the price of the same basket of goods at the observation period;
and Q0 is the quantity in the basket of goods at the base period.
Economic growth is measured as gross domestic product. Real GDP is inflation adjusted market value of
goods and services produced in an economy over time. Due to inflation, GDP increase does not reflect the true
growth in an economy. Therefore, there is need to transform the nominal GDP into an index of total output
(real GDP).
Real GDP = Nominal GDP/(R) (3)
Where R is the GDP deflator givens as 𝑛𝑜𝑚𝑖𝑛𝑎𝑙𝐺𝐷𝑃/ 𝑟𝑒𝑎𝑙𝐺𝐷𝑃
Exchange rate is the value of one economy’s currency against the currency of another country. They are
determined in the foreign exchange market, which is open to trade among economies therefore very useful in
foreign direct investments. Exchange rates measured by the average of Kenyan shilling against the United
States Dollar (KES/USD) exchange rate annually with control against inflation. The US dollar is taken due to
the fact that most of foreign transactions are commonly quoted in the US dollar currency.
𝑅𝑒𝑎𝑙𝑒𝑥𝑐ℎ𝑎𝑛𝑔𝑒𝑟𝑎𝑡𝑒 = 𝑛𝑜𝑚𝑖𝑛𝑎𝑙𝑒𝑥𝑐ℎ𝑎𝑛𝑔𝑒𝑟𝑎𝑡𝑒 × 𝑝𝑟𝑖𝑐𝑒𝑠𝑜𝑓𝑑𝑜𝑚𝑒𝑠𝑡𝑖𝑐𝑔𝑜𝑜𝑑𝑠/𝑝𝑟𝑖𝑐𝑒𝑠𝑜𝑓𝑈𝑛𝑖𝑡𝑒𝑑𝑠𝑡𝑎𝑡𝑒𝑠 (4)
The above variables are measured using the 2010 constant prices, the reason being that, the economic
performance of Kenya in 2010 is considered to be the middle ground between high performance and low
performances.
4.0 RESULTS AND DISCUSION
4.1 Stationarity Tests
Kwiatkowski – Phillips-Schmidt-Shin (KPSS) test is used to examine the null hypothesis, that a given time
series is stationary. A time series with seasonality or trends usually results in unreliable estimates and, thus,
spurious and misleading. KPSS tests are employs to testing the following null hypothesis
H0: that an observable time series is stationary
The tests are carried out at 1% level of significance. The results for KPSS test are shown in table 1 below
Table 1: Stationarity Test
VARIABLE
ASYMPTOTIC
CRITICALVALUES
KPSS TEST
STATISTICSVALUE REMARK
FDI
1% level 0.216000
0.219422*
Non-
stationary
5% level 0.146000
10%level 0.119000
GDP
1% level 0.216000
0.287885*
Non-
stationary
5% level 0.146000
10%level 0.119000
INF
1% level 0.216000
0.061200* stationary 5% level 0.146000

International Journal of Social Sciences and Information Technology
ISSN 2412-0294
Vol VII Issue VII, July 2021
© Ogero, Obere, Odada 6
10%level 0.119000
INT
1% level 0.216000
0.151035* stationary
5% level 0.146000
10%level 0.119000
XR
1% level 0.216000
0.108431* stationary
5% level 0.146000
10%level 0.119000
Asterisk (*) 1% level
Source: Author, 2021
The results in table 1 indicates that the null hypothesis that FDI is stationary is rejected as the KPSS test statistic
0.219422 is greater than the asymptotic critical value 0.216 at 99% confidence interval. Therefore, the study
treats FDI as non-stationary. The null hypothesis that GDP is stationary, as well, is rejected as the KPSS test
statistic 0.287885 is greater than the critical value 0.216 at 1% level of significance. The study, therefore, treats
GDP non-stationary.
The null hypotheses that; INF is stationary, INT is stationary and XR is stationary are not rejected as the KPSS
test statistics of 0.01612, 0.151035 and 0.108431 respectively are less than the critical test statistic of 0.216 at
1 % level of significance. The study, thus, treats INF, INT and XR stationary.
Non-stationary variables, if estimated, yield unreliable estimates and, thus, spurious and misleading. Given
that the stochastic processes have a mixture of stationary and non- stationary variables, the study employs
common logs on FDI and GDP to make them stationary as documented in table 2 below.
Table 2: Stationarity Test for Common logs
VARIABLE
ASYMPTOTIC
CRITICALVALUES
KPSS TEST
STATISTIC
VALUE REMARK
log(FDI)
1% level 0.216000
0.202273* stationary
5% level 0.146000
10%level 0.119000
log(GDP)
1% level 0.216000
0.183780* stationary
5% level 0.146000
10%level 0.119000
Asterisk (*) 1% level
Source: Author, 2021
The results in table 2 above showed that, the null hypothesis that, log (FDI) is stationary is not rejected as the
calculated KPSS t-value 0.202273 is less than the asymptotic critical t-value 0.216000 at 1% level of
significance. As well the null hypothesis that log (GDP) is stationary is not rejected as the calculated KPSS t-

International Journal of Social Sciences and Information Technology
ISSN 2412-0294
Vol VII Issue VII, July 2021
© Ogero, Obere, Odada 7
value 0.183780 is less than the asymptotic critical t-value 0.21600 at 1% level of significance. This indicates
that the common logs of FDI and GDP aretreats stationary.
The study employs common logs on all the variables except on interest rates as it contained negative values in
its variables, whereas, common log is a non-negative factor. This is to increase the level of efficiency in the
analysis.
4.2 GRANGER CAUSALITY
The objective of the study is to show the causal relationship between FDI inflows and the selected
macroeconomic variables. The study employs Granger causality test to determine whether one time series is
significant in forecasting another, through measuring the ability to predict the future values of a time series
using prior values of another time series. The study observed two causalities for every pair of time series. That
is,
H0: Y does not granger cause X
H0: X does not granger cause Y
Whereby the rejection of the null hypothesis is done at 0.1 level for the study to capture all the possible
causalities. The null hypothesis is rejected on the basis that the calculated p-value is greater than the critical p-
value (0.1) and, failed to reject when the calculated p-value is less than the given p-value (0.1).
Table 3: Pairwise Granger Causality Tests
Pairwise Granger Causality Tests
Date: 01/20/21 Time: 20:51
Sample: 1974 2018
Lags: 2
Null Hypothesis: Obs F-Statistic Prob.
log(GDP) does not Granger Cause log(FDI) 43 9.22417 0.0005
log(FDI) does not Granger Cause log(GDP) 2.71241 0.0792
log(XR) does not Granger Cause log(FDI) 43 2.70759 0.0796
log(FDI) does not Granger Cause log(XR) 1.51286 0.2333
log(INF) does not Granger Cause log(FDI) 43 1.99437 0.1501
log(FDI) does not Granger Cause log(INF) 3.88286 0.0292
INT does not Granger Cause log(FDI) 43 0.47347 0.6265
log(FDI) does not Granger Cause INT 0.45536 0.6376
Source: Author, 2021
Granger causality results in table 3 indicates that, the null hypothesis that log (FDI) does not granger cause log
(GDP) is rejected as the p-value 0.0792 is less than the critical p-value of 0.1. The study, therefore, treats log
(GDP) as a function of log (FDI) at 10% level of significance. The null hypothesis that log (GDP) does not

International Journal of Social Sciences and Information Technology
ISSN 2412-0294
Vol VII Issue VII, July 2021
© Ogero, Obere, Odada 8
granger cause log (FDI), as well, is rejected since the p-value 0.0005 is less than the critical p-value 0.1 and
the study treatslog (FDI) a function of log (GDP). This shows that there exists a feedback relationship between
log (GDP) and log (FDI).
The null hypothesis, log (XR) does not granger cause log (FDI) is rejected at 0.1 critical p value as it is greater
than the calculated p-value 0.0796. Thus, log (FDI) istreats a function of log (XR). The null hypothesis that
log (FDI) does not granger cause log (XR) is not rejected as the calculated p-value 0.2333 is greater than the
critical value 0.1 at 10% level of significance. This indicates a unidirectional influence of log (XR) on log
(FDI).
Granger causality results between log (INF) and log (FDI) indicates that, the null hypothesis log (INF) does
not granger cause log(FDI) is not rejected as the calculated p-value 0.1501 is greater than the critical p-value
0.1. Wherein, the null hypothesis that log (FDI) does not granger cause log (INF) is rejected as the critical p-
value 0.1 is greater than the calculated p-value 0.0292, thus a unidirectional influence of log (FDI) on log (INF)
The null hypothesis that, (INT) does not granger cause log (FDI) is not rejected as the calculated p-value 0.6265
is greater than the critical p-value 0.1. As well, the null hypothesis, log (FDI) does not granger cause INT is
not rejected as the calculated p-value 0.6376 is greater than the critical p-value of 0.1 at 10% level of
significance. Therefore, there exists no causality between INT and log (FDI).
From the granger causality results, the following relationship is documented:
Log (FDI) = ƒ [log (GDP), log (XR)] (5)
The following VAR model (4.2) is obtained from the function (4.1).
𝐥𝐨𝐠(𝑭𝑫𝑰)𝒕 = 𝜷𝟎 + ∑ 𝜷𝟏𝐢 𝐥𝐨𝐠(𝑭𝑫𝑰)𝒕−𝒊𝒑𝒊=𝟏 + ∑ 𝜷𝟐𝐢 𝐥𝐨𝐠(𝑮𝑫𝑷)𝒕−𝒊 + ∑ 𝜷𝟑𝐢𝐥𝐨𝐠 (𝐗𝐑)𝒕−𝒊 +
𝒑𝒊=𝟎
𝒑𝒊=𝟎 𝝁𝒕𝟐 (6)
Where p represents the lags
From the VAR model above GDP and exchange rates are found to be important in determining the levels of
foreign direct investment inflows in Kenya.
4.3 LAG SELECTION
The VAR model estimation requires an optimal lag selection. Therefore, an optimal lag was chosen to fit the
model and this is done through the available lag selection criteria; logL, LR, FPE, AIC, HQ and SC lag
selection criteria. Table 4.4 presents the VAR lag order selection criteria.
Table 4: VAR Lag Order Selection Criteria
VAR Lag Order Selection Criteria
Endogenous variables: log(FDI) log(GDP) log(INF) log(XR) INT
Exogenous variables: C
Date: 01/25/21 Time: 09:42
Sample: 1974 2018
Included observations: 40
Lag logL LR FPE AIC SC HQ
International Journal of Social Sciences and Information Technology
ISSN 2412-0294
Vol VII Issue VII, July 2021
© Ogero, Obere, Odada 9
0 -303.7847 NA 3.489999 15.43923 15.65034 15.51557
1 -95.60096 353.9123 0.000372 6.280048 7.546708* 6.738032
2 -61.93314 48.81834 0.000256 5.846657 8.168866 6.686295
3 -40.83600 25.31657 0.000367 6.041800 9.419559 7.263091
4 -16.42840 23.18722 0.000534 6.071420 10.50473 7.674364
5 48.26693 45.28673* 0.000143* 4.086654* 9.575512 6.071251*
* indicates lag order selected by the criterion
LR: sequential modified LR test statistic (each test at 5% level)
FPE: Final prediction error
AIC: Akaike information criterion
SC: Schwarz information criterion
HQ: Hannan-Quinn information criterion
Source: Author 2021
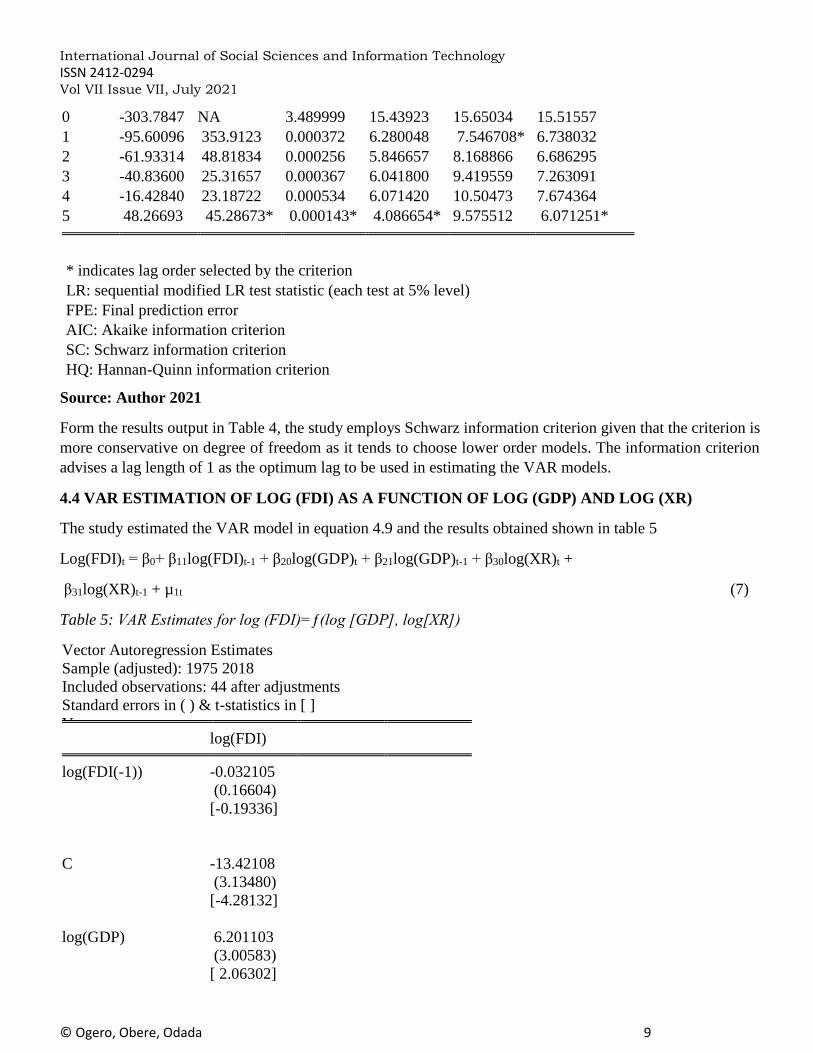
Form the results output in Table 4, the study employs Schwarz information criterion given that the criterion is
more conservative on degree of freedom as it tends to choose lower order models. The information criterion
advises a lag length of 1 as the optimum lag to be used in estimating the VAR models.
4.4 VAR ESTIMATION OF LOG (FDI) AS A FUNCTION OF LOG (GDP) AND LOG (XR)
The study estimated the VAR model in equation 4.9 and the results obtained shown in table 5
Log(FDI)t = β0+ β11log(FDI)t-1 + β20log(GDP)t + β21log(GDP)t-1 + β30log(XR)t +
β31log(XR)t-1 + µ1t (7)
Table 5: VAR Estimates for log (FDI)=ƒ(log [GDP], log[XR])
Vector Autoregression Estimates
Sample (adjusted): 1975 2018
Included observations: 44 after adjustments
Standard errors in ( ) & t-statistics in [ ]
V log(FDI)
log(FDI(-1)) -0.032105
(0.16604)
[-0.19336]
C -13.42108
(3.13480)
[-4.28132]
log(GDP) 6.201103
(3.00583)
[ 2.06302]

International Journal of Social Sciences and Information Technology
ISSN 2412-0294
Vol VII Issue VII, July 2021
© Ogero, Obere, Odada 10
log(GDP(-1)) -4.190853
(2.95676)
[-1.41738]
log(XR) 4.977436
(3.10755)
[ 1.60173]
log(XR(-1)) -5.558262
(3.10659)
[-1.78919]
R-squared 0.606385
Adj. R-squared 0.554594
Sum sq. resids 51.96477
S.E. equation 1.169399
Source: Author 2021
The results in Table 5 indicate that the current year (t) FDI is not important in determining the level of FDI in
the next year (t+1). This is arrived at as the calculated t-statistics, -0.19336, is greater than the critical t-value
of -1.96 at the 5% level of significance hence the null hypothesis that β11=0 fails to be rejected.
GDP is an important factor in influencing FDI instantaneously as the calculated t-statistics, 2.06302, is greater
than the critical t-statistics of 1.96 for a positive relationship at the 5% level of significance, indicating that the
null hypothesis that β20=0 is rejected. Therefore, a 1 % increase in GDP leads to an instant increase in FDI by
6.201103% as indicated by the coefficient, thus, direct relationship. Whereas, GDP in current year (t) is not
important in influencing FDI next year (t+1) as the null hypothesis that β21=0 is not rejected given the
calculated t-statistics -1.41738 is greater than the critical t- value -1.96 for an inverse relationship at 5% level
of significance.
Instantaneous influence of XR on FDI is not important as the null hypothesis that β30=0 is not rejected given
that the calculated t-statistics, 1.60173, is less than the critical t-statistics of 1.96for a direct relationship at the
5% level of significance. As well, current year (t) XR is not important in determining the level of FDI in the
next year (t+1) as the null hypothesis that, β31=0 has failed to be rejected given the calculated t-value, -1.78919,
is greater than the critical t-value of -1.96 for an inverse relationship at the 5% level of significance. The results
reveal that the coefficient of determination (adjusted R-squared) of 0.554594 implies that 55.45% of the
variation in FDI is explained by the explanatory variables in the model. The remaining variation is explained
by lags and variables not included in the model.
The study finds a positive relationship of economic growth on FDI inflows. This is consistent with Gastnanga
et al., (1998), Alcharaz (2003) and Njuguna 2013 who finds a positive relationship between economic growth
and foreign direct investment inflows. The study, as well, is consistent with the literature as the findings are in
approval with Wanjiru (2013) and Ndanu (2018) who finds inflation not being a determinant of FDI inflows
in Kenya.

International Journal of Social Sciences and Information Technology
ISSN 2412-0294
Vol VII Issue VII, July 2021
© Ogero, Obere, Odada 11
5.0 SUMMARY, CONCLUSIONS AND RECOMMENDATIONS
5.1 Summary of Findings
The objective is to show the causal relationship between foreign direct investment inflows and the selected
macroeconomic variables. The causality test determines that foreign direct investment inflows is granger
caused by economic growth (measured by gross domestic product) and exchange rates whereas inflation and
real interest rate are insignificant in granger causing FDI inflows. The VAR estimates for the model, foreign
direct investment inflows as a function of gross domestic product and exchange rate indicates that, current year
level of economic growth is significant in determining the levels of foreign direct investments. The lag 1 values
of foreign direct investment inflows and gross domestic product and the exchange rate are insignificant in
determining foreign direct investment inflows.
5.2 Conclusion
From the findings, the study concludes that exchange rates and gross domestic products are the determinants
of foreign direct investments. The study concludes that, current period’s gross domestic product increase leads
to an increase in the level of foreign direct investment inflows instantaneously. This indicates that a growing
economy presents a conducive environment for attracting foreign direct investment inflows.
5.3 Recommendations
The study concludes that there exists a positive relationship of economic growth on FDI inflows. A rapidly
growing economy shows an opportunity of enhancing income on foreign direct investment given that GDP
indicates levels of economic performance. By attracting FDI, there is introduction of new technology, capital
and cheaper production processes that lead to a rise in economic growth. Therefore, there is need for policies
that enhance foreign direct investment through promoting the prospects of economic growth.
REFERENCES
Asiedu, E. (2002). On the determinants of foreign direct investment to developing countries: Is Africa different?
World development, 30 (1), 107-119.
Charkrabarti, A. (2001). The Determinants of Foreign Direct Investment: Sensitivity Analyses of Cross-
Country Regressions. Kyklos, 54(1), 89-114.
Christopher A. Sims (1980).Macroeconomics and reality, Econometrica, Volume 48, Number 1.
Dunning, J.H. (1993). Multinational Enterprises and the Global Economy, Reading, MA, Addison Wesley
Gastanaga V., Nugent J., & Pashamiova B. (1998). Host Country Reforms and FDI Inflows: How Much
Difference Do They Make? World Development 26(7), 1299-1314.
Liargovas Panagiotis and Anastasia Angelopoulou "Foreign Direct Investment and Growth: EU, EMU and
Transition Economies." Journal of Economic Integration, Vol. 29, No. 3, 2014: 470495.
Lim, D. (1983). Fiscal Incentive and Direct Foreign Investment in Less Developed Countries. The Journal of
Development Studies, 19(2), 207- 212
Mbui N. P. (2017). Effects of Interest Rates on Foreign Direct Investment in Energy and Petroleum Industry
in Kenya, MA Thesis, University of Nairobi.

International Journal of Social Sciences and Information Technology
ISSN 2412-0294
Vol VII Issue VII, July 2021
© Ogero, Obere, Odada 12
Muema, J. (2013). An Analysis of the Determinants of Foreign Direct Investment in Kenya. Unpublished MBA
project, University of Nairobi.
Ndanu Musyoka (2018). The Effect of Real Interest Rates, Inflation, Exchange Rates and Competitiveness on
Foreign Direct Investment in Kenya, Master of Economics, Kenyatta University.
Nduati, M. (2018). The impact of inflation rates on Foreign direct investments in Kenya. MBA project,
University of Nairobi.
Nnadozie, E & AE, Njuguna (2013). Investment Climate and Foreign Direct Investment in Africa, Third
congress of African Economists, Dakar, Senegal.
Ostadi, H. and Ashja, S. (2014). The Relationship Between External Debt and Foreign Direct Investment for
D8 Member Countries. Walia Journal, Vol. 30(3), pp.18-22.
Schneider, F., & Frey, B. (1985). Economic and Political Determinants of Foreign Direct Investment. World
Development, 13(2), 161-175.
UNCTAD (2018). World Investment Report 2018 - Investment and New Industrial Policies.
Vesarach, K. (2014). The Role of Interest Rates in Attracting FDI: A Study on ASEAN 5 65 Economics.
International Journal of Technical Research and Applications.
Wanjala B. M. (2001). Determinants of Foreign Direct Investments in Sub-Saharan Africa, With Inferences on
Kenya, MA economics, University of Nairobi.
Wanjiku M. M. (2016). Impact of Foreign Direct Investments on Economic Growth in Kenya, MA Economics,
University of Nairobi.
Wanjiru S. (2013). Impact of Inflation Volatility and Economic Growth on Foreign Direct Investment in Kenya,
Unpublished MBA thesis, University of Nairobi.
Related Documents