Journal of Emerging Issues in Economics, Finance and Banking (JEIEFB) An Online International Research Journal (ISSN: 2306-367X) 2016 Vol: 5 Issue: 1 1734 www.globalbizresearch.org Relationship between Financial Structure and Financial Performance of Firms Listed at East Africa Securities Exchanges Mwangi Joseph Muchiri, Department of Accounting and Finance, School of Business & Economics, Jomo Kenyatta University of Agriculture and Technology, Kenya. E-mail: [email protected] Willy M Muturi, Department of Accounting and Finance, School of Business & Economics, Jomo Kenyatta University of Agriculture and Technology, Kenya. Patrick M Ngumi, Office of the Chief Executive Officer, Institute of Certified Public Accountants of Kenya (ICPAK), Kenya. _____________________________________________________________________ Abstract Among other factors, the choice of financial structure and mismanagement has led to corporate failure of firms’ world over particularly in East Africa. While mismanagement is being aggressively addressed though ethical code of conduct and even thresholds on managers control in firms, financial structure choice and its impact on financial performance remains a great dilemma to all stakeholders. This study therefore investigated the relationship between financial structure and financial performance of listed firms at the East Africa Securities Exchanges. The study employed explanatory research design with secondary panel data from the financial statements of 61 firms retrieved from the securities exchanges hand books for the period December 2006-2014. Feasible Generalized Least Squares method, random effect for models without moderator and fixed effect for models with moderator, based on Hausman specification test were used. The study found out that in isolation, short term debt, long term debt, retained earnings and external equity had insignificant negative relationship with return on assets but insignificant positive relationship with return on equity. While combined, financial structure had a significant positive and negative relationship with return on equity and return on assets respectively. On moderation of the relationship between financial structure and financial performance, it was found out that gross domestic product growth rate had a significant moderating effect. It is therefore recommended that firms combine both debt and equity in their financial structure and East Africa governments grow and maintain their GDPs trends since GDP was found to have a contingent effect on the financial structure. It is therefore incumbent on firms’ managers and financial advisors to continuously study the market and advice on the appropriateness of the proportions of the various sources of finance based on market circumstances at any given time. ___________________________________________________________________________ Key Words: Financial structure, financial performance

Welcome message from author
This document is posted to help you gain knowledge. Please leave a comment to let me know what you think about it! Share it to your friends and learn new things together.
Transcript
Journal of Emerging Issues in Economics, Finance and Banking (JEIEFB)
An Online International Research Journal (ISSN: 2306-367X)
2016 Vol: 5 Issue: 1
1734
www.globalbizresearch.org
Relationship between Financial Structure and Financial Performance
of Firms Listed at East Africa Securities Exchanges
Mwangi Joseph Muchiri,
Department of Accounting and Finance,
School of Business & Economics,
Jomo Kenyatta University of Agriculture and Technology, Kenya.
E-mail: [email protected]
Willy M Muturi, Department of Accounting and Finance,
School of Business & Economics,
Jomo Kenyatta University of Agriculture and Technology, Kenya.
Patrick M Ngumi, Office of the Chief Executive Officer,
Institute of Certified Public Accountants of Kenya (ICPAK), Kenya.
_____________________________________________________________________
Abstract
Among other factors, the choice of financial structure and mismanagement has led to corporate
failure of firms’ world over particularly in East Africa. While mismanagement is being
aggressively addressed though ethical code of conduct and even thresholds on managers
control in firms, financial structure choice and its impact on financial performance remains a
great dilemma to all stakeholders. This study therefore investigated the relationship between
financial structure and financial performance of listed firms at the East Africa Securities
Exchanges. The study employed explanatory research design with secondary panel data from
the financial statements of 61 firms retrieved from the securities exchanges hand books for the
period December 2006-2014. Feasible Generalized Least Squares method, random effect for
models without moderator and fixed effect for models with moderator, based on Hausman
specification test were used. The study found out that in isolation, short term debt, long term
debt, retained earnings and external equity had insignificant negative relationship with return
on assets but insignificant positive relationship with return on equity. While combined,
financial structure had a significant positive and negative relationship with return on equity
and return on assets respectively. On moderation of the relationship between financial
structure and financial performance, it was found out that gross domestic product growth rate
had a significant moderating effect. It is therefore recommended that firms combine both debt
and equity in their financial structure and East Africa governments grow and maintain their
GDPs trends since GDP was found to have a contingent effect on the financial structure. It is
therefore incumbent on firms’ managers and financial advisors to continuously study the
market and advice on the appropriateness of the proportions of the various sources of finance
based on market circumstances at any given time.
___________________________________________________________________________
Key Words: Financial structure, financial performance
Journal of Emerging Issues in Economics, Finance and Banking (JEIEFB)
An Online International Research Journal (ISSN: 2306-367X)
2016 Vol: 5 Issue: 1
1735
www.globalbizresearch.org
1. Introduction
The determination of a firm’s optimal financial structure is a difficult one since it involves
an analysis of several factors, key among them risk and profitability (Shubita & Alsawalhah,
2012). The decision becomes even more difficult, in times when the economic, social,
technological and political environments in which the firm operates exhibits high degree of
instability (Shubita & Alsawalhah, 2012). Therefore, the choice among ideal proportion of debt
and equity can affect the value of the company, as well as financial performance. Indeed,
Chiang, Chan and Hui (2002) study at Hong Kong Stock Exchange concluded that financial
performance as measured by profitability and capital structure, a subset of financial structure,
are interrelated. Many firms therefore fail for not putting proper strategies, financial among
others, in place.
Financial structure of a firm refers to how a firm finances its assets with all its available
resources (Moyer, McGuigan & Kretlow, 1999). In general, firms finance only a part of their
assets with equity (ordinary, preference and retained earnings) capital , while the other part is
financed by other resources such as long term financial debt or liabilities (like bonds, bank
loans and other loans) and other short term liabilities for example trade payables (Moyer et. al,
1999 Capital structure on the other hand refers to how a firm finances its assets with permanent
short term debt, long term debt, preferred stock and common equity (Moyer et al., 1999). . The
two terms have been used interchangeably by scholars as inferred from their application, a
concept that the researcher wishes to borrow.
Firms can choose among many alternative financial structures. For example, firms can
arrange lease financing, use warrants, issue convertible bonds, sign forward contracts or trade
bond swaps. Firms can also issue dozens of distinct securities in countless combinations to
maximize overall market value (Abor, 2005). Dare and Sola (2010) suggested that capital
structure can take any of the following three alternatives: 100% equity: 0% debt, 0% equity:
100% debt or X% equity: Y% debt. On Dare and Sola (2010), Ishaya and Abduljeleel (2014)
had the following take on their proposed options. Option one is that of a purely equity financed
firm that ignores leverage and its benefits in financing its activities and all the distributions goes
to equity providers. This however is rare in practice. Option two is that of a firm that finances
its affairs wholly on debt, again unrealistic in the real world situation too because hardly will
any provider of fund invest in a business without owners. In essence, it is the equity element
present in capital structure that motivates the debt providers to give their scarce resources to
the business. Option three is that of a firm combining certain proportion of both equity and debt
in its capital structure. It will therefore reap the benefits of combined debt and equity while the
cash flows generated are appropriated between equity and debt providers.
Journal of Emerging Issues in Economics, Finance and Banking (JEIEFB)
An Online International Research Journal (ISSN: 2306-367X)
2016 Vol: 5 Issue: 1
1736
www.globalbizresearch.org
The challenge in option three as provided is the dilution of equity ownership and therefore
the likelihood of emergence of agency conflict between the equity owners and debt providers
(Ishaya & Abduljeleel, 2014). Finanial structure decision is therefore very critical and
fundamental in the business life cycle not only to maximize shareholders wealth but also due
to the impact it has both on sustainability and its ability to satisfy external objectives (Ishaya &
Abduljeleel, 2014). Capital structure theory addresses the means of acquisition of finance
available to a firm, the best mix of such sources that reduces the overall cost of capital while
maximizing returns and the management to achieve the desired objectives (Abor, 2005).
Financial performance is the process of measuring the results of a firm's policies and
operations in monetary terms (Erasmus, 2008). It identifies the financial strengths and
weaknesses of a firm by establishing relationships between the items of the financial position
and income statement. As noted by Erasmus (2008), profitability, return on equity and liquidity
ratios among others provide valuable tools or measures to stakeholders to evaluate the past and
current financial performance of a firm. To this end, ratios relating to profitability and financial
structure were used.
Many empirical and theoretical studies have shown that financial structure really influences
firm's performance. Berger and Patti (2006) for instance posit that capital structure employed
by firms influence their financial performance trends, whose empirical determination and
analysis using listed firms in East Africa Securities Exchanges (EASE) is the overall objective
of this study.
1.1 Problem Statement
Financing decisions result in a given financial structure and suboptimal financing decisions
can lead to corporate failure (Chisti, Ali & Sangmi, 2013). A great dilemma to scholars,
business managers, investors among other stakeholders is whether there exists an optimal
financial structure that maximizes the stakeholders’ wealth, as the core object of firms except
public utility providers. Therefore, measuring the quality of any financing decision is to
investigate the effect of such a decision on the firm’s performance and in particular its impact
on financial performance (Gill et al., 2011).
To establish the impact and clear understanding on the relationship between financial
structure and financial performance of a firm, research has been undertaken by various
researchers all over the world particularly on capital structure. For example, in examining the
effect of capital structure on profitability of the American service and manufacturing firms, Gill
et al. (2011) concluded that there exist a positive relationship between short-term debt to total
assets and profitability and between total debt to total assets and profitability in the service
industry. Abor (2005) investigated the relationship between capital structure and profitability
of listed firms at the Ghana Stock Exchange (GSE) and found a significant positive relation

Journal of Emerging Issues in Economics, Finance and Banking (JEIEFB)
An Online International Research Journal (ISSN: 2306-367X)
2016 Vol: 5 Issue: 1
1737
www.globalbizresearch.org
between the ratio of short-term debt to total assets and return on equity (ROE) and negative
relationship between the ratio of long-term debt to total assets and ROE.
On the contrary however, Abdul (2012) conducted a research to determine the relationship
between capital structure decisions and the performance of firms in Pakistan and found that
financial leverage has a significant negative relationship with firm’s performance, measured by
return on assets (ROA). Ebaid (2009) carried out a study in Egypt to investigate the impact of
choice of capital structure on the performance as measured by gross profit margin and
concluded that capital structure has little or no impact on a firm’s performance
While many studies have been done elsewhere, in Kenya only a few known to the researcher
has been done and documented even as many firms keenly focus on financial restructuring to
avoid delisting or even liquidation. Kaumbuthu (2011) for example carried out a study to
determine the relationship between capital structure and return on equity for industrial and
allied firms at the NSE during the period 2004 to 2008 and found a negative relationship
between debt to equity ratio and ROE. His study however focused on one predictor variable
(debt to equity ratio) which therefore seems simplistic.
To investigate the relationship between leverage and the financial performance of listed
firms in Kenya, Maina and Kondongo (2013) found a significant negative relationship between
debt and profitability but no effect on firm value over the period 2002 – 2011. Again, no attempt
was made to separate debt into short and long term and analyse their respective contributions.
Like Kaumbuthu (2011), their study focused on one predictor variable too.
In summary, studies on the relationship between firm’s financial structure and financial
performance have yielded mixed results. In East Africa (EA), available studies have not
attempted to split equity so as to appreciate the contribution of the retained earnings and share
capital to financial performance separately. No attempt too known to the researcher has been
made to split debt into short and long term and analyse their statistical significance to financial
performance or rank the various sources based on the specific’s source contribution to financial
performance that may even help to validate the pecking order theory in Kenya. Even the
working capital studies that the researcher came across has focused more on cash conversion
cycle which is not an objective in this study. Worse off is lack of documented studies known to
the researcher that compare the financial structure and financial performance relationship of
firms in East Africa. It is for this reasons that this study was therefore conducted. The general
objective was to study the relationship between financial structure and financial performance
of firms listed at EASE with the following specific objectives.
1. To explore the relationship between short term debt and financial performance of firms
listed at EASE.
Journal of Emerging Issues in Economics, Finance and Banking (JEIEFB)
An Online International Research Journal (ISSN: 2306-367X)
2016 Vol: 5 Issue: 1
1738
www.globalbizresearch.org
2. To find out the relationship between long term debt and financial performance of firms
listed at EASE.
3. To assess the relationship between retained earnings and financial performance of firms
listed at EASE.
4. To determine the relationship between share capital and financial performance of firms
listed at EASE.
5. To evaluate the moderating effect of GDP growth rate on the relationship between
financial structure and financial performance of firms listed at EASE.
The research hypothesis were
H01: There is no statistically significant relationship between short-term debt and financial
performance of firms listed at EASE.
H02: There is no statistically significant relationship between long-term debt and
financial performance of firms listed at EASE.
H03: There is no statistically significant relationship between retained earnings and financial
performance of firms listed at EASE.
H04: There is no statistically significant relationship between share capital and
financial performance of firms listed at EASE.
H05: There is no statistically significant moderating effect of GDP growth rate on the
relationship between financial structure and financial performance of firms listed at
EASE.
2. Literature Review
In an attempt to explain how firms finance their assets and the factors that influence these
funding decisions, a number of theories and models of capital structure have been proposed
over the years by different theorists. These theories and models try to explain the percentage of
debt and equity in a firm that not only maximize firms’ value, but also the impact on the firms’
capability to face the competition in the ever changing market. This study is underpinned by
capital structure theories that provide the basis of study variables choice. In particular, capital
structure irrelevance, relevance, agency, signaling theory, trade off and pecking order theories
are reviewed since all of them support both the dependent and predictor variables as shown in
the conceptual framework.
Capital structure irrelevance theory was proposed by Modigliani and Miller (1958) who said
that without taxes and under assumptions of perfect markets, with no capital market frictions
(no transaction costs, asset trade restrictions or bankruptcy costs), symmetric access to credit
markets (firms and investors can borrow or lend at the same rate and firm financial policy
reveals no information), each firm belonging to a risk class set with common earnings, a firm’s

Journal of Emerging Issues in Economics, Finance and Banking (JEIEFB)
An Online International Research Journal (ISSN: 2306-367X)
2016 Vol: 5 Issue: 1
1739
www.globalbizresearch.org
debt-equity ratio does not affect its market value. Therefore the value of the levered firm is
equal to the value of the unlevered firm and hence capital structure financing decision is
therefore irrelevant. They argued that if two firms are identical in all respects but only differ in
their total market value and in the way that they are financed, investors will sell shares of the
overvalued firm, buy shares of the undervalued firm and continue this process until the two
firms command the same value through a process referred to as arbitrage.
On cost of capital, MM argued that the cost of equity of a levered firm is equal to the cost
of equity of an unlevered firm plus a financial risk premium, which depends on the degree of
financial leverage. Using more debt in the capital structure will not increase the value of the
firm because the benefits of cheaper debt will be exactly offset by an increase in the riskiness
of the equity and hence it’s cost to keep the value of the firm constant. The MM irrelevance
theory has been largely criticized due to the assumptions held which are unlikely to hold in
practice at least in the long run.
In incorporates taxes, MM (1963) modified their irrelevance theory and argued that capital
structure indeed matter in determining the value of a firm. The theory was based on the fact
that in many jurisdictions interest on debt is an allowable expense hence tax shield. Based on
this assertion, firms could borrow up to a 100% to reduce their taxes to zero if possible. In
practice however, company tax system and personal tax system interact in complex ways.
Miller (1977) suggested that the presence of taxes on personal income may reduce the tax
advantage associated with debt financing and hence 100% debt financing is not feasible.
Static tradeoff theory assert that while investment decision and firm assets are held constant,
an optimal capital structure is attained when the tax benefit of debt equals to leverage associated
costs which include financial distress, bankruptcy and agency (Myers, 2001). The theory hold
that more profitable firms have more debt-serving capacity thus a higher debt ratio and vice
versa (Luigi & Sorin, 2009). The theory assumes the existence of different target leverage for
different firms due to firm’s specific factors and also believe that firms are already at their
presumed targets (Myers, 2001). Dynamic trade off theory propose that firms may deviate from
their target capital structure but they will exhibit an adjustment behavior towards that target
(Abdeljawad, Nor, Ibrahim & Rahim, 2013). The existence of a presumed target requires that
any deviation from that target leverage be adjusted at a certain speed of adjustment (SOA) but
the magnitude of this SOA is different for different firms (Frank & Goyal, 2007).
The pecking order theory by Myers and Majluf (1984) argue that firms have a preferred
hierarchy for financing decisions with the highest preference being to use internal financing
before resorting to any form of external funds. They envisage an inverse relationship between
debt and financial performance. Though Agency theory, Jensen and Meckling (1976) argue that
an optimal capital structure is attainable by reducing the costs resulting from the conflicts

Journal of Emerging Issues in Economics, Finance and Banking (JEIEFB)
An Online International Research Journal (ISSN: 2306-367X)
2016 Vol: 5 Issue: 1
1740
www.globalbizresearch.org
between the managers, owners and debt holders. They argued that debt can be used to control
the managers’ behaviour by reducing the free cash flows within the firm likely to be
misappropriated by ensuring prompt payment of interest payments. Agency theory has support
for high debt and financial performance relationship.
Information signaling theory argue that the choice of firm’s capital structure signals to the
outside investors the information that the insiders possess. It further argue that due to the
problem of information asymmetry, it makes it difficult for lenders and prospective common
stock investors to accurately assess their level of risk and hence the reliance on what is
communicated by the insiders (Ross, 1977). In sum, two hypothesis emerge from the theory.
First is by Ross (1977) who argue that a firm signals an increase in the firm’s asset value by
increasing its leverage since it has the confidence of meeting the debt obligation. Second is by
Brealey, Leland and Pyle (1977) who argue that a firm signals the increase in firm’s value by
reducing it leverage since it has enough retention to finance its future growth.
Life cycle theory posit that firms use different types of financial structure at different stages
of life cycle. Not many debt providers are keen to lend to new firms however, in any case there
are no assets to act as collateral mostly. Preference for debt is at growth at maturity stages when
financial performance and asset bases are sound. A critic to the theory is the criteria for
classifying life cycle stages which is not precise and hence varied stages by different scholars
yielding different empirical findings (Castro, Tascón, & Amor, 2011).
Many empirical findings on the relationship between debt and profitability have been
reported by various researchers that this study explores. For instance, to investigate the
relationship between capital structure and profitability of conglomerate, consumer goods, and
financial services firms quoted in Nigeria Stock Exchange, Babatunde, Akinwunmi, Khadijah
and Yusuf (2014) showed that the relationship between capital structure and ROA is not
significant across all firms except for 7up and Nestle. The study also showed an insignificant
relationship between ROE and debt asset ratio. However, there was a significant relationship
in almost all firms between ROE and debt to equity ratio. They concluded that highly geared
firms have significant relationship with ROE and insignificant relationship with ROA.
The sample size was 120 obtained using random sampling covering the period 2000 to 2011.
ROA and ROE were used as performance proxies while debt equity ratio and debt asset ratio
were used as capital structure proxies. The relationship between the performance and capital
structure proxies were analysed using correlation coefficient and regression techniques. This
findings are consistent with Anil and Zenner (2005) view on life cycle theory that companies
with large and stable profits should make greater use of debt to take advantage of interest tax
shields. It would have been imperative though for the study to separate short and long term debt
and analyse their implications separately

Journal of Emerging Issues in Economics, Finance and Banking (JEIEFB)
An Online International Research Journal (ISSN: 2306-367X)
2016 Vol: 5 Issue: 1
1741
www.globalbizresearch.org
To analyse on how firms choose their capital structure under pecking order and trade-off
theories particularly when they have leverage target Zurigat (2009) concluded that leverage is
positively related to profitability. They used data from 114 non-financial Jordanian firms (of
which 62 are industrial firms and the remaining are services firms) for the period 1997-2005.
Panel data analysis was employed. While the study disagree with the pecking order theory
hypothesis, it supported both the Agency cost and MM capital structure relevance as both
provides that profitability increase with debt capacity. The study did not discuss in depth the
proxy for profitability.
To study the effect of capital structure on profitability of the industrial companies listed on
Amman Stock Exchange during a six-year period (2004-2009), Shubita and Alsawalhah (2012)
found a significantly negative relation between debt and profitability. This suggests that
profitable firms depend more on equity than debt. The study sample consisted of 39 randomly
selected companies with correlations and multiple regression analysis as techniques of analysis.
The findings contravene Myres and Majluf (1984) pecking order hypothesis that debt is
preferred to equity. It would have been good for the study to separate the retained earnings from
other equity and assess its impact on profitability and span beyond manufacturing sectors for
generalizations of the results. This are some of the objectives of this study.
To test the predictions of pecking order theory using data from the Chinese market Tong
and Green (2005) found a significant negative relationship between leverage and profitability
and a significant positive relationship between leverage and past dividend. They argue that their
findings support the pecking order theory over trade-off theory and will be capable of
explaining the financing behaviour of Chinese companies. The sample size was 42 firms. This
study however considered a s mall sample size in a wide market. Possibly results would have
been different if the sample size was improved.
To determine the relationship between capital structure and financial performance for
industrial and allied sectors in the NSE during the period 2004 to 2008, Kaumbuthu (2011)
found a negative relationship between debt to equity ratio and ROE. The findings therefore
suggest that industrial firms prefer equity to debt again invalidating the pecking order theory.
The proxies for capital structure and financial performance were debt to equity ratio and ROE
respectively with regression as the technique of analysis. Again, it would have been imperative
for the study to span beyond one sector for generalization of findings which is what this study
seeks to do.
To examine capital structure and profitability of the Nigerian listed firms from the agency
cost theory perspective Ishaya and Abduljeleel (2014) found that debt is negatively related with
profitability but equity is directly related with profitability. A sample of 70 out of population
of 245 firms listed at the Nigerian securities Exchange was used for the period 2000 – 2009.

Journal of Emerging Issues in Economics, Finance and Banking (JEIEFB)
An Online International Research Journal (ISSN: 2306-367X)
2016 Vol: 5 Issue: 1
1742
www.globalbizresearch.org
Panel data for the firms were generated and analyzed using fixed-effects, random-effects and
Hausman Chi Square estimations. The findings are consistent with Shubita and Alsawalhal
(2012) survey and also provide evidence against the agency cost theory.
To determine the impact of choice of capital structure on the performance of firms in Egypt,
Ebaid (2009) carried out a study of listed firms in Egypt and found that capital structure has
little or no impact on a firm’s performance. ROE, ROA, and gross profit margin were used as
proxies for performance while short-term debt to asset ratio, long-term debt to asset ratio, and
total debt to total assets were used as proxies for capital structure. Multiple regression was used
to analysis the data. The results were consistent with Berger and Patti (2006) findings.
To evaluate the relationship between leverage and the financial performance of listed firms
in Kenya, Maina and Kondongo (2013) found a significantly negative relationship between
debt and profitability but no effect on firm value. Data for the period 2002 – 2011 was analysed
using descriptive, regression and correlation. Tobin’s Q was used as proxy for firm value while
ROE and ROA were used as proxies for financial performance. Debt to equity, debt to assets
and long term debt to equity were used as proxies for leverage. This results present
contradicting and interesting findings. While they validate MM (1958) irrelevance theory
through Tobin Q, they negate the same since debt had a negative relationship with profitability,
implying that ultimately, it affects the firm value somehow since a firm value is sum of its debt
and equity(which includes retained profits).
While analyzing the impact of macro-economic circumstances and social protection
expenditure on economic deprivation in 25 European countries over the period 2007–2011,
Visser, Gesthuizen and Scheepers (2014) found that GDP growth rate had a moderating effect
on the relationship. They used linear multilevel regression analyses so as to take care of the
hierarchical structure of the data from 148383 respondents.
In summary, the literature review informs the study variables and their underlying
relationships as a basis of developing a conceptual framework that facilitates a quick
understanding of the connection between the responses, explanatory and moderating variables
by the reader as follows.

Journal of Emerging Issues in Economics, Finance and Banking (JEIEFB)
An Online International Research Journal (ISSN: 2306-367X)
2016 Vol: 5 Issue: 1
1743
www.globalbizresearch.org
Figure 2.1 Conceptual Framework
Firms Financial Structure Firms Financial Performance
Independent variables Moderating variable Dependent variable
3. Methodology
The study employed explanatory research design with secondary panel data from the
financial statements of 61 non-financial firms from a target population of 63 firms, retrieved
from the securities exchanges hand books for the period December 2006-2014. Data was
analysed using correlations, descriptive statistics and multiple regression with the aid of
Statistical Package for Social Sciences (SPSS) 18 and STATA 12. The exclusion of financial
institutions is to remove anomalies associated with regulation like liquidity levels, core capital
and bad debt provision (Santos, 2001).
The regression models used for the analysis are.
1. Rit= β0 + β1SDit+ β2LDit + β3REit+ β4Eit +ej
2. Rit= β0 + β1 SDit+ β2 LDit + β3 REit+ β4 Eit+ β5 GDPR +GDPR (β6SDit+ β7LDit + β8REit+
β9Eit) +ej [Baron & Kenny, 1986].
3. Rit = α0 + α1SDit +e3
4. Rit = λ0 + λ1LDit + e4
5. Rit =a0+a1REit+e5
6. Rit =b0+b1Eit+e6
Where Rit is ROA and ROE for each firm i and year t;
ROA is net profit after tax/total assets
ROE is net profit after tax/total equity
SD is current liabilities/total assets
LD is non-current liabilities/total assets.
Share capital (Ordinary
capital, Preference capital)
Short term debt (Creditors,
Accruals and short term loans)
Long term debt (Loan,
bond)
GDP growth rate Retained earnings
Return on assets
Return on equity

Journal of Emerging Issues in Economics, Finance and Banking (JEIEFB)
An Online International Research Journal (ISSN: 2306-367X)
2016 Vol: 5 Issue: 1
1744
www.globalbizresearch.org
RE is the retained earnings/total assets
E is reserves, preference and ordinary capital/total assets
GDPR is gross domestic product growth rate
βi, αi, λi, ai and bi (i=0,1…,5) are the associated regression coefficients.
Ej is the error term (j=1,2…,6)
4. Findings and Discussion
4.1 Diagnostic tests
4.1.1 Multicollinearity
All the correlation coefficients between variables (in absolute form) were less than 0.8
indicating that there was no multicollinearity Gujarati (2003). This is an assurance that the
regression coefficients were stable hence valid significance tests as put by Cooper and Schindler
(2006).
4.1.2 Serial (Auto Correlation) Correlation
The F statistics for models with and without moderation of GDP rate were 12.063 and
63.232 with ROA as the response variable and 12.016 and 127.57 with ROE as the response
variable respectively. The p value for both ROA and ROE models without moderation was
0.0000 and 0.001 for both with moderation. The test statistics were therefore significant in all
cases at 5% level of significance to indicate presence of first order serial correlation in the data.
To remedy this problem, feasible generalized least squares (FGLS) method was therefore used.
This method also guarantee the efficiency and consistency of the estimators for valid
significance tests.
4.1.3 Heteroscedasticity
The null hypothesis was no heteroscedasticity for all models with or without moderator. For
a regression model with ROA as the response variable, the test yielded a chi-square value of
342.45 with a p-value of 0.000 with moderation and a chi-square value of 54.27 with a p-value
of 0.000 without moderation. The chi-square values were in both cases statistically significant
at 5% significance level and hence the null hypotheses were rejected to signify the existence of
heteroscedasticity. To overcome the problem so as to make the standard errors unbiased leading
to valid test statistics and hence significance tests as advocated by Wooldridge (2002), FGLS
method was used.
For a regression model with ROE as the response variable, the test yielded a chi-square
value of 342.02 with a p-value of 0.0000 with moderation and a chi-square value of 71.05 with
a p-value of 0.0000 without moderation. The chi-square values were again in both cases
statistically significant at 5% significance level and hence the null hypotheses were rejected to
signify the existence of heteroscedasticity. Subsequently, FGLS method was employed to
overcome the problem.
Journal of Emerging Issues in Economics, Finance and Banking (JEIEFB)
An Online International Research Journal (ISSN: 2306-367X)
2016 Vol: 5 Issue: 1
1745
www.globalbizresearch.org
4.1.4 Stationarity
The null hypotheses that all panels contain unit roots for all variables were rejected at 5%
significance level since the p values were less than 5%. This therefore implies that all the
variables were stationary (no unit roots) and hence robust regression results even without lags
(at level).
4.1.5 Hausman Specification
For ROA and ROE without moderator respectively, the nulls were failed to be rejected since
the p values, 0.0933 and 0.2159 respectively were greater than 5% level of significance. This
implies that random effects models were preferred. For ROA and ROE with moderator
respectively, the nulls were rejected since the p values 0.0109 and 0.011 respectively were less
than 5% level of significance implying that fixed effects models were preferred. This in in
tandem with Green (2008) recommendations.
4.1.6 Granger Causality
The p-values for all lagged financial structure components in isolation against ROA are
greater than 5% level of significance implying that the null hypotheses that financial structure
does not granger cause financial performance are not rejected. When all lagged values of
financial structure are run against ROA, the p values are zero, which are less than 5% level of
significance hence the null hypothesis that financial structure does not granger cause financial
performance is rejected. The same results are replicated when financial structure components
are run against ROE.
The p-values for all lagged values of ROA and ROE regressed against SD, LD, E, RE and
all combined are all greater than 5% level of significance hence the null hypotheses that
financial performance does not granger cause financial structure is not rejected. In summary,
the tests imply that while a single component of financial structure does not granger cause
financial performance, a mixture of the same does. Financial performance does not however
granger cause financial structure.
4.1.7 Normality
The Shapiro Wilk results for all regression models (with and without the moderator) were a
w=0.861 with a p value of 0.000. This therefore indicated that the null was rejected at 5% level
of significance to imply that the residuals were not normally distributed. To overcome this
problem that may distort the significance tests, robust standard errors were used instead of the
normal standard errors (Gujarati, 2003). Robust standard errors generally improves the
efficiency of the estimators (Green, 2008).
4.2 Descriptive Statistics
As shown in table 4.1, for all firms in EASE the average ROE over the period was 20.85%
with a minimum value of -10.18, maximum value of 19.94 and a standard deviation of 1.19928.

Journal of Emerging Issues in Economics, Finance and Banking (JEIEFB)
An Online International Research Journal (ISSN: 2306-367X)
2016 Vol: 5 Issue: 1
1746
www.globalbizresearch.org
This shows that though on average firms had a positive return on equity, the majority of firms
ROE are to the right of the distribution just like ROA. The mean ROA was 10.76% with a
standard deviation of 0.15793 and a minimum and maximum of -0.54 and 1.64 respectively.
This shows that firms were generally profitable to reward the investment in assets. The
fluctuation of returns in ROE were however higher than ROA as shown by standard deviations.
The average short term and long term debts to total assets are 28.89% and 16.97%
respectively. This demonstrates that a large portion of firms’ assets was financed with short
term debt. The maximum borrowings also reaffirms this position as shown in table 4.1 with
short term debt to total assets ration being 1.11 and long term to total assets ratio being 0.82.
This could imply that short-term debt financing was easily available compared to the long term
debt which is usually associated with high value collateral and at times restrictive covenants to
make it unattractive. All firms however reported positive skewness on their debts to show that
majority lied on the right tail of the distribution. This findings contradict Mwangi, Muathe and
Kosimbei (2014) who concluded that majority of firms at the NSE use long term debt to finance
their assets.
The average retained earnings to total asset over the period was 18.94%, minimum of -0.84
and maximum of .82 with a negative skewness of -0.424. This implies that majority of firms
were utilizing their retained earnings above average usage and therefore lied on the left tail of
the distribution. The mean equity to total assets ratio is 35.2% with a minimum of -0.11,
maximum of 1.05 and a positive skewness of 0.61. This show that though generally firms raised
capital through shares, majority were to the right tail. Finally, the average GDP growth rate
over the period was 5.4525%, minimum of 0.2% and maximum of 10.4% with a negative
skewness of -0.886.
Table 4.1: Descriptive Statistics
N Minimum Maximum Mean Std. Deviation Skewness
EASE GDP(%) 418 0.2 10.4 5.4525 2.20671 -0.886
SD 418 0 1.11 0.2889 0.20904 1.032
LD 418 0 0.82 0.1697 0.16119 1.507
E 418 -0.11 1.05 0.352 0.25056 0.61
RE 418 -0.84 0.82 0.1894 0.26588 -0.424
ROA 418 -0.54 1.64 0.1076 0.15793 2.67
ROE 418 -10.18 19.94 0.2085 1.19928 8.999
4.3 Regressions Statistics
4.3.1 Relationship between Financial Structure and Financial Performance of Firms Listed at EASE
As shown in table 4.2, results on the relationship between financial structure and ROA show
that the coefficient of SD was -6.76 hence a negative relationship with ROA. The p value was
0.153 which is greater than 5% level of significance. This indicate that SD had a statistically

Journal of Emerging Issues in Economics, Finance and Banking (JEIEFB)
An Online International Research Journal (ISSN: 2306-367X)
2016 Vol: 5 Issue: 1
1747
www.globalbizresearch.org
insignificant inverse relationship with ROA. The coefficient of LD was -6.13 hence a negative
relationship with ROA. The p value was 0.162 which is greater than 5% level of significance.
This indicate that LD had a statistically insignificant inverse relationship with ROA.
This findings were consistent with MM (1963) capital structure irrelevance theory that the
amount of debt in the capital structure does not affect the performance and the value of the firm.
Tthe negative relationship between long term debt and the firm performance tends to support
the pecking order theory too. The results also agree with Ebaid (2009) who concluded that
capital structure has little or no impact on a firm’s performance in Egypt. They are also
consistent with Afza and Nazir (2007) who concluded that aggressive financing policy and
firm’s profitability are negatively related. However, the findings contradict those of Abdul
(2012) who found that financial leverage has a significant negative relationship with firm’s
performance, measured by ROA in Pakistan.
Similarly, the coefficients of E and RE were also negative at -6.750 and -1.142 respectively
showing a negative relationship with ROA too. The p values were 0.809 and 0.16 respectively
hence E and RE had insignificant inverse relationship with ROA also. The results agreed with
Abor (2007) who concluded a negative relationship between all capital structure sources and
ROA but contradicts Ishaya and Abduljeleel (2014) who concluded that a positive relationship
between equity and profitability exist. The overall model is significant and strong with a p value
of 0.0000 of being greater than the Wald Chi-square of 2447.24 and a coefficient of
determination of 82.9%. This implies that financial structure components are able to explain to
the extent of 82.9% of ROA with only 16.1% left to other variables not in the model or by
chance.
It is interesting to note that while all individual predictors are insignificant at 5% level of
significance, the overall model is significant and even the coefficient of determination is high.
There is nothing inconsistent between this relationships, it’s simply because the coefficient of
determination never decreases when you add variables to the model but multicollinearity
between predictors changes (Paul, 2006). Slight multicollinearity makes confidence intervals
to be much wider, leading to the acceptance of the null hypothesis more easily due to relatively
large standard error (Gujarati, 2003). Paul (2006) posit that although the t ratio of one or more
of the coefficients is more likely to be insignificant with multicollinearity, the coefficient of
determination for the model can still be relatively high, like exhibited in this analysis. This
possibility may have been due to -0.6 correlation between RE and E and 0.4 correlation between
E and SD which are close to 0.8 as a benchmark for concluding multicollinearity. The overall
model becomes
ROA= 6.64 -6.76SDit-6.61LDit -1.14REit-6.75Eit

Journal of Emerging Issues in Economics, Finance and Banking (JEIEFB)
An Online International Research Journal (ISSN: 2306-367X)
2016 Vol: 5 Issue: 1
1748
www.globalbizresearch.org
Table 4.2: FGLS Regression Results of ROA as Dependent Variable without
Moderator-Random Effects Model
ROA Coefficient. Std. Err. Z P>z
SD -6.760795 4.73033 -1.43 0.153
LD -6.613276 4.73231 -1.4 0.162
E -6.750107 4.73323 -1.43 0.154
RE -1.14242 4.73269 -0.24 0.809
_cons 6.645838 4.7299 1.41 0.16
Prob > Chi .0000 R2=82.9 Wald Chi 2(4)=2447.24
As shown in table 4.3, with regard to ROE, the coefficient of SD was 2.644 hence a positive
relationship with ROE. The p value was 0.709 which is greater than 5% level of significance.
This indicate that SD had a statistically insignificant positive relationship with ROE. The
coefficient of LD was 2.617 hence a positive relationship with ROE. The p value was 0.712
which is greater than 5% level of significance. This indicate that LD had a statistically
insignificant positive relationship with ROE.
This findings were consistent with MM (1953) capital structure irrelevance theory that the
amount of debt in the capital structure does not affect the performance and the value of the firm.
While the results agreed with Abor (2005) on SD and ROE, they contradict his findings on LD
since he concluded a negative relationship. The findings also differ with Mumtaz, Rauf, Bashir
and Noreen (2013) on the significance of the relationship since he found out that financial
performance of firms in Pakistan is significantly affected by their capital structure. In terms of
the nature of the relationship, this study complement Mumtaz et al. (2013) who also found a
negative relationship.
Similarly, the coefficients of E and RE were also positive at 7.932 and 2.452 respectively
showing a positive relationship with ROE too. The p values were 0.263 and 0.729 respectively
hence E and RE had insignificant positive relationship with ROE at 5% level of significance
also. The results contradict Abor (2007) who concluded a negative relationship between all
capital structure sources and ROE but agree with Ishaya and Abduljeleel (2014) who concluded
that a positive relationship between equity and profitability exists. Overall, the model is
significant and strong with a p value of 0.0000 of being greater than the Wald Chi-square of
799.65 and a coefficient of determination of 69.73%. This implies that financial structure
components are able to explain to the extent of 67.19% of ROE with only 32.81% left to other
variables not in the model or by chance. The overall model becomes
ROE= 2.648 +2.645SDit+2.617+LDit 2.45REit+7.932Eit

Journal of Emerging Issues in Economics, Finance and Banking (JEIEFB)
An Online International Research Journal (ISSN: 2306-367X)
2016 Vol: 5 Issue: 1
1749
www.globalbizresearch.org
Table 4.3: FGLS Regression Results of ROE as Dependent Variable without
Moderator-Random Effects Model
ROE Coef. Std. Err. Z P>z
SD 2.644535 7.087832 0.37 0.709
LD 2.616849 7.092413 0.37 0.712
E 7.931728 7.08775 1.12 0.263
RE 2.452277 7.089415 0.35 0.729
_cons -2.647566 7.0866 -0.37 0.709
Prob > Chi .0000 R2= 0.6719 Wald chi2(4)=799.65
4.3.2 Moderating Effect of GDP Growth Rate on the Relationship between Financial Structure and
Firm Performance of Firms Listed at the EASE
As shown in table 4.4, results on the relationship between financial structure and ROA while
GDP is incorporated in the model show that the coefficient of SDG was -0.303 hence SD had
a negative relationship with ROA as GDP growth increase. The p value was 0.029 which is less
than 5% level of significance. This indicate that the moderating effect of GDP growth rate on
SD was statistically significant on ROA’s contribution. The coefficient of LDG was -0.0059
hence a negative relationship with ROA as GDP growth rate increase. The p value was 0.762
which is greater than 5% level of significance. This indicate that moderating effect of GDP
growth rate on LD was statistically insignificant on ROA’s contribution.
Similarly, the coefficients of EG and REG were also negative at -0.698 and -0.37
respectively showing a negative relationship of E and RE with ROA too when GDP growth
increase. The p values were 0 for both hence the moderating effect of GDP growth rate on E
and RE was statistically significant on ROA’s contribution at 5% level of significance. The
overall moderating effect of GDP growth rate on explanatory variables towards ROA was 9.2%
since the proportion of variation of ROA due to the variation in the explanatory variables when
the moderator was incorporated was 92.1%, compared with 82.9% without the moderator.
It is worth noting that this coefficients of determination were determined using the
regression with panel corrected standard error (PCSE) approach, as an alternative to FGLS
(Beck & Katz, 1995). According to Beck & Katz (1995), like FGLS, PCSE is used when the
disturbances are assumed to be either heteroscedastic across panels or heteroscedastic and
contemporaneously correlated across panels. The disturbances may also be assumed to be auto
correlated within panel, and the autocorrelation parameter may be constant across panels or
different for each panel like in this study. While both approaches yield consistent and very close
estimators, FGLS estimators are more efficient. Indeed, the standard errors for the FGLS model
are 50%–100% smaller than those of PCSE model (Beck & Katz, 1995). This in essence implies
that the coefficient of determination determined by PCSE is smaller than but close to FGLS.
Journal of Emerging Issues in Economics, Finance and Banking (JEIEFB)
An Online International Research Journal (ISSN: 2306-367X)
2016 Vol: 5 Issue: 1
1750
www.globalbizresearch.org
Since FGLS does not provide the coefficient of determination, PCSE was therefore used as an
alternative to approximate the coefficients of determination.
Indeed, Akinlo and Egbetunde (2010) in examining the long run causal relationship between
financial development and economic growth for 10 countries in Sub Saharan Africa found that
financial development is co-integrated with economic growth and in particular a bidirectional
relationship between financial development and economic growth in Kenya existed, supporting
this findings. Visser et al. (2014), in analyzing the impact of macroeconomic circumstances and
social protection expenditure on economic deprivation in Europe found that indeed GDP
growth rate had an interaction effect with social protection on economic strain. This study too
found GDP growth rate to have an interaction effect with financial structure and hence
supported by Visser et al. (2014).
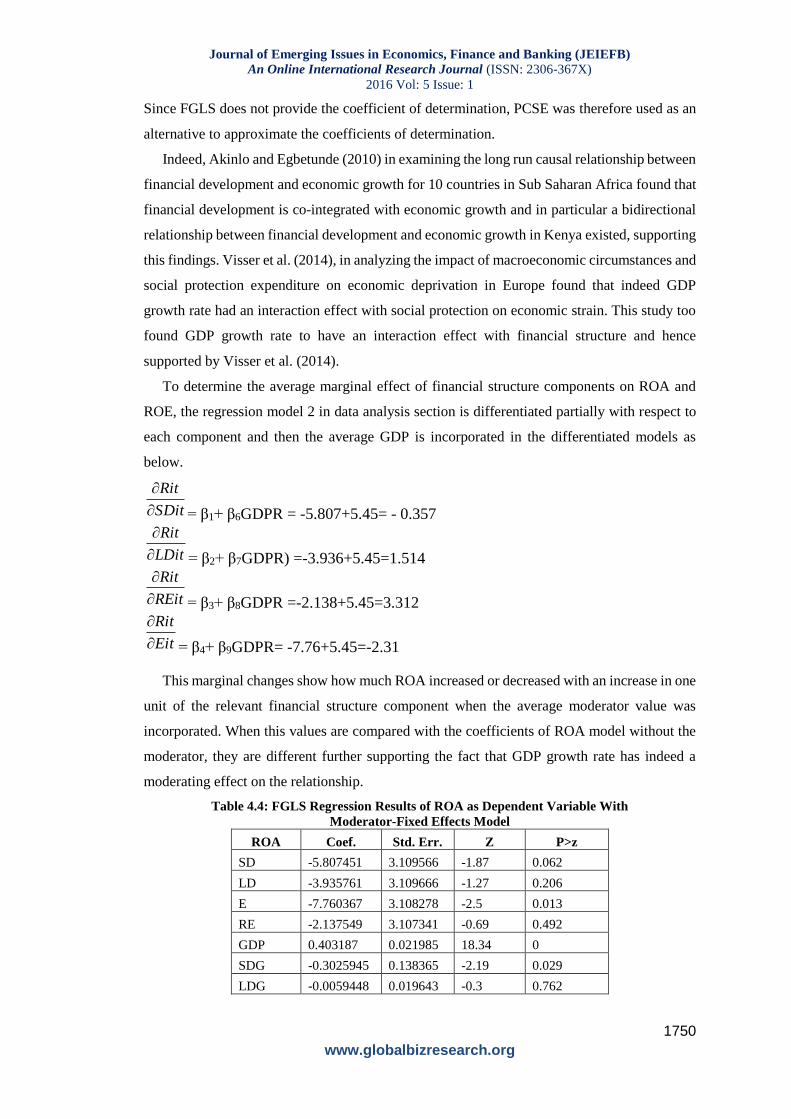
To determine the average marginal effect of financial structure components on ROA and
ROE, the regression model 2 in data analysis section is differentiated partially with respect to
each component and then the average GDP is incorporated in the differentiated models as
below.
SDit
Rit
= β1+ β6GDPR = -5.807+5.45= - 0.357
LDit
Rit
= β2+ β7GDPR) =-3.936+5.45=1.514
REit
Rit
= β3+ β8GDPR =-2.138+5.45=3.312
Eit
Rit
= β4+ β9GDPR= -7.76+5.45=-2.31
This marginal changes show how much ROA increased or decreased with an increase in one
unit of the relevant financial structure component when the average moderator value was
incorporated. When this values are compared with the coefficients of ROA model without the
moderator, they are different further supporting the fact that GDP growth rate has indeed a
moderating effect on the relationship.
Table 4.4: FGLS Regression Results of ROA as Dependent Variable With
Moderator-Fixed Effects Model
ROA Coef. Std. Err. Z P>z
SD -5.807451 3.109566 -1.87 0.062
LD -3.935761 3.109666 -1.27 0.206
E -7.760367 3.108278 -2.5 0.013
RE -2.137549 3.107341 -0.69 0.492
GDP 0.403187 0.021985 18.34 0
SDG -0.3025945 0.138365 -2.19 0.029
LDG -0.0059448 0.019643 -0.3 0.762

Journal of Emerging Issues in Economics, Finance and Banking (JEIEFB)
An Online International Research Journal (ISSN: 2306-367X)
2016 Vol: 5 Issue: 1
1751
www.globalbizresearch.org
EG -0.6984889 0.067313 -10.38 0
REG -0.3704068 0.04203 -8.81 0
_cons 5.577779 3.103793 1.8 0.072
Prob >Chi .0000 R2 = 0.921
Wald
chi2(9)=568
1.27
As shown in table 4.5, results on the relationship between financial structure and ROE while
GDP growth rate is incorporated in the model show that the coefficient of SDG was 0.305 hence
SD had a positive relationship with ROE as GDP growth rate increase. The p value was 0.028
which is less than 5% level of significance. This indicate that the moderating effect of GDP
growth rate on SD was statistically significant on ROE’s contribution. The coefficient of LDG
was 0.006 hence a positive relationship with ROE when GDP increase. The p value was 0.761
which is greater than 5% level of significance. This indicate that moderating effect of GDP
growth rate on LD was statistically insignificant on ROE’s contribution.
The coefficients of EG and REG were negative at -0.302 and -0.63 respectively showing a
negative relationship of E and RE with ROE too just like when there was no moderator. The p
values were 0 for both hence the moderating effect of GDP growth rate on E and RE was
statistically significant on ROE’s contribution at 5% level of significance. The overall
moderating effect of GDP growth rate on the financial structure towards ROE was 26.85%
since the proportion of variation of the ROE due to variation in the explanatory variables when
the moderator is incorporated was 94.04%, compared with 67.19% without the moderator.
Kanwal and Nadeem (2013) using the real GDP as independent variable found that it had an
insignificant impact on ROE and ROA, to suggest that it may have impact on the financial
structure in an insignificant manner as has been observed in this study.
To determine the average marginal effect of financial structure components on ROA and
ROE, the regression model 2 in data analysis section is differentiated partially with respect to
each component and then the average GDP is incorporated in the differentiated models as
below.
SDit
Rit
= β1+ β6GDPR = 5.77+5.45=10.22
LDit
Rit
= β2+ β7GDPR =3.9+5.45=9.35
REit
Rit
= β3+ β8GDPR =2.1+5.45=7.55
Eit
Rit
= β4+ β9GDPR= 7.72+5.45=13.17 This marginal changes show how much ROE increased with an increase in one unit of the
relevant financial structure component when the average moderator value was incorporated.

Journal of Emerging Issues in Economics, Finance and Banking (JEIEFB)
An Online International Research Journal (ISSN: 2306-367X)
2016 Vol: 5 Issue: 1
1752
www.globalbizresearch.org
When this values are compared with the coefficients of ROE model without the moderator, they
are different further supporting the fact that GDP growth rate has indeed a moderating effect
on the relationship.
Table 4.5: FGLS Regression Results of ROE as Dependent Variable with
Moderator-Fixed Effects Model
ROE Coef. Std. Err. Z P>z
SD 5.768252 3.110715 1.85 0.064
LD 3.898061 3.110653 1.25 0.21
E 7.721012 3.109442 2.48 0.013
RE 2.09508 3.108464 0.67 0.5
GDP 0.5967804 0.022006 27.12 0
SDG 0.3047437 0.138402 2.2 0.028
LDG 0.0059859 0.019663 0.3 0.761
EG -0.3018437 0.06734 -4.48 0
REG -0.6299905 0.04208 -14.97 0
_cons -5.537366 3.104953 -1.78 0.075
Prob>Chi .0000 R2=.9404 Wald chi2(9)=5855.78
5. Summary and Conclusion
Based on the findings of the study, it is worth concluding that financial structure indeed
affects the financial performance of firms listed at the EASE, though differently based on the
source. Overall, there exist a strong relationship between financial structure, ROA and ROE.
Both ROE and ROA models were significant at 5% level of significance. In addition, results on
the relationship between SD and ROA or ROE suggest that agency theory is applicable based
on the investors return on investment since while ROE model support the agency theory dictate,
ROA model does not. The huge proportion of asset financing through SD could imply that
short-term debt financing was less costly and therefore available compared to the long term
debt which is usually associated with high value collateral and at times restrictive covenants
making it unattractive. Generally on debt financing, it is prudent to conclude that firms should
borrow to finance their growth without fear of adverse effect on profitability since it is
insignificant.
On moderation of the relationship between financial structure and financial performance of
firms at the EASE, the study concluded that indeed GDP growth rate had significant moderating
effect. This is realistic since as expected, the GDP of a country dictates a lot on the behavior of
not only investors at the securities market but even elsewhere hence a change in GDP is bound
to affect the amounts available for consumption and savings for investment.
Journal of Emerging Issues in Economics, Finance and Banking (JEIEFB)
An Online International Research Journal (ISSN: 2306-367X)
2016 Vol: 5 Issue: 1
1753
www.globalbizresearch.org
6. Recommendations
This study established that in isolation, some financial structure sources contribute
insignificantly to financial performance but when combined with others, the contribution is
significant. It is therefore recommended that firms combine both debt and equity in their
financial structure. It is therefore incumbent on firms’ managers and financial advisors to
continuously study the market and advise on the appropriateness of the proportions of the
various sources of finance based on market circumstances at any given time. This way, their
decisions shall boost firm’s competitiveness and consequently financial performance.
To the EAC secretariat, it is recommended that it aggressively lobby to the EAC
membership for each to meet its mandate so as to ensure improved infrastructure to simplify
and rationalize cross border trading. It is upon it to increase sensitization and awareness on the
EAC protocols, address reported trade barriers towards securing a single securities exchange.
It should also work to strengthen the institutional and regulatory framework for dispute
resolution. This measures as recommended will foster the growth of the much anticipated single
EASE, boost its capital base to attract the much needed foreign capital. It is also recommended
that the EA governments grow and maintain their GDPs trends since GDP was found to have a
contingent effect on the financial structure.
7. Suggestions for Further Research
This study focused on non-financial firms listed at EASE. It is therefore the researcher’s
view that further research be done on non-listed firms and compare their results with those of
this study. It is also imperative to undertake similar studies on larger scope like Africa or
European Union or United States of America or Asia markets and compare their findings with
the current findings.
References
Abdeljawad, I., Mat-Nor, F., Ibrahim, I., & Abdul-Rahim, R. (2013). Dynamic Capital Structure Trade-
off Theory: Evidence from Malaysia. International Review of Business Research Papers, 9(6).
Abdul, G .K. (2012). The Relationship of Capital Structure Decisions with Firm Performance: A Study
of the Engineering Sector of Pakistan. International Journal of Accounting and Financial Reporting,
2(1), 2162-3082.
Abor, J. (2007). Debt policy and performance of SMEs. The Journal of Risk Finance, 8(4), 64- 379.
Abor, J. (2005). The effect of capital structure on profitability: empirical analysis of listed firms in Ghana.
Journal of Risk Finance, 6(5), 438-45.
Afza, T., & Nazir, M. S. (2007). Is it Better to be Aggressive or Conservative in Managing Working
Capital, Journal of Quality and Technology Management, 3(2), 11-21.
Akinlo, A. E., & Egbetunde, T. (2010). Financial development and economic growth: The experience of
10 Sub-saharan African Countries Revisited. The Review of Finance and Banking, 2(1), 17-28.
Anil, S., & Zenner, M. (2005). How to choose a capital structure: navigating the debt‐equity decision.
Journal of Applied Corporate Finance, 17(1), 26-35.

Journal of Emerging Issues in Economics, Finance and Banking (JEIEFB)
An Online International Research Journal (ISSN: 2306-367X)
2016 Vol: 5 Issue: 1
1754
www.globalbizresearch.org
Babatunde, Y., Akinwunmi, O., Khadijah, I., & Yusuf, S. (2014). Capital Structure and Profitability of
Quoted Firms: The Nigerian Perspective.
http://Proceedings.Iises.Net/Index.Php?Action=Proceedingsindexconference&Id=2&Page=1.
Baron, R. M., & Kenny, D. A. (1986). The moderator–mediator variable distinction in social
psychological research: Conceptual, strategic, and statistical considerations. Journal of personality and
social psychology, 51(6), 1173.
Beck, N., & Katz, J. N. (1995). What to do (and not to do) with time-series cross-section data. American
political science review, 89(03), 634-647.
Berger, A. N., & Patti, E. B. D. (2006). Capital structure and firm performance: A new approach to
testing agency theory and an application to the banking industry. Journal of Banking & Finance, 30(4),
1065-1102.
Brealey, R., Leland, H. E., & Pyle, D. H. (1977). Informational asymmetries, financial structure, and
financial intermediation. The journal of Finance, 32(2), 371-387.
Castro, P. C., Tascón, M. T., & Amor-Tapia, B. (2011). Dynamic analysis of capital structure in
technological firms based on the firms’life cycle stages.
Chiang, Y.H., Chan, P.C.A., & Hui, C.M.E., (2002). Capital structure and profitability of the property
and construction sectors in Hong Kong. Journal of Property Investment and Finance, 20(6), 434-454.
Chisti, K. A., Ali, K., & Sangmi, M. I. D. (2013). Impact of Capital Structure on Profitability of Listed
Companies (Evidence from India). The USV Annals of Economics and Public Administration, 13(1 (17)),
183-191.
Cooper, D.R., & Schindler, P.S. (2003). Business Research Methods, 6th, edition. McGraw-Hill
Publishing, Co. Ltd. New Delhi-India.
Cooper, D.R., & Schindler, P.S. (2006). Business Research Methods, 9th, edition. McGraw-Hill
Publishing, Co. Ltd. New Delhi-India.
Dare, F.D., & Sola, O. (2010). Capital Structure and Corporate Performance in Nigeria Petroleum
Industry: Panel Data Analysis. Journal of Mathematics and Statistics 6(2): 168-173.
Ebaid, E. I. (2009). The impact of capital-structure choice on firm performance: empirical evidence from
Egypt. The Journal of Risk Finance, 10(5), 477-487.
Erasmus, P. D. (2008). Evaluating Value Based Financial Performance Measures.
Frank, M. Z., & Goyal, V. K. (2007). Trade-off and pecking order theories of debt. Available at SSRN
670543.
Green, W. H. (2008). Econometric Analysis (6th ed.). New Persey: Pearson Prentice Hall.
Gujarati, D. (2003). Basic Econometrics (4th ed.). New York: McGraw Hill.
Ishaya, L. C., & Abduljeleel, B. O. (2014). Capital Structure and Profitability of Nigerian Quoted: The
Agency Cost Theory Perspective. American International Journal of Social Science, 3(1), 139-140.
Jensen, M. C. (1986). Agency cost of free cash flow, corporate finance, and takeovers. Corporate
Finance, and Takeovers. American Economic Review, 76(2).
Jensen, M., & Meckling, W. (1976): Theory of the firm: managerial behaviour, agency costs and
capital structure. Journal of Financial Economics, 3, 11- 25.
Kanwal, S., & Nadeem, M. (2013). The impact of macroeconomic variables on the profitability of listed
commercial banks in Pakistan. European Journal of Business and Social Sciences, 2 (9), 186-201.
Kaumbuthu, A.J. (2011). The relationship between capital structure and financial performance: a study
of firms listed under industrial and allied sector at the NSE, (MBA Dissertation, University of Nairobi,
2011). Retrieved from http://erepository.uonbi.ac.ke
Luigi, P., & Sorin, V. (2009). A review of capital structure theories. Annals of the University of Oradea,
Economic Science Series, 18(3), 315-320.

Journal of Emerging Issues in Economics, Finance and Banking (JEIEFB)
An Online International Research Journal (ISSN: 2306-367X)
2016 Vol: 5 Issue: 1
1755
www.globalbizresearch.org
Maina, L., & Kondongo, O. (2013). Capital Structure and Financial Performance in Kenya: Evidence
from Firms Listed at the Nairobi Securities Exchange. Paper Presented at the Jomo Kenyatta University
of Science and Technology Research Conference, Kenya.
Miller, E. M. (1977). Risk, uncertainty, and divergence of opinion. The Journal of Finance, 32(4), 1151-
1168.
Miller, E. M. (1988). Why a weekend effect. The Journal of Portfolio Management, 14(4), 43-48.
Modigliani, F., & Miller, M. H. (1958). The cost of capital, corporation finance and the theory of
investment. The American economic review, 261-297.
Modigliani, F., & Miller, M. H. (1963). Corporate income taxes and the cost of capital: a correction. The
American economic review, 433-443.
Moyer, R.C., McGiugan, J.R., & Kretlow, W.J. (1999). Contemporary Financial Management (5th ed).
West publishers, New York.
Mumtaz, R., Rauf, S. A., Bashir, A., & Noreen, U. (2013). Capital structure and financial performance:
Evidence from Pakistan (Kse 100 Index). Journal of Basic and Applied Scientific Research, 3(4), 113-
119.
Mwangi, L. W., Muathe, S. M. A., & Kosimbei, G. K. (2014). Relationship between Capital Structure
and Performance of Non-Financial Companies Listed In the Nairobi Securities Exchange, Kenya. Global
Journal of Contemporary Research in Accounting, Auditing and Business Ethics, 1(2), 76-77.
Mwangi, L. W., Makau, M. S., & Kosimbei, G. (2014). Effects of Working Capital Management on
Performance of Non-Financial Companies Listed in NSE, Kenya. European Journal of Business and
Management, 6(11), 195-205.
Myers, S. C., & Majluf N. S. (1984). Corporate financing and investment decisions when firms have
information that investors do not have. Journal of Financial Economics.13, 187-221.
Myers, S. C. (2001). Capital structure. Journal of Economic perspectives, 81-102.
Paul, R. K. (2006). Multicollinearity: Causes, Effects and Remedies. IASRI, New Delhi.
Rachdi, H. (2013).What determines the Profitability of banks during and before the International
Ross, S.A. (1977). The Determination of Financial Structure: the Incentive Signaling Approach. Bell
Journal of Economics, 8, 23-40.
Shubita, M. F., & Alsawalhah, J.F. (2012). The Relationship between Capital Structure and Profitability.
International Journal of Business and Social Science, 3(16).
Visser, M., Gesthuizen, M., & Scheepers, P. (2014). The Impact of Macro-Economic Circumstances and
Social Protection Expenditure on Economic Deprivation in 25 European Countries, 2007–2011. Social
indicators research, 115(3), 1179-1203.
Wooldridge, J. M. (2002). Econometric Analysis of Cross Section and Panel Data. Cambridge, MA:
MIT Press.
Zurigat, Z. (2009). Pecking order theory, trade-off theory and determinants of capital structure:
empirical evidence from Jordan (Doctoral dissertation, Heriot-Watt University).
Related Documents


