INTERNATIONAL JOURNAL OF CLIMATOLOGY, VOL. 15,625-638 (1995) 551.513.22:551.577.21: 557.589.1(73) RELATIONS BETWEEN WINTER PRECIPITATION AND ATMOSPHERIC CIRCULATION SIMULATED BY THE GEOPHYSICAL FLUID DYNAMICS LABORATORY GENERAL CIRCULATION MODEL GREGORY J. McCABE, Jr. US Geological Survey, Denver Federal Cenier, MS 412 Denver, Colorado 80225 USA AND MICHAEL D. DETTINGER US Geological Survey, 5735 Kearny Villa Road, Suite 0, San Diego, cOli/onia 92123, USA Received 6 August 1993 Accepied 12 July 1994 ABSTRACT General circulation model (GCM) simulations of atmospheric circulation are more reliable than GCM simulations of temperature and precipitation. Thus, some researchers are developing empirical relations between observed atmospheric circulation and observed temperature and precipitation to translate GCM estimates of future atmospheric circulation into estimates of future regional temperature and precipitation. Developing climate-change scenarios in this manner assumes, at least, that relationships between atmospheric circulation and surface climate variables, such as temperature and precipitation, are properly simulated by GCMs. In this study, temporal correlations between 700 hPa height anomalies (700 hPa anomalies) over North America simulated by the Geophysical Fluid Dynamics Laboratory (GFDL) GCM and GFDL-GCM-simulated (GFDL- simulated) winter precipitation at eight locations in the conterminous United States are compared with corresponding correlations in observations. The objectives are to (i) characterize the relations between atmospheric circulation and winter precipitation simulated by the GFDL GCM for selected locations in the conterminous USA, (ii) determine whether these relations are similar to those found in observations of the actual climate system, and (iii) determine if GFDL-simulated precipitation is forced by the same circulation patterns as in the real atmosphere. Results indicate that the GFDL GCM simulates relations between 700 hPa anomalies and local winter precipitation that are similar to relations found in observed data for most of the locations analysed in this study. Results also indicate that at regional scales GFDL GCM simulations of the relations between 700 hPa anomalies and winter precipitation are most similar to observed relations for locations near oceanic sources of atmospheric moisture. These results suggest that the GFDL GCM may not adequately simulate variations in advection of atmospheric moisture into the interior parts of the USA and/or that this moisture is not adequately converted into precipitation in the interior parts of the country. This problem may be due, in part, to (i) the inadequate representation of topography in the GFDL GCM, (ii) stronger-than-observed mean winter zonal winds simulated by the GFDL GCM and the consequent more west-to-east paths of air flow and storm systems across North America, (iii) the relative weakness of important synoptic patterns in GFDL simulations, such as the Pacific North American circulation pattern, and (iv) the occurrence of 'spectral rain'. In addition, for some locations, the GFDL-simulated relationships between precipitation and 700 hPa anomalies can be quite different from observed relations. The differing relationships suggest that GFDL-simulated changes in regional precipitation in response to changes in atmospheric circulation could differ from changes that would occur in the actual climate system. KEY WORDS: GFDL, GCM; US winter precipitation; 700 hPa circulation INTRODUCTION General circulation models (GCMs) are physically-based mathematical representations of the earth-climate system. Climate simulations from GCMs currently are used to study interactions between the surface of CCC 0899-8418/95/060625-14 This paper was produced under the auspices of the US Government and is therefore not subject to US copyright

Welcome message from author
This document is posted to help you gain knowledge. Please leave a comment to let me know what you think about it! Share it to your friends and learn new things together.
Transcript

INTERNATIONAL JOURNAL OF CLIMATOLOGY, VOL. 15,625-638 (1995) 551.513.22:551.577.21: 557.589.1(73)
RELATIONS BETWEEN WINTER PRECIPITATION AND ATMOSPHERIC CIRCULATION SIMULATED BY THE
GEOPHYSICAL FLUID DYNAMICS LABORATORY GENERAL CIRCULATION MODEL
GREGORY J. McCABE, Jr. US Geological Survey, Denver Federal Cenier, MS 412 Denver, Colorado 80225 USA
AND
MICHAEL D. DETTINGER US Geological Survey, 5735 Kearny Villa Road, Suite 0, San Diego, cOli/onia 92123, USA
Received 6 August 1993 Accepied 12 July 1994
ABSTRACT General circulation model (GCM) simulations of atmospheric circulation are more reliable than GCM simulations of temperature and precipitation. Thus, some researchers are developing empirical relations between observed atmospheric circulation and observed temperature and precipitation to translate GCM estimates of future atmospheric circulation into estimates of future regional temperature and precipitation. Developing climate-change scenarios in this manner assumes, at least, that relationships between atmospheric circulation and surface climate variables, such as temperature and precipitation, are properly simulated by GCMs.
In this study, temporal correlations between 700 hPa height anomalies (700 hPa anomalies) over North America simulated by the Geophysical Fluid Dynamics Laboratory (GFDL) GCM and GFDL-GCM-simulated (GFDL- simulated) winter precipitation at eight locations in the conterminous United States are compared with corresponding correlations in observations. The objectives are to (i) characterize the relations between atmospheric circulation and winter precipitation simulated by the GFDL GCM for selected locations in the conterminous USA, (ii) determine whether these relations are similar to those found in observations of the actual climate system, and (iii) determine if GFDL-simulated precipitation is forced by the same circulation patterns as in the real atmosphere.
Results indicate that the GFDL GCM simulates relations between 700 hPa anomalies and local winter precipitation that are similar to relations found in observed data for most of the locations analysed in this study. Results also indicate that at regional scales GFDL GCM simulations of the relations between 700 hPa anomalies and winter precipitation are most similar to observed relations for locations near oceanic sources of atmospheric moisture. These results suggest that the GFDL GCM may not adequately simulate variations in advection of atmospheric moisture into the interior parts of the USA and/or that this moisture is not adequately converted into precipitation in the interior parts of the country. This problem may be due, in part, to (i) the inadequate representation of topography in the GFDL GCM, (ii) stronger-than-observed mean winter zonal winds simulated by the GFDL GCM and the consequent more west-to-east paths of air flow and storm systems across North America, (iii) the relative weakness of important synoptic patterns in GFDL simulations, such as the Pacific North American circulation pattern, and (iv) the occurrence of 'spectral rain'.
In addition, for some locations, the GFDL-simulated relationships between precipitation and 700 hPa anomalies can be quite different from observed relations. The differing relationships suggest that GFDL-simulated changes in regional precipitation in response to changes in atmospheric circulation could differ from changes that would occur in the actual climate system.
KEY WORDS: GFDL, GCM; US winter precipitation; 700 hPa circulation
INTRODUCTION General circulation models (GCMs) are physically-based mathematical representations of the earth-climate system. Climate simulations from GCMs currently are used to study interactions between the surface of
CCC 0899-8418/95/060625-14 This paper was produced under the auspices of the US Government and is therefore not subject to US copyright

626 G. J. McCABE, JR., AND M. D. DETTINGER
the Earth and the atmosphere, as well as to investigate past climates and the potential for future climate change (Baron and Washington, 1984; Schlesinger, 1988; Rind et al., 1990). Although GCMs differ in their levels of physical detail and mathematical complexity, they are able to reproduce the general spatial and temporal distributions of most climate variables on a global scale. At regional scales (104-106 km’, however, estimates of climate variables can vary markedly among GCMs. Differences among GCM horizontal and vertical resolutions of the atmosphere, and modelled ocean-atmosphere interactions, are, in part, responsible for the regional-scale differences between GCM simulations (Legates, 1990).
There have been numerous studies of the effects of potential climate change on water resources (Nemec and Schaake, 1982; Mather and Feddema, 1986; Gleich, 1987; Lettenmaier et al. 1988; McCabe and Ayers, 1989; Schaake, 1990). To estimate the hydrological effects of climate change, estimates of future temperature and precipitation are needed. In general, GCMs agree as to the direction of change in temperature for many regions of the world; however, GCMs do not agree as to the magnitude or direction of changes in precipitation. Thus, GCM estimates of future precipitation are considered more uncertain than estimates of future temperature. Legates and McCabe (1992) found large errors in GCM simulations of regional precipitation for current climatic conditions. These errors were found to be much larger than GFDL-simulated changes in precipitation from current climatic conditions to climatic conditions resulting from a doubling of atmospheric concentrations of carbon dioxide (CO,). Other evaluations of GCM simulations also indicate large errors in GCM simulations of precipitation (McCabe and Ayers, 1989; Legates, 1990; Kalkstein, 1991).
Results of recent research suggest that GCM simulations of atmospheric circulation are more reliable than GCM simulations of regional temperature or precipitation (Hay et al., 1992; Hewitson and Crane, 1992; McCabe and Legates, 1992). Hewitson and Crane (1992) showed that the Goddard Institute for Space Studies (GISS) GCM effectively simulates the synoptic-scale circulation over North America. Hewitson and Crane found that temporal and spatial distributions of sea-level pressures in the GISS GCM simulations were statistically similar to observed distributions of sea-level pressures. Similarly, McCabe and Legates (1992) found that the GFDL GCM, as well as the GISS GCM, simulate temporal and spatial sea-level pressure variability over North America that is similar to that found in observed sea-level pressures. These studies show that GCMs reliably simulate important components of atmospheric circulation and synoptic-scale circulation patterns.
Global atmospheric circulation can be described by negative and positive anomalies of atmospheric pressure that have dimensions of several hundreds to thousands of kilometres (Madden, 1979; Cayan and Peterson, 1989) and which correlate with surface weather phenomena (Namias, 1975; Namias, 1981; Wallace and Gutzler, 1981; Blackmon et al., 1984; Knox and Lawford, 1990). Variations in atmospheric circulation patterns have been found to be related to both temporal and spatial variations in surface temperature and precipitation (Muller and Wax, 1977; Knox, 1984; Knox and Lawford, 1990). For example, systematic deviations in atmospheric circulation over the eastern North Pacific Ocean and the western USA influence precipitation anomalies over the western USA (Cayan and Peterson, 1989). Some researchers have found that a statistically significant part of seasonal precipitation variability can be explained by time-averaged atmospheric circulation anomalies (Klein, 1963; Walsh et al., 1982; Weare and Hoeschele, 1983; Cayan and Roads, 1984; Klein and Bloom, 1987), and that relationships between atmospheric circulation and precipitation are useful for the long-range prediction of precipitation (Walsh et al., 1982).
Because GCM simulations of atmospheric circulation are more reliable than GCM simulations of temperature and precipitation, some researchers are developing empirical relationships between observed temperature and precipitation and observed atmospheric circulation to translate GCM estimates of future atmospheric circulation into estimates of future temperature and precipitation (Yarnal and Leathers, 1988; Dettinger and Cayan, 1992; Hay et al., 1992; Zorita et al., 1992). Such empirical relations may provide a scale-appropriate link between spatially coarse GCM simulations (100s of kilometres) and needed local- and regional-scale estimates of temperature and precipitation for studies of the environmental effects of climate change. Empirical relationships between surface climate and atmospheric circulation may provide a realistic mechanism for describing the regional effects of climate change. Evaluations of these empirical

OBSERVED AND GFDL-GCM CORRELATIONS OF CIRCULATION AND PRECIPITATION 627
relations are instrumental in determining the reliability of GCM-simulated surface climate variables for current and future climatic conditions. If GCM-simulated relationships between atmospheric circulation and surface climate variables for current climatic conditions are not realistic (i.e. similar to observed relations), then important atmospheric circulation/surface climate processes are not being simulated reliably by GCMs, and GCM estimates of future climatic conditions are certainly unreliable.
Developing climate change scenarios in this manner assumes (i) that relationships between atmospheric circulation and surface climate variables, such as temperature and precipitation, are properly simulated by GCMs, (ii) that these relations will not change appreciably in a climate-changed world, and (iii) that changes in surface climate in a climate-changed world primarily will be the result of changes in atmospheric circulation rather than in 'baseline' mean conditions. Although there have been comparisons between observed and GCM-simulated temperature and precipitation values for many regions of the world (Grotch and MacCracken, 1990; Legates, 1990; Kalkstein, 1991 ; Legates and McCabe, 1992), and evaluations of GCM-simulated atmospheric circulation (Hay et al., 1992; Hewitson and Crane, 1992; McCabe and Legates, 1992), few evaluations have been performed of the relationships between atmospheric circulation and surface-climate variables in GCM simulations. Thus, the first assumption above has not been tested. Only when GCM-simulated relationships between atmospheric circulation and surface climate are understood and deemed reliable can the second and third assumptions be examined and justified. Thus, tests of the first assumption will provide useful information for determining the validity of the second and third assumptions.
In this study, a test, albeit preliminary in scope, of the first assumption is performed. Relationships between winter precipitation and atmospheric circulation over North America simulated by the GFDL GCM are examined. The objectives are to (i) characterize the relationships between atmospheric circulation and winter precipitation simulated by the GFDL GCM for selected locations in the conterminous USA, (ii) determine whether these relationships are similar to those found in observations of the actual climate system, and (iii) determine if GFDL-simulated precipitation is forced by the same atmospheric circulation patterns as is observed precipitation.
METHODS
Sources of data
The GFDL GCM is spectrally based and has a horizontal grid spacing of approximately 2-25" of latitude by 3.75' of longitude (R30 version, Manabe and Broccoli, 1990). The model includes nine unevenly spaced vertical atmospheric levels of normalized pressure and prescribed, although seasonally variable, sea-surface temperatures and sea-ice distributions (based on observed climatological means). The orbital geometry of the Earth is specified to provide realistic temporal and spatial distributions of seasonal insolation, but diurnal cycles of insolation are not included. The effects of clouds, water vapour, carbon dioxide, and ozone are included in the calculation of shortwave and longwave radiation. The mixing ratios of carbon dioxide and ozone are prescribed based on observations, and clouds and water-vapour mixing ratios are simulated. Precipitation forms at a given location when the atmosphere becomes saturated with respect to water vapour. In addition, convective precipitation is produced when the temperature lapse rate in the atmosphere exceeds the moist-adiabatic lapse rate (CPD Milly, US Geological Survey, Geophysical Fluid Dynamics Laboratory, Princeton, New Jersey, pers. com., 1993).
The GFDL GCM simulation analysed in this study was run for 12 simulated years. The model atmosphere was initiated in an isothermal state at rest, and was allowed to 'spin up' to realistic atmospheric circulation and climate over the course of two simulated years. Data from those 2 years were discarded and conditions during the remaining 10 years were used in this evaluation.
Monthly totals of precipitation and monthly mean 700 hPa heights for the months of December, January, and February from the 10-year GFDL-GCM simulation are analysed in this study. The 700 hPa anomalies for each month were calculated by subtracting the respective 10-year monthly mean from each monthly

628 G. J. McCABE, JR., AND M. D. DETTINGER
30'
-aoo
Figure 1. Study locations.
mean 700 hPa height. Atmospheric circulation affecting the conterminous USA is characterized in terms of 700 hPa anomalies for the area from 20" north latitude to 60" north latitude, and from 50" west longitude to 150" west longitude. This area includes 486 GFDL GCM grid points. Relationships between monthly mean 700 hPa anomalies and winter precipitation at eight locations in the conterminous USA are examined (Figure 1). These eight locations correspond with GFDL GCM grid points and represent a wide range of climatic settings.
Atmospheric circulation at the 700 hPa level was chosen for this study because (i) it provides a good representation of lower tropospheric atmospheric circulation, (ii) it is above the land surface in most of the conterminous USA, and (iii) it is related to precipitation (Stidd,1954; Klein, 1963; Klein and Bloom, 1987; Knox and Lawford, 1990). An analysis of winter data is performed because (i) the strongest observed relations between large-scale atmospheric circulation and precipitation occur during the winter season, and (ii) precipitation exhibits the broadest spatial coherence during winter (Walsh et al., 1982; Klein and Bloom, 1987).
Observed relationships between atmospheric circulation and regional precipitation were identified using historical monthly precipitation and monthly mean 700 hPa anomalies for the months of December, January, and February during the winters 1947-48 through to 1986-1987 (40 winters). The 700 hPa anomalies were computed from gridded 700 hPa heights provided by the Climate Analysis Center (CAC, Camp Springs, Maryland). The anomalies were constructed by subtracting the 1950-1979 long-term mean 700 hPa height fields for each day from the observed daily 700 hPa height fields for the period of January 1947 through to June 1988 (the 700 hPa height anomaly data were obtained from Daniel Cayan, Scripps Institute of Oceanography, La Jolla, California). Monthly means of observed 700 hPa anomalies were derived by time averaging the daily anomalies for each month of the 40-year record. The 95 grid points in the CAC data set that match the area analysed in the GFDL simulation (20" north latitude to 60" north latitude and from 50" west longitude to 150" west longitude) are used in the study.
Observed precipitation records for the eight locations were obtained from climate division data. December, January, and February precipitation totals from the climate divisions in which each of the eight grid points is located were used (National Climatic Data Center, Asheville, North Carolina). Before performing the analyses, the observed and GFDL-simulated precipitation data were standardized to z-scores with a mean of zero and a variance of unity to remove monthly biases in the precipitation data.
Methoh of analysis
Relationships between 700 hPa anomalies and precipitation were determined following a method introduced by Stidd (1954), and later by Klein (1963). Stidd (1954) and Klein (1963) described

OBSERVED AND GFDL-GCM CORRELATIONS OF CIRCULATION AND PRECIPITATION 629
relationships between atmospheric circulation and precipitation by examining linear temporal correlations between precipitation at specific locations and gridded values of 700 hPa anomalies. Lines of equal correlation between precipitation at a specific location and 700 hPa anomalies typically reflect (i.e. parallel) lines of equal 700 hPa anomalies associated with extreme precipitation (Stidd, 1954; Klein, 1963). Evaluation of relationships between atmospheric circulation and precipitation using correlation fields is advantageous because it uses all of the available data and accounts for spatial variations in the standard deviations of atmospheric pressure.
Using observed and GFDL-simulated 700 hPa anomalies and precipitation, observed and GFDL-simulated correlations were computed between monthly precipitation at each of the eight specific locations and gridded monthly mean 700 hPa anomalies. Subsequently, the correlation fields for the GCM-simulations and observations were compared qualitatively and quantitatively to determine how similar the GFDL-simulated correlations are to observed correlations. If the correlations are similar, then GFDL-simulated precipitation is most likely forced by realistically simulated atmospheric circulation conditions, and simulated changes in atmospheric circulation would presumably yield realistic changes in simulated precipitation. If the observed and GFDL-simulated relationships are not similar, this may imply that some atmospheric circulation/precipitation processes are not well simulated by the GFDL GCM (either locally or at large scales), or are out of realistic proportion to other processes. In this instance, a change in simulated atmospheric circulation could yield simulated precipitation responses quite different from those in the actual climate system.
To estimate the signal-to-noise ratios of the relationships between 700 hPa anomalies and precipitation, lines of equal correlation that are statistically significant (between a 95 per cent and 99 per cent confidence level) were highlighted on the maps of correlations. For the GFDL-simulated correlation fields, correlations of 0.4 and -0.4 are highlighted, and for the observed correlation fields, correlations of 0.2 and -0.2 are highlighted.
Quantitative comparisons of the correlation maps were made using spatial correlations between the observed and GFDL-simulated correlation fields for each of the eight specific locations. To facilitate such comparisons, the observed and GFDL-simulated correlations were interpolated to a common grid system using an algorithm based in spherical coordinates (Willmott et al., 1985). The common grid is a 10" by 10" grid of 40 points that includes the area from 25" north latitude to 55" north latitude and from 55" west longitude to 145" west longitude. This grid is used because it is more coarse than the grids for either the observed or GFDL GCM data. By using this coarse grid, each interpolated value was based on several data points. Also, by using a more coarse grid, the interpolated values primarily portray the largest scale correlation features.
RESULTS AND DISCUSSION
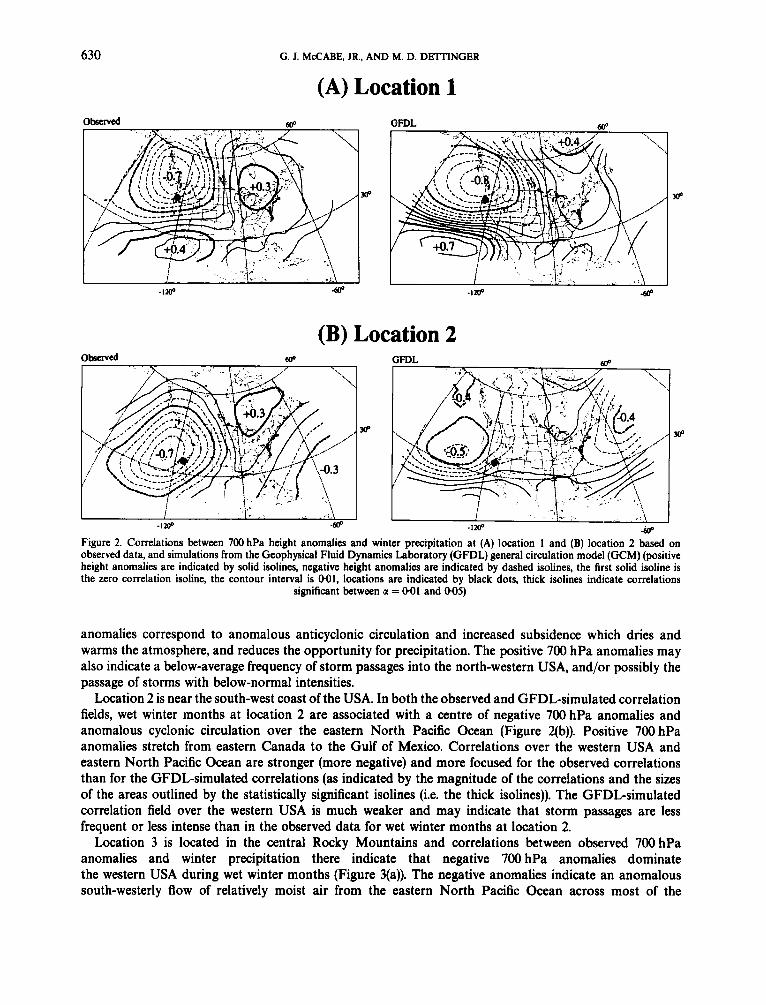
The spatial distribution of correlations between GFDL-simulated 700 hPa anomalies and precipitation are similar to observed distributions for several of the locations examined in this study; however, there are large differences for some areas. For location 1, along the northwest coast of the USA, GFDL-simulated correlations are similar to observed correlations (Figure 2(a)). For wet winter months, both the observed and GFDL-simulated correlation fields indicate an area of negative correlations off the north-west coast of the USA, with positive correlations to the south and east of location 1. The negative correlations correspond to negative 700 hPa anomalies and anomalous cyclonic circulation over that area. This anomalous cyclonic circulation enhances movement of moist air from the eastern North Pacific Ocean into the north-western USA. The negative 700 hPa anomalies also may reflect an above-average frequency of storm passages into the north-western USA, and/or the passage of storms with above-average intensities. The negative 700 hPa anomalies indicate regional suppression of atmospheric subsidence, which facilitates local uplift and formation of precipitation. The thick isolines indicate that large areas of the observed and GFDL-simulated 700 hPa anomalies are significantly correlated with winter precipitation at location 1.
During dry winter months at location 1, the 700 hPa anomalies will be roughly proportional to the negative of the correlation fields shown in Figure 2(a). At location 1, positive 700 hPa anomalies over the north-western USA are present in both the observed and GFDL-simulated fields. The positive 700 hPa
630 G. J. McCABE, JR., AND M. D. DETTINGER
(A) Location 1 GFDL mo w
(B) Location 2
-1200 -a00
Figure 2. Correlations between 700 hPa height anomalies and winter precipitation at (A) location 1 and (B) location 2 based on observed data, and simulations from the Geophysical Fluid Dynamics Laboratory (GFDL) general circulation model (GCM) (positive height anomalies are indicated by solid isolines, negative height anomalies are indicated by dashed isolines, the first solid isoline is the zero correlation isoline, the contour interval is 001, locations are indicated by black dots, thick isolines indicate correlations
significant between a = 001 and 0.05)
anomalies correspond to anomalous anticyclonic circulation and increased subsidence which dries and warms the atmosphere, and reduces the opportunity for precipitation. The positive 700 hPa anomalies may also indicate a below-average frequency of storm passages into the north-western USA, and/or possibly the passage of storms with below-normal intensities.
Location 2 is near the south-west coast of the USA. In both the observed and GFDL-simulated correlation fields, wet winter months at location 2 are associated with a centre of negative 700 hPa anomalies and anomalous cyclonic circulation over the eastern North Pacific Ocean (Figure 2(b)). Positive 700 hPa anomalies stretch from eastern Canada to the Gulf of Mexico. Correlations over the western USA and eastern North Pacific Ocean are stronger (more negative) and more focused for the observed correlations than for the GFDL-simulated correlations (as indicated by the magnitude of the correlations and the sizes of the areas outlined by the statistically significant isolines (i.e. the thick isolines)). The GFDL-simulated correlation field over the western USA is much weaker and may indicate that storm passages are less frequent or less intense than in the observed data for wet winter months at location 2.
Location 3 is located in the central Rocky Mountains and correlations between observed 700 hPa anomalies and winter precipitation there indicate that negative 700 hPa anomalies dominate the western USA during wet winter months (Figure 3(a)). The negative anomalies indicate an anomalous south-westerly flow of relatively moist air from the eastern North Pacific Ocean across most of the

OBSERVED AND GFDL-GCM CORRELATIONS OF CIRCULATION AND PRECIPITATION
(A) Location 3 observed 600
63 1
I -1200 -a00
GFDL
I / . '1. ,. ,. ,.;.\.
-1200 -a00
(B) Location 4 GFDL
w
Figure 3. Same as for figure 2, but for locations 3 and 4.
south-western USA. In general, the configuration of 700 hPa anomalies associated with GFDL-simulated wet winter months at location 3 are similar to observed. However, the GFDL correlation field indicates an anomalous westerly flow from the eastern North Pacific Ocean during wet winter months at location 3, whereas the observed correlation field indicates an anomalous south-westerly flow from the subtropical North Pacific Ocean. In addition, the observed correlations over the north-eastern North Pacific Ocean are positive, and negative in the south-eastem North Pacific Ocean. The opposite is found in the GFDL-simulated correlations.
Note that the GFDL-simulated correlation field for location 3 (Figure 3(a)) is very similar to both the observed and GFDL-simulated correlation patterns for location 1 (Figure 2(a)). In fact, the spatial correlation between the GFDL-simulated correlation fields for locations 1 and 3 is 0.97. Because GFDL-simulated monthly precipitation at locations 1 and 3 are similarly correlated to 700 hPa anomalies, GFDL-simulated precipitation in the central Rocky Mountains also is more strongly correlated with GFDL-simulated precipitation in the north-western USA (r = 0-64), than is found in the observed data (r = 0.16). One implication of these anomalous correlations for climate-change simulations is that atmospheric circulation changes would tend to cause similar precipitation responses at locations 1 and 3, whereas if the same atmospheric-circulation changes were encountered in the real world, the precipitation responses at locations 1 and 3 would most likely be dissimilar. Thus, if a projected climate change strengthened either the climatological high pressures in the subtropics of the North Pacific Ocean or winter low pressures over the north-eastern North Pacific Ocean, the GFDL GCM would tend to simulate more winter precipitation at both locations 1 and 3. The actual precipitation responses might be increased precipitation at location 1 and decreased precipitation at location 3.

632 G. J. McCABE, JR., AND M. D. DETTINGER
For location 4, in the north-central USA, the observed correlation field suggests that, in wet winter months, negative 700 hPa anomalies occur over the western USA with positive anomalies over the eastern USA (Figure 3(b)). These anomalies indicate an anomalous southerly flow of air from the south-eastern North Pacific Ocean and the Gulf of Mexico into the central USA during wet winter months at location 4. This pattern is similar to the 700 hPa anomaly pattern during wet springs in south-central Canada (Knox and Lawford, 1990). However, the correlations are small and only marginally significant, probably indicating that several different atmospheric patterns cause or inhibit precipitation at this location. An analysis of composites of 700 hPa anomaly maps for the 20 wettest and 20 driest winter months at location 4 explains the weak correlation. This analysis yielded an average 700 hPa anomaly pattern for the wettest winter months that looks very similar to the observed correlation map in Figure 3(b) (spatial correlation equal to 0.89), whereas the average map for the driest winter months, which should be the negative of the observed correlation field in Figure 3(b), is only modestly negatively correlated (r = - 0.30). Additionally, the dry-winter composite indicates a large area of positive 700 hPa anomalies over the central USA, which is not seen in the observed correlation field. Another factor that contributes, in part, to the low observed correlations at location 4 is that location 4 generally experiences dry winters. Thus, one or two storms during a month can cause the monthly total precipitation to be above average. However, these same storms may not be discernible in the monthly mean 700 hPa anomalies (Englehart and Douglas, 1985).
The GFDL-simulated correlations for location 4 are not similar to the observed correlations (Figure 3(b)). In the GFDL simulation, wet winter months at location 4 are associated with negative 700 hPa anomalies over the Great Lakes and eastern Canada, and positive 700 hPa anomalies over the south-western USA. This configuration of anomalies implies an anomalous north-westerly flow of air over the north-central USA. Thus, the GFDL simulated correlations for location 4 are somewhat spatially opposite to those found in the observed data (r = - 0.26). One possible explanation for the large difference between the GFDL-simulated and observed correlation fields is the inadequate representation of topography in the GFDL GCM, which only provides a single broad mountain peak in the western USA centred in Utah. This smoothed topography may limit or distort the GFDL GCM’s ability to simulate orographic ’rainout’ of storm systems approaching from the west and cyclogenesis on the lee side of the Rocky Mountains (Carlson, 1991).
Another factor that may contribute to the large difference between the GFDL-simulated and observed correlation fields for location 4 is the occurrence of what modellers call ‘spectral rain’. The GFDL GCM is a spectral model in which the basic atmospheric variables are represented as a finite number of spherical harmonics. This representation has numerical advantages that have made its use quite widespread in global atmospheric models. For simulating certain processes in these models, however, it is required that some variables be transformed to and from a finite-difference grid. For example, the parameterizations for condensation and convection, require that moisture fields be projected on to a grid, so that the moisture processes can be simulated; subsequently the resulting moisture fields are transformed back into spherical harmonics. Because of the sharp gradients of moisture that can occur in the atmosphere (e.g. near the coast of a mid-latitude continent in winter) and the non-linearity of the relationship between temperature and the saturation mixing ratio, the relative smoothness of moisture fields as represented by spherical harmonics can result in spurious condensation, particularly in regions of low temperature and hence low saturation mixing ratio (A. J. Broccoli, GFDL, Princeton, New Jersey, pers. comm., 1993). The relationships between 700 hPa anomalies and precipitation at location 4 indicate an anomalous north-westerly flow of air during wet months at location 4, which suggests the intrusion of cold (and presumably dry) air from Canada. Thus, it is possible that some of the precipitation occurring in the wettest winter months at location 4 may be ’spectral rain’ and may not be related to processes occurring in the real atmosphere.
Correlations between observed 700 hPa anomalies and winter precipitation in the south-central USA (location 5 ) indicate that wet winter months are associated with an anomalous south-easterly flow of moist air from the Gulf of Mexico as a result of negative 700 hPa anomalies centred in the eastern North Pacific Ocean off the west coast of Mexico, and positive anomalies centred over the Great Lakes region (Figure qa)). In the GFDL simulation, the centre of the negative anomalies is in a location similar to that in the observed data; however, the positive correlations are centred in the south-western North Atlantic Ocean

OBSERVED AND GFDL-GCM CORRELATIONS OF CIRCULATION AND PRECIPITATION 633
(A) Location 5 600 GFDL 600
-1200 mo -1200 mo
(B) Location 6 observed 600 GFDL 600
w
-1200 -600 -1wO
Figure 4. Same as for figure 2, but for locations 5 and 6.
w
w
(Figure 4(a)). The GFDL-simulated wet winter months at location 5 are thus associated with anomalous southerly or south-westerly flows of air over the south-central USA. In the GFDL simulation, the contribution of moist air from the Gulf of Mexico to precipitation at location 5 does not seem as strong as in the observations. GFDL-simulated precipitation at location 5 also appears to be more closely tied to this atmospheric circulation than is observed precipitation to the observed pattern, as is indicated by the stronger-than-observed correlations. GFDL-simulated precipitation is particularly sensitive to atmospheric circulation over the eastern North Pacific Ocean and the western North Atlantic Ocean. Thus, GFDL-simulated precipitation at location 5 is more likely to reflect changes in atmospheric circulation over the south-western North Atlantic Ocean, the eastern North Pacific Ocean, and the Gulf of Alaska than is observed precipitation.
Observed correlations between 700 hPa anomalies and precipitation in the east-central USA (location 6) indicate that, for wet winter months, negative 700 hPa anomalies occur over the western USA and positive anomalies occur over the western North Atlantic Ocean (Figure qb)). This configuration of anomalies produces anomalous southerly or south-westerly flows of moist air from the Gulf of Mexico over a large part of the eastern USA. In the GFDL GCM, anomalous southerly or south-easterly flows of air from the Gulf of Mexico are associated with wet winter months; however, the anomalous southerly air flow is mostly due to negative anomalies centred over the south-central USA (Figure qb)). The 700 hPa anomaly pattern associated with observed precipitation at location 6 (Figure qb)) is similar to that at location 4 (Figure 3(b)). In addition, precipitation at these two locations is significantly correlated (r = 0-27,

634 G. J. McCABE, JR., AND M. D. DETTINGER
significant at a = 0.01). In contrast, the GFDL-simulated correlations for these two locations are not similar, and GFDL-simulated precipitation at these two locations is not significantly correlated (r = 0.08). Thus, a change in atmospheric circulation in the real atmosphere may induce similar precipitation changes at locations 4 and 6, whereas the same atmospheric circulation changes in the GFDL GCM might induce independent precipitation responses at locations 4 and 6.
In the north-eastern USA (location 7), observed above-average precipitation is associated with negative 700 hPa anomalies over the central USA and positive 700 hPa anomalies over the western North Atlantic Ocean and eastern North Pacific Ocean (Figure 5(a)). The negative anomalies appear to reflect enhancement of the continental trough, along the eastern edge of which cyclogenesis and precipitation are usually facilitated (Carlson, 1991). Air flow is anomalously southerly or south-westerly, bringing warm and moist air from the Gulf of Mexico into the north-eastern USA (Figure 5(a)). The GFDL-simulated relationships between 700 hPa anomalies and precipitation at location 7 indicate an association between precipitation and anomalous southerly flows of air from the Gulf of Mexico into the north-eastern USA, but for different reasons than those indicated by the observed data. However, as at location 6 (Figure qb)), for wet winter months negative anomalies occur over most of the conterminous USA and into the eastern North Pacific Ocean. In general, observed relationships between 700 hPa anomalies and precipitation at location 7 are weak. The GFDL-simulated precipitation, however, is strongly and unrealistically correlated with 700 hPa anomalies in the subtropics off the west coast of Mexico.
Observed correlations for location 8 (in the south-eastem USA) indicate that wet winter months are accompanied by anomalous south-westerly flows of air produced by negative anomalies centred over the
(A) Location 7 GFDL
-1200 -600
(B) Location 8 observed GFDL a00
-1200 -600 -1200 -600
Figure 5. Same as for figure 2, but for locations 7 and 8.
w

OBSERVED AND GFDL-GCM CORRELATIONS OF CIRCULATION AND PRECIPITATION 635
south-central USA and eastern Mexico (Figure 5(b)). The GFDL-simulated correlations suggest the importance of a centre of negative anomalies over the central USA with positive anomalies in the North Atlantic Ocean. The configuration of these anomalies produces an anomalous south-westerly flow of air over the south-eastern USA that brings in warm and moist air from the Gulf of Mexico. Over most of North America, the patterns of observed and GFDL-simulated correlations between 700 hPa anomalies and pre- cipitation at location 8 are similar. However, GFDL-simulated correlations over the north-eastem North Pacific Ocean are opposite to observed correlations. Thus, GFDL-simulated and observed precipitation at location 8 could respond differently to changes in atmospheric circulation over the Gulf of Alaska.
In general, the areas of negative correlations examined in this study have been interpreted as areas of anomalous cyclonic circulation. These areas also can be interpreted, in part, as time-averaged storm paths. With the exceptions of location 8 and possibly location 1, the GFDL-simulated ‘storm paths’ are more zonal in orientation and extent than are the ‘storm paths’in the observed correlation fields. An evaluation of observed and GFDL-simulated mean winter 700 hPa heights over North America shows that the GFDL GCM simulates a stronger mean winter meridional gradient over North America than is observed. This strong gradient implies a mean zonal atmospheric flow that is 50 to 100 per cent greater than observed. Thus, the mean simulated winds in the GFDL GCM may overemphasize the zonal transport of low-pressure systems and moisture, and underemphasize meridional excursions and associated cyclone development.
Examination of the observed correlation fields indicates that precipitation at locations 3,4, and 6 appear to be related to the Pacific North American (PNA) pattern (Leathers et al., 1991). The influence of the PNA pattern is not evident in the GFDL-simulated correlation fields for these locations. This suggests that the GFDL GCM may not adequately simulate the magnitude of the PNA pattern, and/or realistic relationships between the PNA pattern and precipitation in the conterminous USA. A rotated principal-component analysis of observed and GFDL-simulated 700 hPa anomalies shows that the PNA pattern is frequent in the observations (41 per cent of the monthly variance in 700 hPa anomalies), but is much less prevalent in the GFDL simulations (only about 16 per cent of the monthly variance in 700 hPa anomalies). Thus, precipitation in regions such as locations 3, 4, and 6, which is strongly associated with the PNA pattern in the real world, must be derived from other modes of atmospheric circulation in the GFDL simulations. Thus, the effects of a change in the PNA pattern on precipitation will most likely be de-emphasized in GFDL-simulations, whereas the effects of changes in other circulation patterns on precipitation may be overemphasized.
For four of the eight locations (i.e. locations 1,2, 5, and 8), the GFDL GCM simulates relationships that are qualitatively similar to observed relationships. In addition, for above-average winter precipitation for all locations, except location 4, the GFDL GCM simulates local anomalous air flow directions similar to those found in the observed data, suggesting at least locally similar sources of atmospheric moisture for winter precipitation (Table I). Spatial correlations between GFDL-simulated and observed correlation fields
Table I. Observed and Geophysical Fluid Dynamics Laboratory general circulation model-simulated (GFDL-simulated) anomalous air flow directions associated with above-average winter precipitation as indicated by 700 hPa height anomalies (anomalous air flow directions (given as compass directions))
Location Observed GFDL-simulated
Westerly South-wester1 y South-westerly
Southerly Southeasterly South-westerly South-westerly South-westerly
Westerly South-westerly
Westerly North-westerly
Sout her1 y South-easterly
Southerly South-westerly

636 G. J. McCABE, JR., AND M. D. DETTINGER
Table 11. Correlations between observed and Geophysical Fluid Dynamics Laboratory general cir- culation model simulated relation- ships between 700 hPa height ano- malies and winter precipitation *significant at a = 0.05; **signifi- cant at a = 0.01)
Location Correlation coefficient
0.93** 0.34* 0*33*
0.65** 0*32* 063** 040*
- 0.26
for each location were calculated by interpolating the GFDL-simulated and observed correlations to the same grid as discussed in the Methods section. The GFDL-simulated correlation fields are statistically similar to observed correlation fields (at a = 0.05) for seven of the eight locations. Only for location 4 was the correlation between the observed and GFDL-simulated pattern rejected. The GFDL-simulated relationships for locations 1, 5, and 7 were found to be highly statistically similar to observed relationships (at a = 0.01) (Table 11).
Finally, the GFDL-simulated correlation fields appear to be more similar to observed relationships for locations that are nearest oceanic sources of atmospheric moisture (e.g. the North Pacific Ocean, the Gulf of Mexico, and the North Atlantic Ocean). The highly significant correlations for locations 1, 5, and 7, which are coastal locations, are in contrast to the insignificant correlations for location 4, which is the most distant location from an oceanic source of moisture. These results suggest that the GFDL GCM may not adequately simulate variations in advection of atmospheric moisture into the interior parts of the USA and/or may not convert such moisture to precipitation in the interior in proper amounts. These problems may be due, in part, to (i) the inadequate representation of topography in the GFDL GCM, (ii) stronger-than-observed mean winter zonal winds simulated by the GFDL GCM and the consequent more west-to-east paths of air flow and storms across North America, (iii) the relative weakness of important synoptic patterns in GFDL simulations, such as the Pacific North American circulation pattern, or (iv) the occurrence of ‘spectral rain’.
CONCLUSIONS
Observed and GFDL-simulated correlations between 700 hPa anomalies and winter precipitation were compared for eight locations in the conterminous USA. The GFDL GCM simulates monthly relationships between 700 hPa anomalies and winter precipitation that are locally similar to relations found in observed data for most of the locations analysed in this study. Results also indicate that GFDL GCM simulations of the relationships between 700 hPa anomalies and winter precipitation are most similar to observed relations for locations near oceanic sources of atmospheric moisture. These results suggest that the GFDL GCM may not adequately simulate variations in advection of atmospheric moisture into the interior parts of the conterminous USA and/or that this moisture is not adequately converted into precipitation in the interior parts of the USA. In part, these limitations may be related to (i) the much-smoothed topography used in the GFDL GCM, (ii) a mean winter zonal wind simulated by the GFDL GCM that is much stronger than observed, (iii) the relative weakness of important synoptic patterns

OBSERVED AND GFDL-GCM CORRELATIONS OF CIRCULATION AND PRECIPITATION 637
in the GFDL simulations, such as the Pacific North American circulation pattern, and (iv) model numerical artefacts that generate inappropriate precipitation (e.g. spectral rain).
Regional relationships between 700 hPa anomalies and precipitation at some of the locations are different from observed relations. Consequently, use of GFDL-simulated changes in atmospheric circulation for future climatic conditions (e.g. as a result of increased concentrations of atmospheric CO,) to estimate changes in regional precipitation, may yield estimates that are unrealistic in some areas. In addition, GFDL-simulated precipitation may not respond realistically to changes in atmospheric circulation over important regions, such as the subtropics west of Mexico, the Arctic, the Gulf Stream, the North Atlantic Ocean, and the Gulf of Alaska.
ACKNOWLEDGEMENTS
The authors thank Tony Broccoli of GFDL for helpful comments and suggestions.
REFERENCES
Baron, E. J. and Washington, W. M. 1984. ‘The role of geographic variables in explaining paleoclimates: results from Cretaceous
Blackmon, M. L., Lee, Y. H., Wallace, J. M. and Hsu, H. H. 1984. ‘Time variation of 500 mb height fluctuations with long, intermediate
Carlson, T. N. 1991. Mid-Latitude Weather Systems, Harper-Collins, New York, 507 pp. Cayan, D. R. and Roads, J. 0. 1984. ‘Local relationships between United States west coast precipitation and monthly mean circulation
parameters’, Mon. Wea. Rev., 112, 1276-1282. Cayan, D. R. and Peterson, D. H. 1989. ‘The influence of North Pacific atmospheric circulation on streamflow in the West’, in Aspects of Climate Variability in the Pacifc and Western Americas, American Geophysical Union Monograph 55, pp. 375-397.
Dettinger, M. D. and Cayan, D. R. 1992. ‘Climatechange scenarios for the Sierra Nevada, California, based on winter atmospheric-circulation patterns’, Proceedings, American Water Resources Association Symposium on Managing Water Resources During Global Change, Reno, Nevada, pp. 681-690.
Englehart, P. J. and Douglas, A. V. 1985. ‘A statistical analysis of precipitation frequency in the conterminous United States, including comparisons with precipitation totals’, J. C l h . App. Meteorol., 24, 35C362.
Gleick, P. H. 1987. ‘Regional hydrologic consequences of increases in atmospheric CO, and other trace gases’, Clim. Change, 10,
Grotch, S. L., and MacCracken, M. C. 1990. ‘The use of general circulation models to predict regional climatic change’, J. Climate,
Hay, L. E., McCabe, G. I., Wolock, D. M. and Ayers, M. A. 1992. ‘Use of weather types to disaggregate general circulation model
Hewitson, B. C., and Crane, R. G. 1992. ‘Regional climates in the GlSS GCM: synoptic scale circulation’, J. Climate, 5, 1002-1011. Kalkstein, L. S . 1991. Global Comparisons of Selected GCM Control Runs and Observed Climate Data, US Environmental Protection
Klein, W. H. 1963. ‘Specification of precipitation from the 700 millibar circulation’, Mon. Wea. Reo., 91, 527-536. Klein, W. H. and Bloom, H. J. 1987. ‘Specification of monthly precipitation over the United States from the surrounding 700 mb
height field’, Mon. Wea. Rev., 115, 2118-2132. Knox, J. C. 1984. ‘Fluvial response to small scale climate changes’, in Developments and Applications of Geomorphology,
Springer-Verlag, Berlin, pp. 3 18-342. Knox, J. L. and Lawford, R. G. 1990. ‘The relationship between Canadian prairie, dry and wet months and circulation anomalies in
the mid-troposphere’, Atmox-Ocean, 28, 189-215. Leathers, D. J., Yarnal, B. and Palecki, M. A. 1991. ‘The Pacific/North American teleconnection pattern and United States climate.
Part 1 : regional temperature and precipitation associations’, J. Climate, 4, 517-528. Legates, D. R. 1990. ‘A comparison of GCM-simulated precipitation with a gagecorrected global climatology: zonal averages’,
Proceedings, Eighth Conference on Hydrometeorology, American Meteorological Society, Kananaskis Provincial Park, Alberta, pp.
Legates, D. R. and McCabe, G. J. 1992. ‘General circulation model estimates of regional precipitation’, in Global Climate Change: Implications, Challenges, and Mitigation Measures, Pennsylvania Academy of Science, Lafayette, PA, pp. 302-3 14.
Lettenmaier, D. P., Gan, T. Y., and Dawdy, D. R. 1988. ‘Interpretation of Hydrologic Effects of Climate Change in the Sacramento-Sun Joaquin River Basin, California’, Water Resources Technical Report No. 1 10, Department of Civil Engineering, Environmental Engineering and Science, University of Washington, Seattle, WA., 11 1 pp.
climate model sensitivity studies’, J. Geophys. Res., 89, 1267-1279.
and short time scales as deduced from lag-correlation statistics’, J. Atmos. Sci., 41, 981-991.
137-1 61.
4,286303.
predictions’, J. Geophys. Res., 97, 2781-2790.
Agency, Washington, DC, 251 pp.
23-28.
Madden, R. A. 1979. ‘Observations of large-scale traveling Rossby waves’, Rev. Geophys. Space Phy., 17, 19351949. Manabe, S. and Broccoli, A. J. 1990. ‘Mountains and arid climates of middle latitudes’, Science, 247, 192-195.

638 G. J. McCABE, JR., A N D M. D. DETTINGER
Mather, J. R. and Feddema, J. 1986. ‘Hydrologic consequences of increases in trace gases and CO, in the atmosphere’, in E’ects of Changes in Stratospheric Ozone and Global Climate, Vol. 3, Climate Change, US Environmental Protection Agency, Washington,
McCabe, G. J. and Ayers, M. A. 1989. ‘Hydrologic effects of climate change in the Delaware River basin’, Water Resour. Bull., 25,
McCabe, G. J. and Legates, D. R. 1992. ‘Generalcirculation-model simulations of winter and summer sea-level pressures over North
Muller, R. A. and Wax, C. L. 1977. ‘A comparative synoptic climatic baseline for coastal Louisiana’, Geosci. Man, 18, 121-129. Namias, J. 1975. Northern Hemisphere Seasonal Sea Level Pressure and Anomaly Charts, 1947-1974, CalCOFI Atlas No. 22, Marine
Namias, J. 1981. Teleconnections of 700 mb Height Anomalies for the Northern Hemisphere, CalCOFI Atlas No. 29, Marine Life
Nemec, J. and Schaake, J. 1982. ‘Sensitivity of water resource systems to climate variation’, J. Hydrol. Sci., 27, 327-343. Rind, D., Goldberg, R., Hansen, J., Rosenzweig, C. and Ruedy, R. 1990. ‘Potential evapotranspiration and the likelihood of future
Schaake. J. C. 1990. ‘From flow to climate’, in Climate Change and US. Water Resources, Wiley, New York, pp. 177-206. Schlesinger, M. E. 1988. ‘Model projections of the climatic changes induced by increased atmospheric CO,’, Proceedings, Symposium
Stidd, C . K. 1954. ‘The use of correlation fields in relating precipitation to circulation’, J. Meleorol., 11. 202-213. Wallace, J. M. and Gutzler, D. S. 1981. ‘Teleconnections in the geopotential height field during northern hemisphere winter’, Mon.
Walsh, J. E., Richman, M. B. and Allen, D. W. 1982. ‘Spatial coherence of monthly precipitation in the United States’, Mon. Wea.
Weare, B. C. and Hoeschele, M. A. 1983. ‘Specification of monthly precipitation in the western United States from monthly mean
Willmott, C. J., Rowe, C. M. and Philpot, W. D. 1985. ‘Small-scale climate maps: a sensitivity analysis of some common assumptions
Yarnal, B. and Leathers, D. J. 1988. ‘Relationships between interdecadal and interannual climatic variations and their effect on
Zorita, E., Kharin, V. and von Storch, H. 1992. ‘The atmospheric circulation and sea surface temperature in the North Atlantic area
DC, pp. 251-271.
123 1-1242.
America’, 1nt. J. Climatol., 12, 815-827.
Life Research Program, Scripps Institute of Oceanography, University of California-San Diego, La Jolla, CA., 243 pp.
Research Program, Scripps Institute of Oceanography, University of California-San Diego, La Jolla, CA., 265 pp.
drought’, J. of Geophys. Res., 95, 9983-10004.
on Climate and Geo-Sciences, Louvain La-Neuve, Belgium.
Wea. Rev., 109, 784-812.
Rev., 110, 272-286.
circulation’, J. Clim. Appl. Meteorol., 22, 1000-1007.
associated with grid-point interpolation and contouring’, Am. Cartogr., 12, 5-16.
Pennsylvania climate’, Ann. Assoc. Am. Geogr., 78, 624641.
in winter: their interaction and relevance for Iberian precipitation’, J. Climate, 5, 1097-1 108.
Related Documents


