Relational Models for Visual Understanding of Graphical Documents. Application to Architectural Drawings. A dissertation submitted by Llu´ ıs-Pere de las Heras at Universitat Aut`onoma de Barcelona to fulfil the degree of Doctor of Philosophy. Bellaterra, September 29, 2014

Welcome message from author
This document is posted to help you gain knowledge. Please leave a comment to let me know what you think about it! Share it to your friends and learn new things together.
Transcript
Relational Models for Visual
Understanding of Graphical Documents.Application to Architectural Drawings.
A dissertation submitted by Llu��s-Pere delas Heras at Universitat Autonoma deBarcelona to fulfil the degree of Doctor ofPhilosophy.
Bellaterra, September 29, 2014
Director Dra. Gemma Sanchez
Dept. Ciencies de la Computacio & Centre de Visio per Computador
Universitat Autonoma de Barcelona
Thesis Prof. Dr. Prof. h.c. Andreas Dengel
committee German Research Center for Artificial Intelligence, Knowledge Management
University of Kaiserslauren
Prof. Dr. Jean-Marc Ogier
Laboratoire Informatique, Image et Interaction
Universite de La Rochelle
Dr. Ramon Baldrich
Dept. Ciencies de la Computacio & Centre de Visio per Computador
Universitat Autonoma de Barcelona
Dr. Sergio Escalera
Matematica Aplicada i Analisi
Universitat de Barcelona
Dr. Francisco Javier Sanchez
Dept. Ciencies de la Computacio & Centre de Visio per Computador
Universitat Autonoma de Barcelona
International Dr. Bart Lamiroy
evaluators LORIA
Universite de Lorraine
Dr. Pierre Heroux
Laboratoire LITIS
Universite de Rouen
This document was typeset by the author using LATEX2ε.
The research described in this book was carried out at the Centre de Visio per Computador, Uni-versitat Autonoma de Barcelona.
Copyright © 2014 by Lluıs-Pere de las Heras. All rights reserved. No part of this publicationmay be reproduced or transmitted in any form or by any means, electronic or mechanical, includingphotocopy, recording, or any information storage and retrieval system, without permission in writingfrom the author.
ISBN: 978-84-940902-4-0
Printed by Ediciones Graficas Rey, S.L.
A la Sandra, l’Alba i mons pares...
De vegades,improvitzar es la millor manera
de tenir-ho tot sota control.Lluıs-Pere de las Heras

Agra•�ments
Magradaria agrair a certa gent i institucions que han fet possible la realitzacio daque-sta tesi. Sense ells no hagues estat possible.
Primer de tot magradaria agrair a la Universitat Autonoma de Barcelona perdonar-me loportunitat, ja no nomes de doctorar-me, sino tambe de llicenciar-me coma enginyer i master en informatica. Onze anys fa ja que em vaig incorporar a lainstitucio i per tant, es podria dir que soc de la cantera. A mes, voldria tambe agrairal Centre de Visio per Computador per acollir-me aquests ultims 5 anys i on herealitzat el Master i aquesta tesi doctoral.
Magradaria agrair a la meva directora de tesi, la Dra. Gemma Sanchez, per donar-me loportunitat de desenvolupar aquesta tesi doctoral, per la seva orientacio i conselldurant tots aquests anys.
Magradaria agrair especialment a tres persones que tambe han estat clau peldesenvolupament daquesta tesi. Voldria primer de tot agrair al Dr. Oriol Ramosper la seva col�laboracio, paciencia, pedagogia i amistat. Gracies Oriol, de veritat.Voldria tambe donar les gracies al Dr. Ernest Valveny per orientar-me en els semprecomplexos primers passos de doctorat. Finalment expressar energicament la mevagratitud al Dr. Josep Llados per tot el que m’ha ajudat a arribar fins aquı. GraciesJosep.
I would like to thank Prof. Dr. Prof. h.c. Andreas Dengel and Dr. Marcus Liwickiwho gave the opportunity of spending three profitable months of my research atthe German Research Center for Artificial Intelligence in Kaiserslautern. There Imet great professionals and even better people. Thanks to Dr. Stephan Baunmann,Dr. Ludger van Elst, Heinz Kirchmann, Klaus Broelemann, and Ahmed Sheraz.
Durant la persecucio daquesta tesi doctoral he format part dun grup de gent genialpel que fa tant essers humans com a investigadors. Vull agrair al Dr. DimosthenisKaratzas, Dr. Maral Rossinyol, Dra. Alicia Fornes, Dr. Albert Gordo, Lluıs Gomez,Nuria Cirera, Hongxing Gao, Christophe Rigaud i Antonio Clavelli per les gransreunions de grup que tant mhan il�lustrat en lanalisi de documents.
Evidentment vull agrair a tots els meus amics sense els quals la vida seria tanavorrida que seria impossible realitzar una tesi doctoral. Gracies Riu, Gomez, Llergo,Mireia, Marta, Ade, Roger, Jon, David, Anjan, Toni, Carles, Fran, Ruben, Ekain,Camp, Ivet, Alejandro, Joan, Yainuvis i Jorge. Merci companys, de veritat.
I would like to thank somebody very special to me. Thank you so much, Martin.I spent part of my best lifetime in Kaiserslautern and it was thanks to you. I am surethat even better times will come together. Thanks also to Christian, Anika, Christine,
i
ii
and Sylvia for the great time we have spent together.Tambe vull agrair moltıssim a la meva famılia. Se que sona a topic pero tinc una
famılia que no me la mereixo. I quan parlo de famılia parlo de la Cuadri, evidentment.Moltes gracies a tots per ser com sou.
Gracies a aquelles persones mes proximes i que mes estimo. Vull agrair de tot elcor a la iaia, l’avi, la Rosa Marta, la Silvia, la Fany, el Sergi, el Fran, la Carla, laYolanda i l’Emilio. Gracies.
Que puc dir de vosaltres, Albeta, mare i pare. Ja sabeu tot el que us arribo aestimar, com us admiro i us respecto. Estic tant agraıt per tot el que heu fet per mi,TANT, que soc sincer quan us dic que em salten les llagrimes quan escric, rectificoi torno a escriure aquesta lınia mirant de trobar les paraules correctes. Moltıssimesgracies.
Sandreta, GRACIES en majuscules per ser com ets i per fer-me a mi com soc.Pel teu amor, paciencia, i sacrifici en els moments mes difıcils daquesta tesi. Graciesper fer tan durs els matins i tan boniques les tardes i les nits de cada dia laborable.Gracies pels caps de setmana, pels viatges junts, per les aventures. Gracies per totamore, testimo mes que res en aquest mon. 87’30”
Finalment, voldria agrair-te especialment a tu tieta, ja no nomes per tot allo quehas fet per mi sempre (que n’estic segur que es mes del que ha fet qualsevol altra tietapel seu nebot), sino per mostrar-me lesperit de lluita necessari per tal de sortir-sen ensituacions difıcils. Ets un exemple per tots nosaltres. Ens en sortirem, nestic segur.Testimo molt.
Abstract
Graphical documents express complex concepts using a visual language. This lan-guage consists of a vocabulary (symbols) and a syntax (structural relations amongsymbols) that articulate a semantic meaning in a certain context. Therefore, theautomatic interpretation of these sort of documents by computers entails three mainsteps: the detection of the symbols, the extraction of the structural relations amongthese symbols, and the modeling of the knowledge that permits the extraction ofthe semantics. Different domains in graphical documents include: architectural andengineering drawings, maps, flowcharts, etc.
Graphics Recognition in particular and Document Image Analysis in general areborn from the industrial need of interpreting a massive amount of digitalized doc-uments after the emergence of the scanner. Although many years have passed, thegraphical document understanding problem still seems to be far from being solved.The main reason is that the vast majority of the systems in the literature focus ona very specific problems, where the domain of the document dictates the implemen-tation of the interpretation. As a result, it is difficult to reuse these strategies ondifferent data and on different contexts, hindering thus the natural progress in thefield.
In this thesis, we face the graphical document understanding problem by propos-ing several relational models at different levels that are designed from a generic per-spective. Firstly, we introduce three different strategies for the detection of symbols.The first method tackles the problem structurally, wherein general knowledge of thedomain guides the detection. The second is a statistical method that learns thegraphical appearance of the symbols and easily adapts to the big variability of theproblem. The third method is a combination of the previous two inheriting theirrespective strengths, i.e. copes the big variability and does not need of annotateddata. Secondly, we present two relational strategies that tackle the problem of thevisual context extraction. The first one is a full bottom up method that heuristicallysearches in a graph representation the contextual relations among symbols. Contrar-ily, the second is syntactic method that models probabilistically the structure of thedocuments. It automatically learns the model, which guides the inference algorithmto counter the best structural representation for a given input. Finally, we construct aknowledge-based model consisting of an ontological definition of the domain and realdata. This model permits to perform contextual reasoning and to detect semanticinconsistencies within the data. We evaluate the suitability of the proposed contribu-tions in the framework of floor plan interpretation. Since there is no standard in the
iii
iv
modeling of these documents, there exists an enormous notation variability and thesort of information included in the documents also varies from plan to plan. Therefore,floor plan understanding is a relevant task in the graphical document understandingproblem. It is also worth to mention that, we make freely available all the resourcesused in this thesis (the data, the tool used to generate the data, and the evaluationscripts) aiming at fostering the research in graphical document understanding task.
Resum
Els documents grafics son documents que expressen continguts semantics utilitzantmajoritariament un llenguatge visual. Aquest llenguatge esta format per un vocabu-lari (sımbols) i una sintaxi (relacions estructurals entre els sımbols) que conjuntamentmanifesten certs conceptes en un context determinat. Per tant, la interpretacio dundocument grafic per part dun ordinador implica tres fases. (1) Ha de ser capadedetectar automaticament els sımbols del document. (2) Ha de ser capadextreure lesrelacions estructurals entre aquests sımbols. I (3), ha de tenir un model del domini pertal poder extreure la semantica. Exemples de documents grafics de diferents dominisson els planells darquitectural i d’enginyeria, mapes, diagrames de flux, etc.
El Reconeixement de Grafics, dintre de larea de recerca de Analisi de Documents,neix de la necessitat de la industria dinterpretar la gran quantitat de documents graficsdigitalitzats a partir de laparicio de lescaner. Tot i que molts anys han passat daquestsinicis, el problema de la interpretacio automatica de documents sembla encara estarlluny de ser solucionat. Basicament, aquest proces sha alentit per una rao principal:la majoria dels sistemes dinterpretacio que han estat presentats per la comunitat sonmolt centrats en una problematica especıfica, en el que el domini del document marcaclarament la implementacio del metode. Per tant, aquests metodes son difıcils deser reutilitzats en daltres dades i marcs daplicacio, estancant aixı la seva adopcio ievolucio en favor del progres.
En aquesta tesi afrontem el problema de la interpretacio automatica de docu-ments grafics a partir dun seguit de models relacionals que treballen a tots els nivellsdel problema, i que han estat dissenyats des dun punt de vista generic per tal de quepuguin ser adaptats a diferents dominis. Per una part, presentem 3 metodes diferentsper a lextraccio dels sımbols en un document. El primer tracta el problema des dunpunt de vista estructural, en el que el coneixement general de lestructura dels sımbolspermet trobar-los independentment de la seva aparena. El segon es un metode es-tadıstic que apren laparena dels sımbols automaticament i que, per tant, sadapta ala gran variabilitat del problema. Finalment, el tercer metode es una combinaciodambdos, heretant els beneficis de cadascun dels metodes. Aquesta tercera imple-mentacio no necessita de un aprenentatge previ i a mes sadapta facilment a multiplesnotacions grafiques. D’altra banda, presentem dos metodes per a la extraccio del con-text visuals. El primer metode segueix una estrategia bottom-up que cerca les relacionsestructurals en una representacio de graf mitjanant algorismes dintel�ligencia artificial.La segona en canvi, es un metode basat en una gramatica que mitjanant un modelprobabilıstic apren automaticament lestructura dels planells. Aquest model guia la
v
vi
interpretacio del document amb certa independencia de la implementacio algorısmica.Finalment, hem definit una base del coneixement fent confluir una definicio ontologicadel domini amb dades reals. Aquest model ens permet raonar les dades des dun puntde vista contextual i trobar inconsistencies semantiques entre les dades. Leficienciadaquetes contribucions han estat provades en la interpretacio de planells darquitec-tura. Aquest documents no tenen un estandard establert i la seva notacio graficai inclusio dinformacio varia de planell a planell. Per tant, es un marc rellevant delproblema de reconeixement grafic. A mes, per tal de promoure la recerca en termesde interpretacio de documents grafics, fem publics tant les dades, leina per generarles dades i els evaluadors del rendiment.
Contents
1 Introduction 11.1 Motivation . . . . . . . . . . . . . . . . . . . . . . . . . . . . . . . . . 1
1.1.1 Graphics recognition . . . . . . . . . . . . . . . . . . . . . . . . 21.1.2 Floor plan interpretation . . . . . . . . . . . . . . . . . . . . . 4
1.2 Objectives and Contributions . . . . . . . . . . . . . . . . . . . . . . . 61.3 Organization of the dissertation . . . . . . . . . . . . . . . . . . . . . . 8
2 State-of-the-Art in Graphical Document Recognition 112.1 Introduction . . . . . . . . . . . . . . . . . . . . . . . . . . . . . . . . . 112.2 Symbol recognition . . . . . . . . . . . . . . . . . . . . . . . . . . . . . 12
2.2.1 Statistical symbol recognition . . . . . . . . . . . . . . . . . . . 122.2.2 Structural symbol recognition . . . . . . . . . . . . . . . . . . . 12
2.3 Interpretation of graphical documents . . . . . . . . . . . . . . . . . . 132.4 Floor plan analysis . . . . . . . . . . . . . . . . . . . . . . . . . . . . . 142.5 Conclusions . . . . . . . . . . . . . . . . . . . . . . . . . . . . . . . . . 17
3 Symbol detection 193.1 Introduction . . . . . . . . . . . . . . . . . . . . . . . . . . . . . . . . . 193.2 Document preprocessing . . . . . . . . . . . . . . . . . . . . . . . . . . 203.3 A structural approach for wall segmentation . . . . . . . . . . . . . . . 21
3.3.1 Black-wall detection . . . . . . . . . . . . . . . . . . . . . . . . 223.3.2 Wall-candidates generation . . . . . . . . . . . . . . . . . . . . 233.3.3 Wall-hypothesis generation, score, and selection . . . . . . . . . 23
3.4 A statistical approach for object segmentation . . . . . . . . . . . . . . 263.4.1 Images size normalization . . . . . . . . . . . . . . . . . . . . . 263.4.2 Grid creation . . . . . . . . . . . . . . . . . . . . . . . . . . . . 273.4.3 Feature extraction . . . . . . . . . . . . . . . . . . . . . . . . . 273.4.4 Model learning and classification . . . . . . . . . . . . . . . . . 28
3.5 Combining the structural and statistical methods for wall segmentation 293.5.1 Structural-based phase . . . . . . . . . . . . . . . . . . . . . . . 303.5.2 Statistical-based phase . . . . . . . . . . . . . . . . . . . . . . . 303.5.3 Combining both segmentations . . . . . . . . . . . . . . . . . . 31
3.6 Experimental evaluation . . . . . . . . . . . . . . . . . . . . . . . . . . 313.6.1 Wall evaluation protocol . . . . . . . . . . . . . . . . . . . . . . 31
vii
viii CONTENTS
3.6.2 Evaluation of the structural approach . . . . . . . . . . . . . . 323.6.3 Evaluation of the statistical approach . . . . . . . . . . . . . . 333.6.4 Evaluation of the combinational approach . . . . . . . . . . . . 363.6.5 Discussion of the results . . . . . . . . . . . . . . . . . . . . . . 37
3.7 Conclusion . . . . . . . . . . . . . . . . . . . . . . . . . . . . . . . . . 38
4 Structural and syntactic recognition 454.1 Introduction . . . . . . . . . . . . . . . . . . . . . . . . . . . . . . . . . 454.2 A structural approach for graphical document analysis . . . . . . . . . 46
4.2.1 Wall entity recognition . . . . . . . . . . . . . . . . . . . . . . . 474.2.2 Door and Window entity recognition . . . . . . . . . . . . . . . 50
4.3 Syntactic analysis of graphical documents . . . . . . . . . . . . . . . . 544.3.1 The floor plan attributed graph grammar . . . . . . . . . . . . 554.3.2 Defining the structural context: Syntactic-0 . . . . . . . . . . . 574.3.3 Learning the context: Syntactic . . . . . . . . . . . . . . . . . . 61
4.4 Experimental Evaluation . . . . . . . . . . . . . . . . . . . . . . . . . . 674.4.1 Evaluation Method for Room detection . . . . . . . . . . . . . 684.4.2 Results on room detection . . . . . . . . . . . . . . . . . . . . . 684.4.3 Discussion of the Results . . . . . . . . . . . . . . . . . . . . . 70
4.5 Conclusion . . . . . . . . . . . . . . . . . . . . . . . . . . . . . . . . . 70
5 Semantic analysis 775.1 Introduction . . . . . . . . . . . . . . . . . . . . . . . . . . . . . . . . . 775.2 Floor plan knowledge-base . . . . . . . . . . . . . . . . . . . . . . . . . 78
5.2.1 Floor plan ontology . . . . . . . . . . . . . . . . . . . . . . . . 805.2.2 Introducing real instances into our knowledge base . . . . . . . 81
5.3 Experimental validation . . . . . . . . . . . . . . . . . . . . . . . . . . 825.3.1 Automatic instance classification . . . . . . . . . . . . . . . . . 825.3.2 Automatic instance validation . . . . . . . . . . . . . . . . . . . 85
5.4 Conclusions . . . . . . . . . . . . . . . . . . . . . . . . . . . . . . . . . 85
6 Floor plan database 876.1 Introduction . . . . . . . . . . . . . . . . . . . . . . . . . . . . . . . . . 876.2 Related work . . . . . . . . . . . . . . . . . . . . . . . . . . . . . . . . 88
6.2.1 Floor plan databases . . . . . . . . . . . . . . . . . . . . . . . . 886.2.2 Groundtruthing tools . . . . . . . . . . . . . . . . . . . . . . . 90
6.3 The structural groundtruthing tool . . . . . . . . . . . . . . . . . . . . 906.3.1 Classes and structural relations. Definitions and labeling . . . 916.3.2 Creation and version control of a database . . . . . . . . . . . . 926.3.3 Input images and Ground truth SVG files . . . . . . . . . . . . 93
6.4 Structural Floor Plan GT . . . . . . . . . . . . . . . . . . . . . . . . . 946.4.1 Element labels . . . . . . . . . . . . . . . . . . . . . . . . . . . 956.4.2 Structural relations . . . . . . . . . . . . . . . . . . . . . . . . . 96
6.5 The CVC-FP Images . . . . . . . . . . . . . . . . . . . . . . . . . . . . 976.5.1 Black Dataset . . . . . . . . . . . . . . . . . . . . . . . . . . . . 986.5.2 Textured Dataset . . . . . . . . . . . . . . . . . . . . . . . . . . 100
CONTENTS ix
6.5.3 Textured2 Dataset . . . . . . . . . . . . . . . . . . . . . . . . . 1006.5.4 Parallel Dataset . . . . . . . . . . . . . . . . . . . . . . . . . . 102
6.6 Conclusions . . . . . . . . . . . . . . . . . . . . . . . . . . . . . . . . . 102
7 Conclusions 1057.0.1 Summary and contributions . . . . . . . . . . . . . . . . . . . . 1057.0.2 Future work lines . . . . . . . . . . . . . . . . . . . . . . . . . . 106
Bibliography 109

x CONTENTS
List of Tables
3.1 Definition of True-positives (TP ), False-positives (FP ) and False-Negatives(FN) for Wall segmentation evaluation. Black pixels in an image areconsidered as 1 and white ones as 0 . . . . . . . . . . . . . . . . . . . . 32
3.2 Results regarding the different grid compositions. . . . . . . . . . . . . 333.3 Results regarding the different patch-descriptors. . . . . . . . . . . . . 343.4 Results regarding the different learning and classification strategies. . 343.5 Results regarding the normalization of the images in terms of line thick-
ness. . . . . . . . . . . . . . . . . . . . . . . . . . . . . . . . . . . . . . 353.6 Quantitative parameters on wall detection . . . . . . . . . . . . . . . . 363.7 Global results for wall detection . . . . . . . . . . . . . . . . . . . . . . 38
4.1 Attributes, nodes, rules and equations . . . . . . . . . . . . . . . . . . 634.2 Results on room detection . . . . . . . . . . . . . . . . . . . . . . . . . 75
xi

xii LIST OF TABLES
List of Figures
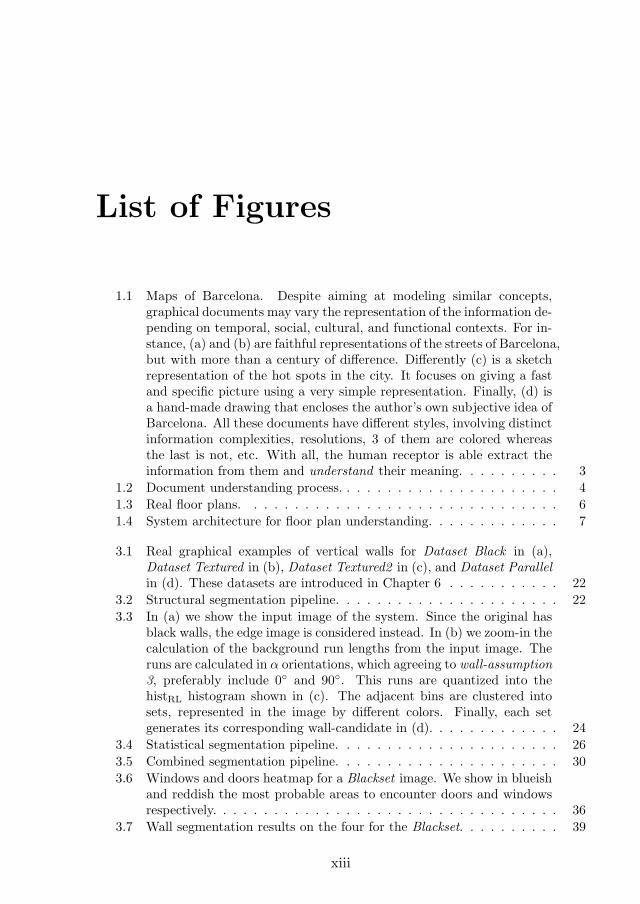
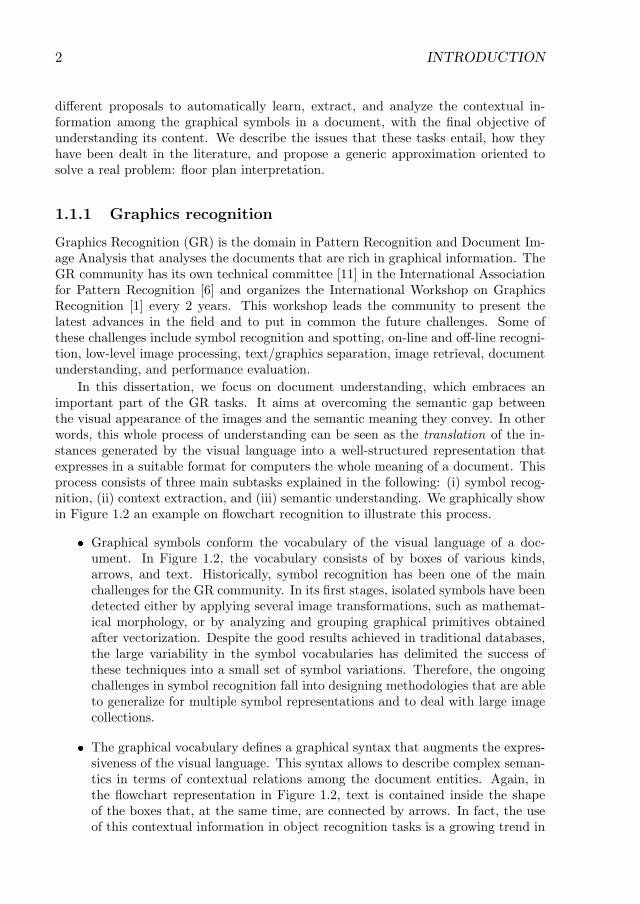
1.1 Maps of Barcelona. Despite aiming at modeling similar concepts,graphical documents may vary the representation of the information de-pending on temporal, social, cultural, and functional contexts. For in-stance, (a) and (b) are faithful representations of the streets of Barcelona,but with more than a century of difference. Differently (c) is a sketchrepresentation of the hot spots in the city. It focuses on giving a fastand specific picture using a very simple representation. Finally, (d) isa hand-made drawing that encloses the author’s own subjective idea ofBarcelona. All these documents have different styles, involving distinctinformation complexities, resolutions, 3 of them are colored whereasthe last is not, etc. With all, the human receptor is able extract theinformation from them and understand their meaning. . . . . . . . . . 3
1.2 Document understanding process. . . . . . . . . . . . . . . . . . . . . . 4
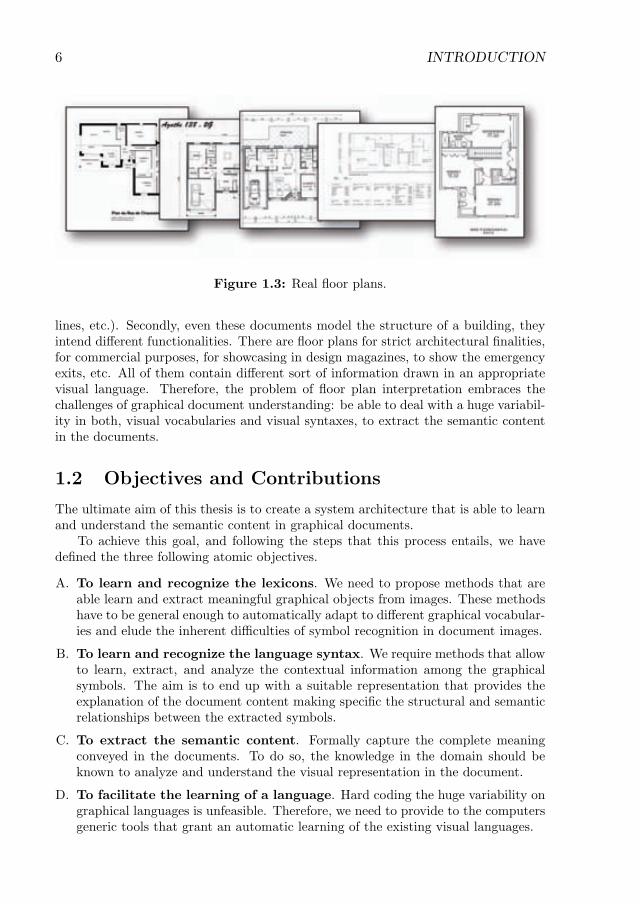
1.3 Real floor plans. . . . . . . . . . . . . . . . . . . . . . . . . . . . . . . 6
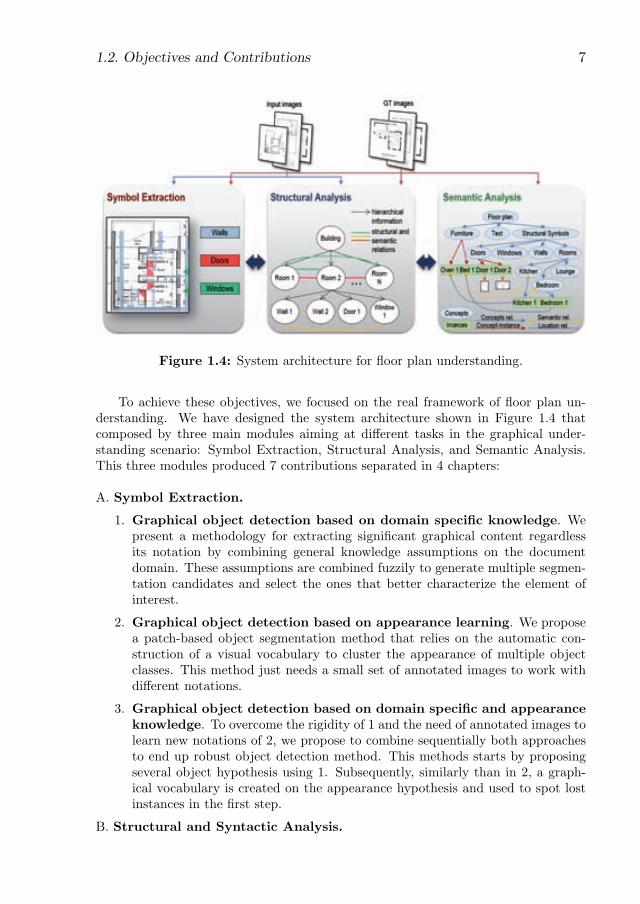
1.4 System architecture for floor plan understanding. . . . . . . . . . . . . 7
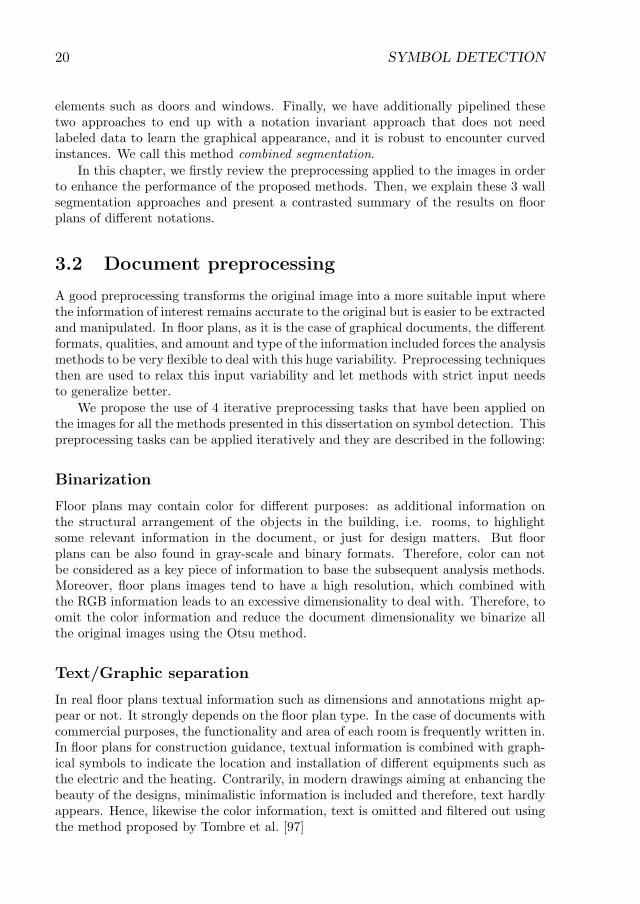
3.1 Real graphical examples of vertical walls for Dataset Black in (a),Dataset Textured in (b), Dataset Textured2 in (c), and Dataset Parallelin (d). These datasets are introduced in Chapter 6 . . . . . . . . . . . 22
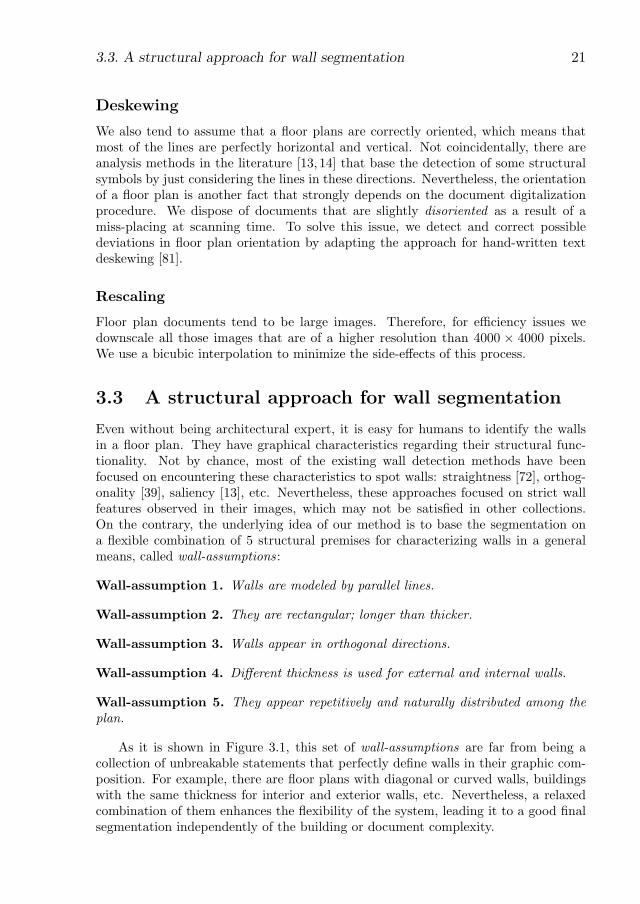
3.2 Structural segmentation pipeline. . . . . . . . . . . . . . . . . . . . . . 22
3.3 In (a) we show the input image of the system. Since the original hasblack walls, the edge image is considered instead. In (b) we zoom-in thecalculation of the background run lengths from the input image. Theruns are calculated in α orientations, which agreeing to wall-assumption3, preferably include 0◦ and 90◦. This runs are quantized into thehistRL histogram shown in (c). The adjacent bins are clustered intosets, represented in the image by different colors. Finally, each setgenerates its corresponding wall-candidate in (d). . . . . . . . . . . . . 24
3.4 Statistical segmentation pipeline. . . . . . . . . . . . . . . . . . . . . . 26
3.5 Combined segmentation pipeline. . . . . . . . . . . . . . . . . . . . . . 30
3.6 Windows and doors heatmap for a Blackset image. We show in blueishand reddish the most probable areas to encounter doors and windowsrespectively. . . . . . . . . . . . . . . . . . . . . . . . . . . . . . . . . . 36
3.7 Wall segmentation results on the four for the Blackset. . . . . . . . . . 39
xiii
xiv LIST OF FIGURES
3.8 Wall segmentation results on the four for the Texturedset. . . . . . . . 40
3.9 Wall segmentation results on the four for the Textured2set. . . . . . . 41
3.10 Wall segmentation results on the four for the Parallel. . . . . . . . . . 42
3.11 Wall segmentation for three images downloaded from the Internet. . . 43
4.1 Pipeline of the method. . . . . . . . . . . . . . . . . . . . . . . . . . . 47
4.2 Complete flow of wall recognition process. . . . . . . . . . . . . . . . 48
4.3 Wall entity recognition. . . . . . . . . . . . . . . . . . . . . . . . . . . 50
4.4 Left: three different windows from real floor plans with dissimilar no-tations. Right: the respective vectorization. Black vectors belong towalls and gray to windows. . . . . . . . . . . . . . . . . . . . . . . . . 51
4.5 Process for finding a door entity. In (a) shows the detection of thedoor by the statistical approach presented in Section 3.4 over the realimage. The centroid of the area where the door is found is shown asa red point in (b). The node expansion by A* for finding the pathbetween the two walls in the graph is shown in red in (c). Finally, bothwalls are connected in (d) by means of a door node. . . . . . . . . . . 52
4.6 A problematic situation is shown in (a) for finding door lines betweenthe blue wall candidates. In this case a ceiling line traverses the doorsymbol. The nodes expanded (red) by a pure implementation of A*algorithm in (b) shows that the final retrieved path does not traversesthe complete door lines. Contrarily, in (c), additional cost for traversingwall nodes is added, and the final retrieved path is correct. . . . . . . 53
4.7 Representation models for floor plans. . . . . . . . . . . . . . . . . . . 56
4.8 Rules for Syntactic-0. Rule r1 derives a Building into M rooms. Ruler2 derives a Room into N primitives. . . . . . . . . . . . . . . . . . . . 58
4.9 Rules for Syntactic. . . . . . . . . . . . . . . . . . . . . . . . . . . . . . 62
4.10 Watershed applied on the room structure. Rooms are in black, doors inred, and separations in orange. The original image is shown in Figure4.11a . . . . . . . . . . . . . . . . . . . . . . . . . . . . . . . . . . . . . 66
4.11 Room segmentation results for the Black dataset. . . . . . . . . . . . . 71
4.12 Room segmentation results for the Textured dataset. . . . . . . . . . . 72
4.13 Room segmentation results for the Textured2 dataset. . . . . . . . . . 73
4.14 Room segmentation results for the Parallel dataset. . . . . . . . . . . . 74
5.1 Catalonia Parliament elections of 2012 . . . . . . . . . . . . . . . . . . 78
5.2 Floor plan ontology at the Protege UI . . . . . . . . . . . . . . . . . . 79
5.3 Class taxonomy. . . . . . . . . . . . . . . . . . . . . . . . . . . . . . . 80
5.4 Object properties. . . . . . . . . . . . . . . . . . . . . . . . . . . . . . 81
5.5 Data properties. . . . . . . . . . . . . . . . . . . . . . . . . . . . . . . 82
5.6 Class hierarchy before and after the automatic inference . . . . . . . . 84
5.7 Automatic instance classification. The reasoner categorizes the in-stance Building104 as Studio according to its area. The reasonerinfers the building parentChildRelation with those primitives that be-long to its rooms. . . . . . . . . . . . . . . . . . . . . . . . . . . . . . . 85
LIST OF FIGURES xv
6.1 Overview of SGT tool architecture. Each database is stored into adifferent folder. For each database a particular set of classes and struc-tural information is defined . . . . . . . . . . . . . . . . . . . . . . . . 91
6.2 Window for new category creation. . . . . . . . . . . . . . . . . . . . . 926.3 Window for new relation creation. . . . . . . . . . . . . . . . . . . . . 936.4 View of the editing page. Among other functionalities, the user can
import an existing GT, choose the labeling procedure, label objectsand structural information, and select those objects and relations wantto show/hide. . . . . . . . . . . . . . . . . . . . . . . . . . . . . . . . . 94
6.5 Wall, door and window labeling. . . . . . . . . . . . . . . . . . . . . . 956.6 Rooms labeling. Rooms are drawn in turquoise and separations in red. 966.7 Examples for the different structural relations between objects. . . . . 986.8 Black Dataset. In (a) we show a sample image from this dataset. In
(b) we show the different types of doors, in (c) the window’s models,and in (d) some of the difficulties of the dataset. . . . . . . . . . . . . 99
6.9 Textured Dataset. In (a) we show a sample image from this dataset.In (b) we show 3 different window symbols. In (c) we show somedifficulties in the dataset: the multiple intersection of symbols andtext to the left, and the side effects of binarizing in poor quality plansto the right. . . . . . . . . . . . . . . . . . . . . . . . . . . . . . . . . . 100
6.10 Textured2 Dataset. In (a) we show the structural distribution of allthe floors in the flat. In (b) we show the different types symbols: fromleft to right: water and electrical symbols. . . . . . . . . . . . . . . . . 101
6.11 Parallel Dataset image. . . . . . . . . . . . . . . . . . . . . . . . . . . 102

xvi LIST OF FIGURES
Chapter 1
Introduction
1.1 Motivation
Nowadays, despite the dramatic increase in the creation and processing of digitaldata, paper-based storage capacity is still growing [56]. This has currently fosteredthe research in Document Image Analysis (DIA) systems, which aim to automati-cally store, extract, and process the information contained in documents. DIA is atthe intersection of the research fields of image processing, pattern recognition, arti-ficial intelligence, linguistics, and storage systems [74], and encloses several researchlines, such as type and hand-written text recognition, document categorization andunderstanding, and graphics recognition.
Graphics Recognition is the sub-domain of DIA that analyzes the content of graph-ical documents. A graphical document is either a physical or a virtual matter createdto convey and communicate a piece of information that, part or all, is manifestedin a pictorial or diagrammatic form, agreeing to a graphical language. Examples ofgraphical documents are maps, engineering drawings, flowcharts, diagrams, etc.
Graphical languages are human-made systems of communication that allow to ex-press complex semantical concepts using graphical information. Making the analogyto natural languages, lexical data (e.g. words) is arranged in a specific order accordingto syntactical rules defined by a language to give a complete meaning to a sentence.In graphical languages, one can think that the vocabulary consists a set of symbols,and the grammatical rules are contextual relations among these symbols that give thecomplete meaning to a graphic. Thus, graphical document understanding entails theparsing by a reading system that recognizes both, the isolated symbols in the docu-ment and their contextual relations. Yet, graphical languages, as natural languagesdo, vary depending on several aspects, e.g. the nature of reader (infants or adults),the sort of information enclosed (technical, complex, informal), creativity and designmatters, etc. For instance, we show in Figure 1.1 four graphical documents thatrepresent the same concept using different visual languages. Therefore, in the samemanner as humans do, computers need to speak the different variations of graphicallanguages in order to understand the information conveyed in these documents.
This work tackles the problem of graphical document interpretation. It presents
1
2 INTRODUCTION
different proposals to automatically learn, extract, and analyze the contextual in-formation among the graphical symbols in a document, with the final objective ofunderstanding its content. We describe the issues that these tasks entail, how theyhave been dealt in the literature, and propose a generic approximation oriented tosolve a real problem: floor plan interpretation.
1.1.1 Graphics recognition
Graphics Recognition (GR) is the domain in Pattern Recognition and Document Im-age Analysis that analyses the documents that are rich in graphical information. TheGR community has its own technical committee [11] in the International Associationfor Pattern Recognition [6] and organizes the International Workshop on GraphicsRecognition [1] every 2 years. This workshop leads the community to present thelatest advances in the field and to put in common the future challenges. Some ofthese challenges include symbol recognition and spotting, on-line and off-line recogni-tion, low-level image processing, text/graphics separation, image retrieval, documentunderstanding, and performance evaluation.
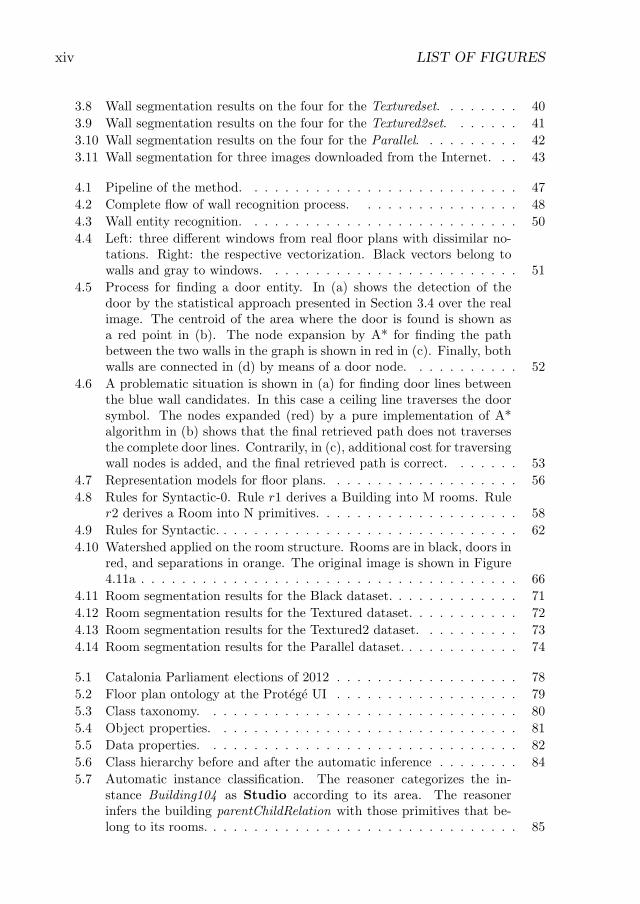
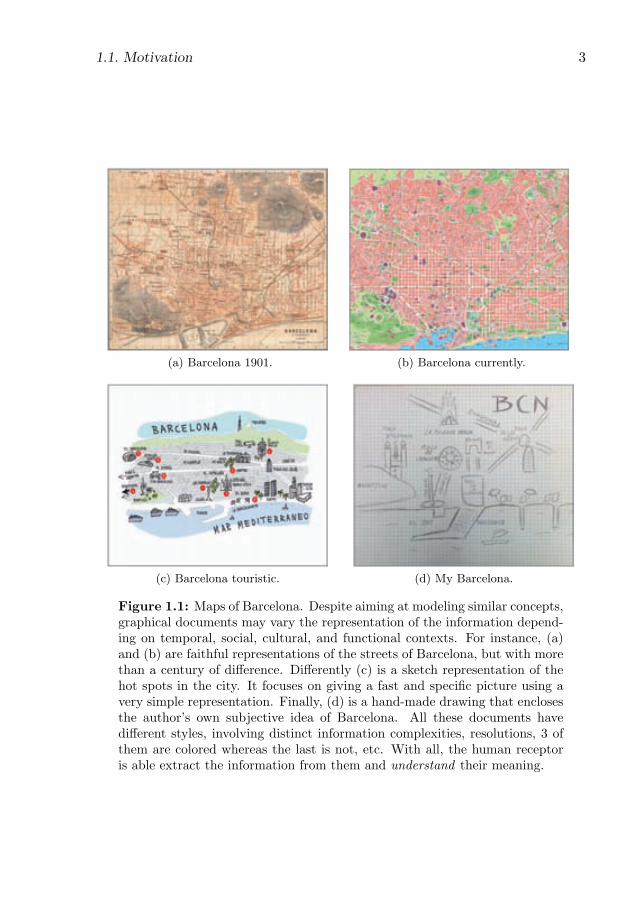
In this dissertation, we focus on document understanding, which embraces animportant part of the GR tasks. It aims at overcoming the semantic gap betweenthe visual appearance of the images and the semantic meaning they convey. In otherwords, this whole process of understanding can be seen as the translation of the in-stances generated by the visual language into a well-structured representation thatexpresses in a suitable format for computers the whole meaning of a document. Thisprocess consists of three main subtasks explained in the following: (i) symbol recog-nition, (ii) context extraction, and (iii) semantic understanding. We graphically showin Figure 1.2 an example on flowchart recognition to illustrate this process.
� Graphical symbols conform the vocabulary of the visual language of a doc-ument. In Figure 1.2, the vocabulary consists of by boxes of various kinds,arrows, and text. Historically, symbol recognition has been one of the mainchallenges for the GR community. In its first stages, isolated symbols have beendetected either by applying several image transformations, such as mathemat-ical morphology, or by analyzing and grouping graphical primitives obtainedafter vectorization. Despite the good results achieved in traditional databases,the large variability in the symbol vocabularies has delimited the success ofthese techniques into a small set of symbol variations. Therefore, the ongoingchallenges in symbol recognition fall into designing methodologies that are ableto generalize for multiple symbol representations and to deal with large imagecollections.
� The graphical vocabulary defines a graphical syntax that augments the expres-siveness of the visual language. This syntax allows to describe complex seman-tics in terms of contextual relations among the document entities. Again, inthe flowchart representation in Figure 1.2, text is contained inside the shapeof the boxes that, at the same time, are connected by arrows. In fact, the useof this contextual information in object recognition tasks is a growing trend in
1.1. Motivation 3
(a) Barcelona 1901. (b) Barcelona currently.
(c) Barcelona touristic. (d) My Barcelona.
Figure 1.1: Maps of Barcelona. Despite aiming at modeling similar concepts,graphical documents may vary the representation of the information depend-ing on temporal, social, cultural, and functional contexts. For instance, (a)and (b) are faithful representations of the streets of Barcelona, but with morethan a century of diff erence. Diff erently (c) is a sketch representation of thehot spots in the city. It focuses on giving a fast and specifi c picture using avery simple representation. Finally, (d) is a hand-made drawing that enclosesthe author’ s own subjective idea of Barcelona. All these documents havediff erent styles, involving distinct information complexities, resolutions, 3 ofthem are colored whereas the last is not, etc. With all, the human receptoris able extract the information from them and understand their meaning.
4 INTRODUCTION
Figure 1.2: Document understanding process.
Computer Vision [29] since it increases the discriminability in this process: itis very probable to fi nd text in an already detected box.
Visual vocabularies and syntaxes represent complex semantic concepts. There-fore, the domain of a document should be known in order extract and processthe information conveyed. For instance, in Figure 1.2, the fl owchart defi nes aworkfl ow of sequential actions defi ned by the arrows that connect the boxes.Moreover, each shape of the boxes defi nes a diff erent sort of action (initial orfi nal action, process, time, etc), which is semantically correlated with the textthat describes each specifi c action. Thus, this semantic knowledge not only al-lows to reveal the meaning of the document, but can also guide the recognitionprocess in the detection of instances and contextual relations.
Despite the huge research in this topic, the nature of graphical of documentsproducing a high variability in terms of visual languages has lead the researches tofocus on a controlled set of document domains. For this reason, the big challenge ondocument understanding falls into the creation of reading systems that are able togeneralize for multiple documents written in diff erent visual languages.
1.1.2 Floor plan interpretation
In architecture and building engineering, a fl oor plan is drawing to scale, showinga view from above of the relationships between rooms, spaces and other physicalfeatures at one level of a structure [95]. The diff erent steps in the building design
1.1. Motivation 5
generate multiple floor plans with distinct sort of information: structural dimensions,construction materials, furniture, water pumps, gas, air and electrical distribution,etc. Recently these documents were handmade whereas they are currently generatedby CAD software; tools that aid architects in the complete design of a building.
In other words, floor plans are graphical documents that visually model the struc-ture of buildings. Here, the graphical vocabulary consists of elements that are seman-tically associated to real concepts, such as walls, doors, windows, etc. They arebasically defined by simple graphical primitives such as lines, arcs, textures, and col-ors. These symbols have strong structural relations defined by the visual syntax ofthe domain, that allow to describe more complex elements: such as rooms, corridors,and terraces. One can think, for instance, that a room is a closed environment sur-rounded by walls, doors, and windows that delimit its space. Contrarily, it is veryunprovable to find an isolated door in a middle of a room. Each of these symbols,either simple or complex, has an associated semantic meaning that characterizes theconcept of a building. For example, the symbol door represents an object that givesaccess between two rooms, rooms might have different functionalities –living-room,bedroom, kitchen–, there are different building intends –dwellings, fabrics, theaters–,etc. Therefore, as in every sort of graphical document, the task of floor plan under-standing entails the extraction of the symbols and their contextual relations in orderto comprehend its meaning.
Indeed, automatic floor plan understanding is a hot topic. On the one hand, ar-chitects tend to re-utilize old not-digitalized designs in order to cut designing costs.Therefore, they usually need to convert manually old drawings into new aiding com-puter tools. This tends to be a tedious task that is expensive in human resources. Onthe other hand, despite their main architectural design purpose, nowadays floor plansare spreading their usability into other different areas. New tools help non-expertusers to virtually create and modify their own house by simply drawing its floor planon an on-line application, such as for instance, Autodesk Homestyler [3] and Floor-planner [4]. These tools can automatically generate the 3D view of a building toget an idea of how it would finally look like. More recently, Google has introducedmore than 10,000 indoor floor plans in Google Maps Indoor to facilitate the mobileuser navigation inside large buildings, usually airports, stations, and malls [5]. Inaddition, state agents with large number of properties may index floor plans by somestructural information extracted from them, as individual room size of each building.This kind of indexing system would be of a great help when customers ask for specificrequirements, like holding a conference or organizing musical shows.
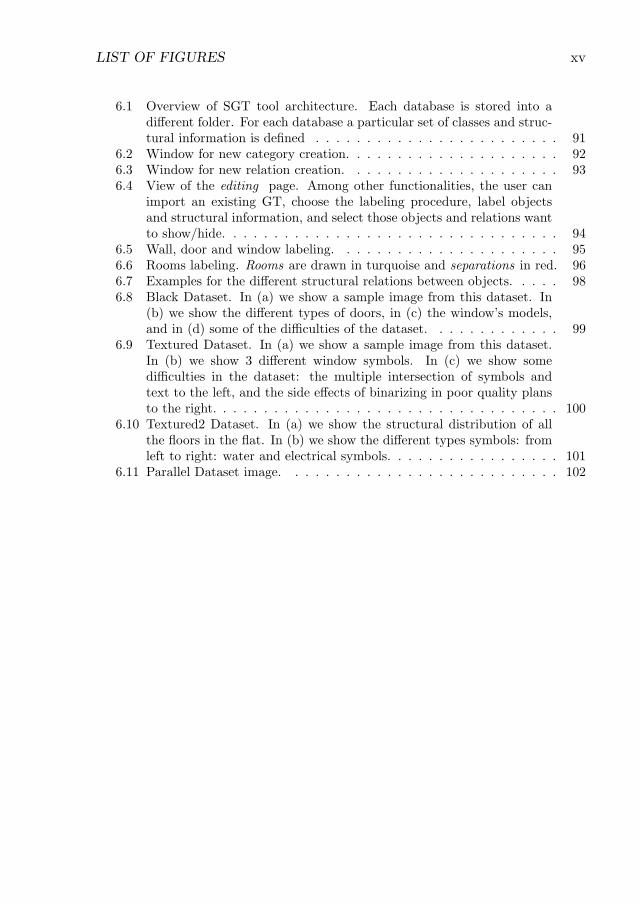
Even though the great effort of the community, automatic floor plan interpreta-tion is far from being solved. Firstly, there is a lack of a standard notation for thedesign of a floor plan1. Thus, they must face a high variability in the visual repre-sentation of a building, as the real examples shown in Fig 1.3. For instance, a wallcan be depicted as a thick line, as a specific textured pattern, or as two thin parallel
1In Germany, a DIN-standard exists (DIN 1356-1), but is rarely used. Furthermore,standards vary from country to country and often even from one architecture company toanother. Depending on the visual appealing, the architects within the same office decide touse different representation.
6 INTRODUCTION
Figure 1.3: Real fl oor plans.
lines, etc.). Secondly, even these documents model the structure of a building, theyintend diff erent functionalities. There are fl oor plans for strict architectural fi nalities,for commercial purposes, for showcasing in design magazines, to show the emergencyexits, etc. All of them contain diff erent sort of information drawn in an appropriatevisual language. Therefore, the problem of fl oor plan interpretation embraces thechallenges of graphical document understanding: be able to deal with a huge variabil-ity in both, visual vocabularies and visual syntaxes, to extract the semantic contentin the documents.
1.2 Objectives and Contributions
The ultimate aim of this thesis is to create a system architecture that is able to learnand understand the semantic content in graphical documents.
To achieve this goal, and following the steps that this process entails, we havedefi ned the three following atomic objectives.
A. To learn and recognize the lexicons. We need to propose methods that areable learn and extract meaningful graphical objects from images. These methodshave to be general enough to automatically adapt to diff erent graphical vocabular-ies and elude the inherent diffi culties of symbol recognition in document images.
B. To learn and recognize the language syntax. We require methods that allowto learn, extract, and analyze the contextual information among the graphicalsymbols. The aim is to end up with a suitable representation that provides theexplanation of the document content making specifi c the structural and semanticrelationships between the extracted symbols.
C. To extract the semantic content. Formally capture the complete meaningconveyed in the documents. To do so, the knowledge in the domain should beknown to analyze and understand the visual representation in the document.
D. To facilitate the learning of a language. Hard coding the huge variability ongraphical languages is unfeasible. Therefore, we need to provide to the computersgeneric tools that grant an automatic learning of the existing visual languages.
1.2. Objectives and Contributions 7
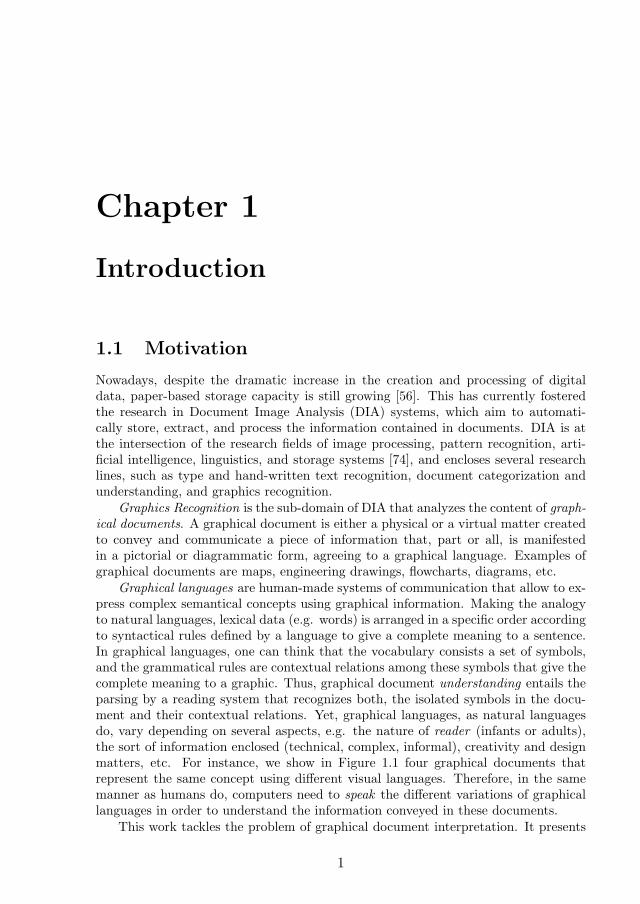
Figure 1.4: System architecture for fl oor plan understanding.
To achieve these objectives, we focused on the real framework of fl oor plan un-derstanding. We have designed the system architecture shown in Figure 1.4 thatcomposed by three main modules aiming at diff erent tasks in the graphical under-standing scenario: Symbol Extraction, Structural Analysis, and Semantic Analysis.This three modules produced 7 contributions separated in 4 chapters:
A. Symbol Extraction.
1. Graphical object detection based on domain specifi c knowledge. Wepresent a methodology for extracting signifi cant graphical content regardlessits notation by combining general knowledge assumptions on the documentdomain. These assumptions are combined fuzzily to generate multiple segmen-tation candidates and select the ones that better characterize the element ofinterest.
2. Graphical object detection based on appearance learning. We proposea patch-based object segmentation method that relies on the automatic con-struction of a visual vocabulary to cluster the appearance of multiple objectclasses. This method just needs a small set of annotated images to work withdiff erent notations.
3. Graphical object detection based on domain specifi c and appearanceknowledge. To overcome the rigidity of 1 and the need of annotated images tolearn new notations of 2, we propose to combine sequentially both approachesto end up robust object detection method. This methods starts by proposingseveral object hypothesis using 1. Subsequently, similarly than in 2, a graph-ical vocabulary is created on the appearance hypothesis and used to spot lostinstances in the fi rst step.
B. Structural and Syntactic Analysis.
8 INTRODUCTION
4. Contextual extraction based on heuristic search. From the symbolsdetected from 1, 2, and 3, we propose to extract the contextual informationembedded in graphical documents by searching heuristically the best alignmentsamong these objects. We have implemented a version of the A* graph traversalalgorithm with a suitable monotonic heuristic to optimize this search. At theend, we construct a structural representation of the document that relates thegraphical objects and their context.
5. Syntactic model for graphical document understanding. We propose agrammar-based model to either represent, learn, and recognize graphical doc-uments. This syntactic model represents the content of documents hierarchi-cally; where complex objects recursively derive into simpler parts that can bestructurally and semantically constrained. Moreover, the probabilistic modelembedded allows to learn those object derivations that are more common froma small set of annotated documents. This probabilistic model guides a bottom-up/top-down parser strategy to end up on the best document representationfor a given instance.
C. Semantic Analysis.
6. Ontology-based knowledge management. Ontologies are widely used tomake machine understandable some sort of knowledge in a certain domain. Inthis stream, we propose the use of ontologies to specifically and formally expressgraphical vocabularies and languages. Our final aim is to allow external agentsto process, learn, and enhance this graphical knowledge. Actually, since oursyntactic representation in 5 naturally transcribes to the ontology taxonomy, wecan iteratively enhance the graphical knowledge based on automatic documentunderstanding.
D. Experimental Framework.
7. Structured database. To conduct and test the mentioned contributions weneeded to create an annotated collection of graphical documents. We havecreated a floor plan database labeled in terms of graphical objects and theircontextual relations. Thus, it allows both, to perform the contextual learningfor the grammar based method in 5 and a natural knowledge transcriptionto the ontology in 6. Furthermore, the lack of available tools to constructthis structural ground-truth has led us to create a new image annotation tool.This is a general-purpose grondtruthing software that allows to define ownobject classes and properties, multiple labeling options are possible, grants thecooperative work, and provides user and version control.
1.3 Organization of the dissertation
The rest of this dissertation is organized in 7 chapters:
� In Chapter 2 we review the state-of-the-art in the domain. We report the re-cent approaches for graphical object recognition, structural interpretation, and
1.3. Organization of the dissertation 9
semantic understanding. Additionally, we look into the most recent proposalsin floor plan understanding, making emphasis in their strong points and lacks.
� In Chapter 3 we propose three different approaches for graphical object detec-tion. All these three strategies are applied for the detection of walls for twomain reasons. Firstly, this element gives crucial information concerning thestructure of a floor plan. Secondly, it suffers a great graphical variability fromplan to plan, which imposes the need of systems that are able to generalize fordifferent graphical vocabularies.
� In Chapter 4 we explain the three different systems for extracting the contex-tual information from graphical documents. We evaluate the suitability of themethodologies for room detection in floor plans. Rooms are white spaces struc-turally composed by walls, doors, windows, and furniture symbols that enclosetheir environment. Hence, discovering the rooms not only entails the detectionof the surrounding symbols, but also the extraction and the analysis of theirstructural and semantic dependencies.
� Chapter 5 is devoted to explain the definition of the domain knowledge: TheFloor Plan Ontology. We show its appropriateness to formally store labeledfloor plans, to validate the interpretations obtained in Chapter 4 according tosome structural and semantic definitions, and to further classify and retrieveinterpretations according to some semantic conceptions.
� In Chapter 6 we present the floor plan database and the groundtruthing tooldesigned to structurally and semantically annotate these documents. We ex-tensively explain the four datasets of real floor plans, which include documentsfor multiple intends and different graphical notations. Hence, this database al-lows us to evaluate our methodologies for different graphical vocabularies andsyntaxes.
� Finally, in Chapter 7 we conclude this dissertation, highlighting the suitabilityof the presented architecture for graphical document understanding. We addi-tionally propose some future research lines to improve the obtained performancein order to construct real applications in the domain.

10 INTRODUCTION
Chapter 2
State-of-the-Art in GraphicalDocument Recognition
2.1 Introduction
DIA tasks in general and GR in particular are born due to the industrial necessitynot only of storing digitalized documents, but also to extract, classify, and indexthem according to the sort of information they convey. This industrial need arosebecause of the emergence of scanners that incremented massively the amount of dig-italized documents to be managed. The research in GR became very popular in the1990’s. The first complex systems for automatic graphical document interpretationappeared in this decade. From the very beginning, GR tasks have been applied in aset of very representative domains such as, electrical diagrams, engineering drawings,mathematical and chemical formulae, maps, and architectural plans.
Even though the initial interest, two main difficulties have hindered the evolutionof fully automatic analysis systems. Firstly, it is not clearly defined how an inter-pretation result must be evaluated, i.e. how to obtain a numerical score out of that.Secondly, most of the existing architectures have tackled the problem under a verydomain specific point of view, abandoning the generality to the benefit of performanceon specific data. This fact has obstructed the re-usability of the existing approaches ondifferent contexts and domains. Hereby, the researchers attracted by other GR tasksthat ease the practical validation and comparison of their contributions, e.g. symbolspotting.
In this chapter, we firstly study the different methods for symbol recognition sinceit is a fundamental step in the graphical document understanding pipeline. Secondly,we review some of the existing the techniques on graphical document understand-ing from a more general perspective, focusing on how the structural approaches andknowledge models participate in this process. Finally, in order to contextualize ourwork, we overview in more detail the recent advances in architectural drawing under-standing. We refer the interested reader on other GR tasks, such as symbol spottingand low-level processing, to [36].
11
12 STATE-OF-THE-ART IN GRAPHICAL DOCUMENT RECOGNITION
2.2 Symbol recognition
Symbol recognition is a mature field of pattern recognition and several surveys andbook chapters address the advances on this area [28,32,36,69]. Symbols are patternscomposed of visual primitives that belong to different classes in a graphical context.Therefore, one of the multiple possible categorization of symbol recognition methodsis following the traditional pattern recognition classification: statistical and structuralmethods:
2.2.1 Statistical symbol recognition
In statistical recognition, each symbol is described as an n-dimensional feature vectorx = (x1, x2, . . . , xn) 2 Rn of n measures. This feature vector is commonly calledsymbol descriptor. The classification of these descriptors entails the partitioningof the n-dimensional feature space into the different categories, one for each symbol.Therefore, the selection of appropriate feature descriptors and classification techniquesare extremely important to maximize the discriminability among symbol classes.
Several surveys and book chapters review the advances on feature descriptors inthe literature [36,106]. The main goal of these description techniques is threefold. Tominimize the distance among symbols of the same class while maximizing it to the restof the classes. To minimize the spatial dimensionality to enhance the classificationefficiency. And to to deal with affine transformations, noise, and distortions of theimage. Some popular techniques involve the adoption or adaption of existing descrip-tors from other mainstream fields in pattern recognition, e.g SIFT [70], SURF [19],and HOG [33]. Yet, sometimes the description of the symbol characteristics requiresof domain specific strategies accounting for these particular features, e.g. geomet-ric moments [41, 59], zoning [43], and histogram-based [104]. Finally, classificationtechniques on statistical recognition methods benefit from the strong mathematicalfoundation of vectorial spaces, i.e. the computation of distances, products, and sumsare well defined. Thus, several efficient algorithms for classification, such as KNN,boosting, SVM, and neural networks have been widely in the literature.
2.2.2 Structural symbol recognition
Structural methods describe the symbols as a set of logically related parts. Theseparts tend to be visual primitives such as lines, vectors, and arcs or combinations ofthem that in a certain context define a specific symbol instance. Then, structural-based description methods are appropriate when the structure itself is a representativeand differentiable feature. Graph representations are suitable tools to describe thestructure of symbols. Nodes tend to be primitives and edges spatial and geometricalrelations among them. For every symbol, a graph modeling its structure is con-structed. Then, the recognition process consists on finding isomorphic substructuresin a graph representation. This matching process tends to be of a big complexity inhigh order structures. Moreover, some representations may be distorted due to the in-stance nature, e.g hand-drawn documents, or because of some artifacts are introducedin previous document transformations, e.g vectorization. Therefore, the current ten-
2.3. Interpretation of graphical documents 13
dency in structural recognition methods is to design high efficiency algorithms thatare able to deal with both, high order and error tolerant graph matching [40, 75]. Inthis stream, it is also noteworthy that graph-embedding techniques based on the com-bination of structural descriptors with statistical classification algorithms aim also atovercoming these problems by taking advantage of the mathematical foundations ofstatistical classification strategies [25,50].
Syntactic methods are also a traditional manner to tackle symbol recognition ina structural manner. A grammatical formalism defines by means of a set of pro-duction rules the structure of the possible symbols. Therefore, the recognition of aninput image entails the parsing of its representation to check whether the languageof the grammar can generate it. The first syntactic approaches defined the struc-ture of symbols in terms of their hierarchy –parts, subparts, etc.–. Obviously, theselimited languages were not sufficient to express the existing variability and complex-ity in symbol structures. Therefore, the language expressiveness has been enhancedby introducing attributes and structural constraints in the rules [24, 45]. Moreover,probabilistic models has been incorporated into the grammatical formulation which,combined with appropriate parsing techniques, are able to deal with inexact recogni-tion scenarios [16].
2.3 Interpretation of graphical documents
As introduced already in the introduction of this thesis, the process of graphicaldocument understanding encompasses the translation of visual vocabularies into ahigher-level conceptualization of the content. This process generally involves the ex-traction of the symbols (vocabulary), its structure (the syntax), and its meaning (thesemantics). Each of these steps forms part of the complete pipeline of interpretation,and sometimes the manner they tackle each respective problem strongly depend onthe domain of the document.
Since we have already seen in the previous section some of the symbol recogni-tion paradigms, here we want to focus on the contextual analysis part, i.e. how theknowledge can be modeled and actually, how it may contribute in the interpretationeither by guiding the contextual analysis or by detecting inconsistencies at the se-mantic level. In [36], the authors classify the graphical interpretation techniques intwo different groups regarding the form of taking advantage of the domain knowledgein the interpretation: bottom-up and knowledge-based strategies.
Bottom-up
Bottom up interpretation, also called ad-hoc interpretation, consists on decomposingthe problem hierarchically. The pipeline of the process is the result of combiningmultiple strategies in a pseudo-sequential order, where the output of one process is theinput of the next. In these approaches, the knowledge of the domain is, in the most ofthe cases, defined on the implementation of the solution. Therefore, this approachestend to focus on a small set of domains and their re-usability on other contextsusually leads to a considerable re-engineering. Some interpretation techniques using
14 STATE-OF-THE-ART IN GRAPHICAL DOCUMENT RECOGNITION
this methodology are [13,39,72,84]. In fact, as we report in the next chapter, the vastmajority of the contributions for architectural drawing understanding are bottom-upmethods.
Knowledge-based
In contrast with bottom up strategies, knowledge-based methods define the contextof the documents with a certain independence to the algorithmic implementation.This fact increases the relevance of the domain knowledge definition while relaxesthe algorithms specificity, i.e. the contextualization of the domain allows to guideand verify the every step involved in the interpretation. Ideally, different knowledgemodels may guide similar implementations in multiple domains. Yet, even if thereexist some proposals in this stream, such as structural, syntactic and ontology-basedanalysis methods [76,79,88], the practical solution for multiple real scenarios seems tobe far. We broadly address the problem of domain definition by the use of syntacticalmethods and ontologies in Chapters 4 and 5 respectively.
2.4 Floor plan analysis
Researchers from document analysis community has already put many efforts to ana-lyze and transfer data from paper or on-line input to digital form, Architectural floorplans are one example of application. The conversion of these diagrams, printed orhand drawn, from paper to digital form usually needs vectorization and documentpreprocessing, while the on-line input needs to manage hand drawn strokes and dis-tortions. The analysis of these diagrams allows the recognition of different structuralelements (doors, windows, walls, etc.), recognition of furniture or decoration (tables,sofas, etc.), generation of corresponding CAD format, 3D reconstruction, or findingthe overall structure and semantic relationship between elements.
The work of Tombre’s group in [12], [38]. and [39] tackle the problem of floor plan3D reconstruction. In these works, they have as input scanned printed plans. First apreprocess separates text and graphics information. In the graphical layer thick andthin lines are separated and vectorized. Walls are detected from thick lines whereasthe rest of the symbols, including doors and windows, are detected from the thin ones.In this process, they consider two kinds of walls: ones represented by parallel thicklines and others by a single thick line. Doors are seek by detecting arcs, windows byfinding small loops, and rooms are composed by even bigger loops. At the end, theycan perform 3D reconstruction of a single level [12], or put in correspondence severalfloors of the same building by finding special symbols as staircases, pipes, and bearingwalls [38]. Either in [38] and [39] it is indicated the need of human feedback whendealing with complex plans. Moreover, the symbol detection strategies implementedare oriented to one specific notation. A hypothetical change of the floor plan drawingstyle might imply the reconsideration of part of the method.
Or et al. in [80] focus on 3D model generation from a 2D plan. Using QGARtools [89], they preprocess the image by separating graphics from text and vectoriz-ing the graphical layer. Subsequently, they manually delete the graphical symbols as
2.4. Floor plan analysis 15
cupboards, sinks, etc. and other lines disturbing the detection of the plan structure.Once the remaining lines belong to walls, doors, and windows, a set of polygons isgenerated using each polyline of the vectorized image. At the end, each polygon rep-resents a particular block; walls are represented by thick lines, windows by rectanglesinside walls, and doors by arcs, which simplify their final detection. This system isable to generate a 3D model of one-story buildings for plans of a predefined notation.Again, the modification of the drawing style leads to the redefinition of the method.
Cherneff in [27] presents a knowledge-based interpretation method for architec-tural drawings: KBIAD. His aim is to extract the structure of the plan; this meanswalls, doors, windows, rooms, and the relations between them. The input is an al-ready vectorized plan with vectors, arcs, and text that is preprocessed to obtain specialsymbols as doors. The system has two models: the semantic and the structural one.The semantic model represents the plan with building components as walls, doors,and windows, and their relations that arrange in composite structures as rooms. Thestructural one represents the geometry of the plan, including two-dimensional spa-tial indexing of primitives. A predefined Drawing Grammar represents the drawingsyntax of a plan describing its symbols and components as a set of primitives andtheir geometrical relationships. The rules have to be general enough to accept allthe variations in a symbol but specific enough to distinguish between symbols. Forexample, they define walls as parallel segments that can have windows or doors atthe end. This fact strongly restricts the interpretation possibilities, since walls in realfloor plans can be curved or even not be modeled by parallel lines.
The work presented by Ryall in [93] focus on segmenting rooms in a building.They propose a semi-automatic method for finding regions in the machine printedfloor plan image, using a proximity metric based on a proximity map. This methodis an extension of the area-filling approach that is able to split rooms when there isa lack of physical separation. Nevertheless, the method retrieves many false positivesgiven by objects that are also drawn by closed boundaries, such as tables, doors, andstaircases. Once more, the method works on a single notation.
Mace in [72] also focused on the extraction of thestructure from scanned plans.As in [12], [38], and [39] a text/graphic separation is done followed by a thin/thickseparation from graphic components. In that way the authors look for walls amongthe set of thick lines. Then, they look for parallel lines extracted from contours,expecting walls to be formed by very thick lines. Afterwards, they find doors andwindows to finally detect rooms based on a recursive decomposition of images untilconvex regions are found. The wall detector strongly depends on the wall notation,and should be re-designed to be able to cope with different floor plans.
Ahmed in [13,14] starts with the classical text/graphics separation to later sepa-rate graphic components into thin, thick lines and, as a novelty, medium lines. Linesforming walls are extracted from thick and medium ones while thin lines are consid-ered forming symbols. Then symbol spotting is applied using SURF to detect doorsand windows and extract the rooms from the plan. At the end, text inside the roomsallows to label each of them. This method is further enhanced by the same authorsin [14] by splitting rooms in as many parts as labels are inside them, just splittingthem vertically or horizontally according to the distribution of their labels. Theseworks take into account some structural and semantic information, as they are label-
16 STATE-OF-THE-ART IN GRAPHICAL DOCUMENT RECOGNITION
ing rooms with their name and are verifying their composition using the position oftheir doors and windows. However, as before, the method might have to be revisitedwhen dealing with floor plans of different graphical conventions.
Some works have as an input a CAD file format that contains the real non-distorted original polylines and lines. This is the case of the work of Lu in [71], where3D reconstruction is performed from CAD floor plans. First they extract paralleloverlapped lines to find T, X, and L shapes. Later they find their connections toconstruct walls and then the 3D reconstruction of the structure. After extracting thestructure, they delete the lines in order to segment graphical symbols as furniture orstairs. Their method bases the recognition on typical features as geometrical ones,attributes of the lines, relational attributes among components, etc. They reconstruct3D building model based on the integration of the recognition results and are specificfor a single CAD file notation.
Also, the work of Zhi et al. in [107] takes as input a CAD file. It extractsautomatically the geometrical and topological information from a 2D architecturaldrawing and transforms it into a building evacuation simulator. Firstly, they semi-automatically filter out redundant information such as furniture, text, specificationnotes, and dimensions, and only keep the essential entities: walls, doors, windows,lifts, etc. Then, they transform the plan into an attributed graph and look for loops,which accordingly to their attributes, are classified into different types: spatial loops(rooms, corridors), physical loops (walls, columns), door loops, window loops, andunidentified loops. Even this procedure is easy to use, it leads to some classificationerrors and further reasoning is needed. Finally, they identify the plan units (compart-ments) and the system is integrated in a model that simulates emergency evacuationsfrom complex buildings.
Works like [18] and [67] analyze hand-sketched floor plans. In [18] a hand-sketchedanalyzer transforms floor plan into a CAD file. They extract the lines that modelthe building structure, which are sketches on a preprinted paper with a grid of linesin drop out color. The method describes line elements, such as walls and windows,and closed region elements, such as doors. On the other hand, [67] uses subgraphisomorphism and Hough transform to recognize different building elements and theirtopological properties. Subgraph isomorphism allows to recognize symbols and Houghtransform to detect walls made by hatched patterns. It is worth to mention that inboth, [18] and [67], the drawing conventions are set beforehand.
Floor plan structural retrieval is one of the recent interests for architects. Theworks of Weber et al. in [15, 101] and Wessel et al. in [102] are two examples in thisdomain. In the case of [101], the query is a sketch drawn on-line by the user. Theirsystem allows the user to sketch a schematic abstraction of floor plan and searchesfor floor plans that are structurally similar. The sketch is translated into a graphenclosing the structure of the plan and it is compared with the graphs representingplans in a repository using subgraph matching algorithms. In [102] the input is apolygon soup representing a 3D plan, so they do not need to vectorize the plan. Fromthis polygon soup, the authors extract the structural polygons of each floor stageby grouping that ones that are parallel to the floor at a determined height. Therest are considered furniture. Then, the rooms, doors, and windows are detectedby cutting the horizontal plane of each floor. Finally, they construct a graph where
2.5. Conclusions 17
attributed nodes are rooms and attributed edges are connections between them: doorsor windows. Based on this connectivity graph, fast and efficient shape retrieval froman architectural database can be achieved.
2.5 Conclusions
In his chapter, we have explained the current issues on graphical document inter-pretation. The vast majority of the methods presented in the literature center theirunderstanding on a small set of document domains. They tend to embed the knowl-edge model in the implementation, abandoning the generality and thus hinderingtheir re-usability in other contexts. Moreover, they are often evaluated on privatedata using self-defined evaluation techniques. Hereby, the progress on systems tofully understand of graphical models has been obstructed in comparison to other GRtasks.
In order to overwhelm these concerns, in this thesis we propose several contribu-tions that aim at generalize at much as possible. Furthermore, all the data, the eval-uation protocols, and the relational models proposed are deeply explain and sharedfreely for research purposes.

18 STATE-OF-THE-ART IN GRAPHICAL DOCUMENT RECOGNITION
Chapter 3
Symbol detection
3.1 Introduction
As mentioned in the introduction of this dissertation, to understand natural languagesentences we need firstly to be able to extract the primitives or tokens, these areletters or words. Then, the analysis of syntax of the sentence leads to its semanticinterpretation. Analogously, to interpret graphical documents we need to extract thegraphical primitives. These primitives are usually formed by simple structures as linesor textures that convey meaningful information regarding structures that are morecomplex. Nevertheless, given the nature of the graphical documents, these primitivesmay vary a lot from document to document, even when they belong to the same topic.
This is the case of floor plans. In these documents walls are considered to bethe main primitive symbol; they conform the structure of the building and conveyinherent information concerning the rest of structural elements, such as doors, win-dows, and rooms. Not coincidentally, most of the state-of-the-art strategies on floorplan interpretation has put their first effort on wall extraction [12,38,39,72,80]. Yet,the nonexistence of a standard graphical notation that produces a large variabilityin walls modeling, see Figure 3.1, has lead the wall detection problem to be a chal-lenging task. In fact, most of traditional strategies have focused only on a reducedrange of similar notations, which in turn, lead to the nonexistence of robust floor planinterpretation systems.
We try to overcome the wall detection problem by proposing three different strate-gies of handling multiple graphical notations. We call our first approach structuralsegmentation. It settles the segmentation on intrinsic attributes of walls: they area repetitive element, naturally distributed within the plan, and commonly modeledby parallel straight lines. Although most of the instances are detected, these struc-tural assumptions are too restrictive and certain instances such as curved walls aremissed. The second strategy, called statistical segmentation, is a patch-based ap-proach that learns, from a small set of annotated images, the graphical notation ofwalls. We propose multiple alternatives regarding the patch topology, description andlearning/classification framework and study their impact in the overall system per-formance. The generality of this approach allows to successfully find other structural
19
20 SYMBOL DETECTION
elements such as doors and windows. Finally, we have additionally pipelined thesetwo approaches to end up with a notation invariant approach that does not needlabeled data to learn the graphical appearance, and it is robust to encounter curvedinstances. We call this method combined segmentation.
In this chapter, we firstly review the preprocessing applied to the images in orderto enhance the performance of the proposed methods. Then, we explain these 3 wallsegmentation approaches and present a contrasted summary of the results on floorplans of different notations.
3.2 Document preprocessing
A good preprocessing transforms the original image into a more suitable input wherethe information of interest remains accurate to the original but is easier to be extractedand manipulated. In floor plans, as it is the case of graphical documents, the differentformats, qualities, and amount and type of the information included forces the analysismethods to be very flexible to deal with this huge variability. Preprocessing techniquesthen are used to relax this input variability and let methods with strict input needsto generalize better.
We propose the use of 4 iterative preprocessing tasks that have been applied onthe images for all the methods presented in this dissertation on symbol detection. Thispreprocessing tasks can be applied iteratively and they are described in the following:
Binarization
Floor plans may contain color for different purposes: as additional information onthe structural arrangement of the objects in the building, i.e. rooms, to highlightsome relevant information in the document, or just for design matters. But floorplans can be also found in gray-scale and binary formats. Therefore, color can notbe considered as a key piece of information to base the subsequent analysis methods.Moreover, floor plans images tend to have a high resolution, which combined withthe RGB information leads to an excessive dimensionality to deal with. Therefore, toomit the color information and reduce the document dimensionality we binarize allthe original images using the Otsu method.
Text/Graphic separation
In real floor plans textual information such as dimensions and annotations might ap-pear or not. It strongly depends on the floor plan type. In the case of documents withcommercial purposes, the functionality and area of each room is frequently written in.In floor plans for construction guidance, textual information is combined with graph-ical symbols to indicate the location and installation of different equipments such asthe electric and the heating. Contrarily, in modern drawings aiming at enhancing thebeauty of the designs, minimalistic information is included and therefore, text hardlyappears. Hence, likewise the color information, text is omitted and filtered out usingthe method proposed by Tombre et al. [97]
3.3. A structural approach for wall segmentation 21
Deskewing
We also tend to assume that a floor plans are correctly oriented, which means thatmost of the lines are perfectly horizontal and vertical. Not coincidentally, there areanalysis methods in the literature [13, 14] that base the detection of some structuralsymbols by just considering the lines in these directions. Nevertheless, the orientationof a floor plan is another fact that strongly depends on the document digitalizationprocedure. We dispose of documents that are slightly disoriented as a result of amiss-placing at scanning time. To solve this issue, we detect and correct possibledeviations in floor plan orientation by adapting the approach for hand-written textdeskewing [81].
Rescaling
Floor plan documents tend to be large images. Therefore, for efficiency issues wedownscale all those images that are of a higher resolution than 4000 � 4000 pixels.We use a bicubic interpolation to minimize the side-effects of this process.
3.3 A structural approach for wall segmentation
Even without being architectural expert, it is easy for humans to identify the wallsin a floor plan. They have graphical characteristics regarding their structural func-tionality. Not by chance, most of the existing wall detection methods have beenfocused on encountering these characteristics to spot walls: straightness [72], orthog-onality [39], saliency [13], etc. Nevertheless, these approaches focused on strict wallfeatures observed in their images, which may not be satisfied in other collections.On the contrary, the underlying idea of our method is to base the segmentation ona flexible combination of 5 structural premises for characterizing walls in a generalmeans, called wall-assumptions:
Wall-assumption 1. Walls are modeled by parallel lines.
Wall-assumption 2. They are rectangular; longer than thicker.
Wall-assumption 3. Walls appear in orthogonal directions.
Wall-assumption 4. Different thickness is used for external and internal walls.
Wall-assumption 5. They appear repetitively and naturally distributed among theplan.
As it is shown in Figure 3.1, this set of wall-assumptions are far from being acollection of unbreakable statements that perfectly define walls in their graphic com-position. For example, there are floor plans with diagonal or curved walls, buildingswith the same thickness for interior and exterior walls, etc. Nevertheless, a relaxedcombination of them enhances the flexibility of the system, leading it to a good finalsegmentation independently of the building or document complexity.
22 SYMBOL DETECTION
(a) (b) (c) (d)
Figure 3.1: Real graphical examples of vertical walls for Dataset Black in(a), Dataset Textured in (b), Dataset Textured2 in (c), and Dataset Parallelin (d). These datasets are introduced in Chapter 6
Figure 3.2: Structural segmentation pipeline.
Figure 3.2 shows the pipeline of our approach. Firstly, the input image is prepro-cessed to fi lter out unnecessary information. After that, the preprocessed documentis transformed into its edge image when it contains black thick walls. Then, using runlength analysis, the parallel lines in the plan are detected and the distances betweenthem are quantized in a histogram. Outstanding values of the histogram correspondto frequent runs likely to defi ne wall segments. Finally, the fi nal wall segmentation isgiven by the combination of wall image candidates according to the wall-assumptionspostulated above.
3.3.1 Black-wall detection
Despite walls are usually drawn by parallel lines with a repetitive graphical pattern,texture, or emptiness between them, there are fl oor plans that include walls graph-ically composed by black thick lines. An example of these sort of models, that wecommonly call black walls, is shown in Figure 3.1a. Since, agreeing to wall-assumption1, we base the structural segmentation on detecting parallel lines, we need to auto-matically identify those fl oor plans with black walls and transform them into a moresuitable input; this is the edge image.
To detect the existence of this type of walls, run lengths over the foreground pixelsin the horizontal and vertical directions are quantized in a histogram. Floor planswith black walls present more sparse frequencies with signifi cant out-layers in high
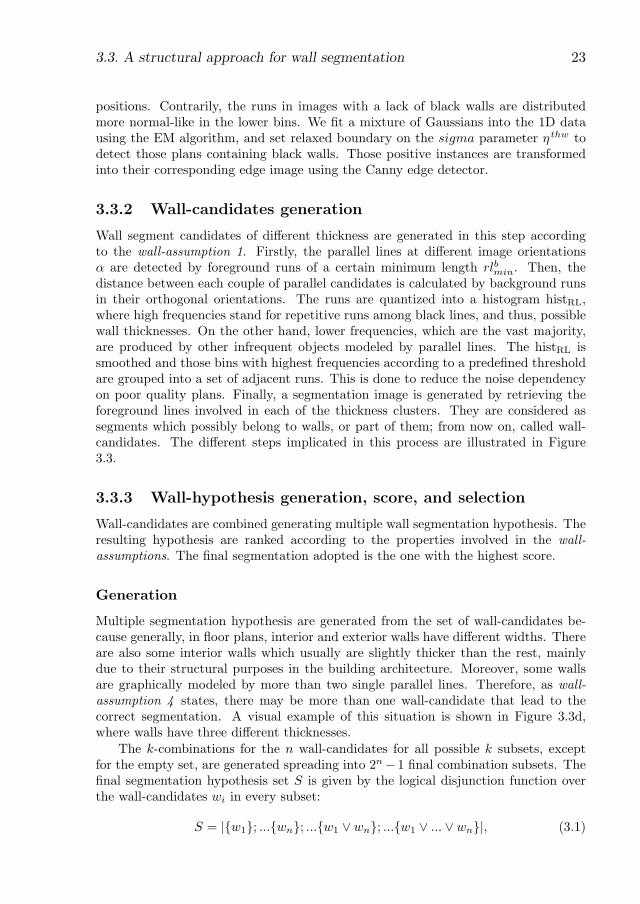
3.3. A structural approach for wall segmentation 23
positions. Contrarily, the runs in images with a lack of black walls are distributedmore normal-like in the lower bins. We fit a mixture of Gaussians into the 1D datausing the EM algorithm, and set relaxed boundary on the sigma parameter σthw todetect those plans containing black walls. Those positive instances are transformedinto their corresponding edge image using the Canny edge detector.
3.3.2 Wall-candidates generation
Wall segment candidates of different thickness are generated in this step accordingto the wall-assumption 1. Firstly, the parallel lines at different image orientationsα are detected by foreground runs of a certain minimum length rlbmin. Then, thedistance between each couple of parallel candidates is calculated by background runsin their orthogonal orientations. The runs are quantized into a histogram histRL,where high frequencies stand for repetitive runs among black lines, and thus, possiblewall thicknesses. On the other hand, lower frequencies, which are the vast majority,are produced by other infrequent objects modeled by parallel lines. The histRL issmoothed and those bins with highest frequencies according to a predefined thresholdare grouped into a set of adjacent runs. This is done to reduce the noise dependencyon poor quality plans. Finally, a segmentation image is generated by retrieving theforeground lines involved in each of the thickness clusters. They are considered assegments which possibly belong to walls, or part of them; from now on, called wall-candidates. The different steps implicated in this process are illustrated in Figure3.3.
3.3.3 Wall-hypothesis generation, score, and selection
Wall-candidates are combined generating multiple wall segmentation hypothesis. Theresulting hypothesis are ranked according to the properties involved in the wall-assumptions. The final segmentation adopted is the one with the highest score.
Generation
Multiple segmentation hypothesis are generated from the set of wall-candidates be-cause generally, in floor plans, interior and exterior walls have different widths. Thereare also some interior walls which usually are slightly thicker than the rest, mainlydue to their structural purposes in the building architecture. Moreover, some wallsare graphically modeled by more than two single parallel lines. Therefore, as wall-assumption 4 states, there may be more than one wall-candidate that lead to thecorrect segmentation. A visual example of this situation is shown in Figure 3.3d,where walls have three different thicknesses.
The k-combinations for the n wall-candidates for all possible k subsets, exceptfor the empty set, are generated spreading into 2n� 1 final combination subsets. Thefinal segmentation hypothesis set S is given by the logical disjunction function overthe wall-candidates wi in every subset:
S = jfw1g; ...fwng; ...fw1 _ wng; ...fw1 _ ... _ wngj, (3.1)
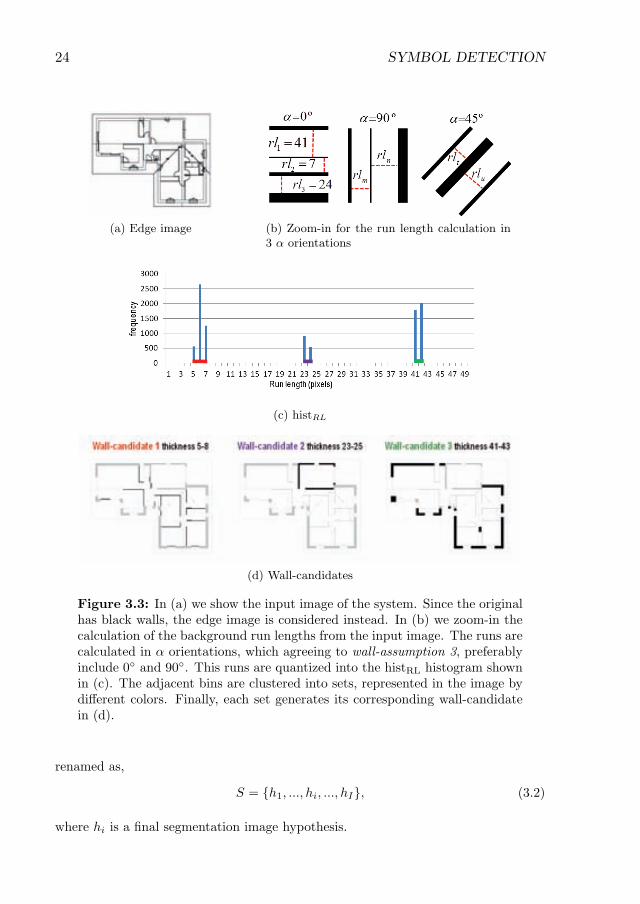
24 SYMBOL DETECTION
(a) Edge image (b) Zoom-in for the run length calculation in3 α orientations
(c) histRL
(d) Wall-candidates
Figure 3.3: In (a) we show the input image of the system. Since the originalhas black walls, the edge image is considered instead. In (b) we zoom-in thecalculation of the background run lengths from the input image. The runs arecalculated in α orientations, which agreeing to wall-assumption 3, preferablyinclude 0 ◦ and 90 ◦ . This runs are quantized into the histRL histogram shownin (c). The adjacent bins are clustered into sets, represented in the image bydiff erent colors. Finally, each set generates its corresponding wall-candidatein (d).
renamed as,
S = { h1 , . . . , hi , . . . , hI } , (3.2)
where hi is a fi nal segmentation image hypothesis.
3.3. A structural approach for wall segmentation 25
Score
For each one of the final segmentation hypothesis in S, four different normalizedattribute scores are calculated to account their agreement to the wall-assumptions:
� SH is frequency in histRL for those thickness involved in each the segmentationhypothesis:
SHhi = histRL(hi). (3.3)
SH benefits those hypothesis formed by several wall-candidates –segmentationswith multiple thickness–, which agrees with wall-assumption 4.
� CC: is the summation of the number of individual connected components ineach wall-candidate involved in the segmentation hypothesis:
CChi = #cc(hi), (3.4)
where #cc(hi) is the number of connected components in the hypothesis hi.This attribute score avails segmentations with multiple components, whichagrees with wall-assumption 5 when mentioning that walls should appear repet-itively.
� AR states for the mean longness aspect ratio (longitude / thickness) of theconnected components in each of the wall-candidates:
ARhi = long(ccj(hi))/thick(ccj(hi)), 8jjccj 2 hi. (3.5)
According wall-assumption 2, walls are longer than thicker, and then, longeraspect ratios are favored in the final segmentation.
� Di�D accounts on the difference of black pixel distribution between the inputimage and each of the segmentation hypothesis. This difference is calculatedlocally for the regions r from a rectangular grid placed on both images:
DiffDhi =
r∑n=1
r∑m=1
pnm � pinm, (3.6)
where pmn and pimn are the percentage of the black pixels in the mnth region ofthe original image and hi respectively. DiffD enforces segmentations distributedsimilarly to the input image throughout the plan, agreeing with wall-assumption5 in terms of walls location, and allows to filter dispersedly located elements.
Selection
Finally, to determine which segmentation hypothesis agrees better to the wall-assumtions,we calculate their global score as:
W (hi) = SHhi +CChi +ARhi +DiffDhi . (3.7)
That segmentation hypothesis with the higher score will be taken as the final wallsegmentation for the given input image.
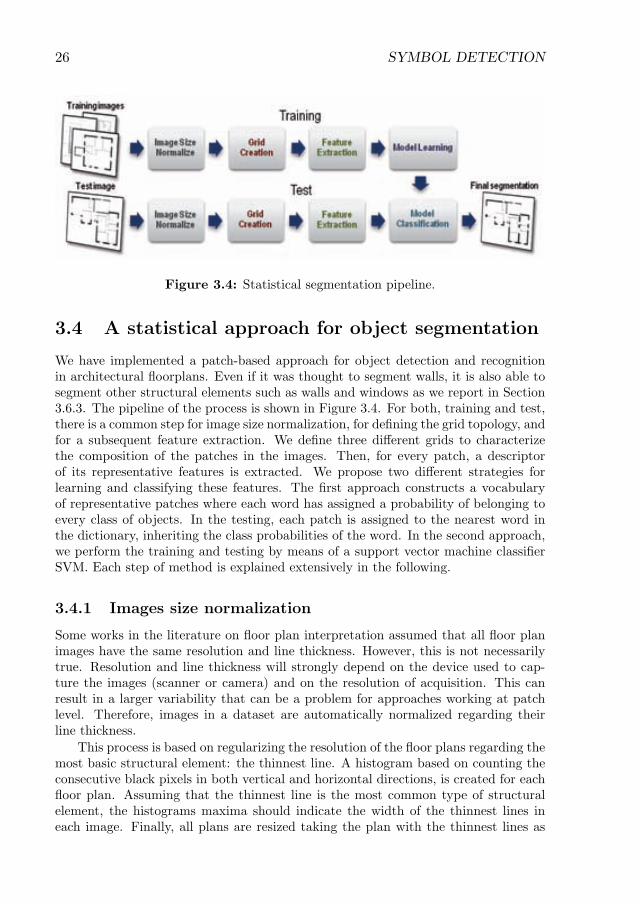
26 SYMBOL DETECTION
Figure 3.4: Statistical segmentation pipeline.
3.4 A statistical approach for object segmentation
We have implemented a patch-based approach for object detection and recognitionin architectural fl oorplans. Even if it was thought to segment walls, it is also able tosegment other structural elements such as walls and windows as we report in Section3.6.3. The pipeline of the process is shown in Figure 3.4. For both, training and test,there is a common step for image size normalization, for defi ning the grid topology, andfor a subsequent feature extraction. We defi ne three diff erent grids to characterizethe composition of the patches in the images. Then, for every patch, a descriptorof its representative features is extracted. We propose two diff erent strategies forlearning and classifying these features. The fi rst approach constructs a vocabularyof representative patches where each word has assigned a probability of belonging toevery class of objects. In the testing, each patch is assigned to the nearest word inthe dictionary, inheriting the class probabilities of the word. In the second approach,we perform the training and testing by means of a support vector machine classifi erSVM. Each step of method is explained extensively in the following.
3.4.1 Images size normalization
Some works in the literature on fl oor plan interpretation assumed that all fl oor planimages have the same resolution and line thickness. However, this is not necessarilytrue. Resolution and line thickness will strongly depend on the device used to cap-ture the images (scanner or camera) and on the resolution of acquisition. This canresult in a larger variability that can be a problem for approaches working at patchlevel. Therefore, images in a dataset are automatically normalized regarding theirline thickness.
This process is based on regularizing the resolution of the fl oor plans regarding themost basic structural element: the thinnest line. A histogram based on counting theconsecutive black pixels in both vertical and horizontal directions, is created for eachfl oor plan. Assuming that the thinnest line is the most common type of structuralelement, the histograms maxima should indicate the width of the thinnest lines ineach image. Finally, all plans are resized taking the plan with the thinnest lines as
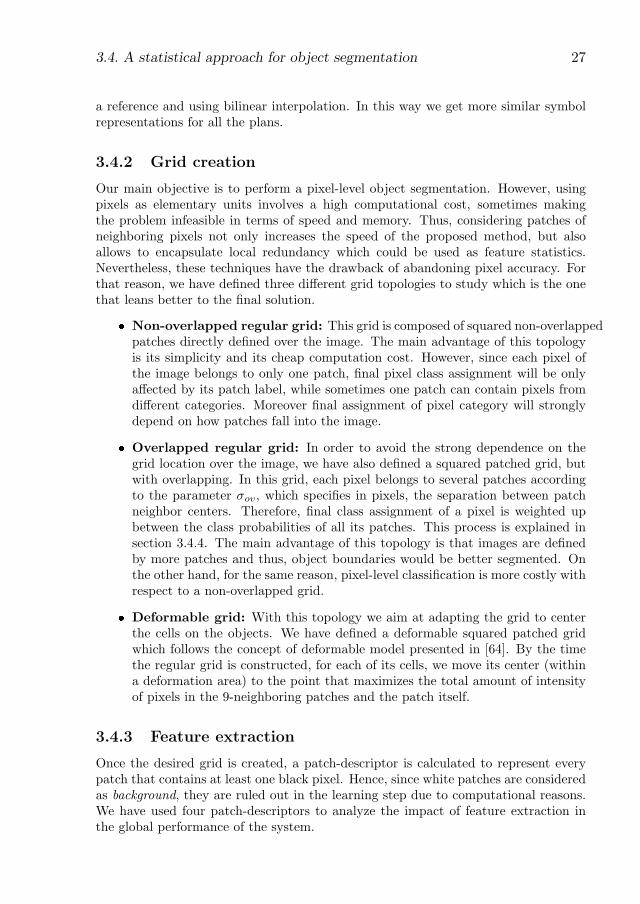
3.4. A statistical approach for object segmentation 27
a reference and using bilinear interpolation. In this way we get more similar symbolrepresentations for all the plans.
3.4.2 Grid creation
Our main objective is to perform a pixel-level object segmentation. However, usingpixels as elementary units involves a high computational cost, sometimes makingthe problem infeasible in terms of speed and memory. Thus, considering patches ofneighboring pixels not only increases the speed of the proposed method, but alsoallows to encapsulate local redundancy which could be used as feature statistics.Nevertheless, these techniques have the drawback of abandoning pixel accuracy. Forthat reason, we have defined three different grid topologies to study which is the onethat leans better to the final solution.
� Non-overlapped regular grid: This grid is composed of squared non-overlappedpatches directly defined over the image. The main advantage of this topologyis its simplicity and its cheap computation cost. However, since each pixel ofthe image belongs to only one patch, final pixel class assignment will be onlyaffected by its patch label, while sometimes one patch can contain pixels fromdifferent categories. Moreover final assignment of pixel category will stronglydepend on how patches fall into the image.
� Overlapped regular grid: In order to avoid the strong dependence on thegrid location over the image, we have also defined a squared patched grid, butwith overlapping. In this grid, each pixel belongs to several patches accordingto the parameter ϕov, which specifies in pixels, the separation between patchneighbor centers. Therefore, final class assignment of a pixel is weighted upbetween the class probabilities of all its patches. This process is explained insection 3.4.4. The main advantage of this topology is that images are definedby more patches and thus, object boundaries would be better segmented. Onthe other hand, for the same reason, pixel-level classification is more costly withrespect to a non-overlapped grid.
� Deformable grid: With this topology we aim at adapting the grid to centerthe cells on the objects. We have defined a deformable squared patched gridwhich follows the concept of deformable model presented in [64]. By the timethe regular grid is constructed, for each of its cells, we move its center (withina deformation area) to the point that maximizes the total amount of intensityof pixels in the 9-neighboring patches and the patch itself.
3.4.3 Feature extraction
Once the desired grid is created, a patch-descriptor is calculated to represent everypatch that contains at least one black pixel. Hence, since white patches are consideredas background, they are ruled out in the learning step due to computational reasons.We have used four patch-descriptors to analyze the impact of feature extraction inthe global performance of the system.
28 SYMBOL DETECTION
� Pixel Intensity Descriptor: called PID for ease, is a simple descriptor formedby concatenating the raw pixels of the patch in a row-wise manner.
� Principal Component Analysis: PCA is calculated over the row-wise vec-tors of all patches. The 95% of the discriminative information of the patches ismaintained meanwhile the dimensionality is highly reduced.
� Blurred Shape Model: BSM is a shape descriptor introduced by Escalera etal. in [43] that has been successfully applied to different graphics recognitionapplications. The patch is divided in n � n equal-sized subregions (BSMreg)where each subregion receives votes from the points in it, and also from thepoints in the neighboring subregions. Each point contributes with a weightaccording to the distance between the point and the subregion centroid. Thefinal description is a vector formed by concatenating the number of weightedvotes received by each subregion.
� SIFT, Scale Invariant Feature Transform: is a descriptor presented byLowe in [70] that describes an image patch as the accumulation of the localgradient orientations. It is invariant to rotations and scaling transformations,and has been used in multiple domains in computer vision such as object recog-nition [47], biometrics [21], and robotics [96].
3.4.4 Model learning and classi�cation
Up to now the training and the test images are described by means of patch-descriptors.We propose two different strategies to learn these descriptors and classify them intoobject classes. The first approach trains and classifies using SVM whereas the secondmethod is bag-of-words model. In both methods, the output labels for the patch-descriptors are combined to obtain the final classification at pixel-level.
Support-vector machine approach
We use the SVM implementation of LIBSVM [26]. N patch-descriptors for each objectclass C are selected randomly to train the classifier. We use a Radial Basis Functionkernel (RBF) defined as:
K(pdi, pdj) = e− ∥pdi−pdj∥2
, (3.8)
where pdi and pdj are patch-descriptors and γ 2 R+ is the RBF width parameterselected by cross-validation.
At testing time, each patch-descriptor is classified by the SVM outputting theprobability estimates for each one of the object classes.
Bag-of-patches approach
In the learning phase we cluster all the labeled patch-descriptors from the learning-set into a vocabulary of K representative words. We use the fast version of K-Meansproposed in [42]. Then, the probability for each word of belonging to each objectclass is calculated. Every patch-descriptor pd, which has ground-truth label to the
3.5. Combining the structural and statistical methods for wall segmentation29
class ci 2 C = fc1, ..., cN ,Backgroundg, is assigned to its closest word in the dictionarywj . Then, the conditional probability for a word of belonging to each object class isgiven by:
p(cijwj) =#(pdwj , ci)
#pdwj
, 8i, j. (3.9)
Where #(pdwj , ci) states for the number of patch descriptors with the label ci assignedto codeword wj , and #pdwj is the total number of patch-descriptors assigned to wj .The summation of the probabilities of a codeword for all the classes is one:
M+1∑i=1
p(cijwj) = 1, 8j. (3.10)
The classification phase is performed by a Nearest Neighbor (NN) classifier in theEuclidean space. Each patch-descriptor is hard-assigned to the closest word in thevocabulary inheriting its class probabilities.
Final pixel assignation
The two classification strategies explicated above output the object class probabilitiesfor descriptors in the test images. Nevertheless, since we desire a pixel-level segmen-tation, the final pixel assignation would depend on the grid topology used at testingtime.
In the case a non-overlapped grid, one pixel px just belong to one patch andtherefore, the final pixel categorization is straightforward:
c(px) = argmaxi
(p(cijpd)). (3.11)
On the other hand, in deformable and overlapped grids pixels may be containedin several patches. Since every patch has its own probability of belonging to everyclass, pixels would acquire a definite number of classification probabilities per objectcategory. This issue can be seen as a combination of classifiers problem, where dif-ferent classification results are obtained for a single pixel. We adapt the Mean Rulepresented in the theoretical framework for combining classifiers of Kittler et al. [65]to obtain the final pixel classification:
c(px) = argmaxi
mean(P (cijpd)),8pd j px 2 pd. (3.12)
3.5 Combining the structural and statistical meth-ods for wall segmentation
As a third contribution for wall segmentation in floor plans, we propose an approachthat is able to overtake the singular drawbacks for both methods presented above,while maintaining their graphical notation invariability. On the one side, this newmethod is not limited to detect straight objects as the structural-based approach is,but is able segment curved and squared instances. On the other side, contrarily to
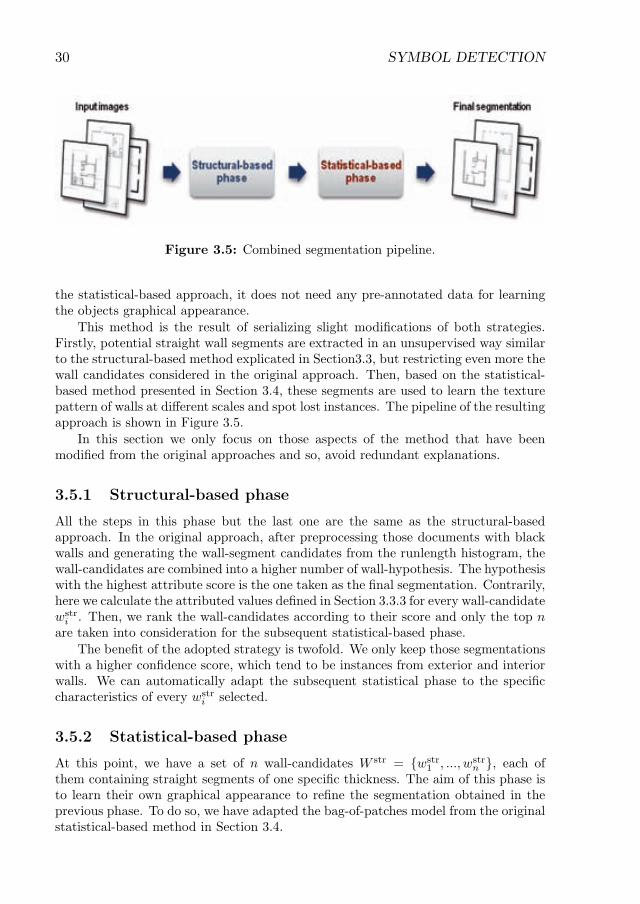
30 SYMBOL DETECTION
Figure 3.5: Combined segmentation pipeline.
the statistical-based approach, it does not need any pre-annotated data for learningthe objects graphical appearance.
This method is the result of serializing slight modifi cations of both strategies.Firstly, potential straight wall segments are extracted in an unsupervised way similarto the structural-based method explicated in Section3.3, but restricting even more thewall candidates considered in the original approach. Then, based on the statistical-based method presented in Section 3.4, these segments are used to learn the texturepattern of walls at diff erent scales and spot lost instances. The pipeline of the resultingapproach is shown in Figure 3.5.
In this section we only focus on those aspects of the method that have beenmodifi ed from the original approaches and so, avoid redundant explanations.
3.5.1 Structural-based phase
All the steps in this phase but the last one are the same as the structural-basedapproach. In the original approach, after preprocessing those documents with blackwalls and generating the wall-segment candidates from the runlength histogram, thewall-candidates are combined into a higher number of wall-hypothesis. The hypothesiswith the highest attribute score is the one taken as the fi nal segmentation. Contrarily,here we calculate the attributed values defi ned in Section 3.3.3 for every wall-candidatewstr
i . Then, we rank the wall-candidates according to their score and only the top nare taken into consideration for the subsequent statistical-based phase.
The benefi t of the adopted strategy is twofold. We only keep those segmentationswith a higher confi dence score, which tend to be instances from exterior and interiorwalls. We can automatically adapt the subsequent statistical phase to the specifi ccharacteristics of every wstr
i selected.
3.5.2 Statistical-based phase
At this point, we have a set of n wall-candidates W str = { wstr1 , . . . , wstr
n } , each ofthem containing straight segments of one specifi c thickness. The aim of this phase isto learn their own graphical appearance to refi ne the segmentation obtained in theprevious phase. To do so, we have adapted the bag-of-patches model from the originalstatistical-based method in Section 3.4.
3.6. Experimental evaluation 31
To obtain the statistical segmentation we perform the following process of learn-ing and classification n times; one for each wstr
i 2 W str. For ease, let us consider wewant to obtain the statistical segmentation associated to wstr
i . We start by splittingthe input images into squared and overlapped patches of size sstrwi
, which is stronglyrelated to the thickness of the segments in wstr
i . This procedure is repeated for theimage rotations 45◦, 90◦ and 135◦ with two purposes: to get more learning instancesand to achieve rotation-invariableness. Patches falling into segmented regions in wstr
i
are labeled as positive examples c = fWallg whereas the rest are labeled as negativec = fBackgroundg instances. Completely white patches are filtered out. The imagedescriptor selected to describe the patches is the BSM [43]. Then, following the samestrategy as in Section 3.5.2, an equal number p of positive and negative patch de-scriptors are clustered into a vocabulary of K visual words . Finally, the classificationstep is performed in the same manner as the bag-of-patches classification in Section3.5.2, producing an output segmentation called wstat
i .
3.5.3 Combining both segmentations
In the end, we need to combine the n wall segments obtained in the structural phaseand their corresponding segments extracted in statistical phase. Therefore, the finalsegmentation is obtained from the binary sum of all these segmentations:
W =n∑
i=1
wstri + wstat
i (3.13)
3.6 Experimental evaluation
In this section, we evaluate the methods for graphical object detection presented inthis chapter in Sections 3.3, 3.4, and 3.5. The evaluation and comparison among the3 strategies is pursued for wall detection, as walls are the main structural element infloor plans and they suffer a substantial variability from plan to plan. Yet, to demon-strate the graphical adaptability of the statistical approach, we also present somequalitative results on door and window detection. Therefore, we start by explainingthe assessment protocol defined for object detection. Then we evaluate the 3 meth-ods on the database explained in Chapter 6 taking special attention to their differentconfigurations and parameter influences. And we finally compare quantitatively andqualitatively these strategies.
3.6.1 Wall evaluation protocol
The evaluation protocol proposed for wall detection works at pixel level. It is calcu-lated over the three images that the system handle for every floor plan: the result oroutput image, the ground-truth image, that contains the labeled pixels for the differ-ent classes, and the original image. The use of the original image is justified becausewe only consider in the score those pixels that are black in the original-image, sinceonly black pixels convey relevant information for segmentation.
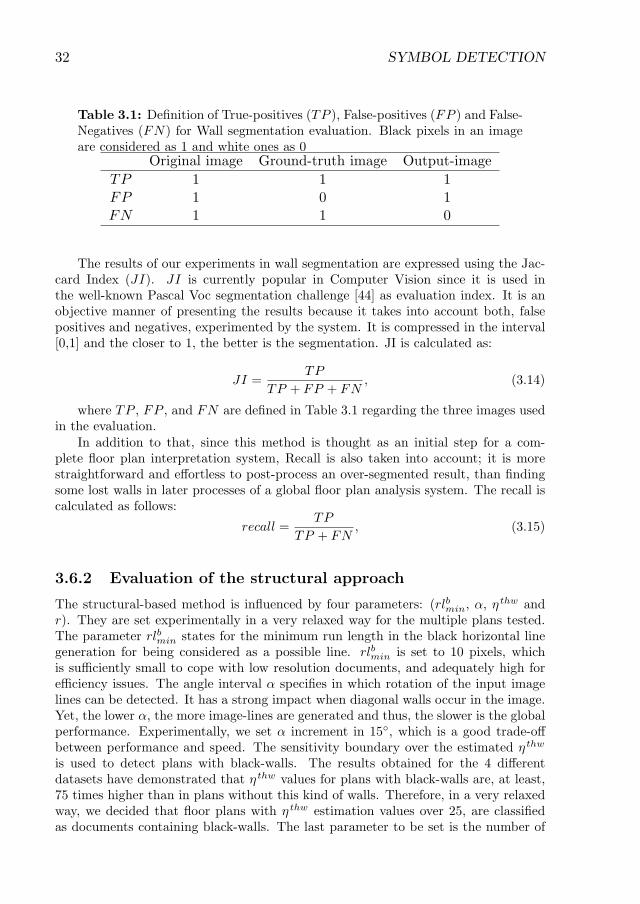
32 SYMBOL DETECTION
Table 3.1: Definition of True-positives (TP ), False-positives (FP ) and False-Negatives (FN) for Wall segmentation evaluation. Black pixels in an imageare considered as 1 and white ones as 0
Original image Ground-truth image Output-image
TP 1 1 1FP 1 0 1FN 1 1 0
The results of our experiments in wall segmentation are expressed using the Jac-card Index (JI). JI is currently popular in Computer Vision since it is used inthe well-known Pascal Voc segmentation challenge [44] as evaluation index. It is anobjective manner of presenting the results because it takes into account both, falsepositives and negatives, experimented by the system. It is compressed in the interval[0,1] and the closer to 1, the better is the segmentation. JI is calculated as:
JI =TP
TP + FP + FN, (3.14)
where TP , FP , and FN are defined in Table 3.1 regarding the three images usedin the evaluation.
In addition to that, since this method is thought as an initial step for a com-plete floor plan interpretation system, Recall is also taken into account; it is morestraightforward and effortless to post-process an over-segmented result, than findingsome lost walls in later processes of a global floor plan analysis system. The recall iscalculated as follows:
recall =TP
TP + FN, (3.15)
3.6.2 Evaluation of the structural approach
The structural-based method is influenced by four parameters: (rlbmin, α, σthw and
r). They are set experimentally in a very relaxed way for the multiple plans tested.The parameter rlbmin states for the minimum run length in the black horizontal linegeneration for being considered as a possible line. rlbmin is set to 10 pixels, whichis sufficiently small to cope with low resolution documents, and adequately high forefficiency issues. The angle interval α specifies in which rotation of the input imagelines can be detected. It has a strong impact when diagonal walls occur in the image.Yet, the lower α, the more image-lines are generated and thus, the slower is the globalperformance. Experimentally, we set α increment in 15◦, which is a good trade-offbetween performance and speed. The sensitivity boundary over the estimated σthw
is used to detect plans with black-walls. The results obtained for the 4 differentdatasets have demonstrated that σthw values for plans with black-walls are, at least,75 times higher than in plans without this kind of walls. Therefore, in a very relaxedway, we decided that floor plans with σthw estimation values over 25, are classifiedas documents containing black-walls. The last parameter to be set is the number of
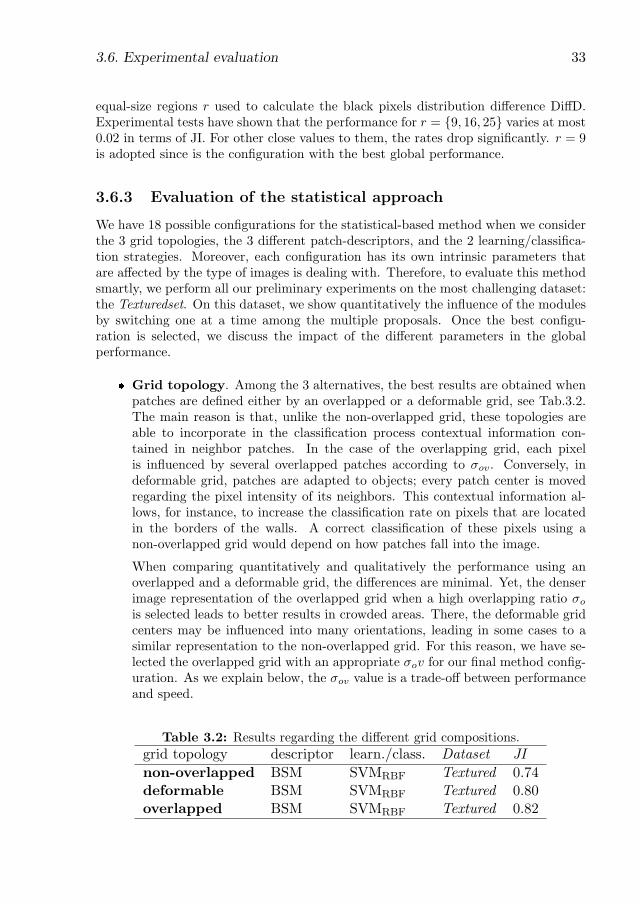
3.6. Experimental evaluation 33
equal-size regions r used to calculate the black pixels distribution difference DiffD.Experimental tests have shown that the performance for r = f9, 16, 25g varies at most0.02 in terms of JI. For other close values to them, the rates drop significantly. r = 9is adopted since is the configuration with the best global performance.
3.6.3 Evaluation of the statistical approach
We have 18 possible configurations for the statistical-based method when we considerthe 3 grid topologies, the 3 different patch-descriptors, and the 2 learning/classifica-tion strategies. Moreover, each configuration has its own intrinsic parameters thatare affected by the type of images is dealing with. Therefore, to evaluate this methodsmartly, we perform all our preliminary experiments on the most challenging dataset:the Texturedset. On this dataset, we show quantitatively the influence of the modulesby switching one at a time among the multiple proposals. Once the best configu-ration is selected, we discuss the impact of the different parameters in the globalperformance.
� Grid topology. Among the 3 alternatives, the best results are obtained whenpatches are defined either by an overlapped or a deformable grid, see Tab.3.2.The main reason is that, unlike the non-overlapped grid, these topologies areable to incorporate in the classification process contextual information con-tained in neighbor patches. In the case of the overlapping grid, each pixelis influenced by several overlapped patches according to ϕov. Conversely, indeformable grid, patches are adapted to objects; every patch center is movedregarding the pixel intensity of its neighbors. This contextual information al-lows, for instance, to increase the classification rate on pixels that are locatedin the borders of the walls. A correct classification of these pixels using anon-overlapped grid would depend on how patches fall into the image.
When comparing quantitatively and qualitatively the performance using anoverlapped and a deformable grid, the differences are minimal. Yet, the denserimage representation of the overlapped grid when a high overlapping ratio ϕo
is selected leads to better results in crowded areas. There, the deformable gridcenters may be influenced into many orientations, leading in some cases to asimilar representation to the non-overlapped grid. For this reason, we have se-lected the overlapped grid with an appropriate ϕov for our final method config-uration. As we explain below, the ϕov value is a trade-off between performanceand speed.
Table 3.2: Results regarding the different grid compositions.
grid topology descriptor learn./class. Dataset JI
non-overlapped BSM SVMRBF Textured 0.74deformable BSM SVMRBF Textured 0.80overlapped BSM SVMRBF Textured 0.82
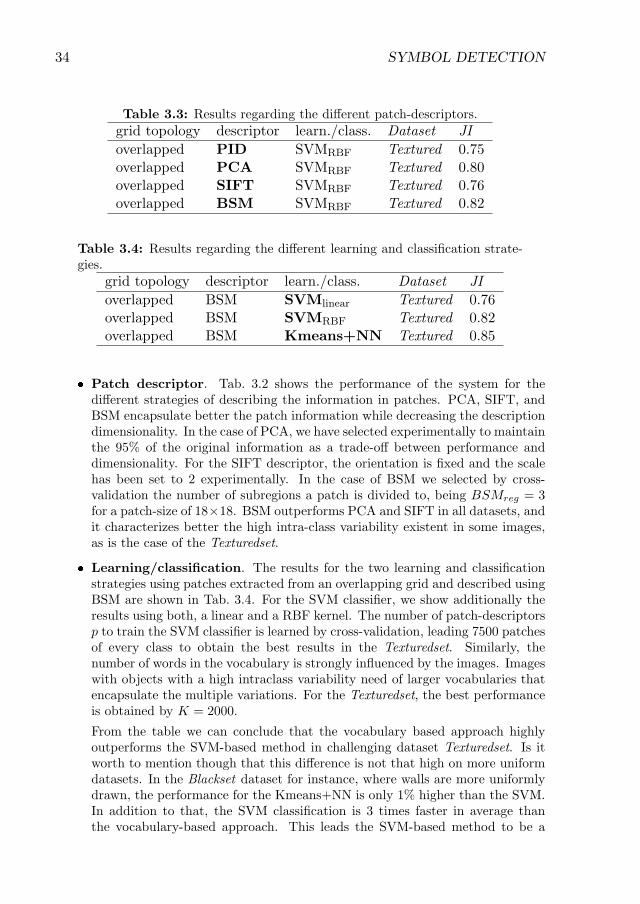
34 SYMBOL DETECTION
Table 3.3: Results regarding the different patch-descriptors.
grid topology descriptor learn./class. Dataset JI
overlapped PID SVMRBF Textured 0.75overlapped PCA SVMRBF Textured 0.80overlapped SIFT SVMRBF Textured 0.76overlapped BSM SVMRBF Textured 0.82
Table 3.4: Results regarding the different learning and classification strate-gies.
grid topology descriptor learn./class. Dataset JI
overlapped BSM SVMlinear Textured 0.76overlapped BSM SVMRBF Textured 0.82overlapped BSM Kmeans+NN Textured 0.85
� Patch descriptor. Tab. 3.2 shows the performance of the system for thedifferent strategies of describing the information in patches. PCA, SIFT, andBSM encapsulate better the patch information while decreasing the descriptiondimensionality. In the case of PCA, we have selected experimentally to maintainthe 95% of the original information as a trade-off between performance anddimensionality. For the SIFT descriptor, the orientation is fixed and the scalehas been set to 2 experimentally. In the case of BSM we selected by cross-validation the number of subregions a patch is divided to, being BSMreg = 3for a patch-size of 18�18. BSM outperforms PCA and SIFT in all datasets, andit characterizes better the high intra-class variability existent in some images,as is the case of the Texturedset.
� Learning/classi�cation. The results for the two learning and classificationstrategies using patches extracted from an overlapping grid and described usingBSM are shown in Tab. 3.4. For the SVM classifier, we show additionally theresults using both, a linear and a RBF kernel. The number of patch-descriptorsp to train the SVM classifier is learned by cross-validation, leading 7500 patchesof every class to obtain the best results in the Texturedset. Similarly, thenumber of words in the vocabulary is strongly influenced by the images. Imageswith objects with a high intraclass variability need of larger vocabularies thatencapsulate the multiple variations. For the Texturedset, the best performanceis obtained by K = 2000.
From the table we can conclude that the vocabulary based approach highlyoutperforms the SVM-based method in challenging dataset Texturedset. Is itworth to mention though that this difference is not that high on more uniformdatasets. In the Blackset dataset for instance, where walls are more uniformlydrawn, the performance for the Kmeans+NN is only 1% higher than the SVM.In addition to that, the SVM classification is 3 times faster in average thanthe vocabulary-based approach. This leads the SVM-based method to be a
3.6. Experimental evaluation 35
Table 3.5: Results regarding the normalization of the images in terms of linethickness.grid topology descriptor learn./class. Dataset JI
overlapped BSM SVMRBF Texdtured 0.82overlapped BSM SVMRBF TexdturedNORM 0.83overlapped BSM KMeans+NN Texdtured 0.85overlapped BSM KMeans+NN TexdturedNORM 0.86
plausible option in easy images.
� Image normalization. To conclude the study on how the different mod-ules affect the global behavior of the method, we would also like to show theresults comparison when the images of Texturedset dataset are normalized asexplained in Section 3.4.1 or not. Table 3.5 shows the results, making clear thatthe preprocess of the images in terms of line thickness has a positive impactindependently on the learning/classification strategy.
Finally, once we have selected the configuration that leads to the best results onthe Texturedset, it is time to explain how we have set its intrinsic parameters andwhich impact they have in the overall method behavior.
The system is only influenced by 3 parameters, the patch-size, the overlapping-factor ϕ, and the size of the vocabulary, all 3 learned in validation time. ForBlackset, 30 images are used for validation following a 5-fold strategy, while the 60remaining are used for testing, with a 10-fold strategy. This procedure is repeated byexchanging some of the validation images for testing ones until all the 90 images inthe dataset are tested. Similarly, the parameter validation in Texturedset2 has beenperformed using 6 images following a Leave-One-Out strategy. The rest are usedfor learning and testing using a 3-fold procedure. On the other hand, regarding theTexturedset and Parallelset, due to the low number of instances, all of the images areused at once for parameter validation and testing following a Leave-One-Out strategy.
When we analyze the influence of the parameters in the different datasets it turnsout that three aspects require the addition of more context to the final classification:a low resolution, a big intraclass variability, and a hight similarity with other floorplan elements. These are the cases of Texturedset, Texturedset2, and Parallelset re-spectively, in which bigger patches and more overlapped among them are used to dealwith their respective problems. Moreover, a bigger vocabulary is needed to representaccurately the different textures existing for modeling exterior and interior walls inthe Texturedset. In contrast, in Blackset a small vocabulary constructed from smallpatches is able to cope with the regularity of the black walls contained in this dataset.In Table 3.6, the parameters used in each dataset are shown numerically.
Additionally, we want to show the suitability of this method to also detect doorsand windows. In quantitative terms, the method is able to detect up to the 91% ofthe windows in the Blackset and the 60% in the Texturedset. Regarding the doors, themethod detects the 71% of the doors in the Blackset and the 63% in the Texturedset.We show qualitatively this performance for door and window detection on one instance
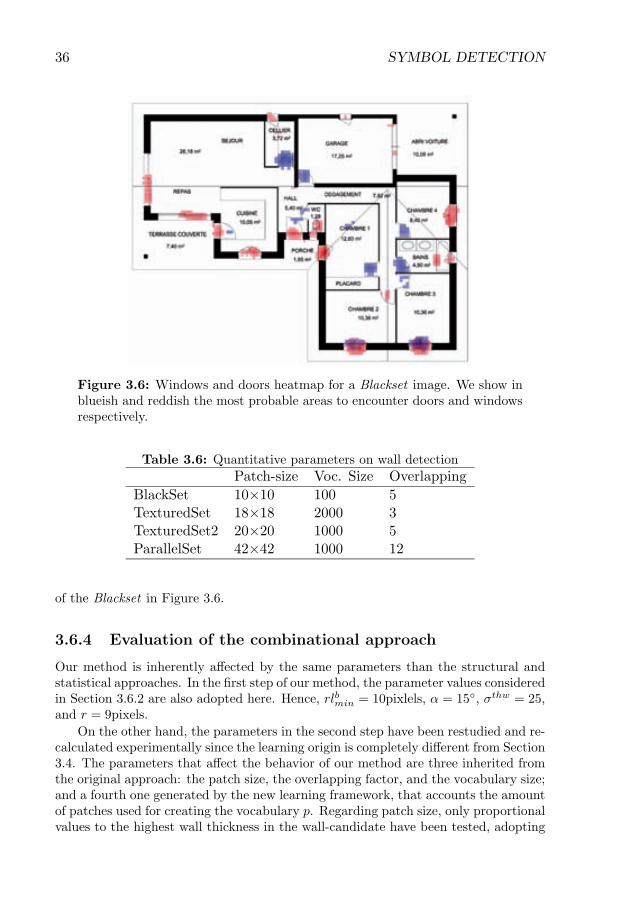
36 SYMBOL DETECTION
Figure 3.6: Windows and doors heatmap for a Blackset image. We show inblueish and reddish the most probable areas to encounter doors and windowsrespectively.
Table 3.6: Quantitative parameters on wall detection
Patch-size Voc. Size Overlapping
BlackSet 10× 10 100 5TexturedSet 18 × 18 2000 3TexturedSet2 20 × 20 1000 5ParallelSet 42 × 42 1000 12
of the Blackset in Figure 3.6.
3.6.4 Evaluation of the combinational approach
Our method is inherently aff ected by the same parameters than the structural andstatistical approaches. In the fi rst step of our method, the parameter values consideredin Section 3.6.2 are also adopted here. Hence, rlbmin = 10pixlels, α = 15 ◦ , ϕthw = 25,and r = 9pixels.
On the other hand, the parameters in the second step have been restudied and re-calculated experimentally since the learning origin is completely diff erent from Section3.4. The parameters that aff ect the behavior of our method are three inherited fromthe original approach: the patch size, the overlapping factor, and the vocabulary size;and a fourth one generated by the new learning framework, that accounts the amountof patches used for creating the vocabulary p. Regarding patch size, only proportionalvalues to the highest wall thickness in the wall-candidate have been tested, adopting
3.6. Experimental evaluation 37
finally 0.5 times the size of the thickest segment. For ϕov, several proportional valuesto patch size have been tested being 1/2� patchsize the value that leads to the bestperformance. In terms of the vocabulary size, smaller dictionaries proved to gener-alize better. Thus, just 300 words are enough to learn the wall texture. Finally, theexperiments have shown that the more learning data, the better results. Therefore,high p values are preferred. Yet, we have detected a saturation point over the 75.000patch-descriptors.
3.6.5 Discussion of the results
Once reviewed all the approaches and their parameters it is time to put them intocontext in both, numerically and graphically. The Tab. 3.7 shows the comparisonamong the three wall detection strategies presented in this thesis on our 4 datasets ofreal floor plans. Notice that we included the proposal of Sheraz et al. [13] but, sincethis method is strictly thought to work on black walls, it can only be applied on theBlack dataset.
At a glance, the three methodologies behave similarly on each dataset. As it canbe seen, their best results are obtained on the Blackset, achieving almost a perfectsegmentation. On the other hand, wall segmentation on the rest o the datasets is a bigdeal more challenging and therefore, not that accurate. For the Texturedset, the lowerresolution and the slightly different notation for exterior and interior walls increasethe false positives rate, mainly given by the detection of symbols that are modeledsimilarly to interior walls. Again, the lack of texture in the Parallelset leads towrongly segment other symbols that are also modeled by parallel lines. Finally, in thecase of the Texturedset2, the unavoidable downscaling –images are 5671�7383pixels–introduces undesirable noise and brakes the original regularity of the hatched pattern,producing multiple textural possibilities for a single wall.
When comparing the performance of the three approaches, the statistical methodoutperforms the rest on all datasets. Its JI score is over 80% in the challengingTexturedset and Texturedset2, and up to 71% in the Parallelset. Nevertheless, whenwe compare the performance between the statistical method with the structural andcombined methods, we must take into account that these latter do not need labeleddata and they are adapted singularly to every image. With all, they obtain signif-icantly close results on all datasets in both scores. In this stream, we also want tonote the difference between the structural and combined performances. In the com-bined method, the statistical step permits to effectively spot lost instances from thestructural phase without decreasing the precision. This leads to increase the recall onall datasets the JI score on the Textured2 and Parallel datasets.
We finally show the qualitative results obtained by the different approaches onimages of the four datasets in Figures 3.7, 3.8, 3.9, and 3.10. As it can be seen, theresults for the three methods are satisfactory independently to the image notation,being the statistical approach the one that achieves the best results in all images.Furthermore, while the structural method only detects straight walls, the combinedis able to retrieve curved and square instances, as it can be contrasted between Figures3.7b and 3.7d. To further demonstrate the good performance of this method whenlabeled data is not available, we show in Figure 3.11 the results on some images
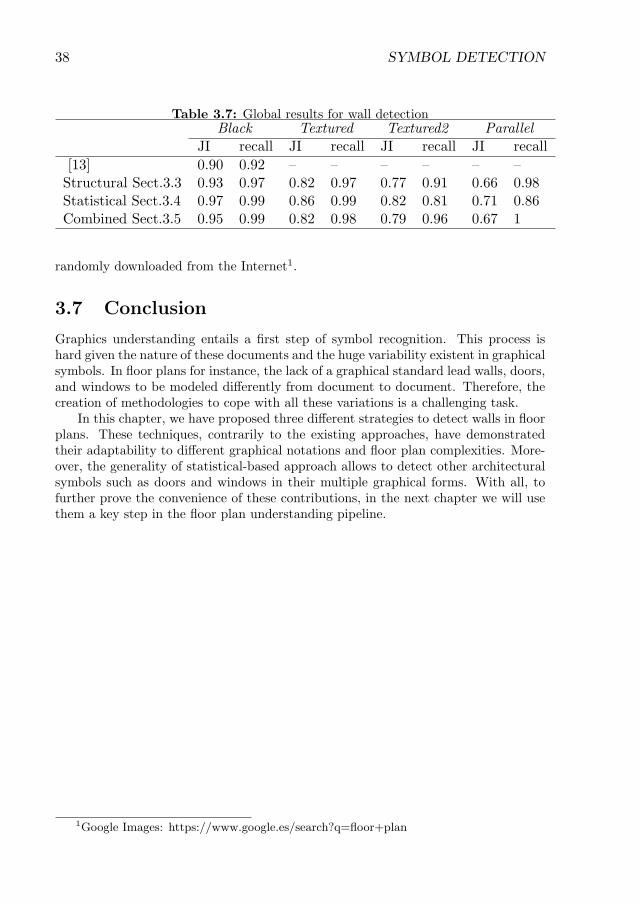
38 SYMBOL DETECTION
Table 3.7: Global results for wall detectionBlack Textured Textured2 Parallel
JI recall JI recall JI recall JI recall
[13] 0.90 0.92 – – – – – –Structural Sect.3.3 0.93 0.97 0.82 0.97 0.77 0.91 0.66 0.98Statistical Sect.3.4 0.97 0.99 0.86 0.99 0.82 0.81 0.71 0.86Combined Sect.3.5 0.95 0.99 0.82 0.98 0.79 0.96 0.67 1
randomly downloaded from the Internet1.
3.7 Conclusion
Graphics understanding entails a first step of symbol recognition. This process ishard given the nature of these documents and the huge variability existent in graphicalsymbols. In floor plans for instance, the lack of a graphical standard lead walls, doors,and windows to be modeled differently from document to document. Therefore, thecreation of methodologies to cope with all these variations is a challenging task.
In this chapter, we have proposed three different strategies to detect walls in floorplans. These techniques, contrarily to the existing approaches, have demonstratedtheir adaptability to different graphical notations and floor plan complexities. More-over, the generality of statistical-based approach allows to detect other architecturalsymbols such as doors and windows in their multiple graphical forms. With all, tofurther prove the convenience of these contributions, in the next chapter we will usethem a key step in the floor plan understanding pipeline.
1Google Images: https://www.google.es/search?q=floor+plan
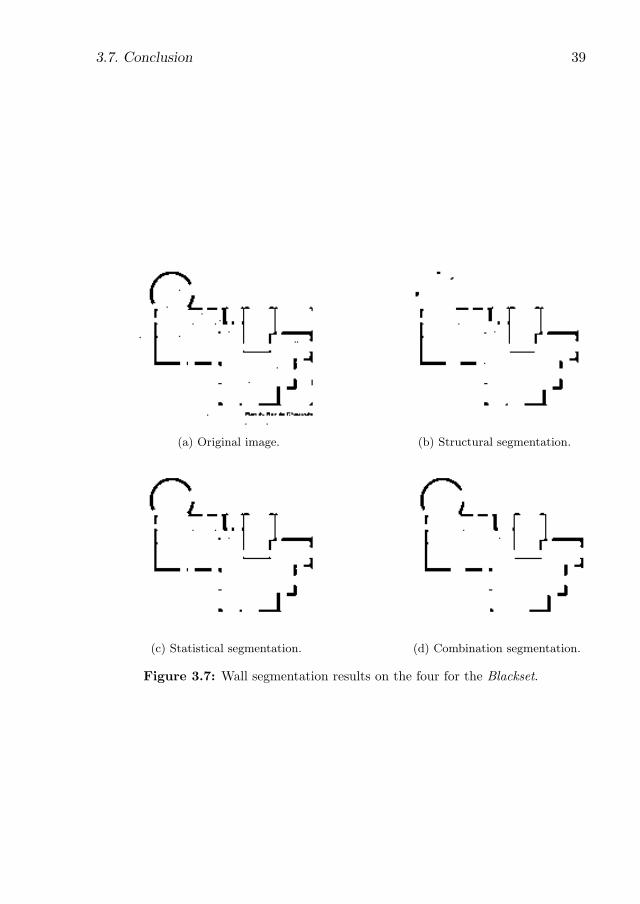
3.7. Conclusion 39
(a) Original image. (b) Structural segmentation.
(c) Statistical segmentation. (d) Combination segmentation.
Figure 3.7: Wall segmentation results on the four for the Blackset.
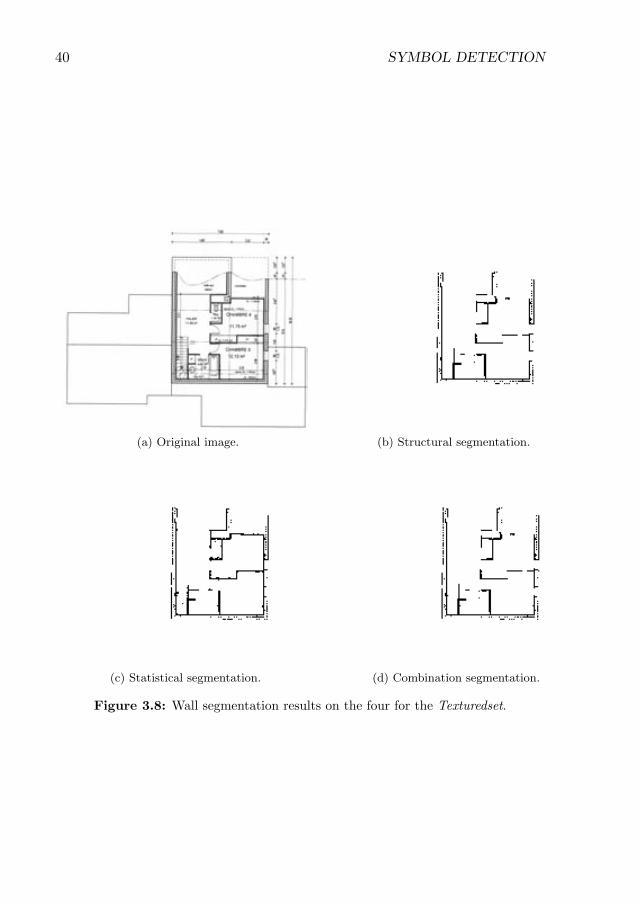
40 SYMBOL DETECTION
(a) Original image. (b) Structural segmentation.
(c) Statistical segmentation. (d) Combination segmentation.
Figure 3.8: Wall segmentation results on the four for the Texturedset.
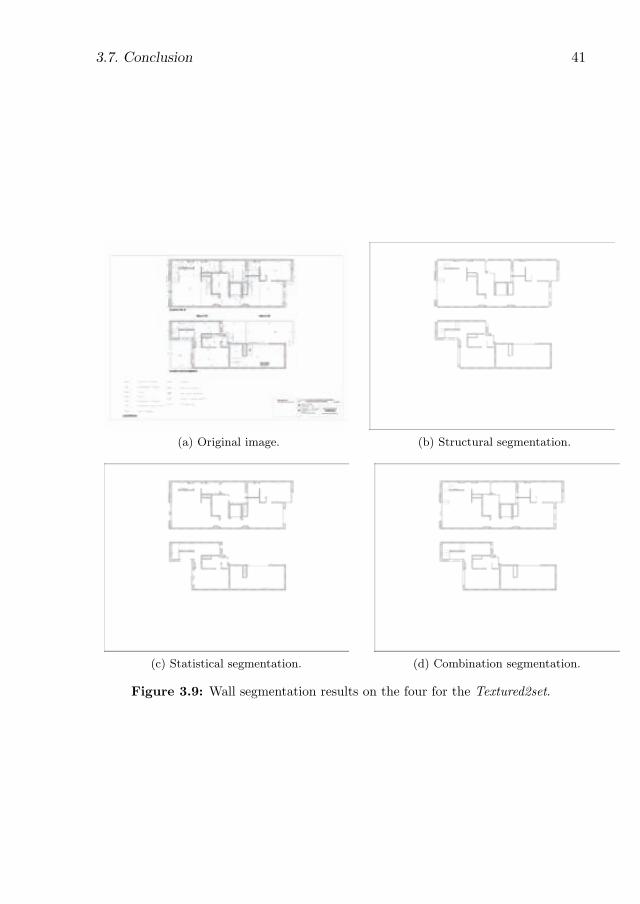
3.7. Conclusion 41
(a) Original image. (b) Structural segmentation.
(c) Statistical segmentation. (d) Combination segmentation.
Figure 3.9: Wall segmentation results on the four for the Textured2set.
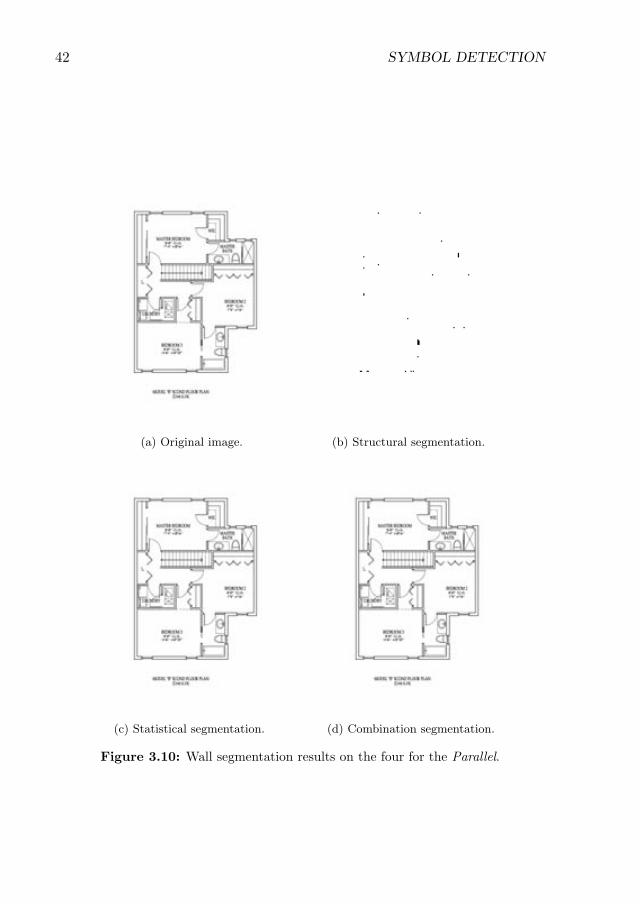
42 SYMBOL DETECTION
(a) Original image. (b) Structural segmentation.
(c) Statistical segmentation. (d) Combination segmentation.
Figure 3.10: Wall segmentation results on the four for the Parallel.
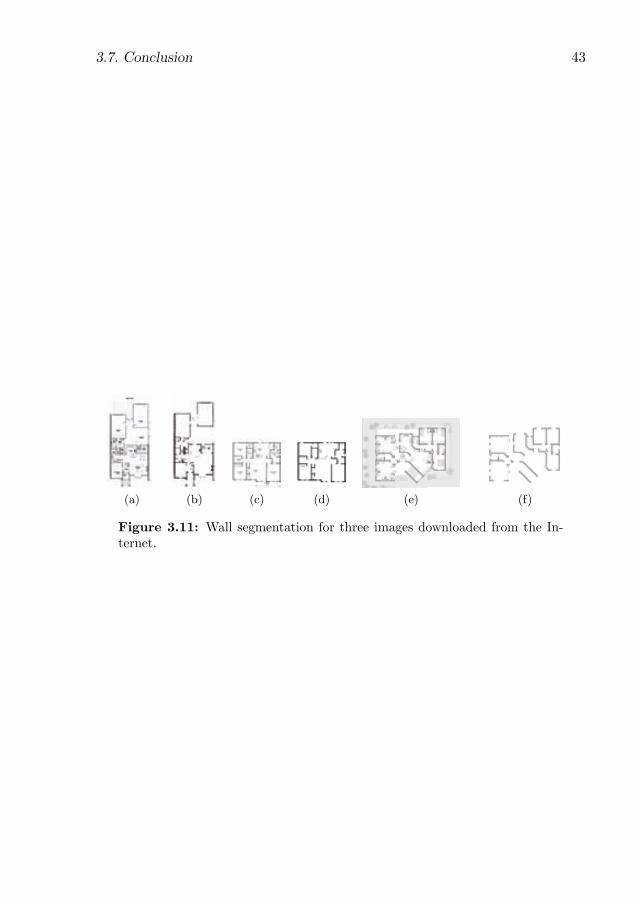
3.7. Conclusion 43
(a) (b) (c) (d) (e) (f)
Figure 3.11: Wall segmentation for three images downloaded from the In-ternet.
44 SYMBOL DETECTION
Chapter 4
Structural and syntactic recognition
4.1 Introduction
A visual language expresses complex semantical concepts by means of a graphicalvocabulary that is structured according to a visual syntax. In other words, a vi-sual syntax defines contextual relations among the graphical objects that permit toaugment their conveyed meaning w.r.t. considering these graphical items isolated.Therefore, the extraction of the contextual relations among the graphical symbols isa crucial step within the document understanding pipeline.
Contextual relations among graphical objects indicate different types of mutualdependences that can be categorized according to the sort of information they express.Generally they can be hierarchical, structural, or semantical. Hierarchical relationsallow to define complex objects as an indefinite set of simpler items. Structural rela-tions may determine, among others, object co-occurrences and relative localizations.And semantic relations carry higher-level conceptual information. Yet, in the samemanner that each natural language has its own grammatical rules, each graphicallanguage is governed by its own visual syntax. This fact implies that the contextualinformation conveyed in a document strongly depends on its language, i.e. the con-textual relationships encountered in a city map are totally different from those in aflowchart. Therefore, as language models assist text recognition methods [46], thecontextual knowledge in graphical documents is a substantial clue to guide and val-idate the recognition procedure. For instance, arrow symbols connect boxes in theirextremities in flowchart drawings. When either arrows or boxes are recognized, thestructural relation connection can be used to discover the missing parts. Hereby, theautomatic structural analysis of graphical document entails 3 main challenges. (i)We need to find appropriate structures to represent the contextual information in adocument. (ii) The graphical language should be known or learned in order to guidethe recognition. (iii) The recognition procedure not only extracts the contextual re-lations among graphical elements, but it is also guided and validated by the domainknowledge.
In this chapter we present two different contributions to analyze the structureof graphical documents with the pretext of evaluating different strategies on repre-
45
46 STRUCTURAL AND SYNTACTIC RECOGNITION
senting, learning and recognizing their contextual information. Both strategies adoptgraph formalisms of different complexities for context representation. Graphs are anatural manner for structuring this sort of information, where nodes represent graph-ical objects or concepts and attributed edges describe the types of relations amongthem. The first contribution, called structural analysis of graphical documents hasas starting point the early detected symbols by the method explained in Section 3.4.Then, artificial intelligence search algorithms with heuristic knowledge of the syntaxrecognize the contextual information on the graph representation. The second calledsyntactical analysis of graphical documents is totally different in spirit. Here, a syn-tactical method is used to either represent, learn, and recognize graphical documents.This is a stochastic grammar over an attributed graph that models the hierarchical,structural, and semantic relations in a document. The probabilistic model embed inthe grammar allows to automatically learn the visual syntax from annotated data. Itis combined with a bottom-up/top-down parsing strategy that allows to extract themost probable contextual graph for a given input. For this latter approach we proposetwo contributions with different strategies for learning the contextual relations andtwo others for parsing.
The effectiveness of the presented methods is evaluated for the detection of roomsin floor plans. On the one hand, floor plans are representative instances of graphicaldocuments given their variability in vocabulary and syntaxes, as explained in Section1.1.2,. On the other hand, rooms are the elements that better represent structure ofa building. They are conceptual entities, not symbols, that need to be extracted fromthe contextual analysis. At the end of this chapter we explain the adopted evaluationprotocol for room detection and present a deep analysis of the obtained results.
4.2 A structural approach for graphical documentanalysis
The a priori knowledge in a certain document domain has been widely used to designadhoc recognition approaches in different scenarios, i.e. office documents, chemicalstructures, flowcharts, and floor plans. Information such as the type of the graph-ical items and their structural characteristics allow to create informed recognitiontechniques that demonstrated to work successfully in a set of controlled collections.Nevertheless, it has been proved that the more expertized an interpretation techniqueis, the worse it generalizes to other recognition scopes. For instance, most of theexisting floor plan techniques are oriented to specifically work in a constrained set ofgraphical notations, they assume that building models are well-aligned w.r.t imageframes, walls are straight, etc.
In this section we present a floor plan analysis method that its main contributionw.r.t. the existing approaches is its generality; it is not only able to interpret floorplans regardless their graphical notation, but it also has been successfully adaptedto interpret graphical documents of a different domain –flowcharts– in [92]. As itcan be seen in Figure 4.1, this system is the result of combining a statistical methodto segment graphical primitives in the images, and a structural method to recognizetheir contextual dependences. Firstly, the symbol extraction methodology presented
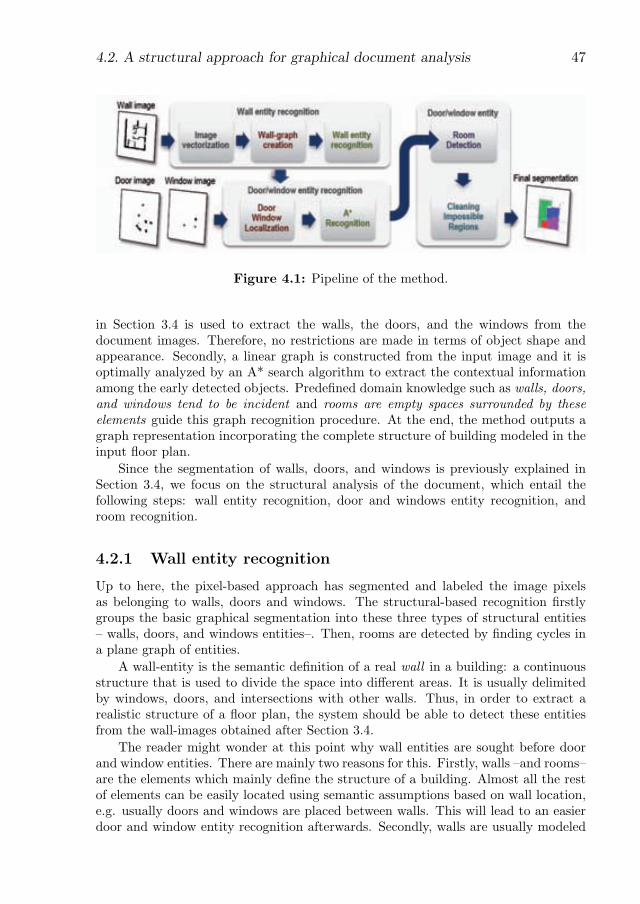
4.2. A structural approach for graphical document analysis 47
Figure 4.1: Pipeline of the method.
in Section 3.4 is used to extract the walls, the doors, and the windows from thedocument images. Therefore, no restrictions are made in terms of object shape andappearance. Secondly, a linear graph is constructed from the input image and it isoptimally analyzed by an A* search algorithm to extract the contextual informationamong the early detected objects. Predefi ned domain knowledge such as walls, doors,and windows tend to be incident and rooms are empty spaces surrounded by theseelements guide this graph recognition procedure. At the end, the method outputs agraph representation incorporating the complete structure of building modeled in theinput fl oor plan.
Since the segmentation of walls, doors, and windows is previously explained inSection 3.4, we focus on the structural analysis of the document, which entail thefollowing steps: wall entity recognition, door and windows entity recognition, androom recognition.
4.2.1 Wall entity recognition
Up to here, the pixel-based approach has segmented and labeled the image pixelsas belonging to walls, doors and windows. The structural-based recognition fi rstlygroups the basic graphical segmentation into these three types of structural entities– walls, doors, and windows entities– . Then, rooms are detected by fi nding cycles ina plane graph of entities.
A wall-entity is the semantic defi nition of a real wall in a building: a continuousstructure that is used to divide the space into diff erent areas. It is usually delimitedby windows, doors, and intersections with other walls. Thus, in order to extract arealistic structure of a fl oor plan, the system should be able to detect these entitiesfrom the wall-images obtained after Section 3.4.
The reader might wonder at this point why wall entities are sought before doorand window entities. There are mainly two reasons for this. Firstly, walls – and rooms–are the elements which mainly defi ne the structure of a building. Almost all the restof elements can be easily located using semantic assumptions based on wall location,e.g. usually doors and windows are placed between walls. This will lead to an easierdoor and window entity recognition afterwards. Secondly, walls are usually modeled
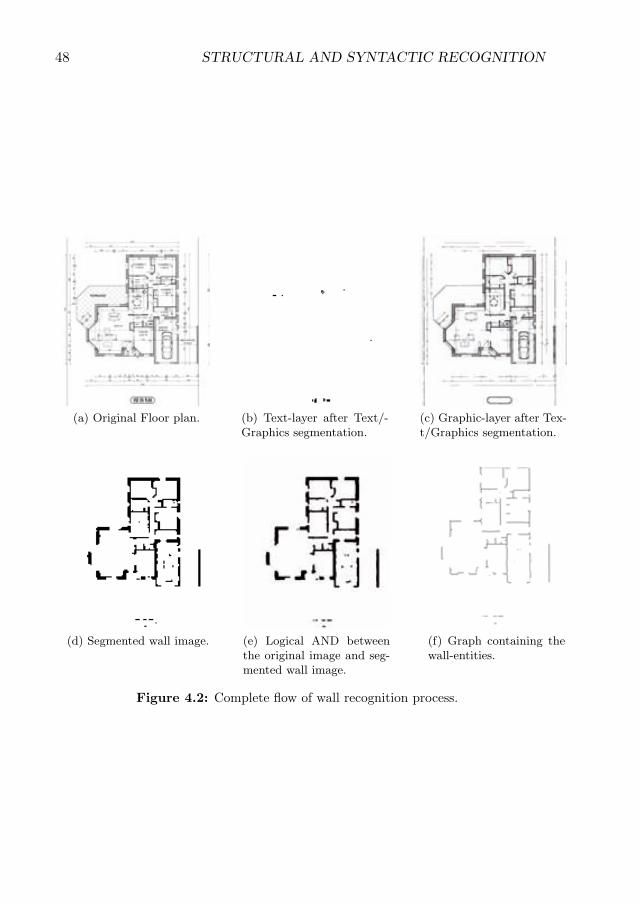
48 STRUCTURAL AND SYNTACTIC RECOGNITION
(a) Original Floor plan. (b) Text-layer after Text/-Graphics segmentation.
(c) Graphic-layer after Tex-t/Graphics segmentation.
(d) Segmented wall image. (e) Logical AND betweenthe original image and seg-mented wall image.
(f) Graph containing thewall-entities.
Figure 4.2: Complete fl ow of wall recognition process.
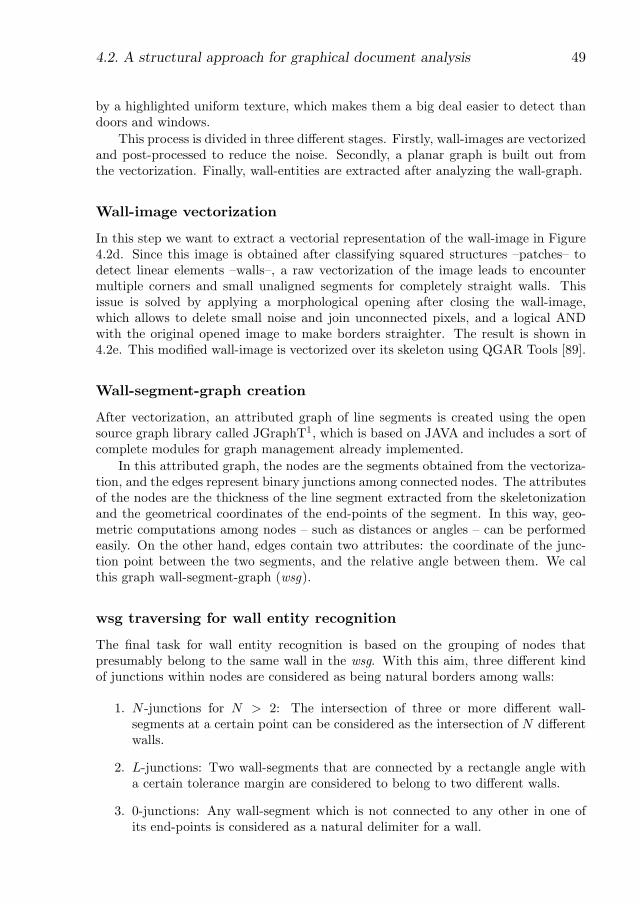
4.2. A structural approach for graphical document analysis 49
by a highlighted uniform texture, which makes them a big deal easier to detect thandoors and windows.
This process is divided in three different stages. Firstly, wall-images are vectorizedand post-processed to reduce the noise. Secondly, a planar graph is built out fromthe vectorization. Finally, wall-entities are extracted after analyzing the wall-graph.
Wall-image vectorization
In this step we want to extract a vectorial representation of the wall-image in Figure4.2d. Since this image is obtained after classifying squared structures –patches– todetect linear elements –walls–, a raw vectorization of the image leads to encountermultiple corners and small unaligned segments for completely straight walls. Thisissue is solved by applying a morphological opening after closing the wall-image,which allows to delete small noise and join unconnected pixels, and a logical ANDwith the original opened image to make borders straighter. The result is shown in4.2e. This modified wall-image is vectorized over its skeleton using QGAR Tools [89].
Wall-segment-graph creation
After vectorization, an attributed graph of line segments is created using the opensource graph library called JGraphT1, which is based on JAVA and includes a sort ofcomplete modules for graph management already implemented.
In this attributed graph, the nodes are the segments obtained from the vectoriza-tion, and the edges represent binary junctions among connected nodes. The attributesof the nodes are the thickness of the line segment extracted from the skeletonizationand the geometrical coordinates of the end-points of the segment. In this way, geo-metric computations among nodes – such as distances or angles – can be performedeasily. On the other hand, edges contain two attributes: the coordinate of the junc-tion point between the two segments, and the relative angle between them. We calthis graph wall-segment-graph (wsg).
wsg traversing for wall entity recognition
The final task for wall entity recognition is based on the grouping of nodes thatpresumably belong to the same wall in the wsg. With this aim, three different kindof junctions within nodes are considered as being natural borders among walls:
1. N -junctions for N > 2: The intersection of three or more different wall-segments at a certain point can be considered as the intersection of N differentwalls.
2. L-junctions: Two wall-segments that are connected by a rectangle angle witha certain tolerance margin are considered to belong to two different walls.
3. 0-junctions: Any wall-segment which is not connected to any other in one ofits end-points is considered as a natural delimiter for a wall.
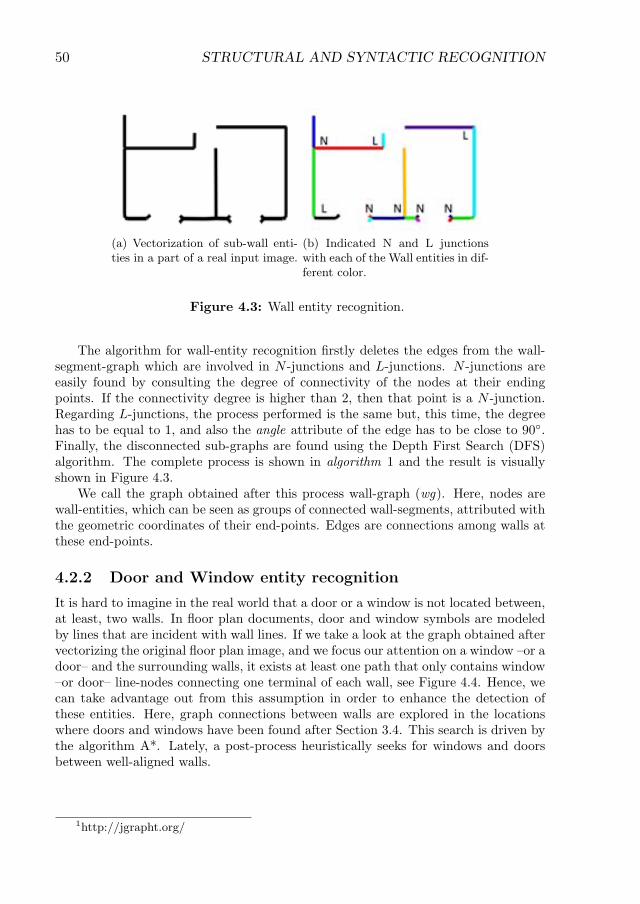
50 STRUCTURAL AND SYNTACTIC RECOGNITION
(a) Vectorization of sub-wall enti-ties in a part of a real input image.
(b) Indicated N and L junctionswith each of the Wall entities in dif-ferent color.
Figure 4.3: Wall entity recognition.
The algorithm for wall-entity recognition firstly deletes the edges from the wall-segment-graph which are involved in N -junctions and L-junctions. N -junctions areeasily found by consulting the degree of connectivity of the nodes at their endingpoints. If the connectivity degree is higher than 2, then that point is a N -junction.Regarding L-junctions, the process performed is the same but, this time, the degreehas to be equal to 1, and also the angle attribute of the edge has to be close to 90◦.Finally, the disconnected sub-graphs are found using the Depth First Search (DFS)algorithm. The complete process is shown in algorithm 1 and the result is visuallyshown in Figure 4.3.
We call the graph obtained after this process wall-graph (wg). Here, nodes arewall-entities, which can be seen as groups of connected wall-segments, attributed withthe geometric coordinates of their end-points. Edges are connections among walls atthese end-points.
4.2.2 Door and Window entity recognition
It is hard to imagine in the real world that a door or a window is not located between,at least, two walls. In floor plan documents, door and window symbols are modeledby lines that are incident with wall lines. If we take a look at the graph obtained aftervectorizing the original floor plan image, and we focus our attention on a window –or adoor– and the surrounding walls, it exists at least one path that only contains window–or door– line-nodes connecting one terminal of each wall, see Figure 4.4. Hence, wecan take advantage out from this assumption in order to enhance the detection ofthese entities. Here, graph connections between walls are explored in the locationswhere doors and windows have been found after Section 3.4. This search is driven bythe algorithm A*. Lately, a post-process heuristically seeks for windows and doorsbetween well-aligned walls.
1http://jgrapht.org/
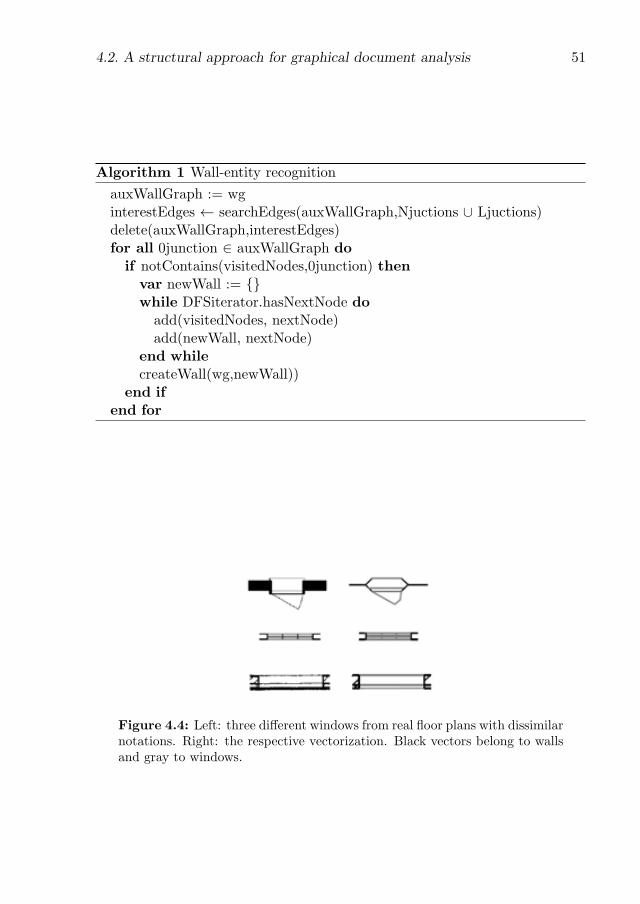
4.2. A structural approach for graphical document analysis 51
Algorithm 1 Wall-entity recognition
auxWallGraph := wginterestEdges searchEdges(auxWallGraph,Njuctions [ Ljuctions)delete(auxWallGraph,interestEdges)for all 0junction 2 auxWallGraph do
if notContains(visitedNodes,0junction) thenvar newWall := fgwhile DFSiterator.hasNextNode do
add(visitedNodes, nextNode)add(newWall, nextNode)
end whilecreateWall(wg,newWall))
end ifend for
Figure 4.4: Left: three different windows from real floor plans with dissimilarnotations. Right: the respective vectorization. Black vectors belong to wallsand gray to windows.
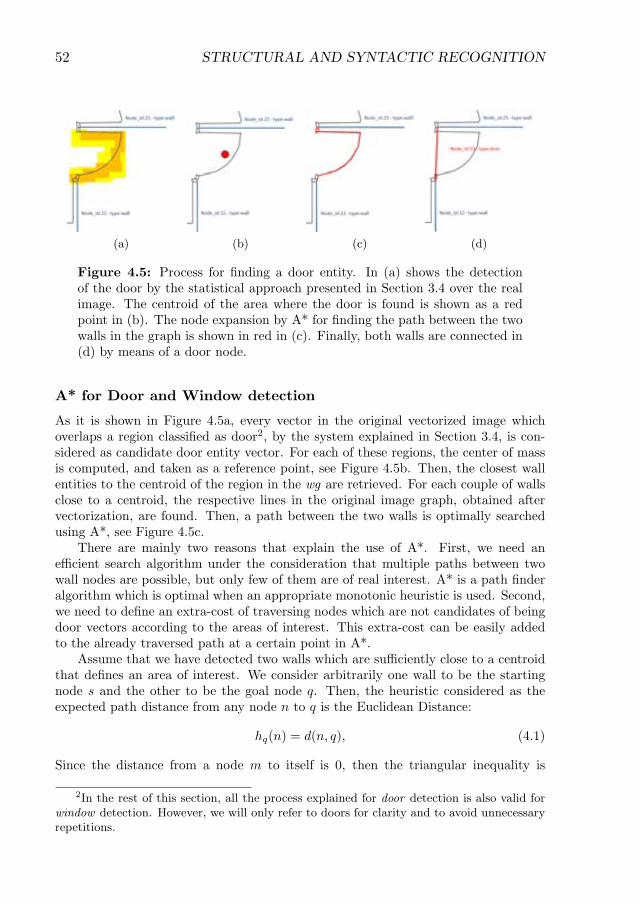
52 STRUCTURAL AND SYNTACTIC RECOGNITION
(a) (b) (c) (d)
Figure 4.5: Process for finding a door entity. In (a) shows the detectionof the door by the statistical approach presented in Section 3.4 over the realimage. The centroid of the area where the door is found is shown as a redpoint in (b). The node expansion by A* for finding the path between the twowalls in the graph is shown in red in (c). Finally, both walls are connected in(d) by means of a door node.
A* for Door and Window detection
As it is shown in Figure 4.5a, every vector in the original vectorized image whichoverlaps a region classified as door2, by the system explained in Section 3.4, is con-sidered as candidate door entity vector. For each of these regions, the center of massis computed, and taken as a reference point, see Figure 4.5b. Then, the closest wallentities to the centroid of the region in the wg are retrieved. For each couple of wallsclose to a centroid, the respective lines in the original image graph, obtained aftervectorization, are found. Then, a path between the two walls is optimally searchedusing A*, see Figure 4.5c.
There are mainly two reasons that explain the use of A*. First, we need anefficient search algorithm under the consideration that multiple paths between twowall nodes are possible, but only few of them are of real interest. A* is a path finderalgorithm which is optimal when an appropriate monotonic heuristic is used. Second,we need to define an extra-cost of traversing nodes which are not candidates of beingdoor vectors according to the areas of interest. This extra-cost can be easily addedto the already traversed path at a certain point in A*.
Assume that we have detected two walls which are sufficiently close to a centroidthat defines an area of interest. We consider arbitrarily one wall to be the startingnode s and the other to be the goal node q. Then, the heuristic considered as theexpected path distance from any node n to q is the Euclidean Distance:
hq(n) = d(n, q), (4.1)
Since the distance from a node m to itself is 0, then the triangular inequality is
2In the rest of this section, all the process explained for door detection is also valid forwindow detection. However, we will only refer to doors for clarity and to avoid unnecessaryrepetitions.
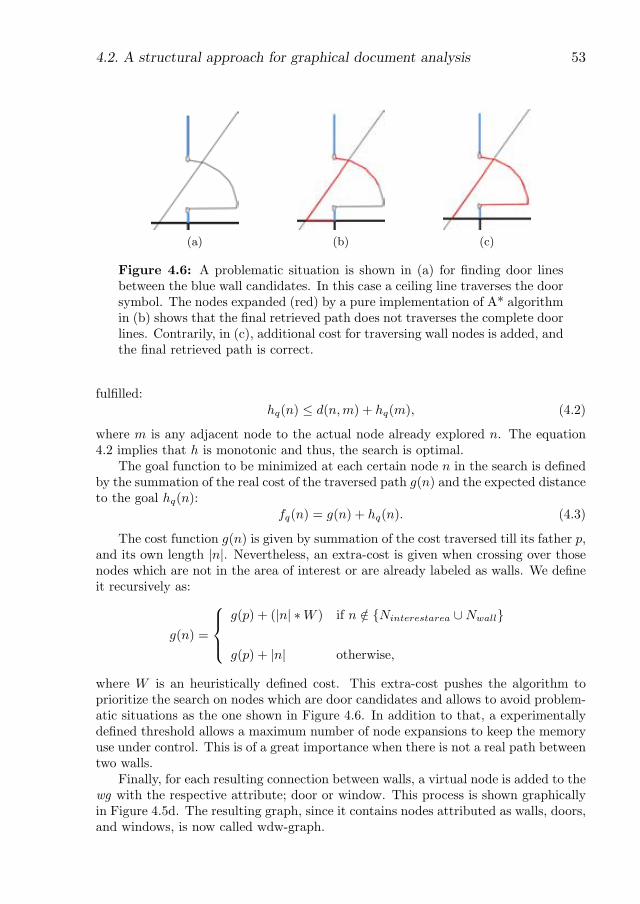
4.2. A structural approach for graphical document analysis 53
(a) (b) (c)
Figure 4.6: A problematic situation is shown in (a) for finding door linesbetween the blue wall candidates. In this case a ceiling line traverses the doorsymbol. The nodes expanded (red) by a pure implementation of A* algorithmin (b) shows that the final retrieved path does not traverses the complete doorlines. Contrarily, in (c), additional cost for traversing wall nodes is added, andthe final retrieved path is correct.
fulfilled:hq(n) � d(n,m) + hq(m), (4.2)
where m is any adjacent node to the actual node already explored n. The equation4.2 implies that h is monotonic and thus, the search is optimal.
The goal function to be minimized at each certain node n in the search is definedby the summation of the real cost of the traversed path g(n) and the expected distanceto the goal hq(n):
fq(n) = g(n) + hq(n). (4.3)
The cost function g(n) is given by summation of the cost traversed till its father p,and its own length jnj. Nevertheless, an extra-cost is given when crossing over thosenodes which are not in the area of interest or are already labeled as walls. We defineit recursively as:
g(n) =
g(p) + (jnj �W ) if n /2 fNinterestarea [Nwallg
g(p) + jnj otherwise,
where W is an heuristically defined cost. This extra-cost pushes the algorithm toprioritize the search on nodes which are door candidates and allows to avoid problem-atic situations as the one shown in Figure 4.6. In addition to that, a experimentallydefined threshold allows a maximum number of node expansions to keep the memoryuse under control. This is of a great importance when there is not a real path betweentwo walls.
Finally, for each resulting connection between walls, a virtual node is added to thewg with the respective attribute; door or window. This process is shown graphicallyin Figure 4.5d. The resulting graph, since it contains nodes attributed as walls, doors,and windows, is now called wdw-graph.
54 STRUCTURAL AND SYNTACTIC RECOGNITION
Wall well-aligned connections
The loss of any door or window entity at this point is a critical issue for the later roomdetection. Rooms are detected by finding closed regions in a wdw-graph. Therefore,when a door or a window is lost, the supposed room formed by these elements is lost.For this reason, a post-process to reduce the impact of losing any of these elementsis carried out.
This process firstly looks for couples of walls that have a geometric gap betweenthem and are sensibly well-aligned in orientation; the tolerance on both, gap distanceand orientation angle, is experimentally learned from the ground-truth. A path amongeach of these couples of walls is searched using the A*, as explained in 4.2.2, but witha slightly modified cost function g(n). Now, an extra-cost is given only to that nodeswhich already belong to walls. It is defined recursively as:
g(n) =
g(p) + (jnj �W ) if n /2 Nwall
g(p) + jnj otherwise
(4.4)
If a path exists, a new node of type connection is added to the graph and connectedto the two correspondent wall terminals. The use of this technique not only results ina better room detection, but also helps on finding abstract boundaries between roomsthat have no physical separation. The final graph is called wdwcg.
Room detection
Finally, closed regions are found from the plane wdwcg using the optimal algorithmfrom Jiang et al. in [61]. Before applying the algorithm, all the terminals of thegraph are erased recursively. This leads to a better computation of the closed regionsas unnecessary terminal paths are not taken into account when searching for closedregions. After obtaining the regions, their area is calculated and used to rule outimpossible rooms regarding their absolute size, such as small regions representingholes for pipes in the plan.
The room information is introduced into the wdwcg to create the output repre-sentation of the analyzed floor plan. Hence, the attributed graph incorporates both,the complete set of architectural elements encountered and their structural depen-dences. This high-level document representation carries on information that could beof special interest for many applications. Techniques such as graph traversing can beused to extract neighbor or accessible rooms, and graph matching to retrieve similarfloor plans regarding their structure.
4.3 Syntactic analysis of graphical documents
In the previous Section 4.2 we have presented a method for the extraction of thestructure of floor plans that is able to cope with multiple graphical notations. Yet, asin most of the literature approaches dealing on this framework, the domain knowledge(the syntax) of the graphical documents is specifically defined by the recognition task.
4.3. Syntactic analysis of graphical documents 55
This fact produces that, even if it can easily adapt to recognize other linear documentssuch as flowcharts, the contextual information of interest needs to be redefined forevery new visual syntax.
In this section we propose the adoption of a syntactic model to overcome thisproblem. In Section 2.3 we have already explained how the syntactic recognition hasbeen used in the literature to solve multiple CV problems. Here we adopt an attributegraph grammar as unified framework for representing the information conveyed indocuments, to automatically learn their visual syntaxes, and to use this knowledge tofavor a better recognition.
Attribute graph grammars have a high representative power. They not only allowto represent images or documents hierarchically, but they include structural attributesand dependences among the existing elements. This complex representation can belearned from annotated data by a probabilistic model embed in the grammaticalformalism. Then, when the model learning is combined with appropriate parsingtechniques, the system retrieves that representation of the input that betters fits intothe syntax.
In this section we firstly introduce the grammatical formalism used to representand interpret architectural documents. This definition is adapted into a preliminarysyntactic model that allowed us to study the feasibility of interpreting floor plans bymeans of a grammatical formalism. It is composed of two production rules, unaryobject attributes, and predefined contextual relations. Finally, we increase the orig-inal model complexity into a grammar that models the contextual relations usingProbabilistic Graphical Models (PGMs). It worth to remark that, for a given input,the proposed contributions initialize the graph representation in order to relax thecomplexity of the inference process. This initialization entails the use of appropriateobject recognition methods to break the semantic gap between image pixels and thegrammatical symbols. In the first approach, a very ad-hoc extraction aims at almostperfect graph initialization. Contrarily, the second method initializes the graph usinga more naive hypothesis of the complete structure of the document, giving more re-sponsibility to the inference process. At the end, both methodologies output the floorplan contextual representation in an attributed graph that includes the hierarchical,structural, and semantic relations among the architectural elements.
4.3.1 The oor plan attributed graph grammar
The first point to discuss is how to represent the structure of the floor plans. Themain architectural elements in these documents are those that model the structureof a building, viz. rooms, walls, doors, and windows. Therefore, we can model thestructure of a floor plan using a hierarchical composition of those elements, see Figure4.7a. In this model, a building is composed by a definite number of rooms and, atthe same time, a room consists of a set of terminals that enclose their space, thisare walls, doors, and windows. The expressiveness of this tree representation can beaugmented by converting it into an attributed graph. In this graph, the nodes containattributes that enclose specific features of the different architectural objects, and theattributed edges allow to constrain structural and semantic relations among them,see Figure 4.7b. Therefore, it is easy to see that every floor plan can be converted
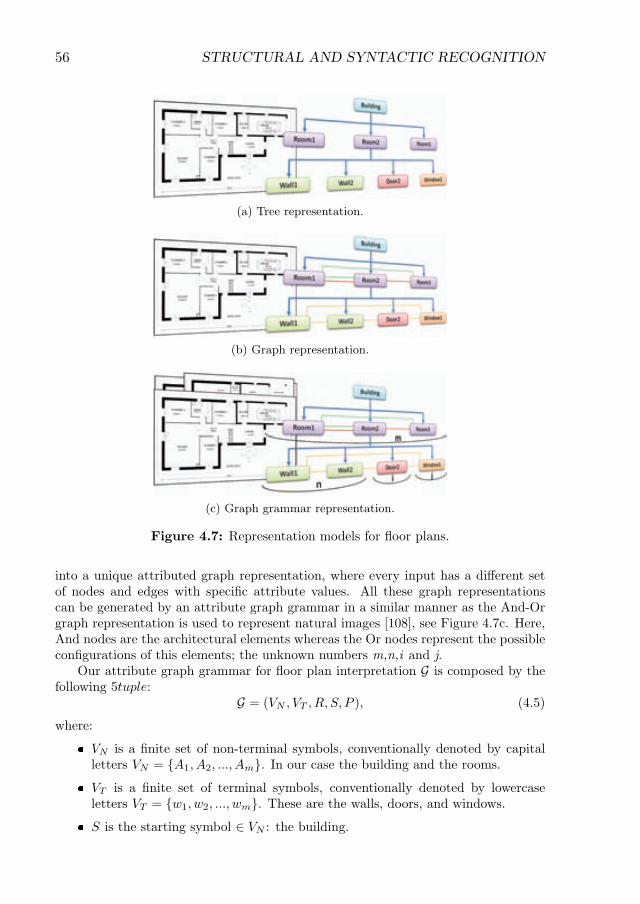
56 STRUCTURAL AND SYNTACTIC RECOGNITION
(a) Tree representation.
(b) Graph representation.
(c) Graph grammar representation.
Figure 4.7: Representation models for fl oor plans.
into a unique attributed graph representation, where every input has a diff erent setof nodes and edges with specifi c attribute values. All these graph representationscan be generated by an attribute graph grammar in a similar manner as the And-Orgraph representation is used to represent natural images [108], see Figure 4.7c. Here,And nodes are the architectural elements whereas the Or nodes represent the possibleconfi gurations of this elements; the unknown numbers m,n,i and j.
Our attribute graph grammar for fl oor plan interpretation G is composed by thefollowing 5tuple:
G = (VN , VT , R, S, P ), (4.5)
where:
VN is a fi nite set of non-terminal symbols, conventionally denoted by capitalletters VN = { A1 , A2 , . . . , Am } . In our case the building and the rooms.
VT is a fi nite set of terminal symbols, conventionally denoted by lowercaseletters VT = { w1 , w2 , . . . , wm } . These are the walls, doors, and windows.
S is the starting symbol ∈ VN : the building.
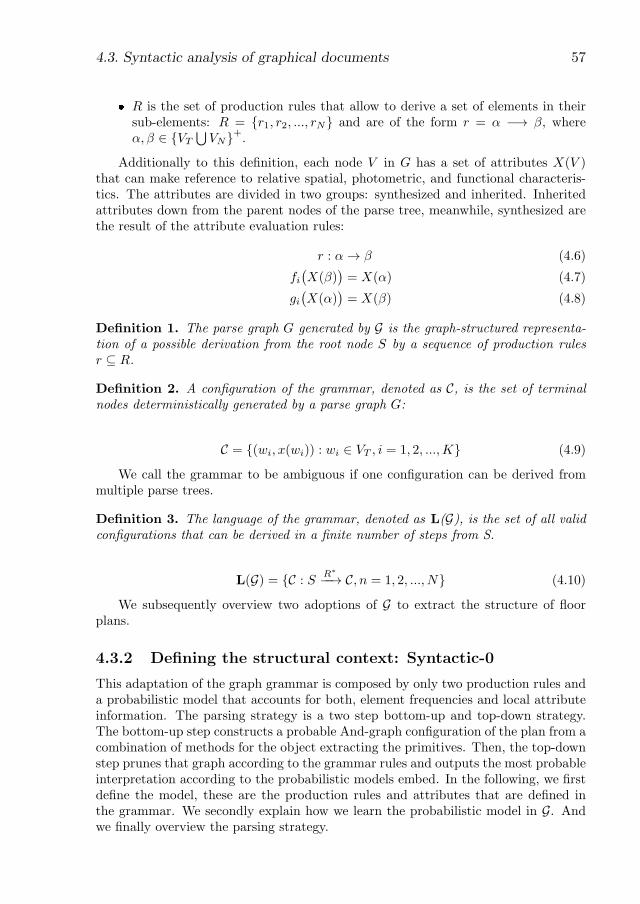
4.3. Syntactic analysis of graphical documents 57
� R is the set of production rules that allow to derive a set of elements in theirsub-elements: R = fr1, r2, ..., rNg and are of the form r = α �! β, whereα, β 2 fVT
∪VNg+.
Additionally to this definition, each node V in G has a set of attributes X(V )that can make reference to relative spatial, photometric, and functional characteris-tics. The attributes are divided in two groups: synthesized and inherited. Inheritedattributes down from the parent nodes of the parse tree, meanwhile, synthesized arethe result of the attribute evaluation rules:
r : α! β (4.6)
fi(X(β)
)= X(α) (4.7)
gi(X(α)
)= X(β) (4.8)
De�nition 1. The parse graph G generated by G is the graph-structured representa-tion of a possible derivation from the root node S by a sequence of production rulesr � R.
De�nition 2. A configuration of the grammar, denoted as C, is the set of terminalnodes deterministically generated by a parse graph G:
C = f(wi, x(wi)) : wi 2 VT , i = 1, 2, ...,Kg (4.9)
We call the grammar to be ambiguous if one configuration can be derived frommultiple parse trees.
De�nition 3. The language of the grammar, denoted as L(G), is the set of all validconfigurations that can be derived in a finite number of steps from S.
L(G) = fC : S R∗
��! C, n = 1, 2, ..., Ng (4.10)
We subsequently overview two adoptions of G to extract the structure of floorplans.
4.3.2 De�ning the structural context: Syntactic-0
This adaptation of the graph grammar is composed by only two production rules anda probabilistic model that accounts for both, element frequencies and local attributeinformation. The parsing strategy is a two step bottom-up and top-down strategy.The bottom-up step constructs a probable And-graph configuration of the plan from acombination of methods for the object extracting the primitives. Then, the top-downstep prunes that graph according to the grammar rules and outputs the most probableinterpretation according to the probabilistic models embed. In the following, we firstdefine the model, these are the production rules and attributes that are defined inthe grammar. We secondly explain how we learn the probabilistic model in G. Andwe finally overview the parsing strategy.
58 STRUCTURAL AND SYNTACTIC RECOGNITION
(a) r1 (b) r2
Figure 4.8: Rules for Syntactic-0. Rule r1 derives a Building into M rooms.Rule r2 derives a Room into N primitives.
Model defi nition
The graph grammar is composed by two production rules that allow to derive hierar-chically and structurally a fl oor plan:
r1 defi nes a building B as an arrangement of rooms H that are contextuallyrelated in terms of neighborhood and accessibility, see Figure 4.8a. The neigh-borhood graph gν = (H, Eν ) and the access graph g µ = (H, EB
µ ) defi ne thestructural connectivity among these rooms. When two rooms Hi and Hj shareat least one primitive in their decomposition, they are called to be neighbors(Hi , Hj) ∈ Eν . Additionally, when at least one of the shared primitives is adoor or a separation, they are accessible (Hi , Hj) ∈ EB
µ . Figure 4.8b shows theroom connectivity for a possible fl oor plan derivation. This rule imposes thatboth, g µ and g ν are connected graphs – all the nodes are reachable from anyother node in a fi nite number of traversing steps– .
r2 defi nes H as a closed environment of a set of architectural primitives w;these are walls, doors, and windows. These primitives are related in terms ofincidence according to the undirected graph gι = (w, Eι ). Two primitives areincident (wi , wj) ∈ E ι whether their segments intersect at some point of theimage. This rule is visually illustrated in Figure 4.8b.
We defi ne two attributes for the rooms that will be used in the recognition toasses the confi dence of the detections. These are their area ε (H) and a perimeterρ (H), and are calculated from the planar confi guration of the graph g ι = (w, E ι ) thatcomposes every room.
Model learning
The probabilistic model for this grammar is defi ned on the parse graph derivations.It accounts for the frequency of the elements and the consistency of the attributes inG:
p(G) = por(G)px(G), (4.11)
where:
4.3. Syntactic analysis of graphical documents 59
� por models the frequency of the production derivations. This is the number ofrooms that a building derives into, and the number of primitives that surroundevery room:
por(G) = p(η(B)
)∑∀Hi∈G p(η(Hi)
)η(Hi)
, (4.12)
Where η(A) is the number of children of A. Since there is a strong relationbetween p
(η(A)
)w.r.t. the floor plan area, this model is normalized by the plan
area to adapt to different building sizes and types.
� px models the room areas ε(H) and ρ(H):
px(G) =1
2η(B)
∑∀Hi∈G
p(ε(Hi)
)+ p
(ρ(Hi)
). (4.13)
All, p(ε(Hi)
), p
(ρ(Hi)
), and p
(η(A)
)are pdfs modeled by Gaussian Mixtures
estimated by the EM algorithm.
Model recognition
The recognition of an input document consists of finding that G that better fits intothe model learned, i.e. that G that maximizes p(G):
G = argmaxG
p(G), (4.14)
We have designed a parsing strategy that constructs a preliminary representa-tion of the floor plan from already extracted primitives. This construction is set in abottom-up manner; the contextual relations among the symbols are synthesized fromthe early detected nodes and relations. Then, in a top-down manner, multiple parsegraphs are generated by considering different configurations agreeing with the gram-mar definition. Finally, we keep that parse graph that maximizes the probabilisticmodel.
Bottom-up parsing
The bottom-up parsing process constructs a graph representation of the floor planfrom the terminal symbols to S. At each step, the parser constructs an abstractionlevel of the tree representation. Then, their contextual graphs are synthesized toconstruct the upper level. In the following we explain the process of constructingeach abstraction level.
1. From pixels to VT : This process of initializing the grammar primitives is per-formed by three different symbol recognition strategies, one for each possibleclass c =fwall, door, windowg. The reason of using such a specialized methodsaims at obtaining and accurate primitive detection that facilitates the subse-quent inference steps. For the detection of walls and doors we have adoptedthe same strategies as in [72]. Walls are detected on the coupling of Hough
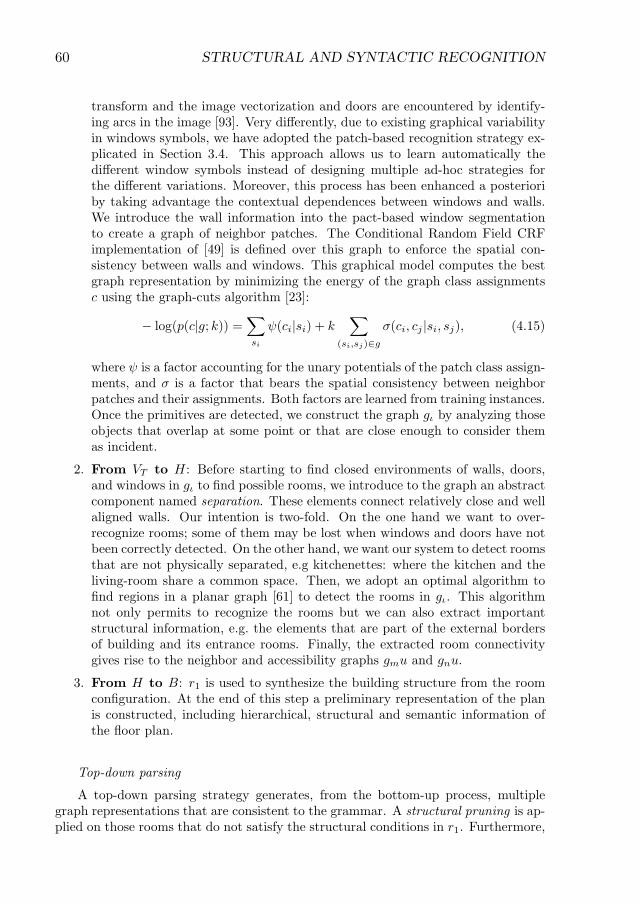
60 STRUCTURAL AND SYNTACTIC RECOGNITION
transform and the image vectorization and doors are encountered by identify-ing arcs in the image [93]. Very differently, due to existing graphical variabilityin windows symbols, we have adopted the patch-based recognition strategy ex-plicated in Section 3.4. This approach allows us to learn automatically thedifferent window symbols instead of designing multiple ad-hoc strategies forthe different variations. Moreover, this process has been enhanced a posterioriby taking advantage the contextual dependences between windows and walls.We introduce the wall information into the pact-based window segmentationto create a graph of neighbor patches. The Conditional Random Field CRFimplementation of [49] is defined over this graph to enforce the spatial con-sistency between walls and windows. This graphical model computes the bestgraph representation by minimizing the energy of the graph class assignmentsc using the graph-cuts algorithm [23]:
� log(p(cjg; k)) =∑si
ψ(cijsi) + k∑
(si;sj)∈g
ϕ(ci, cj jsi, sj), (4.15)
where ψ is a factor accounting for the unary potentials of the patch class assign-ments, and ϕ is a factor that bears the spatial consistency between neighborpatches and their assignments. Both factors are learned from training instances.Once the primitives are detected, we construct the graph g� by analyzing thoseobjects that overlap at some point or that are close enough to consider themas incident.
2. From VT to H: Before starting to find closed environments of walls, doors,and windows in g� to find possible rooms, we introduce to the graph an abstractcomponent named separation. These elements connect relatively close and wellaligned walls. Our intention is two-fold. On the one hand we want to over-recognize rooms; some of them may be lost when windows and doors have notbeen correctly detected. On the other hand, we want our system to detect roomsthat are not physically separated, e.g kitchenettes: where the kitchen and theliving-room share a common space. Then, we adopt an optimal algorithm tofind regions in a planar graph [61] to detect the rooms in g�. This algorithmnot only permits to recognize the rooms but we can also extract importantstructural information, e.g. the elements that are part of the external bordersof building and its entrance rooms. Finally, the extracted room connectivitygives rise to the neighbor and accessibility graphs gmu and gnu.
3. From H to B: r1 is used to synthesize the building structure from the roomconfiguration. At the end of this step a preliminary representation of the planis constructed, including hierarchical, structural and semantic information ofthe floor plan.
Top-down parsing
A top-down parsing strategy generates, from the bottom-up process, multiplegraph representations that are consistent to the grammar. A structural pruning is ap-plied on those rooms that do not satisfy the structural conditions in r1. Furthermore,
4.3. Syntactic analysis of graphical documents 61
a probabilistic analysis generates multiple graph instances according to probabilisticscores. At the end, the parser selects that valid graph representation with highestprobability:
� Structural pruning : Some of the building representations constructed whileparsing the document are highly inconsistent according to the grammar speci-fication. In this stream, r1 specifies that all the rooms should be connected interms of neighborhood and accessibility. To fulfill this rule, the parser checksthe graphs g� and g� connectivity using the Dijkstra shortest-path algorithm.From each unconnected component a new graph instance is created by keepingthe parent and the offspring of the rooms.
� Probabilistic pruning : For each one of the rooms H 2 G we calculate its px.When this probability is close to 0, we generate a new G′ that is the resultruling out that room from G and all its single parent offspring. This process isrepeated for every room in G.
When the inference process finishes, the floor plan representation obtained in-cludes the architectural objects, their mutual dependences, and a probability associ-ated.
4.3.3 Learning the context: Syntactic
The previous methodology uses the structural information in three different manners.Firstly, it is defined at the grammatical rules, e.g a building is composed of accessiblerooms. Secondly, attributes allow to assess the reliability of the room hypothesis.Finally spatial dependences are learned by a graphical model to enhance the initial-ization of the graph. Still, that syntactic approach does not learn any structuralrelation among the architectural symbols that is considered at inference time. In thisfollowing method we do learn structural context to favor a better interpretation. Thisfact permits to initialize the graph in a more naive fashion, giving more reliabilityto the recognition process. In the following we explain each module in grammaticalformalism separately.
Model de�nition
This grammar represents hierarchically and structurally the architecture of a floorplan in similar manner to the previous syntactic approach in Section 4.3.2. Here, theroot node is the building and the terminals symbols are walls, doors, separations, andnothings –we explain below why a nothing element is added into the model–. Thegrammar definition has two extra production rules that give rise to the concept of do-main. The domains are physical regions of the image that enclose the different spacesof the rooms. Our intention is to permit the grammar to atomize the composition ofrooms and predict which image spaces belong to a certain room and which not. Let’sreview the rules, which are visually represented in Figure 4.9:
� r1 is very similar to the first production in the previous Section, which allowsto derive building B into an arrangement of rooms H. Here, the rooms are also
62 STRUCTURAL AND SYNTACTIC RECOGNITION
(a) r1 (b) r2
(c) r3 (d) r4
Figure 4.9: Rules for Syntactic.
related in terms of neighborhood and accessibility according to the graphs gBνand gBµ . Yet, this connectivity is not set in the rule defi nition but it is learnedfrom the GT.
A room can be divided into multiple domains D by r2. The domains in G arealso connected in terms of accessibility gHν . When Di and Dj share a door anda separation in their derivations they are considered accessible (Di , Dj) ∈ EH
ν .Moreover and diff erently to r1, two domains are also accessible when they sharea nothing among their off spring.
Two accessible rooms H1 and H2 consisting of two or more accessible domainsD1 and D2 can be merged together into a new room. This rule can be appliedrecursively to merge several domains into a single room. As it will be explainedlater, r3 allows to infer the fi nal spatial confi guration of the rooms. It is worthto remark that when this production is applied, the label of the shared primitiverelabeled into nothing.
Finally, r4 is similar to r2 in the previous approach. It defi nes how D is enclosedinto a set of architectural primitives w. These primitives are related in termsof incidence according to the undirected graph gι = (w, E ι ). Two of them areconsidered incident (wi , wj) ∈ E ι whether their segments intersect at somepoint of the image.
The list of attributes for the diff erent nonterminal nodes and the associate equa-tions to the rules they participate in are summarized in Tab. 4.1. All the nonterminalnodes have a common attribute σ(A) stating for their number of children. Addition-ally, each nonterminal node has its own attributes accounting for specifi c structuralcharacteristics. For the building, ρ(B) and µ (B) are defi ned on the neighborhood and
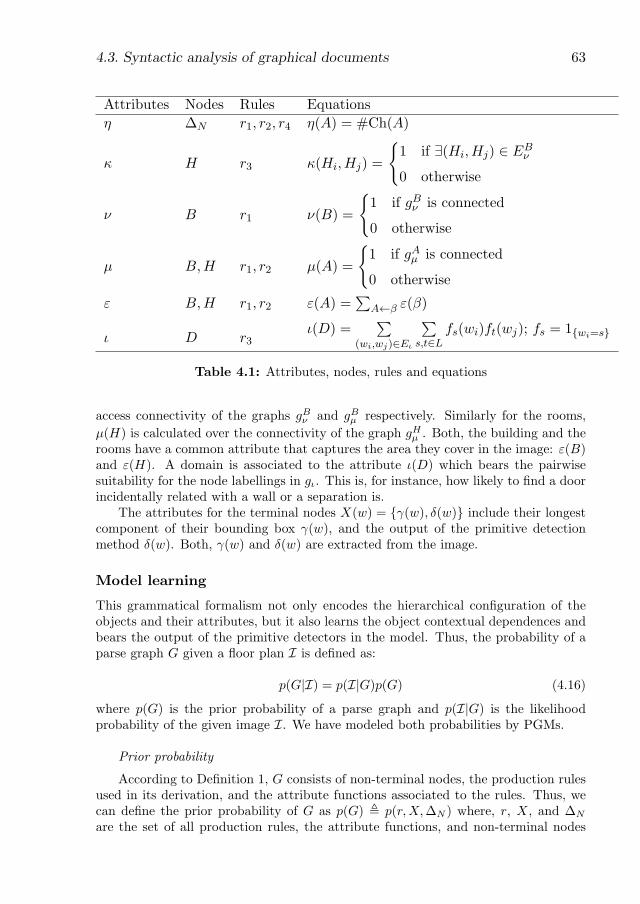
4.3. Syntactic analysis of graphical documents 63
Attributes Nodes Rules Equations
η ∆N r1, r2, r4 η(A) = #Ch(A)
κ H r3 κ(Hi,Hj) =
{1 if 9(Hi,Hj) 2 EB
ν
0 otherwise
ν B r1 ν(B) =
{1 if gBν is connected
0 otherwise
µ B,H r1, r2 µ(A) =
{1 if gAµ is connected
0 otherwise
ε B,H r1, r2 ε(A) =∑
A←β ε(β)
ι D r3ι(D) =
∑(wi,wj)∈Eι
∑s,t∈L
fs(wi)ft(wj); fs = 1{wi=s}
Table 4.1: Attributes, nodes, rules and equations
access connectivity of the graphs gB� and gB� respectively. Similarly for the rooms,
µ(H) is calculated over the connectivity of the graph gH� . Both, the building and therooms have a common attribute that captures the area they cover in the image: ε(B)and ε(H). A domain is associated to the attribute ι(D) which bears the pairwisesuitability for the node labellings in g�. This is, for instance, how likely to find a doorincidentally related with a wall or a separation is.
The attributes for the terminal nodes X(w) = fγ(w), δ(w)g include their longestcomponent of their bounding box γ(w), and the output of the primitive detectionmethod δ(w). Both, γ(w) and δ(w) are extracted from the image.
Model learning
This grammatical formalism not only encodes the hierarchical configuration of theobjects and their attributes, but it also learns the object contextual dependences andbears the output of the primitive detectors in the model. Thus, the probability of aparse graph G given a floor plan I is defined as:
p(GjI) = p(IjG)p(G) (4.16)
where p(G) is the prior probability of a parse graph and p(IjG) is the likelihoodprobability of the given image I. We have modeled both probabilities by PGMs.
Prior probability
According to Definition 1, G consists of non-terminal nodes, the production rulesused in its derivation, and the attribute functions associated to the rules. Thus, wecan define the prior probability of G as p(G) , p(r,X,∆N ) where, r, X, and ∆N
are the set of all production rules, the attribute functions, and non-terminal nodes
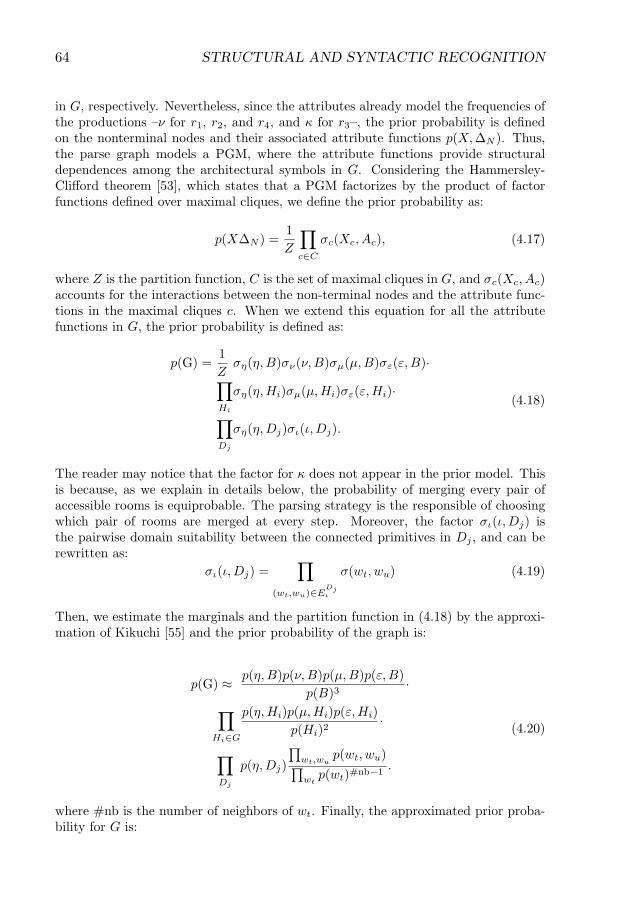
64 STRUCTURAL AND SYNTACTIC RECOGNITION
in G, respectively. Nevertheless, since the attributes already model the frequencies ofthe productions –ρ for r1, r2, and r4, and κ for r3–, the prior probability is definedon the nonterminal nodes and their associated attribute functions p(X,∆N ). Thus,the parse graph models a PGM, where the attribute functions provide structuraldependences among the architectural symbols in G. Considering the Hammersley-Clifford theorem [53], which states that a PGM factorizes by the product of factorfunctions defined over maximal cliques, we define the prior probability as:
p(X∆N ) =1
Z
∏c∈C
ϕc(Xc, Ac), (4.17)
where Z is the partition function, C is the set of maximal cliques in G, and ϕc(Xc, Ac)accounts for the interactions between the non-terminal nodes and the attribute func-tions in the maximal cliques c. When we extend this equation for all the attributefunctions in G, the prior probability is defined as:
p(G) =1
Zϕ�(η,B)ϕ�(ν,B)ϕ�(µ,B)ϕ"(ε,B)�∏
Hi
ϕ�(η,Hi)ϕ�(µ,Hi)ϕ"(ε,Hi)�∏Dj
ϕ�(η,Dj)ϕ�(ι,Dj).
(4.18)
The reader may notice that the factor for κ does not appear in the prior model. Thisis because, as we explain in details below, the probability of merging every pair ofaccessible rooms is equiprobable. The parsing strategy is the responsible of choosingwhich pair of rooms are merged at every step. Moreover, the factor ϕ�(ι,Dj) isthe pairwise domain suitability between the connected primitives in Dj , and can berewritten as:
ϕ�(ι,Dj) =∏
(wt;wu)∈EDjι
ϕ(wt, wu) (4.19)
Then, we estimate the marginals and the partition function in (4.18) by the approxi-mation of Kikuchi [55] and the prior probability of the graph is:
p(G) � p(η,B)p(ν,B)p(µ,B)p(ε,B)
p(B)3�∏
Hi∈G
p(η,Hi)p(µ,Hi)p(ε,Hi)
p(Hi)2�
∏Dj
p(η,Dj)
∏wt;wu
p(wt, wu)∏wt
p(wt)#nb−1.
(4.20)
where #nb is the number of neighbors of wt. Finally, the approximated prior proba-bility for G is:
4.3. Syntactic analysis of graphical documents 65
p(G) � p(ηjB)p(νjB)p(µjB)p(εjB)p(B)�∏Hi∈G
p(ηjHi)p(µjHi)p(εjHi)p(Hi)�
∏Dj
p(ηjDj)p(Dj)
∏wt;wu
p(wt, wu)∏wt
p(wt)#nb−1.
(4.21)
All the model parameters has been learned using the ontological knowledge expli-cated in Chapter 5. In the following we will explain how they have been estimated:
� p(ηjA) is the likelihood for a Poisson pdf on the number of children for eachnode:
p(η = kjA) = λkAe
−k
k!=
1
k!, (4.22)
where λA is the children average for a node type A, k = η(A).
� p(νjB), p(µjB), and p(µjH) are learned from sampling over the global graphsconnectivity of the children of B and H.
� p(εjA) is a Gaussian mixture pdf, learned employing the EM algorithm, on thearea of each type of node A.
� p(wt, wu) is learned from the GT.
Likelihood probability
The likelihood probability p(IjG) is formally defined as the conditional probabilityof an object image I of being generated by a parse graph G. In practice, I is composedof a set of attributes x directly extracted from an image and p(IjG) is a pdf linkingthese features with the terminal nodes of the parse graph. Thus, we define p(IjG) ,p(xjw) as:
p(xjw) = p(wjx)p(x)p(w)
, (4.23)
where p(x) is constant in the graph parsing, and p(wjx) estimates the domain of wgiven the attribute values γ(w) and δ(w). It is learned using a multinomial logisticregression.
Model recognition
Again, we address this problem from a probabilistic point of view. Thus, the under-standing problem is defined as a MAP inference given the input image.
G = argmaxG∈G
p(GjI) = argmaxG∈G
p(IjG)p(G) (4.24)
In order to find this graph we propose a greedy search algorithm that involvesthree consecutive steps: a first bottom-up graph initialization, a top-down verification
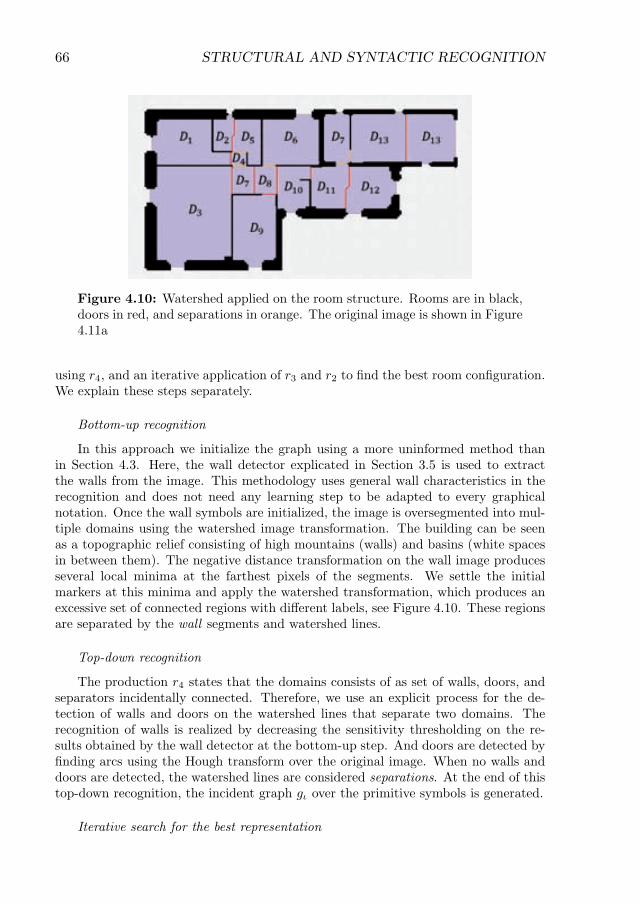
66 STRUCTURAL AND SYNTACTIC RECOGNITION
Figure 4.10: Watershed applied on the room structure. Rooms are in black,doors in red, and separations in orange. The original image is shown in Figure4.11a
using r4, and an iterative application of r3 and r2 to fi nd the best room confi guration.We explain these steps separately.
Bottom-up recognition
In this approach we initialize the graph using a more uninformed method thanin Section 4.3. Here, the wall detector explicated in Section 3.5 is used to extractthe walls from the image. This methodology uses general wall characteristics in therecognition and does not need any learning step to be adapted to every graphicalnotation. Once the wall symbols are initialized, the image is oversegmented into mul-tiple domains using the watershed image transformation. The building can be seenas a topographic relief consisting of high mountains (walls) and basins (white spacesin between them). The negative distance transformation on the wall image producesseveral local minima at the farthest pixels of the segments. We settle the initialmarkers at this minima and apply the watershed transformation, which produces anexcessive set of connected regions with diff erent labels, see Figure 4.10. These regionsare separated by the wall segments and watershed lines.
Top-down recognition
The production r4 states that the domains consists of as set of walls, doors, andseparators incidentally connected. Therefore, we use an explicit process for the de-tection of walls and doors on the watershed lines that separate two domains. Therecognition of walls is realized by decreasing the sensitivity thresholding on the re-sults obtained by the wall detector at the bottom-up step. And doors are detected byfi nding arcs using the Hough transform over the original image. When no walls anddoors are detected, the watershed lines are considered separations. At the end of thistop-down recognition, the incident graph gι over the primitive symbols is generated.
Iterative search for the best representation
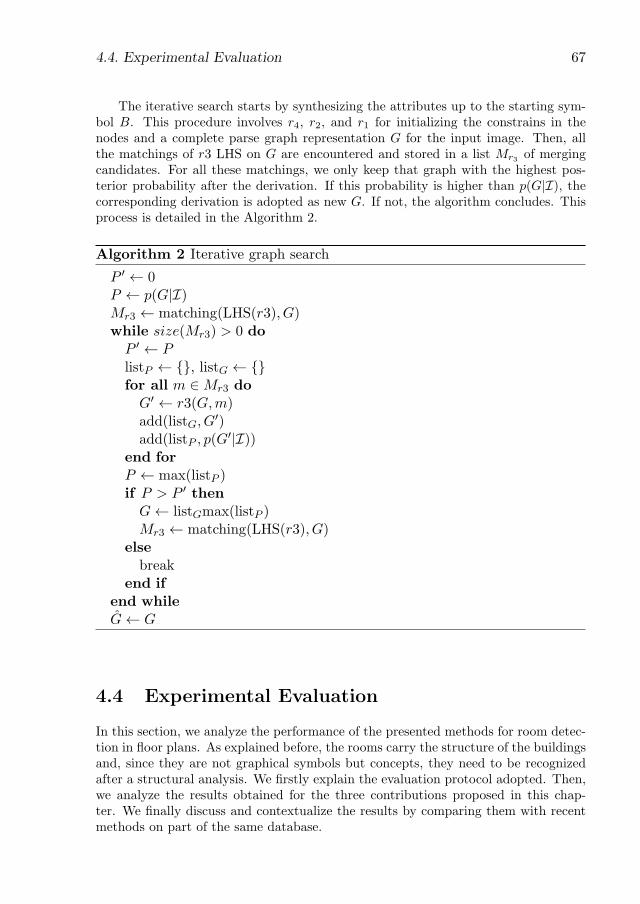
4.4. Experimental Evaluation 67
The iterative search starts by synthesizing the attributes up to the starting sym-bol B. This procedure involves r4, r2, and r1 for initializing the constrains in thenodes and a complete parse graph representation G for the input image. Then, allthe matchings of r3 LHS on G are encountered and stored in a list Mr3 of mergingcandidates. For all these matchings, we only keep that graph with the highest pos-terior probability after the derivation. If this probability is higher than p(GjI), thecorresponding derivation is adopted as new G. If not, the algorithm concludes. Thisprocess is detailed in the Algorithm 2.
Algorithm 2 Iterative graph search
P ′ 0P p(GjI)Mr3 matching(LHS(r3), G)while size(Mr3) > 0 do
P ′ PlistP fg, listG fgfor all m 2Mr3 do
G′ r3(G,m)add(listG, G
′)add(listP , p(G
′jI))end forP max(listP )if P > P ′ then
G listGmax(listP )Mr3 matching(LHS(r3), G)
elsebreak
end ifend whileG G
4.4 Experimental Evaluation
In this section, we analyze the performance of the presented methods for room detec-tion in floor plans. As explained before, the rooms carry the structure of the buildingsand, since they are not graphical symbols but concepts, they need to be recognizedafter a structural analysis. We firstly explain the evaluation protocol adopted. Then,we analyze the results obtained for the three contributions proposed in this chap-ter. We finally discuss and contextualize the results by comparing them with recentmethods on part of the same database.
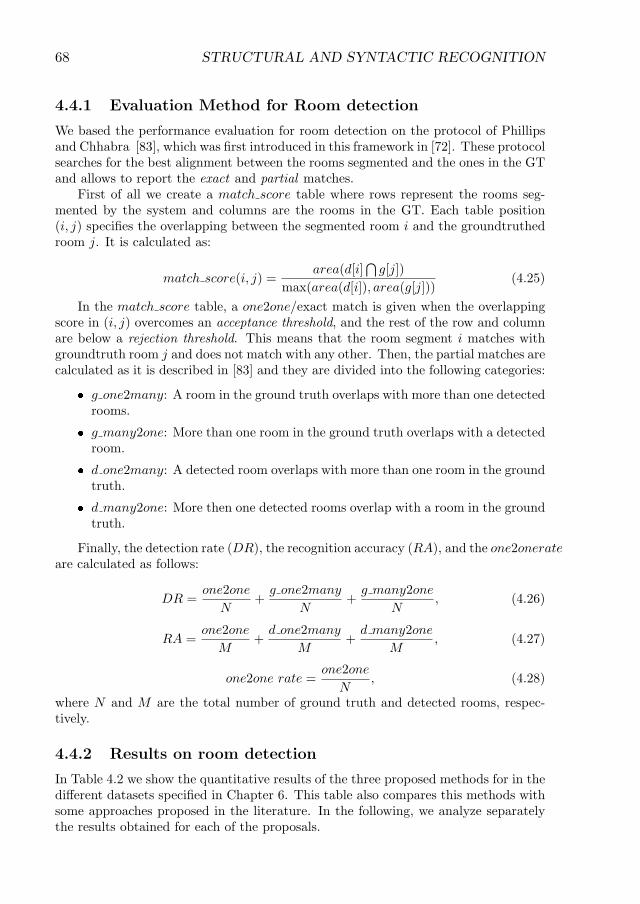
68 STRUCTURAL AND SYNTACTIC RECOGNITION
4.4.1 Evaluation Method for Room detection
We based the performance evaluation for room detection on the protocol of Phillipsand Chhabra [83], which was first introduced in this framework in [72]. These protocolsearches for the best alignment between the rooms segmented and the ones in the GTand allows to report the exact and partial matches.
First of all we create a match score table where rows represent the rooms seg-mented by the system and columns are the rooms in the GT. Each table position(i, j) specifies the overlapping between the segmented room i and the groundtruthedroom j. It is calculated as:
match score(i, j) =area(d[i]
∩g[j])
max(area(d[i]), area(g[j]))(4.25)
In the match score table, a one2one/exact match is given when the overlappingscore in (i, j) overcomes an acceptance threshold, and the rest of the row and columnare below a rejection threshold. This means that the room segment i matches withgroundtruth room j and does not match with any other. Then, the partial matches arecalculated as it is described in [83] and they are divided into the following categories:
� g one2many: A room in the ground truth overlaps with more than one detectedrooms.
� g many2one: More than one room in the ground truth overlaps with a detectedroom.
� d one2many: A detected room overlaps with more than one room in the groundtruth.
� d many2one: More then one detected rooms overlap with a room in the groundtruth.
Finally, the detection rate (DR), the recognition accuracy (RA), and the one2onerateare calculated as follows:
DR =one2one
N+
g one2many
N+
g many2one
N, (4.26)
RA =one2one
M+
d one2many
M+
d many2one
M, (4.27)
one2one rate =one2one
N, (4.28)
where N and M are the total number of ground truth and detected rooms, respec-tively.
4.4.2 Results on room detection
In Table 4.2 we show the quantitative results of the three proposed methods for in thedifferent datasets specified in Chapter 6. This table also compares this methods withsome approaches proposed in the literature. In the following, we analyze separatelythe results obtained for each of the proposals.
4.4. Experimental Evaluation 69
Structural method
Quantitative examples for this system are shown in Figures 4.11b, 4.12b, 4.13b, and4.14b. Moreover, we illustrate in Table 4.2 the quantitative results compared withthe rest of the methods. At a glance, we can verify that the performance obtainedin terms of the detection rate (DR) is practically perfect in all the datasets –alwaysover 90%–. This fact indicates that the vast majority of the room instances aredetected; regardless of the notations of the floor plan documents. Very differently,the recognition accuracy (RA) strongly varies depending on the dataset. For the Blackdataset the RA is very high, substantially outperforming the rest of the methods. Yet,for the rest of the datasets, it considerably decreases as a result of a worse detectionof the walls. In the Textured, Textured2, and Parallel datasets the notation is morechallenging than in the Black dataset. This leads to the wall detection approach toproduce several false positive instances on the outskirts of the building boundaries.Then, the intelligent search finds alignments between these walls producing false roomhypothesis. Moreover, this fact not only lowers the RA but it also increments theoversegmentation of the rooms. This fact is clearly seen in Figures 4.13b and 4.14band corroborated by the ⋆� 1 score in these datasets.
Syntactic-0
The syntactical mode Syntactic-0 has been designed as a preliminary approach tostudy the feasibility of applying syntactic models for floor plan understanding. Fur-thermore, the notation-specific methodology for the wall extraction determines theapplicability of the interpretation. It can only be applied on floor plans of the Blackdataset. The learning of this model is carried out following a leave-one-out strategy,i.e. using one image for testing and the rest for learning the parameters at each time.The quantitative results are shown in Table 4.2 and qualitative example is shownin Figure 4.11c. It is interesting to analyze the results by closely comparing themwith [72] as both methods are constructed from the same extraction of walls anddoors. As we can observe, the results in DR practically the same. Yet, our methodslightly outperforms the original approach in terms of RA. This small difference isproduced by the top-down inference, where inconsistent rooms, such as non accessiblespaces or unprovable, are ruled-out producing better interpretation hypothesis.
Syntactic
We show in Figures 4.11d, 4.12c, 4.13c, and 4.14c visual examples of the perfor-mance of Syntactic in the different datasets. Syntactic is a grammatical formalismthat models probabilistically the representation of the floor plans using PGM’s. Theparameters of this model are learned using a leave-one-out strategy for the completecollection of images. This is that for every test image, the rest 121 are used for learn-ing. It is worth to notice that independently of the testing image, we train usingimages of different resolution and notations. Our aim is to study the robustness ofthe method when no there is not prior knowledge on the type of image.
We analyze the results of the Syntactic in each dataset separately to draw a finalconclusion of its overall performance. In the Black dataset the interpretation it is
70 STRUCTURAL AND SYNTACTIC RECOGNITION
almost perfect. It outperforms the rest of the approaches in RA while maintaininga DR very close to the Structural method. The reason of this hight performanceis a good graph initialization combined with an appropriate modeling of the floorplan structure. When we focus on the results for the Textured Dataset, the DR issignificantly higher than the Structural. Contrarily, the RA drops for the same causeit also drops for the Structural method. The reason is that, since the detection of thewalls it is more challenging in this dataset, the untrained method several false positivesinstances that adversely affect the initialization of G. This problem extrapolates alsofor the Textured2 and Parallel datasets. Even though the DR results are more thansatisfactory, the multiple rooms generated out from the building boundaries decreasethe RA score. Clear examples of this problem are shown in Figures 4.13c and 4.14c.
4.4.3 Discussion of the Results
There are several key reasons, beyond those strictly related to performance, that makethe presented systems –Structural and Syntactic-2– very attractive for floor plan in-terpretation. Firstly, these methodologies are able work on documents of multiplegraphical vocabularies. The usage of statistic approximations to detect the primitivesymbols in the floor plan permits to deal with completely different notations. More-over, this technique also allows to relax some of the structural assumptions madeby some works in literature, such as assume that walls are straight elements, andalways horizontally and vertically aligned. In addition to that, both methods notonly detect the rooms in a floor plan but they also output the complete structure ofthe documents. This representation is expressed in an attributed graph that makesexplicit the attributes of the elements and their mutual contextual dependences. Aswe will explain in the next chapter, this explicit structural information will allow usto perform further semantic reasoning on the floor plan representations.
Finally, we also want to emphasize the generality of the presented approachesthat allows them to easily adapt to other graphics recognition tasks. On one side, theStructural method has already been adopted to implement part of the interpretationof flowcharts drawings in patent documents [92]. The process of room hypothesisdetection has been adapted to find the nodes in the flowcharts. Then, the proposedheuristic search algorithm has been applied to find correlations between symbols, andtext boxes and symbols. On the other side, the Statistical method proposes a completedifferent manner to tackle the problem. A probabilistic model learns automaticallythe structure of the documents in order to guide the recognition procedure. Therefore,this syntactical learning combined with appropriated parsing strategies can be easilyadapted to different applied frameworks.
4.5 Conclusion
In this chapter we have explained how graphical documents express complex seman-tic concepts by a set of structurally related symbols. Therefore, in order to makethe computers able to understand these documents, there is need of obtaining andmanaging this structural information.
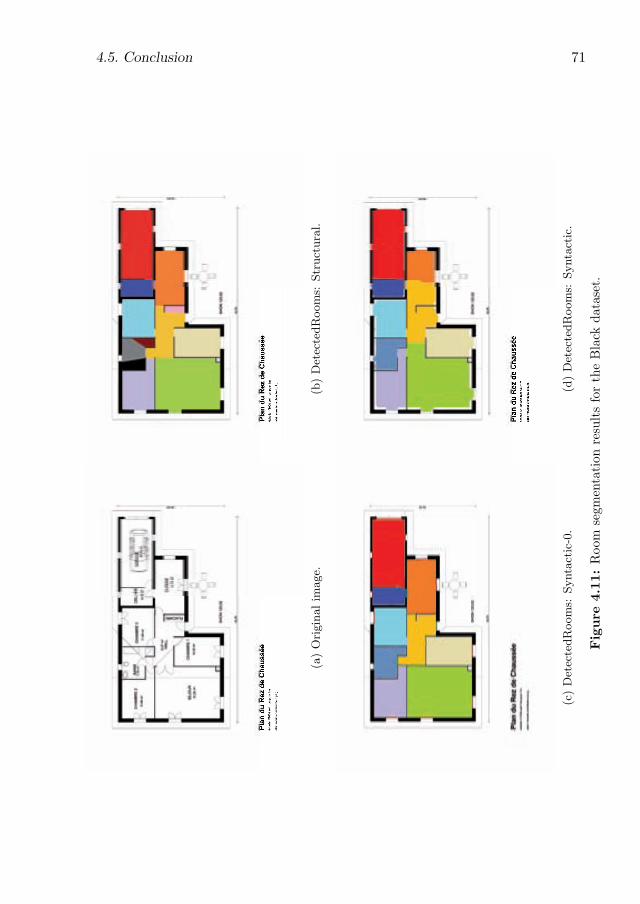
4.5. Conclusion 71
(a)Originalim
age.
(b)DetectedRooms:
Structural.
(c)DetectedRooms:
Syntactic-0.
(d)DetectedRooms:
Syntactic.
Figure
4.11:Room
segm
entation
resultsfortheBlack
dataset.
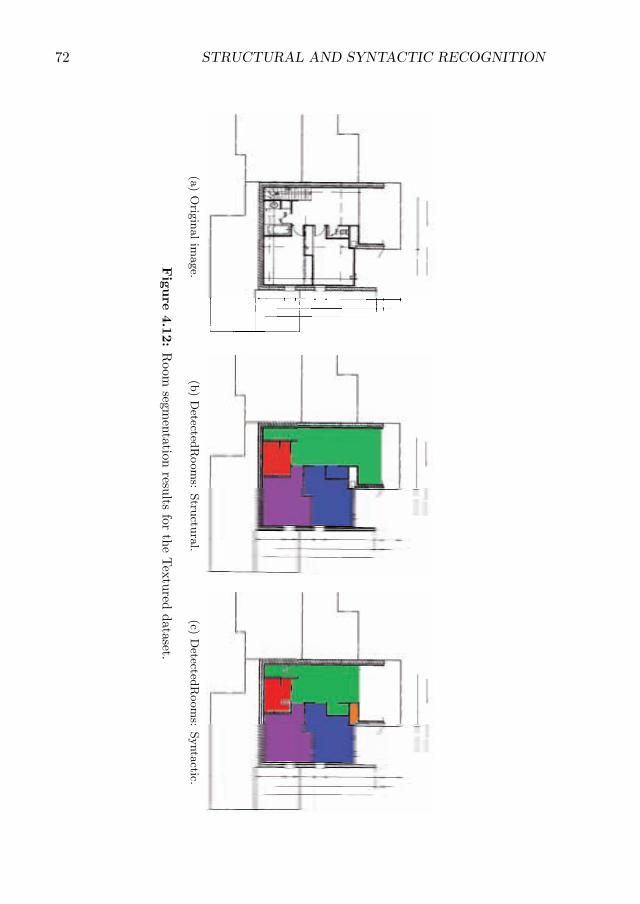
72 STRUCTURAL AND SYNTACTIC RECOGNITION
(a)Orig
inalim
age.
(b)Detected
Rooms:
Stru
ctural.
(c)Detected
Rooms:
Syntactic.
Figure
4.12:Room
segmentation
results
fortheTextured
dataset.
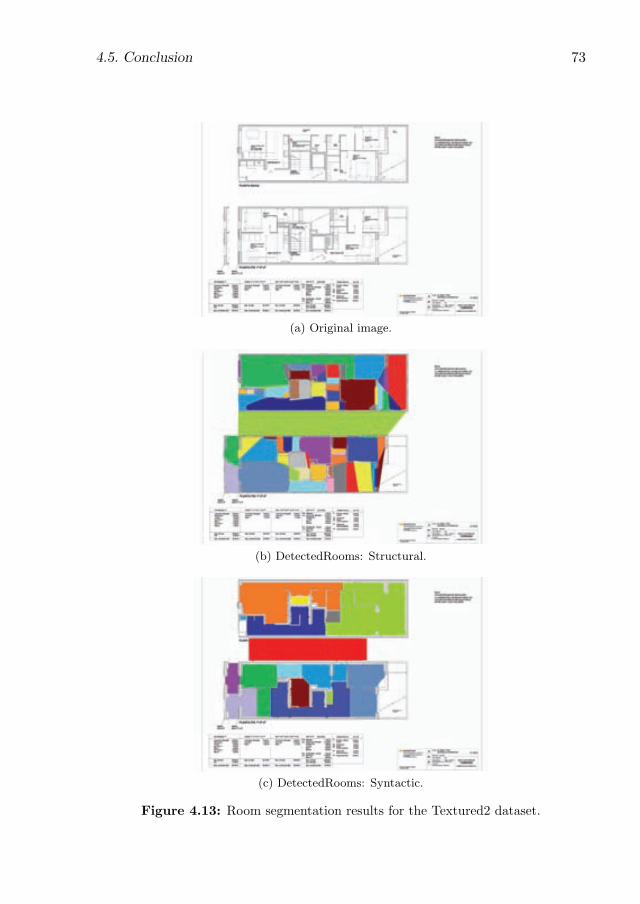
4.5. Conclusion 73
(a) Original image.
(b) DetectedRooms: Structural.
(c) DetectedRooms: Syntactic.
Figure 4.13: Room segmentation results for the Textured2 dataset.
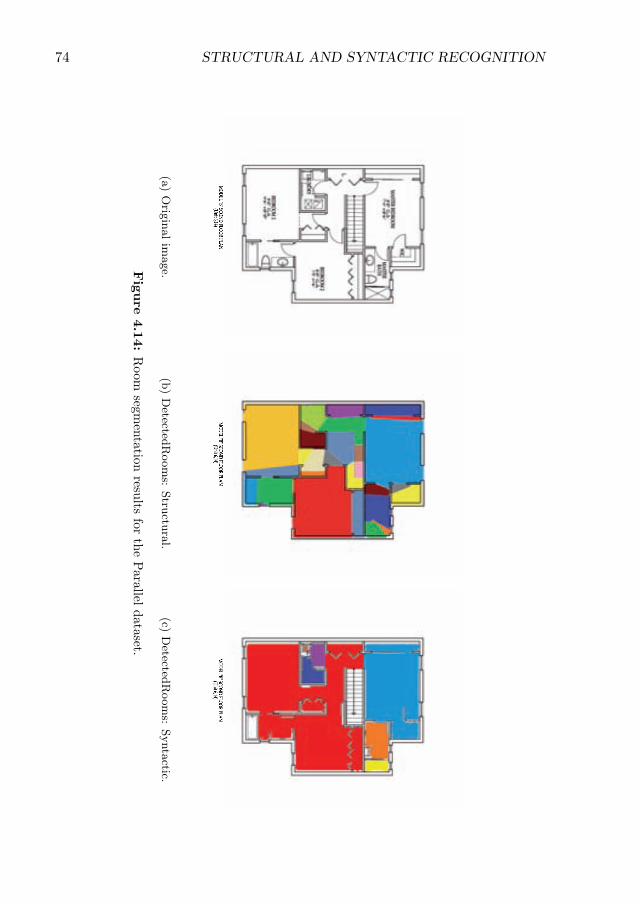
74 STRUCTURAL AND SYNTACTIC RECOGNITION
(a)Orig
inalim
age.
(b)Detected
Rooms:
Stru
ctural.
(c)Detected
Rooms:
Syntactic.
Figure
4.14:Room
segmentation
results
fortheParallel
dataset.
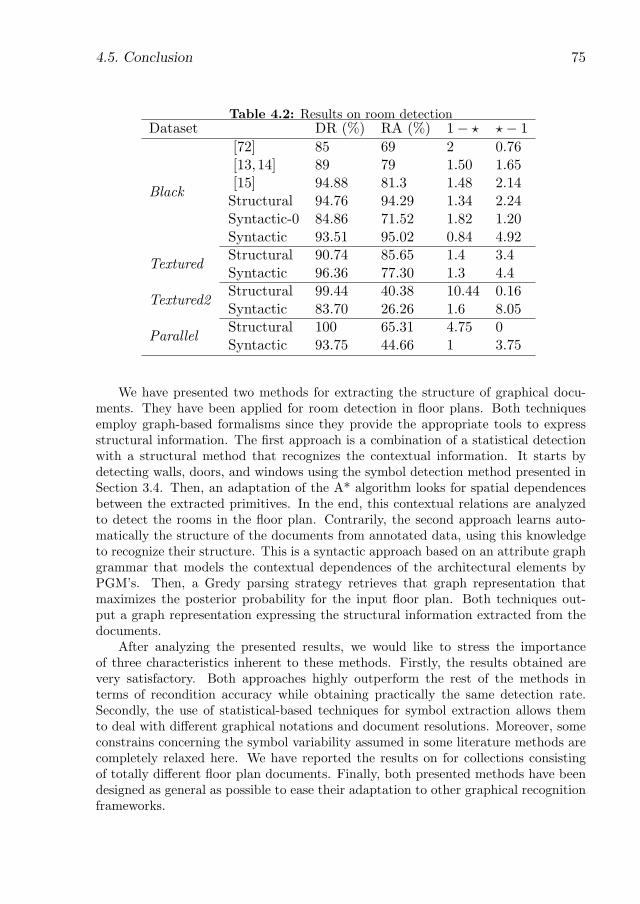
4.5. Conclusion 75
Table 4.2: Results on room detectionDataset DR (%) RA (%) 1� ⋆ ⋆� 1
Black
[72] 85 69 2 0.76[13,14] 89 79 1.50 1.65[15] 94.88 81.3 1.48 2.14Structural 94.76 94.29 1.34 2.24Syntactic-0 84.86 71.52 1.82 1.20Syntactic 93.51 95.02 0.84 4.92
TexturedStructural 90.74 85.65 1.4 3.4Syntactic 96.36 77.30 1.3 4.4
Textured2Structural 99.44 40.38 10.44 0.16Syntactic 83.70 26.26 1.6 8.05
ParallelStructural 100 65.31 4.75 0Syntactic 93.75 44.66 1 3.75
We have presented two methods for extracting the structure of graphical docu-ments. They have been applied for room detection in floor plans. Both techniquesemploy graph-based formalisms since they provide the appropriate tools to expressstructural information. The first approach is a combination of a statistical detectionwith a structural method that recognizes the contextual information. It starts bydetecting walls, doors, and windows using the symbol detection method presented inSection 3.4. Then, an adaptation of the A* algorithm looks for spatial dependencesbetween the extracted primitives. In the end, this contextual relations are analyzedto detect the rooms in the floor plan. Contrarily, the second approach learns auto-matically the structure of the documents from annotated data, using this knowledgeto recognize their structure. This is a syntactic approach based on an attribute graphgrammar that models the contextual dependences of the architectural elements byPGM’s. Then, a Gredy parsing strategy retrieves that graph representation thatmaximizes the posterior probability for the input floor plan. Both techniques out-put a graph representation expressing the structural information extracted from thedocuments.
After analyzing the presented results, we would like to stress the importanceof three characteristics inherent to these methods. Firstly, the results obtained arevery satisfactory. Both approaches highly outperform the rest of the methods interms of recondition accuracy while obtaining practically the same detection rate.Secondly, the use of statistical-based techniques for symbol extraction allows themto deal with different graphical notations and document resolutions. Moreover, someconstrains concerning the symbol variability assumed in some literature methods arecompletely relaxed here. We have reported the results on for collections consistingof totally different floor plan documents. Finally, both presented methods have beendesigned as general as possible to ease their adaptation to other graphical recognitionframeworks.
76 STRUCTURAL AND SYNTACTIC RECOGNITION
Chapter 5
Semantic analysis
5.1 Introduction
As already mentioned in this thesis, the graphical documents convey complex se-mantic concepts understandable by humans. This information is structured agreeingto a visual language; consisting of a vocabulary –graphical symbols– and a syntax–contextual relations–. Therefore, the semantic content expressed in a document isdefined by the contextualized meaning of its structurally related symbols. Let usexemplify this fact by making again an analogy with natural languages.
The following two sentences are correct in terms of vocabulary and syntax:
People drive carsCars drive people
Even though both sentences consist of the same set of words, their structure–syntactical positioning– leads the them to express completely different mean-ings. Moreover, given our natural knowledge of the language domain –the realworld–, we can assert that one of the sentences expresses an unlikely event.
Alike to natural language comprehension, graphical understanding requires theknowledge of the document domain. This knowledge defines the meaning of thecompounding items in a determined context. For instance, in Figure 5.1, the visualsyntax, e.g color matching and relative object location, combined with the domainknowledge of the graphical document allows us to answer complex questions such aswho won the Catalan elections of 2012?. Thus, aiming at making computers able tounderstand graphical documents, we need to provide them with the appropriate toolsto define, store, and employ this knowledge.
Ontologies are machine-interpretable specifications of conceptualizations [51]. Theymake explicit the description of concepts (classes), their attributes (properties) andmutual relationships that can exist in a domain. The domain definitions are written informal languages with an expressive power close to the first-order logic; the languagedefinition is independent to the data structure. Therefore, ontologies allow to describe
77
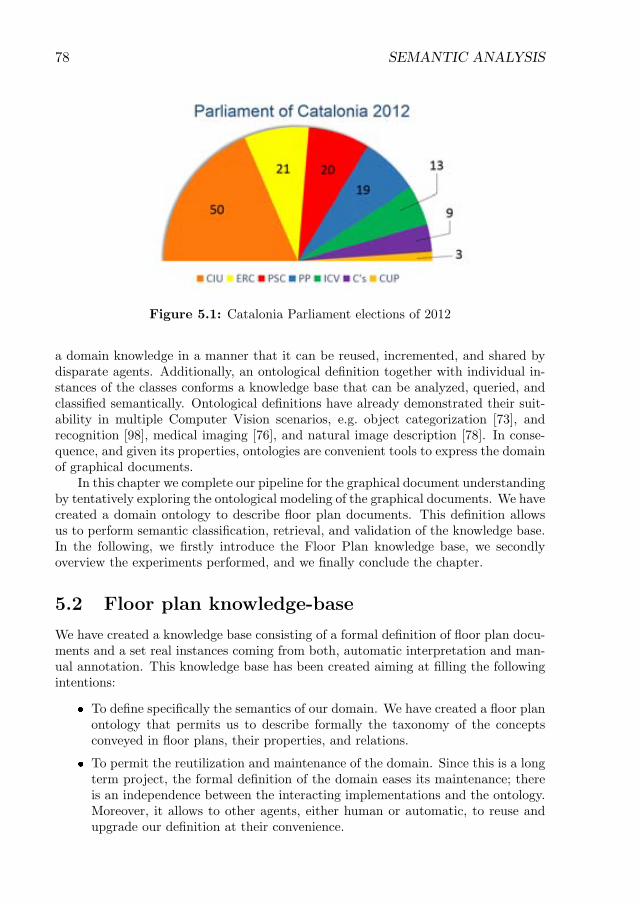
78 SEMANTIC ANALYSIS
Figure 5.1: Catalonia Parliament elections of 2012
a domain knowledge in a manner that it can be reused, incremented, and shared bydisparate agents. Additionally, an ontological definition together with individual in-stances of the classes conforms a knowledge base that can be analyzed, queried, andclassified semantically. Ontological definitions have already demonstrated their suit-ability in multiple Computer Vision scenarios, e.g. object categorization [73], andrecognition [98], medical imaging [76], and natural image description [78]. In conse-quence, and given its properties, ontologies are convenient tools to express the domainof graphical documents.
In this chapter we complete our pipeline for the graphical document understandingby tentatively exploring the ontological modeling of the graphical documents. We havecreated a domain ontology to describe floor plan documents. This definition allowsus to perform semantic classification, retrieval, and validation of the knowledge base.In the following, we firstly introduce the Floor Plan knowledge base, we secondlyoverview the experiments performed, and we finally conclude the chapter.
5.2 Floor plan knowledge-base
We have created a knowledge base consisting of a formal definition of floor plan docu-ments and a set real instances coming from both, automatic interpretation and man-ual annotation. This knowledge base has been created aiming at filling the followingintentions:
� To define specifically the semantics of our domain. We have created a floor planontology that permits us to describe formally the taxonomy of the conceptsconveyed in floor plans, their properties, and relations.
� To permit the reutilization and maintenance of the domain. Since this is a longterm project, the formal definition of the domain eases its maintenance; thereis an independence between the interacting implementations and the ontology.Moreover, it allows to other agents, either human or automatic, to reuse andupgrade our definition at their convenience.
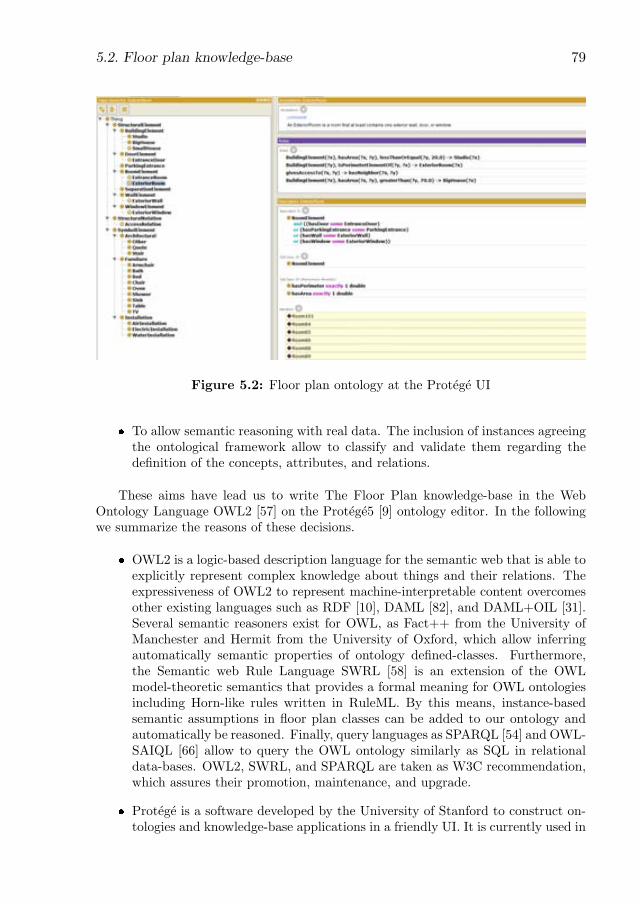
5.2. Floor plan knowledge-base 79
Figure 5.2: Floor plan ontology at the Protege UI
� To allow semantic reasoning with real data. The inclusion of instances agreeingthe ontological framework allow to classify and validate them regarding thedefinition of the concepts, attributes, and relations.
These aims have lead us to write The Floor Plan knowledge-base in the WebOntology Language OWL2 [57] on the Protege5 [9] ontology editor. In the followingwe summarize the reasons of these decisions.
� OWL2 is a logic-based description language for the semantic web that is able toexplicitly represent complex knowledge about things and their relations. Theexpressiveness of OWL2 to represent machine-interpretable content overcomesother existing languages such as RDF [10], DAML [82], and DAML+OIL [31].Several semantic reasoners exist for OWL, as Fact++ from the University ofManchester and Hermit from the University of Oxford, which allow inferringautomatically semantic properties of ontology defined-classes. Furthermore,the Semantic web Rule Language SWRL [58] is an extension of the OWLmodel-theoretic semantics that provides a formal meaning for OWL ontologiesincluding Horn-like rules written in RuleML. By this means, instance-basedsemantic assumptions in floor plan classes can be added to our ontology andautomatically be reasoned. Finally, query languages as SPARQL [54] and OWL-SAIQL [66] allow to query the OWL ontology similarly as SQL in relationaldata-bases. OWL2, SWRL, and SPARQL are taken as W3C recommendation,which assures their promotion, maintenance, and upgrade.
� Protege is a software developed by the University of Stanford to construct on-tologies and knowledge-base applications in a friendly UI. It is currently used in
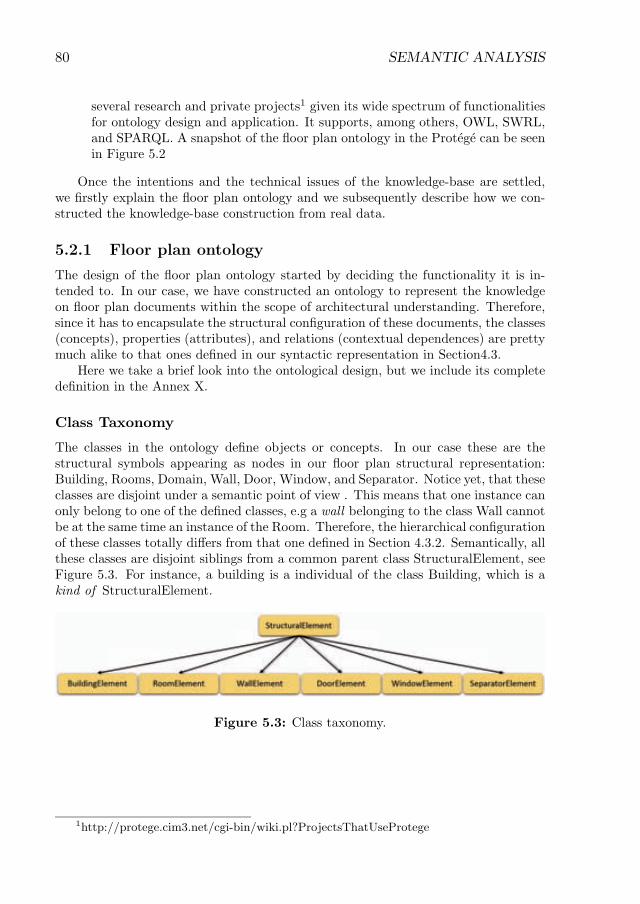
80 SEMANTIC ANALYSIS
several research and private projects1 given its wide spectrum of functionalitiesfor ontology design and application. It supports, among others, OWL, SWRL,and SPARQL. A snapshot of the fl oor plan ontology in the Protege can be seenin Figure 5.2
Once the intentions and the technical issues of the knowledge-base are settled,we fi rstly explain the fl oor plan ontology and we subsequently describe how we con-structed the knowledge-base construction from real data.
5.2.1 Floor plan ontology
The design of the fl oor plan ontology started by deciding the functionality it is in-tended to. In our case, we have constructed an ontology to represent the knowledgeon fl oor plan documents within the scope of architectural understanding. Therefore,since it has to encapsulate the structural confi guration of these documents, the classes(concepts), properties (attributes), and relations (contextual dependences) are prettymuch alike to that ones defi ned in our syntactic representation in Section4.3.
Here we take a brief look into the ontological design, but we include its completedefi nition in the Annex X.
Class Taxonomy
The classes in the ontology defi ne objects or concepts. In our case these are thestructural symbols appearing as nodes in our fl oor plan structural representation:Building, Rooms, Domain, Wall, Door, Window, and Separator. Notice yet, that theseclasses are disjoint under a semantic point of view . This means that one instance canonly belong to one of the defi ned classes, e.g a wall belonging to the class Wall cannotbe at the same time an instance of the Room. Therefore, the hierarchical confi gurationof these classes totally diff ers from that one defi ned in Section 4.3.2. Semantically, allthese classes are disjoint siblings from a common parent class StructuralElement, seeFigure 5.3. For instance, a building is a individual of the class Building, which is akind of StructuralElement.
Figure 5.3: Class taxonomy.
1http://protege.cim3.net/cgi-bin/wiki.pl?ProjectsThatUseProtege
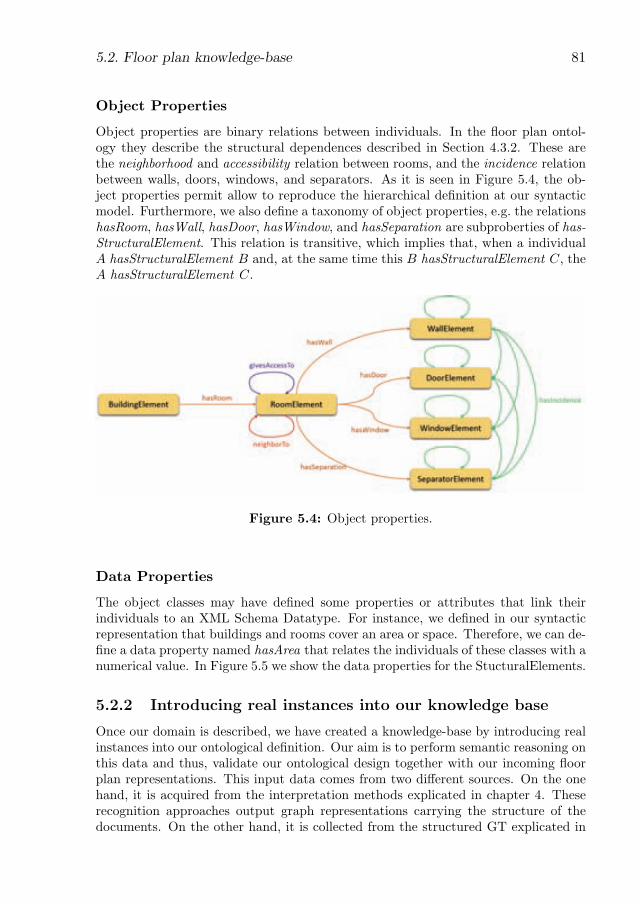
5.2. Floor plan knowledge-base 81
Object Properties
Object properties are binary relations between individuals. In the fl oor plan ontol-ogy they describe the structural dependences described in Section 4.3.2. These arethe neighborhood and accessibility relation between rooms, and the incidence relationbetween walls, doors, windows, and separators. As it is seen in Figure 5.4, the ob-ject properties permit allow to reproduce the hierarchical defi nition at our syntacticmodel. Furthermore, we also defi ne a taxonomy of object properties, e.g. the relationshasRoom, hasWall, hasDoor, hasWindow, and hasSeparation are subproberties of has-StructuralElement. This relation is transitive, which implies that, when a individualA hasStructuralElement B and, at the same time this B hasStructuralElement C, theA hasStructuralElement C.
Figure 5.4: Object properties.
Data Properties
The object classes may have defi ned some properties or attributes that link theirindividuals to an XML Schema Datatype. For instance, we defi ned in our syntacticrepresentation that buildings and rooms cover an area or space. Therefore, we can de-fi ne a data property named hasArea that relates the individuals of these classes with anumerical value. In Figure 5.5 we show the data properties for the StucturalElements.
5.2.2 Introducing real instances into our knowledge base
Once our domain is described, we have created a knowledge-base by introducing realinstances into our ontological defi nition. Our aim is to perform semantic reasoning onthis data and thus, validate our ontological design together with our incoming fl oorplan representations. This input data comes from two diff erent sources. On the onehand, it is acquired from the interpretation methods explicated in chapter 4. Theserecognition approaches output graph representations carrying the structure of thedocuments. On the other hand, it is collected from the structured GT explicated in
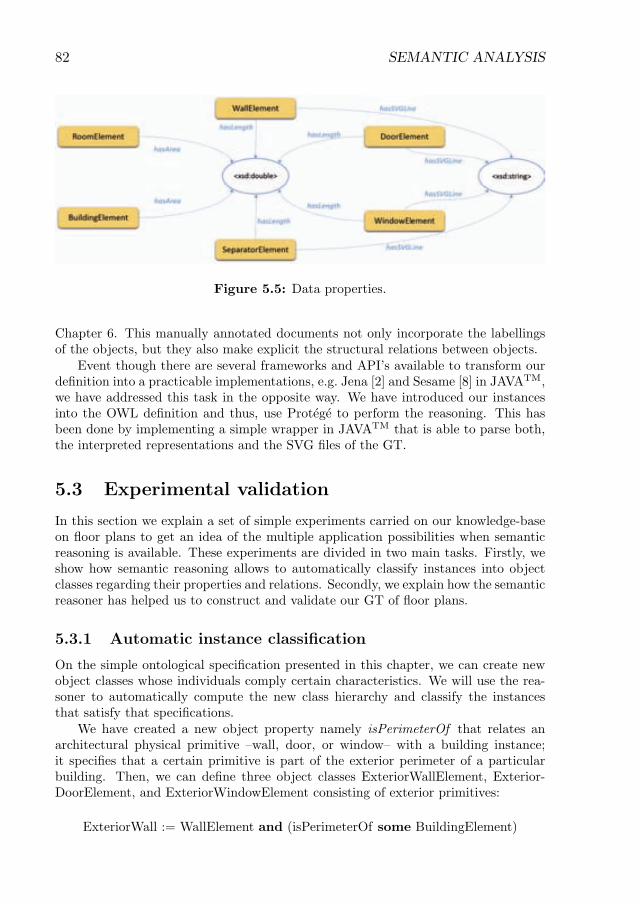
82 SEMANTIC ANALYSIS
Figure 5.5: Data properties.
Chapter 6. This manually annotated documents not only incorporate the labellingsof the objects, but they also make explicit the structural relations between objects.
Event though there are several frameworks and API’ s available to transform ourdefi nition into a practicable implementations, e.g. Jena [2] and Sesame [8] in JAVATM,we have addressed this task in the opposite way. We have introduced our instancesinto the OWL defi nition and thus, use Protege to perform the reasoning. This hasbeen done by implementing a simple wrapper in JAVATM that is able to parse both,the interpreted representations and the SVG fi les of the GT.
5.3 Experimental validation
In this section we explain a set of simple experiments carried on our knowledge-baseon fl oor plans to get an idea of the multiple application possibilities when semanticreasoning is available. These experiments are divided in two main tasks. Firstly, weshow how semantic reasoning allows to automatically classify instances into objectclasses regarding their properties and relations. Secondly, we explain how the semanticreasoner has helped us to construct and validate our GT of fl oor plans.
5.3.1 Automatic instance classifi cation
On the simple ontological specifi cation presented in this chapter, we can create newobject classes whose individuals comply certain characteristics. We will use the rea-soner to automatically compute the new class hierarchy and classify the instancesthat satisfy that specifi cations.
We have created a new object property namely isPerimeterOf that relates anarchitectural physical primitive – wall, door, or window– with a building instance;it specifi es that a certain primitive is part of the exterior perimeter of a particularbuilding. Then, we can defi ne three object classes ExteriorWallElement, Exterior-DoorElement, and ExteriorWindowElement consisting of exterior primitives:
ExteriorWall := WallElement and (isPerimeterOf some BuildingElement)
5.3. Experimental validation 83
ExteriorDoor := DoorElement and (isPerimeterOf some BuildingElement)ExteriorWindow := WindowElement and (isPerimeterOf some BuildingElement).
When we run the reasoner, it automatically infers that the classes ExteriorWall,ExteriorDoor, and ExteriorWindow are subclasses of WallElement, DoorElement, andWindowElement respectively. Furthermore, it automatically classifies that primitiveindividuals with a valid isPerimeterOf relation. Now we want to define what anexterior room is. We can do it as follows:
ExteriorRoom := RoomElement
and((hasWall some ExteriorWall)
or(hasDoor some ExteriorDoor)
or(hasWindow some ExteriorWindow)).
Therefore, an exterior room is a room instance that has a wall, a door, or a windowthat belongs to the exterior perimeter of a building. Let’s now define what an entranceroom of a building is. We do it as:
EntranceRoom := RoomElement
and(hasDoor some ExteriorDoor).
The reader may notice that both, ExteriorRoom and EntranceRoom are defined assubclasses of RoomElement. Yet, the reasoner actually infers that the class Entrance-Room is a subclass of ExteriorRoom, i.e. all instances of EntranceRoom are instancesof ExteriorRoom at the same time. Figure 5.6 shows a snapshot of the class hierarchybefore and after applying the reasoner. This feature is really helpful when the size ofthe ontology (the number of classes) starts to significantly increase and keeping themulticlass hierarchy becomes a challenging task.
Now, we can imagine that this knowledge base belongs to real estate companythat allows to search online their available flats for rent. It may be interesting toclassify the dwellings according to their usable space. Therefore, we can predefinesome classes to define different building types concerning their area:
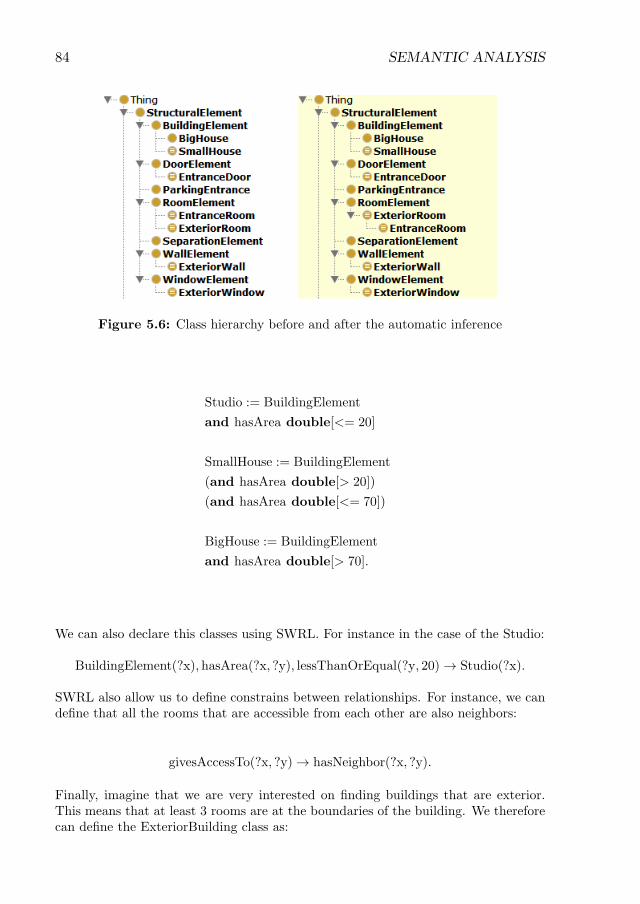
84 SEMANTIC ANALYSIS
Figure 5.6: Class hierarchy before and after the automatic inference
Studio := BuildingElement
and hasArea double[<= 20]
SmallHouse := BuildingElement
(and hasArea double[> 20])
(and hasArea double[<= 70])
BigHouse := BuildingElement
and hasArea double[> 70].
We can also declare this classes using SWRL. For instance in the case of the Studio:
BuildingElement(?x), hasArea(?x, ?y), lessThanOrEqual(?y, 20)! Studio(?x).
SWRL also allow us to define constrains between relationships. For instance, we candefine that all the rooms that are accessible from each other are also neighbors:
givesAccessTo(?x, ?y)! hasNeighbor(?x, ?y).
Finally, imagine that we are very interested on finding buildings that are exterior.This means that at least 3 rooms are at the boundaries of the building. We thereforecan define the ExteriorBuilding class as:
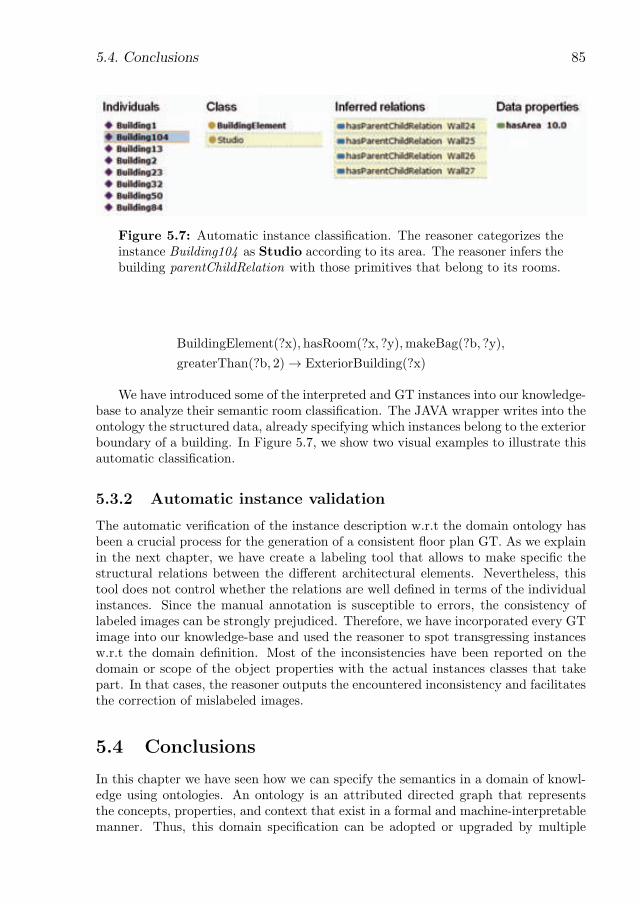
5.4. Conclusions 85
Figure 5.7: Automatic instance classifi cation. The reasoner categorizes theinstance Building104 as Studio according to its area. The reasoner infers thebuilding parentChildRelation with those primitives that belong to its rooms.
BuildingElement(?x), hasRoom(?x , ?y), makeBag(?b, ?y),
greaterThan(?b, 2) → ExteriorBuilding(?x)
We have introduced some of the interpreted and GT instances into our knowledge-base to analyze their semantic room classifi cation. The JAVA wrapper writes into theontology the structured data, already specifying which instances belong to the exteriorboundary of a building. In Figure 5.7, we show two visual examples to illustrate thisautomatic classifi cation.
5.3.2 Automatic instance validation
The automatic verifi cation of the instance description w.r.t the domain ontology hasbeen a crucial process for the generation of a consistent fl oor plan GT. As we explainin the next chapter, we have create a labeling tool that allows to make specifi c thestructural relations between the diff erent architectural elements. Nevertheless, thistool does not control whether the relations are well defi ned in terms of the individualinstances. Since the manual annotation is susceptible to errors, the consistency oflabeled images can be strongly prejudiced. Therefore, we have incorporated every GTimage into our knowledge-base and used the reasoner to spot transgressing instancesw.r.t the domain defi nition. Most of the inconsistencies have been reported on thedomain or scope of the object properties with the actual instances classes that takepart. In that cases, the reasoner outputs the encountered inconsistency and facilitatesthe correction of mislabeled images.
5.4 Conclusions
In this chapter we have seen how we can specify the semantics in a domain of knowl-edge using ontologies. An ontology is an attributed directed graph that representsthe concepts, properties, and context that exist in a formal and machine-interpretablemanner. Thus, this domain specifi cation can be adopted or upgraded by multiple
86 SEMANTIC ANALYSIS
agents for their own convenience. In addition to that, an ontological definition to-gether with real instances compose a knowledge base on the domain. Given the formalstructure of this knowledge, ontological reasoners can analyze this data and extractcomplex semantic concepts from the structured data.
We have created an ontology to define the semantic meaning expressed in floorplan documents. This ontology has allowed us to specifically define the architecturalconcepts appearing in this documents, their attributes, and relations. It has beenwritten in the Ontology Web Language due to its convenient expressibility and themultiple tools available for this language. Into our definition we have introduced realinstances from both, interpreted and GT floor plans, to create a knowledge base offloor plans. Then, we have experimentally illustrated the applied possibilities whenwe can perform semantic reasoning. For instance, we have created new concepts byassociating the existing knowledge and used to classify the individuals accordingly.Finally, we have explained why the ontological definition of our domain has been ofessential help at the GT generation.
Chapter 6
Floor plan database
6.1 Introduction
Current advances on structured learning methods in many pattern recognition taskshave driven to the development of new approaches encoding structural information.For instance, structured SVM [62] have been used for object segmentation [20],and conditional random fields [60] have largely applied in many object recognitiontasks [87]. In the field of document image analysis, there is a long experience onstructural methods for information extraction and analysis of multiple types of docu-ments: Markov logic networks [90] have been applied for contextual word spotting onhistorical documents [46], and graph matching algorithms have been used for symbolrecognition on technical drawings [68]. With all, these systems usually need conve-niently annotated databases to extract and learn the structural interrelations amongobjects. The lack of such available databases may constrain the research advances insome domains, which is for instance, the case of automatic floor plan understanding.
In order to representatively evaluate all the contributions presented in this thesis,some of them based on structured learning, we have created a database of real floorplans that fulfill three different requirements:
1. The database should model the real variability of the problem. This means thatit has to incorporate floor plans of different graphical notations, resolutions,purpose, and sort of information.
2. The dataset must be adequately annotated to guarantee a fair performanceevaluation for the different contributions.
3. The collection must grant the extraction of structural interrelations amongthe architectural elements. This would let the structured learning systems toexplicitly learn contextual object dependences and trigger better interpretation.
Yet, the creation of databases entails a main difficulty: the image labeling. Eventhough it is a straightforward procedure, the creation of ground truth (GT) is, forthe most part, tedious and slow. Thus, tools allowing complex GT generation in anefficient way are highly required to speed up this procedure and make it as lighter as
87
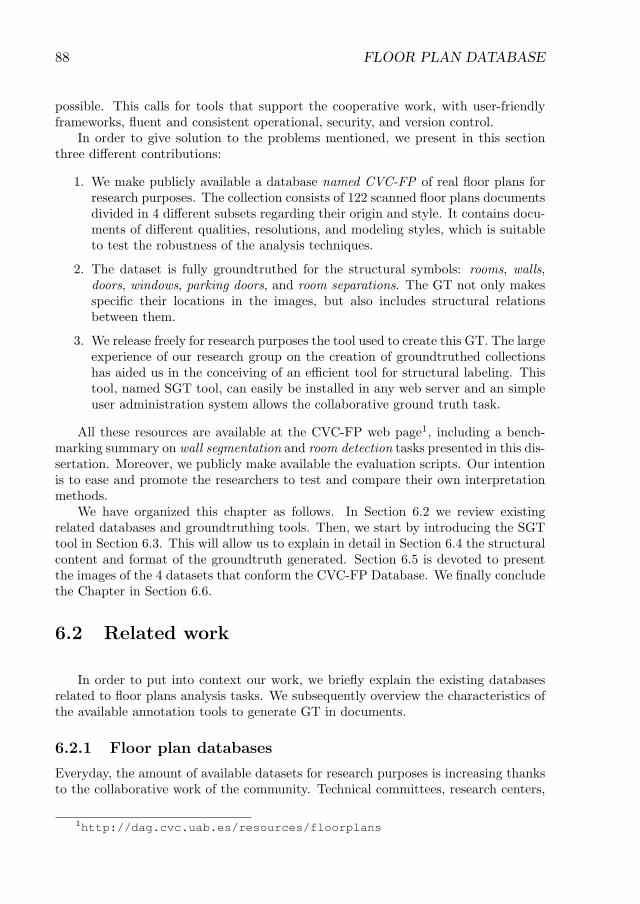
88 FLOOR PLAN DATABASE
possible. This calls for tools that support the cooperative work, with user-friendlyframeworks, fluent and consistent operational, security, and version control.
In order to give solution to the problems mentioned, we present in this sectionthree different contributions:
1. We make publicly available a database named CVC-FP of real floor plans forresearch purposes. The collection consists of 122 scanned floor plans documentsdivided in 4 different subsets regarding their origin and style. It contains docu-ments of different qualities, resolutions, and modeling styles, which is suitableto test the robustness of the analysis techniques.
2. The dataset is fully groundtruthed for the structural symbols: rooms, walls,doors, windows, parking doors, and room separations. The GT not only makesspecific their locations in the images, but also includes structural relationsbetween them.
3. We release freely for research purposes the tool used to create this GT. The largeexperience of our research group on the creation of groundtruthed collectionshas aided us in the conceiving of an efficient tool for structural labeling. Thistool, named SGT tool, can easily be installed in any web server and an simpleuser administration system allows the collaborative ground truth task.
All these resources are available at the CVC-FP web page1, including a bench-marking summary on wall segmentation and room detection tasks presented in this dis-sertation. Moreover, we publicly make available the evaluation scripts. Our intentionis to ease and promote the researchers to test and compare their own interpretationmethods.
We have organized this chapter as follows. In Section 6.2 we review existingrelated databases and groundtruthing tools. Then, we start by introducing the SGTtool in Section 6.3. This will allow us to explain in detail in Section 6.4 the structuralcontent and format of the groundtruth generated. Section 6.5 is devoted to presentthe images of the 4 datasets that conform the CVC-FP Database. We finally concludethe Chapter in Section 6.6.
6.2 Related work
In order to put into context our work, we briefly explain the existing databasesrelated to floor plans analysis tasks. We subsequently overview the characteristics ofthe available annotation tools to generate GT in documents.
6.2.1 Floor plan databases
Everyday, the amount of available datasets for research purposes is increasing thanksto the collaborative work of the community. Technical committees, research centers,
1http://dag.cvc.uab.es/resources/floorplans
6.2. Related work 89
and universities are highly contributing by updating, maintaining, and sharing theirresources [11]. Yet, we are still far away from having a wide range of representativebenchmark datasets for the different scenarios in document analysis. Testing andcomparing different approaches in distinct domains is limited to few well known la-beled collections. This fact sometimes can favor ad-hoc systems that fit very well inthe existing datasets over those ones which better fill in the large variability of thereal world. For these reason, new annotated datasets, well structured and detailed,that fill empty spaces in any research domain are always welcome.
In our area of interest, graphics recognition in documents, multiple availabledatabases have been incorporated for the different sub-areas that it covers. Thesedatasets can be created either by means of synthetic data generation or by real docu-ment annotation. On the one hand, synthetic databases consist of data generated byvarying a predefined set of parameters to model different degrees of distortion, noise,and degradation than real documents may suffer. The generation of these sort ofcollections tends to be much faster than the annotated ones. In return, the model hasto be closed enough to the reality to allow strong conclusions when using them. Onthe other hand, the annotated databases of real documents reflect the real variabil-ity of the world. However, collecting and manually groundtruthing the images canbe very time demanding. This issue can be relaxed by semi-automatic annotationprocedures [77].
One example of synthetic database is the GREC’2003 [100]. It was conceived inthe IAPR International Workshop on Graphics Recognition in 2003 to settle up acommon evaluation strategy for symbol recognition. This challenge dataset contains50 cropped models from architectural and electrical documents. The primitives ofthese symbols are lines and arcs, which are subjected to different levels of noise,shape distortions, and linear transformations. Lately, the GREC’2011 dataset [99]was created not only as an extension of GREC’2003 in terms of recognition, but alsoincluded a symbol spotting contest in both architectural and electrical documents.
One of the most used databases for symbol recognition related tasks is the SESYDdatabase [35]. It is a collection of labeled synthetic images. They include architecturaland electrical documents for symbol spotting, recognition, and retrieval. Additionaldatasets for text-graphic separation and text segmentation are included. Regardingits floor plan collections, they are specifically generated for detection purposes; leavingaside the semantic assembly between symbols and the building structure.
The FPLAN-POLY database [91] is, to our best knowledge, the only availablecollection of annotated real floor plans. Nevertheless, it aims for symbol spottingtasks. It contains 38 symbol models in a collection consisting of 48 vectorized images.
Despite there is not any floor plan database for complete analysis purposes, onother structured drawings such as flowchart diagrams, several work has been pursuedon structural and semantic understanding. Thereby, the CLEF-IP initiative investi-gates information retrieval techniques on patent documents. One of the goals of thatchallenge consists of extracting the structural information from patent flowcharts inorder to be queried semantically a posteriori. This process entails not only the de-tection and recognition of the elements participating in the diagrams (nodes, text,arrows), but also the structural assembly between them and their semantic mean-ing [85,92].
90 FLOOR PLAN DATABASE
6.2.2 Groundtruthing tools
In the document analysis domain we can find a large set of tools developed for thegeneration of GT. We analyze them by describing their functionality and limitations.
Most of the existing groundtruthing tools for document analysis related tasks areoriented to deal with textual documents. On the one hand, some of them addressthe evaluation of logical and physical layout methods, e.g. Aletheia [30], GEDI [37],TRUEVIZ [52], PinkPanther [105], and GiDoc2. Here, entities are represented byrectangular or polygonal regions by both physical and logical information. Physicalinformation usually belongs to textual regions, pictures, figures, tables, etc. while log-ical information usually denote the semantic meaning of each physical entity in thedocument context, i.e. headers, title, footnote, etc. On the other hand, some tools fo-cus on performance evaluation at pixel level. These tools aim at a very accurate pixelannotation and include semi-automatic labeling tools to improve the groundtruthingefficiency. Examples of these tools are the multi-platform based on JavaTM PixLa-beler [94], and the very recent web-based tools WebGT [22] and APEP-te [63].
The specific focus of the previously cited tools hinder their usability on otherdocument analysis tasks, i.e. graphics recognition. Some of them only allow to labelrectangular segments [48, 52, 103]. Others delimit the definition of object categoriesinto a small set of predefined classes [22, 94]. Moreover, the definition of objectdependences usually rely on hierarchical information [63, 105] and limited structuralconcepts [30, 37], i.e. reading order and relative location. Furthermore, to our bestknowledge, only [30] has a multilayer representation that permits the labeling of fullyoverlapped objects.
Finally, it is worth to mention that the current tendency is to design multiusertools that foster real-time grountruthing cooperation either by versioning control [22,63] or following crowdsourcing strategies [17, 48]. Moreover, the vast majority of therecent tools use slight variation based on XML for GT specification, i.e. the PAGEformat [86]. This fact permits to easily adapt the existing platforms to parse GT filesgenerated by other applications. Yet, none of the existing web-based tools uses theSVG format to naturally display the GT at the web browser interfaces.
6.3 The structural groundtruthing tool
The SGT tool is thought to perform general purpose groundtruthing; not restrictedonly to one specific domain as most of the existing tools are. It grants full flexibilitysince the proprietaries of the databases can create, modify, and erase their own objectclasses. Additionally, it is possible to define and declare n-ary properties for theobjects, that allows to represent the ground truth as an attributed graph, wherenodes are labeled objects and edges are relations between them. In Figure 6.1 we cansee an scheme of the SGT tool architecture. The SGT tool is user-friendly, it allows 2different labeling options, and the output is in the standard Scalable Vector Graphics(SVG). The tool is a cross-platform running on a web service, which enforces co-working without sacrificing security. It has been implemented in php5 and HTML5,
2https://prhlt.iti.upv.es/page/projects/multimodal/idoc/gidoc
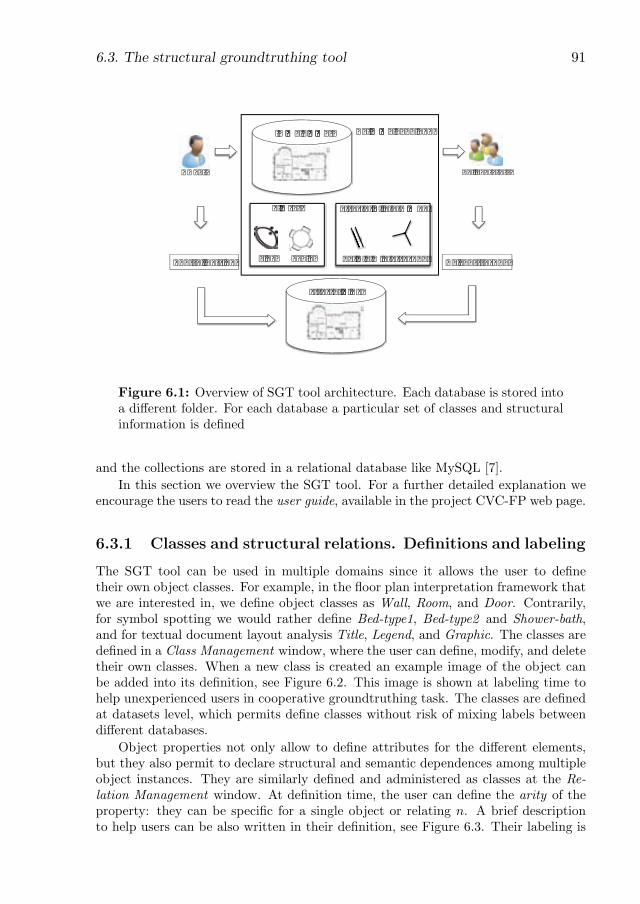
6.3. The structural groundtruthing tool 91
� � � � � � � � � �
� � � � � � � � � � � � � � � � � � � � � � � � � � �
� � � � � � � � � � � � � � � � � � �
� � � � � � � � � � � � �
� � � � � � � � � � � � � � �
� � � � � � � � � � � � � �
� � � � � � � � � � � � � � �
� � � � � � � � � � �
� � � � � � � � � � � � � � � � � �
Figure 6.1: Overview of SGT tool architecture. Each database is stored intoa diff erent folder. For each database a particular set of classes and structuralinformation is defi ned
and the collections are stored in a relational database like MySQL [7].
In this section we overview the SGT tool. For a further detailed explanation weencourage the users to read the user guide, available in the project CVC-FP web page.
6.3.1 Classes and structural relations. Defi nitions and labeling
The SGT tool can be used in multiple domains since it allows the user to defi netheir own object classes. For example, in the fl oor plan interpretation framework thatwe are interested in, we defi ne object classes as Wall, Room, and Door. Contrarily,for symbol spotting we would rather defi ne Bed-type1, Bed-type2 and Shower-bath,and for textual document layout analysis Title, Legend, and Graphic. The classes aredefi ned in a Class Management window, where the user can defi ne, modify, and deletetheir own classes. When a new class is created an example image of the object canbe added into its defi nition, see Figure 6.2. This image is shown at labeling time tohelp unexperienced users in cooperative groundtruthing task. The classes are defi nedat datasets level, which permits defi ne classes without risk of mixing labels betweendiff erent databases.
Object properties not only allow to defi ne attributes for the diff erent elements,but they also permit to declare structural and semantic dependences among multipleobject instances. They are similarly defi ned and administered as classes at the Re-lation Management window. At defi nition time, the user can defi ne the arity of theproperty: they can be specifi c for a single object or relating n. A brief descriptionto help users can be also written in their defi nition, see Figure 6.3. Their labeling is
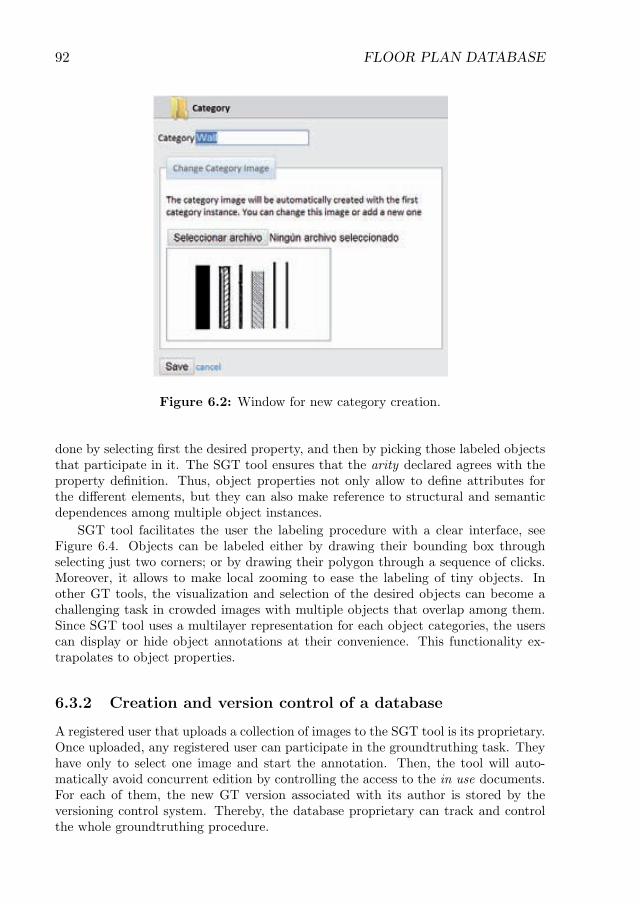
92 FLOOR PLAN DATABASE
Figure 6.2: Window for new category creation.
done by selecting fi rst the desired property, and then by picking those labeled objectsthat participate in it. The SGT tool ensures that the arity declared agrees with theproperty defi nition. Thus, object properties not only allow to defi ne attributes forthe diff erent elements, but they can also make reference to structural and semanticdependences among multiple object instances.
SGT tool facilitates the user the labeling procedure with a clear interface, seeFigure 6.4. Objects can be labeled either by drawing their bounding box throughselecting just two corners; or by drawing their polygon through a sequence of clicks.Moreover, it allows to make local zooming to ease the labeling of tiny objects. Inother GT tools, the visualization and selection of the desired objects can become achallenging task in crowded images with multiple objects that overlap among them.Since SGT tool uses a multilayer representation for each object categories, the userscan display or hide object annotations at their convenience. This functionality ex-trapolates to object properties.
6.3.2 Creation and version control of a database
A registered user that uploads a collection of images to the SGT tool is its proprietary.Once uploaded, any registered user can participate in the groundtruthing task. Theyhave only to select one image and start the annotation. Then, the tool will auto-matically avoid concurrent edition by controlling the access to the in use documents.For each of them, the new GT version associated with its author is stored by theversioning control system. Thereby, the database proprietary can track and controlthe whole groundtruthing procedure.
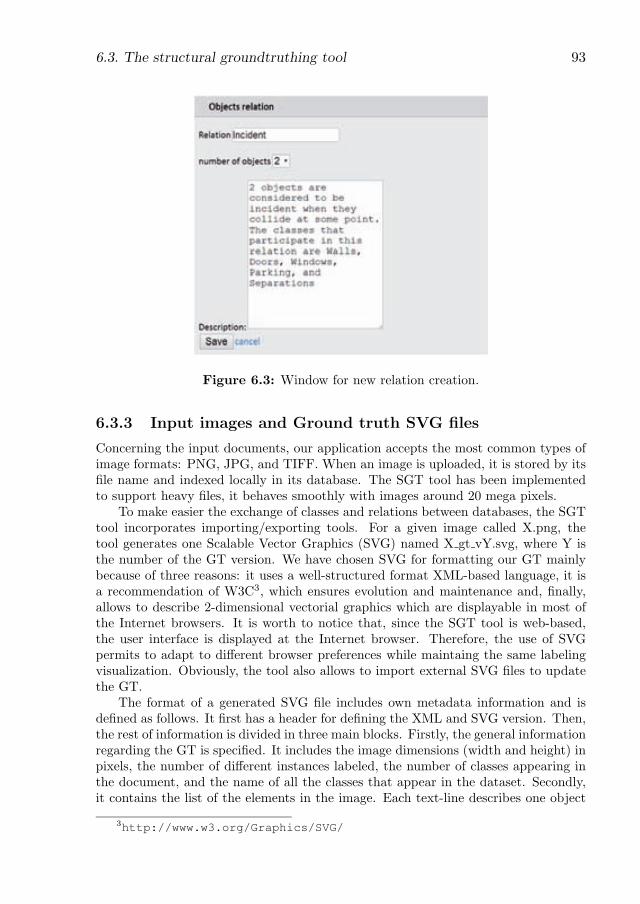
6.3. The structural groundtruthing tool 93
Figure 6.3: Window for new relation creation.
6.3.3 Input images and Ground truth SVG fi les
Concerning the input documents, our application accepts the most common types ofimage formats: PNG, JPG, and TIFF. When an image is uploaded, it is stored by itsfi le name and indexed locally in its database. The SGT tool has been implementedto support heavy fi les, it behaves smoothly with images around 20 mega pixels.
To make easier the exchange of classes and relations between databases, the SGTtool incorporates importing/exporting tools. For a given image called X.png, thetool generates one Scalable Vector Graphics (SVG) named X gt vY.svg, where Y isthe number of the GT version. We have chosen SVG for formatting our GT mainlybecause of three reasons: it uses a well-structured format XML-based language, it isa recommendation of W3C3, which ensures evolution and maintenance and, fi nally,allows to describe 2-dimensional vectorial graphics which are displayable in most ofthe Internet browsers. It is worth to notice that, since the SGT tool is web-based,the user interface is displayed at the Internet browser. Therefore, the use of SVGpermits to adapt to diff erent browser preferences while maintaing the same labelingvisualization. Obviously, the tool also allows to import external SVG fi les to updatethe GT.
The format of a generated SVG fi le includes own metadata information and isdefi ned as follows. It fi rst has a header for defi ning the XML and SVG version. Then,the rest of information is divided in three main blocks. Firstly, the general informationregarding the GT is specifi ed. It includes the image dimensions (width and height) inpixels, the number of diff erent instances labeled, the number of classes appearing inthe document, and the name of all the classes that appear in the dataset. Secondly,it contains the list of the elements in the image. Each text-line describes one object
3http://www.w3.org/Graphics/SVG/
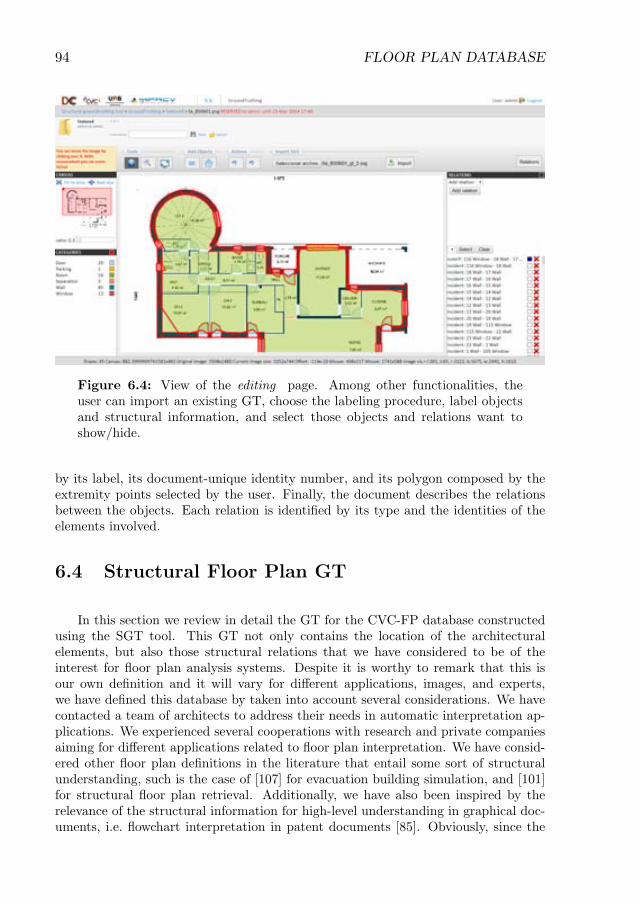
94 FLOOR PLAN DATABASE
Figure 6.4: View of the editing page. Among other functionalities, theuser can import an existing GT, choose the labeling procedure, label objectsand structural information, and select those objects and relations want toshow/hide.
by its label, its document-unique identity number, and its polygon composed by theextremity points selected by the user. Finally, the document describes the relationsbetween the objects. Each relation is identified by its type and the identities of theelements involved.
6.4 Structural Floor Plan GT
In this section we review in detail the GT for the CVC-FP database constructedusing the SGT tool. This GT not only contains the location of the architecturalelements, but also those structural relations that we have considered to be of theinterest for floor plan analysis systems. Despite it is worthy to remark that this isour own definition and it will vary for different applications, images, and experts,we have defined this database by taken into account several considerations. We havecontacted a team of architects to address their needs in automatic interpretation ap-plications. We experienced several cooperations with research and private companiesaiming for different applications related to floor plan interpretation. We have consid-ered other floor plan definitions in the literature that entail some sort of structuralunderstanding, such is the case of [107] for evacuation building simulation, and [101]for structural floor plan retrieval. Additionally, we have also been inspired by therelevance of the structural information for high-level understanding in graphical doc-uments, i.e. flowchart interpretation in patent documents [85]. Obviously, since the
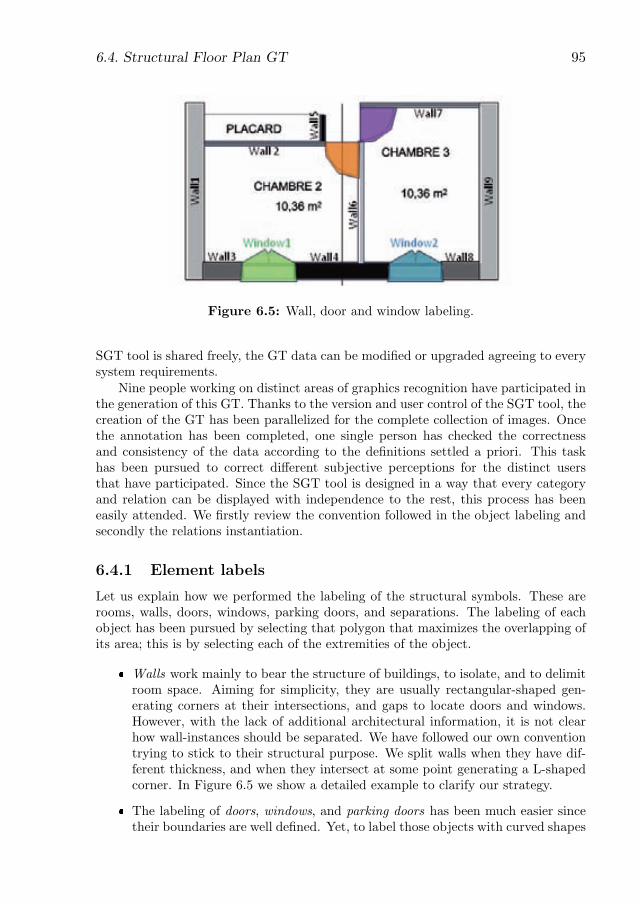
6.4. Structural Floor Plan GT 95
Figure 6.5: Wall, door and window labeling.
SGT tool is shared freely, the GT data can be modifi ed or upgraded agreeing to everysystem requirements.
Nine people working on distinct areas of graphics recognition have participated inthe generation of this GT. Thanks to the version and user control of the SGT tool, thecreation of the GT has been parallelized for the complete collection of images. Oncethe annotation has been completed, one single person has checked the correctnessand consistency of the data according to the defi nitions settled a priori. This taskhas been pursued to correct diff erent subjective perceptions for the distinct usersthat have participated. Since the SGT tool is designed in a way that every categoryand relation can be displayed with independence to the rest, this process has beeneasily attended. We fi rstly review the convention followed in the object labeling andsecondly the relations instantiation.
6.4.1 Element labels
Let us explain how we performed the labeling of the structural symbols. These arerooms, walls, doors, windows, parking doors, and separations. The labeling of eachobject has been pursued by selecting that polygon that maximizes the overlapping ofits area; this is by selecting each of the extremities of the object.
Walls work mainly to bear the structure of buildings, to isolate, and to delimitroom space. Aiming for simplicity, they are usually rectangular-shaped gen-erating corners at their intersections, and gaps to locate doors and windows.However, with the lack of additional architectural information, it is not clearhow wall-instances should be separated. We have followed our own conventiontrying to stick to their structural purpose. We split walls when they have dif-ferent thickness, and when they intersect at some point generating a L-shapedcorner. In Figure 6.5 we show a detailed example to clarify our strategy.
The labeling of doors, windows, and parking doors has been much easier sincetheir boundaries are well defi ned. Yet, to label those objects with curved shapes
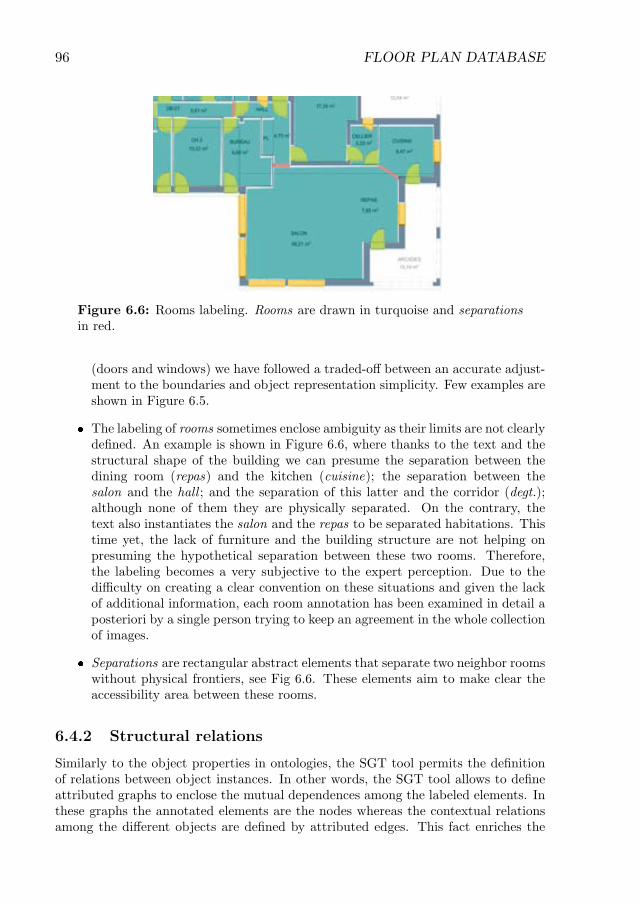
96 FLOOR PLAN DATABASE
Figure 6.6: Rooms labeling. Rooms are drawn in turquoise and separationsin red.
(doors and windows) we have followed a traded-off between an accurate adjust-ment to the boundaries and object representation simplicity. Few examples areshown in Figure 6.5.
� The labeling of rooms sometimes enclose ambiguity as their limits are not clearlydefined. An example is shown in Figure 6.6, where thanks to the text and thestructural shape of the building we can presume the separation between thedining room (repas) and the kitchen (cuisine); the separation between thesalon and the hall ; and the separation of this latter and the corridor (degt.);although none of them they are physically separated. On the contrary, thetext also instantiates the salon and the repas to be separated habitations. Thistime yet, the lack of furniture and the building structure are not helping onpresuming the hypothetical separation between these two rooms. Therefore,the labeling becomes a very subjective to the expert perception. Due to thedifficulty on creating a clear convention on these situations and given the lackof additional information, each room annotation has been examined in detail aposteriori by a single person trying to keep an agreement in the whole collectionof images.
� Separations are rectangular abstract elements that separate two neighbor roomswithout physical frontiers, see Fig 6.6. These elements aim to make clear theaccessibility area between these rooms.
6.4.2 Structural relations
Similarly to the object properties in ontologies, the SGT tool permits the definitionof relations between object instances. In other words, the SGT tool allows to defineattributed graphs to enclose the mutual dependences among the labeled elements. Inthese graphs the annotated elements are the nodes whereas the contextual relationsamong the different objects are defined by attributed edges. This fact enriches the
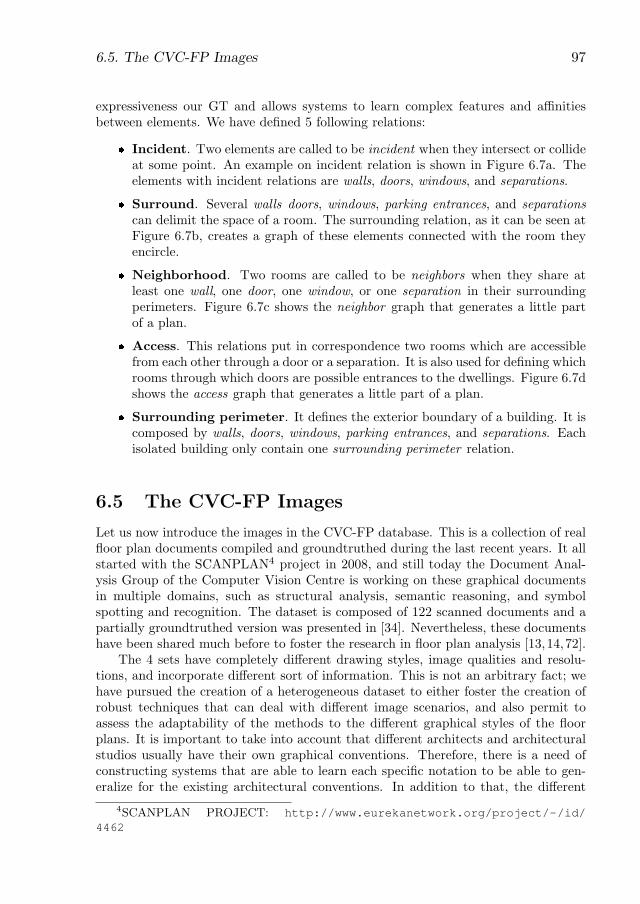
6.5. The CVC-FP Images 97
expressiveness our GT and allows systems to learn complex features and affinitiesbetween elements. We have defined 5 following relations:
� Incident. Two elements are called to be incident when they intersect or collideat some point. An example on incident relation is shown in Figure 6.7a. Theelements with incident relations are walls, doors, windows, and separations.
� Surround. Several walls doors, windows, parking entrances, and separationscan delimit the space of a room. The surrounding relation, as it can be seen atFigure 6.7b, creates a graph of these elements connected with the room theyencircle.
� Neighborhood. Two rooms are called to be neighbors when they share atleast one wall, one door, one window, or one separation in their surroundingperimeters. Figure 6.7c shows the neighbor graph that generates a little partof a plan.
� Access. This relations put in correspondence two rooms which are accessiblefrom each other through a door or a separation. It is also used for defining whichrooms through which doors are possible entrances to the dwellings. Figure 6.7dshows the access graph that generates a little part of a plan.
� Surrounding perimeter. It defines the exterior boundary of a building. It iscomposed by walls, doors, windows, parking entrances, and separations. Eachisolated building only contain one surrounding perimeter relation.
6.5 The CVC-FP Images
Let us now introduce the images in the CVC-FP database. This is a collection of realfloor plan documents compiled and groundtruthed during the last recent years. It allstarted with the SCANPLAN4 project in 2008, and still today the Document Anal-ysis Group of the Computer Vision Centre is working on these graphical documentsin multiple domains, such as structural analysis, semantic reasoning, and symbolspotting and recognition. The dataset is composed of 122 scanned documents and apartially groundtruthed version was presented in [34]. Nevertheless, these documentshave been shared much before to foster the research in floor plan analysis [13,14,72].
The 4 sets have completely different drawing styles, image qualities and resolu-tions, and incorporate different sort of information. This is not an arbitrary fact; wehave pursued the creation of a heterogeneous dataset to either foster the creation ofrobust techniques that can deal with different image scenarios, and also permit toassess the adaptability of the methods to the different graphical styles of the floorplans. It is important to take into account that different architects and architecturalstudios usually have their own graphical conventions. Therefore, there is a need ofconstructing systems that are able to learn each specific notation to be able to gen-eralize for the existing architectural conventions. In addition to that, the different
4SCANPLAN PROJECT: http://www.eurekanetwork.org/project/-/id/4462
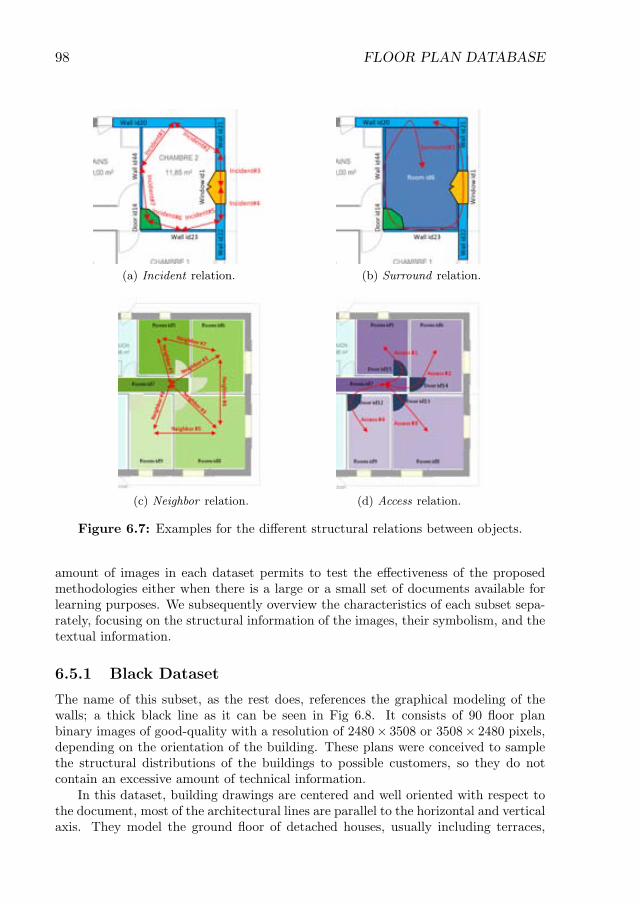
98 FLOOR PLAN DATABASE
(a) Incident relation. (b) Surround relation.
(c) Neighbor relation. (d) Access relation.
Figure 6.7: Examples for the different structural relations between objects.
amount of images in each dataset permits to test the effectiveness of the proposedmethodologies either when there is a large or a small set of documents available forlearning purposes. We subsequently overview the characteristics of each subset sepa-rately, focusing on the structural information of the images, their symbolism, and thetextual information.
6.5.1 Black Dataset
The name of this subset, as the rest does, references the graphical modeling of thewalls; a thick black line as it can be seen in Fig 6.8. It consists of 90 floor planbinary images of good-quality with a resolution of 2480� 3508 or 3508� 2480 pixels,depending on the orientation of the building. These plans were conceived to samplethe structural distributions of the buildings to possible customers, so they do notcontain an excessive amount of technical information.
In this dataset, building drawings are centered and well oriented with respect tothe document, most of the architectural lines are parallel to the horizontal and verticalaxis. They model the ground floor of detached houses, usually including terraces,
6.5. The CVC-FP Images 99
Figure 6.8: Black Dataset. In (a) we show a sample image from this dataset.In (b) we show the diff erent types of doors, in (c) the window’ s models, andin (d) some of the diffi culties of the dataset.
porches, and garages with cars. The drawing style is clear, with few elements crossingamong them. Concerning the structural symbols, walls are mostly modeled by blacklines of three diff erent thicknesses whether they are main, interior, or exterior walls.Just in 3 plans, walls are modeled by parallel lines. Simple doors are drawn by aquarter of a circle arc whereas building’ s main doors have an additional rectangularbase of the size of their incident walls. Moreover, toilet doors are represented by aquarter circle arc, and double doors by two consecutive arcs centered in each of thewall limits and tangent in the center of the accessible area (see Figure 6.8b). Thewindow models can highly vary, see Figure 6.8c. We can fi nd full opened windows,partly opened windows, and sliding windows; all of them with diff erent breadths.The last of the structural symbols we can fi nd are the stairs. They are modeled byconsecutive parallel rectangles. In terms of non-structural symbols, the fl oor planscontain mostly symbols making reference to bath utilities. Diff erent kind of sinks,toilets, shower baths, and bathtubs are the only ones repeated in all the images.In addition to that, occasionally we can fi nd living room furniture and in buildingsdelighting of a terrace or a porch may include a garden-table with 4 chairs.
Text can be found in these documents. Each fl oor plan has a title with big boldletters that it can be read “ Plan du Rez de Chausee” , in English “ plan of the groundfl oor” . As a subtitle we fi nd the scale of the model (always 1/100, 1cm is 1m) andinformation about the architectural studio. In some plans next to the title we can fi ndinformation about the surface area of the dependencies, the building utile area, andthe slope of the roof. Less frequently, information of the surface and the orientationof the windows is included in the subtitle. Moreover, each room encloses the textdescribing its functionality and area – in squared meters– . Finally, each plan has twodimensions measuring in meters the rectangular surface of the building. They arelocated in the limits of the building perimeter.
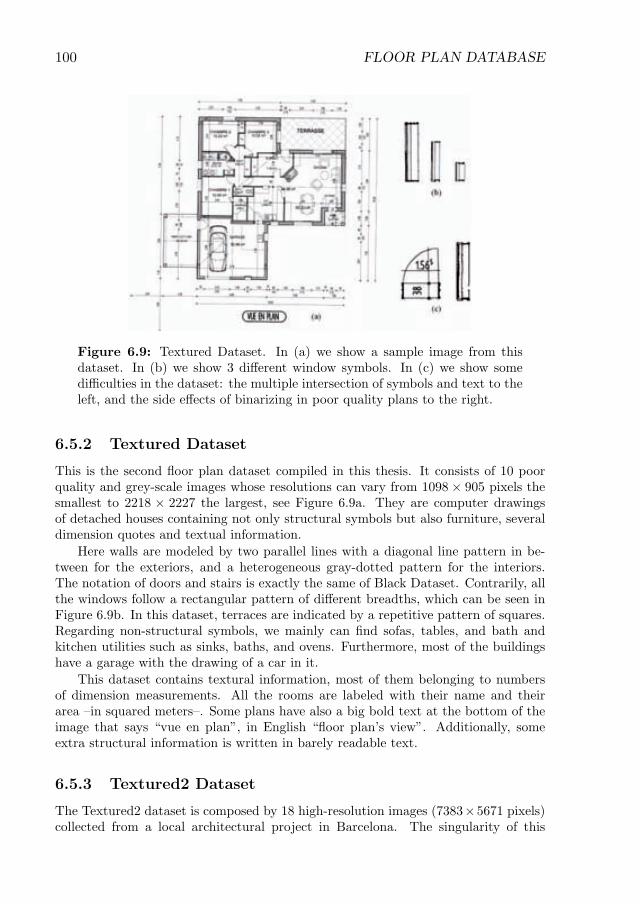
100 FLOOR PLAN DATABASE
Figure 6.9: Textured Dataset. In (a) we show a sample image from thisdataset. In (b) we show 3 diff erent window symbols. In (c) we show somediffi culties in the dataset: the multiple intersection of symbols and text to theleft, and the side eff ects of binarizing in poor quality plans to the right.
6.5.2 Textured Dataset
This is the second fl oor plan dataset compiled in this thesis. It consists of 10 poorquality and grey-scale images whose resolutions can vary from 1098 × 905 pixels thesmallest to 2218 × 2227 the largest, see Figure 6.9a. They are computer drawingsof detached houses containing not only structural symbols but also furniture, severaldimension quotes and textual information.
Here walls are modeled by two parallel lines with a diagonal line pattern in be-tween for the exteriors, and a heterogeneous gray-dotted pattern for the interiors.The notation of doors and stairs is exactly the same of Black Dataset. Contrarily, allthe windows follow a rectangular pattern of diff erent breadths, which can be seen inFigure 6.9b. In this dataset, terraces are indicated by a repetitive pattern of squares.Regarding non-structural symbols, we mainly can fi nd sofas, tables, and bath andkitchen utilities such as sinks, baths, and ovens. Furthermore, most of the buildingshave a garage with the drawing of a car in it.
This dataset contains textural information, most of them belonging to numbersof dimension measurements. All the rooms are labeled with their name and theirarea – in squared meters– . Some plans have also a big bold text at the bottom of theimage that says “ vue en plan” , in English “ fl oor plan’ s view” . Additionally, someextra structural information is written in barely readable text.
6.5.3 Textured2 Dataset
The Textured2 dataset is composed by 18 high-resolution images (7383 × 5671 pixels)collected from a local architectural project in Barcelona. The singularity of this
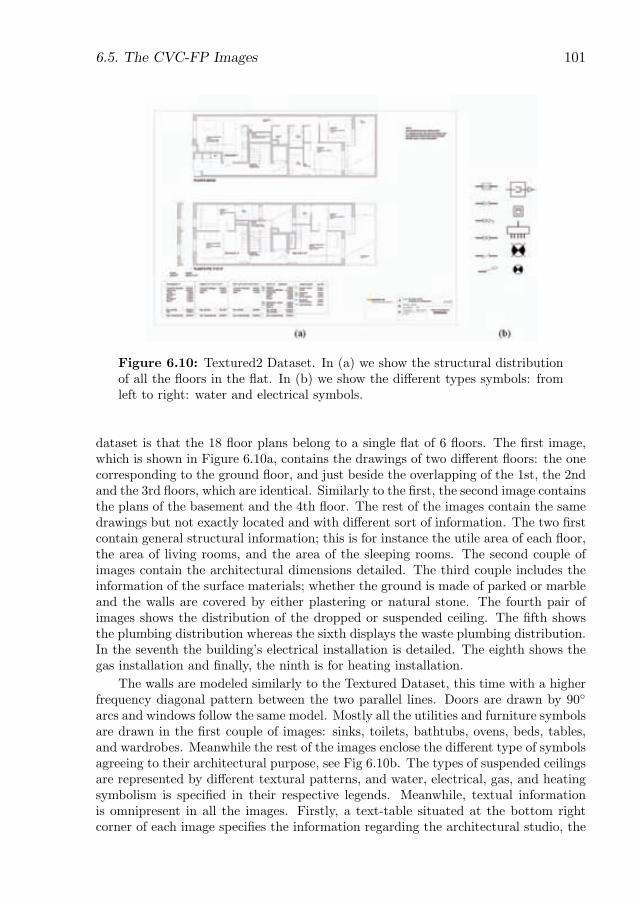
6.5. The CVC-FP Images 101
Figure 6.10: Textured2 Dataset. In (a) we show the structural distributionof all the fl oors in the fl at. In (b) we show the diff erent types symbols: fromleft to right: water and electrical symbols.
dataset is that the 18 fl oor plans belong to a single fl at of 6 fl oors. The fi rst image,which is shown in Figure 6.10a, contains the drawings of two diff erent fl oors: the onecorresponding to the ground fl oor, and just beside the overlapping of the 1st, the 2ndand the 3rd fl oors, which are identical. Similarly to the fi rst, the second image containsthe plans of the basement and the 4th fl oor. The rest of the images contain the samedrawings but not exactly located and with diff erent sort of information. The two fi rstcontain general structural information; this is for instance the utile area of each fl oor,the area of living rooms, and the area of the sleeping rooms. The second couple ofimages contain the architectural dimensions detailed. The third couple includes theinformation of the surface materials; whether the ground is made of parked or marbleand the walls are covered by either plastering or natural stone. The fourth pair ofimages shows the distribution of the dropped or suspended ceiling. The fi fth showsthe plumbing distribution whereas the sixth displays the waste plumbing distribution.In the seventh the building’ s electrical installation is detailed. The eighth shows thegas installation and fi nally, the ninth is for heating installation.
The walls are modeled similarly to the Textured Dataset, this time with a higherfrequency diagonal pattern between the two parallel lines. Doors are drawn by 90◦
arcs and windows follow the same model. Mostly all the utilities and furniture symbolsare drawn in the fi rst couple of images: sinks, toilets, bathtubs, ovens, beds, tables,and wardrobes. Meanwhile the rest of the images enclose the diff erent type of symbolsagreeing to their architectural purpose, see Fig 6.10b. The types of suspended ceilingsare represented by diff erent textural patterns, and water, electrical, gas, and heatingsymbolism is specifi ed in their respective legends. Meanwhile, textual informationis omnipresent in all the images. Firstly, a text-table situated at the bottom rightcorner of each image specifi es the information regarding the architectural studio, the
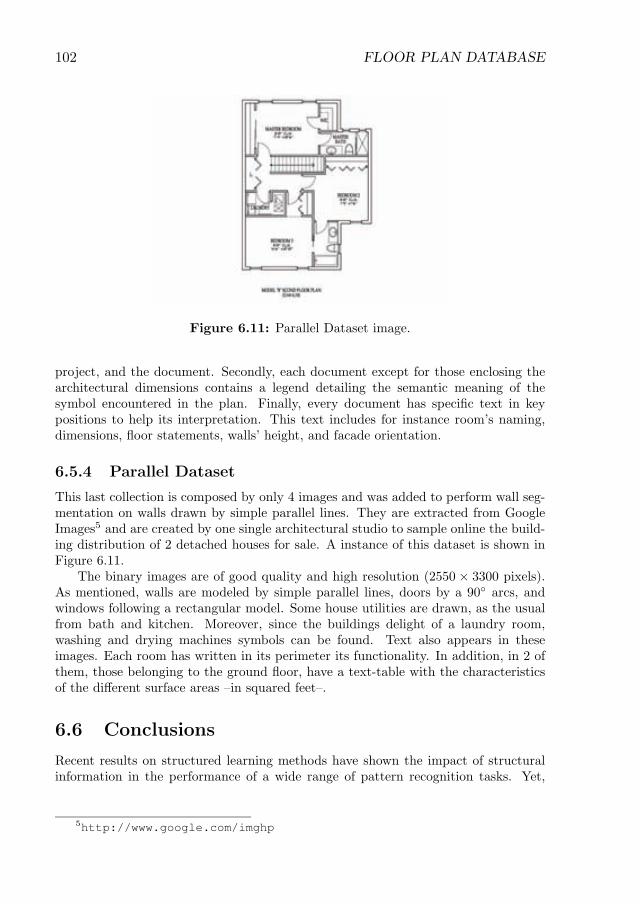
102 FLOOR PLAN DATABASE
Figure 6.11: Parallel Dataset image.
project, and the document. Secondly, each document except for those enclosing thearchitectural dimensions contains a legend detailing the semantic meaning of thesymbol encountered in the plan. Finally, every document has specifi c text in keypositions to help its interpretation. This text includes for instance room’ s naming,dimensions, fl oor statements, walls’ height, and facade orientation.
6.5.4 Parallel Dataset
This last collection is composed by only 4 images and was added to perform wall seg-mentation on walls drawn by simple parallel lines. They are extracted from GoogleImages5 and are created by one single architectural studio to sample online the build-ing distribution of 2 detached houses for sale. A instance of this dataset is shown inFigure 6.11.
The binary images are of good quality and high resolution (2550 × 3300 pixels).As mentioned, walls are modeled by simple parallel lines, doors by a 90◦ arcs, andwindows following a rectangular model. Some house utilities are drawn, as the usualfrom bath and kitchen. Moreover, since the buildings delight of a laundry room,washing and drying machines symbols can be found. Text also appears in theseimages. Each room has written in its perimeter its functionality. In addition, in 2 ofthem, those belonging to the ground fl oor, have a text-table with the characteristicsof the diff erent surface areas – in squared feet– .
6.6 Conclusions
Recent results on structured learning methods have shown the impact of structuralinformation in the performance of a wide range of pattern recognition tasks. Yet,
5http://www.google.com/imghp
6.6. Conclusions 103
these techniques usually need conveniently annotated databases to learn the interre-lation among the objects of interest. In this chapter we have presented the CVC-FPdatabase. It is composed of real floor plan documents that are fully annotated forarchitectural symbols and make specific their structural interrelations. This sort ofinformation agrees the semantic definition of the domain set in Chapter 5, and willlet floor plan analysis systems to learn directly from the knowledge based data howthe elements are structurally arranged and thus, to trigger better interpretation.
The groundtruthing tool used to generate this database, the so-called SGT tool, isa general purpose groundtruthing tool. It is a web-based service that permits to createown objects classes and relations using a very intuitive user-interface. This tool fostersthe collaboration by allowing standalone and multi-user handling, including user andversion control. Thus, the SGT tool is suitable for the creation, the upgrade, andthe maintenance of databases in domains where making specific additional structuralinformation can be of great interest.
The CVC-FP database, the SGT tool, and the evaluation scripts are freely re-leased to the research community to ease comparisons and boosting reproducibleresearch.
Regarding future work, in a short-middle term we are planning to upgrade theSGT tool to allow the arrangement of object classes and relations in a taxonomicway. The aim is to organize and facilitate complex labeling procedures, and to fos-ter the reutilization by defining formally the ground truth domain. This taxonomywill be defined by either creating a class and relation hierarchy in the SGT tool, oruploading a formal ontology definition. The SGT tool will be able to export the GTin an ontological framework for further semantic reasoning, i.e. to check the groundtruth consistency according its definition. In a longer term, we plan to include thisontological functionality to the tool. Hence, the SGT tool will be able to help, correctand suggest the user at real time.

104 FLOOR PLAN DATABASE
Chapter 7
Conclusions
Throughout this dissertation we have presented several methods at the different levelsof the graphical document understanding pipeline. In this chapter we summarizethe contributions presented in each chapter trying to focus on their strengths andweaknesses. Finally, we introduce several working lines to be considered in the future.
7.0.1 Summary and contributions
In Chapter 1 we have introduced the problem of graphical document understandingand the difficulties it currently entails. We have also presented our contributionsin this topic, which consist on several relational models at each of the steps in thetypical document interpretation architecture. Finally, we have introduced the appli-cation framework (architectural drawings), and why it is representative of the generalproblem.
Chapter 2 has introduced the main difficulties experienced in the literature whentackling the problem of graphical document understanding. Moreover, to contex-tualize our work, we have reviewed the cutting edge methodologies on floor planinterpretation. The review of this techniques has allowed us to conclude that mostof the existing contributions focus on specific domains, data, and assumptions. Thisfact has constrained the progress on graphical document understanding w.r.t. otherGR and DIA tasks.
We have presented two different contributions in Chapter 3 on symbol detection.The first addresses the problem from a structural perspective, which a predefinedgeneral knowledge of the domain guides the process. Contrarily, the second is anstatistical approach that learns automatically the appearance of the symbols fromannotated data. Furthermore, after analyzing the advantages and drawback of each,we have combined them into a new method that benefits from the strength of bothapproaches; it does not need to learn every predefined notation and it robust fordifferent shapes and textures. Finally, the effective of this methods has been evaluatedfor wall detection on floor plans.
Chapter 4 has addressed the extraction of the visual context in graphical docu-ments. We have presented two relational strategies that again tackle the problem from
105
106 CONCLUSIONS
very different perspectives. The first is a full bottom-up method that heuristicallysearches in a graph the contextual relations among symbols. The second approachis a syntactic method that models probabilistically the structure of the images. Thismodel is learned automatically and guides the parsing in both, bottom-up and top-down. The presented approaches have been evaluated for room detection of floorplans.
In Chapter 5 we have constructed a knowledge-based model from an ontologicaldefinition of our domain together with real data. This model has permitted theaforementioned syntactic method to learn the context of the documents, i.e. it hasguided the interpretation of the documents. Additionally, the explicit definition ofthe domain has permitted to find semantic inconsistencies in the construction of thestructural GT in Chapter 6.
Finally in Chapter 6, we have presented the data used to evaluate each of thecontributions presented in this dissertation. This data consists of 122 real floor plansseparated in four datasets regarding their graphical notations. These images have beenmanually labeled not only for the architectural symbols, but also making specific therelations among this symbols. In this chapter we have also introduced the SGT tool,that permits to create structural GT in an efficient manner by fostering cooperativework.
In general, in this thesis we have presented several relational models intended tosolve the problem of graphical document understanding. This problem entails thedetection of symbols, their structure and semantics in a visual context. The proposedmodels have demonstrated to be able to encapsulate this sort information and use it inthe interpretation. Their suitability has been evaluated on floor plan understanding.We also want to highlight that, with the aim at fostering research in this topic, weshare freely all the resources used in this dissertation.
7.0.2 Future work lines
We have several ideas regarding future work lines after this dissertation. We summa-rize them in the following:
� In Chapter 3 we have used statistical patch-based methods to segment walls,doors, and windows. Then, the syntactic approach in Chapter 4 uses this seg-mentation to recognize the real entities of these elements. What we propose isto introduce the patch level representation into the syntactic model. Thus, thecontextual knowledge introduced by the probabilistic model would allow to infercontextual relations at patch level thus, enhance both, the initial segmentationand the final structural and semantic representation.
� As we have introduced in Chapter 1, we have chosen architectural drawingsas a relevant framework to evaluate our methods on graphical document un-derstanding for two main reasons. Firstly, there is a big variability on thevocabulary notation. Secondly, the amount of information (color, dimensionlines, text, etc.) strongly depends on the floor plan intent. Therefore, we havestudied how our relational models are able to adapt to different vocabularies andstructures within this domain. Yet, in order to asses their generality without a
107
considerable re-engineering, we would need to extrapolate our contributions toother domains, such as flowcharts, maps, etc.
� Finally, we have explained in Chapter 5 that the ontological definition of ourdomain has helped us in the semantic verification of our GT. In this process,every plan has been checked after its labeling whether it agreed to the domaindefinition. This process was slow because multiple inconsistencies were foundin every plan. Therefore, we had planned –and finally we did not implement itbecause of time constrains– to integrate the ontological definition into the SGTtool. In this manner, the tool would help, suggest, and correct the user on realtime at labeling time.

108 CONCLUSIONS
Bibliography
[1] IAPR International Workshop on Graphics Recognition. grec2013.loria.fr/GREC2013/, 2013.
[2] Apache Jena - A free and open source Java framework for building SemanticWeb and Linked Data applications. https://jena.apache.org/index.html, 2014.
[3] Autodesk Homestyler - Home design and decorating ideas to get inspired andget expert tips. http://www.homestyler.com/, 2014.
[4] Floorplanner - Create floor plans, house plans and home plans on-line withFloorplanner. http://en.floorplanner.com/, 2014.
[5] Google maps indoor. http://www.google.com/maps/about/partners/indoormaps/,2014.
[6] International Association for Pattern Recognition. http://iapr.org/, 2014.
[7] Mysql: The world’s most popular open source database. www.mysql.com, 2014.
[8] OpenRDF Sesame - A de-facto standard framework for processing RDF data.http://www.openrdf.org/, 2014.
[9] Protege 5: A free, open-source ontology editor and framework for buildingintelligent systems. http://protege.stanford.edu/, 2014.
[10] RDF: Resource Description Framework. http://www.w3.org/RDF/, 2014.
[11] Technical commitee on graphics recognition. http://iapr-tc10.univ-lr.fr/, 2014.
[12] C. Ah-soon and K. Tombre. Variations on the analysis of architectural drawings.In In Proceedings of Fourth International Conference on Document Analysis andRecognition, pages 347–351, 1997.
[13] S. Ahmed, M. Liwicki, M. Weber, and A. Dengel. Improved automatic anal-ysis of architectural floor plans. In In International Conference on DocumentAnalysis and Recognition, 2011.
[14] S. Ahmed, M. Liwicki, M. Weber, and A. Dengel. Automatic room detectionand room labeling from architectural floor plans. In 10th . IAPR InternationalWorkshop on Document Analysis Systems (DAS-2012), pages 339–343. IEEE,2012.
109
110 BIBLIOGRAPHY
[15] S. Ahmed, M. Weber, M. Liwicki, C. Langenhan, A. Dengel, and F. Petzold. Au-tomatic analysis and sketch-based retrieval of architectural floor plans. PatternRecognition Letters, 35(0):91 – 100, 2014. Frontiers in Handwriting Processing.
[16] F. Alvaro, J.-A. Sanchez, and J.-M. Benedi. Recognition of printed mathemat-ical expressions using two-dimensional stochastic context-free grammars. InDocument Analysis and Recognition (ICDAR), 2011 International Conferenceon, pages 1225–1229, 2011.
[17] A. Amato, A. D. Sappa, A. Fornes, F. Lumbreras, and J. Llados. Divide andconquer: Atomizing and parallelizing a task in a mobile crowdsourcing platform.In Proceedings of the 2Nd ACM International Workshop on Crowdsourcing forMultimedia, pages 21–22, 2013.
[18] Y. Aoki, A. Shio, H. Arai, and K. Odaka. A prototype system for interpretinghand-sketched floor plans. In Proceedings of the 13th International Conferenceon Pattern Recognition, volume 3, pages 747–751, 1996.
[19] H. Bay, T. Tuytelaars, and L. Van Gool. Surf: Speeded up robust features. InProceedings of the European Conference on Computer Vision, pages 404–417.2006.
[20] L. Bertelli, t. Yu, D. Vu, and B. Gokturk. Kernelized structural svm learningfor supervised object segmentation. In Proceedings of IEEE Conference onComputer Vision and Pattern Recognition 2011, 2011.
[21] M. Bicego, A. Lagorio, E. Grosso, and M. Tistarelli. On the use of sift featuresfor face authentication. In Computer Vision and Pattern Recognition Workshop,2006. CVPRW ’06. Conference on, pages 35–35, June 2006.
[22] O. Biller, A. Asi, K. Kedem, J. El-Sana, and I. Dinstein. Webgt: An interac-tive web-based system for historical document ground truth generation. 12thInternational Conference on Document Analysis and Recognition, 0:305–308,2013.
[23] Y. Boykov, O. Veksler, and R. Zabih. Fast approximate energy minimizationvia graph cuts. Pattern Analysis and Machine Intelligence, IEEE Transactionson, 23(11):1222–1239, 2001.
[24] H. Bunke. Attributed programmed graph grammars and their application toschematic diagram interpretation. IEEE Trans. Pattern Anal. Mach. Intell.,4(6):574–582, Nov. 1982.
[25] H. Bunke and K. Riesen. Recent advances in graph-based pattern recognitionwith applications in document analysis. Pattern Recognition, 44(5):1057 – 1067,2011.
[26] C.-C. Chang and C.-J. Lin. LIBSVM: A library for support vector machines.ACM Transactions on Intelligent Systems and Technology, 2:27:1–27:27, 2011.Software available at http://www.csie.ntu.edu.tw/∼cjlin/libsvm.
BIBLIOGRAPHY 111
[27] J. Cherneff, R. Logcher, J. Connor, and N. Patrikalakis. Knowledge-basedinterpretation of architectural drawings. Research in Engineering Design, 3:195–210, 1992.
[28] A. Chhabra. Graphic symbol recognition: An overview. In K. Tombre andA. Chhabra, editors, Graphics Recognition Algorithms and Systems, volume1389 of Lecture Notes in Computer Science, pages 68–79. Springer Berlin Hei-delberg, 1998.
[29] M. J. Choi, A. Torralba, and A. S. Willsky. Context models and out-of-contextobjects. Pattern Recognition Letters, 33(7):853 – 862, 2012. Special Issue onAwards from fICPRg 2010.
[30] C. Clausner, S. Pletschacher, and A. Antonacopoulos. Aletheia - an advanceddocument layout and text ground-truthing system for production environments.In Document Analysis and Recognition (ICDAR), 2011 International Confer-ence on, pages 48–52, Sept 2011.
[31] D. Connolly, F. van Harmelen, I. Horrocks, D. L. McGuinness, P. F.Patel-Schneider, and L. A. Stein. DAML+OIL: Reference Description.http://www.w3.org/TR/daml+oil-reference, 2001.
[32] L. Cordella and M. Vento. Symbol recognition in documents: a collection oftechniques? International Journal on Document Analysis and Recognition,3(2):73–88, 2000.
[33] N. Dalal and B. Triggs. Histograms of oriented gradients for human detection. InComputer Vision and Pattern Recognition, 2005. CVPR 2005. IEEE ComputerSociety Conference on, volume 1, pages 886–893 vol. 1, 2005.
[34] L.-P. de las Heras, S. Ahmed, M. Liwicki, E. Valveny, and G. Sanchez. Sta-tistical segmentation and structural recognition for floor plan interpretation.International Journal on Document Analysis and Recognition (IJDAR), pages1–17, 2013.
[35] M. Delalandre, T. Pridmore, E. Valveny, H. Locteau, and E. Trupin. Build-ing synthetic graphical documents for performance evaluation. In GraphicsRecognition. Recent Advances and New Opportunities, pages 288–298. SpringerBerlin/Heidelberg, 2008.
[36] D. Doermann and K. Tombre, editors. Handbook of Document Image Processingand Recognition. Springer, 2014.
[37] D. Doermann, E. Zotkina, and H. Li. Gedi - a groundtruthing environmentfor document images. In Ninth IAPR International Workshop on DocumentAnalysis Systems, 2010. Submitted.
[38] P. Dosch and G. Masini. Reconstruction of the 3d structure of a building fromthe 2d drawings of its floors. In Proceedings of the International Conference onDocument Analysis and Recognition, pages 487–490, 1999.
112 BIBLIOGRAPHY
[39] P. Dosch, K. Tombre, C. Ah-Soon, and G. Masini. A complete system for theanalysis of architectural drawings. International Journal on Document Analysisand Recognition, 3:102–116, 2000.
[40] A. Dutta. Inexact Subgraph Matching Applied to Symbol Spotting in GraphicalDocuments. PhD thesis, Universitat Autonoma de Barcelona, 2014.
[41] I. El Rube, M. Ahmed, and M. Kamel. Wavelet approximation-based affineinvariant shape representation functions. Pattern Analysis and Machine Intel-ligence, IEEE Transactions on, 28(2):323–327, 2006.
[42] C. Elkan. Using the triangle inequality to accelerate k-means. In Proceedings ofthe 20th International Conference on Machine Learning, pages 147–153, 2003.
[43] S. Escalera, A. Fornes, O. Pujol, A. Escudero, and P. Radeva. Circular blurredshape model for symbol spotting in documents. In Proceedings of the 26th IEEEInternational Conference on Image Processing, pages 2005–2008, 2009.
[44] M. Everingham, L. Van Gool, C. Williams, J. Winn, and A. Zisserman. Thepascal visual object classes (voc) challenge. International Journal of ComputerVision, 88:303–338, 2010.
[45] H. Fahmy and D. Blostein. A survey of graph grammars: theory and applica-tions. pages 294 –298, aug. 1992.
[46] D. Fernandez, S. Marinai, J. Llados, and A. Fornes. Contextual word spottingin historical manuscripts using markov logic networks. In Proceedings of the2Nd International Workshop on Historical Document Imaging and Processing,HIP ’13, pages 36–43, New York, NY, USA, 2013. ACM.
[47] G. Flitton, T. Breckon, and N. Megherbi Bouallagu. Object recognition using3d sift in complex ct volumes. In Proceedings of the British Machine VisionConference, pages 11.1–11.12. BMVA Press, 2010. doi:10.5244/C.24.11.
[48] A. Fornes, J. Llados, J. Mas, J. M. Pujades, and A. Cabre. A bimodal crowd-sourcing platform for demographic historical manuscripts. In Proceedings of theFirst International Conference on Digital Access to Textual Cultural Heritage,DATeCH ’14, pages 103–108, 2014.
[49] B. Fulkerson, A. Vedaldi, and S. Soatto. Class segmentation and object local-ization with superpixel neighborhoods. In Computer Vision, 2009 IEEE 12thInternational Conference on, pages 670–677, 2009.
[50] J. Gibert. Jaume GibertVector Space Embedding of Graphs via Statistics ofLabelling Information. PhD thesis, Universitat Autonoma de Barcelona, 2012.
[51] T. R. Gruber. A translation approach to portable ontology specification. Knowl-edge Acquisition, 5:199–220, 1993.
[52] C. Ha Lee and T. Kanungo. The architecture of TRUEVIZ: AgroundTRUth/metadata Editing and VIsualizing toolkit. Technical report,LAMP, 2001.
BIBLIOGRAPHY 113
[53] J. M. Hammersley and P. E. Clifford. Markov random fields on finite graphsand lattices. Unpublished manuscript, 1971.
[54] S. Harris and A. Seaborne. SPARQL 1.1 Query Language. http://www.w3.org/TR/sparql11-query/, 2013.
[55] T. Heskes. Convexity arguments for efficient minimization of the bethe andkikuchi free energies. J. Artif. Int. Res., 26(1):153–190, 2006.
[56] M. Hilbert and P. Lopez. The worlds technological capacity to store, commu-nicate, and compute information. Science, 6025:60–65, 2011.
[57] P. Hitzler, M. Krotzsch, B. Parsia, P. F. Patel-Schneider, and S. Rudolph. OWL2: Web Ontology Language. http://www.w3.org/TR/owl2-primer/, 2012.
[58] I. Horrocks, P. F. Patel-Schneider, H. Boley, S. Tabet, B. Grosof, and M. Dean.SWRL: A Semantic Web Rule Language Combining OWL and RuleML.http://www.w3.org/Submission/SWRL/, 2004.
[59] M.-K. Hu. Visual pattern recognition by moment invariants. Information The-ory, IRE Transactions on, 8(2):179–187, 1962.
[60] A. M. J. Lafferty and F. Pareira. Conditional random fields: Probabilisticmodels for segmenting and labeling sequence data. In ICML, 2001.
[61] X. Y. Jiang and H. Bunke. An optimal algorithm for extracting the regions ofa plane graph. Pattern Recogn. Lett., 14(7):553–558, 1993.
[62] T. Joachims, T. Finley, and C. J. Yu. Cutting-plane training of structural svms.Mach. Learn., 77(1):27–59, Oct. 2009.
[63] D. Karatzas, S. Robles, and L. Gomez. An online platform for ground truthingand performance evaluation of text extraction systems. In Proceedings of theInternational Workshop on Document Analysis Systems, 2014.
[64] D. Keysers, T. Deselaers, C. Gollan, and H. Ney. Deformation models for imagerecognition. IEEE Transactions on Pattern Analysis and Machine Intelligence,29:1422–1435, 2007.
[65] J. Kittler, M. Hatef, R. Duin, and J. Matas. On combining classifiers. PatternAnalysis and Machine Intelligence, IEEE Transactions on, 20(3):226–239, 1998.
[66] A. Kubias, S. Schenk, S. Staab, and J. Z. Pan. OWL SAIQL - An OWL DLquery language for ontology extraction. In Workshop on OWL: Experiences anddirections OWLED-07, 2007.
[67] J. Llados, J. Lopez-Krahe, and E. Marti. A system to understand hand-drawnfloor plans using subgraph isomorphism and hough transform. Machine Visionand Applications, 10:150–158, 1997. 10.1007/s001380050068.
[68] J. Llados, E. Martı, and J. Villanueva. Symbol recognition by error-tolerantsubgraph matching between region adjacency graphs. IEEE Trans. PatternAnal. Mach. Intell., 23(10):1137–1143, 2001.
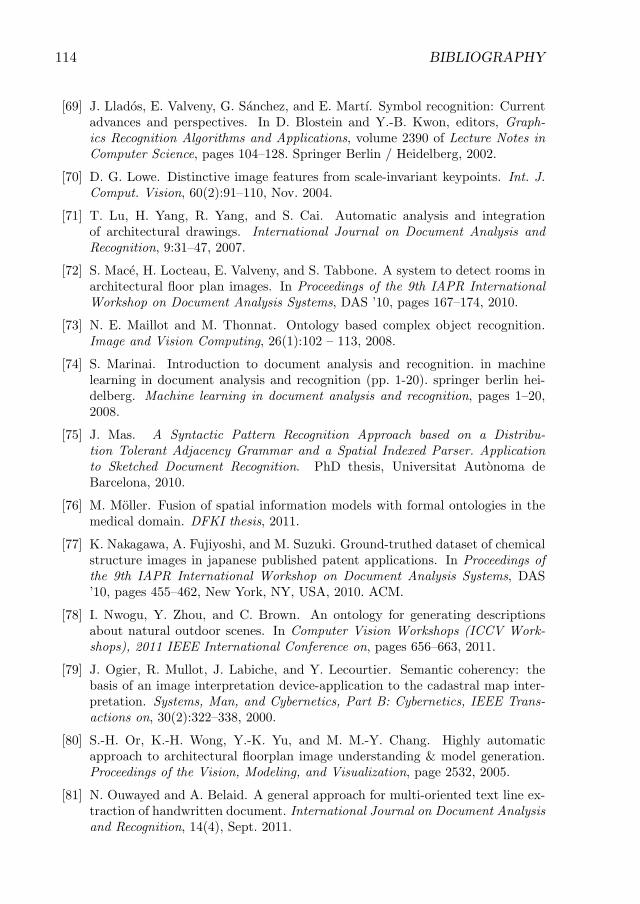
114 BIBLIOGRAPHY
[69] J. Llados, E. Valveny, G. Sanchez, and E. Martı. Symbol recognition: Currentadvances and perspectives. In D. Blostein and Y.-B. Kwon, editors, Graph-ics Recognition Algorithms and Applications, volume 2390 of Lecture Notes inComputer Science, pages 104–128. Springer Berlin / Heidelberg, 2002.
[70] D. G. Lowe. Distinctive image features from scale-invariant keypoints. Int. J.Comput. Vision, 60(2):91–110, Nov. 2004.
[71] T. Lu, H. Yang, R. Yang, and S. Cai. Automatic analysis and integrationof architectural drawings. International Journal on Document Analysis andRecognition, 9:31–47, 2007.
[72] S. Mace, H. Locteau, E. Valveny, and S. Tabbone. A system to detect rooms inarchitectural floor plan images. In Proceedings of the 9th IAPR InternationalWorkshop on Document Analysis Systems, DAS ’10, pages 167–174, 2010.
[73] N. E. Maillot and M. Thonnat. Ontology based complex object recognition.Image and Vision Computing, 26(1):102 – 113, 2008.
[74] S. Marinai. Introduction to document analysis and recognition. in machinelearning in document analysis and recognition (pp. 1-20). springer berlin hei-delberg. Machine learning in document analysis and recognition, pages 1–20,2008.
[75] J. Mas. A Syntactic Pattern Recognition Approach based on a Distribu-tion Tolerant Adjacency Grammar and a Spatial Indexed Parser. Applicationto Sketched Document Recognition. PhD thesis, Universitat Autonoma deBarcelona, 2010.
[76] M. Moller. Fusion of spatial information models with formal ontologies in themedical domain. DFKI thesis, 2011.
[77] K. Nakagawa, A. Fujiyoshi, and M. Suzuki. Ground-truthed dataset of chemicalstructure images in japanese published patent applications. In Proceedings ofthe 9th IAPR International Workshop on Document Analysis Systems, DAS’10, pages 455–462, New York, NY, USA, 2010. ACM.
[78] I. Nwogu, Y. Zhou, and C. Brown. An ontology for generating descriptionsabout natural outdoor scenes. In Computer Vision Workshops (ICCV Work-shops), 2011 IEEE International Conference on, pages 656–663, 2011.
[79] J. Ogier, R. Mullot, J. Labiche, and Y. Lecourtier. Semantic coherency: thebasis of an image interpretation device-application to the cadastral map inter-pretation. Systems, Man, and Cybernetics, Part B: Cybernetics, IEEE Trans-actions on, 30(2):322–338, 2000.
[80] S.-H. Or, K.-H. Wong, Y.-K. Yu, and M. M.-Y. Chang. Highly automaticapproach to architectural floorplan image understanding & model generation.Proceedings of the Vision, Modeling, and Visualization, page 2532, 2005.
[81] N. Ouwayed and A. Belaid. A general approach for multi-oriented text line ex-traction of handwritten document. International Journal on Document Analysisand Recognition, 14(4), Sept. 2011.
BIBLIOGRAPHY 115
[82] M. Pagels. DAML - The DARPA Agent Markup Language. www.daml.org,2006.
[83] I. Phillips and A. Chhabra. Empirical performance evaluation of graphics recog-nition systems. Pattern Analysis and Machine Intelligence, IEEE Transactionson, 21(9):849–870, 1999.
[84] M. Pierrot Deseilligny, R. Mariani, J. Labiche, and R. Mullot. Topographicmaps automatic interpretation : Some proposed strategies. In Graphics Recog-nition Algorithms and Systems, volume 1389 of Lecture Notes in ComputerScience, pages 175–193. Springer Berlin Heidelberg, 1998.
[85] F. Piroi, M. Lupu, A. Hanbury, A. Sexton, W. Magdy, and I. Filippov. Clef-ip2012: Retrieval experiments in the intellectual property domain. CLEF 2012evaluation labs and workshop, (Online Working Notes), 2012.
[86] S. Pletschacher and A. Antonacopoulos. The page (page analysis and ground-truth elements) format framework. In Proceedings of the 2010 20th InternationalConference on Pattern Recognition, ICPR ’10, pages 257–260, Washington, DC,USA, 2010. IEEE Computer Society.
[87] A. Quattoni, M. Collins, and T. Darrell. Conditional random fields for objectrecognition. In In NIPS, pages 1097–1104. MIT Press, 2004.
[88] R. Raveaux. Graph mining and graph Classification: Application to catastralmap analysis. PhD thesis, University of La Rochelle, 2010.
[89] J. Rendek, G. Masini, P. Dosch, and K. Tombre. The search for genericity ingraphics recognition applications: Design issues of the qgar software system.In Document Analysis Systems VI, volume 3163 of Lecture Notes in ComputerScience, pages 366–377. 2004.
[90] M. Richardson and P. Domingos. Markov logic networks. Mach. Learn., 62(1-2):107–136, Feb. 2006.
[91] M. Rusinol, A. Borras, and J. Llados. Relational indexing of vectorial primi-tives for symbol spotting in line-drawing images. Pattern Recognition Letters,31(3):188–201, 2010.
[92] M. Rusinol, L.-P. de las Heras, and O. Terrades. Flowchart recognition for non-textual information retrieval in patent search. Information Retrieval, pages1–18, 2013.
[93] K. Ryall, S. Shieber, J. Marks, and M. Mazer. Semi-automatic delineation ofregions in floor plans. In Proceedings of the Third International Conference onDocument Analysis and Recognition, pages 964–983, 1995.
[94] E. Saund, J. Lin, and P. Sarkar. Pixlabeler: User interface for pixel-level labelingof elements in document images. In ICDAR, pages 646–650. IEEE ComputerSociety, 2009.
[95] F. Schneider and O. Heckmann. Grundrißatlas Wohnungsbau / Floor PlanManual Housing. Birkhauser, 2012.
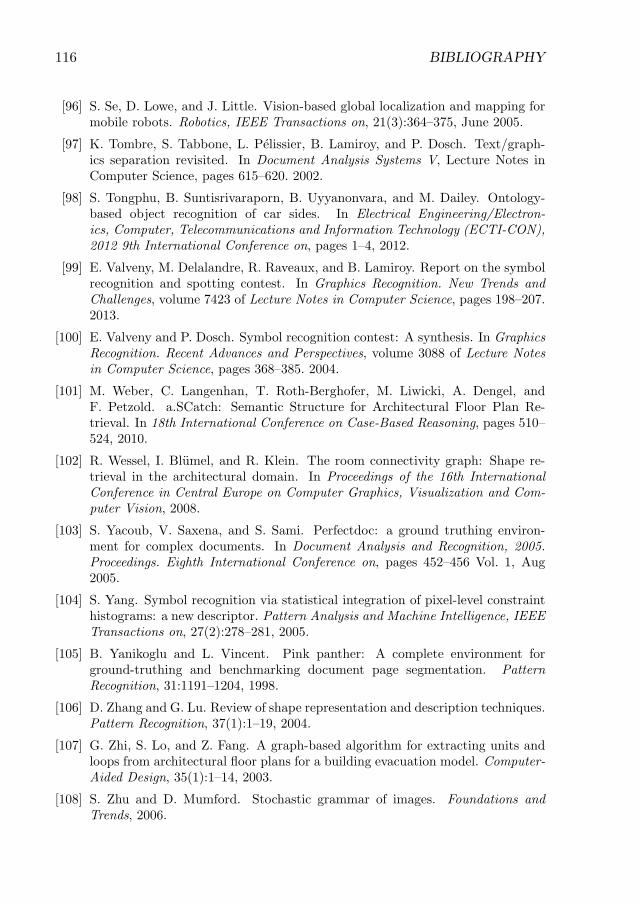
116 BIBLIOGRAPHY
[96] S. Se, D. Lowe, and J. Little. Vision-based global localization and mapping formobile robots. Robotics, IEEE Transactions on, 21(3):364–375, June 2005.
[97] K. Tombre, S. Tabbone, L. Pelissier, B. Lamiroy, and P. Dosch. Text/graph-ics separation revisited. In Document Analysis Systems V, Lecture Notes inComputer Science, pages 615–620. 2002.
[98] S. Tongphu, B. Suntisrivaraporn, B. Uyyanonvara, and M. Dailey. Ontology-based object recognition of car sides. In Electrical Engineering/Electron-ics, Computer, Telecommunications and Information Technology (ECTI-CON),2012 9th International Conference on, pages 1–4, 2012.
[99] E. Valveny, M. Delalandre, R. Raveaux, and B. Lamiroy. Report on the symbolrecognition and spotting contest. In Graphics Recognition. New Trends andChallenges, volume 7423 of Lecture Notes in Computer Science, pages 198–207.2013.
[100] E. Valveny and P. Dosch. Symbol recognition contest: A synthesis. In GraphicsRecognition. Recent Advances and Perspectives, volume 3088 of Lecture Notesin Computer Science, pages 368–385. 2004.
[101] M. Weber, C. Langenhan, T. Roth-Berghofer, M. Liwicki, A. Dengel, andF. Petzold. a.SCatch: Semantic Structure for Architectural Floor Plan Re-trieval. In 18th International Conference on Case-Based Reasoning, pages 510–524, 2010.
[102] R. Wessel, I. Blumel, and R. Klein. The room connectivity graph: Shape re-trieval in the architectural domain. In Proceedings of the 16th InternationalConference in Central Europe on Computer Graphics, Visualization and Com-puter Vision, 2008.
[103] S. Yacoub, V. Saxena, and S. Sami. Perfectdoc: a ground truthing environ-ment for complex documents. In Document Analysis and Recognition, 2005.Proceedings. Eighth International Conference on, pages 452–456 Vol. 1, Aug2005.
[104] S. Yang. Symbol recognition via statistical integration of pixel-level constrainthistograms: a new descriptor. Pattern Analysis and Machine Intelligence, IEEETransactions on, 27(2):278–281, 2005.
[105] B. Yanikoglu and L. Vincent. Pink panther: A complete environment forground-truthing and benchmarking document page segmentation. PatternRecognition, 31:1191–1204, 1998.
[106] D. Zhang and G. Lu. Review of shape representation and description techniques.Pattern Recognition, 37(1):1–19, 2004.
[107] G. Zhi, S. Lo, and Z. Fang. A graph-based algorithm for extracting units andloops from architectural floor plans for a building evacuation model. Computer-Aided Design, 35(1):1–14, 2003.
[108] S. Zhu and D. Mumford. Stochastic grammar of images. Foundations andTrends, 2006.
Related Documents