RELATING STRATIGRAPHY, LITHOLOGIC FACIES, AND 3D SEISMIC ATTRIBUTES TO OIL PRODUCTION IN BAKKEN FORMATION WELLS, RED SKY AREA, WILLISTON BASIN, NORTH DAKOTA A Thesis Presented to the Faculty of the Department of Earth and Atmospheric Sciences University of Houston In Partial Fulfillment of the Requirements for the Degree Master of Science By Corbin William Crews II August 2015

Welcome message from author
This document is posted to help you gain knowledge. Please leave a comment to let me know what you think about it! Share it to your friends and learn new things together.
Transcript

RELATING STRATIGRAPHY, LITHOLOGIC FACIES, AND 3D SEISMIC
ATTRIBUTES TO OIL PRODUCTION IN BAKKEN FORMATION WELLS,
RED SKY AREA, WILLISTON BASIN, NORTH DAKOTA
A Thesis Presented to the
Faculty of the Department of Earth and
Atmospheric Sciences University of
Houston
In Partial Fulfillment of the Requirements for the Degree Master of Science
By
Corbin William Crews II
August 2015

ii
RELATING STRATIGRAPHY, LITHOLOGIC FACIES, AND 3D SEISMIC
ATTRIBUTES TO OIL PRODUCTION IN BAKKEN FORMATION WELLS,
RED SKY AREA, WILLISTON BASIN, NORTH DAKOTA
Corbin William Crews II
APPROVED:
Dr. Paul Mann
Dr. Robert Stewart
Mr. Peter Bartok
Dean, College of Natural Sciences and Mathematics
iii
ACKNOWLEDGEMENTS
I would like to first thank my thesis adviser, Dr. Paul Mann, for his support,
guidance, and encouragement throughout the thesis project. Without his many hours of
input and advising, my study would not have been possible. I would also like to thank my
other committee members, Dr. Robert Stewart and Mr. Peter Bartok, for their technical
insight and advice on both the geologic and geophysical aspects of this project.
I thank Hess Corporation for allowing me access to their Red Sky 3D dataset.
Special thanks to Michele Simon, James Courtier, and John Hohman at Hess for their
insightful conversations and encouragement very early on in the process.
I would like to thank the University of Houston students Bode Kingsley and Yue
Du for their insightful conversations and previous work in this area. I also want to thank
Patrick Loureiro and Bryan Ott for their friendship and general support through this
project and graduate school in general.
Finally, I would like to give special thanks to my parents and brothers for their
love, support, and encouragement through this long process. Without you guys keeping
everything in perspective, I could not have done it.

iv
RELATING STRATIGRAPHY, LITHOLOGIC FACIES, AND 3D SEISMIC
ATTRIBUTES TO OIL PRODUCTION IN BAKKEN FORMATION WELLS,
RED SKY AREA, WILLISTON BASIN, NORTH DAKOTA
A Thesis Presented to the
Faculty of the Department of Earth and
Atmospheric Sciences University of
Houston
In Partial Fulfillment
of the Requirements for the Degree Master
of Science
By
Corbin William Crews II
August 2015

v
ABSTRACT
The Bakken Formation is considered the most important hydrocarbon-bearing rock
unit in the Williston Basin of North Dakota and is currently one of the most prolific
unconventional resource plays in North America with a 2015, basin-wide production of
approximately 1.1 million barrels of oil per day. Most production from the Bakken
Formation is from wells drilled horizontally and completed using hydraulic fracturing in
the relatively thin Bakken formation that varies in thickness from 0 to 160 feet (0 to 49
meters). Studies by previous workers in the Williston basin have identified six, field-
scale “sweet spots” characterized by higher production relative to other areas of the
Williston Basin. Previous workers have also recognized that significant variation in
hydrocarbon production exists even at scales of 1000’s of feet to a few miles between
individual wells within these known sweet spots. The objective of this thesis is to
understand the causes of these localized, field-scale, production variations and how to
best optimize future wells and completions. Unlike previous studies that focused on
regional-scale sweet spots, the work presented here focuses on the field level, which is
scale for drilling and completion decisions.
I present an integrated interpretation of the geology, geophysics, and drilling and
completion designs of wells targeting the Bakken Formation in the Red Sky area,
Mountrail County, North Dakota, in order to explain localized variations in well
productivity using my compilation of historical production statistics. Using a high-quality,
time-migrated, 3D seismic survey combined with well logs, core data, well files, seismic
attributes, and production statistics, I have identified the productive reservoir unit and its
vi
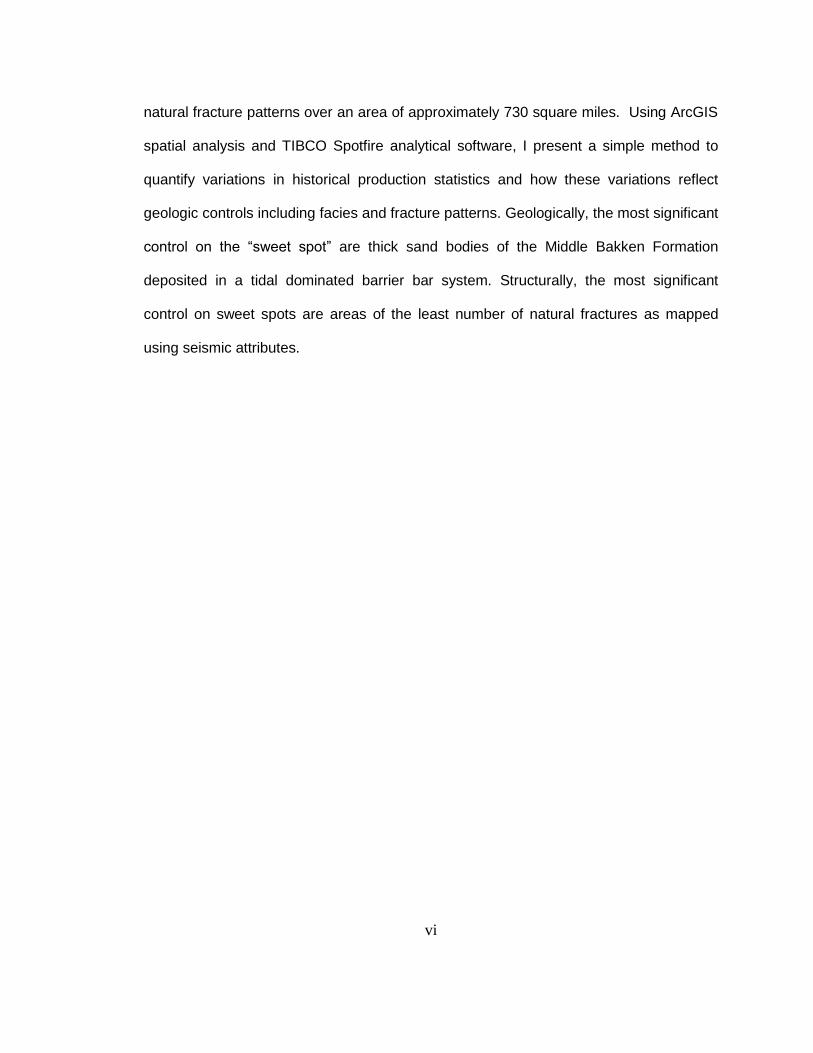
natural fracture patterns over an area of approximately 730 square miles. Using ArcGIS
spatial analysis and TIBCO Spotfire analytical software, I present a simple method to
quantify variations in historical production statistics and how these variations reflect
geologic controls including facies and fracture patterns. Geologically, the most significant
control on the “sweet spot” are thick sand bodies of the Middle Bakken Formation
deposited in a tidal dominated barrier bar system. Structurally, the most significant
control on sweet spots are areas of the least number of natural fractures as mapped
using seismic attributes.

vii
TABLE OF CONTENTS
Acknowledgments …………………………………………………………………………... iii
Abstract ……………...……………………………………………………………………….... v
Table of Contents ...……………………………………………………………………….... vii
List of Figures ……………………………………………………………………………….. ix
Chapter 1: INTRODUCTION ………………………………………………………………… 1
1.1 Project rational …………………………………………………………………………… 1
1.2 Conventional versus unconventional resources …………………………………... 3
1.3 Project background ……………………………………………………………………... 6
Chapter 2: INTEGRATION OF STRATIGRAPHY, FACIES, SEISMIC ATTRIBUTES,
AND PRODUCTION STATISTICS TO PREDICT BAKKEN WELL PERFORMANCE,
RED SKY, WILLISTON BASIN, NORTH DAKOTA ………………………………………. 8
2.1 Introduction ……………………………………………………………………………….. 8
2.1.1 Significance and history of production from the Williston Basin …………… 8
2.1.2 Project goals and methodology ……………………………………………… 11
2.1.3 Project data ……………………………………………………………………. 12
2.1.4 Data integration and work flow ………………………………………………. 12
2.2 Regional-scale geology ……………………………………………………………….. 14
2.2.1 Paleogeography of the Williston Basin ……………………………………... 14
2.2.2 Basement types and structure underlying the Williston Basin …………… 16
2.2.3 Regional structural elements ………………………………………………… 17
2.2.4 Physical profile and general stratigraphy of the Bakken Formation ……... 20

viii
2.2.5 Petroleum system elements of the Bakken Formation in North Dakota … 22
2.2.6 Bakken Formation stratigraphic facies distribution ………………………... 29
2.2.7 Bakken lithofacies analysis of core from the Nesson State well …………. 40
2.2.8 Bakken lithofacies analysis of cores from the AV Wrigley well …………... 42
2.2.9 Interpretation of the Middle Bakken depositional environment …………... 48
2.3 Field-scale to well-scale seismic structure ………………………………………... 50
2.3.1 Red Sky 3D seismic survey ………………………………………………….. 50
2.3.2 Seismic attributes for analysis of subtle structural features ……………… 56
2.3.3 Quantifying structural variation on a well-to-well basis …………………… 60
2.4 Normalizing historical production to evaluate well quality …………………….. 63
2.4.1 Bakken production statistics …………………………………………………. 63
2.5 Well-scale analysis of relationships between multi-source attributes ……….. 65
2.5.1 Analyzing attribute relationships …………………………………………….. 65
2.5.2 Statistical analysis of attribute relationships ……………………………….. 66
2.6 Discussion and conclusions …………………………………………………………. 69
2.6.1 Discussion of results ………………………………………………………….. 69
2.6.2 Conclusions and recommendations ………………………………………… 72
2.7 References ………………………………………………………………………………. 75
2.8 Appendix Tables………………………………………………………………………… 81
Table 1: Well information……………………………………………………………. 81
Table 2: Completion attributes……………………………………………………… 82
Table 3: Geologic and geophysical attributes…………………………………….. 83

ix
LIST OF FIGURES
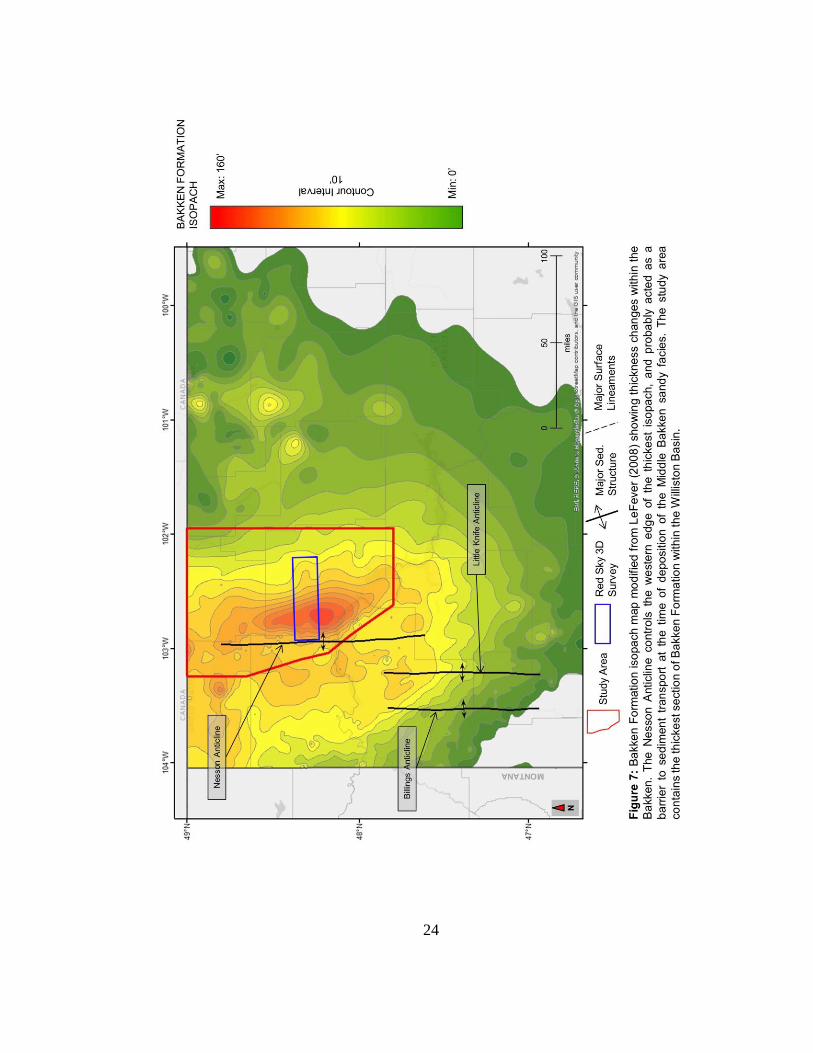
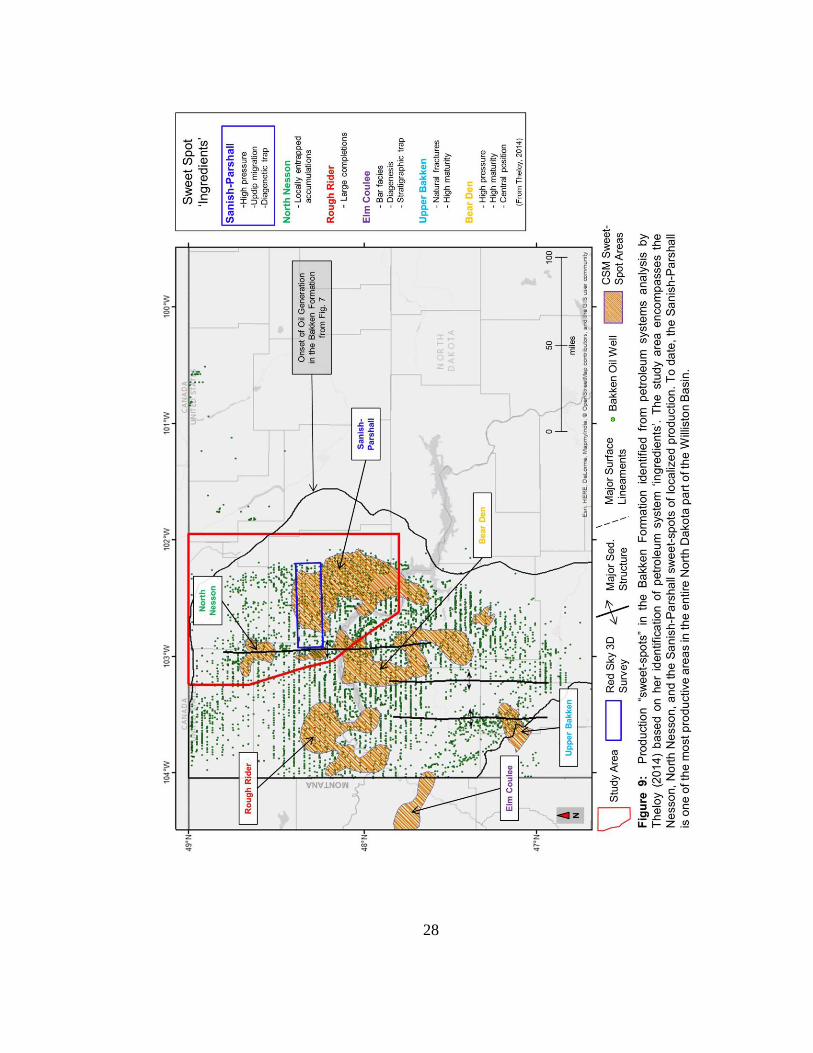
Figure 1: Late Devonian (~375 Ma) paleogeographic reconstruction showing the equatorial, shallow marine, and intracratonic setting of the Williston Basin and other time equivalent sedimentary basins of North America (map modified from Blakey, 2015.…. 15 Figure 2: (A) Aeromagnetic map of the United States (from USGS, 2014), for the Williston Basin showing the signature of basement terranes underlying the Phanerozoic sediment fill. The Nesson Anticline is the major structural element in the central Williston Basin. (B) The Williston Basin overlies a suture zone between the Wyoming and Superior Archean age cratons (map modified from Fischer, et al. 2005). Faulting and deformation of the suture between the two basement block propagates upward into the overlying, Paleozoic Williston Basin and is expressed by subsidence, faulting, and fracturing in the Williston Basin…………………….………………………………………... 18 Figure 3: Structural elements in the Williston Basin (modified from Gerhard et al., 1987). The Brockton-Froid Lineament is a major regional fault connecting the Williston basin with the Ancestral Rocky Mountains to the west. Direction of maximum stress modified from Zoback (1980) and Sonnenberg (2011) is consistent with the orientation of observed surface lineaments………..………………………………………………...…….. 19 Figure 4: (A) Regional west-east cross section modified from Sonnenberg and Pramudito (2009) through the Williston Basin showing major elements the Bakken petroleum system. Mississippian-Devonian, shallow marine deposition was centered in a sub-circular, intracratonic basin with gentle depositional dips towards the basin center. The Nesson Anticline is the major structural element in the basin and lies on the eastern flank of the study area. (B) Approximate location of west-to-east cross section through the Williston Basin with the outline of the study area and basin structural elements….. 21 Figure 5: Generalized stratigraphy of the Bakken petroleum system modified from Egenhoff (2011). Deposition of the Bakken Formation lasted from the Late Devonian to the Early Mississippian time. The Bakken Formation is divided into three members: the Upper, Middle, and Lower Bakken Members. The Middle Bakken, which contains silt and sands and is the primary drilling target for operators in the study area is itself divided into three members: the Upper Middle, the Middle Sand, and the Lower Middle. The Middle Sand contains relatively high porosity and permeability and considered the highest quality reservoir facies of the Bakken Formation……………………………………..…… 21 Figure 6: Top of Bakken Formation modified from LeFever (2008) showing subsurface depth of the formation. The North Dakota part of the Williston basin is characterized by its concentric shape and defined by shallow, basinal dips. Major faults and folds in the Phanerozoic sedimentary section are controlled by the upward propagation of faults in the crystalline basement…………...………………………………………………………… 23 Figure 7: Bakken Formation isopach map modified from LeFever (2008) showing thickness changes within the Bakken. The Nesson Anticline controls the western edge of the thickest isopach, and probably acted as a barrier to sediment transport at the time of deposition of the Middle Bakken sandy facies. The study area contains the thickest

x
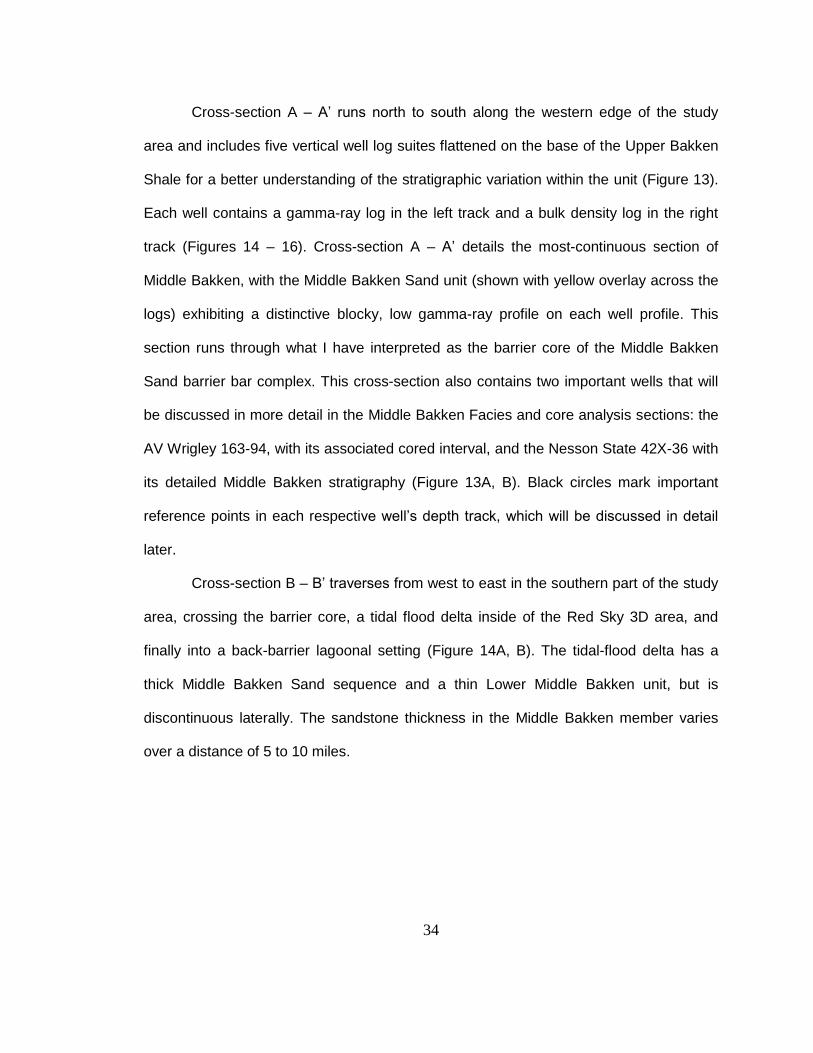
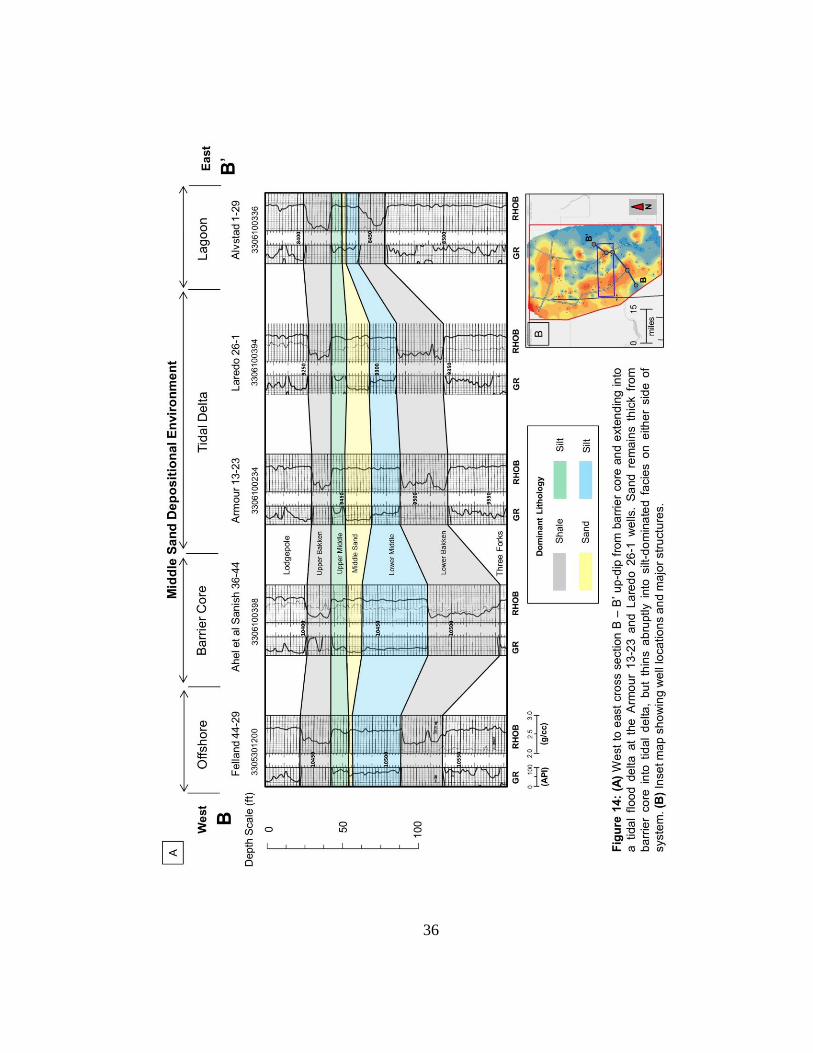
section of Bakken Formation within the Williston Basin……………...…………………… 24 Figure 8: Time-Temperature Index (TTI) of the Bakken Formation in North Dakota (modified from Nordeng et al., 2010). Generation of oil begins at a TTI value of 15, while dry gas is generated at a TTI value of 200. The majority of my study area falls within the Bakken Formation oil generation window………………………………………………...… 26 Figure 9: Production “sweet-spots” in the Bakken Formation identified from petroleum systems analysis by Theloy (2014) based on her identification of petroleum system ‘ingredients’. The study area encompasses the Nesson, North Nesson, and the Sanish-Parshall sweet-spots of localized production. To date, the Sanish-Parshall is one of the most productive areas in the entire North Dakota part of the Williston Basin……………………………………………………………………………………….…... 28 Figure 10: (A) My study area in North Dakota showing the location of 182 vertical well logs used for stratigraphic analysis of the Bakken Formation. (B) Well log profile of the Bakken Formation from the Nesson State 42X-36 well, which contains a well-developed sand in the Middle Bakken member (yellow highlight). (C) Core plug analysis from the same well with depths matched to gamma ray log. There is higher porosity and permeability development in the Middle Bakken member, particularly in the sandier intervals…………………………………………………………………………………….…... 30 Figure 11: Isopach maps of Bakken Formation facies mapped from 182 wells in the study area. (A) Lower Bakken Shale (B) Lower Middle Bakken Silt (C) Middle Bakken Sand (D) Upper Middle Bakken Silt (E) Upper Bakken Shale. (F) Map showing the total thickness of the Upper Bakken Shale, Middle Bakken Sand, and Lower Bakken Shale in the study area. This thicker area of the Bakken Formation provides the area of highest hydrocarbon storage capacity in the Williston Basin……………………………………… 31 Figure 12: Middle Bakken sand thickness map for the study area. Locations of well log cross sections are indicated: A-A’ (Fig. 1-11), B-B’ (Fig. 1-12), C-C’ (Fig. 1-13), and D-D’ (Fig. 1-14). Core descriptions from the Nesson State 42X-36 well drilled by XTO in 2008 and the AV-Wrigley 163-94 well drilled by Hess in 2008 are shown in Figures 1.15 and 1.16, respectively……………………………………………………………………………… 33 Figure 13: (A) Well log cross section A - A’ provides an along-strike cross section through the inferred barrier bar system of the Middle Bakken formation which ranges from 13 to 10 feet thick along the trend of the bar. (B) Inset map showing well locations and major structures…………………………………………………………….……………. 35 Figure 14: (A) West to east cross section B – B’ up-dip from barrier core and extending into a tidal flood delta at the Armour 13-23 and Laredo 26-1 wells. Sand remains thick from barrier core into tidal delta, but thins abruptly into silt-dominated facies on either side of system. (B) Inset map showing well locations and major structures……………. 36 Figure 15: (A) South to north cross section C – C’ through flood delta sands and wash-over sand deposits. In contrast to a relatively constant sand thickness within barrier core, the tidal delta/wash-over complex shows a more variable sand thickness along strike
xi
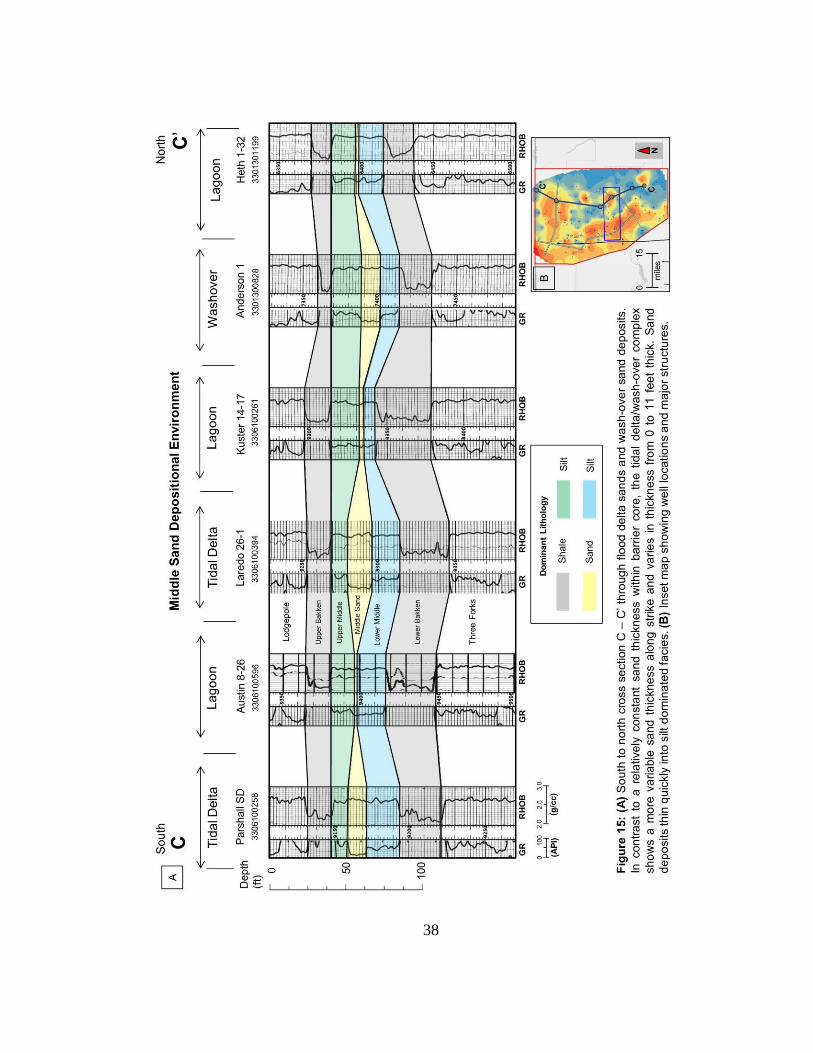
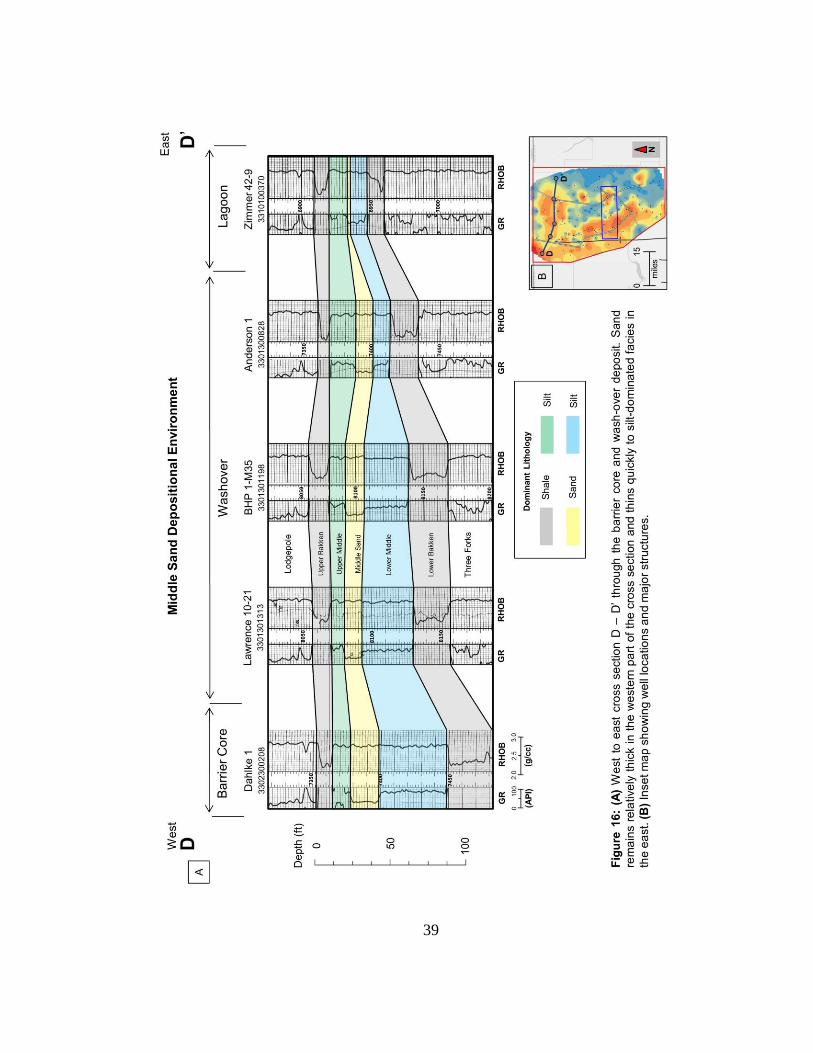
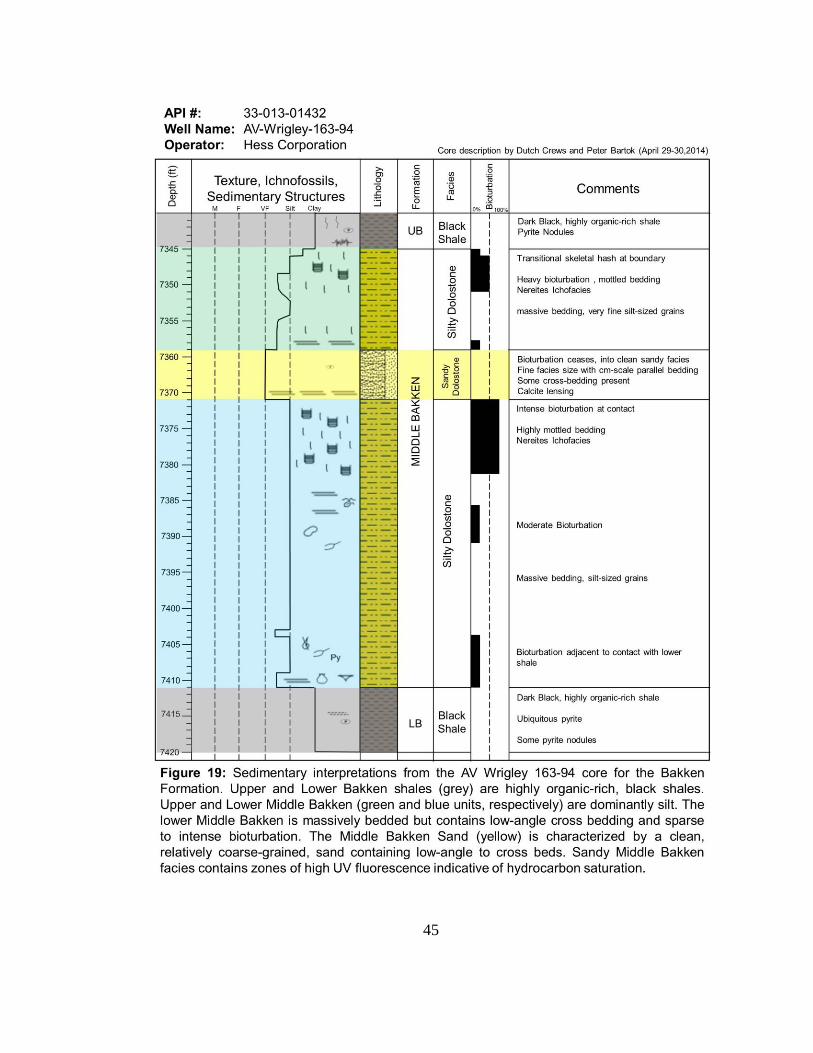
and varies in thickness from 0 to 11 feet thick. Sand deposits thin quickly into silt dominated facies. (B) Inset map showing well locations and major structures…….…... 38 Figure 16: (A) West to east cross section D – D’ through the barrier core and wash-over deposit. Sand remains relatively thick in the western part of the cross section and thins quickly to silt-dominated facies in the east. (B) Inset map showing well locations and major structures…………………………………………………………….…………………. 39 Figure 17: (A) Location and gamma ray profile of the Nesson State 42X-36 well. (B) Upper Middle Bakken silt facies with mm-scale mottled bedding, shell hash, and bioturbation. (C) Middle Bakken sandy facies associated with low GR log profile. Interval contains low-angle and cross bedded structures. (D) Lower Middle Bakken silt facies, similar to upper-middle facies but lacking heavy bioturbation and containing massive bedding…………………………………………………………………………………..…….. 41 Figure 18: Well log character and location of AV Wrigley 163-94 well with photographs of major Bakken facies. Upper and Lower Bakken are highly organic-rich, black shales. Upper and Lower Middle Bakken are dominantly silt, while the Middle Bakken Sand is primarily clean sand. Note the gamma ray well log profile and its similarity to the Nesson State 42X-36 well shown in Figure 15. …………………………………………………….. 43 Figure 19: Sedimentary interpretations from the AV Wrigley 163-94 core for the Bakken Formation. Upper and Lower Bakken shales (grey) are highly organic-rich, black shales. Upper and Lower Middle Bakken (green and blue units, respectively) are dominantly silt. The lower Middle Bakken is massively bedded but contains low-angle cross bedding and sparse to intense bioturbation. The Middle Bakken Sand (yellow) is characterized by a clean, relatively coarse-grained, sand containing low-angle to cross beds. Sandy Middle Bakken facies contains zones of high UV fluorescence indicative of hydrocarbon saturation………………………………………………………………………………………. 45 Figure 20: Detailed photographs from the Middle Bakken Sand from the core of the AV Wrigley 163-94 well. (A) Photograph with white light showing calcite-dolomite lensing on the centimeter to meter scale; and (B) Photograph with ultraviolet (UV) light showing zones of hydrocarbon saturation, generally associated with dolomitized lenses. (C) The Middle Bakken Sand facies contains low angle, wavy, and cross bedded layers with scattered pyrite nodules. Calcite-dolomite lensing appears to also work on a smaller, cm to mm, scale within particular zones of the core……………………………..……………. 47 Figure 21: (A) Three-dimensional block diagram showing idealized tide-dominated barrier bar system from Reinson (1992) used as an analog to explain the geometry and thickness variations of the Middle Bakken Sand facies in the thesis study area. (B) Interpreted Middle Bakken sand distribution system in the study area. (C) Modern-day depositional environment analog for the Middle Bakken Sand facies based on a Google Earth satellite image from the Atlantic coast of North Carolina………...………………... 49 Figure 22: (A) Location of Red Sky 3D seismic survey. Top Three Forks two-way time structure map is displayed inside the survey area. The Three Forks surface gently dips westward from the east to its to greatest depth between crosslines 881 and 981. The

xii
surface steepens abruptly on the western edge of survey, which is interpreted as the eastern flank of the Nesson Anticline. Locations of wells used for production analysis are included within the survey. (B) Map showing extent of the Red Sky 3D seismic shown relative to Middle Bakken Sand facies……….……………………………………………... 52 Figure 23: Middle Bakken sand thickness variation across the Red Sky Study area as mapped from 187 vertical well logs shown in section 1. Thicker sands are located along the western and eastern margins of the Red Sky Survey. Location of wells used for production analysis are included within the survey.………………………………..……… 53 Figure 24: Inline 1011 through the Red Sky 3D viewed from south to north at 20 times vertical exaggeration. Seismic horizons dip gently to west to a maximum depth near crossline 844. This depth maximum is adjacent to the Nesson anticline as shown by increased structural dips and shallowing horizons westward to the limit of seismic coverage………………………………………………………………….……………………. 54 Figure 25: (A) Bakken and Three Forks Formation well and its seismic tie (Kingsley, 2015). (B) Zoomed section showing seismic amplitude of the Bakken and Three Forks horizons. Note strong seismic reflection associated with the Upper and Lower Bakken Shale. Seismic attributes in Figures 26, 27, and 28 were generated on the Three Forks Formation horizon………………..…………………………………………………………… 55 Figure 26: Seismic attributes computed on the top of the Three Forks Formation. (A) Two-way time structure, (B) edge detection attribute, and (C) dip angle. Edge detection and highlight areas of seismic discontinuity and are interpreted to identify local areas of high stress and/or natural fracturing………………………………………………………… 58 Figure 27: Edge detection on top Three Forks Formation and interpreted areas of natural fracturing within the Bakken interval. Orientation of attribute anomalies correlates well with regional maximum stress direction and direction of fracture propagation shown in Figure 3..……………………………………………………………………………….……. 59 Figure 28: (A) Edge detection attribute on top Three Forks Horizon showing areas with of the densest concentrations of natural fractures. Wells are plotted with normalized production bubbles at their surface location. (B) Sample of the 500 foot wide buffer generated around each wellbore and raster pixilation used for production versus cumulative fracture intersection. Statistics were calculated for raster values falling within each wellbore buffer…………………………………………………..…............................. 62 Figure 29: Cross plot of edge detection sum inside 500 foot wide, well buffers (Figure 28A) versus normalized hydrocarbon production. A strong statistical correlation exists between normalized production and sum of the edge detection attribute. Wells in less naturally fractured areas tend to produce better relative to the other wells in more naturally fractured areas. Relationship intersections are colored by azimuth of their wellbore, which is generally considered an important property for optimal well design. No overall trend is evident in the direction of the wellbore azimuth. Higher production tends to be associated with wellbores drilled perpendicular to the regional maximum stress direction……………..………………………………………………………………………..... 67

xiii
Figure 30: Cross plot of mean dip angle inside well buffers (Figure 28B) versus normalized hydrocarbon production. A strong statistical correlation exists between normalized production and dip angle variation………………………………………….…. 68
Figure 31: Middle Bakken sand thickness with fracture interpretation based on overlay of seismic attributes. Sand thickness of the high quality Middle Bakken sand is considered a first-order control on normalized hydrocarbon production within the study area. Geologic horizon continuity, interpreted from the edge detection and dip angle attributes, is considered a second-order control on production. Wells intersecting areas with higher densities of natural fractures tend to produce less over their lifetime relative to wells sited in less fractured areas………………………………………………………… 70
1
Chapter 1: Introduction
1.1 Project rational
This project began with the observation that closely spaced, horizontal wells in
the Bakken Formation displayed significant variations in production even when drilled
with similar orientations and completion designs (Wiley et al., 2004). This observation
led to the main objective of this thesis: to understand what geologic processes or
characteristics control well quality between adjacent wells on the scale of a typical
oilfield development.
The answer to this question is not straightforward as shown by previously
published research on the Williston basin and other unconventional shale plays in North
America. Reservoir analysis techniques developed for conventional reservoirs are often
insufficient to address the scale of geologic variation within unconventional resource
plays like the Bakken Formation (Cipolla et al., 2011). Localized sedimentary facies
variations -especially in thin (less than 150 feet thick) formations like the Bakken
Formation - are commonly below the resolution of both 3D seismic data and well logs
(Simenson, 2011). Lenses of calcite cement, which were observed from cores in this
study to act as strong vertical barriers on hydrocarbon saturation at the inch to foot scale
also exist well below the resolution of both 3D seismic data and well logs (Chapter 2,
Figure 20).
Good vertical well-log coverage often is not available in unconventional plays like
the Bakken because most wells are drilled horizontally. Well logs run in horizontal
wellbores give important information of the reservoir characteristics adjacent to the
wellbore, but because the drilling and logging orientation is parallel to bedding variation,

2
horizontal well logs lack the vertical reference frame for accurate mapping of spatial
facies changes. Finally, drilling and completion operations induce mechanical effects on
the reservoir, which can act to mask the effects of geologic controls including natural
fractures (Cipolla et al., 2011).
This thesis uses an extensive data compilation to propose a new technique for
evaluating productivity at high spatial resolutions and over large areas in a short time
and at reasonable cost. For most operating companies exploring unconventional
resources, the use of 3D seismic data is critical in developing drilling plans and
identifying drilling hazards. The 3D seismic data are used to assess the fracturing and
structure above and below the reservoir and to improve drilling designs.
Unconventional plays are usually restricted to a thin vertical section at depth
(less than 160 feet in the case of the Bakken Formation). Because such thin beds may
be below the seismic-tuning thickness, seismic resolution is unable to detect thin
lithologic changes. Computing seismic attributes based on the 3D seismic data set is an
approach for characterizing potential drilling targets that has proven very successful in
evaluating deep-water units where thicknesses can be over a thousand feet (Chopra and
Marfurt, 2007). Seismic attributes implementation have been less successful in thin
unconventional formations, like the Bakken, which is approximately 160 feet at its
thickest point with some of the highest quality reservoir facies between 5 and 20 feet
thick.
Because the Upper and Lower Bakken shale have high organic content and are
characterized by significantly slower seismic velocities than the surrounding carbonate
lithologies the Bakken reflector is easily recognized and mappable over most of the
Williston Basin (Anna et al., 2010)(Chapter 2, Figure 24). The generation of structural
3
attributes can be used to reveal subtle variation in the reservoir structure that may have
an impact upon stress states and the presence of natural fractures that may exist below
the resolution of the 3D seismic data (Jones and Roden, 2012). Attribute values can
then be compared with normalized production volumes over the lifetime of Bakken wells
to establish relationships between the particular attribute characteristic and well quality
(Cipolla et al., 2011).
Large-scale hydraulic fracture operations, carried out on reservoirs like the
Bakken Formation that have high reservoir pressures - close to ambient critical stress -
can significantly, alter in situ stresses during drilling and completion (Zhou et al., 2008).
These human-induced engineering effects on the reservoir must also be taken into
account to recognize the underlying and complex geologic variations that control
production variations at local scales.
1.2 Conventional versus unconventional resources
A brief discussion is required to address nomenclature and fundamental
differences and issues between the two primary types of hydrocarbon accumulations
being exploited around the world today. Conventional resources, with a much longer
period of development extending back to the 19th century, are characterized by three
essential elements: a source, a reservoir, and a seal. Conventional petroleum systems
also require a process of hydrocarbon generation, migration, trapping, and preservation
over geologic time to produce exploitable hydrocarbons. Any conventional petroleum
system lacking a crucial component element or having mistimed process will be
uneconomic or could lack hydrocarbon accumulations all together.

4
Conventional petroleum accumulations are characterized by buoyancy effects of
hydrocarbons that require pathways for fluid migration away from a source rock and into
a sealed trap. Within a trap there are usually multiple fluid phases and contacts between
gas, oil, and water segregated vertically according to their buoyancy. These
accumulations usually occur over relatively large areas and require gravity drainage and
a water-drive mechanism to move hydrocarbons from the reservoir to the surface.
Because these mechanisms are quite efficient, very few wells are required to drain large
volumes of hydrocarbons from conventional traps and large recovery factors are to be
expected (Sonnenberg, 2001).
Conversely, unconventional, or continuous, petroleum accumulations do not
require these same petroleum systems elements. Often unconventional resources are
associated with shale formations that would be considered the source rock for a
conventional system. Thus, unconventional petroleum systems are often characterized
by a single formation acting as a source, reservoir, and seal.
Unconventional accumulations are usually associated with tight rock, or
formations with very low porosity and permeabilites, and high reservoir pressures, which
act as the driving mechanism for hydrocarbon production. As hydrocarbons are
produced, the driving high reservoir pressures that drive production is inherently
diminished over time, and future production potential is lowered. Unlike conventional
reservoirs, which generally produce hydrocarbons at more constant rates throughout
their production lifetime, production from unconventional systems decline at a rapid,
exponential pace over time (Sonnenberg, 2001). Tight geological formations are defined
as reservoirs that have less than 0.1 millidarcy (mD) of matrix permeability and less than

5
ten percent matrix porosity, which generally require large hydraulic fracture completions
to be economically produced (Law and Spencer, 1993).
Because of these characteristics, unconventional resource plays require both a
large number of wells drilled horizontally over long distances and complex completion
designs that use multiple perforation stages and high-pressure hydraulic fracture
stimulations to access the hydrocarbon stored within the tight rocks (Cipolla et al., 2011).
Because of the high reservoir pressures and extremely low porosities and permeabilites,
fractures induced by hydraulic fracturing must be propped open by ceramics or sand-like
particles called proppants to reduce the closure of the fracture network after fracture
operations cease. The presence of naturally occurring fractures will have major effects
on the production within these tight reservoirs. Most of these natural fractures exist at
scales well below the resolvable limit of seismic data. The use of a seismic attribute on
3D data, such as edge detection, gives an indication of stress state and possible natural
fracture swarms that are irresolvable by seismic offset analysis.
Owing their success to new technological innovations and large areal extents,
formations like the Bakken that were known to be hydrocarbon-rich, but uneconomic to
develop, now produce huge output volumes and highly favorable return on investment
capital, especially in sweet spot areas of basins like the Williston (Theloy, 2014). While
these unconventional plays have been considered highly successful, the fact remains
that recovery factors -even for the most productive North American unconventional
plays, are still dismally low, and often in the single digits, with an average of around 5-
8% of oil in place (EIA, 2011). When this small recovery is compared with primary
recover factors of conventional reservoirs in the range of 30-40%, the large disparity in
production efficiency of conventional vs. unconventional resources is clearly illustrated.
6
“Tight oil plays,” as these new unconventional resources are called, present a
number of additional challenges that are not completely shared with tight gas plays
(Aguilera, 2014). First, oil is a liquid that is incompressible and its molecular structure is
much larger and more complex than that of natural gas, or methane. Oil is also a generic
term and in most case the in-situ fluids are found in a variety of phases at in different
areas of a particular basin. Second, this phase complexity impacts reservoir-drive
mechanisms and presents additional issues related to processing and deliverability at
the surface
The recent boom of unconventional resource success in North America has not
come without continuing challenges. One of the biggest issues currently facing
exploration and production companies is the application of conventional geological and
engineering techniques that have been developed and refined for over a century to
unconventional resources that have emerged only within the past decade (Wiley et al.,
2004). Though conventional techniques can be used on large, basin- to field-size scales,
better methods and techniques must be developed to assess variations in reservoir
quality and stress heterogeneity over more useful scales, like the field- to the well-
scales. Improvements in these areas will help us increase the efficiency of extraction
and improve the recovery factor with which these unconventional resources are
developed and support their viability for the futures.
1.3 Project background
This thesis project is the outgrowth of several personal experiences during my
academic work and during my applied experiences with the oil and gas industry. I
personally witnessed the boom of Barnett Shale production near my hometown of

7
Dallas, Texas, and became interested in unconventional resource plays and becoming
involved in exploring for new shale resources here in North America.
For the two summers following high school, and after my first year as an
undergraduate geology major at the University of Texas at Austin, I worked for a small
company in Dallas, Brazos Oil & Gas, exploring the Hayneville-Bossier Shale play in
east Texas and Western Louisiana. The Haynesville remains a very prolific gas play
although production has slackened during the large drop in natural gas prices in 2008
related to overproduction using newly developed, unconventional drilling and production
methods.
During the summer after my second year at the University of Texas, I worked for
a small, unconventional exploration company, Eldorado Resources, exploring the
shallow, immature, but highly organic-rich Bakken shale in eastern North Dakota and
southern Manitoba. Being involved in this truly unconventional shale-oil extraction, I was
introduced to innovative hydrocarbon extraction method involving dual horizontal well
and advanced electrode heating elements that were designed to coerced oil and gas out
of immature, but highly organic rich source rocks.
For the last two summers of my undergraduate studies at the University of
Texas, I worked for Three Rivers Operating Company, which was an independent
operator, working in the west Texas and eastern New Mexico Permian Basin. With the
Three Rivers Operating Company I had the opportunity to work on a number of
conventional and unconventional play types in the Permian Basin. Around the time of my
graduation from the University of Texas in May of 2012, Three Rivers was very
interested in the Lower Wolfcamp Shale (also referred to as the Cline Shale) which was

8
an emerging unconventional oil play with large areal extents and very high upside, which
is still underexplored.
In a final summer internship with ConocoPhillips as a graduate student at the
University of Houston, I had the opportunity to work on exploration of the Eagle Ford
shale play in southeast Texas, which was another of North America’s most prolific
unconventional resource plays. The Eagle Ford Formation has many characteristics
similar to the Bakken Formation and my work during this internship has significantly
influenced the development of this thesis project.
Because well data and production statistics remain proprietary and restricted for
researchers in the state of Texas, I decided to focus my study on the Bakken Shale
located in the Williston Basin, North Dakota. All data pertaining to the exploration and
production of hydrocarbons in the state of North Dakota is open access and available for
a small annual fee. A large volume of data can be accessed by a simple web query,
which makes it very attractive for graduate students and others in academia seeking
access to high-quality data. I also benefitted from gaining access to the Red Sky 3D
seismic and well dataset kindly provided by the Hess Corporation to Dr. Robert Stewart
and the AGL Project at the University of Houston.
Chapter 2: INTEGRATION OF STRATIGRAPHY, FACIES, SEISMIC ATTRIBUTES, AND PRODUCTION STATISTICS TO PREDICT BAKKEN WELL PERFORMANCE,
RED SKY, WILLISTON BASIN, NORTH DAKOTA
2.1 Introduction
2.1.1 Significance and history of production from the Williston Basin
The Late Devonian-Early Mississippian age Bakken Formation is the most
important lithological unit in relation to oil and gas production in the Phanerozoic

9
Williston Bain according to Sarg (2012). As of June 2015, the Bakken Formation
produces approximately 1.2 million barrels of oil a day and is one of the largest
unconventional hydrocarbon resources in the United States and the world (EIA, 2015).
The Bakken is a relatively thin (160 foot maximum thickness), heterogeneous
formation divided into three main members: The Upper Bakken, the Middle Bakken, and
the Lower Bakken. The Upper and Lower Bakken members are black shales; the Middle
Bakken member is a dolomitized siltstone with mixed sandstones in some areas. The
upper and lower shale members have unusually high organic content (up to 20% total
organic carbon (TOC) by weight) that produces significant formation over-pressure
where these upper and lower shale members are thermally mature, in the center of the
basin (Nordeng et al,. 2010). The Upper and Lower Bakken Shale are the primary
source rock for the majority of hydrocarbon production throughout the Williston Basin
and are classified as world-class source rocks based on their productivity (Schmoker
and Hester, 1983).
Hydrocarbon production in the Bakken Formation began in 1953 with
conventional wells that targeted highly fractured and localized oil and gas pools.
Success was limited because of the discontinuous nature of the distribution of high-
quality reservoir facies in the Middle Bakken member (Price and LeFever, 1991). During
this early exploration period in the 1950’s, 60’s, and 70’s, porosity and permeability
within in the Bakken Formation itself was considered to be too low for economic
exploitation at the time, except for a few isolated, producing fields characterized by
extensive natural fractures and exceptional reservoir quality in the Middle Bakken
member (Gerhard et al., 1982). Most production in the 1950’s through the 1980 in the
Williston Basin was from porous, carbonate formations above and below the Bakken
10
Formation that include the Mississippian Madison Group and the Silurian Red River
Formation (Gerhard et al. 1982). This conventional production trend, characterized by
vertically-drilled wellbores targeting high-porosity reservoirs, continued through the
1980s but remained largely insignificant; in terms of production volumes compared to
other productive US basins at the time such as the Permian Basin of west Texas.
In the late 1980’s horizontal drilling technology gained widespread acceptance in
the oil and gas industry and led to increased production from thin units including the
Bakken Formation (Wiley et al., 2004). However, the reservoir quality and total
production, which were approximately 4,500 barrels of oil per day (BOPD) within the
Bakken Formation, remained relatively poor in comparison to other resource plays
around the United States such as the Permian Basin, which was producing over one
million BOPD at the time (UTPB website, 2015) In the early 1990’s, hydraulic fracture
completions developed in the Cretaceous Barnett Shale of north-central Texas were
applied to the thin and tight Middle Bakken reservoir and successfully enhanced porosity
and permeability that allowed remarkable increases in production of both liquids and
natural gas. Various major and mid-sized companies experimented with combinations of
horizontal drilling and hydraulic fracturing over the next decade. By the mid to late
2000’s, world oil prices skyrocketed and the ‘Bakken Revolution’ of tight oil production
sparked a bonanza in light- and tight-oil production from the Bakken Formation in the
Williston Basin and other unconventional reservoirs in North America like the Barnett
and Eagle Ford shale of Texas and the Marcellus shale of Pennsylvania (EIA, 2010).
Estimates of the total recoverable reserves from the Bakken Formation have
varied over time by a number of authors, but it is widely accepted that the Bakken
petroleum system in the Williston Basin is one of the most significant continuous
11
hydrocarbon accumulations in North America (Sorenson et al., 2010). Various studies
estimate the total reserves, recoverable and non-recoverable with today's technology, at
up to 24 billion barrels (Sarg, 2012). Another estimate places the figure at 18 billion
barrels (LeFever and Helms, 2006). In April 2013, the US Geological Survey released a
figure for the expected ultimate recovery of 7.4 billion barrels of oil (Androff and Wade,
2013). Additionally, the existence of highly developed midstream infrastructure and the
basin’s proximity to major consumer markets in Canada and the United States makes
the Bakken one of the most readily exploitable hydrocarbon resources in the world.
Operators are able to quickly move hydrocarbons from the ground to the well site to
market which added fuel to the Bakken Revolution since late 2014. The Bakken
Formation has arguably become a victim of its own success as recent production
capacity of the Bakken and other tight oil resources in North America have helped to
oversaturated a world oil market in an environment of flat consumer demand, which is
exerting downward pressure on the high oil prices that spurred development of in drilling
and production methods and technology.
2.1.2 Project goals and methodology
Previous studies have proposed optimal, “sweet spot” areas of Bakken
production based upon critical petroleum systems elements recognized at sub-basin
scale of tens of miles (Theloy, 2014). These sweet spots have been the primary focus of
drilling and production from the major operating companies in the Williston Basin.
Significant variation in production also occurs from well to well, even within these
regional sweet spot areas (Cipolla, et al., 2011). This project will provide an integrated
interpretation of the geology, geophysics, and hydrocarbon-production statistics in the

12
Bakken Formation to explain variations in well quality in at both the regional scale and
well-to-well scale in the eastern region of the Williston Basin in North Dakota.
2.1.3 Project data
The primary subsurface data used in this analysis is the Red Sky 3D seismic and
well data provided by Hess Petroleum Company to the University of Houston (UH) Allied
Geophysical Laboratory (AGL) in 2014 and an open-access online database from the
North Dakota Industrial Commission (NDIC), Department of Mineral Resources (DMR),
Oil and Gas Division (<https://www.dmr.nd.gov/oilgas> accessed in 2014 and 2015).
The Hess Red Sky 3D dataset contains both post-stack seismic data and seismic
horizon interpretations picked by staff geologists (personal communication with Hess
geologist John Hohman, March, 2014). The Hess Red Sky dataset also includes seismic
vertical seismic profile (VSP), microseismic, diagnostic fracture injection test (DFIT),
core, and well attribute data. The open-access, NDIC online database included scout
tickets, well files, well log, and core data for the majority of wells drilled across the North
Dakota part of the Williston Basin.
2.1.4 Data integration and workflow
All study data was evaluated using specialized geological and geophysical
platforms including IES Petra and Petrel then integrated geospatially in GIS using
ArcMap 10.1. ArcMap was chosen for its flexibility in handling many different data types
including geology, geophysics, and geospatially referenced surface and subsurface
attributes, like historical hydrocarbon-production statistics for specific Bakken oil wells.
Additionally, the NDIC has an open-access GIS Map server, compatible with ArcMap,

13
that contains a large, downloadable dataset of North Dakota oil & gas spatial layers,
from which I imported data for my study in the Red Sky area. The NDIC shape files
illustrate state planes boundaries, unit boundaries, oil fields, well surface locations,
directional and horizontal well paths et cetera. I also downloaded, digitized, and imported
several open-access geologic studies by the North Dakota Geological Survey with
general Bakken and Formation information including regional stratigraphy, structure,
thermal maturity, et cetera through the North Dakota Geological Survey’s webpage
(https://www.dmr.nd.gov/ndgs/bakken/bakkenthree.asp).
Post-stack seismic data provided to UH AGL by the Hess Corporation was
evaluated and interpreted in the Petrel software. Seismic attributes generated in Petrel
were imported as the spatial values (x, y) and as the attribute value (z). Each attribute
horizon contained over two million unique x, y, and z coordinates which were converted
using ArcMap, to raster layers in order to optimize their rendering and comparison
speed.
Historical fluid production statistics, as well as drilling and completion data, were
obtained from the NDIC online database and normalized using Microsoft Excel. The
normalized statistics became additional “production statistic attributes” associated
individual Bakken Formation oil wells in the study. These production attributes could
then be used for further analysis and comparison between the geologic and seismic
attributes that were computed in Petra and Petrel.
All of the attribute data were imported into ArcMap for spatial analysis. The
geology and geophysics attributes were gridded using empirical Bayesian kriging
method and converted to raster layers. Well-paths of Red Sky study wells were linked
with their associated production statistics to create individual, ArcGIS feature classes for
14
each study well. Using results from microseismic monitoring studies of hydraulic fracture
completion geometries in the Middle Bakken buffer zones were created that measured
500 feet transverse, in all directions, to the wellbores of the study wells (Dohmen, et al.,
2014). The wellbore buffer zones account for the average effective area of stimulated
rock induced by hydraulic fracture completions, and allows me to compare geologic and
geophysical spatial attributes to production statistics for individual wells. Using the
spatial analysis toolset in ArcMap, geological and geophysical attributes statistics within
each well’s wellbore buffer were computed as linked with the associated well.
All of the geological, geophysical statistics computed within the study well’s
wellbore buffers were imported into TIBCO Spotfire analytics software to be compared
with the normalized production statics for each well. Linear-regression analysis was run
to analyze relationships between the geology and ultimate well production. These results
will be discussed in depth in Section 2.5.2.
2.2 Regional-scale geology
2.2.1 Paleogeography of the Williston Basin
The Bakken Formation is a Late Devonian to Early Mississippian Formation
deposited in the intracratonic, Williston Basin which was a partially, enclosed, easterly
embayment of the Western Canada sedimentary basin (Figure 1). At the time of
deposition, the Williston Basin was situated nearly 600 miles from a convergent plate
boundary to the west and formed a shallow epicontinental sea near the Paleozoic
equator (LeFever, 1991).

15

16
Clastic sedimentary rocks of the Williston Basin were sourced from the southeast and
northeast from uplift and erosion of the North American Transcontinental arch. The
Lower and Upper Bakken shales were deposited in transgressive systems tracts with
max flooding surfaces near their tops. The Middle Bakken member is marked by a
complete transgressive-regressive system (Meissner, 1991). These depositional
systems generally follow the Paleozoic, eustatic sea level curve as shown by Cobb and
Sonnenberg (2013). Bakken lithofacies are also controlled by circulation patterns within
the intracratonic Williston basin that promoted cyclical periods of anoxic and oxidized
sedimentation (Angulo et al., 2008).
2.2.2 Basement types and structure underlying the Williston Basin
Aeromagnetic surveys by the U.S. Geological Survey (2000) over the Williston
Basin show strong, north-south magnetic lineations that correlate with major structures
within the overlying Williston Basin of Paleozoic age that include the Nesson and Cedar
Creek Anticlines (Figure 2A). The Phanerozoic sedimentary rocks of the Williston basin
were deposited above a suture zone separating two Archean age cratons: the Wyoming
Craton to the west and the Superior Craton to the east (Green, et al. 1985). It is
generally accepted that Phanerozoic sediment was draped upon basement structure and
that these and other planes of weakness evolved and were reactivated at numerous time
periods in the history of the Williston basin, including the Laramide orogeny during the
late Cretaceous to Eocene time (Gerhard et al., 1987). This basement reactivation has
produced most of the major structural deformation and natural fractures developed in the
Bakken interval (Gerhard et al., 1987; Herrera, 2013). These episodes of basement
reactivation propagated upward to control natural fractures within the Bakken Formation
17
interval (Brown and Brown, 1987). My thesis study area (red polygon shown in Figures
2A, 2B) is situated near the center of the Williston Basin, in the northwestern corner of
North Dakota. The Red Sky 3D seismic survey, which will be discussed later in the
thesis, is shown for reference (blue rectangle, Figures 2A, 2B). The largest structural
feature in the Williston Basin and adjacent to my study area is the Nesson Anticline
(Figure 2).
2.2.3 Regional structural elements
All of the major anticlines in the Williston basin including the Nesson, Billings,
Little Knife, and the Cedar Creek are associated with greater conventional hydrocarbon
production related to enhanced porosity and permeability development (Sonnenberg and
Pramudito, 2009). Overprinting the major north-south-trending fold axis of the Williston
Basin are surface lineaments associated with the Brockton-Froid and the Great Falls
Fault Zones, which were formed as a result of the far-field effect of first the Paleozoic
Ancestral Rocky Mountains and later during the Cretaceous-Eocene as a result of the
Laramide Orogeny (Gerhard et al., 1987: Herrera, 2013). Associated trends can be
mapped via surface lineaments and subsurface seismic data (Figure 3). These surface
lineaments have been correlated with swarms of subsurface fractures controlled by the
modern northeast-southwest direction of maximum stress. Fractures in this orientation
have also been observed in cores and from borehole breakout studies by Zoback (1980)
and Sonnenberg et al. (2011). More recently this northwest to southeast fracture trend
has also been observed from induced fractures and microseismic monitoring of hydraulic
fracture stimulations in the Bakken formation (Abbot et al., 2009).

18

19
20
2.2.4 Physical profile and general stratigraphy of the Bakken Formation
While major north-south folds are present in the Williston basin, dips defining
these folds are generally less than one degree (Meissner, 1991). The cross section in
Figure 4 summarizes the main elements of the Devonian-Mississippian Bakken
Petroleum System: the Devonian Three Forks Formation, the Devonian to Mississippian
Bakken Formation, and the Mississippian Lodgepole formation (Figure 5).
The Lodgepole Formation is primarily composed of marine limestone and
historically has contained the most prolific, Bakken-sourced, conventional reservoirs with
more developed conventional porosity and permeability pathways (Stroud and
Sonnenberg, 2011). In contrast, the Three Forks Formation is an emerging tight-oil play
similar to unconventional Bakken development, sourced from the Upper and Lower
Bakken shale (Sonnenberg, et al., 2010). While each of these members have, and
continue to, produce significant volumes of hydrocarbons, the Bakken Formation is by
far the most significant hydrocarbon sourcing and bearing member in the Williston Basin
(Sarg, 2012). The Upper and Lower Bakken shale are classified as world-class source
rocks that contain an average TOC content of 11% and source the majority of the
hydrocarbon accumulation in the Williston Basin (Jarvie, 2001: Jin and Sonnenberg,
2013).

21
22
Because the Bakken shales contain such high amounts of TOC, which makes
them mechanically ductile, drilling through these ductile shales presents a challenge to
maintain borehole stability (Wiley et al., 2004). In contrast, the Middle Bakken member,
though relatively thin (<100 feet in most areas), is considered the primary reservoir
interval and is the drilling target for the majority of wells drilled in the Bakken Formation
(Angulo and Buatois, 2012). The Middle Bakken provides an increased level brittleness
favorable for drilling when compared with the Upper and Lower Bakken shales (Grau
and Sterling, 2011). In addition to increased brittleness, the Middle Bakken member
provides, in some cases, an increase in porosity and permeability similar to a
conventional reservoir, but this is largely localized and controlled by the presence of
certain Middle Bakken lithologies (Sonnenberg, et al., 2010).
2.2.5 Petroleum system elements of the Bakken in North Dakota
Structure. In the study area dips are subtle, averaging less than 2° over the
majority of the study area to the east of the East Nesson Deep and increase slightly, to
approximately 5° on the flank of the Nesson anticline (Figure 6). The Williston Basin as a
whole is generally symmetrical and typical of intracratonic basin (Meissner, 1991). My
study area deepens to the southwest and contains the deepest part of the basin on the
eastern flank of the Nesson Anticline. The low dips and lack of major structure allows the
Middle Bakken reservoir to be well sealed and overpressured as hydrocarbons are
generated (Sorensen et al., 2010).
Stratigraphic thickness. The thickness of the Bakken Formation inside the
study area is controlled by the structure of the Nesson Anticline (Figure 7).

23
24

25
It is asserted that, at the time of deposition, the Nesson Anticline had formed and acted
as a barrier to clastic sediment transport in the shallow marine environment (Gerhard, et
al. 1987). The thickest occurrence of the Bakken Formation (160 feet) is found within the
study area and the Red Sky 3D seismic survey, which, in turn, corresponds to the
thickest occurrence of the Middle Bakken clastic rocks (Figure 7).
Maturity. Thermal maturity of the upper and lower Bakken shale corresponds
with the greater burial depth of the Bakken Formation in the study area and is a major
factor for the productivity of this area (Figure 8). Anomalously high thermal maturity is
found outside of the study area to the south and is locally associated a zone of
anomalously higher heat flow (Nordeng, 2010).
Overpressure. Thermal maturity of the upper and lower Bakken shale also
correlates with overpressure within the Bakken and is a major driver of production in the
Bakken tight oil system (Sorensen et al. 2010). This overpressure has contributed to the
generation of hydrocarbons by the conversion of solid, compressible kerogen to
incompressible liquid hydrocarbons (Duhailan and Sonnenberg, 2014).
Production limits. It is well established that hydrocarbon generation begins at a
Time Temperature Index (TTI) value of 15 (Jarvie, 2001). However, historical Bakken
production on the eastern side of the Nesson Anticline has established an informal “line
of death” where hydrocarbon generation has not been sufficient to create the
overpressure necessary to extract meaningful volumes of hydrocarbons from a TTI value
of 25. This production boundary is apparent on Figure 8 as the sharp eastern limit of
producing Bakken wells within the study area. This thermal maturity boundary aligns with
the eastern extent of the Red Sky 3D seismic survey (Figure 8).

26

27
Sweet spots in the basin. Previous studies in the Williston Basin have proposed
sweet spots of the Williston Basin based on their geologic elements and historical well
performance (Sorensen et al., 2010). Important elements in these studies include shale
thickness, thermal maturity, and overpressure, which is generally concentrated in the
central area of the basin (Gerhard et al. 1982). More-recent studies have identified more
locally specific sweet spots and characterized the specific attributes that make them
unique (Figure 9). The study area for this project encompasses several of these
proposed sweet spots, but I will focus primarily on the Sanish-Parshall fields that have
been North Dakota’s most prolific oil fields since 2005 (Simenson, 2011).
High reservoir pressure, up-dip migration, and diagenetic trapping all
characterize the Sanish-Parshall sweet spot (Theloy, 2014). These characteristics
require the presence of a mature source rock, a permeability conduit for hydrocarbon
migration, and a high-quality reservoir facies. Even within these proposed sweet spots,
significant production variation exists between closely spaced wells within these sweet
spots (Sorensen et al., 2010). This study will address the question of what controls this
production variation within individual sweet spots and how we can use this knowledge to
guide future drilling.
The study will begin with establishing a geologic framework within the study area
by mapping changes in the reservoir lithology of the Middle Bakken in the eastern region
of the Williston Basin (Figure 9). Upon establishing the geologic framework, I will provide
a more detailed evaluation of the geologic heterogeneity within the blue rectangle
covered by the Red Sky 3D survey using core data. This detailed geologic interpretation
will then be compared with the productivity of wells in the area by analyzing historical
28

29
production statistics to identify important geologic elements that correlate with production
variation between closely spaced wells.
2.2.6 Bakken Formation facies distribution
Operators drilling wells in the Bakken Formation in the Williston Basin, east of the
Nesson Anticline, generally target a low-gamma-ray sandstone unit in the upper part of
the middle Bakken (Sorensen et al. 2010) (Figure 10A, B). This unit is relatively thin
(usually less than 15 feet thick) but fairly easy to recognize in the vertical section and
using MWD (measurement while drilling) tools. Core analysis of the Bakken Formation in
my study area consistently identifies the middle Bakken Sand as the highest quality
target due to its high hydrocarbon saturations, good porosity, and good permeability
observed by measurements from the Middle Bakken (Simenson, 2011) (Figure 10C).
However, the sandstone thickness is quite discontinuous over the study area.
Using 182 wells that have vertical well log suites, including gamma ray, with
complete Bakken Formation sections, I correlated the three Bakken members, as well as
the Lower Middle, the Upper Middle, and Middle Sand within the Middle Bakken (Figure
10B). Isopach maps were contoured over the study area for the Lower Bakken Shale
(Figure 11A), the Lower Middle Bakken Silt (Figure 11B), The Middle Bakken Sand
(11C), the Upper Middle Bakken Silt (Figure 11D), and the Upper Bakken Shale (Figure
11E). For reference, an isopach of the summation of the Upper and Lower Bakken Shale
thickness with the Middle Bakken Sand thickness (Figure 11F) was made to indicate
areas where one would expect high volumes of hydrocarbon in place.

30

31
32
I assume that the Upper Middle and Lower Middle Bakken silt facies have matrix
porosities too low to provide significant storage of hydrocarbons in place. The Middle
Bakken Sand (Figure 11C) has been identified as the highest-quality reservoir facies
present in the Middle Bakken member within the study area and where sufficiently
charged, would have the inherent porosity and permeably to flow hydrocarbon to a
wellbore. Where no sand is present, I assume wells must connect to natural, or induced
permeability pathways into the Upper or Lower Bakken Shales. These connections are
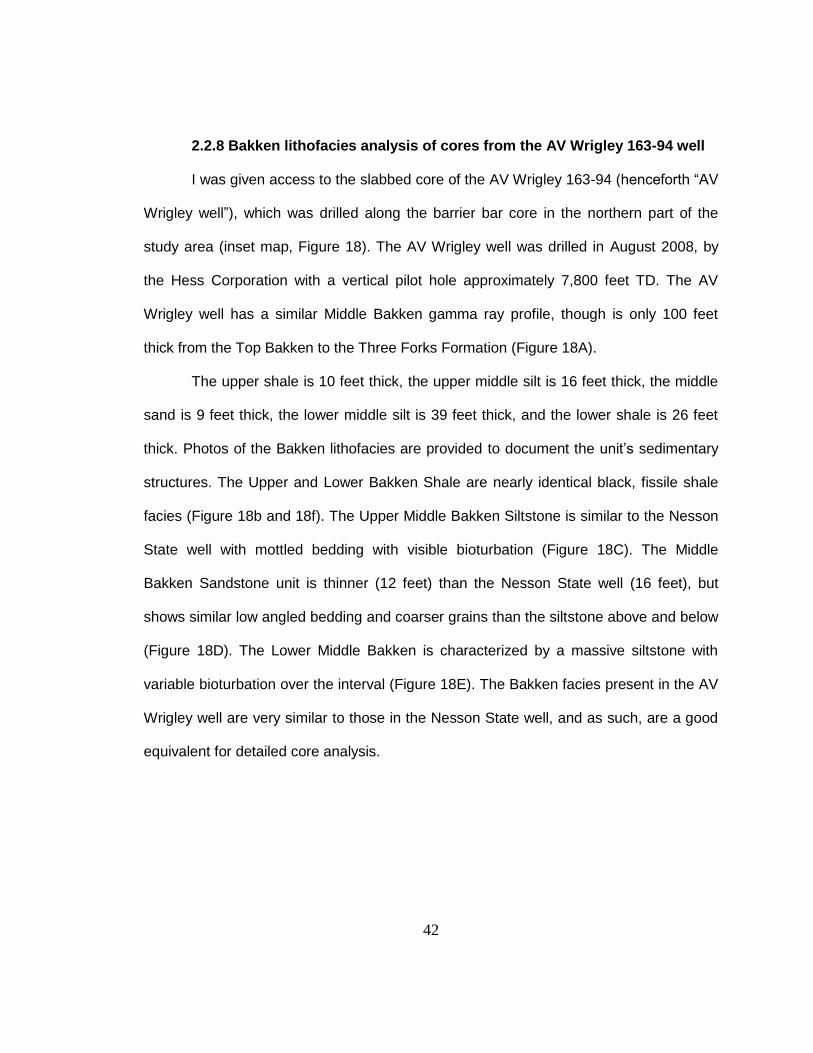
assumed but supported by observations from core descriptions (Figure, 19).
The Middle Bakken Sand has thicknesses that range from 0-25 feet and is
deposited fairly uniformly across the Nesson Anticline structure (Figure 12). The Middle
Bakken Sand is more continuous in an elongated northwest-southeast orientation with
discontinuous deposits on the eastern side of the study area (Figure 12). From its overall
geometry and orientation the depositional environment of the Middle Bakken sand is
interpreted to be a barrier bar complex with tidal influences (Angulo and Buatois, 2012).
Four cross-sections A – A’, B – B’, C – C’, and D – D’, oriented north to south, west to
east, south to north, and west to east respectively were constructed to show how facies
vary within the Middle Bakken interval (Figure 12).

33
34
Cross-section A – A’ runs north to south along the western edge of the study
area and includes five vertical well log suites flattened on the base of the Upper Bakken
Shale for a better understanding of the stratigraphic variation within the unit (Figure 13).
Each well contains a gamma-ray log in the left track and a bulk density log in the right
track (Figures 14 – 16). Cross-section A – A’ details the most-continuous section of
Middle Bakken, with the Middle Bakken Sand unit (shown with yellow overlay across the
logs) exhibiting a distinctive blocky, low gamma-ray profile on each well profile. This
section runs through what I have interpreted as the barrier core of the Middle Bakken
Sand barrier bar complex. This cross-section also contains two important wells that will
be discussed in more detail in the Middle Bakken Facies and core analysis sections: the
AV Wrigley 163-94, with its associated cored interval, and the Nesson State 42X-36 with
its detailed Middle Bakken stratigraphy (Figure 13A, B). Black circles mark important
reference points in each respective well’s depth track, which will be discussed in detail
later.
Cross-section B – B’ traverses from west to east in the southern part of the study
area, crossing the barrier core, a tidal flood delta inside of the Red Sky 3D area, and
finally into a back-barrier lagoonal setting (Figure 14A, B). The tidal-flood delta has a
thick Middle Bakken Sand sequence and a thin Lower Middle Bakken unit, but is
discontinuous laterally. The sandstone thickness in the Middle Bakken member varies
over a distance of 5 to 10 miles.

35
36

37
Cross-section C – C’ runs from south to north, in the eastern part of the study area, and
crosses the back-barrier environmental setting (Figure 15A, B). The interpreted tidal
flood delta sands occur locally and are separated in wells by predominantly silty Middle
Bakken intervals (Figure 15A). The back-barrier setting is characterized by wells with
relatively thin total Middle Bakken intervals compared with wells in the barrier core,
which is probably due to their position on the flank of the Williston Basin, rather than
near the deeper middle portion where the barrier core lies (Figure 15A).
Cross-section D – D’ travels west to east, in the northern part of the study area,
through the barrier bar core and across a relatively thin Middle Bakken Sand section
interpreted as a wash-over fan deposit (Figure 16A, B). The Middle Bakken Sand unit
landward of the barrier bar (east) is relatively thin compared to the core and to the tidal
flood delta deposits to the south. This may be due to depositional method (wash-over
deposit).
38
39

40
2.2.7 Bakken lithofacies analysis of core from the Nesson State 42X-36 well
The Nesson State 42X-36 well is a horizontal well with a deep, vertical pilot hole
drilled into the core of the sandy Middle Bakken barrier bar inside of the Red Sky 3D
survey area (inset map Figure 17). The Nesson State 42X-36 (henceforth “Nesson State
well”) was spudded in February, 2008, by Headington Oil Company, now operated by
XTO Energy. According to the NDIC well file for this well, the vertical pilot hole
penetrated to the top of the Three Forks Formation underlying the Bakken Formation for
a total depth of 10,430 feet. The Bakken Formation is approximately 143 feet thick in the
Nesson State well, which is near the maximum thickness of 160 feet shown on
LeFever’s (2008) Williston Basin Bakken isopach map (in Figure 7). The Middle Bakken
thickness in the Nesson State is 74 feet total, with a Middle Bakken Sand thickness of 12
feet, an Upper Middle Bakken silt thickness of 8 feet, and a Lower Middle Bakken Silt
thickness of 54 feet (Figure 17A). The Upper Middle Bakken is a relatively thin, silty unit
with mottled bedding and relatively intense bioturbation (Figure 17B). The Middle
Bakken Sand is marked by a blocky low gamma-ray-log signature and low-angle dip to
cross bedding (Figure 17A). The Lower Middle Bakken is the thickest well log unit
marked by mostly massive bed with variable bioturbation throughout the unit (Figure
17C). I did not have access to core samples for the Nesson State well, thus no detailed
core analysis was undertaken on this well. However the Middle Bakken facies present in
the Nesson State well closely resemble the well log profile and those facies observed in
core analysis of the AV Wrigley 163-94 well.

41
42
2.2.8 Bakken lithofacies analysis of cores from the AV Wrigley 163-94 well
I was given access to the slabbed core of the AV Wrigley 163-94 (henceforth “AV
Wrigley well”), which was drilled along the barrier bar core in the northern part of the
study area (inset map, Figure 18). The AV Wrigley well was drilled in August 2008, by
the Hess Corporation with a vertical pilot hole approximately 7,800 feet TD. The AV
Wrigley well has a similar Middle Bakken gamma ray profile, though is only 100 feet
thick from the Top Bakken to the Three Forks Formation (Figure 18A).
The upper shale is 10 feet thick, the upper middle silt is 16 feet thick, the middle
sand is 9 feet thick, the lower middle silt is 39 feet thick, and the lower shale is 26 feet
thick. Photos of the Bakken lithofacies are provided to document the unit’s sedimentary
structures. The Upper and Lower Bakken Shale are nearly identical black, fissile shale
facies (Figure 18b and 18f). The Upper Middle Bakken Siltstone is similar to the Nesson
State well with mottled bedding with visible bioturbation (Figure 18C). The Middle
Bakken Sandstone unit is thinner (12 feet) than the Nesson State well (16 feet), but
shows similar low angled bedding and coarser grains than the siltstone above and below
(Figure 18D). The Lower Middle Bakken is characterized by a massive siltstone with
variable bioturbation over the interval (Figure 18E). The Bakken facies present in the AV
Wrigley well are very similar to those in the Nesson State well, and as such, are a good
equivalent for detailed core analysis.

43

44
I described 119 feet of core for the AV Wrigley well from the top of the Three
Forks Formation, through the entire Bakken Formation, into the lower Lodgepole
Formation. Since I was primarily interested in the Middle Bakken reservoir interval, and
the Upper and Lower Bakken shale are effectively homogenous to the naked eye, the
core description figures will document a section approximately 90 feet thick that includes
the Middle Bakken interval in the AV Wrigley well (Figure 19). The core analysis began
from the bottom of the section to the top, following the order of deposition from oldest to
youngest strata.
The Lower Bakken Shale is 26 feet thick and is dark black in color, with
centimeter-scale, fissile bedding, ubiquitous pyrite, and sparse silty layers near its top
contact (Figure 19). The upper contact with the Lower Middle Bakken is sharp and is
marked by approximately 3.5 inch lens of skeletal rip-up clasts (Figure 19).
The Lower Middle Bakken is a silt-dominated dolostone and the thickest unit in
the Bakken Formation measuring 39 feet in the AV Wrigley well (Figure 19). This unit
has moderate bioturbation at its base and intense bioturbation near its top (Figure 19).
Where the Lower Middle Bakken lacks bioturbation it is generally massively bedded with
sparse pyrite nodules. Skeletal hash contains primarily brachiopod and bivalve shells,
with some crinoid columnals (Figure 19). In bioturbated areas ichnology is complex, but
primarily Cruziana ichofacies (Angulo and Buatois, 2012). Bioturbation ceases and grain
sizes coarsen sharply at the Lower Middle Bakken’s top contact with the Middle Bakken
Sand.
45

46
The Middle Bakken Sandstone measures approximately 9.5 feet and is a light
grey to white, clean (little to no mud), well-sorted sand with centimeter-scale parallel to
cross bedded beds and alternating calcite-dolomite banding (Figure 20a). Intergranular
porosity is visibly higher in the sand unit relative to all other Bakken units, but varies
depending on cementation. The Middle Bakken Sandstone has bright blue fluorescence
under ultra violet (UV) light indicative of hydrocarbon saturation, which is
compartmentalized by lenses of calcite cement (Figure 20b). Although the unit is
relatively thin, the Middle Bakken Sandstone is the highest quality reservoir facies in the
Bakken Formation based upon hydrocarbon storage and potential permeability
pathways. The sand’s upper contact with the Upper Middle Bakken unit is sharp and
marked by an increase in bioturbation and a decrease in grain size, as well as a
darkening of color.
The Upper Middle Bakken in the AV Wrigley is 16 feet thick, dark grey in color,
and silt dominated. The Upper Middle Bakken is similar to the Lower Little Bakken facies
but is bioturbated through the entire interval. Grain size is very fine and bedding is highly
mottled. The unit has some UV fluorescence near its basal contact with the Middle
Bakken Sandstone, but is weaker in intensity and orange-yellow in color which is
considered less saturated and ultimately lower quality (Chuparova, Hohman, and Lean
2014). The top contact with the Upper Bakken is sharp into the dark black shale.
The Upper Bakken Shale is visually identical to the Lower Bakken Shale. In the
AV Wrigley, the Upper Bakken is 10 feet in thickness, dark black in color and highly
organic. Ubiquitous pyrite and fissile bedding characterize the upper shale as well
(Figure 19).

47

48
2.2.9 Interpretation of the Middle Bakken depositional environment
The environment of deposition of the Middle Bakken sand is interpreted to be a
barrier bar system with a strong tidal influence similar to the same, coeval unit previously
described in southeastern Saskatchewan (Wood et al., 2013). Reinson’s (1992)
depositional model for an idealized shallow marine barrier bar complex (Figure 21A),
closely resembles the two-dimensional sand thickness map mapped via well logs in map
view from my study area (Figure 21B). Sand thickness and orientation is controlled in
large part by eustatic sea level changes promoting a higher energy environment than
observed in the upper and lower middle siltstones.
The most striking feature of the Middle Bakken Sand geometry is the elongated
barrier core, which is oriented northwest to southeast, and the tidal flood deltas
deposited on the landward (eastward) side of the barrier core (Figure 21B). The tidal
flood deltas, though small in area, appear to contain very high reservoir quality with the
thickest sands separate from the barrier core. A large wash-over deposit is interpreted in
the northern portion of the study area, which covers a relatively large area (Figure 21B).
49

50
However, the wash-over deposit is relatively thin and appears to contain lower-quality
reservoir sands than that found in barrier core and flood tidal delta. Coastal North
Carolina has been identified as a modern-day analog to the deposition of the Middle
Bakken Sand (Figure 21C) though size and scale are not exact. No exact modern
analog to the Bakken Formation deposition in an intracratonic basin in an epicontintal
seaway (Kasper, 1995).
2.3 Field to well-scale seismic structure
2.3.1 Red Sky 3D seismic survey
The Bakken Formation is a tight-oil reservoir that requires large hydraulic fracture
completions to produce at economic volumes (Angster and Sarg, 2013). Therefore, while
a thick section of Middle Bakken Sandstone greatly improves the well quality of a
Bakken unconventional well, the sand alone is insufficient to produce a high quality well.
Permeability pathways from the wellbore to the hydrocarbons generated in the Upper
and Lower Shale must be naturally present, or induced through hydraulic fracture
treatments. To analyze the field-level structure in the study area, the Red Sky 3D
Seismic survey was evaluated for seismic discontinuity that would indicate structural
deformation associated with natural fractures.
My study area survey lies on the eastern flank of the Nesson Anticline and
includes a portion of the deep Williston basin, shallowing eastward towards the basin
margin. Structural dip is relatively shallow, measuring less that one degree in most
cases in the Bakken interval (Figure 22A). Eighty-four horizontal Bakken wells drilled
from 2005 to 2014 were chosen for production analysis in statistical analysis section,
however there location is displayed here for reference. The Red Sky 3D survey is
51
situated in the central portion of the stratigraphic study area discussed in the previous
section (Figure 22B). The Red Sky survey covers the central portion of the Middle
Bakken barrier bar mapped via well logs on its west side, and includes a major tidal flood
delta to the east (Figure 23). The Middle Bakken Sand thins toward the center of the
survey, but overall the Middle Bakken is relatively thick in the study area and appears to
be of high reservoir quality.
The low dips of the Bakken formation are apparent on the 2D seismic lines
(Figure 24). This lack of significant structure is consistent with the intracratonic setting of
the Williston Basin (Meissner, 1991). Prominent seismic horizons were tied to study well
logs (Kingsley, 2015) and were picked over the study area following the regional 2D
seismic work of Anna et al. (2010). The Bakken Formation, though relatively thin, is
characterized by strong seismic impedance from the contrast of upper and lower shale
with surrounding rock and is continuous and easy to pick across the Red Sky survey
(Figure 24). No obvious seismic discontinuities are present within the survey area that
would indicate major faults. However, subtle dip changes are evident in the Bakken
Formation and above and below that would suggest sub-seismic faulting.
A sample synthetic seismogram from Kingsley (2015) and a zoomed in view of
the Bakken and Three Forks reflector reveals that the Bakken formation consists of a
trough-trough-peak in the seismic data (Figure 25A, B). Though the formation appears
largely flat at the survey scale, subtle structural variation is apparent at smaller scales
(Figure 25B). This subtle structural variation at very small scales likely impacts the local
stress regimes and may impact drilling and completion effectiveness on a well to well
basis (Cipolla, 2011). Quantifying this structural variation will be the aim of the next
section of the project.

52
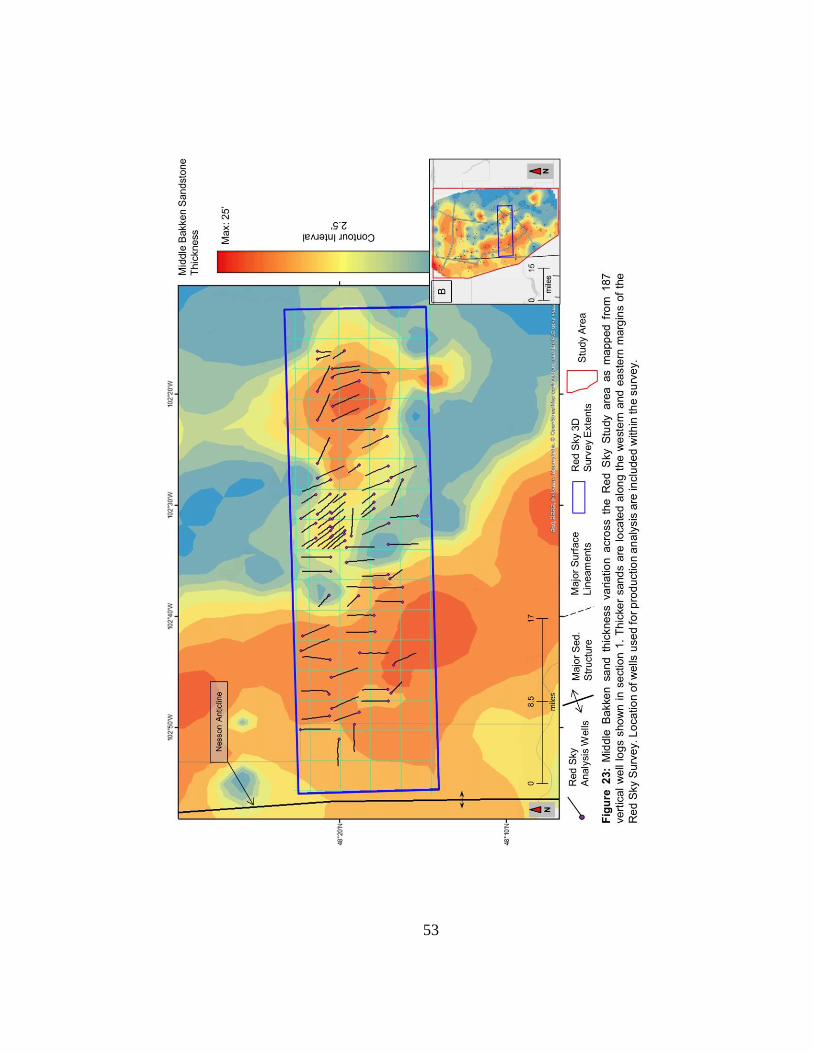
53
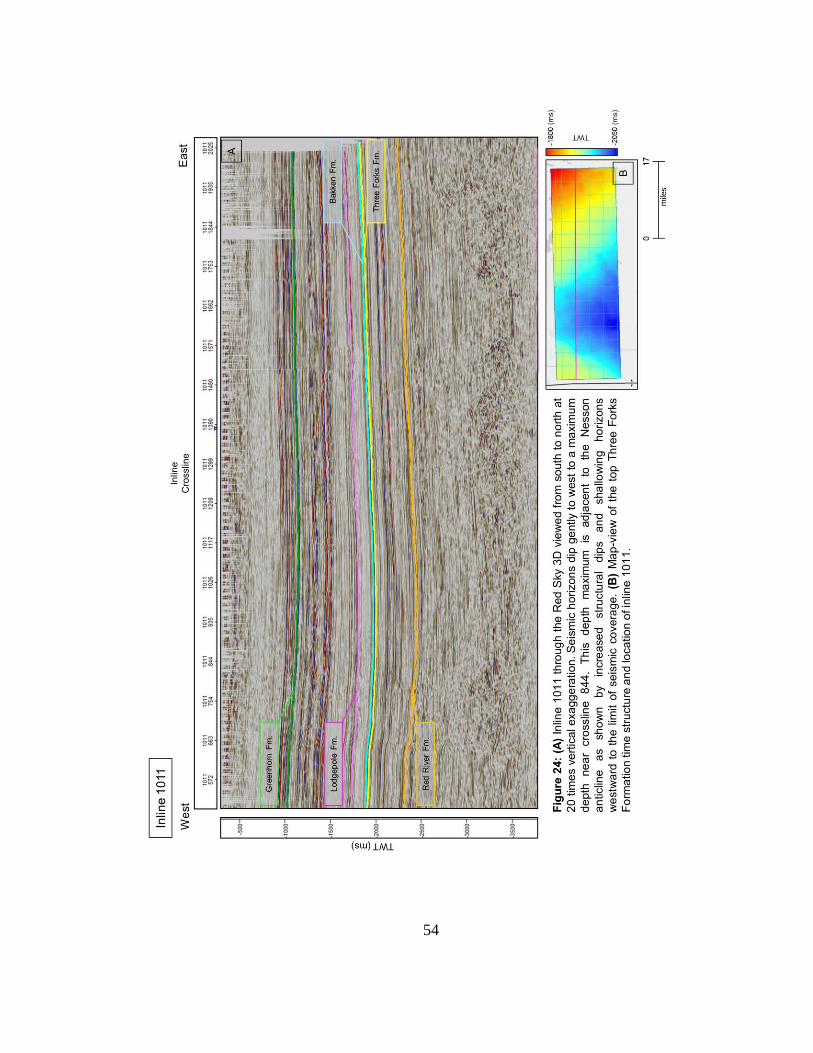
54

55
TW
T (
ms)
Am
plit
ud
e
S-wave Density Gamma
Ray
Computed
Reflectivity P-wave

56
2.3.2 Seismic attributes for analysis of subtle structural features
Natural fractures present in the Red Sky study area will significantly impact
modern, ambient stress regimes with northeast-southwest compression (Sonnenberg et
al., 2010) that may preferentially promote the development of fractures along these
preexisting planes of weakness during hydraulic fracturing (Gale, 2014). Because the
fracturing in the Red Sky 3D seismic volume contains little to no offset on larger faults
detectable on the seismic data, or abrupt changes in dips of bedding related to fault
offsets (Figure 24), structural attributes were generated on the base of the Bakken
Formation to highlight changes in continuity between seismic traces (Figures 26A, B, C).
Being the base of the Bakken reservoir, this horizon should be the best representation of
the structure of the Bakken as a whole (Figure 26A). These discontinuities likely
correspond with structural deformation that is very subtle and interpreted as a system of
fractures that parallels the modern direction of maximum compressive stress (Figure 27).
The use of seismic attributes in thin rock formations is a developing field that
shows great potential (Marfurt and Alves, 2015). The problem with many tight oil plays,
like the Bakken, is that the thickness of the target formation lies near or below the
physical limit of seismic resolution, or the tuning thickness. Advanced thin-bed attributes
have been developed which use external data sources, such as sonic well logs, to add
high frequency bandwidths to the band-limited seismic data. However, these attributes
have in inherent non-uniqueness that adds high uncertainty to their interpretation (Taner,
2003). Therefore, I have chosen to utilize well-developed attributes to characterize
variation in the strong lower seismic reflector of the Bakken Formation. Any subtle
changes in the continuity of the Bakken formation may be indicative of sub-seismic

57
natural fractures or areas of increased stress regimes that may preferentially fracture
during hydraulic stimulation (Jones and Roden, 2012).
First, the edge detection attribute was used to identify fractures on the top of the
Three Forks Formation that underlies the Bakken Formation (Figure 26B). The edge
detection attribute calculated in Petrel is closely related to the semblance algorithm that
is also sensitive to changes in both amplitude and waveform along the seismic reflector
(Chopra and Marfurt, 2007). Edge detection values were extracted along the top of the
Three Forks horizon and plotted in map view with the higher values associated with
higher seismic continuity, while lower values are associated with edges associated with
fractures. Next, a dip-angle attribute was generated on the Three Forks (base of the
Bakken) Formation (Figure 26C). The dip-angle attribute is essentially a first derivative of
the seismic structure, which highlights second-order structural changes independent of
first-order structural dip (Chopra and Marfurt, 2007). The dip-angle attribute appears to
highlight major structural discontinuities, similar to edge detection. Both the edge
detection and dip-angle attributes extracted on the Three Forks horizon were compared
with attributes extracted on the Lodgepole Formation horizon, approximately 200 ms
above, to insure that no shallow-horizon artifacts were present in the Bakken interval of
interest. Although the orientations of major structural anomalies appear to correlate,
attributes generated on the Three Forks horizon were deemed unique.

58
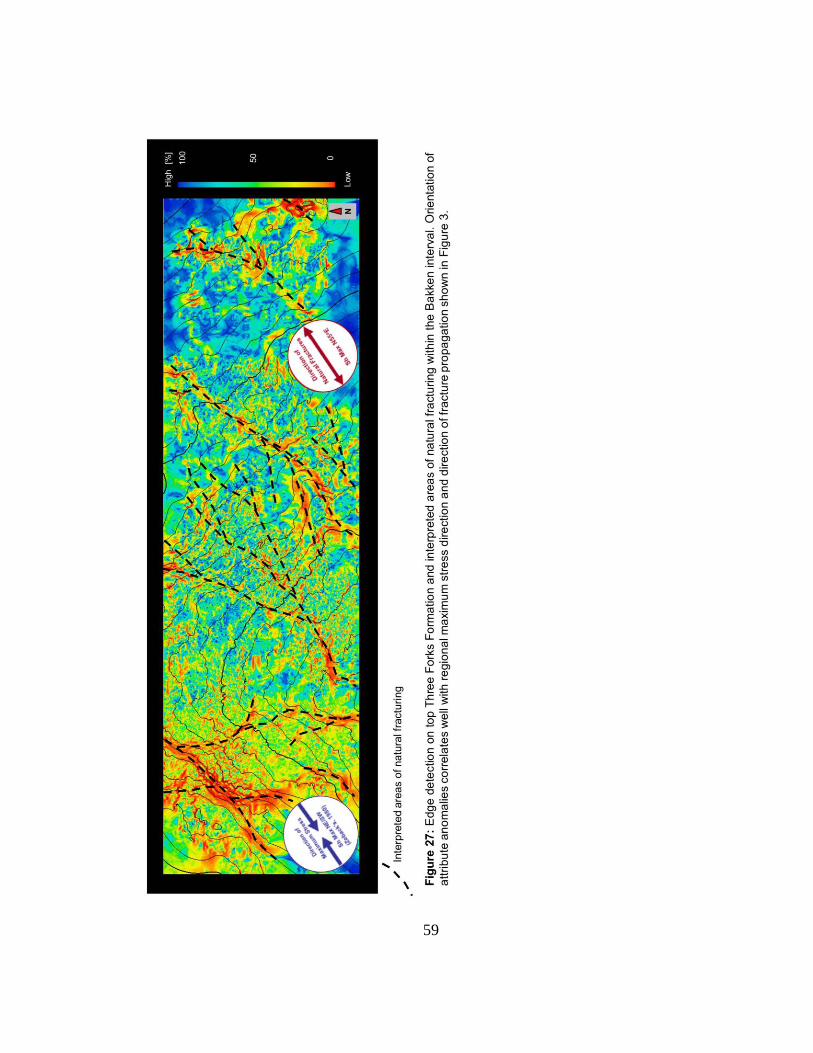
59
60
Because it is easiest to visualize structural discontinuities that appear to be
geological using edge detection, this attribute is used to illustrate fracturing of the
Bakken Formation. Using the edge detection attribute and the regional maximum stress
direction from Zoback (1980), I interpreted areas with a high probability of natural
fracturing associated with the most extreme edge detection values (Figure 28). The
interpreted fracture trends are consistent with the direction of natural propagation seen
in other studies in the area (Sonnenberg and Pramudito, 2009). These natural fractures
may provide areas of increased permeability development in the low permeability rock
and are also likely to influence the local stress and/or pressure state of the Bakken
reservoir. Because the Bakken Formation has a solution-gas reservoir drive mechanism,
any fractures may be impacting pressure development, especially if the Upper or Lower
Bakken Shale has been breached (Theloy, 2014).
2.3.3 Quantifying structural variation in individual wells Identifying and interpreting areas of possible natural fracture development is a
basic observation for characterizing structural variation at the field scale. In order for this
fracture analysis to be applied to specific wells, I quantified the attribute values
associated with 84 individual, horizontal wells to compare well quality.
I imported seismic attributes generated in Petrel into ArcMap 10.1 for spatial
analysis. Using ArcMap I was able to generate statistics for each of the 84 chosen
wellbores in comparison to the attribute values for the part of the 3D volume that these
individual wells penetrate (Fig. 28A). Because of large, hydraulic fracture completions
associated with Bakken Formation horizontal wells, the attribute value intersecting the
wellbore may not be an accurate representation of the structural conditions under wich

61
the induced fracture lengthens after initiation. Previous microseismic surveys in the
Bakken Formation of the Williston basin encountered fracture growth varying from a few
hundred feet laterally, to more than 1000 feet horizontal from the wellbore (Abbott et al.,
2009).
Using an approximate average from the observed extreme values, I choose to
implement a buffer overlay of 500 feet perpendicular around each wellbore to calculate
statistical values of seismic attributes likely to be encountered by induced fractures in
each well (Figure 28B). Using ArcMap, I generated statistics within each wellbore buffer
and stored them in an Excel table. Statistical values for attribute values within the buffers
include minimum, maximum, range, mean, sum, and standard deviation. The same
process was used for the dip angle attribute. These statistics will be compared with well
quality and quantified using normalized, historical production statistics discussed in the
next section.

62

63
2.4 Normalizing historical production to evaluate well quality
2.4.1 Bakken production statistics
To evaluate the relationship between well quality and the seismic-attribute
statistics calculated within the wellbore buffers, a quantitative measurement of well
quality must be determined. The most obvious quantity associated with the quality of an
oil well is cumulative production reported over a certain period of time. However,
cumulative production contains numerous inherent variables that must be normalized to
make valid comparisons. The majority of the normalization analysis was undertaken in
Microsoft Excel.
The Red Sky 3D seismic survey includes more than 300 wells of varying lengths,
orientations, target formations, and completion designs that define approximately five
separate oilfields (NDIC). Many field regulations dictate well spacing and orientation, but
no consistent regulations apply across the entire Williston Basin. I selected 84 wells from
within the seismic survey for use in production normalization analysis in this thesis. All
chosen wells had at least two years on production records, which accounts for - on the
average - approximately 80% of a typical Bakken well’s production decline which is
typical for most unconventional wells regardless of basin (Cipolla et al., 2011).
To normalize well quality for wells drilled in different areas at different times, I
queried production statistics for selected wells from the North Dakota Department of
Mineral Resource’s online database, which reports statistics both by month and by the
number of days per month that each well actually produced (some wells are shut in for
various operational reasons). For this study, a 24-month period of cumulative production
of oil, gas, and water were extracted, summed for each well, and divided by total number
of days on production within that 24-month time period.

64
One thousand cubic feet (MCF) gas was converted to barrels oil equivalent
(BOE) by the industry standard of 1 BOE = 6 MCF gas before summation. Final
cumulative production was reported in BOE. Cumulative water production was included
in the calculated production volume as water is a minor contributor to produced fluids.
Water may represent additional produced fluids, but for most wells in the analysis, water
volumes produced were approximately equivalent in volume to fluids pumped during
hydraulic fracturing operations. Twenty-four month cumulative production was calculated
using this method for all 84 wells in the project in terms of BOE.
This time-normalization analysis was conducted for a variety of time periods
including, one-year and five-year cumulative production. Short-term normalization (one-
year) sometimes did not include significant production variation. On the other hand, a
long-term (five-year) normalization window yielded few data points for comparison
because many wells within the Red Sky Survey area had not been online for that period
of time at the time of this work. Additionally, normalized production numbers from wells
older than 5 years were plotted against their own 24-month normalized cumulative and a
strong linear relationship exists. Therefore, it is reasonable to assume that records for a
24-month cumulative production is a good sampling of well performance for a typical
Bakken well over its production lifetime.
In addition to time-normalization, the advance of technology and the steep
learning curve of drilling and completion optimization cause changes in production
values over the cycle of development within a particular basin (Cipolla, 2011). The
Bakken, like other unconventional resource plays in North America has seen steadily
increasing lateral lengths and proppant volumes used during hydraulic fracture
completions. These “operational variables” must be normalized as along with time on
65
production, because a newer well - drilled into a lower quality reservoir - may produce
more because of its larger completion design with a more complexly-induced fracture
network (Cipolla, 2011).
To simplify this normalization as much as possible I divided the time-normalized
production statistics calculated above by the size of the respective well’s completion,
which was reported in the well files as pounds of proppant. Proppant volume is the
simplest approximation of the well’s stimulated rock volume - or, in other words - the
induced, effective permeability of the unconventional system. With lower proppant
volumes a complex fracture system may be induced by hydraulic fracturing, but will not
contribute to sustained hydrocarbon production due to fracture closure that occurs at
high pressure in unconventional reservoirs like the Bakken Formation (Gale, 2014).
I define “normalized production” as the time-normalization procedure described
above divided by the amount of proppant, or completion size. Although this method may
oversimplify a complexly variable system, I will demonstrate in the next section that
statistical relationships can be observed between production and seismic attribute
statistics calculated for the buffer areas surrounding these wells.
2.5 Well-scale analysis of relationship between multi-source attributes
2.5.1 Analyzing attribute relationships
In Figure 28A, production statistics from 84 wells within the Red Sky 3D survey -
including cumulative and initial oil, gas, and water volumes - were reviewed and
normalized following the procedure described in Section 2.4. Normalized production for
each well was then added to ArcMap for visualization and comparison with fractures in
the Bakken Formation imaged using the edge detection attribute derived from the 3D
seismic volume. While some trends begin to emerge from visual analysis alone, it is

66
difficult to draw any conclusion from the attribute image alone. Adding to the difficulty is
the necessity to consider all attribute values along the wellbore and more realistically
within a set buffer around the wellbore that is likely to control induced fractures and
stimulated rock volume orientation. Therefore, statistical analysis is necessary to show
conclusive relationships between normalized production and fractures in the reservoir.
2.5.2 Statistical analysis of attribute relationships
All generated and calculated attributes were compiled on a spreadsheet in
Microsoft Excel for each well and then imported into TIBCO Spotfire analytical software
for statistical analysis of attribute relationships using linear regression. A positive linear
relationship with high statistical significance was discovered between the summation of
edge detection values within the 500 foot wellbore buffer and normalized production
values for the 84 wells inside the Red Sky 3D survey area (Fig. 29). The higher, edge-
detection values correspond with areas of continuous seismic reflectors and cooler
colors in the attribute map in Figure 28 showing that wells drilled in fractured areas
correlate with lower normalized production volumes over the well’s lifetime.
Another strong linear relationship with high statistical significance, although
negatively trending, was determined between mean dip angle inside the 500-foot
wellbore buffer and normalized production for the wells inside the Red Sky 3D Survey
area (Fig. 30). This relationship, like the one previously discussed associated with edge
detection, indicates that higher quality wells are associated with drilling in areas not
affected by natural fracturing.

67

68
69
2.6 Discussion and conclusions
2.6.1 Discussion of results
Through a combination of regional stratigraphic and local structural analysis I
have interpreted an integrated system that explains variations in production observed
between closely spaced wells (1,000-5,000 feet separations) in the Red Sky area. Thick
sections of the Middle Bakken Sandstone facies (10-25 feet) in areas with the least
number of natural fractures - mapped with attributes from 3D seismic volumes -
correspond with the most productive Bakken Formation wells when analyzed using
normalized hydrocarbon production volumes over their first two years of production (Fig.
31). Conversely, wells that are drilled in areas characterized by thin Middle Bakken
reservoir facies with large numbers of fractures - mapped from attributes of 3D seismic
volumes - tend to show poorer production over their lifetime.
An early Mississippian age, sandy barrier bar complex in the Middle Bakken
Formation controls the presence of high-quality, sandy reservoir facies over the study
area. Thick sections (10-25 feet) of the Middle Bakken Sand reservoir deposited in
barrier bar settings correspond with more productive wells when normalized for time on
production and changes in completion method. Statistical analysis of the relationships
between normalized production and structural attributes of the Bakken Formation reveal
an unexpected result contrary to the widespread assumption in the Bakken basin that
natural fractures enhance the effective permeability of an inherently tight hydrocarbon
system and thus should contribute to higher production wells in most cases.

70
71
The factor that eludes direct observation in core analysis and conventionally
exploited resource plays is the pressure dependence observed in many unconventional
reservoir plays (Cipolla, 2011). The Bakken Formation is an over-pressured reservoir
and is at or near its critical stress in its normal, un-fractured state (Meissner, 1991). This
means that any natural fracture that breaks the upper or lower sealing shales of the
Bakken Formation may allow local overpressure to dissipate. This fracture-related,
dissipation of overpressure will negatively impact the primary driving mechanism for
hydrocarbon production in the unconventional resource and lead to lower production.
Because accurate estimates of reservoir pressure are often impossible or impractical to
obtain, the presence or absence of overpressure is difficult to detect prior to bringing a
Bakken well on production.
In addition to pressure degradation by natural fractures in the Bakken Formation,
another phenomenon may control lower quality well production linked to local fracturing
may be the local stress state (Fig. 27). Areas of the Williston Basin with a preferred
natural fracture orientation in a northeast-southwest orientation related to the ambient
high stress state may control relatively simple, linear completions instead of the ideal
amorphous fracture ‘clouds’ which are typical of more intensively, stimulated rock
volumes. This phenomenon is regularly observed in microseismic surveys of more
highly fractured reservoirs like the Eagle Ford Formation in Texas (EIA, 2011), but
should also be considered as an important factor on local well productivity when drilling
and completing wells in the Bakken Formation.

72
2.6.2 Conclusions and recommendations
Through integration of observations from subsurface geology, facies
interpretation, 3-D seismic data and their attributes, and production analysis from wells, I
present an explanation for the production variation observed between closely-spaced
wells at separation distances of 1,000 to 5,000 feet, in the Bakken Formation in the
North Dakota part of the Williston Basin. Unlike previous studies which focused on
regional scale sweet spots, this work presented focuses on the field level which is the
scale for drilling and completion decisions. My main explanations and recommendations
for improving local production include:
1.) As recognized by previous workers in the area (Theloy, 2014: Grau et al., 2013,
Simenson, 2011:) The highest-quality reservoir facies in the Bakken Formation,
within The Red Sky area, is the Middle Bakken Sandstone, which can be
mapped using well logs from the NDIC. Following Simenson (2011) I have
interpreted the Middle Bakken Sandstone as an Early-Mississippian, northwest-
trending barrier bar depositional system with a strong tidal influence. Areas of
greatest production in the Red Sky area tend to cluster above the core barrier
ridge and the tidal flood deltas.
2.) Northeast-trending fracturing in the Bakken Formation can be mapped using 3D
seismic attributes at the field-level scale of 1 to 5 miles and correspond to
regional maximum stress direction and observed induced fracture orientations.
These natural fractures are shown to have significant negative impact on
production results from wells that have wellbores that intersect them.

73
3.) Areas characterized by fracturing the Bakken Formation tend to correspond with
poorer well quality. This is likely due to a breach in the sealing capacity of the
Upper and/or Lower Bakken shale which allows the naturally high reservoir
pressure, which is the main driving mechanism for the tight oil reservoir, to bleed
off from the Middle Bakken Reservoir prematurely. In addition to diminished
reservoir pressure, highly fractured areas are characterized by a preferred plane
of weakness oriented parallel to the natural fracture trend. This preferred-
weakness plane will promote linear fracture growth during hydraulic fracture
completions, which will decrease the complexity of the simulated rock volume,
and hurt the overall cumulative production for the lifetime of the well.
4.) Using the method I described in Section 2.5, complex relationships, such as
those between seismic discontinuity and normalized production statistics can be
evaluated on a well-to-well basis by using a wellbore buffer zone and spatial
analysis software like ArcMap to link multi-source attributes calculated in
specialized geologic or geophysical software to their associated oil well. These
relationships may be observable by the visual correlation between simple
production bubble charts and geologic attributes maps. It is likely necessary, as
was the case in this project, to use more advanced analytical software like
TIBCO Spotfire to unravel more complex relationships between multisource
attributes which may be blurred by evolving technology and operational
variables.

74
5.) To optimize the quality of unconventional wells targeting the Bakken Formation in
the eastern region of the Williston Basin in North Dakota, an operator should
target thick sections of Middle Bakken Sandstone with planned well paths
through areas least affected by natural fracturing. The best sandstones in the
study area are the least fractured.

75
2.7 References Abbott, D., Williams-Stroud, S., and Shaffer, R., 2009, Surface microseismic monitoring
of hydraulic fracture stimulations, Bakken Formation, Nesson Anticline, Williston Basin, North Dakota: AAPG Search and Discovery article #110089.
Aguilera, R., 2014, Flow units: From conventional to tight-gas to shale-gas to tight-oil to
shale-oil reservoirs: SPE reservoir evaluation and engineering, vol. 17, no. 2, p. 190-208.
Angster, S. and Sarg, F., 2013, Regional and local fractures of the Bakken petroleum
system, Williston Basin: Integrating field studies and 3-D seismic analysis, in C. Knight and J. Cuzella (eds.), Application of structural methods to Rocky Mountain hydrocarbon exploration and development: AAPG Studies in Geology 65, p. 101—111.
Angulo, S., and Buatois, L. A., 2012, Integrating depositional models, ichnology, and
sequence stratigraphy in reservoir characterization: The middle member of the Devonian–Carboniferous Bakken Formation of subsurface southeastern Saskatchewan revisited: AAPG Bulletin, vol. 96, no. 6, p. 1017-1043.
Angulo, S., Buatois, L., and Halabura, S., 2008, Paleoenvironmental and sequence-
stratigraphic reinterpretation of the Upper Devonian-Lower Mississippian Bakken Formation of subsurface Saskatchewan integrating sedimentological and ichnological data: Summary of Investigations 2008, v. 1, Saskatchewan Geological Survey, Saskatchewan Ministry of Energy and Resources, miscellaneous report 2008-4.
Blakey, R., 2015, Paleogeography and geologic evolution of North America: Northern
Arizona University, Ron Blakey webpage. Accessed June, 2015. <http:jan.ucc.nau.edu/~rcb7/nam.html>.
Brown, D, and Brown, D., 1987, Wrench-style deformation and paleostructural influence
on sedimentation in and around a cratonic basin: Rocky Mountain Association of Geologists, in M. Longman (ed.), Williston Basin: Anatomy of a Cratonic Province, p. 57-70.
Chopra, S., and Marfurt, K., 2007, Seismic attributes for prospect identification and
reservoir characterization: SEG geophysical developments series, no. 11. 464 p. Chuparova E., Hohman, J., and Lean, J., 2014, Observations of core UV fluorescence of
Middle Bakken and Three Forks reservoirs, Williston Basin, North Dakota: AAPG search and discovery article #90189.
Cipolla, C., Lewis, R., Maxwell, S., and Mack, M., 2011, Appraising unconventional
resource plays: Separating reservoir quality from completion effectiveness: International Petroleum Technology Conference (IPTC), article #14677.

76
Cobb, D. and Sonnneberg, S., 2013, Characterization of thickness anomalies in the Bakken and Three Forks Formations, north-central North Dakota, USA: Unconventional Resources Technology Conference (URTEC), article #16117728.
Duhailan, M., and Sonnenberg, S., 2014, The curious case of hydrocarbon-expulsion
fractures: Genesis and impact on the Bakken Shales. AAPG Search and Discovery article #80398.
Egenhoff, S., Van Dolah, A., Jaffri, A., Maletz, J., 2011, Facies architecture and
sequence stratigraphy of the Middle Bakken Member, North Dakota: The Rocky Mountain Association of Geologists, in J. Robinson, J. LeFever, S. Gaswirth (eds.), The Bakken-Three Forks Petroleum System in the Williston Basin, Chapter 2, p 27-47.
EIA, 2011, Review of emerging resources: U.S. shale gas and shale oil plays:
Independent statistics and analysis, webpage access: June 2015, <http://www.eia.gov/analysis/studies/usshalegas/pdf/usshaleplays.pdf>.
EIA, 2015, Bakken Region drilling productivity Report: webpage accessed: June 2015.
<http://www.eia.gov/petroleum/drilling/pdf/bakken.pdf>. Eidsnes, H., 2013, Structural and stratigraphic factors influencing hydrocarbon
accumulations in the Bakken Petroleum System in the Elm Coulee Field, Williston Basin, Montana. Colorado School of Mines unpublished MS thesis, 137 p.
Fischer, D., LeFever, J., LeFever, R., Anderson, S., Helms, L., Wittaker, S., Sorensen,
J., Smith, S., Peck, W., Steadman, E., Harju, J., 2005, Overview of Williston Basin geology as it relates to CO2 sequestration: EERC publication for the National Energy Technology Laboratory.
Gale, J., Laubach, S., Olson, J., Eichhubl, P., and Fall, A., 2014, Natural fractures in
shale: A review and new observations: AAPG Bulletin, vol. 98, no.11, p. 2165-2216. Gaswirth, S., Marra, K., Cook, T., Charpentier, R., Gautier, D., Higley, D., and Whidden,
K., 2013, Assessment of undiscovered oil resources in the Bakken and Three Forks Formations, Williston Basin Province, Montana, North Dakota, and South Dakota: U.S. Geological Survey fact sheet, no. 3013, p.4
Gerhard, L., Anderson, S., and LeFever, J. A., 1987, Structural history of the Nesson
anticline, North Dakota: Rocky Mountain Association of Geologists, in M. Longman (ed.), Williston Basin: Anatomy of a Cratonic Province, p. 337-354.
Gerhard, L., Anderson, S., Lefever, J., and Carlson, C., 1982, Geological development,
origin, and energy mineral resources of Williston Basin, North Dakota: AAPG Bulletin, vol. 66, no. 8, p. 989-1020.
Grau, A., Sterling, R., Bottjer, R., and Dea, P., 2011, Characterization of the Bakken
reservoir at Parshall Field and east of the Nesson Anticline, North Dakota: Rocky

77
Mountain Association of Geologists, in J. Robinson, J. LeFever, S. Gaswirth (eds.), The Bakken-Three Forks Petroleum System in the Williston Basin, ch. 10, p. 282-307.
Green, A., Weber, W., and Hajnal, Z., 1985, Evolution of Proterozoic terrains beneath
the Williston Basin: Geology, vol. 13, no. 9, p. 624-628. Herrera, H., 2013, A petroleum system study of the cratonic Williston Basin in North
Dakota, U. S. A: The role of the Laramide Orogeny: University of Houston unpublished MS thesis, 177 p.
Jarvie, D., 2001, Williston Basin petroleum systems: Inferences from oil geochemistry
and geology: Rocky Mountain Association of Geologist, The Mountain Geologist, v. 38, no.1, p. 19-41.
Jin, H., 2013, Characterization for source rock potential of the Bakken Shales in the
Williston Basin, North Dakota and Montana: Unconventional Resources Technology Conference (URTEC), article #1581243.
Jones, G., and Roden, R., 2012, Fracture detection interpretation beyond conventional
seismic approaches: AAPG Search and Discovery article #41035. Kasper, D., 1995, Aspects of the sedimentology, stratigraphy, and diagenesis of the
Upper Devonian-Lower Mississippian Bakken Formation of west-central Saskatchewan: University of Saskatchewan unpublished MS thesis, 294 p.
Kingsley, O., 2015, Seismic anisotropy dependence on fluids, fractures, and stress:
Physical modeling with Bakken and Barnett Shale field cases: University of Houston unpublished doctoral dissertation, 168 p.
Kuhn, P., di Primio, R., Hill, R., Lawrence, J., and Horsfield, B., 2012, Three-dimensional
modeling study of the low-permeability petroleum system of the Bakken Formation: AAPG Bulletin, v. 96, no.10, p. 1867-1897.
Law, B., and Spencer, C., 1993, Gas in tight reservoirs-an emerging major source of
energy: in David G. Howell (ed.), The Future of Energy Gasses, US Geological Survey, Professional Paper 1570, p. 233-252.
Lefever, J., Martiniuk, C., Dancsok, E., and Mahnic, P., 1991, Petroleum potential of the
Middle Member, Bakken Formation, Williston Basin: Sixth International Williston Basin Symposium, p. 74-94.
LeFever, J. and Helms, L, 2006, Bakken Formation reserve estimates: North Dakota
Geologic Survey. Miscellaneous report, Accessed June 2015. <https://www.dmr.nd.gov/ndgs/bakken/newpostings/07272006_bakkenreserveestimates.pdf>.
78
Lillis, P., 2013, Review of oil families and their petroleum systems of the Williston Basin: Rocky Mountain Association of Geologists, in J. Nelson (ed.), The Mountain Geologist, v. 50, no.1 p. 5-31.
Marfurt, K., and Alves, T., 2014, Pitfalls and limitations in seismic attribute interpretation
of tectonic features: Interpretation, vol. 3, no. 1, p. SB5-SB15. Meissner, F., 1991, Petroleum geology of the Bakken Formation Williston Basin, North
Dakota and Montana: Montana Geological Society, in W. Hansen (ed.), Guidebook to Geology and Horizontal Drilling of the Bakken Formation, p. 19-42.
Nickel, E., and Kohlruss, D., 2011, The Bakken Formation of southeast Saskatchewan,
Canada:, in J. Robinson, J. LeFever, S. Gaswirth (eds.), The Bakken-Three Forks Petroleum System in the Williston Basin, Chapter 6, p. 146-158.
Nordeng, S., Lefever, J., Anderson, F., Bingle-Davis, M. and Johnson, E., 2010, An
examination of the factors that impact oil production from the middle member of the Bakken Formation in Mountrail County, North Dakota: North Dakota Geological Survey, Report of Investigation No. 109.
Perez, R., and Marfurt, K., 2013, Calibration of brittleness to elastic rock properties via
mineralogy logs in unconventional reservoirs: AAPG Search and Discovery article #41237.
Price, L., and LeFever, J., 1994, Dysfunctionalism in the Williston Basin: The mid-
Madison/Bakken Petroleum System: Bulletin of Canadian Petroleum Geology, v. 42, no. 2, p. 187-218.
Sarg, J., 2012, The Bakken – An unconventional petroleum and reservoir system: Final
scientific/technical report prepared for the United States Department of Energy, Accessed June 2015, <https://www.netl.doe.gov/file%20library/research/oilgas/ enhanced%20oil%20recovery/nt0005672-final-report.pdf>.
Simenson, A., 2011, Depositional facies and petrophysical analysis of the Bakken
Formation, Parshall Field, Mountrail County, North Dakota: Unpublished Colorado School of Mines MS thesis, 198 p.
Sonnenberg, S. ,2001, Core analysis and unconventional reservoirs: Tight oil from shale
plays: PowerPoint presentation, Accessed June, 2015, <http://www.tight-oil-shale-plays.com/media/downloads/inline/steve-sonnenberg-colorado-school-of-mines.1295453329.pdf>.
Sonnenberg, S., and Pramudito, A., 2009, Petroleum geology of the giant Elm Coulee
field, Williston Basin: AAPG Bulletin, v. 93, no. 9, p. 1127-1153. Sonnenberg, S., Appleby, S., and Sarg, J, 2010, Quantitative mineralogy and
microfractures in the Middle Bakken Formation, Williston Basin, North Dakota: AAPG Search and Discovery article #40628.

79
Sonnenberg, S., LeFever, J., and Hill, R., 2011, Fracturing in the Bakken Petroleum
System, Williston Basin: The Bakken-Three Forks petroleum system in the Williston Basin, Chapter 15, p. 393-417.
Sorensen, J., Schmidt, S., Smith, S., Bailey, T., Mibeck, B., Harju, J., 2008, Final Report,
in J. Terneus (project manager), Evaluation of key factors affecting successful oil production in the Bakken Formation, North Dakota: Prepared for the U. S. Department of Energy, 61 p.
Stroud, J. and Sonnenberg, S., 2011, Role of the Lower Lodgepole Formation in the
Bakken petroleum system, Billings Nose, North Dakota:, in J. Robinson, J. LeFever, S. Gaswirth (eds.), The Bakken-Three Forks Petroleum System in the Williston Basin, The Rocky Mountain Geologist , chapter 12, p. 332-364.
Taner, T., 2003, Attributes Revisited: Published by Rock Solid Images, accessed June
2015, < http://www.rocksolidimages.com/pdf/attrib_revisited.htm>. Theloy, C., 2014, Integration of geological and technological factors influencing
production in the Bakken play, Williston Basin: Colorado School of Mines, Unpublished MS thesis, 223 p.
U.S. Geological Survey, 2000, Digitized aeromagnetic datasets for the conterminous
United States, Hawaii, and Puerto Rico, U.S. Geological Survey open-file report 99-0557.
U.S. Geological Survey Williston Basin Province Assessment Team, 2011, Assessment
of undiscovered oil and gas resources of the Williston Basin Province of North Dakota, Montana, and South Dakota, 2010 (v. 1.1, November 2013): U.S. Geological Survey Digital Data Series 69–W, 7 chaps., 1 CD-ROM, <http://pubs.usgs.gov/dds/dds-069/dds-069-w/>.
University of Texas of the Permian Basin, 2015, Graphs and data on Permian Basin oil
production and reserves: website accessed June, 2015. <http://www.utpb.edu/ceed/energy-resources/petroleum-library/permian-basin-statistics/graphs-and-data-on-permian-basin-oil-production-and-reserves>.
Anna, L., Miller, J., and Pearson, O., 2010, Williston Basin Province – interpretation of 2-
D seismic data, Mountrail County, North Dakota: U.S. Geological Survey Williston Basin Province Assessment Team, Assessment of Undiscovered Oil and Gas Resources of the Williston Basin Province of North Dakota, Montana, and South Dakota, Chapter 6, p. 1-6.
Pitman, J., Price, L., and LeFever, J., 2001, Diagenesis and fracture development in the
Bakken Formation, Williston Basin: Implications for reservoir quality in the middle member: U.S. Geological Survey professional paper 1653, p. 1-19.

80
Wiley, C., Barree, B., Eberhard, M., and Lantz, T., 2004, Improved horizontal well stimulations in the Bakken Formation, Williston Basin, Montana: Society of Petroleum Engineers annual technical conference and exhibition, SPE article #90697.
Wood, J., O'Connell, S., and Robinson, S., 2005, Erosional tidal ridges in the Bakken
Formation (Late Devonian-Early Mississippian), Southwestern Saskatchewan, Canada: 2005 AAPG annual convention, Search and Discovery article #50901.
Yang, Y., and Zoback, M., 2014, The role of preexisting fractures and faults during
multistage hydraulic fracturing in the Bakken Formation: Interpretation, vol. 2, no. 3, pg. SG25-SG39.
Zhou, X., Zeng, Z., Belobraydic, M., and Han, Y., 2008, Geomechanical stability
assessment of Williston Basin formations for petroleum production and CO2 Sequestration: ARMA 08-211, Chapter 1, p. 1-9.
Zoback, M., and Zoback, M., 1991, Tectonic stress field of North America and relative
plate motions: Neotectonics of North America, v. 1, p. 339-366.
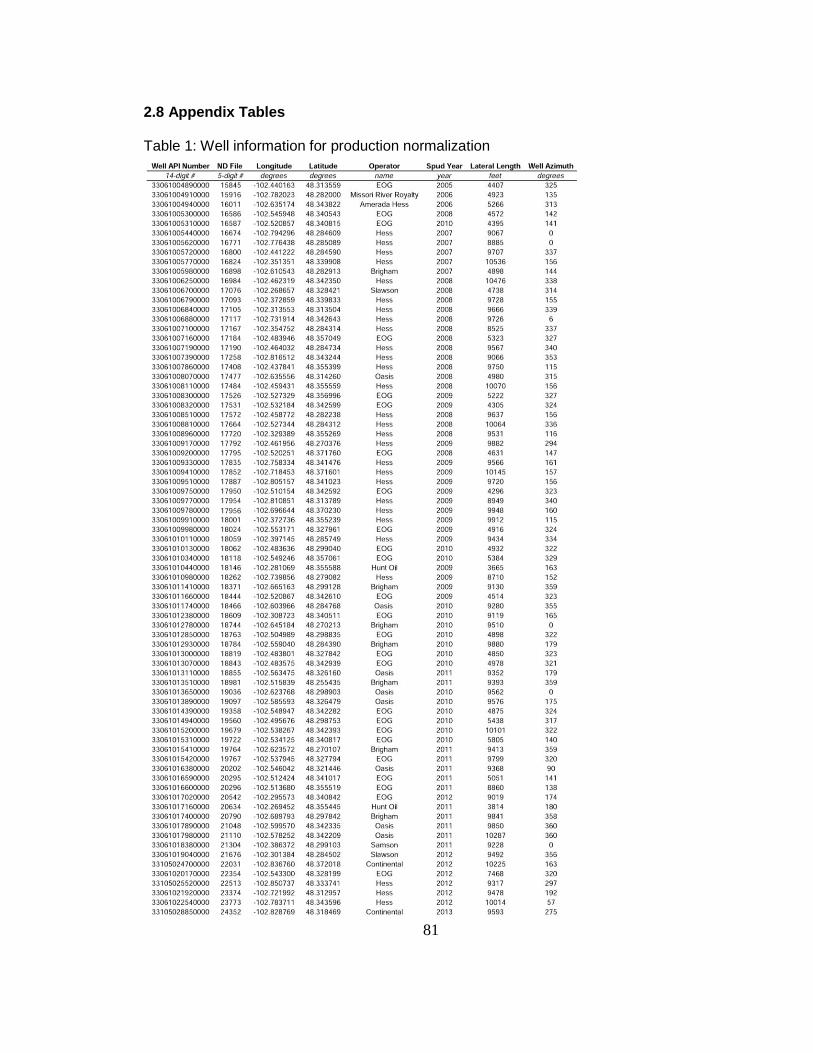
81
2.8 Appendix Tables Table 1: Well information for production normalization

82
Table 2: Completion Attributes

83
Table 3: Geologic and geophysical attributes
Related Documents