Relating Perceptual and Feature Space Invariances in Music Emotion Recognition Erik M. Schmidt, Matthew Prockup, Jeffery Scott, Brian Dolhansky, Brandon G. Morton, and Youngmoo E. Kim Music and Entertainment Technology Laboratory (MET-lab) Electrical and Computer Engineering, Drexel University {eschmidt,mprockup,jjscott,bdol,bmorton,ykim}@drexel.edu Abstract. It is natural for people to organize music in terms of its emo- tional associations, but while this task is a natural process for humans, quantifying it empirically proves to be a very difficult task. Consequently, no particular acoustic feature has emerged as the optimal representation for musical emotion recognition. Due to the subjective nature of emotion, determining how informative an acoustic feature domain is requires eval- uation by human subjects. In this work, we seek to perceptually evaluate two of the most commonly used features in music information retrieval: mel-frequency cepstral coefficients and the chromagram. Furthermore, to identify emotion-informative feature domains, we seek to identify what musical features are most variant or invariant to changes in musical qual- ities. This information could also potentially be used to inform methods that seek to learn acoustic representations that are specifically optimized for prediction of emotion. Keywords: emotion, music emotion recognition, features, acoustic fea- tures, machine learning, invariance 1 Introduction The problem of automated recognition of emotional (or mood) content within music has been the subject of increasing attention among the music informa- tion retrieval (Music-IR) research community [1]. While there has been much progress in machine learning systems for estimating human emotional response to music, very little progress has been made in terms of compact or intuitive feature representations. Current methods generally focus on combining several feature domains (e.g. loudness, timbre, harmony, rhythm), in some cases as many as possible, and performing dimensionality reduction techniques such as prin- cipal component analysis (PCA). Overall, these methods have not sufficiently improved performance, and have done little to advance the field. In this work, we begin by perceptually evaluating two of the most commonly used features in Music-IR: mel-frequency cepstral coefficients (MFCCs) and the chromagram. MFCCs have been shown in previous work to be one of the most informative feature domains for music emotion recognition [2–5], but as MFCCs 9th International Symposium on Computer Music Modelling and Retrieval (CMMR 2012) 19-22 June 2012, Queen Mary University of London All rights remain with the authors. 534

Welcome message from author
This document is posted to help you gain knowledge. Please leave a comment to let me know what you think about it! Share it to your friends and learn new things together.
Transcript

Relating Perceptual and Feature SpaceInvariances in Music Emotion Recognition
Erik M. Schmidt, Matthew Prockup, Jeffery Scott, Brian Dolhansky,Brandon G. Morton, and Youngmoo E. Kim
Music and Entertainment Technology Laboratory (MET-lab)Electrical and Computer Engineering, Drexel University
{eschmidt,mprockup,jjscott,bdol,bmorton,ykim}@drexel.edu
Abstract. It is natural for people to organize music in terms of its emo-tional associations, but while this task is a natural process for humans,quantifying it empirically proves to be a very difficult task. Consequently,no particular acoustic feature has emerged as the optimal representationfor musical emotion recognition. Due to the subjective nature of emotion,determining how informative an acoustic feature domain is requires eval-uation by human subjects. In this work, we seek to perceptually evaluatetwo of the most commonly used features in music information retrieval:mel-frequency cepstral coefficients and the chromagram. Furthermore, toidentify emotion-informative feature domains, we seek to identify whatmusical features are most variant or invariant to changes in musical qual-ities. This information could also potentially be used to inform methodsthat seek to learn acoustic representations that are specifically optimizedfor prediction of emotion.
Keywords: emotion, music emotion recognition, features, acoustic fea-tures, machine learning, invariance
1 Introduction
The problem of automated recognition of emotional (or mood) content withinmusic has been the subject of increasing attention among the music informa-tion retrieval (Music-IR) research community [1]. While there has been muchprogress in machine learning systems for estimating human emotional responseto music, very little progress has been made in terms of compact or intuitivefeature representations. Current methods generally focus on combining severalfeature domains (e.g. loudness, timbre, harmony, rhythm), in some cases as manyas possible, and performing dimensionality reduction techniques such as prin-cipal component analysis (PCA). Overall, these methods have not sufficientlyimproved performance, and have done little to advance the field.
In this work, we begin by perceptually evaluating two of the most commonlyused features in Music-IR: mel-frequency cepstral coefficients (MFCCs) and thechromagram. MFCCs have been shown in previous work to be one of the mostinformative feature domains for music emotion recognition [2–5], but as MFCCs
9th International Symposium on Computer Music Modelling and Retrieval (CMMR 2012) 19-22 June 2012, Queen Mary University of London All rights remain with the authors.
534

2 Schmidt et al.
were originally designed for speech recognition, it is unclear why they perform sowell or how much information about emotion they actually contain. Conversely,the chromagram appears to be one of the most intuitive representations, as it pro-vides information about the notes contained in the piece, which could potentiallyprovide information about the key and mode. Thus far, chroma has shown littlepromise in informing this problem. In order to properly assess these features,we construct a perceptual study using Amazon’s Mechanical Turk1 (MTurk) toanalyze the relative emotion of two song clips, comparing human ratings of boththe original audio and audio reconstructions from these features. By analyzingthese reconstructions, we seek to directly assess how much information aboutmusical emotion is retained in these features.
Given our collected data, we also wish to identify patterns in relationshipsbetween musical parameters (e.g. key, mode, tempo) and perceived emotion.By identifying variability in emotion related to these parameters, we identifyexisting features that respond with the highest variance to those that informemotion, and the least variance in those that do not. In order to properly assessa large variety of features, we investigate the features used in our perceptualstudy reconstructions, features used in our prior work [2–5], and 14 additionalfeatures from the MIR-toolbox2.
In investigating these invariances, we explore approaches that attempt todevelop feature representations which are specifically optimized for the predic-tion of emotion. In forming such representations, we are presented with a verychallenging problem as music theory offers an insufficient foundation for con-structing features using a bottom-up approach. As a result, in previous work wehave instead taken a top-down approach, attempting to learn representationsdirectly from magnitude spectra [5]. These approaches show much promise butare highly underconstrained as we have little idea of what our features shouldbe invariant to. In this paper, we seek to provide some initial insight into howthese problems could be better constrained.
2 Background
A musical piece is made up of a combination of different attributes such as key,mode, tempo, instrumentation, etc. While not one of these attributes fully de-scribes a piece of music, each one contributes to the listener’s perception of thepiece. We hope to establish which compositional attributes significantly deter-mine emotion and which parameters are less relevant. These parameters are notthe sole contributors to the emotion of the music, but are within our ability tomeasure from the symbolic dataset we use in our experiments, and thereforeare the focus of this study [6]. Specifically, we want to determine whether thesecompositional building blocks induce changes in the acoustic feature domain.
1 http://mturk.com2 http://www.jyu.fi/hum/laitokset/musiikki/en/research/coe/materials/
mirtoolbox
535

Invariances in Music Emotion Recognition 3
We motivate our experiments from findings that have been verified by severalindependent experiments in psychology [7–9]. When discussing emotion, we referto happy versus sad temperament as valence and higher and lower intensity ofthat temperament as arousal [10]. Mode and tempo have been shown to consis-tently elicit a change in perceived emotion in user studies. Mode is the selectionof notes (scale) that form the basic tonal substance of a composition and tempois the speed of a composition [11]. Research shows that major modes tend toelicit happier emotional responses, while the inverse is true for minor modes [9,12–14]. Tempo also determines a user’s perception of music, with higher tempigenerally inducing stronger positive valence and arousal responses [8, 9, 12, 13,15].
3 Data Collection
In previous studies (such as [9]), several controlled variations of musical phrasesare provided to each participant. Since we are studying the changes in the acous-tic feature domain, we require samples that we can easily manipulate in termsof mode and tempo and that provide a wide enough range to ensure we areaccurately representing all possible variations in the feature space. To this end,we put together a dataset of 50 Beatles MIDI files, attained online3, spanning 5albums (Sgt. Peppers, Revolver, Let It Be, Rubber Soul, Magical Mystery Tour).In order to remove the effect of instrumentation, each song was synthesized as apiano reduction and a random twenty second clip of each song was used for ourlabeling task.
3.1 Song Clip Pair Selection
Labeling the entire 1225 possible pairs from the 50 songs would be prohibitiveso we choose to generate a subset of 160 pairs. Since the Beatles dataset weuse contains 35 songs in the major (Ionian) mode and only 9 in the minor(Aolean) mode (with 6 additional pieces in alternate modes), we want to ensurethat major-major pairings do not completely dominate our task. Some songs arerepresented one extra time in order to generate 160 pairs but no song is repeatedmore than once. Out of these 160 pairs, there are 81 major-major pairings, 33major-minor pairings, and 7 minor-minor pairings.
For each song, we render the piano reduction of the MIDI file for the 20second clip, and then compute MFCC and chroma features on the audio. Aftercomputing the features, we then synthesize audio from the features. Chroma-gram features are extracted and reconstructed using Dan Ellis’ chroma featuresanalysis and synthesis code4 and MFCCs using his rastamat5 library. The MFCC
3 http://earlybeatles.com/4 http://www.ee.columbia.edu/~dpwe/resources/matlab/chroma-ansyn/5 http://www.ee.columbia.edu/~dpwe/resources/matlab/rastamat/
536

4 Schmidt et al.
reconstructions sound like a pitched noise source, and the chroma reconstruc-tions have an ethereal ‘warbly’ quality to them but sound more like the originalaudio than the MFCC reconstruction (examples are available online 6).
3.2 Mechanical Turk Annotation Task
In order to annotate our clip pairs, we use the Mechanical Turk online crowd-sourcing engine to gain input from a wide variety of subjects [16]. In our HumanIntelligence Task (HIT), we ask participants to label four uniformly selectedsong pairs from each of the three categories: original MIDI rendering, MFCCreconstructions, and chromagram reconstructions. For each pair of clips partic-ipants are asked to label which one exhibits more positive emotion and whichclip is more intense. The three categories of audio sources are presented on threeseparate pages. The participants are always comparing chroma reconstructionsto chroma reconstructions, MFCC reconstructions to MFCC reconstructions orMIDI renderings to MIDI renderings. Subjects never compare a reconstructionto the original audio. For each round, we randomly select a clip to repeat as ameans of verification. If a user labels the duplicated verification clip differentlyduring the round with the original audio, their data is removed from the dataset.
4 Experiments and Results
Our first set of experiments investigates the emotional information retained insome of the most common acoustic features used in Music-IR, MFCCs and chro-magrams. As described above, users listen to a pair of clips that was recon-structed from features (MFCC or chroma) and rate which is more positive andwhich has more emotional intensity. We seek to quantify how much informationabout musical emotion is retained in these acoustic features by how stronglyemotion ratings of the reconstructions correlate with that of the originals. Wefirst relate the user ratings to musical tempo and mode, and then we explorewhich features exhibit high variance with changes in tempo and mode or areinvariant to altering these musical qualities.
4.1 Perceptual Evaluation of Acoustic Features
Running the task for three days, we collected a total of 3661 completed HITs,and accepted 1426 for an approval rating of 39%, which is similar to previouswork annotating music data with MTurk [16–18]. The final dataset contains17112 individual song pair annotations, distributed among 457 unique Turkers,with each Turker completing on average ∼ 2.5 HITs. With a total of 160 pairs,this equates to ∼ 35.65 ratings per pair. HITs are rejected for completing thetask too quickly (less than 5 minutes), failing to label the repeated verificationpairs the same for the original versions, and failing too many previous HITs.
6 http://music.ece.drexel.edu/research/emotion/invariance
537
Invariances in Music Emotion Recognition 5
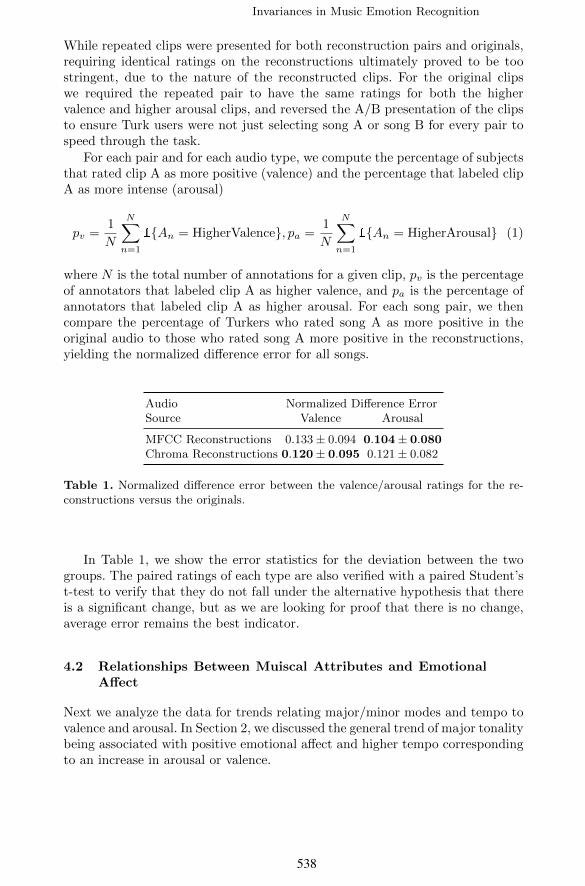
While repeated clips were presented for both reconstruction pairs and originals,requiring identical ratings on the reconstructions ultimately proved to be toostringent, due to the nature of the reconstructed clips. For the original clipswe required the repeated pair to have the same ratings for both the highervalence and higher arousal clips, and reversed the A/B presentation of the clipsto ensure Turk users were not just selecting song A or song B for every pair tospeed through the task.
For each pair and for each audio type, we compute the percentage of subjectsthat rated clip A as more positive (valence) and the percentage that labeled clipA as more intense (arousal)
pv =1
N
N∑
n=1
1{An = HigherValence}, pa =1
N
N∑
n=1
1{An = HigherArousal} (1)
where N is the total number of annotations for a given clip, pv is the percentageof annotators that labeled clip A as higher valence, and pa is the percentage ofannotators that labeled clip A as higher arousal. For each song pair, we thencompare the percentage of Turkers who rated song A as more positive in theoriginal audio to those who rated song A more positive in the reconstructions,yielding the normalized difference error for all songs.
Audio Normalized Difference ErrorSource Valence Arousal
MFCC Reconstructions 0.133± 0.094 0.104± 0.080Chroma Reconstructions 0.120± 0.095 0.121± 0.082
Table 1. Normalized difference error between the valence/arousal ratings for the re-constructions versus the originals.
In Table 1, we show the error statistics for the deviation between the twogroups. The paired ratings of each type are also verified with a paired Student’st-test to verify that they do not fall under the alternative hypothesis that thereis a significant change, but as we are looking for proof that there is no change,average error remains the best indicator.
4.2 Relationships Between Muiscal Attributes and EmotionalAffect
Next we analyze the data for trends relating major/minor modes and tempo tovalence and arousal. In Section 2, we discussed the general trend of major tonalitybeing associated with positive emotional affect and higher tempo correspondingto an increase in arousal or valence.
538

6 Schmidt et al.
We divide our entire dataset S into a subset M ⊂ S that consists of pairsthat contain one major mode song and one minor mode song, as well as a subsetT ⊂ S in which pairs differ in tempo by more than 10 beats per minute (bpm).For subset M , we calculate what percentage of users labeled the major song asmore positive and what percentage of users label the major song as more intense.For subset T , we similarly determine whether the faster song is more intense andwhether the faster song is happier according to the users. Looking at Table 2, weconclude that the results are commensurate with the findings from the variouspsychology studies referenced in Section 2, namely that major songs are happierand faster songs are more intense.
Null Hypothesis Agreement Ratio
Major Key Labeled as More Positive Valence 0.667Faster Tempo Labeled More Positive Valence 0.570Major Key Labeled as More Positive Arousal 0.528Faster Tempo Labeled as More Positive Arousal 0.498
Table 2. Percentage of paired comparisons that yielded the desired perceptual resultfor mode and tempo.
One area where we expected larger agreement is the relationship betweentempo and intensity. We only have the beats per minute for each song, andwe label the faster song as the one with a higher bpm. The note lengths andemphasis in relation to the tempo are disregarded in this analysis and may be asource of uncertainty in the result. Depending upon the predominant note value(quarter/eighth/sixteenth), a slower tempo can sound faster than a song with ahigher number of beats per minute. These are two different compositions, notthe same clip at two different tempos.
4.3 Identifying Informative Feature Domains
When using features to understand certain perceptual qualities of music, it isimportant to know how those features relate to changes in the perceptual quali-ties being studied. We want to find appropriate variances and invariances as theyrelate to a perceptual quality. For example, if emotion is invariant to key, if thekey changes, the features should also be invariant to that key change. We wantcorrelation in variance as well. If the emotion of the audio changes, we want thefeatures that describe it to change in conjunction with it. In order to investigatethese variances and invariances, we use a feature set from prior work [3], as wellas a set of features from the MIR-toolbox. Using the Beatles’ clips, we generatechanges in key, tempo, and mode to investigate possible corresponding differ-ences in features. For key, the original was compared with transposed versionsa 5th above and below. For tempo, the original was compared with versions at75% and 133% of the original tempo. For mode, we shifted all the minor songs
539

Invariances in Music Emotion Recognition 7
to major and all the major songs to natural minor and compared the full datasetin major vs. the full dataset in minor.
Because the features contain different dimensions and have different ranges,looking at differences in their direct results does not allow for proper comparisonbetween them. In order to draw proper comparisons, the features are normalizedover dimension and range.
Given 2 feature vectors over time F1 ∈ RM×N and F2 ∈ RM×N , we normalizethe content over the vectors’ shared range.
F ′1 =F1 −min(F1 ∪ F2)
max(F1 ∪ F2), F ′2 =
F2 −min(F1 ∪ F2)
max(F1 ∪ F2), (2)
The mean for each dimension is calculated, creating mean vectors µ1 ∈ RN×1 andµ2 ∈ RN×1. The average feature change across all dimensions is then computed.
FeatureChange =1
N
N∑
n=1
|µ1(n)− µ2(n)|, (3)
If this FeatureChange value is low, it means that the feature is invariant to themusical change being presented. In Table 3 we observe that features that exhibithigher variance to the specified change (tempo up/down, key up/down, andmode shift) should be more effective in computational models that are sensitiveto these parameters. Several intuitive features including onsets, RMS energy,and beat spectrum emerge as the most variant features to tempo. Conversely,it is intuitive that features like mode and tonal center do not vary much withtempo.
Tempo Up Tempo Down Key Up Key Down Mode Shift
Feature Feature Feature Feature Feature Feature Feature Feature Feature FeatureDomain Change Domain Change Domain Change Domain Change Domain Change
Onsets 0.127 Onsets 0.126 Key 0.142 Key 0.145 Mode 0.142Beat Spec. 0.081 Beat Spec. 0.078 Beat Spec. 0.134 Beat Spec. 0.131 Tonal Cent. 0.114RMS Energy 0.049 RMS 0.050 Tonal Cent. 0.105 Tonal Cent. 0.102 Beat Spec. 0.103HCDF 0.024 HCDF 0.022 MFCC 0.084 MFCC 0.178 Key 0.063xChroma 0.024 xChroma 0.021 Zerocross 0.081 Zerocross 0.064 Chroma 0.047Roughness 0.023 Roughness 0.019 Chroma 0.055 Chroma 0.051 MFCC 0.030Zerocross 0.022 SSD 0.017 Contrast 0.054 Contrast 0.049 Brightness 0.019Brightness 0.021 MFCC 0.016 Regularity 0.050 xChroma 0.048 Onsets 0.015SSD 0.021 Brightness 0.015 xChroma 0.038 Regularity 0.045 Attacktime 0.014MFCC 0.017 Zerocross 0.015 Mode 0.038 SSD 0.041 Regularity 0.013Chroma 0.014 Chroma 0.014 Brightness 0.037 Brightness 0.041 Zerocross 0.012Key 0.013 Key 0.014 SSD 0.036 Mode 0.040 Contrast 0.011S. Contrast 0.012 Regularity 0.011 Attacktime 0.030 Attacktime 0.026 xChroma 0.011Regularity 0.012 Contrast 0.010 RMS 0.021 Roughness 0.023 SSD 0.010Fluctuation 0.011 Fluctuation 0.009 Roughness 0.021 Onsets 0.020 RMS 0.009Attacktime 0.010 Mode 0.007 Onsets 0.017 RMS 0.017 Attack Slope 0.008Mode 0.009 Attacktime 0.007 Attack Slope 0.015 HCDF 0.015 Roughness 0.007Tonal Cent. 0.007 Tonal Cent. 0.006 HCDF 0.012 Attack Slope 0.009 HCDF 0.006Attack Slope 0.006 Attack Slope 0.005 Fluctuation 0.008 Fluctuation 0.008 Fluctuation 0.002
Table 3. Normalized feature change with respect to musical mode and tempo alter-ations.
540

8 Schmidt et al.
5 Discussion and Future Work
In this paper, we have provided a perceptual evaluation of emotional content inaudio reconstructions from acoustic features, and at the time of writing we knowof no other work that has performed such experiments. In addition, we have re-lated our findings to those of previous work showing correlation between majorkeys and increased positive emotion as well as increased tempo and increasedpositive emotion and activity. For tempo, mode and key we have provided avariational analysis for a large number of acoustic features. The findings we pre-sented should be informative for future computational investigations in modelingemotions in music using content based methods.
References
1. Y. E. Kim, E. M. Schmidt, R. Migneco, B. G. Morton, P. Richardson, J. Scott, J. A.Speck, and D. Turnbull, “Music emotion recognition: A state of the art review,”in ISMIR, Utrecht, Netherlands, 2010.
2. E. M. Schmidt and Y. E. Kim, “Modeling musical emotion dynamics with condi-tional random fields,” in ISMIR, Miami, FL, 2011.
3. ——, “Prediction of time-varying musical mood distributions from audio,” in IS-MIR, Utrecht, Netherlands, 2010.
4. E. M. Schmidt, D. Turnbull, and Y. E. Kim, “Feature selection for content-based,time-varying musical emotion regression,” in ACM MIR, Philadelphia, PA, 2010.
5. E. M. Schmidt and Y. E. Kim, “Learning emotion-based acoustic features withdeep belief networks,” in WASPAA, New Paltz, NY, 2011.
6. P. N. Juslin, J. Karlsson, E. Lindstrom, A. Friberg, and E. Schoonderwaldt, “Playit again with feeling: Computer feedback in musical communication of emotions,”Journal of Experimental Psychology: Applied, vol. 12, no. 2, pp. 79–95, 2006.
7. K. Hevner, “Experimental studies of the elements of expression in music,” Ameri-can Journal of Psychology, no. 48, pp. 246–268, 1936.
8. M. G. Rigg, “Speed as a determiner of musical mood,” Journal of ExperimentalPsychology, vol. 27, pp. 566–571, 1940.
9. G. D. Webster and C. G. Weir, “Emotional responses to music: Interactive effectsof mode, texture, and tempo,” Motivation and Emotion, vol. 29, pp. 19–39, 2005.
10. R. E. Thayer, The Biopsychology of Mood and Arousal. Oxford, U.K.: OxfordUniv. Press, 1989.
11. D. M. Randel, The Harvard dictionary of music / edited by Don Michael Randel,4th ed. Belknap Press of Harvard University Press, Cambridge, MA :, 2003.
12. L. Gagnon and I. Peretz, “Mode and tempo relative contributions to happy-sadjudgements in equitone melodies,” Cognition & Emotion, vol. 17, no. 1, pp. 25–40,2003.
13. S. Dalla Bella, I. Peretz, L. Rousseau, and N. Gosselin, “A developmental studyof the affective value of tempo and mode in music.” Cognition, vol. 80, no. 3, Jul.2001.
14. G. Gerardi and L. Gerken, “The development of affective responses to modalityand melodic contour,” Music Perception, vol. 12, no. 3, pp. 279–290, 1995.
15. E. G. S. Gabriela Husain, WIlliam Thompson, “Effects of musical tempo and modeon arousal, mood, and spatial abilities,” Music Perception, vol. 20, no. 2, pp. 151–171, 2002.
541

Invariances in Music Emotion Recognition 9
16. J. A. Speck, E. M. Schmidt, B. G. Morton, and Y. E. Kim, “A comparative studyof collaborative vs. traditional annotation methods,” in ISMIR, Miami, Florida,2011.
17. J. H. Lee, “Crowdsourcing music similarity judgments using mechanical turk,” inISMIR, Utrecht, Netherlands, 2010.
18. M. I. Mandel, D. Eck, and Y. Bengio, “Learning tags that vary within a song,” inISMIR, Utrecht, Netherlands, 2010.
542
Related Documents