REGULAR ARTICLE Relating net primary productivity to soil organic matter decomposition rates in pure and mixed Chinese fir plantations Silong Wang & Weidong Zhang & Felipe Sanchez Received: 26 July 2009 / Accepted: 14 April 2010 / Published online: 30 April 2010 # Springer Science+Business Media B.V. 2010 Abstract In a 5-year field trial, we examined plant productivity and soil organic matter decomposition on plots with a mixture of Chinese fir (Cunninghamia lanceolata (Lamb.) Hook.) and broadleaved trees. We compared pure fir (PF) plots to two mixed plots (2:1 ratio of fir to broadleaved trees): MP1 (C. lanceolata and Liquidambar formosana Hance) and MP2 (C. lanceolata and Alnus cremastogyne Burk). The mixed plots differed in that the MP2 plots incorporated a nitrogen-fixing tree (A. cremastogyne). We hypothe- sized that the mixed plots would have higher soil organic matter decomposition rates than the PF plots as a result of increased primary productivity. The increased productivity would increase carbon input into soils, thus resulting in greater microbial biomass and soil basal respiration. We measured tree biomass, soil organic matter decomposition rates, microbial biomass carbon, total organic carbon, metabolic quotient and microbial quotient for each plot. The results showed that the productivity, microbial bio- mass carbon, and total carbon in the MP2 plots were significantly higher than in the PF and MP1 plots. Path analyses suggested that soil respiration varied with the amount of tree biomass produced. However contrary to our hypothesis, soil basal respiration was higher in the PF plots than in the MP2 plots. Keywords Chinese fir . Biomass . Foliage . Microbial biomass C . Soil basal respiration Introduction Chinese fir (Cunninghamia lanceolata) is prevalent in Southern China and plays a role in the global carbon (C) cycle as the planting area has reached 12 million ha, accounting for 24% of the total plantation area in China (Lei 2005). The introduction of broad-leaved trees into these fir plantations has enhanced biodiversity, litter production, and nutrient return (Wang et al. 2008a). Although some researchers have studied the effects of mixtures of Chinese fir and broadleaved trees on soil fertility, forest environment and tree growth status, little information is available about the relationship between mixed plantations and soil microbial activity. Soil microbial activity is the main driving force in soil organic matter decomposition and the development Plant Soil (2010) 334:501–510 DOI 10.1007/s11104-010-0400-8 Responsible Editor: Eric Paterson. S. Wang (*) : W. Zhang Huitong Experimental Station of Forest Ecology, Institute of Applied Ecology, Chinese Academy of Sciences, Shenyang 110016, China e-mail: [email protected] W. Zhang Graduate School of Chinese Academy of Sciences, Beijing 100039, China F. Sanchez USDA Forest Service, 3041 Cornwallis Road, Research Triangle Park, Durham, NC 27709, USA

Welcome message from author
This document is posted to help you gain knowledge. Please leave a comment to let me know what you think about it! Share it to your friends and learn new things together.
Transcript

REGULAR ARTICLE
Relating net primary productivity to soil organic matterdecomposition rates in pure and mixed Chinese firplantations
Silong Wang & Weidong Zhang & Felipe Sanchez
Received: 26 July 2009 /Accepted: 14 April 2010 /Published online: 30 April 2010# Springer Science+Business Media B.V. 2010
Abstract In a 5-year field trial, we examined plantproductivity and soil organic matter decomposition onplots with a mixture of Chinese fir (Cunninghamialanceolata (Lamb.) Hook.) and broadleaved trees. Wecompared pure fir (PF) plots to two mixed plots (2:1ratio of fir to broadleaved trees): MP1 (C. lanceolataand Liquidambar formosana Hance) and MP2 (C.lanceolata and Alnus cremastogyne Burk). The mixedplots differed in that the MP2 plots incorporated anitrogen-fixing tree (A. cremastogyne). We hypothe-sized that the mixed plots would have higher soilorganic matter decomposition rates than the PF plotsas a result of increased primary productivity. Theincreased productivity would increase carbon inputinto soils, thus resulting in greater microbial biomassand soil basal respiration. We measured tree biomass,
soil organic matter decomposition rates, microbialbiomass carbon, total organic carbon, metabolicquotient and microbial quotient for each plot. Theresults showed that the productivity, microbial bio-mass carbon, and total carbon in the MP2 plots weresignificantly higher than in the PF and MP1 plots.Path analyses suggested that soil respiration variedwith the amount of tree biomass produced. Howevercontrary to our hypothesis, soil basal respiration washigher in the PF plots than in the MP2 plots.
Keywords Chinese fir . Biomass . Foliage .
Microbial biomass C . Soil basal respiration
Introduction
Chinese fir (Cunninghamia lanceolata) is prevalent inSouthern China and plays a role in the global carbon(C) cycle as the planting area has reached 12 million ha,accounting for 24% of the total plantation area in China(Lei 2005). The introduction of broad-leaved trees intothese fir plantations has enhanced biodiversity, litterproduction, and nutrient return (Wang et al. 2008a).Although some researchers have studied the effects ofmixtures of Chinese fir and broadleaved trees on soilfertility, forest environment and tree growth status, littleinformation is available about the relationship betweenmixed plantations and soil microbial activity.
Soil microbial activity is the main driving force insoil organic matter decomposition and the development
Plant Soil (2010) 334:501–510DOI 10.1007/s11104-010-0400-8
Responsible Editor: Eric Paterson.
S. Wang (*) :W. ZhangHuitong Experimental Station of Forest Ecology,Institute of Applied Ecology,Chinese Academy of Sciences,Shenyang 110016, Chinae-mail: [email protected]
W. ZhangGraduate School of Chinese Academy of Sciences,Beijing 100039, China
F. SanchezUSDA Forest Service,3041 Cornwallis Road, Research Triangle Park,Durham, NC 27709, USA
and maintenance of soil structure (Dick 1992). Micro-bial biomass carbon (C) is affected by the amount anddiversity of C inputs and nutrient availability. Soilmicrobial biomass C has been reported to be signifi-cantly higher in litter-amended soils than the controls(Piao et al. 2006) and has been reported to besignificantly influenced by the level of litter speciesdiversity (Bardgett and Shine 1999). Additionally, soilbasal respiration, a measure of soil organic matterdecomposition, has been reported to be influenced bysoil temperature, moisture (Raich and Schlesinger1992; Liu et al. 2005), C input (Landi et al. 2006)and microbial biomass. Consequently, highly produc-tive forest ecosystems may be expected to have highsoil basal respiration, hence high soil organic matterdecomposition rates, owing to the large C input fromthe forest floor and root systems. Vegetation composi-tion also affects soil basal respiration by altering soilmicroclimate and structure, litter quality, and soilmicroorganisms (Yan et al. 2004; Hu et al. 2006). Itis reasonable to expect that the greater biodiversity in amixed plantation may increase tree productivity (Fenget al. 1988), and thus C inputs into soils, leading toincreased microbial respiration.
In May 2003, we established an experimentconsisting of pure Chinese fir plots, plots with amixture of Chinese fir and sweetgum (Liquidambarformosana Hance) and plots with a mixture ofChinese fir and alder (Alnus cremastogyne), anitrogen (N)-fixing tree. Sweetgum and alder differin their foliar N contribution to the soil, likelyproviding plots of differing N content. The focus ofthis study was to (1) examine how productivity andsoil basal respiration varied with tree species compo-sition, and (2) determine the key biotic controls onsoil basal respiration rates.
Materials and methods
Site description
This study was conducted at the Huitong ExperimentalStation of Forest Ecology, Chinese Academy ofSciences (109°36′E, 26°51′N), Hunan Province, China.The site is at an elevation of 300–500 m with a meanannual temperature of 15.8°C and a mean minimum of1.9°C in January and a mean maximum of 20°C in July.The mean annual precipitation was 1,100–1,300 mm of
which about 67% occurred between April and August.The clay loam soil (sand 29.35%, silt 45.53%, clay25.12%) in this study is classified as a Paddy soil(loamy, mixed, superactive Lithic Haplocryolls) and theinitial parameters were as following: pH 4.0, 1.65%C,0.17%N and 2.9% organic matter.
This experiment was carried out in croplands withrelatively homogenous soil thereby minimizingmicrosite variability typically found in a forestedstand. In May 2003, the cropland was divided intoeighteen 1.5 m×7.5 m (0.001 ha) plots representing 6replicates of 3 plots. The plots were a pure fir (PF)plot (C. lanceolata), and two mixed plots: MP1 (C.lanceolata and L. formosana) and MP2 (C. lanceolataand A. cremastogyne). The mixed plots maintained a2:1 ratio of fir to broadleaved trees. The trees wereplanted 0.6 m apart in each plot for a total of 24 treesper plot to accelerate canopy closure. At the time ofmeasurement, trees in the plots ranged from 2.5 m to9.2 m in height.
Data collection
For the plantation measurements, all trees within eachplot were measured in December 2007 for DBH andheight. In each plot, three trees from each species wereharvested and divided into nine components: stemwood,stem bark, branches, foliage, cone, stump root, coarseroot (>2 cm), medium root (0.2–2 cm) and fine root(<0.2 cm). All components wereweighed in the field andsubsampled. The subsamples were taken back to the labfor the measurement of water content. Then the drybiomass for each component was used to develop thebiomass model. At the same time, soil cores at twodepths (0–10 cm and 10–20 cm) were collected from 10random locations in each plot with a stainless steel auger(5 cm internal diameter). Soils sampled from the sameplot and layers were bulked and divided into twoportions. One portion was air dried at room temperatureand ground to pass a 0.25 mm sieve for total C analyses.The other portion was sieved moist through a 2 mmsieve and stored in plastic bags at 4°C until microbialbiomass C and soil basal respiration analyses wereperformed. All analyses were performed within 15 days.
Analytical methods
Mean DBH, total height, basal area, componentvolume and biomass were calculated for each plot.
502 Plant Soil (2010) 334:501–510
Tree volume (V) was estimated utilizing the equation(Eq. 1) developed by Wang et al. (2008b) andcomponent and total biomasses were estimated usingEqs. 2 and 3.
V ¼ basal area� height � 0:5 ð1Þ
Y ¼ a� Vþ b ð2Þ
Y ¼ a� ln Vð Þ þ b ð3ÞWhere Y is the biomass in kilograms and the
coefficients a and b are constants calculated for eachspecies. Specific equations and coefficients wereemployed for each species and each component (see“Appendix”). Equation 2 was used to calculate mostof the estimates, with the exception of foliage, stumproot and coarse root biomass for L. formosana inwhich Eq. 3 was used. The whole plot biomass wasexpressed in kg m−2.
Total organic carbon (TOC) was determined with anElemantar High II TOC analyzer (Hanau, Germany).Soil microbial biomass C was determined by thechloroform fumigation-extraction method as describedby Vance et al. (1987), with 0.5 M K2SO4 as theextracting agent. The organic C in the extracting agentwas measured by dichromate oxidation. The microbialbiomass C was calculated by Cmin=EC/Kc, where ECis the difference in C content of the fumigated and un-fumigated extracting agent and Kc=0.38 (Lu 1999).Soil basal respiration was determined by measuringCO2 evolution (Xu and Zhen 1986). The CO2
produced by 100 g field-moisture soil samples afterincubation at 28°C for 24 h was absorbed in 15 ml0.1 M NaOH solution. The unconsumed base wastitrated with 0.05 M HCl after addition of BaCl2. Theresults were expressed as mg CO2-C kg−1 dry soil h−1.And the metabolic quotient or qCO2 (μg CO2-Creleased mg−1 biomass C h−1) was calculated as theratio of basal respiration and microbial biomass C. Themicrobial quotient was calculated as the ratio ofmicrobial biomass C to total organic C.
Statistical analyses
One-way analyses of variance (ANOVA) were used totest for significant differences in DBH, total treeheight and biomass and soil microbial properties. The
least significant differences (LSD) were calculatedwhen treatments were significantly different. In orderto better discern the relationship between tree biomassand soil basal respiration, multiple regression analysiswas used to determine the variables that explained themajority of the variation in soil basal respiration. Thevariables tested included microbial biomass, foliagebiomass and total tree biomass. Path analyses wereused to determine pathways contributing to correla-tions between possible control variables and soil basalrespiration and to assess any causal relationships.Analyses were performed with SPSS release 13.0(SPSS Statistics, Shanghai, China), and the significantlevel was fixed at 0.05.
Results
Comparisons of growth and biomass of trees in pureand mixed plantations
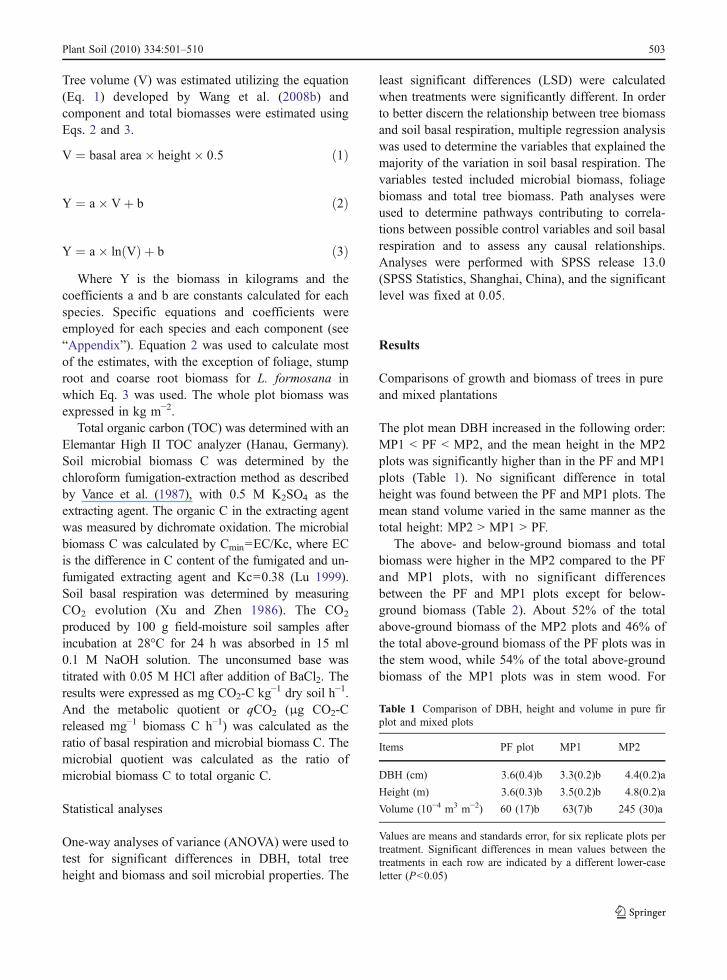
The plot mean DBH increased in the following order:MP1 < PF < MP2, and the mean height in the MP2plots was significantly higher than in the PF and MP1plots (Table 1). No significant difference in totalheight was found between the PF and MP1 plots. Themean stand volume varied in the same manner as thetotal height: MP2 > MP1 > PF.
The above- and below-ground biomass and totalbiomass were higher in the MP2 compared to the PFand MP1 plots, with no significant differencesbetween the PF and MP1 plots except for below-ground biomass (Table 2). About 52% of the totalabove-ground biomass of the MP2 plots and 46% ofthe total above-ground biomass of the PF plots was inthe stem wood, while 54% of the total above-groundbiomass of the MP1 plots was in stem wood. For
Table 1 Comparison of DBH, height and volume in pure firplot and mixed plots
Items PF plot MP1 MP2
DBH (cm) 3.6(0.4)b 3.3(0.2)b 4.4(0.2)a
Height (m) 3.6(0.3)b 3.5(0.2)b 4.8(0.2)a
Volume (10−4 m3 m−2) 60 (17)b 63(7)b 245 (30)a
Values are means and standards error, for six replicate plots pertreatment. Significant differences in mean values between thetreatments in each row are indicated by a different lower-caseletter (P<0.05)
Plant Soil (2010) 334:501–510 503

MP1, almost 44% of total belowground biomass wasin the stump root, while for the PF and MP2, 41% and45% of belowground biomass was in the stump root.The biomass of stem wood, stem bark, branches,foliage stump root, coarse root and middle rootdecreased in the followed order: MP2 > PF > MP1.While the lowest fine root biomass value was in theMP1 plots, there was no significant differencebetween the MP2 and the PF plots. The PF plotshad the highest percentage of total biomass in stembark (10%), foliage (22%), medium root (4%) andfine root (3%). The MP2 plots had the highestpercentage of total biomass in the stem wood (43%)and branch (17%).
Comparisons of soil microbial properties in pure firplot and mixed plots
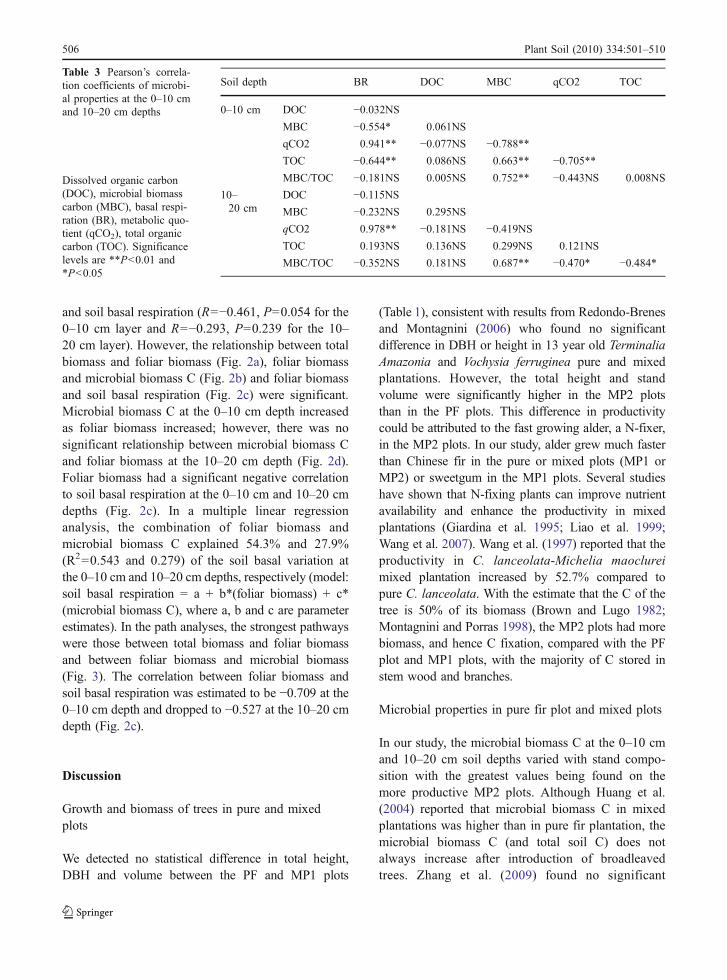
Total C, dissolved C, microbial biomass C, soilbasal respiration and qCO2 at the soil 0–10 cmdepth were significantly higher compared to those atthe 10–20 cm depth (Fig. 1). At the 0–10 cm depth,total C in the MP2 plots was significantly highercompared to PF and MP1 plots (p=0.006). Total C atthe 10–20 cm depth ranged from 11.01 g kg−1 to14.63 g kg−1, with no significant differences amongplots. The dissolved C at the 0–10 cm depth washigher than at the 10–20 cm depth but was notsignificantly different between the depths or plots.At the 0–10 cm depth, TOC was negativelycorrelated to basal respiration and qCO2 and posi-
tively correlated to microbial biomass C (Table 3).However, these relationships were absent at the 10–20 cm depth.
Microbial biomass C ranged from 486 mg kg−1
to 746 mg kg−1 at the 0–10 cm depth and485 mg kg−1 to 647 mg kg−1 at the 10–20 cm depth(Fig. 1). Microbial biomass varied with standcomposition and soil depth. The maximum value ofmicrobial biomass C at both depths appeared in theMP2 plots. At the 0–10 cm depth, microbial biomassC in the PF plots was significantly higher than in theMP1 plots; however, there was no differencebetween the two treatments at the 10–20 cm depth.Plot tree composition did not affect the microbialquotient at the 0–10 cm depth. However, at the 10–20 cm depth, the microbial quotient in the MP2 plotswas higher compared to the PF and MP1 plots. Therewas a significant positive correlation between mi-crobial biomass C and microbial quotient at bothdepths, and a negative correlation between microbialbiomass C and soil basal respiration at the 0–10 cmdepth (Table 3).
Soil basal respiration and qCO2 ranged from0.21 mg CO2-C kg−1 h−1 to 0.88 mg CO2-C kg−1 h−1
and 0.36 mg CO2-C g Cmic−1 h−1 to 1.55 mg CO2-C g
Cmic−1 h−1, respectively (Fig. 1). Basal respiration
and qCO2 responded similarly to stand compositionat both soil depths. Basal respiration at the 0–10 cmdepth increased in the following order: MP2 < PF <MP1, and there was no significant differencebetween the MP2 (0.28 mg CO2-C kg−1 h−1) and
Biomass PF MP1 MP2
Mean SE Sig. Mean SE Sig. Mean SE Sig.
Stem wood 2.35 0.43 b 3.84 0.35 B 9.82 1.07 a
Stem bark 0.67 0.12 b 0.76 0.07 B 1.77 0.17 a
Branches 0.78 0.13 b 1.41 0.13 B 3.79 0.44 a
Foliage 1.43 0.24 b 1.07 0.12 B 2.76 0.37 a
Cone 0 0 b 0 0 B 1.17 0.20 a
Stump root 0.58 0.10 c 1.14 0.09 B 1.74 0.16 a
coarse roots 0.40 0.07 c 0.95 0.08 B 1.58 0.17 a
medium roots 0.25 0.04 b 0.28 0.02 B 0.49 0.03 a
Fine root 0.17 0.03 a 0.09 0.01 B 0.19 0.01 a
Above-ground 5.09 0.88 b 7.12 0.68 B 18.85 2.24 a
Below-ground 1.41 0.24 c 2.58 0.21 B 3.89 0.33 a
Total 6.49 1.11 b 9.70 0.88 B 22.75 2.56 a
Table 2 Mean componentand total biomass (kg m−2)in pure fir plot and mixedplots
Values are means andstandards error, for six rep-licate plots per treatment.Significant differences inmean values between thetreatments in each row areindicated by a differentlower-case letter (P<0.05)
504 Plant Soil (2010) 334:501–510

PF plots (0.36 mg CO2-C kg−1 h−1) at the 10–20 cmdepth (P>0.05). The values of qCO2 at each depthdecreased in the following order: MP1 > PF > MP2(Fig. 1). The qCO2 values were negatively correlatedwith the microbial quotient at the 10–20 cm depthand positively related with soil basal respiration atthe 0–10 cm depth and at the 10–20 cm depth(Table 3).
Relationship between total biomass of trees, microbialbiomass C, and basal respiration at each soil depth
No significant relationship was detected between totalbiomass and fine root biomass (R=0.324, P=0.189),fine root biomass and microbial biomass C (R=0.234,P=0.350 for the 0–10 cm layer and R=0.452, P=0.060 for the 10–20 cm layer ) and fine root biomass
0-10cm 10- 20cm10
12
14
16T
otal
org
anic
C (
g kg
-1)
Pure fir plotMixed plot 1Mixed plot 2
a
a
b
ba
a
0-10cm 10-20cm100
110
120
130
140
150
160
170
180
Dis
solv
ed o
rgan
ic C
(mg
kg-1
)
a
a
a
a
a
0-10cm 10-20cm
400
450
500
550
600
650
700
Mic
robi
al b
iom
ass
C
(mg
kg-1
)
Pure fir plotMixed plot 1Mixed plot 2a
a
a
b bb
0-10cm 0-20cm
3.0
3.5
4.0
4.5
5.0
5.5
6.0
Mic
robi
al q
uoti
ent
(%)
a
a
a
bb
a
0-10cm 10-20cm0.0
0.1
0.2
0.3
0.4
0.5
0.6
0.7
0.8
0.9
Soil
basa
l res
pira
tion
(mg
CO
2-C
kg
-1 h
-1)
b
a
cb
a
b
0-10cm 10-20cm0.2
0.4
0.6
0.8
1.0
1.2
1.4
1.6
1.8
qCO
2
(mg
CO
2-C g
Cm
ic-1 h
-1)
a
ab
bc
c
Pure fir plotMixed plot 1Mixed plot 2
Pure fir plotMixed plot 1Mixed plot 2
Pure fir plotMixed plot 1Mixed plot 2
Pure fir plotMixed plot 1Mixed plot 2
a
Fig 1 Soil organic C, dissolved organic C, microbial biomass C, basal respiration, qCO2 and microbial quotient at the 0–10 cm and10–20 cm depths on the pure fir (PF), mixed plot 1 (MP1) and mixed plot 2 (MP2) plots
Plant Soil (2010) 334:501–510 505
and soil basal respiration (R=−0.461, P=0.054 for the0–10 cm layer and R=−0.293, P=0.239 for the 10–20 cm layer). However, the relationship between totalbiomass and foliar biomass (Fig. 2a), foliar biomassand microbial biomass C (Fig. 2b) and foliar biomassand soil basal respiration (Fig. 2c) were significant.Microbial biomass C at the 0–10 cm depth increasedas foliar biomass increased; however, there was nosignificant relationship between microbial biomass Cand foliar biomass at the 10–20 cm depth (Fig. 2d).Foliar biomass had a significant negative correlationto soil basal respiration at the 0–10 cm and 10–20 cmdepths (Fig. 2c). In a multiple linear regressionanalysis, the combination of foliar biomass andmicrobial biomass C explained 54.3% and 27.9%(R2=0.543 and 0.279) of the soil basal variation atthe 0–10 cm and 10–20 cm depths, respectively (model:soil basal respiration = a + b*(foliar biomass) + c*(microbial biomass C), where a, b and c are parameterestimates). In the path analyses, the strongest pathwayswere those between total biomass and foliar biomassand between foliar biomass and microbial biomass(Fig. 3). The correlation between foliar biomass andsoil basal respiration was estimated to be −0.709 at the0–10 cm depth and dropped to −0.527 at the 10–20 cmdepth (Fig. 2c).
Discussion
Growth and biomass of trees in pure and mixedplots
We detected no statistical difference in total height,DBH and volume between the PF and MP1 plots
(Table 1), consistent with results from Redondo-Brenesand Montagnini (2006) who found no significantdifference in DBH or height in 13 year old TerminaliaAmazonia and Vochysia ferruginea pure and mixedplantations. However, the total height and standvolume were significantly higher in the MP2 plotsthan in the PF plots. This difference in productivitycould be attributed to the fast growing alder, a N-fixer,in the MP2 plots. In our study, alder grew much fasterthan Chinese fir in the pure or mixed plots (MP1 orMP2) or sweetgum in the MP1 plots. Several studieshave shown that N-fixing plants can improve nutrientavailability and enhance the productivity in mixedplantations (Giardina et al. 1995; Liao et al. 1999;Wang et al. 2007). Wang et al. (1997) reported that theproductivity in C. lanceolata-Michelia maoclureimixed plantation increased by 52.7% compared topure C. lanceolata. With the estimate that the C of thetree is 50% of its biomass (Brown and Lugo 1982;Montagnini and Porras 1998), the MP2 plots had morebiomass, and hence C fixation, compared with the PFplot and MP1 plots, with the majority of C stored instem wood and branches.
Microbial properties in pure fir plot and mixed plots
In our study, the microbial biomass C at the 0–10 cmand 10–20 cm soil depths varied with stand compo-sition with the greatest values being found on themore productive MP2 plots. Although Huang et al.(2004) reported that microbial biomass C in mixedplantations was higher than in pure fir plantation, themicrobial biomass C (and total soil C) does notalways increase after introduction of broadleavedtrees. Zhang et al. (2009) found no significant
Soil depth BR DOC MBC qCO2 TOC
0–10 cm DOC −0.032NSMBC −0.554* 0.061NS
qCO2 0.941** −0.077NS −0.788**TOC −0.644** 0.086NS 0.663** −0.705**MBC/TOC −0.181NS 0.005NS 0.752** −0.443NS 0.008NS
10–20 cm
DOC −0.115NSMBC −0.232NS 0.295NS
qCO2 0.978** −0.181NS −0.419NSTOC 0.193NS 0.136NS 0.299NS 0.121NS
MBC/TOC −0.352NS 0.181NS 0.687** −0.470* −0.484*
Table 3 Pearson’s correla-tion coefficients of microbi-al properties at the 0–10 cmand 10–20 cm depths
Dissolved organic carbon(DOC), microbial biomasscarbon (MBC), basal respi-ration (BR), metabolic quo-tient (qCO2), total organiccarbon (TOC). Significancelevels are **P<0.01 and*P<0.05
506 Plant Soil (2010) 334:501–510

difference in total soil C between pure and mixedplantations, while others have reported that soil C wasenhanced when broadleaf trees were introduced toChinese fir plantations (Zheng and Ding 1998; Jia etal. 2005; Guo 2008). Since total soil C and microbial
biomass C are intimately correlated (Insam andDomsch 1988), changes in total soil C would resultin comparable changes in microbial biomass C.Mixed plantations with greater NPP as compared tothe pure plantations would show an increase in soil C
0 5 10 15 20 25 30
0.5
1.0
1.5
2.0
2.5
3.0
3.5
4.0
Folia
ge b
iom
ass
(kg
m2 )
Total tree biomass (kg m2)
(R=0.925, P<0.001)
0.5 1.0 1.5 2.0 2.5 3.0 3.5 4.0450
500
550
600
650
700
750 0-10cm (R=0.542, P=0.02) 10-20cm (R=0.378, P=0.128)
Mic
robi
al b
iom
ass
C (
mg
kg-1)
Foliage biomass (kg m2)
0.5 1.0 1.5 2.0 2.5 3.0 3.5 4.0
0.2
0.3
0.4
0.5
0.6
0.7
0.8
0.9
Bas
al r
espi
ratio
n (m
g C
O2-
C k
g-1 h
-1)
Foliage biomass (kg m2)
0-10cm (R= -0.709, P<0.001)10-20cm (R= -0.527, P=0.025)
450 500 550 600 650 700 750
0.2
0.3
0.4
0.5
0.6
0.7
0.8
0.9
Bas
al r
espi
ratio
n (m
g C
O2-
C k
g-1 h
-1)
Microbial biomass C (mg kg-1)
0-10cm (R= -0.555, P= 0.017)10-20cm (R= -0.233, P=0.353)
a b
c d
Fig 2 a–d Correlative relationship between total biomass and foliage biomass (a), foliar biomass and microbial biomass C (b), foliarbiomass and basal respiration (c) and basal respiration and microbial biomass (d)
Fig 3 Path analysesexamining biotic controls ofsoil basal respiration. Thenumbers on the diagram arethe path coefficients andsignificance levels are **P<0.01 and *P<0.05
Plant Soil (2010) 334:501–510 507
because of the increased C input from roots and theforest floor. Likewise, mixed plantations that haveessentially the same productivity as the pure planta-tions would be anticipated to have the same soil C asthe pure plantations because the C inputs would bethe same.
Soil basal respiration and qCO2 in the MP2 plotswas significantly lower than in PF plots, in agree-ment with an earlier report by Mu (2004), whoreported that soil CO2 efflux in mixed forest wassignificantly lower than in deciduous, and coniferousforest. However, some comparative studies revealedthat soil respiration in mixed plantations were higherthan in pure plantations (Yang et al. 2004; Zhang et al.2007). A possible explanation for this discrepancy maylie in whether there was a change in soil pH. Xuand Qi (2001) found that soil respiration increasedon plots where soil pH decreased. Nitrogen fixingtrees have been shown to decrease soil pH; however,this effect is not appreciable until decades after studyinstallation (Van Miegroet et al. 1989; Binkley andSollins 1990) and would not be a factor in the shortduration of our study.
The relationship between tree biomassand microbial biomass C, soil basal respiration
A main objective of this study was to determine theeffect of stand composition on soil organic matterdecomposition. We anticipated that mixed plots wouldincrease tree productivity and C inputs into soils,leading to an increase in soil C content. This wouldfurther result in an increase in soil basal respirationthrough increasing microbial biomass and microbialactivity as a result of the increased C supply. Treebiomass was greatest in the MP2 plots and lowest in thePF plots. Microbial biomass and the C use efficiency(qCO2) showed the same trend while soil basalrespiration showed an opposite trend. Our datasuggests that stand composition had a significant effecton soil basal respiration at the 0–10 cm and 10–20 cmsoil depths, where soil basal respiration was negativelycorrelated to tree biomass. Our study indirectly linkstree productivity and soil organic matter decomposi-tion, in that foliar biomass explained 50% and 28% ofthe variation in basal respiration in 0–10 cm and 10–20 cm soil depth. Greater tree biomass could reflectmore foliage biomass and photosynthesis product andnutrient supply to soil, thus the content and quality of
soil organic matter (expressed by the ratio of Cmic/Corg)was improved. If the demand for nutrient and energywas met, the C use efficiency of microbial communitywould increase, and soil basal respiration woulddecrease. It should be noted that soil respiration inplantation stands consist of root respiration andmicrobial respiration, and root respiration was excludedin this study.
The improved soil properties in the mixed plots ascompared to the pure Chinese fir plots suggests that theimprovements are attributed to the combination ofenhanced biodiversity and biomass in the mixed plots.The microbial properties in the MP1 plots were notimproved probably due to productivity not increasing(relative to the PF plots), even though the biodiversityincreased. Soil C process were moderately affected bythe introduction of C. Lanceolata and A. cremastogyneinto Chinese fir plantations in three ways: (1) increasingC storage in biomass, (2) increasing soil organic matterby more C input into soils, (3) reducing soil organicmatter decomposition.
The advantages and disadvantages of the small plotarea
The small plot area may complicate stand leveldeterminations but do not negate examinations of soilprocesses. The homogenous nature of the plots atplanting coupled with the small plot areas minimizewithin-plot variability. Since soil processes are drivenby soil moisture, temperature and nutrient status(Raich and Schlesinger 1992; Liu et al. 2005),microsite variations in these soil properties can havea profound effect on the variability of soil processmetrics. The low within plot variability in this studypermits a clearer examination of the impact of netprimary productivity on soil processes, including soilorganic matter decomposition, without the externalinfluence of microsite differences that may masktreatment effects.
Conclusion
This study suggests that the introduction of broad-leafed trees into pure Chinese fir plantations mayincrease site productivity, especially for the N-fixingalder (MP2 plots). The higher microbial biomass andC use efficiency (qCO2) in the more productive MP2
508 Plant Soil (2010) 334:501–510
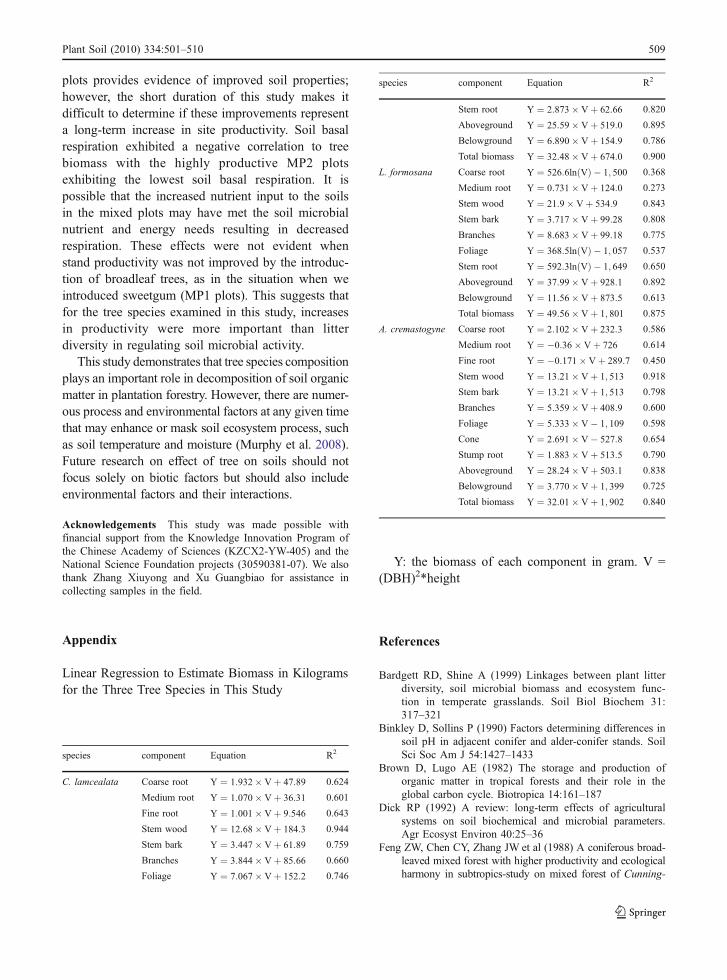
plots provides evidence of improved soil properties;however, the short duration of this study makes itdifficult to determine if these improvements representa long-term increase in site productivity. Soil basalrespiration exhibited a negative correlation to treebiomass with the highly productive MP2 plotsexhibiting the lowest soil basal respiration. It ispossible that the increased nutrient input to the soilsin the mixed plots may have met the soil microbialnutrient and energy needs resulting in decreasedrespiration. These effects were not evident whenstand productivity was not improved by the introduc-tion of broadleaf trees, as in the situation when weintroduced sweetgum (MP1 plots). This suggests thatfor the tree species examined in this study, increasesin productivity were more important than litterdiversity in regulating soil microbial activity.
This study demonstrates that tree species compositionplays an important role in decomposition of soil organicmatter in plantation forestry. However, there are numer-ous process and environmental factors at any given timethat may enhance or mask soil ecosystem process, suchas soil temperature and moisture (Murphy et al. 2008).Future research on effect of tree on soils should notfocus solely on biotic factors but should also includeenvironmental factors and their interactions.
Acknowledgements This study was made possible withfinancial support from the Knowledge Innovation Program ofthe Chinese Academy of Sciences (KZCX2-YW-405) and theNational Science Foundation projects (30590381-07). We alsothank Zhang Xiuyong and Xu Guangbiao for assistance incollecting samples in the field.
Appendix
Linear Regression to Estimate Biomass in Kilogramsfor the Three Tree Species in This Study
Y: the biomass of each component in gram. V =(DBH)2*height
References
Bardgett RD, Shine A (1999) Linkages between plant litterdiversity, soil microbial biomass and ecosystem func-tion in temperate grasslands. Soil Biol Biochem 31:317–321
Binkley D, Sollins P (1990) Factors determining differences insoil pH in adjacent conifer and alder-conifer stands. SoilSci Soc Am J 54:1427–1433
Brown D, Lugo AE (1982) The storage and production oforganic matter in tropical forests and their role in theglobal carbon cycle. Biotropica 14:161–187
Dick RP (1992) A review: long-term effects of agriculturalsystems on soil biochemical and microbial parameters.Agr Ecosyst Environ 40:25–36
Feng ZW, Chen CY, Zhang JW et al (1988) A coniferous broad-leaved mixed forest with higher productivity and ecologicalharmony in subtropics-study on mixed forest of Cunning-
species component Equation R2
C. lamcealata Coarse root Y ¼ 1:932� Vþ 47:89 0.624
Medium root Y ¼ 1:070� Vþ 36:31 0.601
Fine root Y ¼ 1:001� Vþ 9:546 0.643
Stem wood Y ¼ 12:68� Vþ 184:3 0.944
Stem bark Y ¼ 3:447� Vþ 61:89 0.759
Branches Y ¼ 3:844� Vþ 85:66 0.660
Foliage Y ¼ 7:067� Vþ 152:2 0.746
species component Equation R2
Stem root Y ¼ 2:873� Vþ 62:66 0.820
Aboveground Y ¼ 25:59� Vþ 519:0 0.895
Belowground Y ¼ 6:890� Vþ 154:9 0.786
Total biomass Y ¼ 32:48� Vþ 674:0 0.900
L. formosana Coarse root Y ¼ 526:6ln Vð Þ � 1; 500 0.368
Medium root Y ¼ 0:731� Vþ 124:0 0.273
Stem wood Y ¼ 21:9� Vþ 534:9 0.843
Stem bark Y ¼ 3:717� Vþ 99:28 0.808
Branches Y ¼ 8:683� Vþ 99:18 0.775
Foliage Y ¼ 368:5ln Vð Þ � 1; 057 0.537
Stem root Y ¼ 592:3ln Vð Þ � 1; 649 0.650
Aboveground Y ¼ 37:99� Vþ 928:1 0.892
Belowground Y ¼ 11:56� Vþ 873:5 0.613
Total biomass Y ¼ 49:56� Vþ 1; 801 0.875
A. cremastogyne Coarse root Y ¼ 2:102� Vþ 232:3 0.586
Medium root Y ¼ �0:36� Vþ 726 0.614
Fine root Y ¼ �0:171�Vþ 289:7 0.450
Stem wood Y ¼ 13:21� Vþ 1; 513 0.918
Stem bark Y ¼ 13:21� Vþ 1; 513 0.798
Branches Y ¼ 5:359� Vþ 408:9 0.600
Foliage Y ¼ 5:333� V� 1; 109 0.598
Cone Y ¼ 2:691� V� 527:8 0.654
Stump root Y ¼ 1:883� Vþ 513:5 0.790
Aboveground Y ¼ 28:24� Vþ 503:1 0.838
Belowground Y ¼ 3:770� Vþ 1; 399 0.725
Total biomass Y ¼ 32:01� Vþ 1; 902 0.840
Plant Soil (2010) 334:501–510 509

hamia lanceolata and Michelia macclurei. Acta Phytoe-cogica Et Geobotanica Sinica 12(3):165–180
Giardina CP, Huffinan S, Binkley D, Cauldwell BA (1995) Aldersincrease soil phosphorus availability in a Douglas-firplantation. Can J For Res 25:1652–1657
Guo J (2008) Comparison of soil organic carbon and nitrogenpool between mixed and pure forests of Chinese fir. JFujian For Sci Tech 35(2):5–9
Hu Y, Wang S, Zeng D (2006) Effects of single Chinese firand mixed leaf litters on soil chemical, microbialproperties and soil enzyme activities. Plant Soil282:379–386
Huang Y, Feng Z, Wang S et al (2004) Effects of Chinese-firmixing with N-fixing and non-N fixing tree species onforestland quality and forest-floor solution chemistry. [J]Acta Ecologica Sinia 24(10):2192–2199
Insam H, Domsch KH (1988) Relationship between soilorganic carbon and microbial biomass on chronosequencesof reclamation sites. Microb Ecol 15:177–188
Jia Y, Wang T, Du R (2005) Study on variety of the content ofcarbon and nitrogen in different type of soil. J Beijing AgriCol 20(3):63–66
Landi F, Valori J, Ascher J, Renella G, Falchini L, Nannipieri P(2006) Root exudates effects on the bacterial communities,CO2 evolution, nitrogen transformations and ATP contentof rhizosphere and bulk soils. Soil Biol Biochem 38(3):509–516
Lei JF (2005) Forest resources of China. Chinese Forestry,Beijing, pp 172–173
Liao L, Yang Y, Wang S et al (1999) Distribution,decomposition and nutrient return of the fine root inpure Cunninghamia lanceolata, Michelia macclurei andthe mixed plantation. [J] Acta Ecologica Sinia 19(3):342–346
Liu Y, Han S, Hu Y, Dai G (2005) Effects of soil temperatureand humidity on soil respiration rate under pinus sylves-triformis forest. Chin J Appl Ecol 16(9):1581–1585
Lu RK (1999) Analysis methods of soil agricultural chemistry.China Agricultural Science and Technology, Beijing,pp 228–233
Montagnini F, Porras C (1998) Evaluating the role ofplantations as carbon sinks: an example of an integrativeapproach from the humid tropics. Environ Manage 22(3):459–470
Mu S (2004) Respiration of soils under temperate deciduous,coniferous and mixed forest. Acta Pedologia Sin 41(4):564–570
Murphy M, Balser T, Buchmann N, Hahn V, Potvin C (2008)Linking tree biodiversity to belowground process in ayoung tropical plantation: impacts on soil CO2 flux. ForEco Manage 255:2577–2588
Piao HC, Zhu JM, Liu GS, Liu CQ, Tao FX (2006) Changes ofnatural 13C abundance in microbial biomass during litterdecomposition. Appl Soil Ecol 33(1):3–9
Raich JW, Schlesinger WH (1992) The global carbon dioxideflux in soil respiration and its relation to vegetation andclimates. Tellus 44B:81–99
Redondo-Brenes A, Montagnini F (2006) Growth, productivity,aboveground biomass, and carbon sequestration of pureand mixed native tree plantations in the Caribbeanlowlands of Costa Rica. For Eco Manage 232:168–178
Van Miegroet H, Cole D, Binkley D, Sollins P (1989) Theeffect of nitrogen accumulation and nitrification on soilchemical properties in alder forests. In: Olson RK, LeFohnAS (eds) Effects of air pollution on western forests. AirWaste Manage. Assoc, Pittsburgh, pp 515–528
Vance ED, Brookes PC, Jenkinson DS (1987) An extractionmethod for measuring soil microbial biomass C. Soil BiolBiochem 19:703–707
Wang S, Liao L, Ma Y (1997) Nutrient return and productivityof mixed Cunninghamia lanceolata and Michelia Mao-clurei plantations. Chin J Appl Ecol 8(4):347–352
Wang Q, Wang S, Fan B, Yu X (2007) Litter production, leaflitter decomposition and nutrient return in Cunninghamialanceolata plantation in south China: effect of plantingconifers with broadleaved species. Plant Soil 297:201–211
Wang Q, Wang S, Huang Y (2008a) Comparison of litterfall,litter decomposition and nutrient return in a monocultureCunninghamia lanceolata and a mixed stand in southernChina. For Ecol Manag 255:1210–1218
Wang W, Lei Y, Wang X et al (2008b) A review of forestbiomass models. J Northwest For Univ 23(2):58–63
Xu GH, Zhen HY (1986) Manual on microbial analysis methodof soil. Agriculture, Beijing
Xu M, Qi Y (2001) Soil surface CO2 efflux and its spatial andtemporal variations in a young ponderosa pine plantationin northern California. Glob Chang Biol 7:667–677
Yan S, Wang S, Yu X (2004) Effect of mixtures with alders onsoil fauna in plantation forest of Chinese fir. Chin J ApplEnviron 10:462–466
Yang Q, Li M, Wang B (2004) Study on soil respiration of thelower subtropical successive forest communities. Guihaia24(5):443–449
Zhang L, Wang B, Liu Y, Chen B, Ao J (2007) A study on the soilrespiration under four forest types in dagangshan in summerand autumn. Acta Agri Univ Jiangxiensis 29(1):72–77
Zhang J, Wang S, Wang Q, Liu Y (2009) Content and seasonalchange in soil labile organic carbon under different forestcovers. Chin J Eco-Agri 17(1):41–47
Zheng YS, Ding YX (1998) Effect of mixed forests of Chinesefir and tsoong’s tree on soil properties. Pedosphere 8(2):161–168
510 Plant Soil (2010) 334:501–510
Related Documents