Reinforced Concrete Coupling Beams with High-Strength Steel Bars Alexander S. Weber-Kamin Shahedreen Ameen Rémy D. Lequesne Andrés Lepage Department of Civil, Environmental & Architectural Engineering The University of Kansas Lawrence, Kansas, USA December 2019

Welcome message from author
This document is posted to help you gain knowledge. Please leave a comment to let me know what you think about it! Share it to your friends and learn new things together.
Transcript

ReinforcedConcreteCouplingBeams
withHigh-StrengthSteelBars
Alexander S. Weber-Kamin
Shahedreen Ameen
Rémy D. Lequesne
Andrés Lepage
Department of Civil, Environmental & Architectural Engineering
The University of Kansas
Lawrence, Kansas, USA
December 2019

ReinforcedConcreteCouplingBeams
WithHigh-StrengthSteelBars
CPFResearchGrantAgreement#03‐17
CHARLES PANKOW FOUNDATION 1390 Chain Bridge Road, Suite 700
McLean, Virginia 22101
PrincipalInvestigators: Dr. Andrés Lepage
Dr. Rémy D. Lequesne
GraduateResearchAssistants: Alexander S. Weber-Kamin
Shahedreen Ameen
Industry Support:
IndustryChampions:
AdvisoryPanel:
David Fields, MKA
Ramón Gilsanz, GMS
Dominic Kelly, SGH
Conrad Paulson, WJE

i
ABSTRACT
The use of high-strength steel bars in reinforced concrete coupling beams is expected to
reduce reinforcement congestion. A series of tests was conducted to investigate the effects of
high-strength reinforcement on coupling beam behavior. This document summarizes the test
program and test data.
Eleven large-scale coupling beam specimens were tested under fully reversed cyclic
displacements of increasing magnitude. The main variables of the test program included: yield
stress of the primary longitudinal reinforcement (Grade 80, 100, and 120 [550, 690, and 830]),
span-to-depth (aspect) ratio (1.5, 2.5, and 3.5), and layout of the primary longitudinal
reinforcement (diagonal [D] and parallel [P]). All beams had the same nominal concrete
compressive strength (8,000 psi [55 MPa]) and cross-sectional dimensions (12 by 18 in. [310 by
460 mm]). Beams were designed for target shear stresses of 8 𝑓 psi (0.67 𝑓 MPa) for D-type
beams and 6 𝑓 psi (0.5 𝑓 MPa) for P-type beams. Transverse reinforcement was Grade 80
(550) in all but one beam, which had Grade 120 (830) reinforcement.
The test program is documented by presenting the details of specimen construction, test
setup, instrumentation, and loading protocol. Documentation of test data includes material
properties, cyclic force-deformation response, progression of damage, calculated and measured
strengths, initial stiffness, and measured reinforcement strains.
ii
ACKNOWLEDGMENTS
Primary financial support for the experimental program was provided by the Charles
Pankow Foundation, the Concrete Reinforcing Steel Institute, and the ACI Foundation’s Concrete
Research Council. Additional support was provided by Commercial Metals Company, MMFX
Technologies Corporation, Harris Rebar, Midwest Concrete Materials, Nucor Corporation, and
The University of Kansas through the Department of Civil, Environmental and Architectural
Engineering and the School of Engineering.
Grateful acknowledgment is made to the Industry Champions, David Fields (principal at
MKA, Seattle) and Ramón Gilsanz (partner at GMS, New York) and the Advisory Panel, Dominic
Kelly (principal at SGH, Boston) and Conrad Paulson (principal at WJE, Los Angeles), for their
ideas and constructive criticism.
Appreciation is due to the multitude of dedicated students and technicians who were
involved in the construction, instrumentation, and testing of specimens.

iii
TABLE OF CONTENTS
ABSTRACT .................................................................................................................................... i
ACKNOWLEDGMENTS ............................................................................................................ ii
LIST OF TABLES ........................................................................................................................ v
LIST OF FIGURES ..................................................................................................................... vi
CHAPTER 1: INTRODUCTION ................................................................................................ 1
1.1 Background and Motivation ................................................................................................... 1
1.2 Research Objectives ............................................................................................................... 2
CHAPTER 2: EXPERIMENTAL PROGRAM ......................................................................... 4
2.1 Specimens ............................................................................................................................... 4
2.1.1 Design and Detailing ......................................................................................................... 4
2.1.2 Materials ............................................................................................................................ 9
2.1.3 Construction .................................................................................................................... 10
2.2 Test Setup ............................................................................................................................. 10
2.3 Instrumentation ..................................................................................................................... 11
2.3.1 Linear Variable Differential Transformers (LVDTs) ..................................................... 11
2.3.2 Infrared Non-Contact Position Measurement System..................................................... 11
2.3.3 Strain Gauges .................................................................................................................. 12
2.4 Loading Protocol .................................................................................................................. 12
CHAPTER 3: EXPERIMENTAL RESULTS .......................................................................... 14
3.1 Measured Shear versus Chord Rotation ............................................................................... 14
3.2 Specimen Response and Observations ................................................................................. 15
3.2.1 D80-1.5 ........................................................................................................................... 16
3.2.2 D100-1.5 ......................................................................................................................... 17
3.2.3 D120-1.5 ......................................................................................................................... 17
3.2.4 D80-2.5 ........................................................................................................................... 18
3.2.5 D100-2.5 ......................................................................................................................... 18
3.2.6 D120-2.5 ......................................................................................................................... 18
3.2.7 D80-3.5 ........................................................................................................................... 19
3.2.8 D100-3.5 ......................................................................................................................... 19
3.2.9 D120-3.5 ......................................................................................................................... 20

iv
3.2.10 P80-2.5 .......................................................................................................................... 20
3.2.11 P100-2.5 ........................................................................................................................ 21
3.3 ASCE 41 Envelopes ............................................................................................................. 21
3.4 Progression of Damage ......................................................................................................... 23
3.5 Calculated and Measured Strengths of Specimens ............................................................... 26
3.6 Stiffness ................................................................................................................................ 27
3.7 Measured Reinforcement Strains ......................................................................................... 30
3.7.1 Diagonal Reinforcement ................................................................................................. 32
3.7.2 Parallel Primary Reinforcement ...................................................................................... 33
3.7.3 Parallel Secondary Reinforcement .................................................................................. 34
3.7.4 Transverse Reinforcement .............................................................................................. 34
CHAPTER 4: CONCLUDING REMARKS ............................................................................ 36
REFERENCES ............................................................................................................................ 39
TABLES ....................................................................................................................................... 41
FIGURES ..................................................................................................................................... 56
APPENDIX A: NOTATION ................................................................................................... A–1
APPENDIX B: SELECTED PHOTOS OF SPECIMENS DURING CONSTRUCTION . B–1
APPENDIX C: SELECTED PHOTOS OF SPECIMENS DURING TESTING ............... C–1

v
LIST OF TABLES
Table 1 – Design data for coupling beam specimens ................................................................... 42
Table 2 – Measured compressive and tensile strengths of concrete ............................................. 43
Table 3 – Concrete mixture proportions ....................................................................................... 44
Table 4 – Reinforcing steel properties .......................................................................................... 45
Table 5 – Specimen and actuator nominal elevations relative to strong floor .............................. 45
Table 6 – List of strain gauges on primary and secondary longitudinal reinforcement ............... 46
Table 7 – List of strain gauges on transverse reinforcement ........................................................ 47
Table 8 – Loading protocol ........................................................................................................... 48
Table 9 – Coupling beam maximum shear stress and deformation capacity ................................ 49
Table 10 – Force-deformation envelope for D-type coupling beams with aspect ratio of 1.5 ..... 50
Table 11 – Force-deformation envelope for D-type coupling beams with aspect ratio of 2.5 ..... 51
Table 12 – Force-deformation envelope for D-type coupling beams with aspect ratio of 3.5 ..... 52
Table 13 – Force-deformation envelope for P-type coupling beams with aspect ratio of 2.5 ...... 53
Table 14 – Coupling beam measured and calculated strengths .................................................... 54
Table 15 – Summary of test data .................................................................................................. 55

vi
LIST OF FIGURES
Figure 1 – Reinforcement layout types, parallel (P) and diagonal (D) ......................................... 57
Figure 2 – Elevation view of D80-1.5 .......................................................................................... 58
Figure 3 – Reinforcement details of D80-1.5 ............................................................................... 59
Figure 4 – Elevation view of D100-1.5 ........................................................................................ 60
Figure 5 – Reinforcement details of D100-1.5 ............................................................................. 61
Figure 6 – Elevation view of D120-1.5 ........................................................................................ 62
Figure 7 – Reinforcement details of D120-1.5 ............................................................................. 63
Figure 8 – Elevation view of D80-2.5 .......................................................................................... 64
Figure 9 – Reinforcement details of D80-2.5 ............................................................................... 65
Figure 10 – Elevation view of D100-2.5 ...................................................................................... 66
Figure 11 – Reinforcement details of D100-2.5 ........................................................................... 67
Figure 12 – Elevation view of D120-2.5 ...................................................................................... 68
Figure 13 – Reinforcement details of D120-2.5 ........................................................................... 69
Figure 14 – Elevation view of D80-3.5 ........................................................................................ 70
Figure 15 – Reinforcement details of D80-3.5 ............................................................................. 71
Figure 16 – Elevation view of D100-3.5 ...................................................................................... 72
Figure 17 – Reinforcement details of D100-3.5 ........................................................................... 73
Figure 18 – Elevation view of D120-3.5 ...................................................................................... 74
Figure 19 – Reinforcement details of D120-3.5 ........................................................................... 75
Figure 20 – Elevation view of P80-2.5 ......................................................................................... 76
Figure 21 – Reinforcement details of P80-2.5 .............................................................................. 77
Figure 22 – Elevation view of P100-2.5 ....................................................................................... 78
Figure 23 – Reinforcement details of P100-2.5 ............................................................................ 79
Figure 24 – Measured stress versus strain for reinforcement ....................................................... 80
Figure 25 – Test setup, view from northeast................................................................................. 81
Figure 26 – Test setup, view from northwest ............................................................................... 81
Figure 27 – Test setup, plan view ................................................................................................. 82
Figure 28 – Test setup for coupling beams with aspect ratio of 1.5 ............................................. 83
Figure 29 – Test setup for coupling beams with aspect ratio of 2.5 ............................................. 83
Figure 30 – Test setup for coupling beams with aspect ratio of 3.5 ............................................. 84

vii
Figure 31 – LVDT locations ......................................................................................................... 85
Figure 32 – Infrared marker positions .......................................................................................... 85
Figure 33 – Strain gauge layout (view from north), D-type specimens ........................................ 86
Figure 34 – Strain gauge layout (view from north), P-type specimens ........................................ 87
Figure 35 – Loading protocol ....................................................................................................... 88
Figure 36 – General deformed shape of specimen, view from north ............................................ 88
Figure 37 – Shear versus chord rotation for D80-1.5 ................................................................... 89
Figure 38 – Shear versus chord rotation for D100-1.5 ................................................................. 89
Figure 39 – Shear versus chord rotation for D120-1.5 ................................................................. 90
Figure 40 – Shear versus chord rotation for D80-2.5 ................................................................... 90
Figure 41 – Shear versus chord rotation for D100-2.5 ................................................................. 91
Figure 42 – Shear versus chord rotation for D120-2.5 ................................................................. 91
Figure 43 – Shear versus chord rotation for D80-3.5 ................................................................... 92
Figure 44 – Shear versus chord rotation for D100-3.5 ................................................................. 92
Figure 45 – Shear versus chord rotation for D120-3.5 ................................................................. 93
Figure 46 – Shear versus chord rotation for P80-2.5 .................................................................... 94
Figure 47 – Shear versus chord rotation for P100-2.5 .................................................................. 94
Figure 48 – Shear versus chord rotation envelope for D80-1.5 .................................................... 95
Figure 49 – Shear versus chord rotation envelope for D100-1.5 .................................................. 95
Figure 50 – Shear versus chord rotation envelope for D120-1.5 .................................................. 96
Figure 51 – Shear versus chord rotation envelope for D80-2.5 .................................................... 96
Figure 52 – Shear versus chord rotation envelope for D100-2.5 .................................................. 97
Figure 53 – Shear versus chord rotation envelope for D120-2.5 .................................................. 97
Figure 54 – Shear versus chord rotation envelope for D80-3.5 .................................................... 98
Figure 55 – Shear versus chord rotation envelope for D100-3.5 .................................................. 98
Figure 56 – Shear versus chord rotation envelope for D120-3.5 .................................................. 99
Figure 57 – Shear versus chord rotation envelope for P80-2.5 ................................................... 100
Figure 58 – Shear versus chord rotation envelope for P100-2.5 ................................................. 100
Figure 59 – Chord rotation capacity versus primary reinforcement grade
for D-type coupling beams .................................................................................................. 101
Figure 60 – Shear versus chord rotation envelopes for D80-1.5, D100-1.5, and D120-1.5 ....... 102

viii
Figure 61 – Shear versus chord rotation envelopes for D80-2.5, D100-2.5, and D120-2.5 ....... 102
Figure 62 – Shear versus chord rotation envelopes for D80-3.5, D100-3.5, and D120-3.5 ....... 103
Figure 63 – Shear versus chord rotation envelopes for P80-2.5 and P100-2.5 ........................... 104
Figure 64 – Normalized shear versus chord rotation envelopes for P80-2.5 and P100-2.5 ....... 104
Figure 65 – Generalized force-deformation relationship
for diagonally-reinforced concrete coupling beams ............................................................ 105
Figure 66 – Reinforcing bar fracture locations, D80-1.5 ............................................................ 106
Figure 67 – Reinforcing bar fracture locations, D100-1.5 .......................................................... 106
Figure 68 – Reinforcing bar fracture locations, D120-1.5 .......................................................... 107
Figure 69 – Reinforcing bar fracture locations, D80-2.5 ............................................................ 107
Figure 70 – Reinforcing bar fracture locations, D100-2.5 .......................................................... 108
Figure 71 – Reinforcing bar fracture locations, D120-2.5 .......................................................... 108
Figure 72 – Reinforcing bar fracture locations, D80-3.5 ............................................................ 109
Figure 73 – Reinforcing bar fracture locations, D100-3.5 .......................................................... 109
Figure 74 – Reinforcing bar fracture locations, D120-3.5 .......................................................... 110
Figure 75 – Reinforcing bar fracture locations, P80-2.5 ............................................................ 111
Figure 76 – Reinforcing bar fracture locations, P100-2.5 .......................................................... 111
Figure 77 – Shear versus chord rotation envelopes for D80-1.5, D100-1.5, and D120-1.5 ....... 112
Figure 78 – Shear versus chord rotation envelopes for D80-2.5, D100-2.5, and D120-2.5 ....... 112
Figure 79 – Shear versus chord rotation envelopes for D80-3.5, D100-3.5, and D120-3.5 ....... 113
Figure 80 – Shear versus chord rotation envelopes for P80-2.5 and P100-2.5 ........................... 113
Figure 81 – Effective moment of inertia, 𝐼𝑒𝑓𝑓, normalized by
gross moment of inertia, 𝐼𝑔 ................................................................................................. 114
Figure 82 – Effective moment of inertia, 𝐼𝑒𝑓𝑓, normalized by
transformed uncracked moment of inertia, 𝐼𝑡𝑟 .................................................................... 114
Figure 83 – Measured strain in diagonal bar of D80-1.5, strain gauge D1................................. 115
Figure 84 – Measured strain in diagonal bar of D80-1.5, strain gauge D2................................. 115
Figure 85 – Measured strain in diagonal bar of D80-1.5, strain gauge D3................................. 116
Figure 86 – Measured strain in diagonal bar of D80-1.5, strain gauge D4................................. 116
Figure 87 – Measured strain in diagonal bar of D80-1.5, strain gauge D5................................. 117
Figure 88 – Measured strain in diagonal bar of D80-1.5, strain gauge D6................................. 117

ix
Figure 89 – Measured strain in diagonal bar of D80-1.5, strain gauge D7................................. 118
Figure 90 – Measured strain in diagonal bar of D80-1.5, strain gauge D8................................. 118
Figure 91 – Measured strain in diagonal bar of D80-1.5, strain gauge D9................................. 119
Figure 92 – Measured strain in diagonal bar of D80-1.5, strain gauge D10............................... 119
Figure 93 – Measured strain in diagonal bar of D80-1.5, strain gauge D11............................... 120
Figure 94 – Measured strain in diagonal bar of D80-1.5, strain gauge D12............................... 120
Figure 95 – Measured strain in diagonal bar of D80-1.5, strain gauge D13............................... 121
Figure 96 – Measured strain in diagonal bar of D80-1.5, strain gauge D14............................... 121
Figure 97 – Measured strain in closed stirrup of D80-1.5, strain gauge S1 ............................... 122
Figure 98 – Measured strain in closed stirrup of D80-1.5, strain gauge S2 ............................... 122
Figure 99 – Measured strain in closed stirrup of D80-1.5, strain gauge S3 ............................... 123
Figure 100 – Measured strain in closed stirrup of D80-1.5, strain gauge S4 ............................. 123
Figure 101 – Measured strain in closed stirrup of D80-1.5, strain gauge S5 ............................. 124
Figure 102 – Measured strain in closed stirrup of D80-1.5, strain gauge S6 ............................. 124
Figure 103 – Measured strain in closed stirrup of D80-1.5, strain gauge S7 ............................. 125
Figure 104 – Measured strain in closed stirrup of D80-1.5, strain gauge S8 ............................. 125
Figure 105 – Measured strain in closed stirrup of D80-1.5, strain gauge S9 ............................. 126
Figure 106 – Measured strain in parallel bar of D80-1.5, strain gauge H1 ................................ 127
Figure 107 – Measured strain in parallel bar of D80-1.5, strain gauge H2 ................................ 127
Figure 108 – Measured strain in parallel bar of D80-1.5, strain gauge H3 ................................ 128
Figure 109 – Measured strain in parallel bar of D80-1.5, strain gauge H4 ................................ 128
Figure 110 – Measured strain in parallel bar of D80-1.5, strain gauge H5 ................................ 129
Figure 111 – Measured strain in parallel bar of D80-1.5, strain gauge H6 ................................ 129
Figure 112 – Measured strain in parallel bar of D80-1.5, strain gauge H9 ................................ 130
Figure 113 – Measured strain in parallel bar of D80-1.5, strain gauge H11 .............................. 131
Figure 114 – Measured strain in parallel bar of D80-1.5, strain gauge H12 .............................. 131
Figure 115 – Measured strain in parallel bar of D80-1.5, strain gauge H13 .............................. 132
Figure 116 – Measured strain in parallel bar of D80-1.5, strain gauge H14 .............................. 132
Figure 117 – Measured strain in crosstie of D80-1.5, strain gauge T1 ....................................... 133
Figure 118 – Measured strain in crosstie of D80-1.5, strain gauge T2 ....................................... 133
Figure 119 – Measured strain in crosstie of D80-1.5, strain gauge T3 ....................................... 134

x
Figure 120 – Measured strain in crosstie of D80-1.5, strain gauge T4 ....................................... 134
Figure 121 – Measured strain in diagonal bar of D100-1.5, strain gauge D1............................. 135
Figure 122 – Measured strain in diagonal bar of D100-1.5, strain gauge D2............................. 135
Figure 123 – Measured strain in diagonal bar of D100-1.5, strain gauge D3............................. 136
Figure 124 – Measured strain in diagonal bar of D100-1.5, strain gauge D4............................. 136
Figure 125 – Measured strain in diagonal bar of D100-1.5, strain gauge D5............................. 137
Figure 126 – Measured strain in diagonal bar of D100-1.5, strain gauge D6............................. 137
Figure 127 – Measured strain in diagonal bar of D100-1.5, strain gauge D7............................. 138
Figure 128 – Measured strain in diagonal bar of D100-1.5, strain gauge D8............................. 138
Figure 129 – Measured strain in diagonal bar of D100-1.5, strain gauge D9............................. 139
Figure 130 – Measured strain in diagonal bar of D100-1.5, strain gauge D10........................... 139
Figure 131 – Measured strain in diagonal bar of D100-1.5, strain gauge D11........................... 140
Figure 132 – Measured strain in diagonal bar of D100-1.5, strain gauge D12........................... 140
Figure 133 – Measured strain in diagonal bar of D100-1.5, strain gauge D13........................... 141
Figure 134 – Measured strain in diagonal bar of D100-1.5, strain gauge D14........................... 141
Figure 135 – Measured strain in closed stirrup of D100-1.5, strain gauge S1 ........................... 142
Figure 136 – Measured strain in closed stirrup of D100-1.5, strain gauge S2 ........................... 142
Figure 137 – Measured strain in closed stirrup of D100-1.5, strain gauge S3 ........................... 143
Figure 138 – Measured strain in closed stirrup of D100-1.5, strain gauge S4 ........................... 143
Figure 139 – Measured strain in closed stirrup of D100-1.5, strain gauge S5 ........................... 144
Figure 140 – Measured strain in closed stirrup of D100-1.5, strain gauge S6 ........................... 144
Figure 141 – Measured strain in closed stirrup of D100-1.5, strain gauge S7 ........................... 145
Figure 142 – Measured strain in closed stirrup of D100-1.5, strain gauge S8 ........................... 145
Figure 143 – Measured strain in closed stirrup of D100-1.5, strain gauge S9 ........................... 146
Figure 144 – Measured strain in parallel bar of D100-1.5, strain gauge H1 .............................. 147
Figure 145 – Measured strain in parallel bar of D100-1.5, strain gauge H2 .............................. 147
Figure 146 – Measured strain in parallel bar of D100-1.5, strain gauge H3 .............................. 148
Figure 147 – Measured strain in parallel bar of D100-1.5, strain gauge H4 .............................. 148
Figure 148 – Measured strain in parallel bar of D100-1.5, strain gauge H5 .............................. 149
Figure 149 – Measured strain in parallel bar of D100-1.5, strain gauge H6 .............................. 149
Figure 150 – Measured strain in parallel bar of D100-1.5, strain gauge H7 .............................. 150

xi
Figure 151 – Measured strain in parallel bar of D100-1.5, strain gauge H8 .............................. 150
Figure 152 – Measured strain in parallel bar of D100-1.5, strain gauge H9 .............................. 151
Figure 153 – Measured strain in parallel bar of D100-1.5, strain gauge H10 ............................ 151
Figure 154 – Measured strain in parallel bar of D100-1.5, strain gauge H11 ............................ 152
Figure 155 – Measured strain in parallel bar of D100-1.5, strain gauge H12 ............................ 152
Figure 156 – Measured strain in crosstie of D100-1.5, strain gauge T1 ..................................... 153
Figure 157 – Measured strain in crosstie of D100-1.5, strain gauge T2 ..................................... 153
Figure 158 – Measured strain in crosstie of D100-1.5, strain gauge T3 ..................................... 154
Figure 159 – Measured strain in crosstie of D100-1.5, strain gauge T4 ..................................... 154
Figure 160 – Measured strain in crosstie of D100-1.5, strain gauge T5 ..................................... 155
Figure 161 – Measured strain in diagonal bar of D120-1.5, strain gauge D1............................. 156
Figure 162 – Measured strain in diagonal bar of D120-1.5, strain gauge D2............................. 156
Figure 163 – Measured strain in diagonal bar of D120-1.5, strain gauge D3............................. 157
Figure 164 – Measured strain in diagonal bar of D120-1.5, strain gauge D4............................. 157
Figure 165 – Measured strain in diagonal bar of D120-1.5, strain gauge D5............................. 158
Figure 166 – Measured strain in diagonal bar of D120-1.5, strain gauge D6............................. 158
Figure 167 – Measured strain in diagonal bar of D120-1.5, strain gauge D7............................. 159
Figure 168 – Measured strain in diagonal bar of D120-1.5, strain gauge D8............................. 159
Figure 169 – Measured strain in diagonal bar of D120-1.5, strain gauge D9............................. 160
Figure 170 – Measured strain in diagonal bar of D120-1.5, strain gauge D10........................... 160
Figure 171 – Measured strain in diagonal bar of D120-1.5, strain gauge D11........................... 161
Figure 172 – Measured strain in diagonal bar of D120-1.5, strain gauge D12........................... 161
Figure 173 – Measured strain in diagonal bar of D120-1.5, strain gauge D13........................... 162
Figure 174 – Measured strain in diagonal bar of D120-1.5, strain gauge D14........................... 162
Figure 175 – Measured strain in closed stirrup of D120-1.5, strain gauge S1 ........................... 163
Figure 176 – Measured strain in closed stirrup of D120-1.5, strain gauge S2 ........................... 163
Figure 177 – Measured strain in closed stirrup of D120-1.5, strain gauge S3 ........................... 164
Figure 178 – Measured strain in closed stirrup of D120-1.5, strain gauge S4 ........................... 164
Figure 179 – Measured strain in closed stirrup of D120-1.5, strain gauge S5 ........................... 165
Figure 180 – Measured strain in closed stirrup of D120-1.5, strain gauge S6 ........................... 165
Figure 181 – Measured strain in closed stirrup of D120-1.5, strain gauge S7 ........................... 166

xii
Figure 182 – Measured strain in closed stirrup of D120-1.5, strain gauge S8 ........................... 166
Figure 183 – Measured strain in closed stirrup of D120-1.5, strain gauge S9 ........................... 167
Figure 184 – Measured strain in parallel bar of D120-1.5, strain gauge H1 .............................. 168
Figure 185 – Measured strain in parallel bar of D120-1.5, strain gauge H2 .............................. 168
Figure 186 – Measured strain in parallel bar of D120-1.5, strain gauge H3 .............................. 169
Figure 187 – Measured strain in parallel bar of D120-1.5, strain gauge H4 .............................. 169
Figure 188 – Measured strain in parallel bar of D120-1.5, strain gauge H5 .............................. 170
Figure 189 – Measured strain in parallel bar of D120-1.5, strain gauge H6 .............................. 170
Figure 190 – Measured strain in parallel bar of D120-1.5, strain gauge H7 .............................. 171
Figure 191 – Measured strain in parallel bar of D120-1.5, strain gauge H8 .............................. 171
Figure 192 – Measured strain in parallel bar of D120-1.5, strain gauge H9 .............................. 172
Figure 193 – Measured strain in parallel bar of D120-1.5, strain gauge H10 ............................ 172
Figure 194 – Measured strain in parallel bar of D120-1.5, strain gauge H11 ............................ 173
Figure 195 – Measured strain in crosstie of D120-1.5, strain gauge T1 ..................................... 174
Figure 196 – Measured strain in crosstie of D120-1.5, strain gauge T2 ..................................... 174
Figure 197 – Measured strain in crosstie of D120-1.5, strain gauge T3 ..................................... 175
Figure 198 – Measured strain in crosstie of D120-1.5, strain gauge T4 ..................................... 175
Figure 199 – Measured strain in crosstie of D120-1.5, strain gauge T5 ..................................... 176
Figure 200 – Measured strain in crosstie of D120-1.5, strain gauge T6 ..................................... 176
Figure 201 – Measured strain in diagonal bar of D80-2.5, strain gauge D1............................... 177
Figure 202 – Measured strain in diagonal bar of D80-2.5, strain gauge D2............................... 177
Figure 203 – Measured strain in diagonal bar of D80-2.5, strain gauge D3............................... 178
Figure 204 – Measured strain in diagonal bar of D80-2.5, strain gauge D4............................... 178
Figure 205 – Measured strain in diagonal bar of D80-2.5, strain gauge D5............................... 179
Figure 206 – Measured strain in diagonal bar of D80-2.5, strain gauge D6............................... 179
Figure 207 – Measured strain in diagonal bar of D80-2.5, strain gauge D7............................... 180
Figure 208 – Measured strain in diagonal bar of D80-2.5, strain gauge D8............................... 180
Figure 209 – Measured strain in diagonal bar of D80-2.5, strain gauge D9............................... 181
Figure 210 – Measured strain in diagonal bar of D80-2.5, strain gauge D10............................. 181
Figure 211 – Measured strain in diagonal bar of D80-2.5, strain gauge D11............................. 182
Figure 212 – Measured strain in diagonal bar of D80-2.5, strain gauge D12............................. 182

xiii
Figure 213 – Measured strain in diagonal bar of D80-2.5, strain gauge D13............................. 183
Figure 214 – Measured strain in diagonal bar of D80-2.5, strain gauge D14............................. 183
Figure 215 – Measured strain in closed stirrup of D80-2.5, strain gauge S1 ............................. 184
Figure 216 – Measured strain in closed stirrup of D80-2.5, strain gauge S2 ............................. 184
Figure 217 – Measured strain in closed stirrup of D80-2.5, strain gauge S3 ............................. 185
Figure 218 – Measured strain in closed stirrup of D80-2.5, strain gauge S4 ............................. 185
Figure 219 – Measured strain in closed stirrup of D80-2.5, strain gauge S5 ............................. 186
Figure 220 – Measured strain in closed stirrup of D80-2.5, strain gauge S6 ............................. 186
Figure 221 – Measured strain in closed stirrup of D80-2.5, strain gauge S7 ............................. 187
Figure 222 – Measured strain in closed stirrup of D80-2.5, strain gauge S8 ............................. 187
Figure 223 – Measured strain in closed stirrup of D80-2.5, strain gauge S9 ............................. 188
Figure 224 – Measured strain in parallel bar of D80-2.5, strain gauge H1 ................................ 189
Figure 225 – Measured strain in parallel bar of D80-2.5, strain gauge H2 ................................ 189
Figure 226 – Measured strain in parallel bar of D80-2.5, strain gauge H3 ................................ 190
Figure 227 – Measured strain in parallel bar of D80-2.5, strain gauge H4 ................................ 190
Figure 228 – Measured strain in parallel bar of D80-2.5, strain gauge H5 ................................ 191
Figure 229 – Measured strain in crosstie of D80-2.5, strain gauge T1 ....................................... 192
Figure 230 – Measured strain in crosstie of D80-2.5, strain gauge T2 ....................................... 192
Figure 231 – Measured strain in crosstie of D80-2.5, strain gauge T3 ....................................... 193
Figure 232 – Measured strain in diagonal bar of D100-2.5, strain gauge D1............................. 194
Figure 233 – Measured strain in diagonal bar of D100-2.5, strain gauge D2............................. 194
Figure 234 – Measured strain in diagonal bar of D100-2.5, strain gauge D3............................. 195
Figure 235 – Measured strain in diagonal bar of D100-2.5, strain gauge D4............................. 195
Figure 236 – Measured strain in diagonal bar of D100-2.5, strain gauge D5............................. 196
Figure 237 – Measured strain in diagonal bar of D100-2.5, strain gauge D6............................. 196
Figure 238 – Measured strain in diagonal bar of D100-2.5, strain gauge D7............................. 197
Figure 239 – Measured strain in diagonal bar of D100-2.5, strain gauge D8............................. 197
Figure 240 – Measured strain in diagonal bar of D100-2.5, strain gauge D9............................. 198
Figure 241 – Measured strain in diagonal bar of D100-2.5, strain gauge D10........................... 198
Figure 242 – Measured strain in diagonal bar of D100-2.5, strain gauge D11........................... 199
Figure 243 – Measured strain in diagonal bar of D100-2.5, strain gauge D12........................... 199

xiv
Figure 244 – Measured strain in diagonal bar of D100-2.5, strain gauge D13........................... 200
Figure 245 – Measured strain in diagonal bar of D100-2.5, strain gauge D14........................... 200
Figure 246 – Measured strain in closed stirrup of D100-2.5, strain gauge S1 ........................... 201
Figure 247 – Measured strain in closed stirrup of D100-2.5, strain gauge S2 ........................... 201
Figure 248 – Measured strain in closed stirrup of D100-2.5, strain gauge S3 ........................... 202
Figure 249 – Measured strain in closed stirrup of D100-2.5, strain gauge S4 ........................... 202
Figure 250 – Measured strain in closed stirrup of D100-2.5, strain gauge S5 ........................... 203
Figure 251 – Measured strain in closed stirrup of D100-2.5, strain gauge S6 ........................... 203
Figure 252 – Measured strain in closed stirrup of D100-2.5, strain gauge S7 ........................... 204
Figure 253 – Measured strain in closed stirrup of D100-2.5, strain gauge S8 ........................... 204
Figure 254 – Measured strain in closed stirrup of D100-2.5, strain gauge S9 ........................... 205
Figure 255 – Measured strain in parallel bar of D100-2.5, strain gauge H1 .............................. 206
Figure 256 – Measured strain in parallel bar of D100-2.5, strain gauge H2 .............................. 206
Figure 257 – Measured strain in parallel bar of D100-2.5, strain gauge H3 .............................. 207
Figure 258 – Measured strain in parallel bar of D100-2.5, strain gauge H4 .............................. 207
Figure 259 – Measured strain in parallel bar of D100-2.5, strain gauge H5 .............................. 208
Figure 260 – Measured strain in parallel bar of D100-2.5, strain gauge H6 .............................. 208
Figure 261 – Measured strain in crosstie of D100-2.5, strain gauge T1 ..................................... 209
Figure 262 – Measured strain in crosstie of D100-2.5, strain gauge T2 ..................................... 209
Figure 263 – Measured strain in crosstie of D100-2.5, strain gauge T3 ..................................... 210
Figure 264 – Measured strain in diagonal bar of D120-2.5, strain gauge D1............................. 211
Figure 265 – Measured strain in diagonal bar of D120-2.5, strain gauge D2............................. 211
Figure 266 – Measured strain in diagonal bar of D120-2.5, strain gauge D3............................. 212
Figure 267 – Measured strain in diagonal bar of D120-2.5, strain gauge D4............................. 212
Figure 268 – Measured strain in diagonal bar of D120-2.5, strain gauge D5............................. 213
Figure 269 – Measured strain in diagonal bar of D120-2.5, strain gauge D6............................. 213
Figure 270 – Measured strain in diagonal bar of D120-2.5, strain gauge D7............................. 214
Figure 271 – Measured strain in diagonal bar of D120-2.5, strain gauge D8............................. 214
Figure 272 – Measured strain in diagonal bar of D120-2.5, strain gauge D9............................. 215
Figure 273 – Measured strain in diagonal bar of D120-2.5, strain gauge D10........................... 215
Figure 274 – Measured strain in diagonal bar of D120-2.5, strain gauge D11........................... 216

xv
Figure 275 – Measured strain in diagonal bar of D120-2.5, strain gauge D12........................... 216
Figure 276 – Measured strain in diagonal bar of D120-2.5, strain gauge D13........................... 217
Figure 277 – Measured strain in diagonal bar of D120-2.5, strain gauge D14........................... 217
Figure 278 – Measured strain in closed stirrup of D120-2.5, strain gauge S1 ........................... 218
Figure 279 – Measured strain in closed stirrup of D120-2.5, strain gauge S2 ........................... 218
Figure 280 – Measured strain in closed stirrup of D120-2.5, strain gauge S3 ........................... 219
Figure 281 – Measured strain in closed stirrup of D120-2.5, strain gauge S4 ........................... 219
Figure 282 – Measured strain in closed stirrup of D120-2.5, strain gauge S5 ........................... 220
Figure 283 – Measured strain in closed stirrup of D120-2.5, strain gauge S6 ........................... 220
Figure 284 – Measured strain in closed stirrup of D120-2.5, strain gauge S7 ........................... 221
Figure 285 – Measured strain in closed stirrup of D120-2.5, strain gauge S8 ........................... 221
Figure 286 – Measured strain in closed stirrup of D120-2.5, strain gauge S9 ........................... 222
Figure 287 – Measured strain in closed stirrup of D120-2.5, strain gauge S10 ......................... 222
Figure 288 – Measured strain in closed stirrup of D120-2.5, strain gauge S11 ......................... 223
Figure 289 – Measured strain in closed stirrup of D120-2.5, strain gauge S12 ......................... 223
Figure 290 – Measured strain in closed stirrup of D120-2.5, strain gauge S13 ......................... 224
Figure 291 – Measured strain in closed stirrup of D120-2.5, strain gauge S14 ......................... 224
Figure 292 – Measured strain in closed stirrup of D120-2.5, strain gauge S15 ......................... 225
Figure 293 – Measured strain in closed stirrup of D120-2.5, strain gauge S16 ......................... 225
Figure 294 – Measured strain in closed stirrup of D120-2.5, strain gauge S17 ......................... 226
Figure 295 – Measured strain in closed stirrup of D120-2.5, strain gauge S18 ......................... 226
Figure 296 – Measured strain in parallel bar of D120-2.5, strain gauge H1 .............................. 227
Figure 297 – Measured strain in parallel bar of D120-2.5, strain gauge H2 .............................. 227
Figure 298 – Measured strain in parallel bar of D120-2.5, strain gauge H3 .............................. 228
Figure 299 – Measured strain in parallel bar of D120-2.5, strain gauge H4 .............................. 228
Figure 300 – Measured strain in parallel bar of D120-2.5, strain gauge H5 .............................. 229
Figure 301 – Measured strain in parallel bar of D120-2.5, strain gauge H6 .............................. 229
Figure 302 – Measured strain in crosstie of D120-2.5, strain gauge T1 ..................................... 230
Figure 303 – Measured strain in crosstie of D120-2.5, strain gauge T2 ..................................... 230
Figure 304 – Measured strain in crosstie of D120-2.5, strain gauge T3 ..................................... 231
Figure 305 – Measured strain in diagonal bar of D80-3.5, strain gauge D1............................... 232

xvi
Figure 306 – Measured strain in diagonal bar of D80-3.5, strain gauge D2............................... 232
Figure 307 – Measured strain in diagonal bar of D80-3.5, strain gauge D3............................... 233
Figure 308 – Measured strain in diagonal bar of D80-3.5, strain gauge D4............................... 233
Figure 309 – Measured strain in diagonal bar of D80-3.5, strain gauge D5............................... 234
Figure 310 – Measured strain in diagonal bar of D80-3.5, strain gauge D6............................... 234
Figure 311 – Measured strain in diagonal bar of D80-3.5, strain gauge D7............................... 235
Figure 312 – Measured strain in diagonal bar of D80-3.5, strain gauge D8............................... 235
Figure 313 – Measured strain in diagonal bar of D80-3.5, strain gauge D9............................... 236
Figure 314 – Measured strain in diagonal bar of D80-3.5, strain gauge D10............................. 236
Figure 315 – Measured strain in diagonal bar of D80-3.5, strain gauge D11............................. 237
Figure 316 – Measured strain in diagonal bar of D80-3.5, strain gauge D12............................. 237
Figure 317 – Measured strain in diagonal bar of D80-3.5, strain gauge D13............................. 238
Figure 318 – Measured strain in diagonal bar of D80-3.5, strain gauge D14............................. 238
Figure 319 – Measured strain in closed stirrup of D80-3.5, strain gauge S1 ............................. 239
Figure 320 – Measured strain in closed stirrup of D80-3.5, strain gauge S2 ............................. 239
Figure 321 – Measured strain in closed stirrup of D80-3.5, strain gauge S3 ............................. 240
Figure 322 – Measured strain in closed stirrup of D80-3.5, strain gauge S4 ............................. 240
Figure 323 – Measured strain in closed stirrup of D80-3.5, strain gauge S5 ............................. 241
Figure 324 – Measured strain in closed stirrup of D80-3.5, strain gauge S6 ............................. 241
Figure 325 – Measured strain in closed stirrup of D80-3.5, strain gauge S7 ............................. 242
Figure 326 – Measured strain in closed stirrup of D80-3.5, strain gauge S8 ............................. 242
Figure 327 – Measured strain in closed stirrup of D80-3.5, strain gauge S9 ............................. 243
Figure 328 – Measured strain in parallel bar of D80-3.5, strain gauge H1 ................................ 244
Figure 329 – Measured strain in parallel bar of D80-3.5, strain gauge H2 ................................ 244
Figure 330 – Measured strain in parallel bar of D80-3.5, strain gauge H3 ................................ 245
Figure 331 – Measured strain in parallel bar of D80-3.5, strain gauge H4 ................................ 245
Figure 332 – Measured strain in parallel bar of D80-3.5, strain gauge H5 ................................ 246
Figure 333 – Measured strain in parallel bar of D80-3.5, strain gauge H6 ................................ 246
Figure 334 – Measured strain in parallel bar of D80-3.5, strain gauge H7 ................................ 247
Figure 335 – Measured strain in parallel bar of D80-3.5, strain gauge H8 ................................ 247
Figure 336 – Measured strain in crosstie of D80-3.5, strain gauge T1 ....................................... 248

xvii
Figure 337 – Measured strain in crosstie of D80-3.5, strain gauge T2 ....................................... 248
Figure 338 – Measured strain in crosstie of D80-3.5, strain gauge T3 ....................................... 249
Figure 339 – Measured strain in diagonal bar of D100-3.5, strain gauge D1............................. 250
Figure 340 – Measured strain in diagonal bar of D100-3.5, strain gauge D2............................. 250
Figure 341 – Measured strain in diagonal bar of D100-3.5, strain gauge D3............................. 251
Figure 342 – Measured strain in diagonal bar of D100-3.5, strain gauge D4............................. 251
Figure 343 – Measured strain in diagonal bar of D100-3.5, strain gauge D5............................. 252
Figure 344 – Measured strain in diagonal bar of D100-3.5, strain gauge D6............................. 252
Figure 345 – Measured strain in diagonal bar of D100-3.5, strain gauge D7............................. 253
Figure 346 – Measured strain in diagonal bar of D100-3.5, strain gauge D8............................. 253
Figure 347 – Measured strain in diagonal bar of D100-3.5, strain gauge D9............................. 254
Figure 348 – Measured strain in diagonal bar of D100-3.5, strain gauge D10........................... 254
Figure 349 – Measured strain in diagonal bar of D100-3.5, strain gauge D11........................... 255
Figure 350 – Measured strain in diagonal bar of D100-3.5, strain gauge D12........................... 255
Figure 351 – Measured strain in diagonal bar of D100-3.5, strain gauge D13........................... 256
Figure 352 – Measured strain in diagonal bar of D100-3.5, strain gauge D14........................... 256
Figure 353 – Measured strain in closed stirrup of D100-3.5, strain gauge S1 ........................... 257
Figure 354 – Measured strain in closed stirrup of D100-3.5, strain gauge S2 ........................... 257
Figure 355 – Measured strain in closed stirrup of D100-3.5, strain gauge S3 ........................... 258
Figure 356 – Measured strain in closed stirrup of D100-3.5, strain gauge S4 ........................... 258
Figure 357 – Measured strain in closed stirrup of D100-3.5, strain gauge S5 ........................... 259
Figure 358 – Measured strain in closed stirrup of D100-3.5, strain gauge S6 ........................... 259
Figure 359 – Measured strain in closed stirrup of D100-3.5, strain gauge S7 ........................... 260
Figure 360 – Measured strain in closed stirrup of D100-3.5, strain gauge S8 ........................... 260
Figure 361 – Measured strain in closed stirrup of D100-3.5, strain gauge S9 ........................... 261
Figure 362 – Measured strain in parallel bar of D100-3.5, strain gauge H1 .............................. 262
Figure 363 – Measured strain in parallel bar of D100-3.5, strain gauge H2 .............................. 262
Figure 364 – Measured strain in parallel bar of D100-3.5, strain gauge H3 .............................. 263
Figure 365 – Measured strain in parallel bar of D100-3.5, strain gauge H4 .............................. 263
Figure 366 – Measured strain in parallel bar of D100-3.5, strain gauge H5 .............................. 264
Figure 367 – Measured strain in parallel bar of D100-3.5, strain gauge H6 .............................. 264

xviii
Figure 368 – Measured strain in parallel bar of D100-3.5, strain gauge H7 .............................. 265
Figure 369 – Measured strain in crosstie of D100-3.5, strain gauge T1 ..................................... 266
Figure 370 – Measured strain in crosstie of D100-3.5, strain gauge T2 ..................................... 266
Figure 371 – Measured strain in crosstie of D100-3.5, strain gauge T3 ..................................... 267
Figure 372 – Measured strain in diagonal bar of D120-3.5, strain gauge D1............................. 268
Figure 373 – Measured strain in diagonal bar of D120-3.5, strain gauge D2............................. 268
Figure 374 – Measured strain in diagonal bar of D120-3.5, strain gauge D3............................. 269
Figure 375 – Measured strain in diagonal bar of D120-3.5, strain gauge D4............................. 269
Figure 376 – Measured strain in diagonal bar of D120-3.5, strain gauge D5............................. 270
Figure 377 – Measured strain in diagonal bar of D120-3.5, strain gauge D6............................. 270
Figure 378 – Measured strain in diagonal bar of D120-3.5, strain gauge D7............................. 271
Figure 379 – Measured strain in diagonal bar of D120-3.5, strain gauge D8............................. 271
Figure 380 – Measured strain in diagonal bar of D120-3.5, strain gauge D9............................. 272
Figure 381 – Measured strain in diagonal bar of D120-3.5, strain gauge D10........................... 272
Figure 382 – Measured strain in diagonal bar of D120-3.5, strain gauge D11........................... 273
Figure 383 – Measured strain in diagonal bar of D120-3.5, strain gauge D12........................... 273
Figure 384 – Measured strain in diagonal bar of D120-3.5, strain gauge D13........................... 274
Figure 385 – Measured strain in diagonal bar of D120-3.5, strain gauge D14........................... 274
Figure 386 – Measured strain in closed stirrup of D120-3.5, strain gauge S1 ........................... 275
Figure 387 – Measured strain in closed stirrup of D120-3.5, strain gauge S2 ........................... 275
Figure 388 – Measured strain in closed stirrup of D120-3.5, strain gauge S3 ........................... 276
Figure 389 – Measured strain in closed stirrup of D120-3.5, strain gauge S4 ........................... 276
Figure 390 – Measured strain in closed stirrup of D120-3.5, strain gauge S5 ........................... 277
Figure 391 – Measured strain in closed stirrup of D120-3.5, strain gauge S6 ........................... 277
Figure 392 – Measured strain in closed stirrup of D120-3.5, strain gauge S7 ........................... 278
Figure 393 – Measured strain in closed stirrup of D120-3.5, strain gauge S8 ........................... 278
Figure 394 – Measured strain in closed stirrup of D120-3.5, strain gauge S9 ........................... 279
Figure 395 – Measured strain in parallel bar of D120-3.5, strain gauge H1 .............................. 280
Figure 396 – Measured strain in parallel bar of D120-3.5, strain gauge H2 .............................. 280
Figure 397 – Measured strain in parallel bar of D120-3.5, strain gauge H3 .............................. 281
Figure 398 – Measured strain in parallel bar of D120-3.5, strain gauge H4 .............................. 281

xix
Figure 399 – Measured strain in parallel bar of D120-3.5, strain gauge H5 .............................. 282
Figure 400 – Measured strain in crosstie of D120-3.5, strain gauge T1 ..................................... 283
Figure 401 – Measured strain in crosstie of D120-3.5, strain gauge T2 ..................................... 283
Figure 402 – Measured strain in crosstie of D120-3.5, strain gauge T3 ..................................... 284
Figure 403 – Measured strain in parallel bar of P80-2.5, strain gauge P1 .................................. 285
Figure 404 – Measured strain in parallel bar of P80-2.5, strain gauge P2 .................................. 285
Figure 405 – Measured strain in parallel bar of P80-2.5, strain gauge P3 .................................. 286
Figure 406 – Measured strain in parallel bar of P80-2.5, strain gauge P4 .................................. 286
Figure 407 – Measured strain in parallel bar of P80-2.5, strain gauge P5 .................................. 287
Figure 408 – Measured strain in parallel bar of P80-2.5, strain gauge P6 .................................. 287
Figure 409 – Measured strain in parallel bar of P80-2.5, strain gauge P7 .................................. 288
Figure 410 – Measured strain in parallel bar of P80-2.5, strain gauge P8 .................................. 288
Figure 411 – Measured strain in parallel bar of P80-2.5, strain gauge P9 .................................. 289
Figure 412 – Measured strain in parallel bar of P80-2.5, strain gauge P10 ................................ 289
Figure 413 – Measured strain in parallel bar of P80-2.5, strain gauge P11 ................................ 290
Figure 414 – Measured strain in parallel bar of P80-2.5, strain gauge P12 ................................ 290
Figure 415 – Measured strain in closed stirrup of P80-2.5, strain gauge S1 .............................. 291
Figure 416 – Measured strain in closed stirrup of P80-2.5, strain gauge S2 .............................. 291
Figure 417 – Measured strain in closed stirrup of P80-2.5, strain gauge S3 .............................. 292
Figure 418 – Measured strain in closed stirrup of P80-2.5, strain gauge S4 .............................. 292
Figure 419 – Measured strain in closed stirrup of P80-2.5, strain gauge S5 .............................. 293
Figure 420 – Measured strain in closed stirrup of P80-2.5, strain gauge S6 .............................. 293
Figure 421 – Measured strain in closed stirrup of P80-2.5, strain gauge S7 .............................. 294
Figure 422 – Measured strain in closed stirrup of P80-2.5, strain gauge S8 .............................. 294
Figure 423 – Measured strain in closed stirrup of P80-2.5, strain gauge S9 .............................. 295
Figure 424 – Measured strain in crosstie of P80-2.5, strain gauge T1 ....................................... 296
Figure 425 – Measured strain in parallel bar of P100-2.5, strain gauge P1 ................................ 297
Figure 426 – Measured strain in parallel bar of P100-2.5, strain gauge P2 ................................ 297
Figure 427 – Measured strain in parallel bar of P100-2.5, strain gauge P3 ................................ 298
Figure 428 – Measured strain in parallel bar of P100-2.5, strain gauge P4 ................................ 298
Figure 429 – Measured strain in parallel bar of P100-2.5, strain gauge P5 ................................ 299

xx
Figure 430 – Measured strain in parallel bar of P100-2.5, strain gauge P6 ................................ 299
Figure 431 – Measured strain in parallel bar of P100-2.5, strain gauge P7 ................................ 300
Figure 432 – Measured strain in parallel bar of P100-2.5, strain gauge P8 ................................ 300
Figure 433 – Measured strain in parallel bar of P100-2.5, strain gauge P9 ................................ 301
Figure 434 – Measured strain in parallel bar of P100-2.5, strain gauge P10 .............................. 301
Figure 435 – Measured strain in parallel bar of P100-2.5, strain gauge P11 .............................. 302
Figure 436 – Measured strain in parallel bar of P100-2.5, strain gauge P12 .............................. 302
Figure 437 – Measured strain in closed stirrup of P100-2.5, strain gauge S1 ............................ 303
Figure 438 – Measured strain in closed stirrup of P100-2.5, strain gauge S2 ............................ 303
Figure 439 – Measured strain in closed stirrup of P100-2.5, strain gauge S3 ............................ 304
Figure 440 – Measured strain in closed stirrup of P100-2.5, strain gauge S4 ............................ 304
Figure 441 – Measured strain in closed stirrup of P100-2.5, strain gauge S5 ............................ 305
Figure 442 – Measured strain in closed stirrup of P100-2.5, strain gauge S6 ............................ 305
Figure 443 – Measured strain in closed stirrup of P100-2.5, strain gauge S7 ............................ 306
Figure 444 – Measured strain in closed stirrup of P100-2.5, strain gauge S8 ............................ 306
Figure 445 – Measured strain in closed stirrup of P100-2.5, strain gauge S9 ............................ 307
Figure 446 – Measured strain in crosstie of P100-2.5, strain gauge T1 ..................................... 308
Figure 447 – Envelopes of measured strains in diagonal bars of D80-1.5, D strain gauges ...... 309
Figure 448 – Envelopes of measured strains in closed stirrups of D80-1.5, S strain gauges ..... 309
Figure 449 – Envelopes of measured strains in parallel bars of D80-1.5, H strain gauges ........ 310
Figure 450 – Envelopes of measured strains in crossties of D80-1.5, T strain gauges .............. 310
Figure 451 – Envelopes of measured strains in diagonal bars of D100-1.5, D strain gauges .... 311
Figure 452 – Envelopes of measured strains in closed stirrups of D100-1.5, S strain gauges ... 311
Figure 453 – Envelopes of measured strains in parallel bars of D100-1.5, H strain gauges ...... 312
Figure 454 – Envelopes of measured strains in crossties of D100-1.5, T strain gauges ............ 312
Figure 455 – Envelopes of measured strains in diagonal bars of D120-1.5, D strain gauges .... 313
Figure 456 – Envelopes of measured strains in closed stirrups of D120-1.5, S strain gauges ... 313
Figure 457 – Envelopes of measured strains in parallel bars of D120-1.5, H strain gauges ...... 314
Figure 458 – Envelopes of measured strains in crossties of D120-1.5, T strain gauges ............ 314
Figure 459 – Envelopes of measured strains in diagonal bars of D80-2.5, D strain gauges ...... 315
Figure 460 – Envelopes of measured strains in closed stirrups of D80-2.5, S strain gauges ..... 315

xxi
Figure 461 – Envelopes of measured strains in parallel bars of D80-2.5, H strain gauges ........ 316
Figure 462 – Envelopes of measured strains in crossties of D80-2.5, T strain gauges .............. 316
Figure 463 – Envelopes of measured strains in diagonal bars of D100-2.5, D strain gauges .... 317
Figure 464 – Envelopes of measured strains in closed stirrups of D100-2.5, S strain gauges ... 317
Figure 465 – Envelopes of measured strains in parallel bars of D100-2.5, H strain gauges ...... 318
Figure 466 – Envelopes of measured strains in crossties of D100-2.5, T strain gauges ............ 318
Figure 467 – Envelopes of measured strains in diagonal bars of D120-2.5, D strain gauges .... 319
Figure 468 – Envelopes of measured strains in closed stirrups of D120-2.5, S strain gauges ... 319
Figure 469 – Envelopes of measured strains in parallel bars of D120-2.5, H strain gauges ...... 320
Figure 470 – Envelopes of measured strains in crossties of D120-2.5, T strain gauges ............ 320
Figure 471 – Envelopes of measured strains in diagonal bars of D80-3.5, D strain gauges ...... 321
Figure 472 – Envelopes of measured strains in closed stirrups of D80-3.5, S strain gauges ..... 321
Figure 473 – Envelopes of measured strains in parallel bars of D80-3.5, H strain gauges ........ 322
Figure 474 – Envelopes of measured strains in crossties of D80-3.5, T strain gauges .............. 322
Figure 475 – Envelopes of measured strains in diagonal bars of D100-3.5, D strain gauges .... 323
Figure 476 – Envelopes of measured strains in closed stirrups of D100-3.5, S strain gauges ... 323
Figure 477 – Envelopes of measured strains in parallel bars of D100-3.5, H strain gauges ...... 324
Figure 478 – Envelopes of measured strains in crossties of D100-3.5, T strain gauges ............ 324
Figure 479 – Envelopes of measured strains in diagonal bars of D120-3.5, D strain gauges .... 325
Figure 480 – Envelopes of measured strains in closed stirrups of D120-3.5, S strain gauges ... 325
Figure 481 – Envelopes of measured strains in parallel bars of D120-3.5, H strain gauges ...... 326
Figure 482 – Envelopes of measured strains in crossties of D120-3.5, T strain gauges ............ 326
Figure 483 – Envelopes of measured strains in parallel bars of P80-2.5, P strain gauges ......... 327
Figure 484 – Envelopes of measured strains in closed stirrups of P80-2.5, S strain gauges ...... 327
Figure 485 – Envelopes of measured strains in crossties of P80-2.5, T strain gauges ............... 328
Figure 486 – Envelopes of measured strains in parallel bars of P100-2.5, P strain gauges ....... 329
Figure 487 – Envelopes of measured strains in closed stirrups of P100-2.5, S strain gauges .... 329
Figure 488 – Envelopes of measured strains in crossties of P100-2.5, T strain gauges ............. 330
Figure 489 – Envelopes of measured strains in diagonal bars of D-type beams
with an aspect ratio of 1.5, D strain gauges ......................................................................... 331

xxii
Figure 490 – Envelopes of measured strains in closed stirrups of D-type beams
with an aspect ratio of 1.5, S strain gauges ......................................................................... 331
Figure 491 – Envelopes of measured strains in parallel bars of D-type beams
with an aspect ratio of 1.5, H strain gauges ......................................................................... 332
Figure 492 – Envelopes of measured strains in crossties of D-type beams
with an aspect ratio of 1.5, T strain gauges ......................................................................... 332
Figure 493 – Envelopes of measured strains in diagonal bars of D-type beams
with an aspect ratio of 2.5, D strain gauges ......................................................................... 333
Figure 494 – Envelopes of measured strains in closed stirrups of D-type beams
with an aspect ratio of 2.5, S strain gauges ......................................................................... 333
Figure 495 – Envelopes of measured strains in parallel bars of D-type beams
with an aspect ratio of 2.5, H strain gauges ......................................................................... 334
Figure 496 – Envelopes of measured strains in crossties of D-type beams
with an aspect ratio of 2.5, T strain gauges ......................................................................... 334
Figure 497 – Envelopes of measured strains in diagonal bars of D-type beams
with an aspect ratio of 3.5, D strain gauges ......................................................................... 335
Figure 498 – Envelopes of measured strains in closed stirrups of D-type beams
with an aspect ratio of 3.5, S strain gauges ......................................................................... 335
Figure 499 – Envelopes of measured strains in parallel bars of D-type beams
with an aspect ratio of 3.5, H strain gauges ......................................................................... 336
Figure 500 – Envelopes of measured strains in crossties of D-type beams
with an aspect ratio of 3.5, T strain gauges ......................................................................... 336
Figure 501 – Envelopes of measured strains in parallel bars of P-type beams
with an aspect ratio of 2.5, P strain gauges ......................................................................... 337
Figure 502 – Envelopes of measured strains in closed stirrups of P-type beams
with an aspect ratio of 2.5, S strain gauges ......................................................................... 337
Figure 503 – Envelopes of measured strains in crossties of P-type beams
with aspect ratio of 2.5, T strain gauges .............................................................................. 338
Figure 504 – Maximum strains in D-type beams during loading steps 5 through 9
(1% through 4% chord rotation), D strain gauges ............................................................... 339

xxiii
Figure 505 – Maximum strains in P-type beams during loading steps 5 through 9
(1% through 4% chord rotation), P strain gauges................................................................ 339
Figure B.1 – Coupling beam reinforcement, D120-1.5 ............................................................. B–2
Figure B.2 – Coupling beam reinforcement, D120-2.5 .............................................................. B–2
Figure B.3 – Coupling beam reinforcement, D120-3.5 .............................................................. B–3
Figure B.4 – Coupling beam reinforcement, P100-2.5 ............................................................... B–3
Figure B.5 – Base block reinforcement, typical of beams with aspect ratios of 2.5 and 3.5 ...... B–4
Figure B.6 –Top block reinforcement, typical of beams with aspect ratios of 2.5 and 3.5 ........ B–4
Figure B.7 – Specimens before casting,
D80-1.5, D100-1.5, and D120-1.5 (from left to right) ........................................................ B–5
Figure B.8 – Specimens after formwork removal,
D100-3.5, D80-3.5, P100-2.5, P80-2.5, D100-2.5, and D80-2.5 (from left to right) .......... B–5
Figure C.1 – D80-1.5 during second cycle to 2% chord rotation ............................................... C–2
Figure C.2 – D80-1.5 during second cycle to 6% chord rotation ............................................... C–3
Figure C.3 – D80-1.5 at +2% chord rotation, second cycle ........................................................ C–4
Figure C.4 – D80-1.5 at -2% chord rotation, second cycle......................................................... C–4
Figure C.5 – D80-1.5 at +4% chord rotation, second cycle ........................................................ C–4
Figure C.6 – D80-1.5 at -4% chord rotation, second cycle......................................................... C–4
Figure C.7 – D80-1.5 at +6% chord rotation, second cycle ........................................................ C–5
Figure C.8 – D80-1.5 at -6% chord rotation, second cycle......................................................... C–5
Figure C.9 – D80-1.5 at +8% chord rotation, first cycle ............................................................ C–5
Figure C.10 – D80-1.5 at -8% chord rotation, first cycle ........................................................... C–5
Figure C.11 – D100-1.5 during second cycle to 2% chord rotation ........................................... C–6
Figure C.12 – D100-1.5 during second cycle to 6% chord rotation ........................................... C–7
Figure C.13 – D100-1.5 at +2% chord rotation, second cycle .................................................... C–8
Figure C.14 – D100-1.5 at -2% chord rotation, second cycle ..................................................... C–8
Figure C.15 – D100-1.5 at +4% chord rotation, second cycle .................................................... C–8
Figure C.16 – D100-1.5 at -4% chord rotation, second cycle ..................................................... C–8
Figure C.17 – D100-1.5 at +6% chord rotation, second cycle .................................................... C–9
Figure C.18 – D100-1.5 at -6% chord rotation, second cycle ..................................................... C–9
Figure C.19 – D100-1.5 at +8% chord rotation, first cycle ........................................................ C–9

xxiv
Figure C.20 – D120-1.5 during second cycle to 2% chord rotation ......................................... C–10
Figure C.21 – D120-1.5 during first cycle to 6% chord rotation .............................................. C–11
Figure C.22 – D120-1.5 at +2% chord rotation, second cycle .................................................. C–12
Figure C.23 – D120-1.5 at -2% chord rotation, second cycle ................................................... C–12
Figure C.24 – D120-1.5 at +4% chord rotation, second cycle .................................................. C–12
Figure C.25 – D120-1.5 at -4% chord rotation, second cycle ................................................... C–12
Figure C.26 – D120-1.5 at +6% chord rotation, first cycle ...................................................... C–13
Figure C.27 – D120-1.5 at -6% chord rotation, first cycle ....................................................... C–13
Figure C.28 – D80-2.5 during second cycle to 2% chord rotation ........................................... C–14
Figure C.29 – D80-2.5 during second cycle to 6% chord rotation ........................................... C–15
Figure C.30 – D80-2.5 at +2% chord rotation, second cycle .................................................... C–16
Figure C.31 – D80-2.5 at -2% chord rotation, second cycle..................................................... C–16
Figure C.32 – D80-2.5 at +4% chord rotation, second cycle .................................................... C–16
Figure C.33 – D80-2.5 at -4% chord rotation, second cycle..................................................... C–16
Figure C.34 – D80-2.5 at +6% chord rotation, second cycle .................................................... C–17
Figure C.35 – D80-2.5 at -6% chord rotation, second cycle..................................................... C–17
Figure C.36 – D80-2.5 at +8% chord rotation, second cycle .................................................... C–17
Figure C.37 – D80-2.5 at -8% chord rotation, second cycle..................................................... C–17
Figure C.38 – D80-2.5 at +10% chord rotation, first cycle ...................................................... C–18
Figure C.39 – D80-2.5 at -10% chord rotation, first cycle ......................................................... C–18
Figure C.40 – D100-2.5 during second cycle to 2% chord rotation ......................................... C–19
Figure C.41 – D100-2.5 during second cycle to 6% chord rotation ......................................... C–20
Figure C.42 – D100-2.5 at +2% chord rotation, second cycle .................................................. C–21
Figure C.43 – D100-2.5 at -2% chord rotation, second cycle ................................................... C–21
Figure C.44 – D100-2.5 at +4% chord rotation, second cycle .................................................. C–21
Figure C.45 – D100-2.5 at -4% chord rotation, second cycle ................................................... C–21
Figure C.46 – D100-2.5 at +6% chord rotation, second cycle .................................................. C–22
Figure C.47 – D100-2.5 at -6% chord rotation, second cycle ................................................... C–22
Figure C.48 – D100-2.5 at +8% chord rotation, first cycle ...................................................... C–22
Figure C.49 – D100-2.5 at -8% chord rotation, first cycle ....................................................... C–22
Figure C.50 – D120-2.5 during second cycle to 2% chord rotation ......................................... C–23

xxv
Figure C.51 – D120-2.5 during second cycle to 6% chord rotation ......................................... C–24
Figure C.52 – D120-2.5 at +2% chord rotation, second cycle .................................................. C–25
Figure C.53 – D120-2.5 at -2% chord rotation, second cycle ................................................... C–25
Figure C.54 – D120-2.5 at +4% chord rotation, second cycle .................................................. C–25
Figure C.55 – D120-2.5 at -4% chord rotation, second cycle ................................................... C–25
Figure C.56 – D120-2.5 at +6% chord rotation, second cycle .................................................. C–26
Figure C.57 – D120-2.5 at -6% chord rotation, second cycle ................................................... C–26
Figure C.58 – D120-2.5 at +8% chord rotation, second cycle .................................................. C–26
Figure C.59 – D120-2.5 at -8% chord rotation, second cycle ................................................... C–26
Figure C.60 – D80-3.5 during second cycle to 2% chord rotation ........................................... C–27
Figure C.61 – D80-3.5 during second cycle to 6% chord rotation ........................................... C–29
Figure C.62 – D80-3.5 at +2% chord rotation, second cycle .................................................... C–30
Figure C.63 – D80-3.5 at -2% chord rotation, second cycle..................................................... C–30
Figure C.64 – D80-3.5 at +4% chord rotation, second cycle .................................................... C–30
Figure C.65 – D80-3.5 at -4% chord rotation, second cycle..................................................... C–30
Figure C.66 – D80-3.5 at +6% chord rotation, second cycle .................................................... C–31
Figure C.67 – D80-3.5 at -6% chord rotation, second cycle..................................................... C–31
Figure C.68 – D80-3.5 at +8% chord rotation, second cycle .................................................... C–31
Figure C.69 – D80-3.5 at -8% chord rotation, second cycle..................................................... C–31
Figure C.70 – D80-3.5 at +10% chord rotation, first cycle ...................................................... C–32
Figure C.71 – D80-3.5 at -10% chord rotation, first cycle ....................................................... C–32
Figure C.72 – D100-3.5 during second cycle to 2% chord rotation ......................................... C–33
Figure C.73 – D100-3.5 during second cycle to 6% chord rotation ......................................... C–35
Figure C.74 – D100-3.5 at +2% chord rotation, second cycle .................................................. C–36
Figure C.75 – D100-3.5 at -2% chord rotation, second cycle ................................................... C–36
Figure C.76 – D100-3.5 at +4% chord rotation, second cycle .................................................. C–36
Figure C.77 – D100-3.5 at -4% chord rotation, second cycle ................................................... C–36
Figure C.78 – D100-3.5 at +6% chord rotation, second cycle .................................................. C–37
Figure C.79 – D100-3.5 at -6% chord rotation, second cycle ................................................... C–37
Figure C.80 – D100-3.5 at +8% chord rotation, second cycle .................................................. C–37
Figure C.81 – D100-3.5 at -8% chord rotation, second cycle ................................................... C–37

xxvi
Figure C.82 – D100-3.5 at +10% chord rotation, first cycle .................................................... C–38
Figure C.83 – D100-3.5 at -10% chord rotation, first cycle ..................................................... C–38
Figure C.84 – D120-3.5 during second cycle to 2% chord rotation ......................................... C–39
Figure C.85 – D120-3.5 during second cycle to 6% chord rotation ......................................... C–40
Figure C.86 – D120-3.5 at +2% chord rotation, second cycle .................................................. C–41
Figure C.87 – D120-3.5 at -2% chord rotation, second cycle ................................................... C–41
Figure C.88 – D120-3.5 at +4% chord rotation, second cycle .................................................. C–41
Figure C.89 – D120-3.5 at -4% chord rotation, second cycle ................................................... C–41
Figure C.90 – D120-3.5 at +6% chord rotation, second cycle .................................................. C–42
Figure C.91 – D120-3.5 at -6% chord rotation, second cycle ................................................... C–42
Figure C.92 – D120-3.5 at +8% chord rotation, second cycle .................................................. C–42
Figure C.93 – D120-3.5 at -8% chord rotation, second cycle ................................................... C–42
Figure C.94 – P80-2.5 during second cycle to 2% chord rotation ............................................ C–43
Figure C.95 – P80-2.5 during second cycle to 6% chord rotation ............................................ C–44
Figure C.96 – P80-2.5 at +2% chord rotation, second cycle .................................................... C–45
Figure C.97 – P80-2.5 at -2% chord rotation, second cycle ..................................................... C–45
Figure C.98 – P80-2.5 at +4% chord rotation, second cycle .................................................... C–45
Figure C.99 – P80-2.5 at -4% chord rotation, second cycle ..................................................... C–45
Figure C.100 – P80-2.5 at +6% chord rotation, second cycle .................................................. C–46
Figure C.101 – P80-2.5 at -6% chord rotation, second cycle ................................................... C–46
Figure C.102 – P100-2.5 during second cycle to 2% chord rotation ........................................ C–47
Figure C.103 – P100-2.5 during second cycle to 6% chord rotation ........................................ C–48
Figure C.104 – P100-2.5 at +2% chord rotation, second cycle ................................................ C–49
Figure C.105 – P100-2.5 at -2% chord rotation, second cycle ................................................. C–49
Figure C.106 – P100-2.5 at +4% chord rotation, second cycle ................................................ C–49
Figure C.107 – P100-2.5 at -4% chord rotation, second cycle ................................................. C–49
Figure C.108 – P100-2.5 at +6% chord rotation, second cycle ................................................ C–50
Figure C.109 – P100-2.5 at -6% chord rotation, second cycle ................................................. C–50

1
CHAPTER 1: INTRODUCTION
1.1 Background and Motivation
Reinforced concrete structural walls are a common lateral force resisting system used in
medium to high-rise construction. Structural walls resist lateral forces and limit building drift
during earthquakes or high wind events. Perforations in a structural wall to accommodate
windows, doors, and other building components reduce the stiffness and strength of the lateral
force resisting system and may lead to the structural wall acting as a series of independent, smaller
structural walls. Coupling beams are used to couple the actions of structural walls, restoring much
of the lost stiffness and strength while retaining the openings necessary for building use. The
transfer of forces between structural wall segments by coupling beams results in wall axial tension
and compression forces that form a moment couple in response to overturning loads.
The geometry of the coupled wall system amplifies interstory wall drifts into greater
coupling beam deformations. The large shear and deformation demands placed on reinforced
concrete coupling beams require special reinforcement detailing. This detailing is aimed at
preventing shear strength and stiffness reductions when the coupling beam is subjected to repeated
inelastic loading cycles that would compromise the lateral strength and stiffness of the reinforced
concrete coupled wall system.
The amount and detailing of reinforcement required in concrete coupling beams typically
cause reinforcement congestion and increase construction costs. Reducing the quantity or size of
the coupling beam diagonal and transverse reinforcement by using high-strength reinforcement is
one way to reduce reinforcement congestion. The ACI Building Code (ACI 318-14)[1] limits the
nominal yield stress of primary longitudinal reinforcement in special seismic systems to 60 ksi

2
(420 MPa) and transverse confining reinforcement to 100 ksi (690 MPa) because there are limited
experimental data from specimens constructed with high-strength reinforcement. Typical
problems associated with the use of high-strength steel in reinforced concrete, such as width of
cracks, are not a concern in members primarily designed to resist large, inelastic cyclic
deformations. Therefore, there is reason to believe high-strength steel reinforcement can function
as diagonal reinforcement in coupling beams.
The ACI Building Code[1] requires the use of diagonal reinforcement in coupling beams
with aspect ratios (ℓ ℎ⁄ ) less than two and nominal shear stresses higher than 4 𝑓 psi
(0.33 𝑓 MPa). Coupling beams with aspect ratios not less than four are required to be designed
as a beam of a special moment frame. The Code permits coupling beams with aspect ratios between
two and four to be designed as either diagonally-reinforced or as special moment frame beams.
Diagonal bars in slender beams (with aspect ratios higher than two) have a small angle relative to
the horizontal, resulting in a need for large amounts of diagonal reinforcement to resist the shear
demand. Slender coupling beams may therefore especially benefit from the use of high-strength
reinforcement. The effect of using high-strength steel on the behavior of coupling beams with a
representative range of aspect ratios needs to be evaluated.
1.2 Research Objectives
This study was undertaken to investigate the use of high-strength steel as reinforcement in
diagonally-reinforced and special moment frame coupling beams. The expected impact of this
work is to reduce reinforcement congestion and, as a result, lower construction costs of robust and
more efficient reinforced concrete buildings.

3
The test results presented in this report may be useful as a basis for comparisons between
coupling beams reinforced with Grade 80, 100, and 120 (550, 690, and 830) steel bars. They may
also be useful for developing and calibrating models for use in design and analysis of systems with
high-strength reinforcement.

4
CHAPTER 2: EXPERIMENTAL PROGRAM
2.1 Specimens
2.1.1 Design and Detailing
Eleven large-scale coupling beam specimens were subjected to pseudo-static cyclic
displacements of increasing magnitude. Details of the specimens are listed in Table 1 and shown
in Figures 1 through 23. The approximately ½-scale specimens had nominally the same beam cross
sectional dimensions: a height (ℎ) of 18 in. (460 mm) and a width (𝑏 ) of 12 in. (300 mm); clear
span lengths (ℓ ) of 27, 45, or 63 in. (690, 1140, or 1600 mm), resulting in aspect ratios (ℓ ℎ⁄ ) of
1.5, 2.5, or 3.5 (which are similar to the range of aspect ratios commonly used in practice); either
Grade 80, 100, or 120 (550, 690, or 830) reinforcing bars; and either diagonal (D-type) or
moment-frame (P-type) reinforcement.
Each specimen consisted of a coupling beam that framed into top and bottom blocks. The
end blocks had dense reinforcement cages near the connection with the coupling beam to emulate
structural wall boundary elements. The coupling beams were tested rotated 90 degrees from
horizontal for convenience. All reinforcement in the end blocks was Grade 60 (420) except for the
coupling beam reinforcement embedded into the end blocks.
Specimens, such as D120-3.5 or P80-2.5, were named using the following rules: the first
letter indicates whether it has diagonal (D) or parallel (P) primary longitudinal reinforcement (see
Figure 1), followed by a number that represents the reinforcement grade (in ksi), and the last
number (separated by a dash) indicates the coupling beam aspect ratio (clear span to overall height,
ℓ ℎ⁄ ).

5
One D-type coupling beam was constructed for each combination of aspect ratio (1.5, 2.5,
or 3.5) and diagonal bar grade (Grade 80, 100, or 120 [550, 690, or 830]), for a total of nine
specimens with D-type reinforcement layout. D-type specimens were designed to have a nominal
shear stress of approximately 8 𝑓 psi (0.67 𝑓 MPa) based on 𝑓 of 8,000 psi (55 MPa). The
targeted shear stress is near the maximum design stress of 10 𝑓 psi (0.71 𝑓 MPa) permitted by
the ACI Building Code[1] for diagonally-reinforced coupling beams. Beam shear strength (𝑉 ) was
calculated using ACI 318-14 Section 18.10.7.4.a[1] (Equation 2.1) with nominal 𝑓 . The product of
yield stress and reinforcement ratio, 𝜌𝑓 , was approximately constant for a given beam aspect ratio
so the amount of diagonal reinforcement was inversely proportional to its yield stress. Transverse
reinforcement was provided in accordance with ACI 318-14 Section 18.10.7.4.d[1] using Equation
2.2, see below for additional details. The transverse reinforcement was Grade 80 (550) for all
beams except D120-2.5, which had Grade 120 (830) transverse reinforcement.
Two P-type coupling beams were constructed with an aspect ratio of 2.5 and either Grade
80 or 100 (550 or 690) longitudinal reinforcement. The target shear stress for the P-type beams
was approximately 6 𝑓 psi (0.5 𝑓 MPa). This shear stress was based on the beam reaching its
probable flexural strength at both ends. Probable flexural strength was calculated using a
rectangular stress block for concrete in compression with 𝑓 of 8,000 psi (55 MPa), linear strain
distribution, and elasto-plastic stress-strain behavior for the reinforcement with a maximum stress
of 1.25𝑓 in the longitudinal tension reinforcement. The maximum design stress permitted by the
Code for beams with special moment frame reinforcement is 6 𝑓 psi (0.5 𝑓 MPa). Transverse
reinforcement was provided such that 0.75 times the nominal shear strength of a P-type coupling
𝑉 2𝐴 𝑓 sin𝛼 Equation 2.1

6
beam exceeded the shear demand associated with probable flexural strength at both ends of the
beam.
The coupling beams described in Table 1 are similar to those tested by Naish et al.[16], which
included diagonally-reinforced beams with aspect ratios of 2.4 and 3.3, Grade 60 (420)
reinforcement, and confinement for the entire beam cross section. The similarities between the
beams allow the use of those tested by Naish et al. as control beams; the scope of this study was
therefore focused on beams with higher-grade reinforcement. However, there were some
differences in the designs that caused the beams in this study to be subjected to more demanding
conditions. First, the design shear stresses for D-type beams in this study were 10% to 70% higher
than the design shear stresses used by Naish et al., where nominal shear stresses of 7.3 𝑓 psi
(0.61 𝑓 MPa) and 4.8 𝑓 psi (0.40 𝑓 MPa) were used for diagonally-reinforced beams with
aspect ratios of 2.4 and 3.3, respectively; and second, the volumetric ratios of transverse
reinforcement for D-type beams in this study were approximately 20% lower (but still compliant
with the ACI Building Code[1]) than those used by Naish et al.
The specimens in this study are also similar to those described in Ameen et al.[3] and Poudel
et al.[18] which included diagonally-reinforced coupling beams with an aspect ratio of 1.9, Grades
60 and 120 (420 and 830) reinforcement, full-section confinement, and several coupling beams
with fully-developed secondary longitudinal reinforcement. However, the design shear stresses in
Ameen et al. and Poudel et al. were approximately 10 to 14 𝑓 psi (0.83 to 1.2 𝑓 MPa),
approximately 20% to 80% higher than the design shear stresses of the D-type beams in this study.
Another difference was that coupling beams in this study were free to elongate axially whereas
some of the beams tested by Ameen et al. and Poudel et al. were restrained axially. This may have

7
caused those beams to exhibit somewhat higher shear forces and lower chord rotation capacities.
Finally, the beam widths in this study were 12 in. (300 mm) rather than 10 in. (250 mm). The 20%
increase in width was not expected to affect results and allowed more options when selecting
transverse reinforcement for concrete confinement.
The coupling beams had No. 6 (19) or No. 7 (22) Grade 80, 100, or 120 (550, 690, or 830)
steel bars as primary longitudinal reinforcement. D-type specimens were constructed with two
bundles of diagonal reinforcing bars that intersected near midspan of the coupling beam with an
angle of inclination between 10 and 23 degrees depending on the aspect ratio. P-type specimens
were constructed with six parallel reinforcing bars, three near each of the extreme fibers of the
beam cross section. The design data in Table 1 include the quantity and minimum straight
embedment length (ℓ ) of the primary longitudinal reinforcement of the coupling beams into the
top and bottom blocks. The as-built dimensions of the specimens are shown in Figures 2 through
23.
Transverse reinforcement, in the form of closed hoops and crossties oriented parallel to both
strong and weak axes, was used in all D-type beams to provide full-section confinement. For D-
type beams, the transverse reinforcement was not considered when calculating the shear strength
in accordance with Equation 2.1 following ACI 318-14 Section 18.10.7.4.a[1]. Instead, it met the
requirements of ACI 318-14 Section 18.10.7.4.d[1] (shown in Equation 2.2). All D-type beams had
No. 3 (10) Grade 80 (550) transverse reinforcement except D120-2.5, where No. 3 (10) Grade 120
(830) was used. Each layer of transverse reinforcement in D-type beams consisted of a closed hoop
with seismic hooks (135 degrees), one crosstie along the beam depth, and two crossties along the
beam width. All crossties had one end with a 135 degree hook and the other with a 90 degree hook,
as permitted by ACI 318-14[1]. Beam cross sections for the D-type beams are shown in Figures 2

8
through 19. The longitudinal spacing of each layer of transverse reinforcement in the D-type beams
was 3 in. (76 mm). For both transverse directions of the cross-sectional area of D-type beams, the
amount of transverse reinforcement provided closely match the amount required by Equation 2.2
(based on ACI 318-14 Section 18.10.7.4.d[1]):
Beam cross sections for P-type beams are shown in Figures 21 and 23, where the transverse
reinforcement was designed such that 0.75 times the nominal shear strength exceeded the shear
force associated with the probable flexural strength being developed at both ends of the beam. The
shear strength attributed to the concrete was zero. The resulting longitudinal spacing of transverse
reinforcement for P80-2.5 and P100-2.5 was 3.5 in. (89 mm) and 3 in. (76 mm), respectively.
These spacings satisfied ACI 318-14 Section 18.6.4.4[1].
Following recommendations by NIST GCR 14-917-30[17], the maximum spacing of
transverse reinforcement for both D-type and P-type beams was limited to 5𝑑 for beams with
Grade 80 (550) longitudinal reinforcement and 4𝑑 for beams with Grade 100 or 120 (690 or 830)
longitudinal reinforcement.
D-type specimens had ten secondary longitudinal No. 3 (10) bars distributed around the
perimeter of the beam such that each secondary longitudinal bar was supported by either a crosstie
or a corner of a hoop. These bars were Grade 80 (550) for all specimens except for D120-2.5,
where all bars were Grade 120 (830). Consistent with the detailing recommended in the ACI
Building Code[1] commentary, the secondary longitudinal reinforcement was terminated 2 in.
(51 mm) into the top and bottom blocks for all specimens except D120-2.5. The No. 3 (10)
𝐴 0.09 s 𝑏 𝑓 𝑓⁄ ; 0.3 s 𝑏𝐴𝐴
1 𝑓 𝑓⁄ Equation 2.2

9
longitudinal bars in D120-2.5 were extended into the end blocks a length sufficient to develop a
stress of 1.25𝑓 . This deviation, along with the Grade 120 (830) transverse reinforcement, was
done to explore whether developing the secondary longitudinal reinforcement and providing
excess transverse reinforcement (by means of higher 𝑓 ) would cause improved deformation
capacity by inhibiting the concentration of damage at the block-beam interfaces.
2.1.2 Materials
2.1.2.1 Concrete
Ready-mix concrete with a maximum aggregate size of 0.5 in. (13 mm), provided by a local
supplier, was used to cast the specimens. The specified compressive strength (f’c) was 8,000 psi
(55 MPa). The measured compressive and tensile strengths of concrete (fcm and fct in Table 2) were
obtained from tests of 6 by 12 in. (150 by 300 mm) standard concrete cylinders following ASTM
C39[9] and C496[11]. Slump of the plastic concrete was obtained in accordance with ASTM
C143[10]. Slump measurements and concrete mixture proportions are shown in Table 3.
2.1.2.2 Reinforcing Steel
Deformed steel reinforcing bars were used for all reinforcement. Mill certifications for
reinforcing bars used as Grade 80 and 100 (550 and 690) showed compliance with ASTM A615[6]
Grades 80 and 100 (550 and 690). Mill certifications for reinforcing bars used as Grade 120 (830)
showed compliance with ASTM A1035[8] Grade 120 (830). Mechanical properties of reinforcing
bars (Table 4) used in the beams were obtained from tensile tests in accordance with ASTM
A370[5]. Figure 24 shows sample tensile test results of the six types of reinforcing bars used in the
coupling beams.

10
Reinforcement used to construct the top and bottom blocks was Grade 60 (420) and
complied with ASTM A615[6] Grade 60 (420).
2.1.3 Construction
Photos taken during various stages of specimen construction are shown in Figures B.1
through B.8 of Appendix B. The specimens were cast monolithically with the top and bottom block
formwork lying flat on the laboratory floor. The coupling beam concrete was supported with
elevated wood formwork because the width of the beams was narrower than the width of the end
blocks. Construction of each specimen included the assembly of reinforcing bar cages, installation
of strain gauges on relevant reinforcing bars, construction of wooden formwork, and placement of
the concrete. After casting, specimens and cylinders were covered with wet burlap and plastic
sheets until formwork removal three to five days after casting. Specimens were kept in a climate-
controlled laboratory from casting to testing.
2.2 Test Setup
The test setup is shown in Figures 25 through 27. The bottom block of each specimen was
bolted to the laboratory strong floor with two unbonded 2.5-in. (64-mm) diameter high-strength
threaded rods passing through the bottom block and strong floor. Two hydraulic actuators acting
in parallel were used to load the specimens. The actuators each have a stroke length of 40 in.
(1020 mm) and a force capacity of 220 kips (980 kN). The two actuators were connected to the
strong wall and the specimen by means of vertically oriented HP steel sections. Actuator elevations
are indicated in Table 5 and illustrated in Figures 28 through 30. One of the HP sections was
connected to the top block of the specimen with two hollow structural steel (HSS) sections (acting
as a spacer) transmitting compression when the actuators pushed the specimen and six unbonded

11
2.25-in. (57-mm) diameter high-strength threaded rods transmitting tension when the actuators
pulled the specimen. Additional steel fixtures were used to externally brace the HP section against
out-of-plane motions. Mirrored steel (attached to the HP section), nylon pads (attached to the
external bracing system), and white lithium grease (between the mirrored steel and nylon pads)
were used to minimize friction between the HP section and the external bracing.
2.3 Instrumentation
Several instruments were used to record specimen response during the tests: one linear
variable differential transformers (LVDT) and load cell integral to each actuator; two LVDTs
attached to the top block; an infrared non-contact position measurement system; and strain gauges
attached to reinforcing bars. Actuator load cell data were used to report the applied shear
throughout the tests. LVDT data are not reported because they are redundant with data from the
infrared position measurement system.
2.3.1 Linear Variable Differential Transformers (LVDTs)
Movement of the top block was recorded with two LVDTs (Figure 31). These results were
used to validate the measurements made with the infrared position measurement system. These
LVDTs were attached to the top block face opposite to the actuators, horizontally centered with
respect to the thickness of the top block. They were located approximately 24 and 36 in. (610 and
910 mm) above the bottom of the top block.
2.3.2 Infrared Non-Contact Position Measurement System
The motion capture system recorded the positions of optical markers attached to the surface
of each specimen (63, 83, or 94 markers for beams with aspect ratios of 1.5, 2.5 or 3.5) and three

12
optical markers attached to a rigid stand on the laboratory floor. The markers emit infrared light
pulses that are detected by the infrared camera system. The spatial coordinates of the markers were
triangulated and recorded throughout the tests. The markers were arranged in a 4-in. (100-mm)
square grid over one face of the coupling beam and part of the top and bottom blocks, as shown in
Figure 32.
2.3.3 Strain Gauges
Several 120-ohm electrical resistance strain gauges were applied to selected reinforcing
bars prior to casting. D-type specimens were instrumented with at least 31 strain gauges and P-type
specimens with at least 22. Figures 33 and 34 generically show locations where a strain gauge was
used in at least one specimen. Tables 6 and 7 identify the strain gauge locations for each specimen
and indicate which gauges malfunctioned prior to testing. Strain gauges on diagonal reinforcement
(D in D-type beams) and developed longitudinal reinforcement (P in P-type beams and H in
D120-2.5) were rated for 15% strain (150 millistrains) to allow strain measurements near fracture
elongation of reinforcement. The remaining strain gauges were rated for 5% strain.
2.4 Loading Protocol
Specimens were subjected to a series of reversed cyclic displacements following the
protocol described in Table 8 and shown in Figure 35, patterned after the protocol recommended
in FEMA 461[14]. Several small cycles were imposed prior to testing (with forces too small to cause
cracking) to facilitate tightening of the threaded rods connecting the bottom block to the strong
floor and the top block to the actuators. Force-based control was used for the first few cycles of
loading before yielding of the reinforcement. Displacement-based control was used starting at
0.5% chord rotation for beams with aspect ratios of 1.5 and 2.5 and 0.75% chord rotation for beams

13
with an aspect ratio of 3.5. Testing continued until the beam residual strength was nearly 20% of
the peak strength, provided instability was not a concern.
The weight of all fixtures (HP sections, spacer sections, steel plates, and actuators)
eccentrically attached to the specimen (Figure 25) caused a permanent moment of approximately
42 ft-kips (57 m-kN) prior to loading. At the start of the test, an equal and opposite moment was
applied using the actuators.
Applied forces or displacements were selected to minimize the relative rotation between
top and bottom blocks (i.e., the difference between the top block rotation and the bottom block
rotation). This was done to ensure that double-curvature was imposed on the coupling beam,
resulting in an inflection point near beam midspan.
The loading rates are given in Table 8 for coupling beams with aspect ratios of 1.5 and 2.5;
coupling beams with an aspect ratio of 3.5 were tested at twice the given rates. Loading rates were
periodically increased in increments of 0.01 in./sec (0.25 mm/sec) as chord rotation demands
increased.

14
CHAPTER 3: EXPERIMENTAL RESULTS
3.1 Measured Shear versus Chord Rotation
Chord rotation (𝐶𝑅) of the coupling beam is defined as the displacement of the top block
relative to the bottom block divided by the length of the beam clear span and corrected for rotation
of the top and bottom blocks:
𝐶𝑅 𝛿 𝛿
𝑙 𝜃 𝜃
2 Equation 3.1
Figure 36 shows the generalized deformed shape of a coupling beam with displacement
and rotational components identified. The chord rotation represents the average of the relative
rotation at each end of the coupling beam. Figure 36 corresponds to a specimen elevation view
from laboratory north with the top block displacement (𝛿 ) and bottom block displacement (𝛿 )
positive when moving eastward (away from the laboratory strong wall). Figure 36 also shows
positive top block rotation (𝜃 ) and bottom block rotation (𝜃 ) as counterclockwise rotation
when viewed from laboratory north.
Displacements and rotations were calculated from measurements obtained with the infrared
non-contact position measuring system (Section 2.3.1) and checked with data from the redundant
LVDTs. The infrared markers were offset from the edges of the top and bottom blocks by
approximately 2.5 in. (64 mm) to reduce the probability of losing an end-block marker (due to
concrete spalling) during the test. This offset was accounted for in the components of Equation
3.1.

15
3.2 Specimen Response and Observations
The eleven specimens described in Chapter 2 were subjected to the loading protocol
discussed in Section 2.4. Table 9 summarizes the deformation capacity and maximum shear of
each coupling beam. Maximum shear stress was normalized by the square root of the concrete
compressive strength at the time of testing (𝑓 in Table 2). General observations during testing
of each specimen are summarized in Sections 3.2.1 through 3.2.11.
The measured force-deformation relationships for each coupling beam are plotted in
Figures 37 through 47 in terms of shear versus chord rotation and discussed in the following
sections. A shear-chord rotation envelope for each coupling beam was developed in accordance
with ASCE 41-17 Section 7.6.3.1.1[4] by connecting the maximum displacement of the first cycle
of each loading step. The envelopes thus generated were superimposed on the measured
shear-chord rotation data in Figures 48 through 58. Coordinates of the breakpoints for the
envelopes are listed in Tables 10 through 13.
Two definitions were used for deformation capacity or chord rotation capacity in Table 9.
The first, called Deformation Capacity A, was defined as the average of the maximum chord
rotation reached in each loading direction while sustaining 80% of the maximum strength in that
loading direction. The second, called Deformation Capacity B, was defined as the average of the
chord rotations in each loading direction where the envelope of the shear versus chord rotation
curve formed by connecting the maximum chord rotation of the first cycle of each loading step
intersects with 80% of the maximum applied shear (in each loading direction).
Both definitions of chord rotation capacity are provided because the distinctions may
appeal to designers and researchers differently. Deformation Capacity A is a more stringent

16
appraisal of chord rotation capacity and represents chord rotations the coupling beam was actually
subjected to. Deformation Capacity B, which is based on an envelope drawn according to
ASCE 41-17[4], is based on the assumption that force-deformation relationships are represented by
linear interpolations between measured values. Deformation Capacity B is less sensitive to loading
protocol than Deformation Capacity A and is also always greater than or equal to Deformation
Capacity A. Deformation capacity in this report refers to Deformation Capacity B unless otherwise
noted.
The deformation capacity of each D-type beam is shown in Figure 59, organized by aspect
ratio (ℓ ℎ⁄ ) and measured yield stress (𝑓 ) of the diagonal reinforcement. Deformation capacity
for D-type beams is positively correlated to aspect ratio and negatively correlated to the yield stress
of the diagonal reinforcement. The deformation capacity of D120-2.5 deviates from the trend
shown by the beams with aspect ratios of 2.5. This may be attributable to the higher 𝜌𝑓 and/or
the fully-developed secondary longitudinal reinforcement distributing the damage away from the
beam-end interfaces.
3.2.1 D80-1.5
Measured shear force is plotted versus chord rotation in Figure 37 for D80-1.5. The
coupling beam completed both cycles to 6% chord rotation (Step 10 of the loading protocol in
Table 8) before strength notably diminished. The second excursion to -6% reached a shear of
approximately 80% of the strength after at least one bar fractured. This resulted in a deformation
capacity of 6.9% (as reported in Table 9). One cycle to 8% chord rotation (Step 11 in Table 8) was
completed before the test was terminated. Strength loss was initiated by buckling of diagonal bars
which fractured in subsequent opposite loading cycles.

17
3.2.2 D100-1.5
Measured shear force is plotted versus chord rotation in Figure 38 for D100-1.5. This
coupling beam completed both cycles to 4% chord rotation (Step 9) before multiple bar fractures
occurred during the first cycle to 6% and strength diminished rapidly. This resulted in a
deformation capacity of 5.3% (as reported in Table 9). One excursion to +8% chord rotation (Step
11) was attempted but aborted at approximately +6.1% due to stability concerns from the numerous
bar fractures during the previous loading cycle (Step 10B). Strength loss was initiated by buckling
of the diagonal bars followed by bar fractures in subsequent cycles.
3.2.3 D120-1.5
Measured shear force is plotted versus chord rotation in Figure 39 for D120-1.5. The
coupling beam completed both cycles to 3% chord rotation (Step 8) and the first excursion to 4%.
However, an exception to the testing protocol occurred during the first excursion to -4% (Step 9).
The coupling beam displaced through -4.9% before fracturing all reinforcing bars in one group of
diagonal bars near the top end of the beam. The sudden bar fractures caused a large increase in top
block rotation, resulting in a large increase in chord rotation to 8.1%. There was no prior evidence
of bar buckling or fracture. The test resumed with cycles to 4% and 6% chord rotations (Steps 9
and 10). The deformation capacity was 5.2% based on the definition of Deformation Capacity B
(as reported in Table 9).
Reinforcing bar fractures near -5% suggest that the beam would not have completed Step
10 if the exception to the loading protocol had not occurred. Failure was imminent regardless of
the testing protocol. It was observed after testing that all four reinforcing bars in one of the
diagonal-bar bundles near the top of the coupling beam had fractured.

18
3.2.4 D80-2.5
Measured shear force is plotted versus chord rotation in Figure 40 for D80-2.5. The
coupling beam completed two cycles to 6% chord rotation (Step 10) and half of a cycle to 8%
chord rotation before strength diminished by more than 20%. This resulted in a deformation
capacity of 7.6% (as reported in Table 9). One cycle to 10% chord rotation (Step 12) was
completed before the test was terminated. Strength loss was due to fracture of diagonal bars near
the ends of the coupling beam after they were observed to have buckled in a prior cycle.
3.2.5 D100-2.5
Measured shear force is plotted versus chord rotation for D100-2.5 in Figure 41. The
coupling beam reached chord rotations of -4.7%a and +6% in each loading direction before a 20%
loss of strength, resulting in a deformation capacity of 6% (as reported in Table 9). Loading
continued until nearly two cycles at 8% chord rotation (Step 11) were completed. Strength loss
was caused by fracture of one set of diagonal bars near the top end of the coupling beam after they
were observed to have buckled in a prior cycle.
3.2.6 D120-2.5
Measured shear force is plotted versus chord rotation for D120-2.5 in Figure 42. The
deformation capacity of the coupling beam was 6.9% (as reported in Table 9). Beam strength began
to diminish in the first cycle to 6% with bar fractures occurring during the second excursion to
+6%. Loading continued until completion of two cycles to 8% (Step 11). Strength loss was
associated with hoop opening and bar buckling followed by bar fracture in both diagonal bundles
a A chord rotation of 4% was targeted.

19
near the bottom end of the coupling beam. Several longitudinal No. 3 bars also fractured. D120-2.5
had longitudinal No. 3 bars extended into the end blocks for a length sufficient to develop 1.25
times the specified yield stress of the bar at the face of the end blocks. This may have contributed
to achieving a maximum shear stress of 15 𝑓 psi (1.25 𝑓 MPa).
3.2.7 D80-3.5
Measured shear force is plotted versus chord rotation in Figure 43 for D80-3.5. The
coupling beam completed one cycle to 8% chord rotation (Step 11) before bar fractures occurred
during the second excursion to +8% with a strength loss of approximately 30%. This resulted in a
deformation capacity of 8.6% (as reported in Table 9). Testing continued through one cycle of
10% (Step 12). A second excursion to +10% chord rotation was attempted but aborted due to
numerous bar fractures at approximately +3%. Strength loss was due to buckling followed by
fracture of diagonal bars near the ends of the coupling beam.
3.2.8 D100-3.5
Measured shear force is plotted versus chord rotation in Figure 44 for D100-3.5. The
coupling beam completed one cycle to 6% chord rotation (Step 10) before bar fractures occurred
during the second excursion to +6% with a strength loss of nearly 20%. This resulted in a
deformation capacity of 6.8% (as reported in Table 9). Testing continued through one cycle of
10% (Step 12). Strength loss was due to fractures of diagonal bars near the ends of the coupling
beam after they were observed to have buckled in previous cycles. Large out-of-plane
deformations (2.7% of the beam clear span) occurred during the second cycle to 6% chord rotation.

20
3.2.9 D120-3.5
Measured shear force is plotted versus chord rotation in Figure 45 for D120-3.5. The
coupling beam completed one cycle to 6% chord rotation (Step 10) before bar fractures occurred
during the second excursion to +6% with a strength loss of nearly 80%. This resulted in a
deformation capacity of 6.7% (as reported in Table 9). Testing continued through two cycles of
8% (Step 11). Strength loss was due to buckling followed by fracture of diagonal bars near the
ends of the coupling beam.
Continuous data from the position tracking marker system are unavailable after the second
2% cycle (Step 7) due to a recording error of the primary data acquisition system. However,
shear-chord rotation coordinates were also recorded each time the test was paused with
independent software that used optical character recognition to capture in real-time the display of
the primary data acquisition system. These discrete data are shown in Figure 45 as hollow points
connected with dotted lines.
3.2.10 P80-2.5
Test results are plotted for P80-2.5 in terms of measured shear force versus chord rotation
in Figure 46. The deformation capacity of the coupling beam was 3.9% (as reported in Table 9).
Although strength began to diminish in the second excursion to a chord rotation of -3%, the first
excursion to +4% reached a shear that was greater than 80% of the strength in the positive loading
direction. Loading continued until two cycles to 6% chord rotation (Step 10) had been completed.
No bar fracture was observed during the test. Strength loss was due to shear strength decay, with
damage concentrated near the ends of the coupling beam.

21
3.2.11 P100-2.5
Test results are plotted for P100-2.5 in terms of measured shear force versus chord rotation
in Figure 47. The chord rotation capacity of the coupling beam was 4.1% (as reported in Table 9).
The first cycle to +3% was the last cycle to exceed 80% of the strength in the positive loading
direction. The second excursion to a chord rotation of -3% reached a shear nearly equal to 80% of
the strength in the negative loading direction, while the first excursion to -4% exceeded the 80%
threshold. Loading continued until two cycles to 6% chord rotation (Step 10) had been completed.
No bar fracture was observed after the test. Strength loss was due to shear strength decay associated
with damage near the ends of the coupling beam.
3.3 ASCE 41 Envelopes
Figures 60 through 64 show the shear-chord rotation envelopes of the tested beams grouped
by aspect ratio (ℓ ℎ⁄ of 1.5, 2.5, or 1.5) and reinforcement layout (D- or P-type beams). The plots
also include the generalized force-deformation curve for modeling coupling beams as defined in
ASCE 41-17 Table 10-19[4]. The coordinates of points A through E are based on Figure 10-1(b) [4]
(shown in Figure 65), which depend on parameters c, d, and e in Table 10-19[4]. For D-type beams,
Table 10 19[4] gives c = 0.8, d = 0.03, and e = 0.05. For P-type beams with conforming transverse
reinforcement and shear stresses greater than or equal to 6 𝑓 𝑏 𝑑 psi (0.5 𝑓 𝑏 𝑑 MPa), Table
10 19[4] gives c = 0.5, d = 0.02, and e = 0.04. Parameters c, d, and e correspond, respectively, to
the residual strength ratio (or shear at points D and E in relation to point B); the deformation at
peak force (or chord rotation at point C); and the maximum deformation before total loss of
strength (or chord rotation at point E). In ASCE 41-17[4], point B is generally associated with the

22
calculated member strength based on the measured yield strength of reinforcement 𝑓 , whereas
point C is generally based on 1.25𝑓 .
For D-type beams, the ordinate of point B in Figures 60 through 62 was determined based
on the target design shear stress of 8 𝑓 psi (0.67 𝑓 MPa), as indicated by the average 𝑣 in
Table 1, and the ordinate of point C was based on 10 𝑓 psi (0.83 𝑓 MPa), or 5/4 of the ordinate
of point B.
For P-type beams, the ordinate of point C in Figure 63 was determined based on the target
design shear stress of 6 𝑓 psi (0.5 𝑓 MPa), as indicated by the average 𝑣 in Table 1, and the
ordinate of point B was based on 4.8 𝑓 psi (0.40 𝑓 MPa), or 4/5 of the ordinate of point C.
The slope from points A to B (initial stiffness) was calculated based on ASCE 41-17 Table
10-5[4] using a flexural rigidity of 𝐸 𝐼 , where 𝐼 = 0.3𝐼 , and a shear rigidity of 𝐺 𝐴 , where
𝐴 = 1.0𝐴 . The initial slope of the shear versus chord rotation curve (in units of force/rad) is
given by
𝐾 1
Equation 3.2
Figures 60 through 63 show Point B was not enclosed by the envelopes of any of the
coupling beams, which indicates that the beams had less stiffness than expected based on the ASCE
41-17[4] provisions. Beam stiffness is discussed in more detail in Section 3.6.

23
Figures 60 through 63 show that envelopes from the measured test data of each coupling
beam exceeded the chord rotation capacity that ASCE 41-17[4] assigns to coupling beams that are
compliant with ACI 318-14[1].
Figure 63 shows that the shear strength exhibited by P100-2.5 was higher than the shear
force at point C though the shear strength of P80-2.5 was not. This can be attributed to the different
design strengths of the P-type beams. The design shear stresses of P80-2.5 and P100-2.5 were 5.2
and 6.4 𝑓 psi (0.43 and 0.53 𝑓 MPa), respectively. When the shear force applied to each P-
type beam is normalized by the shear force associated with the nominal flexural strength (Mnm), as
shown in Figure 64, both P-type beams exceeded the normalized shear at point B, which is shown
as ±1.0, indicating that both beams exceeded their nominal strength. However, neither P-type beam
reached a peak that exceeded the normalized shear at point C, which is shown as ±1.25. This
indicates that an acceptable upper bound for the shear demand in P-type coupling beams may be
determined using 1.25Mnm.
3.4 Progression of Damage
The condition of the specimens (viewed from the south) during the last cycle to target chord
rotations of 2, 4, 6, 8, and 10% are shown in Figures C.1 through C.109 of Appendix C. The
locations of necked and fractured bars were recorded after each test, as shown in Figures 66
through 76.
The first flexural cracks in each test were frequently observed during the first cycle to 0.2%
chord rotation. Flexural and shear cracks continued to develop until testing ceased but most cracks
initiated before 2% chord rotation, after which cracks primarily widened and lengthened.

24
Horizontal cracking, associated with flexural cracking, was observed on both 12-in.
(300-mm) faces of the coupling beam. When these cracks penetrated through the 18-in. (460-mm)
depth of the coupling beam, some remained perpendicular to the beam longitudinal axis but they
frequently developed into inclined flexure-shear cracks. Horizontal cracks were most likely to
become inclined away from the beam ends but toward the nearest support.
All specimens had horizontal cracks extending across the 18-in. (460-mm) beam depth at
both ends of the coupling beam early in the tests. These cracks tended to become wide as rotations
concentrated near the face of the top and bottom blocks. These concentrated rotations are attributed
to elongation and slip of the longitudinal reinforcement inside the end blocks, also referred to as
strain penetration.
Inclined (shear) cracks formed along the 18-in. (460-mm) face of the beam, primarily
developing from the tips of horizontal (flexural) cracks. Most inclined cracks were oriented at
approximately 45 degrees from the beam longitudinal axis. Corner to corner cracks only occurred
in the beams with an aspect ratio of 1.5, see cracks on D80-1.5 (Figure C.1) or D120-1.5 (Figure
C.20). The spacing of inclined cracks was fairly even near midspan of the beams.
Most of the fractured diagonal reinforcement was observed to buckle in a half-cycle prior
to fracturing. For example, buckling of reinforcing bars in the bottom west bar bundle of D80-1.5
was observed at -6% chord rotation (shown in Figure C.8) followed by bar fracture en route to
+8% chord rotation (shown in Figure C.9). This type of buckling-induced fracture may be due to
the bar exceeding a “critical bending strain” from large curvature demands on the bar during
buckling. The testing of Barcley and Kowalsky (2019)[13] showed that the magnitude of the
imposed strain due to buckling influences the tensile strain capacity of reinforcing bars tested

25
under cyclic loading. No visible buckling, necking, or fracture was observed for the primary
longitudinal reinforcement in the P-type beams. However, the primary longitudinal reinforcement
was deformed laterally (shown in Figure C.99) near the coupling beam ends as a result of
concentrated shear deformations (also referred to as sliding shear).
One beam end exhibited more damage than the other in most specimens. Differences
between beam ends were least pronounced in D80-1.5, D80-2.5, D120-2.5, and D80-3.5, which
are shown near final loading steps in Figures C.2, C.29, C.51, and C.61. This list consists of the
three D-type specimens with Grade 80 (550) primary reinforcement and the single D-type Grade
120 (830) specimen with developed No. 3 (10) secondary longitudinal reinforcement. The more
symmetrical behavior in the Grade 80 (550) beams may be due to reduced occurrence of buckling.
It is likely that fewer Grade 80 (550) diagonal bars buckled because spacing of transverse
reinforcement in all D-type beams was identical (3 in. [76 mm]). The likelihood of buckling for
Grade 80 (550) bars was reduced due to lower stress demands (associated with their lower yield
stress). In addition, some Grade 80 (550) diagonals used larger diameter bars with lower
slenderness ratios.
The development of the No. 3 (10) reinforcement in D120-2.5 likely contributed to the
more symmetric observed damage because it forced beam deformations to be less concentrated at
the beam ends. During chord rotation cycles to 6%, specimens D100-1.5 and D120-1.5 (Figures
C.12 and C.21) with secondary longitudinal reinforcement terminating at 2 in. (51 mm) into the
end blocks had damage concentrated near the beam ends. During chord rotation cycles to 6%,
D100-2.5 (Figure C.41) had concrete loss due to crushing or spalling extending approximately 3
to 4 in. (76 and 100 mm) away from the end blocks. The damage at the bottom end was primarily
localized in the bottom east corner, corresponding to the compression zone for positive chord

26
rotations. The damage to the top end was distributed across the entire 18-in. (460-mm) beam width.
In contrast, D120-2.5 at chord rotations of -6% (Figure C.51) had visible damage to its concrete
across the entire 18-in. (460-mm) beam width and extended approximately 8 in. (200 mm) away
from the face of the end blocks.
3.5 Calculated and Measured Strengths of Specimens
Table 14 shows the maximum measured and calculated strengths for each specimen and
the measured-to-calculated strength ratio. The calculated shear strength of the D-type beams, 𝑉 ,
was obtained by substituting measured yield stress, 𝑓 , into Equation 2.1, which corresponds to
the nominal strength of a diagonally-reinforced coupling beam according to ACI 318-14 Section
18.10.7.4.a[1]. The developed No. 3 (10) reinforcement in D120-2.5 were not considered in
calculations as the ACI equation neglects developed longitudinal reinforcement in diagonally-
reinforced coupling beams.
The calculated strength of the P-type beams, 𝑉 , corresponds to the shear stress associated
with the nominal flexural strength occurring at both ends of the beam, calculated using a tensile
bar stress of 1.0𝑓 , a concrete compressive strength of 𝑓 , and including the contribution of
reinforcement in compression. Values of 𝑓 and 𝑓 were taken from Tables 2 and 4.
The average ratio of measured-to-calculated strength was 1.48 for D-type beams and 1.15
for P-type beams. The higher average ratio for D-type beams may be because the calculated
strength, 𝑉 , depends only on the diagonal reinforcement and neglects the contribution of the
concrete and transverse reinforcement. These results are consistent with those from other studies[3,
15, 16]. The ratios for the D-type beams ranged from 1.28 to 1.68, excluding D120-2.5 which had a

27
ratio of 1.90 partly due to developing the No. 3 (10) bars (secondary longitudinal reinforcement)
into the end blocks. All of the measured-to-calculated strength ratios for D120 beams were higher
than those of D80 and D100 beams with the same aspect ratio.
For D-type beams, the measured-to-calculated strength ratio would reduce from 1.48 to
1.18 if the strength is estimated using 1.25𝑓 instead of 1.0𝑓 . Alternative calculations based
on probable flexural strength (using 1.25𝑓 ) and accounting for the projected area of steel may
also provide additional accuracy. This is further examined in other work[3, 15, 18].
3.6 Stiffness
Secant stiffness (𝐾 ) refers to the slope of a line drawn from a point at the origin of the
force-deformation envelope to any other point on the envelope. Secant stiffness was calculated
with Equation 3.3. This definition of stiffness is based on deformations defined using chord
rotation times clear span length (𝐶𝑅 𝑙 ). For each of the coordinates (𝐶𝑅,𝑉) presented in Tables
10 through 13, the corresponding 𝐾 are tabulated.
𝐾 𝑉
𝐶𝑅 𝑙 Equation 3.3
Shear-chord rotation envelope data, shown in Tables 10 through 13, were used to estimate
the initial stiffness (𝐾 ) and the corresponding effective moment of inertia (𝐼 ) for each of the
coupling beams. The initial stiffness was defined as the secant stiffness to a notional first yield,
which was assumed to occur at a shear equal to 0.75𝑉 . Two initial stiffness values were
determined for each coupling beam, one for each loading direction. This definition of initial
stiffness was selected because it is simple and it was observed that tangential stiffness visibly

28
decreased beyond the assumed notional first yield. Chord rotations (𝐶𝑅 ) associated with
0.75 𝑉 are listed in Tables 10 through 13 and identified with a diamond in the envelopes of
shear versus chord rotation in Figures 77 through 80.
Values of 𝐾 in the positive loading direction ranged from 990 kips/in. (173 kN/mm) in
D80-1.5 to 167 kips/in. (29 kN/mm) in D120-3.5. Although similar stiffness values were expected
for both loading directions, minor differences were observed. Values of 𝐾 in the negative loading
direction were within 7% of its positive loading counterpart for beams with aspect ratios of 2.5
and 3.5 but a difference of up to 22% was observed for beams with aspect ratios of 1.5. The greater
difference for beams with aspect ratios of 1.5 was in part due to the smaller displacement
associated with the first yield of beams with a clear span of 27 in. (690 mm). Note that a chord
rotation of 𝐶𝑅 = -0.55%, as seen in Table 10 for D80-1.5, corresponds to a displacement
(corrected for relative rotation of the end blocks) of -0.15 in. (3.8 mm).
Values of 𝐾 were negatively correlated to both beam aspect ratio and primary
reinforcement grade. The average values of 𝐾 for the D-type beams with an aspect ratio of 1.5,
2.5, and 3.5 were 920, 362, and 206 kips/in. (160, 63, and 36 kN/mm), respectively. For P-type
beams with an aspect ratio of 2.5, the average value of 𝐾 was 277 kips/in. (49 kN/mm).
Comparisons among beams grouped by grade of the primary reinforcement show that 𝐾
was inversely proportional to reinforcement grade. This observation is consistent with the coupling
beam test data reported by Ameen[3]. Values of 𝐾 for D80-1.5 were approximately 20% greater
than 𝐾 for D100-1.5 and approximately 50% greater than 𝐾 for D120-1.5. A similar trend was
observed for D80-3.5 when compared with D100-3.5 and D120-3.5. Values of 𝐾 for P80-2.5 were
approximately 20% greater than 𝐾 for P100-2.5.

29
An effective moment of inertia (𝐼 ) for both loading directions was calculated using
Equation 3.4, which attributes all deformations to flexure. Values of 𝐼 are plotted in Figures 81
and 82 as the ratio of 𝐼 to either the gross moment of inertia (𝐼 ) or transformed uncracked
moment of inertia (𝐼 ). For D-type beams, the value of 𝐼 accounts for the projected area of the
diagonal steel bars and the net area of concrete.
𝐼 0.75 𝑉 𝑙12 𝐸 𝐶𝑅
Equation 3.4
The effective moments of inertia normalized by 𝐼 and 𝐼 in Figures 81 and 82 have similar
trends. Both aspect ratio (𝑙 ℎ⁄ ) and 𝐼 𝐼⁄ were positively correlated for D-type beams, with
average values of 0.05, 0.09, and 0.14 for 𝑙 ℎ⁄ of 1.5, 2.5, and 3.5, respectively. The average
𝐼 𝐼⁄ for P-type beams was approximately 0.07. The positive correlation of 𝐼 𝐼⁄ and 𝐼 𝐼⁄
to 𝑙 ℎ⁄ may in part be due to the more important role of shear deformations in the behavior of
beams with small 𝑙 ℎ⁄ . In other words, 𝐼 𝐼⁄ was lower for beams with higher shear
deformations than for those with lower shear deformations. The negative correlation between
reinforcement grade and both 𝐼 𝐼⁄ and 𝐼 𝐼⁄ is attributed to the amount of longitudinal
reinforcement used in the beams, which was inversely proportional to the steel grade. Beams with
𝑙 ℎ⁄ of 3.5, namely, D80-3.5, D100-3.5, and D120-3.5, had 𝐼 𝐼⁄ of 0.13, 0.11, and 0.09,
respectively. The trend was less pronounced in D-type beams with 𝑙 ℎ⁄ of 2.5, but this was
expected because D120-2.5 had the secondary longitudinal reinforcement developed into the end
blocks, which may have increased the cracked stiffness of the beam.

30
3.7 Measured Reinforcement Strains
Reinforcing bars were instrumented with electrical resistance strain gauges as described in
Section 2.3.3 and listed in Tables 6 and 7. All strain gauge data are reported assuming zero strain
in the reinforcement at the start of the tests. The layout of strain gauges is shown in Figures 33 and
34. Measured strain data versus chord rotation are shown in Figures 83 through 446 with a sketch
of the specimen reinforcement and the location (circled) of the strain gauge providing the plotted
data. The figures are sorted by specimen identification followed by strain gauge identification: D
for Diagonal bars in D-type beams; P for primary Parallel bars in P-type beams; S for closed
Stirrups; H for secondary Horizontal longitudinal bars in D-type beams; and T for Transverse
crossties. Bars with H gauges were in the horizontal position during casting.
Figures 447 through 488 show the envelope of measured strains at the peak chord rotation
of each loading step (Table 8). It is important to note that higher strains may have occurred during
a cycle that did not define the peak chord rotation for a loading step (which involves two cycles).
Each of these figures contain data from all gauges of one type (D, P, S, H, or T) in a single
specimen. For example, Figure 447 shows strain maxima measured with D strain gauges in
D80-1.5 at discrete points corresponding to the peak chord rotation of each loading step. The text
labels in Figures 447 through 488 identify which strain gauge corresponds to each curve shown.
The text labels were vertically translated to avoid overlap. The ends of each curve have an “x”
indicating the chord rotation at which the gauge became inoperable and an open circle identifies
the overall maximum strain recorded for the reported gauge type. Figures 447 through 488 also
include a heavier black line to represent the overall strain envelope for that gauge type in that
specimen. To facilitate comparisons among specimens, the overall envelopes are grouped in
Figures 489 through 503 based on reinforcement layout (D- or P-type) and aspect ratio (1.5, 2.5,

31
or 3.5). For example, Figure 489 shows the envelopes of strains measured with D strain gauges in
D-type beams with an aspect ratio of 1.5.
In the following sections, strain gauge data are occasionally used as a basis for stating that
the reinforcement yielded at a certain point during the test. For the purpose of this discussion,
strains in excess of 0.3, 0.4, and 0.5% (3, 4, and 5 millistrains) are taken to be indicative of yielding
for Grade 80, 100, and 120 (550, 690, and 830) reinforcement, respectively. More precise
statements regarding the initiation of yielding are not made for several reasons: 1) effects of
concrete shrinkage on bar strains at the start of the test are neglected, 2) strain gauges measure bar
strains at discrete locations that may not coincide with the location of maximum strain, and 3)
stress-strain curves for high-strength reinforcement do not generally show a well-defined yield
plateau.
A change in slope in the strain versus chord rotation curves is apparent for beams with
Grade 80 (550) reinforcement, which shows a well-defined yield plateau in Figure 24. A sharp
change in slope is evident in Figures 212 and 214 for gauges D12 and D14 in D80-2.5. However,
a more gradual change in slope occurred in Figures 268 and 269 for gauges D5 and D6 in D120-2.5
with Grade 120 (830) reinforcement, which lacked a well-defined yield plateau in Figure 24.
Continuous strain gauge data are not shown for D120-3.5 in Figures 372 through 402 after
the second 2% cycle (end of Step 7 in Table 8) due to a recording error that occurred with the
position tracking data acquisition system. The plots of strain gauge data versus chord rotation
shown in Figures 372 through 402 show the strain for each gauge with the corresponding chord
rotation recorded by a backup system based on optical character recognition (OCR) activated each

32
time the test was paused. The strain data synchronized with the recordings of the OCR system are
shown with dashed lines and bounded by open circles.
3.7.1 Diagonal Reinforcement
The strain envelopes in Figures 489, 493, and 497 show the maximum strains measured on
the diagonal reinforcement with D gauges in the D-type specimens. The location of the gauges are
shown in Figure 33. No consistent patterns are discernible between the maximum strain measured
with the D strain gauges and either reinforcement grade or aspect ratio. However, for chord
rotations lower than 3%, specimens with Grade 120 (830) reinforcement tended to have lower
strains than other specimens, particularly for D120-2.5, which had the secondary longitudinal
reinforcement, No. 3 (10) bars developed into the end blocks.
Strain values consistent with yielding were observed in D gauges at both beam-end
interfaces. Beams with primary reinforcement of higher grade and higher aspect ratio (𝑙 ℎ⁄ )
experienced yielding at higher chord rotations. Maximum strain values were consistently measured
in D gauges located at the beam-end interfaces (D5, D6, D13, and D14, see Figure 33).
Figures 489, 493, and 497 show that the highest strain in diagonal bars exceeded 5%
(50 millistrains) in most specimens, and occasionally exceeded 7%. The highest strains generally
occurred at chord rotations between 3 and 6%, with the higher chord rotations typically defined by
beams with an aspect ratio of 3.5. In loading cycles where beam strength was decreasing, the
reported maximum strain in diagonal bars appears to decrease. This is because gauges became
inoperable where damage was most severe (and strains were highest). The envelopes (Figures 489,
493, and 497) were therefore based on working gauges where strains were relatively low at high
chord rotations.

33
Figure 504 shows the maximum strain in the diagonal bars of D-type beams during any of
the cycles of loading steps 5 through 9 (nominal chord rotations of 1 through 4%, see Table 8).
For the limited test data, an upper bound estimate of maximum strain for D-type beams with aspect
ratios of 1.5, 2.5, or 3.5 may be defined by 2𝐶𝑅, which gives 8% strain for 𝐶𝑅 4%.
3.7.2 Parallel Primary Reinforcement
The envelopes of strains measured with P gauges on the primary reinforcement (parallel to
the beam longitudinal axis) in P-type specimens, are shown in Figure 501. The overall maximum
measured strains were approximately 5% (50 millistrains) for P80-2.5 and 3% for P100-2.5, both
considerably higher than the strain associated with yielding. The strains in P80-2.5 were similar in
magnitude to the strains measured with D gauges in D-type specimens whereas the maximum
strains in P100-2.5 were lower. This may be due to the absence of a yield plateau in the
Grade 100 (690) reinforcement of P100-2.5.
The maximum strain measured with P gauges at the beam-end interfaces (P5, P6, P11, and
P12, see Figure 34) exceeded 1%, see Figures 483 and 486. Strain gauge P6 in P80-2.5 (Figure
483) recorded the maximum strains throughout the chord rotation history, but gauge P6
malfunctioned in P100-2.5 and P5 became inoperable early in the test (Figure 486). The highest
measured strains generally occurred at chord rotations higher than those corresponding to the
maximum shear (see open circles at 𝐶𝑅 in Figure 501).
Figure 505 shows the maximum strain in the primary longitudinal reinforcement of P-type
beams during any of the cycles of loading steps 5 through 9 (nominal chord rotations of 1 through
4%, see Table 8). Based on the limited test data, an upper bound estimate of maximum strain for

34
P-type beams with an aspect ratio of 2.5 may be defined by 1.5𝐶𝑅, which gives 4.5% strain for
𝐶𝑅 3%.
3.7.3 Parallel Secondary Reinforcement
Figure 33 shows the location of the H strain gauges on the secondary longitudinal
reinforcement (parallel to the beam longitudinal axis) in D-type specimens. The strain envelopes
for these gauges are shown in Figures 491, 495, and 499. All of the parallel secondary
reinforcement in D-type specimens was Grade 80 (550), and only extended 2 in. (51 mm) into the
end blocks, except for the secondary reinforcement in D120-2.5, which was Grade 120 (830) and
extended nominally 17 in. (430 mm) into the end blocks.
The maximum strains measured with H gauges in D-type beams were highly variable, with
maximum values recorded in gauges located approximately at one-third of the beam span (except
for D120-2.5). Beams with an aspect ratio of 1.5 were the only ones with strain maxima (for H
gauges) generally below yielding, strain well in excess of yielding was recorded in all other D-
type beams.
Strain gauges at the beam-end interfaces of D120-2.5 recorded maximum values near 1.3%
(13 millistrains, refer to gauges H1 and H2 in Figure 469), clearly indicating yielding of the
reinforcement. High strain demands were expected in the H gauges of D120-2.5 due to the 17-in.
(430-mm) embedment of the reinforcement into the end blocks.
3.7.4 Transverse Reinforcement
The strain envelopes for S gauges on the closed stirrups are shown in Figures 490, 494,
498, and 502 and those for T gauges on crossties are shown in Figures 492, 496, 500, and 503. The

35
locations of S and T gauges are shown in Figures 33 and 34. Grade 80 (550) transverse
reinforcement was used in all beams except D120-2.5, which had Grade 120 (830) transverse
reinforcement.
The maximum strains recorded by S gauges, for chord rotations lower than 6%, did not
exceed 0.3% (3 millistrains) in any of the beams, except D120-2.5. The recorded strain from the
closed stirrups in D120-2.5 was higher than D80-2.5 and D100-2.5, which indicates that the
developed secondary longitudinal reinforcement had an effect on distributing damage into the
beam span, with increased expansion of the concrete core and higher strains in the closed stirrups.
However, strains higher than 0.5% were not recorded, indicating that the Grade 120 closed stirrups
may not have yielded. Maximum recorded strain exceeded 0.3% in several of the S gauges in
D120-2.5. Therefore, providing higher 𝜌𝑓 than required by ACI 318-14[1] seemed to be effective
and avoided yielding of the transverse reinforcement.
Crossties along both transverse directions were instrumented (T gauges) in D-type beams.
The strain versus chord rotation envelopes (Figures 492, 496, 500, and 503) were nearly
symmetrical for both loading directions. Maximum strains were generally below 0.3% in the Grade
80 (550) transverse reinforcement except for the single instrumented crosstie (T1) in P80-2.5,
which approached 0.4%. No correlation with the grade of the primary longitudinal reinforcement
or aspect ratio (𝑙 ℎ⁄ ) was observed.

36
CHAPTER 4: CONCLUDING REMARKS
Experimental data are reported for eleven large-scale reinforced concrete coupling beams
subjected to reversed cyclic displacements. This research was conducted to investigate the use of
high-strength reinforcement in diagonally-reinforced (D-type) and moment frame (P-type)
coupling beams. Variables included nominal yield stress of the primary longitudinal reinforcement
(80, 100, and 120 ksi [550, 690, and 830 MPa]), span-to-depth (aspect) ratio (1.5, 2.5, and 3.5),
and layout of primary longitudinal reinforcement (diagonal [D] and parallel [P]). All beams had
the same nominal concrete compressive strength (8,000 psi [55 MPa]) and cross-sectional
dimensions (12 by 18 in. [300 by 460 mm]). The D-type beams were designed for a target shear
strength of 8 𝑓 𝑏 ℎ psi (0.67 𝑓 𝑏 ℎ MPa) and the P-type beams for 6 𝑓 𝑏 𝑑 psi
(0.5 𝑓 𝑏 𝑑 MPa). All transverse reinforcement was Grade 80 (550) except for one D-type beam
that had Grade 120 (830) transverse reinforcement (D120-2.5). A summary of the test data is listed
in Table 15. The main findings and observations from this study are summarized as follows:
1. Chord rotation capacities of D-type beams with Grade 100 or Grade 120 (690 or 830) diagonal
reinforcement were similar, with average deformation capacities of approximately 5, 6, and
7% for beams with aspect ratios of 1.5, 2.5, and 3.5, respectively. Deformation capacity was
based on the average chord rotation (for positive and negative loading directions)
corresponding to 20% loss of strength. These deformation capacities exceeded the minimum
chord rotation capacities in ASCE 41-17[4] for diagonally-reinforced coupling beams with
shear stresses greater than or equal to 6 𝑓 psi (0.5 𝑓 MPa).
2. D-type beams with Grade 80 (550) diagonal reinforcement exhibited approximately 25%
higher chord rotation capacities, on average, than their Grade 100 or Grade 120 (690 or 830)

37
counterparts. The increased rotation capacity of the beams with Grade 80 (550) diagonal bars
may be attributed to their lower ratio of 𝑓 to 𝑠 𝑑⁄ , where 𝑓 is the yield stress of the diagonal
bar, 𝑑 is the diameter of the diagonal bar, and 𝑠 is the spacing of the hoops, which delayed
buckling of the Grade 80 (550) diagonal bars during testing.
3. Chord rotation capacities of P-type beams with Grade 80 or Grade 100 (550 or 690)
longitudinal reinforcement were similar, with an average chord rotation capacity of
approximately 4% for beams with an aspect ratio of 2.5.
4. Measured strength of D-type beams, on average, was nearly 50% higher than the calculated
nominal shear strength (𝑉 for a diagonally-reinforced coupling beam based on 𝑓 ).
Therefore, the expected strength of diagonally-reinforced coupling beams is generally
underestimated when strength is based on only the contribution of the diagonal reinforcement.
5. Measured strength of P-type beams, on average, was approximately 15% higher than the
calculated nominal flexural strength (𝑀 for a moment frame beam based on 𝑓 and 𝑓 ).
Therefore, the probable flexural strength (based on 1.25𝑓 ) is generally conservative for
determining the required shear reinforcement for these beams.
6. For the coupling beams of this study, the initial stiffness associated with the secant to 75% of the
maximum shear (on the ascending branch of the shear-chord rotation envelope) was consistently
lower than the recommended value in ASCE 41-17[4]. The effective moment of inertia (𝐼 )
corresponding to the initial stiffness varied between 0.04𝐼 to 0.17𝐼 , with the lower coefficient
for beams with aspect ratios of 1.5 and higher for beams with aspect ratios of 3.5. These values
of 𝐼 account for the effects of shear deformations and bar slip (or strain penetration into
supports). For beams designed to a target strength (with constant 𝜌𝑓 ), the initial stiffness was
inversely proportional to the reinforcement grade.

38
7. The chord rotation capacities of D-type beams with Grade 120 (830) diagonal reinforcement were
nearly identical to those with Grade 100 (690) reinforcement, except for D120-2.5, which reached
6.9% compared with 6.0% for D100-2.5. The improved deformation capacity of D120-2.5 was
attributed to the combined effects of 1) extending the non-diagonal longitudinal reinforcement
into the end blocks to develop 1.25𝑓 , which reduced localized damage at the beam-wall
interface and 2) using higher grade of transverse reinforcement, Grade 120 (830) instead of 80
(550) with the same area and spacing as in the other D-type beams. Beam D120-2.5 reached a
strength of 15 𝑓 𝑏 ℎ psi (1.25 𝑓 𝑏 ℎ MPa) approximately 75% higher than the usable
strength (𝜙𝑉 ) permitted in ACI 318-14[1].
8. Strain gauge measurements in diagonal bars of nine D-type beams showed that maximum strains
ranged between 3 and 8% at a chord rotation of 4%, with lower maxima occurring in D120-2.5,
which had the secondary longitudinal reinforcement extended beyond the beam-wall interface to
develop 1.25𝑓 . Strain gauge data from the two P-type beams showed that maximum strains in
the primary longitudinal bars reached 4.5% at a chord rotation of 3%.

39
REFERENCES
1. ACI 318 (2014). “Building Code Requirements for Structural Concrete (ACI 318-14) and Commentary (ACI 318R-14).” American Concrete Institute, Farmington Hills, Michigan.
2. ACI 408 (2003). “Bond and Development of Straight Reinforcing Bars in Tension (ACI 408R-03).” American Concrete Institute, Farmington Hills, Michigan.
3. Ameen, S. (2019). “Diagonally-Reinforced Concrete Coupling Beams with High-Strength Steel Bars.” PhD Dissertation, The University of Kansas, Lawrence, Kansas.
4. ASCE 41 (2017). “Seismic Evaluation and Retrofit of Existing Buildings (ASCE 41-17).” American Society of Civil Engineers, Reston, Virginia.
5. ASTM A370 (2017). “Standard Test Methods and Definitions for Mechanical Testing of Steel Products (ASTM A370-17).” ASTM International, West Conshohocken, Pennsylvania.
6. ASTM A615 (2016). “Standard Specification for Deformed and Plain Carbon-Steel Bars for Concrete Reinforcement (A615-16/A615M-16).” ASTM International, West Conshohocken, Pennsylvania.
7. ASTM A706 (2016). “Standard Specification for Deformed and Plain Low-Alloy Steel Bars for Concrete Reinforcement (ASTM A706/A706M-16).” ASTM International, West Conshohocken, Pennsylvania.
8. ASTM A1035 (2016). “Standard Specification for Deformed and Plain, Low-Carbon, Chromium, Steel Bars for Concrete Reinforcement (ASTM A1035/1035M-16b).” ASTM International, West Conshohocken, Pennsylvania.
9. ASTM C39 (2017). “Standard Test Method for Compressive Strength of Cylindrical Concrete Specimens (ASTM C39/C39M-17a).” ASTM International, West Conshohocken, Pennsylvania.
10. ASTM C143 (2015). “Standard Test Method for Slump of Hydraulic-Cement Concrete (ASTM C143/C143M-15a).” ASTM International, West Conshohocken, Pennsylvania.
11. ASTM C496 (2011). “Standard Test Method for Splitting Tensile Strength of Cylindrical Concrete Specimens (ASTM C496/C496M-11).” ASTM International, West Conshohocken, Pennsylvania.
12. ASTM E8 (2016). “Standard Test Methods for Tension Testing of Metallic Materials (ASTM E8/E8M-16a).” ASTM International, West Conshohocken, Pennsylvania.
13. Barcley, L. and Kowalsky, M. (2019). “Critical Bending Strain of Reinforcing Steel and the Buckled Bar Tension Test.” ACI Materials Journal, 116 (3), 53-61.
14. FEMA 461 (2007). “Interim Testing Protocols for Determining the Seismic Performance Characteristics of Structural and Nonstructural Components.” Applied Technology Council, Redwood City, California.

40
15. Lequesne, R.D. (2011). “Behavior and Design of High-Performance Fiber-Reinforced Concrete Coupling Beams and Coupled-Wall Systems.” PhD Dissertation, University of Michigan, Ann Arbor, Michigan.
16. Naish, D., Fry, A., Klemencic, R., and Wallace, J. (2013). “Reinforced Concrete Coupling Beams – Part I: Testing.” ACI Structural Journal, 110 (6), 1057-1066.
17. NIST GCR 14-917-30 (2014). “Use of High-Strength Reinforcement in Earthquake-Resistant Concrete Structures.” National Institute of Standards and Technology, Gaithersburg, Maryland.
18. Poudel, A., Lequesne, R. D., and Lepage, A. (2018). “Diagonally-Reinforced Concrete Coupling Beams: Effects of Axial Restraint.” University of Kansas Center for Research, Inc., Lawrence, Kansas.

41
TABLES

42
Table 1 – Design data for coupling beam specimens a (1 in. = 25.4 mm, 1 ksi = 1,000 psi = 6.89 MPa)
Coupling Beamb Primary Longitudinal Reinforcement Transverse Reinforcement
Id. 𝑣 ℓℎ
ℓ 𝑓 𝑛 𝑑 ℓ c 𝐴 𝛼 𝐴 Weak Axisd
Strong Axise
𝑓 𝑠
𝑓 , psi in. ksi in. in. in.2 degrees in.2 in.2 in.2 ksi in.
D80-1.5 8.4 1.5 27 80 6 0.75 21 2.64 22.7 - 0.44 0.33 80 3
D100-1.5 8.8 1.5 27 100 5 0.75 27 2.20 22.7 - 0.44 0.33 80 3
D120-1.5 8.4 1.5 27 120 4 0.75 34 1.76 22.7 - 0.44 0.33 80 3
D80-2.5 8.0 2.5 45 80 9 0.75 21 3.96 14.2 - 0.44 0.33 80 3
D100-2.5 7.8 2.5 45 100 7 0.75 27 3.08 14.2 - 0.44 0.33 80 3
D120-2.5 8.0 2.5 45 120 6 0.75 34 2.64 14.2 - 0.44 0.33 120 3
D80-3.5 7.8 3.5 63 80 9 0.875 24 5.40 10.0 - 0.44 0.33 80 3
D100-3.5 7.3 3.5 63 100 9 0.75 27 3.96 10.3 - 0.44 0.33 80 3
D120-3.5 7.8 3.5 63 120 8 0.75 34 3.52 10.3 - 0.44 0.33 80 3
P80-2.5 5.2 2.5 45 80 3 0.75 21 - - 1.32 0.22 0.33 80 3.5
P100-2.5 6.4 2.5 45 100 3 0.75 27 - - 1.32 0.22 0.33 80 3 a For notation and definitions, see APPENDIX A: NOTATION. b All specimens have 𝑓′ 8,000 psi, ℎ 18 in., 𝑏 12 in., and 𝑐 0.75 in. to No. 3 (10) transverse
reinforcement. Specimen Id. starts with D for cases with diagonal reinforcement and P for cases with parallel reinforcement, see Figure 1.
c Minimum straight embedment length based on ACI 408R-03 Eq. 4.11.a[2] using = = = = = 1, (c + Ktr)/db = 4, 1.25𝑓 psi, and 𝑓 = 8,000 psi. Grade 80 (550) No. 3 (10) longitudinal reinforcing bars were terminated approximately 2 in. into the top and bottom blocks consistent with the detailing recommendations in the ACI Building Code[1] commentary, except for Grade 120 (830) No. 3 (10) longitudinal reinforcing bars in D120-2.5 with a minimum straight embedment length of 17 in. into the top and bottom blocks.
d Transverse reinforcement along the 12-in. width of the coupling beam; 4 legs of No. 3 (10) bars at spacing s for D-type beams and 2 legs of No. 3 (10) bars for P-type beams.
e Transverse reinforcement along the 18-in. depth of the coupling beam; 3 legs of No. 3 (10) bars at spacing s.

43
Table 2 – Measured compressive and tensile strengths of concretea (1,000 psi = 6.89 MPa)
Coupling Beam Identification
Cast Date Test Date Age (days) 𝑓 b (psi) 𝑓 c (psi)
D80-1.5 3 Nov 17 1 May 18 179 7,600 710
D100-1.5 3 Nov 17 9 Apr 18 157 8,200 720
D120-1.5 3 Nov 17 31 May 18 209 7,600 610
D80-2.5 16 Jun 17 3 Oct 17 109 8,400 620
D100-2.5 30 Jun 17 29 Nov 17 152 8,000 790
D120-2.5 18 Aug 17 6 Mar 18 200 7,800 760
D80-3.5 26 Jul 17 19 Jun 18 328 7,800 660
D100-3.5 26 Jul 17 6 Jul 18 345 7,900 650
D120-3.5 18 Aug 17 25 Jul 18 341 8,200 660
P80-2.5 16 Jun 17 10 Nov 17 147 8,300 790
P100-2.5 30 Jun 17 12 Dec 17 165 7,500 790 a For notation and definitions, see APPENDIX A: NOTATION. b Tested in accordance with ASTM C39[9], average of two tests of 6 by 12 in. (150 by 300 mm) cylinders.
c Tested in accordance with ASTM C496[11], average of two tests of 6 by 12 in. (150 by 300 mm) cylinders.

44
Table 3 – Concrete mixture proportions (1 lb = 4.45 N, 1 gal = 128 oz = 3.79 L, 1 in. = 25.4 mm, 1 yd3 = 0.764 m3)
Date of Casting
Constituent Materials Unit 16 Jun 17 30 Jun 17 26 Jul 17 18 Aug 17 3 Nov 17
Coupling Beam Identification
D80-2.5, P80-2.5 D100-2.5, P100-2.5 D80-3.5, D100-3.5 D120-2.5, D120-3.5 D80-1.5, D100-1.5,
D120-1.5
Water gal/yd3 36 36 36 36 36
Cementitious Material (CM)
Cement lb/yd3 647 647 645 668 662
Fly Ash lb/yd3 149 158 148 157 149
Fine Aggregate lb/yd3 1672 1659 1656 1658 1663
Coarse Aggregatea lb/yd3 1180 1184 1182 1178 1177
Admixturesb
Set Retarder oz/yd3 32 32 32 32 32
Rheology Modifier oz/yd3 48 48 48 48 48
Water Reducer oz/yd3 56 56 56 56 56
Water/CM 0.38 0.38 0.38 0.36 0.37
Initial Slumpc in. 9.0 10.5 9.0 9.5 9.0 a Maximum aggregate size of ½ in. b Concrete arrived at laboratory with tabulated amounts of admixtures. Supplemental water-reducing admixture was added in the laboratory to achieve a
minimum 20-in. spread before casting. c Slump measured in accordance with ASTM C143[10] when concrete arrived at laboratory.

45
Table 4 – Reinforcing steel properties a (1 in. = 25.4 mm, 1 ksi = 6.89 MPa)
Coupling Beam
Identification
Bar Size
Nominal Bar
Diameter Yield Stressb Tensile
Strengthb 𝑓𝑓 Uniform
Elongationc Fracture
Elongationd
𝑑 𝑓 𝑓 𝑓 𝜀 𝜀 No. in. ksi ksi ksi % %
D80-1.5 D80-2.5 P80-2.5
3 (10) 0.375 89 113 9.7 12.9
6 (19) 0.75 83 110 1.32 9.2 13.3
D80-3.5 3 (10) 0.375 89 113 9.7 12.9
7 (22) 0.875 84 114 1.36 10.0 16.4
D100-1.5 D100-2.5 D100-3.5 P100-2.5
3 (10) 0.375 89 113 9.7 12.9
6 (19) 0.75 108 125 1.16 6.8 9.8
D120-1.5 D120-3.5
3 (10) 0.375 89 113 9.7 12.9
6 (19) 0.75 116 163 1.41 5.2 9.9
D120-2.5 3 (10) 0.375 133 133 173 1.30 4.5 6.3
6 (19) 0.75 116 163 1.41 5.2 9.9
a For notation and definitions, see APPENDIX A: NOTATION. b Tested in accordance with ASTM A370[5]. c Corresponds to strain at peak stress, in accordance with ASTM E8[12], based on 8-in. (203-mm) gauge length. d Calculated strain corresponding to zero stress on a line with slope equal to modulus of elasticity and passing
through the fracture point, based on 8-in. (203-mm) gauge length.
Table 5 – Specimen and actuator nominal elevations relative to strong floor (1 in. = 25.4 mm)
𝑙ℎ
Top of Bottom
Block (in.) Bottom of Top
Block (in.) Actuator A
Centerline (in.) Actuator B
Centerline (in.)
1.5 39.5 66.5 21 87
2.5 36.5 81.5 45 87
3.5 36.5 99.5 51 130

46
Table 6 – List of strain gauges on primary and secondary longitudinal reinforcement
Coupling Beam Identification
D80
-1.5
D10
0-1.
5
D12
0-1.
5
D80
-2.5
D10
0-2.
5
D12
0-2.
5
D80
-3.5
D10
0-3.
5
D12
0-3.
5
P80
-2.5
P10
0-2.
5
Pri
mar
y R
einf
orce
men
t
Dia
gona
l
D1 X X X X X X X O X D2 X O X O X X X X X D3 X X X X X X X O X D4 X X X X X X X X X D5 X X X X O X X X X D6 X X X X X X X X X D7 X X X X X X X X X D8 X X X X X X O X X D9 O X X O X O X X X
D10 X X X X X X X X X D11 X X X X O X X X X D12 X X X X O X X X X D13 X X O O X X X X X D14 X X X X X X X X X
Par
alle
la
P1 X X P2 X O P3 X X P4 X X P5 X X P6 X O P7 X X P8 X O P9 X X
P10 X X P11 X X P12 X X
Sec
onda
ry R
einf
orce
men
t
Par
alle
lb
H1 X O O X X X X X X H2 X O X X O X O X X H3 X X X X O X O X X H4 X X X X X X X O X H5 X X O X X O X O X H6 X X X X O X X H7 X O O X H8 O X X H9 X X X
H10 X X H11 X O X H12 X X H13 X H14 X
“X” indicates strain gauge is present. “O” indicates strain gauge is present but data not available due to instrument malfunction.
a No. 6 (19) reinforcement placed parallel to the longitudinal axis of the P-type beams.
b No. 3 (10) reinforcement placed parallel to the longitudinal axis of the D-type beams.

47
Table 7 – List of strain gauges on transverse reinforcement
Coupling Beam Identification
D80
-1.5
D10
0-1.
5
D12
0-1.
5
D80
-2.5
D10
0-2.
5
D12
0-2.
5
D80
-3.5
D10
0-3.
5
D12
0-3.
5
P80
-2.5
P10
0-2.
5
Tra
nsve
rse
Rei
nfor
cem
ent
Clo
sed
Sti
rrup
s
S1 O O X O X O O O O X X S2 X X X X X X X X X X X S3 X X X X X X X X X O X S4 X X X X X X X X X O X S5 X X X X O X X X X X X S6 X O X X X X X X X X X S7 X X X X X X X X X X X S8 X X X X X X X X X X X S9 X X X X X X X O X X X
S10 X S11 X S12 X S13 X S14 X S15 X S16 X S17 X S18 O
Cro
sstie
s
T1 X X O X X X X X X X X T2 X X O X X X X X X T3 X X X O X X X X X T4 X X X T5 X X T6 X
“X” indicates strain gauge is present. “O” indicates strain gauge is present but data not available due to instrument malfunction.

48
Table 8 – Loading protocol (1 in. = 25.4 mm)
Stepa
Chord Rotationb
%
Loading Rate in./s c
1 0.20 0.01
2 0.30 0.01
3 0.50 0.01
4 0.75 0.01
5 1.00 0.02
6 1.50 0.02
7 2.00 0.02
8 3.00 0.03
9 4.00 0.03
10 6.00 0.04
11 8.00 0.04
12 10.00 0.04
a Two cycles of loading in each step, following recommendations in FEMA 461[14], see Figure 35.
b Based on the relative lateral displacement between end blocks divided by the beam clear span (excluding contributions due to sliding of the specimen and rotation of the end blocks).
c Loading rate of coupling beams with aspect ratios of 1.5 and 2.5. Coupling beams with an aspect ratio of 3.5 were tested at twice these rates.

49
Table 9 – Coupling beam maximum shear stress and deformation capacitya (1,000 psi = 6.89 MPa, 1 kip = 4.45 kN)
Coupling Beam
Id.
Maximum Applied Shear 𝑉
Maximum Applied Shear Stress 𝑣
Deformation Capacity
A b
Deformation Capacity
B c
kips 𝑓 , psi % %
D80-1.5 254 13.5 6.1 6.9
D100-1.5 257 13.1 4.9 5.3
D120-1.5 264 14.0 4.6 5.2
D80-2.5 220 11.1 7.1 7.6
D100-2.5 220 11.4 5.3 6.0
D120-2.5 286 15.0 6.6 6.9
D80-3.5 219 11.5 8.3 8.6
D100-3.5 196 10.2 6.3 6.8
D120-3.5 216 11.0 6.5 6.7
P80-2.5 91 5.0 3.6 3.9
P100-2.5 110 6.4 3.6 4.1 a For notation and definitions, see APPENDIX A: NOTATION. b The average of the highest chord rotations reached in each loading direction before strength
diminished to less than 80% of the maximum applied shear.
c The average of the chord rotations in each loading direction where the envelope curve formed by connecting the maximum chord rotation of the first cycle of each loading step intersects with 80% of the maximum applied shear.
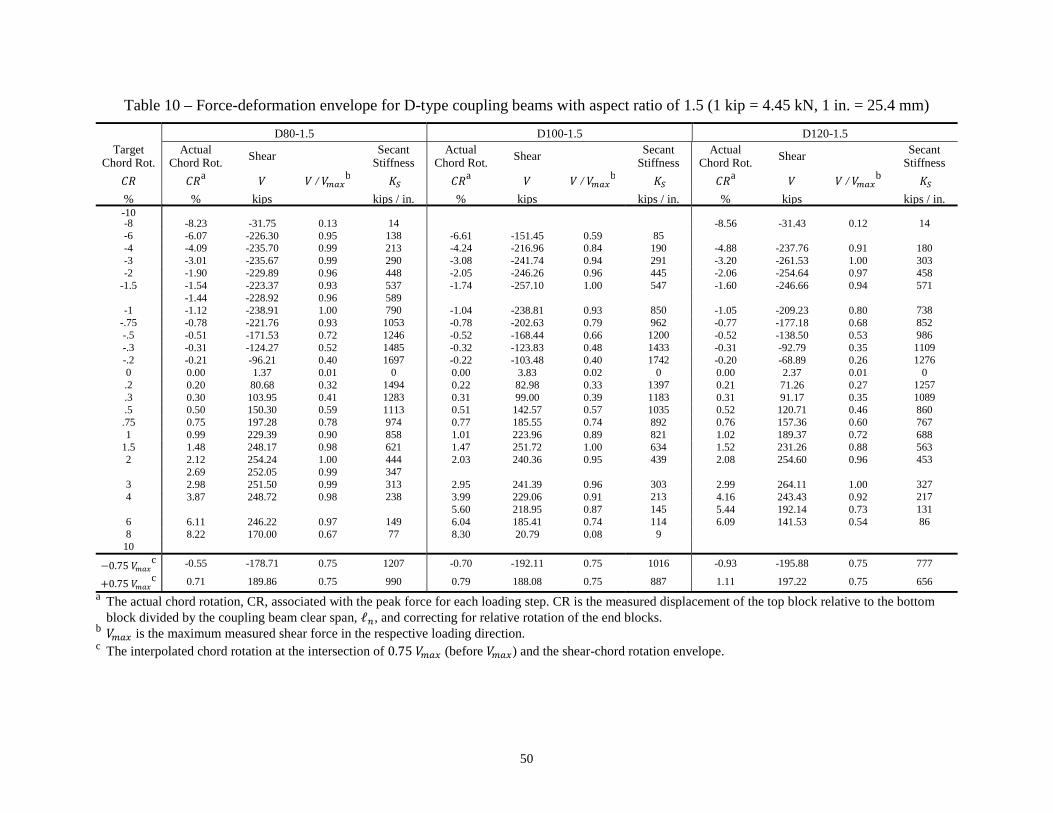
50
Table 10 – Force-deformation envelope for D-type coupling beams with aspect ratio of 1.5 (1 kip = 4.45 kN, 1 in. = 25.4 mm)
D80-1.5 D100-1.5 D120-1.5 Target
Chord Rot. Actual
Chord Rot. Shear
Secant Stiffness
Actual Chord Rot.
Shear Secant
Stiffness Actual
Chord Rot. Shear Secant
Stiffness
𝐶𝑅 𝐶𝑅a 𝑉 𝑉 / 𝑉 b 𝐾 𝐶𝑅a 𝑉 𝑉 / 𝑉 b 𝐾 𝐶𝑅a 𝑉 𝑉 / 𝑉 b 𝐾
% % kips kips / in. % kips kips / in. % kips kips / in. -10 -8 -8.23 -31.75 0.13 14 -8.56 -31.43 0.12 14 -6 -6.07 -226.30 0.95 138 -6.61 -151.45 0.59 85 -4 -4.09 -235.70 0.99 213 -4.24 -216.96 0.84 190 -4.88 -237.76 0.91 180 -3 -3.01 -235.67 0.99 290 -3.08 -241.74 0.94 291 -3.20 -261.53 1.00 303 -2 -1.90 -229.89 0.96 448 -2.05 -246.26 0.96 445 -2.06 -254.64 0.97 458
-1.5 -1.54 -223.37 0.93 537 -1.74 -257.10 1.00 547 -1.60 -246.66 0.94 571 -1.44 -228.92 0.96 589
-1 -1.12 -238.91 1.00 790 -1.04 -238.81 0.93 850 -1.05 -209.23 0.80 738 -.75 -0.78 -221.76 0.93 1053 -0.78 -202.63 0.79 962 -0.77 -177.18 0.68 852 -.5 -0.51 -171.53 0.72 1246 -0.52 -168.44 0.66 1200 -0.52 -138.50 0.53 986 -.3 -0.31 -124.27 0.52 1485 -0.32 -123.83 0.48 1433 -0.31 -92.79 0.35 1109 -.2 -0.21 -96.21 0.40 1697 -0.22 -103.48 0.40 1742 -0.20 -68.89 0.26 1276 0 0.00 1.37 0.01 0 0.00 3.83 0.02 0 0.00 2.37 0.01 0 .2 0.20 80.68 0.32 1494 0.22 82.98 0.33 1397 0.21 71.26 0.27 1257 .3 0.30 103.95 0.41 1283 0.31 99.00 0.39 1183 0.31 91.17 0.35 1089 .5 0.50 150.30 0.59 1113 0.51 142.57 0.57 1035 0.52 120.71 0.46 860 .75 0.75 197.28 0.78 974 0.77 185.55 0.74 892 0.76 157.36 0.60 767 1 0.99 229.39 0.90 858 1.01 223.96 0.89 821 1.02 189.37 0.72 688
1.5 1.48 248.17 0.98 621 1.47 251.72 1.00 634 1.52 231.26 0.88 563 2 2.12 254.24 1.00 444 2.03 240.36 0.95 439 2.08 254.60 0.96 453 2.69 252.05 0.99 347 3 2.98 251.50 0.99 313 2.95 241.39 0.96 303 2.99 264.11 1.00 327 4 3.87 248.72 0.98 238 3.99 229.06 0.91 213 4.16 243.43 0.92 217 5.60 218.95 0.87 145 5.44 192.14 0.73 131 6 6.11 246.22 0.97 149 6.04 185.41 0.74 114 6.09 141.53 0.54 86 8 8.22 170.00 0.67 77 8.30 20.79 0.08 9
10
0.75 𝑉 c -0.55 -178.71 0.75 1207 -0.70 -192.11 0.75 1016 -0.93 -195.88 0.75 777
0.75 𝑉 c 0.71 189.86 0.75 990 0.79 188.08 0.75 887 1.11 197.22 0.75 656
a The actual chord rotation, CR, associated with the peak force for each loading step. CR is the measured displacement of the top block relative to the bottom block divided by the coupling beam clear span, ℓ , and correcting for relative rotation of the end blocks.
b 𝑉 is the maximum measured shear force in the respective loading direction. c The interpolated chord rotation at the intersection of 0.75 𝑉 (before 𝑉 ) and the shear-chord rotation envelope.

51
Table 11 – Force-deformation envelope for D-type coupling beams with aspect ratio of 2.5 (1 kip = 4.45 kN, 1 in. = 25.4 mm)
D80-2.5 D100-2.5 D120-2.5 Target
Chord Rot. Actual
Chord Rot. Shear Secant
Stiffness Actual
Chord Rot. Shear
Secant Stiffness
Actual Chord Rot.
Shear Secant Stiffness
𝐶𝑅 𝐶𝑅a 𝑉 𝑉 / 𝑉 b 𝐾 𝐶𝑅a 𝑉 𝑉 / 𝑉 b 𝐾 𝐶𝑅a 𝑉 𝑉 / 𝑉 b 𝐾
% % kips kips / in. % kips kips / in. % kips kips / in. -10 -10.01 -20.96 0.10 5 -8 -7.91 -131.70 0.60 37 -7.99 -46.15 0.21 13 -8.35 -119.57 0.42 32 -6 -5.91 -216.84 0.99 82 -6.04 -127.65 0.58 47 -6.42 -243.63 0.86 84 -4 -3.85 -215.74 0.98 125 -4.67 -216.89 0.99 103 -4.30 -283.46 1.00 146 -3 -3.11 -220.13 1.00 157 -3.15 -272.27 0.96 192 -2 -2.03 -213.19 0.97 233 -2.48 -220.12 1.00 197 -2.04 -241.03 0.85 263
-1.5 -1.51 -201.65 0.92 297 -1.50 -207.61 0.94 308 -1.56 -217.28 0.77 310 -1 -0.99 -170.95 0.78 384 -0.98 -167.82 0.76 381 -1.00 -162.48 0.57 361
-.75 -0.70 -144.26 0.66 458 -0.75 -138.02 0.63 409 -0.74 -134.47 0.47 404 -.5 -0.47 -108.58 0.49 513 -0.50 -101.22 0.46 450 -0.53 -105.53 0.37 442 -.3 -0.28 -80.44 0.37 638 -0.29 -73.03 0.33 560 -0.31 -65.09 0.23 467 -.2 -0.23 -72.21 0.33 698 -0.19 -60.27 0.27 705 -0.20 -40.35 0.14 448 0 0.00 0.00 0.00 0 0.00 0.00 0.00 0 0.01 2.10 0.01 467 .2 0.23 63.45 0.29 613 0.20 58.02 0.27 645 0.20 40.13 0.14 446 .3 0.38 92.87 0.43 543 0.33 76.62 0.36 516 0.31 64.96 0.23 466 .5 0.48 106.54 0.49 493 0.54 102.19 0.48 421 0.61 116.76 0.41 425 .75 0.76 142.91 0.66 418 0.81 144.25 0.67 396 0.77 138.26 0.48 399 1 0.98 166.18 0.76 377 1.04 170.74 0.80 365 1.01 168.12 0.59 370
1.5 1.89 212.34 0.97 250 1.45 203.97 0.95 313 1.50 216.83 0.76 321 2 2.06 193.89 0.89 209 2.16 214.25 1.00 220 2.10 251.95 0.88 267 3 2.92 209.56 0.96 159 3.06 210.68 0.98 153 3.15 277.43 0.97 196 4 3.94 207.45 0.95 117 4.02 194.51 0.91 108 4.29 285.94 1.00 148 5.80 271.60 0.95 104 6 6.00 217.95 1.00 81 6.01 191.05 0.89 71 6.68 251.57 0.88 84 8 8.17 180.68 0.83 49 8.12 124.04 0.58 34 9.11 94.56 0.33 23
10
0.75 𝑉 c -0.92 -164.28 0.75 398 -0.96 -165.53 0.75 382 -1.50 -211.80 0.75 313
0.75 𝑉 c 0.96 163.85 0.75 380 0.95 160.55 0.75 375 1.47 213.96 0.75 323
a The actual chord rotation, CR, associated with the peak force for each loading step. CR is the measured displacement of the top block relative to the bottom block divided by the coupling beam clear span, ℓ , and correcting for relative rotation of the end blocks.
b 𝑉 is the maximum measured shear force in the respective loading direction. c The interpolated chord rotation at the intersection of 0.75 𝑉 (before 𝑉 ) and the shear-chord rotation envelope.

52
Table 12 – Force-deformation envelope for D-type coupling beams with aspect ratio of 3.5 (1 kip = 4.45 kN, 1 in. = 25.4 mm)
D80-3.5 D100-3.5 D120-3.5 Target
Chord Rot. Actual
Chord Rot. Shear
Secant Stiffness
Actual Chord Rot.
Shear Secant
Stiffness Actual
Chord Rot. Shear Secant
Stiffness
𝐶𝑅 𝐶𝑅a 𝑉 𝑉 / 𝑉 b 𝐾 𝐶𝑅a 𝑉 𝑉 / 𝑉 b 𝐾 𝐶𝑅a 𝑉 𝑉 / 𝑉 b 𝐾
% % kips kips / in. % kips kips / in. % kips kips / in. -10 -10.29 -53.91 0.25 8 -10.25 -38.06 0.20 6 -8 -8.24 -182.26 0.84 35 -8.09 -102.84 0.54 20 -7.91 -93.00 0.43 19 -6 -6.04 -217.50 1.00 57 -6.35 -180.91 0.94 45 -6.38 -184.10 0.85 46 -4 -4.13 -209.83 0.96 81 -4.12 -186.92 0.97 72 -4.08 -215.70 1.00 84 -3 -3.09 -207.46 0.95 107 -3.10 -191.73 1.00 98 -3.01 -214.54 0.99 113 -2 -2.16 -204.24 0.94 150 -2.11 -189.19 0.99 142 -1.97 -191.87 0.89 155
-1.5 -1.56 -195.04 0.90 198 -1.58 -175.56 0.92 176 -1.58 -172.44 0.80 173 -1 -1.08 -164.62 0.76 242 -1.05 -134.79 0.70 204 -1.03 -129.45 0.60 199
-.75 -0.77 -125.98 0.58 260 -0.76 -106.16 0.55 222 -0.77 -105.13 0.49 217 -.5 -0.51 -95.35 0.44 297 -0.51 -77.91 0.41 242 -0.51 -78.48 0.36 244 -.3 -0.30 -66.42 0.31 351 -0.31 -55.74 0.29 285 -0.31 -55.70 0.26 285 -.2 -0.22 -46.14 0.21 333 -0.22 -45.86 0.24 331 -0.20 -40.57 0.19 322 0 0.00 -0.16 0.00 0 0.00 1.63 0.01 0 0.00 0.06 0.00 0 .2 0.22 49.87 0.23 360 0.26 52.65 0.27 321 0.23 43.16 0.20 298 .3 0.34 71.92 0.33 336 0.31 57.99 0.30 297 0.33 57.05 0.27 274 .5 0.51 95.47 0.44 297 0.53 86.95 0.44 260 0.53 79.80 0.38 239
.75 0.78 130.92 0.60 266 0.77 114.71 0.59 236 0.78 104.60 0.49 213 1 1.08 166.34 0.76 244 1.02 139.32 0.71 217 1.02 126.60 0.60 197
1.5 1.55 196.19 0.90 201 1.57 177.08 0.90 179 1.55 161.65 0.76 166 2 2.03 206.40 0.95 161 2.02 187.53 0.96 147 2.07 182.77 0.86 140 3 3.13 212.97 0.98 108 3.16 195.99 1.00 98 3.04 211.46 1.00 110 4 4.16 211.81 0.97 81 4.36 189.27 0.97 69 4.14 212.40 1.00 81 6 5.96 219.40 1.00 57 6.20 184.12 0.94 47 6.53 191.10 0.90 46 8 8.28 211.74 0.97 41 8.11 94.05 0.48 18 8.48 62.12 0.29 12
10 10.20 84.96 0.39 13 10.25 34.29 0.17 5
0.75 𝑉 c -1.07 -163.13 0.75 242 -1.17 -144.06 0.75 195 -1.44 -161.69 0.75 178
0.75 𝑉 c 1.06 164.25 0.75 245 1.14 147.27 0.75 206 1.52 159.46 0.75 167
a The actual chord rotation, CR, associated with the peak force for each loading step. CR is the measured displacement of the top block relative to the bottom block divided by the coupling beam clear span, ℓ , and correcting for relative rotation of the end blocks.
b 𝑉 is the maximum measured shear force in the respective loading direction. c The interpolated chord rotation at the intersection of 0.75 𝑉 (before 𝑉 ) and the shear-chord rotation envelope.

53
Table 13 – Force-deformation envelope for P-type coupling beams with aspect ratio of 2.5 (1 kip = 4.45 kN, 1 in. = 25.4 mm)
P80-2.5 P100-2.5 Target
Chord Rot. Actual
Chord Rot. Shear
Secant Stiffness
Actual Chord Rot.
Shear Secant Stiffness
𝐶𝑅 𝐶𝑅a 𝑉 𝑉 / 𝑉 b 𝐾 𝐶𝑅a 𝑉 𝑉 / 𝑉 b 𝐾
% % kips kips / in. % kips kips / in. -10 -8 -6 -6.03 -16.81 0.19 6 -6.53 -29.39 0.27 10 -4 -4.06 -39.15 0.44 21 -4.02 -96.44 0.89 53 -3 -3.04 -77.09 0.86 56 -3.23 -106.60 0.98 73 -2 -1.98 -89.56 1.00 101 -2.05 -108.48 1.00 118
-1.5 -1.50 -87.17 0.97 129 -1.46 -104.53 0.96 159 -1 -1.01 -82.07 0.92 181 -0.99 -95.65 0.88 215
-.75 -0.84 -80.11 0.89 212 -0.73 -82.75 0.76 252 -.5 -0.47 -66.10 0.74 313 -0.50 -67.15 0.62 298 -.3 -0.35 -58.97 0.66 374 -0.29 -50.74 0.47 389 -.2 -0.19 -42.31 0.47 495 -0.23 -44.38 0.41 429 0 0.00 0.00 0.00 0 0.00 0.00 0.00 0 .2 0.18 42.34 0.47 523 0.23 41.34 0.38 399 .3 0.31 52.68 0.58 378 0.35 51.10 0.47 324 .5 0.55 73.64 0.81 298 0.58 63.98 0.58 245 .75 0.82 84.79 0.94 230 0.77 83.49 0.76 241 1 1.00 84.80 0.94 188 1.09 98.78 0.90 201
1.5 1.58 88.92 0.98 125 1.76 109.85 1.00 139 2 1.93 88.61 0.98 102 2.11 107.52 0.98 113 3 2.86 90.58 1.00 70 3.18 106.76 0.97 75 4 4.09 80.15 0.88 44 4.10 76.02 0.69 41 6 7.09 30.53 0.34 10 6.15 48.95 0.45 18 8
10
0.75 𝑉 c -0.50 -67.17 0.75 299 -0.71 -81.64 0.75 255
0.75 𝑉 c 0.48 67.94 0.75 311 0.76 82.41 0.75 241
a The actual chord rotation, CR, associated with the peak force for each loading step. CR is the measured displacement of the top block relative to the bottom block divided by the coupling beam clear span, ℓ , and correcting for relative rotation of the end blocks.
b 𝑉 is the maximum measured shear force in the respective loading direction. c The interpolated chord rotation at the intersection of 0.75 𝑉 (before 𝑉 ) and the shear-chord rotation
envelope.

54
Table 14 – Coupling beam measured and calculated strengthsa (1,000 psi = 6.89 MPa, 1 kip = 4.45 kN)
Coupling Beam
Id. Measured Calculated
Measured-to-Calculated
Ratiob
𝑉 𝑣 𝑉 2𝑀 𝑙⁄ 𝑣
kips 𝑓 , psi kips kips 𝑓 , psi
D80-1.5 254 13.5 169 - 9.0 1.50
D100-1.5 257 13.1 183 - 9.4 1.40
D120-1.5 264 14.0 158 - 8.4 1.68
D80-2.5 220 11.1 161 - 8.1 1.36
D100-2.5 220 11.4 163 - 8.4 1.35
D120-2.5 286 15.0 150 - 7.9 1.90
D80-3.5 219 11.5 158 - 8.3 1.39
D100-3.5 196 10.2 153 - 8.0 1.28
D120-3.5 216 11.0 146 - 7.5 1.48
P80-2.5 91 5.0 - 77 4.3 1.18
P100-2.5 110 6.4 - 99 5.8 1.11
a For notation and definitions, see APPENDIX A: NOTATION.
b The average of measured-to-calculated ratios is 1.43 for D-type beams (excluding D120-2.5) and 1.15 for P-type beams.

55
Table 15 – Summary of test dataa (1 ksi = 1000 psi = 6.89 MPa)
Coupling Beam Id.
Reinforcement Type
ℓℎ
𝑓 𝑓 𝑓 𝑣 b 𝑣 c
Measured Chord
Rotation Capacityd
ASCE 41-17 Chord
Rotation Capacitye
psi ksi ksi 𝑓 , psi 𝑓 , psi % %
D80-1.5 Diagonal 1.5 7,600 83 89 13.5 9.0 6.9 5.0
D100-1.5 Diagonal 1.5 8,200 108 89 13.1 9.4 5.3 5.0
D120-1.5 Diagonal 1.5 7,600 116 89 14.0 8.4 5.2 5.0
D80-2.5 Diagonal 2.5 8,400 83 89 11.1 8.1 7.6 5.0
D100-2.5 Diagonal 2.5 8,000 108 89 11.4 8.4 6.0 5.0
D120-2.5 Diagonal 2.5 7,800 116 133 15.0 7.9 6.9 5.0
D80-3.5 Diagonal 3.5 7,800 84 89 11.5 8.3 8.6 5.0
D100-3.5 Diagonal 3.5 7,900 108 89 10.2 8.0 6.8 5.0
D120-3.5 Diagonal 3.5 8,200 116 89 11.0 7.5 6.7 5.0
P80-2.5 Parallel 2.5 8,300 83 89 5.0 4.3 3.9 4.0f
P100-2.5 Parallel 2.5 7,500 108 89 6.4 5.8 4.1 4.0f a For notation and definitions, see APPENDIX A: NOTATION.
b Shear stress associated with maximum applied shear 𝑉 . For D-type beams, 𝑣 𝑉 𝑏 ℎ⁄ . For P-type beams, 𝑣 𝑉 𝑏 𝑑⁄ .
c For D-type beams, 𝑣 2𝐴 𝑓 sin 𝛼 𝑏 ℎ⁄ . For P-type beams, 𝑣 2𝑀 ℓ⁄ 𝑏 𝑑⁄ .
d The average of the chord rotations in each loading direction where the envelope curve formed by connecting the maximum chord rotation of the first cycle of each loading step intersects with 80% of the maximum applied shear.
e Chord rotation capacity from ASCE 41-17[4] Table 10-19 corresponding to the maximum chord rotation associated with the residual strength defined by segment D-E in ASCE 41-17[4] Figure 10-1(b). It is important to note that the measured chord rotation capacity (see footnote d) corresponds to a higher residual strength than those used in ASCE 41-17[4], where the residual strength is defined as 80% of the strength at point B in Figure 10-1(b)[4].
f The reported ASCE 41-17[4] chord rotation capacity is taken from Table 10-19[4] and corresponds to a residual strength of 50% of the strength at point B in Figure 10-1(b)[4]. In contrast, the measured chord rotation capacity (see footnote d) corresponds to the chord rotation associated with a post-peak strength of 80% of the maximum applied shear.

56
FIGURES

57
(a) P-type beam (b) D-type beam
Figure 1 – Reinforcement layout types, parallel (P) and diagonal (D)

58
Figure 2 – Elevation view of D80-1.5 (1 in. = 25.4 mm)
2" EM
BED
.

59
Figure 3 – Reinforcement details of D80-1.5 (1 in. = 25.4 mm, 1 ksi = 1,000 psi = 6.89 MPa)
11 1/
2”
39 1
/2”
22”
27”
51 1
/2”
22”
18”
12”

60
Figure 4 – Elevation view of D100-1.5 (1 in. = 25.4 mm)
2" EM
BED
.

61
Figure 5 – Reinforcement details of D100-1.5 (1 in. = 25.4 mm, 1 ksi = 1,000 psi = 6.89 MPa)
11 2"11 2"
39 1
/2”
27”
51 1
/2”
22”
22”
18”
12”

62
Figure 6 – Elevation view of D120-1.5 (1 in. = 25.4 mm)
EM
BED
.2"
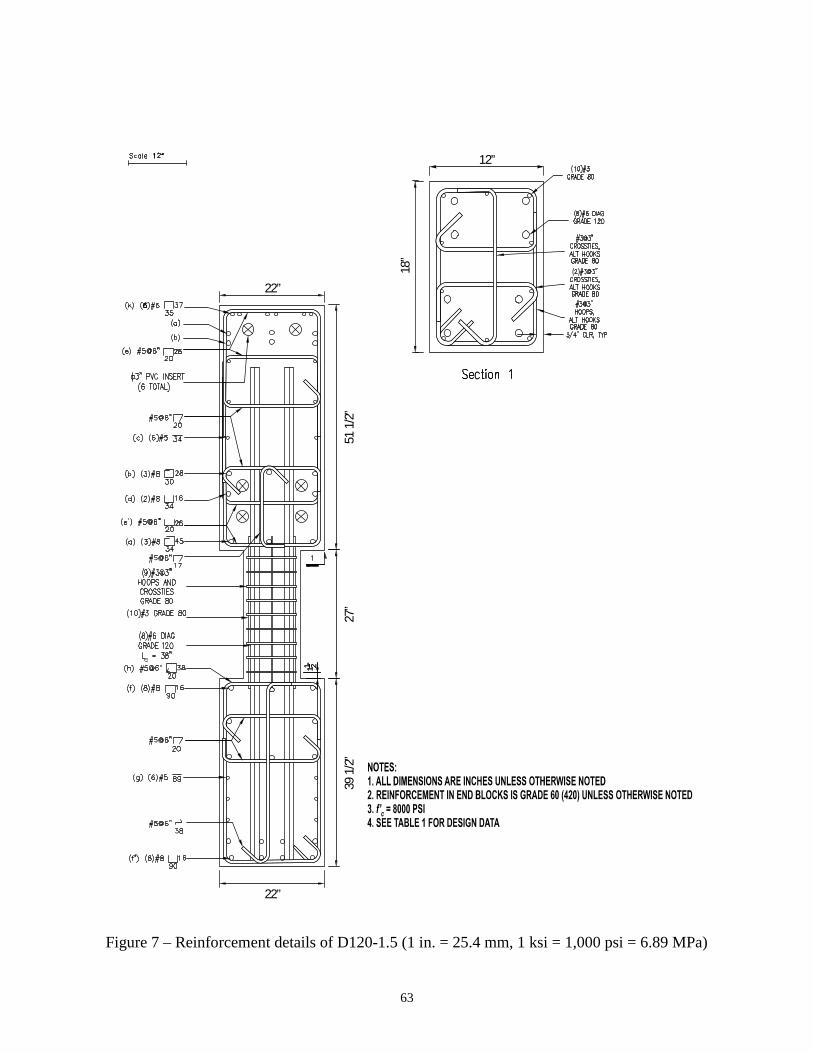
63
Figure 7 – Reinforcement details of D120-1.5 (1 in. = 25.4 mm, 1 ksi = 1,000 psi = 6.89 MPa)
39 1
/2”
22”
27”
51 1
/2”
22”
18”
12”
11 2"11 2"

64
Figure 8 – Elevation view of D80-2.5 (1 in. = 25.4 mm)
2" EMBE
D.

65
Figure 9 – Reinforcement details of D80-2.5 (1 in. = 25.4 mm, 1 ksi = 1,000 psi = 6.89 MPa)
11 2"11 2"
36 1
/2”
22”
45”
48 1
/2”
22”
18”
12”

66
Figure 10 – Elevation view of D100-2.5 (1 in. = 25.4 mm)
2" EMBE
D.

67
Figure 11 – Reinforcement details of D100-2.5 (1 in. = 25.4 mm, 1 ksi = 1,000 psi = 6.89 MPa)
11 2"11 2"
36 1
/2”
22”
45”
48 1
/2”
22”
18”
12”

68
Figure 12 – Elevation view of D120-2.5 (1 in. = 25.4 mm)
21"
EM
BED
.

69
Figure 13 – Reinforcement details of D120-2.5 (1 in. = 25.4 mm, 1 ksi = 1,000 psi = 6.89 MPa)
11 2"11 2"
36 1
/2”
22”
45”
48 1
/2”
22”
18”
12”

70
Figure 14 – Elevation view of D80-3.5 (1 in. = 25.4 mm)
2" EM
BE
D.

71
Figure 15 – Reinforcement details of D80-3.5 (1 in. = 25.4 mm, 1 ksi = 1,000 psi = 6.89 MPa)
11 2"11 2"
36 1
/2”
22”
63”
48 1
/2”
22”
18”
12”

72
Figure 16 – Elevation view of D100-3.5 (1 in. = 25.4 mm)
63"
2"
63"
EM
BE
D.

73
Figure 17 – Reinforcement details of D100-3.5 (1 in. = 25.4 mm, 1 ksi = 1,000 psi = 6.89 MPa)
11 2"11 2"
36 1
/2”
22”
63”
48 1
/2”
22”
18”
12”

74
Figure 18 – Elevation view of D120-3.5 (1 in. = 25.4 mm)
63"
2"
63"
EM
BE
D.

75
Figure 19 – Reinforcement details of D120-3.5 (1 in. = 25.4 mm, 1 ksi = 1,000 psi = 6.89 MPa)
11 2"11 2"
36 1
/2”
22”
63”
48 1
/2”
22”
18”
12”

76
Figure 20 – Elevation view of P80-2.5 (1 in. = 25.4 mm)

77
Figure 21 – Reinforcement details of P80-2.5 (1 in. = 25.4 mm, 1 ksi = 1,000 psi = 6.89 MPa)
11 2"11 2"
36 1
/2”
22”
45”
48 1
/2”
22”
18”
12”

78
Figure 22 – Elevation view of P100-2.5 (1 in. = 25.4 mm)

79
Figure 23 – Reinforcement details of P100-2.5 (1 in. = 25.4 mm, 1 ksi = 1,000 psi = 6.89 MPa)
11 2"11 2"
36 1
/2”
22”
45”
48 1
/2”
22”
18”
12”

80
Figure 24 – Measured stress versus strain for reinforcement
0.00 0.05 0.10 0.15 0.20Strain
0
45
90
135
180
Str
ess,
ksi
0
315
630
945
1260
Str
ess,
MP
a
Gr.120 #3 Gr.120 #6 Gr.100 #6 Gr. 80 #7 Gr. 80 #3 Gr. 80 #6 0.2% Offset

81
Figure 25 – Test setup, view from northeast
Figure 26 – Test setup, view from northwest
HP Section Top Block
Bottom Block
Infrared Markers
Threaded Rods
Spacer
External Bracing
Actuators
Mirror Plate
Instrument Stand
Nylon Pad
Bottom Block
HP Section
Mirror Plate
Nylon Pad

82
Figure 27 – Test setup, plan view
Actuators
Strong
Wall
Infrared Marker
Coupling Beam
Steel Shims
Positive Chord Rotation
External Bracing
Strong Floor Hole(3’-0” Spacing)
Top BlockBottom Block
Surface
(Eastward)
HP Section
N
HP Section
Mirrored Plate
HSS Section
Nylon Pads

83
a External bracing omitted for clarity. Actuator and coupling beam elevations in Table 5.
Figure 28 – Test setup for coupling beams with aspect ratio of 1.5a
Figure 29 – Test setup for coupling beams with aspect ratio of 2.5a

84
a External bracing omitted for clarity. Actuator and coupling beam elevations in Table 5.
Figure 30 – Test setup for coupling beams with aspect ratio of 3.5a

85
Figure 31 – LVDT locations (1 in. = 25.4 mm)
Figure 32 – Infrared marker positions (1 in. = 25.4 mm)

86
Figure 33 – Strain gauge layout (view from north), D-type specimens
H2, H10
North SideW
est Sid
e
S7,S8,S10,S11,S12,S13

87
Figure 34 – Strain gauge layout (view from north), P-type specimens
S1
S4
S7
S9
S8
S2
S5
P5
P3
P1
P7
P9
P11
P6
P4
P2
P8
P10
P12
Hoop 1
P1, P3, P5,P7, P9, P11
P2, P4, P6,P8, P10, P12
T1
S4
S6
S5
West S
ide
S1
S3
S2
Hoop 2
South Side
North Side
S7, S8, S9

88
-12
-9
-6
-3
0
3
6
9
12
Cho
rdR
otat
ion,
% 1 Cycle
1 Step
Figure 35 – Loading protocola
a Values listed in Table 8. b Positive displacement corresponds to actuator extension toward laboratory east.
Figure 36 – General deformed shape of specimen, view from northb
lnγδ
δ
δθ
θ
θ
γ= ln
CR= top
δtop δbot
(γ θtop (γ θbot2
ActuatorSide
(West)
θbot
δbot
δtop

89
-12 -6 0 6 12Chord Rotation, %
-300
-150
0
150
300
She
ar,
kips
-15.5
-7.75
0
7.75
15.5
She
arS
tres
s/√
f c',ps
i/psi
Figure 37 – Shear versus chord rotation for D80-1.5 (1,000 psi = 6.89 MPa, 1 kip = 4.45 kN)
-12 -6 0 6 12Chord Rotation, %
-300
-150
0
150
300
She
ar,
kips
-15.5
-7.75
0
7.75
15.5
She
arS
tres
s/√
f c',ps
i/psi
Figure 38 – Shear versus chord rotation for D100-1.5 (1,000 psi = 6.89 MPa, 1 kip = 4.45 kN)

90
Figure 39 – Shear versus chord rotation for D120-1.5 (1,000 psi = 6.89 MPa, 1 kip = 4.45 kN)
-12 -6 0 6 12Chord Rotation, %
-300
-150
0
150
300
She
ar,
kips
-15.5
-7.75
0
7.75
15.5
She
arS
tres
s/√
f c',ps
i/psi
Figure 40 – Shear versus chord rotation for D80-2.5 (1,000 psi = 6.89 MPa, 1 kip = 4.45 kN)
-12 -6 0 6 12Chord Rotation, %
-300
-150
0
150
300
She
ar,
kips
-15.5
-7.75
0
7.75
15.5
She
arS
tres
s/√
f c',ps
i/psi

91
-12 -6 0 6 12Chord Rotation, %
-300
-150
0
150
300
She
ar,
kips
-15.5
-7.75
0
7.75
15.5
She
arS
tres
s/√
f c',ps
i/psi
Figure 41 – Shear versus chord rotation for D100-2.5 (1,000 psi = 6.89 MPa, 1 kip = 4.45 kN)
-12 -6 0 6 12Chord Rotation, %
-300
-150
0
150
300
She
ar,
kips
-15.5
-7.75
0
7.75
15.5
She
arS
tres
s/√
f c',ps
i/psi
Figure 42 – Shear versus chord rotation for D120-2.5 (1,000 psi = 6.89 MPa, 1 kip = 4.45 kN)

92
-12 -6 0 6 12Chord Rotation, %
-300
-150
0
150
300
She
ar,
kips
-15.5
-7.75
0
7.75
15.5
She
arS
tres
s/√
f c',ps
i/psi
Figure 43 – Shear versus chord rotation for D80-3.5 (1,000 psi = 6.89 MPa, 1 kip = 4.45 kN)
-12 -6 0 6 12Chord Rotation, %
-300
-150
0
150
300
She
ar,
kips
-15.5
-7.75
0
7.75
15.5
She
arS
tres
s/√
f c',ps
i/psi
Figure 44 – Shear versus chord rotation for D100-3.5 (1,000 psi = 6.89 MPa, 1 kip = 4.45 kN)

93
-12 -6 0 6 12Chord Rotation, %
-300
-150
0
150
300
She
ar,
kips
-15.5
-7.75
0
7.75
15.5
She
arS
tres
s/√
f c',ps
i/psi
Figure 45 – Shear versus chord rotation for D120-3.5 (1,000 psi = 6.89 MPa, 1 kip = 4.45 kN)

94
-12 -6 0 6 12Chord Rotation, %
-150
-75
0
75
150
She
ar,
kips
-8.5
-4.25
0
4.25
8.5
She
arS
tres
s/√
f c',ps
i/psi
Figure 46 – Shear versus chord rotation for P80-2.5 (1,000 psi = 6.89 MPa, 1 kip = 4.45 kN)
-12 -6 0 6 12Chord Rotation, %
-150
-75
0
75
150
She
ar,
kips
-8.5
-4.25
0
4.25
8.5
She
arS
tres
s/√
f c',ps
i/psi
Figure 47 – Shear versus chord rotation for P100-2.5 (1,000 psi = 6.89 MPa, 1 kip = 4.45 kN)

95
Figure 48 – Shear versus chord rotation envelope for D80-1.5 (1,000 psi = 6.89 MPa, 1 kip = 4.45 kN)
Figure 49 – Shear versus chord rotation envelope for D100-1.5 (1,000 psi = 6.89 MPa, 1 kip = 4.45 kN)
-12 -6 0 6 12Chord Rotation, %
-300
-150
0
150
300
She
ar,
kips
-15.5
-7.75
0
7.75
15.5
She
arS
tres
s/√
f c',ps
i/psi
0.8 Vmax
= 203 kips
0.8 Vmax
= -191 kips
Vmax
= 254 kips @ 2.1%
Vmax
= -239 kips @ -1.1%
6.1%
-6.1%
7.3%
-6.4%
CR B
V
CR A
Vmax
-12 -6 0 6 12Chord Rotation, %
-300
-150
0
150
300
She
ar,
kips
-15.5
-7.75
0
7.75
15.5
She
arS
tres
s/√
f c',ps
i/psi
0.8 Vmax
= 201 kips
0.8 Vmax
= -206 kips
Vmax
= 252 kips @ 1.5%
Vmax
= -257 kips @ -1.7%
5.6%
-4.2%
5.8%
-4.7%
CR B
V
CR A
Vmax

96
Figure 50 – Shear versus chord rotation envelope for D120-1.5 (1,000 psi = 6.89 MPa, 1 kip = 4.45 kN)
Figure 51 – Shear versus chord rotation envelope for D80-2.5 (1,000 psi = 6.89 MPa, 1 kip = 4.45 kN)
-12 -6 0 6 12Chord Rotation, %
-300
-150
0
150
300
She
ar,
kips
-15.5
-7.75
0
7.75
15.5
She
arS
tres
s/√
f c',ps
i/psi
0.8 Vmax
= 211 kips
0.8 Vmax
= -209 kips
Vmax
= 264 kips @ 3.0%
Vmax
= -262 kips @ -3.2%
4.2%
-4.9%
5.0%
-5.4%
CR B
V
CR A
Vmax
-12 -6 0 6 12Chord Rotation, %
-300
-150
0
150
300
She
ar,
kips
-15.5
-7.75
0
7.75
15.5
She
arS
tres
s/√
f c',ps
i/psi
0.8 Vmax
= 174 kips
0.8 Vmax
= -176 kips
Vmax
= 218 kips @ 6.0%
Vmax
= -220 kips @ -3.1%
8.2%
-5.9%
8.3%
-6.9%
CR B
V
CR A
Vmax

97
Figure 52 – Shear versus chord rotation envelope for D100-2.5 (1,000 psi = 6.89 MPa, 1 kip = 4.45 kN)
Figure 53 – Shear versus chord rotation envelope for D120-2.5 (1,000 psi = 6.89 MPa, 1 kip = 4.45 kN)
-12 -6 0 6 12Chord Rotation, %
-300
-150
0
150
300
She
ar,
kips
-15.5
-7.75
0
7.75
15.5
She
arS
tres
s/√
f c',ps
i/psi
0.8 Vmax
= 171 kips
0.8 Vmax
= -176 kips
Vmax
= 214 kips @ 2.2%
Vmax
= -220 kips @ -2.5%
6.0%
-4.7%
6.6%
-5.3%
CR B
V
CR A
Vmax
-12 -6 0 6 12Chord Rotation, %
-300
-150
0
150
300
She
ar,
kips
-15.5
-7.75
0
7.75
15.5
She
arS
tres
s/√
f c',ps
i/psi
0.8 Vmax
= 229 kips
0.8 Vmax
= -228 kips
Vmax
= 286 kips @ 4.3%
Vmax
= -284 kips @ -4.3%
6.7%
-6.4%
7.0%
-6.7%
CR B
V
CR A
Vmax

98
Figure 54 – Shear versus chord rotation envelope for D80-3.5 (1,000 psi = 6.89 MPa, 1 kip = 4.45 kN)
Figure 55 – Shear versus chord rotation envelope for D100-3.5 (1,000 psi = 6.89 MPa, 1 kip = 4.45 kN)
-12 -6 0 6 12Chord Rotation, %
-300
-150
0
150
300
She
ar,
kips
-15.5
-7.75
0
7.75
15.5
She
arS
tres
s/√
f c',ps
i/psi
0.8 Vmax
= 176 kips
0.8 Vmax
= -174 kips
Vmax
= 219 kips @ 6.0%
Vmax
= -217 kips @ -6.0%
8.3%
-8.2%
8.8%
-8.4%
CR B
V
CR A
Vmax
-12 -6 0 6 12Chord Rotation, %
-300
-150
0
150
300
She
ar,
kips
-15.5
-7.75
0
7.75
15.5
She
arS
tres
s/√
f c',ps
i/psi0.8 V
max = 157 kips
0.8 Vmax
= -153 kips
Vmax
= 196 kips @ 3.2%
Vmax
= -192 kips @ -3.1%
6.2%
-6.4%
6.7%
-6.9%
CR B
V
CR A
Vmax

99
Figure 56 – Shear versus chord rotation envelope for D120-3.5 (1,000 psi = 6.89 MPa, 1 kip = 4.45 kN)
-12 -6 0 6 12Chord Rotation, %
-300
-150
0
150
300
She
ar,
kips
-15.5
-7.75
0
7.75
15.5
She
arS
tres
s/√
f c',ps
i/psi
0.8 Vmax
= 170 kips
0.8 Vmax
= -173 kips
Vmax
= 212 kips @ 4.1%
Vmax
= -216 kips @ -4.1%
6.5%
-6.4%
6.8%
-6.6%
CR B
V
CR A
Vmax

100
Figure 57 – Shear versus chord rotation envelope for P80-2.5 (1,000 psi = 6.89 MPa, 1 kip = 4.45 kN)
Figure 58 – Shear versus chord rotation envelope for P100-2.5 (1,000 psi = 6.89 MPa, 1 kip = 4.45 kN)
-12 -6 0 6 12Chord Rotation, %
-150
-75
0
75
150
She
ar,
kips
-8.5
-4.25
0
4.25
8.5
She
arS
tres
s/√
f c',ps
i/psi0.8 V
max = 72 kips
0.8 Vmax
= -72 kips
Vmax
= 91 kips @ 2.9%
Vmax
= -90 kips @ -2.0%
4.1%
-3.0%
4.6%
-3.2%
CR B
V
CR A
Vmax
-12 -6 0 6 12Chord Rotation, %
-150
-75
0
75
150
She
ar,
kips
-7.8
-3.9
0
3.9
7.8
She
arS
tres
s/√
f c',ps
i/psi
0.8 Vmax
= 88 kips
0.8 Vmax
= -87 kips
Vmax
= 110 kips @ 1.8%
Vmax
= -108 kips @ -2.1%
3.2%
-4.0%
3.7%
-4.4%
CR B
V
CR A
Vmax

101
Figure 59 – Chord rotation capacity versus primary reinforcement grade for D-type coupling beams (1,000 psi = 6.89 MPa)
80 (550) 100 (690) 120 (830)
Diagonal Reinforcement fym, ksi (MPa)
0
3
6
9
Cho
rdR
otat
ion
Cap
acity
,%
ln/ = 3.5h
ln/ = 2.5h
ln/ = 1.5h
D120-2.5 (All Bars Developed and fyt = 120 ksi [830 MPa])

102
Figure 60 – Shear versus chord rotation envelopes for D80-1.5, D100-1.5, and D120-1.5 (1,000 psi = 6.89 MPa, 1 kip = 4.45 kN)
Figure 61 – Shear versus chord rotation envelopes for D80-2.5, D100-2.5, and D120-2.5 (1,000 psi = 6.89 MPa, 1 kip = 4.45 kN)
-12 -6 0 6 12Chord Rotation, %
-300
-150
0
150
300
She
ar,
kips
-15.5
-7.75
0
7.75
15.5
She
ar S
tres
s / √
f c', ps
i / p
si
A
BC
D E
D80-1.5 D100-1.5 D120-1.5 ASCE 41-17
-12 -6 0 6 12Chord Rotation, %
-300
-150
0
150
300
She
ar,
kips
-15.5
-7.75
0
7.75
15.5
She
ar S
tres
s / √
f c',ps
i/ps
i
A
BC
D E
D80-2.5 D100-2.5 D120-2.5 ASCE 41-17

103
Figure 62 – Shear versus chord rotation envelopes for D80-3.5, D100-3.5, and D120-3.5 (1,000 psi = 6.89 MPa, 1 kip = 4.45 kN)
-12 -6 0 6 12Chord Rotation, %
-300
-150
0
150
300
She
ar,
kips
-15.5
-7.75
0
7.75
15.5
She
ar S
tres
s / √
f c', ps
i / p
si
A
BC
D E
D80-3.5 D100-3.5 D120-3.5 ASCE 41-17

104
Figure 63 – Shear versus chord rotation envelopes for P80-2.5 and P100-2.5 (1,000 psi = 6.89 MPa, 1 kip = 4.45 kN)
Figure 64 – Normalized shear versus chord rotation envelopes for P80-2.5 and P100-2.5 (1,000 psi = 6.89 MPa, 1 kip = 4.45 kN)
-12 -6 0 6 12Chord Rotation, %
-150
-75
0
75
150
She
ar,
kips
-8.5
-4.25
0
4.25
8.5
She
ar S
tres
s / √
f c',ps
i/ps
i
A
BC
D E
P80-2.5 P100-2.5 ASCE 41-17
-12 -6 0 6 12Chord Rotation, %
-1.5
-1
-0.5
0
0.5
1
1.5
She
ar/(
2M
nm
/l n
)
A
B
C
D E
P80-2.5 P100-2.5 ASCE 41-17
Abscissa of point C based on 6 𝑓 psi (0.5 𝑓 MPa)

105
Figure 65 – Generalized force-deformation relationship for diagonally-reinforced concrete coupling beams (taken from ASCE 41-17 Figure 10-1(b)[4])
Δ
h
D EA
B C
c
e
d1.0
Qy
Q

106
Figure 66 – Reinforcing bar fracture locations, D80-1.5
Figure 67 – Reinforcing bar fracture locations, D100-1.5

107
Figure 68 – Reinforcing bar fracture locations, D120-1.5
Figure 69 – Reinforcing bar fracture locations, D80-2.5

108
Figure 70 – Reinforcing bar fracture locations, D100-2.5
Figure 71 – Reinforcing bar fracture locations, D120-2.5

109
Figure 72 – Reinforcing bar fracture locations, D80-3.5
Figure 73 – Reinforcing bar fracture locations, D100-3.5

110
Figure 74 – Reinforcing bar fracture locations, D120-3.5
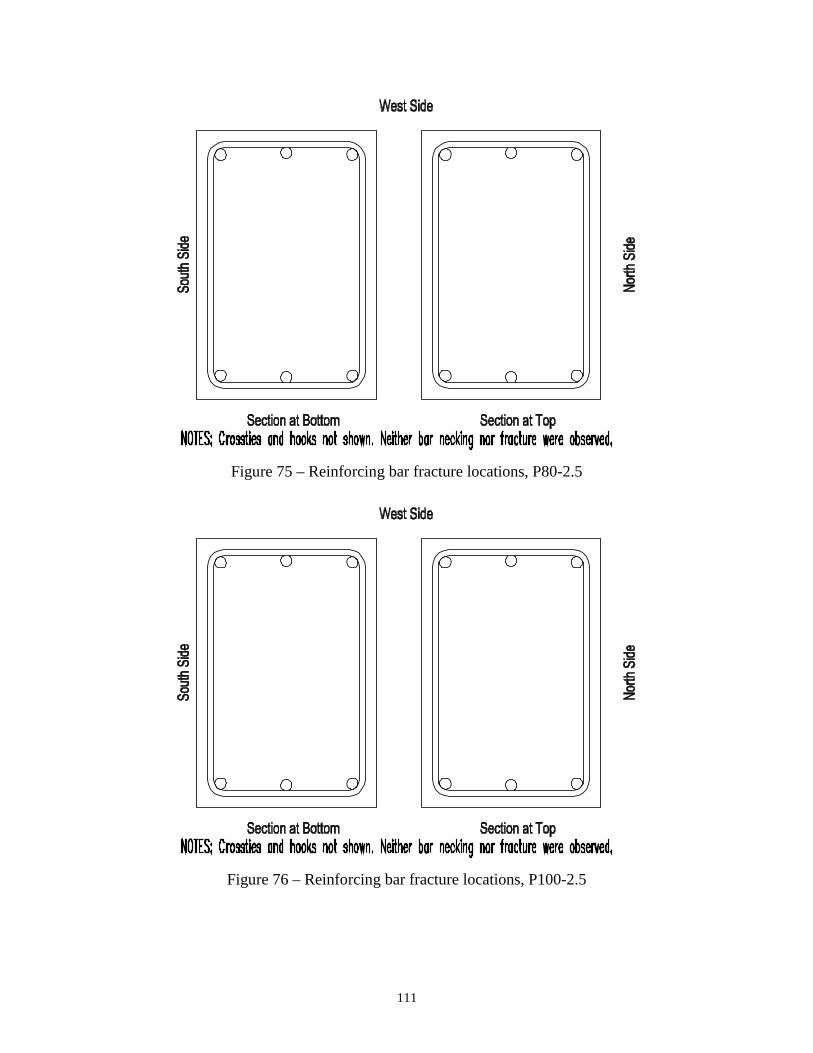
111
Figure 75 – Reinforcing bar fracture locations, P80-2.5
Figure 76 – Reinforcing bar fracture locations, P100-2.5

112
Figure 77 – Shear versus chord rotation envelopes for D80-1.5, D100-1.5, and D120-1.5
Figure 78 – Shear versus chord rotation envelopes for D80-2.5, D100-2.5, and D120-2.5
0Chord Rotation, %
-300
-150
0
150
300
She
ar,
kips
-15.5
-7.75
0
7.75
15.5
She
arS
tres
s/√
f c',ps
i/psi
-6 -3 3 6
D80-1.5 D100-1.5 D120-1.5 0.75 V
max
-6 -3 0 3 6Chord Rotation, %
-300
-150
0
150
300
She
ar,
kips
-15.5
-7.75
0
7.75
15.5
She
arS
tres
s/√
f c',ps
i/psi
D80-2.5 D100-2.5 D120-2.5 0.75 V
max

113
Figure 79 – Shear versus chord rotation envelopes for D80-3.5, D100-3.5, and D120-3.5
Figure 80 – Shear versus chord rotation envelopes for P80-2.5 and P100-2.5
0Chord Rotation, %
-300
-150
0
150
300
She
ar,
kips
-15.5
-7.75
0
7.75
15.5
She
arS
tres
s/√
f c',ps
i/psi
-6 -3 3 6
D80-3.5 D100-3.5 D120-3.5 0.75 V
max
Chord Rotation, %
-150
-75
0
75
150
She
ar,
kips
-8.5
-4.25
0
4.25
8.5
She
arS
tres
s/√
f c',ps
i/psi
P80-2.5 P100-2.5 0.75 V
max
0-6 -3 3 6

114
Figure 81 – Effective moment of inertia, 𝐼 , normalized by gross moment of inertia, 𝐼
Figure 82 – Effective moment of inertia, 𝐼 , normalized by transformed uncracked moment of inertia, 𝐼
D8
0-1
.5
D1
00
-1.5
D1
20
-1.5
D8
0-2
.5
D1
00
-2.5
D1
20
-2.5
D8
0-3
.5
D1
00
-3.5
D1
20
-3.5
P8
0-2
.5
P1
00
-2.5
0
0.06
0.12
0.18
I eff
/Ig
Negative CR Positive CR
D8
0-1
.5
D1
00
-1.5
D1
20
-1.5
D8
0-2
.5
D1
00
-2.5
D1
20
-2.5
D8
0-3
.5
D1
00
-3.5
D1
20
-3.5
P8
0-2
.5
P1
00
-2.5
0
0.06
0.12
0.18
I eff
/Itr
Negative CR Positive CR

115
Figure 83 – Measured strain in diagonal bar of D80-1.5, strain gauge D1
Figure 84 – Measured strain in diagonal bar of D80-1.5, strain gauge D2

116
Figure 85 – Measured strain in diagonal bar of D80-1.5, strain gauge D3
Figure 86 – Measured strain in diagonal bar of D80-1.5, strain gauge D4

117
Figure 87 – Measured strain in diagonal bar of D80-1.5, strain gauge D5
Figure 88 – Measured strain in diagonal bar of D80-1.5, strain gauge D6

118
Figure 89 – Measured strain in diagonal bar of D80-1.5, strain gauge D7
Figure 90 – Measured strain in diagonal bar of D80-1.5, strain gauge D8

119
Figure 91 – Measured strain in diagonal bar of D80-1.5, strain gauge D9
Figure 92 – Measured strain in diagonal bar of D80-1.5, strain gauge D10
-12 -6 0 6 12Chord Rotation, %
-10
10
30
50
70
Mill
istr
ain
Gauge Malfunctioned

120
Figure 93 – Measured strain in diagonal bar of D80-1.5, strain gauge D11
Figure 94 – Measured strain in diagonal bar of D80-1.5, strain gauge D12

121
Figure 95 – Measured strain in diagonal bar of D80-1.5, strain gauge D13
Figure 96 – Measured strain in diagonal bar of D80-1.5, strain gauge D14

122
Figure 97 – Measured strain in closed stirrup of D80-1.5, strain gauge S1
Figure 98 – Measured strain in closed stirrup of D80-1.5, strain gauge S2
-12 -6 0 6 12Chord Rotation, %
-2
0
2
4
6
8
Mill
istr
ain
Gauge Malfunctioned

123
Figure 99 – Measured strain in closed stirrup of D80-1.5, strain gauge S3
Figure 100 – Measured strain in closed stirrup of D80-1.5, strain gauge S4

124
Figure 101 – Measured strain in closed stirrup of D80-1.5, strain gauge S5
Figure 102 – Measured strain in closed stirrup of D80-1.5, strain gauge S6

125
Figure 103 – Measured strain in closed stirrup of D80-1.5, strain gauge S7
Figure 104 – Measured strain in closed stirrup of D80-1.5, strain gauge S8

126
Figure 105 – Measured strain in closed stirrup of D80-1.5, strain gauge S9

127
Figure 106 – Measured strain in parallel bar of D80-1.5, strain gauge H1
Figure 107 – Measured strain in parallel bar of D80-1.5, strain gauge H2
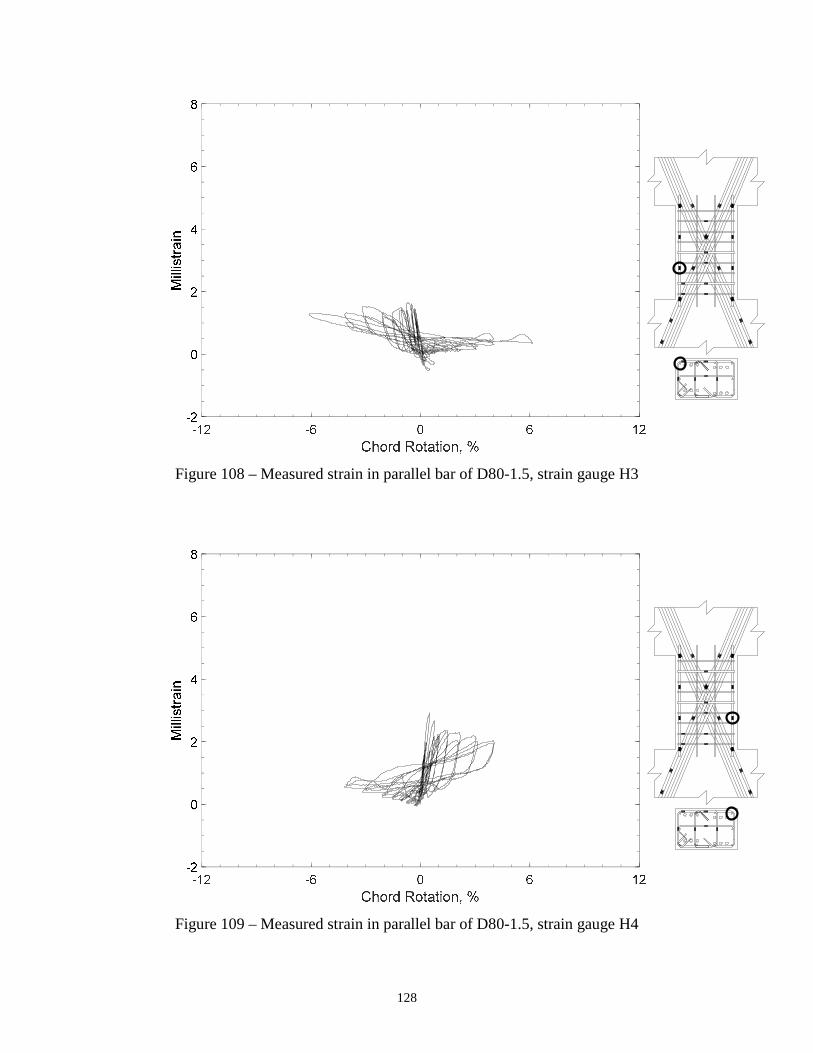
128
Figure 108 – Measured strain in parallel bar of D80-1.5, strain gauge H3
Figure 109 – Measured strain in parallel bar of D80-1.5, strain gauge H4
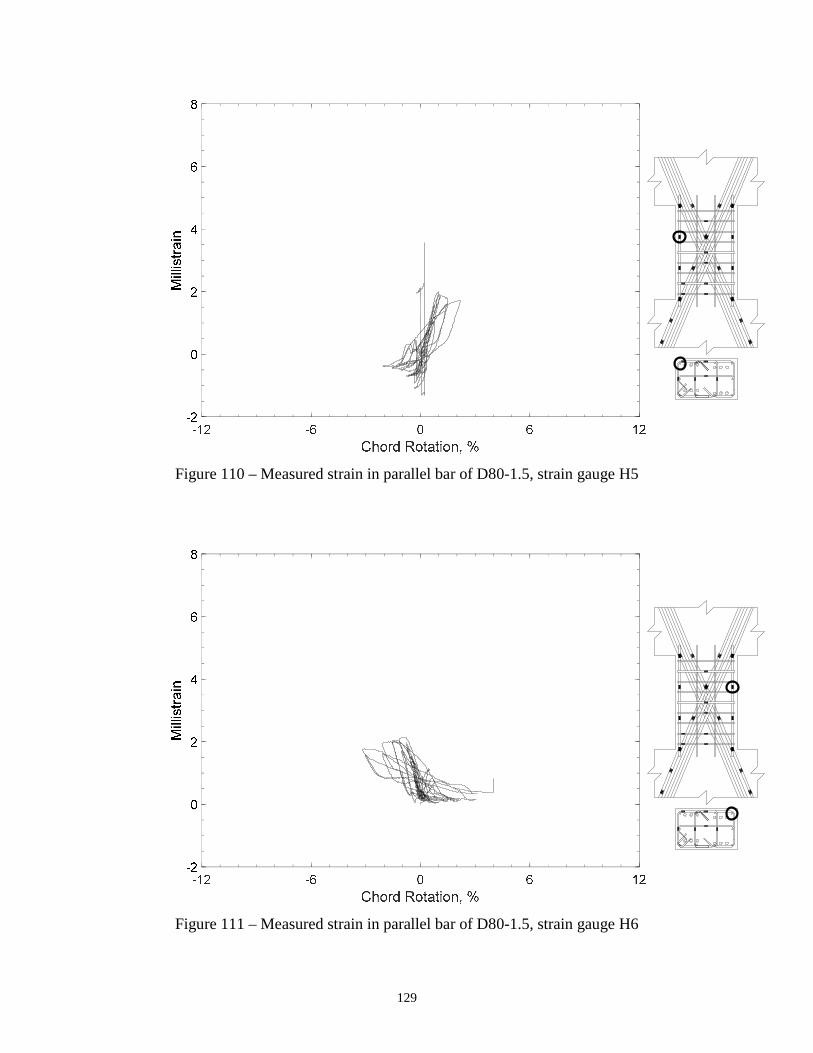
129
Figure 110 – Measured strain in parallel bar of D80-1.5, strain gauge H5
Figure 111 – Measured strain in parallel bar of D80-1.5, strain gauge H6

130
Figure 112 – Measured strain in parallel bar of D80-1.5, strain gauge H9

131
Figure 113 – Measured strain in parallel bar of D80-1.5, strain gauge H11
Figure 114 – Measured strain in parallel bar of D80-1.5, strain gauge H12

132
Figure 115 – Measured strain in parallel bar of D80-1.5, strain gauge H13
Figure 116 – Measured strain in parallel bar of D80-1.5, strain gauge H14

133
Figure 117 – Measured strain in crosstie of D80-1.5, strain gauge T1
Figure 118 – Measured strain in crosstie of D80-1.5, strain gauge T2

134
Figure 119 – Measured strain in crosstie of D80-1.5, strain gauge T3
Figure 120 – Measured strain in crosstie of D80-1.5, strain gauge T4

135
Figure 121 – Measured strain in diagonal bar of D100-1.5, strain gauge D1
Figure 122 – Measured strain in diagonal bar of D100-1.5, strain gauge D2
-12 -6 0 6 12Chord Rotation, %
-10
10
30
50
70
Mill
istr
ain
Gauge Malfunctioned

136
Figure 123 – Measured strain in diagonal bar of D100-1.5, strain gauge D3
Figure 124 – Measured strain in diagonal bar of D100-1.5, strain gauge D4

137
Figure 125 – Measured strain in diagonal bar of D100-1.5, strain gauge D5
Figure 126 – Measured strain in diagonal bar of D100-1.5, strain gauge D6
-12 -6 0 6 12-10
15
40
65
90

138
Figure 127 – Measured strain in diagonal bar of D100-1.5, strain gauge D7
Figure 128 – Measured strain in diagonal bar of D100-1.5, strain gauge D8

139
Figure 129 – Measured strain in diagonal bar of D100-1.5, strain gauge D9
Figure 130 – Measured strain in diagonal bar of D100-1.5, strain gauge D10

140
Figure 131 – Measured strain in diagonal bar of D100-1.5, strain gauge D11
Figure 132 – Measured strain in diagonal bar of D100-1.5, strain gauge D12

141
Figure 133 – Measured strain in diagonal bar of D100-1.5, strain gauge D13
Figure 134 – Measured strain in diagonal bar of D100-1.5, strain gauge D14

142
Figure 135 – Measured strain in closed stirrup of D100-1.5, strain gauge S1
Figure 136 – Measured strain in closed stirrup of D100-1.5, strain gauge S2
-12 -6 0 6 12Chord Rotation, %
-2
0
2
4
6
8
Mill
istr
ain
Gauge Malfunctioned

143
Figure 137 – Measured strain in closed stirrup of D100-1.5, strain gauge S3
Figure 138 – Measured strain in closed stirrup of D100-1.5, strain gauge S4

144
Figure 139 – Measured strain in closed stirrup of D100-1.5, strain gauge S5
Figure 140 – Measured strain in closed stirrup of D100-1.5, strain gauge S6
-12 -6 0 6 12Chord Rotation, %
-2
0
2
4
6
8
Mill
istr
ain
Gauge Malfunctioned

145
Figure 141 – Measured strain in closed stirrup of D100-1.5, strain gauge S7
Figure 142 – Measured strain in closed stirrup of D100-1.5, strain gauge S8

146
Figure 143 – Measured strain in closed stirrup of D100-1.5, strain gauge S9

147
Figure 144 – Measured strain in parallel bar of D100-1.5, strain gauge H1
Figure 145 – Measured strain in parallel bar of D100-1.5, strain gauge H2
-12 -6 0 6 12Chord Rotation, %
-2
0
2
4
6
8
Mill
istr
ain
Gauge Malfunctioned
-12 -6 0 6 12Chord Rotation, %
-2
0
2
4
6
8
Mill
istr
ain
Gauge Malfunctioned

148
Figure 146 – Measured strain in parallel bar of D100-1.5, strain gauge H3
Figure 147 – Measured strain in parallel bar of D100-1.5, strain gauge H4

149
Figure 148 – Measured strain in parallel bar of D100-1.5, strain gauge H5
Figure 149 – Measured strain in parallel bar of D100-1.5, strain gauge H6

150
Figure 150 – Measured strain in parallel bar of D100-1.5, strain gauge H7
Figure 151 – Measured strain in parallel bar of D100-1.5, strain gauge H8
-12 -6 0 6 12Chord Rotation, %
-2
0
2
4
6
8
Mill
istr
ain
Gauge Malfunctioned
-12 -6 0 6 12-3
-1.75
-0.5
0.75
2

151
Figure 152 – Measured strain in parallel bar of D100-1.5, strain gauge H9
Figure 153 – Measured strain in parallel bar of D100-1.5, strain gauge H10

152
Figure 154 – Measured strain in parallel bar of D100-1.5, strain gauge H11
Figure 155 – Measured strain in parallel bar of D100-1.5, strain gauge H12
-12 -6 0 6 12Chord Rotation, %
-2
0
2
4
6
8
Mill
istr
ain
Gauge Malfunctioned

153
Figure 156 – Measured strain in crosstie of D100-1.5, strain gauge T1
Figure 157 – Measured strain in crosstie of D100-1.5, strain gauge T2

154
Figure 158 – Measured strain in crosstie of D100-1.5, strain gauge T3
Figure 159 – Measured strain in crosstie of D100-1.5, strain gauge T4

155
Figure 160 – Measured strain in crosstie of D100-1.5, strain gauge T5

156
Figure 161 – Measured strain in diagonal bar of D120-1.5, strain gauge D1
Figure 162 – Measured strain in diagonal bar of D120-1.5, strain gauge D2

157
Figure 163 – Measured strain in diagonal bar of D120-1.5, strain gauge D3
Figure 164 – Measured strain in diagonal bar of D120-1.5, strain gauge D4

158
Figure 165 – Measured strain in diagonal bar of D120-1.5, strain gauge D5
Figure 166 – Measured strain in diagonal bar of D120-1.5, strain gauge D6

159
Figure 167 – Measured strain in diagonal bar of D120-1.5, strain gauge D7
Figure 168 – Measured strain in diagonal bar of D120-1.5, strain gauge D8

160
Figure 169 – Measured strain in diagonal bar of D120-1.5, strain gauge D9
Figure 170 – Measured strain in diagonal bar of D120-1.5, strain gauge D10

161
Figure 171 – Measured strain in diagonal bar of D120-1.5, strain gauge D11
Figure 172 – Measured strain in diagonal bar of D120-1.5, strain gauge D12
-12 -6 0 6 12-10
17.5
45
72.5
100

162
Figure 173 – Measured strain in diagonal bar of D120-1.5, strain gauge D13
Figure 174 – Measured strain in diagonal bar of D120-1.5, strain gauge D14
-12 -6 0 6 12Chord Rotation, %
-10
10
30
50
70
Mill
istr
ain
Gauge Malfunctioned

163
Figure 175 – Measured strain in closed stirrup of D120-1.5, strain gauge S1
Figure 176 – Measured strain in closed stirrup of D120-1.5, strain gauge S2

164
Figure 177 – Measured strain in closed stirrup of D120-1.5, strain gauge S3
Figure 178 – Measured strain in closed stirrup of D120-1.5, strain gauge S4

165
Figure 179 – Measured strain in closed stirrup of D120-1.5, strain gauge S5
Figure 180 – Measured strain in closed stirrup of D120-1.5, strain gauge S6

166
Figure 181 – Measured strain in closed stirrup of D120-1.5, strain gauge S7
Figure 182 – Measured strain in closed stirrup of D120-1.5, strain gauge S8

167
Figure 183 – Measured strain in closed stirrup of D120-1.5, strain gauge S9

168
Figure 184 – Measured strain in parallel bar of D120-1.5, strain gauge H1
Figure 185 – Measured strain in parallel bar of D120-1.5, strain gauge H2
-12 -6 0 6 12Chord Rotation, %
-2
0
2
4
6
8
Mill
istr
ain
Gauge Malfunctioned

169
Figure 186 – Measured strain in parallel bar of D120-1.5, strain gauge H3
Figure 187 – Measured strain in parallel bar of D120-1.5, strain gauge H4

170
Figure 188 – Measured strain in parallel bar of D120-1.5, strain gauge H5
Figure 189 – Measured strain in parallel bar of D120-1.5, strain gauge H6
-12 -6 0 6 12Chord Rotation, %
-2
0
2
4
6
8
Mill
istr
ain
Gauge Malfunctioned

171
Figure 190 – Measured strain in parallel bar of D120-1.5, strain gauge H7
Figure 191 – Measured strain in parallel bar of D120-1.5, strain gauge H8
-12 -6 0 6 12Chord Rotation, %
-2
0
2
4
6
8
Mill
istr
ain
Gauge Malfunctioned

172
Figure 192 – Measured strain in parallel bar of D120-1.5, strain gauge H9
Figure 193 – Measured strain in parallel bar of D120-1.5, strain gauge H10

173
Figure 194 – Measured strain in parallel bar of D120-1.5, strain gauge H11

174
Figure 195 – Measured strain in crosstie of D120-1.5, strain gauge T1
Figure 196 – Measured strain in crosstie of D120-1.5, strain gauge T2
-12 -6 0 6 12Chord Rotation, %
-2
0
2
4
6
8
Mill
istr
ain
Gauge Malfunctioned
-12 -6 0 6 12Chord Rotation, %
-2
0
2
4
6
8
Mill
istr
ain
Gauge Malfunctioned

175
Figure 197 – Measured strain in crosstie of D120-1.5, strain gauge T3
Figure 198 – Measured strain in crosstie of D120-1.5, strain gauge T4

176
Figure 199 – Measured strain in crosstie of D120-1.5, strain gauge T5
Figure 200 – Measured strain in crosstie of D120-1.5, strain gauge T6

177
Figure 201 – Measured strain in diagonal bar of D80-2.5, strain gauge D1
Figure 202 – Measured strain in diagonal bar of D80-2.5, strain gauge D2
-12 -6 0 6 12Chord Rotation, %
-10
10
30
50
70
Mill
istr
ain
Gauge Malfunctioned

178
Figure 203 – Measured strain in diagonal bar of D80-2.5, strain gauge D3
Figure 204 – Measured strain in diagonal bar of D80-2.5, strain gauge D4

179
Figure 205 – Measured strain in diagonal bar of D80-2.5, strain gauge D5
Figure 206 – Measured strain in diagonal bar of D80-2.5, strain gauge D6
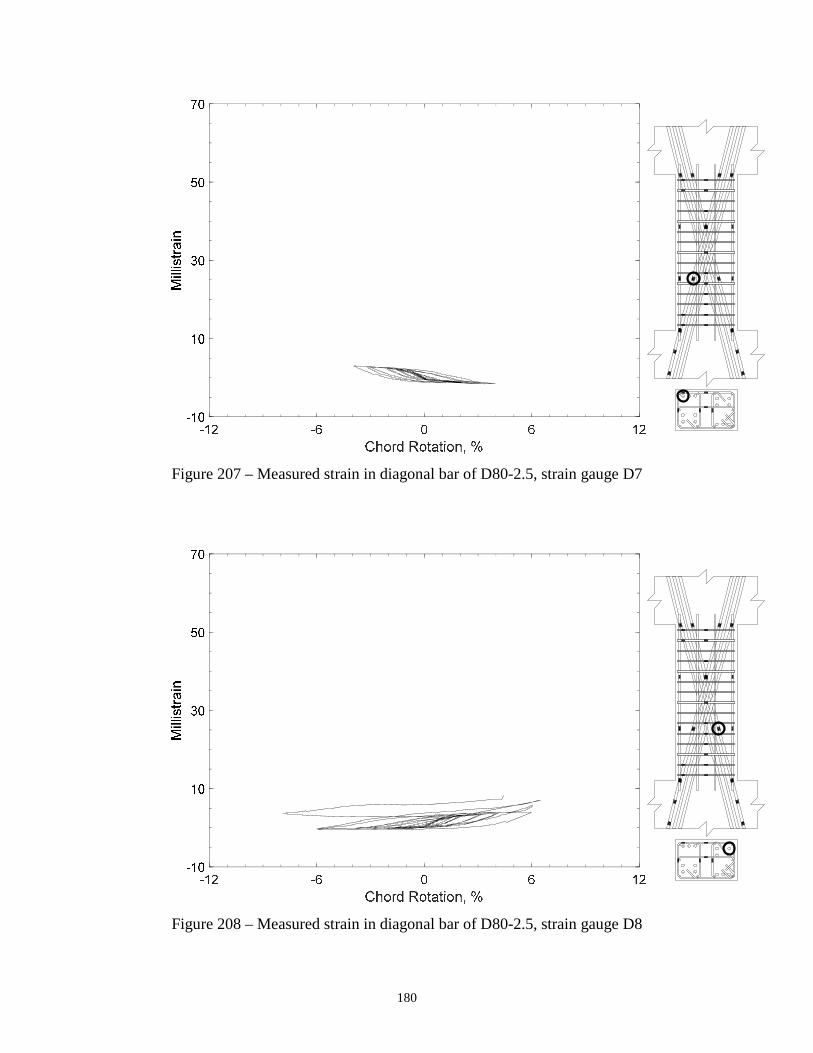
180
Figure 207 – Measured strain in diagonal bar of D80-2.5, strain gauge D7
Figure 208 – Measured strain in diagonal bar of D80-2.5, strain gauge D8

181
Figure 209 – Measured strain in diagonal bar of D80-2.5, strain gauge D9
Figure 210 – Measured strain in diagonal bar of D80-2.5, strain gauge D10
-12 -6 0 6 12Chord Rotation, %
-10
10
30
50
70
Mill
istr
ain
Gauge Malfunctioned

182
Figure 211 – Measured strain in diagonal bar of D80-2.5, strain gauge D11
Figure 212 – Measured strain in diagonal bar of D80-2.5, strain gauge D12

183
Figure 213 – Measured strain in diagonal bar of D80-2.5, strain gauge D13
Figure 214 – Measured strain in diagonal bar of D80-2.5, strain gauge D14
-12 -6 0 6 12Chord Rotation, %
-10
10
30
50
70
Mill
istr
ain
Gauge Malfunctioned

184
Figure 215 – Measured strain in closed stirrup of D80-2.5, strain gauge S1
Figure 216 – Measured strain in closed stirrup of D80-2.5, strain gauge S2
-12 -6 0 6 12Chord Rotation, %
-2
0
2
4
6
8
Mill
istr
ain
Gauge Malfunctioned
-12 -6 0 6 12-8
-5.5
-3
-0.5
2

185
Figure 217 – Measured strain in closed stirrup of D80-2.5, strain gauge S3
Figure 218 – Measured strain in closed stirrup of D80-2.5, strain gauge S4

186
Figure 219 – Measured strain in closed stirrup of D80-2.5, strain gauge S5
Figure 220 – Measured strain in closed stirrup of D80-2.5, strain gauge S6

187
Figure 221 – Measured strain in closed stirrup of D80-2.5, strain gauge S7
Figure 222 – Measured strain in closed stirrup of D80-2.5, strain gauge S8

188
Figure 223 – Measured strain in closed stirrup of D80-2.5, strain gauge S9

189
Figure 224 – Measured strain in parallel bar of D80-2.5, strain gauge H1
Figure 225 – Measured strain in parallel bar of D80-2.5, strain gauge H2
-12 -6 0 6 12-7
-5
-3
-1
1

190
Figure 226 – Measured strain in parallel bar of D80-2.5, strain gauge H3
Figure 227 – Measured strain in parallel bar of D80-2.5, strain gauge H4

191
Figure 228 – Measured strain in parallel bar of D80-2.5, strain gauge H5

192
Figure 229 – Measured strain in crosstie of D80-2.5, strain gauge T1
Figure 230 – Measured strain in crosstie of D80-2.5, strain gauge T2

193
Figure 231 – Measured strain in crosstie of D80-2.5, strain gauge T3
-12 -6 0 6 12Chord Rotation, %
-2
0
2
4
6
8
Mill
istr
ain
Gauge Malfunctioned

194
Figure 232 – Measured strain in diagonal bar of D100-2.5, strain gauge D1
Figure 233 – Measured strain in diagonal bar of D100-2.5, strain gauge D2

195
Figure 234 – Measured strain in diagonal bar of D100-2.5, strain gauge D3
Figure 235 – Measured strain in diagonal bar of D100-2.5, strain gauge D4

196
Figure 236 – Measured strain in diagonal bar of D100-2.5, strain gauge D5
Figure 237 – Measured strain in diagonal bar of D100-2.5, strain gauge D6
-12 -6 0 6 12Chord Rotation, %
-10
10
30
50
70
Mill
istr
ain
Gauge Malfunctioned
-12 -6 0 6 12-10
12.5
35
57.5
80

197
Figure 238 – Measured strain in diagonal bar of D100-2.5, strain gauge D7
Figure 239 – Measured strain in diagonal bar of D100-2.5, strain gauge D8

198
Figure 240 – Measured strain in diagonal bar of D100-2.5, strain gauge D9
Figure 241 – Measured strain in diagonal bar of D100-2.5, strain gauge D10

199
Figure 242 – Measured strain in diagonal bar of D100-2.5, strain gauge D11
Figure 243 – Measured strain in diagonal bar of D100-2.5, strain gauge D12
-12 -6 0 6 12Chord Rotation, %
-10
10
30
50
70
Mill
istr
ain
Gauge Malfunctioned
-12 -6 0 6 12Chord Rotation, %
-10
10
30
50
70
Mill
istr
ain
Gauge Malfunctioned

200
Figure 244 – Measured strain in diagonal bar of D100-2.5, strain gauge D13
Figure 245 – Measured strain in diagonal bar of D100-2.5, strain gauge D14

201
Figure 246 – Measured strain in closed stirrup of D100-2.5, strain gauge S1
Figure 247 – Measured strain in closed stirrup of D100-2.5, strain gauge S2

202
Figure 248 – Measured strain in closed stirrup of D100-2.5, strain gauge S3
Figure 249 – Measured strain in closed stirrup of D100-2.5, strain gauge S4

203
Figure 250 – Measured strain in closed stirrup of D100-2.5, strain gauge S5
Figure 251 – Measured strain in closed stirrup of D100-2.5, strain gauge S6
-12 -6 0 6 12Chord Rotation, %
-2
0
2
4
6
8
Mill
istr
ain
Gauge Malfunctioned

204
Figure 252 – Measured strain in closed stirrup of D100-2.5, strain gauge S7
Figure 253 – Measured strain in closed stirrup of D100-2.5, strain gauge S8

205
Figure 254 – Measured strain in closed stirrup of D100-2.5, strain gauge S9

206
Figure 255 – Measured strain in parallel bar of D100-2.5, strain gauge H1
Figure 256 – Measured strain in parallel bar of D100-2.5, strain gauge H2
-12 -6 0 6 12Chord Rotation, %
-2
0
2
4
6
8
Mill
istr
ain
Gauge Malfunctioned

207
Figure 257 – Measured strain in parallel bar of D100-2.5, strain gauge H3
Figure 258 – Measured strain in parallel bar of D100-2.5, strain gauge H4
-12 -6 0 6 12Chord Rotation, %
-2
0
2
4
6
8
Mill
istr
ain
Gauge Malfunctioned
-12 -6 0 6 12-1
2.5
6
9.5
13

208
Figure 259 – Measured strain in parallel bar of D100-2.5, strain gauge H5
Figure 260 – Measured strain in parallel bar of D100-2.5, strain gauge H6

209
Figure 261 – Measured strain in crosstie of D100-2.5, strain gauge T1
Figure 262 – Measured strain in crosstie of D100-2.5, strain gauge T2

210
Figure 263 – Measured strain in crosstie of D100-2.5, strain gauge T3

211
Figure 264 – Measured strain in diagonal bar of D120-2.5, strain gauge D1
Figure 265 – Measured strain in diagonal bar of D120-2.5, strain gauge D2

212
Figure 266 – Measured strain in diagonal bar of D120-2.5, strain gauge D3
Figure 267 – Measured strain in diagonal bar of D120-2.5, strain gauge D4

213
Figure 268 – Measured strain in diagonal bar of D120-2.5, strain gauge D5
Figure 269 – Measured strain in diagonal bar of D120-2.5, strain gauge D6
-12 -6 0 6 12-10
17.5
45
72.5
100

214
Figure 270 – Measured strain in diagonal bar of D120-2.5, strain gauge D7
Figure 271 – Measured strain in diagonal bar of D120-2.5, strain gauge D8

215
Figure 272 – Measured strain in diagonal bar of D120-2.5, strain gauge D9
Figure 273 – Measured strain in diagonal bar of D120-2.5, strain gauge D10
-12 -6 0 6 12Chord Rotation, %
-10
10
30
50
70
Mill
istr
ain
Gauge Malfunctioned

216
Figure 274 – Measured strain in diagonal bar of D120-2.5, strain gauge D11
Figure 275 – Measured strain in diagonal bar of D120-2.5, strain gauge D12

217
Figure 276 – Measured strain in diagonal bar of D120-2.5, strain gauge D13
Figure 277 – Measured strain in diagonal bar of D120-2.5, strain gauge D14
-12 -6 0 6 12-10
15
40
65
90

218
Figure 278 – Measured strain in closed stirrup of D120-2.5, strain gauge S1
Figure 279 – Measured strain in closed stirrup of D120-2.5, strain gauge S2
-12 -6 0 6 12Chord Rotation, %
-2
0
2
4
6
8
Mill
istr
ain
Gauge Malfunctioned

219
Figure 280 – Measured strain in closed stirrup of D120-2.5, strain gauge S3
Figure 281 – Measured strain in closed stirrup of D120-2.5, strain gauge S4
-12 -6 0 6 12-1
4
9
14
19

220
Figure 282 – Measured strain in closed stirrup of D120-2.5, strain gauge S5
Figure 283 – Measured strain in closed stirrup of D120-2.5, strain gauge S6

221
Figure 284 – Measured strain in closed stirrup of D120-2.5, strain gauge S7
Figure 285 – Measured strain in closed stirrup of D120-2.5, strain gauge S8

222
Figure 286 – Measured strain in closed stirrup of D120-2.5, strain gauge S9
Figure 287 – Measured strain in closed stirrup of D120-2.5, strain gauge S10

223
Figure 288 – Measured strain in closed stirrup of D120-2.5, strain gauge S11
Figure 289 – Measured strain in closed stirrup of D120-2.5, strain gauge S12

224
Figure 290 – Measured strain in closed stirrup of D120-2.5, strain gauge S13
Figure 291 – Measured strain in closed stirrup of D120-2.5, strain gauge S14

225
Figure 292 – Measured strain in closed stirrup of D120-2.5, strain gauge S15
Figure 293 – Measured strain in closed stirrup of D120-2.5, strain gauge S16

226
Figure 294 – Measured strain in closed stirrup of D120-2.5, strain gauge S17
Figure 295 – Measured strain in closed stirrup of D120-2.5, strain gauge S18
-12 -6 0 6 12Chord Rotation, %
-2
0
2
4
6
8
Mill
istr
ain
Gauge Malfunctioned

227
Figure 296 – Measured strain in parallel bar of D120-2.5, strain gauge H1
Figure 297 – Measured strain in parallel bar of D120-2.5, strain gauge H2
-12 -6 0 6 12-3
14.5
32
49.5
67
-12 -6 0 6 12-11
12
35
58
81

228
Figure 298 – Measured strain in parallel bar of D120-2.5, strain gauge H3
Figure 299 – Measured strain in parallel bar of D120-2.5, strain gauge H4

229
Figure 300 – Measured strain in parallel bar of D120-2.5, strain gauge H5
Figure 301 – Measured strain in parallel bar of D120-2.5, strain gauge H6
-12 -6 0 6 12Chord Rotation, %
-2
0
2
4
6
8
Mill
istr
ain
Gauge Malfunctioned
-12 -6 0 6 12Chord Rotation, %
-2
0
2
4
6
8
Mill
istr
ain
Gauge Malfunctioned

230
Figure 302 – Measured strain in crosstie of D120-2.5, strain gauge T1
Figure 303 – Measured strain in crosstie of D120-2.5, strain gauge T2

231
Figure 304 – Measured strain in crosstie of D120-2.5, strain gauge T3

232
Figure 305 – Measured strain in diagonal bar of D80-3.5, strain gauge D1
Figure 306 – Measured strain in diagonal bar of D80-3.5, strain gauge D2

233
Figure 307 – Measured strain in diagonal bar of D80-3.5, strain gauge D3
Figure 308 – Measured strain in diagonal bar of D80-3.5, strain gauge D4

234
Figure 309 – Measured strain in diagonal bar of D80-3.5, strain gauge D5
Figure 310 – Measured strain in diagonal bar of D80-3.5, strain gauge D6

235
Figure 311 – Measured strain in diagonal bar of D80-3.5, strain gauge D7
Figure 312 – Measured strain in diagonal bar of D80-3.5, strain gauge D8
-12 -6 0 6 12Chord Rotation, %
-10
10
30
50
70
Mill
istr
ain
Gauge Malfunctioned

236
Figure 313 – Measured strain in diagonal bar of D80-3.5, strain gauge D9
Figure 314 – Measured strain in diagonal bar of D80-3.5, strain gauge D10

237
Figure 315 – Measured strain in diagonal bar of D80-3.5, strain gauge D11
Figure 316 – Measured strain in diagonal bar of D80-3.5, strain gauge D12
-12 -6 0 6 12Chord Rotation, %
-10
10
30
50
70
Mill
istr
ain

238
Figure 317 – Measured strain in diagonal bar of D80-3.5, strain gauge D13
Figure 318 – Measured strain in diagonal bar of D80-3.5, strain gauge D14

239
Figure 319 – Measured strain in closed stirrup of D80-3.5, strain gauge S1
Figure 320 – Measured strain in closed stirrup of D80-3.5, strain gauge S2
-12 -6 0 6 12Chord Rotation, %
-2
0
2
4
6
8
Mill
istr
ain
Gauge Malfunctioned

240
Figure 321 – Measured strain in closed stirrup of D80-3.5, strain gauge S3
Figure 322 – Measured strain in closed stirrup of D80-3.5, strain gauge S4

241
Figure 323 – Measured strain in closed stirrup of D80-3.5, strain gauge S5
Figure 324 – Measured strain in closed stirrup of D80-3.5, strain gauge S6
-12 -6 0 6 12-4
-2.75
-1.5
-0.25
1

242
Figure 325 – Measured strain in closed stirrup of D80-3.5, strain gauge S7
Figure 326 – Measured strain in closed stirrup of D80-3.5, strain gauge S8
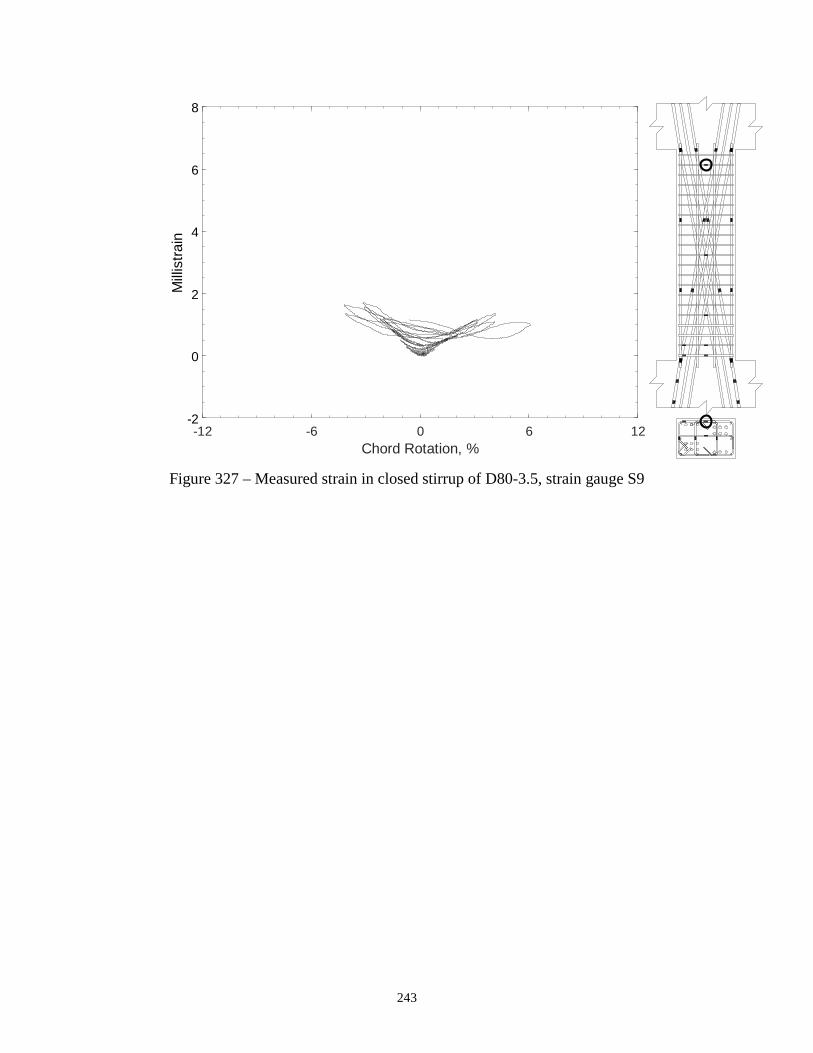
243
Figure 327 – Measured strain in closed stirrup of D80-3.5, strain gauge S9
-12 -6 0 6 12Chord Rotation, %
-2
0
2
4
6
8
Mill
istr
ain

244
Figure 328 – Measured strain in parallel bar of D80-3.5, strain gauge H1
Figure 329 – Measured strain in parallel bar of D80-3.5, strain gauge H2
-12 -6 0 6 12Chord Rotation, %
-2
0
2
4
6
8
Mill
istr
ain
Gauge Malfunctioned
-12 -6 0 6 12-7
-4.75
-2.5
-0.25
2

245
Figure 330 – Measured strain in parallel bar of D80-3.5, strain gauge H3
Figure 331 – Measured strain in parallel bar of D80-3.5, strain gauge H4
-12 -6 0 6 12Chord Rotation, %
-2
0
2
4
6
8
Mill
istr
ain
Gauge Malfunctioned

246
Figure 332 – Measured strain in parallel bar of D80-3.5, strain gauge H5
Figure 333 – Measured strain in parallel bar of D80-3.5, strain gauge H6

247
Figure 334 – Measured strain in parallel bar of D80-3.5, strain gauge H7
Figure 335 – Measured strain in parallel bar of D80-3.5, strain gauge H8
-12 -6 0 6 12Chord Rotation, %
-2
0
2
4
6
8
Mill
istr
ain
Gauge Malfunctioned

248
Figure 336 – Measured strain in crosstie of D80-3.5, strain gauge T1
Figure 337 – Measured strain in crosstie of D80-3.5, strain gauge T2

249
Figure 338 – Measured strain in crosstie of D80-3.5, strain gauge T3

250
Figure 339 – Measured strain in diagonal bar of D100-3.5, strain gauge D1
Figure 340 – Measured strain in diagonal bar of D100-3.5, strain gauge D2
-12 -6 0 6 12Chord Rotation, %
-10
10
30
50
70
Mill
istr
ain
Gauge Malfunctioned

251
Figure 341 – Measured strain in diagonal bar of D100-3.5, strain gauge D3
Figure 342 – Measured strain in diagonal bar of D100-3.5, strain gauge D4
-12 -6 0 6 12Chord Rotation, %
-10
10
30
50
70
Mill
istr
ain
Gauge Malfunctioned

252
Figure 343 – Measured strain in diagonal bar of D100-3.5, strain gauge D5
Figure 344 – Measured strain in diagonal bar of D100-3.5, strain gauge D6

253
Figure 345 – Measured strain in diagonal bar of D100-3.5, strain gauge D7
Figure 346 – Measured strain in diagonal bar of D100-3.5, strain gauge D8

254
Figure 347 – Measured strain in diagonal bar of D100-3.5, strain gauge D9
Figure 348 – Measured strain in diagonal bar of D100-3.5, strain gauge D10

255
Figure 349 – Measured strain in diagonal bar of D100-3.5, strain gauge D11
Figure 350 – Measured strain in diagonal bar of D100-3.5, strain gauge D12

256
Figure 351 – Measured strain in diagonal bar of D100-3.5, strain gauge D13
Figure 352 – Measured strain in diagonal bar of D100-3.5, strain gauge D14

257
Figure 353 – Measured strain in closed stirrup of D100-3.5, strain gauge S1
Figure 354 – Measured strain in closed stirrup of D100-3.5, strain gauge S2
-12 -6 0 6 12Chord Rotation, %
-2
0
2
4
6
8
Mill
istr
ain
Gauge Malfunctioned

258
Figure 355 – Measured strain in closed stirrup of D100-3.5, strain gauge S3
Figure 356 – Measured strain in closed stirrup of D100-3.5, strain gauge S4

259
Figure 357 – Measured strain in closed stirrup of D100-3.5, strain gauge S5
Figure 358 – Measured strain in closed stirrup of D100-3.5, strain gauge S6

260
Figure 359 – Measured strain in closed stirrup of D100-3.5, strain gauge S7
Figure 360 – Measured strain in closed stirrup of D100-3.5, strain gauge S8

261
Figure 361 – Measured strain in closed stirrup of D100-3.5, strain gauge S9
-12 -6 0 6 12Chord Rotation, %
-2
0
2
4
6
8
Mill
istr
ain
Gauge Malfunctioned

262
Figure 362 – Measured strain in parallel bar of D100-3.5, strain gauge H1
Figure 363 – Measured strain in parallel bar of D100-3.5, strain gauge H2
-12 -6 0 6 12Chord Rotation, %
-2
0
2
4
6
8
Mill
istr
ain
-12 -6 0 6 12-3
-1.5
0
1.5
3

263
Figure 364 – Measured strain in parallel bar of D100-3.5, strain gauge H3
Figure 365 – Measured strain in parallel bar of D100-3.5, strain gauge H4
-12 -6 0 6 12Chord Rotation, %
-2
0
2
4
6
8
Mill
istr
ain
Gauge Malfunctioned

264
Figure 366 – Measured strain in parallel bar of D100-3.5, strain gauge H5
Figure 367 – Measured strain in parallel bar of D100-3.5, strain gauge H6
-12 -6 0 6 12Chord Rotation, %
-2
0
2
4
6
8
Mill
istr
ain
Gauge Malfunctioned

265
Figure 368 – Measured strain in parallel bar of D100-3.5, strain gauge H7

266
Figure 369 – Measured strain in crosstie of D100-3.5, strain gauge T1
Figure 370 – Measured strain in crosstie of D100-3.5, strain gauge T2

267
Figure 371 – Measured strain in crosstie of D100-3.5, strain gauge T3

268
Figure 372 – Measured strain in diagonal bar of D120-3.5, strain gauge D1
Figure 373 – Measured strain in diagonal bar of D120-3.5, strain gauge D2
-12 -6 0 6 12Chord Rotation, %
-10
10
30
50
70
Mill
istr
ain
-12 -6 0 6 12Chord Rotation, %
-10
10
30
50
70
Mill
istr
ain

269
Figure 374 – Measured strain in diagonal bar of D120-3.5, strain gauge D3
Figure 375 – Measured strain in diagonal bar of D120-3.5, strain gauge D4
-12 -6 0 6 12Chord Rotation, %
-10
10
30
50
70
Mill
istr
ain
-12 -6 0 6 12Chord Rotation, %
-10
10
30
50
70
Mill
istr
ain

270
Figure 376 – Measured strain in diagonal bar of D120-3.5, strain gauge D5
Figure 377 – Measured strain in diagonal bar of D120-3.5, strain gauge D6
-12 -6 0 6 12Chord Rotation, %
-10
10
30
50
70
Mill
istr
ain
-12 -6 0 6 12Chord Rotation, %
-10
10
30
50
70
Mill
istr
ain
-12 -6 0 6 12-20
-2.5
15
32.5
50

271
Figure 378 – Measured strain in diagonal bar of D120-3.5, strain gauge D7
Figure 379 – Measured strain in diagonal bar of D120-3.5, strain gauge D8
-12 -6 0 6 12Chord Rotation, %
-10
10
30
50
70
Mill
istr
ain
-12 -6 0 6 12Chord Rotation, %
-10
10
30
50
70
Mill
istr
ain

272
Figure 380 – Measured strain in diagonal bar of D120-3.5, strain gauge D9
Figure 381 – Measured strain in diagonal bar of D120-3.5, strain gauge D10
-12 -6 0 6 12Chord Rotation, %
-10
10
30
50
70
Mill
istr
ain
-12 -6 0 6 12Chord Rotation, %
-10
10
30
50
70
Mill
istr
ain

273
Figure 382 – Measured strain in diagonal bar of D120-3.5, strain gauge D11
Figure 383 – Measured strain in diagonal bar of D120-3.5, strain gauge D12
-12 -6 0 6 12Chord Rotation, %
-10
10
30
50
70
Mill
istr
ain
-12 -6 0 6 12Chord Rotation, %
-10
10
30
50
70
Mill
istr
ain

274
Figure 384 – Measured strain in diagonal bar of D120-3.5, strain gauge D13
Figure 385 – Measured strain in diagonal bar of D120-3.5, strain gauge D14
-12 -6 0 6 12Chord Rotation, %
-10
10
30
50
70
Mill
istr
ain
-12 -6 0 6 12Chord Rotation, %
-10
10
30
50
70
Mill
istr
ain
-12 -6 0 6 12-30
-7.5
15
37.5
60

275
Figure 386 – Measured strain in closed stirrup of D120-3.5, strain gauge S1
Figure 387 – Measured strain in closed stirrup of D120-3.5, strain gauge S2
-12 -6 0 6 12Chord Rotation, %
-2
0
2
4
6
8
Mill
istr
ain
Gauge Malfunctioned
-12 -6 0 6 12Chord Rotation, %
-2
0
2
4
6
8
Mill
istr
ain

276
Figure 388 – Measured strain in closed stirrup of D120-3.5, strain gauge S3
Figure 389 – Measured strain in closed stirrup of D120-3.5, strain gauge S4
-12 -6 0 6 12Chord Rotation, %
-2
0
2
4
6
8
Mill
istr
ain
-12 -6 0 6 12Chord Rotation, %
-2
0
2
4
6
8
Mill
istr
ain

277
Figure 390 – Measured strain in closed stirrup of D120-3.5, strain gauge S5
Figure 391 – Measured strain in closed stirrup of D120-3.5, strain gauge S6
-12 -6 0 6 12Chord Rotation, %
-2
0
2
4
6
8
Mill
istr
ain
-12 -6 0 6 12Chord Rotation, %
-2
0
2
4
6
8
Mill
istr
ain

278
Figure 392 – Measured strain in closed stirrup of D120-3.5, strain gauge S7
Figure 393 – Measured strain in closed stirrup of D120-3.5, strain gauge S8
-12 -6 0 6 12Chord Rotation, %
-2
0
2
4
6
8
Mill
istr
ain
-12 -6 0 6 12Chord Rotation, %
-2
0
2
4
6
8
Mill
istr
ain

279
Figure 394 – Measured strain in closed stirrup of D120-3.5, strain gauge S9
-12 -6 0 6 12Chord Rotation, %
-2
0
2
4
6
8
Mill
istr
ain

280
Figure 395 – Measured strain in parallel bar of D120-3.5, strain gauge H1
Figure 396 – Measured strain in parallel bar of D120-3.5, strain gauge H2
-12 -6 0 6 12Chord Rotation, %
-2
0
2
4
6
8
Mill
istr
ain
-12 -6 0 6 12Chord Rotation, %
-2
0
2
4
6
8
Mill
istr
ain
-12 -6 0 6 12-10
-5
0
5
10

281
Figure 397 – Measured strain in parallel bar of D120-3.5, strain gauge H3
Figure 398 – Measured strain in parallel bar of D120-3.5, strain gauge H4
-12 -6 0 6 12Chord Rotation, %
-2
0
2
4
6
8
Mill
istr
ain
-12 -6 0 6 12Chord Rotation, %
-2
0
2
4
6
8
Mill
istr
ain
-12 -6 0 6 12-10
-5
0
5
10

282
Figure 399 – Measured strain in parallel bar of D120-3.5, strain gauge H5
-12 -6 0 6 12Chord Rotation, %
-2
0
2
4
6
8
Mill
istr
ain
-12 -6 0 6 12-10
-5
0
5
10

283
Figure 400 – Measured strain in crosstie of D120-3.5, strain gauge T1
Figure 401 – Measured strain in crosstie of D120-3.5, strain gauge T2
-12 -6 0 6 12Chord Rotation, %
-2
0
2
4
6
8
Mill
istr
ain
-12 -6 0 6 12Chord Rotation, %
-2
0
2
4
6
8
Mill
istr
ain

284
Figure 402 – Measured strain in crosstie of D120-3.5, strain gauge T3
-12 -6 0 6 12Chord Rotation, %
-2
0
2
4
6
8
Mill
istr
ain

285
Figure 403 – Measured strain in parallel bar of P80-2.5, strain gauge P1
Figure 404 – Measured strain in parallel bar of P80-2.5, strain gauge P2

286
Figure 405 – Measured strain in parallel bar of P80-2.5, strain gauge P3
Figure 406 – Measured strain in parallel bar of P80-2.5, strain gauge P4

287
Figure 407 – Measured strain in parallel bar of P80-2.5, strain gauge P5
Figure 408 – Measured strain in parallel bar of P80-2.5, strain gauge P6

288
Figure 409 – Measured strain in parallel bar of P80-2.5, strain gauge P7
Figure 410 – Measured strain in parallel bar of P80-2.5, strain gauge P8
-12 -6 0 6 12-20
-10
0
10
20

289
Figure 411 – Measured strain in parallel bar of P80-2.5, strain gauge P9
Figure 412 – Measured strain in parallel bar of P80-2.5, strain gauge P10

290
Figure 413 – Measured strain in parallel bar of P80-2.5, strain gauge P11
Figure 414 – Measured strain in parallel bar of P80-2.5, strain gauge P12

291
Figure 415 – Measured strain in closed stirrup of P80-2.5, strain gauge S1
Figure 416 – Measured strain in closed stirrup of P80-2.5, strain gauge S2

292
Figure 417 – Measured strain in closed stirrup of P80-2.5, strain gauge S3
Figure 418 – Measured strain in closed stirrup of P80-2.5, strain gauge S4
-12 -6 0 6 12Chord Rotation, %
-2
0
2
4
6
8
Mill
istr
ain
Gauge Malfunctioned
-12 -6 0 6 12Chord Rotation, %
-2
0
2
4
6
8
Mill
istr
ain
Gauge Malfunctioned

293
Figure 419 – Measured strain in closed stirrup of P80-2.5, strain gauge S5
Figure 420 – Measured strain in closed stirrup of P80-2.5, strain gauge S6

294
Figure 421 – Measured strain in closed stirrup of P80-2.5, strain gauge S7
Figure 422 – Measured strain in closed stirrup of P80-2.5, strain gauge S8

295
Figure 423 – Measured strain in closed stirrup of P80-2.5, strain gauge S9

296
Figure 424 – Measured strain in crosstie of P80-2.5, strain gauge T1

297
Figure 425 – Measured strain in parallel bar of P100-2.5, strain gauge P1
Figure 426 – Measured strain in parallel bar of P100-2.5, strain gauge P2
-12 -6 0 6 12Chord Rotation, %
-10
10
30
50
70
Mill
istr
ain
Gauge Malfunctioned

298
Figure 427 – Measured strain in parallel bar of P100-2.5, strain gauge P3
Figure 428 – Measured strain in parallel bar of P100-2.5, strain gauge P4

299
Figure 429 – Measured strain in parallel bar of P100-2.5, strain gauge P5
Figure 430 – Measured strain in parallel bar of P100-2.5, strain gauge P6
-12 -6 0 6 12Chord Rotation, %
-10
10
30
50
70
Mill
istr
ain
Gauge Malfunctioned

300
Figure 431 – Measured strain in parallel bar of P100-2.5, strain gauge P7
Figure 432 – Measured strain in parallel bar of P100-2.5, strain gauge P8
-12 -6 0 6 12Chord Rotation, %
-10
10
30
50
70
Mill
istr
ain
Gauge Malfunctioned

301
Figure 433 – Measured strain in parallel bar of P100-2.5, strain gauge P9
Figure 434 – Measured strain in parallel bar of P100-2.5, strain gauge P10

302
Figure 435 – Measured strain in parallel bar of P100-2.5, strain gauge P11
Figure 436 – Measured strain in parallel bar of P100-2.5, strain gauge P12

303
Figure 437 – Measured strain in closed stirrup of P100-2.5, strain gauge S1
Figure 438 – Measured strain in closed stirrup of P100-2.5, strain gauge S2

304
Figure 439 – Measured strain in closed stirrup of P100-2.5, strain gauge S3
Figure 440 – Measured strain in closed stirrup of P100-2.5, strain gauge S4

305
Figure 441 – Measured strain in closed stirrup of P100-2.5, strain gauge S5
Figure 442 – Measured strain in closed stirrup of P100-2.5, strain gauge S6

306
Figure 443 – Measured strain in closed stirrup of P100-2.5, strain gauge S7
Figure 444 – Measured strain in closed stirrup of P100-2.5, strain gauge S8

307
Figure 445 – Measured strain in closed stirrup of P100-2.5, strain gauge S9

308
Figure 446 – Measured strain in crosstie of P100-2.5, strain gauge T1

309
Figure 447 – Envelopes of measured strains in diagonal bars of D80-1.5, D strain gauges
Figure 448 – Envelopes of measured strains in closed stirrups of D80-1.5, S strain gauges
-12 -6 0 6 12Chord Rotation, %
-10
10
30
50
70
Mill
istr
ain
D1D1 D2D2 D3
D3 D4
D4
D5
D5 D6
D6
D7
D7
D8
D8D10
D10
D11D11
D12
D12
D13D13 D14
D14
-12 -6 0 6 12Chord Rotation, %
-2
0
2
4
6
8
Mill
istr
ain
S2
S2
S3
S3
S4
S4S5S5
S6
S6
S7S7
S8S8S9
S9
S4

310
Figure 449 – Envelopes of measured strains in parallel bars of D80-1.5, H strain gauges
Figure 450 – Envelopes of measured strains in crossties of D80-1.5, T strain gauges
-12 -6 0 6 12Chord Rotation, %
-2
0
2
4
6
8
Mill
istr
ain
H1H1
H2
H2
H3
H3
H4
H4
H5
H5
H6
H9
H11
H11
H12
H12
H13
H13H14
H14
H6
H9
H12
H14
-12 -6 0 6 12Chord Rotation, %
-2
0
2
4
6
8
Mill
istr
ain
T1
T2T2
T3T3
T4
T4T4
T1

311
Figure 451 – Envelopes of measured strains in diagonal bars of D100-1.5, D strain gauges
Figure 452 – Envelopes of measured strains in closed stirrups of D100-1.5, S strain gauges
-12 -6 0 6 12Chord Rotation, %
-10
10
30
50
70
Mill
istr
ain
D1D1D3
D3 D4D4
D5
D6
D6
D7
D7
D8D8
D9
D9 D10
D10
D11
D11
D12
D12D13
D13
D14
D14
D5
-12 -6 0 6 12Chord Rotation, %
-2
0
2
4
6
8
Mill
istr
ain
S2
S2 S3
S3
S4S5
S5 S7
S7
S8
S8S9
S9
S4
S8S7
-12 -6 0 6 120
22.5
45
67.5
90
D5
D11

312
Figure 453 – Envelopes of measured strains in parallel bars of D100-1.5, H strain gauges
Figure 454 – Envelopes of measured strains in crossties of D100-1.5, T strain gauges
-12 -6 0 6 12Chord Rotation, %
-2
0
2
4
6
8
Mill
istr
ain
H3
H3
H4
H5H5
H6H6
H7H7
H9
H9
H10
H10
H12H12
H12
H3
H4
-12 -6 0 6 12Chord Rotation, %
-2
0
2
4
6
8
Mill
istr
ain
T1T1 T2T2
T3
T3
T4T4
T5T5

313
Figure 455 – Envelopes of measured strains in diagonal bars of D120-1.5, D strain gauges
Figure 456 – Envelopes of measured strains in closed stirrups of D120-1.5, S strain gauges
-12 -6 0 6 12Chord Rotation, %
-10
10
30
50
70
Mill
istr
ain
D1D1 D2D2
D3
D3 D4
D4
D5
D5
D6
D6 D7D7 D8D8
D10
D10D9
D9
D11
D12
D12
D14
D14D11
-12 -6 0 6 12Chord Rotation, %
-2
0
2
4
6
8
Mill
istr
ain
S1
S1
S2
S2S3
S3
S4S4
S5
S5
S6
S6S7
S7
S8S8
S9
S9
S2

314
Figure 457 – Envelopes of measured strains in parallel bars of D120-1.5, H strain gauges
Figure 458 – Envelopes of measured strains in crossties of D120-1.5, T strain gauges
-12 -6 0 6 12Chord Rotation, %
-2
0
2
4
6
8
Mill
istr
ain
H1
H1
H3
H3 H4
H4
H6
H8H8
H9
H9
H10
H11
H11
H3
H10H6
H4
-12 -6 0 6 12Chord Rotation, %
-2
0
2
4
6
8
Mill
istr
ain
T3T3T4
T4T5
T5
T6T6
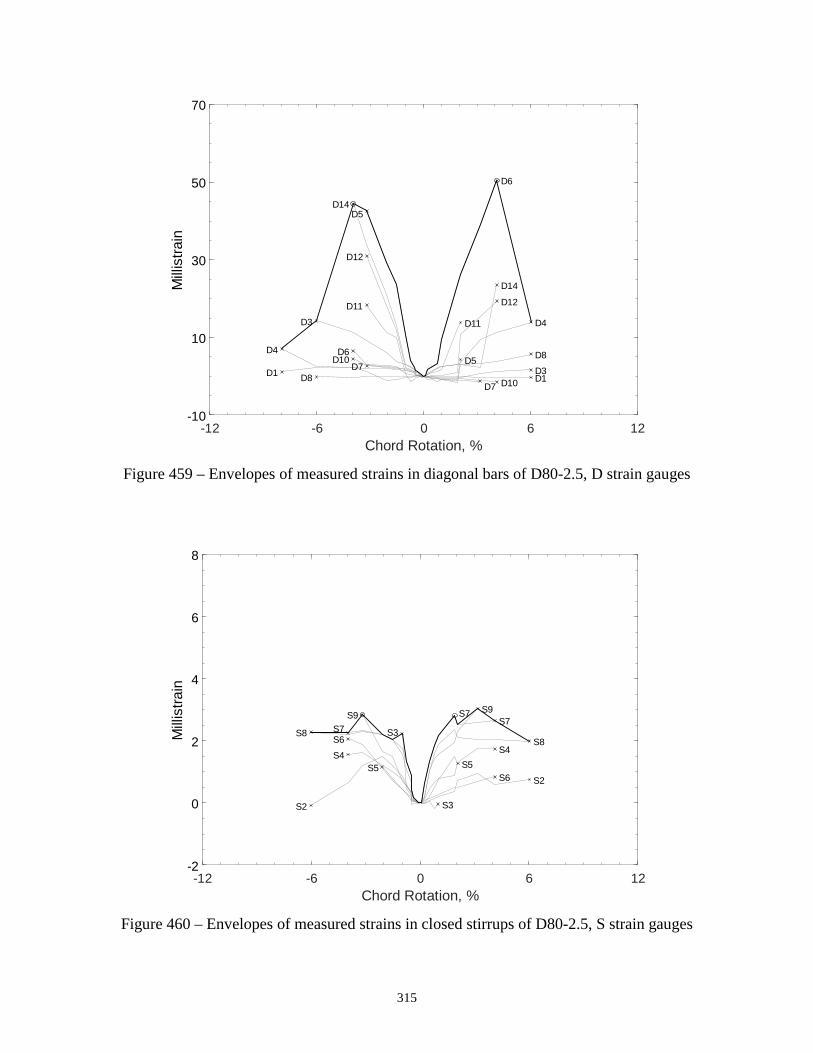
315
Figure 459 – Envelopes of measured strains in diagonal bars of D80-2.5, D strain gauges
Figure 460 – Envelopes of measured strains in closed stirrups of D80-2.5, S strain gauges
-12 -6 0 6 12Chord Rotation, %
-10
10
30
50
70
Mill
istr
ain
D1D1 D3
D3 D4
D4D5
D5
D6
D6
D7
D7D8
D8 D10
D10
D11
D11 D12
D12
D14
D14
-12 -6 0 6 12Chord Rotation, %
-2
0
2
4
6
8
Mill
istr
ain
S2
S2 S3
S3
S4S4
S5S5S6
S6
S7S7
S8S8
S9S9 S7

316
Figure 461 – Envelopes of measured strains in parallel bars of D80-2.5, H strain gauges
Figure 462 – Envelopes of measured strains in crossties of D80-2.5, T strain gauges
-12 -6 0 6 12Chord Rotation, %
-2
0
2
4
6
8
Mill
istr
ain
H1
H1
H2
H2
H3
H3
H4
H4
H5
H1H5
H4
H3
-12 -6 0 6 12Chord Rotation, %
-2
0
2
4
6
8
Mill
istr
ain
T1T1
T2T2

317
Figure 463 – Envelopes of measured strains in diagonal bars of D100-2.5, D strain gauges
Figure 464 – Envelopes of measured strains in closed stirrups of D100-2.5, S strain gauges
-12 -6 0 6 12Chord Rotation, %
-10
10
30
50
70
Mill
istr
ain
D1D1D2
D3
D3
D4D6
D7D7D8
D8
D9
D9D10
D10D13
D13
D14
D14
D4D2
D6
-12 -6 0 6 12Chord Rotation, %
-2
0
2
4
6
8
Mill
istr
ain
S1S1
S2
S2
S3
S3
S4
S4
S6S6
S7S7S8S8
S9
S9
-12 -6 0 6 120
20
40
60
80
D14
D6

318
Figure 465 – Envelopes of measured strains in parallel bars of D100-2.5, H strain gauges
Figure 466 – Envelopes of measured strains in crossties of D100-2.5, T strain gauges
-12 -6 0 6 12Chord Rotation, %
-2
0
2
4
6
8
Mill
istr
ain
H1
H1
H4
H4H5
H5
H6
H6
-12 -6 0 6 12Chord Rotation, %
-2
0
2
4
6
8
Mill
istr
ain
T1T1 T2T2
T3
T3
T3

319
Figure 467 – Envelopes of measured strains in diagonal bars of D120-2.5, D strain gauges
Figure 468 – Envelopes of measured strains in closed stirrups of D120-2.5, S strain gauges
-12 -6 0 6 12Chord Rotation, %
-10
10
30
50
70
Mill
istr
ain
D1D1 D2D2 D3
D3D4D4 D5
D5
D6
D6
D7
D7
D8
D8 D10
D10
D11
D11
D12
D12
D13
D13
D14
D14
-12 -6 0 6 12Chord Rotation, %
-2
0
2
4
6
8
Mill
istr
ain
S2
S2
S3S3
S4S4
S5
S5
S6
S6 S7S7
S8
S8
S9S9
S10
S10
S11
S11
S12S12
S13
S13
S14
S14S15
S15
S16S16
S17
S17
S11

320
Figure 469 – Envelopes of measured strains in parallel bars of D120-2.5, H strain gauges
Figure 470 – Envelopes of measured strains in crossties of D120-2.5, T strain gauges
-12 -6 0 6 12Chord Rotation, %
-2
0
2
4
6
8
Mill
istr
ain
H1
H2
H3
H3
H4H4
H1 H2
-12 -6 0 6 12Chord Rotation, %
-2
0
2
4
6
8
Mill
istr
ain
T1
T1
T2T2
T3T3
T3

321
Figure 471 – Envelopes of measured strains in diagonal bars of D80-3.5, D strain gauges
Figure 472 – Envelopes of measured strains in closed stirrups of D80-3.5, S strain gauges
-12 -6 0 6 12Chord Rotation, %
-10
10
30
50
70
Mill
istr
ain
D1D1D2D2
D3D3
D4D4
D5
D5
D6
D7
D7 D9
D9 D10
D10
D11
D11D12
D12
D13
D13
D14
D14
D6
-12 -6 0 6 12Chord Rotation, %
-2
0
2
4
6
8
Mill
istr
ain
S2S2 S3
S3
S4S4S5
S5
S6S6
S7
S7 S8S8
S3
S3
S9
S9

322
Figure 473 – Envelopes of measured strains in parallel bars of D80-3.5, H strain gauges
Figure 474 – Envelopes of measured strains in crossties of D80-3.5, T strain gauges
-12 -6 0 6 12Chord Rotation, %
-2
0
2
4
6
8
Mill
istr
ain
H4
H4
H5
H6
H8
H8 H6
H5
H1 H1
-12 -6 0 6 12Chord Rotation, %
-2
0
2
4
6
8
Mill
istr
ain
T1T1
T2
T2
T3
T3
T3

323
Figure 475 – Envelopes of measured strains in diagonal bars of D100-3.5, D strain gauges
Figure 476 – Envelopes of measured strains in closed stirrups of D100-3.5, S strain gauges
-12 -6 0 6 12Chord Rotation, %
-10
10
30
50
70
Mill
istr
ain
D2D2D4D4
D5
D5
D6
D7
D7 D8
D8 D9D9 D10D10
D11
D11D12
D12
D13
D13D14
D14
D6
-12 -6 0 6 12Chord Rotation, %
-2
0
2
4
6
8
Mill
istr
ain
S2
S2
S3
S3
S4
S4 S5S5
S6S6
S7
S7
S8S8

324
Figure 477 – Envelopes of measured strains in parallel bars of D100-3.5, H strain gauges
Figure 478 – Envelopes of measured strains in crossties of D100-3.5, T strain gauges
-12 -6 0 6 12Chord Rotation, %
-2
0
2
4
6
8
Mill
istr
ain
H1
H1
H2
H2H3
H3
H6
H6
H7
H7
H6
H7
-12 -6 0 6 12Chord Rotation, %
-2
0
2
4
6
8
Mill
istr
ain
T1T1 T2
T2
T3
T3

325
Figure 479 – Envelopes of measured strains in diagonal bars of D120-3.5, D strain gauges
Figure 480 – Envelopes of measured strains in closed stirrups of D120-3.5, S strain gauges
-12 -6 0 6 12Chord Rotation, %
-10
10
30
50
70
Mill
istr
ain
D1D1 D2D2 D3D3 D4D4
D5
D5
D6
D6D7
D7 D8D8
D9
D9D10D10
D11D12
D12
D13
D13
D14
D14
-12 -6 0 6 12Chord Rotation, %
-2
0
2
4
6
8
Mill
istr
ain
S2
S3
S3
S4S4
S5
S5
S6
S6 S7S7
S8S8S9
S9
S2

326
Figure 481 – Envelopes of measured strains in parallel bars of D120-3.5, H strain gauges
Figure 482 – Envelopes of measured strains in crossties of D120-3.5, T strain gauges
-12 -6 0 6 12Chord Rotation, %
-2
0
2
4
6
8
Mill
istr
ain
H1
H1
H2
H3
H3
H4
H5H5 H2
H4
-12 -6 0 6 12Chord Rotation, %
-2
0
2
4
6
8
Mill
istr
ain
T1
T1
T2T2
T3
T3
T3T3

327
Figure 483 – Envelopes of measured strains in parallel bars of P80-2.5, P strain gauges
Figure 484 – Envelopes of measured strains in closed stirrups of P80-2.5, S strain gauges
-12 -6 0 6 12Chord Rotation, %
-10
10
30
50
70
Mill
istr
ain
P1P1
P2P2
P3
P3P4
P4
P5
P5P6
P6
P7P9
P9P10
P10
P11
P11P12
P12
P7
P8 P8
P6
-12 -6 0 6 12Chord Rotation, %
-2
0
2
4
6
8
Mill
istr
ain
S1S1
S2
S2
S5S5
S6
S6
S7S7S8
S8
S9
S9
S8

328
Figure 485 – Envelopes of measured strains in crossties of P80-2.5, T strain gauges
-12 -6 0 6 12Chord Rotation, %
-2
0
2
4
6
8
Mill
istr
ain
T1
T1
T1

329
Figure 486 – Envelopes of measured strains in parallel bars of P100-2.5, P strain gauges
Figure 487 – Envelopes of measured strains in closed stirrups of P100-2.5, S strain gauges
-12 -6 0 6 12Chord Rotation, %
-10
10
30
50
70
Mill
istr
ain
P1P1
P3
P3 P4P4
P5
P5
P7
P7
P8
P8 P9
P9
P10P10
P11
P11
P12
P12
-12 -6 0 6 12Chord Rotation, %
-2
0
2
4
6
8
Mill
istr
ain
S1
S1
S2
S2
S3
S3
S4
S5
S6
S6 S7
S7S8S8 S9
S9S4
S5

330
Figure 488 – Envelopes of measured strains in crossties of P100-2.5, T strain gauges
-12 -6 0 6 12Chord Rotation, %
-2
0
2
4
6
8
Mill
istr
ain
T1
T1 T1

331
Figure 489 – Envelopes of measured strains in diagonal bars of D-type beams with an aspect ratio of 1.5, D strain gauges
Figure 490 – Envelopes of measured strains in closed stirrups of D-type beams with an aspect ratio of 1.5, S strain gauges
-12 -6 0 6 12Chord Rotation, %
-10
10
30
50
70
Mill
istr
ain
D80-1.5 D100-1.5 D120-1.5Strain at V
maxmax
D80-1.5 D100-1.5 D120-1.5Strain at CR100
-12 -6 0 6 12Chord Rotation, %
-2
0
2
4
6
8
Mill
istr
ain
D80-1.5 D100-1.5 D120-1.5Strain at V
maxmax
D80-1.5 D100-1.5 D120-1.5Strain at CR100

332
Figure 491 – Envelopes of measured strains in parallel bars of D-type beams with an aspect ratio of 1.5, H strain gauges
Figure 492 – Envelopes of measured strains in crossties of D-type beams with an aspect ratio of 1.5, T strain gauges
-12 -6 0 6 12Chord Rotation, %
-2
0
2
4
6
8
Mill
istr
ain
D80-1.5 D100-1.5 D120-1.5Strain at V
maxmax
D80-1.5 D100-1.5 D120-1.5Strain at CR100
-12 -6 0 6 12Chord Rotation, %
-2
0
2
4
6
8
Mill
istr
ain
D80-1.5 D100-1.5 D120-1.5Strain at V
maxmax
D80-1.5 D100-1.5 D120-1.5Strain at CR100

333
Figure 493 – Envelopes of measured strains in diagonal bars of D-type beams with an aspect ratio of 2.5, D strain gauges
Figure 494 – Envelopes of measured strains in closed stirrups of D-type beams with an aspect ratio of 2.5, S strain gauges
-12 -6 0 6 12Chord Rotation, %
-10
10
30
50
70
Mill
istr
ain
D80-2.5 D100-2.5 D120-2.5Strain at V
maxmax
D80-2.5 D100-2.5 D120-2.5Strain at CR100
-12 -6 0 6 12Chord Rotation, %
-2
0
2
4
6
8
Mill
istr
ain
D80-2.5 D100-2.5 D120-2.5Strain at V
maxmax
D80-2.5 D100-2.5 D120-2.5Strain at CR100
-12 -6 0 6 120
20
40
60
80

334
Figure 495 – Envelopes of measured strains in parallel bars of D-type beams with an aspect ratio of 2.5, H strain gauges
Figure 496 – Envelopes of measured strains in crossties of D-type beams with an aspect ratio of 2.5, T strain gauges
-12 -6 0 6 12Chord Rotation, %
-2
0
2
4
6
8
Mill
istr
ain
max
D80-2.5 D100-2.5 D120-2.5Strain at CR100
-12 -6 0 6 12Chord Rotation, %
-2
0
2
4
6
8
Mill
istr
ain
D80-2.5 D100-2.5 D120-2.5Strain at V
maxmax
D80-2.5 D100-2.5 D120-2.5Strain at CR100
-12 -6 0 6 120
3.75
7.5
11.25
15
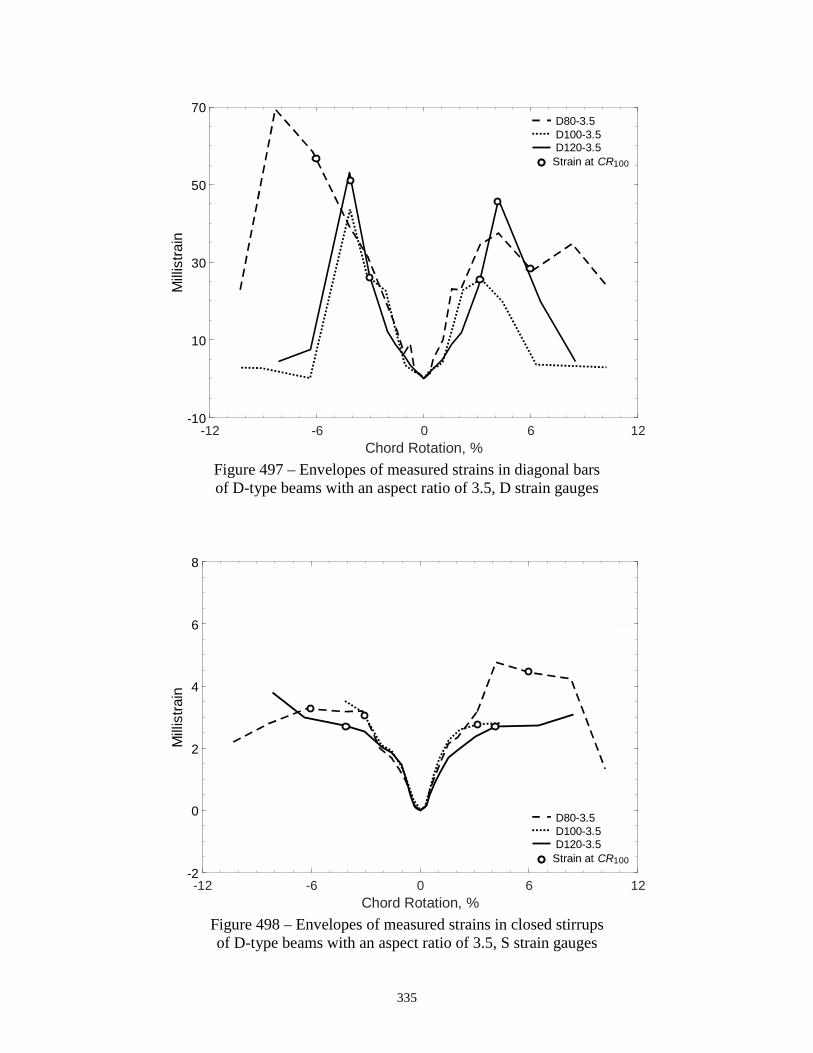
335
Figure 497 – Envelopes of measured strains in diagonal bars of D-type beams with an aspect ratio of 3.5, D strain gauges
Figure 498 – Envelopes of measured strains in closed stirrups of D-type beams with an aspect ratio of 3.5, S strain gauges
-12 -6 0 6 12Chord Rotation, %
-10
10
30
50
70
Mill
istr
ain
D80-3.5 D100-3.5 D120-3.5Strain at V
maxmax
D80-3.5 D100-3.5 D120-3.5Strain at CR100
-12 -6 0 6 12Chord Rotation, %
-2
0
2
4
6
8
Mill
istr
ain
max
D80-3.5 D100-3.5 D120-3.5Strain at CR100

336
Figure 499 – Envelopes of measured strains in parallel bars of D-type beams with an aspect ratio of 3.5, H strain gauges
Figure 500 – Envelopes of measured strains in crossties of D-type beams with an aspect ratio of 3.5, T strain gauges
-12 -6 0 6 12Chord Rotation, %
-2
0
2
4
6
8
Mill
istr
ain
D80-3.5 D100-3.5 D120-3.5Strain at CR100
-12 -6 0 6 12Chord Rotation, %
-2
0
2
4
6
8
Mill
istr
ain
D80-3.5 D100-3.5 D120-3.5Strain at V
maxmax
D80-3.5 D100-3.5 D120-3.5Strain at CR100

337
Figure 501 – Envelopes of measured strains in parallel bars of P-type beams with an aspect ratio of 2.5, P strain gauges
Figure 502 – Envelopes of measured strains in closed stirrups of P-type beams with an aspect ratio of 2.5, S strain gauges
-12 -6 0 6 12Chord Rotation, %
-10
10
30
50
70
Mill
istr
ain
P80-2.5 P100-2.5Strain at CR100
P80-2.5 P100-2.5Strain at CR100
-12 -6 0 6 12Chord Rotation, %
-2
0
2
4
6
8
Mill
istr
ain
P80-2.5 P100-2.5Strain at V
maxmax
P80-2.5 P100-2.5Strain at CR100

338
Figure 503 – Envelopes of measured strains in crossties of P-type beams with aspect ratio of 2.5, T strain gauges
-12 -6 0 6 12Chord Rotation, %
-2
0
2
4
6
8
Mill
istr
ain
P80-2.5 P100-2.5Strain at V
maxmax
P80-2.5 P100-2.5Strain at CR100

339
Figure 504 – Maximum strains in D-type beams during loading steps 5 through 9 (1% through 4% chord rotation), D strain gauges
Figure 505 – Maximum strains in P-type beams during loading steps 5 through 9 (1% through 4% chord rotation), P strain gauges
-4 -2 0 2 4Chord Rotation, %
0
25
50
75
100
Mill
istr
ain D80-1.5
D80-1.5
D100-1.5
D100-1.5
D120-1.5
D120-1.5
D80-2.5
D80-2.5
D100-2.5
D120-2.5
D120-2.5
D80-3.5 D80-3.5
D100-3.5
D100-3.5
D120-3.5
D120-3.5
D120-2.5 D80-3.5 D100-3.5 D120-3.5
D80-1.5 D100-1.5 D120-1.5 D80-2.5 D100-2.5
-4 -2 0 2 4Chord Rotation, %
Mill
istr
ain
P80-2.5
P80-2.5
P100-2.5
P100-2.5
P80-2.5 P100-2.5
0
25
50
75
100

A–1
APPENDIX A: NOTATION

A–2
𝐴 = cross-sectional area of a member measured to the outside edges of transverse
reinforcement, in.2
𝐴 = effective shear area, in.2
𝐴 = gross area of concrete section, in.2
𝐴 = total area of primary longitudinal reinforcement along the top or bottom face of a
coupling beam with parallel reinforcement layout, in.2
𝐴 = total cross-sectional area of transverse reinforcement, including crossties, within
spacing s and perpendicular to dimension bc, in.2
𝐴 = total area of reinforcement in each group of diagonal bars in a
diagonally-reinforced coupling beam, in.2
𝐴 = shear area, 𝐴 𝑏 ℎ 1.2⁄ (for rectangular sections), in.2
𝑏 = cross-sectional dimension of member core measured to the outside edges of the
transverse reinforcement composing area 𝐴 , in.
𝑏 = beam width, in.
𝑐 = clear cover of reinforcement, in.
𝐶𝑅 = chord rotation of the coupling beam, corrected for sliding and relative rotation
between the top and bottom block, rad
𝐶𝑅 = chord rotation corresponding to 𝑉 0.75𝑉 on the 𝑉 versus 𝐶𝑅 envelope curve
(before 𝑉 and for a given loading direction), rad
𝐶𝑅 = chord rotation corresponding to 𝑉 , rad
𝑑 = distance from extreme compression fiber to centroid of longitudinal tension
reinforcement, in.
𝑑 = nominal diameter of the primary longitudinal reinforcing bar, in.
𝐸 = modulus of elasticity of steel reinforcement, 29,000 ksi (200,000 MPa)
𝐸 = modulus of elasticity of concrete, psi
𝑓 = specified compressive strength of concrete, psi
𝑓 = measured average compressive strength of concrete, psi

A–3
𝑓 = measured average splitting tensile strength of concrete, psi
𝑓 = measured peak stress or tensile strength of reinforcement, ksi
𝑓 = specified yield stress of longitudinal reinforcement, ksi
𝑓 = measured yield stress of longitudinal reinforcement, ksi
𝑓 = specified yield stress of transverse reinforcement, ksi
𝑓 = measured yield stress of transverse reinforcement, ksi
𝐺 = shear modulus of concrete, 𝐺 0.4𝐸 , ksi
ℎ = beam height, in.
𝑖 = index referring to layer of reinforcement
𝐼 = effective moment of inertia, in.4
𝐼 = gross moment of inertia, in.4
𝐼 = uncracked moment of inertia of the transformed section, in.4
𝐾 = stiffness calculated using ASCE 41-17 Table 10-19[4], kips/in.
𝐾 = secant stiffness associated with 𝐶𝑅 , kips/in.
𝐾 = secant stiffness associated with the peak force of a loading step (Tables 10 through
13), kips/in.
ℓ = minimum straight embedment length to develop a tension stress of 1.25fy, in.
ℓ = length of clear span measured face-to-face of supports, in.
𝑀 = calculated flexural strength corresponding to a stress of fym in the primary
longitudinal reinforcement, lb-in.
𝑀 = calculated flexural strength corresponding to a stress of 1.25fy in the primary
longitudinal reinforcement, lb-in.
𝑛 = total number of primary longitudinal reinforcing bars
For a D-type beam, number of bars in each group of diagonal bars
For a P-type beam, number of bars along the top or bottom face
𝑠 = spacing of transverse reinforcement, center-to-center, in.
𝑣 = calculated shear stress based on specified material properties, psi

A–4
for a D-type beam, 𝑣 2𝐴 𝑓 sin 𝛼 / 𝑏 ℎ , psi
for a P-type beam, 𝑣 2𝑀 ℓ⁄ / 𝑏 𝑑 , psi
𝑣 = shear stress associated with 𝑉 , psi
for a D-type beam, 𝑣 𝑉 / 𝑏 ℎ , psi
for a P-type beam, 𝑣 𝑉 / 𝑏 𝑑 , psi
𝑣 = shear stress associated with 𝑉 , psi
for a D-type beam, 𝑣 𝑉 / 𝑏 ℎ , psi
for a P-type beam, 𝑣 𝑉 / 𝑏 𝑑 , psi
𝑉 = applied shear, kips
𝑉 = maximum applied shear, kips
𝑉 = calculated shear strength based on measured material properties, kips
for a D-type beam, 𝑉 2𝐴 𝑓 sin 𝛼
for a P-type beam, 𝑉 2𝑀 ℓ⁄
𝛼 = angle of inclination of diagonal reinforcement relative to beam longitudinal axis,
degrees
𝛿 = displacement of the bottom block top surface, in.
𝛿 = displacement of the top block bottom surface, in.
𝜀 = fracture elongation of reinforcement, in./in.
𝜀 = uniform elongation of reinforcement or strain corresponding to 𝑓 , in./in.
𝜃 = rotation of the bottom block (in the loading plane), rad
𝜃 = rotation of the top block (in the loading plane), rad
𝜌 = ratio of 𝐴 to 𝑏 𝑑

B–1
APPENDIX B: SELECTED PHOTOS
OF SPECIMENS DURING CONSTRUCTION

B–2
Figure B.2 – Coupling beam reinforcement, D120-2.5
Figure B.1 – Coupling beam reinforcement, D120-1.5

B–3
Figure B.3 – Coupling beam reinforcement, D120-3.5
Figure B.4 – Coupling beam reinforcement, P100-2.5

B–4
Figure B.5 – Base block reinforcement,
typical of beams with aspect ratios of 2.5 and 3.5
Figure B.6 –Top block reinforcement
typical of beams with aspect ratios of 2.5 and 3.5

B–5
Figure B.7 – Specimens before casting, D80-1.5, D100-1.5, and D120-1.5 (from left to right)
Figure B.8 – Specimens after formwork removal, D100-3.5, D80-3.5, P100-2.5, P80-2.5, D100-2.5, and D80-2.5 (from left to right)

C–1
APPENDIX C: SELECTED PHOTOS
OF SPECIMENS DURING TESTING

C–2
Figure C.1 – D80-1.5 during second cycle to 2% chord rotation

C–3
Figure C.2 – D80-1.5 during second cycle to 6% chord rotation
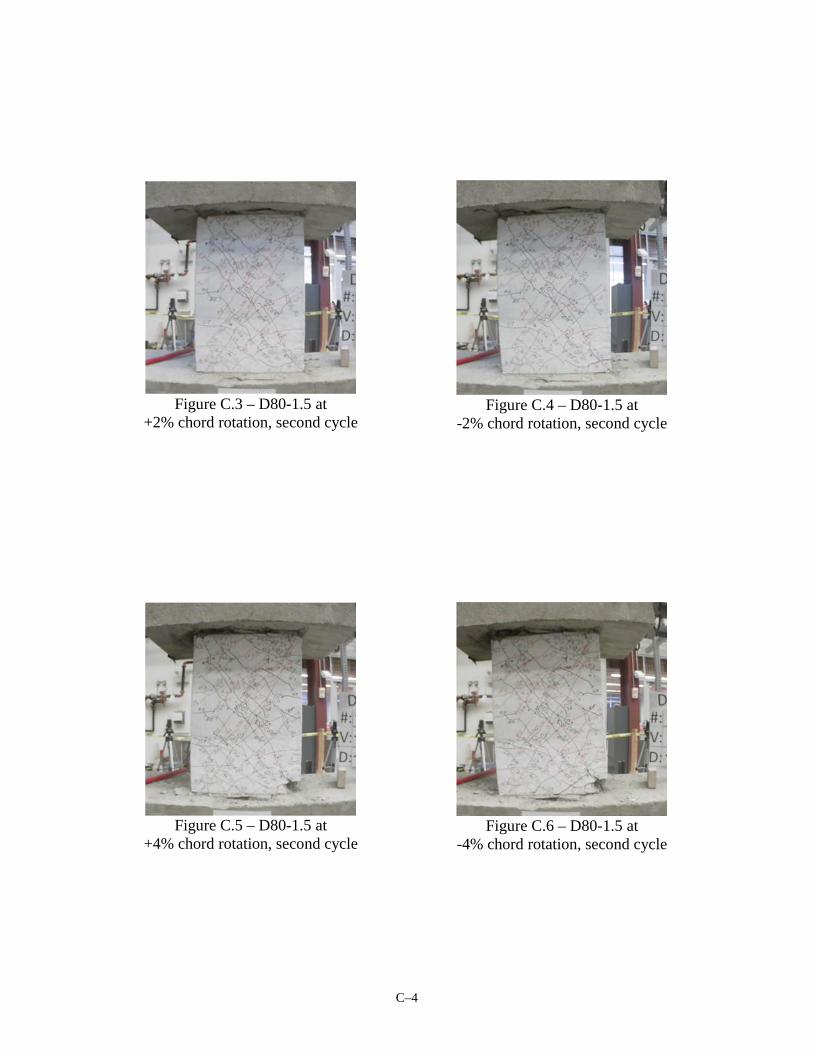
C–4
Figure C.3 – D80-1.5 at
+2% chord rotation, second cycle
Figure C.4 – D80-1.5 at
-2% chord rotation, second cycle
Figure C.5 – D80-1.5 at
+4% chord rotation, second cycle
Figure C.6 – D80-1.5 at
-4% chord rotation, second cycle

C–5
Figure C.7 – D80-1.5 at
+6% chord rotation, second cycle
Figure C.8 – D80-1.5 at
-6% chord rotation, second cycle
Figure C.9 – D80-1.5 at
+8% chord rotation, first cycle
Figure C.10 – D80-1.5 at
-8% chord rotation, first cycle

C–6
Figure C.11 – D100-1.5 during second cycle to 2% chord rotation

C–7
Figure C.12 – D100-1.5 during second cycle to 6% chord rotation

C–8
Figure C.13 – D100-1.5 at
+2% chord rotation, second cycle
Figure C.14 – D100-1.5 at
-2% chord rotation, second cycle
Figure C.15 – D100-1.5 at
+4% chord rotation, second cycle
Figure C.16 – D100-1.5 at
-4% chord rotation, second cycle

C–9
Figure C.17 – D100-1.5 at
+6% chord rotation, second cycle
Figure C.18 – D100-1.5 at
-6% chord rotation, second cycle
Figure C.19 – D100-1.5 at
+8% chord rotation, first cycle

C–10
Figure C.20 – D120-1.5 during second cycle to 2% chord rotation

C–11
Figure C.21 – D120-1.5 during first cycle to 6% chord rotation

C–12
Figure C.22 – D120-1.5 at
+2% chord rotation, second cycle
Figure C.23 – D120-1.5 at
-2% chord rotation, second cycle
Figure C.24 – D120-1.5 at
+4% chord rotation, second cycle
Figure C.25 – D120-1.5 at
-4% chord rotation, second cycle

C–13
Figure C.26 – D120-1.5 at
+6% chord rotation, first cycle
Figure C.27 – D120-1.5 at
-6% chord rotation, first cycle

C–14
Figure C.28 – D80-2.5 during
second cycle to 2% chord rotation

C–15
Figure C.29 – D80-2.5 during second cycle to 6% chord rotation

C–16
Figure C.30 – D80-2.5 at
+2% chord rotation, second cycle
Figure C.31 – D80-2.5 at
-2% chord rotation, second cycle
Figure C.32 – D80-2.5 at
+4% chord rotation, second cycle
Figure C.33 – D80-2.5 at
-4% chord rotation, second cycle

C–17
Figure C.34 – D80-2.5 at
+6% chord rotation, second cycle
Figure C.35 – D80-2.5 at
-6% chord rotation, second cycle
Figure C.36 – D80-2.5 at
+8% chord rotation, second cycle
Figure C.37 – D80-2.5 at
-8% chord rotation, second cycle

C–18
Figure C.38 – D80-2.5 at
+10% chord rotation, first cycle
Figure C.39 – D80-2.5 at
-10% chord rotation, first cycle

C–19
Figure C.40 – D100-2.5 during second cycle to 2% chord rotation

C–20
Figure C.41 – D100-2.5 during second cycle to 6% chord rotation

C–21
Figure C.42 – D100-2.5
at +2% chord rotation, second cycle
Figure C.43 – D100-2.5 at
-2% chord rotation, second cycle
Figure C.44 – D100-2.5 at
+4% chord rotation, second cycle
Figure C.45 – D100-2.5 at
-4% chord rotation, second cycle

C–22
Figure C.46 – D100-2.5 at
+6% chord rotation, second cycle
Figure C.47 – D100-2.5 at
-6% chord rotation, second cycle
Figure C.48 – D100-2.5 at
+8% chord rotation, first cycle
Figure C.49 – D100-2.5 at
-8% chord rotation, first cycle

C–23
Figure C.50 – D120-2.5 during second cycle to 2% chord rotation

C–24
Figure C.51 – D120-2.5 during second cycle to 6% chord rotation

C–25
Figure C.52 – D120-2.5 at
+2% chord rotation, second cycle
Figure C.53 – D120-2.5 at
-2% chord rotation, second cycle
Figure C.54 – D120-2.5 at
+4% chord rotation, second cycle
Figure C.55 – D120-2.5 at
-4% chord rotation, second cycle

C–26
Figure C.56 – D120-2.5 at
+6% chord rotation, second cycle
Figure C.57 – D120-2.5 at
-6% chord rotation, second cycle
Figure C.58 – D120-2.5 at
+8% chord rotation, second cycle
Figure C.59 – D120-2.5 at
-8% chord rotation, second cycle

C–27
Figure C.60 – D80-3.5 during second cycle to 2% chord rotation

C–28
Figure C.61 – D80-3.5 during second cycle to 6% chord rotation

C–29
Figure C.62 – D80-3.5 at
+2% chord rotation, second cycle
Figure C.63 – D80-3.5 at
-2% chord rotation, second cycle
Figure C.64 – D80-3.5 at
+4% chord rotation, second cycle
Figure C.65 – D80-3.5 at
-4% chord rotation, second cycle

C–30
Figure C.66 – D80-3.5 at
+6% chord rotation, second cycle
Figure C.67 – D80-3.5 at
-6% chord rotation, second cycle
Figure C.68 – D80-3.5 at
+8% chord rotation, second cycle
Figure C.69 – D80-3.5 at
-8% chord rotation, second cycle

C–31
Figure C.70 – D80-3.5 at
+10% chord rotation, first cycle
Figure C.71 – D80-3.5 at
-10% chord rotation, first cycle

C–32
Figure C.72 – D100-3.5 during second cycle to 2% chord rotation

C–33
Figure C.73 – D100-3.5 during second cycle to 6% chord rotation

C–34
Figure C.74 – D100-3.5 at
+2% chord rotation, second cycle
Figure C.75 – D100-3.5 at
-2% chord rotation, second cycle
Figure C.76 – D100-3.5 at
+4% chord rotation, second cycle
Figure C.77 – D100-3.5 at
-4% chord rotation, second cycle

C–35
Figure C.78 – D100-3.5 at
+6% chord rotation, second cycle
Figure C.79 – D100-3.5 at
-6% chord rotation, second cycle
Figure C.80 – D100-3.5 at
+8% chord rotation, second cycle
Figure C.81 – D100-3.5 at
-8% chord rotation, second cycle

C–36
Figure C.82 – D100-3.5 at
+10% chord rotation, first cycle
Figure C.83 – D100-3.5 at
-10% chord rotation, first cycle

C–37
Figure C.84 – D120-3.5 during second cycle to 2% chord rotation

C–38
Figure C.85 – D120-3.5 during second cycle to 6% chord rotation

C–39
Figure C.86 – D120-3.5 at
+2% chord rotation, second cycle
Figure C.87 – D120-3.5 at
-2% chord rotation, second cycle
Figure C.88 – D120-3.5 at
+4% chord rotation, second cycle
Figure C.89 – D120-3.5 at
-4% chord rotation, second cycle

C–40
Figure C.90 – D120-3.5 at
+6% chord rotation, second cycle
Figure C.91 – D120-3.5 at
-6% chord rotation, second cycle
Figure C.92 – D120-3.5 at
+8% chord rotation, second cycle
Figure C.93 – D120-3.5 at
-8% chord rotation, second cycle

C–41
Figure C.94 – P80-2.5 during second cycle to 2% chord rotation

C–42
Figure C.95 – P80-2.5 during second cycle to 6% chord rotation

C–43
Figure C.96 – P80-2.5 at
+2% chord rotation, second cycle
Figure C.97 – P80-2.5 at
-2% chord rotation, second cycle
Figure C.98 – P80-2.5 at
+4% chord rotation, second cycle
Figure C.99 – P80-2.5 at
-4% chord rotation, second cycle

C–44
Figure C.100 – P80-2.5 at
+6% chord rotation, second cycle
Figure C.101 – P80-2.5 at
-6% chord rotation, second cycle

C–45
Figure C.102 – P100-2.5 during
second cycle to 2% chord rotation

C–46
Figure C.103 – P100-2.5 during second cycle to 6% chord rotation

C–47
Figure C.104 – P100-2.5 at
+2% chord rotation, second cycle
Figure C.105 – P100-2.5 at
-2% chord rotation, second cycle
Figure C.106 – P100-2.5 at
+4% chord rotation, second cycle
Figure C.107 – P100-2.5 at
-4% chord rotation, second cycle

C–48
Figure C.108 – P100-2.5 at
+6% chord rotation, second cycle
Figure C.109 – P100-2.5 at
-6% chord rotation, second cycle
Related Documents