Reid & Sanders, Operations Management © Wiley 2002 Forecasting 8 C H A P T E R

Welcome message from author
This document is posted to help you gain knowledge. Please leave a comment to let me know what you think about it! Share it to your friends and learn new things together.
Transcript

Reid & Sanders, Operations Management© Wiley 2002
Forecasting 8C H A P T E R
Page 2Reid & Sanders, Operations Management© Wiley 2002
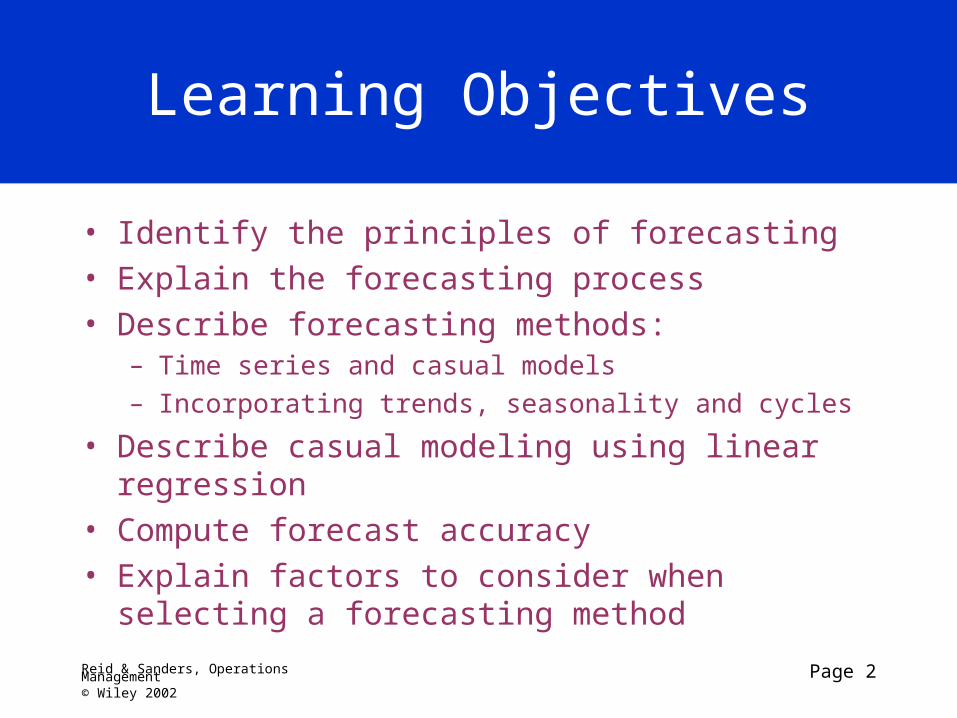
Learning Objectives
• Identify the principles of forecasting• Explain the forecasting process• Describe forecasting methods:
– Time series and casual models – Incorporating trends, seasonality and cycles
• Describe casual modeling using linear regression• Compute forecast accuracy• Explain factors to consider when selecting a
forecasting method
Page 3Reid & Sanders, Operations Management© Wiley 2002
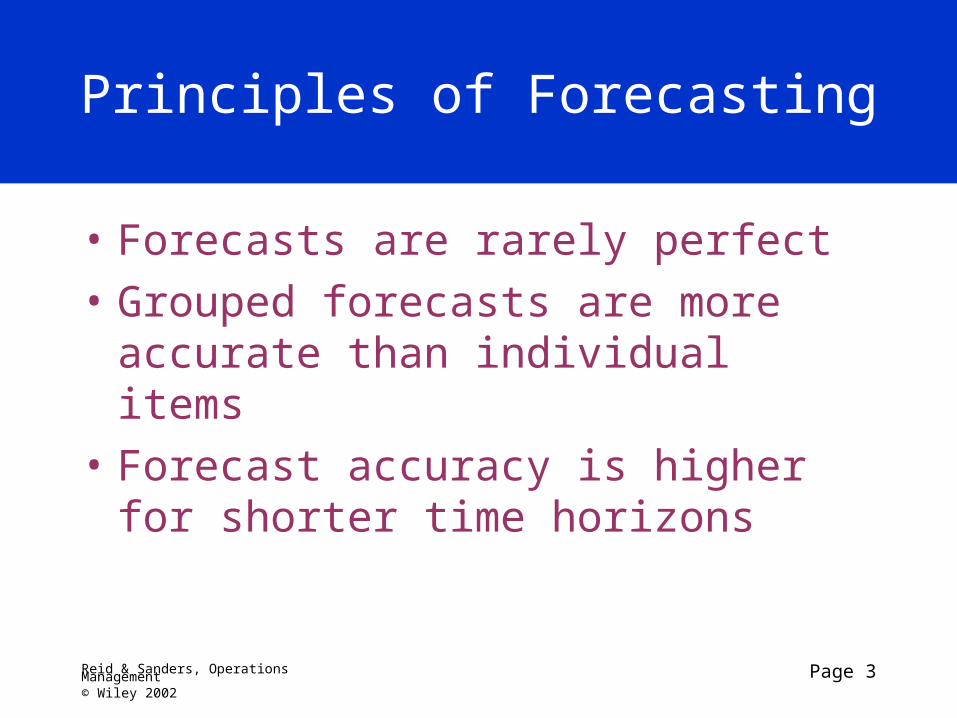
Principles of Forecasting
• Forecasts are rarely perfect
• Grouped forecasts are more accurate than individual items
• Forecast accuracy is higher for shorter time horizons

Page 4Reid & Sanders, Operations Management© Wiley 2002
Step-by-Step
• Decide what to forecast:– Level of detail, units of analysis & time horizon
required
• Evaluate & analyze appropriate data– Identify needed data & whether it’s available
• Select & test the forecasting model– Cost, ease of use & accuracy
• Generate the forecast• Monitor forecast accuracy over time

Page 5Reid & Sanders, Operations Management© Wiley 2002
Types of Forecasting Methods
• Qualitative methods:– Forecasts generated subjectively by the
forecaster
• Quantitative methods:– Forecasts generated through mathematical
modeling

Page 6Reid & Sanders, Operations Management© Wiley 2002
Qualitative Methods
• Strengths:– Incorporates inside information– Particularly useful when the future is
expected to be very different than the past
• Weaknesses:– Forecaster bias can reduce the accuracy of
the forecast
Page 7Reid & Sanders, Operations Management© Wiley 2002
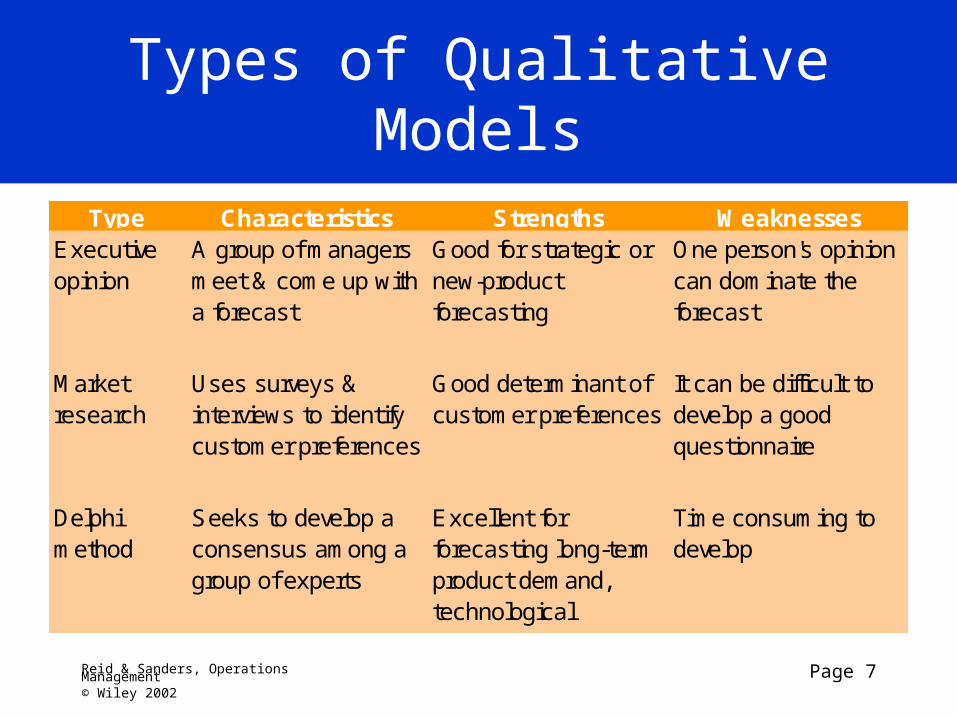
Types of Qualitative Models
Type Characteristics Strengths WeaknessesExecutive opinion
A group of managers meet & come up with a forecast
Good for strategic or new-product forecasting
One person's opinion can dominate the forecast
Market research
Uses surveys & interviews to identify customer preferences
Good determinant of customer preferences
It can be difficult to develop a good questionnaire
Delphi method
Seeks to develop a consensus among a group of experts
Excellent for forecasting long-term product demand, technological changes, and
Time consuming to develop

Page 8Reid & Sanders, Operations Management© Wiley 2002
Quantitative Methods
• Strengths:– Consistent and objective– Can consider a lot of data at once
• Weaknesses:– Necessary data isn’t always available– Forecast quality is dependent upon data
quality
Page 9Reid & Sanders, Operations Management© Wiley 2002
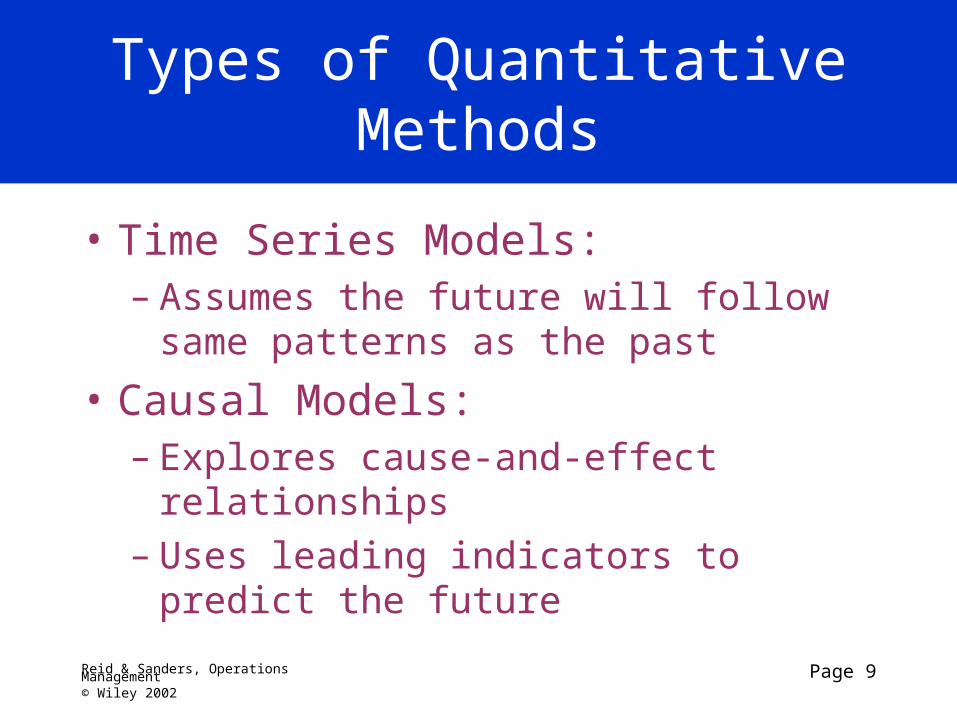
Types of Quantitative Methods
• Time Series Models:– Assumes the future will follow same
patterns as the past
• Causal Models:– Explores cause-and-effect relationships– Uses leading indicators to predict the
future
Page 10Reid & Sanders, Operations Management© Wiley 2002
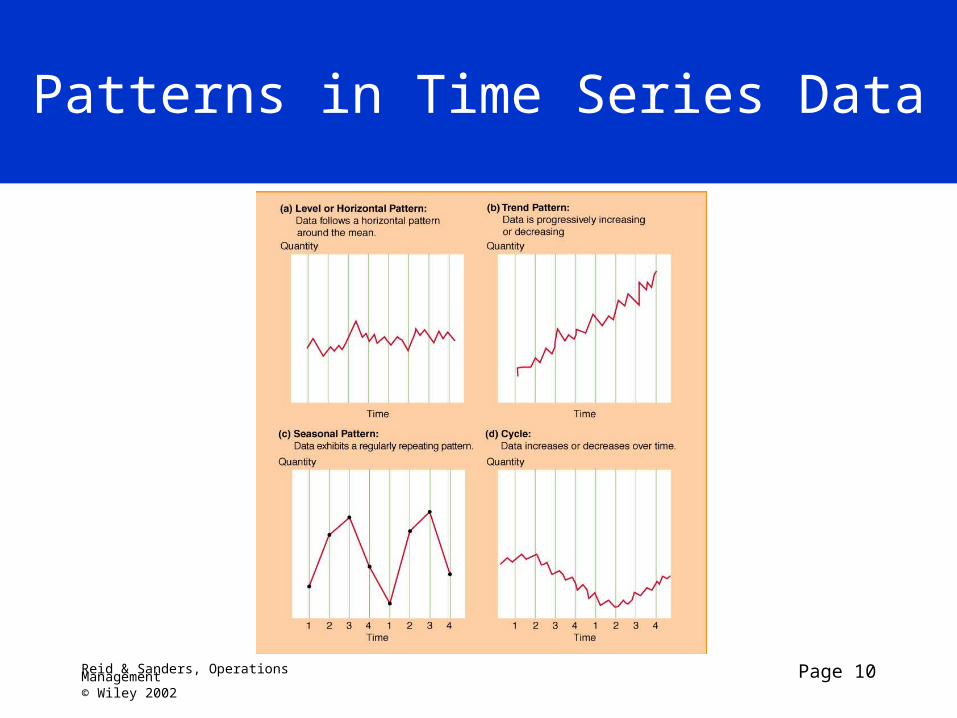
Patterns in Time Series Data
Page 11Reid & Sanders, Operations Management© Wiley 2002
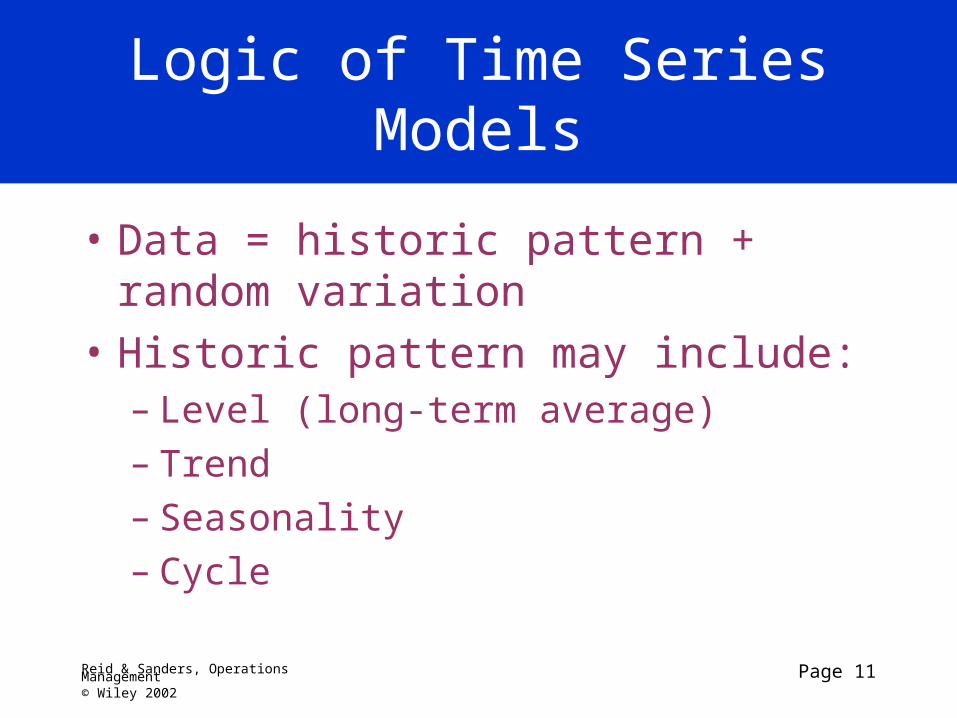
Logic of Time Series Models
• Data = historic pattern + random variation
• Historic pattern may include: – Level (long-term average) – Trend – Seasonality – Cycle
Page 12Reid & Sanders, Operations Management© Wiley 2002
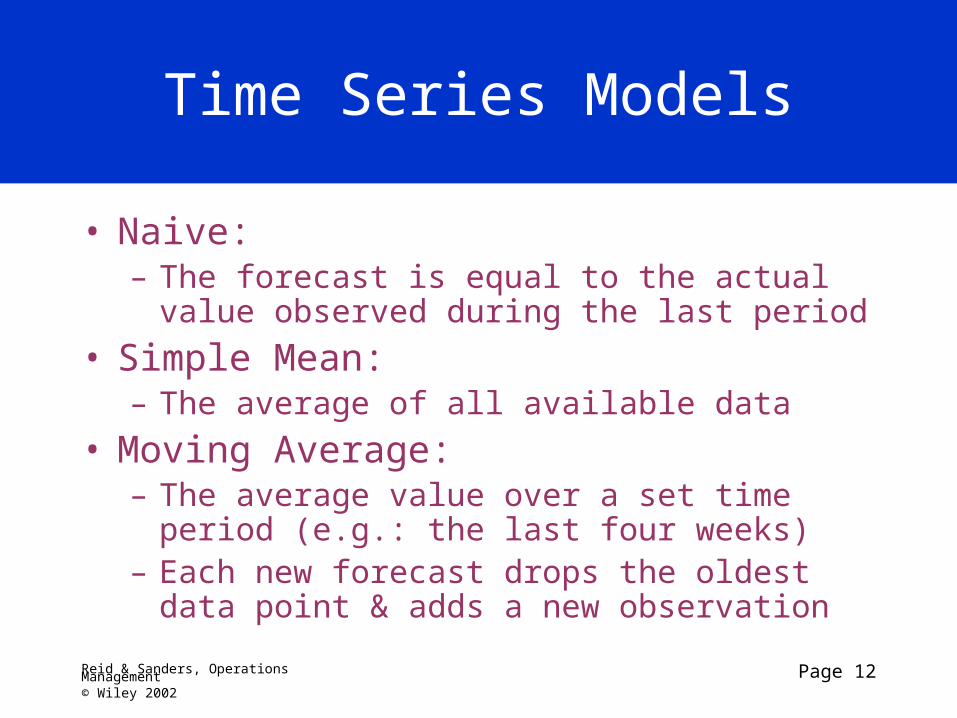
Time Series Models
• Naive:– The forecast is equal to the actual value observed
during the last period
• Simple Mean:– The average of all available data
• Moving Average:– The average value over a set time period (e.g.: the
last four weeks)– Each new forecast drops the oldest data point &
adds a new observation

Page 13Reid & Sanders, Operations Management© Wiley 2002
Weighted Moving Average
• All weights must add to 100% or 1.00
• Allows the forecaster to emphasize one period over others
• Differs from the simple moving average that weights all periods equally
ttt ACF 1
Page 14Reid & Sanders, Operations Management© Wiley 2002
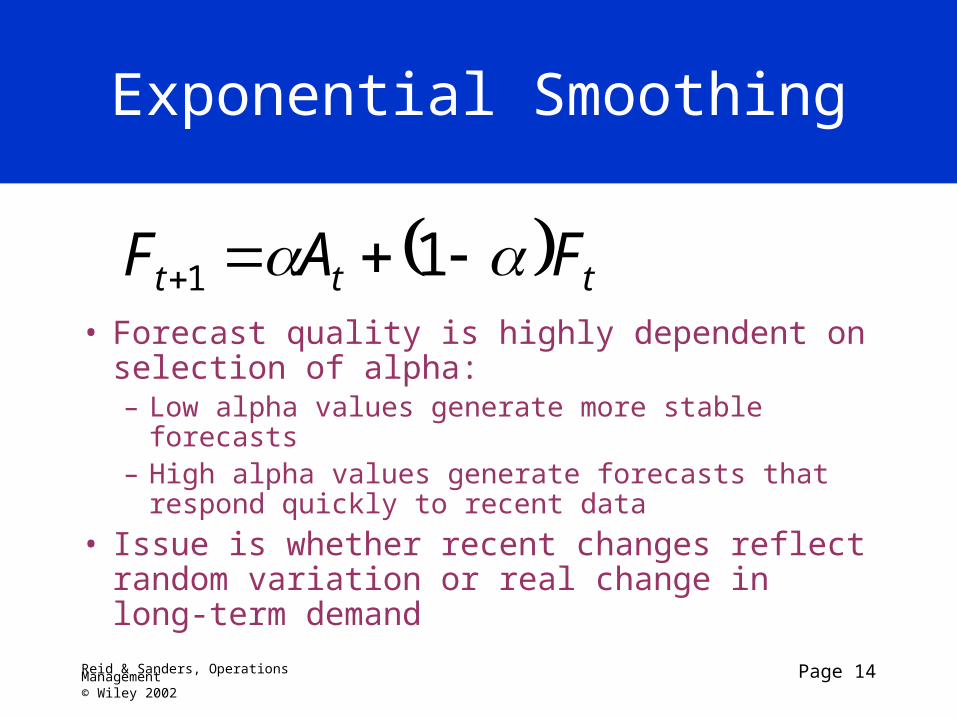
Exponential Smoothing
• Forecast quality is highly dependent on selection of alpha:– Low alpha values generate more stable forecasts– High alpha values generate forecasts that respond
quickly to recent data
• Issue is whether recent changes reflect random variation or real change in long-term demand
ttt FAF 11
Page 15Reid & Sanders, Operations Management© Wiley 2002
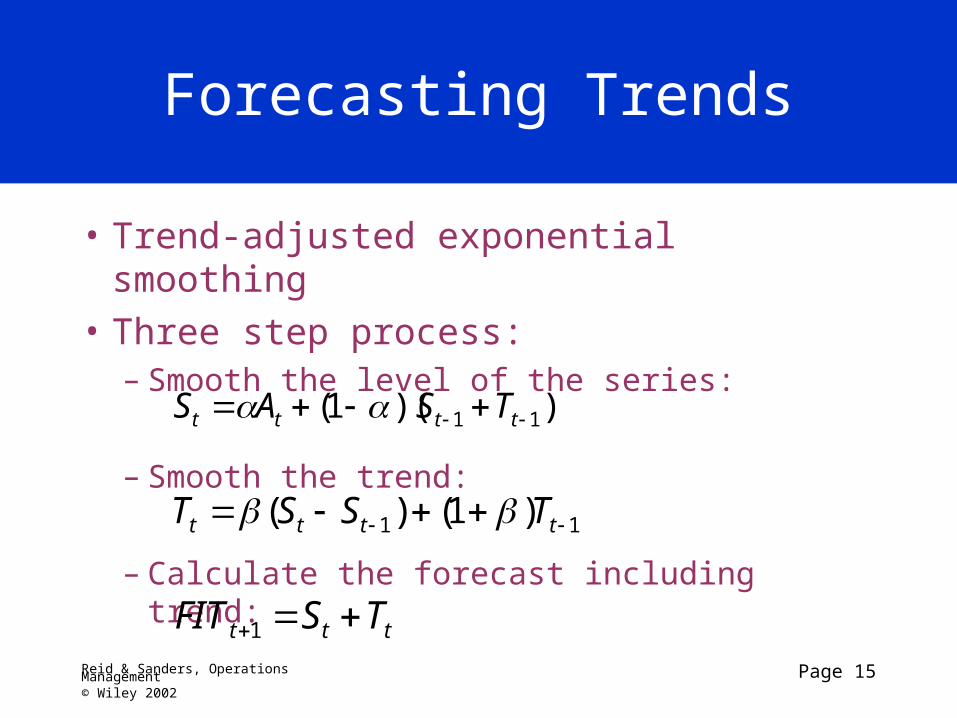
Forecasting Trends
• Trend-adjusted exponential smoothing
• Three step process:– Smooth the level of the series:
– Smooth the trend:
– Calculate the forecast including trend:
))(1( 11 tttt TSAS
11 )1()( tttt TSST
ttt TSFIT 1
Page 16Reid & Sanders, Operations Management© Wiley 2002
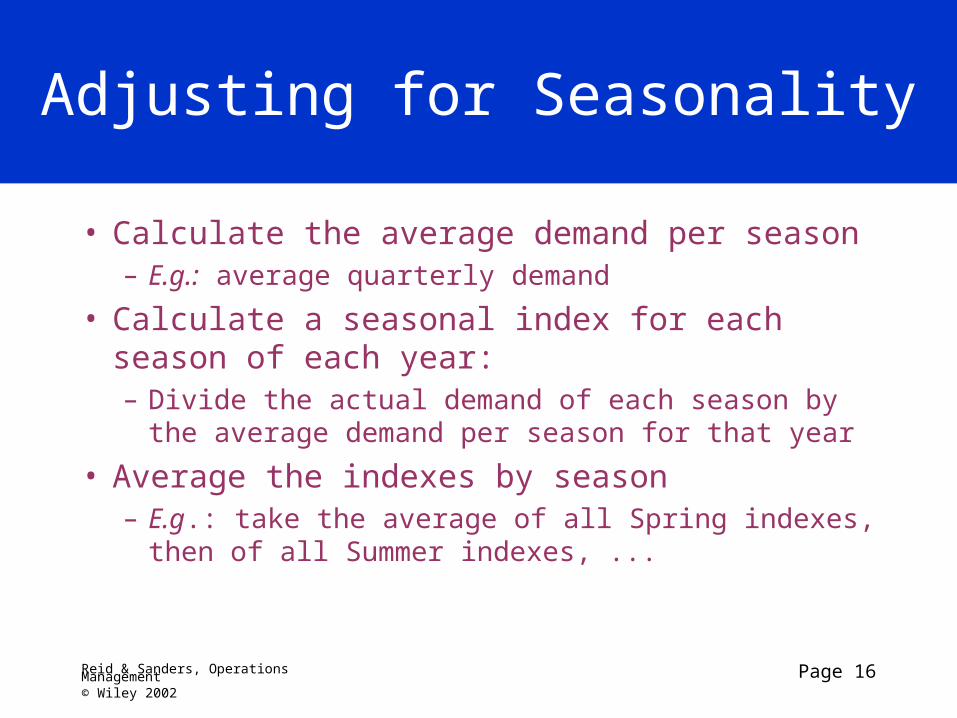
Adjusting for Seasonality
• Calculate the average demand per season– E.g.: average quarterly demand
• Calculate a seasonal index for each season of each year:– Divide the actual demand of each season by the
average demand per season for that year
• Average the indexes by season– E.g.: take the average of all Spring indexes, then
of all Summer indexes, ...
Page 17Reid & Sanders, Operations Management© Wiley 2002
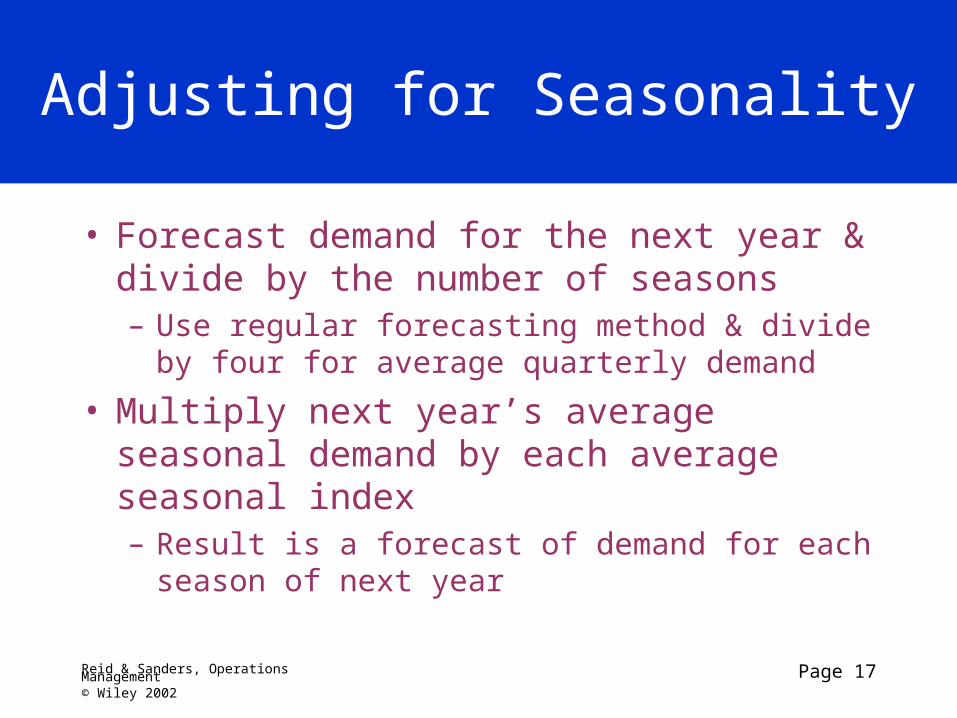
Adjusting for Seasonality
• Forecast demand for the next year & divide by the number of seasons– Use regular forecasting method & divide by four
for average quarterly demand
• Multiply next year’s average seasonal demand by each average seasonal index– Result is a forecast of demand for each season of
next year
Page 18Reid & Sanders, Operations Management© Wiley 2002
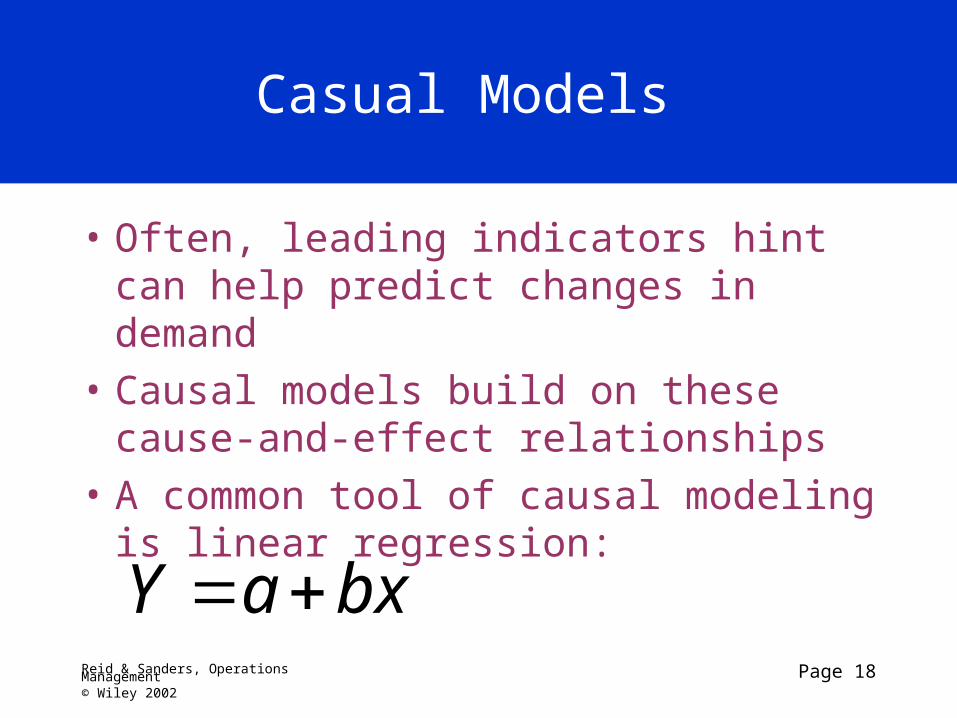
Casual Models
• Often, leading indicators hint can help predict changes in demand
• Causal models build on these cause-and-effect relationships
• A common tool of causal modeling is linear regression:
bxaY

Page 19Reid & Sanders, Operations Management© Wiley 2002
Linear Regression

Page 20Reid & Sanders, Operations Management© Wiley 2002
Forecast Accuracy
• Forecasts are rarely perfect• Need to know how much we should rely on
our chosen forecasting method• Measuring forecast error:
• Note that over-forecasts = negative errors and under-forecasts = positive errors
ttt FAE

Page 21Reid & Sanders, Operations Management© Wiley 2002
Tracking Forecast ErrorOver Time
• Mean Absolute Deviation (MAD):– A good measure of the actual error
in a forecast
• Mean Square Error (MSE):– Penalizes extreme errors
• Tracking Signal– Exposes bias (positive or negative)
1
forecast - actual2
nMSE
MAD
TS forecast - actual
nMAD
forecastactual
Page 22Reid & Sanders, Operations Management© Wiley 2002
Factors for Selecting a Forecasting Model
• The amount & type of available data
• Degree of accuracy required
• Length of forecast horizon
• Presence of data patterns
Page 23Reid & Sanders, Operations Management© Wiley 2002
The End
Copyright © 2002 John Wiley & Sons, Inc. All rights reserved. Reproduction or translation of this work beyond that permitted in Section 117 of the 1976 United State Copyright Act without the express written permission of the copyright owner is unlawful. Request for further information should be addressed to the Permissions Department, John Wiley & Sons, Inc. The purchaser may make back-up copies for his/her own use only and not for distribution or resale. The Publisher assumes no responsibility for errors, omissions, or damages, caused by the use of these programs or from the use of the information contained herein.
Related Documents