Appendix J Rehabilitaon and landscape management strategy

Welcome message from author
This document is posted to help you gain knowledge. Please leave a comment to let me know what you think about it! Share it to your friends and learn new things together.
Transcript
Appendix J
Rehabilita�on and landscape management strategy
Prepared for Holcim (Australia) Pty Ltd January 2021
Rehabilitation and Landscape Management StrategyDubbo Quarry Continuation Project
www.emmconsulting.com.au
Servicing projects throughoutAustralia and internationally
SYDNEYGround Floor, 20 Chandos StreetSt Leonards NSW 2065T 02 9493 9500
NEWCASTLELevel 3, 175 Scott StreetNewcastle NSW 2300T 02 4907 4800
BRISBANELevel 1, 87 Wickham TerraceSpring Hill QLD 4000T 07 3648 1200
ADELAIDELevel 4, 74 Pirie StreetAdelaide SA 5000T 08 8232 2253
MELBOURNEGround Floor, 188 Normanby RoadSouthbank VIC 3006T 03 9993 1905
PERTHSuite 9.02, Level 9, 109 St Georges TerracePerth WA 6000T 02 9339 3184
CANBERRAPO Box 9148Deakin ACT 2600
Rehabilitation and Landscape Management Strategy Dubbo Quarry Continuation Project
Report Number
J180313 RP#18
Client
Holcim (Australia) Pty Ltd
Date
14 January 2021
Version
v1 Final
Prepared by Approved by
Michael Frankcombe
National Technical Leader - Land, Water and Rehabilitation
14 January 2021
Rachael Thelwell
Associate - Environmental Planner
14 January 2021
This report has been prepared in accordance with the brief provided by the client and has relied upon the information collect ed at the time and
under the conditions specified in the report. All findings, conclusions or recommendations contained in the repo rt are based on the
aforementioned circumstances. The report is for the use of the client and no responsibility will be taken for its use by othe r parties. The client
may, at its discretion, use the report to inform regulators and the public.
© Reproduction of this report for educational or other non-commercial purposes is authorised without prior written permission from EMM
provided the source is fully acknowledged. Reproduction of this report for resale or other commercial purposes is prohibited without EMM’s
prior written permission.
J180313 | RP#18 | v1 ES.1
Executive Summary This Rehabilitation and Landscape Management Strategy (the strategy) forms part of the Environmental Impact Statement to support a development application for the Dubbo Quarry; for which approval is sought under Part 4, Division 4.1 of the NSW Environmental Planning and Assessment Act 1979.
The Dubbo Quarry Continuation Project (the project) comprises two key components; the existing quarry where basalt rock is being quarried, processed and distributed to the market, and two proposed resource areas – the Southern Extension Area and the Western Extension Area. This report presents a rehabilitation strategy for the entire project.
The existing quarry is approximately 1.9 km west of Dubbo, within the Dubbo Regional Council local government area.
The overarching rehabilitation objective of the project is to restore the land as much as possible to its pre-quarrying land use at the end of its operational life; that is, primarily an agricultural land use comprising grazing on improved pasture while improving the biodiversity values of the area by re-establishing endemic woodland communities as part of the rehabilitation program.
There will be opportunities for progressive rehabilitation of all available disturbed areas as the quarry is developed. Wherever possible during operations, disturbed areas no longer required for quarrying activities will be progressively rehabilitated.
The project area has been divided into a series of primary and secondary domains, in accordance with ESG3 Mining Operations Plan (MOP) Guidelines (NSW Department of Trade and Investment – Division of Resources and Energy 2013). The primary domains form the basis of conceptual rehabilitation and project closure planning for this strategy. The primary domains identified across the project area are infrastructure areas, water management areas, soil stockpiles and the quarry pits. A secondary domain (ie final land use) of pasture/grazing has been assigned to all of the primary domains as well as a secondary domain of biodiversity for the pit walls and the north-eastern bank of Eulomogo Creek, and Pond 1 which will remain as a water storage.
Preliminary completion criteria have been developed for each of the domains as part of this strategy. Rehabilitation monitoring will be undertaken throughout the quarry life once rehabilitation commences and post-closure to assess progress towards meeting the criteria. Whether rehabilitation criteria have been met depends on the trending of measurements over time compared to analogue site conditions. The criteria will be refined and confirmed in a rehabilitation management plan to be prepared following approval of the project, and a detailed closure plan to be prepared as the project progresses towards closure.
Once extraction has completed, closure of the quarry will likely involve rehabilitation of the remaining unrehabilitated sections of the pits, decommissioning and removal of infrastructure and services; soil testing of potentially contaminated areas such as hydrocarbon storage areas and bitumen coating areas; and remediation or removal of any contaminated soil if required. Soil will also be tested for erosion and agronomic aspects and ameliorated as required to suit the agreed post-quarrying land use. Reshaping will be undertaken where required to blend disturbed surfaces into surrounding topography, contours scarified, and stockpiled soil applied to promote the establishment of species appropriate for the agreed post-quarrying land use.
J180313 | RP#18 | v1 i
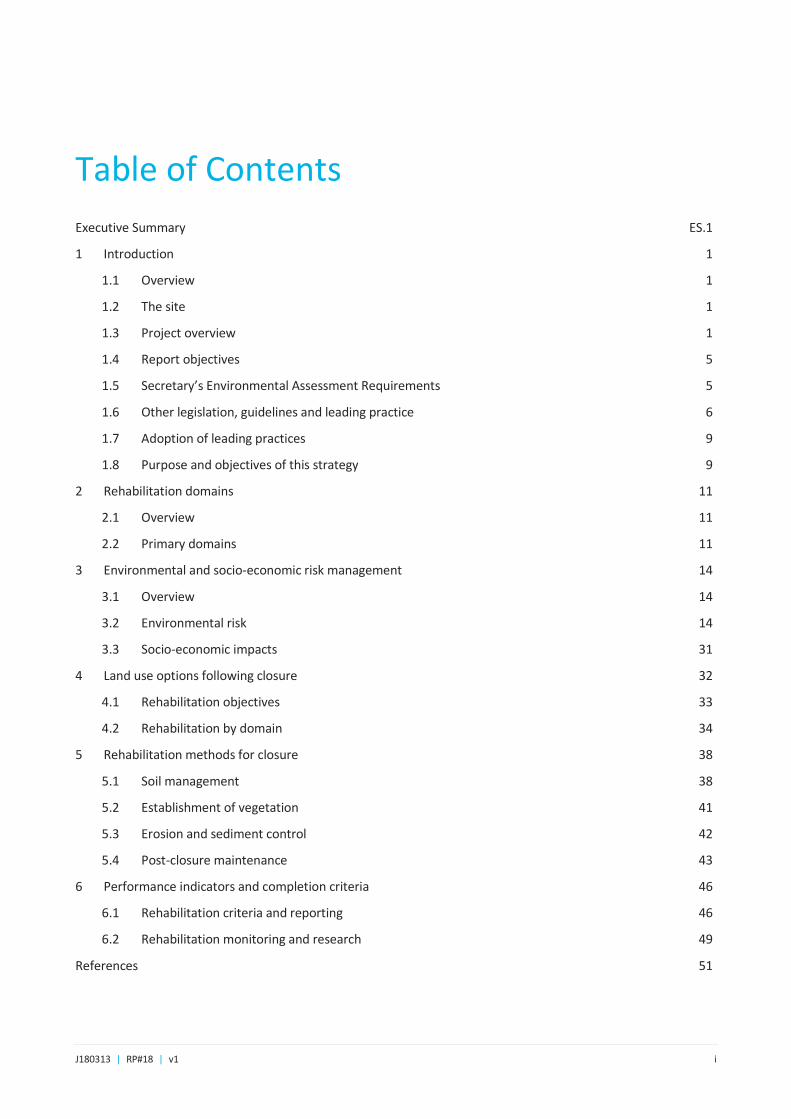
Table of Contents
Executive Summary ES.1
1 Introduction 1
1.1 Overview 1
1.2 The site 1
1.3 Project overview 1
1.4 Report objectives 5
1.5 Secretary’s Environmental Assessment Requirements 5
1.6 Other legislation, guidelines and leading practice 6
1.7 Adoption of leading practices 9
1.8 Purpose and objectives of this strategy 9
2 Rehabilitation domains 11
2.1 Overview 11
2.2 Primary domains 11
3 Environmental and socio-economic risk management 14
3.1 Overview 14
3.2 Environmental risk 14
3.3 Socio-economic impacts 31
4 Land use options following closure 32
4.1 Rehabilitation objectives 33
4.2 Rehabilitation by domain 34
5 Rehabilitation methods for closure 38
5.1 Soil management 38
5.2 Establishment of vegetation 41
5.3 Erosion and sediment control 42
5.4 Post-closure maintenance 43
6 Performance indicators and completion criteria 46
6.1 Rehabilitation criteria and reporting 46
6.2 Rehabilitation monitoring and research 49
References 51
J180313 | RP#18 | v1 ii
Appendices
Appendix A Land and soil capability assessment
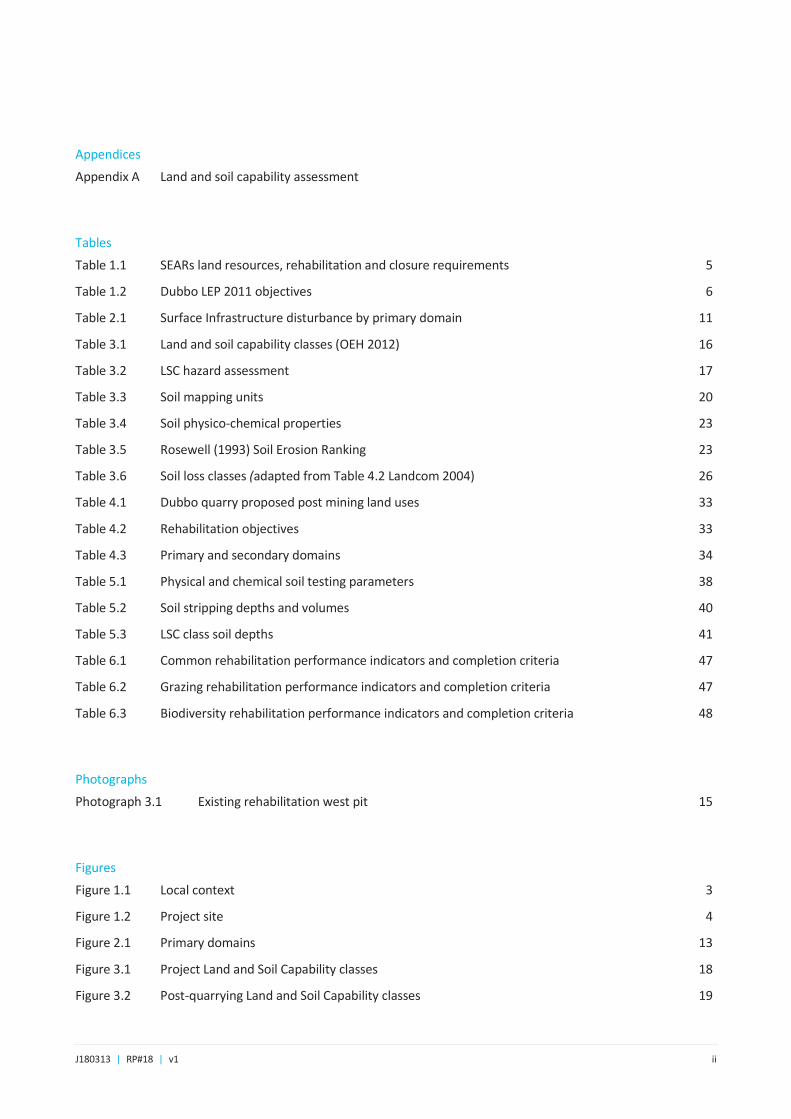
Tables
Table 1.1 SEARs land resources, rehabilitation and closure requirements 5
Table 1.2 Dubbo LEP 2011 objectives 6
Table 2.1 Surface Infrastructure disturbance by primary domain 11
Table 3.1 Land and soil capability classes (OEH 2012) 16
Table 3.2 LSC hazard assessment 17
Table 3.3 Soil mapping units 20
Table 3.4 Soil physico-chemical properties 23
Table 3.5 Rosewell (1993) Soil Erosion Ranking 23
Table 3.6 Soil loss classes (adapted from Table 4.2 Landcom 2004) 26
Table 4.1 Dubbo quarry proposed post mining land uses 33
Table 4.2 Rehabilitation objectives 33
Table 4.3 Primary and secondary domains 34
Table 5.1 Physical and chemical soil testing parameters 38
Table 5.2 Soil stripping depths and volumes 40
Table 5.3 LSC class soil depths 41
Table 6.1 Common rehabilitation performance indicators and completion criteria 47
Table 6.2 Grazing rehabilitation performance indicators and completion criteria 47
Table 6.3 Biodiversity rehabilitation performance indicators and completion criteria 48
Photographs
Photograph 3.1 Existing rehabilitation west pit 15
Figures
Figure 1.1 Local context 3
Figure 1.2 Project site 4
Figure 2.1 Primary domains 13
Figure 3.1 Project Land and Soil Capability classes 18
Figure 3.2 Post-quarrying Land and Soil Capability classes 19

J180313 | RP#18 | v1 iii
Figure 3.3 Project soil mapping units 22
Figure 3.4 Modelled K-factors (OEH 2016) 25
Figure 3.5 Assessment of potential erosion hazard (Figure 4.6 Landcom 2004) 26
Figure 3.6 Project slope gradients 28
Figure 4.1 Primary and secondary domains 35
J180313 | RP#18 | v1 1
1 Introduction 1.1 Overview
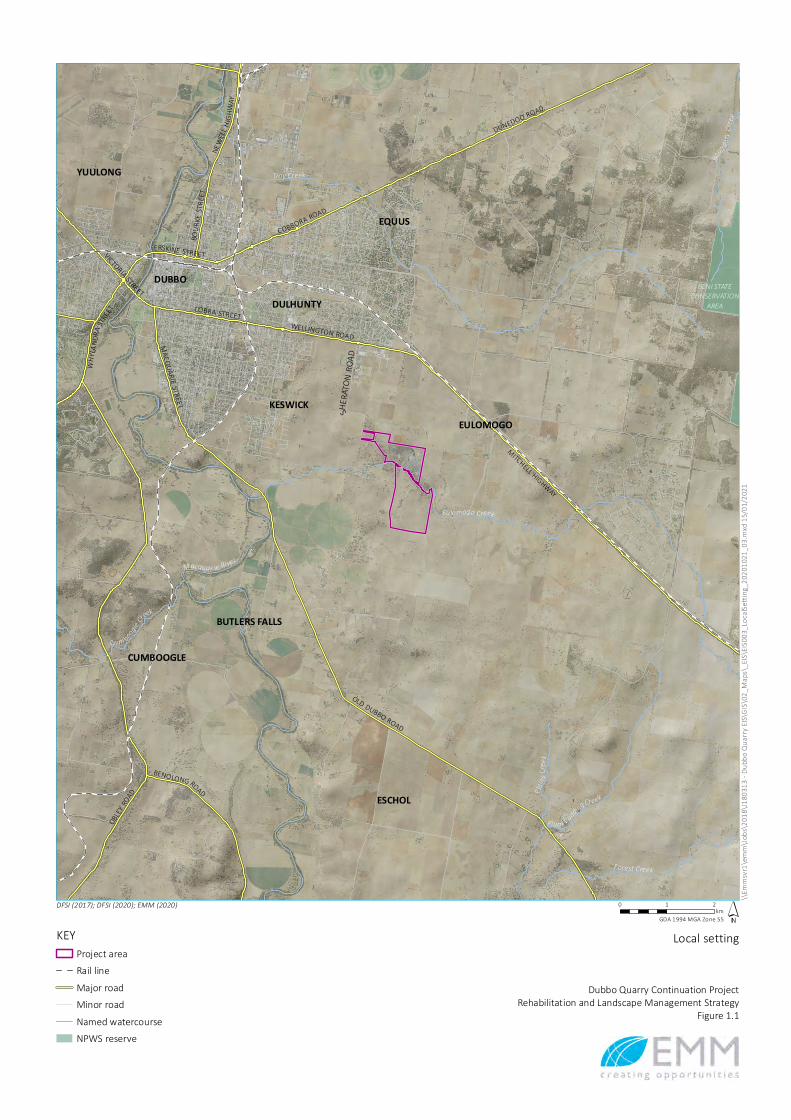
Holcim (Australia) Pty Limited (Holcim) are the owners and operators of Dubbo Quarry (the quarry) located on Sheraton Road, Dubbo (refer Figure 1.1). The quarry has operated since 1980 under a development consent granted by Dubbo Regional Council (DRC). Accessible basalt resources within the existing quarry boundary (refer Figure 1.2) are close to exhaustion and planning approval is required to allow the quarry to continue operating. Holcim is, therefore, seeking approval for the Dubbo Quarry Continuation Project (henceforth referred to as ‘the project’) which involves the continued operation of the quarry through the development of two new resource areas to the south and west of the existing quarry boundary (refer Figure 1.2).
The project is classified as State significant development (SSD) under Part 4, Division 4.1 of the NSW Environmental Planning Assessment Act 1979 (EP&A Act). This report will accompany the environmental impact statement (EIS) prepared for the project.
1.2 The site
The quarry is located within Dubbo Regional Local Government Area (LGA) approximately 1.9 kilometres (km) west of the city of Dubbo. The quarry is accessed via Sheraton Road which connects to the Mitchell Highway approximately 2 km north-west of the quarry.
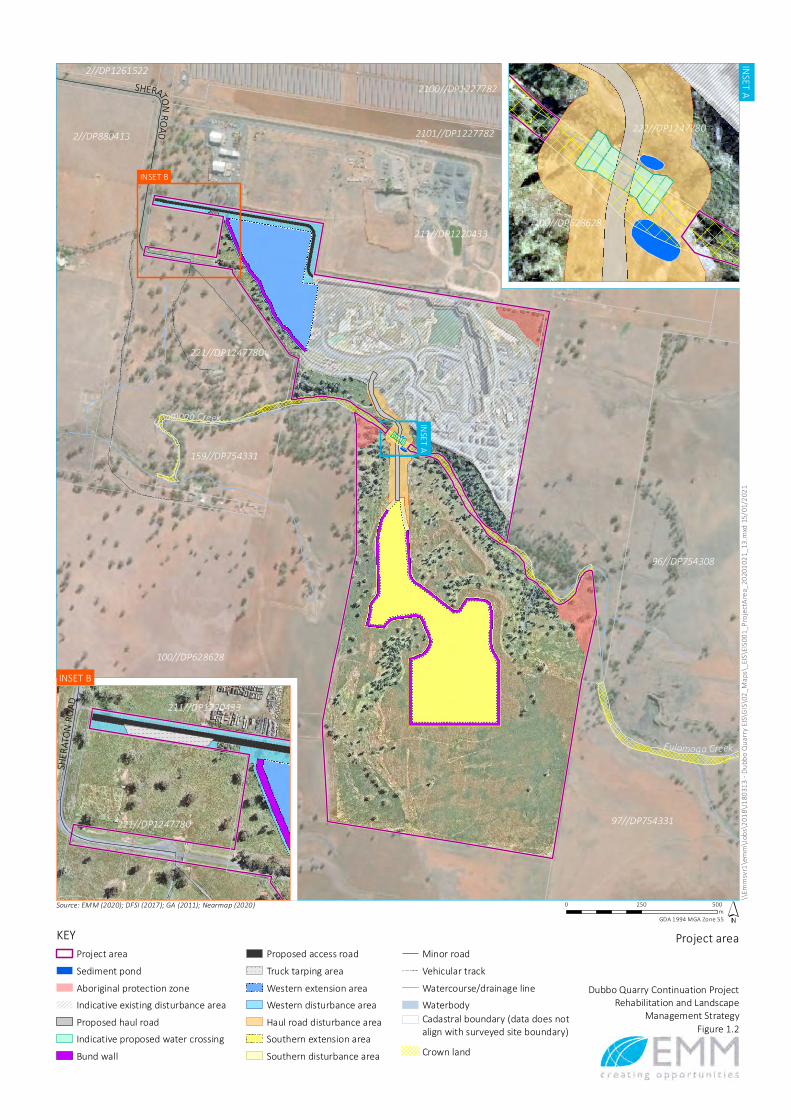
The project area relates to the following land as shown on Figure 1.2:
• Lot 222 DP 1247780, owned by Holcim; and
• Part Lot 100 DP 628628, for which Holcim propose to enter into an Access Licence with the landowners.
Development consent for Dubbo Quarry was originally granted by Talbragar Shire Council on 18 March 1980 under SPR79/22 (the existing consent). This consent related to the establishment of a basalt quarry on former Portions 208 and 211, Parish Dubbo (the existing site) and contains eight conditions with no restrictions on production rates or operating hours. Holcim also holds Environment Protection Licence (EPL) No. 2212 for land-based extraction activities between 100,000 and 500,000 tonnes per annum (tpa).
The quarry produces high quality aggregates for use in the construction industry, such as concrete and asphalt production, and for use as road base. Precoated sealing aggregates from crushed basalt are produced at the quarry. The quarry produces many types of road base, both specification and non-specification, such as the premium road base product Heavy Duty DGB20 which is frequently used by local councils and Roads and Maritime Services (RMS) for the construction and upgrade of roads.
1.3 Project overview
The project involves continued operations within the existing site and into two new resource areas as described below (refer Figure 1.2):
• the existing approved disturbance boundary within Lot 222 DP 1247780 which is approximately 32.5 ha in size and contains approximately 960,000 t of remaining resource;
• the Western Extension Area (WEA) which is west and north-west of the existing quarry boundary, located within Lot 222 DP 1247780 (north and south of Sheraton Road), is approximately 6.5 ha in size and contains approximately 2.24 Million tonnes (Mt) of resource; and

J180313 | RP#18 | v1 2
• the Southern Extension Area (SEA) which is south of the existing quarry boundary on the southern side of Eulomogo Creek, located within part Lot 100 DP 628628, is approximately 13.6 ha in size and contains approximately 5.17 Mt of resource.
A new haul road and crossing over Eulomogo Creek would also be constructed as part of the project to connect the existing site with the SEA. The quarry’s access road, which connects to Sheraton Road, is to be relocated around the boundary of the WEA.
The existing consent for quarry operations places no restriction on production, with the existing infrastructure having the capacity to produce a maximum of 500,000 tpa. The two proposed extension areas provide sufficient resource for quarry operations to continue for approximately 20–25 years.
DUBBO
ESCHOL
CUMBOOGLE
EULOMOGOKESWICK
BUTLERS FALLS
EQUUS
YUULONG
DULHUNTY
Forest Creek
P lains
Cree k
Cu m boogle
Creek
Boun d a
ry Cree
k
Plum PuddingCreek
Troy Creek
Macquar ie Rive r
Eu lomogo Creek
SHERAT
O NRO
ADWHY LA
NDRA
STREET
OLD DUBBO ROAD
COBRA STREET
ERSKINE STREET
COBBORA ROAD
WELLINGTON ROAD
VICTORIA STREET
OBLEY R
OAD
BOUR
KE STR
EET
DUNEDOO ROAD
NEWE
LLH IG
HWAY
MACQUARIE STREET
BENOLONG ROAD
MITCHELL HIGHWAY
BENI STATECONSERVATION
AREA
\\Emm
svr1\e
mm\Jo
bs\20
18\J1
8031
3 - Du
bbo Q
uarry
EIS\G
IS\02
_Maps
\_EIS\
EIS00
3_Loca
lSettin
g_202
01021
_03.m
xd 15
/01/20
21
0 1 2km
GDA 1994 MGA Zone 55DFSI (2017); DFSI (2020); EMM (2020)
KEYProject areaRail lineMajor roadMinor roadNamed watercourseNPWS reserve
Local setting
Dubbo Quarry Continuation ProjectRehabilitation and Landscape Management Strategy
Figure 1.1
INSET A
INSET B
Eulomogo Creek
Eulomogo Creek
SHERATONROAD
211//DP1220433
2101//DP1227782
2100//DP1227782
159//DP754331
97//DP754331
96//DP754308
2//DP1261522
101//DP628628
100//DP628628
221//DP1247780
2//DP880413
\\Emm
svr1\e
mm\Jo
bs\20
18\J1
8031
3 - Du
bbo Q
uarry
EIS\G
IS\02
_Maps
\_EIS\
EIS00
1_Proj
ectAre
a_202
0102
1_13.
mxd 1
5/01/2
021
0 250 500m
GDA 1994 MGA Zone 55
KEYProject areaSediment pondAboriginal protection zoneIndicative existing disturbance areaProposed haul roadIndicative proposed water crossingBund wall
Proposed access roadTruck tarping areaWestern extension areaWestern disturbance areaHaul road disturbance areaSouthern extension areaSouthern disturbance area
Minor roadVehicular trackWatercourse/drainage lineWaterbodyCadastral boundary (data does notalign with surveyed site boundary)Crown land
Project area
Dubbo Quarry Continuation ProjectRehabilitation and Landscape
Management StrategyFigure 1.2
Source: EMM (2020); DFSI (2017); GA (2011); Nearmap (2020)
100//DP628628
222//DP1247780
211//DP1220433
221//DP1247780
SHER
ATON R
OAD
INSET A
INSET B
J180313 | RP#18 | v1 5
1.4 Report objectives
This Rehabilitation and Landscape Strategy has been prepared by EMM Consulting Pty Limited (EMM) to assess the potential land resources, rehabilitation and closure impacts associated with the project.
This assessment addresses the relevant Secretary’s Environmental Assessment Requirement (SEARs) (refer to Section 1.5).
1.5 Secretary’s Environmental Assessment Requirements
The SEARs for the project were issued on 3 April 2020. The SEARs related to land resources, rehabilitation and closure are provided in Table 1.1.
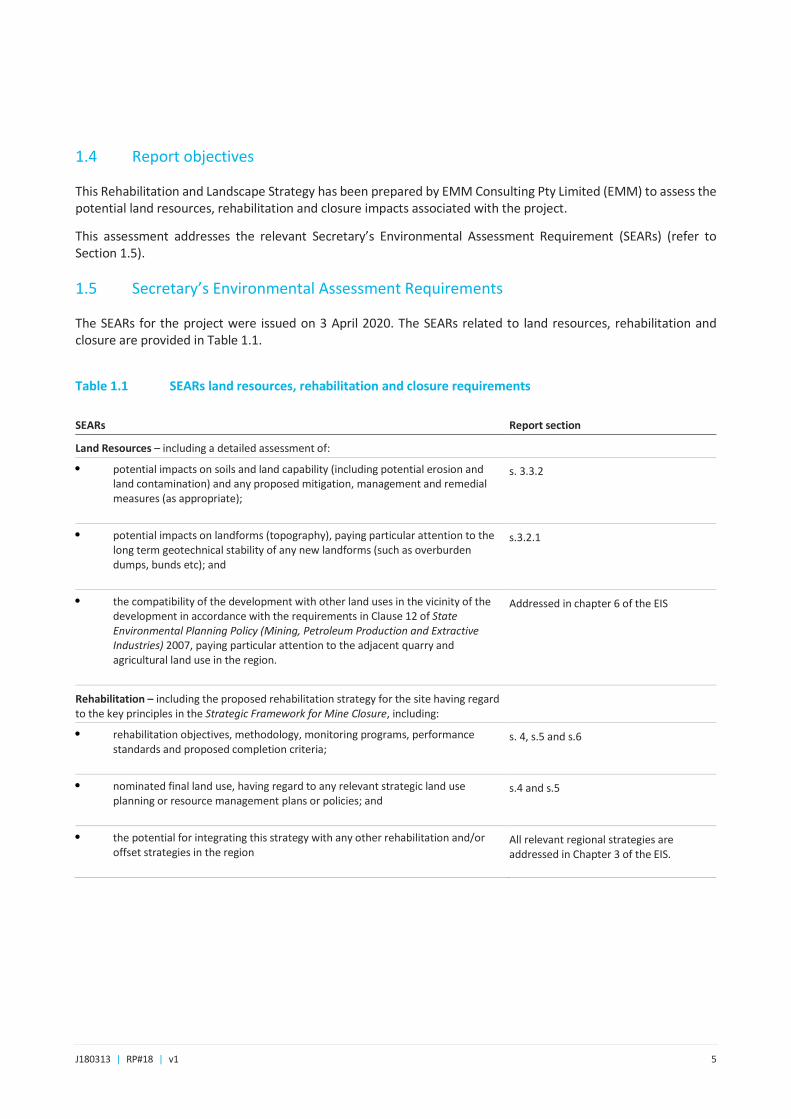
Table 1.1 SEARs land resources, rehabilitation and closure requirements
SEARs Report section
Land Resources – including a detailed assessment of:
• potential impacts on soils and land capability (including potential erosion and land contamination) and any proposed mitigation, management and remedial measures (as appropriate);
s. 3.3.2
• potential impacts on landforms (topography), paying particular attention to the long term geotechnical stability of any new landforms (such as overburden dumps, bunds etc); and
s.3.2.1
• the compatibility of the development with other land uses in the vicinity of the development in accordance with the requirements in Clause 12 of State Environmental Planning Policy (Mining, Petroleum Production and Extractive Industries) 2007, paying particular attention to the adjacent quarry and agricultural land use in the region.
Addressed in chapter 6 of the EIS
Rehabilitation – including the proposed rehabilitation strategy for the site having regard to the key principles in the Strategic Framework for Mine Closure, including:
• rehabilitation objectives, methodology, monitoring programs, performance standards and proposed completion criteria;
s. 4, s.5 and s.6
• nominated final land use, having regard to any relevant strategic land use planning or resource management plans or policies; and
s.4 and s.5
• the potential for integrating this strategy with any other rehabilitation and/or offset strategies in the region
All relevant regional strategies are addressed in Chapter 3 of the EIS.
J180313 | RP#18 | v1 6
1.6 Other legislation, guidelines and leading practice
1.6.1 Legislation and environmental planning instruments
i Protection of the Environment Operations Act 1997
The Protection of the Environment Operations Act 1997 (POEO Act) establishes the State’s environmental regulatory framework and includes licensing requirements for certain activities. The objectives of the POEO Act that relate to decommissioning and rehabilitation include:
to protect, restore and enhance the environment, to reduce risks to human health and prevent degradation of the environment.
The POEO Act objectives have been used in the preparation of this strategy and are principally reflected in one of the overarching goals of the strategy; to minimise the risk of pollution occurring from the quarry during and following closure, decommissioning and rehabilitation.
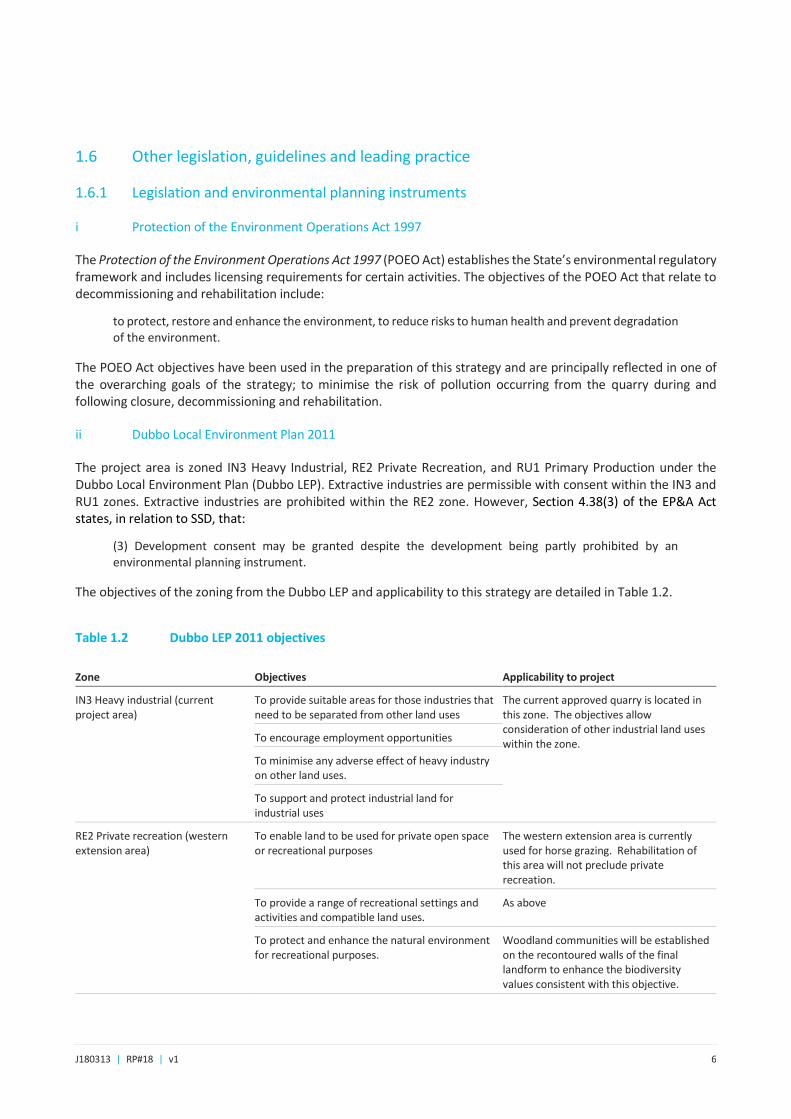
ii Dubbo Local Environment Plan 2011
The project area is zoned IN3 Heavy Industrial, RE2 Private Recreation, and RU1 Primary Production under the Dubbo Local Environment Plan (Dubbo LEP). Extractive industries are permissible with consent within the IN3 and RU1 zones. Extractive industries are prohibited within the RE2 zone. However, Section 4.38(3) of the EP&A Act states, in relation to SSD, that:
(3) Development consent may be granted despite the development being partly prohibited by an environmental planning instrument.
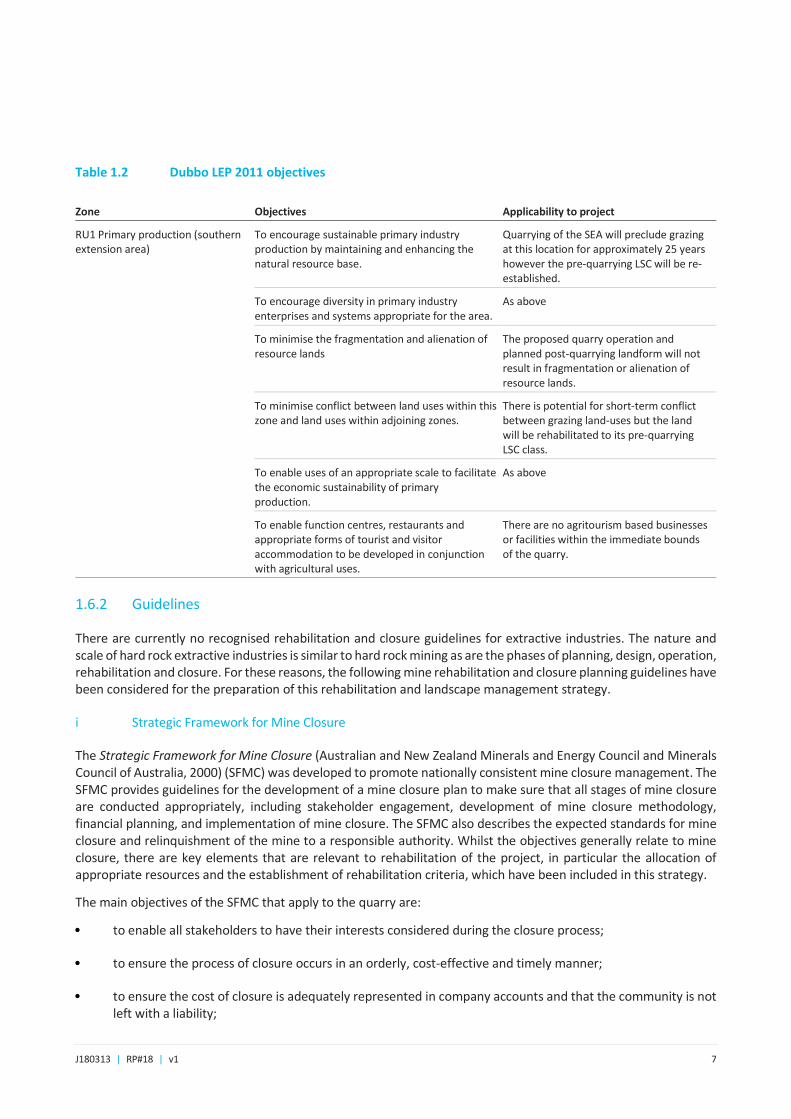
The objectives of the zoning from the Dubbo LEP and applicability to this strategy are detailed in Table 1.2.
Table 1.2 Dubbo LEP 2011 objectives
Zone Objectives Applicability to project
IN3 Heavy industrial (current project area)
To provide suitable areas for those industries that need to be separated from other land uses
The current approved quarry is located in this zone. The objectives allow consideration of other industrial land uses within the zone.
To encourage employment opportunities
To minimise any adverse effect of heavy industry on other land uses.
To support and protect industrial land for industrial uses
RE2 Private recreation (western extension area)
To enable land to be used for private open space or recreational purposes
The western extension area is currently used for horse grazing. Rehabilitation of this area will not preclude private recreation.
To provide a range of recreational settings and activities and compatible land uses.
As above
To protect and enhance the natural environment for recreational purposes.
Woodland communities will be established on the recontoured walls of the final landform to enhance the biodiversity values consistent with this objective.
J180313 | RP#18 | v1 7
Table 1.2 Dubbo LEP 2011 objectives
Zone Objectives Applicability to project
RU1 Primary production (southern extension area)
To encourage sustainable primary industry production by maintaining and enhancing the natural resource base.
Quarrying of the SEA will preclude grazing at this location for approximately 25 years however the pre-quarrying LSC will be re-established.
To encourage diversity in primary industry enterprises and systems appropriate for the area.
As above
To minimise the fragmentation and alienation of resource lands
The proposed quarry operation and planned post-quarrying landform will not result in fragmentation or alienation of resource lands.
To minimise conflict between land uses within this zone and land uses within adjoining zones.
There is potential for short-term conflict between grazing land-uses but the land will be rehabilitated to its pre-quarrying LSC class.
To enable uses of an appropriate scale to facilitate the economic sustainability of primary production.
As above
To enable function centres, restaurants and appropriate forms of tourist and visitor accommodation to be developed in conjunction with agricultural uses.
There are no agritourism based businesses or facilities within the immediate bounds of the quarry.
1.6.2 Guidelines
There are currently no recognised rehabilitation and closure guidelines for extractive industries. The nature and scale of hard rock extractive industries is similar to hard rock mining as are the phases of planning, design, operation, rehabilitation and closure. For these reasons, the following mine rehabilitation and closure planning guidelines have been considered for the preparation of this rehabilitation and landscape management strategy.
i Strategic Framework for Mine Closure
The Strategic Framework for Mine Closure (Australian and New Zealand Minerals and Energy Council and Minerals Council of Australia, 2000) (SFMC) was developed to promote nationally consistent mine closure management. The SFMC provides guidelines for the development of a mine closure plan to make sure that all stages of mine closure are conducted appropriately, including stakeholder engagement, development of mine closure methodology, financial planning, and implementation of mine closure. The SFMC also describes the expected standards for mine closure and relinquishment of the mine to a responsible authority. Whilst the objectives generally relate to mine closure, there are key elements that are relevant to rehabilitation of the project, in particular the allocation of appropriate resources and the establishment of rehabilitation criteria, which have been included in this strategy.
The main objectives of the SFMC that apply to the quarry are:
• to enable all stakeholders to have their interests considered during the closure process;
• to ensure the process of closure occurs in an orderly, cost-effective and timely manner;
• to ensure the cost of closure is adequately represented in company accounts and that the community is not left with a liability;
J180313 | RP#18 | v1 8
• to ensure there is clear accountability, and adequate resources, for the implementation of the closure plan;
• to establish a set of indicators which will demonstrate the successful completion of the closure process; and
• to reach a point where the company has met agreed rehabilitation criteria to the satisfaction of the Responsible Authority.
ii Mining Operations Plan Guidelines
The ESG3 – Mining Operations Plan (MOP) Guidelines, September 2013 (the MOP guidelines) (NSW Department of Trade and Investment – Division of Resources and Energy 2013) provide a process for managing and monitoring progression towards successful rehabilitation of a mine site. The guidelines provide content and formatting requirements for MOPs and Annual Reviews. The purpose of these documents is to ‘ensure that all mining operations are safe, the resources are efficiently extracted, the environment is protected and rehabilitation achieves a stable and satisfactory outcome.’
As the project will not require a mining lease, the requirements for a MOP are not triggered, this strategy has been prepared to address the various requirements of the closure and rehabilitation aspects of the MOP guidelines. In particular, rehabilitation domains have been identified as per the guidelines, as well as objectives and completion criteria for these domains.
iii Mine Rehabilitation - Leading Practice Sustainable Development Program for the Mining Industry
The aim of Mine Rehabilitation – Leading Practice Sustainable Development Program for the Mining Industry (NSW Department of Industry, Tourism and Resources, 2006) (MR Handbook) is to provide guidelines to promote ‘leading practice’ sustainable mine planning and rehabilitation design, considering environmental, economic, and social aspects to support on-going sustainability of a mining development. The MR Handbook recommends procedures and mitigation measures that should be considered during mine plan and rehabilitation design, including stakeholder consultation, material and handling, water balance, final landform design, soil (topsoil and subsoil) management, vegetation and fauna habitat re-establishment and rehabilitation, and agriculture/commercial forestry suitability. The MR Handbook also provides relevant mine development case studies supporting the recommended procedures and mitigation measures. Where relevant to the project, the above principals have been addressed in this strategy.
iv Mine Closure and Completion - Leading Practice Sustainable Development Program for the Mining Industry
The aim of Mine Closure and Completion – Leading Practice Sustainable Development Program for the Mining Industry (NSW Department of Industry, Tourism and Resources, 2006) (MCC Handbook) is to provide guidelines to promote ‘leading practice’ sustainable mine closure and completion, minimising any long-term environmental, economic, and social impacts and resulting in a suitable final land form for an agreed land use. Specifically, the MCC Handbook provides that a progressive rehabilitation plan, which is a key principle of this strategy, should be developed for mine closure.
v Managing Urban Stormwater – Soils and Construction Volume 1
The purpose of Managing Urban Stormwater – Soils and Construction Volume 1, 4th edition (Landcom 2004) is to help mitigate the impacts of land disturbance on soils, landforms and receiving waters by focusing on erosion and sediment control to:
• reduce pollution to downstream areas and receiving water; and
J180313 | RP#18 | v1 9
• reduce land degradation.
It is based on the premise that land degradation can be avoided or minimised, largely through appropriate planning before commencement of land disturbing activities and the application of best management practices using a ‘treatment train’ approach.
vi Managing Urban Stormwater – Soils and Construction Volume 2E Mines and Quarries
The purpose of Managing Urban Stormwater – Soils and Construction Volume 2E – Mines and quarries, Department of Environment and Climate Change 2008 (DECC 2008) is to provide guidelines, principles and recommended design standards for erosion and sediment control at mines and quarries. Specifically, it guides the user in the application of the principles and practices of erosion and sediment control described in Landcom 2004 to mines and quarries.
1.7 Adoption of leading practices
Holcim is committed to adopting leading practices in the planning, construction, operation, closure and rehabilitation of the project. This includes leading practice measures to avoid, minimise and/or mitigate potential environmental and social impacts. In relation to rehabilitation the leading practices adopted are:
• adoption of a pit wall rehabilitated slope design that avoids structural drainage and linear features that have potential to fail and are visually intrusive;
• use of topsoil/rock matrices on the reshaped pit wall slopes to provide critical shear protection, reduce runoff and encourage root penetration;
• establishing a biodiversity post mining land-use on the pit walls and north-eastern bank of Eulomogo Creek that will help account for previous clearing for agricultural purposes;
• using mineral based–biologically activated fertilizers to reduce nutrient run-off compared to chemical based fertilizers and promote beneficial soil biology in rehabilitation areas to increase root depth, drought tolerance and nutrient cycling; and
• re-establishing pre-mining Land and Soil Capability (LSC) classes within the quarry pits.
1.8 Purpose and objectives of this strategy
The purpose of this strategy is to address applicable regulatory requirements, standards and guidelines for the rehabilitation and landscape management of the quarry.
The objectives of this strategy are:
• to describe the proposed post-quarrying land use;
• identify potential risks and impacts which will impact on rehabilitation, landscape management and success;
• to describe the methods for establishing stable post-quarrying landforms; and
• to set rehabilitation criteria and outline the monitoring requirements that assess whether or not these criteria are being accomplished.

J180313 | RP#18 | v1 10
The rehabilitation concepts presented in this strategy should be regarded as provisional to allow for consideration of the outcomes from future rehabilitation trials and research, and other unforeseeable changes that may come about, for example via the quarry closure consultation phase. Final rehabilitation and project closure requirements will ultimately be formulated in consultation with key government agencies and other relevant stakeholders.
J180313 | RP#18 | v1 11
2 Rehabilitation domains 2.1 Overview
Holcim have adopted a domain based rehabilitation approach where the project area has been divided into a series of physically discrete rehabilitation domains that have similar rehabilitation requirements in accordance with the Department of Trade and Investment’s guideline ESG3: Mining Operations Plan (MOP) Guidelines (September 2013) (the MOP guidelines).
2.2 Primary domains
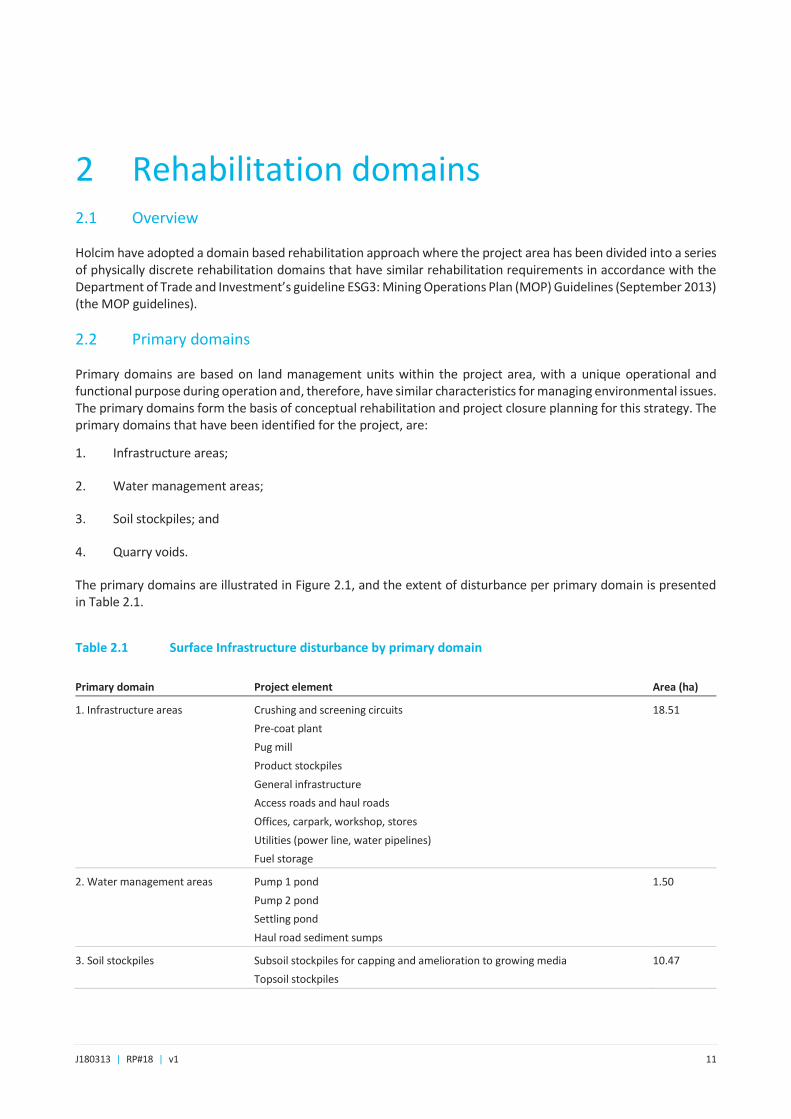
Primary domains are based on land management units within the project area, with a unique operational and functional purpose during operation and, therefore, have similar characteristics for managing environmental issues. The primary domains form the basis of conceptual rehabilitation and project closure planning for this strategy. The primary domains that have been identified for the project, are:
1. Infrastructure areas;
2. Water management areas;
3. Soil stockpiles; and
4. Quarry voids.
The primary domains are illustrated in Figure 2.1, and the extent of disturbance per primary domain is presented in Table 2.1.
Table 2.1 Surface Infrastructure disturbance by primary domain
Primary domain Project element Area (ha)
1. Infrastructure areas Crushing and screening circuits
Pre-coat plant
Pug mill
Product stockpiles
General infrastructure
Access roads and haul roads
Offices, carpark, workshop, stores
Utilities (power line, water pipelines)
Fuel storage
18.51
2. Water management areas Pump 1 pond
Pump 2 pond
Settling pond
Haul road sediment sumps
1.50
3. Soil stockpiles Subsoil stockpiles for capping and amelioration to growing media
Topsoil stockpiles
10.47

J180313 | RP#18 | v1 12
Table 2.1 Surface Infrastructure disturbance by primary domain
Primary domain Project element Area (ha)
4. Pits West pit (existing)
East pit (existing)
WEA (proposed)
SEA (proposed)
33.25
A description of the rehabilitation activities to be carried out in each primary domain is presented in Chapter 5.
TruckparkingEulomogo Creek
SHER
ATON R
OAD
97//DP754331
1//DP623367
159//DP754331
96//DP754308
2//DP880413
100//DP628628
22//DP793541
22//DP793541
101//DP628628
211//DP1220433 2101//DP1227782
2100//DP1227782
\\Emm
svr1\e
mm\Jo
bs\20
18\J1
8031
3 - Du
bbo Q
uarry
EIS\G
IS\02
_Maps
\_EIS\
_TechR
eport
s\RaC
\RaC0
03_P
rimary
Doma
ins_2
0210
114_0
5.mxd
15/01
/2021
0 250 500m
GDA 1994 MGA Zone 55
KEYProject area
Primary domains1. Infrastructure area2. Water management area3. Soil stockpile area4. Pit
Minor roadVehicular trackWatercourse/drainage lineWaterbodyCadastral boundary (data does notalign with surveyed site boundary)
Primary domains
Dubbo Quarry Continuation ProjectRehabilitation and Landscape Management Strategy
Figure 2.1
Source: EMM (2020); DFSI (2017); Nearmap (2020)
J180313 | RP#18 | v1 14
3 Environmental and socio-economic risk management
3.1 Overview
Identifying environmental, social and economic risks associated with rehabilitation and closure is essential for effective closure planning.
Key risks during the rehabilitation and closure phases include:
• mineralised drainage to rock geochemistry and geotechnical instability;
• not achieving the agreed post-mining LSC classes on rehabilitated lands and post-mine land uses;
• erosion and sediment control;
• noise and dust;
• weeds;
• hydrocarbons, chemicals and wastes;
• bushfire; and
• socio-economic considerations.
3.2 Environmental risk
3.2.1 Geochemistry and geotechnical stability
Specific testing has not been undertaken for potential acid rock drainage (ARD) as the Tertiary` alkali basalt rock chemistry does not include elements that can oxidise to form ARD and mobilise heavy metals. Basalt is commonly pulverised as the basis for mineral based fertilisers for agronomic and revegetation purposes (Carson et al 2012).
Testing of a site sample by Geochempet Services (Geochempet 2019) summarised the sample to be:
• basalt (a basic volcanic rock type);
• finely crystalline and variably glassy;
• contains < 1% of vesicles;
• unweathered to slightly weathered;
• fresh to lightly altered;
• 5% green to yellow smectite clay, 1% zeolite and <1% iddingsite and calcite;
• hard (not easily scratched); and
J180313 | RP#18 | v1 15
• strong (resistant to permanent deformation by flow or fracture).
Geochempet 2019 determined that the rock is suitable for use as concrete aggregate, is predicted to be suitable for use in road base, asphalt/sealing aggregate (subject to bitumen stripping and polishing tests) and rail ballast (subject to compliance with Durability Criteria of CT147/AS2758.7).
They predicted it to be suitable for use as rip rap and marine armour rock, provided blocks of sufficient size can be obtained free of weak or permeable joint and other penetrative defects.
There has been one high wall failure that occurred at the eastern end of the west pit on 8 February 2019 via a stepped downwards slide of the rock mass. The trigger mechanism was assumed to be rainfall entering via tension cracks and reducing shear resistance along the sliding plane (GHD 2019). A Ground Control Plan prepared for the quarry in 2017 by Xstract mining consultants 2017 interpreted the eastern wall as being close to the margin of the channel into which the lava flowed to form the basalt. It was inferred that the contact between the basalt and the lithic sandstone was moderately to steeply dipping to the west (into the pit) and was a relatively narrow zone approximately 1 m thick.
Based on observations of the highwall failure, GHD 2019 confirmed that is was likely due to translational sliding along the altered basalt-sandstone contact.
Xstract 2017 stated that the rock mass exposed in the existing west pit is typically high strength (50 to 100 MPa estimate) for the fresh rock materials. To minimise geotechnical hazards, such as rock falls and slides to quarry workers in the pit, Xstract 2017 recommended a maximum batter height, minimum berm width of 10 m and maximum face angle between 70° and 80° depending on the location within the west pit and the orientation of joints and faults to:
• working benches;
• terminal benches; and
• terminal pit walls, from crest to toe over multiple benches.
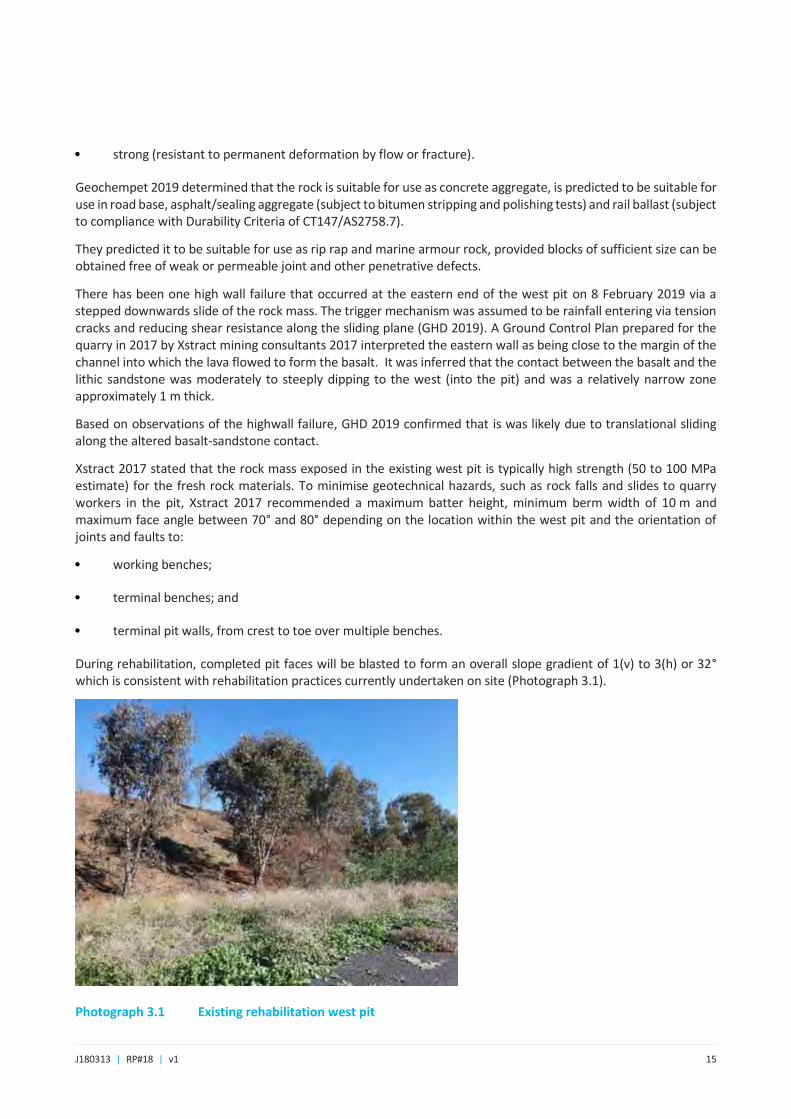
During rehabilitation, completed pit faces will be blasted to form an overall slope gradient of 1(v) to 3(h) or 32° which is consistent with rehabilitation practices currently undertaken on site (Photograph 3.1).
Photograph 3.1 Existing rehabilitation west pit
J180313 | RP#18 | v1 16
There is no evidence of slope failure or erosion on the existing rehabilitation areas on site that have been in place since 2010.
3.2.2 Land and soil capability
i LSC classes
The LSC classes of the project area were determined as part of the Land and Soil Capability Assessment undertaken for the project (Landloch 2019), in accordance with the Land and Soil Capability Assessment Scheme – second approximation (LSC Assessment, OEH 2012) (refer Appendix A).
The LSC assessment classifies land into one of eight classes (Table 3.1). These classes give an indication of what the land can be used for without causing land and soil degradation.
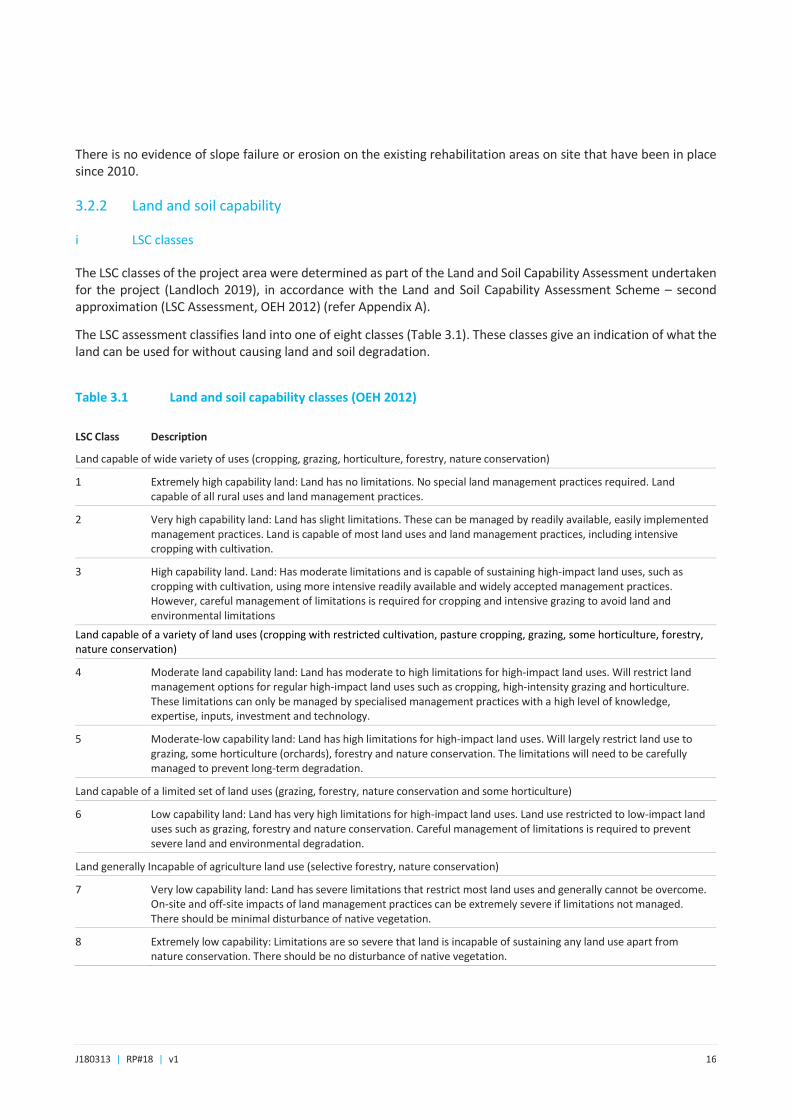
Table 3.1 Land and soil capability classes (OEH 2012)
LSC Class Description
Land capable of wide variety of uses (cropping, grazing, horticulture, forestry, nature conservation)
1 Extremely high capability land: Land has no limitations. No special land management practices required. Land capable of all rural uses and land management practices.
2 Very high capability land: Land has slight limitations. These can be managed by readily available, easily implemented management practices. Land is capable of most land uses and land management practices, including intensive cropping with cultivation.
3 High capability land. Land: Has moderate limitations and is capable of sustaining high-impact land uses, such as cropping with cultivation, using more intensive readily available and widely accepted management practices. However, careful management of limitations is required for cropping and intensive grazing to avoid land and environmental limitations
Land capable of a variety of land uses (cropping with restricted cultivation, pasture cropping, grazing, some horticulture, forestry, nature conservation)
4 Moderate land capability land: Land has moderate to high limitations for high-impact land uses. Will restrict land management options for regular high-impact land uses such as cropping, high-intensity grazing and horticulture. These limitations can only be managed by specialised management practices with a high level of knowledge, expertise, inputs, investment and technology.
5 Moderate-low capability land: Land has high limitations for high-impact land uses. Will largely restrict land use to grazing, some horticulture (orchards), forestry and nature conservation. The limitations will need to be carefully managed to prevent long-term degradation.
Land capable of a limited set of land uses (grazing, forestry, nature conservation and some horticulture)
6 Low capability land: Land has very high limitations for high-impact land uses. Land use restricted to low-impact land uses such as grazing, forestry and nature conservation. Careful management of limitations is required to prevent severe land and environmental degradation.
Land generally Incapable of agriculture land use (selective forestry, nature conservation)
7 Very low capability land: Land has severe limitations that restrict most land uses and generally cannot be overcome. On-site and off-site impacts of land management practices can be extremely severe if limitations not managed. There should be minimal disturbance of native vegetation.
8 Extremely low capability: Limitations are so severe that land is incapable of sustaining any land use apart from nature conservation. There should be no disturbance of native vegetation.
J180313 | RP#18 | v1 17
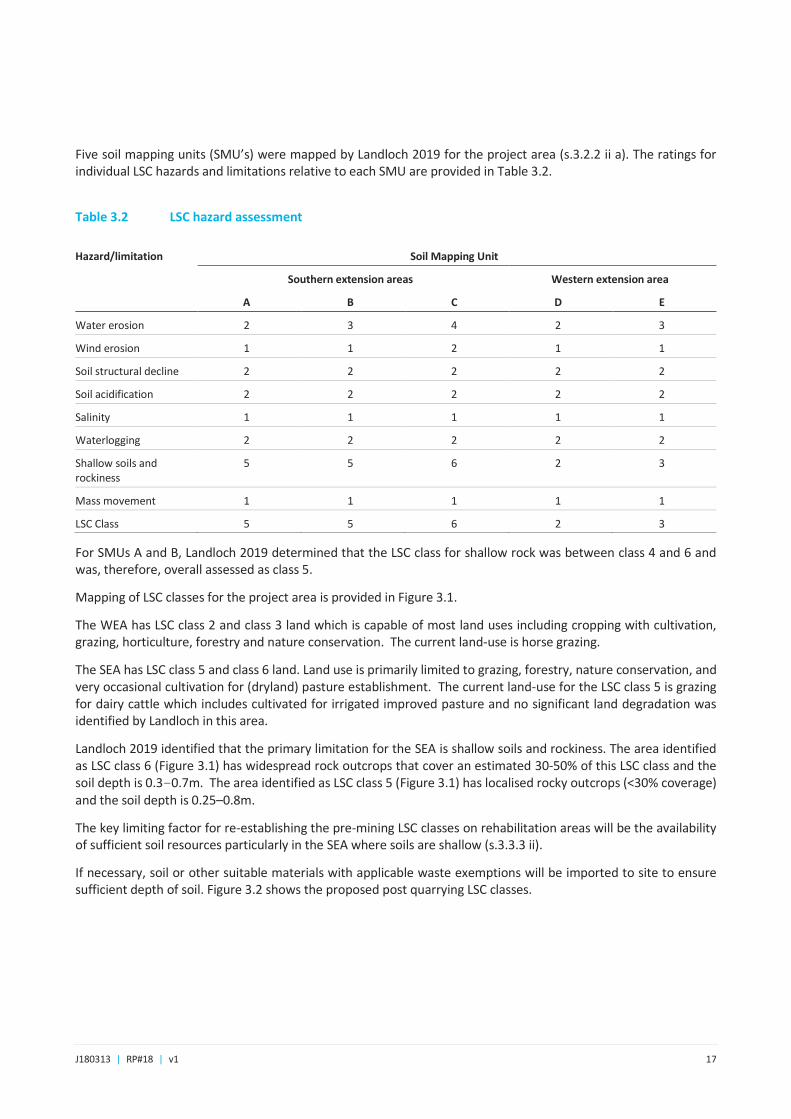
Five soil mapping units (SMU’s) were mapped by Landloch 2019 for the project area (s.3.2.2 ii a). The ratings for individual LSC hazards and limitations relative to each SMU are provided in Table 3.2.
Table 3.2 LSC hazard assessment
Hazard/limitation Soil Mapping Unit
Southern extension areas Western extension area
A B C D E
Water erosion 2 3 4 2 3
Wind erosion 1 1 2 1 1
Soil structural decline 2 2 2 2 2
Soil acidification 2 2 2 2 2
Salinity 1 1 1 1 1
Waterlogging 2 2 2 2 2
Shallow soils and rockiness
5 5 6 2 3
Mass movement 1 1 1 1 1
LSC Class 5 5 6 2 3
For SMUs A and B, Landloch 2019 determined that the LSC class for shallow rock was between class 4 and 6 and was, therefore, overall assessed as class 5.
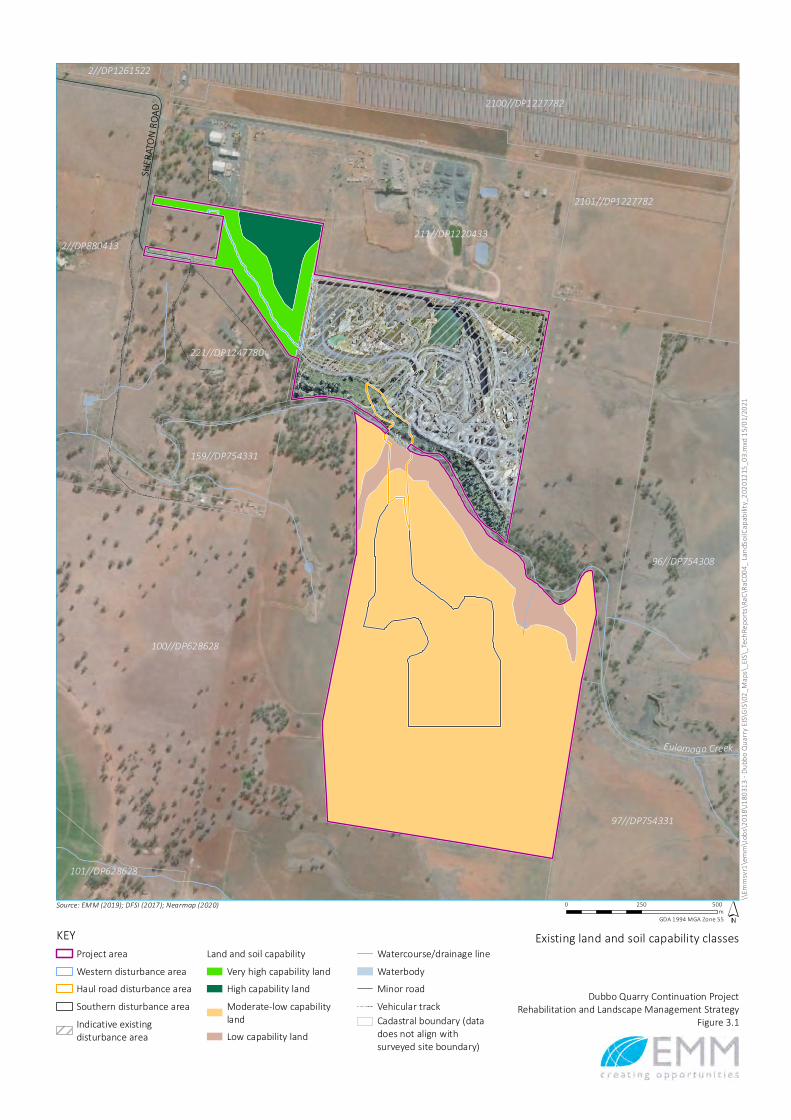
Mapping of LSC classes for the project area is provided in Figure 3.1.
The WEA has LSC class 2 and class 3 land which is capable of most land uses including cropping with cultivation, grazing, horticulture, forestry and nature conservation. The current land-use is horse grazing.
The SEA has LSC class 5 and class 6 land. Land use is primarily limited to grazing, forestry, nature conservation, and very occasional cultivation for (dryland) pasture establishment. The current land-use for the LSC class 5 is grazing for dairy cattle which includes cultivated for irrigated improved pasture and no significant land degradation was identified by Landloch in this area.
Landloch 2019 identified that the primary limitation for the SEA is shallow soils and rockiness. The area identified as LSC class 6 (Figure 3.1) has widespread rock outcrops that cover an estimated 30-50% of this LSC class and the soil depth is 0.3-0.7m. The area identified as LSC class 5 (Figure 3.1) has localised rocky outcrops (<30% coverage) and the soil depth is 0.25–0.8m.
The key limiting factor for re-establishing the pre-mining LSC classes on rehabilitation areas will be the availability of sufficient soil resources particularly in the SEA where soils are shallow (s.3.3.3 ii).
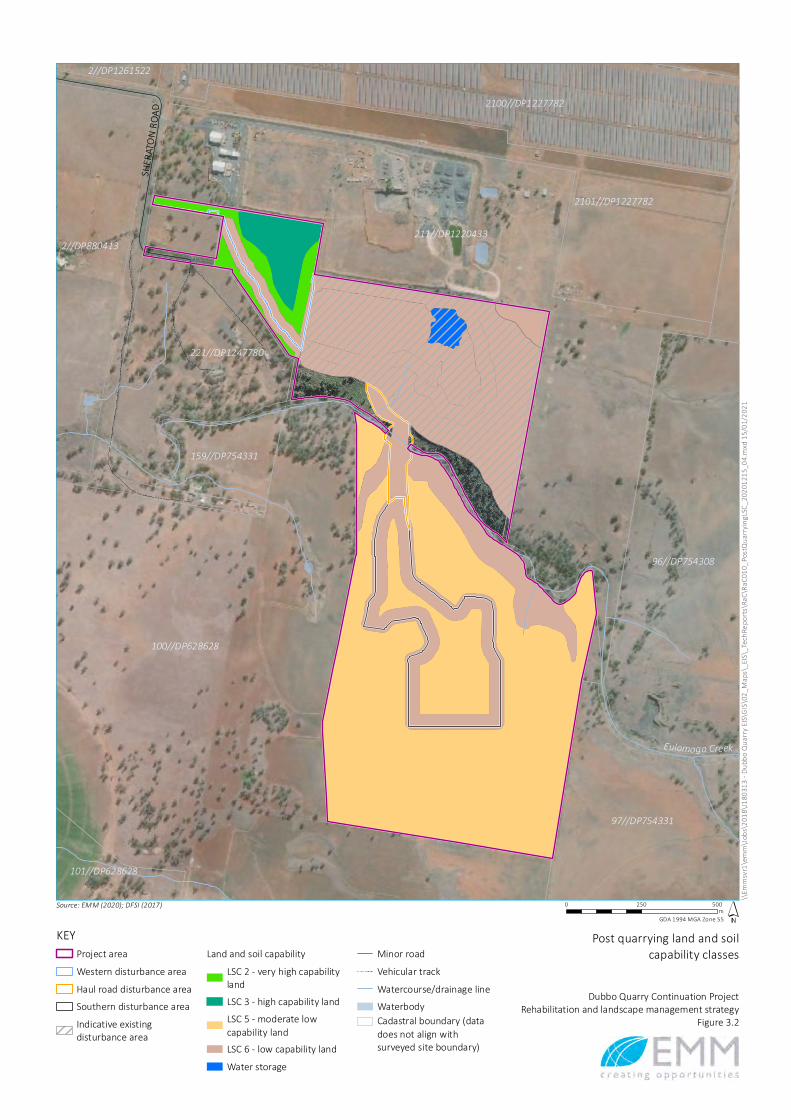
If necessary, soil or other suitable materials with applicable waste exemptions will be imported to site to ensure sufficient depth of soil. Figure 3.2 shows the proposed post quarrying LSC classes.
Eulomogo Creek
SHER
ATON R
O AD
211//DP1220433
2101//DP1227782
2100//DP1227782
159//DP754331
97//DP754331
96//DP754308
2//DP1261522
101//DP628628
100//DP628628
221//DP1247780
2//DP880413
\\Emm
svr1\e
mm\Jo
bs\20
18\J1
8031
3 - Du
bbo Q
uarry
EIS\G
IS\02
_Maps
\_EIS\
_TechR
eport
s\RaC
\RaC0
04_ L
andSo
ilCapab
ility_2
02012
15_0
3.mxd
15/01
/2021
0 250 500m
GDA 1994 MGA Zone 55
KEYProject areaWestern disturbance areaHaul road disturbance areaSouthern disturbance areaIndicative existingdisturbance area
Land and soil capabilityVery high capability landHigh capability landModerate-low capabilitylandLow capability land
Watercourse/drainage lineWaterbodyMinor roadVehicular trackCadastral boundary (datadoes not align withsurveyed site boundary)
Existing land and soil capability classes
Dubbo Quarry Continuation ProjectRehabilitation and Landscape Management Strategy
Figure 3.1
Source: EMM (2019); DFSI (2017); Nearmap (2020)
Eulomogo Creek
SHER
ATON R
O AD
211//DP1220433
2101//DP1227782
2100//DP1227782
159//DP754331
97//DP754331
96//DP754308
2//DP1261522
101//DP628628
100//DP628628
221//DP1247780
2//DP880413
\\Emm
svr1\e
mm\Jo
bs\20
18\J1
8031
3 - Du
bbo Q
uarry
EIS\G
IS\02
_Maps
\_EIS\
_TechR
eport
s\RaC
\RaC0
10_P
ostQu
arryin
gLSC_
20201
215_0
4.mxd
15/01
/2021
0 250 500m
GDA 1994 MGA Zone 55
KEYProject areaWestern disturbance areaHaul road disturbance areaSouthern disturbance areaIndicative existingdisturbance area
Land and soil capabilityLSC 2 - very high capabilitylandLSC 3 - high capability landLSC 5 - moderate lowcapability landLSC 6 - low capability landWater storage
Minor roadVehicular trackWatercourse/drainage lineWaterbodyCadastral boundary (datadoes not align withsurveyed site boundary)
Post quarrying land and soilcapability classes
Dubbo Quarry Continuation ProjectRehabilitation and landscape management strategy
Figure 3.2
Source: EMM (2020); DFSI (2017)
J180313 | RP#18 | v1 20
ii Soils
a Soil mapping units
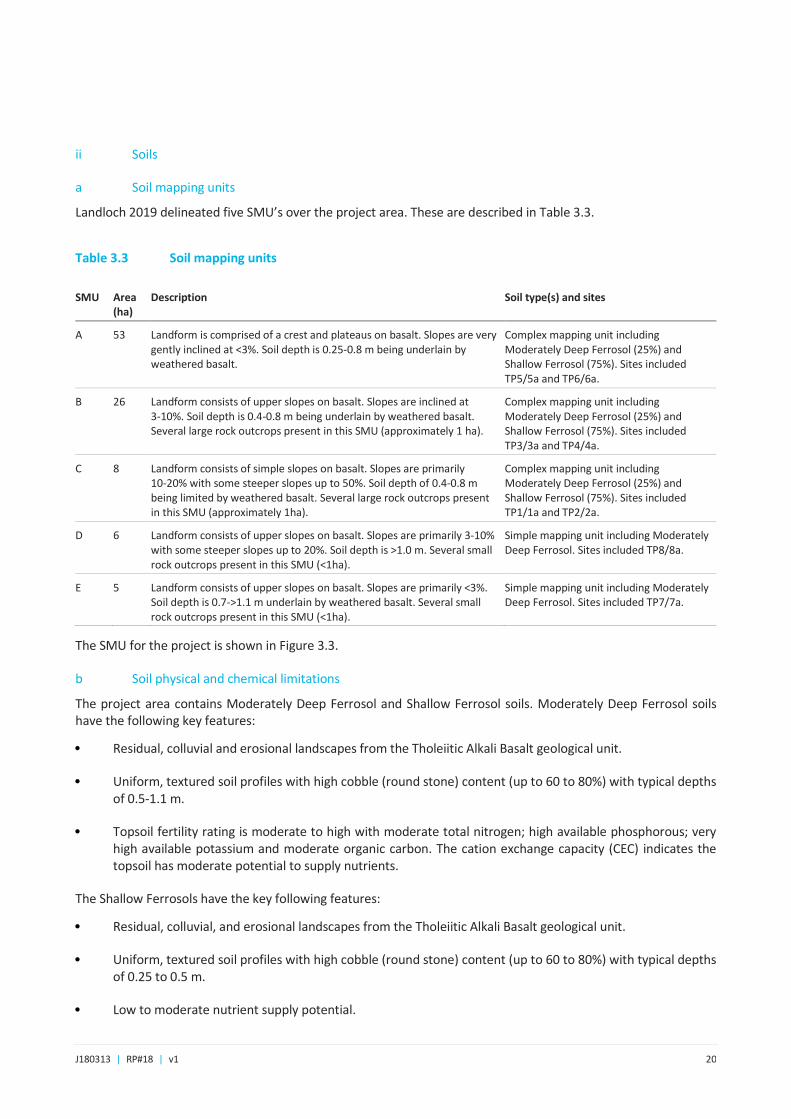
Landloch 2019 delineated five SMU’s over the project area. These are described in Table 3.3.
Table 3.3 Soil mapping units
SMU Area (ha)
Description Soil type(s) and sites
A 53 Landform is comprised of a crest and plateaus on basalt. Slopes are very gently inclined at <3%. Soil depth is 0.25-0.8 m being underlain by weathered basalt.
Complex mapping unit including Moderately Deep Ferrosol (25%) and Shallow Ferrosol (75%). Sites included TP5/5a and TP6/6a.
B 26 Landform consists of upper slopes on basalt. Slopes are inclined at 3-10%. Soil depth is 0.4-0.8 m being underlain by weathered basalt. Several large rock outcrops present in this SMU (approximately 1 ha).
Complex mapping unit including Moderately Deep Ferrosol (25%) and Shallow Ferrosol (75%). Sites included TP3/3a and TP4/4a.
C 8 Landform consists of simple slopes on basalt. Slopes are primarily 10-20% with some steeper slopes up to 50%. Soil depth of 0.4-0.8 m being limited by weathered basalt. Several large rock outcrops present in this SMU (approximately 1ha).
Complex mapping unit including Moderately Deep Ferrosol (25%) and Shallow Ferrosol (75%). Sites included TP1/1a and TP2/2a.
D 6 Landform consists of upper slopes on basalt. Slopes are primarily 3-10% with some steeper slopes up to 20%. Soil depth is >1.0 m. Several small rock outcrops present in this SMU (<1ha).
Simple mapping unit including Moderately Deep Ferrosol. Sites included TP8/8a.
E 5 Landform consists of upper slopes on basalt. Slopes are primarily <3%. Soil depth is 0.7->1.1 m underlain by weathered basalt. Several small rock outcrops present in this SMU (<1ha).
Simple mapping unit including Moderately Deep Ferrosol. Sites included TP7/7a.
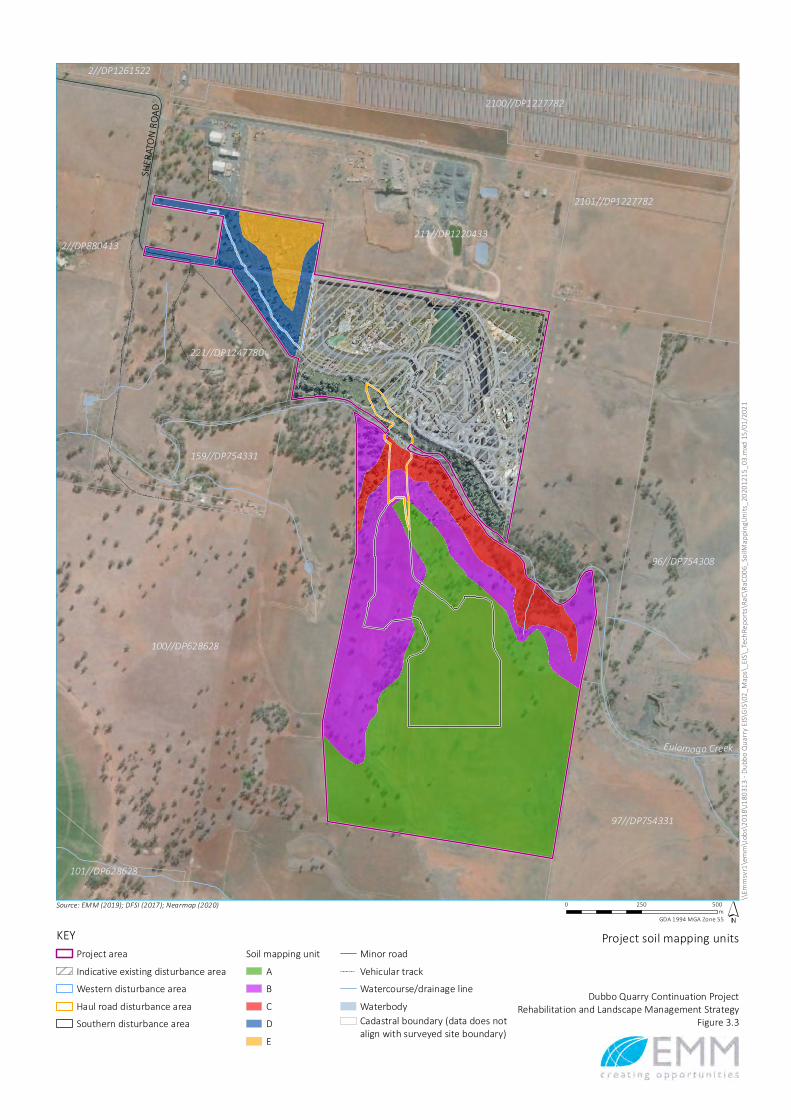
The SMU for the project is shown in Figure 3.3.
b Soil physical and chemical limitations
The project area contains Moderately Deep Ferrosol and Shallow Ferrosol soils. Moderately Deep Ferrosol soils have the following key features:
• Residual, colluvial and erosional landscapes from the Tholeiitic Alkali Basalt geological unit.
• Uniform, textured soil profiles with high cobble (round stone) content (up to 60 to 80%) with typical depths of 0.5-1.1 m.
• Topsoil fertility rating is moderate to high with moderate total nitrogen; high available phosphorous; very high available potassium and moderate organic carbon. The cation exchange capacity (CEC) indicates the topsoil has moderate potential to supply nutrients.
The Shallow Ferrosols have the key following features:
• Residual, colluvial, and erosional landscapes from the Tholeiitic Alkali Basalt geological unit.
• Uniform, textured soil profiles with high cobble (round stone) content (up to 60 to 80%) with typical depths of 0.25 to 0.5 m.
• Low to moderate nutrient supply potential.

J180313 | RP#18 | v1 21
The Moderately Deep Ferrosols are found in the WEA and the Shallow Ferrosols are found in the SEA.
The soil physical and chemical properties and associated management considerations are summarised in Table 3.4.
Eulomogo Creek
SHER
ATON R
O AD
211//DP1220433
2101//DP1227782
2100//DP1227782
159//DP754331
97//DP754331
96//DP754308
2//DP1261522
101//DP628628
100//DP628628
221//DP1247780
2//DP880413
\\Emm
svr1\e
mm\Jo
bs\20
18\J1
8031
3 - Du
bbo Q
uarry
EIS\G
IS\02
_Maps
\_EIS\
_TechR
eport
s\RaC
\RaC0
06_So
ilMap
pingU
nits_2
0201
215_
03.m
xd 15
/01/20
21
0 250 500m
GDA 1994 MGA Zone 55
KEYProject areaIndicative existing disturbance areaWestern disturbance areaHaul road disturbance areaSouthern disturbance area
Soil mapping unitABCDE
Minor roadVehicular trackWatercourse/drainage lineWaterbodyCadastral boundary (data does notalign with surveyed site boundary)
Project soil mapping units
Dubbo Quarry Continuation ProjectRehabilitation and Landscape Management Strategy
Figure 3.3
Source: EMM (2019); DFSI (2017); Nearmap (2020)
J180313 | RP#18 | v1 23
Table 3.4 Soil physico-chemical properties
Typical depth (mm) Texture pH Salinity Sodicity/dispersion Management considerations
0 to 50-100 Clay loam or light clay
Low to moderate acidity
Low Non-sodic/sometimes slightly dispersive
Moderate fertility, moderate organic matter content. Negligible physico-chemical limitations to plant growth
100-500 Light to medium heavy clay
Low acidity to high alkalinity
Low to moderate salinity
Non-sodic to sometimes sodic/ potentially dispersive and slaking
Low fertility, low organic matter. Potentially sodic.
>500 Light to medium clay to medium heavy clay
Neutral to extremely alkaline
Low Non-sodic to sometimes sodic/potentially dispersive and slaking
The subsoil limitations are readily addressed via amelioration which will be undertaken during the stripping and rehabilitation phases. This is addressed in more detail in Section 5.1.
c Erosion and sediment control
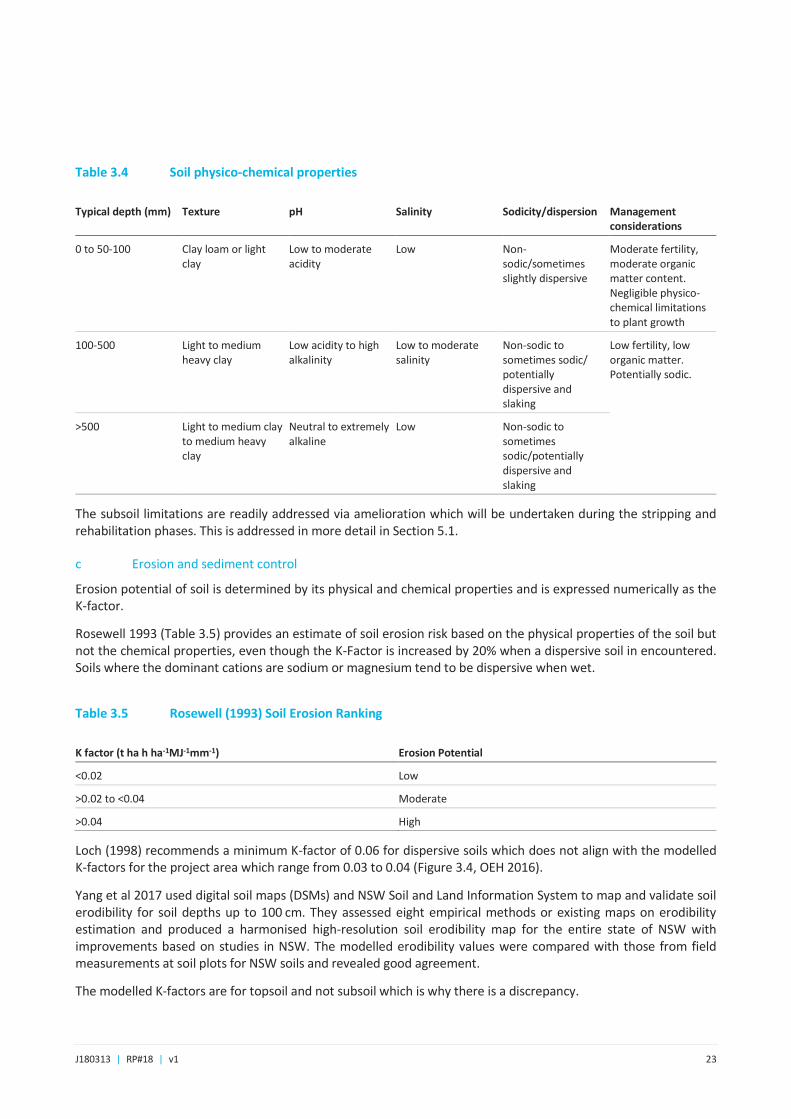
Erosion potential of soil is determined by its physical and chemical properties and is expressed numerically as the K-factor.
Rosewell 1993 (Table 3.5) provides an estimate of soil erosion risk based on the physical properties of the soil but not the chemical properties, even though the K-Factor is increased by 20% when a dispersive soil in encountered. Soils where the dominant cations are sodium or magnesium tend to be dispersive when wet.
Table 3.5 Rosewell (1993) Soil Erosion Ranking
K factor (t ha h ha-1MJ-1mm-1) Erosion Potential
<0.02 Low
>0.02 to <0.04 Moderate
>0.04 High
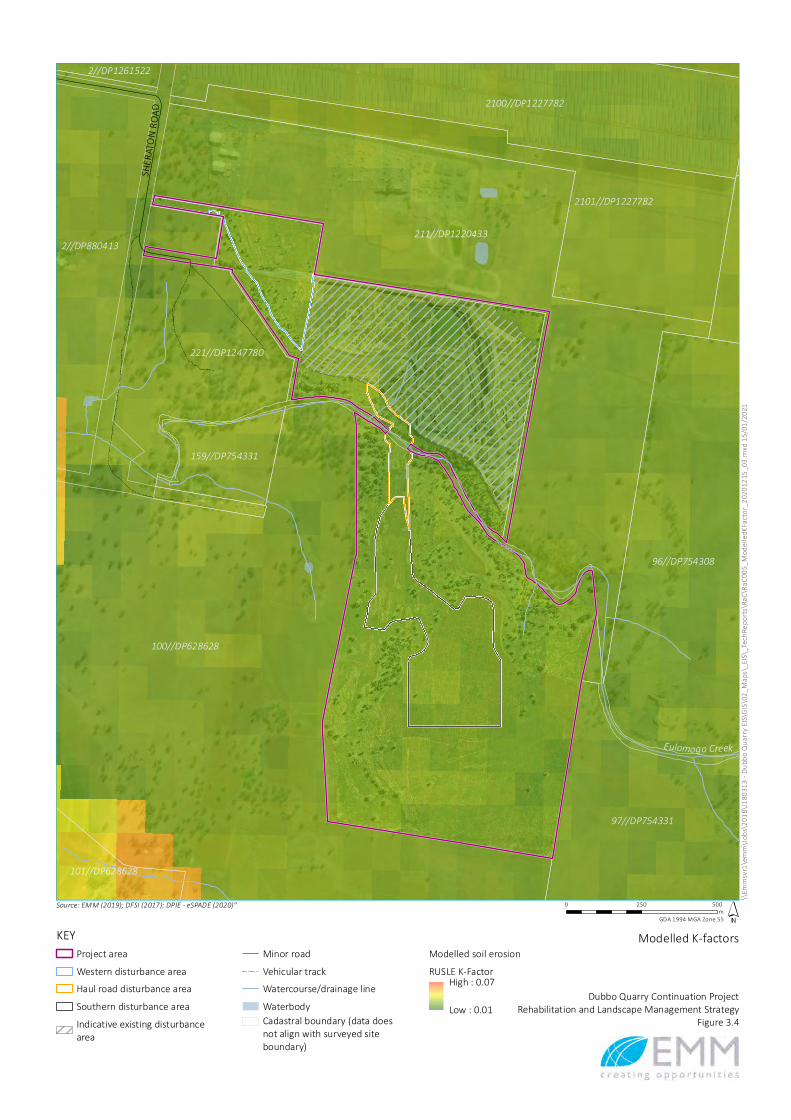
Loch (1998) recommends a minimum K-factor of 0.06 for dispersive soils which does not align with the modelled K-factors for the project area which range from 0.03 to 0.04 (Figure 3.4, OEH 2016).
Yang et al 2017 used digital soil maps (DSMs) and NSW Soil and Land Information System to map and validate soil erodibility for soil depths up to 100 cm. They assessed eight empirical methods or existing maps on erodibility estimation and produced a harmonised high-resolution soil erodibility map for the entire state of NSW with improvements based on studies in NSW. The modelled erodibility values were compared with those from field measurements at soil plots for NSW soils and revealed good agreement.
The modelled K-factors are for topsoil and not subsoil which is why there is a discrepancy.

J180313 | RP#18 | v1 24
An assessment of the project’s K-factors against the Rosewell (1993) soil erosion ranking (Table 3.5) demonstrates a ‘high’ soil erosion potential (which is fundamentally due to soil dispersion risk).
The erosion hazard for the project area has been determined using the procedure described in section 4.4.1 of Landcom 2004. The first step in the hazard assessment is a simple process using Figure 4.6 from Landcom 2004 (reproduced as Figure 3.5) that considers slope of the land and the Rainfall Erosivity or R factor.
Eulomogo Creek
SHER
ATON R
O AD
211//DP1220433
2101//DP1227782
2100//DP1227782
159//DP754331
97//DP754331
96//DP754308
2//DP1261522
101//DP628628
100//DP628628
221//DP1247780
2//DP880413
\\Emm
svr1\e
mm\Jo
bs\20
18\J1
8031
3 - Du
bbo Q
uarry
EIS\G
IS\02
_Maps
\_EIS\
_TechR
eport
s\RaC
\RaC0
05_M
odelle
dKFac
tor_2
02012
15_03
.mxd
15/01
/2021
0 250 500m
GDA 1994 MGA Zone 55
KEYProject areaWestern disturbance areaHaul road disturbance areaSouthern disturbance areaIndicative existing disturbancearea
Minor roadVehicular trackWatercourse/drainage lineWaterbodyCadastral boundary (data doesnot align with surveyed siteboundary)
Modelled soil erosionRUSLE K-FactorHigh : 0.07
Low : 0.01
Modelled K-factors
Dubbo Quarry Continuation ProjectRehabilitation and Landscape Management Strategy
Figure 3.4
Source: EMM (2019); DFSI (2017); DPIE - eSPADE (2020)"
J180313 | RP#18 | v1 26
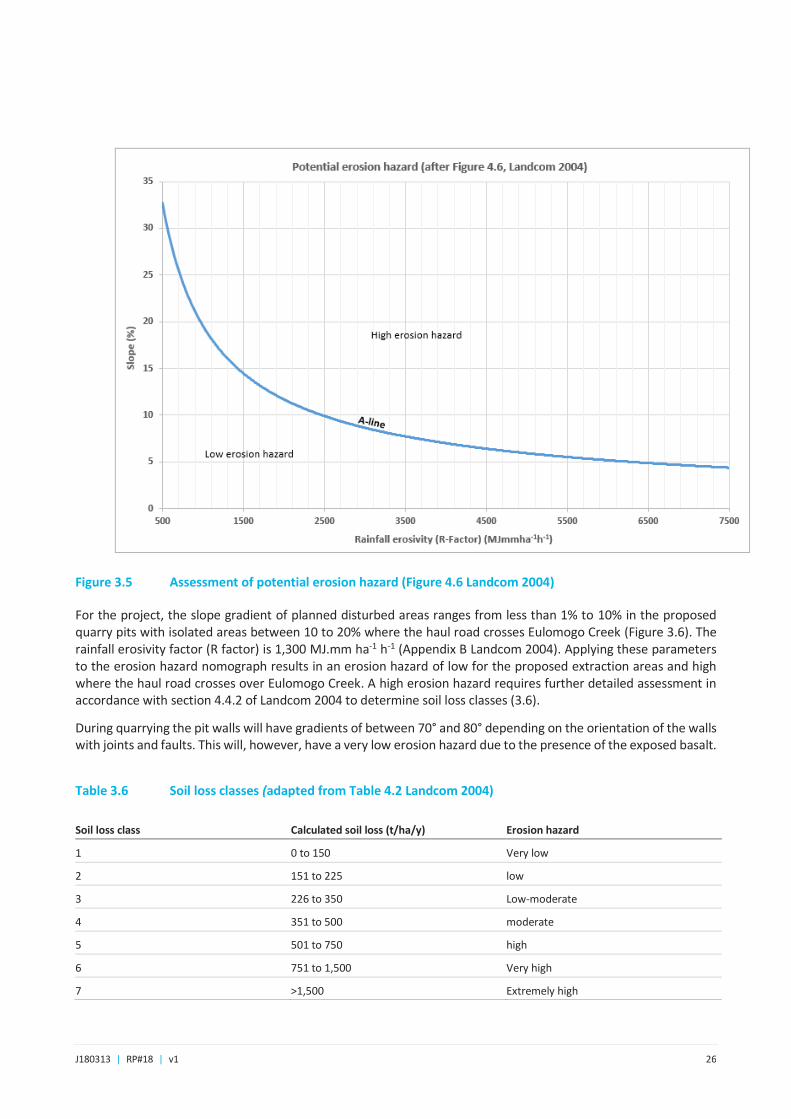
Figure 3.5 Assessment of potential erosion hazard (Figure 4.6 Landcom 2004)
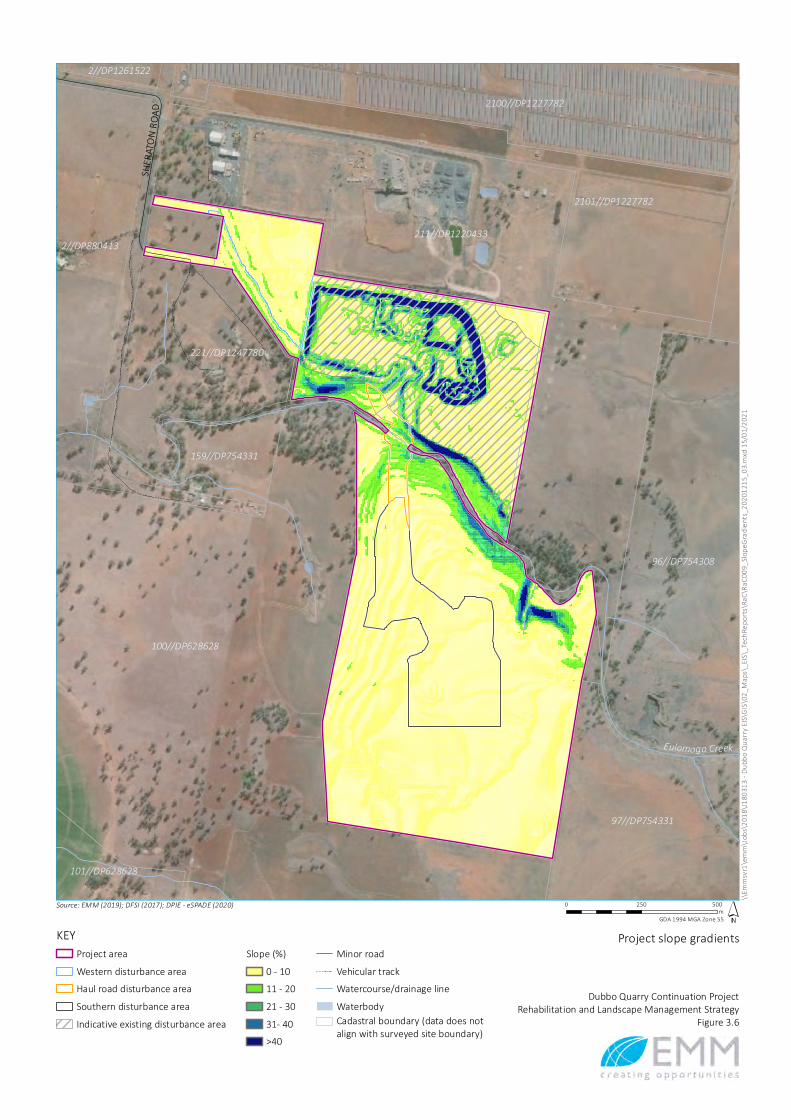
For the project, the slope gradient of planned disturbed areas ranges from less than 1% to 10% in the proposed quarry pits with isolated areas between 10 to 20% where the haul road crosses Eulomogo Creek (Figure 3.6). The rainfall erosivity factor (R factor) is 1,300 MJ.mm ha-1 h-1 (Appendix B Landcom 2004). Applying these parameters to the erosion hazard nomograph results in an erosion hazard of low for the proposed extraction areas and high where the haul road crosses over Eulomogo Creek. A high erosion hazard requires further detailed assessment in accordance with section 4.4.2 of Landcom 2004 to determine soil loss classes (3.6).
During quarrying the pit walls will have gradients of between 70° and 80° depending on the orientation of the walls with joints and faults. This will, however, have a very low erosion hazard due to the presence of the exposed basalt.
Table 3.6 Soil loss classes (adapted from Table 4.2 Landcom 2004)
Soil loss class Calculated soil loss (t/ha/y) Erosion hazard
1 0 to 150 Very low
2 151 to 225 low
3 226 to 350 Low-moderate
4 351 to 500 moderate
5 501 to 750 high
6 751 to 1,500 Very high
7 >1,500 Extremely high

J180313 | RP#18 | v1 27
Soil loss classes are determined by calculating the annual average soil loss using the Revised Universal Soil Loss Equation (RUSLE) with a nominal 80m slope length and soil surface cover factor (C-factor) of 1.
Eulomogo Creek
SHER
ATON R
O AD
211//DP1220433
2101//DP1227782
2100//DP1227782
159//DP754331
97//DP754331
96//DP754308
2//DP1261522
101//DP628628
100//DP628628
221//DP1247780
2//DP880413
\\Emm
svr1\e
mm\Jo
bs\20
18\J1
8031
3 - Du
bbo Q
uarry
EIS\G
IS\02
_Maps
\_EIS\
_TechR
eport
s\RaC
\RaC0
09_Sl
opeG
radien
ts_20
2012
15_0
3.mxd
15/01
/2021
0 250 500m
GDA 1994 MGA Zone 55
KEYProject areaWestern disturbance areaHaul road disturbance areaSouthern disturbance areaIndicative existing disturbance area
Slope (%)0 - 1011 - 2021 - 3031- 40>40
Minor roadVehicular trackWatercourse/drainage lineWaterbodyCadastral boundary (data does notalign with surveyed site boundary)
Project slope gradients
Dubbo Quarry Continuation ProjectRehabilitation and Landscape Management Strategy
Figure 3.6
Source: EMM (2019); DFSI (2017); DPIE - eSPADE (2020)
J180313 | RP#18 | v1 29
RUSLE calculates the annual average erosion in tons per hectare from rill and inter-rill (sheet) erosion. It does not consider gully or tunnel erosion and does not calculate peak erosion.
Most of the project is Soil Loss Class (SLC) 1 which has a very low erosion hazard with Eulomogo Creek crossing and approaches having SLCs from SLC 2 to SLC 5 which has a low to high erosion hazard.
Landcom 2004 recommends scheduling land disturbing activities for times of low rainfall erosivity for SLC 5 and SLC 6 lands (riparian lands are considered to be SLC 6). Where it is not possible or practical to schedule disturbance for periods of low rainfall erosivity then it will be necessary to provide erosion protection to achieve C-factors of 0.1 or lower when the 3-day rainfall forecast suggests that rain is likely. Further detail will be provided in the Water Management Plan for the project.
3.2.3 Dust and noise
Air quality and noise management plans will be implemented during operations and will be updated to include the rehabilitation phase of the project prior to rehabilitation activities commencing. These management plans will be designed to achieve compliance with licence limits during decommissioning and rehabilitation activities.
The main anticipated source of dust during rehabilitation operations include:
• light and heavy vehicles travelling on unsealed roads and tracks;
• soil dumping during capping and topsoil activities; and
• land shaping.
Dust management to be used during rehabilitation and closure may include:
• sheeting roads with gravel;
• application of trafficable soil stabilising polymers to unsealed roads and tracks;
• watering areas of dust generation;
• reducing the speed of light and heavy vehicles;
• not undertaking works on exposed locations during windy conditions; and
• progressive stabilisation and rehabilitation of disturbed areas.
The main sources of noise during the rehabilitation and closure phases include:
• demolition works;
• hauling and placement of capping materials and topsoil; and
• reshaping works.
Noise control during rehabilitation and closure may include:
• undertaking demolition and rehabilitation works in daylight hours only;
• reducing heavy vehicle speeds; and
J180313 | RP#18 | v1 30
• maintenance of guarding and silencers on vehicles and machinery.
3.2.4 Weeds
The presence of weed species has the potential to have an impact on revegetation outcomes. Additionally, weed species within the surrounding land has the potential to impact on the success of rehabilitated areas. Weed management will, therefore, be a critical component of rehabilitation activities.
Weeds will be managed through a series of control measures, including:
• if machinery to be used for rehabilitation is brought to the site from another site, and if there is a risk of weed seeds having been transported on the machinery, it will be hosed down in an approved wash down area before entry to the project area;
• herbicide spraying or scalping weeds from soil stockpiles prior to re-spreading;
• rehabilitation inspections to identify potential weed infestations; and
• identifying and spraying existing weed populations together with ongoing weed spraying over the life of the project.
Weed control programs will be implemented according to industry best management practice for the weed species present, if required.
3.2.5 Hydrocarbons, chemicals and wastes
Despite designs that prevent or contain spills, there is a low residual risk that land within the surface infrastructure area could be contaminated during de-commissioning (eg from hydrocarbon spills, storage of fuel and chemicals, refuelling activities, sewage, etc).
To manage any potential contamination sources, waste management practices in accordance with the quarry’s Environmental Management System will continue to be implemented during rehabilitation. For example:
• hydrocarbons will be stored in self bunded tanks or bunded areas designed in accordance with Australian Standard 1940;
• refueling will be undertaken away from Eulomogo Creek and in-pit water storages;
• waste products that are removed from the project will be appropriately disposed of at licensed facilities; and
• sewage generated post-decommissioning will be minimal (ie after the on-site sewerage treatment facility is removed). Any such waste (eg portable toilets) will be transported off-site for appropriate disposal at a licensed facility by a licensed waste contractor.
There is a low risk that hydrocarbon spills may also occur during soil spreading associated with rehabilitation (eg a burst hydraulic hose), but the impact would be isolated and spill-clean-up procedures would mitigate any potential impacts.

J180313 | RP#18 | v1 31
3.2.6 Bushfire
To prevent or manage bushfire risks, the site bushfire management plan will continue to be implemented. A hot work permit system will be used during rehabilitation works which will take into account the risk factors for bush fires. Machinery working on site will have spark arrestors fitted to their exhaust systems.
3.3 Socio-economic impacts
Community consultation has been, and will continue to be, key to project planning and understanding the project’s potential impacts on the local community. Relevant stakeholders will be engaged in the rehabilitation and closure planning and implementation process, including in the development of a detailed closure plan as the project progresses towards completion. The closure plan will address post-quarrying land use and rehabilitation objectives.
J180313 | RP#18 | v1 32
4 Land use options following closure Land uses on properties surrounding the project area primarily comprise agricultural uses, rural residential, quarrying, a solar farm, industrial and transport infrastructure (Mitchell Highway). Consideration of final land use options have taken into account the current land uses in and surrounding the project area, infrastructure that has been developed by the project, and the proximity of the project to existing agricultural land uses, the city of Dubbo, residences and general local infrastructure. The rehabilitation approach for the project is to reinstate the previous land-use as much as possible while enhancing biodiversity values lost due to past agricultural clearing.
As described in Section 3.2.2, the project area is currently LSC classes 5 and 6 in the SEA and LSC classes 2 and 3 in the WEA, which is consistent with the historic land-use of growing naturalised and improved pasture to support grazing by cattle and sheep.
All soil will be stripped and preserved prior to quarrying as having sufficient subsoil and topsoil volumes resources to ensure pre-quarrying LSCs can be established. It is intended that soils would be formed into bund walls around the perimeter of the WEA and SEA for future use in rehabilitation activities and to provide visual and acoustic treatment. However, due to low soil availability in the project area it will be necessary to import soil or other suitable materials with applicable waste exemptions to ensure sufficient depths of soil in rehabilitation activities (0.25-1 m).
Holcim proposes an open woodland for the pit walls to enhance the biodiversity and visual amenity of the project area.
There are some infrastructure areas associated with the project that may be able to provide an alternate beneficial post mining land use, such as:
• the quarry infrastructure areas and the pit floors that may be used for industrial purposes; and
• a workshop that may be suitable for storage of agricultural machinery or industrial enterprise.
Such alternate options will be considered, along with any other identified options by Holcim during operation of the quarry as part of detailed closure planning, and in consultation with relevant stakeholders, including the Department of Planning, Industry and Environment and Dubbo Regional Council.
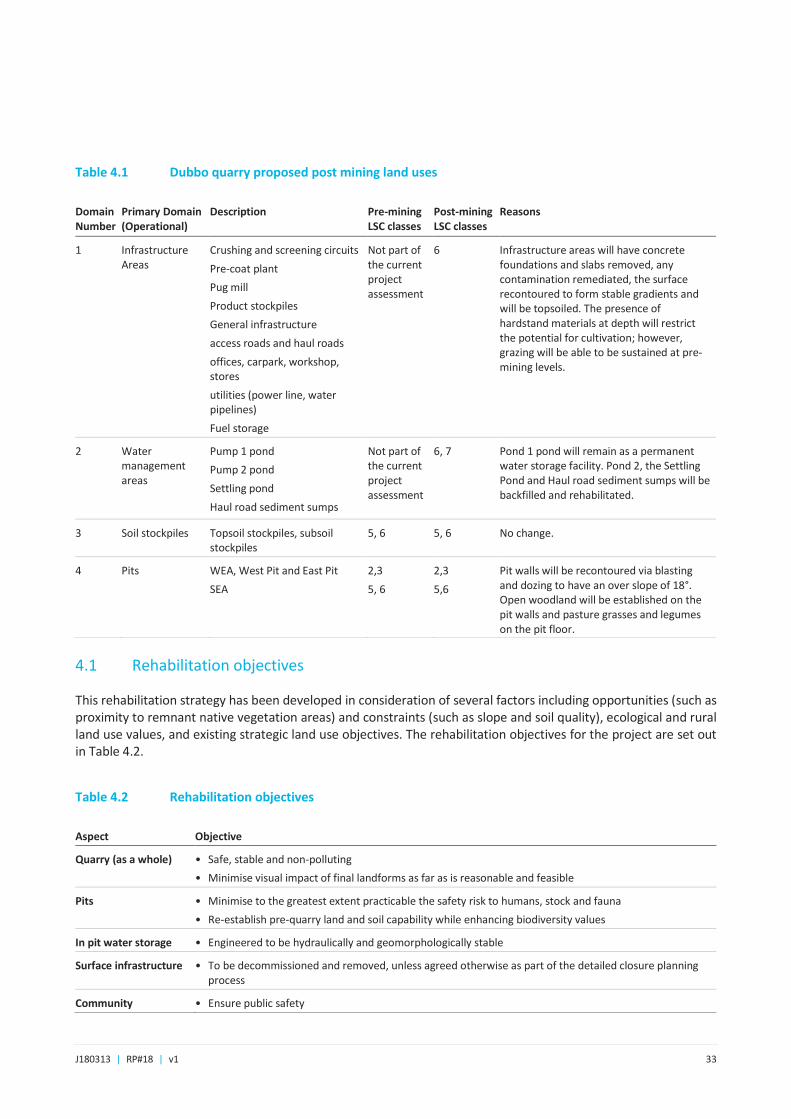
Proposed post mining land uses for each domain are summarised in Table 4.1.
J180313 | RP#18 | v1 33
4.1 Rehabilitation objectives
This rehabilitation strategy has been developed in consideration of several factors including opportunities (such as proximity to remnant native vegetation areas) and constraints (such as slope and soil quality), ecological and rural land use values, and existing strategic land use objectives. The rehabilitation objectives for the project are set out in Table 4.2.
Table 4.2 Rehabilitation objectives
Aspect Objective
Quarry (as a whole) • Safe, stable and non-polluting
• Minimise visual impact of final landforms as far as is reasonable and feasible
Pits • Minimise to the greatest extent practicable the safety risk to humans, stock and fauna
• Re-establish pre-quarry land and soil capability while enhancing biodiversity values
In pit water storage • Engineered to be hydraulically and geomorphologically stable
Surface infrastructure • To be decommissioned and removed, unless agreed otherwise as part of the detailed closure planning process
Community • Ensure public safety
Table 4.1 Dubbo quarry proposed post mining land uses
Domain Number
Primary Domain (Operational)
Description Pre-mining LSC classes
Post-mining LSC classes
Reasons
1 Infrastructure Areas
Crushing and screening circuits
Pre-coat plant
Pug mill
Product stockpiles
General infrastructure
access roads and haul roads
offices, carpark, workshop, stores
utilities (power line, water pipelines)
Fuel storage
Not part of the current project assessment
6 Infrastructure areas will have concrete foundations and slabs removed, any contamination remediated, the surface recontoured to form stable gradients and will be topsoiled. The presence of hardstand materials at depth will restrict the potential for cultivation; however, grazing will be able to be sustained at pre-mining levels.
2 Water management areas
Pump 1 pond
Pump 2 pond
Settling pond
Haul road sediment sumps
Not part of the current project assessment
6, 7 Pond 1 pond will remain as a permanent water storage facility. Pond 2, the Settling Pond and Haul road sediment sumps will be backfilled and rehabilitated.
3 Soil stockpiles Topsoil stockpiles, subsoil stockpiles
5, 6 5, 6 No change.
4 Pits WEA, West Pit and East Pit
SEA
2,3
5, 6
2,3
5,6
Pit walls will be recontoured via blasting and dozing to have an over slope of 18°. Open woodland will be established on the pit walls and pasture grasses and legumes on the pit floor.
J180313 | RP#18 | v1 34
Further details of specific rehabilitation methodology and rehabilitation criteria related to the establishment of these areas as outlined above are included in the following sections.
4.2 Rehabilitation by domain
4.2.1 Secondary domains
Primary and secondary domains for rehabilitation planning have been developed for the project in accordance with the requirements of ESG3. As described in Section 2.2, the primary domains are defined based on land management units within the project area with unique operational and functional purposes.
The secondary domains are the post-quarrying land-use domains and are characterised by similar post-quarrying land-uses. These domains form the basis of performance criteria used for measuring rehabilitation and closure success.
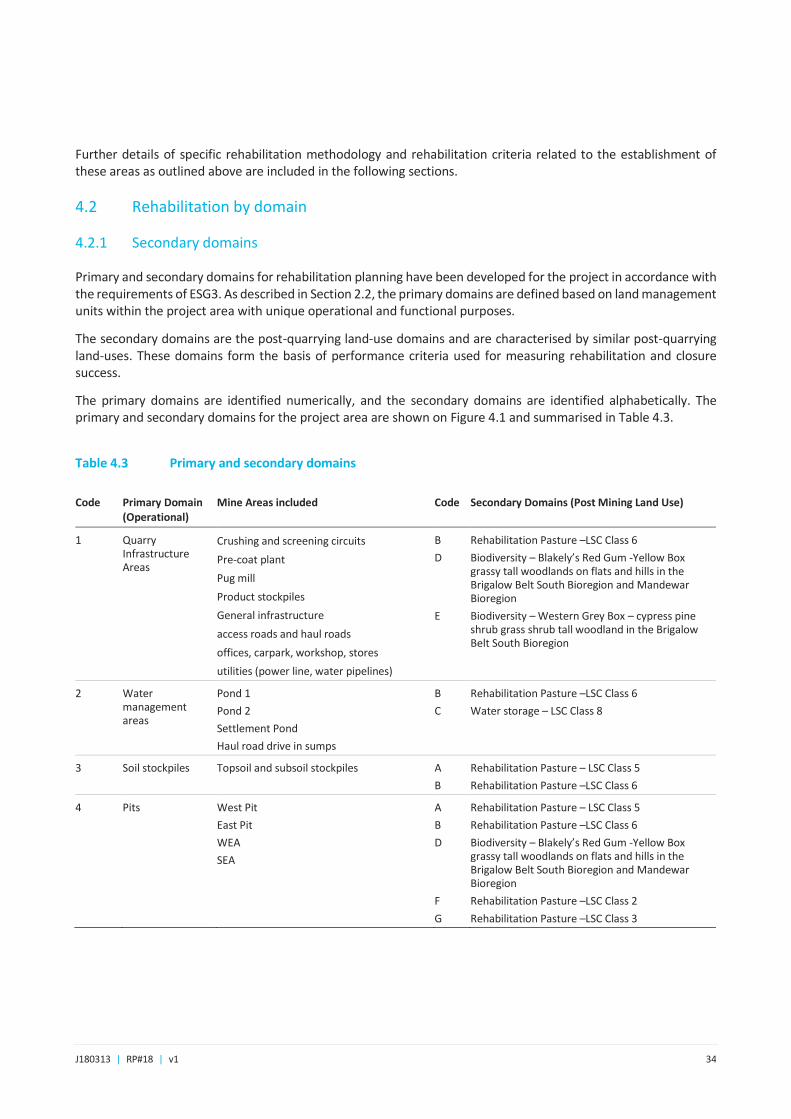
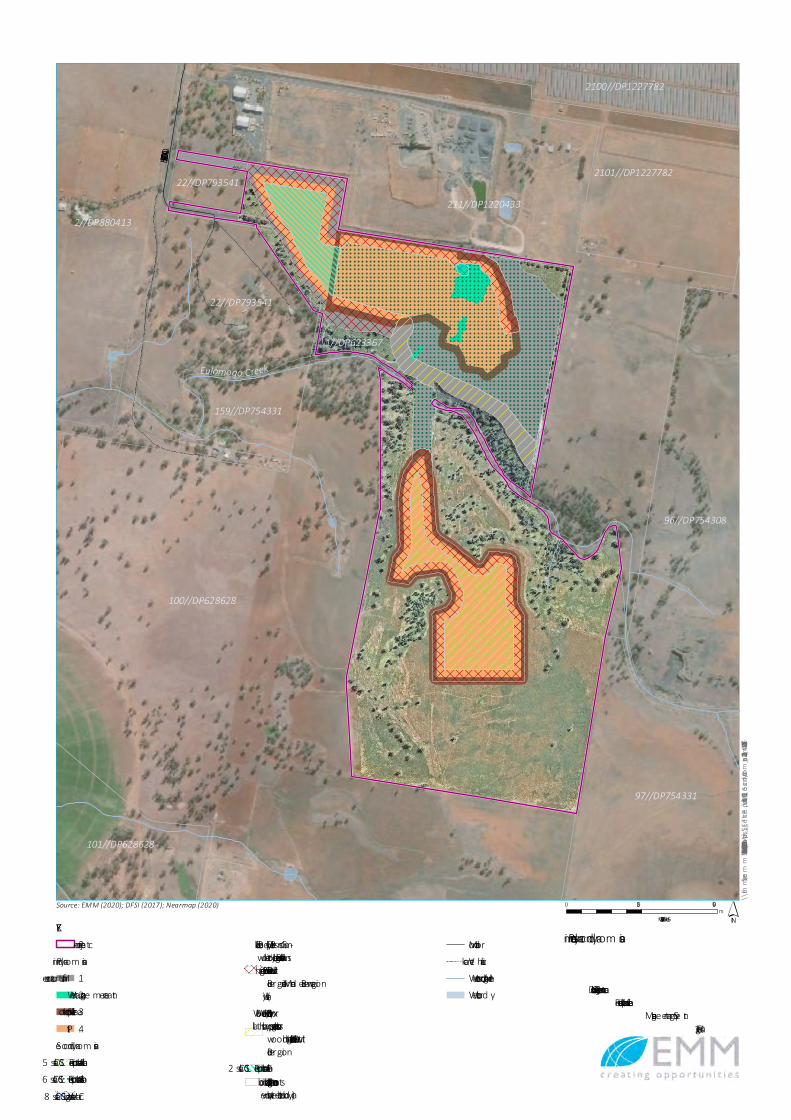
The primary domains are identified numerically, and the secondary domains are identified alphabetically. The primary and secondary domains for the project area are shown on Figure 4.1 and summarised in Table 4.3.
Table 4.3 Primary and secondary domains
Code Primary Domain (Operational)
Mine Areas included Code Secondary Domains (Post Mining Land Use)
1 Quarry Infrastructure Areas
Crushing and screening circuits
Pre-coat plant
Pug mill
Product stockpiles
General infrastructure
access roads and haul roads
offices, carpark, workshop, stores
utilities (power line, water pipelines)
B
D
E
Rehabilitation Pasture –LSC Class 6
Biodiversity – Blakely’s Red Gum -Yellow Box grassy tall woodlands on flats and hills in the Brigalow Belt South Bioregion and Mandewar Bioregion
Biodiversity – Western Grey Box – cypress pine shrub grass shrub tall woodland in the Brigalow Belt South Bioregion
2 Water management areas
Pond 1
Pond 2
Settlement Pond
Haul road drive in sumps
B
C
Rehabilitation Pasture –LSC Class 6
Water storage – LSC Class 8
3 Soil stockpiles Topsoil and subsoil stockpiles A
B
Rehabilitation Pasture – LSC Class 5
Rehabilitation Pasture –LSC Class 6
4 Pits West Pit
East Pit
WEA
SEA
A
B
D
F
G
Rehabilitation Pasture – LSC Class 5
Rehabilitation Pasture –LSC Class 6
Biodiversity – Blakely’s Red Gum -Yellow Box grassy tall woodlands on flats and hills in the Brigalow Belt South Bioregion and Mandewar Bioregion
Rehabilitation Pasture –LSC Class 2
Rehabilitation Pasture –LSC Class 3
Eulomogo Creek
SHERATON ROAD
97//DP754331
1//DP623367
159//DP754331
96//DP754308
2//DP880413
100//DP628628
22//DP793541
22//DP793541
101//DP628628
211//DP1220433
2101//DP1227782
2100//DP1227782
\\Emmsvr1\emm\Jobs\2018\J180313 - Dubbo Quarry EIS\GIS\02_Maps\_EIS\_TechReports\RaC\RaC011_SecondaryDomains_20210114_04.mxd 15/01/2021
0 250 500m
GDA 1994 MGA Zone 55KEYProje ct are a
Prim ary d om ains1. Infrastructure are a2. Wate r m anage m e nt are a3. Soil stockpile are a4. Pit
Se cond ary d om ainsA. Re habilitation pasture - LSC Class 5B. Re habilitation pasture - LSC Class 6C. Wate r storage - LSC Class 8
D. Biod ive rsity - Blake ly’s Re d Gum -Ye llow Box grassy tall wood lands on flatsand hills in the Brigalow Be lt SouthBiore gion and Mand e war Biore gion(walls)E. Biod ive rsity - We ste rn Gre y Box -cypre ss pine shrub grass shrub tallwood land in the Brigalow Be lt SouthBiore gionF. Re habilitation pasture - LSC Class 2Cadastral boundary (data d oe s not alignwith surve ye d site boundary)
Minor roadVe hicular trackWate rcourse /d rainage lineWate rbod y
Prim ary and se condary d om ains
Dubbo Q uarry Continuation Proje ctRe habilitation and Landscape
Manage m e nt Strate gyFigure 4.1
Source: EMM (2020); DFSI (2017); Nearmap (2020)
J180313 | RP#18 | v1 36
4.2.2 Domain 1 Infrastructure areas
Domain 1 is situated on the north-eastern side of Eulomogo Creek as shown in Figure 2.1. An angle of repose fill embankment and dirty water diversion has been constructed as part of the current quarry on the north-eastern bank of Eulomogo Creek and generally follows the top bank of creek to the west to where it meets the northern end of the proposed haul road.
At the completion of quarrying the diversion bank will be removed and the fill batter recontoured to blend in with the profile of the existing creek bank. Any excess fill from the recontouring works will be used to back fill water management areas or used as subsoil for rehabilitation of the quarry pits.
All buildings, plant, machinery, tanks, footings, slabs, pipelines, power lines and road pavements will be removed unless required for an alternate post-quarrying land use to be determined later in the project’s life.
Land contamination assessments will be undertaken, and any contaminated materials will either be bioremediated on site or transported to a suitable off-site facility.
Hardstand areas will be contour ripped and soils will be ameliorated to support improved pastures. Slopes steeper than 1(v):4(h) will be contour scarified and hydromulched. Blakely’s Red Gum -Yellow Box grassy tall woodlands on flats and hills in the Brigalow Belt South Bioregion and Mandewar Bioregion and Western Grey Box – cypress pine shrub grass shrub tall woodland in the Brigalow Belt South Bioregion community species will be planted within the re-contoured fill batter on the creek bank via hydro-seeding and hydro-mulching to enhance biodiversity values.
4.2.3 Domain 2 Water management areas
All water management areas will be rehabilitated apart from Pond 1 that will remain as a water storage. All pumps, footvalves and pipelines will be removed. All other water management structures will be backfilled using embankment material and soil generated from recontouring Domain 1 and revegetated.
The highwall above Pond 1 will be recontoured via blasting and dozing in accordance with the rehabilitation practices for pit walls described in section 4.2.5.
4.2.4 Domain 3 Soil stockpiles
Soil stockpiles will be removed as progressive rehabilitation is undertaken. In-situ soils in the footprint of the stockpiles will be contour scarified, ameliorated if required and direct seeded with pasture species.
4.2.5 Domain 4 Pits
Once extraction has been completed in a pit, the pit walls will be recontoured via blasting and dozing to have an overall gradient of approximately 1(v):3(h) or 18° consistent with rehabilitation undertaken to date on the south-western wall of the west pit. The blasted rock will be mixed with soil to form a rock/soil matrix to facilitate slope stability and a suitable growing media for the Blakely’s Red Gum -Yellow Box grassy tall woodlands on flats and hills in the Brigalow Belt South Bioregion and Mandewar Bioregion and Western Grey Box – cypress pine shrub grass shrub tall woodland in the Brigalow Belt South Bioregion communities. This will be direct seeded via hydro-seeding and then protected with a hydro-mulch.
Subsoil and topsoil will be respread on the pit floors at sufficient depth to re-establish the pre-quarrying LSC class. If there is a soil deficit, soil or other suitable materials with applicable waste exemptions will be imported for the purpose. During the operation of the quarry the materials will be imported and stockpiled on the west pit for this purpose.

J180313 | RP#18 | v1 37
The SEA pit floor will be re-shaped so that it is free draining to Eulomogo Creek. The floor of the west pit generally drains to Pond 1 at the eastern end of the pit. The floor of the WEA will be shaped so that it free drains to Pond 1.
A contamination assessment will be undertaken in the pits and extension areas and any contaminated materials either bioremediated on site or taken to an appropriate disposal facility.
Soils in the floor of the pits will be contour scarified, ameliorated if required, and seeded with pasture species.
J180313 | RP#18 | v1 38
5 Rehabilitation methods for closure 5.1 Soil management
Topsoil and subsoil stripping plans will be developed for each area prior to soil disturbance. As part of this process, a Land Disturbance Permit system will be implemented for operations personnel, to ensure that stripping activities are managed appropriately.
Some soils within the project area are sodic and/or magnesic. Sodium and magnesium levels typically increase with depth. Soil stripping and stockpiling will involve disturbance and mixing of soil; therefore, reduction in soil stability and fertility can be expected. Rehabilitated areas will be (initially) completely bare of vegetation, subject to increased rates of runoff and (if sloping) risk of erosion. Therefore, amelioration of the soils to ensure stability and to redress any fertility decline is likely to be required.
Where required, gypsum will be applied to the soil during stripping to reduce the potential for dispersion and reduce soil pH where high alkalinity exists.
5.1.1 Soil testing
Prior to stripping, topsoil and subsoil will be sampled to:
• identify the soil resource prior to stripping;
• assist with the preparation of a soil balance or inventory to assist with rehabilitation planning; and
• determine if the soil requires amelioration.
Soil sampling will determine if the soil requires amelioration to ensure the soils physical and chemical characteristics are within ranges necessary to address any erosion or revegetation constraints posed by the soils.
Soil exchangeable sodium levels, soil exchangeable magnesium levels and potential for clay dispersion will be assessed, with data on exchangeable cations used to calculate gypsum requirements to reduce Exchangeable Sodium Percentage (ESP) to <4% and Exchangeable Magnesium Percentage (EMP) to <20% (presence of dispersive clays will drastically increase erosion risk, and also reduce vegetation establishment and growth.)
Removal of vegetation will effectively reduce nutrient stores. Some elements such as nitrogen will be eventually replaced by growth of leguminous species, but elements (generally phosphorus) that are in extremely low levels may well become limiting to both pastures and native woodland rehabilitation.
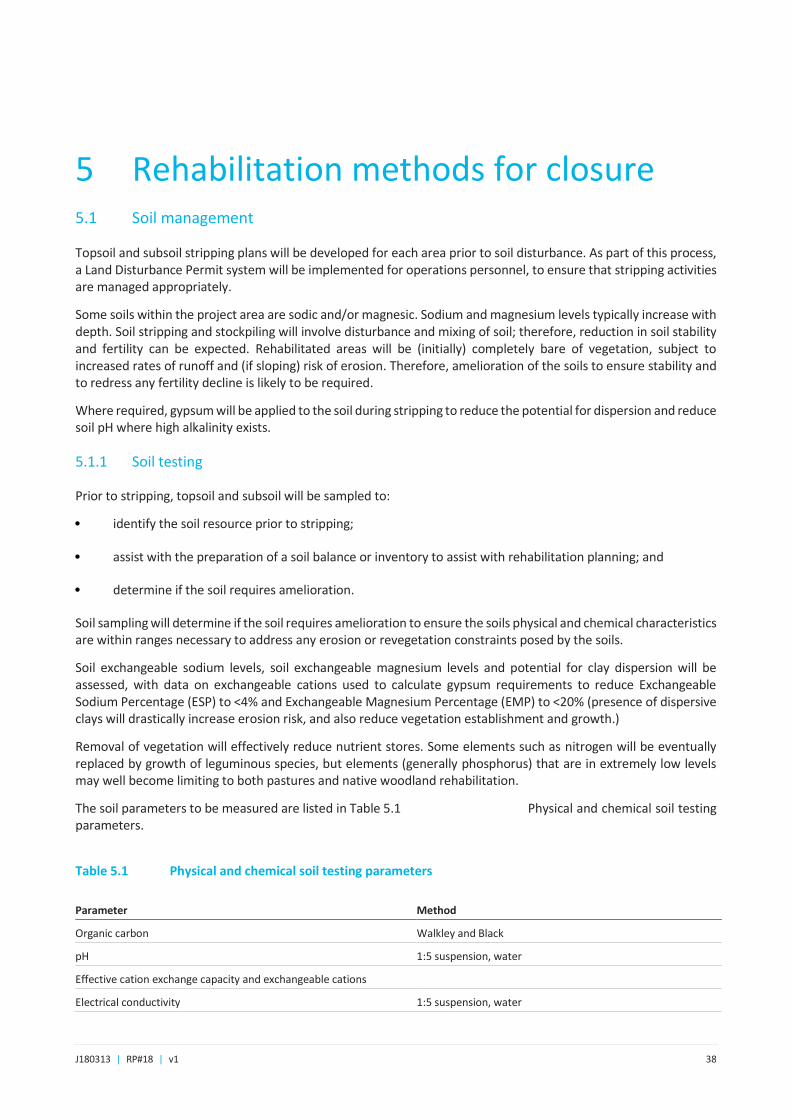
The soil parameters to be measured are listed in Table 5.1 Physical and chemical soil testing parameters.
Table 5.1 Physical and chemical soil testing parameters
Parameter Method
Organic carbon Walkley and Black
pH 1:5 suspension, water
Effective cation exchange capacity and exchangeable cations
Electrical conductivity 1:5 suspension, water
J180313 | RP#18 | v1 39
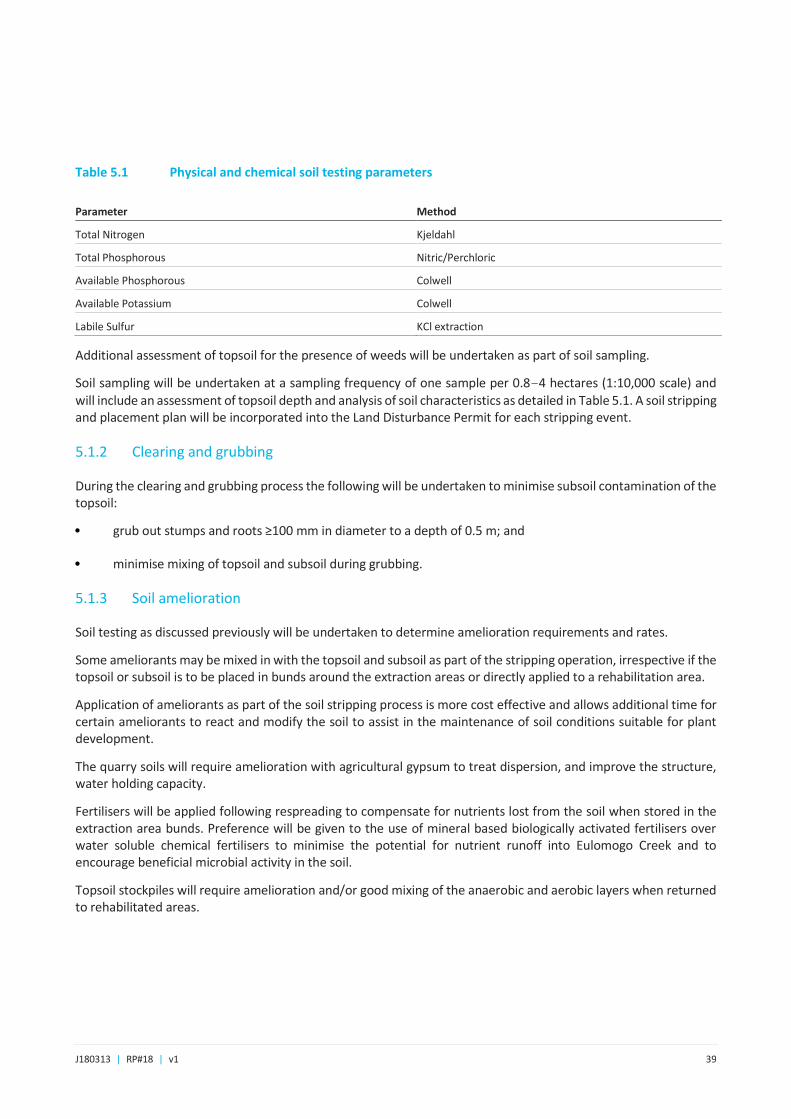
Table 5.1 Physical and chemical soil testing parameters
Parameter Method
Total Nitrogen Kjeldahl
Total Phosphorous Nitric/Perchloric
Available Phosphorous Colwell
Available Potassium Colwell
Labile Sulfur KCl extraction
Additional assessment of topsoil for the presence of weeds will be undertaken as part of soil sampling.
Soil sampling will be undertaken at a sampling frequency of one sample per 0.8-4 hectares (1:10,000 scale) and
will include an assessment of topsoil depth and analysis of soil characteristics as detailed in Table 5.1. A soil stripping and placement plan will be incorporated into the Land Disturbance Permit for each stripping event.
5.1.2 Clearing and grubbing
During the clearing and grubbing process the following will be undertaken to minimise subsoil contamination of the topsoil:
• grub out stumps and roots ≥100 mm in diameter to a depth of 0.5 m; and
• minimise mixing of topsoil and subsoil during grubbing.
5.1.3 Soil amelioration
Soil testing as discussed previously will be undertaken to determine amelioration requirements and rates.
Some ameliorants may be mixed in with the topsoil and subsoil as part of the stripping operation, irrespective if the topsoil or subsoil is to be placed in bunds around the extraction areas or directly applied to a rehabilitation area.
Application of ameliorants as part of the soil stripping process is more cost effective and allows additional time for certain ameliorants to react and modify the soil to assist in the maintenance of soil conditions suitable for plant development.
The quarry soils will require amelioration with agricultural gypsum to treat dispersion, and improve the structure, water holding capacity.
Fertilisers will be applied following respreading to compensate for nutrients lost from the soil when stored in the extraction area bunds. Preference will be given to the use of mineral based biologically activated fertilisers over water soluble chemical fertilisers to minimise the potential for nutrient runoff into Eulomogo Creek and to encourage beneficial microbial activity in the soil.
Topsoil stockpiles will require amelioration and/or good mixing of the anaerobic and aerobic layers when returned to rehabilitated areas.
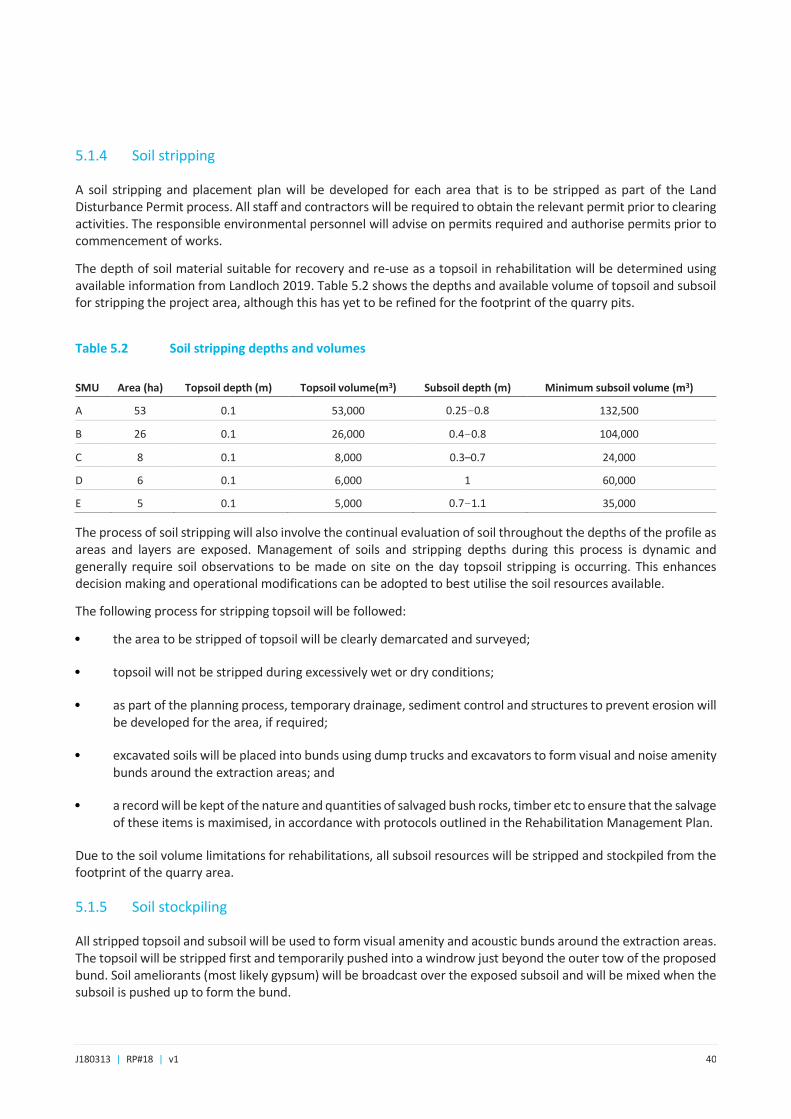
J180313 | RP#18 | v1 40
5.1.4 Soil stripping
A soil stripping and placement plan will be developed for each area that is to be stripped as part of the Land Disturbance Permit process. All staff and contractors will be required to obtain the relevant permit prior to clearing activities. The responsible environmental personnel will advise on permits required and authorise permits prior to commencement of works.
The depth of soil material suitable for recovery and re-use as a topsoil in rehabilitation will be determined using available information from Landloch 2019. Table 5.2 shows the depths and available volume of topsoil and subsoil for stripping the project area, although this has yet to be refined for the footprint of the quarry pits.
Table 5.2 Soil stripping depths and volumes
SMU Area (ha) Topsoil depth (m) Topsoil volume(m3) Subsoil depth (m) Minimum subsoil volume (m3)
A 53 0.1 53,000 0.25-0.8 132,500
B 26 0.1 26,000 0.4-0.8 104,000
C 8 0.1 8,000 0.3–0.7 24,000
D 6 0.1 6,000 1 60,000
E 5 0.1 5,000 0.7-1.1 35,000
The process of soil stripping will also involve the continual evaluation of soil throughout the depths of the profile as areas and layers are exposed. Management of soils and stripping depths during this process is dynamic and generally require soil observations to be made on site on the day topsoil stripping is occurring. This enhances decision making and operational modifications can be adopted to best utilise the soil resources available.
The following process for stripping topsoil will be followed:
• the area to be stripped of topsoil will be clearly demarcated and surveyed;
• topsoil will not be stripped during excessively wet or dry conditions;
• as part of the planning process, temporary drainage, sediment control and structures to prevent erosion will be developed for the area, if required;
• excavated soils will be placed into bunds using dump trucks and excavators to form visual and noise amenity bunds around the extraction areas; and
• a record will be kept of the nature and quantities of salvaged bush rocks, timber etc to ensure that the salvage of these items is maximised, in accordance with protocols outlined in the Rehabilitation Management Plan.
Due to the soil volume limitations for rehabilitations, all subsoil resources will be stripped and stockpiled from the footprint of the quarry area.
5.1.5 Soil stockpiling
All stripped topsoil and subsoil will be used to form visual amenity and acoustic bunds around the extraction areas. The topsoil will be stripped first and temporarily pushed into a windrow just beyond the outer tow of the proposed bund. Soil ameliorants (most likely gypsum) will be broadcast over the exposed subsoil and will be mixed when the subsoil is pushed up to form the bund.
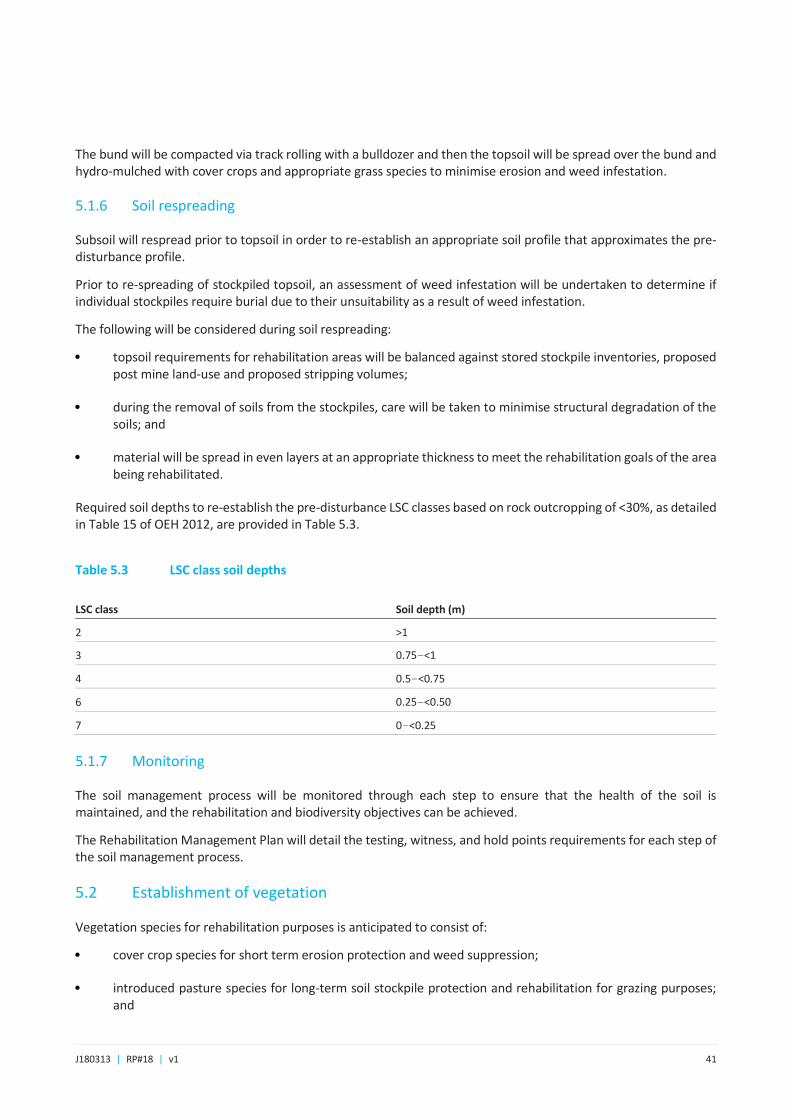
J180313 | RP#18 | v1 41
The bund will be compacted via track rolling with a bulldozer and then the topsoil will be spread over the bund and hydro-mulched with cover crops and appropriate grass species to minimise erosion and weed infestation.
5.1.6 Soil respreading
Subsoil will respread prior to topsoil in order to re-establish an appropriate soil profile that approximates the pre-disturbance profile.
Prior to re-spreading of stockpiled topsoil, an assessment of weed infestation will be undertaken to determine if individual stockpiles require burial due to their unsuitability as a result of weed infestation.
The following will be considered during soil respreading:
• topsoil requirements for rehabilitation areas will be balanced against stored stockpile inventories, proposed post mine land-use and proposed stripping volumes;
• during the removal of soils from the stockpiles, care will be taken to minimise structural degradation of the soils; and
• material will be spread in even layers at an appropriate thickness to meet the rehabilitation goals of the area being rehabilitated.
Required soil depths to re-establish the pre-disturbance LSC classes based on rock outcropping of <30%, as detailed in Table 15 of OEH 2012, are provided in Table 5.3.
Table 5.3 LSC class soil depths
LSC class Soil depth (m)
2 >1
3 0.75-<1
4 0.5-<0.75
6 0.25-<0.50
7 0-<0.25
5.1.7 Monitoring
The soil management process will be monitored through each step to ensure that the health of the soil is maintained, and the rehabilitation and biodiversity objectives can be achieved.
The Rehabilitation Management Plan will detail the testing, witness, and hold points requirements for each step of the soil management process.
5.2 Establishment of vegetation
Vegetation species for rehabilitation purposes is anticipated to consist of:
• cover crop species for short term erosion protection and weed suppression;
• introduced pasture species for long-term soil stockpile protection and rehabilitation for grazing purposes; and
J180313 | RP#18 | v1 42
• species that comprise the vegetation communities currently present within the project area: Blakely’s Red Gum -Yellow Box grassy tall woodlands on flats and hills in the Brigalow Belt South Bioregion and Mandewar Bioregion and Western Grey Box – cypress pine shrub grass shrub tall woodland in the Brigalow Belt South Bioregion communities for the pit wills and western side of Eulomogo Creek.
Seed for cover crop and pasture species will be obtained from commercial suppliers.
Seed will be stored in a humidity controlled and vermin free environment to maximise its viability.
A number of sowing methods will be employed at the quarry. These may include:
• hand seeding;
• broadcast seeding; and
• hydroseeding.
Hand seeding is likely to be used on small areas or where machinery access is difficult.
Broadcast seeding is likely be used for the establishment of cover crop and pasture species of flatter areas up to approximately 14°. This will be followed by harrowing using pasture harrows to lightly cover the seed with soil to ensure intimate soil contact. The rockiness of the soil generally precludes the use of drill seeding techniques.
On the pit walls and western side of Eulomogo Creek, native seed will be sowed using a hydro-seeder followed by the application of a straw-based hydro-mulch and hydro-colloid binder to protect the seed and soil from compact and erosion by rainfall and erosion from overland flow.
Cover crops will be used with all seeding activities to provide erosion protection and minimise the potential for weed invasion.
It may also be necessary to inoculate woodland rehabilitation areas with small quantities of fresh topsoil from adjacent open-woodland and open forest areas from within the project area to ensure necessary mycorrhizal fungi are present within the soil biology.
5.3 Erosion and sediment control
An assessment of soil erosion hazard was undertaken for the project in accordance with the requirements of Landcom 2004. This is described in Section 3.2.2 and ranges from very low to high. The key erosion risks for the project are:
• dispersible subsoils due to ESP and/or EMP; and
• steep gradients where the haul road crosses Eulomogo Creek and a steep fill batter associated with Domain 1 of the north-eastern side Eulomogo Creek.
Dispersive soils will be gypsum treated during the stripping process to reduce ESP and/or EMP to improve their electrochemical stability.
The greatest erosion risk during the rehabilitation phase will be the removal of the culvert in Eulomogo Creek and rehabilitation of the haul road either side of the culvert. These works should be undertaken during periods of low rainfall erosivity from April to September. An environmental work method statement including an erosion and sediment control plan will be prepared prior to undertaken these rehabilitation work to ensure risks are identified and appropriately managed and mitigated.
The floor of the WEA will drain to Pond 1 in the western pit and will ultimately be contained.
J180313 | RP#18 | v1 43
A sediment dam will be excavated south of Eulomogo Creek, adjacent to the southern haul road, at a lower elevation than the SEA to contain turbid runoff and this will be retained until approximately 60% soil surface cover has been achieved.
Based on observations of existing rehabilitation works in the west pit and the lack of rill erosion, annual average erosion rates of less than 2 tonnes per hectare per year (t/ha/y) and a peak erosion rate of less than 5t/ha/y should be achieved on the pit walls essentially reducing the erosion hazard to very low using a combination of rock/soil matrices and hydromulching.
Revegetation techniques as described in Section 5.2 will be varied to suit the erosion hazard of areas undergoing rehabilitation. For example, broadcast seeding is appropriate for the pit floors as the slope gradients are very low and significant erosion of the exposed soil awaiting grass germination is unlikely to occur, whereas it is unsuitable for the recontoured fill batter on the north-eastern side of Eulomogo Creek as the erosion and sedimentation risk is high and the costs associated with replacing the lost topsoil and seed would be very high.
Holcim will, therefore, aim to progressively rehabilitated disturbed areas as quickly as possible to minimise the risk of erosion and re-work.
A water management plan will be prepared for the project that will include an overarching erosion and sediment control plan. Progressive erosion and sediment control plans will then be prepared for discrete areas as required in accordance with the requirements of DECC 2008.
5.4 Post-closure maintenance
5.4.1 Rehabilitation monitoring
Rehabilitation monitoring will be undertaken annually once rehabilitation commences, using analogue sites and Landscape Function Analysis (LFA) to assess rehabilitation progress and success and an annual rehabilitation report will be prepared. A summary of which will be provided in the Annual Review.
Data obtained from the analogue sites will provide a range of values from replicated examples of similar vegetation communities. Rehabilitation areas are compared to reference sites that best represent the final land use, vegetation community and management conditions they will be subjected to.
This approach allows the recognition of the dynamic nature of ecosystems and, therefore, rehabilitation sites will be monitored simultaneously to the reference sites over time to account for changes in:
1. seasonal variations;
2. climatic conditions;
3. management practices; and
4. unexpected disturbance events such bushfire.
In order to demonstrate rehabilitate success, or succession toward rehabilitation success, specific indicators will be expected to equal or exceed values obtained from the reference site under the same set of conditions or demonstrate a positive trend towards target values.
All domains will have all or part grazing post-mining land use. Holcim will include grazing productivity parameters in the rehabilitation monitoring program.
J180313 | RP#18 | v1 44
Rehabilitation monitoring will inform areas requiring maintenance and identify and address deviations from the expected outcomes. Rehabilitated areas will be assessed against performance indicators (refer Section 6) and regularly (at least on an annual basis) inspected for the following aspects:
• evidence of any erosion or sedimentation;
• success of initial establishment cover;
• natural regeneration of improved pasture;
• weed infestation (primarily noxious weeds, but also where rehabilitation areas are dominated by other weeds);
• integrity of drainage, erosion and sediment control structures; and
• general stability of the rehabilitation areas.
Where rehabilitation criteria have not been met, maintenance works will be undertaken. This may include the following:
• re-seeding and, where necessary, re-soiling and/or the application of specialised treatments;
• use of materials such as composted mulch to areas with poor vegetation establishment;
• replacement of drainage controls if they are found to be inadequate for their intended purpose, or compromised by vegetation or wildlife; and
• de-silting or repair of sediment control structures.
5.4.2 Weed management
The presence of weed species has the potential to majorly impact on revegetation outcomes. Additionally, any significant weed species within the surrounding land has the potential to impact on the success of the rehabilitated areas. Therefore, weed management will be an important component of rehabilitation activities.
The spread of declared noxious weeds (and other invasive weeds that could impact revegetation success and/or plants that are undesirable to grazing stock) will be managed across the project area through a series of control measures, including:
• herbicide spraying or scalping weeds;
• post-quarrying use of rehabilitated areas as a working farm, with associated management practices; and
• rehabilitation inspections to identify potential weed infestations.
5.4.3 Access
Access tracks may be required to facilitate the revegetation and ongoing maintenance of the project. These tracks will be kept to a practical minimum and will be designated prior to the completion of the project.
J180313 | RP#18 | v1 45
5.4.4 Public safety
Controls will be implemented to minimise the potential for impacts on public safety, and may include maintenance of fencing and warning signs around areas that have the potential to cause harm and are that are accessible to the public. Permanent bunding of the quarry pits are not anticipated due to the planned regrading to a safe and stable gradient of 18° which is trafficable by farm machinery and agricultural equipment such as quad bikes.
An assessment of the regraded pit walls will be undertaken to determine if there are any large rocks present that may provide a safety risk post closure of the quarry.
5.4.5 Rehabilitation resources
The Quarry Manager will be responsible for achieving the rehabilitation criteria.
A rehabilitation management plan will be developed to provide a structured and documented process for managing and improving rehabilitation activities at the quarry. The plan will serve as a process map for interdepartmental administration of rehabilitation activities within the quarry planning and implementation process.
The rehabilitation management plan will have two focus areas.
1. The integration of rehabilitation activates between the various departments within the quarry organisational structure through all stages of the rehabilitation process. To achieve this, the rehabilitation management plan will separate the rehabilitation process into different phases and outline responsibilities at each stage with hold and witness points.
2. The second focus is on establishing effective and robust monitoring methods with clear guidelines on the process to be followed to achieve quarry rehabilitation objectives, and a means to record the process followed and results obtained.
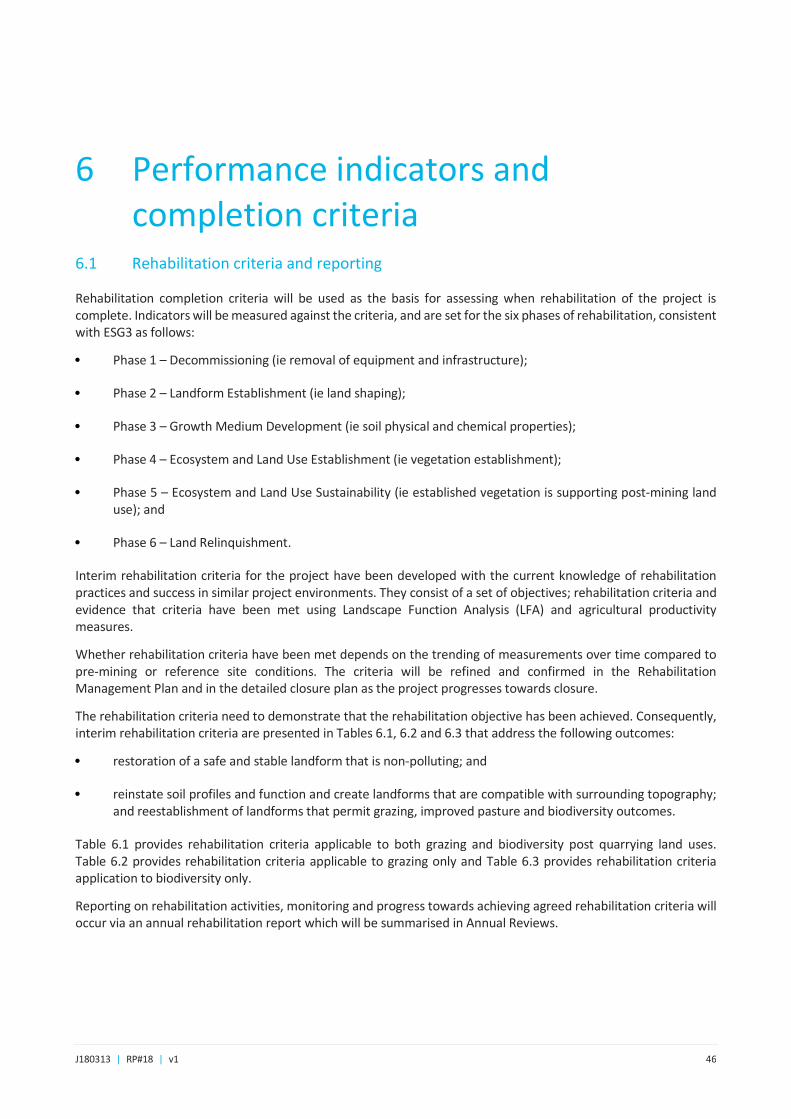
J180313 | RP#18 | v1 46
6 Performance indicators and completion criteria
6.1 Rehabilitation criteria and reporting
Rehabilitation completion criteria will be used as the basis for assessing when rehabilitation of the project is complete. Indicators will be measured against the criteria, and are set for the six phases of rehabilitation, consistent with ESG3 as follows:
• Phase 1 – Decommissioning (ie removal of equipment and infrastructure);
• Phase 2 – Landform Establishment (ie land shaping);
• Phase 3 – Growth Medium Development (ie soil physical and chemical properties);
• Phase 4 – Ecosystem and Land Use Establishment (ie vegetation establishment);
• Phase 5 – Ecosystem and Land Use Sustainability (ie established vegetation is supporting post-mining land use); and
• Phase 6 – Land Relinquishment.
Interim rehabilitation criteria for the project have been developed with the current knowledge of rehabilitation practices and success in similar project environments. They consist of a set of objectives; rehabilitation criteria and evidence that criteria have been met using Landscape Function Analysis (LFA) and agricultural productivity measures.
Whether rehabilitation criteria have been met depends on the trending of measurements over time compared to pre-mining or reference site conditions. The criteria will be refined and confirmed in the Rehabilitation Management Plan and in the detailed closure plan as the project progresses towards closure.
The rehabilitation criteria need to demonstrate that the rehabilitation objective has been achieved. Consequently, interim rehabilitation criteria are presented in Tables 6.1, 6.2 and 6.3 that address the following outcomes:
• restoration of a safe and stable landform that is non-polluting; and
• reinstate soil profiles and function and create landforms that are compatible with surrounding topography; and reestablishment of landforms that permit grazing, improved pasture and biodiversity outcomes.
Table 6.1 provides rehabilitation criteria applicable to both grazing and biodiversity post quarrying land uses. Table 6.2 provides rehabilitation criteria applicable to grazing only and Table 6.3 provides rehabilitation criteria application to biodiversity only.
Reporting on rehabilitation activities, monitoring and progress towards achieving agreed rehabilitation criteria will occur via an annual rehabilitation report which will be summarised in Annual Reviews.
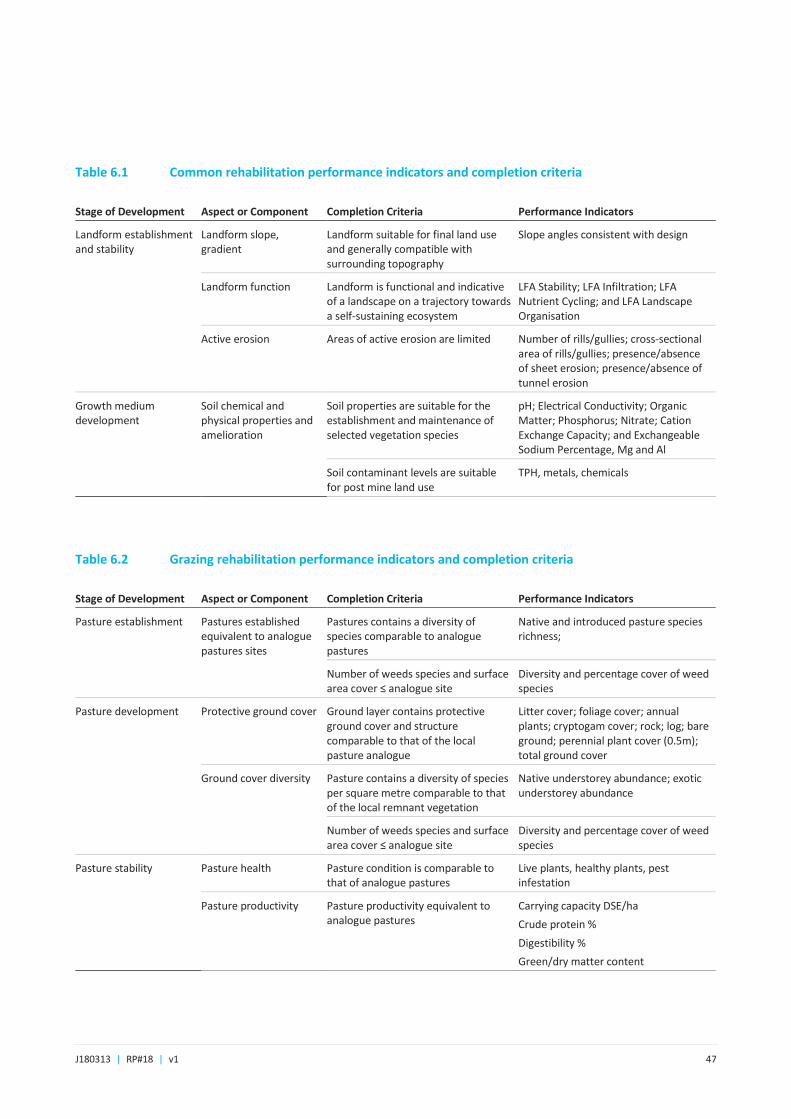
J180313 | RP#18 | v1 47
Table 6.1 Common rehabilitation performance indicators and completion criteria
Stage of Development Aspect or Component Completion Criteria Performance Indicators
Landform establishment and stability
Landform slope, gradient
Landform suitable for final land use and generally compatible with surrounding topography
Slope angles consistent with design
Landform function Landform is functional and indicative of a landscape on a trajectory towards a self-sustaining ecosystem
LFA Stability; LFA Infiltration; LFA Nutrient Cycling; and LFA Landscape Organisation
Active erosion Areas of active erosion are limited Number of rills/gullies; cross-sectional area of rills/gullies; presence/absence of sheet erosion; presence/absence of tunnel erosion
Growth medium development
Soil chemical and physical properties and amelioration
Soil properties are suitable for the establishment and maintenance of selected vegetation species
pH; Electrical Conductivity; Organic Matter; Phosphorus; Nitrate; Cation Exchange Capacity; and Exchangeable Sodium Percentage, Mg and Al
Soil contaminant levels are suitable for post mine land use
TPH, metals, chemicals
Table 6.2 Grazing rehabilitation performance indicators and completion criteria
Stage of Development Aspect or Component Completion Criteria Performance Indicators
Pasture establishment Pastures established equivalent to analogue pastures sites
Pastures contains a diversity of species comparable to analogue pastures
Native and introduced pasture species richness;
Number of weeds species and surface area cover ≤ analogue site
Diversity and percentage cover of weed species
Pasture development Protective ground cover Ground layer contains protective ground cover and structure comparable to that of the local pasture analogue
Litter cover; foliage cover; annual plants; cryptogam cover; rock; log; bare ground; perennial plant cover (0.5m); total ground cover
Ground cover diversity Pasture contains a diversity of species per square metre comparable to that of the local remnant vegetation
Native understorey abundance; exotic understorey abundance
Number of weeds species and surface area cover ≤ analogue site
Diversity and percentage cover of weed species
Pasture stability Pasture health Pasture condition is comparable to that of analogue pastures
Live plants, healthy plants, pest infestation
Pasture productivity Pasture productivity equivalent to analogue pastures
Carrying capacity DSE/ha
Crude protein %
Digestibility %
Green/dry matter content
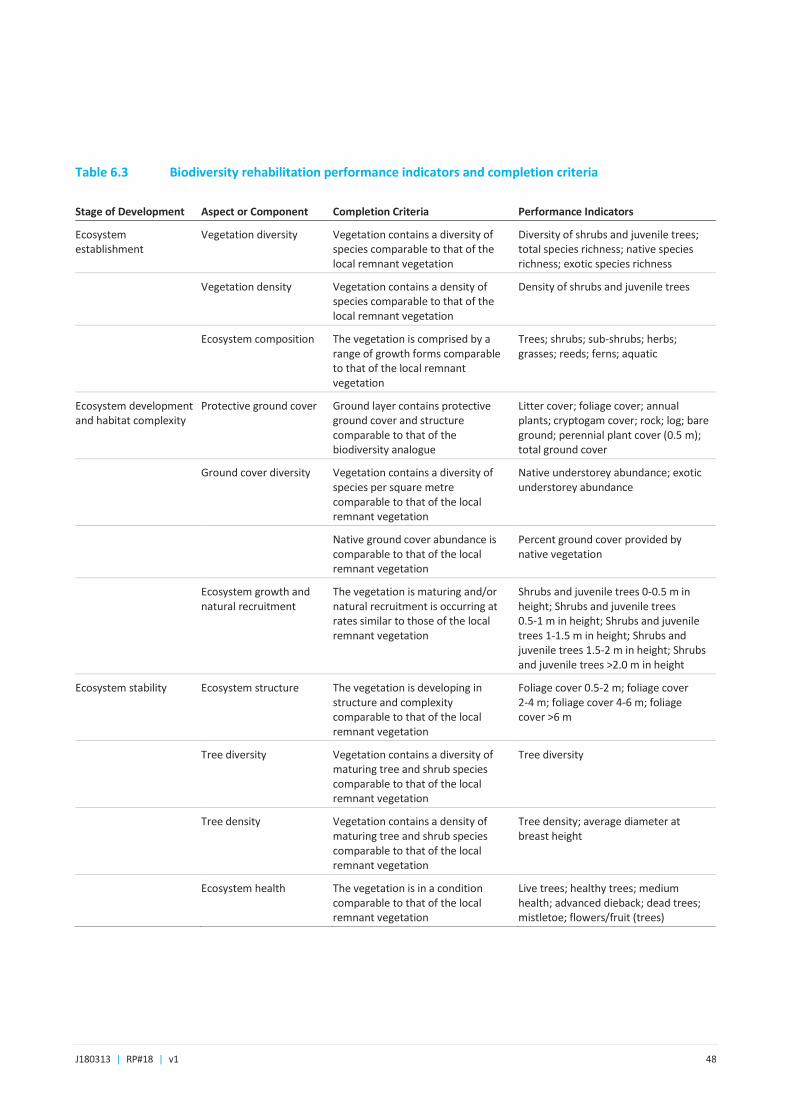
J180313 | RP#18 | v1 48
Table 6.3 Biodiversity rehabilitation performance indicators and completion criteria
Stage of Development Aspect or Component Completion Criteria Performance Indicators
Ecosystem establishment
Vegetation diversity Vegetation contains a diversity of species comparable to that of the local remnant vegetation
Diversity of shrubs and juvenile trees; total species richness; native species richness; exotic species richness
Vegetation density Vegetation contains a density of species comparable to that of the local remnant vegetation
Density of shrubs and juvenile trees
Ecosystem composition The vegetation is comprised by a range of growth forms comparable to that of the local remnant vegetation
Trees; shrubs; sub-shrubs; herbs; grasses; reeds; ferns; aquatic
Ecosystem development and habitat complexity
Protective ground cover Ground layer contains protective ground cover and structure comparable to that of the biodiversity analogue
Litter cover; foliage cover; annual plants; cryptogam cover; rock; log; bare ground; perennial plant cover (0.5 m); total ground cover
Ground cover diversity Vegetation contains a diversity of species per square metre comparable to that of the local remnant vegetation
Native understorey abundance; exotic understorey abundance
Native ground cover abundance is comparable to that of the local remnant vegetation
Percent ground cover provided by native vegetation
Ecosystem growth and natural recruitment
The vegetation is maturing and/or natural recruitment is occurring at rates similar to those of the local remnant vegetation
Shrubs and juvenile trees 0-0.5 m in height; Shrubs and juvenile trees 0.5-1 m in height; Shrubs and juvenile trees 1-1.5 m in height; Shrubs and juvenile trees 1.5-2 m in height; Shrubs and juvenile trees >2.0 m in height
Ecosystem stability Ecosystem structure The vegetation is developing in structure and complexity comparable to that of the local remnant vegetation
Foliage cover 0.5-2 m; foliage cover 2-4 m; foliage cover 4-6 m; foliage cover >6 m
Tree diversity Vegetation contains a diversity of maturing tree and shrub species comparable to that of the local remnant vegetation
Tree diversity
Tree density Vegetation contains a density of maturing tree and shrub species comparable to that of the local remnant vegetation
Tree density; average diameter at breast height
Ecosystem health The vegetation is in a condition comparable to that of the local remnant vegetation
Live trees; healthy trees; medium health; advanced dieback; dead trees; mistletoe; flowers/fruit (trees)

J180313 | RP#18 | v1 49
6.2 Rehabilitation monitoring and research
6.2.1 Monitoring methodology
As proposed rehabilitation works require the establishment of pastures and woodland areas, the rehabilitation monitoring methodology adopted needs to be sufficiently flexible and capable of providing meaningful information of rehabilitation trajectories and when intervention is required.
A combination of LFA and agricultural productivity analysis is an appropriate and generally accepted rehabilitation monitoring methodology for demonstrating the success of rehabilitation works and providing meaningful guidance where intervention is required. However, the specific monitoring methods applied will be determined in the rehabilitation management plan and will be flexible in consideration of advancing technologies and changes to industry best practice.
6.2.2 Frequency of monitoring
It is expected that formal rehabilitation monitoring will be undertaken annually during operations and for approximately five years following quarry closure (or less if the rehabilitation criteria have been met). At this time, a review of the monitoring frequency will be undertaken based on the performance of the revegetation and an appropriate monitoring frequency determined. The frequency will be determined by a suitably qualified person(s) and in consultation with the relevant regulatory authorities.
Informal monitoring of rehabilitation by quarry personnel will also be undertaken.
6.2.3 Analogue sites
Representative analogue sites will be established for grazing areas and woodland communities. These will be identified in the Rehabilitation Management Plan.
6.2.4 Rehabilitation monitoring
Permanent transacts and quadrats will be established for rehabilitation monitoring in analogue and rehabilitation areas over time. These will include permanent photo monitoring points.
The monitoring results will be used to assess whether rehabilitation areas are on a trajectory towards a self-sustaining landscape.
Soil samples will be taken using a core sampler within a monitoring quadrat at each rehabilitation monitoring site and soil samples will be sent to a National Association of Testing Authorities (NATA) accredited laboratory for analysis. Soil samples are analysed for the following parameters: pH, electrical conductivity, available calcium, magnesium, potassium, ammonia, sulphur, organic matter, exchangeable sodium, calcium, magnesium, potassium, hydrogen, aluminium, cation exchange capacity, available and extractable phosphorus, micronutrients (zinc, manganese, iron, copper, boron) and total carbon and nitrogen. Exchangeable sodium percentages are also calculated to determine sodicity and soil dispersion.
The parameters to be tested are likely to reduce over time as a better understanding of project soils and the key parameters are understood.
For the native woodland and riparian rehabilitation, various biodiversity components will be assessed to monitor the successional phases/changes of plant development and to identify the requirements for ameliorative measures and guide adaptive management.
J180313 | RP#18 | v1 50
Rapid ecological assessment techniques will be used to provides quantitative data that measures changes in:
• floristic diversity including species area curves and growth forms (using full floristic sampling);
• ground cover diversity and abundance;
• vegetation structure and habitat characteristics (including ground cover, cryptogams, logs, rocks, litter, projected foliage cover at various height increments);
• understorey density and growth (including established shrubs, direct seeding and tube stock plantings and tree regeneration);
• overstorey characteristics including tree density, health and survival; and
• other habitat attributes such as the presence of hollows, mistletoe and the production of buds, flowers and fruit. Permanent transects and photo-points (as described below) have been established to record changes in these attributes over time.
As large portions of the site will be returned to a grazing post-mine land use, rehabilitation monitoring will also include indicators of grazing productivity such as:
• stock carrying capacity;
• pasture crude protein levels;
• digestibility; and
• dry matter content.
6.2.5 Research and continual improvement
Knowledge of appropriate rehabilitation practices required to achieve the rehabilitation objectives is continually growing. Holcim have engaged with industry specialists in the development of rehabilitation designs and techniques through the EIS development process and will consult with various experts as required during the operational, rehabilitation and closure phases of the project to address any rehabilitation and closure knowledge gaps.
J180313 | RP#18 | v1 51
References Australian and New Zealand Minerals and Energy Council (ANZMEC) and Minerals Council of Australia (MCA) 2000, The Strategic Framework for Mine Closure.
AS/NZS ISO 3100:2009 Risk Management - Principles and Guidelines.
Carson, J., Harley, L K,. and Gleeson D 2012 Adding Value to Organic Pasture Microbes and minerals RIRDC Publication No. 12/069 Rural Industries Research and Development Corporation.
Commonwealth of Australia 2006, Mine Closure and Completion – Leading Practice Sustainable Development Program for the Mining Industry.
Commonwealth of Australia 2006, Mine Rehabilitation – Leading Practice Sustainable Development.
Department of Environment and Climate Change 2008 Managing Urban Stormwater Soils and Construction Volume 2E Mines and quarries.
Landloch 2019, Holcim Quarry Dubbo: Land and Soil Capability Assessment July 2019.
NSW Department of Trade and Investment – Division of Resources and Energy, September 2013, ESG3 Mining Operations Plan (MOP) Guidelines.
Loch,. R, Slater, B.K, and Devoil, 1998, C Soil erodibility (Km) values for some Australian soils Australian Journal of Soil Research.
Landcom 2004, Managing Urban Stormwater Soils and Construction Volume 1 4th edition and Volume 2E.
OEH 2012, 2nd Edition, The land and soil capability assessment scheme: second approximation.
Xstract mining consultants, 2017 Dubbo Quarry Ground Control Management Plan prepared for Holcim Australia November 2017.
Yang X, Gray JM, Chapman G, Zhu Q, Tulau M and McInnes-Clarke S 2017, Digital mapping of soil erodibility for water erosion in New South Wales, Australia. In: Soil Research Vol. 56 No. 2, January 2017.
Appendix ALand and soil capability assesment
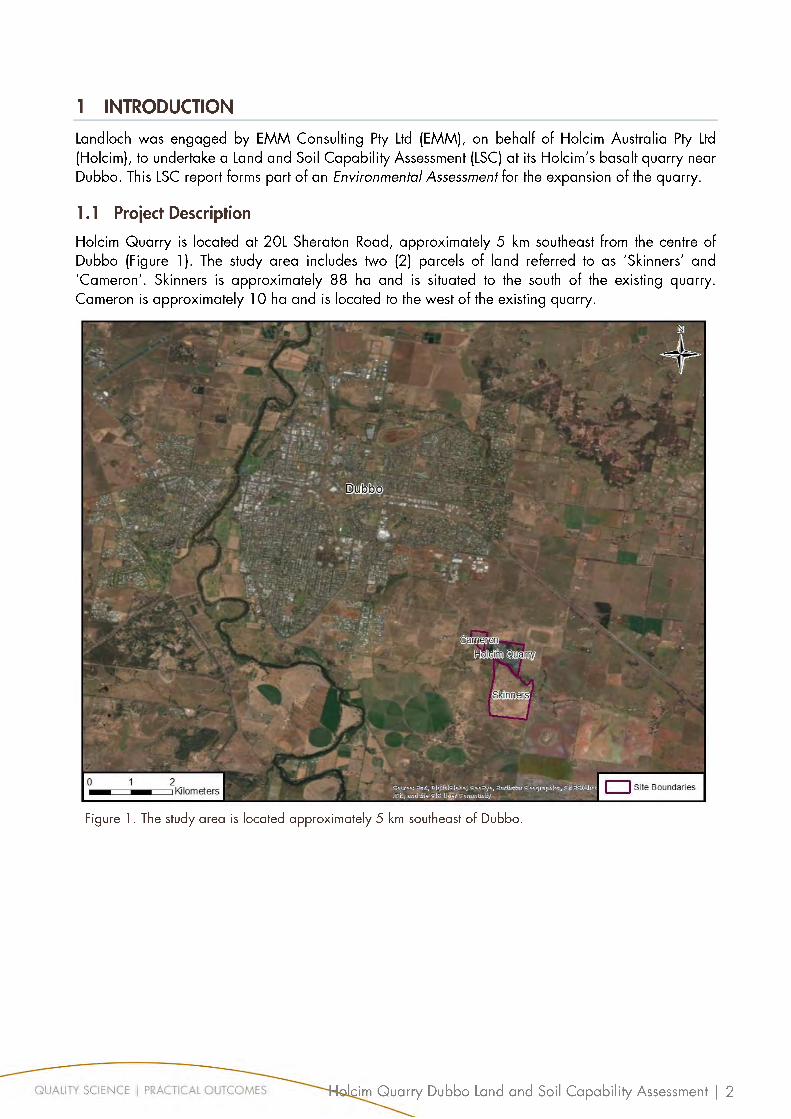
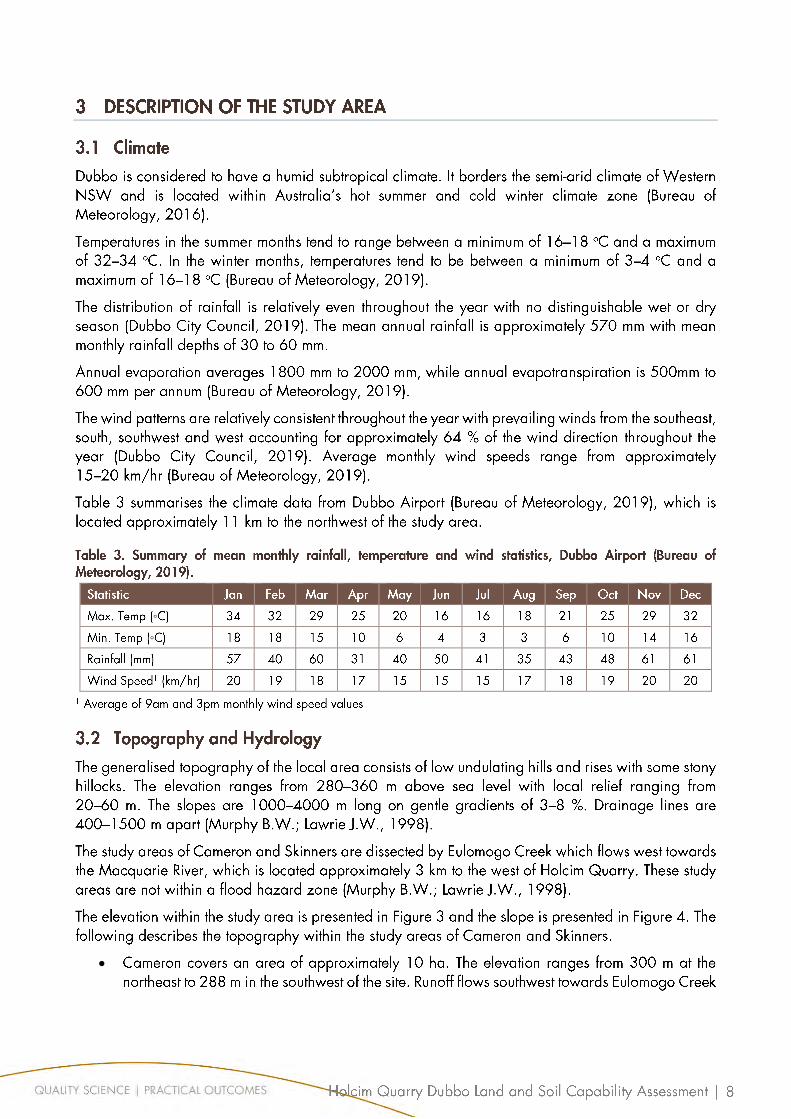
◦
◦
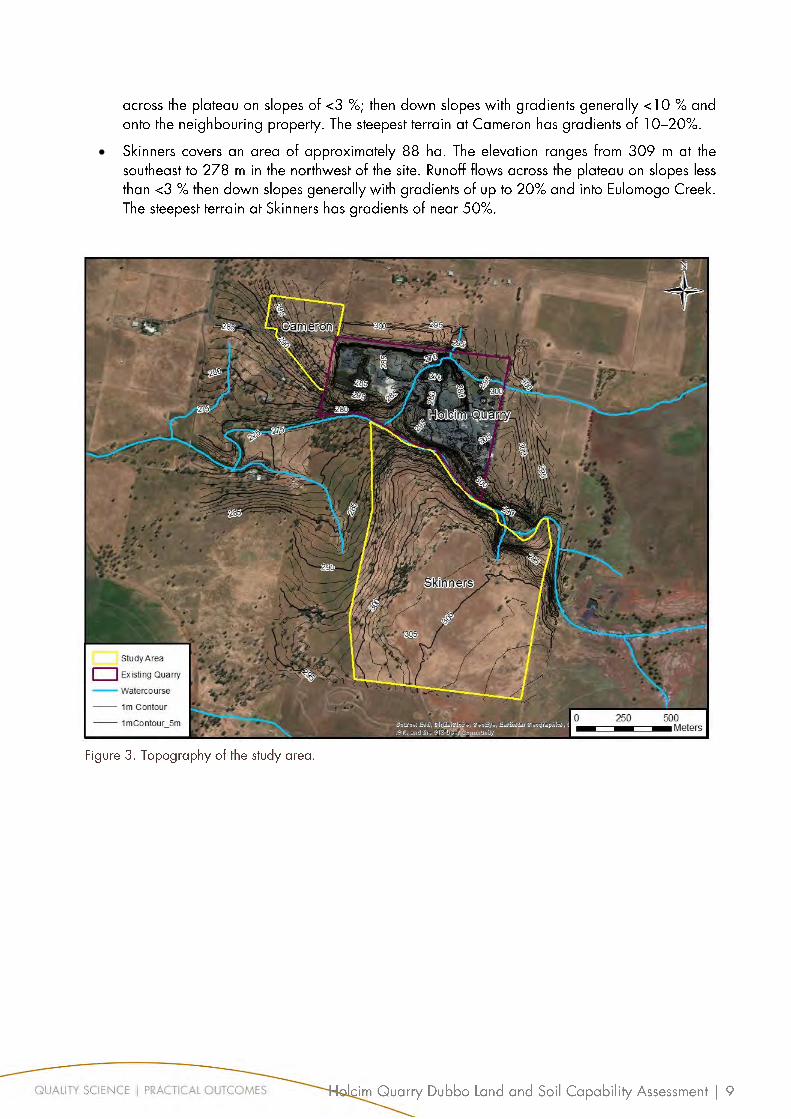
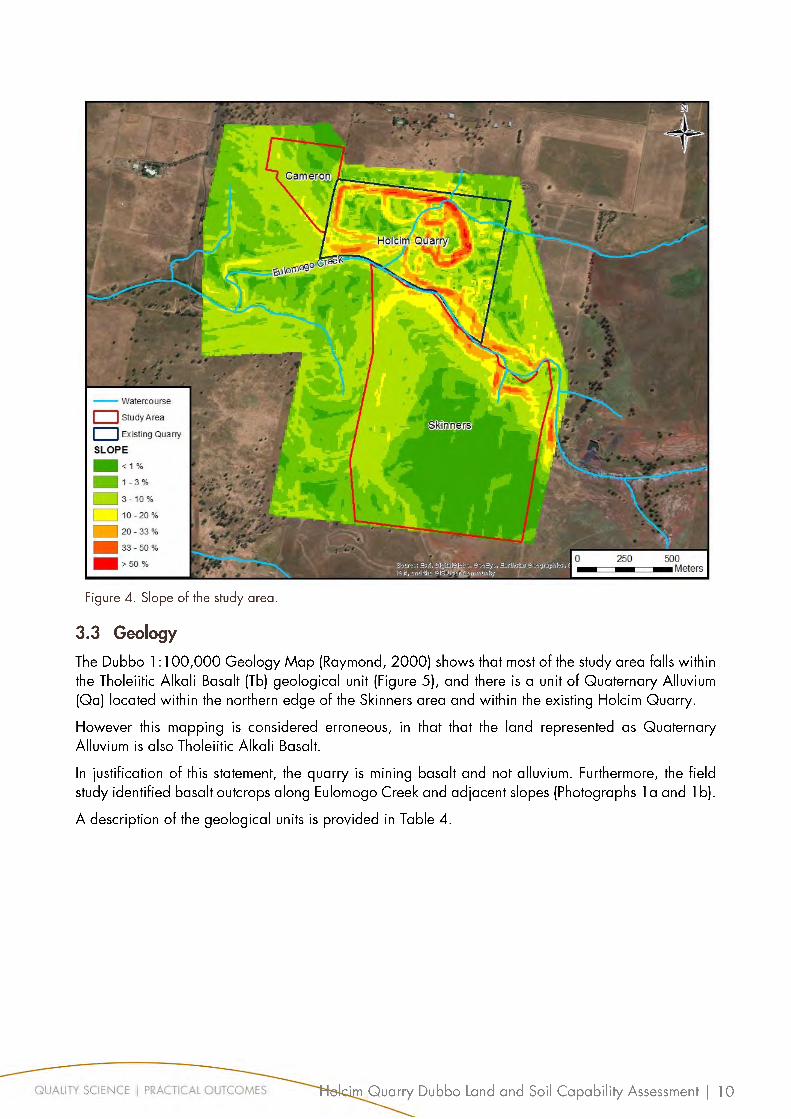
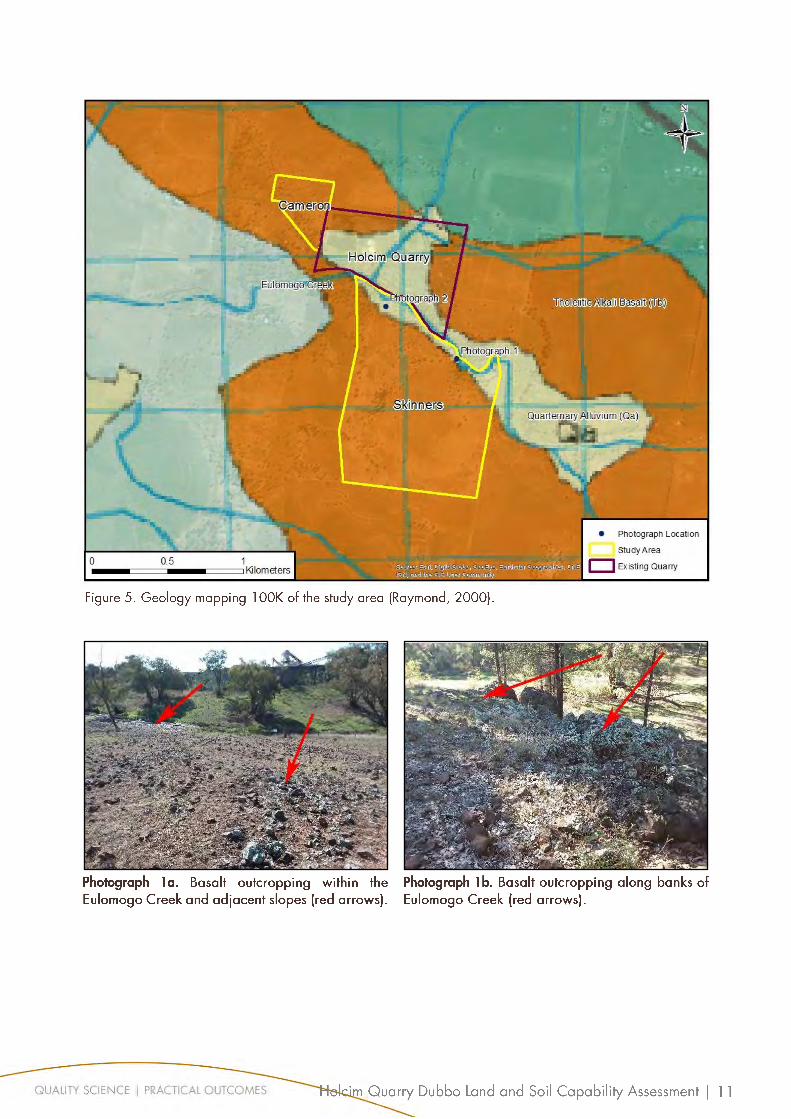
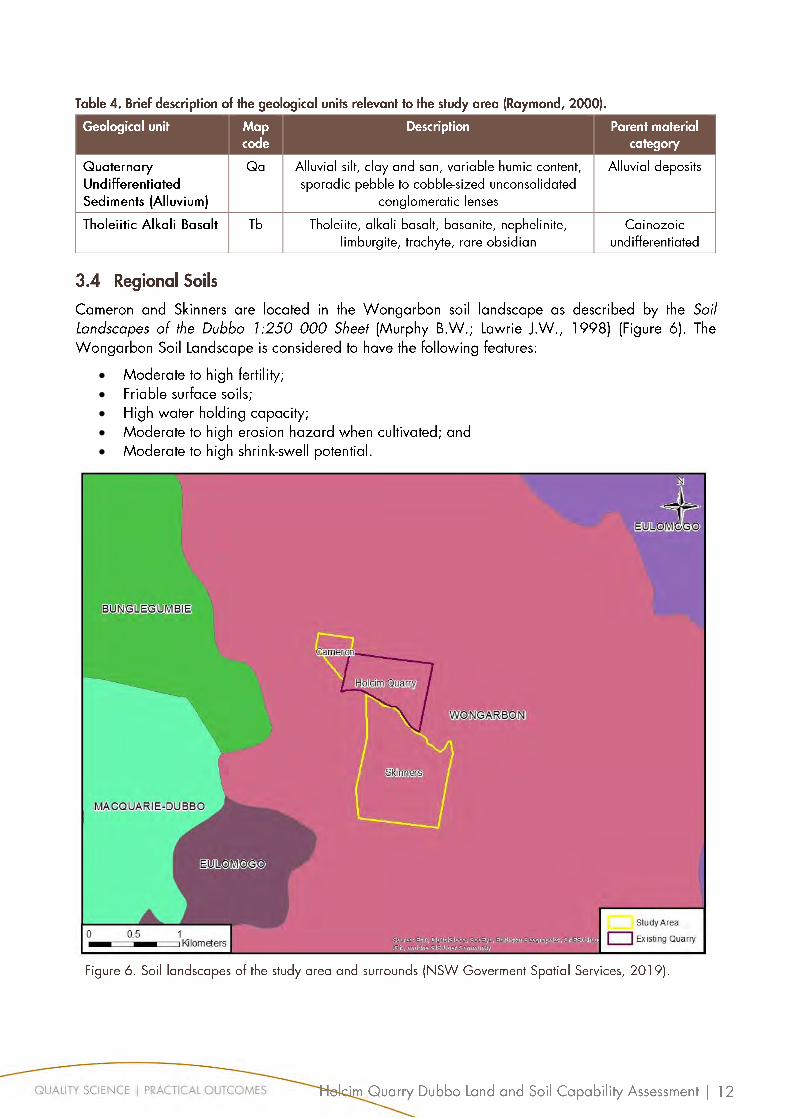
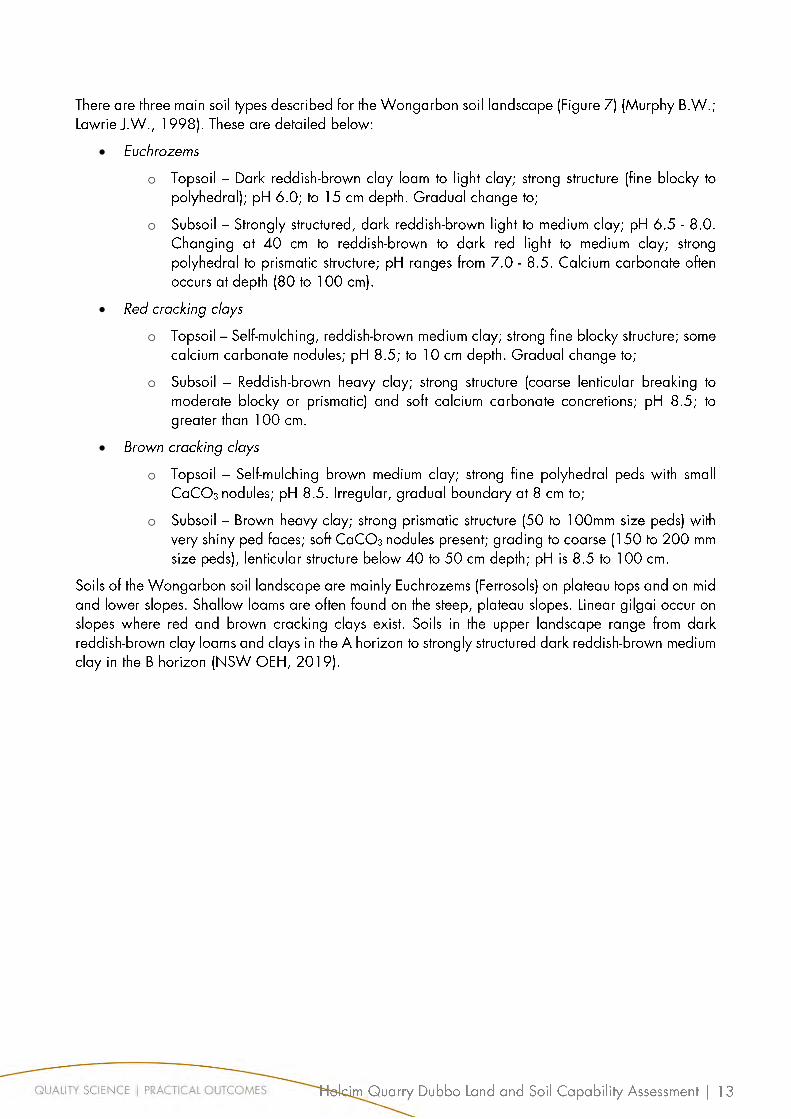
o
o
o
o
o
o
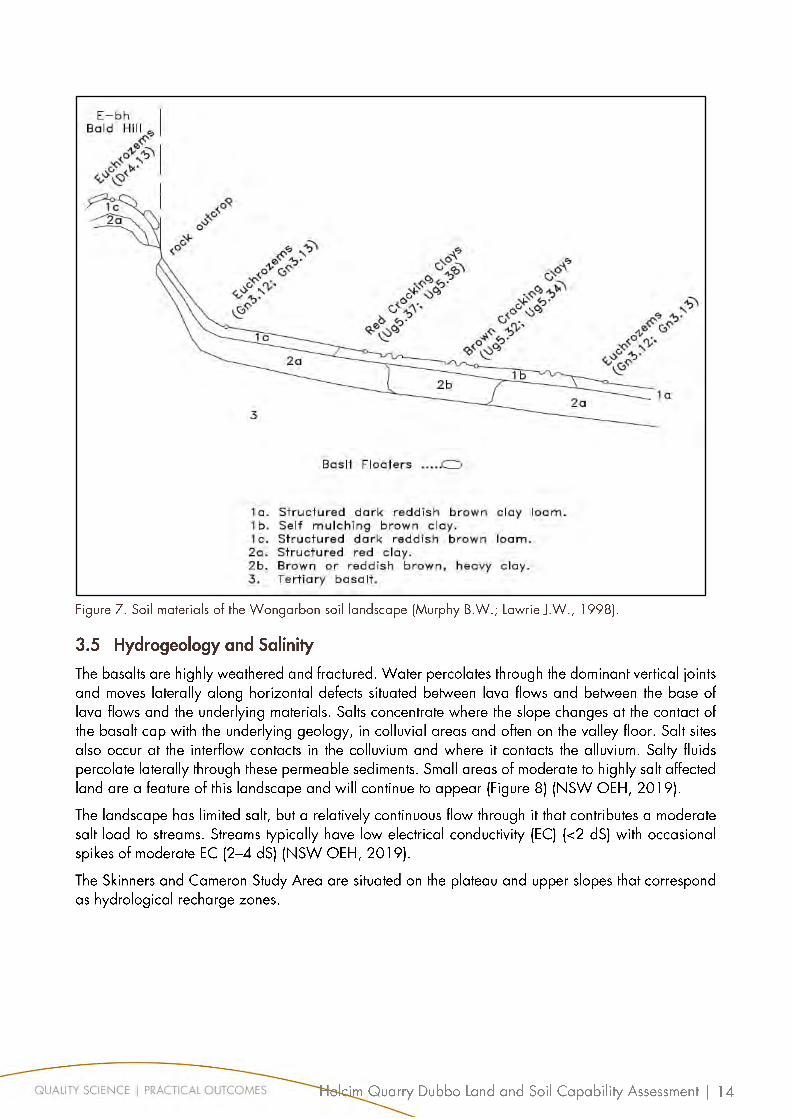
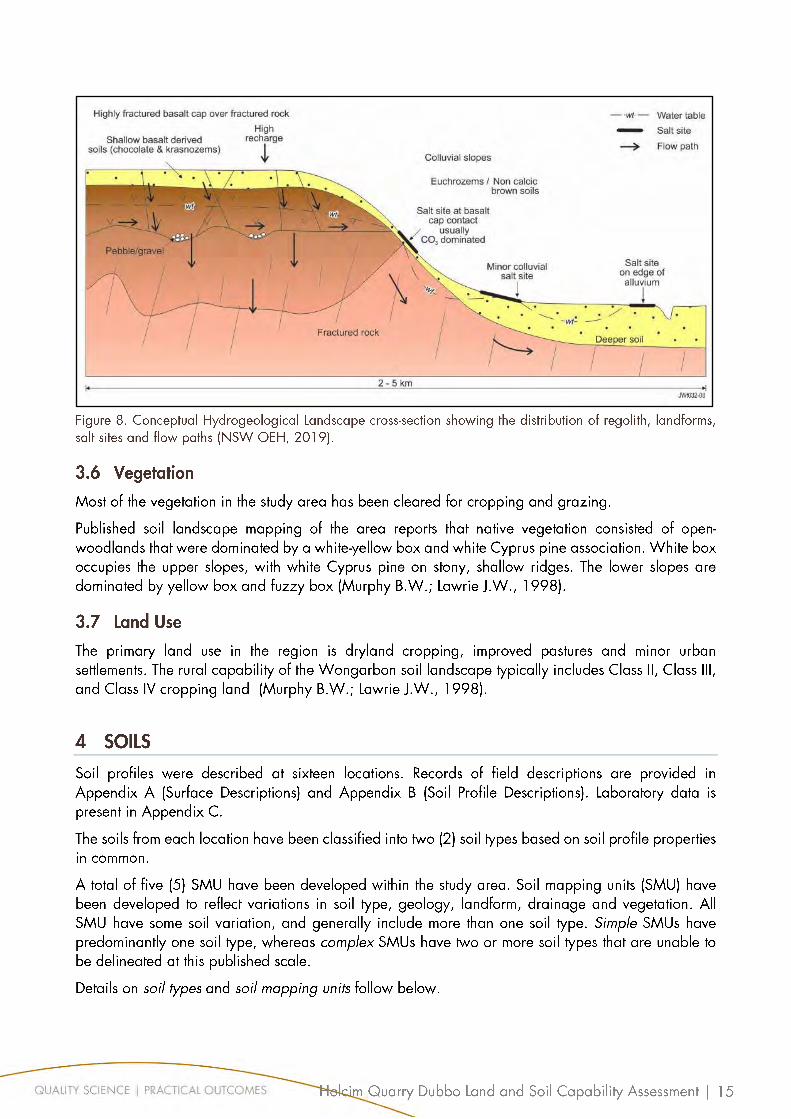
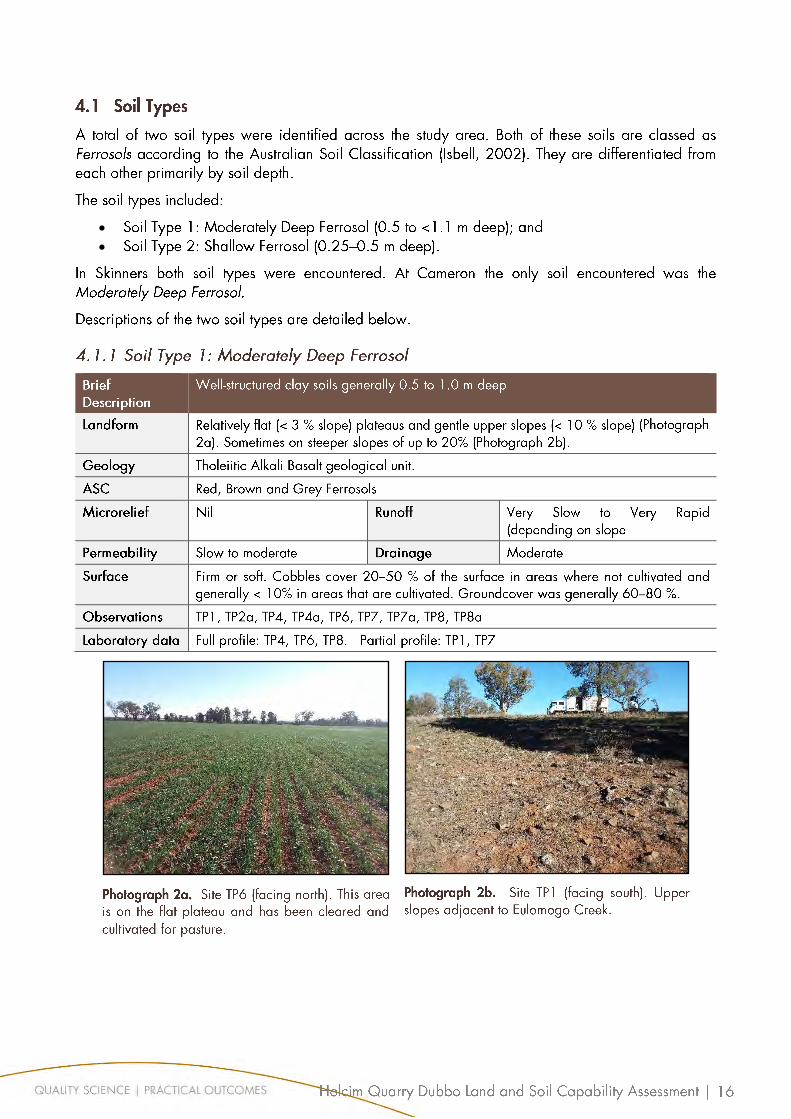
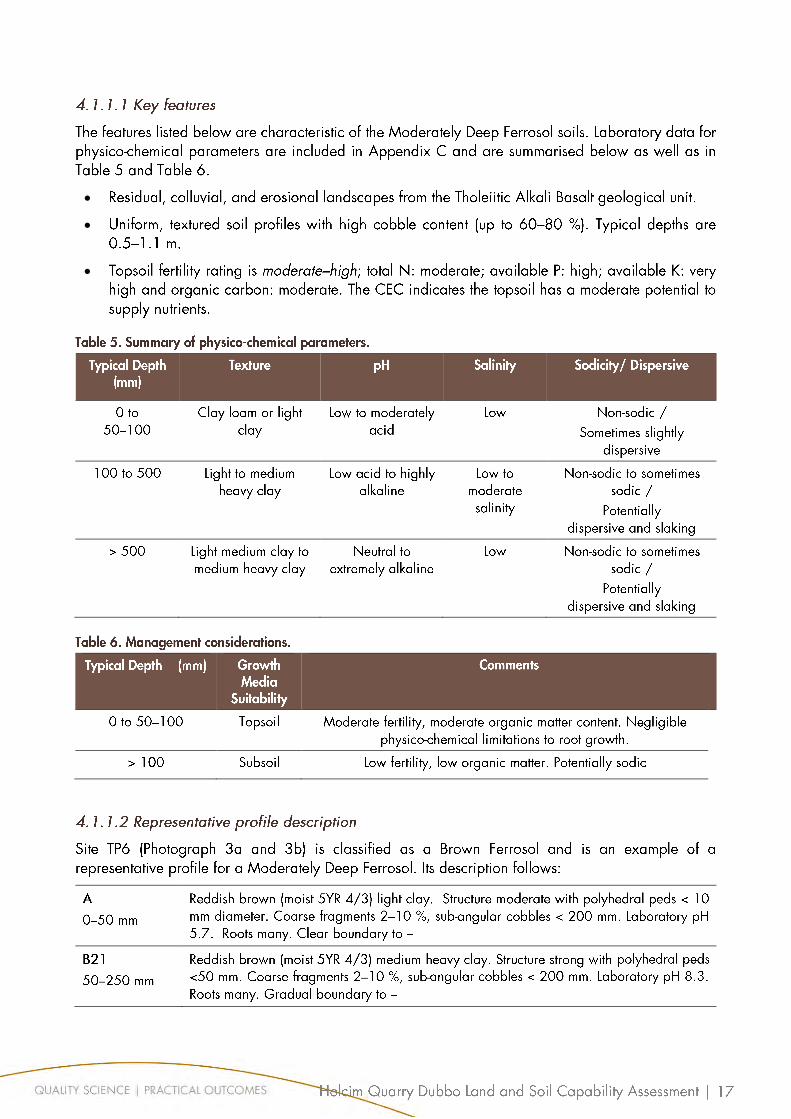
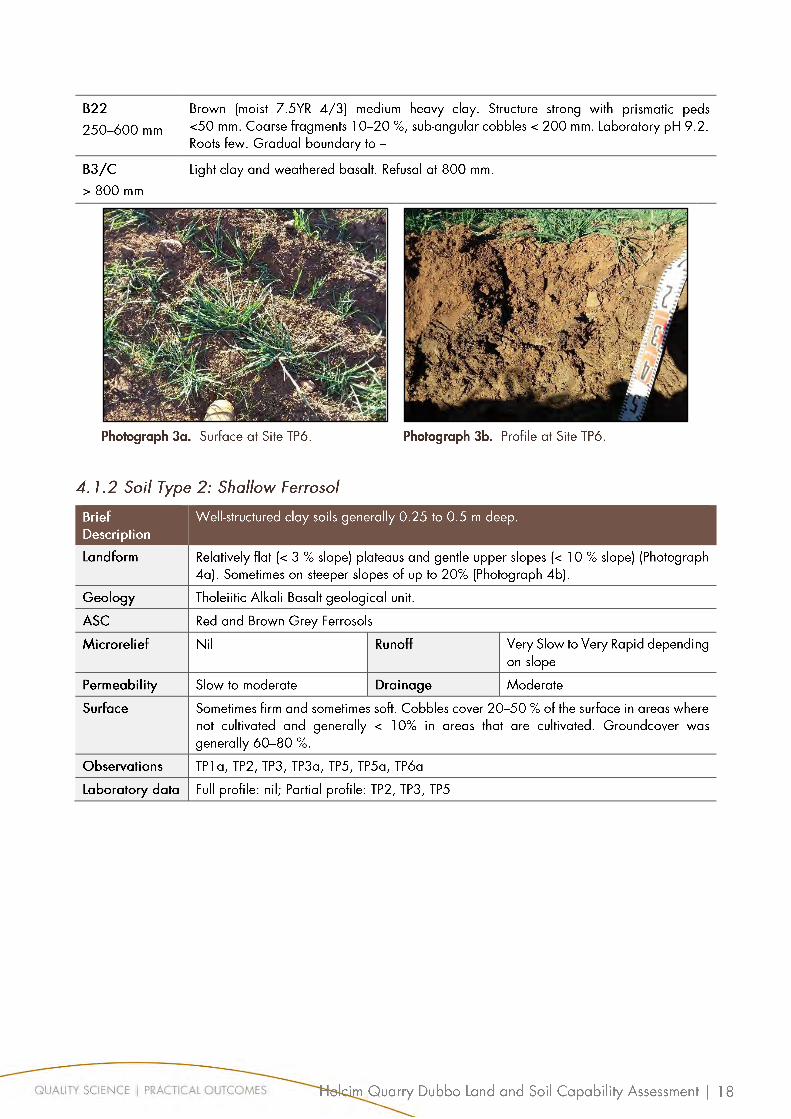
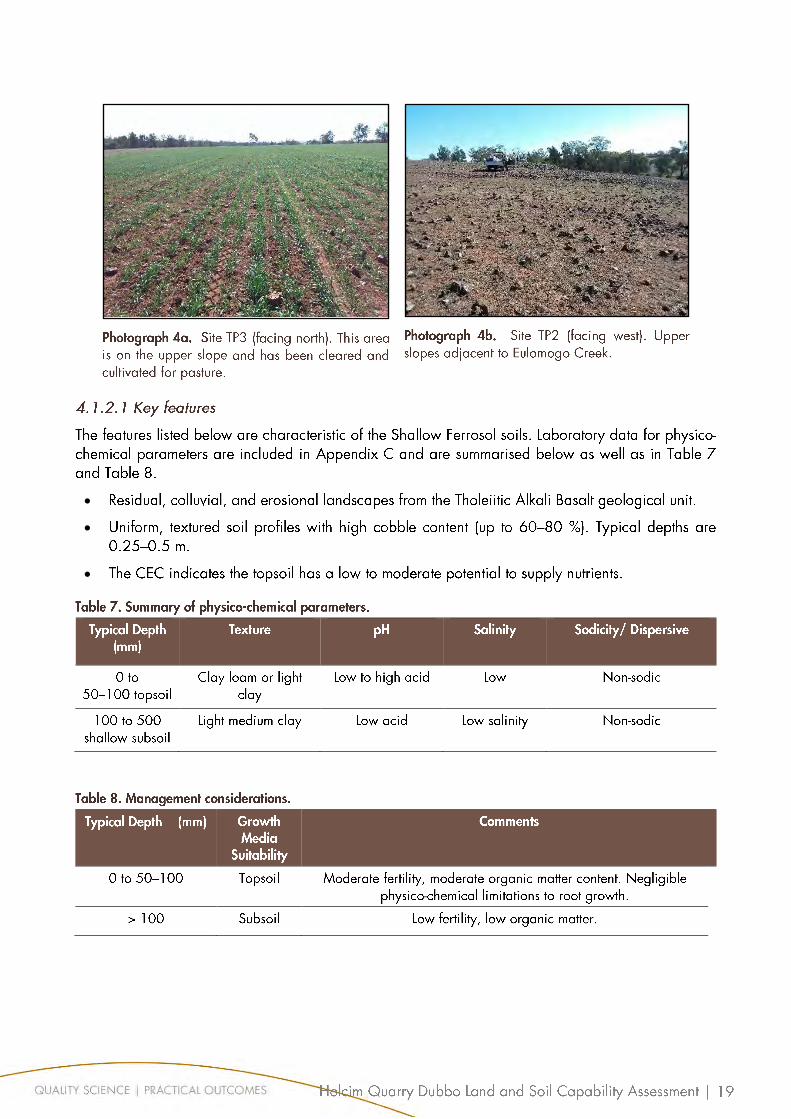
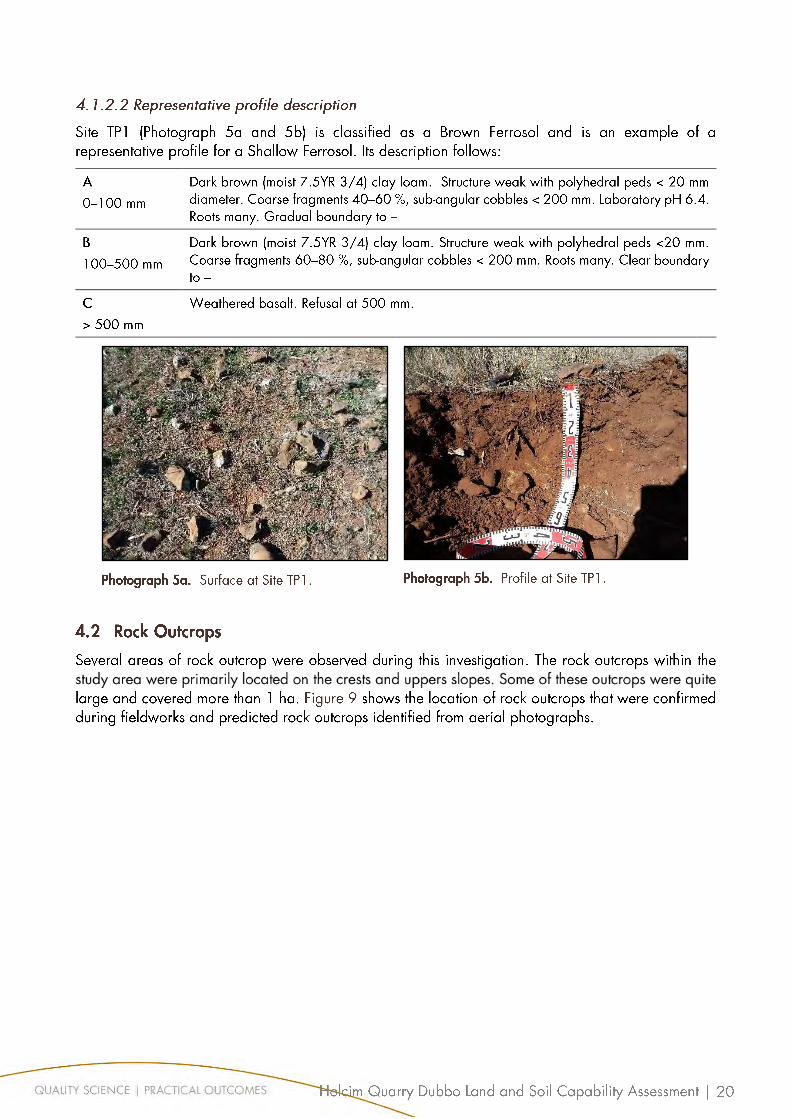
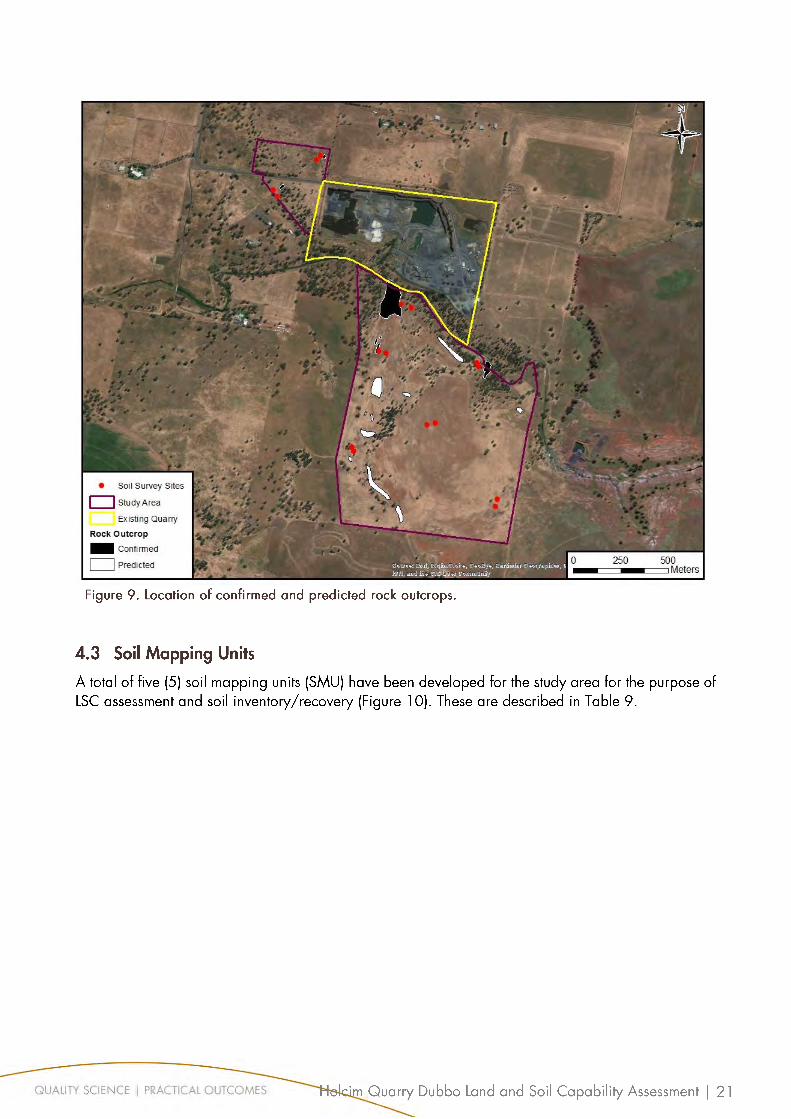
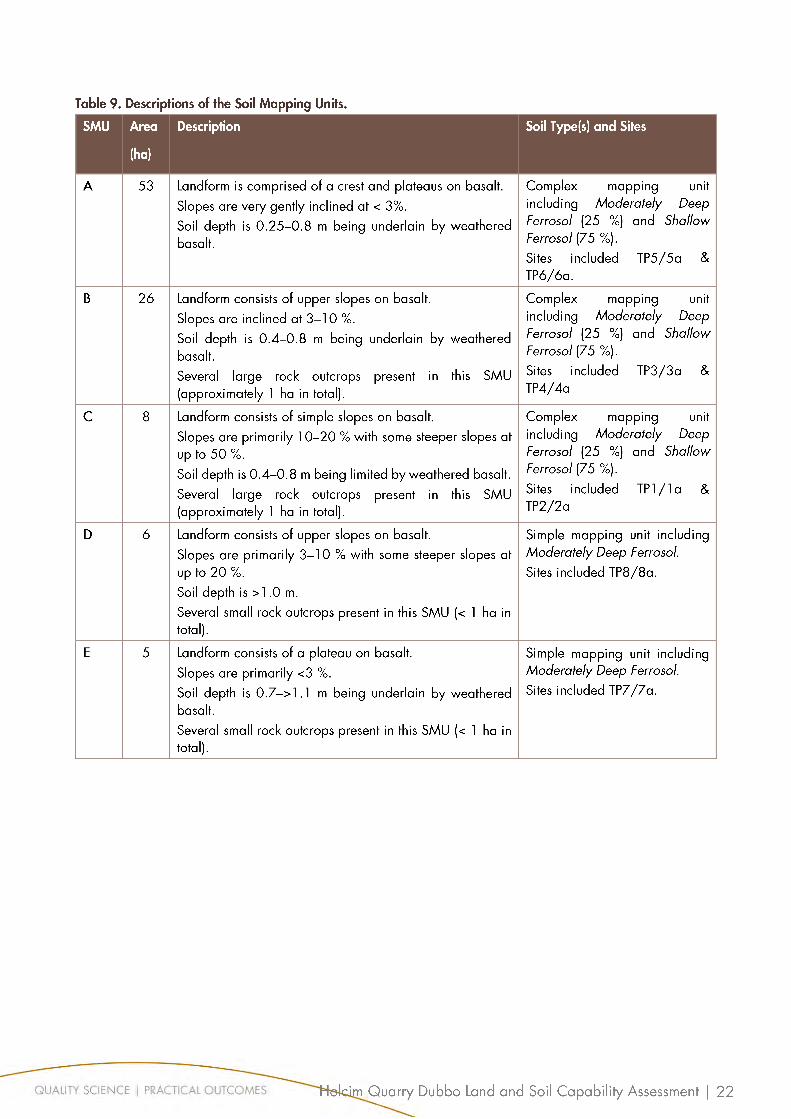
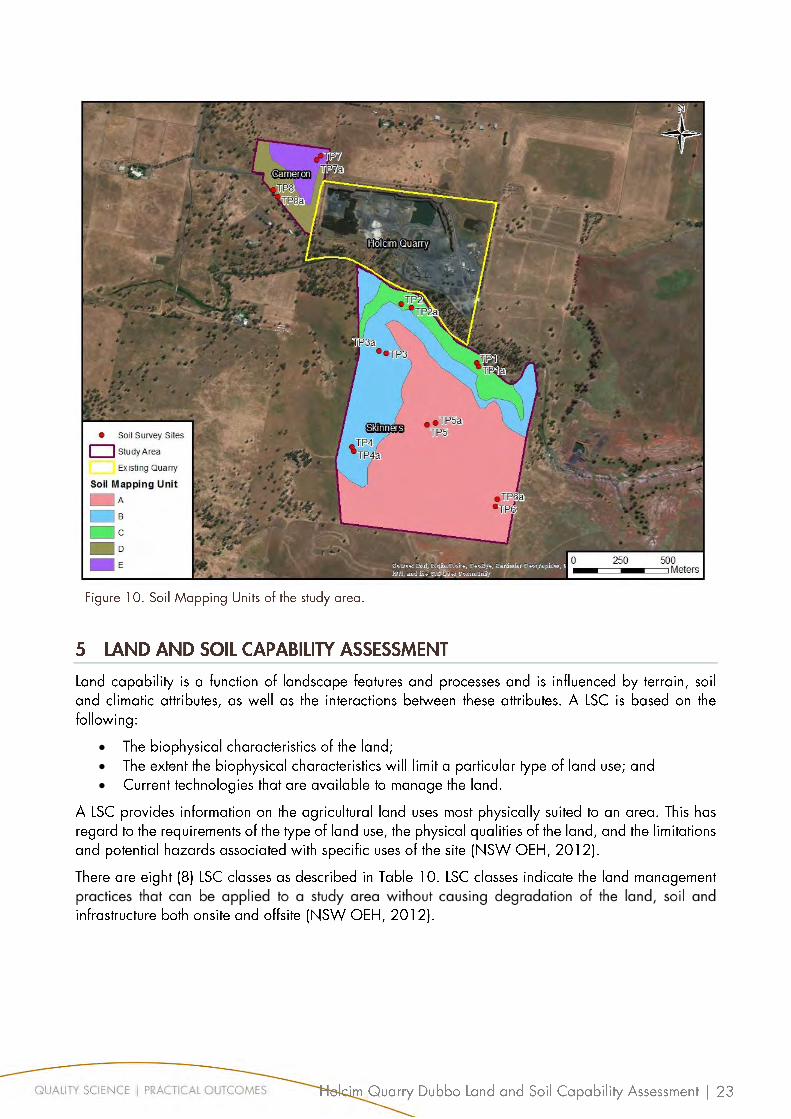
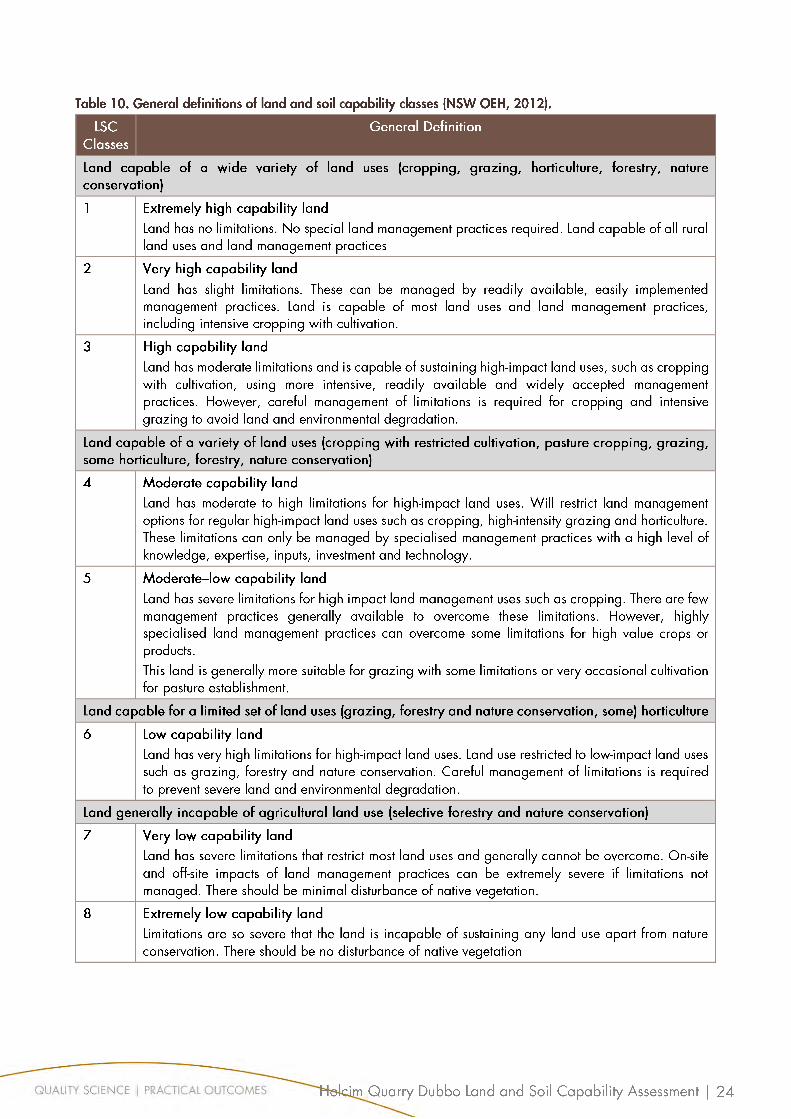
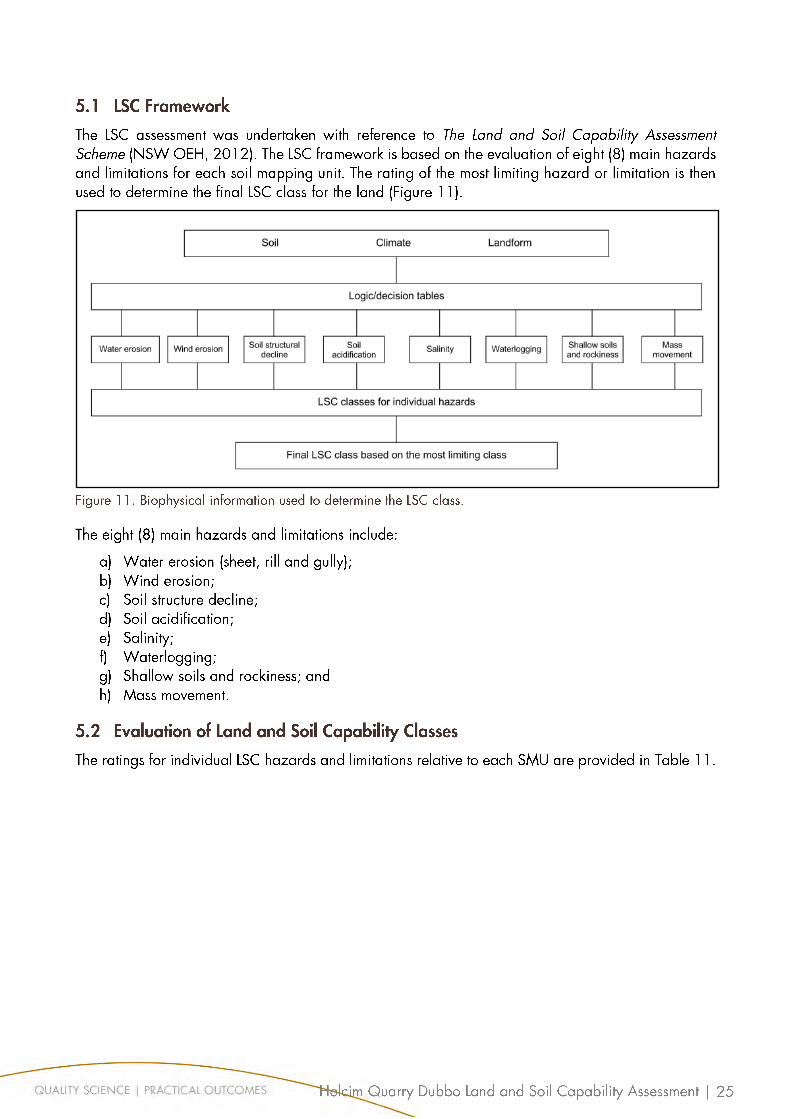
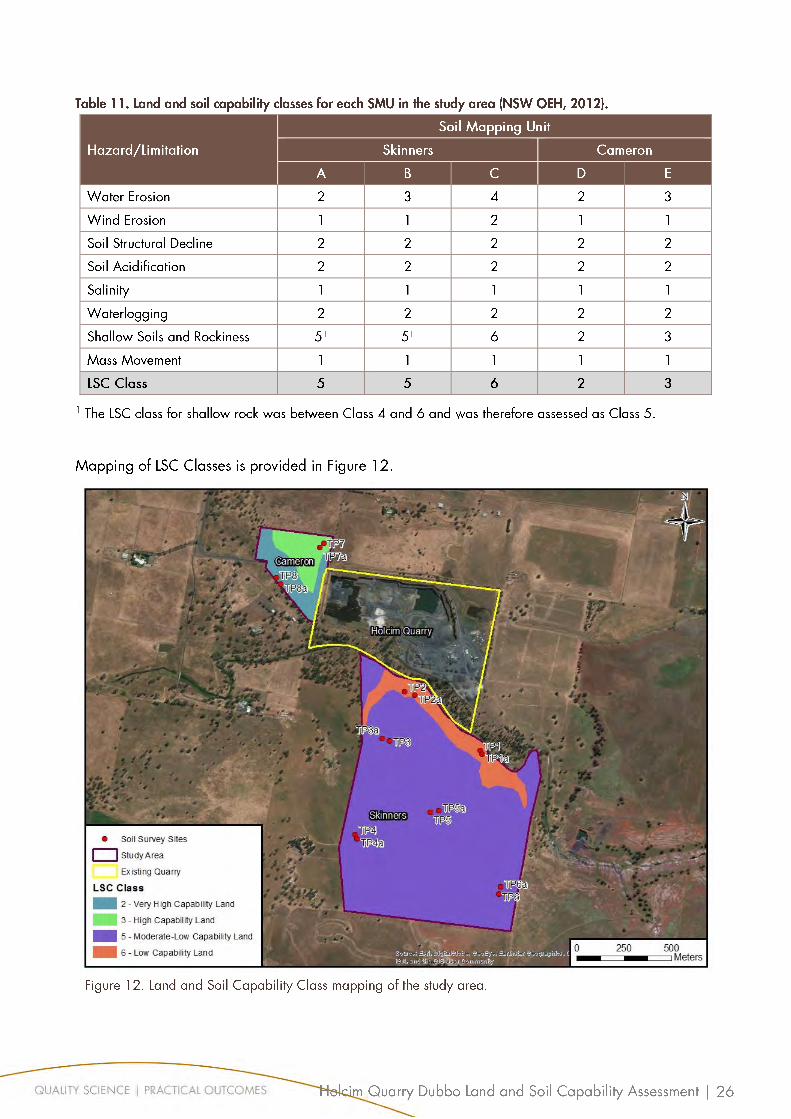
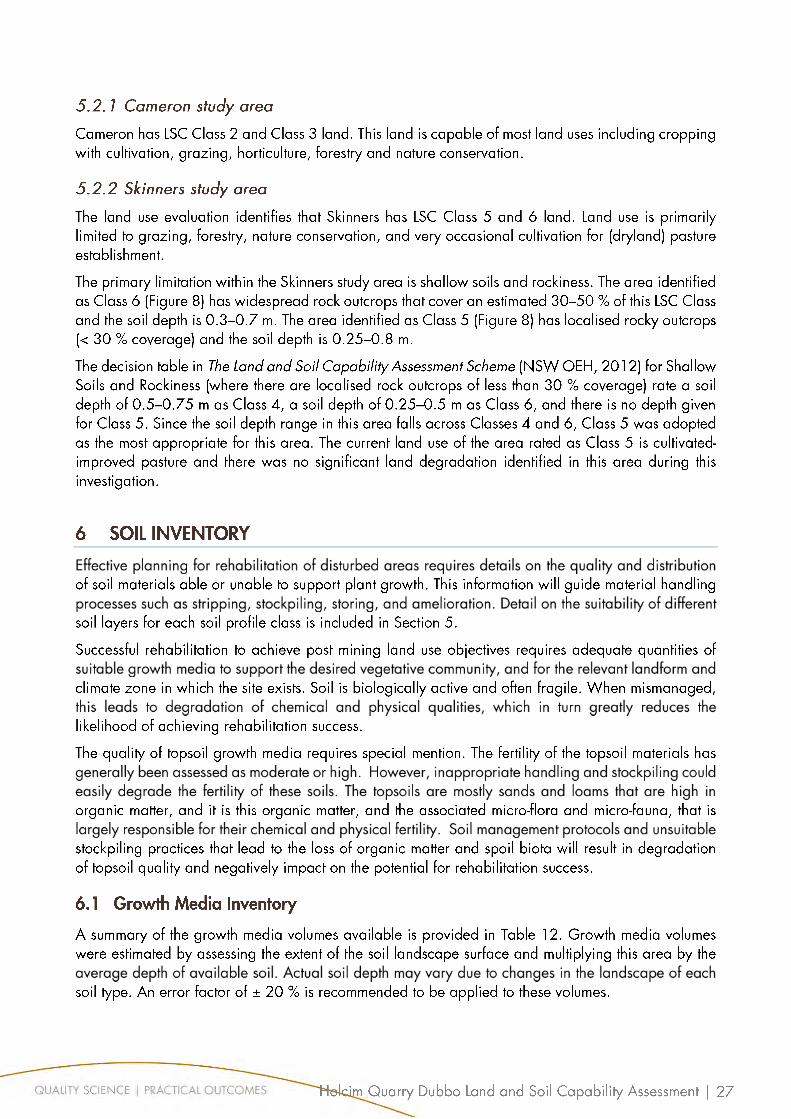
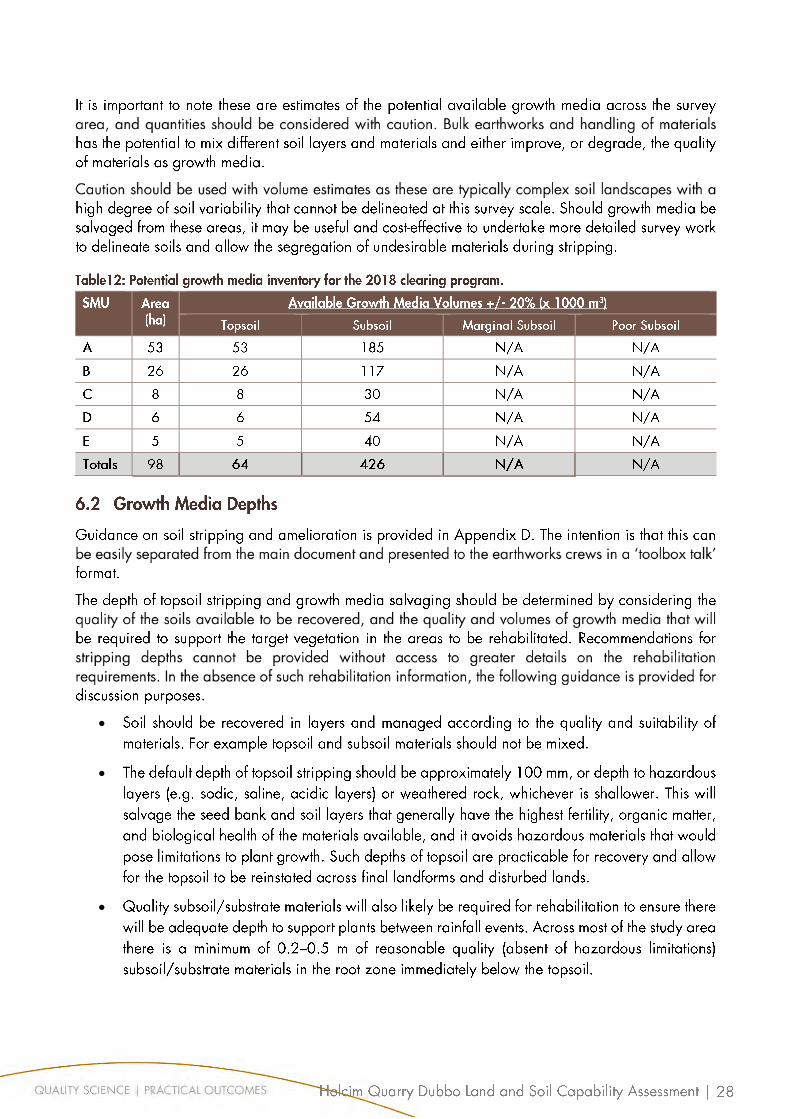
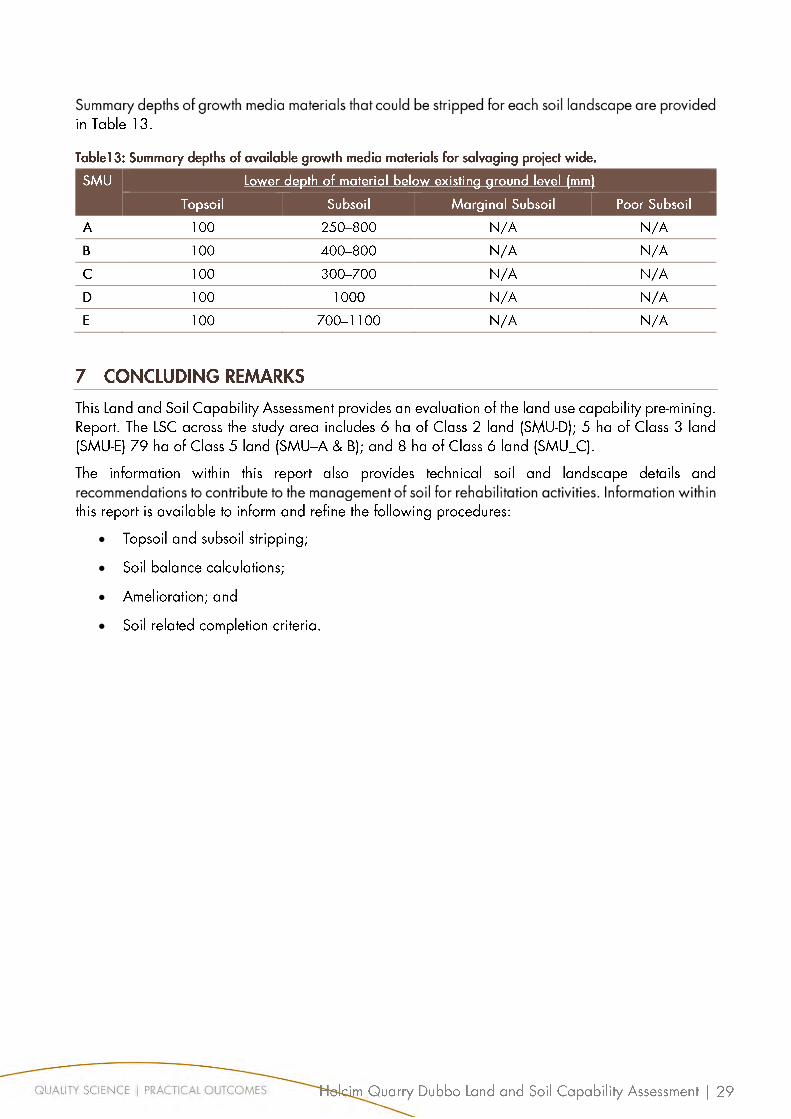
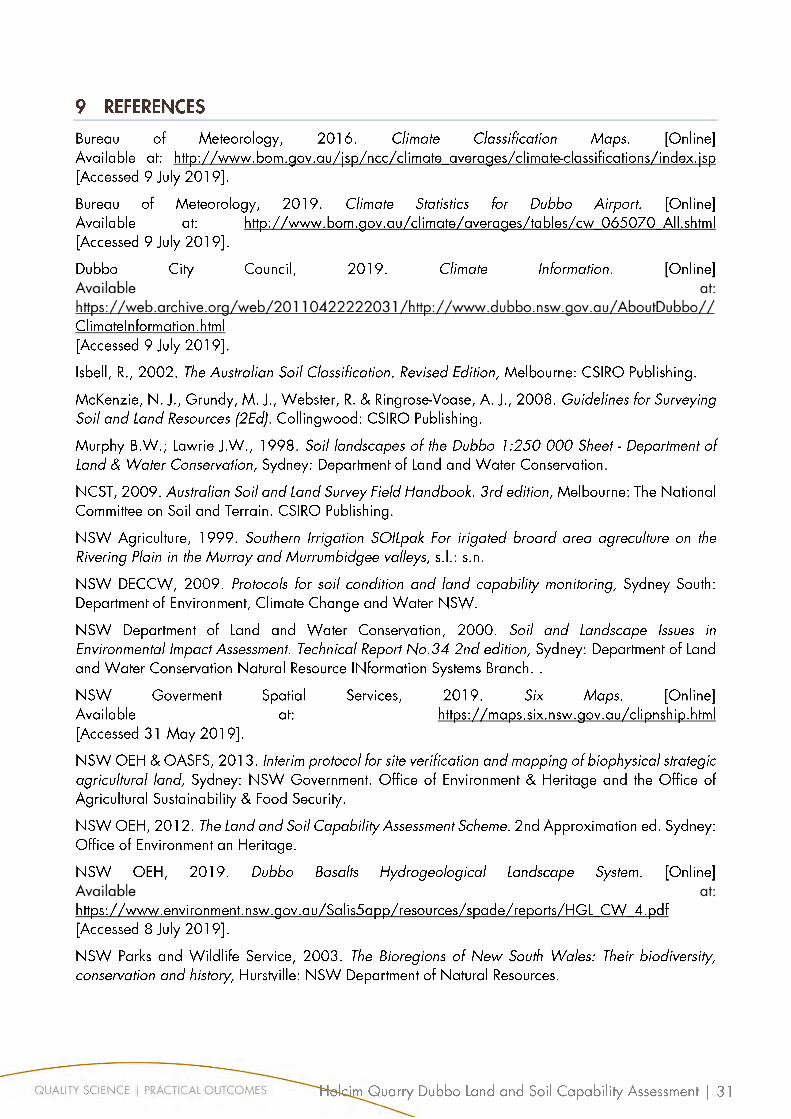

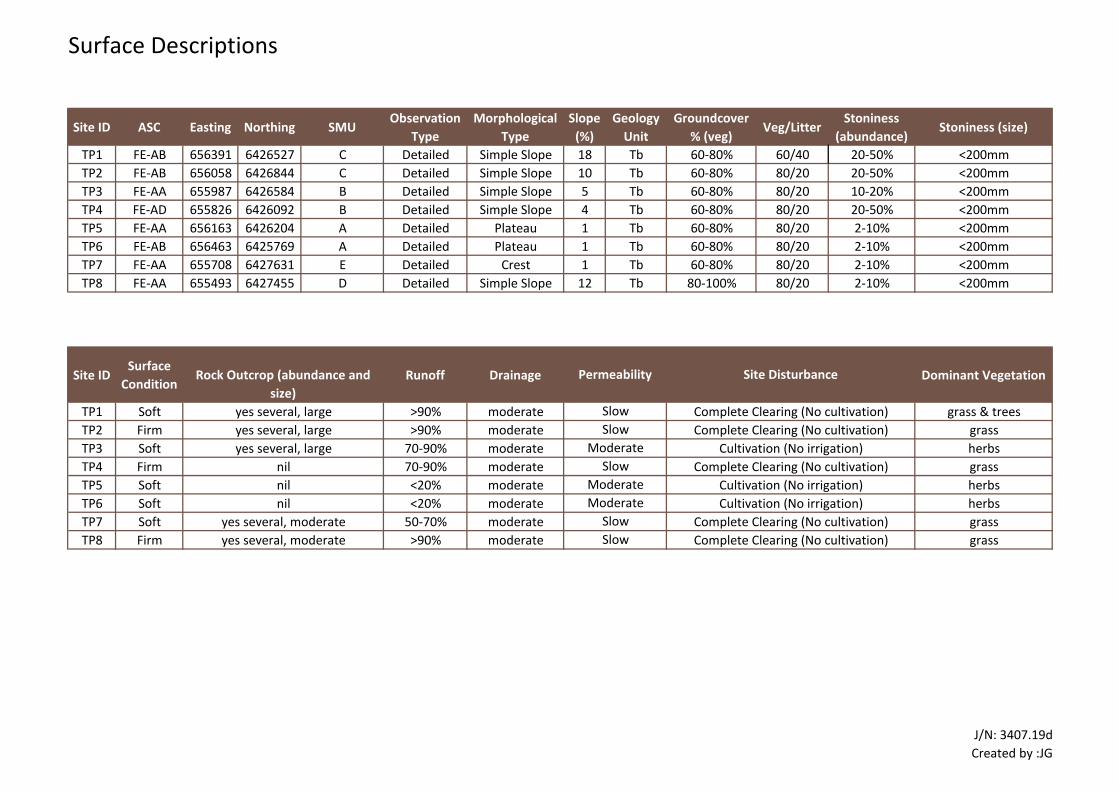
Surface Descriptions
Site ID ASC Easting Northing SMUObservation
Type
Morphological
Type
Slope
(%)
Geology
Unit
Groundcover
% (veg)Veg/Litter
Stoniness
(abundance)Stoniness (size)
TP1 FE-AB 656391 6426527 C Detailed Simple Slope 18 Tb 60-80% 60/40 20-50% <200mm
TP2 FE-AB 656058 6426844 C Detailed Simple Slope 10 Tb 60-80% 80/20 20-50% <200mm
TP3 FE-AA 655987 6426584 B Detailed Simple Slope 5 Tb 60-80% 80/20 10-20% <200mm
TP4 FE-AD 655826 6426092 B Detailed Simple Slope 4 Tb 60-80% 80/20 20-50% <200mm
TP5 FE-AA 656163 6426204 A Detailed Plateau 1 Tb 60-80% 80/20 2-10% <200mm
TP6 FE-AB 656463 6425769 A Detailed Plateau 1 Tb 60-80% 80/20 2-10% <200mm
TP7 FE-AA 655708 6427631 E Detailed Crest 1 Tb 60-80% 80/20 2-10% <200mm
TP8 FE-AA 655493 6427455 D Detailed Simple Slope 12 Tb 80-100% 80/20 2-10% <200mm
Site IDSurface
ConditionRunoff Drainage Dominant Vegetation
TP1 Soft >90% moderate grass & trees
TP2 Firm >90% moderate grass
TP3 Soft 70-90% moderate herbs
TP4 Firm 70-90% moderate grass
TP5 Soft <20% moderate herbs
TP6 Soft <20% moderate herbs
TP7 Soft 50-70% moderate grass
TP8 Firm >90% moderate grass
nil
yes several, moderate
yes several, moderate
Permeability
Slow
Slow
Moderate
Slow
Moderate
Moderate
Rock Outcrop (abundance and
size)
yes several, large
yes several, large
yes several, large
nil
nil
Complete Clearing (No cultivation)
Slow
Slow
Site Disturbance
Complete Clearing (No cultivation)
Complete Clearing (No cultivation)
Cultivation (No irrigation)
Complete Clearing (No cultivation)
Cultivation (No irrigation)
Cultivation (No irrigation)
Complete Clearing (No cultivation)
J/N: 3407.19d
Created by :JG
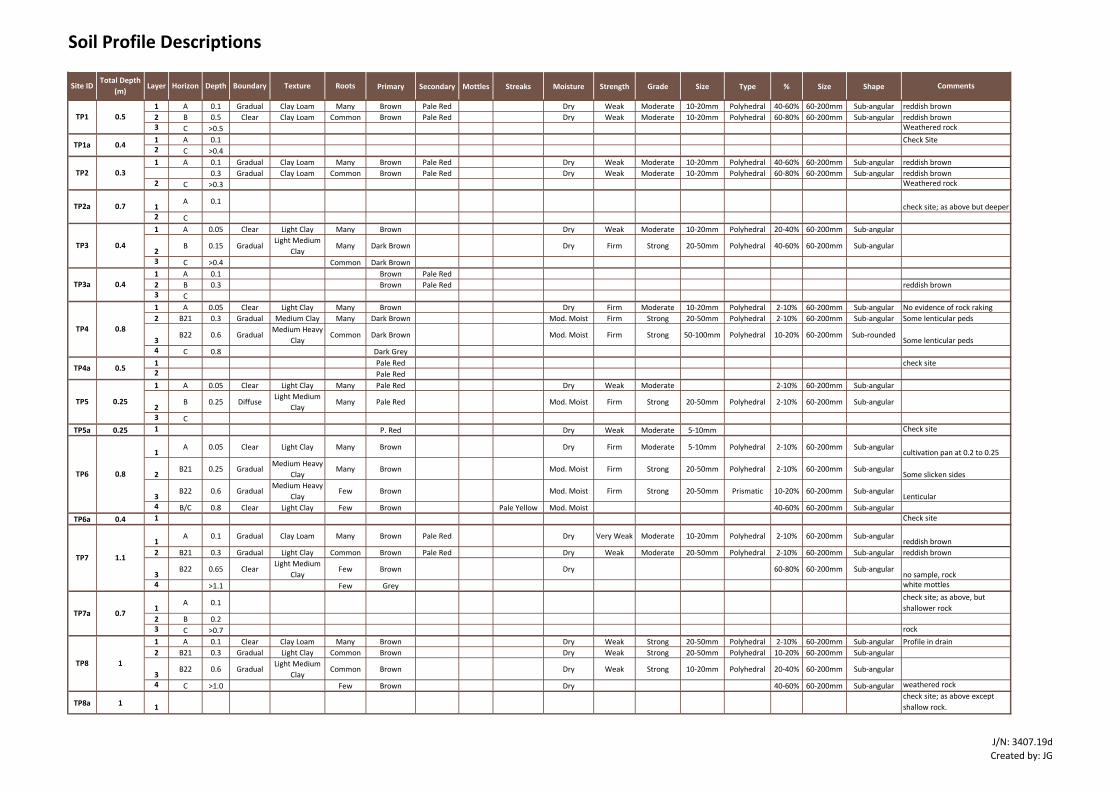
Soil Profile Descriptions
Primary Secondary Mottles Streaks Moisture Strength Grade Size Type % Size Shape
1 A 0.1 Gradual Clay Loam Many Brown Pale Red Dry Weak Moderate 10-20mm Polyhedral 40-60% 60-200mm Sub-angular reddish brown
2 B 0.5 Clear Clay Loam Common Brown Pale Red Dry Weak Moderate 10-20mm Polyhedral 60-80% 60-200mm Sub-angular reddish brown3 C >0.5 Weathered rock
1 A 0.1 Check Site2 C >0.4
1 A 0.1 Gradual Clay Loam Many Brown Pale Red Dry Weak Moderate 10-20mm Polyhedral 40-60% 60-200mm Sub-angular reddish brown
0.3 Gradual Clay Loam Common Brown Pale Red Dry Weak Moderate 10-20mm Polyhedral 60-80% 60-200mm Sub-angular reddish brown2 C >0.3 Weathered rock
1A 0.1
check site; as above but deeper2 C
1 A 0.05 Clear Light Clay Many Brown Dry Weak Moderate 10-20mm Polyhedral 20-40% 60-200mm Sub-angular
2B 0.15 Gradual
Light Medium
ClayMany Dark Brown Dry Firm Strong 20-50mm Polyhedral 40-60% 60-200mm Sub-angular
3 C >0.4 Common Dark Brown
1 A 0.1 Brown Pale Red
2 B 0.3 Brown Pale Red reddish brown3 C
1 A 0.05 Clear Light Clay Many Brown Dry Firm Moderate 10-20mm Polyhedral 2-10% 60-200mm Sub-angular No evidence of rock raking
2 B21 0.3 Gradual Medium Clay Many Dark Brown Mod. Moist Firm Strong 20-50mm Polyhedral 2-10% 60-200mm Sub-angular Some lenticular peds
3B22 0.6 Gradual
Medium Heavy
ClayCommon Dark Brown Mod. Moist Firm Strong 50-100mm Polyhedral 10-20% 60-200mm Sub-rounded
Some lenticular peds4 C 0.8 Dark Grey
1 Pale Red check site2 Pale Red
1 A 0.05 Clear Light Clay Many Pale Red Dry Weak Moderate 2-10% 60-200mm Sub-angular
2B 0.25 Diffuse
Light Medium
ClayMany Pale Red Mod. Moist Firm Strong 20-50mm Polyhedral 2-10% 60-200mm Sub-angular
3 C
TP5a 0.25 1 P. Red Dry Weak Moderate 5-10mm Check site
1A 0.05 Clear Light Clay Many Brown Dry Firm Moderate 5-10mm Polyhedral 2-10% 60-200mm Sub-angular
cultivation pan at 0.2 to 0.25
2B21 0.25 Gradual
Medium Heavy
ClayMany Brown Mod. Moist Firm Strong 20-50mm Polyhedral 2-10% 60-200mm Sub-angular
Some slicken sides
3B22 0.6 Gradual
Medium Heavy
ClayFew Brown Mod. Moist Firm Strong 20-50mm Prismatic 10-20% 60-200mm Sub-angular
Lenticular4 B/C 0.8 Clear Light Clay Few Brown Pale Yellow Mod. Moist 40-60% 60-200mm Sub-angular
TP6a 0.4 1 Check site
1A 0.1 Gradual Clay Loam Many Brown Pale Red Dry Very Weak Moderate 10-20mm Polyhedral 2-10% 60-200mm Sub-angular
reddish brown
2 B21 0.3 Gradual Light Clay Common Brown Pale Red Dry Weak Moderate 20-50mm Polyhedral 2-10% 60-200mm Sub-angular reddish brown
3B22 0.65 Clear
Light Medium
ClayFew Brown Dry 60-80% 60-200mm Sub-angular
no sample, rock4 >1.1 Few Grey white mottles
1A 0.1
check site; as above, but
shallower rock
2 B 0.23 C >0.7 rock
1 A 0.1 Clear Clay Loam Many Brown Dry Weak Strong 20-50mm Polyhedral 2-10% 60-200mm Sub-angular Profile in drain
2 B21 0.3 Gradual Light Clay Common Brown Dry Weak Strong 20-50mm Polyhedral 10-20% 60-200mm Sub-angular
3B22 0.6 Gradual
Light Medium
ClayCommon Brown Dry Weak Strong 10-20mm Polyhedral 20-40% 60-200mm Sub-angular
4 C >1.0 Few Brown Dry 40-60% 60-200mm Sub-angular weathered rock
TP8a 1 1
check site; as above except
shallow rock.
CommentsHorizonSite IDTotal Depth
(m)Layer Depth Boundary Texture Roots
0.4
TP3a
TP2
TP2a
TP3
TP8 1
TP6
TP5
0.8
0.25
TP7 1.1
TP7a
0.5TP1
0.7
TP4 0.8
TP4a 0.5
TP1a 0.4
0.4
0.3
0.7
J/N: 3407.19d
Created by: JG
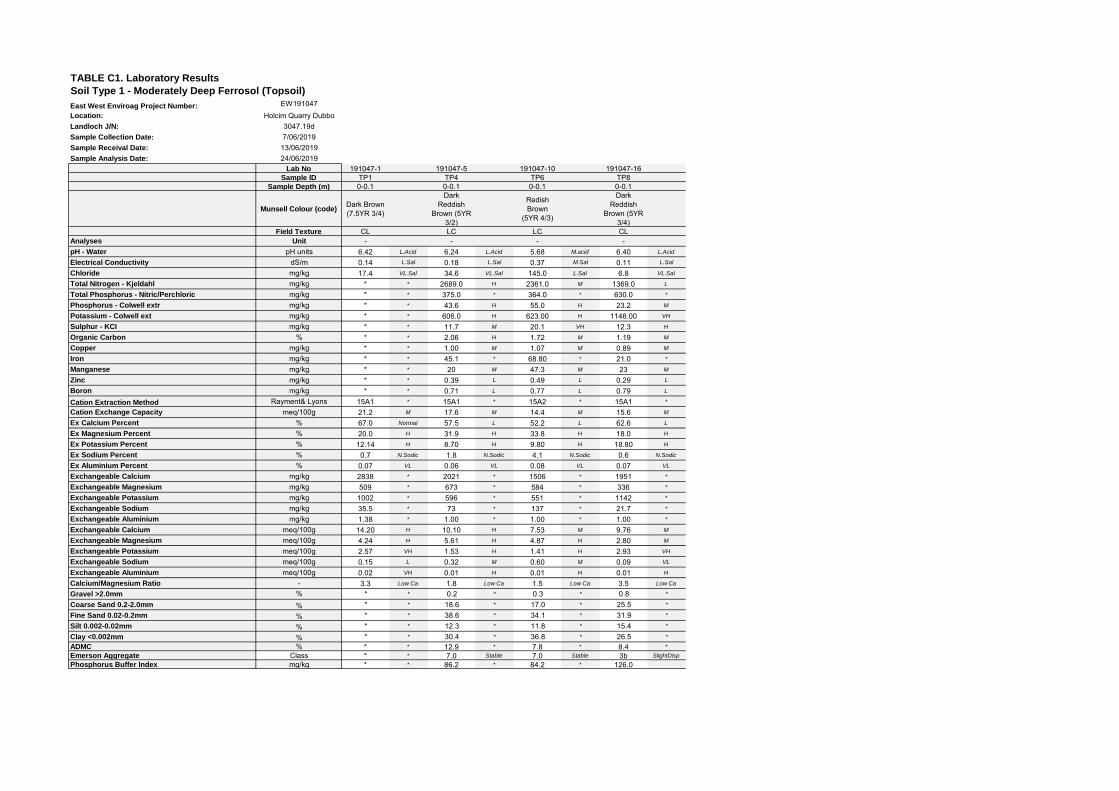
TABLE C1. Laboratory Results
Soil Type 1 - Moderately Deep Ferrosol (Topsoil)
East West Enviroag Project Number: EW191047Location: Holcim Quarry DubboLandloch J/N: 3047.19dSample Collection Date: 7/06/2019Sample Receival Date: 13/06/2019Sample Analysis Date: 24/06/2019
Lab No 191047-1 191047-5 191047-10 191047-16Sample ID TP1 TP4 TP6 TP8
Sample Depth (m) 0-0.1 0-0.1 0-0.1 0-0.1
Munsell Colour (code)Dark Brown (7.5YR 3/4)
Dark Reddish
Brown (5YR 3/2)
Redish Brown
(5YR 4/3)
Dark Reddish
Brown (5YR 3/4)
Field Texture CL LC LC CLAnalyses Unit - - - -pH - Water pH units 6.42 L.Acid 6.24 L.Acid 5.68 M.acid 6.40 L.Acid
Electrical Conductivity dS/m 0.14 L.Sal 0.18 L.Sal 0.37 M.Sal 0.11 L.Sal
Chloride mg/kg 17.4 VL.Sal 34.6 VL.Sal 145.0 L.Sal 6.8 VL.Sal
Total Nitrogen - Kjeldahl mg/kg * * 2689.0 H 2361.0 M 1369.0 L
Total Phosphorus - Nitric/Perchloric mg/kg * * 375.0 * 364.0 * 630.0 *
Phosphorus - Colwell extr mg/kg * * 43.6 H 55.0 H 23.2 M
Potassium - Colwell ext mg/kg * * 606.0 H 623.00 H 1146.00 VH
Sulphur - KCI mg/kg * * 11.7 M 20.1 VH 12.3 H
Organic Carbon % * * 2.06 H 1.72 M 1.19 M
Copper mg/kg * * 1.00 M 1.07 M 0.89 M
Iron mg/kg * * 45.1 * 68.80 * 21.0 *
Manganese mg/kg * * 20 M 47.3 M 23 M
Zinc mg/kg * * 0.39 L 0.49 L 0.29 L
Boron mg/kg * * 0.71 L 0.77 L 0.79 L
Cation Extraction Method Rayment& Lyons 15A1 * 15A1 * 15A2 * 15A1 *
Cation Exchange Capacity meq/100g 21.2 M 17.6 M 14.4 M 15.6 M
Ex Calcium Percent % 67.0 Normal 57.5 L 52.2 L 62.6 L
Ex Magnesium Percent % 20.0 H 31.9 H 33.8 H 18.0 H
Ex Potassium Percent % 12.14 H 8.70 H 9.80 H 18.80 H
Ex Sodium Percent % 0.7 N.Sodic 1.8 N.Sodic 4.1 N.Sodic 0.6 N.Sodic
Ex Aluminium Percent % 0.07 VL 0.06 VL 0.08 VL 0.07 VL
Exchangeable Calcium mg/kg 2838 * 2021 * 1506 * 1951 *
Exchangeable Magnesium mg/kg 509 * 673 * 584 * 336 *
Exchangeable Potassium mg/kg 1002 * 596 * 551 * 1142 *
Exchangeable Sodium mg/kg 35.5 * 73 * 137 * 21.7 *
Exchangeable Aluminium mg/kg 1.38 * 1.00 * 1.00 * 1.00 *
Exchangeable Calcium meq/100g 14.20 H 10.10 H 7.53 M 9.76 M
Exchangeable Magnesium meq/100g 4.24 H 5.61 H 4.87 H 2.80 M
Exchangeable Potassium meq/100g 2.57 VH 1.53 H 1.41 H 2.93 VH
Exchangeable Sodium meq/100g 0.15 L 0.32 M 0.60 M 0.09 VL
Exchangeable Aluminium meq/100g 0.02 VH 0.01 H 0.01 H 0.01 H
Calcium/Magnesium Ratio - 3.3 Low Ca 1.8 Low Ca 1.5 Low Ca 3.5 Low Ca
Gravel >2.0mm % * * 0.2 * 0.3 * 0.8 *
Coarse Sand 0.2-2.0mm % * * 18.6 * 17.0 * 25.5 *
Fine Sand 0.02-0.2mm % * * 38.6 * 34.1 * 31.9 *
Silt 0.002-0.02mm % * * 12.3 * 11.8 * 15.4 *
Clay <0.002mm % * * 30.4 * 36.8 * 26.5 *
ADMC % * * 12.9 * 7.8 * 8.4 *
Emerson Aggregate Class * * 7.0 Stable 7.0 Stable 3b SlightDisp
Phosphorus Buffer Index mg/kg * * 86.2 * 84.2 * 126.0
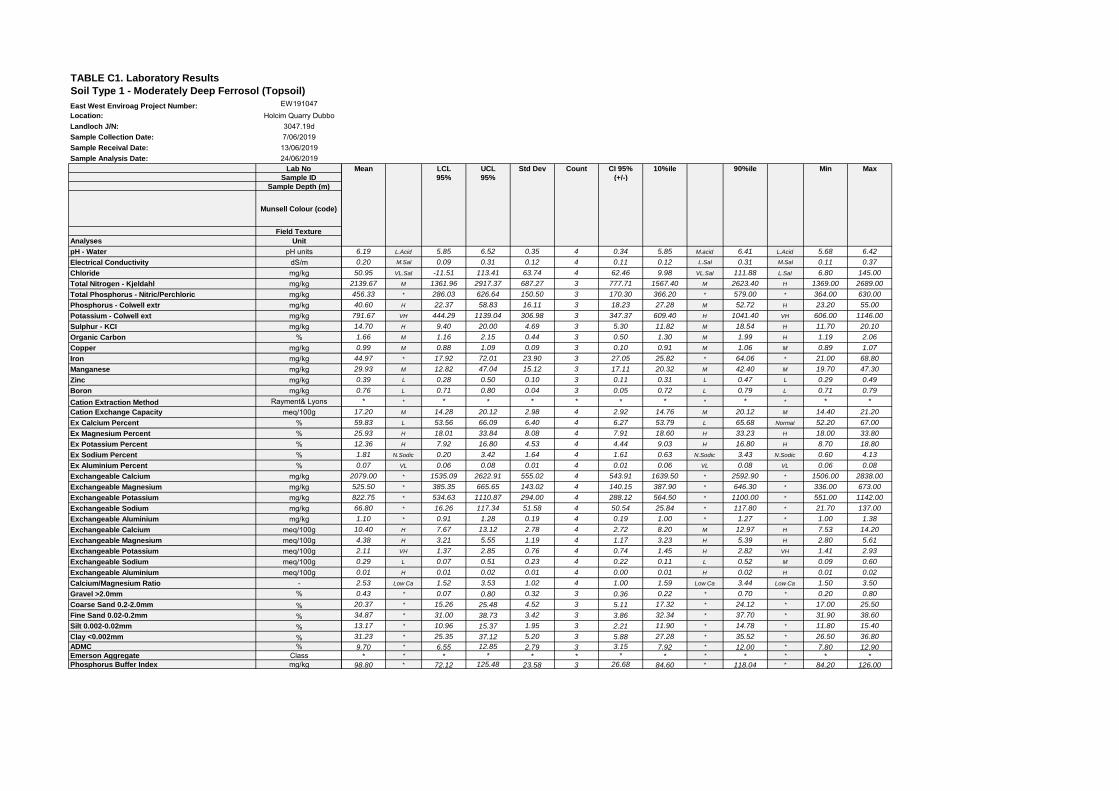
TABLE C1. Laboratory Results
Soil Type 1 - Moderately Deep Ferrosol (Topsoil)
East West Enviroag Project Number: EW191047Location: Holcim Quarry DubboLandloch J/N: 3047.19dSample Collection Date: 7/06/2019Sample Receival Date: 13/06/2019Sample Analysis Date: 24/06/2019
Lab No
Sample ID
Sample Depth (m)
Munsell Colour (code)
Field Texture
Analyses Unit
pH - Water pH unitsElectrical Conductivity dS/mChloride mg/kgTotal Nitrogen - Kjeldahl mg/kgTotal Phosphorus - Nitric/Perchloric mg/kgPhosphorus - Colwell extr mg/kgPotassium - Colwell ext mg/kgSulphur - KCI mg/kgOrganic Carbon %Copper mg/kgIron mg/kgManganese mg/kgZinc mg/kgBoron mg/kgCation Extraction Method Rayment& LyonsCation Exchange Capacity meq/100gEx Calcium Percent %Ex Magnesium Percent %Ex Potassium Percent %Ex Sodium Percent %Ex Aluminium Percent %Exchangeable Calcium mg/kgExchangeable Magnesium mg/kgExchangeable Potassium mg/kgExchangeable Sodium mg/kgExchangeable Aluminium mg/kgExchangeable Calcium meq/100gExchangeable Magnesium meq/100gExchangeable Potassium meq/100gExchangeable Sodium meq/100gExchangeable Aluminium meq/100gCalcium/Magnesium Ratio -Gravel >2.0mm %Coarse Sand 0.2-2.0mm %Fine Sand 0.02-0.2mm %Silt 0.002-0.02mm %Clay <0.002mm %ADMC %Emerson Aggregate ClassPhosphorus Buffer Index mg/kg
Mean LCL UCL Std Dev Count CI 95% 10%ile 90%ile Min Max
95% 95% (+/-)
6.19 L.Acid 5.85 6.52 0.35 4 0.34 5.85 M.acid 6.41 L.Acid 5.68 6.42
0.20 M.Sal 0.09 0.31 0.12 4 0.11 0.12 L.Sal 0.31 M.Sal 0.11 0.37
50.95 VL.Sal -11.51 113.41 63.74 4 62.46 9.98 VL.Sal 111.88 L.Sal 6.80 145.00
2139.67 M 1361.96 2917.37 687.27 3 777.71 1567.40 M 2623.40 H 1369.00 2689.00
456.33 * 286.03 626.64 150.50 3 170.30 366.20 * 579.00 * 364.00 630.00
40.60 H 22.37 58.83 16.11 3 18.23 27.28 M 52.72 H 23.20 55.00
791.67 VH 444.29 1139.04 306.98 3 347.37 609.40 H 1041.40 VH 606.00 1146.00
14.70 H 9.40 20.00 4.69 3 5.30 11.82 M 18.54 H 11.70 20.10
1.66 M 1.16 2.15 0.44 3 0.50 1.30 M 1.99 H 1.19 2.06
0.99 M 0.88 1.09 0.09 3 0.10 0.91 M 1.06 M 0.89 1.07
44.97 * 17.92 72.01 23.90 3 27.05 25.82 * 64.06 * 21.00 68.80
29.93 M 12.82 47.04 15.12 3 17.11 20.32 M 42.40 M 19.70 47.30
0.39 L 0.28 0.50 0.10 3 0.11 0.31 L 0.47 L 0.29 0.49
0.76 L 0.71 0.80 0.04 3 0.05 0.72 L 0.79 L 0.71 0.79
* * * * * * * * * * * * *
17.20 M 14.28 20.12 2.98 4 2.92 14.76 M 20.12 M 14.40 21.20
59.83 L 53.56 66.09 6.40 4 6.27 53.79 L 65.68 Normal 52.20 67.00
25.93 H 18.01 33.84 8.08 4 7.91 18.60 H 33.23 H 18.00 33.80
12.36 H 7.92 16.80 4.53 4 4.44 9.03 H 16.80 H 8.70 18.80
1.81 N.Sodic 0.20 3.42 1.64 4 1.61 0.63 N.Sodic 3.43 N.Sodic 0.60 4.13
0.07 VL 0.06 0.08 0.01 4 0.01 0.06 VL 0.08 VL 0.06 0.08
2079.00 * 1535.09 2622.91 555.02 4 543.91 1639.50 * 2592.90 * 1506.00 2838.00
525.50 * 385.35 665.65 143.02 4 140.15 387.90 * 646.30 * 336.00 673.00
822.75 * 534.63 1110.87 294.00 4 288.12 564.50 * 1100.00 * 551.00 1142.00
66.80 * 16.26 117.34 51.58 4 50.54 25.84 * 117.80 * 21.70 137.00
1.10 * 0.91 1.28 0.19 4 0.19 1.00 * 1.27 * 1.00 1.38
10.40 H 7.67 13.12 2.78 4 2.72 8.20 M 12.97 H 7.53 14.20
4.38 H 3.21 5.55 1.19 4 1.17 3.23 H 5.39 H 2.80 5.61
2.11 VH 1.37 2.85 0.76 4 0.74 1.45 H 2.82 VH 1.41 2.93
0.29 L 0.07 0.51 0.23 4 0.22 0.11 L 0.52 M 0.09 0.60
0.01 H 0.01 0.02 0.01 4 0.00 0.01 H 0.02 H 0.01 0.02
2.53 Low Ca 1.52 3.53 1.02 4 1.00 1.59 Low Ca 3.44 Low Ca 1.50 3.50
0.43 * 0.07 0.80 0.32 3 0.36 0.22 * 0.70 * 0.20 0.80
20.37 * 15.26 25.48 4.52 3 5.11 17.32 * 24.12 * 17.00 25.50
34.87 * 31.00 38.73 3.42 3 3.86 32.34 * 37.70 * 31.90 38.60
13.17 * 10.96 15.37 1.95 3 2.21 11.90 * 14.78 * 11.80 15.40
31.23 * 25.35 37.12 5.20 3 5.88 27.28 * 35.52 * 26.50 36.80
9.70 * 6.55 12.85 2.79 3 3.15 7.92 * 12.00 * 7.80 12.90
* * * * * * * * * * * * *
98.80 * 72.12 125.48 23.58 3 26.68 84.60 * 118.04 * 84.20 126.00
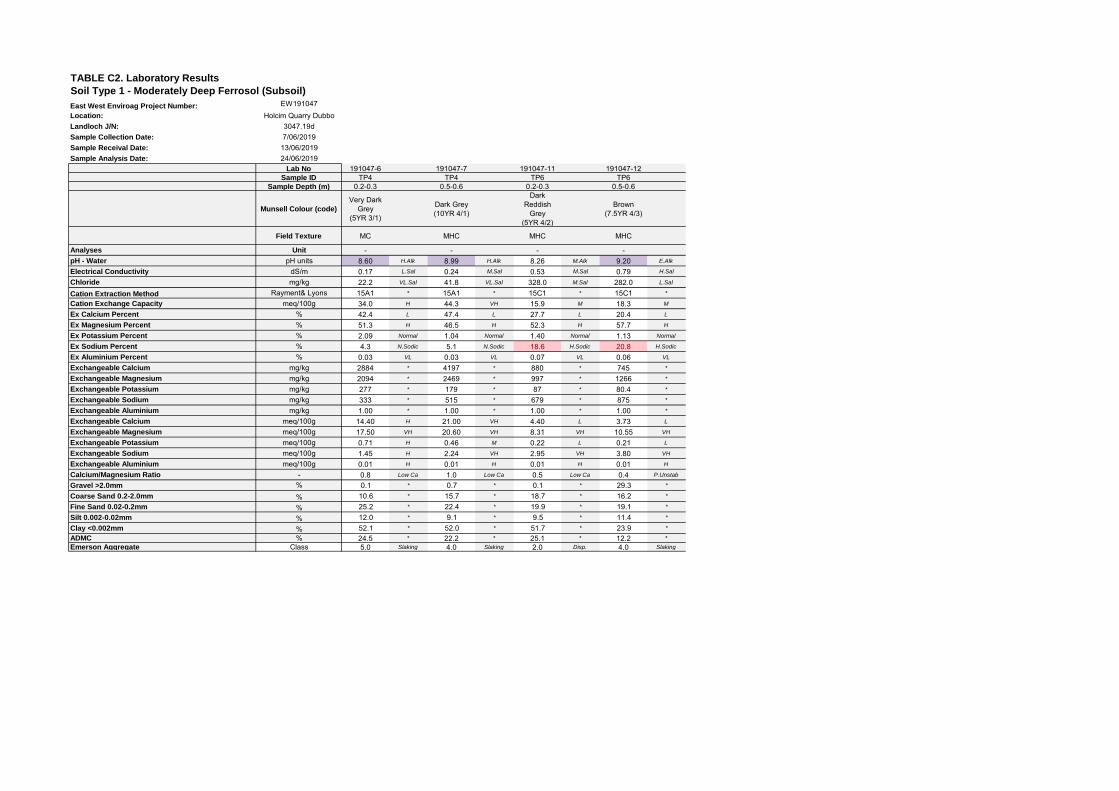
TABLE C2. Laboratory Results
Soil Type 1 - Moderately Deep Ferrosol (Subsoil)
East West Enviroag Project Number: EW191047Location: Holcim Quarry DubboLandloch J/N: 3047.19dSample Collection Date: 7/06/2019Sample Receival Date: 13/06/2019Sample Analysis Date: 24/06/2019
Lab No 191047-6 191047-7 191047-11 191047-12Sample ID TP4 TP4 TP6 TP6
Sample Depth (m) 0.2-0.3 0.5-0.6 0.2-0.3 0.5-0.6
Munsell Colour (code)
Very Dark Grey
(5YR 3/1)
Dark Grey(10YR 4/1)
Dark Reddish
Grey(5YR 4/2)
Brown(7.5YR 4/3)
Field Texture MC MHC MHC MHC
Analyses Unit - - - -pH - Water pH units 8.60 H.Alk 8.99 H.Alk 8.26 M.Alk 9.20 E.Alk
Electrical Conductivity dS/m 0.17 L.Sal 0.24 M.Sal 0.53 M.Sal 0.79 H.Sal
Chloride mg/kg 22.2 VL.Sal 41.8 VL.Sal 328.0 M.Sal 282.0 L.Sal
Cation Extraction Method Rayment& Lyons 15A1 * 15A1 * 15C1 * 15C1 *
Cation Exchange Capacity meq/100g 34.0 H 44.3 VH 15.9 M 18.3 M
Ex Calcium Percent % 42.4 L 47.4 L 27.7 L 20.4 L
Ex Magnesium Percent % 51.3 H 46.5 H 52.3 H 57.7 H
Ex Potassium Percent % 2.09 Normal 1.04 Normal 1.40 Normal 1.13 Normal
Ex Sodium Percent % 4.3 N.Sodic 5.1 N.Sodic 18.6 H.Sodic 20.8 H.Sodic
Ex Aluminium Percent % 0.03 VL 0.03 VL 0.07 VL 0.06 VL
Exchangeable Calcium mg/kg 2884 * 4197 * 880 * 745 *
Exchangeable Magnesium mg/kg 2094 * 2469 * 997 * 1266 *
Exchangeable Potassium mg/kg 277 * 179 * 87 * 80.4 *
Exchangeable Sodium mg/kg 333 * 515 * 679 * 875 *
Exchangeable Aluminium mg/kg 1.00 * 1.00 * 1.00 * 1.00 *
Exchangeable Calcium meq/100g 14.40 H 21.00 VH 4.40 L 3.73 L
Exchangeable Magnesium meq/100g 17.50 VH 20.60 VH 8.31 VH 10.55 VH
Exchangeable Potassium meq/100g 0.71 H 0.46 M 0.22 L 0.21 L
Exchangeable Sodium meq/100g 1.45 H 2.24 VH 2.95 VH 3.80 VH
Exchangeable Aluminium meq/100g 0.01 H 0.01 H 0.01 H 0.01 H
Calcium/Magnesium Ratio - 0.8 Low Ca 1.0 Low Ca 0.5 Low Ca 0.4 P.Unstab
Gravel >2.0mm % 0.1 * 0.7 * 0.1 * 29.3 *
Coarse Sand 0.2-2.0mm % 10.6 * 15.7 * 18.7 * 16.2 *
Fine Sand 0.02-0.2mm % 25.2 * 22.4 * 19.9 * 19.1 *
Silt 0.002-0.02mm % 12.0 * 9.1 * 9.5 * 11.4 *
Clay <0.002mm % 52.1 * 52.0 * 51.7 * 23.9 *
ADMC % 24.5 * 22.2 * 25.1 * 12.2 *
Emerson Aggregate Class 5.0 Slaking 4.0 Slaking 2.0 Disp. 4.0 Slaking
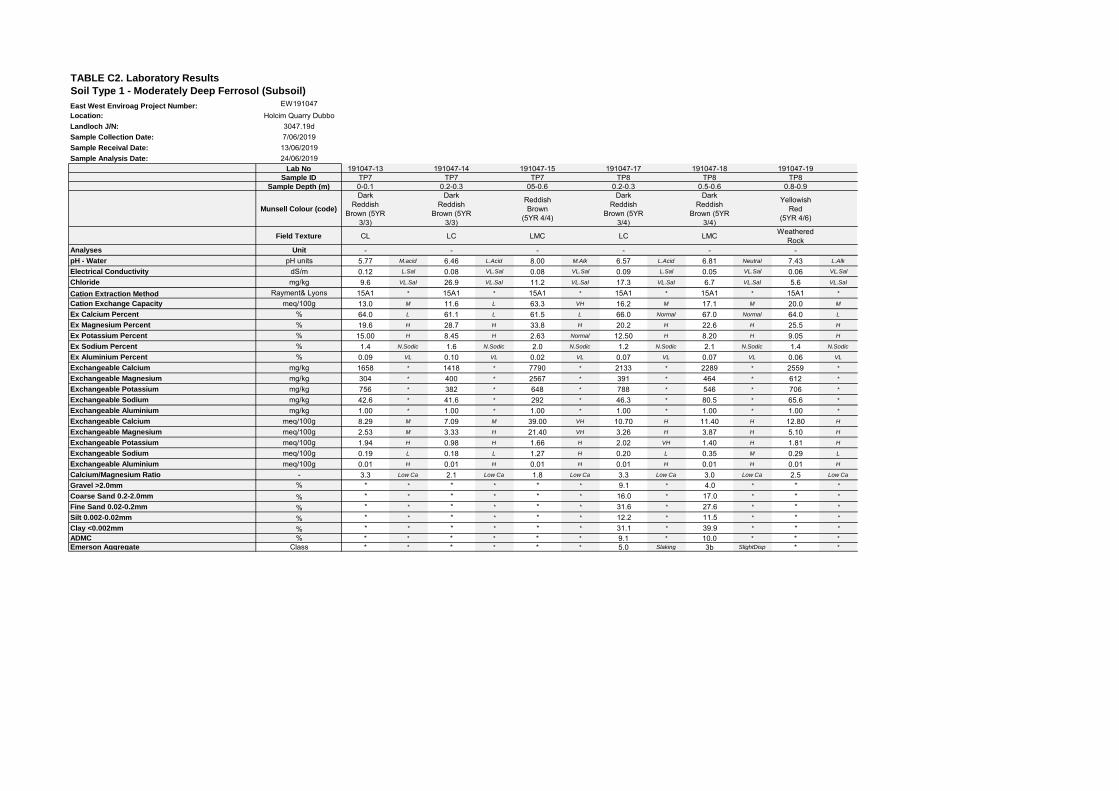
TABLE C2. Laboratory Results
Soil Type 1 - Moderately Deep Ferrosol (Subsoil)
East West Enviroag Project Number: EW191047Location: Holcim Quarry DubboLandloch J/N: 3047.19dSample Collection Date: 7/06/2019Sample Receival Date: 13/06/2019Sample Analysis Date: 24/06/2019
Lab No
Sample ID
Sample Depth (m)
Munsell Colour (code)
Field Texture
Analyses Unit
pH - Water pH unitsElectrical Conductivity dS/mChloride mg/kgCation Extraction Method Rayment& LyonsCation Exchange Capacity meq/100gEx Calcium Percent %Ex Magnesium Percent %Ex Potassium Percent %Ex Sodium Percent %Ex Aluminium Percent %Exchangeable Calcium mg/kgExchangeable Magnesium mg/kgExchangeable Potassium mg/kgExchangeable Sodium mg/kgExchangeable Aluminium mg/kgExchangeable Calcium meq/100gExchangeable Magnesium meq/100gExchangeable Potassium meq/100gExchangeable Sodium meq/100gExchangeable Aluminium meq/100gCalcium/Magnesium Ratio -Gravel >2.0mm %Coarse Sand 0.2-2.0mm %Fine Sand 0.02-0.2mm %Silt 0.002-0.02mm %Clay <0.002mm %ADMC %Emerson Aggregate Class
191047-13 191047-14 191047-15 191047-17 191047-18 191047-19TP7 TP7 TP7 TP8 TP8 TP80-0.1 0.2-0.3 05-0.6 0.2-0.3 0.5-0.6 0.8-0.9Dark
Reddish Brown (5YR
3/3)
Dark Reddish
Brown (5YR 3/3)
Reddish Brown
(5YR 4/4)
Dark Reddish
Brown (5YR 3/4)
Dark Reddish
Brown (5YR 3/4)
Yellowish Red
(5YR 4/6)
CL LC LMC LC LMC Weathered Rock
- - - - - -5.77 M.acid 6.46 L.Acid 8.00 M.Alk 6.57 L.Acid 6.81 Neutral 7.43 L.Alk
0.12 L.Sal 0.08 VL.Sal 0.08 VL.Sal 0.09 L.Sal 0.05 VL.Sal 0.06 VL.Sal
9.6 VL.Sal 26.9 VL.Sal 11.2 VL.Sal 17.3 VL.Sal 6.7 VL.Sal 5.6 VL.Sal
15A1 * 15A1 * 15A1 * 15A1 * 15A1 * 15A1 *
13.0 M 11.6 L 63.3 VH 16.2 M 17.1 M 20.0 M
64.0 L 61.1 L 61.5 L 66.0 Normal 67.0 Normal 64.0 L
19.6 H 28.7 H 33.8 H 20.2 H 22.6 H 25.5 H
15.00 H 8.45 H 2.63 Normal 12.50 H 8.20 H 9.05 H
1.4 N.Sodic 1.6 N.Sodic 2.0 N.Sodic 1.2 N.Sodic 2.1 N.Sodic 1.4 N.Sodic
0.09 VL 0.10 VL 0.02 VL 0.07 VL 0.07 VL 0.06 VL
1658 * 1418 * 7790 * 2133 * 2289 * 2559 *
304 * 400 * 2567 * 391 * 464 * 612 *
756 * 382 * 648 * 788 * 546 * 706 *
42.6 * 41.6 * 292 * 46.3 * 80.5 * 65.6 *
1.00 * 1.00 * 1.00 * 1.00 * 1.00 * 1.00 *
8.29 M 7.09 M 39.00 VH 10.70 H 11.40 H 12.80 H
2.53 M 3.33 H 21.40 VH 3.26 H 3.87 H 5.10 H
1.94 H 0.98 H 1.66 H 2.02 VH 1.40 H 1.81 H
0.19 L 0.18 L 1.27 H 0.20 L 0.35 M 0.29 L
0.01 H 0.01 H 0.01 H 0.01 H 0.01 H 0.01 H
3.3 Low Ca 2.1 Low Ca 1.8 Low Ca 3.3 Low Ca 3.0 Low Ca 2.5 Low Ca
* * * * * * 9.1 * 4.0 * * *
* * * * * * 16.0 * 17.0 * * *
* * * * * * 31.6 * 27.6 * * *
* * * * * * 12.2 * 11.5 * * *
* * * * * * 31.1 * 39.9 * * *
* * * * * * 9.1 * 10.0 * * *
* * * * * * 5.0 Slaking 3b SlightDisp * *
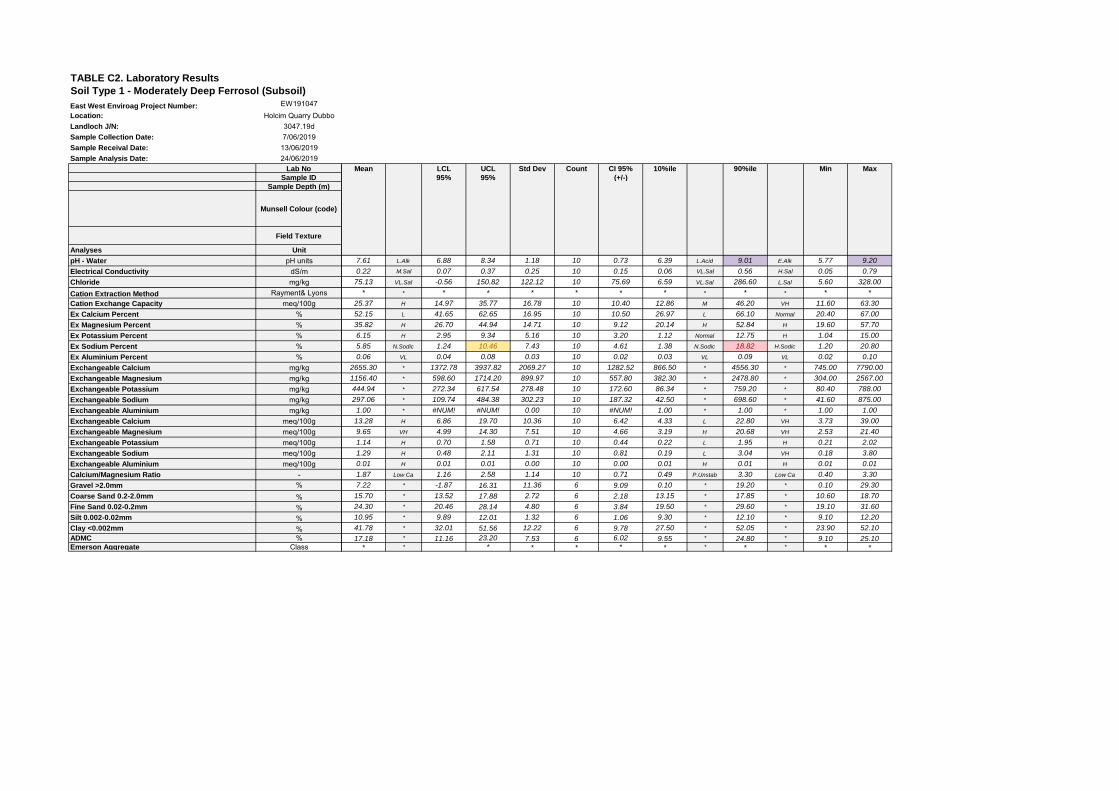
TABLE C2. Laboratory Results
Soil Type 1 - Moderately Deep Ferrosol (Subsoil)
East West Enviroag Project Number: EW191047Location: Holcim Quarry DubboLandloch J/N: 3047.19dSample Collection Date: 7/06/2019Sample Receival Date: 13/06/2019Sample Analysis Date: 24/06/2019
Lab No
Sample ID
Sample Depth (m)
Munsell Colour (code)
Field Texture
Analyses Unit
pH - Water pH unitsElectrical Conductivity dS/mChloride mg/kgCation Extraction Method Rayment& LyonsCation Exchange Capacity meq/100gEx Calcium Percent %Ex Magnesium Percent %Ex Potassium Percent %Ex Sodium Percent %Ex Aluminium Percent %Exchangeable Calcium mg/kgExchangeable Magnesium mg/kgExchangeable Potassium mg/kgExchangeable Sodium mg/kgExchangeable Aluminium mg/kgExchangeable Calcium meq/100gExchangeable Magnesium meq/100gExchangeable Potassium meq/100gExchangeable Sodium meq/100gExchangeable Aluminium meq/100gCalcium/Magnesium Ratio -Gravel >2.0mm %Coarse Sand 0.2-2.0mm %Fine Sand 0.02-0.2mm %Silt 0.002-0.02mm %Clay <0.002mm %ADMC %Emerson Aggregate Class
Mean LCL UCL Std Dev Count CI 95% 10%ile 90%ile Min Max
95% 95% (+/-)
7.61 L.Alk 6.88 8.34 1.18 10 0.73 6.39 L.Acid 9.01 E.Alk 5.77 9.20
0.22 M.Sal 0.07 0.37 0.25 10 0.15 0.06 VL.Sal 0.56 H.Sal 0.05 0.79
75.13 VL.Sal -0.56 150.82 122.12 10 75.69 6.59 VL.Sal 286.60 L.Sal 5.60 328.00
* * * * * * * * * * * * *
25.37 H 14.97 35.77 16.78 10 10.40 12.86 M 46.20 VH 11.60 63.30
52.15 L 41.65 62.65 16.95 10 10.50 26.97 L 66.10 Normal 20.40 67.00
35.82 H 26.70 44.94 14.71 10 9.12 20.14 H 52.84 H 19.60 57.70
6.15 H 2.95 9.34 5.16 10 3.20 1.12 Normal 12.75 H 1.04 15.00
5.85 N.Sodic 1.24 10.46 7.43 10 4.61 1.38 N.Sodic 18.82 H.Sodic 1.20 20.80
0.06 VL 0.04 0.08 0.03 10 0.02 0.03 VL 0.09 VL 0.02 0.10
2655.30 * 1372.78 3937.82 2069.27 10 1282.52 866.50 * 4556.30 * 745.00 7790.00
1156.40 * 598.60 1714.20 899.97 10 557.80 382.30 * 2478.80 * 304.00 2567.00
444.94 * 272.34 617.54 278.48 10 172.60 86.34 * 759.20 * 80.40 788.00
297.06 * 109.74 484.38 302.23 10 187.32 42.50 * 698.60 * 41.60 875.00
1.00 * #NUM! #NUM! 0.00 10 #NUM! 1.00 * 1.00 * 1.00 1.00
13.28 H 6.86 19.70 10.36 10 6.42 4.33 L 22.80 VH 3.73 39.00
9.65 VH 4.99 14.30 7.51 10 4.66 3.19 H 20.68 VH 2.53 21.40
1.14 H 0.70 1.58 0.71 10 0.44 0.22 L 1.95 H 0.21 2.02
1.29 H 0.48 2.11 1.31 10 0.81 0.19 L 3.04 VH 0.18 3.80
0.01 H 0.01 0.01 0.00 10 0.00 0.01 H 0.01 H 0.01 0.01
1.87 Low Ca 1.16 2.58 1.14 10 0.71 0.49 P.Unstab 3.30 Low Ca 0.40 3.30
7.22 * -1.87 16.31 11.36 6 9.09 0.10 * 19.20 * 0.10 29.30
15.70 * 13.52 17.88 2.72 6 2.18 13.15 * 17.85 * 10.60 18.70
24.30 * 20.46 28.14 4.80 6 3.84 19.50 * 29.60 * 19.10 31.60
10.95 * 9.89 12.01 1.32 6 1.06 9.30 * 12.10 * 9.10 12.20
41.78 * 32.01 51.56 12.22 6 9.78 27.50 * 52.05 * 23.90 52.10
17.18 * 11.16 23.20 7.53 6 6.02 9.55 * 24.80 * 9.10 25.10
* * * * * * * * * * * *

TABLE C3. Laboratory Results
Soil Type 2 - Shallow Ferrosol
East West Enviroag Project Number: EW191047Location: Holcim Quarry DubboLandloch J/N: 3047.19dSample Collection Date: 7/06/2019Sample Receival Date: 13/06/2019Sample Analysis Date: 24/06/2019
Lab No 191047-2 191047-3 191047-4 191047-8 191047-9Sample ID TP2 TP3 TP3 TP5 TP5
Sample Depth (m) 0-0.1 0-0.05 0.05-0.15 0-0.1 0.1-0.2
Munsell Colour (code)Dark Brown (7.5YR 3/4)
Dark Reddish
Brown (5YR 3/3)
Dark Reddish
Brown (5YR 2.5/2)
Red(2.5YR 4/6)
Red(2.5YR 4/6)
Field Texture CL LC LMC LC MCAnalyses Unit - - - - -pH - Water pH units 6.17 L.Acid 6.25 L.Acid 6.45 L.Acid 5.22 H.Acid 6.22 L.Acid
Electrical Conductivity dS/m 0.06 VL.Sal 0.11 L.Sal 0.10 VL.Sal 0.14 L.Sal 0.14 L.Sal
Chloride mg/kg 7.1 VL.Sal 4.3 VL.Sal 7.3 VL.Sal 9.8 VL.Sal 24.0 VL.Sal
Cation Extraction Method Rayment& Lyons 15A1 * 15A1 * 15A1 * 15A1 * 15A1 *
Cation Exchange Capacity meq/100g 14.6 M 17.8 M 17.5 M 8.8 L 10.9 L
Ex Calcium Percent % 60.0 L 61.1 L 58.4 L 58.6 L 65.2 Normal
Ex Magnesium Percent % 26.9 H 32.6 H 37.5 H 31.6 H 31.7 H
Ex Potassium Percent % 12.00 H 5.50 H 2.21 Normal 6.92 H 2.02 Normal
Ex Sodium Percent % 1.1 N.Sodic 0.8 N.Sodic 1.8 N.Sodic 2.6 N.Sodic 0.9 N.Sodic
Ex Aluminium Percent % 0.08 VL 0.06 VL 0.06 VL 0.22 VL 0.10 VL
Exchangeable Calcium mg/kg 1748 * 2169 * 2048 * 1034 * 1418 *
Exchangeable Magnesium mg/kg 470 * 695 * 788 * 335 * 414 *
Exchangeable Potassium mg/kg 682 * 381 * 151 * 238 * 85.8 *
Exchangeable Sodium mg/kg 35.8 * 31.6 * 73.8 * 53.3 * 23.7 *
Exchangeable Aluminium mg/kg 1.00 * 1.00 * 1.00 * 1.74 * 1.00 *
Exchangeable Calcium meq/100g 8.74 M 10.80 H 10.20 H 5.17 M 7.09 M
Exchangeable Magnesium meq/100g 3.92 H 5.79 H 6.57 H 2.79 M 3.45 H
Exchangeable Potassium meq/100g 1.75 H 0.98 H 0.39 M 0.61 M 0.22 L
Exchangeable Sodium meq/100g 0.16 L 0.14 L 0.32 M 0.23 L 0.10 L
Exchangeable Aluminium meq/100g 0.01 H 0.01 H 0.01 H 0.02 VH 0.01 H
Calcium/Magnesium Ratio - 2.2 Low Ca 1.9 Low Ca 1.6 Low Ca 1.9 Low Ca 2.1 Low Ca
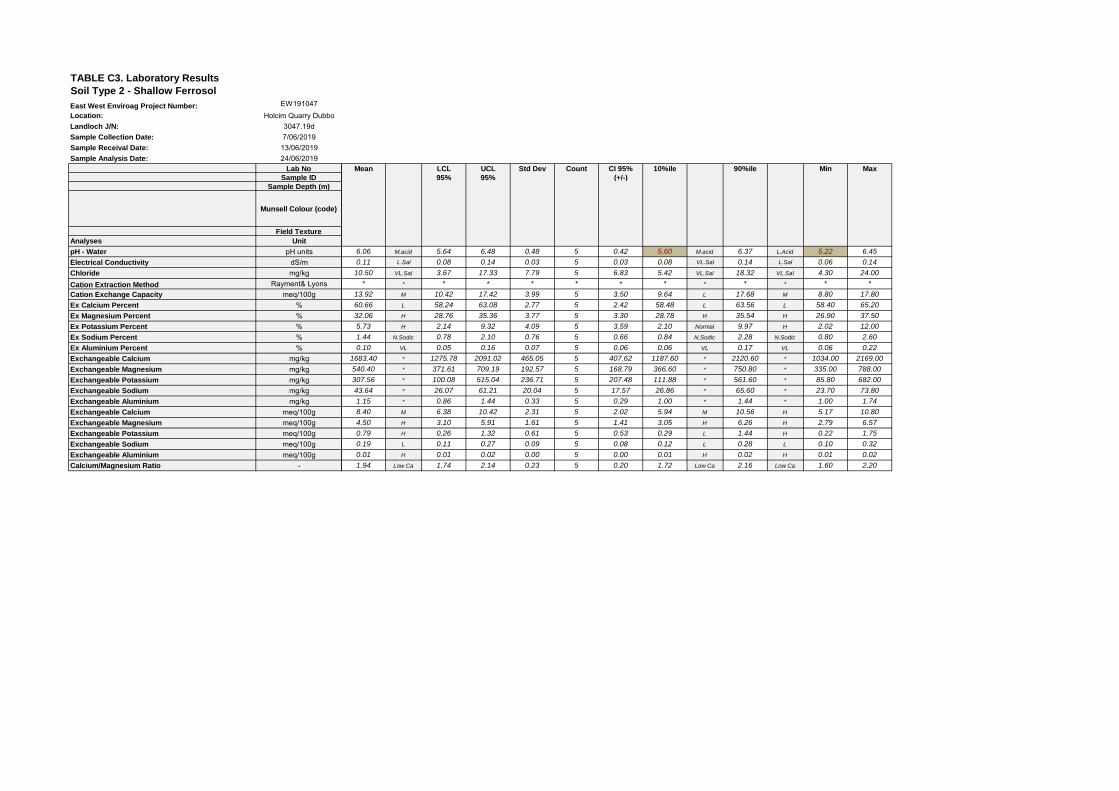
TABLE C3. Laboratory Results
Soil Type 2 - Shallow Ferrosol
East West Enviroag Project Number: EW191047Location: Holcim Quarry DubboLandloch J/N: 3047.19dSample Collection Date: 7/06/2019Sample Receival Date: 13/06/2019Sample Analysis Date: 24/06/2019
Lab No
Sample ID
Sample Depth (m)
Munsell Colour (code)
Field Texture
Analyses Unit
pH - Water pH unitsElectrical Conductivity dS/mChloride mg/kgCation Extraction Method Rayment& LyonsCation Exchange Capacity meq/100gEx Calcium Percent %Ex Magnesium Percent %Ex Potassium Percent %Ex Sodium Percent %Ex Aluminium Percent %Exchangeable Calcium mg/kgExchangeable Magnesium mg/kgExchangeable Potassium mg/kgExchangeable Sodium mg/kgExchangeable Aluminium mg/kgExchangeable Calcium meq/100gExchangeable Magnesium meq/100gExchangeable Potassium meq/100gExchangeable Sodium meq/100gExchangeable Aluminium meq/100gCalcium/Magnesium Ratio -
Mean LCL UCL Std Dev Count CI 95% 10%ile 90%ile Min Max
95% 95% (+/-)
6.06 M.acid 5.64 6.48 0.48 5 0.42 5.60 M.acid 6.37 L.Acid 5.22 6.45
0.11 L.Sal 0.08 0.14 0.03 5 0.03 0.08 VL.Sal 0.14 L.Sal 0.06 0.14
10.50 VL.Sal 3.67 17.33 7.79 5 6.83 5.42 VL.Sal 18.32 VL.Sal 4.30 24.00
* * * * * * * * * * * * *
13.92 M 10.42 17.42 3.99 5 3.50 9.64 L 17.68 M 8.80 17.80
60.66 L 58.24 63.08 2.77 5 2.42 58.48 L 63.56 L 58.40 65.20
32.06 H 28.76 35.36 3.77 5 3.30 28.78 H 35.54 H 26.90 37.50
5.73 H 2.14 9.32 4.09 5 3.59 2.10 Normal 9.97 H 2.02 12.00
1.44 N.Sodic 0.78 2.10 0.76 5 0.66 0.84 N.Sodic 2.28 N.Sodic 0.80 2.60
0.10 VL 0.05 0.16 0.07 5 0.06 0.06 VL 0.17 VL 0.06 0.22
1683.40 * 1275.78 2091.02 465.05 5 407.62 1187.60 * 2120.60 * 1034.00 2169.00
540.40 * 371.61 709.19 192.57 5 168.79 366.60 * 750.80 * 335.00 788.00
307.56 * 100.08 515.04 236.71 5 207.48 111.88 * 561.60 * 85.80 682.00
43.64 * 26.07 61.21 20.04 5 17.57 26.86 * 65.60 * 23.70 73.80
1.15 * 0.86 1.44 0.33 5 0.29 1.00 * 1.44 * 1.00 1.74
8.40 M 6.38 10.42 2.31 5 2.02 5.94 M 10.56 H 5.17 10.80
4.50 H 3.10 5.91 1.61 5 1.41 3.05 H 6.26 H 2.79 6.57
0.79 H 0.26 1.32 0.61 5 0.53 0.29 L 1.44 H 0.22 1.75
0.19 L 0.11 0.27 0.09 5 0.08 0.12 L 0.28 L 0.10 0.32
0.01 H 0.01 0.02 0.00 5 0.00 0.01 H 0.02 H 0.01 0.02
1.94 Low Ca 1.74 2.14 0.23 5 0.20 1.72 Low Ca 2.16 Low Ca 1.60 2.20
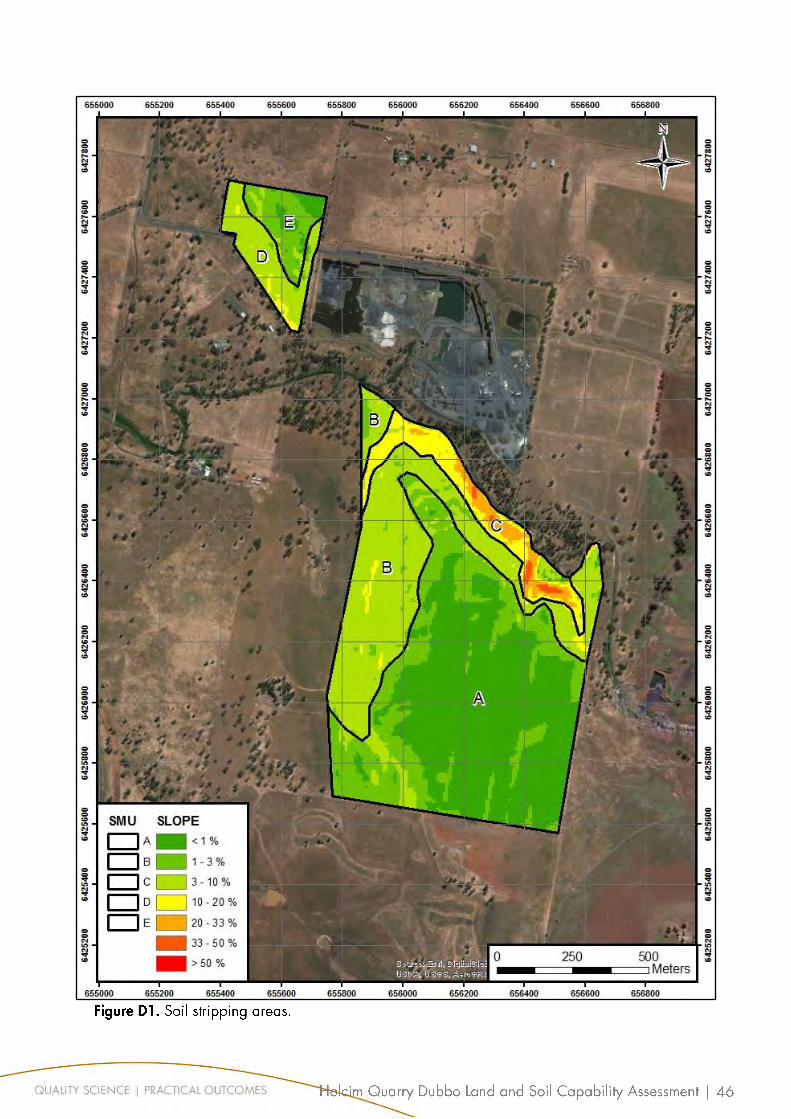
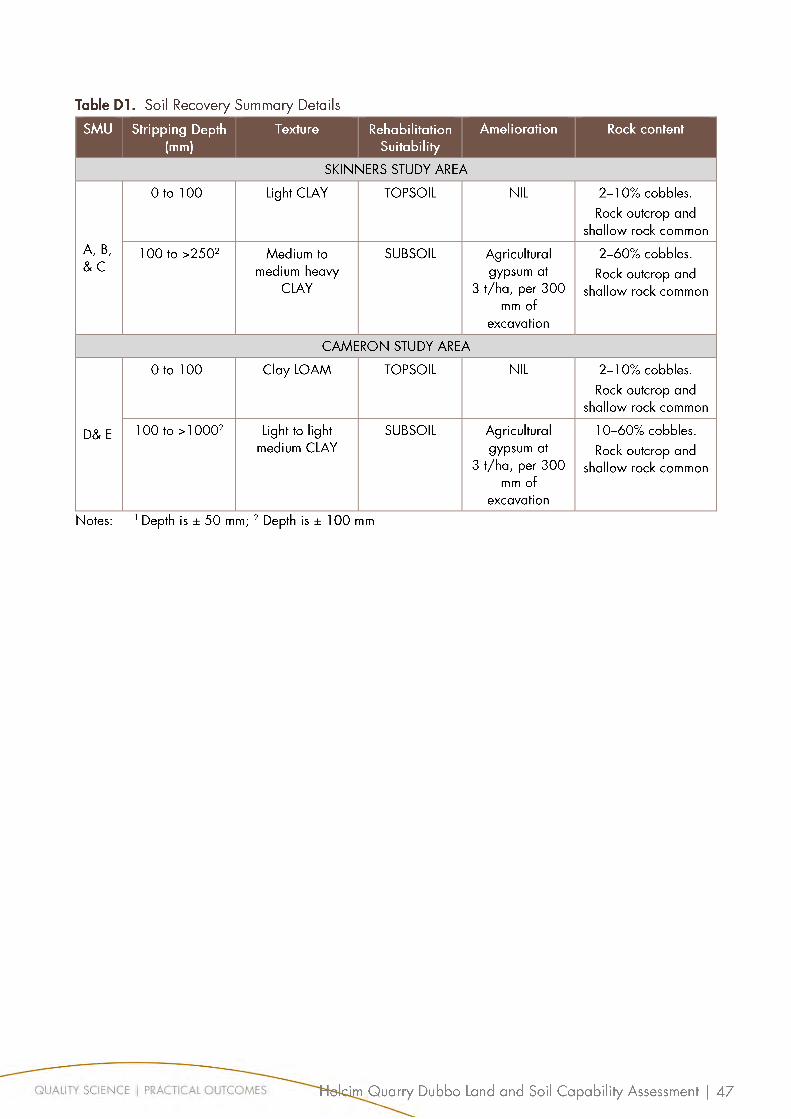

www.emmconsulting.com.au
www.emmconsulting.com.au
Related Documents