©NRRI Regulatory Finance Concepts Educational Seminar Session 3: The Cost of Debt Presented to the Public Service Commission of South Carolina December 30, 2020 Carl Pechman, Ph.D. Director – National Regulatory Research Institute NRRI www.nrri.org ACCEPTED FOR PROCESSING - 2020 December 30 11:40 AM - SCPSC - 2005-83-A - Page 1 of 18 jbg-

Welcome message from author
This document is posted to help you gain knowledge. Please leave a comment to let me know what you think about it! Share it to your friends and learn new things together.
Transcript
©NRRI
Regulatory Finance Concepts Educational Seminar
Session 3: The Cost of Debt
Presented to the Public Service Commission of South Carolina
December 30, 2020
Carl Pechman, Ph.D.Director – National Regulatory Research Institute
NRRI www.nrri.org
ACCEPTED
FORPR
OCESSIN
G-2020
Decem
ber3011:40
AM-SC
PSC-2005-83-A
-Page1of
18jbg-
©NRRI
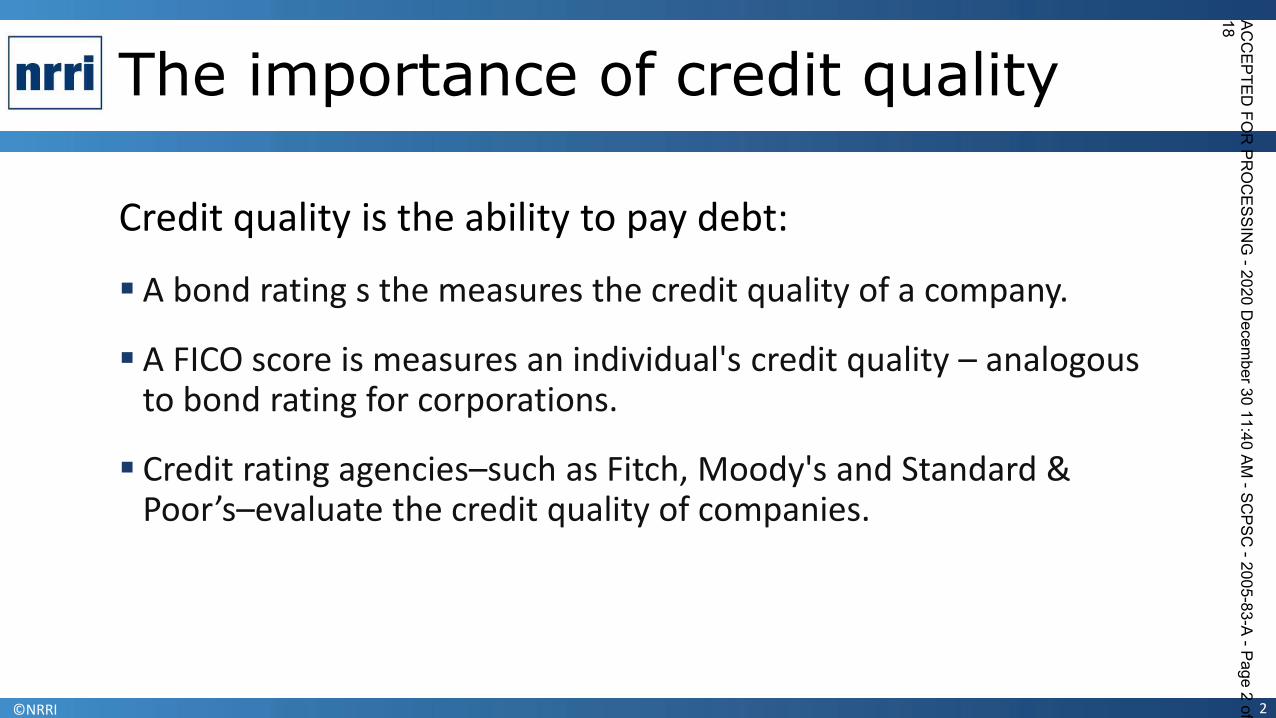
The importance of credit quality
Credit quality is the ability to pay debt:
▪ A bond rating s the measures the credit quality of a company.
▪ A FICO score is measures an individual's credit quality – analogous to bond rating for corporations.
▪ Credit rating agencies–such as Fitch, Moody's and Standard & Poor’s–evaluate the credit quality of companies.
2
ACCEPTED
FORPR
OCESSIN
G-2020
Decem
ber3011:40
AM-SC
PSC-2005-83-A
-Page2of
18

©NRRI
Bond Credit Ratings Measure Credit Quality
3
Source: https://investinginbonds.com/learnmore.asp?catid=5&subcatid=19&id=190
ACCEPTED
FORPR
OCESSIN
G-2020
Decem
ber3011:40
AM-SC
PSC-2005-83-A
-Page3of
18
Credit Risk Moody's* Standard 8 Poor's** Fitch Ratings**
AaaAa AA
A A
Baa BBB
BB
B
CCCCCD
D
Investment gradeHighest qualityHigh quality (very strong)Upper medium grade (strong)Medium gradeNot investment gradeLower medium grade (somewhat speculative) BaLow grade (speculative) B
Poor quality (may default) CaaMost speculative CaNo interest being paid or bankruptcy petition filed C
In default C
AAA
AA
A
BBB
BB
B
CCCCCCD
©NRRI
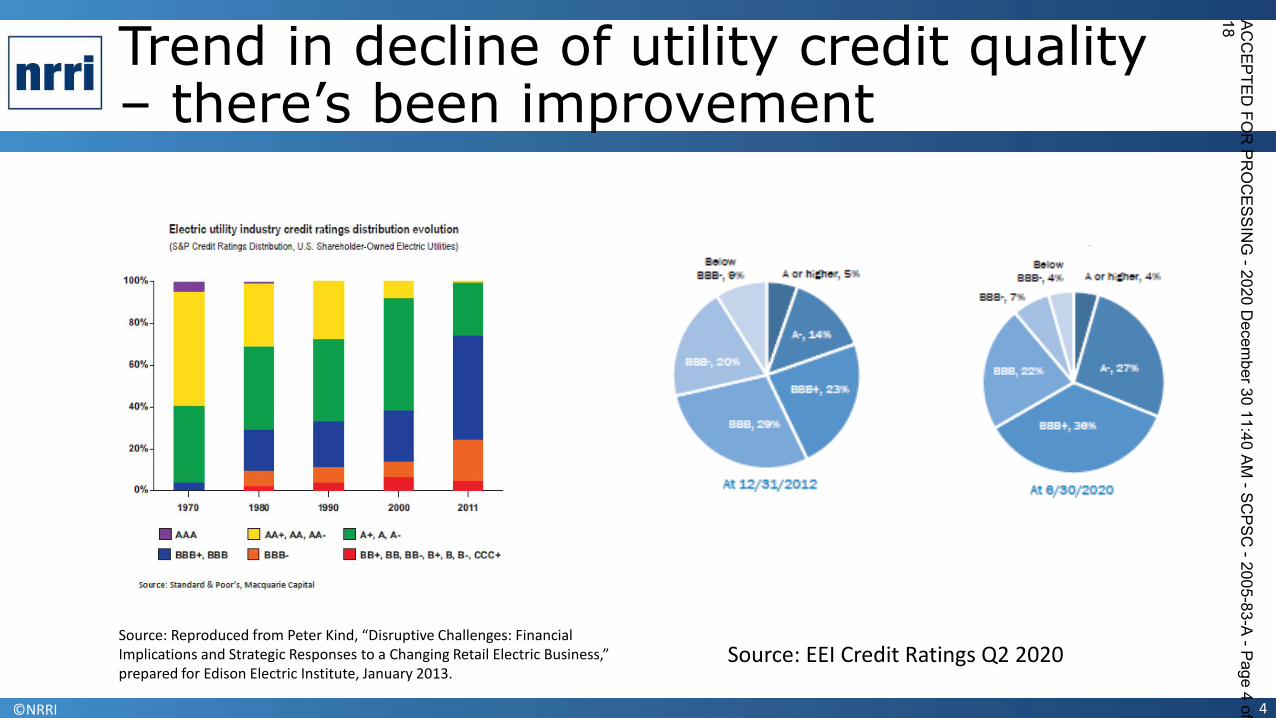
Trend in decline of utility credit quality – there’s been improvement
4
Source: Reproduced from Peter Kind, “Disruptive Challenges: Financial Implications and Strategic Responses to a Changing Retail Electric Business,” prepared for Edison Electric Institute, January 2013.
Source: EEI Credit Ratings Q2 2020
ACCEPTED
FORPR
OCESSIN
G-2020
Decem
ber3011:40
AM-SC
PSC-2005-83-A
-Page4of
18
Electric utility industry credit ratings distritrution evolutionlsSP credit Rabnga Dinnbubcn, U s. shareholder-owned Electee Utibbee)
rb or hiohee, 5th BBB-,4X horgt&tw,498
0, 2398
20%
1970 1980 2000 2011
At 6/3D/2020
R rbrbrb rbrbo, rbah stub. Q rbo, rh rb
~ BBB+, BBB 9 BBB- 8 BB+, BB, Bns B+, B, Bn CCC+
source: standard 8 ooor's, Macquane capeal

©NRRI
Corporate Rating Methodology
Corporate rating is based on:
▪ Anchor Rating
oBusiness Risk Profile
o Financial Risk Profile
▪ Modifiers: Diversification, Liquidity, Governance, etc.
▪ Group Rating
5
Source: S&P Global Ratings Corporate Methodology, November 19, 2013https://www.spratings.com/scenario-builder-portlet/pdfs/CorporateMethodology.pdf
ACCEPTED
FORPR
OCESSIN
G-2020
Decem
ber3011:40
AM-SC
PSC-2005-83-A
-Page5of
18
©NRRI
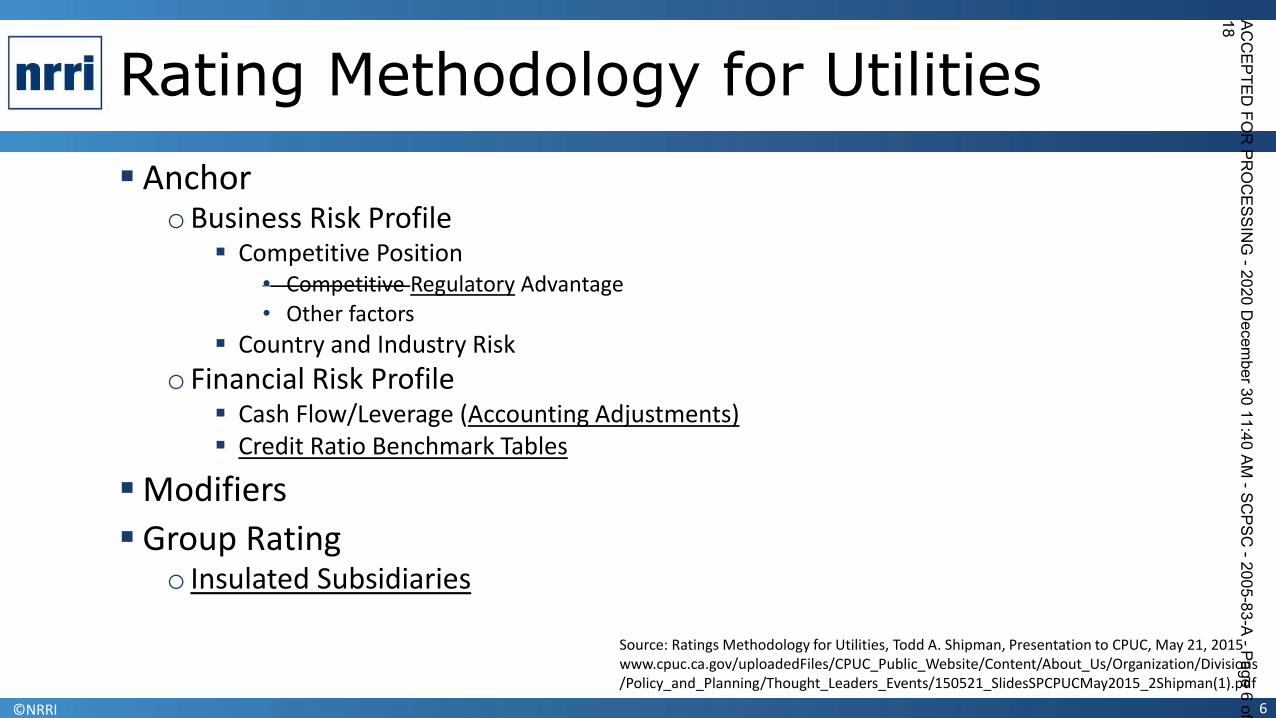
Rating Methodology for Utilities
▪ AnchoroBusiness Risk Profile
▪ Competitive Position• Competitive Regulatory Advantage• Other factors
▪ Country and Industry Risk
o Financial Risk Profile▪ Cash Flow/Leverage (Accounting Adjustments)▪ Credit Ratio Benchmark Tables
▪ Modifiers
▪ Group Ratingo Insulated Subsidiaries
6
Source: Ratings Methodology for Utilities, Todd A. Shipman, Presentation to CPUC, May 21, 2015 www.cpuc.ca.gov/uploadedFiles/CPUC_Public_Website/Content/About_Us/Organization/Divisions/Policy_and_Planning/Thought_Leaders_Events/150521_SlidesSPCPUCMay2015_2Shipman(1).pdf
ACCEPTED
FORPR
OCESSIN
G-2020
Decem
ber3011:40
AM-SC
PSC-2005-83-A
-Page6of
18
©NRRI
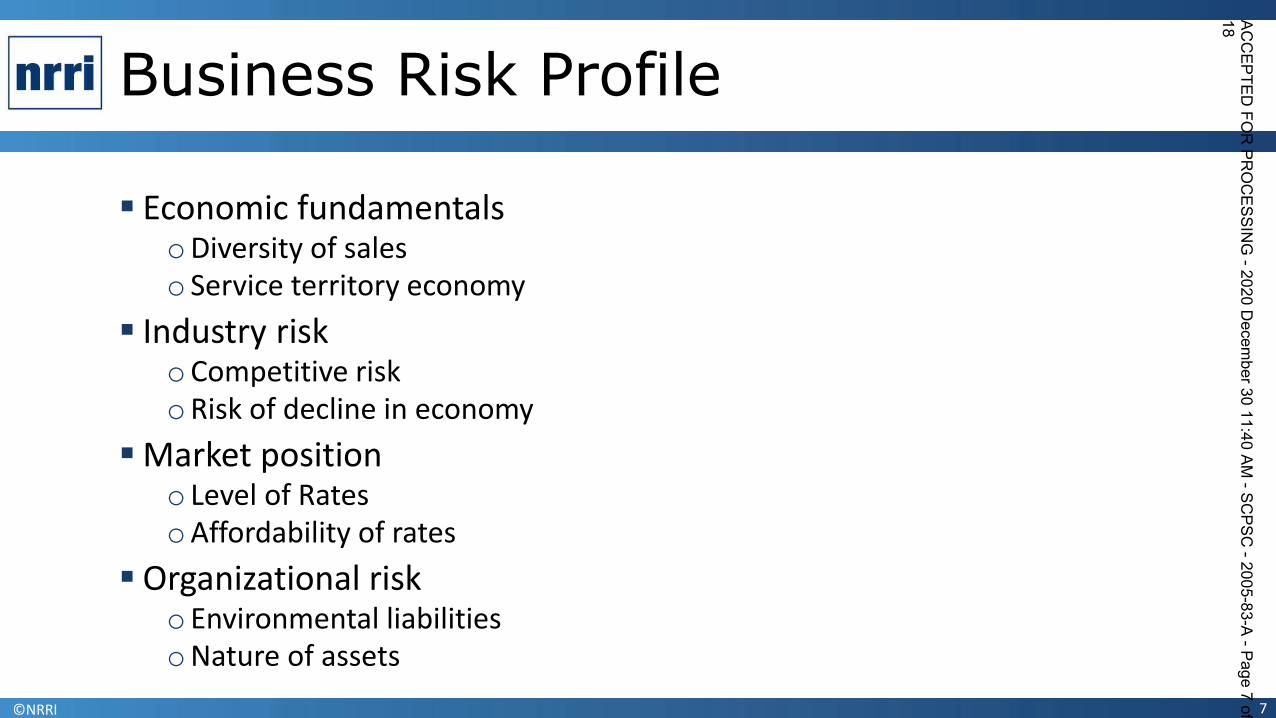
Business Risk Profile
▪ Economic fundamentals oDiversity of saleso Service territory economy
▪ Industry riskoCompetitive risk oRisk of decline in economy
▪ Market positiono Level of RatesoAffordability of rates
▪ Organizational risko Environmental liabilitiesoNature of assets
7
ACCEPTED
FORPR
OCESSIN
G-2020
Decem
ber3011:40
AM-SC
PSC-2005-83-A
-Page7of
18

©NRRI
Financial Risk Profile
▪Coverage is a measure of the utility’s ability to service debt and meet financial obligations. The higher the coverage ratio the more capable of servicing debt
▪Liquidity is access to cash required to run the business
▪Debt and liabilities – are an indication of what the utility ownso Liabilities may be purchase power agreements for which the utility has
contractual obligations
8
ACCEPTED
FORPR
OCESSIN
G-2020
Decem
ber3011:40
AM-SC
PSC-2005-83-A
-Page8of
18

©NRRI
Regulatory Advantage
▪ Assesses business characteristics affected by regulation, including:oRegulatory stability
oRecoverability of operating and capital costs
o Timeliness of cost recovery
oRecovery of unexpected costs
oAbility to attract long-term capital
▪ Greater weight placed on regulatory advantage for utilities than on competitive advantage for other sectors
9
Source: Ratings Methodology for Utilities, Todd A. Shipman, Presentation to CPUC, May 21, 2015 www.cpuc.ca.gov/uploadedFiles/CPUC_Public_Website/Content/About_Us/Organization/Divisions/Policy_and_Planning/Thought_Leaders_Events/150521_SlidesSPCPUCMay2015_2Shipman(1).pdf
ACCEPTED
FORPR
OCESSIN
G-2020
Decem
ber3011:40
AM-SC
PSC-2005-83-A
-Page9of
18
©NRRI
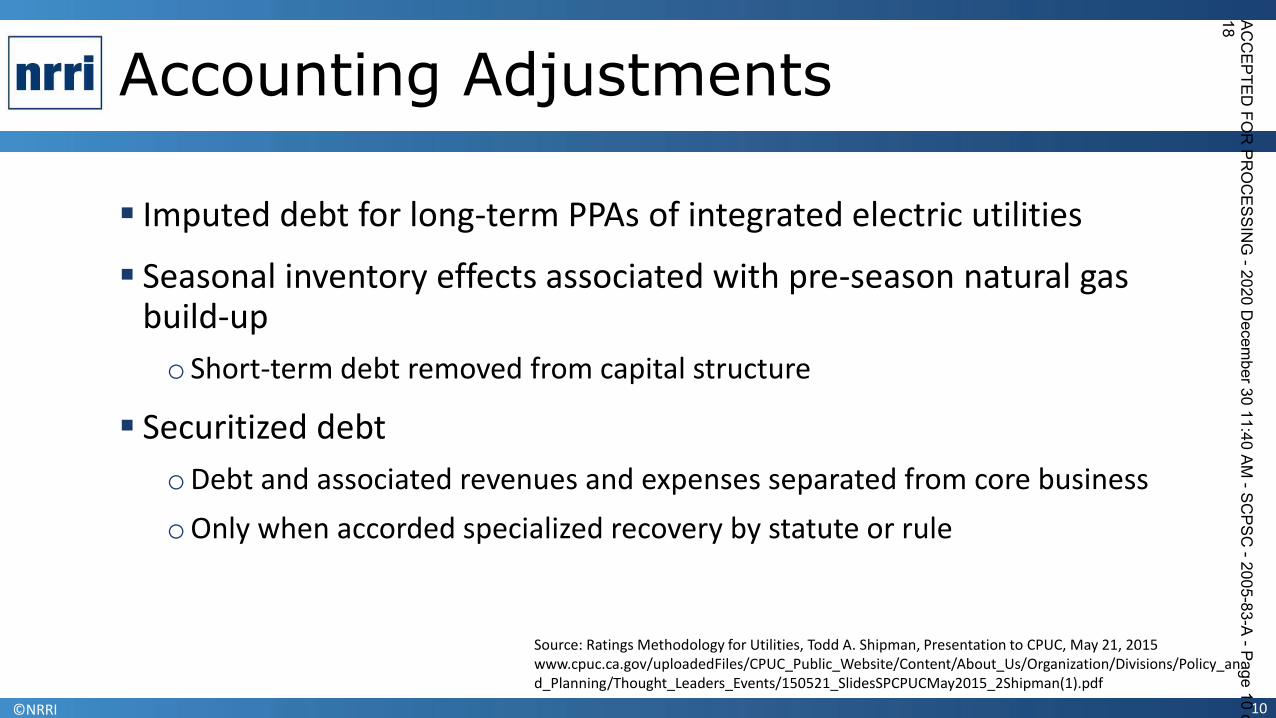
Accounting Adjustments
▪ Imputed debt for long-term PPAs of integrated electric utilities
▪ Seasonal inventory effects associated with pre-season natural gas build-up
o Short-term debt removed from capital structure
▪ Securitized debt
oDebt and associated revenues and expenses separated from core business
oOnly when accorded specialized recovery by statute or rule
10
Source: Ratings Methodology for Utilities, Todd A. Shipman, Presentation to CPUC, May 21, 2015 www.cpuc.ca.gov/uploadedFiles/CPUC_Public_Website/Content/About_Us/Organization/Divisions/Policy_and_Planning/Thought_Leaders_Events/150521_SlidesSPCPUCMay2015_2Shipman(1).pdf
ACCEPTED
FORPR
OCESSIN
G-2020
Decem
ber3011:40
AM-SC
PSC-2005-83-A
-Page10
of18

©NRRI
Benchmarking and Group Rating
▪ Aspects of regulated business used as criteria to assign utilities to benchmark tables
oPercentage of operating cash flow from regulated operations
o Strength of regulatory advantage
▪ Regulated entities may be rated higher than parent group if
o Financially independent and severable; no commingling of funds
o Subject to regulatory restrictions or active regulatory oversight
oParent has strategic and economic interest in preserving the subsidiary
11
Source: Ratings Methodology for Utilities, Todd A. Shipman, Presentation to CPUC, May 21, 2015 www.cpuc.ca.gov/uploadedFiles/CPUC_Public_Website/Content/About_Us/Organization/Divisions/Policy_and_Planning/Thought_Leaders_Events/150521_SlidesSPCPUCMay2015_2Shipman(1).pdf
ACCEPTED
FORPR
OCESSIN
G-2020
Decem
ber3011:40
AM-SC
PSC-2005-83-A
-Page11
of18
©NRRI
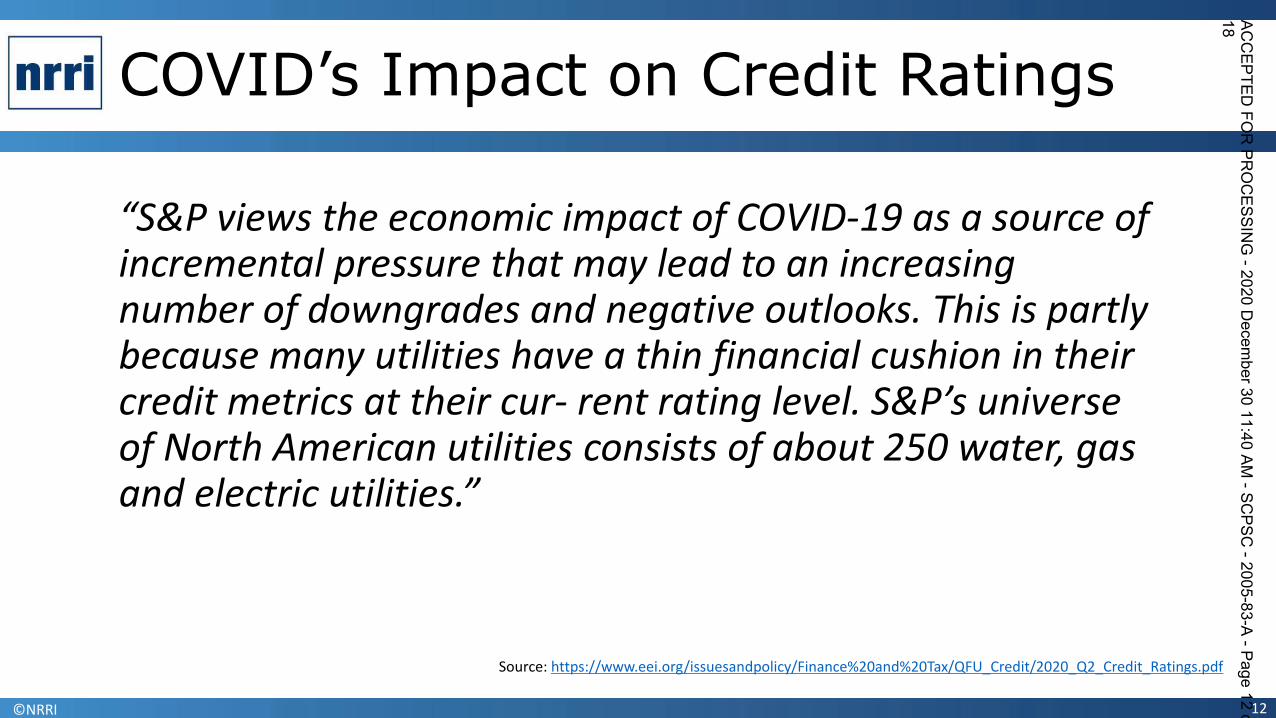
COVID’s Impact on Credit Ratings
“S&P views the economic impact of COVID-19 as a source of incremental pressure that may lead to an increasing number of downgrades and negative outlooks. This is partly because many utilities have a thin financial cushion in their credit metrics at their cur- rent rating level. S&P’s universe of North American utilities consists of about 250 water, gas and electric utilities.”
12
Source: https://www.eei.org/issuesandpolicy/Finance%20and%20Tax/QFU_Credit/2020_Q2_Credit_Ratings.pdf
ACCEPTED
FORPR
OCESSIN
G-2020
Decem
ber3011:40
AM-SC
PSC-2005-83-A
-Page12
of18

©NRRI
Regulation affects credit quality
▪ Most obvious – higher rates improve cash flow, at cost of consumers, balance is required.
▪ Prudence disallowances
▪ Adjustment mechanisms
oDecoupling
o Fuel adjustment clause
▪ Financial support for large scale projects
13
ACCEPTED
FORPR
OCESSIN
G-2020
Decem
ber3011:40
AM-SC
PSC-2005-83-A
-Page13
of18

©NRRI
The Importance of Prudence
▪ The Prudence Criteria determines what costs (both capital costs and operating costs are recovered in rates
▪ Indian Point Nuclear refueling
▪ Between 1981 and 1991, PUCs disallowed $19 billion cost recovery (in present value terms, that is more than $100 billion)
▪ More recently, Mississippi Power and Light entered into an agreement with the Mississippi Public Service Commission that disallowed $6.4 billion related to failed technology at the Kemper County Power Plan lignite coal gasification facilities
▪ Traditionally, prudence is evaluated when a utility seeks cost recovery – i.e., when adding to rate base
14
ACCEPTED
FORPR
OCESSIN
G-2020
Decem
ber3011:40
AM-SC
PSC-2005-83-A
-Page14
of18

©NRRI
Decoupling insulates utility revenues from impact of energy efficiency
▪ Rate issues arises because rates are designed with capital cost recovery in the variable portion of rates
▪ When customers conserve, the utility loses revenues for capital cost recovery
▪ This provides a dis-incentive for utilities to pursue energy conservation (also disincentive for customer sided solar)
▪ Decoupling removes disincentive by creating a tracking account for estimated lost revenues
▪ Tracking account is then recovered from ratepayers – making utility whole
▪ One of three legs of stool to encourage energy efficiency – other two legs – financial incentives and cost recovery of EE expenses
15
ACCEPTED
FORPR
OCESSIN
G-2020
Decem
ber3011:40
AM-SC
PSC-2005-83-A
-Page15
of18
©NRRI
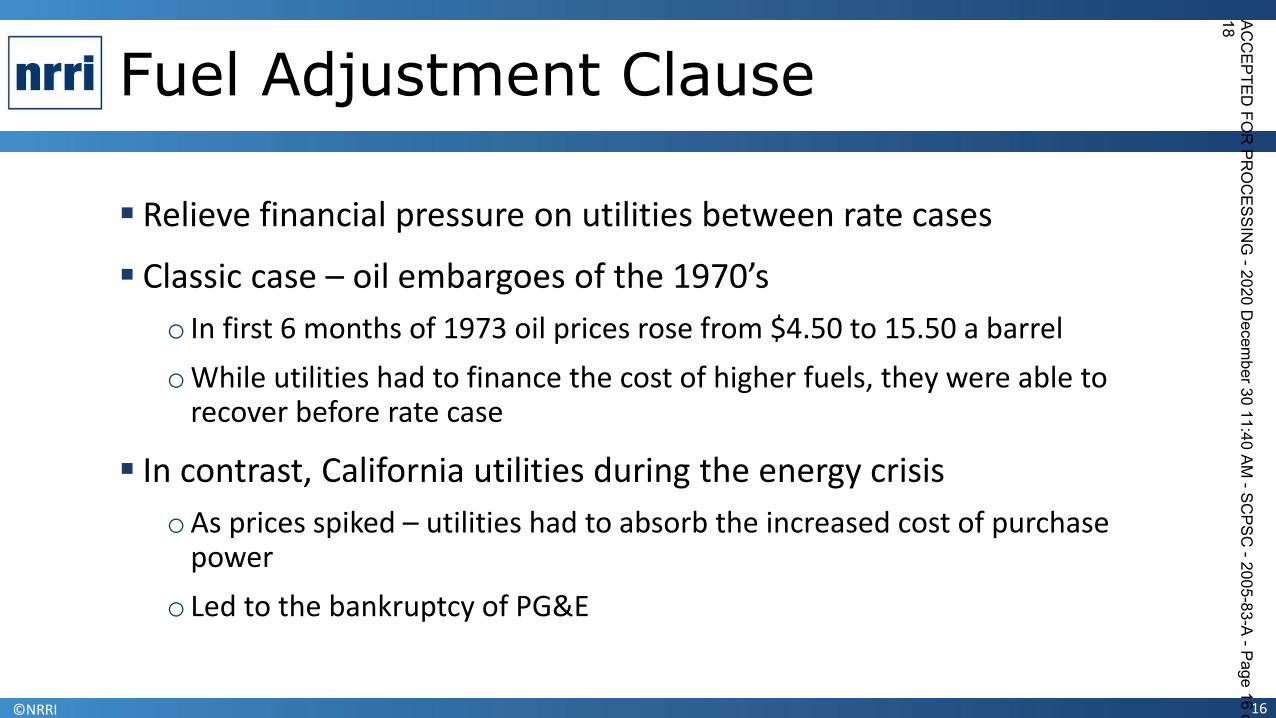
Fuel Adjustment Clause
▪ Relieve financial pressure on utilities between rate cases
▪ Classic case – oil embargoes of the 1970’s
o In first 6 months of 1973 oil prices rose from $4.50 to 15.50 a barrel
oWhile utilities had to finance the cost of higher fuels, they were able to recover before rate case
▪ In contrast, California utilities during the energy crisis
oAs prices spiked – utilities had to absorb the increased cost of purchase power
o Led to the bankruptcy of PG&E
16
ACCEPTED
FORPR
OCESSIN
G-2020
Decem
ber3011:40
AM-SC
PSC-2005-83-A
-Page16
of18
©NRRI
Regulatory Support Facilitated Large Capital Investments
▪ Around 2005 there was a significant push to build new coal plants
▪ State PUC’s provided financial support in a number of ways
oPre-declarations of prudence
▪ Helps insulate utility from uneconomic investments when factors change
o Enhanced cash flow during construction
▪ Return on CWIP – enhances cash flow – reduces rate shock
o Fuel adjustment clauses reduce the risk of fuel volatility
▪ Regularity support improves credit quality
▪ Demonstrates
17
ACCEPTED
FORPR
OCESSIN
G-2020
Decem
ber3011:40
AM-SC
PSC-2005-83-A
-Page17
of18

©NRRI
The ultimate regulatory decision – to allow a utility to go bankrupt
▪ When a utility is on the verge of bankruptcy, the PUC must determine whether to provide financial support through higher rates
▪ It is a weighing process
▪ Bankruptcy is expensive (high transactions costs)
▪ Regulatory authority shifts to Bankruptcy court – not a court of equity
▪ Search for solutions – find a financially stronger financial partner.
▪ Regulatory / legislative commitments
18
ACCEPTED
FORPR
OCESSIN
G-2020
Decem
ber3011:40
AM-SC
PSC-2005-83-A
-Page18
of18
Related Documents