WP/10/98 Regulatory Capital Charges for Too-Connected-to-Fail Institutions: A Practical Proposal Jorge A. Chan-Lau

Welcome message from author
This document is posted to help you gain knowledge. Please leave a comment to let me know what you think about it! Share it to your friends and learn new things together.
Transcript
WP/10/98
Regulatory Capital Charges for Too-Connected-to-Fail Institutions:
A Practical Proposal
Jorge A. Chan-Lau
© 2009 International Monetary Fund WP/10/98
IMF Working Paper
Western Hemisphere Department
Regulatory Capital Charges for Too-Connected-to-Fail Institutions:A Practical Proposal1
Prepared by Jorge A. Chan-Lau
Authorized for distribution by Robert Rennhack
April 2010
Abstract
This Working Paper should not be reported as representing the views of the IMF.The views expressed in this Working Paper are those of the author(s) and do not necessarily represent those of the IMF or IMF policy. Working Papers describe research in progress by the author(s) and are published to elicit comments and to further debate.
The recent financial crisis has highlighted once more that interconnectedness in the financial system is a major source of systemic risk. I suggest a practical way to levy regulatory capital charges based on the degree of interconnectedness among financial institutions. Namely, the charges are based on the institution’s incremental contribution to systemic risk. The imposition of such capital charges could go a long way towards internalizing the negative externalities associated with too-connected-to-fail institutions and providing managerial incentives to strengthen an institution’s solvency position, and avoid too much homogeneityand excessive reliance on the same counterparties in the financial industry.
JEL Classification Numbers:G01, G18, G28, G32
Keywords:Regulatory capital, too-connected-to-fail, incremental portfolio, financial institutions, CoRisk, network analysis, perimeter of regulation, systemic risk
Author’s E-Mail Address: [email protected]
1 The paper benefits from comments and suggestions by M. Cerisola, A. Garcia, C. Gauthier, T. Gravelle, M. Kaufmann, B. Johnston, F. Li, L. Lipscomb, O. Melander, J. Mencía, M. Misina, G. de Nicolo, R. Rennhack, A. Santos, M.Souissi,T. Tressel, A. Vamvakidis, Y. Xiao and seminar participants at the Financial Stability Department, Bank of Canada. All errors and omissions are the author’s sole responsibility.

2
Contents Page
I. Financial Crisis, Interconnectedness and Regulatory Capital ................................................3
II. The Too-Connected-To-Fail Capital Charge: A Simple but Powerful Concept...................5A. Societal Losses..........................................................................................................5B. A Two-Bank Example...............................................................................................6C. From Societal Losses to Too-Connected-to-Fail Capital Charges: the Incremental Portfolio Approach ....................................................................................6D. Differences with Other Approaches........................................................................10
III. A Basic Toolkit For Calculating TCTF Capital Charges...................................................10A. CoRisk Analysis......................................................................................................11B. Network Analysis....................................................................................................13C. The One-Factor Credit Portfolio Risk Model .........................................................16
IV. An Illustrative Example.....................................................................................................17
V. Conclusions.........................................................................................................................20
References................................................................................................................................23
Figures1. The incremental contribution of the default of institution J to societal loss..........................72. AIG and Lehman Brothers CoRisk......................................................................................123. Network analysis: a diagrammatic representation of cascading bank failures ....................14
Tables1. Average increase of the probability of default due to the failure of other institution......... 182. Too-Connected-to-Fail capital charges for global financial institutions .............................19

3
I. FINANCIAL CRISIS, INTERCONNECTEDNESS AND REGULATORY CAPITAL
Problems experienced in the U.S. subprime mortgage market in mid-2007 rapidly escalatedto a liquidity crisis in the financial system, leading to a full blown financial crisis in 2008-9and the worst global recession experienced since the Great Depression in 1929. The economic consequences of the crisis have been substantial. Writedowns in the banking sector through the first half of 2009 amounted to $1.3 trillion and going forward, they may increase to $2.8 trillion (IMF, 2009b). The financial crisis led to a large contraction of the real economy of around1 percent in real terms in 2009. The contraction could have been larger without massive fiscal stimulus plans adopted by governments. For instance, discretionary government spending among the G20 economies would amount to 2 percent of GDP for 2009 and 1½ percent for 2010 relative to 2007 baselines (IMF, 2009c).
The substantial costs associated with the crisis, which originated in the banking and financial sectors, have raised concerns in regard to whether the financial regulatory framework provides adequate safeguards against externalities affecting the systemic financial stability . One such externality is associated with the Too-Big-to-Fail (TBTF) problem, which motivated heavy government support of large financial institutions in advanced countries. Such a problem, in principle, could be prevented by imposing limits on the scope and scale of the activities undertaken by a financial institution at the expense of foregoing economies of scale.
A more insidious externality, which arises naturally from the increased interdependence and globalization of the financial system, is associated with the Too-Connected-to-Fail (TCTF) problem. Arguably, the problems experienced in the payment and settlement system following the liquidation of Herstatt bank in 1974 were an earlier manifestation of the TCTF problem. The arguments put forward by the Federal Reserve Bank of New York in 1998 for coordinating the rescue of Long Term Capital Management, a hedge fund, by a consortium of private institutions were also closely related to the TCTF problem. More recently, the TCTF problem was dramatically illustrated by the increased volatility and liquidity shortages affecting financial institutions in the aftermath of the demise of Lehman Brothers, an investment bank, on September 15, 2008. Partly motivated by these developments, American International Group (AIG), an insurance company, was bailed out the next day to prevent a disorderly unwinding of AIG’s credit derivatives exposure and its potential negative consequences on the financial system.
In order to deal with the TCTF problem, the paper introduces regulatory capital charges proportional to how interconnected an institution is within a financial system or to other systemic institutions. Until now, regulatory capital charges, especially those based on theBasel I and Basel II frameworks, focus mainly on the risks related to an individual institution’s trading and loan books. In contrast, a Too-Connected-to-Fail Capital Chargepenalizes institutions by their incremental contribution to the risk of other institutions. As one institution fails, the domino effect increases the risk of failure of other institutions and the potential costs that must be borne by the government, and ultimately, by the taxpayers.
One clear benefit of an interconnectedness capital charge is that it induces institutions tointernalize the costs associated with Too-Connected-to-Fail. Therefore, the capital charge
4
may provide managerial incentives to avoid too much homogeneity in the financial system and excessive reliance on a reduced number of counterparties. The adoption of a TCTFcapital charge also goes along the calls for imposing more and higher quality capital requirements for systemically important institutions (Acharya and Richardson, 2009; Brunnermeier et al, 2009; Bernanke, 2009), and the capital charges should reflect the market interaction between firms (Milne, 2009; Tarullo, 2009).2 The TCTF capital charge could also complement the recent proposal by the IMF to make banks pay insurance fees to fund future rescues in the sector.3
The TCTF capital charge represents a step forward to meet calls on the reform of the regulatory framework with a practical methodology for allocating capital for systemic risk, in the same spirit as recent proposals advanced by Adrian and Brunnermeier (2009), Gauthier, Lehar, and Souissi (2009), and Tarashev, Borio, and Tsatsaronis (2009).4 Furthermore, the proposed capital charge methodology extends and integrates work on systemic risk indicators based on credit risk models (Chan-Lau and Gravelle, 2005, Huang, Zhou, and Zhu, forthcoming), CoRisk measures (Adrian and Brunnermeier, 2009; Chan-Lau, 2008), and network analysis (Aikman et al, 2009), along the lines proposed in the Basel II framework.
The rest of this paper explains the TCTF capital charge methodology in detail. Section II explains the conceptual issues underlying the proposed TCTF capital charge, introduces the concept of the incremental portfolio and incremental contribution to systemic risk, and highlight the differences with earlier contributions. Section III introduces a basic toolkit for calculating the TCTF capital charges. The toolkit relies on three methods, CoRisk, networkanalysis, and one-factor credit risk portfolio models, to quantify the marginal contribution to risk arising from direct and indirect exposures. Some advantages of these methods is that they are relatively easy to implement and that the interpretation of the results is simple and intuitive. The usefulness of the methods is fully examined in Section IV, which illustrates the computation of the TCTF capital charge for a set of financial institutions using CoRiskanalysis and data on expected default frequencies (EDFs) from Moody’s KMV. Finally, Section V concludes by discussing how the TCTF capital charge methodology bears on procyclicality, the imposition of capital charges, macro-financial linkages and the perimeter of regulation.
2 While the reform proposals have been mainly discussed in the context of advanced economies, their implications for emerging market countries, such as those belonging to the G20, are important. For instance, see Rennhack (2009) for a timely an in-depth discussion of how prospective reforms may affect Latin America.
3 IMF exploring insurance levy on banks, November 8, 2009 (Reuters).
4 In particular, the interconnectedness capital charge complements and improves upon the CoVaR-based capital measures proposed by Adrian and Brunnermeier (2009), which are based on the dependence between asset returns. The TCTF capital charge, instead, focuses on the credit losses likely to be bear by taxpayers and addresses directly the costs default imposes on society. In contrast to Tarashev et al (2009), the TCTF accounts for the potential increase in the probability of default conditional on the failure of other institutions, that can be calculated with the use of CoRisk analysis and network analysis among other methods (section III below). Also, the concept of incremental or marginal contribution to systemic risk is different (section II below for details).

5
II. THE TOO-CONNECTED-TO-FAIL CAPITAL CHARGE: A SIMPLE BUT
POWERFUL CONCEPT
As highlighted in IMF (2009a) the globalization of the financial system and the expansion of large complex financial institution onto an array of diverse activities that transcend national boundaries have led to stronger linkages and interconnectedness across institutions, whether regulated or not.5 This section first explains why societal loss is the right risk metric for measuring losses associated with TCTF, illustrates the concept of the TCTF capital charge using a simple intuitive example, and shows how to use societal loss distributions for calculating the TCTF capital charges for an institution.
A. Societal Losses
In a highly interconnected system, the failure of one institution is likely to trigger the failure of other institutions due to either direct or indirect sources of exposures. Direct exposure can arise from interbank claims and/or counterparty exposure from derivatives transactions. An institution may have also accumulated a substantial exposure through credit derivatives contracts to the credit risk of an otherwise unrelated institution, as it was the case with AIG.Among indirect exposures, the similarities of investment portfolios and trading strategies subject them to substantial mark-to-market losses if the bankruptcy of one institution forces a disorderly fire-sale of assets at drastically reduced prices.
Societal loss is the proper risk metric for assessing the TCTF capital charge. Either due to direct or indirect exposures, the externalities associated with the failure of a too-big-to-fail or too-interconnected-to-fail institution force the government to partly assume some of the losses, which are ultimately borne out by taxpayers. It becomes natural, therefore, that the TCTF capital charge reflects the incremental contribution of the default of one institution to the potential societal loss from the surviving institutions.
The definition of societal loss is rather flexible and should be determined by the systemic regulatory agency. The operational definition depends on the dominant features of the financial system it oversees. In a country where the financial system comprises mostly deposit-taking institutions the measure of societal loss could be associated to potential deposit losses. If pension funds are among the main sources of funding to domestic banks, it may be justified to include as societal losses potential losses faced by pension funds in case financial institutions fail. The recent experience in the U.S. indicates that societal losses could be roughly proxied by the potential losses associated with the bank liabilities sincemany of the government measures effectively guarantee the claims of banks’ senior creditors. Indeed, the implicit U.S. government guarantee was priced in the market as shown by the convergence of the U.S. sovereign and banks’ credit default swaps following the implementation of support measures.
5 For a detailed account on the systemic risks posed by financial globalization and how they contribute to interconnectedness, see Chan-Lau (2008).
6
B. A Two-Bank Example
The following two-bank example helps to clarify the intuition underlying the interconnectedness capital charge. Suppose that the two banks, A and B, are identical. Each bank holds $100 million and their unconditional probability of default is 5 percent. If one bank defaults, all deposits are lost and the probability of default of the surviving bank increases to 6 percent. Since deposits, in this example, are guaranteed by the government, the societal cost is equal to the losses suffered by the depositors. In isolation, the expected societal loss from the default of any of the two banks is $5 million (5 percent times the amount of deposits, $100 million). If bank A defaults, the expected societal loss from the subsequent default of bank B increases to $6 million (6 percent times $100 million).
In this example, the incremental contribution to societal loss of the default of bank A is $1 million, or the increase in the expected losses of bank B ($6 million minus $5 million). The TCTF capital charge should be proportional to the incremental contribution of $1 million. For instance, if capital charges (or provisions, in this example) were set equal to the expected loss, bank A would have to hold $6 million in capital: $5 million corresponding to its unconditional expected loss, and an additional $1 million corresponding to the expected losses its default induces on bank B.
C. From Societal Losses to Too-Connected-to-Fail Capital Charges: the Incremental Portfolio Approach
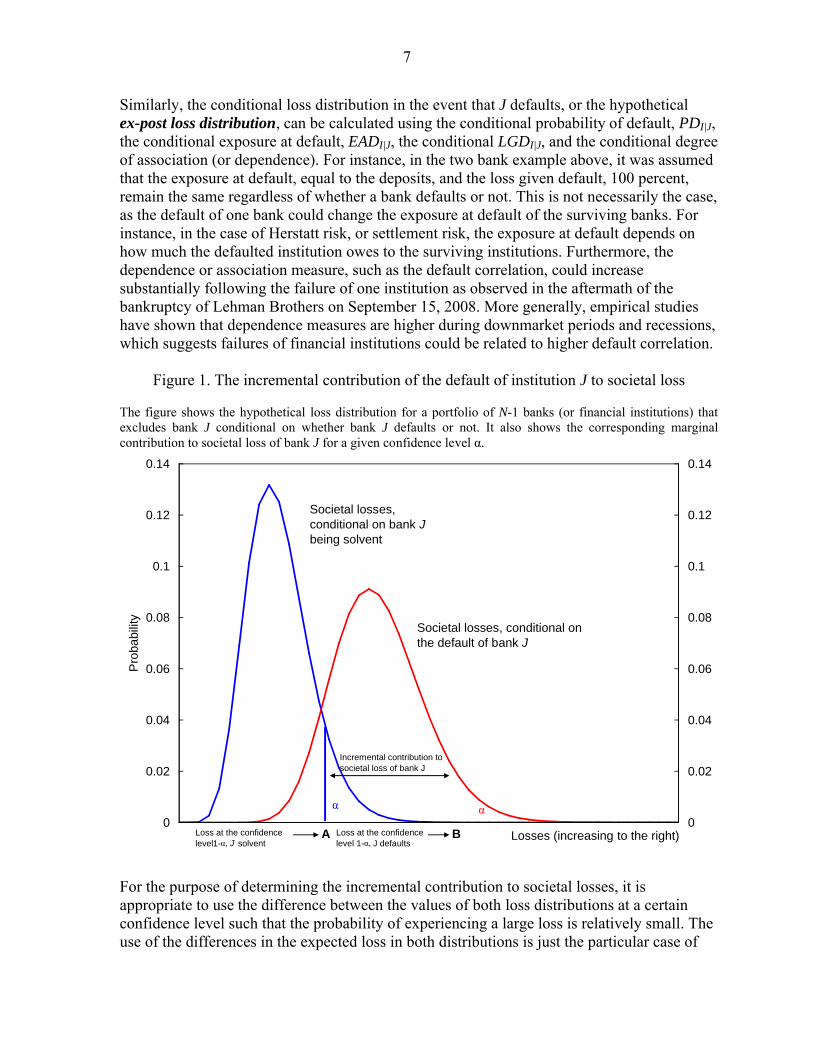
More generally, the TCTF capital charge for a specific institution should be assessed based on the differences between the conditional societal loss distributions when the institution survives and defaults respectively. Furthermore, in line with current practice established under the Basel Accord, the comparison between the loss distributions should be based on a predetermined confidence level set up by the regulatory authority. This is summarized in Figure 1. The Figure depicts the hypothetical case of N banks or systemic financial institutions of interest to the regulator. The incremental contribution to societal loss of bank Jis determined by comparing changes in the loss distribution of the other N-1 banks when the bank J is solvent and when bank J defaults.
The calculations to assess the incremental contribution of bank J on the system, based on known techniques for risk budgeting (Litterman, 1996), are described below.
The starting point is a portfolio of N-1 banks that excludes bank J. This portfolio is referred to as the N-J portfolio, or the incremental portfolio of institution J. The loss distribution over a fixed time horizon conditional on the survival of bank J is calculated for the N-J portfolio using the probability of default, PDI, exposure at default, EADI, and the loss given default, LGDI. Depending on the loss distribution model used, it would also be necessary to specify the degree of association (or dependence) between the probabilities of default of the banks in the N-J portfolio. For instance, in the case of the one-factor Gaussian model (or Gaussian copula), the dependence parameter is the correlation of the asset values of the banks with a common factor. The loss distribution associated with the survival of institution J is referred to as the hypothetical ex-ante loss distribution, i.e. prior to the failure of the institution.
7
Similarly, the conditional loss distribution in the event that J defaults, or the hypothetical ex-post loss distribution, can be calculated using the conditional probability of default, PDI|J, the conditional exposure at default, EADI|J, the conditional LGDI|J, and the conditional degree of association (or dependence). For instance, in the two bank example above, it was assumed that the exposure at default, equal to the deposits, and the loss given default, 100 percent, remain the same regardless of whether a bank defaults or not. This is not necessarily the case, as the default of one bank could change the exposure at default of the surviving banks. For instance, in the case of Herstatt risk, or settlement risk, the exposure at default depends on how much the defaulted institution owes to the surviving institutions. Furthermore, the dependence or association measure, such as the default correlation, could increase substantially following the failure of one institution as observed in the aftermath of the bankruptcy of Lehman Brothers on September 15, 2008. More generally, empirical studies have shown that dependence measures are higher during downmarket periods and recessions, which suggests failures of financial institutions could be related to higher default correlation.
Figure 1. The incremental contribution of the default of institution J to societal loss
The figure shows the hypothetical loss distribution for a portfolio of N-1 banks (or financial institutions) that excludes bank J conditional on whether bank J defaults or not. It also shows the corresponding marginal contribution to societal loss of bank J for a given confidence level α.
0
0.02
0.04
0.06
0.08
0.1
0.12
0.14
Losses (increasing to the right)
Pro
ba
bilit
y
0
0.02
0.04
0.06
0.08
0.1
0.12
0.14
Societal losses, conditional on bank J being solvent
Societal losses, conditional on the default of bank J
α α
Loss at the confidence level1-α, J solvent
Loss at the confidence level 1-α, J defaults
Incremental contribution to societal loss of bank J
A B
For the purpose of determining the incremental contribution to societal losses, it is appropriate to use the difference between the values of both loss distributions at a certain confidence level such that the probability of experiencing a large loss is relatively small. The use of the differences in the expected loss in both distributions is just the particular case of
8
setting the confidence level at 50 percent. Furthermore, the use of a confidence level is also the standard practice for the calculation of economic and regulatory capital using Value-at-Risk (VaR) models, which facilitates the adoption of the interconnectedness capital charge by regulatory agencies. Alternatively, it is possible to use Expected Shortfall (ES) rather than VaR or other coherent risk measures.6 For illustration purposes only, the discussion below focuses on VaR but extending the methodology to other risk measures is straightforward.
Consequently, as shown in Figure 1, for a confidence level of 1-α, the incrementalcontribution to societal loss of bank J is equal to B-A, the difference between the VaRα
values of the conditional and unconditional loss distributions respectively:
(1)
Incremental contribution to societal loss of Bank
(Loss distribution when defaults)
(Loss distribution when is solvent)
J
VaR J
VaR J
Once the incremental contribution to societal loss is calculated, the TCTF capital charge can be calculated simply as the product of the probability of default of bank J times the incremental contribution to societal loss:
(2)
Too-Connected-to-Fail capital charge for Bank =
Incremental contribution to societal loss of Bank
Probability of default of Bank
J
J
J
In the two-bank example above the interconnectedness capital charge for any of the banks will be $50000 (5 percent times $1 million). The magnitude of the TCTF capital charge of an institution increases with its incremental contribution to societal loss and with the probability it defaults. So imposing this charge provides banks with incentives to either change their business activities to reduce the risk they pose to other banks or to take measures aimed to strengthen their solvency.
Summarizing, the steps for calculating the interconnectedness capital charge for an institutionJ in relation to a group of connected institutions are:
1. For each institution other than J, specify the probability of default of the remaining institutions in the events that institution J survives or defaults.
2. Similarly, for each one of the institutions in step 1 determine the societal exposure at default and the societal loss given default for each of the two events. Typical choices are the nominal amount of potential losses incurred by the government in case that the institutions default.
6 See Artzner, Delbaen, Eber and Heath (1999) on coherent risk measures..
9
3. Construct the societal loss distributions for the incremental portfolio that comprises all institutions excluding institution J under the events that J survives, ex-ante loss distribution, or defaults, ex-post loss distribution.
4. Pick up a given confidence level. Typical values correspond to those used for calculating Value-at-Risk (VaR), i.e. 95 percent, 99 percent, and 99.5 percent(alternatively, a tail-risk measure such as Expected Shortfall (ES) can be used).
5. Calculate the VaR in the ex-ante and ex-post societal loss distributions at the specified confidence level.
6. Calculate the incremental contribution to societal loss as the difference between the VaR conditional on the default of institution J (VaR of ex-ante loss distribution) and the VaR conditional on the survival of institution J (VaR of ex-post loss distribution).
7. Calculate the TCTF capital charge as the product of the probability of default of institution J and its incremental contribution to societal loss.
Among the steps above, the most difficult ones are likely related to step 1, the specification of the probability of default, but in particular to step 2, the determination of the exposure at default and loss given default. Step 3 requires the specification of a loss distribution model and its associated characteristics. Foremost among them is the specification of the degree of association or dependence, i.e. in layman terms, comovement, between the probabilities of default of individual institutions. Steps 4 to 7 are relatively straightforward after the specification of the required elements in steps 1 to 3.
Section III describes how the probabilities of default can be calculated using two methodologies, CoRisk analysis and network analysis. The calculation of the societal exposure at default and the corresponding loss given default is somewhat more complicated. To start with, the academic and practitioners’ advances on these two topics, even for corporate credit risk, are still evolving and at a relatively primitive stage compared with advances on the calculation of the probability of default. Under these circumstances, it may be appropriate to use rough estimates of the exposure at default and loss given default based on the liabilities that could potentially be guaranteed by the government if a financial institution were to default. While these liabilities should include at least deposits, policy responses during the recent crisis suggest that it would be justifiable to also include senior creditor claims.
Finally, it is worth mentioning that a rigorous calculation of the TCTF capital charge requires an iterative process, or finding a fixed point, as emphasized in Gauthier, Lehar and Souissi (2009). Equation (2) points out that the capital charge depends on the probability of default. The addition of the TCTF capital charge increases the capital of the institution and reduces its leverage. Lower leverage usually contributes to lower asset volatility. As a result, the probability of default of the institution declines and in turn, it reduces the TCTF capital charge. From a regulatory perspective, however, a one iteration of the TCTF capital charge errs on the conservative side and appears to be a second-best solution in a world where optimal solutions are unfeasible due to data quality and model risk.
10
D. Differences with Other Approaches
The step-by-step summary helps to highlight the difference between the TCTF capital charge and the systemic risk capital charge recently proposed by Tarashev, Borio, and Tsatsaronis (2009), and Gauthier, Lehar, and Souissi (2009). While similar in spirit, there are two important differences between these two approaches and the one presented here.
The first difference is related to the measurement of an institution’s contribution to systemic risk. The incremental contribution to risk of a specific institution, as explained in the section above, is proportional to the change in the risk metrics of a reference portfolio, i.e. VaR or expected shortfall, induced by the failure of that institution. The reference portfolio in the TCTF capital charge excludes the failed institution both ex-ante and ex-post the failure event.In Tarashev et al (2009) and Gauthiers et al (2009), the capital charge for an institution is calculated in reference to two different portfolios. The first portfolio, or ex-ante portfolio, does not include the institution while the second portfolio, or ex-post portfolio, does. So in both approaches, the capital charge is based on the marginal contribution to risk from adding one institution to the ex-ante portfolio.7 Note that this portfolio building approach cannot account for the impact of the failure of one institution. Or in other words, the ex-ante and ex-post portfolios suggested by these authors are portfolios conditional on the event that the institution survives.
The second difference is related to the probabilities of default used in the calculation of the loss distributions. Because the ex-ante and ex-post portfolios do not consider the failure of the institution, both Tarashev et al and Gauthiers et al do not factor in the increase in default risk triggered by the failure of one institution as it is done in the TCTF capital charge. Similarly, changes in other parameters such as the societal exposure at default or the degree of association, i.e. correlation, between institutions are not accounted for. It is important to note, that, as in the case of Tarashev et al, the methodology to calculate the TCTF capital charge can be generalized to accommodate the simultaneous default of more than one institution, since this is not a limitation in the CoRisk and network analysis methods described below.
III. A BASIC TOOLKIT FOR CALCULATING TCTF CAPITAL CHARGES
As explained above, the first step in the calculation of the TCTF capital charge for a given institution requires knowing how the institution’s survival or default affects the probability of default of other institutions. For systemic institutions, the calculation in the former case is relatively straightforward as probability of default estimates may be readily available fromrisk data providers such as Moody’s KMV. Alternatively, they can be obtained from market prices such as CDS and bond spreads, or equity prices, using reduced form and/or structural models of default risk and adjusting for the market price of risk. The calculation in the latter 7 The calculations involved in obtaining the maximal contribution to risk in setting up the ex-ante and ex-post portfolios are relatively complex since they involve the use of the Shapley values for each institution. See Tarashev, Borio, and Tsatsaronis (2009), and Gauthier, Lehar, and Souissi (2009) for details and further references.
11
case is more complex but fortunately some methodologies have been developed recently to address this task.
Once the individual probabilities of default have been calculated, it is necessary to use credit portfolio models to construct the loss distributions underlying the calculation of the TCTF capital charge. Credit portfolio models rely on a statistical technique, copulas, to construct the joint multivariate probability of defaults of the institutions included in the portfolio from the individual probabilities of default.
This section presents two useful methods for the estimation of conditional probabilities of default, the CoRisk analysis and network analysis. It also describes in detail the one-factor credit portfolio model as it is intuitive enough to understand what drives dependencies, i.e. comovements, across individual probabilities of default. The choice of the methods presented in this section is guided by their ease of implementation, but more importantly by their transparency and tractability, the latter two key characteristics to ensure model reliability and robustness. These characteristics facilitate the mapping of the model features to the underlying economic environment, identify model anomalies, suggest potential ways to deal with them, and equally important, make easier to communicate results and policy implications to senior decision makers.
A. CoRisk Analysis
As for the probabilities of default conditional on the failure of a specific institution, the use of CoRisk analysis provides a simple way to calculate them while accounting for market interaction due to either direct or indirect sources of exposure.
CoRisk analysis, based on the CoVaR analysis introduced by Adrian and Brunnermeier (2009) and extended in Chan-Lau (2010) to analyze interconnectedness risk between financial institutions, measures risk codependence, or how the risk of one institution reacts to changes in the risk of other institution after controlling for common risk factors. The risk codependence, or CoRisk, can be estimated using quantile regression.
In a quantile regression, first introduced by Koenker and Basset (1978), the response of the independent variable to a number of covariates can be sorted in ascending order by quantiles. Roughly speaking, in a linear quantile regression, the response at different quantiles is represented by a linear regression with different slopes for each linear regression. If the dependent variable is the probability of default of an institution, each quantile regression can be identified with different risk regimes, i.e. low risk to high risk. If among the covariates, in addition to aggregate risk factors, one includes the probability of default of another institution, the quantile regression estimates the CoRisk of the first institution to changes in the probability of default of the second institution at different quantile levels.8
8 The interpretation of quantile regression in the text assumes that the probability of default of the second institution “causes” the probability of default of the first institution, a typical problem in reduced form econometric models.
12
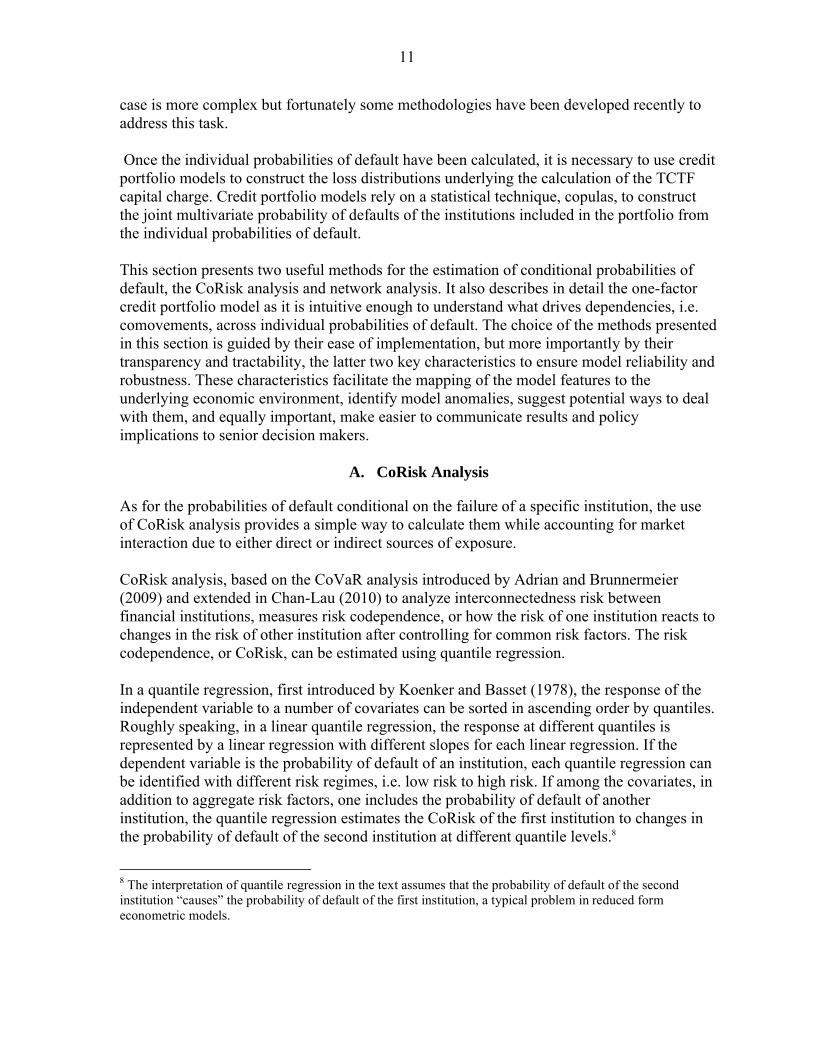
Figure 2 illustrates the use of quantile regressions to estimate CoRisk. In this illustration, credit default swaps (CDS) spreads are used to proxy probabilities of default. The scatter plotshows the relationship between the CDS spreads of Lehman Brothers and AIG credit default swap (CDS) spreads for the period for the period July 1, 2003 – September 12, 2008. It also shows the quantile regression for the 5th, 50th, and 95th quantiles, where the Lehman Brothers CDS was included among the covariates in addition to other common risk factors.9
The slope of the regression steeps up as the quantile of interest increases and indicates that during high risk regimes, i.e. regimes corresponding to higher quantiles, the CoRisk of AIG to Lehman Brothers is higher than in low risk regimes.
Figure 2. AIG and Lehman Brothers CoRisk
Source: IMF (2009a)
For the purpose of estimating the TCTF capital charge, the relevant quantile regression is:
(3) , ,
K
i k k j jk
PD R PD ,
where PD denotes the probability of default, Rk denotes the common factors, the quantile of interest, and the coefficients associated with the covariates.10
9 In order to obtain a two-dimensional figure, it is necessary to specify constant values for the additional variables constant. Therefore, Figure 2 is an approximate two-dimensional representation of the quantile regression.
10 Since the probabilities of default are bounded between 0 and 1, it is necessary to use a Cox transformation before estimating the CoRisk quantile regressions.
13
Two observations in regard to equation (3) are worth mentioning since they would ultimately affect the calculation of the TCTF capital charge. The first one corresponds to the choice of the quantile for the estimation of the probability of default conditional on the failure of one institution. This choice is subject to the discretion of the regulatory agency since it will be affected by the agency’s objectives and the inherent tradeoffs between the efficiency and safety of the financial system. For instance, in normal periods, it could be justified to use the 50th percent quantile regression. A more cautious approach would be to choose an upper quantile, such as the 95th or 99th quantiles. The tradeoff is that a higher quantile implies a higher TCTF capital requirement and a reduced supply of credit from the affected bank. It is worth keeping in mind, though, that the use of an upper quantile regression to set the TCTF capital charge is less vulnerable to procyclicality so it is better aligned with recent proposals for reducing the impact of procyclical capital requirements (Brunnermeier et al, 2009; IMF, 2009c).
The second observation concerns the value of the probability of default of the institutionassumed to fail in equation (3). The obvious choice is a value of one, as it indicates that the institution has already failed. Similarly to the choice of the quantile regression, the alternative to the use of a value of one is to use a value corresponding to the higherpercentiles, i.e. 95th percentile, of the historical distribution of the probabilities of default. This alternative is viable if the data covers at least one business cycle or major crisis episode. Another alternative is to use a threshold “intervention” probability of default in the calculations, especially under a prompt corrective action framework. Under this scenario, no institution defaults since the systemic regulator intervenes well ahead of the default event and requires the implementation of corrective measures. If the threshold for intervention can be associated with a specific probability of default, then the use of the latter in equation (3) is justified.
B. Network Analysis
CoRisk analysis relies on market-based estimates of the probability of default of an institution. These estimates are reliable as long as the market is pricing correctly the risks to the institution, either those arising from direct or indirect sources. If information on the direct exposures across institutions is available, network analysis provides a complementary approach for calculating probabilities of default conditional on the failure of one institutionand provides a cross-check to estimates based on CoRisk analysis. The use of network analysis could be very useful in jurisdictions where market data is either not available or reliable.
Network analysis starts from the fact that the balance sheets of institutions are linked by the direct exposures across institutions, e.g. interbank exposures.11 The liabilities of one institution constitute the assets of another institution. The default of the first institution has a
11 See IMF (2009a) for details and references. The data requirements for implementing network analysis, however, could be too onerous.
14
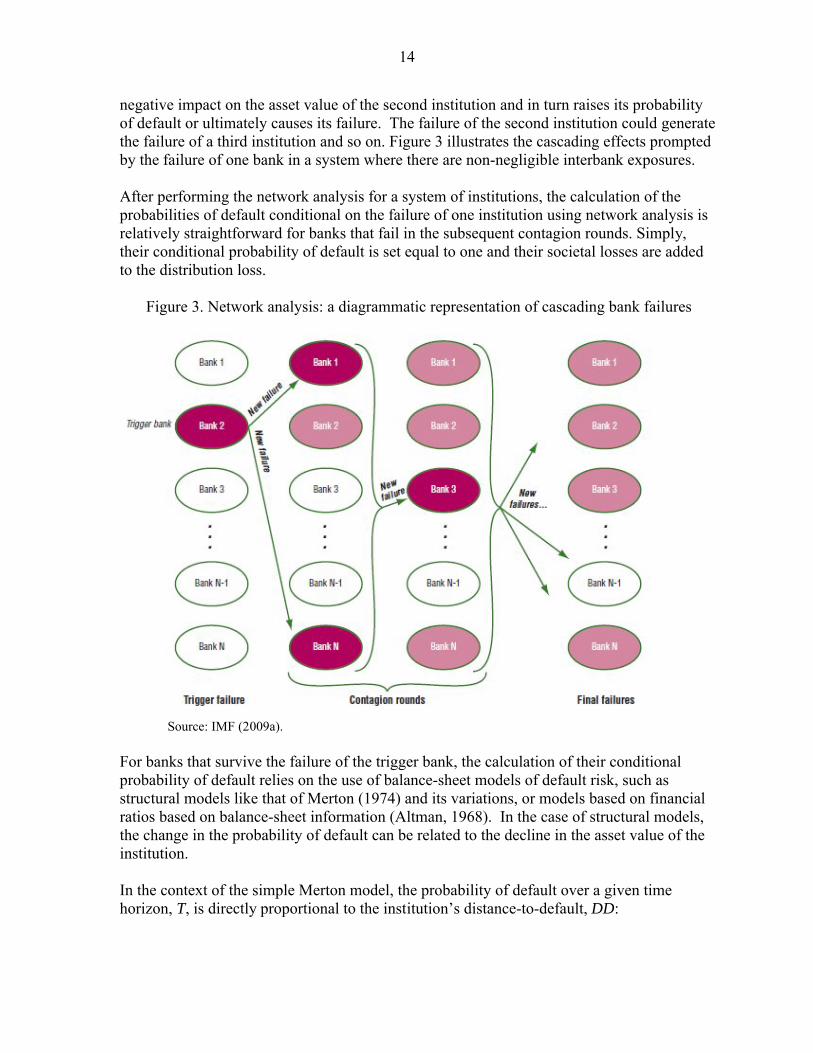
negative impact on the asset value of the second institution and in turn raises its probability of default or ultimately causes its failure. The failure of the second institution could generate the failure of a third institution and so on. Figure 3 illustrates the cascading effects prompted by the failure of one bank in a system where there are non-negligible interbank exposures.
After performing the network analysis for a system of institutions, the calculation of the probabilities of default conditional on the failure of one institution using network analysis is relatively straightforward for banks that fail in the subsequent contagion rounds. Simply, their conditional probability of default is set equal to one and their societal losses are added to the distribution loss.
Figure 3. Network analysis: a diagrammatic representation of cascading bank failures
Source: IMF (2009a).
For banks that survive the failure of the trigger bank, the calculation of their conditional probability of default relies on the use of balance-sheet models of default risk, such as structural models like that of Merton (1974) and its variations, or models based on financial ratios based on balance-sheet information (Altman, 1968). In the case of structural models, the change in the probability of default can be related to the decline in the asset value of the institution.
In the context of the simple Merton model, the probability of default over a given time horizon, T, is directly proportional to the institution’s distance-to-default, DD:
15
(4)
2
ln2
Ar T
LDD
T
,
where A is the asset value of the institution, L is the face value of its liabilities, r is the risk-free rate, and is the volatility of the asset value.12
Building on the balance sheet linkages across institutions, network analysis pinpoints exactly the change in the asset values of the firm. Furthermore, network analysis can also capture second-round effects due to the forced sale of assets due to the initial change in the asset value of the firm. The forced sale of assets may be prompted by margin calls, and in the case of regulated institutions, the need to rebuild capital ratios up to the minimum regulatory requirements. The sale of assets under distress would depress prices and further reduce the asset value of all surviving institutions.
Continuing the example of the Merton model, the risk-neutral probability of default of institution I, conditional on the failure of institution J, *
IPD , is simply given by13:
(5) * 1( | )IPD DD J ,
where is the cumulative normal distribution, and |DD J is the distance-to-default of institution I after accounting for negative impact on its balance sheet of the failure of institution J. The probability of default conditional on the default of institution J will likely increase vis-à-vis the value obtained when institution J survives, as the asset-liability ratio will deteriorate and the asset volatility will increase.
To transform the risk-neutral probabilities of default to real-world, or physical, probabilities of default, it is necessary to correct them by including a market risk premium. If the market risk premium is calculated using the capital asset pricing model (CAPM), Bohn (1999) has shown that the physical probability of default of institution I, PDI, can be approximated by:
(6)*
1,2
2I
I I M
PDPD T
,
12 For a recent discussion on the distance-to-default and its possible variations, see Capuano et al (2009).
13 The probability of default in equation (4) is risk-neutral since it requires inverting an option pricing formula. In general, asset pricing formulas discount future cash flows using the risk-free rate rather than a discount rate equal to the risk-free rate plus a risk premium. To compensate for a lower discount rate, the probabilities of adverse events are overweight vis-à-vis those of positive events. The risk-neutral probabilities, therefore, reflect the risk aversion of the market.
16
where T is the time horizon of the analysis, ,I M is the correlation between the asset returns
and the market returns, and is the market price of risk, or the market return in excess of the risk-free rate per unit of market volatility.14
C. The One-Factor Credit Portfolio Risk Model
The one-factor credit portfolio model is the benchmark model for constructing the loss distribution of a portfolio of risky assets, or in the case of the TCTF capital charge, of risky systemic institutions.15 The one-factor model offers a simple way to capture the joint behavior of default events for a portfolio of institutions. Furthermore, the model can be extended to account for several common factors (Hull and White, 2004) and the loss distribution can be computed either using Monte Carlo simulation or fast and efficient numerical solution algorithms available (Andersen, Sidenius, and Basu, 2003).
The one-factor model assumes that the normalized asset value of institution i, xi, depends on a single common factor, M, and an idiosyncratic shock, Zi:
(7) 21 ,i i i ix a M a Z
where xi , M, and Zi are random variables with zero mean and unit variance and cumulative distribution functions Fi, G, and H respectively. The coefficient ia , or factor loading, is
restricted to values between 0 and 1.16 Default occurs when the asset value falls below a threshold value ix . The threshold value depends on the current probability of default of the
institution, PDi, and is given by 1( )i i ix F PD . Finally, the probability of default conditional
on the realization of the common factor is simply
14 For illustrative purposes, the Merton (1974) model is appropriate because it is simple and relatively well known well known in policy making institutions and regulatory agencies. For a more complete taxonomy of models, see the textbook of Lando (2003).
15 See, among others, Gibson (2004) and Hull and White (2004) for a comprehensive description of the one-factor model. The Gaussian copula version of the one-factor credit portfolio model was originally introduced by Li (2000). Vacisek (1997) presents an earlier loss distribution model in the same spirit as Li’s model. The special case of the one-factor Gaussian model came into the limelight in the aftermath of the 2008-9 subprime crisis. The model was the benchmark pricing model for collateralized debt obligation tranches and has been much maligned unfairly for contributing to the large losses observed in the structured credit market. The criticisms may have been overblown, as the model was used mainly as a pricing convention communication tool in the same spirit as traders used the Black-Scholes implied volatility to quote option prices.
16 A documented empirical observation is that correlations during stressful events are higher than during normal periods. This asymmetry can be captured by allowing the factor loading to be an increasing function of the common shock M, or of the probability of default of the institution. I thank Fuchun Li for discussions that lead to the suggested modification.
17
(8) 1
2Prob | ( | ) .
1i i
i i i
i
x a Mx x M PD t M H
a
Contrary to common perception, arguably misguided by the fixation with the special case of the one-factor Gaussian model, the one-factor model can easily accommodate skewness, fat tails, as well as the use of extreme value and empirical distributions by choosing the appropriate distribution functions for the asset value and the common and idiosyncratic shocks.
Equation (7) implies that the asset correlation between two institutions, i and j, is equal to
i ja a . Hence, the practical problem of estimating multiple pairwise and/or group-wise
correlations (or comovements) is reduced to, first, estimate the normalized asset value for each institution; second, identify the common factor; and third, estimate the factor loadings for each institution.
Currently, there is no established methodology for performing these tasks and the ones being used have their pros and cons (de Servigny and Renault, 2004). One simple procedure is to use a structural model to infer the normalized asset values from the estimated probabilities of default. Statistical methods like factor analysis or principal component analysis are then used to extract the common factor. Once the asset values and common factor have estimated, it is straightforward to estimate the factor loadings. The loss distribution can then be computed using either Monte Carlo simulation of analytical algorithms.
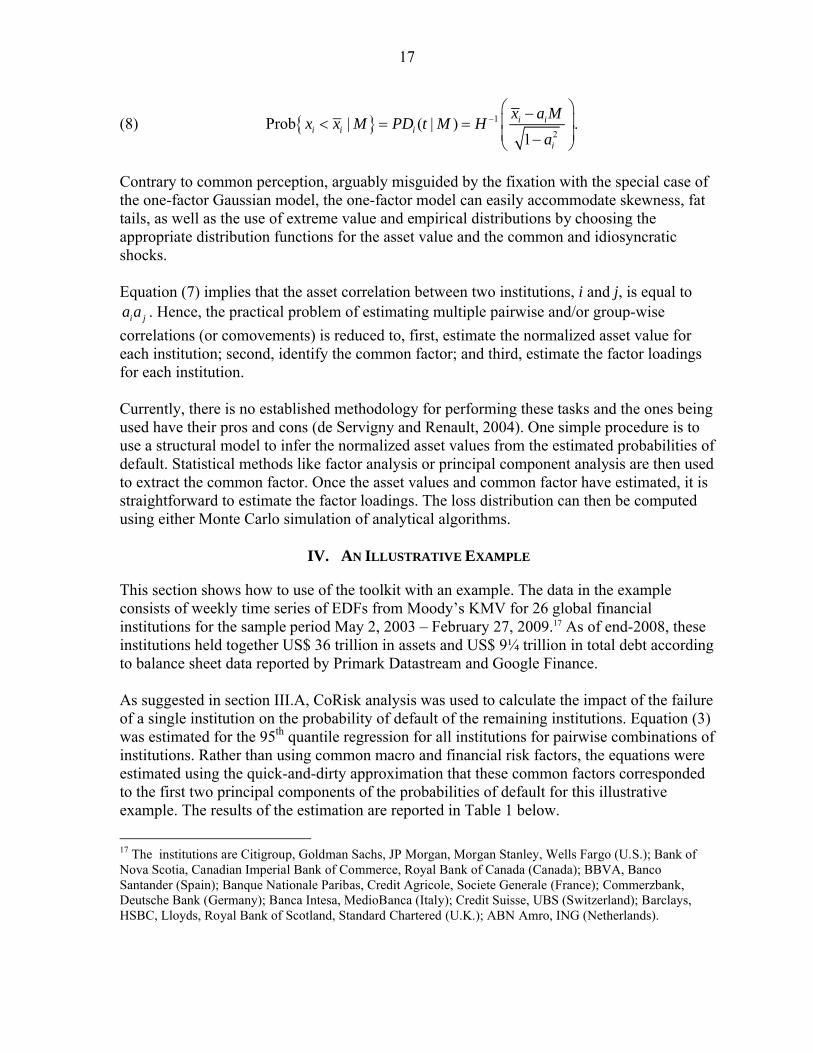
IV. AN ILLUSTRATIVE EXAMPLE
This section shows how to use of the toolkit with an example. The data in the example consists of weekly time series of EDFs from Moody’s KMV for 26 global financial institutions for the sample period May 2, 2003 – February 27, 2009.17 As of end-2008, these institutions held together US$ 36 trillion in assets and US$ 9¼ trillion in total debt according to balance sheet data reported by Primark Datastream and Google Finance.
As suggested in section III.A, CoRisk analysis was used to calculate the impact of the failure of a single institution on the probability of default of the remaining institutions. Equation (3) was estimated for the 95th quantile regression for all institutions for pairwise combinations of institutions. Rather than using common macro and financial risk factors, the equations were estimated using the quick-and-dirty approximation that these common factors corresponded to the first two principal components of the probabilities of default for this illustrative example. The results of the estimation are reported in Table 1 below.
17 The institutions are Citigroup, Goldman Sachs, JP Morgan, Morgan Stanley, Wells Fargo (U.S.); Bank of Nova Scotia, Canadian Imperial Bank of Commerce, Royal Bank of Canada (Canada); BBVA, Banco Santander (Spain); Banque Nationale Paribas, Credit Agricole, Societe Generale (France); Commerzbank, Deutsche Bank (Germany); Banca Intesa, MedioBanca (Italy); Credit Suisse, UBS (Switzerland); Barclays, HSBC, Lloyds, Royal Bank of Scotland, Standard Chartered (U.K.); ABN Amro, ING (Netherlands).
18
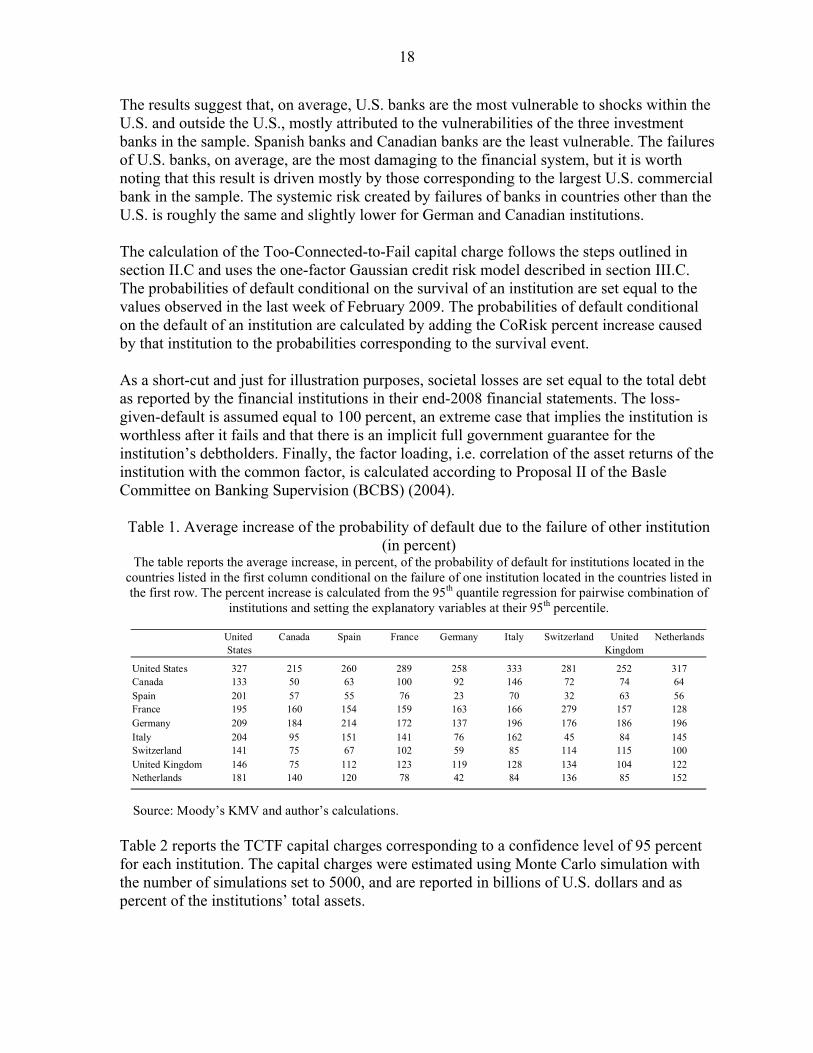
The results suggest that, on average, U.S. banks are the most vulnerable to shocks within the U.S. and outside the U.S., mostly attributed to the vulnerabilities of the three investment banks in the sample. Spanish banks and Canadian banks are the least vulnerable. The failures of U.S. banks, on average, are the most damaging to the financial system, but it is worth noting that this result is driven mostly by those corresponding to the largest U.S. commercial bank in the sample. The systemic risk created by failures of banks in countries other than the U.S. is roughly the same and slightly lower for German and Canadian institutions.
The calculation of the Too-Connected-to-Fail capital charge follows the steps outlined in section II.C and uses the one-factor Gaussian credit risk model described in section III.C. The probabilities of default conditional on the survival of an institution are set equal to the values observed in the last week of February 2009. The probabilities of default conditional on the default of an institution are calculated by adding the CoRisk percent increase caused by that institution to the probabilities corresponding to the survival event.
As a short-cut and just for illustration purposes, societal losses are set equal to the total debt as reported by the financial institutions in their end-2008 financial statements. The loss-given-default is assumed equal to 100 percent, an extreme case that implies the institution is worthless after it fails and that there is an implicit full government guarantee for the institution’s debtholders. Finally, the factor loading, i.e. correlation of the asset returns of the institution with the common factor, is calculated according to Proposal II of the Basle Committee on Banking Supervision (BCBS) (2004).
Table 1. Average increase of the probability of default due to the failure of other institution (in percent)
The table reports the average increase, in percent, of the probability of default for institutions located in the countries listed in the first column conditional on the failure of one institution located in the countries listed in the first row. The percent increase is calculated from the 95th quantile regression for pairwise combination of
institutions and setting the explanatory variables at their 95th percentile.
United Canada Spain France Germany Italy Switzerland United NetherlandsStates Kingdom
United States 327 215 260 289 258 333 281 252 317Canada 133 50 63 100 92 146 72 74 64Spain 201 57 55 76 23 70 32 63 56France 195 160 154 159 163 166 279 157 128Germany 209 184 214 172 137 196 176 186 196Italy 204 95 151 141 76 162 45 84 145Switzerland 141 75 67 102 59 85 114 115 100United Kingdom 146 75 112 123 119 128 134 104 122Netherlands 181 140 120 78 42 84 136 85 152
Source: Moody’s KMV and author’s calculations.
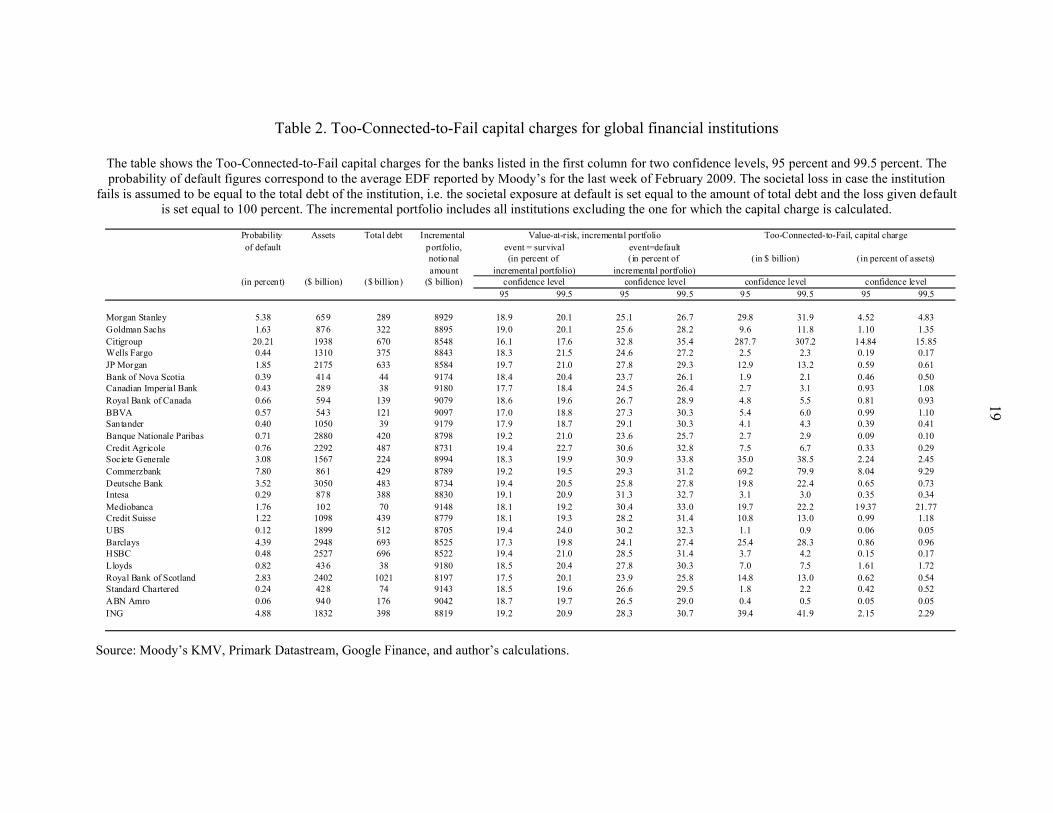
Table 2 reports the TCTF capital charges corresponding to a confidence level of 95 percent for each institution. The capital charges were estimated using Monte Carlo simulation with the number of simulations set to 5000, and are reported in billions of U.S. dollars and as percent of the institutions’ total assets.
19
Table 2. Too-Connected-to-Fail capital charges for global financial institutions
The table shows the Too-Connected-to-Fail capital charges for the banks listed in the first column for two confidence levels, 95 percent and 99.5 percent. The probability of default figures correspond to the average EDF reported by Moody’s for the last week of February 2009. The societal loss in case the institution
fails is assumed to be equal to the total debt of the institution, i.e. the societal exposure at default is set equal to the amount of total debt and the loss given default is set equal to 100 percent. The incremental portfolio includes all institutions excluding the one for which the capital charge is calculated.
Probability Assets Total debt Incremental of default portfolio,
notionalamount
(in percent) ($ billion) ($ billion) ($ billion)95 99.5 95 99.5 95 99.5 95 99.5
Morgan Stanley 5.38 659 289 8929 18.9 20.1 25 .1 26.7 29.8 31.9 4.52 4.83Goldman Sachs 1.63 876 322 8895 19.0 20.1 25 .6 28.2 9.6 11.8 1.10 1.35Citigroup 20.21 1938 670 8548 16.1 17.6 32 .8 35.4 287.7 307.2 14.84 15.85Wells Fargo 0.44 1310 375 8843 18.3 21.5 24 .6 27.2 2.5 2.3 0.19 0.17JP Morgan 1.85 2175 633 8584 19.7 21.0 27 .8 29.3 12.9 13.2 0.59 0.61Bank of Nova Scotia 0.39 414 44 9174 18.4 20.4 23 .7 26.1 1.9 2.1 0.46 0.50Canadian Imperial Bank 0.43 289 38 9180 17.7 18.4 24 .5 26.4 2.7 3.1 0.93 1.08Royal Bank of Canada 0.66 594 139 9079 18.6 19.6 26 .7 28.9 4.8 5.5 0.81 0.93BBVA 0.57 543 121 9097 17.0 18.8 27 .3 30.3 5.4 6.0 0.99 1.10Santander 0.40 1050 39 9179 17.9 18.7 29 .1 30.3 4.1 4.3 0.39 0.41Banque Nationale Paribas 0.71 2880 420 8798 19.2 21.0 23 .6 25.7 2.7 2.9 0.09 0.10Credit Agricole 0.76 2292 487 8731 19.4 22.7 30 .6 32.8 7.5 6.7 0.33 0.29Societe Generale 3.08 1567 224 8994 18.3 19.9 30 .9 33.8 35.0 38.5 2.24 2.45Commerzbank 7.80 861 429 8789 19.2 19.5 29 .3 31.2 69.2 79.9 8.04 9.29Deutsche Bank 3.52 3050 483 8734 19.4 20.5 25 .8 27.8 19.8 22.4 0.65 0.73Intesa 0.29 878 388 8830 19.1 20.9 31 .3 32.7 3.1 3.0 0.35 0.34Mediobanca 1.76 102 70 9148 18.1 19.2 30 .4 33.0 19.7 22.2 19.37 21.77Credit Suisse 1.22 1098 439 8779 18.1 19.3 28 .2 31.4 10.8 13.0 0.99 1.18UBS 0.12 1899 512 8705 19.4 24.0 30 .2 32.3 1.1 0.9 0.06 0.05Barclays 4.39 2948 693 8525 17.3 19.8 24 .1 27.4 25.4 28.3 0.86 0.96HSBC 0.48 2527 696 8522 19.4 21.0 28 .5 31.4 3.7 4.2 0.15 0.17Lloyds 0.82 436 38 9180 18.5 20.4 27 .8 30.3 7.0 7.5 1.61 1.72Royal Bank of Scotland 2.83 2402 1021 8197 17.5 20.1 23 .9 25.8 14.8 13.0 0.62 0.54Standard Chartered 0.24 428 74 9143 18.5 19.6 26 .6 29.5 1.8 2.2 0.42 0.52ABN Amro 0.06 940 176 9042 18.7 19.7 26 .5 29.0 0.4 0.5 0.05 0.05ING 4.88 1832 398 8819 19.2 20.9 28 .3 30.7 39.4 41.9 2.15 2.29
confidence level
Too-Connected-to-Fail, capital charge
confidence level
(in $ billion) (in percent of assets)event=default(in percent of
confidence level
Value-at-risk, incremental portfolioevent = survival(in percent of
confidence levelincremental portfolio) incremental portfolio)
Source: Moody’s KMV, Primark Datastream, Google Finance, and author’s calculations.

20
Unsurprisingly, given the sample period analyzed and the specific point-in-time chosen for the probabilities of default, Citigroup stands out as the institution with the highest TCTF capital charge at around 15 percent of total assets. At the 95 percent confidence level, the VaR of Citigroup’s incremental portfolio almost doubles to 32 percent of the nominal amount of the portfolio in case Citigroup defaults. But the main factor responsible for the high capital charge is Citigroup’s high probability of default.
For comparison purposes, note that Spanish banks BBVA and Santander, and the French Banks Credit Agricole and Societe Generale, have incremental portfolios roughly as large as Citigroup. For these institutions, their failure increases the VaR of the incremental portfolio by the same magnitude as in the case of Citigroup. But the probability of default of these institutions is one or two orders of magnitude lower than the probability of default of Citigroup and is reflected is substantially lower TCTF capital requirements.
The numerical example highlights some of the main issues discussed in section II.C, namely, that TCTF capital charges depend on both the risk of the individual institution and the risk its default poses to other institutions. The results, therefore, support current prudential measures aimed at reducing the risk of individual institutions deemed systemic to the financial system. For example, in Chile, Banco Santander is required to hold higher capital charges than other banks due to their dominance of the system.
One caveat to bear in mind is that the results reported in this section should not be taken at full face value. Since the purpose of the example was restricted to illustrate the methodology and how to use the different tools, some rough approximations and assumption were used in the calculations. In particular, assuming normal distributions in the one-factor credit portfolio risk model could neglect tail risk. A more careful analysis would have analyzed whether the latent asset values associated to each institution were better fitted with a fat-tail distributionsuch as the Student-t or the Gumbel distributions. Also the BCBS formula for correlation assigns lower correlations for higher probabilities of default and imposes an upper bound of 0.24. This shortcoming can be addressed with the use of structural models, as suggested in section III.C, assuming a constant, high correlation value deemed consistent with a tail risk scenario, or specifying correlation as an increasing function of the probability of default. In any case, the two assumptions discussed here would bias down the TCTF capital charges reported in Table 2.
V. CONCLUSIONS
The failure of Too-Connected-to-Fail institutions has been widely acknowledged as a major source of systemic risk to the financial system, as witnessed in the failures of Hersttat Bank in 1974 and Long Term Capital Management in 1998. But only recently, and in response to the large losses in the financial system caused by the subprime crisis of 2008-9, the policy making community and regulatory agencies have undertaken substantial efforts to revamp the regulatory framework to address the interconnectedness problem.
The proposed Too-Connected-to-Fail capital charge introduced in this paper is an important contribution to the ongoing efforts towards the design of a modern regulatory framework.The proposed capital charge methodology has three important features. First, it builds upon

21
an intuitive principle: the capital charge must be proportional to the incremental contribution to societal losses (or risk) due to the failure of the institution. Second, by relating the concept of incremental contribution to systemic risk to concepts such as Value-at-Risk and Expected Shortfall, the TCTF capital charge is aligned with the spirit of Basel II. This alignment will facilitate its adoption and implementation by supervisory agencies and systemic risk regulators. Third, the measurement of the incremental contribution can be accomplished using a simple toolkit of models such as CoRisk analysis, network analysis, and portfolio credit risk models.18
The proposed TCTF capital charge methodology may also provide a practical way to define the proper perimeter of regulation (IMF, 2009d). While the methodology was illustrated here for financial institutions, it does not preclude the inclusion of non-financial and/or unregulated institutions. In some emerging market countries, non-bank institutions such as department stores are responsible for a susbstantial amount of financial intermediation and domestic credit to the household sector. In some countries brokerage houses are important players in the repo market so their failure could trigger a liquidity crunch in the domestic financial system.19
Determining what institutions should be covered by the perimeter of regulation can be based on each institution incremental contribution to societal loss. If this contribution exceeds a predetermined threshold, the institution should be included in the perimeter. Under this procedure, some institutions that are not currently regulated may be subsequently included while others may be dropped from it if they no longer present a systemic risk to society. Theadoption of a dynamic perimeter of regulation not only responds to changes in market practices and business conditions but also helps to allocate scarce regulatory resources more efficiently by focusing them on the more vulnerable and/or riskier institutions from a societal vantage point. 20
The methodology also contributes to the literature on macro-financial linkages in regard to the measurement of risk between the financial and non-financial institutions. For instance, it could well be the case that trade financing in one country relies on one domestic bank, or at best, on a reduced numbers of domestic banks. The TCTF capital charge for these banks should account for the potential impact of their failure on the export-import sector. While there may not be information about the direct exposure between the banks and the export-import sector, the use of CoRisk analysis can help to compute the capital charges.
18 The transparency of the methodology and its reliance on a simple toolkit of models facilitates its implementation and simplifies the design of the supporting technical infrastructure and its associated costs. For instance, in the numerical example presented in this paper, all calculations were performed using standard econometric software and Microsoft Visual Basic.
19 Ana Carvajal, personal discussion.
20 During stress periods, however, there may be instances during which the authorities may need to support institutions not deemed too-big-to-fail or to-interconnected-to-fail to avoid a bank-run triggered by rapidly deteriorating investor sentiment.
22
The discussion above assumes the charge should be applied to the institution that fails. There are valid arguments, however, for applying the charges to the institutions most affected by the failure of the TCTF institution.21 One argument is that the TCTF capital charge, if applied as suggested in the paper, may potentially penalize efficient institutions. Their efficiency, arguably, is one reason why they have become TCTF. A second argument is that, from the perspective of a TCTF institution, the linkages with other institutions could depend on the business models of the latter. In this case, the TCTF institution would be punished unfairly for factors beyond its control. One potential way to partly address these concerns is to add up the individual TCTF capital charges and distribute them proportionally to each institution’s probability of default.
As with any capital charge, there are some procyclical features in the TCTF capital charge as the probability of default of an interconnected institution increases during economic slowdowns and/or periods of generalized market underperformance. As discussed in section III, the procyclicality could be reduced to a certain extent by using estimates of the probability of default conditional on the realization of extreme events. In addition, to reduce the risks to the system, it may be possible to design a prompt corrective action (PCA) framework where different thresholds for the TCTF capital charges trigger potential remedial actions. In this case, even if the TCTF capital charge is procyclical, its use within a PCA framework ensures a ceiling on the maximum probability of default of any given institution that partly offsets the procyclicality.
Finally, the imposition of a TCTF capital charge could go a long way towards internalizing the negative externalities associated with too-connected-to-fail institutions and provide managers the incentives to strengthen an institution’s solvency position, and avoid too much homogeneity and excessive reliance on the same counterparties in the financial industry.
But for the TCTF capital charge to have its intended effects, it would be necessary to harmonize regulatory practices, especially in regard to the measurement of interconnectedness risk, across different jurisdictions. The TCTF problem involves systemic bank and financial institutions that operate across the globe and subject to the different regulatory regimes in their home jurisdiction. Fortunately, the need to cope with future financial crisis has strengthened the political will to increased harmonization as shown, for instance, by the establishment of the Financial Stability Board and the broadening of the surveillance mandate of the IMF. In this context, an intermediate step towards the global adoption of a TCTF charge would be its use as one input for constructing a scorecard for systemic institutions. To avoid conflicts of interest, the calculation of the charge could be performed by a neutral multilateral institution such as the BIS or the IMF.
21 I thank Barry Johnston for raising these arguments.

23
REFERENCES
Acharya, V., and M. Richardson, 2009, “Government Guarantees: Why the Genie Needs to be Put Back in the Bottle,” The Economists’ Voice, November (The Berkeley Electronic Press).
Adrian, T., and M. Brunnermeier, 2009, “CoVaR,” mimeo (New York: Federal Reserve Bank of New York).
Aikman, D., P. Alessandri, B. Eklund, P. Gai, S. Kapadia, E. Martin, N. Mora, G. Sterne, and M. Willison, 2009,“Funding Liquidity Risk in a Quantitative Model of Systemic Stability,” Working Paper No. 372 (London: Bank of England).
Andersen, L., J. Sidenius, and S. Basu, 2003, “All your Hedges in One Basket,” Risk, pp. 67–72 (November).
Artzner, P., F. Delbaen, J.-M. Eber, and D. Heath, 1999, “Coherent Measures of Risk,” Mathematical Finance, Vol. 9, pp. 203–28.
Basle Committee of Banking Supervision, 2004, Modifications to the Capital Treatment for Expected and Unexpected Credit Losses (Basel).
Bernanke, B., 2009, “Financial Regulation and Supervision after the Crisis – the Role of the Federal Reserve,” speech at the Federal Reserve Bank of Boston 54th Economic Conference, October 23.
Bohn, J., 1999, “A Survey of Contingent-Claims Approaches by Risky Debt Valuation,” working paper (San Francisco: Moody’s KMV).
Brunnermeier, M., A. Crockett, C. Goodhart, A. Persaud, and H.-S. Shin, 2009, “The Fundamental Principles of Financial Regulation,” Geneva Reports of the World Economy.
Capuano, C., J.A. Chan-Lau, G. Gasha, C. Medeiros, A.O. Santos, M. Souto, 2009, “Recent Advances in Credit Risk Modeling,” IMF Working Paper 09/162 (Washington, D.C.: International Monetary Fund).
Chan-Lau, J.A., 2008a, “The Globalization of Finance and its Implications for Financial Stability: An Overview of the Issues,” International Journal of Banking, Accounting and Finance, Vol. 1, No.1, pp. 3 -29.
_____, 2010, “Default Risk Codependence in the Global Financial System: Was the Bear Stearns Bailout Justified?” in G. Gregoriou, editor, The Banking Crisis Handbook, CRC Press.
Chan-Lau, J.A., and T. Gravelle, 2005, “The END Indicator: A New Indicator of Financial and NonFinancial Corporate Sector Vulnerability,” available at ssrn.com

24
de Servigny, A., and O. Renault, 2004, Measuring and Managing Credit Risk (New York: McGraw Hill).
Gauthier, C., A. Lehar, and M. Souissi, 2009, “Macroprudential capital requirements and systemic risk,” working paper (Ottawa: Bank of Canada).
Gibson, M., 2004, “Understanding the Risk of Synthetic CDOs,” Working Paper 2004-36, Finance and Economics Discussion Series (Washington, D.C.: Board of Governors of the Federal Reserve).
Huang, X., H. Zhou, and H. Zhu, 2009, “A Framework for Assessing the Systemic Risk of Major Financial Institutions,” forthcoming in Journal of Banking and Finance.
International Monetary Fund, 2009a, Global Financial Stability Report (April).
_____, 2009b, Global Financial Stability Report (October).
_____, 2009c, World Economic Outlook (October).
_____, 2009d, Policies to Mitigate Procyclicality, Staff Position Note SPN/09/09.
_____, 2009e, The Perimeter of Financial Regulation, Staff Position Note SPN/09/07.
Koenker, R., and G. Bassett, Jr., 1978, “Regression Quantiles,” Econometrica, Vol. 45, No. 1, pp. 33–50.
Lando, D., 2003, Credit Risk Modeling (Princeton, NJ: Princeton University Press).
Litterman, R., 1996, “Hot SpotsTM and Hedges,” Journal of Portfolio Management, Vol. 23 (December, special issue) pp. 52–75.
Merton, R., 1974, “On the Pricing of Corporate Debt: the Risk Structure of Interest Rates,” Journal of Finance.
Milne, F., 2009, “The Complexities of Financial Risk Management and Systemic Risks,” Bank of Canada Review, pp. 15–29 (Summer).
Rennhack, R., et al, 2009, “Global Financial Regulatory Reform: Implications for Latin America and the Caribbean (LAC),” Policy Discussion Paper prepared for the Second Meeting of the Finance Ministers of the Americas and the Caribbean, July 3, 2009.
Tarashev, N., C. Borio, and K. Tsatsaronis, 2009, “The Systemic Importance of Financial Institutions,” BIS Quarterly Review, pp. 75–87 (September).
25
Tarullo, D.K., 2009, “Regulatory Reform,” Testimony before the Committee on Financial Services, U.S. House of Representatives, Washington, D.C. (October 29).
Vasicek, O., 1997, “Probability of loss on a loan portfolio,” working paper (San Francisco: Moody’s KMV).
Related Documents