February 2015 IMPERIAL COLLEGE LONDON Regulatory B cells in seasonal allergic rhinitis and the influence of grass pollen immunotherapy JAMES EDWARD GERALD CHARLESWORTH Allergy and Clinical Immunology National Heart and Lung Institute Thesis submitted to Imperial College London in candidature for the degree of DOCTOR OF PHILOSOPHY (PhD)

Welcome message from author
This document is posted to help you gain knowledge. Please leave a comment to let me know what you think about it! Share it to your friends and learn new things together.
Transcript
February 2015
IMPERIAL COLLEGE LONDON
Regulatory B cells in seasonal
allergic rhinitis and the
influence of grass pollen
immunotherapy
JAMES EDWARD GERALD CHARLESWORTH
Allergy and Clinical Immunology
National Heart and Lung Institute
Thesis submitted to Imperial College London
in candidature for the degree
of
DOCTOR OF PHILOSOPHY
(PhD)
2
Abstract Introduction:
Interleukin (IL)-10-producing B cells (Bregs) regulate immune responses in autoimmune disease;
however their role in allergy is unclear. Allergen exposure in predisposed atopic individuals results in
the induction of IgE-secreting B cells, crucial in the immunopathophysiology of allergic rhinitis.
Allergen-specific immunotherapy (AIT) is the only disease-modifying treatment for allergic rhinitis. AIT
results in long-term clinical and immunological tolerance; however, whether Bregs contribute towards
AIT-induced tolerance remains unclear.
Hypotheses:
1. In vitro induced IL-10-producing B cells regulate allergen-driven Th2 inflammation,
2. Bregs are present in fewer numbers in seasonal grass pollen allergic (SAR) individuals
compared with healthy controls, which is restored during AIT.
Methods:
B cells were isolated and subjected to flow cytometry to detect surface markers and IL-10 capacity
following CpG stimulation. FluoroSpot, ELISA or qPCR were used to confirm IL-10. Suppression of T cell
proliferation (by CFSE) and cytokine production (by ELISA) were carried out in co-cultures. Regulatory
B cells in SAR (n=14), AIT (n=18) and healthy (n=14) donors were compared. Nasal allergen challenge
(NAC) was carried out, with blood taken pre and post challenge for flow cytometry.
Results:
CpG significantly enhanced proportions of Bregs, with enrichment particularly within CD24hiCD27+,
CD5hi, PD-L1+ and CD24hiCD38hi populations. Bregs suppressed both polyclonally- and grass pollen
allergen-stimulated T cells. Ex vivo, proportions of IL-10+ B cells from SAR and healthy donors matched,
but were significantly greater amongst AIT donors (particularly sublingual immunotherapy - SLIT)
compared to SAR. Following NAC, proportions of B cells within CD24hiCD38hi, CD5hi, CD24hiCD27hi and
CD25+ subsets were significantly increased amongst non-allergic and AIT groups, but not amongst SAR
donors.
Conclusion:
Bregs are capable of suppressing allergen induced, Th2-driven inflammation in vitro and may be
involved in the induction of tolerance during allergen immunotherapy in vivo, particularly following
SLIT.
3
Declaration I confirm that the contents of this thesis are my own work; all laboratory-based experiments were
performed by me. Clinical and diagnostic procedures were carried out by the persons acknowledged
overleaf, for which I am extremely grateful. Experimental assistance, laboratory guidance and
supervision are also acknowledged overleaf. A full list of references is given, with citing throughout
the text where evidential assertions have been made. This work has not been submitted in application
for any other higher degree.
The copyright of this thesis rests with the author and is made available under a Creative Commons Attribution
Non-Commercial No Derivatives licence. Researchers are free to copy, distribute or transmit the thesis on the
condition that they attribute it, that they do not use it for commercial purposes and that they do not alter,
transform or build upon it. For any reuse or redistribution, researchers must make clear to others the licence
terms of this work.
4
Acknowledgements I am extremely grateful for this project to my supervisors, Professor Stephen Durham and Dr David
Cousins. I owe the completion of this thesis to Prof Durham’s attention to detail and endlessly making
time to read repeated drafts. Dr David Cousins was also able to coach me through a microarray, the
figure included in the appendix was analysed by him. I am grateful to Dr Mohamed Shamji for the
proposal of this project and for laboratory supervision. I am also extremely grateful to have been part
of the MRC and Asthma UK PhD programme. The MRC centre has offered a hugely supportive peer
and PI network and regular enjoyable seminars with world class researchers. I had the opportunity to
present nationally and internationally with funding provided by the BSI and BSACI during my PhD, for
which I am very grateful and has contributed to the project and my development.
I wouldn’t have completed any experiments without the guidance, education, techniques and tips
from those in the laboratory at the time I started. The research technicians, Mimi Poon and Delica
Chung, were my lifeline when I first started. I am greatly indebted to the final year PhD students during
the first year of my PhD, now Dr Bryony Stott and Dr Pascal Venn, who not only provided light relief
and a friendly ear but also imparted their wealth of experience, taught me most of my techniques,
ensured I was including the relevant controls and helped me plan my project properly. To Janice
Layhadi, who started as a technician at the same time as me in the lab; I’m grateful for her support as
we learnt our way around the lab together. A great debt of gratitude goes to Dr Mikila Jacobson, with
whom it has been a real pleasure to work and is a font of all knowledge on immunohistochemistry and
teaches a great deal of common (scientific) sense when planning, carrying out and interpreting
experiments. I have greatly enjoyed working with Natalia Couto-Francisco who always brought very
thoughtful discussions to the lab, as well as so much enthusiasm! I also can’t fail to mention Dr
Tomokazu Matsouka, who brought a great deal of experience and wisdom to the lab as well as
fantastic tales of a career as a physician scientist! I also owe a debt of gratitude to the supervisor of
my master’s project, Dr Alistair Noble, who taught me flow cytometry, skills that have been essential
and built on throughout my PhD.
This work relied on the ability to use human samples, obtained by the clinical team, and the ability to
recruit and support the blood donors was crucial to the progress of this project. I can’t fail to thank
the donors for their essential contribution to this project. A huge debt of thanks for this goes to Shireen
Quli Khan, Rachel Yan and Andrea Goldstone for arranging and bleeding volunteers for me throughout
this project. I would also like to thank Andrea for her support, advice and direction when I was making
the decision to apply to medicine and for very kindly (and expertly) training me in phlebotomy. When

5
at the clinic, Dr Moises Calderon was always a pleasure to work with, cheerful regardless of how early
in the morning or late in the evening I bumped into him and always concerned that I was able to get
hold of the samples I needed to complete my studies. The clinical administrators, Natalia Kimowska-
Nassar and latterly Mimi Poon, were of immense help to me in navigating forms and finding my way
around the clinic. They have also been a friendly ear for a world of advice throughout, who always
made trips to the clinic a pleasure.
Key to this thesis is the cross sectional study of participants who were recruited as part of Dr Guy
Scadding’s PhD. Guy, as well as being a font of allergy knowledge and the most cheerful and pleasant
colleague one could hope for, has been extremely kind by incorporating into the study protocol a
dedicated blood collection to isolate B cells and for phenotyping of B cells within the nasal allergen
challenge. I would like to acknowledge the contributions to this thesis made by Dr Guy Scadding and
Dr Arif Eifan who performed the intradermal allergen challenges and nasal allergen challenges for the
cross sectional study. The clinical data, as a result of these challenges, is presented here processed by
Mimi Poon, who also processed participant data including age, gender, screening results and
treatment received. Participants were recruited and screened by the extremely dedicated research
nurses, Rachel Yan and Andrea Goldstone.
To my friends in Leukocyte Biology and at King’s, thank you for getting me though, for your company,
conversation and including me in your PhD journal club! Especially Bex, Kate, Jess, Maryam, Natasha,
Thanu, Pallavi, Cheryl and Andia.
To my family Mum, Dad, Caroline and Lawrence, thank you for never pressuring me towards anything
but letting me follow my interests and indulging my curiosity. Especially the parents for encouraging
me in whatever route I took. And of course Chantal for things too numerous to mention and without
whom I couldn’t have got through these many years! Clearly I’ve been lucky to have a B cell biologist
for a fiancée, who not only understands my experiments and the stress but also asks me the best
questions about my work. This project has often kept us apart but I’m incredibly lucky to receive
patience and understanding when I’ve returned from the lab late at night or, on occasion, in the early
morning and for extensive proof reading of this thesis. Chantal’s given me enormous support and
encouragement when making the decision to apply for medicine following this long slog for which I
can only hope to repay, thank you!
6
Abstracts relating to this thesis
J.E.G. Charlesworth, S.M. Quli Khan, G.W. Scadding, D.J. Cousins, S.R. Durham and M.H. Shamji IL-10-
producing regulatory B cells suppress allergen-specific T cell proliferation and are elevated ex vivo
following specific immunotherapy - - Clinical and Experimental Allergy, 2012, vol.42(12):p1817
James E. G. Charlesworth, Andrea Goldstone, Moises A. Calderon, David Cousins, Stephen R. Durham,
Mohamed H. Shamji Grass Pollen Allergics Have Fewer IL-10-Producing B Cells Than Non-Atopic
Controls -– J. Allergy and Clinical Immunology, 2013, vol.131(2 supplemental):pAB204
J. Charlesworth, A. Goldstone, R. Yan, M.A. Calderon, D.J. Cousins, S.R. Durham and M.H.Shamji
Regulatory B cells are reduced amongst grass-pollen allergic patients compared with non-allergic
controls -– Clinical and Experimental Allergy, 2013, vol.43(12):p1429
J.E.G. Charlesworth, G.W. Scadding, A. Eifan, R. Yan, A.E. Goldstone, M.A. Calderon, S.R. Durham, M.H.
Shamji IL-10-Producing B Cells Are Increased After Grass Pollen Immunotherapy Compared to
Untreated Grass Pollen Allergic Controls: A Blinded Cross-Sectional Study -– J. Allergy and Clinical
Immunology, 2014, vol.133(2 supplemental):pAB53w
7
Contents
ABSTRACT ........................................................................................................................................................ 2
DECLARATION .................................................................................................................................................. 3
ACKNOWLEDGEMENTS .................................................................................................................................... 4
ABSTRACTS RELATING TO THIS THESIS ............................................................................................................. 6
LIST OF FIGURES ............................................................................................................................................. 11
LIST OF TABLES .............................................................................................................................................. 13
LIST OF ABBREVIATIONS ................................................................................................................................ 14
1. INTRODUCTION ..................................................................................................................................... 16
1.1. ALLERGY ................................................................................................................................................. 16
1.2. ALLERGIC RHINITIS ................................................................................................................................... 17
1.2.1. CLINICAL FEATURES OF ALLERGIC RHINITIS ................................................................................................. 17
1.2.2. Epidemology of allergic rhinitis .................................................................................................. 18
1.2.2.1. Grass pollen allergic rhinitis ....................................................................................................... 18
1.2.3. IMMUNOLOGICAL BASIS OF ALLERGIC RHINITIS ........................................................................................... 19
1.2.3.1. TLRs in allergy ............................................................................................................................. 21
1.2.3.2. Immunoregulation in allergic disease......................................................................................... 22
1.2.4. TREATMENT OF ALLERGIC RHINITIS (FOCUSING ON SAR) .............................................................................. 23
1.2.4.1. ALLERGEN SPECIFIC IMMUNOTHERAPY ..................................................................................................... 24
1.2.4.2. IMMUNOLOGICAL FEATURES OF AIT ........................................................................................................ 26
1.2.4.3. Allergen-specific IgG4 and AIT .................................................................................................... 27
1.3. T CELLS .............................................................................................................................................. 28
1.3.1. CD4+ T CELL DEVELOPMENT AND SELECTION ............................................................................................. 28
1.3.2. T CELL ACTIVATION ............................................................................................................................... 29
1.3.3. TH2 CELLS .......................................................................................................................................... 29
1.3.4. TH1, TH17 & TFH SUBSETS ................................................................................................................... 30
1.3.5. REGULATORY T CELLS ............................................................................................................................ 32
1.4. IMMUNOBIOLOGY OF IL-10 ............................................................................................................... 33
1.5. B CELLS .............................................................................................................................................. 35
1.5.1. DEVELOPMENT .................................................................................................................................... 35
1.5.2. GERMINAL CENTRE INTERACTIONS ........................................................................................................... 36
1.5.2.1. Ectopic germinal centres ............................................................................................................ 38
1.5.3. B CELLS AND TLRS ............................................................................................................................... 39
1.5.4. CYTOKINE-PRODUCING B CELLS ............................................................................................................... 39
1.6. REGULATORY B CELLS ................................................................................................................................ 40
1.6.1. PHENOTYPES OF HUMAN IL-10-PRODUCING B CELLS .................................................................................. 40
1.6.1.1. CD1dhiCD5+ B cells ....................................................................................................................... 41
1.6.2. REGULATORY B CELLS IN AUTOIMMUNE DISEASE ........................................................................................ 44
1.6.3. REGULATORY B CELLS IN INFECTIOUS DISEASE ............................................................................................ 44
1.6.4. HELMINTH INFECTION, ALLERGY AND REGULATORY B CELLS .......................................................................... 45
8
1.7. REGULATORY B CELLS IN ALLERGIC DISEASE .................................................................................................... 45
2. METHODS .............................................................................................................................................. 48
2.1. ETHICAL STATEMENT ................................................................................................................................. 48
2.2. BLOOD DONOR SELECTION ......................................................................................................................... 48
2.3. CELL ISOLATION AND CULTURE .................................................................................................................... 48
2.3.1. Phlebotomy and PBMC isolation ................................................................................................ 48
2.3.2. Cell subset isolation .................................................................................................................... 49
2.3.3. Cell culture .................................................................................................................................. 49
2.4. CFSE ..................................................................................................................................................... 49
2.5. CO-CULTURE ........................................................................................................................................... 50
2.5.1. Polyclonal T cell co-culture ......................................................................................................... 50
2.5.2. Allergen-driven T cell co-culture ................................................................................................. 50
2.6. FLOW CYTOMETRY ................................................................................................................................... 52
2.6.1. Staining Panels ........................................................................................................................... 52
2.6.2. Compensation ............................................................................................................................. 52
2.6.3. Experimental surface staining .................................................................................................... 53
2.6.4. Experimental intracellular staining ............................................................................................ 53
2.6.5. Flow cytometry of whole blood .................................................................................................. 55
2.6.6. Live/Dead staining ...................................................................................................................... 55
2.7. ENZYME-LINKED IMMUNOSORBANT ASSAY (ELISA) ....................................................................................... 56
2.7.1. IL-10 Sandwich ELISA .................................................................................................................. 56
2.7.2. Multiplex ELISA ........................................................................................................................... 56
2.8. QUANTITATIVE REAL TIME POLYMERASE CHAIN REACTION (QRT-PCR) .............................................................. 57
2.9. IL-10 FLUOROSPOT .................................................................................................................................. 58
2.10. CROSS-SECTIONAL STUDY ........................................................................................................................... 58
2.10.1. Inclusion and exclusion criteria ................................................................................................... 59
2.10.2. Self-assessment questionnaires .................................................................................................. 59
2.10.3. Intradermal allergen challenge .................................................................................................. 60
2.10.4. Nasal allergen challenge (NAC) .................................................................................................. 60
2.11. IMMUNOHISTOCHEMISTRY ......................................................................................................................... 61
2.11.1. Immunostaining.......................................................................................................................... 61
2.11.1.1. Staining with fast red for light microscopy – ABC-AP............................................................. 63
2.11.1.2. Staining with fluorochrome conjugates for UV microscopy ................................................... 64
2.12. STATISTICAL PLAN ..................................................................................................................................... 65
3. GENERATION AND FUNCTION OF HUMAN IL-10-PRODUCING B CELLS IN VITRO .................................... 66
HYPOTHESES .................................................................................................................................................. 66
AIMS .............................................................................................................................................................. 66
3.1. INDUCTION AND DETECTION OF IL-10 PRODUCING B CELLS .............................................................. 67
3.1.1. DOSE RESPONSES ................................................................................................................................. 67
3.1.2. EFFECT OF CPG, CD40L OR LPS STIMULATION ON B CELLS AMONGST PBMC OR ISOLATED CULTURES ................. 69
3.1.3. TIME COURSE OF IL-10 INDUCTION BY CPG AMONGST B CELLS ..................................................................... 71
3.1.4. CPG-ENHANCED B CELL IL-10 RELATES TO INNATE CAPACITY ........................................................................ 75
3.1.5. PHENOTYPING OF IL-10-PRODUCING B CELLS ............................................................................................ 76
3.2. REGULATION OF T CELL RESPONSES .................................................................................................. 83
3.2.1. SUPPRESSION OF POLYCLONAL T CELL RESPONSES ....................................................................................... 83

9
3.2.2. SUPPRESSION OF ALLERGEN-STIMULATED T CELL RESPONSES......................................................................... 88
3.3. DISCUSSION ...................................................................................................................................... 97
3.3.1. CPG-INDUCED IL-10 ............................................................................................................................ 97
3.3.2. LPS AND CD40 RESPONSES ................................................................................................................... 97
3.3.2.1. LPS .............................................................................................................................................. 97
3.3.2.2. CD40 stimulation ........................................................................................................................ 98
3.3.3. DETECTION OF B CELL MRNA FOLLOWING CPG STIMULATION ...................................................................... 99
3.3.4. THE RELEVANCE OF CPG-INDUCED IL-10 .................................................................................................. 99
3.3.5. PHENOTYPING IL-10-PRODUCING B CELLS .............................................................................................. 100
3.3.6. EXPLORING THE PREDICTIVE VALUE OF EX VIVO PHENOTYPING ON IN VITRO IL-10 CAPACITY .............................. 101
3.3.7. B CELL MEDIATED SUPPRESSION OF STIMULATED T CELLS ............................................................................ 103
3.3.7.1. USE OF INHIBITORY ANTIBODIES ............................................................................................................ 105
3.4. FUTURE WORK ....................................................................................................................................... 106
4. INFLUENCE OF GRASS POLLEN IMMUNOTHERAPY ON PERIPHERAL IL-10+ BREG RESPONSES EX VIVO. 107
HYPOTHESES ................................................................................................................................................ 108
AIMS ............................................................................................................................................................ 108
4.1. PILOT COMPARISONS OF B CELLS FROM ALLERGIC AND NON-ALLERGIC PARTICIPANTS ........................................... 109
4.2. EFFECT OF ALLERGEN-SPECIFIC IMMUNOTHERAPY ON IL-10-PRODUCING BREGS ................................................. 110
4.2.1. CROSS-SECTIONAL PARTICIPANT’S BASELINE DEMOGRAPHIC AND CLINICAL DATA ............................................. 110
4.2.2. IL-10 FLUOROSPOT OF B CELLS ............................................................................................................ 114
4.2.3. CPG-INDUCED CHANGES IN MRNA AT 5 HOURS POST STIMULATION ............................................................ 120
4.2.4. B CELL MRNA EXPRESSION AT BASELINE COMPARED BETWEEN CLINICAL GROUPS ............................................ 122
4.2.5. B CELL SUPERNATANT PROTEINS FOLLOWING 48 HOUR CPG STIMULATION .................................................... 124
4.2.6. COMPARING MEASURES OF B CELL PRODUCED IL-10 ................................................................................ 126
4.2.7. B CELL IL-10 RESPONSES IN RELATION TO PATIENT DEMOGRAPHICS .............................................................. 127
4.2.8. B CELL IL-10 RESPONSES IN RELATION TO PARTICIPANTS’ INTRADERMAL CHALLENGE RESPONSES ........................ 130
4.2.9. CLINICAL OUTCOMES OF NASAL ALLERGEN CHALLENGE ............................................................................... 132
4.2.10. B CELL SUB POPULATIONS BEFORE AND AFTER NASAL ALLERGEN CHALLENGE................................................... 133
4.2.10.1. BASELINE COMPARISON OF B CELL SUBSETS BETWEEN STUDY PARTICIPANTS .............................................. 134
4.2.10.2. CHANGES IN B CELL SUBSETS FOLLOWING NASAL ALLERGEN CHALLENGE (NAC).......................................... 136
4.2.10.3. CHANGES IN B CELL SUBSETS FOR NON-ALLERGIC CONTROLS IN THE ABSENCE OF ALLERGEN CHALLENGE .......... 139
4.3. EXAMINATION OF IL-10-PRODUCING B CELLS BY HISTOLOGY .......................................................................... 141
4.3.1. Immunohistochemistry staining of tonsil sections ................................................................... 141
4.3.2. Immunohistochemistry staining of nasal sections .................................................................... 144
4.4. DISCUSSION .................................................................................................................................... 149
4.4.1. PILOT COMPARISON OF ALLERGIC AND NON-ALLERGIC RESPONSIVENESS AND IDENTIFICATION OF IL-10 DETECTION BY
FLUOROSPOT ..................................................................................................................................................... 149
4.4.2. CROSS SECTIONAL STUDY ..................................................................................................................... 149
4.4.2.1. PARTICIPANTS ................................................................................................................................... 150
4.4.2.2. IL-10 RESPONSES OF B CELLS FROM CROSS SECTIONAL PATIENTS ................................................................. 151
4.4.2.2.1. Allergen-induced responses ................................................................................................. 151
4.4.2.2.2. CpG-induced IL-10 responses ............................................................................................... 151
4.4.2.3. IL-10, IL-6 AND TNFΑ DETECTED IN CULTURE SUPERNATANTS ................................................................... 152
4.4.2.4. BEYOND IL-10 – MRNA AT BASELINE AND FOLLOWING CPG ..................................................................... 153
4.4.2.5. EXAMINATION OF CONFOUNDERS IN DETECTING INCREASED CAPACITY FOR B CELL IL-10 .................................. 154
4.4.2.5.1. AIT duration ......................................................................................................................... 154
10
4.4.2.5.2. Gender of participants ......................................................................................................... 155
4.4.2.5.3. Donor age ............................................................................................................................. 156
4.4.2.6. RELATIONSHIPS BETWEEN CLINICAL OUTCOMES AND IL-10+ B CELLS ............................................................ 156
4.4.3. NASAL ALLERGEN CHALLENGE ............................................................................................................... 157
4.4.3.1. B CELL DISTRIBUTIONS AT BASELINE........................................................................................................ 157
4.4.3.2. COMPARISON OF B CELLS BEFORE AND AFTER ALLERGEN CHALLENGE ............................................................ 158
4.4.4. HISTOLOGICAL EVIDENCE OF IL-10-PRODUCING B CELLS IN VIVO ................................................................. 159
4.4.5. FUTURE WORK .................................................................................................................................. 160
5. SUMMARY AND CONCLUDING REMARKS ............................................................................................ 164
6. REFERENCES ........................................................................................................................................ 167
7. APPENDIX ............................................................................................................................................ 190
11
List of Figures
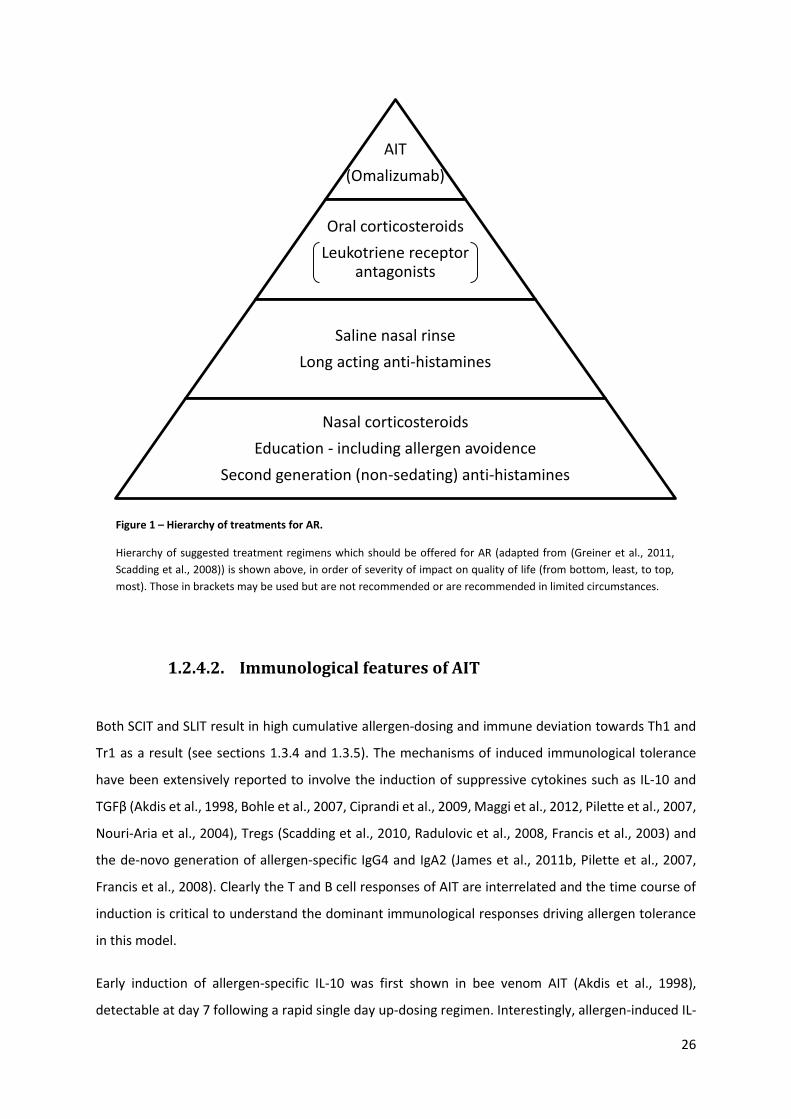
Figure 1 – Hierarchy of treatments for AR. ........................................................................................... 26
Figure 2 – Diagram of B and T cell co-cultures...................................................................................... 51
Figure 3 – Diagram of nasal allergen challenge (NAC) protocol. .......................................................... 60
Figure 4 – Diagram of immunohistochemistry staining antibodies used. ............................................ 62
Figure 5 – Detection of IL-10-producing B cells. ................................................................................... 68
Figure 6 – Comparison of IL-10-producing B cells following stimulation in PBMC or isolated culture.
.............................................................................................................................................................. 70
Figure 7 – Time course of IL-10 production amongst isolated B cells using CpG. ............................... 72
Figure 8 – Time course of mRNA induction following CpG stimulation................................................ 74
Figure 9 – Comparison of medium or CpG stimulated B cells for IL-10 capacity. ................................. 75
Figure 10 – Relative expressions of IL-10 amongst CD24 and CD38 B cell subsets. ............................. 77
Figure 11 – Phenotypic markers of IL-10-producing B cells. ................................................................. 78
Figure 12 – Comparisons of IL-10-producing B cells following culture and B cell subsets detected ex-
vivo in whole blood. .............................................................................................................................. 81
Figure 13 – Chemokine receptor expression on IL-10-producing B cells. ............................................. 82
Figure 14 – Co-culture of CpG-primed B cells with polyclonally stimulated T cells .............................. 83
Figure 15 – Regulatory T cells following polyclonal stimulation of T cells in B cell co-culture. ............ 85
Figure 16 – Changes in supernatant cytokines following polyclonally stimulated T cells in co-culture
with B cells. ........................................................................................................................................... 87
Figure 17 – T cell Proliferation following allergen-stimulated and B cell co-culture. ........................... 88
Figure 18 - Tregs following allergen-stimulated and B cell co-culture. ................................................ 90
Figure 19 – Changes in supernatant cytokines following allergen-stimulated T cells in co-culture with
B cells. ................................................................................................................................................... 92
Figure 20 – Live/dead staining of allergen-stimulated T cells in co-culture with primed B cells. ........ 94
Figure 21 – Allergen stimulated T and B cell co-cultures with the addition of inhibitory antibodies. . 96
Figure 22 –Comparison of B cell IL-10 from non-allergic, allergic and immunotherapy-treated donors.
............................................................................................................................................................ 109
Figure 23 – Self-assessment data of cross-sectional study participants............................................. 112
Figure 24 – Intradermal challenge results of cross-sectional study participants. .............................. 113
Figure 25 – IL-10 B cell FluoroSpot of cross-sectional participants. ................................................... 114
Figure 26 – Comparison of IL-10 B cell spots between CpG and CpG + Phl P stimulation. ................. 115
Figure 27 – IL-10 spots following CpG stimulation. ............................................................................ 117
Figure 28 – IL-10 B cell spots following Phl P + CpG stimulation. ........................................................ 118
Figure 29 – B cell IL-10 spots following allergen stimulation. ............................................................. 119
Figure 30 – Relative IL-10 and IL-6 mRNA expression in cross-sectional populations after stimulation.
............................................................................................................................................................ 121
Figure 31 – Comparison of mRNA in time 0 B cell lysates from cross-sectional patients. ................. 123
Figure 32 – ELISA of CpG-stimulated B cells from cross-sectional donors. ........................................ 125
Figure 33 – Correlations between IL-10 FluoroSpot, IL-10 mRNA and IL-10 ELISA. ............................ 126
Figure 34 – Comparison between duration of treatment and IL-10 spots or IL-10 produced. .......... 127
Figure 35 – Age and gender comparisons with IL-10-producing B cell spots and IL-10 production. . 129
Figure 36 - Comparisons between intradermal challenge and CpG-induced B cell IL-10. .................. 131
Figure 37 – Change in peak nasal flow demonstrates nasal blockage following allergen challenge. 132
12
Figure 38 – B cell subset analysis of nasal allergen challenge during cross-sectional study. ............. 133
Figure 39 – Numbers of CD19+ B cells at baseline between clinical groups ....................................... 134
Figure 40 – Comparison between cross-sectional groups of baseline B cell subsets. ........................ 135
Figure 41 – Changes in B cell subsets after nasal allergen challenge. ................................................ 138
Figure 42 – Change in B cell subsets for non-allergic patients on an unchallenged day. ................... 140
Figure 43 – Tonsil staining of IL-10 and CD20. .................................................................................... 142
Figure 44 – Tonsil staining of IL-10 and CD138. .................................................................................. 143
Figure 45 - Nasal staining of CD20 and CD138. ................................................................................... 145
Figure 46 – Optimisation of IL-10 staining of nasal sections. ............................................................. 146
Figure 47 – Dual IL-10 and CD20 or CD138 staining in nasal sections. ............................................... 148
Appendix Figure 1 – Heatmap of 37 significantly up or down regulated genes between IL-10+ and IL-
10- B cells sorted for RNA microarray. ................................................................................................ 190
Appendix Figure 2 – Increasing concentrations of Dexamethasone increase proportions of IL-10-
producing B cells from PBMC cultures. ............................................................................................... 192
Appendix Figure 4 – Day six (6) cell death in T and B cell co-cultures, as measured by Annexin V and
7AAD. .................................................................................................................................................. 195
Appendix Figure 3 – Day six (6) CD4+ T cell allergen-driven proliferation in co-culture with B cells. . 195
Appendix Figure 6 – Self-assessment quality of life data of cross-sectional study participants. ....... 196
Appendix Figure 5 - Allergen stimulated T cells co-culture with B cells win the absence of APCs. .... 196
Appendix Figure 8 – Correlation of relative mRNA towards TLR4 and TLR9 in freshly isolated B cells.
............................................................................................................................................................ 200
Appendix Figure 7 – Correlation of IL-10 FluoroSpot and ELISA to relative expression of mRNA at
baseline. .............................................................................................................................................. 200
Appendix Figure 9 – Approximate cumulative dose of allergen received by AIT patients against
proportions of IL-10-producing B cells and IL-10 concentration. ....................................................... 201
Appendix Figure 10 – Concentrations of IL-6 and TNFα in CpG-stimulated B cell supernatants by
gender. ................................................................................................................................................ 202
Appendix Figure 11 – Early and late phase responses correlated to allergen-induced IL-10 spots. .. 203
Appendix Figure 12 – Proportions of IL-10-producing B cells by FluoroSpot, adjusted by baseline
numbers of peripheral B cells. ............................................................................................................ 204
Appendix Figure 13 – Changes in B cell subsets after nasal allergen challenge. ................................ 206
Appendix Figure 14 - Change in B cell subsets for non-allergic patients on an unchallenged day..... 208
Appendix Figure 15 – Tonsil staining of IL-10 and CD20. .................................................................... 208
13
List of Tables
Table 1 – Description of human TLRs and their ligands ........................................................................ 21
Table 2 – Blocking antibodies used in co-culture. ................................................................................ 51
Table 3 – Flow cytometry antibodies used. .......................................................................................... 54
Table 4 – Primers used for qPCR of mRNA towards genes listed. ........................................................ 57
Table 5 – Antibodies used for immunohistochemistry. ........................................................................ 63
Table 6 – Demographic data of cross-sectional participants. ............................................................. 111
Table 7 – qPCR or mRNA after 5 hour CpG stimulation of B cells from cross-sectional participants. 120
Table 8 – ELISA results of 48 hour CpG stimulated B cell supernatants. ............................................ 124
Appendix Table 1 – Spreadsheet of 37 significantly up (red) or down (blue) regulated genes between
IL-10+ and IL-10- B cells sorted for RNA microarray. ........................................................................... 191
Appendix Table 2 – Median cytokine concentrations from polyclonally stimulated co-culture (pg/mL).
............................................................................................................................................................ 193
Appendix Table 3 – Median cytokine concentrations from allergen-stimulated co-cultures (pg/mL).
............................................................................................................................................................ 194
Appendix Table 4 – Additional cytokine concentrations data from CpG-stimulated B cells derived
from cross sectional study of AIT. ....................................................................................................... 198
Appendix Table 5 – Changes in peak nasal inspiratory flow following nasal allergen challenge. ...... 207
14
List of abbreviations
7AAD – 7-aminoactinomycin D
Ab – Antibody
AID – Activation-induced cytidine deaminase
AIT – Allergen-specific immunotherapy
AP - Alkaline
APC - Antigen presenting cell
AR – Allergic rhinitis
B10 – IL-10-producing regulatory B cell
B10pro – IL-10-capable B cell (once induced)
BAT – Basophil activation test
BCR – B cell receptor
Breg – Regulatory B cell
BSA - Bovine serum albumin
CD – Cluster of designation
CFSE - carboxyfluorescein succinimidyl ester
CpG – CpG-containing single stranded DNA
CSR – Class switch recombination
CTLA – Cytotoxic T lymphocyte antigen
DC – Dendritic cell
Dex – Dexamethasone
DMSO - Dimethyl sulfoxide
EAE – Experimental autoimmune encephalitis
EDTA - Ethylenediaminetetraacetic acid
ELISA - Enzyme-Linked ImmunoSorbant Assay
Fc – Fraction crystallising (of antibody)
FcεR – Fc epsilon receptor
FEV – Forced expiatory volume
FoxP3 – Forkhead box protein 3
GC – Germinal Centre
IFN - Interferon
Ig – Immunoglobulin
IL – Interleukin
IL-10R – Interleukin 10 receptor
KU/L – Kilo units per litre (arbitrary)
LPS – Lipopolysaccharide
LTRA – Leukotriene receptor antagonist
mAb – Monoclonal antibody
MHC – Major histocompatibility complex
mRNA – Messenger ribonucleic acid
mRQLQ - mini Rhinoconjunctivitis Quality of
Life Questionnaire
MS – multiple sclerosis
NAC – Nasal allergen challenge
NHS – Normal human (AB) serum
NFκB – Nuclear factor κB
OVA - ovalbumin
PBMC – Peripheral blood mononuclear cell
PBS - Phosphate buffered saline
PC – Plasma cell
PCR - Polymerase chain reaction
PD-L – Programmed death ligand
Phl p - Phleum pratense

PLA – Phospholipase A
PMA - phorbol 12-myristate 13-acetate
PPD – Purified protein derivative
PRR – Pattern recognition receptor
QC - Quality control
qPCR – Quantitative polymerase chain
reaction
RA – Rheumatoid arthritis
SAR – Seasonal allergic rhinitis
SCIT – Subcutaneous immunotherapy
SHM – Somatic hypermutation
SLE – Systemic lupus erythematosus
SLIT – Sublingual immunotherapy
SNP – Single nucleotide polymorphism
SPT – Skin prick test
SQ-U – Standardised quantity units (of
allergen)
SS – primary Sjögren’s syndrome
STAT – Signal transducer and activator of
transcription
TCM – Tissue culture medium
TCR – T cell receptor
Tfh – T follicular helper cell
TGF – Tissue growth factor
Th – T helper cell
TIM – T cell immunoglobulin and mucin
domain
TLR – Toll like receptor
TMB – Tetramethylbenzidine
TNF – Tissue necrosis factor
Tr1 – IL-10-producing regulatory T cell
Treg – Regulatory T cell
TT – Tetanus toxoid

16
1. Introduction
1.1. Allergy
Allergic responses (type I hypersensitivity reactions) are immunoglobulin (Ig) E-mediated and directed
at exogenous and innocuous antigens. Sensitisation can occur anywhere the external environment
comes into contact with the immune system, such as broken skin, the respiratory and nasal mucosa,
the eyes and the entire digestive tract.
Repeated allergen exposure is required for allergen sensitisation, without which, antigen-specific IgE
cannot be generated. Sensitisation can be shown by the detection of specific IgE in serum or by
demonstrating a wheal and flare response following a skin prick test (SPT) with an allergen solution
on the skin. Whilst allergic sensitisation is typically systemic, allergic diseases are typically localised to
the site of exposure to the sensitised allergen. For example, allergic sensitisation to airborne allergens
can lead to allergic rhinitis (AR), asthma or both in the upper, lower or combined airway. Skin reactivity
with allergen can result in atopic eczema, whilst food allergens consumed orally (given that these can
also be inhaled) typically cause gastrointestinal reactions.
The exception to these localised allergic diseases is anaphylaxis, which is typically IgE-mediated
(although can be non-allergen/IgE-mediated, driving systemic mast cell degranulation) and can be
fatal if rapid treatment is not provided. This multi-organ disease can be fatal due to its rapid onset
(minutes to hours), systemic nature and the impairment of both respiratory and cardiac systems.
Whilst there has been suggested to be around 60% heritability for atopic disease, this does not
account for the increasing prevalence of allergic sensitisation in recent decades (Custovic et al., 2012).
The environment therefore not only accounts for the initiation of allergy amongst genetically pre-
disposed individuals, but also an altered environment must account for increasing prevalence.
The increasing prevalence of allergy has been associated with a rise in sanitisation in the Western
world and increasing urbanisation, reviewed in (Von Hertzen and Haahtela, 2004). The hygiene
hypothesis predicts that reduced exposure to the infectious agents amongst which humans have
evolved, has led to a loss of peripheral tolerance to immune challenge. This in turn is suggested to
result in a reduced capacity to resolve inflammation once triggered, which especially relates to
helminth immunity which is called on infrequently in the Western world (Rook, 2009). The hygiene
hypothesis is supported by studies showing greater incidence of atopy and AR amongst urban children
17
as compared to rural children (Cooper et al., 2014, Majkowska-Wojciechowska et al., 2007). Children
growing up on farms show a greater protection from atopy, beyond those in rural settings alone, and
have been extensively studied in Europe. These studies have shown that the consumption of
unpasteurised milk and greater exposure to endotoxin are the major contributing factors in protection
from allergy (Perkin and Strachan, 2006, Loss et al., 2011). Single nucleotide polymorphisms (SNPs)
affecting CD14 expression can confer either protection or increased risk of allergic sensitisation or
asthma depending on both genotype and relative level of endotoxin exposure (Simpson et al., 2006,
Bieli et al., 2007). This protective farm-living effect can be conferred in utero by maternal exposure to
farms (Ege et al., 2008). Maternal farmyard exposure has been shown to induce toll like receptor (TLR)
2 and 4 and CD14 mRNA induction, which favour T helper type 1 (Th1) rather than T helper type 2
(Th2) priming of the immune system (Ege et al., 2006). A similar impact on immunological phenotype
was observed amongst children growing up on farms, compared to matched non-farm controls, who
showed increased proportions of regulatory T cells, especially in response to endotoxin stimulation
(Lluis et al., 2014).
1.2. Allergic Rhinitis
1.2.1. Clinical features of allergic rhinitis
AR, a chronic disease of the upper airway, typically presents with either perennial or seasonal
symptoms which are increased or induced on allergen exposure. Nasal allergic symptoms were shown
to have a prevalence of 27% amongst UK adults, occurring at least once in the 12 months preceding
the study, accounting for a mean of 25 per 100,000 GP consultations (Gupta et al., 2004). Patients
suffer with a combination of upper respiratory symptoms which include rhinorrhoea or nasal
congestion, nasal itching, sneezing and ocular symptoms of allergic conjunctivitis such as chemosis
and periorbital oedema, resulting in painful, itchy and watery eyes (Greiner et al., 2011). These
symptoms can also present with a systemic response, which is unsurprising given the typically elevated
levels of serum-detectable allergen-specific IgE which can result in urticaria on allergen contact with
the skin.
Diagnosis of AR is led by a history of symptoms upon exposure to allergen, if this can be recalled
accurately, which may be a persistent allergen such as house dust mite, or a seasonal allergen, such
as grass pollen. A SPT is routinely employed as a cheap and accurate method of confirming
sensitisation to a trigger (Bousquet et al., 2012), taking just 20 minutes to develop. In a similar vein to
SPT, intradermal allergen challenge can also show an allergen-specific sensitisation, with titration of
allergen concentration in this case used to discriminate patients by magnitude of response.

18
Intradermal testing is rarely used for the diagnosis of AR, but may be used in research to evaluate
suppression of allergic response over time. Further in vivo testing is rarely carried out outside of
research for AR, but can include nasal allergen challenge (NAC) (Scadding et al., 2012) and allergen
challenge chamber (ACC) (Devillier et al., 2011). Both of these techniques aim to replicate natural
allergen exposure and will call on patients to score symptoms with the potential to additionally
measure nasal secretions or peripheral blood and serum in vitro throughout challenge.
The typical definition of an AR patient as systemically sensitised has been complicated by the
identification of local AR (Rondon et al., 2012), which presents with identical symptoms but an
absence of systemic allergen-specific IgE. These patients show positive clinical symptoms on nasal
allergen provocation and have detectable secreted nasal IgE, suggesting a localised allergic response.
1.2.2. Epidemiology of allergic rhinitis
AR in the UK impacts on quality of life for the most severe sufferers and given peak incidence is
amongst 15-19-year olds, this can seriously affect seasonal allergic rhinitis (SAR) sufferers during the
pollen, coincidently also the exam, season (Ghouri et al., 2008). This study identified an increase in the
prevalence of GP-diagnosed AR in just 5 years between 2001 and 2005 from 4.6-6.6%, although this
underestimates the disease incidence of AR. A large self-report study conducted across Europe found
allergic nasal symptoms in 21.9-31% of responders across 4 centres in the UK (Burney and ECRHS.,
1996).
AR was documented in 17% of asthmatics in a large UK-based study of general practice-treated
asthmatics (Price et al., 2005), which showed a significantly increased severity (likelihood of
hospitalisation) of asthma in concomitant AR. This likely underestimates the concomitance of these
diseases as shown by a comprehensive literature review examining the prevalence of AR amongst
asthmatics in the US and Europe, and a single study in China (Gaugris et al., 2006), which found a cross-
sectional prevalence of AR in asthma was 60%-94% amongst the European and US studies. Lifetime
prevalence of any AR was greater still, which was typically >67.2%, up to 100% in a Danish study of
734 patients. Asthma amongst AR patients was shown to be present in 7.6-22.6% of cases in a large
multi-centred European study (Leynaert et al., 2004).
1.2.2.1. Grass pollen allergic rhinitis
Commonly referred to as hay fever, grass pollen SAR occurs between May and July in the UK, during
the peak grass pollen season. Sensitisation to pollen is extremely common (Scala et al., 2010), however

19
given the disparity of allergenic pollens detected within Europe, and the further complexity of
divergent pollen seasons for the same pollen (Smith et al., 2014), a lack of clarity with respect to
allergen trigger exposures has been shown amongst patients who miss-diagnose themselves
(positively or negatively) in 30% of cases of grass or tree pollinosis (Smith et al., 2009). Structured
history and SPT allows patients to make lifestyle changes and allergen avoidance measures in order to
address symptoms. Although, surprisingly, grass pollen counts by regions across Europe showed an
inverse correlation with the prevalence of AR (Burr et al., 2003), adding weight to the suggestion that
low dose allergen is required to drive Th2 responses (discussed further below, section 1.3.3).
Grasses belong to the Poaceae family which contains 9,000 species (Andersson and Lidholm, 2003),
few of which are allergenic. Efforts to limit the number of pollens needed to screen to confirm grass
pollen allergy has identified reactivity to Phleum pratense (Phl p) as highly concordant with at least 12
other grass commonly allergenic species (Andersson and Lidholm, 2003). Indeed, specific IgE towards
recombinant Phl p 1, 2 and 5 proteins identifies the majority of Phleum-sensitised individuals, along
with a large proportion of grass-allergic patients (Niederberger et al., 1998, Laffer et al., 1996). Whilst
Phl p peptides 1, 2 and 5 are still acknowledged as immunodominant, a recent study shows further
complexity with identification of an additional 52 Phl P Th2 peptides (Schulten et al., 2013).
Additionally, allergen-specific immunotherapy (AIT) towards Phl p is also successful at inducing
protective tolerance towards other grasses (Hejl et al., 2009).
1.2.3. Immunological basis of allergic rhinitis
AR is initiated and maintained by a Th2-dominated response, resulting in the induction of allergen-
specific IgE. IgE is bound to high affinity Fcε receptors (FcεRI) on the surface of mast cells
(predominantly) and basophils (Baraniuk, 2001, Stone et al., 2010). Tissue-resident mast cells of the
nasal mucosa are activated by the crosslinking of FcεR1 following engagement of allergen with
surface-bound IgE. Upon activation, the early phase cascade of allergic responses, is triggered within
seconds or minutes of allergen inhalation. Mast cells release preformed granules which contain
histamine, leukotrienes, prostaglandins, tryptase and bradykinin, the key mediators of the early phase
allergic responses interacting with nerves, blood vessels and mucus-producing cells of the nasal
mucosa (Parikh et al., 2003).
Following these immediate responses, mast cells are also able to produce cytokines which propagate
late phase and Th2 responses over the following hours, reinforcing sensitisation and allergen
recognition. The late phase response may be a second peak of rhinitic symptoms, or maintenance of
symptoms above baseline for up to 8 hours following exposure (Scadding, 2014, Scadding et al., 2012).
20
TNFα, GM-CSF, IL-3, IL-4, IL-5, IL-6 and IL-13 can all be produced by mast cells (Parikh et al., 2003,
Stone et al., 2010), and can recruit and promote eosinophils and basophils (GM-CSF, IL-3 and IL-5),
Th2 cells (IL-4 and IL-13) and IgE-switching in B cells (IL-4 and IL-13). Basophils share many properties
of mast cells but are not tissue resident and have a much shorter half-life. Basophils will traffic to the
mucosal tissue and produce much greater levels of IL-4 and IL-13. Eosinophils may reside in the nasal
mucosa, where they are thought to traffic to from the bone marrow in response to IL-5, contributing
to the early phase response (Barnes, 2011, Stone et al., 2010, Eliashar and Levi-Schaffer, 2005).
Eosinophils have a very short half-life (hours) in the circulation and traffic rapidly to the tissue. Upon
activation by IL-3, IL-4, IL-5, eotaxin and GM-CSF, eosinophils will degranulate, releasing toxic proteins
from lytic granules as well as synthesising and releasing cytokines and leukotrienes into the local
inflammatory environment (Bystrom et al., 2011). The discovery of a previously unrecognised innate
lymphoid cell, ILC2, which produces copious quantities of IL-13 and IL-5 in response to the allergic-
type epithelial cytokines IL-33 and IL-25 (Neill et al., 2010), suggests these cells are able to contribute
further to the late phase response and may be critical in promoting Th2 cells (Walker and McKenzie,
2013).
The generation of Th2 cells and IgE-switched B cells is discussed in further detail elsewhere (section
1.3.3 and 1.5.2, respectively). Allergen-specific naïve T cells are driven towards Th2 in the local mucosa
or draining lymph, these drive naïve antigen-specific B cells to switch towards IgE production by
further producing IL-4, IL-13 and expressing CD154 in the germinal centre. IgE-switched B cells go on
to become IgE-secreting plasma cells (PCs) or plasma blasts and may migrate to the local mucosa for
the short term, or to the bone marrow and spleen for the longer term (Luger et al., 2009). Th2 memory
T cells reside within the local mucosa and draining lymph, contributing IL-4 and IL-13 to the late phase
response following activation both non-specifically by inflammatory cells in situ (through CD154, CD28
and IL-4R), and through antigen-specific T cell receptor (TCR) engagement.
Despite the common description of an early and late phase response to allergens, in vivo these
responses overlap, with early acute response (sneezing, rhinorrhoea and itching) giving way to an
extended period of nasal blockage or rhinorrhoea following controlled single exposure (Scadding et
al., 2012). It is also clear from the above description that the allergic nasal response requires allergen-
specific sensitisation, as mentioned previously (section 1.1), and allergic priming to generate high
affinity allergen-specific IgE bound to the surface of mast cells for the initiation and progression of AR,
which may take one or more pollen seasons in the case of SAR.
21
1.2.3.1. TLRs in allergy
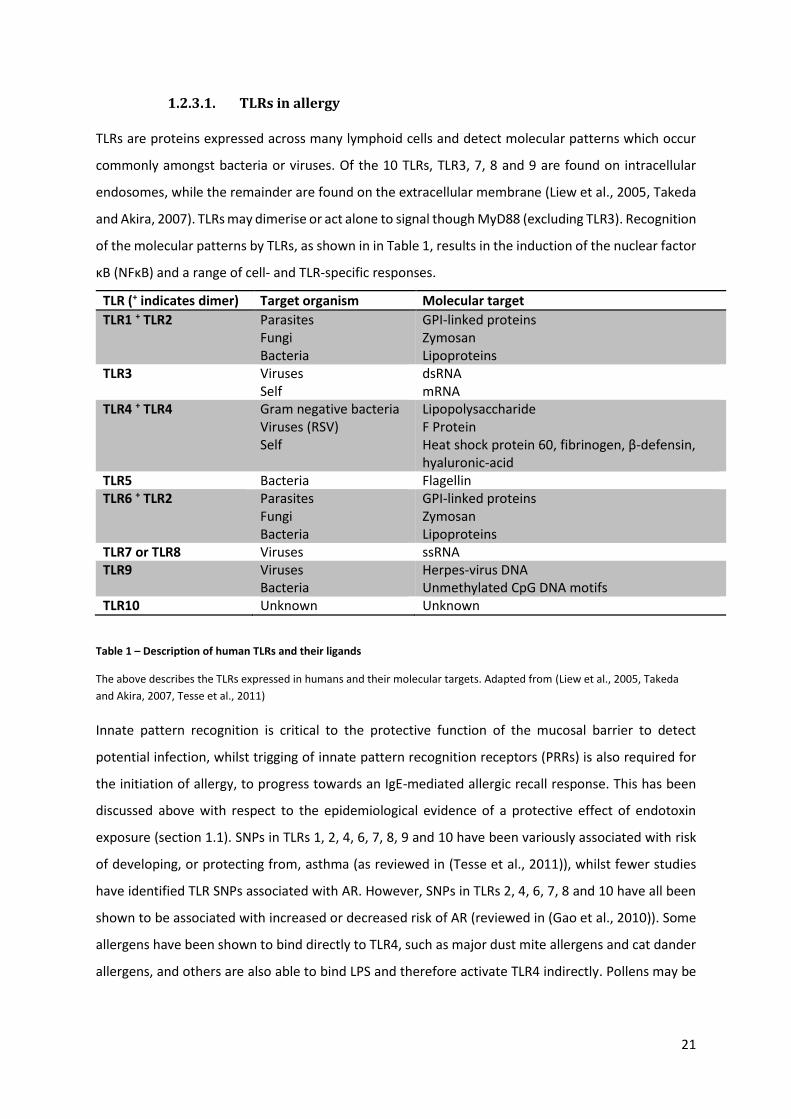
TLRs are proteins expressed across many lymphoid cells and detect molecular patterns which occur
commonly amongst bacteria or viruses. Of the 10 TLRs, TLR3, 7, 8 and 9 are found on intracellular
endosomes, while the remainder are found on the extracellular membrane (Liew et al., 2005, Takeda
and Akira, 2007). TLRs may dimerise or act alone to signal though MyD88 (excluding TLR3). Recognition
of the molecular patterns by TLRs, as shown in in Table 1, results in the induction of the nuclear factor
κB (NFκB) and a range of cell- and TLR-specific responses.
TLR (+ indicates dimer) Target organism Molecular target
TLR1 + TLR2 Parasites Fungi Bacteria
GPI-linked proteins Zymosan Lipoproteins
TLR3 Viruses Self
dsRNA mRNA
TLR4 + TLR4 Gram negative bacteria Viruses (RSV) Self
Lipopolysaccharide F Protein Heat shock protein 60, fibrinogen, β-defensin, hyaluronic-acid
TLR5 Bacteria Flagellin TLR6 + TLR2 Parasites
Fungi Bacteria
GPI-linked proteins Zymosan Lipoproteins
TLR7 or TLR8 Viruses ssRNA TLR9 Viruses
Bacteria Herpes-virus DNA Unmethylated CpG DNA motifs
TLR10 Unknown Unknown
Table 1 – Description of human TLRs and their ligands
The above describes the TLRs expressed in humans and their molecular targets. Adapted from (Liew et al., 2005, Takeda
and Akira, 2007, Tesse et al., 2011)
Innate pattern recognition is critical to the protective function of the mucosal barrier to detect
potential infection, whilst trigging of innate pattern recognition receptors (PRRs) is also required for
the initiation of allergy, to progress towards an IgE-mediated allergic recall response. This has been
discussed above with respect to the epidemiological evidence of a protective effect of endotoxin
exposure (section 1.1). SNPs in TLRs 1, 2, 4, 6, 7, 8, 9 and 10 have been variously associated with risk
of developing, or protecting from, asthma (as reviewed in (Tesse et al., 2011)), whilst fewer studies
have identified TLR SNPs associated with AR. However, SNPs in TLRs 2, 4, 6, 7, 8 and 10 have all been
shown to be associated with increased or decreased risk of AR (reviewed in (Gao et al., 2010)). Some
allergens have been shown to bind directly to TLR4, such as major dust mite allergens and cat dander
allergens, and others are also able to bind LPS and therefore activate TLR4 indirectly. Pollens may be
22
carriers for gram negative bacteria, driving low level TLR1, 2 or 4 activation (Deifl and Bohle, 2011,
Heydenreich et al., 2012).
Low level immune activation, partly through TLR stimulation in places, is thought to drive Th2
responses. Conversely, TLR agonists have been thought to be able to drive Th1 responses when
offered as adjuvants to AIT (high dose allergen with higher concentration TLR stimuli), or indeed in
isolation. TLR4 agonists have been successfully used in clinical trials as adjuvants for grass pollen
immunotherapy, showing significant induction of regulatory T cells, specific IgG4 and leukotrienes,
however neither study examined clinical suppression of AR symptoms (Rosewich et al., 2010, Mothes
et al., 2003). Of relevance to this thesis, the use of the TLR9 agonist, CpG, as adjuvants to ragweed
pollen AIT have shown successful suppression of Th2 responses and clinical symptoms against placebo
throughout the pollen season in a number of studies (Creticos et al., 2006, Simons et al., 2004, Tighe
et al., 2000, Tulic et al., 2004). In mouse models of OVA-induced allergic airway inflammation,
successful tolerance and reversal of allergy was shown with CpG alone and, to a greater extent, as an
adjuvant (Fonseca et al., 2011), leading to the suggestion that CpG alone may be used in humans,
potentially by intranasal administration, as pollen-free therapy. Interestingly, a study of TLR9 protein
across allergic rhinitics found expression across Th2 cells in the periphery, mucosa and bone marrow,
but no difference compared to controls (Fransson et al., 2007), suggesting these patients will be
equally receptive to CpG.
1.2.3.2. Immunoregulation in allergic disease
Whilst the immunoregulatory balance of both T and B cells in autoimmunity has been extensively
studied, a similarly defective regulatory compartment has been demonstrated in allergic inflammation
(Akdis, 2009) (section 1.3.5). Allergic donors are differentiated from non-allergics by their production
of Th2 cytokines, IL-4, IL-5 and IL-13, in allergen-driven PBMC cultures, which is not detected in
cultures of non-allergic PBMCs (Akdis et al., 2004). A comparable IL-10 response between allergic and
non-allergic donors suggests that the capacity to produce an allergen-specific IL-10 response is not
defective (Bullens et al., 2004, Domdey et al., 2010, Nouri-Aria et al., 2004); the excessive Th2 cytokine
response is the feature of the immunological dysregulation amongst allergics. Grass pollen-stimulated
peripheral blood mononuclear cells (PBMCs) show increased IL-10 during the grass pollen season
amongst grass allergic individuals (Singh et al., 2011), which may be a product of Th2 or Tr1 cells, but
is insufficient to prevent Th2 cytokine production or clinically relevant pathology. Alternatively,
blockade of allergen-induced IL-10 in PBMC cultures exacerbates allergen-driven proliferation and
cytokine responses in allergic donors only, showing the IL-10 produced is successful, to a degree, in
Th2 suppression (Domdey et al., 2010). Th1-biased responses to polyclonal T cell stimulation, tetanus

23
toxoid (TT) or purified-protein derivative (PPD) of Mycobacterium tuberculosis amongst allergic
individuals is similar to non-allergic controls, demonstrating an allergen-specific, Th2 biased, response
(Domdey et al., 2010, Bullens et al., 2004, Till et al., 1997a, Till et al., 1997b).
Beyond measures of IL-10, there is no consensus of evidence suggesting quantitative differences in
CD25hiFoxP3+ Tregs amongst CD4+ T cells in allergic patients (revisited below, 1.3.5). Studies
comparing proportions of Tregs show equivalent (Provoost et al., 2009, Han et al., 2010), decreased
(Stelmaszczyk-Emmel et al., 2013) or increased proportions (Ito et al., 2009) in allergic disease
compared with controls. Interestingly, Tregs derived from grass or birch pollen allergic individuals
have been shown incapable of controlling allergen-stimulated effector T cell proliferation in vitro
compared with matched non-allergic controls (Thunberg et al., 2007, Bellinghausen et al., 2003, Ling
et al., 2004). Tregs of grass pollen allergic patients showed a further loss of suppressive activity during
the pollen season (Ling et al., 2004). A recent study has also shown greater methylation of the FoxP3
locus amongst the isolated memory (CD45RO+) Tregs from allergics, compared to non-allergics, which
was directly related to reduced FOXP3 transcript in these patients compared to controls (Swamy et
al., 2012).
1.2.4. Treatment of allergic rhinitis (focusing on SAR)
The patient experience of allergic rhinitic symptoms varies greatly, with little predictive capacity of
severity using current diagnostic techniques. Approach to AR treatment in the UK is typically stepwise
(Figure 1), with more advanced (and expensive) treatment offered in addition to and following first
line treatment, if these alone are unable to provide satisfactory relief (Scadding et al., 2008, Angier et
al., 2010).
Following accurate diagnosis, AR patients are offered disease education with respect to likely triggers
(based on clinical history, SPT and specific IgE), likely disease progression (development of asthma and
increased susceptibility to viral respiratory infections (Cirillo et al., 2007, Mahesh et al., 2009)) and
advice on allergen avoidance, where possible. Allergen avoidance is likely to be accompanied by
second generation (non-sedating) oral anti-histamines, which provide a cost effective benefit to
patients, especially when used prophylactically (Demoly et al., 2014). Nasal corticosteroids are also
one of the most effective treatments available for AR, with greater symptom relief experienced than
anti-histamines alone and limited penetration of the drug into the systemic circulation this is a widely
popular option (Weiner et al., 1998). In practice, both anti-histamines and nasal corticosteroids are
both advised as first line treatments and are often used concurrently (Figure 1) (Scadding et al., 2008).
Second line treatment may be offered in addition to first line treatments for use as required if the
24
patient feels adequate relief is not offered from first line treatments alone, these are also relatively
inexpensive but may address specific needs, such as nasal rinse for reducing the experience of nasal
symptoms in pollen SAR (Figure 1).
Systemic treatments such as oral leukotriene receptor antagonists (LTRA) are effective but less
predictably so than antihistamines or nasal steroids (Wilson et al., 2004). There has been a suggestion
that LTRAs may be of use for asthma complicated by AR as opposed to AR alone (Nishimura et al.,
2011), but are not routinely recommended for AR (Scadding et al., 2008). Oral corticosteroids are
rarely used in SAR patients, other than for short-term use when judged appropriate for
moderate/severe or severe uncontrolled AR.
Omalizumab, an anti-IgE monoclonal antibody (mAb) therapy, has shown efficacy in poorly controlled
allergic asthma (Holgate et al., 2009). This results in down-regulation of FcεR1 on the surface of mast
cells and basophils due to a reduction in cell-free IgE, whereas anti-IgE does not result in FcεR1 cross-
linking or binding to surface-bound IgE, thereby avoiding the risk of anaphylaxis. There is evidence
that Omalizumab is effective in reducing symptom scores and increasing quality of life in poorly
controlled AR, when compared with placebo (Tsabouri et al., 2014). When used in combination with
subcutaneous immunotherapy (SCIT), Omalizumab for 18 weeks, beginning 10 weeks prior to the
pollen season, there was an additional 36% reduction in symptom severity during the pollen season
(Kopp et al., 2013). However, this was not maintained in subsequent pollen seasons in which
Omalizumab was not used in addition to AIT. This effective treatment is more expensive than AIT and
does not provide a persistent benefit following withdrawal; as such it is unlikely to be adopted widely.
1.2.4.1. Allergen Specific Immunotherapy
AIT as an immunomodulatory therapy for severe AR and asthma has been well described since it was
first demonstrated over 100 years ago (Durham and Leung, 2011, Akdis and Akdis, 2011, Frew, 2010).
AIT is the only treatment for allergic disease which is disease-modifying and shows efficacy following
withdrawal of treatment (Durham et al., 1999, Eifan et al., 2011, Marogna et al., 2010). AIT is indicated
in patients with severe AR, poorly controlled by pharmacotherapy and where allergen avoidance is
not possible (Figure 1) (Walker et al., 2011). AIT is expensive and time consuming, with poor
adherence, only 18% completed the full 3 year course in a retrospective audit of AIT outpatients (Kiel
et al., 2013). Therefore patients are screened carefully before commencing treatment. Efficacy of both
SCIT and sub-lingual immunotherapy (SLIT) has been shown by meta-analysis of double-blinded
placebo-controlled studies showing significant reduction of symptoms and use of medication
(Calderon et al., 2010, Calderon et al., 2007, Radulovic et al., 2010). In grass pollen immunotherapy,

25
significant reductions in symptom and medication scores have been clearly demonstrated by both
routes, which extends at least 2 years following cessation of the 3 year standard protocol (Durham et
al., 1999, Durham et al., 2012).
The protocols and dosing for the only two forms of grass AIT licensed for use in the UK (Pollinex® –
SCIT and Grazax® – SLIT) differ dramatically (Joint-Formulary-Committee, 2014). SCIT, as licenced in
the UK, is a solution of 13 grass allergoids with no adjuvant. SCIT requires an up-dosing regimen,
typically over 4-6 months, before achieving a maximum allergen dose (100,000 standard quantity units
(SQ-U), which equates to approximately 22.5µg of major allergen). Up-dosing is patient-specific, and
depends on their ability to tolerate injections, with serious local reactions or systemic reactions likely
to lead to repeated or lower dosing before continuing to increase. Maintenance dosing is then
continued, ideally every 4 weeks. In comparison, SLIT tablets contain 75,000 SQ-U of lyophilised
timothy grass pollen, also with no adjuvant. The SLIT tablet is taken first in the clinic to ensure no
severe local or systemic reactions take place, which is extremely rare, after which they are taken daily
at home. It is placed under the tongue and swallowing is avoided for 1 minute, and food and drink
avoided for 5 minutes, with allergen uptake expected to take place within 2 minutes in the sublingual
mucosa.
Grass pollen SCIT has greater risk associated with treatment, with systemic reactions more common
by this route but also a slightly greater mean improvement in quality of life and reduction in symptoms
and medication amongst this group compared to SLIT (Calderon et al., 2010), although no head to
head studies of SLIT and SCIT have been sufficiently powered to detect differences between the two.
Adherence is also greater with SCIT, although this is likely due to the requirement to attend outpatient
appointments to receive treatment (Kiel et al., 2013). In a large population-based analysis of SCIT
treatment in Denmark (Linneberg et al., 2012), SCIT was shown to be protective against developing
autoimmune disease and myocardial infarction, and, surprisingly, all-cause mortality.
26
1.2.4.2. Immunological features of AIT
Both SCIT and SLIT result in high cumulative allergen-dosing and immune deviation towards Th1 and
Tr1 as a result (see sections 1.3.4 and 1.3.5). The mechanisms of induced immunological tolerance
have been extensively reported to involve the induction of suppressive cytokines such as IL-10 and
TGFβ (Akdis et al., 1998, Bohle et al., 2007, Ciprandi et al., 2009, Maggi et al., 2012, Pilette et al., 2007,
Nouri-Aria et al., 2004), Tregs (Scadding et al., 2010, Radulovic et al., 2008, Francis et al., 2003) and
the de-novo generation of allergen-specific IgG4 and IgA2 (James et al., 2011b, Pilette et al., 2007,
Francis et al., 2008). Clearly the T and B cell responses of AIT are interrelated and the time course of
induction is critical to understand the dominant immunological responses driving allergen tolerance
in this model.
Early induction of allergen-specific IL-10 was first shown in bee venom AIT (Akdis et al., 1998),
detectable at day 7 following a rapid single day up-dosing regimen. Interestingly, allergen-induced IL-
AIT
(Omalizumab)
Oral corticosteroids
Leukotriene receptor antagonists
Saline nasal rinse
Long acting anti-histamines
Nasal corticosteroids
Education - including allergen avoidence
Second generation (non-sedating) anti-histamines
Figure 1 – Hierarchy of treatments for AR.
Hierarchy of suggested treatment regimens which should be offered for AR (adapted from (Greiner et al., 2011,
Scadding et al., 2008)) is shown above, in order of severity of impact on quality of life (from bottom, least, to top,
most). Those in brackets may be used but are not recommended or are recommended in limited circumstances.
27
10 was principally derived from T cells at day 7, followed by monocytes and B cells by day 28. Further
studies have confirmed the early induction of allergen-specific IL-10 responses in PBMCs during birch
and grass pollen immunotherapy, compared with placebo-treated patients (Francis et al., 2008, Möbs
et al., 2012). A prospective study of birch AIT followed IL-10 responses through 3 years of AIT
maintenance dosing and 2 years of withdrawal (Möbs et al., 2012). The increase in IL-10 responses
observed at 6 months returned to and remained at baseline throughout the remainder of the study.
Conversely, the grass study showed a very early increase in peripheral IL-10 production at 2-4 weeks
achieved at low cumulative allergen doses and these increases in IL-10 were sustained throughout the
12 months of follow up. (Francis et al., 2008).
1.2.4.3. Allergen-specific IgG4 and AIT
Induction of allergen-specific IgG4 antibodies, capable of blocking allergen-IgE interactions, is critical
to the clinical efficacy of AIT (James et al., 2011b, Shamji et al., 2012). Switching towards IgG4
production requires IL-10 (Akdis et al., 1998, Aalberse et al., 2009, Satoguina et al., 2005), which is
thought to be derived from Tr1 (Satoguina et al., 2008, Satoguina et al., 2005). Allergen-specific IgG4
is significantly induced after 6 months of AIT (Francis et al., 2008). Although clinical efficacy of AIT is
maintained following withdrawal of AIT (Marogna et al., 2010, Calderon et al., 2007, Durham et al.,
1999), allergen-specific IgG4 declines toward, but does not return to, baseline levels (Möbs et al.,
2012, James et al., 2011a). The persistence of clinical efficacy post withdrawal is due to retention of
functional IgG4 capable of blocking allergen-IgE interactions in vitro to the same degree observed
during AIT maintenance (James et al., 2011a). The first study of IgG4 in relation to Bregs was able to
sort bee venom- (phospholipase A2; PLA) specific B cells in bee-allergic, bee venom AIT-treated and
bee venom tolerised beekeepers (van de Veen et al., 2013). PLA-specific B cells had increased IL-10
and IgG4 mRNA directly ex vivo, whilst IL-10-producing B cells were enriched within the PLA+ but not
PLA- B cells following 3 days of CpG stimulation. Additionally, CpG-induced IL-10-expressing B cells
showed expression of IgG4 mRNA and protein when further stimulated with CpG whereas blockade
of IL-10 receptor prevented IgG4 induction. The authors finally show that CD27- (naïve) IL-10+ B cells
produce IgG4 following further CpG stimulation, which is not observed amongst IL-10- and CD27+ B
cells. Previous data has drawn correlation between the induction of allergen-specific IgG4 and
regulatory T cells (both IL-10+ and FoxP3+ Tregs) (Pereira-Santos et al., 2008).

28
1.3. T cells
T cells are critical for effective adaptive and sterile immunity. T cells exist in many forms in the
periphery; the two numerically dominant divisions of T cells are CD4+ and CD8+ T cells, which act as
‘helper’ cells (to macrophages and B cells) and cytotoxic cells, respectively. Although CD8+ T cells will
not be the focus of this introduction, they are critical in effective anti-viral immunity and for tackling
intracellular bacteria. Additionally, invariant natural killer T cells (iNK T) and γδ T cells will not be the
focus of this introduction. Although iNK T cells will be briefly introduced later in this section due to
their recognition of CD1d which can be found on B cells (Blair et al., 2010).
CD4+ and CD8+ T cells recognise protein antigens held in the context of either class II or class I major
histocompatibility complex (MHC), respectively (Sercarz and Maverakis, 2003). TCR engagement in
order to promote T cell activation requires a threshold of affinity (strength of recognition) and avidity
(number of interactions) to be met (Brownlie and Zamoyska, 2013), in addition to co-stimulatory and
cytokine signals. The expression of antigen in MHC requires the processing of proteins for insertion
into MHC and as such, T cells do not recognise folded protein structures (unlike B cells) but will
respond to a processed linear peptide sequence, typically 8-10 amino acids for MHC class I or 13-22
amino acids in MHC class II (Sercarz and Maverakis, 2003), expressed by self-MHC. Peptides presented
in MHC class I are fragmented from cytosolic proteins in the proteasome and are loaded into MHC
class I by the loading complex in the endoplasmic reticulum. MHC class II-presented antigens are
obtained by phagocytosis of extracellular material, which may be antibody-mediated. Class II MHC is
expressed on professional APCs, such as dendritic cells (DCs), B cells and macrophages, as well as
activated T cells at a low level. As such CD4+ T cells are directed at extracellular epitopes whilst CD8+
T cells detect and kill cells with a burden of non-self, intracellular antigens.
1.3.1. CD4+ T cell development and selection
All T cells mature in the thymus, having migrated from the bone marrow as thymocytes without the
expression of T cell receptors (TCRs). TCR diversity is generated by rearrangement of genes encoding
V, D and J segments of the α and β chains which form the vast majority of T cells that exit the thymus
in adults (Carpenter and Bosselut, 2010). Complete expression of an αβ TCR on CD4 and CD8 double
positive T cells leads to selection of the appropriate co-receptor based on successful engagement of
MHC class II or MHC class I, respectively. T cells are selected against self-reactivity by a process of
positive and negative selection within the thymus to ensure selection for T cells that can recognise
self-MHC but against those that engage with self-peptide in this context with too great an affinity
(Brownlie and Zamoyska, 2013, Morris and Allen, 2012). This process is an imperfect balance between

29
generating T cells with broad antigen recognition and preventing autoimmunity; despite this, all
healthy individuals have T cell clones which can react to self. Thymically generated ‘natural’ Tregs,
which express the transcription factor FoxP3 on egress from the thymus and recognise self-antigens
with moderate affinity, are selected to assist with self-tolerance in the periphery (Hsieh et al., 2012).
Peripheral tolerance resists T cell self-recognition by controlling the context of T cell activation, driving
peripherally-generated Tregs or anergy where T cells are activated in non-inflammatory settings.
1.3.2. T cell activation
Mature, naïve, CD4+ T cells migrate from the thymus to circulate through the secondary lymphoid
organs via the peripheral blood. Naïve CD4+ T cells require constant interaction with self-MHC through
the TCR/CD3/CD4 complex in order to survive (Morris and Allen, 2012). T cells are therefore seeking
constant contacts with DCs and B cells expressing MHC class II whilst recirculating through the
secondary lymph. They are carried through the lymph by a chemotactic gradient of CCL21, which
engages with CCR7 on the surface of naïve T cells (Gatto and Brink, 2010). Engagement with non-self-
peptide in the context of MHC class II in sufficient concentration to trigger TCR signalling alone is not
sufficient for T cell activation and requires co-stimulation (signal 2) and cytokine stimuli (signal 3),
which also direct the differentiation of the T helper subset. Co-stimulatory molecules including
CD80/86 and CD40, which bind CD28 and CD40L on T cells, respectively, are able to stabilise the
activatory signals of the TCR and are not expressed on APCs in the absence of inflammation.
Inflammatory cytokines in the microenvironment and engagement of pattern recognition receptors
(PRRs) (such as TLRs, described previously, section 1.2.3.1) lead to the expression of co-stimulatory
molecules and cytokine production by APCs. T cell activation leads to expression of CD25, the high
affinity IL-2 receptor α chain, along with production of IL-2 which maintains survival and promotes
proliferation. The cytokine production of APCs, local cells or even more peripheral cells is largely
thought to influence T helper cell subset fate, which is ultimately determined by specific transcription
factors.
1.3.3. Th2 cells
The key T cells orchestrating allergic responses and parasitic defences are Th2 T cells, which are able
to drive the production of IgE amongst B cells as well as promoting mast cell, basophil and eosinophil
responses towards multi-cellular organisms. IL-4 is crucial to the induction of Th2 cells in vivo (Kopf et
al., 1993, Seder et al., 1992), IL-4, accompanied by TCR recognition of antigen, leads to an induction
of the transcription factor GATA3 amongst mature T cells, binding the Th2 locus which encodes IL-4, -
5 and -13, driving and maintaining the Th2 phenotype and cytokines (IL-4, IL-5 and IL-13) (Zheng and
Flavell, 1997, Wan, 2014, Zeng, 2013, Cook and Miller, 2010). The source of IL-4 that drives Th2

30
development is not APCs, although an absence of IL-12 or IFNγ may allow Th2 cytokines to become
more dominant. IL-4 may be produced by other Th2 cells, as well as T follicular helper cells (Tfh), mast
cells, basophils and iNK T cells (Zeng, 2013), to drive Th2 expansion in the microenvironment.
Given that T cells are the dominant source of IL-4, the initiation of Th2 responses requires an IL-4-
independent polarising factor. Mature naïve T cells express GATA3, although function is antagonised
in the absence of TCR signalling (Kurata et al., 2002). However, weak TCR engagement (poor affinity
or avidity) drives Th2-differentiation in the absence of IL-4, as GATA3 repression has a low threshold
for reversal (Milner et al., 2010, Tao et al., 1997). This is a critical step towards priming a Th2 immune
response, given the early absence of IL-4. The grass pollen proteins Phl p 1, 3 and 5 are the dominant
Th2 antigens in grass allergic individuals (Oseroff et al., 2010), which are small, rapidly soluble,
proteins (Vrtala et al., 1993). Low-dose grass pollen, present in very low abundance, with weak
triggering of PRRs, is incapable of driving a Th1 response but achieves a threshold for Th2 priming.
1.3.4. Th1, Th17 & Tfh subsets
A typical, non-pathological immune response does not include one T cell subset alone and will show a
balance of helper subsets in order to target a variety of effector mechanisms, although depending on
the triggering agent some helper subsets will dominate.
Th1 responses drive immunity against intracellular pathogens, specifically arming macrophages
towards an inflammatory phenotype, promoting intercellular killing, as well as driving the production
of opsonising IgG antibody from B cells (Zhou et al., 2009a, Jutel and Akdis, 2011). Th1 differentiation
is driven by IL-12 produced by APCs under the transcriptional control of T-bet, and assisted by high
affinity and avidity of MHC class II-peptide-TCR complex signalling along with efficient co-stimulation
(induced on APCs by PAMPs) (Milner et al., 2010, Zhou et al., 2009a). Expression of IL-12Rβ or IL-4R
and subsequent signalling reinforces the expression of T-bet and GATA3, respectively, and
transcriptionally suppress Th2 or Th1 cytokines and differentiation, respectively. IL-2 and IFNγ
production is core to Th1 functionality, promoting T cell survival and proliferation, whilst driving the
activation and differentiation of inflammatory macrophages, respectively (Mills, 2012). Th1 and Tr1
cells have been suggested to be critical in the induction of immunological tolerance by AIT (Wisniewski
et al., 2013, Soyer et al., 2013). Administration of chronic high dose allergen is likely to drive this Th1
phenotype, rather than low dose allergen which induces Th2 responses amongst allergics.
Furthermore, chronic antigen stimulation induces IL-10 amongst Th1 cells, a Tr1 phenotype thought
to mediate induced allergen tolerance (Saraiva et al., 2009, O'Garra and Vieira, 2007, Thunberg et al.,
2007, Soyer et al., 2013). A recent study of the grass pollen-specific T cell repertoire showed T cells
31
the major allergens Phl p 1 and 5, were predominantly Th2 cells (at least 75%) amongst allergics. T
cells recognising the same peptide allergens in non-allergics were significantly fewer and, of those,
were predominantly Th1/Tr1 (at least 75%) amongst AIT-treated and non-allergic individuals (Wambre
et al., 2014). Although Th2 cells are able to assume a Th1 phenotype in a Th1 microenvironment in
vitro or in vivo (Smits et al., 2001, Krawczyk et al., 2007), it appears that AIT leads to the selective
deletion of allergen-specific Th2 cells in favour of Th1/Tr1 (Wambre et al., 2014).
Whilst the balance of Th1 and Th2 responses have been the focus of T cell research in AR, the Th17
subset, which shows plasticity between FoxP3-expressing Tregs, may also contribute to the
pathogenesis of AR (Liu et al., 2014c). IL-17A (commonly called IL-17), IFNγ, TNFα and IL-17E
(commonly referred to as IL-25) are produced by Th17 cells under the transcriptional control of RORγt
in mice, or RORC in humans (Kimura and Kishimoto, 2010). Whilst these cytokine products are
predominantly pro-inflammatory, IL-25 has been associated with Th2 priming, predominantly
produced by the epithelium along with IL-33. Studies examining the Th17 subset in AR have shown
increased frequencies of Th17 cells in humans (Tsvetkova-Vicheva et al., 2014), whilst Th17 cells in a
murine model of AR support Th2-driven inflammation (Quan et al., 2012). In mice, Tregs and Th17
cells show plasticity between one another, with IL-6 and TGFβ able to induce Th17 cells from naïve T
cells, instead of FoxP3+ Tregs induced by TGFβ alone (Kimura and Kishimoto, 2010, Liu et al., 2014c).
In humans, IL-6 remains critical for the development of a Th17 phenotype, however, the addition of
IL-1β is required rather than TGFβ (Tuomela et al., 2012, Wilson et al., 2007). TGFβ in humans may
drive a subset of IL-21-secreting T cells (Tfh), derived from Th17 or Th1 cells (Liu et al., 2013b). The
unstable and plastic Th17 phenotype has shown these cells are capable of switching to Th1 or Th2
cytokine producers in the context of Th1 and Th2 cytokines, respectively, in spite of 3 weeks of in vitro
polarisation towards a Th17 phenotype (Lexberg et al., 2008), with plasticity demonstrated towards
Th1 in models of Th1 disease in vivo (Lee et al., 2009, Zhou et al., 2009a).
Tfh are critical in the formation of the germinal centre (GC) (Barr and Gray, 2012, Kemeny, 2012), and
secrete the cytokine IL-21. The classical phenotype of these cells is thought to be CD4+ CXCR5+ CD40L+
ICOS+ PD-1+. They are dependent on ICOS signalling for survival and differentiate in the presence of IL-
6 and IL-21. The GC transcription factor BCL-6, a feature of B cells within the GC, is also expressed by
Tfh. The subtypes of Tfh cells appear to mirror the T helper subsets in the periphery, co-opting the
cytokines IL-4, IFNγ, IL-10 or IL-17 with IL-21 production depending on the subset. Loss of IL-21 in
humans leads to a dramatic loss of class-switched antibody and PCs (Salzer et al., 2014), demonstrating
a critical role for this cytokine and the Tfh cellular subset in regulation of GCs.

32
1.3.5. Regulatory T cells
Tregs have been explored in great depth in the last 2 decades; research has shown these cells as a
critical regulator of peripheral tolerance. This is apparent by selective murine FOX3 knockouts, such
as the scurfy mouse, or the loss of functional FoxP3 in humans, leading to the development of IPEX
(immune dysregulation, polyendocrinopathy, enteropathy, X-linked syndrome), which are
characterised by spontaneous allergy, autoimmunity and inflammatory bowel disease (Sakaguchi et
al., 2008, Liston and Gray, 2014, Zhou et al., 2009b). The transcription factor, FoxP3, induced by TGFβ
and maintained by IL-2, drives and maintains the regulatory phenotype both as a function of centrally
induced (nTreg) and peripherally induced (iTreg) Tregs. The intracellular identification of FoxP3, as
well as the expression of the high affinity IL-2 receptor chain, CD25, has been crucial to identification
of these cells ex vivo. However, plasticity between Treg and Th17, Th1 or Tfh, and the instability of
FoxP3 in the absence of high IL-2 make these cells a heterogeneous and dynamic population,
dependent on the local cytokine milieu. However, in relation to Th2 immunity, the expression of IL-4
and GATA3 are inversely related to FoxP3, suggesting iTreg are unlikely to be able to differentiate in a
Th2-biased microenvironment (Mantel et al., 2007). Tregs produce immunosuppressive cytokines
such as IL-10, TGFβ and IL-35. Of which, IL-10 and TGFβ have been shown to be up regulated following
AIT and capable of inducing B cell IgG4 and IgA production (Ciprandi et al., 2009, Satoguina et al.,
2008), respectively and cooperatively. Tregs act additionally through cell surface markers such as
CTLA-4, CD39 and CD73 (Tang and Bluestone, 2008).
The role of Tregs in AR has been described briefly above (section 1.2.4.2), with a focus on IL-10.
Although it is clear that FoxP3-expressing regulatory T cells produce suppressive IL-10, it is unclear to
what extent a reduction in FoxP3+ Tregs might be relevant to loss of allergen tolerance in AR. There is
no clear data of a numerical deficiency of Tregs from dust mite allergic individuals were shown to be
equally as functional as non allergics (Maggi et al., 2007). However, a larger study of grass pollen
allergics showed a functional deficit of Tregs in suppressing grass pollen-driven proliferation (Ling et
al., 2004), which was amplified during the pollen season. Although Tregs have been shown to be
increased both locally and peripherally following AIT (Scadding et al., 2010, Radulovic et al., 2008,
Pereira-Santos et al., 2008), conflicting data suggests that the peripheral detection of FoxP3+ Tregs
may be either transient or matched by placebo (Mobs et al., 2010, Bonvalet et al., 2012). It remains
unclear whether the Tregs detected post AIT are allergen-specific or induced by bystander TGFβ or IL-
10 production, but these studies have shown they are certainly capable of suppressing allergen-driven
T cell responses.
33
1.4. Immunobiology of IL-10
IL-10 is a 35kDa homodimer encoded on chromosome 1, across 5 exons, which was first described as
a Th2 cytokine (Sabat et al., 2010). In vitro it is possible to show IL-10 production from all subsets of
human CD4+ T cells and CD8+ T cells as well as B cells, monocytes, macrophages, dendritic cells, mast
cells, natural killer cells, eosinophils and neutrophils (Saraiva and O'Garra, 2010, Sabat et al., 2010),
implicating this cytokine in many aspects of immune function, both adaptive and innate. Given the
broadly anti-inflammatory role of IL-10, it is clear that this cytokine is a critical part of the regulation
and resolution of inflammation (Ng et al., 2013). Loss of IL-10 in mice is associated with chronic
inflammatory bowel disease, possibly due to an inability to suppress inflammatory responses to
commensal gut bacteria (Kuhn et al., 1993). A mouse model of allergic airway disease showed IL-10-
deficient mice developed less airway remodelling and hyper-responsiveness, whereas the
inflammatory infiltrate and resulting inflammation was exacerbated (Makela et al., 2000). A separate
study has shown that transfer of Tregs into wild-type mice with an OVA-induced allergic airway disease
was able to resolve Th2 inflammation through an IL-10-dependet mechanism (Kearley et al., 2005).
Whilst IL-10 appears to be crucial to the mechanism of action of AIT (reviewed above, section 1.2.4.2),
allergen-induced IL-10 production does not appear to be dysregulated amongst a subset of grass AR
patients compared to controls (also reviewed above, section 1.2.3.2).
The action of IL-10 is broad but well understood. In order to respond to IL-10, cells express the IL-10
receptor (IL-10R), of which two chains exist, IL-10R1 and IL-10R2 (also referred to as IL-10Rα and IL-
10Rβ, respectively). IL-10R1 is specific for IL-10, which cannot bind IL-10R2, however, once bound to
IL-10R1, IL-10R2 is able to associate and increase the affinity of the IL-10/receptor interaction by up
to 10x (Sabat et al., 2010). Expression of IL-10R1 determines the cellular responsiveness to human IL-
10 (Ding et al., 2001). Signalling through IL-10R1 results in the phosphorylation and the nuclear
translocation of STAT3, with STAT1 under some conditions, (Finbloom and Winestock, 1995) which
leads to cell-specific gene promotion. Monocytes and macrophages are key innate targets of IL-10
which drives a regulatory macrophage phenotype, inhibiting pro-inflammatory cytokine production,
inducing the up-regulation of scavenger receptors and the down-regulation of cell surface MHC class
II and co-stimulatory molecules (Nguyen et al., 2012, Mosser and Edwards, 2008, de Waal Malefyt et
al., 1991). IL-10, acting on APCs, is able to suppress T cell activation and T cell polarisation indirectly
whilst also acting directly on T cells, predominantly activated or memory T cells. T cell inflammation is
suppressed by the targeted suppression of Th1 cytokines (such as IFNγ and TNFα), Th2 cytokines (IL-
4, IL-5 and IL-13) and the suppression of Th17 activation (Hawrylowicz and O'Garra, 2005, O'Garra and
Vieira, 2007, Grunig et al., 1997). However, relevant to data in this thesis is the suggestion that IL-17A,
34
produced by Th17 cells, is not suppressed by IL-10 (Naundorf et al., 2009). IL-10 is able to suppress the
responsiveness of eosinophils and mast cells, with mast cell antigen-specific responses suppressed by
IL-10 along with reduction of the IgE receptor on the surface (Royer et al., 2001, Takanaski et al., 1994).
As well as being producers of IL-10 (discussed further in section 1.6), B cells are crucial targets of IL-10
in order to direct their development and antibody-producing role. Survival of germinal centre B cells
is dependent on IL-10 (Levy and Brouet, 1994), as is the proliferation and development of B cells into
long-lived plasma cells (Rousset et al., 1992). Switching of B cells is controlled by the cytokine milieu
of activated and anti-CD40-stimulated B cells, of which IL-10 drives switching towards IgG (1-4) classes
and can inhibit switching towards IgE in preference of IgG4 (Milovanovic et al., 2009, Jeannin et al.,
1998). This is of particular interest in AIT where allergen-specific IgG4 is generated in an environment
rich in IL-10-secreting cells. The source of IL-10 driving switching and plasmablast development has
been associated with B cell derived IL-10, which may have an autocrine function (Gary-Gouy et al.,
2002, Heine et al., 2014, van de Veen et al., 2013, Maseda et al., 2012) and which may be positively
regulated by Tfh cells and their cytokine, IL-21, in secondary lymphoid organs (Yoshizaki et al., 2012,
Yang et al., 2013).
35
1.5. B cells
B cells, so named due to their production from the bone marrow, develop from a common lymphoid
progenitor and share many features in common with their T cell cousins, such as the development of
receptor diversity. Immature B cells develop in the bone marrow and are selected against auto-
reactivity by stromal cell expression of self-proteins. As the B cell receptor (BCR) does not rely on
peptide presentation in the context of MHC, B cells do not require a process of positive selection
(Pieper et al., 2013). B cell somatic gene rearrangement drives a diverse repertoire of surface
immunoglobulin which acts as the B cell receptor and, following further affinity maturation in the
periphery, results in the secretory arm of the humoral immune system. B cells are known for their
ability to secrete antibody, however recent years have seen an expansion of research exploring their
non-antibody-dependent roles. B cells are potent APCs (matching that of DCs), phagocytic, capable of
producing a variety of inflammatory and non-inflammatory cytokines, as well as directing the
development and activation of T cells (Barr et al., 2012, Mauri and Bosma, 2012, Fillatreau, 2012). A
full understanding of the complex and diverse roles of B cells in vivo is especially important given the
current ever-increasing use of monoclonal antibodies (mAbs) to deplete B cells in the treatment of
autoimmunity and cancer.
1.5.1. Development
Within the bone marrow niche B cells, supported by stromal cells, differentiate into naïve immature
B cells which ultimately enter peripheral circulation (Maddaly et al., 2010, Pieper et al., 2013). The
pro-B cell undergoes rearrangements of the immunoglobulin heavy chain with random use of the V,
D and J segments of the heavy chain, similar to the β chain rearrangements of the TCR. The pre-B cell,
consisting of 2 arranged heavy chains with a µ constant region, is then expressed alongside two
surrogate light chains and Igα/Igβ to permit BCR signalling to form a functional early BCR. If the
rearranged heavy chain recognises self-proteins on stromal cells, resulting in BCR signalling, heavy
chain rearrangement will be attempted on the other chromosome. If neither chromosomal
rearrangement is successful, self-reactive BCR signalling results in clonal deletion by apoptosis. Much
like T cell development, this is an imperfect process which may allow Ig which show weak affinity to
self to progress. Healthy humans can be shown to have self-reactive BCRs (Tiller et al., 2007,
Wardemann et al., 2003, Koelsch et al., 2007), and further mechanisms of peripheral tolerance are
necessary to select against auto reactivity. Following successful heavy chain expression, the light chain
will undergo a similar process, in which V and J genes are randomly rearranged. There are two possible
light chains, with κ rearranging on both chromosomes (if self-reactive in the first instance) before the
attempted rearrangement of the λ light chain on each chromosome. If a rearrangement is successful,
36
and does not produce BCR signalling, maturation will progress. If all of the light chain rearrangements
contribute to a self-reactive BCR then the cell is selected against. The final immature B cell will express
2 identical heavy chains, which include the constant region, determining antibody isotype, alongside
2 identical light chains. Each heavy and light chain pair constitutes a fragment antigen binding or F(ab)
region, allowing a single antibody to bind 2 antigens.
Immature naïve B cells leave the bone marrow as a ‘transitional’ (T) subset in blood (Marie-Cardine et
al., 2008, Sims et al., 2005), expressing the rearranged BCR in the form of both IgM and IgD isotypes
by alternative splicing (Chen and Cerutti, 2011). These cells are CD24hiCD38hi and may make up two
distinct populations (T1 and T2; with decreasing staining intensity for both CD24 and CD38 between
T1 and T2), similar to those described in mice, in which T1-3 exist (Vossenkamper et al., 2012). Human
CD24hiCD38hi B cells make up a small proportion of circulating CD19+ B cells, around 5-7% in adults,
but are up to 50% of the peripheral blood B cell pool at birth, decreasing rapidly until age 6, reaching
adult proportions around age 13 (Marie-Cardine et al., 2008). These cells have been associated with
regulatory capacity (Blair et al., 2010), as discussed further below (section 1.6.1.4), but also were first
reported to express CD5 (Sims et al., 2005), which is associated with IL-10 capacity in B cells (Mageed
et al., 2012, Garaud et al., 2009, Gary-Gouy et al., 2002). Transitional B cells appear to exist as a
checkpoint for maturation into follicular or marginal zone B cells in the spleen. They are highly prone
to death and require stromal cells or IL-4 and CD40 signalling for survival and cell cycle progression
(Sims et al., 2005), BCR signalling acts as a regulator of autoreactivity by promoting cell death.
1.5.2. Germinal centre interactions
If not selected against, transitional B cells become follicular or marginal zone (MZ) B cells, losing the
expression of CD10 and also losing the intensity of CD24 and CD38 expression (Sims et al., 2005).
Follicular B cells circulate through the B cell zones of the spleen and other secondary lymphoid organs,
whilst MZ B cells in humans occupy the margin of the red and white pulp of the spleen, analogous to
the marginal sinus in mice (Weill et al., 2009). MZ B cells respond to T-independent antigens,
supported by a network of neutrophils driven towards a B helper phenotype (Puga et al., 2012), as
well as DCs and macrophages which are able to present antigen (Vossenkamper et al., 2012). Marginal
zone B cells can produce rapid responses to pathogens in the absence of T cell help, becoming short
lived IgM-producing plasma cells (Weill et al., 2009). These cells are high expressers of surface IgM
(compared to IgD), express CD27 and have undergone somatic hypermutation (SHM) in >80% of cases
(Garraud et al., 2012).
37
Follicular B cells circulate through the secondary lymphoid follicles responding to BCR/antigen cognate
interactions (Gonzalez et al., 2011, Shlomchik and Weisel, 2012). B cells express CXCR5 which directs
them to interact with follicular DCs (FDCs) in response to a gradient of CXCL13, produced by stromal
cells (Cyster, 2010). FDCs are non-proliferative, specialised presenting cells of the lymphoid organs
which express high levels of the low affinity FcγRs and complement receptors in the absence of MHC,
trapping antigen complexes in their conformational form for presentation to B cells. Successful BCR
signalling leads initially to B cells migrating to the follicular boundary with T cells, driven by expression
of CCR7, to seek T cell help (Gatto and Brink, 2010). B cells at this stage require the presentation of
CD40L by activated T cells. Activated follicular B cells commit to either becoming plasma cells,
secreting high affinity, somatically hypermutated, class-switched antibody, or may become extra-
follicular plasmablasts early on during GC formation, leaving the follicle to produce low affinity IgM,
similar to marginal zone B cells.
GC formation, under the control of the transcription factor BCL-6, is the result of very few clones,
potentially even one, which retain expression of CXCR5 (Shlomchik and Weisel, 2012, Gatto and Brink,
2010). These cells rapidly undergo proliferation and seed the GC. The structure of GCs has been well
established and consists of a ‘light’ and ‘dark’ zone. Within the light zone B cells have contact with T
cells and FDCs and are subjected to antigenic selection, whilst in the dark zone SHM and class switch
recombination (CSR) take place. B cell migration within the GC is driven by the expression of CXCR4,
the ligand for, CXCL12, is highly expressed in the dark zone. Whereas CXCL13 is highly expressed in the
light zone, allowing the retained expression of CXCR5 to direct CXCR4lo B cell centrocytes to the light
zone, whilst CXCR4high centroblasts are driven to the dark zone. SHM is the random targeted
mutagenesis of the variable region of the heavy and light chains of Ig in order to alter affinity for
antigen. CSR involves the pairing of the rearranged and mutated V, (D) and J sections with a differing
constant region, allowing expression of IgG1-4, IgA1, IgA2 or IgE, depending on the T cell-produced
cytokine milieu which direct switching. Pertinent to the pathogenesis of AR and AIT-induced tolerance
is the knowledge that switching towards IgE and IgG1, in which switching to IgG1 may be a precursor
to IgE switching, can be driven by IL-4 and inhibited by IFNγ (Davies et al., 2013). IgG4 is driven by IL-
10, whilst IL-21 is able to further drive IgG4 and inhibit the switching of IgE (Aalberse et al., 2009).
Following SHM, the BCR may have improved affinity for antigen or, given the randomness of the
mutations, may have weaker affinity for antigen in the light zone (Shlomchik and Weisel, 2012). The
BCR, post-SHM, is tested in the light zone by BCR engagement with antigen, strong signalling may lead
to internalisation of antigen and presentation to Tfh through MHC class II and increased co-stimulatory
molecules which drive proliferation. Some of these positively selected cells may go on to become
38
memory B cells or terminally differentiated plasma cells, whilst others may undergo further
proliferation or return to the light zone for further SHM. Weak affinity or no BCR/antigen interactions,
with limited co-stimulation, leads to death by neglect. Some B cells with BCRs showing moderate
affinity for antigen may be able to return to the light zone to attempt further SHM in order to improve
affinity.
GC B cells can differentiate into plasma cells, which are long lived antibody secreting cells that reside
predominantly in the bone marrow, or memory B cells, which recirculate through the secondary
lymphoid organs and may populate the marginal zone and allow antigen recall. Plasma cell
differentiation, driven by the transcription factor BLIMP-1, has been reported to be directed on the
basis of high affinity BCR signalling in addition to cytokine signals such as IL-21 and is defined by the
expression of CD138 in the absence of CD19, CD20 and CD21 (Shlomchik and Weisel, 2012, Gatto and
Brink, 2010, Eibel et al., 2014). Memory B cells have BCRs with lower affinity than plasma cells,
suggesting they left the GC reaction earlier on. Memory B cells are predominantly CD27+IgD- although
there is also evidence of a small population of CD27- memory B cells (Giesecke et al., 2014).
1.5.2.1. Ectopic germinal centres
Whilst GCs typically form in the secondary lymph, supported by a network of stromal cells and FDCs.
GCs, or GC-like reactions such as SHM and CSR, indicated by the ectopic expression of the necessary
molecular machinery, activation-induced cytidine deaminase (AID), in local tissue have been shown in
both autoimmune disease and allergy (Gatto and Brink, 2010, Coker et al., 2003, Takhar et al., 2005).
The nasal mucosa may be more receptive to IgE switching. In mice, IgE switching is inhibited by the
component GC cytokine, IL-21 (Suto et al., 2002). It is unclear what the role the cytokine IL-21 plays in
human B cells switching towards IgE; there is support for IL-21 inhibition of IgE switching and
promoting IgG4 in mixed PBMC cultures (Wood et al., 2004). However, IL-21 may be able to promote
IgE switching (Avery et al., 2008), particularly from IgG1+ cells, in the absence of BCL-6 expression, as
has been modelled in mice (Kobayashi et al., 2009). IL-21 as an inhibitor of IgE in humans is supported
by decreasing levels of T cell-produced IL-21 in atopic dermatitis of increasing severity, with
corresponding increased IgE (Lin et al., 2011). AID expression in the nasal mucosa in humans, along
with IgA and IgG transcripts has led to the suggestion that IgE switching takes place in the local
mucosa, due to the GC being more restrictive to IgE switching due to the expression of BCL-6 and IL-
21 (Coker et al., 2003, Takhar et al., 2005, Gatto and Brink, 2010, Davies et al., 2013).
39
1.5.3. B cells and TLRs
B cells in humans express TLRs 1, 6, 7, 8, 9 and 10 (Hornung et al., 2002, Bourke et al., 2003). Whilst
expression is detected in the absence of stimulation, expression is rapidly upregulated following a
range of stimuli, including TLR, BCR, CD40 and non-specific mitogens. The ligation of TLRs by B cells
has been shown to boost the generation of class switched B cells under GC conditions and drive the
differentiation of plasma cells (Pone et al., 2012, Jiang et al., 2011, Eckl-Dorna and Batista, 2009,
Huggins et al., 2007). It is likely that TLRs on B cells contribute to the GC response by providing further
positive feedback, similar to that generated by co-stimulatory molecules, whilst also inducing co-
stimulatory molecule expression on B cells (Agrawal and Gupta, 2011). TLR signalling may also
contribute to the switching decisions of B cells. In PBMC cultures, TLR 3, 7 and 9 agonists have been
shown to drive IgG, IgA and IgE switching in the presence of IL-4 and CD40L (Sackesen et al., 2013).
This study showed some bias of TLR9 stimulation to select for switching toward IgG or IgA over IgE,
compared to TLR3 or 7 agonists. In addition, patients with common variable immunodeficiency (CVID),
who have a deficiency in circulating IgA, IgG and/or IgM, showed a lack of B cell responsiveness to
TLR7 or 9 stimulation, along with a loss of IgD-CD27+ memory B cells (Yu et al., 2009). The action of
TLRs in inducing B cell switching may be contributed to, or indeed driven, by cytokines released by B
cells, or other PBMCs, following TLR stimulation.
1.5.4. Cytokine-producing B cells
Pertinent to this thesis, B cells have been shown to produce IL-10, IL-6, TNFα, IP10 (CXCL10), IL-8, IL-
1α/β and IL-13 following TLR1, 7 or 9 stimulation (Agrawal and Gupta, 2011). This study showed IL-
10, IL-6 and TNFα were produced by all three agonists, whilst the Th2-associated cytokine, IL-13, was
restricted to TLR1 stimulation. The induction of IL-10 secretion will be discussed further in the next
section, however the detection of IL-10 appears to be accompanied by detection of both IL-6 and TNFα
in B cells (Ziegler et al., 2014, Thibult et al., 2013, Iwata et al., 2012). The production of
immunoregulatory cytokines by B cells is discussed in the next section (1.6). A plethora of cytokines
have been suggested to be produced by murine B cells, although little of this data has been repeated
in humans or expanded further in mice (Bao and Cao, 2014). Human B cells have been shown to
produce IL-4 both spontaneously in vitro, enhanced on additional IL-4R stimulation, and in vivo, in the
dark zone of the GC response (Johansson-Lindbom and Borrebaeck, 2002). Additionally, IL-12 was
shown to be induced by human B cells, following CD40 and TLR9 stimulation (Wagner et al., 2004) and
capable of inducing IFNγ amongst Th1 T cells. However, a more recent study was unable to replicate
B cell IL-12 production using TLR9 stimulation alone (Agrawal and Gupta, 2011). The detection of IL4
and IL-12-producing B cells, at least amongst humans, remains unrepeated and requires further work
40
to explore the mechanisms underlying these findings. However, the data referred to in this section
suggests that B cells may contribute more to the cytokine signals and switch decisions in immune
responses than T and B cell dogma would predict, this is at least in part through TLR engagement,
although similar B cell cytokine responses have been reported by CD40 or BCR stimulation.
1.6. Regulatory B cells
The concept of suppressor B cells originated in the mid-1970s following a series of publications
reporting that adoptive transfer of B cells in guinea pigs resulted in suppression of ovalbumin (OVA)-
induced contact hypersensitivity responses (Katz et al., 1974, Neta and Salvin, 1974). These studies
were not able to demonstrate antigen-specific suppression or the B cell subset(s) responsible for the
observed suppressive activity. Increased interest in suppressor B cells took place during the 1990s.
Wolf and colleagues showed that B cell-deficient mice failed to resolve experimental autoimmune
encephalomyelitis (EAE) (Wolf et al., 1996). Additionally, in a T cell-deficient murine model of colitis,
further loss of B cells lead to exacerbated disease severity on subsequent histological examination
(Mizoguchi et al., 1997). Adoptive transfer of B cells was able to show recovery of colitis in this model,
commensurate with the numbers of B cells transferred. IL-10 has been associated with B cells since
the early 1990s (O'Garra et al., 1990). At this time it was known that CD5-expressing B cells were the
dominant IL-10 producers (O'Garra et al., 1992, Ishida et al., 1992). Murine models have been used to
explore the relevance of IL-10-producing B cells in autoimmune disease. Loss of IL-10 restricted to B
cells is sufficient to exacerbate disease scores for EAE, collagen-induced arthritis and colitis (Fillatreau
et al., 2002, Mauri et al., 2003, Carter et al., 2011, Mizoguchi et al., 2002). In mice antigen-specific
suppression by IL-10 producing B cells has been demonstrated in the resolution of inflammatory
models (Yanaba et al., 2008, Yoshizaki et al., 2012). In a recent study, adoptive transfer of IL-10-
competent B cells (Bregs) from naïve or EAE mice into EAE mice showed in vivo suppression of IFNγ
or IL-17-producing T cells (Yoshizaki et al., 2012). Suppression was achieved using both B cell donors,
but was not nearly as great in mice receiving Bregs from naïve mice compared to antigen-experienced
Bregs. However, antigen-specific B cell mediated suppression has not been demonstrated in humans.
1.6.1. Phenotypes of human IL-10-producing B cells
IL-10-producing B cells have been most extensively studied for their regulatory potential in man and
mice. However there is no consensus, as yet, of cell surface markers to discriminate IL-10-competent
B cells from those incapable of IL-10 production. Stimulation to directly detect IL-10+ B cells by flow
41
cytometry has produced a number of well-characterised subsets, within which the IL-10-producing B
cells were enriched. This may in part be due to the variety of stimuli used to detect IL-10-competent
B cells, which in man and mouse include BCR and antigen stimuli, CD40 stimulation, TLR ligands and
helminthic infections (Iwata et al., 2011, Milovanovic et al., 2009, Blair et al., 2010, Bouaziz et al., 2010,
Iwata et al., 2012, Correale et al., 2008). Recent work in mice has suggested that IL-21 is able to induce
and sustain IL-10-producing B cells in mice in vitro and in vivo (Yang et al., 2013, Yoshizaki et al., 2012).
The most comprehensive of these studies showed IL-21 capable of maintaining and expanding IL-10-
producing B cells for 9 days in culture (Yoshizaki et al., 2012). This has been disputed by Holan et al,
who show that IL-21 or IL-10 inhibited murine B cell IL-10 production in vitro (Holan et al., 2013). Little
of this work has focused on human B cells. Studies by the Jahrsdörfer group have shown that IL-21
and BCR stimulation can induce a CD5+ CD25+ granzyme B+ (GZB) and IL-10-producing phenotype, able
to supress T cell activation and proliferation by GZB-dependent killing (Lindner et al., 2013, Hagn et
al., 2012, Hagn et al., 2009). This area is well worth further study, especially in human B cells to
determine the potential for IL-21 to influence Bregs, especially in light of evidence, relevant to AIT,
that both IL-21 and IL-10 enhance TLR-mediated IgG production in human B cells (Liu et al., 2013a). To
date, IL-10+ B cells have been reported to reside within CD1dhiCD5+, CD24hiCD27+, CD25+CD71+CD73-
and CD24hiCD38hi B cell subsets.
Despite the Breg subset being predominantly immature, CD27 expression has been previously
associated with regulatory B cells (Iwata et al., 2011), although it is clear that IL-10+ B cells are not
exclusively CD27+ and may express IgD and IgM (Bouaziz et al., 2010, Khoder et al., 2014). Although
TLR9 stimulation appears artificial, Gray et al., have shown apoptotic cells induce B cell IL-10 responses
(Gray et al., 2007), which in man and mouse were attributed to TLR-stimulating DNA exposed by the
apoptotic cells (Miles et al., 2012). TLR9-deficient mice showed exacerbated disease scores for EAE,
which were alleviated by supplementation with TLR9-competent B cells in vivo.
1.6.1.1. CD1dhiCD5+ B cells
TLR 4 and TLR 9 ligands, LPS and type B CpG-containing oligonucleotides, respectively, have been the
mainstay of B cell IL-10 induction in mice (Mauri and Ehrenstein, 2008). This has led to the well-
established CD1dhiCD5+ Breg subset in mice and man, within which the majority of IL-10-producing B
cells reside (Yanaba et al., 2008, Blair et al., 2010). CD5 has a long history of association with IL-10-
producing B cells in mice (Ishida et al., 1992, O'Garra et al., 1992). A direct relationship suggesting that
CD5 is sufficient for the induction of IL-10 has been shown in vitro in humans (Garaud et al., 2009,
Garaud et al., 2011, Gary-Gouy et al., 2002).

42
1.6.1.2. CD24hiCD27+ B cells
Two phenotypes of IL-10-producing B cells have been demonstrated following the use of TLR9 ligands
to identify IL-10-producing B cells. Of these the CD24hiCD27+ B cells were shown to be IL-10-dominant
following both 5 hours of TLR stimulation (described by the authors as B10 cells – approximately 0.8%
of peripheral blood B cells) and following 48 hours of stimulation (described as a combination of B10
and B10-pro B cells – approximately 4% following TLR9 stimulation) (Iwata et al., 2011). These cells
did not act directly on T cells, but on monocytes to suppress TNFα production.
1.6.1.3. CD25+CD71+CD73- B cells
van de Veen and colleagues have recently identified a new subset of IL-10 producing CD25+CD71+CD73-
B cells following mRNA microarray analysis of IL-10+ and IL-10- B cells following CpG stimulation,
followed by flow cytometry. This subset of Breg was reported as expressing higher levels of PD-L1
amongst IL-10-expressing B cells (van de Veen et al., 2013). CD25+CD71+CD73- B cells were competent
at suppressing PPD-driven CD4+ T cell proliferation within peripheral blood mononuclear cell (PBMC)
cultures in an IL-10-dependent manner.
1.6.1.4. CD24hiCD38hi B cells
In addition to TLR9-derived IL-10 phenotypes, Mauri and colleagues have shown that T2 transitional B
cells are the dominant IL-10 secretors in comparison with other B cell subsets in mice (Evans et al.,
2007). These CD21hiCD23hi T2 B cells in mice are represented by the human phenotype CD24hiCD38hi
(Blair et al., 2010) and were shown to be the dominant IL-10 producers following CD40 stimulation in
humans. Additionally, CD1dhiCD5+ B cells were shown to fall within this transitional B cell population.
CD24hiCD38hi B cells are capable of controlling T cell Th1 cytokine responses in vitro, mediated partly
by IL-10 but also CD80 and CD86 co-receptor interactions (Blair et al., 2010).
1.6.1.5. IL-10-producing plasma cells
Evidence in mice has shown IL-10-producing B cells become class-switched plasma cells (Maseda et
al., 2012, Neves et al., 2010), particularly switching towards IgM- and IgG-secreting plasma cells.
Recent human evidence supports this murine data, showing human IL-10-producing B cells become
IgM- and IgG-secreting B cells, with a sustained capacity to produce IL-10 amongst CD138+ B cells
(Heine et al., 2014, Shen et al., 2014, van de Veen et al., 2013). This recent concept has shown that
the life cycle of the Breg has not been fully explored, that these cells populate the plasma cell pool
and may continue to produce IL-10, which is of clear interest to the induction of allergen tolerance by
AIT.
43
1.6.1.6. Beyond IL-10 amongst regulatory B cells
Although IL-10-producing B cells have been the most extensively studied, other phenotypes of
regulatory B cells have been demonstrated in mice and man. Data published in the last year has shown
an IL-35-producing B cell subset in mice (Wang et al., 2014). This study showed that IL-35+ and IL-10+
B cell populations coincide within the CD5+ pool when B cells are treated with IL-35. IL-35 drove B cells
towards an IL-10-producing phenotype in mice and humans, and in mice these cells were able to
control autoimmune uveitis and inflammatory T cell responses. An earlier study showed that IL-35-
or IL-10-producing B cells could be detected amongst murine plasma cells, which increased following
salmonella infection, and, in conflict with the previously cited study, IL-35 or IL-10 was not co-
expressed in these cells (Shen et al., 2014). Loss of IL-35 amongst B cells showed exacerbated EAE
disease severity, which does not resolve, unlike in IL-35 wild type mice, along with exacerbated T cell
inflammatory responses. There is limited evidence of TGFβ-producing B cells in mice and man (Lee et
al., 2011, Lee et al., 2014), which may be due to the challenge of detecting this cytokine. If these cells
exist, they may act much like TGFβ-producing T cells in promoting Tregs.
As well as secretory mechanisms of suppression, there is growing evidence that regulatory B cells may
act by cell-cell contact, such as through PD-L1 (Bodhankar et al., 2013, van de Veen et al., 2013), which
may explain the lack of maximal reversal of suppression observed with blockade of IL-10 or IL-10
receptor (van de Veen et al., 2013). Additionally, cytotoxic B cells have been proposed as potential
regulators of inflammation (Klinker and Lundy, 2012), with evidence of CD5+ B cells also capable of
expressing FASL (CD95L) (Lundy, 2002, Lundy and Fox, 2009). Granzyme B-expressing B cells, with
cytotoxic capacity, have also been shown to be present within the CD5+ population (Hagn et al., 2010,
Hagn et al., 2009, Hagn et al., 2012), with granzyme B expression induced by IL-21 (Hagn et al., 2009,
Lindner et al., 2013).
An emerging marker of IL-10-expressing B cells in mice is TIM-1 (T cell immunoglobulin and mucin
domain 1) (Ding et al., 2011, Lee et al., 2012, Xiao et al., 2012). In murine models, TIM-1-deficient mice
had reduced proportions of IL-10-producing B cells, a discrepancy which was exaggerated by age and
accompanied by generalised autoimmunity (Xiao et al., 2012). Although mouse data for allergic airway
disease paints a similar picture (Curtiss et al., 2012), with systemic loss of TIM-1 resulting in
exacerbated Th2 responses, a recent study of TIM-1 in human allergen immunotherapy has shown a
negative relationship with TIM-1 and allergen tolerance (Lin et al., 2013). Sublingual immunotherapy
in children for house dust mite allergy was clinically effective, whereas an inverse correlation was
observed between TIM-1 expression and IL-10 mRNA expression by PBMCs sampled before and at 6
44
months during immunotherapy. IL-5 mRNA positively correlated with TIM-1 mRNA expression. This
study did not however explore the cell-source of TIM-1 expression, beyond PBMC isolation.
1.6.2. Regulatory B cells in autoimmune disease
The role of regulatory B cells has been much explored in human autoimmune disease; given that a loss
of self-tolerance is required for the onset of autoimmune disease, Bregs are a likely target. Most of
these studies show decreased proportions or a functional loss of capacity in the Breg compartment
relative to healthy controls. This is true for systemic lupus erythematosus (SLE) (Blair et al., 2010,
Lemoine et al., 2011), Graves’ disease (Zha et al., 2012), multiple sclerosis (MS) (Knippenberg et al.,
2011, Correale et al., 2008) and rheumatoid arthritis (RA) (Ma et al., 2013, Flores-Borja et al., 2013).
However, Iwata and colleagues examined IL-10+ B cells in moderately sized cohorts of RA, SLE, primary
Sjögren’s syndrome (SS), autoimmune vesiculobullous skin disease and MS patients, demonstrating a
large spread in B cell IL-10 capacity, but a tendency towards increased proportions of IL-10+ B cells in
disease compared with controls (Iwata et al., 2011). This was in agreement with Lemoine et al., who
also showed no changes in functionally suppressive B cells in RA or SS, but a dramatic loss of T cell
suppression by CpG and anti-CD40-primed B cells amongst SLE donors compared with healthy controls
(Lemoine et al., 2011). Very little work has shown the direct result of antigen stimulation on IL-10-
producing B cells. One such study compared B cell IL-10 responses to the self-antigen, thyroglobulin
and against tetanus toxoid (TT) in healthy control subjects (Langkjaer et al., 2012). Thyroglobulin
produced higher IL-10 and IL-6 responses in B cells compared with TT stimulation, suggesting these B
cells capable of autoregulation.
1.6.3. Regulatory B cells in infectious disease
Regulatory B cells in autoimmunity are a clear cell of interest, due to the loss of tolerance. Whilst no
loss of self-tolerance has taken place in infectious disease, chronic disease persists due to an ability to
evade or suppress immune responses; the latter may involve regulatory B cells. Evidence has been
emerging of this in humans, especially with respect to viral infection. Total IL-10-producing B cells,
detected by CpG stimulation, were increased in chronic Hepatitis B (HBV)-infected individuals
compared to controls (Das et al., 2012). Whilst these patients also had IL-10 responsiveness to HBV
stimulation, both total and HBV-induced IL-10+ B cells correlated with viral flares. Additionally, a series
of papers from different groups have recently shown similar evidence amongst HIV-1-infected
individuals (Jiao et al., 2014, Liu et al., 2014b, Siewe et al., 2013). Increased proportions of IL-10+ B
cells were detected amongst HIV-1+ donors compared to controls, which related to viral load in all
studies, the latter two studies also showed depletion of IL-10+ B cells restored CD8 responses towards
the virus. Liu et al., were further able to show that the greatest proportions of Bregs were within
45
untreated or early disease donors, compared to those on treatment or described as ‘long-term non-
progressors’, with IL-10+ B cells predominantly CD10-CD27+, suggesting a memory phenotype which
also expressed TIM-1.
1.6.4. Helminth infection, allergy and regulatory B cells
It has been proposed that Tregs are induced during helminth infection, deviating a Th2 response
towards a Treg response (Nausch et al., 2011, van der Vlugt et al., 2012). Additionally IL-10+ B cells
have recently been shown to be associated with helminth burden in mice and man (Correale et al.,
2008, van der Vlugt et al., 2012, Hussaarts et al., 2011). B cells derived from patients with MS were
unable to suppress myelin-driven responses of a peptide-specific T cell line in co-cultures, which was
fully suppressed by B cells derived from healthy controls (Correale et al., 2008). The capacity to
suppress myelin-specific T cell responses was recovered in B cells derived from helminth-infected MS
patients.
Helminth infection has been proposed to have therapeutic potential in allergic disease (Pritchard et
al., 2012). In mouse models helminth infection has been used to demonstrate suppression of allergic
airway inflammation. Two studies have independently shown that OVA-allergic models of disease can
be suppressed and resolved by adoptive transfer of CD1dhi IL-10-producing regulatory B cells (Amu et
al., 2010, van der Vlugt et al., 2012). Amu and colleagues were able to further demonstrate that
established allergic airway inflammation was reversed by adoptive transfer of IL-10-producing CD1dhi
B cells induced by Schistosome infection (Amu et al., 2010), which resolved OVA-allergic airway
inflammation by the IL-10-mediated induction of regulatory T cells.
1.7. Regulatory B cells in allergic disease
Dissection of the Breg contribution to allergic inflammation has been lacking. In a recent publication,
van der Vlugt and colleagues examined the characterised IL-10-producing regulatory B cell phenotypes
in response to LPS and CpG (van der Vlugt et al., 2013). LPS-stimulated (but not CpG-stimulated) B
cells demonstrated reduced IL-10-responses amongst allergic asthmatics compared to controls. The
reduced B cell IL-10 capacity was restricted to the CD24hiCD27+ subset, not CD24hiCD38 or CD1dhi B
cells. The authors also demonstrate a quantitative decrease in CD24hiCD27+ B cells amongst allergic
asthmatics. Allergen-specific triggers have rarely been used to illicit B cell IL-10 responses. A series of
studies in cow milk allergic children has suggested that B cells expressing either IL-10 or TGFβ, which
compared allergic patients against sensitised, but non-allergic, subjects (Lee et al., 2011, Noh et al.,
46
2010). The studies of milk-allergic versus milk-sensitised children used the cow milk allergen, casein,
to stimulate PBMCs in vitro (Noh et al., 2010). Aeroallergens from dog, grass and house dust mite have
also been examined for B cell IL-10-inducing capacity (Milovanovic et al., 2009). The authors found
astounding proportions of B cells producing IL-10 in response to both allergen (7.5%) and CpG (42.9%),
these proportions of IL-10-specific B cells have not been repeated elsewhere under either stimulatory
condition (2-5% producing IL-10 is typically reported of CpG-stimulated B cells (Iwata et al., 2011,
Bouaziz et al., 2010)), but presents the enticing prospect of allergen-induced B cell IL-10.
1.7.1. Regulatory B cells and AIT
CpG is commonly used to drive IL-10 responses of B cells in vitro and in vivo (Miles et al., 2012, de Brito
et al., 2010), which has led to the suggestion that CpG may be of use clinically as an adjuvant to drive
both Th1 and B10 responses (Fonseca and Kline, 2009, Vollmer and Krieg, 2009). Tempting data in
mice has further shown that subcutaneous administration of CpG in OVA-allergic mice is capable of
suppressing and reversing allergic airway inflammation (Fonseca et al., 2011, Ashino et al., 2008). In
humans, a series of ragweed immunotherapy clinical trials explored the role of CpG adjuvants. In two
independent trials, the major allergen, Amb a1, conjugated to CpG showed clinical improvement in
SAR and a parallel local induction of Th1 responses within the nasal mucosa (Creticos et al., 2006, Tulic
et al., 2004). Another study used weekly nebulised CpG as an immunotherapeutic intervention in
asthma and failed to show clinical suppression of allergen-specific asthmatic or Th2 responses
(Gauvreau et al., 2006). However this approach was successful in restoring clinical measures of allergic
airway disease in horses, to the level observed in healthy animals (Klier et al., 2012), suggesting further
work may be needed to optimise delivery or clinical results in humans. The latter study was the only
to examine IL-10, showing significantly increased production from bronchoalveolar lavage-derived
cells after just 3 inhalations, compared to baseline.
It is clear that prospective studies of immunological changes during allergen-immunotherapy and
following withdrawal is worthy of further study to determine the time course of induction for IL-10
and/or FoxP3-expressing regulatory T cells, IL-10-producing regulatory B cells and allergen-specific
IgG4. No study has specifically examined the induction or duration of B cell derived IL-10 following the
course of AIT.
Based on the available data, allergen-specific IL-10-producing T cells appear prior to the induction of
allergen-specific IgG4 and/or IL-10-producing B cells (Francis et al., 2008, Möbs et al., 2012, van de
Veen et al., 2013, Akdis et al., 1998). It is unclear whether regulatory T cells induce regulatory B cells,
or if the reverse is true. Indeed IL-10-producing B cells correlate with CD39+ Tregs (Wilde et al., 2013)
47
and further studies have suggested Bregs are able to induce both FoxP3- and CLTA-4- (cytotoxic T
lymphocyte associated antigen-4) expressing Tregs in humans and mice (Kessel et al., 2012, Ray et al.,
2012, Olkhanud et al., 2011, Lemoine et al., 2011, Carter et al., 2011). There is little evidence thus far
of regulatory B cells induced following interaction with regulatory T cells.
48
2. Methods
2.1. Ethical statement
Samples obtained for this thesis followed good clinical practice and received ethical approval and local
approval from the Royal Brompton and Harefield Hospital NHS trust. Informed and written consent
was taken from volunteers prior to phlebotomy or biopsy.
2.2. Blood donor selection
Volunteers were self-selected in response to advertisements for grass pollen allergic, non-allergic or
allergen-specific immunotherapy (AIT)-treated blood donors. AIT-treated patients were obtained
routine NHS outpatient clinical visits at the Royal Brompton Hospital. All volunteers were
characterised as to their allergic status. Skin prick tests (SPT) were performed on the volar aspect of
the forearm using an extract of timothy grass (Phleum pratense, Phl p) pollen (Aquagen SQ, ALK,
Abelló, Denmark). Histamine (10 mg/mL histamine dihydrochloride, ALK) was used as positive control
and saline diluent as negative control. A sterile lancet was used to pierce the skin where allergen drops
had been applied. After 20 minutes, the presence of erythema and wheal size was recorded by
encircling the wheal using a fine, fibre-tipped pen and transferring to a record sheet with adhesive
tape. A wheal with diameter >3mm was taken as positive. Positive SPT, timothy grass-specific IgE
(>0.35 KU/L) and a clinical history of grass pollen allergies lead to patients being classified as allergic.
Non-atopic patients underwent the same classification and had a negative SPT to grass and other
common aeroallergens, allergen-specific IgE and clinical history. Patients who received AIT were
screened within the NHS and met a clinician-diagnosed need for either sublingual (SLIT) or
subcutaneous (SCIT) immunotherapy.
2.3. Cell isolation and culture
2.3.1. Phlebotomy and PBMC isolation
Venous blood was collected in sodium-heparinised vacutainer tubes (BD Biosciences, Oxford, UK) and
peripheral blood mononuclear cell (PBMC) isolation was begun within 2 hours of phlebotomy. Tubes
were centrifuged at 1500rpm and plasma layer removed. Blood was diluted in equal volumes of RPMI
1650 medium (Gibco, Life Technologies, Paisley, UK). Diluted blood was layered over ficoll (GE
Healthcare, Buckinghamshire, UK) and centrifuged at 2200 rpm for 25 minutes without braking.
49
Following centrifugation the buffy coat layer was extracted and washed 3 times in RPMI 1650. PBMC
viability was assessed by Trypan blue exclusion, with viable cells counted by haemocytometer.
2.3.2. Cell subset isolation
CD19+ B cells or CD4+ T cells were isolated by negative selection using EasySep magnetic enrichment
(Stem Cell Technologies, Manchester, UK) following manufacturer’s instructions. Purity of CD19+ or
CD4+ cells following isolation was established by single colour flow cytometry. Although purity of 95%
was considered acceptable for experiments with single cells, >98% purity was routinely detected by
this protocol, which was superior to purity observed by magnetic separation using MACS columns
(Miltenyi Biotec, Oxford, UK).
2.3.3. Cell culture
B or T cells were reconstituted to 5x10⁶ cells/mL in tissue culture medium (TCM). TCM contained 10%
FCS in RPMI 1650 containing L-glutamine and HEPES (Gibco). Routinely, 5x10⁵ cells/well were cultured
in 200 μL of TCM, incubated at 37 °C in 5% CO2 atmosphere in flat-based 96 well plates (Nunc, Thermo
Scientific, UK), unless otherwise stated. Cell culture reagents were added at the following
concentrations unless shown otherwise, CpG ODN 2006, a type B CpG, 1 µg/mL (5’ –tcg ttt cgt ttt gtc
gtt – 3’) (InvivoGen, Toulouse, France), LPS, 1 µg/mL (Sigma-Aldrich, Poole, UK), recombinant CD40L,
0.01 µg/mL (R&D systems, Abingdon, UK) and anti-human CD40 antibody, 1 µg/mL (clone 5C3, BD
Biosciences).
2.4. CFSE
T cells were labelled with intracellular CFSE (carboxyfluorescein succinimidyl ester) in order to
determine the proportion of cells proliferating. CellTrace CFSE (Invitrogen, Life Technologies, UK) was
reconstituted to 5 mM with DMSO as per manufacturer instructions. A known number of cells to be
labelled were pelleted by centrifugation and resuspended in 37 °C pre-warmed PBS with CFSE at 10
µM to a total cell concentration of 10x106 cells/mL. Cells were incubated for 10 minutes in the dark at
37 °C and 5% CO2 whilst CFSE was internalised. Following the 10 minute culture, the reaction was
quenched with an equal volume of cold (4 °C) FCS initially and additional cold TCM to bring it to a final
volume 10x that of the PBS/CFSE incubated with the cells. Cells were incubated at 4 °C for 10 minutes
before centrifugation and resuspending in warm TCM for addition to cell culture plates. CFSE-labelled
cells were always analysed on the flow cytometer immediately after staining to ensure internalisation
of the dye.
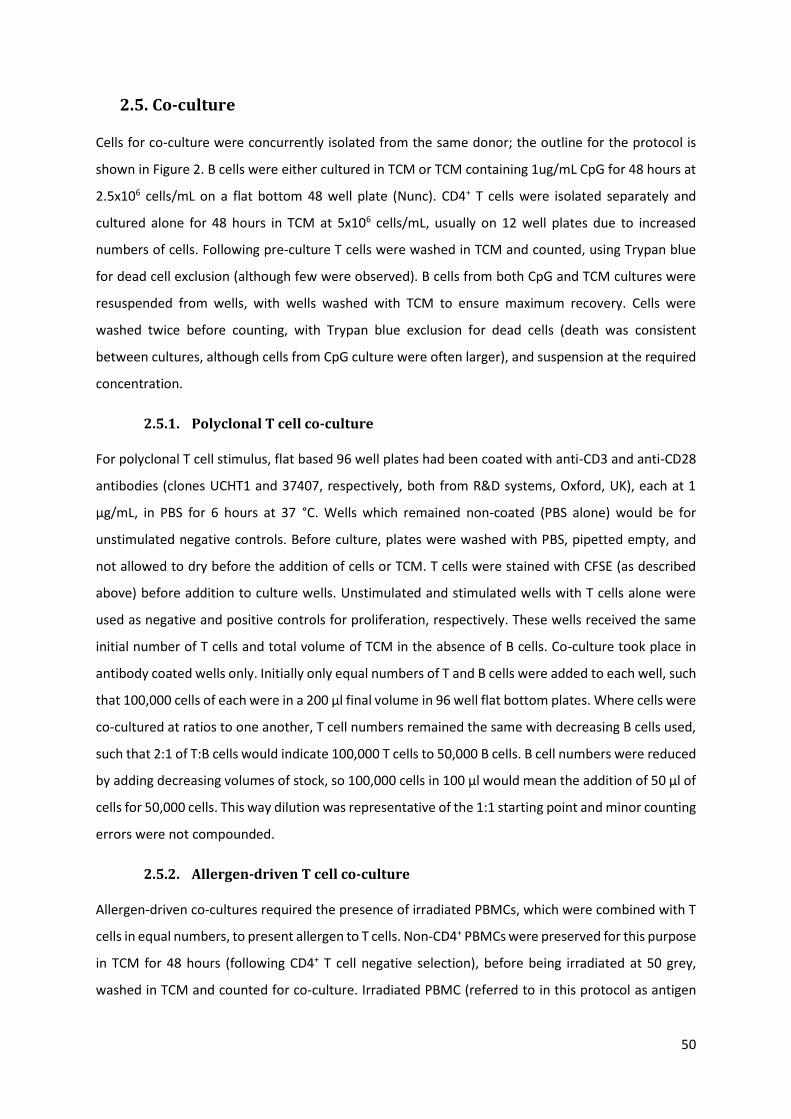
50
2.5. Co-culture
Cells for co-culture were concurrently isolated from the same donor; the outline for the protocol is
shown in Figure 2. B cells were either cultured in TCM or TCM containing 1ug/mL CpG for 48 hours at
2.5x10⁶ cells/mL on a flat bottom 48 well plate (Nunc). CD4+ T cells were isolated separately and
cultured alone for 48 hours in TCM at 5x10⁶ cells/mL, usually on 12 well plates due to increased
numbers of cells. Following pre-culture T cells were washed in TCM and counted, using Trypan blue
for dead cell exclusion (although few were observed). B cells from both CpG and TCM cultures were
resuspended from wells, with wells washed with TCM to ensure maximum recovery. Cells were
washed twice before counting, with Trypan blue exclusion for dead cells (death was consistent
between cultures, although cells from CpG culture were often larger), and suspension at the required
concentration.
2.5.1. Polyclonal T cell co-culture
For polyclonal T cell stimulus, flat based 96 well plates had been coated with anti-CD3 and anti-CD28
antibodies (clones UCHT1 and 37407, respectively, both from R&D systems, Oxford, UK), each at 1
µg/mL, in PBS for 6 hours at 37 °C. Wells which remained non-coated (PBS alone) would be for
unstimulated negative controls. Before culture, plates were washed with PBS, pipetted empty, and
not allowed to dry before the addition of cells or TCM. T cells were stained with CFSE (as described
above) before addition to culture wells. Unstimulated and stimulated wells with T cells alone were
used as negative and positive controls for proliferation, respectively. These wells received the same
initial number of T cells and total volume of TCM in the absence of B cells. Co-culture took place in
antibody coated wells only. Initially only equal numbers of T and B cells were added to each well, such
that 100,000 cells of each were in a 200 µl final volume in 96 well flat bottom plates. Where cells were
co-cultured at ratios to one another, T cell numbers remained the same with decreasing B cells used,
such that 2:1 of T:B cells would indicate 100,000 T cells to 50,000 B cells. B cell numbers were reduced
by adding decreasing volumes of stock, so 100,000 cells in 100 µl would mean the addition of 50 µl of
cells for 50,000 cells. This way dilution was representative of the 1:1 starting point and minor counting
errors were not compounded.
2.5.2. Allergen-driven T cell co-culture
Allergen-driven co-cultures required the presence of irradiated PBMCs, which were combined with T
cells in equal numbers, to present allergen to T cells. Non-CD4+ PBMCs were preserved for this purpose
in TCM for 48 hours (following CD4+ T cell negative selection), before being irradiated at 50 grey,
washed in TCM and counted for co-culture. Irradiated PBMC (referred to in this protocol as antigen
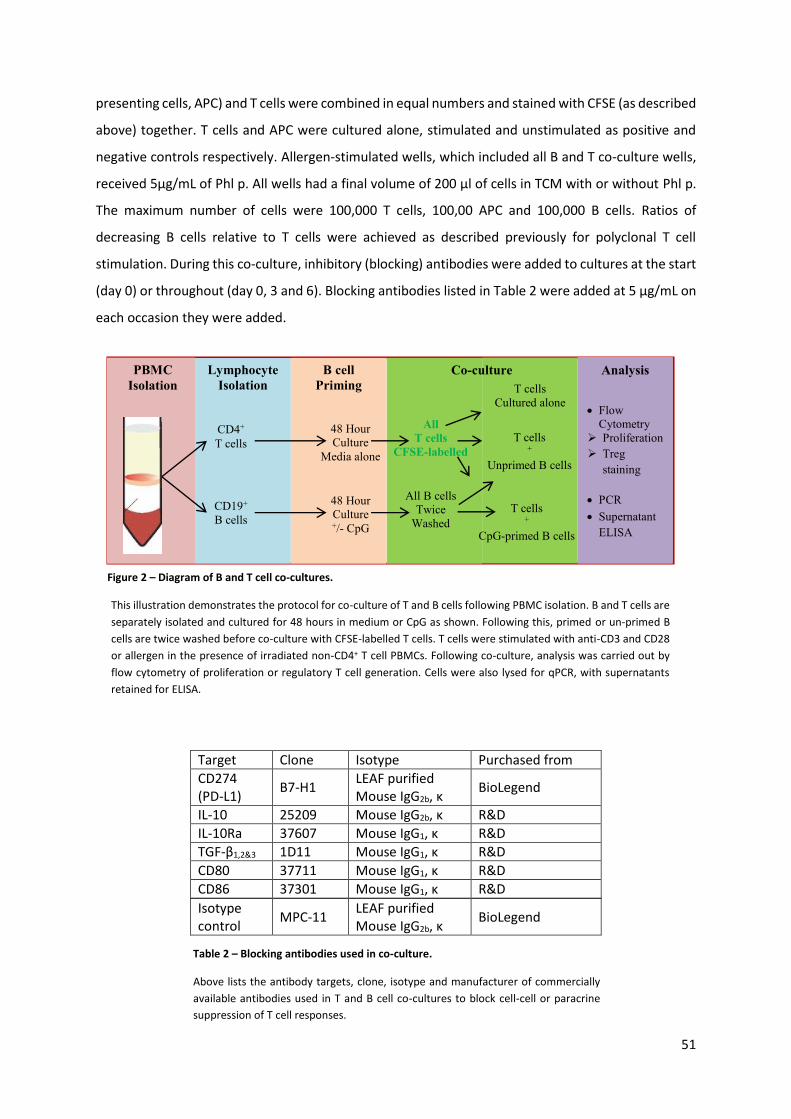
51
presenting cells, APC) and T cells were combined in equal numbers and stained with CFSE (as described
above) together. T cells and APC were cultured alone, stimulated and unstimulated as positive and
negative controls respectively. Allergen-stimulated wells, which included all B and T co-culture wells,
received 5µg/mL of Phl p. All wells had a final volume of 200 µl of cells in TCM with or without Phl p.
The maximum number of cells were 100,000 T cells, 100,00 APC and 100,000 B cells. Ratios of
decreasing B cells relative to T cells were achieved as described previously for polyclonal T cell
stimulation. During this co-culture, inhibitory (blocking) antibodies were added to cultures at the start
(day 0) or throughout (day 0, 3 and 6). Blocking antibodies listed in Table 2 were added at 5 µg/mL on
each occasion they were added.
Target Clone Isotype Purchased from
CD274 (PD-L1)
B7-H1 LEAF purified Mouse IgG2b, κ
BioLegend
IL-10 25209 Mouse IgG2b, κ R&D
IL-10Ra 37607 Mouse IgG1, κ R&D
TGF-β1,2&3 1D11 Mouse IgG1, κ R&D
CD80 37711 Mouse IgG1, κ R&D
CD86 37301 Mouse IgG1, κ R&D
Isotype control
MPC-11 LEAF purified Mouse IgG2b, κ
BioLegend
Table 2 – Blocking antibodies used in co-culture.
Above lists the antibody targets, clone, isotype and manufacturer of commercially
available antibodies used in T and B cell co-cultures to block cell-cell or paracrine
suppression of T cell responses.
Lymphocyte Isolation
CD4+
T cells
CD19+ B cells
B cell
Priming
48 Hour
Culture +/- CpG
48 Hour
Culture Media alone
Co-culture
Analysis
All B cells
Twice
Washed
All
T cells
CFSE-labelled
T cells
Cultured alone
T cells +
Unprimed B cells
T cells +
CpG-primed B cells
Flow
Cytometry
Proliferation
Treg
staining
PCR
Supernatant
ELISA
ELISA
PBMC Isolation
Figure 2 – Diagram of B and T cell co-cultures.
This illustration demonstrates the protocol for co-culture of T and B cells following PBMC isolation. B and T cells are
separately isolated and cultured for 48 hours in medium or CpG as shown. Following this, primed or un-primed B
cells are twice washed before co-culture with CFSE-labelled T cells. T cells were stimulated with anti-CD3 and CD28
or allergen in the presence of irradiated non-CD4+ T cell PBMCs. Following co-culture, analysis was carried out by
flow cytometry of proliferation or regulatory T cell generation. Cells were also lysed for qPCR, with supernatants
retained for ELISA.

52
2.6. Flow Cytometry
2.6.1. Staining Panels
Cells were stained with fluorochrome-coupled monoclonal antibodies (Table 3), at half the volume
described by the manufacturer, which produced a clear signal in combination staining. Staining of 8
(or fewer) fluorochrome-conjugated antibodies were carried out using the following panel design:
1) FITC or Alexa Flour 488
2) PE
3) PerCP or PerCP-Cy5.5 or PerCP-eFlour 710
4) PE-Cy7
5) APC or Alex Flour 647
6) APC-Cy7 or APC-H7
7) Pacific Blue or BD Horizion V450
8) AmCyan or BD Horizion V500.
2.6.2. Compensation
Panels were compensated in advance of use in the main experiment. Initially, antibodies coupled to
the same fluorochromes in the panels, but directed at common PBMC surface antigens (e.g. CD3, CD4)
were used. Single stained and unstained tubes were analysed on the flow cytometer, with automatic
software compensation (BD FACS Diva, BD Biosciences). The degree of compensation was
subsequently adjusted by eye once both compensation and experimental panels had been acquired,
if required. Preference for compensation was given to the experimental panel. However, it was
common that less compensation was required with this protocol, as stronger signals could be
produced from the antibodies used to compensate.
Later experiments used compensation beads (BioLegend), with which the experimental antibodies
could be incubated in individual tubes. Following incubation the beads were washed and acquired as
previously stated, with automated software compensation. The full panel was also run with the
experimental antibodies (including permiablisation where relevant) on PBMCs to check
compensation. If required, compensation was manually adjusted.
Compensation was unchanged within complete experiments.

53
2.6.3. Experimental surface staining
Cells were stained on U bottom 96 well plates or occasionally in 5 mL flow cytometry tubes. Cells for
staining were washed in cell staining buffer (PBS, 1% BSA and 0.05% Sodium Azide), centrifuging at
200 g for 5 minutes between washing and vortexing to resuspended. Cells at 10x106 cells/mL in
staining buffer were incubated with 10 µL Fc receptor block (Miltenyi Biotec) for 10 minutes at room
temperature. Pre-prepared (no more than 24 hours in advance) antibody aliquots, towards cell surface
antigens, were added and fully distributed by pipetting, before incubation for 30 minutes at room
temperature in the dark. Cells were hidden from light throughout the protocol from this point on.
Following incubation cells were washed in staining buffer. If intracellular or intranuclear staining was
carried out the protocol below was carried out. If surface staining alone was carried out cells were
fixed in 1x cell fix solution (BD Biosciences) before running on FACS Canto II (BD Biosciences).
2.6.4. Experimental intracellular staining
To detect intracellular cytokines by flow cytometry, cells were re-stimulated for the final 5 hours of
incubation with 20ng/mL phorbol 12-myristate 13-acetate (PMA) (Sigma-Aldrich), 1 µg/mL Ionomycin
(Sigma-Aldrich) and 1 µL Golgi Plug (BD Biosciences) per well containing 5x10⁵ cells. This re-stimulation
protocol was only relevant for detection of intracellular cytokines and was not used for intranuclear
staining (FoxP3). Cell surface staining was carried out as detailed above, following which cells were
resuspended in 1x ForxP3 perm/fix buffer (Biolegend, Cambridge, UK) and incubated for 20 minutes
at room temperature. Cells were centrifuged again, washed in cell staining buffer. Cells were then
washed and re-suspended in 1x perm/wash buffer (Biolegend) and incubated for 15 minutes at room
temperature in the dark. Cells were centrifuged and resuspended in residual perm/wash buffer before
the addition of antibodies towards intracellular and/or nuclear antigens. Cells and antibodies were
incubated for 30 minutes at room temperature. Finally cells were washed and resuspended in cell
staining buffer before running on FACS Canto II (BD Biosciences).
Analysis of flow cytometry data was carried out on FACS Diva (BD Biosciences) or FlowJo software
(Tree Star, California, USA).
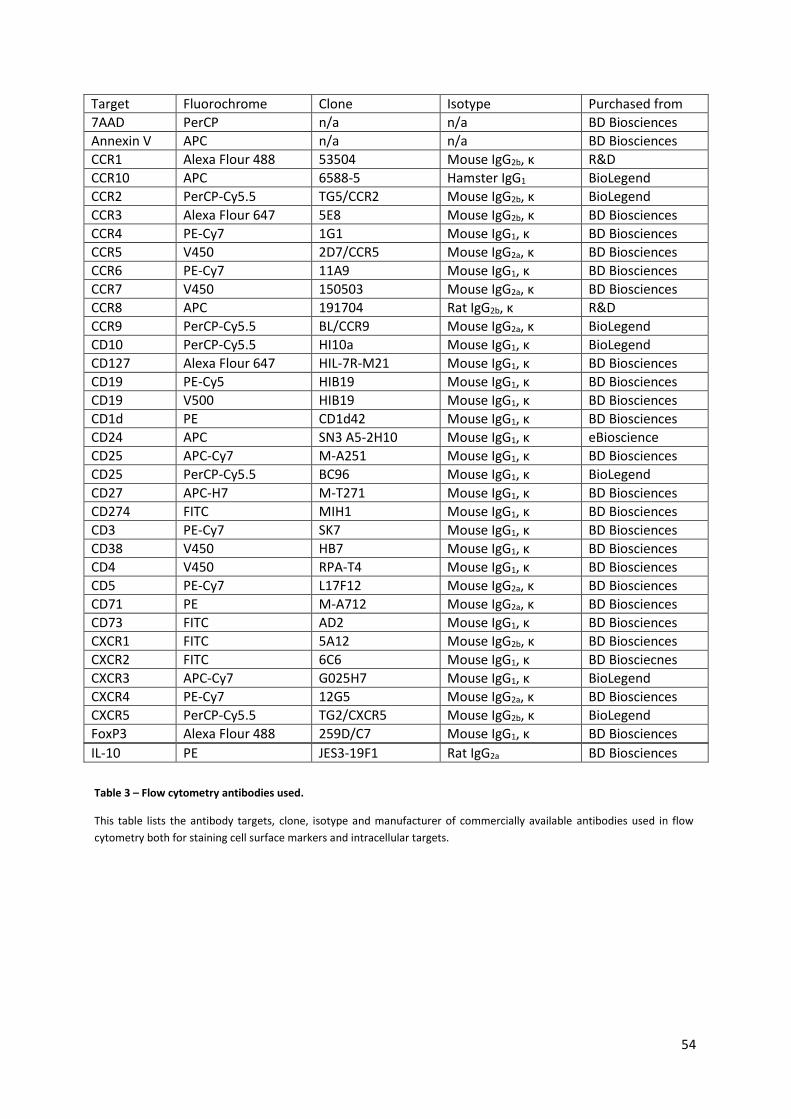
54
Target Fluorochrome Clone Isotype Purchased from
7AAD PerCP n/a n/a BD Biosciences
Annexin V APC n/a n/a BD Biosciences
CCR1 Alexa Flour 488 53504 Mouse IgG2b, κ R&D
CCR10 APC 6588-5 Hamster IgG1 BioLegend
CCR2 PerCP-Cy5.5 TG5/CCR2 Mouse IgG2b, κ BioLegend
CCR3 Alexa Flour 647 5E8 Mouse IgG2b, κ BD Biosciences
CCR4 PE-Cy7 1G1 Mouse IgG1, κ BD Biosciences
CCR5 V450 2D7/CCR5 Mouse IgG2a, κ BD Biosciences
CCR6 PE-Cy7 11A9 Mouse IgG1, κ BD Biosciences
CCR7 V450 150503 Mouse IgG2a, κ BD Biosciences
CCR8 APC 191704 Rat IgG2b, κ R&D
CCR9 PerCP-Cy5.5 BL/CCR9 Mouse IgG2a, κ BioLegend
CD10 PerCP-Cy5.5 HI10a Mouse IgG1, κ BioLegend
CD127 Alexa Flour 647 HIL-7R-M21 Mouse IgG1, κ BD Biosciences
CD19 PE-Cy5 HIB19 Mouse IgG1, κ BD Biosciences
CD19 V500 HIB19 Mouse IgG1, κ BD Biosciences
CD1d PE CD1d42 Mouse IgG1, κ BD Biosciences
CD24 APC SN3 A5-2H10 Mouse IgG1, κ eBioscience
CD25 APC-Cy7 M-A251 Mouse IgG1, κ BD Biosciences
CD25 PerCP-Cy5.5 BC96 Mouse IgG1, κ BioLegend
CD27 APC-H7 M-T271 Mouse IgG1, κ BD Biosciences
CD274 FITC MIH1 Mouse IgG1, κ BD Biosciences
CD3 PE-Cy7 SK7 Mouse IgG1, κ BD Biosciences
CD38 V450 HB7 Mouse IgG1, κ BD Biosciences
CD4 V450 RPA-T4 Mouse IgG1, κ BD Biosciences
CD5 PE-Cy7 L17F12 Mouse IgG2a, κ BD Biosciences
CD71 PE M-A712 Mouse IgG2a, κ BD Biosciences
CD73 FITC AD2 Mouse IgG1, κ BD Biosciences
CXCR1 FITC 5A12 Mouse IgG2b, κ BD Biosciences
CXCR2 FITC 6C6 Mouse IgG1, κ BD Biosciecnes
CXCR3 APC-Cy7 G025H7 Mouse IgG1, κ BioLegend
CXCR4 PE-Cy7 12G5 Mouse IgG2a, κ BD Biosciences
CXCR5 PerCP-Cy5.5 TG2/CXCR5 Mouse IgG2b, κ BioLegend
FoxP3 Alexa Flour 488 259D/C7 Mouse IgG1, κ BD Biosciences
IL-10 PE JES3-19F1 Rat IgG2a BD Biosciences
Table 3 – Flow cytometry antibodies used.
This table lists the antibody targets, clone, isotype and manufacturer of commercially available antibodies used in flow
cytometry both for staining cell surface markers and intracellular targets.

55
2.6.5. Flow cytometry of whole blood
Blood was collected as previously described and staining for flow cytometry began within 2 hours of
collection. Antibody staining panels were designed as previously described, using antibodies in Table
3, with manufacturer described volumes used for each. Isotype matched control antibodies were used
in the same concentrations as test antibodies. On collection, at least 200 µL of whole blood was
reserved per tube (test or isotype), 20 µL Fc receptor block (Miltenyi Biotec) added per 200 µL of blood
and incubated for 10 minutes at room temperature. Following incubation, 220 µL of this sample (so
200 µL of whole blood in total) was added to antibodies already prepared in 5mL flow cytometry tubes
(BD Biosciences) combined into staining panels (test or isotype controls). Blood and antibodies were
incubated for 30 minutes at room temperature in the dark before a further 10 minute incubation with
2mL of red blood cell lysis buffer (10x contains 90g NH4Cl, 10g KHCO3 and 370mg EDTA in 1L of dH20
filtered through a 0.22 µm filter), and vortexed. Following lysis, tubes were centrifuged for 5 minutes
at 200g at room temperature and washed twice (with vortexing) with 2mL cell staining buffer. Finally
cells are re-suspended in 350 µL of cell fix (BD Biosciences). Immediately before acquisition 50 µL
(therefore a known number, described on each sample) of counting beads (CountBright absolute
count beads, Molecular Probes, Life Technologies, Paisley, UK) at room temperature are vortexed and
added. Counted beads allowed for back calculation of cell numbers per µL of blood stained, as
described by manufacturer. FSC and SSC voltages had been previously set to include both cell counting
beads and whole blood cell subsets. Cells and beads were acquired on FACS Canto II (BD Biosciences).
Analysis was carried out on FACS Diva (BD Biosciences) or FlowJo (Tree Star, California, USA) software.
2.6.6. Live/Dead staining
Following culture, cells were stained for stage of cell death. The dyes 7AAD and Annexin V (as
described in Table 3), which bind exposed intranuclear DNA or phosphatidylserine on the inverted cell
membrane, were used in combination to identify cells in the latter stages of death with permeable
cell membranes, and cells with inverted cell membranes in the early stages of apoptosis, respectively.
Live cells are double negative, pre-apoptotic cells stain for Annexin V only whilst apoptotic cells stain
double positive for both 7AAD and Annexin V. All cells were kept on ice and washed twice in staining
buffer before re-suspending cells in 100 µL 1x Annexin V binding buffer (BD Biosciences). 5 µL of 7AAD
and Annexin V were each added to 90 µL of binding buffer per well required and vortexed before
adding 100 µL to each well to be stained, pipetted to re-suspend cells and incubated for 15 minutes
on ice. Cells were acquired on the flow cytometer within 60 minutes of 7AAD and Annexin V addition.

56
2.7. Enzyme-Linked ImmunoSorbant Assay (ELISA)
2.7.1. IL-10 Sandwich ELISA
IL-10 ELISAs (R&D Systems) were carried out following manufacturer’s instructions, in 96 well
maxisorb plates (Nunc, Fisher Scientific, Loughborough, UK). The concentration standard was diluted
in serial dilutions from 2000-15.625 pg/mL and cell culture supernatants were diluted 1:2 with the
recommended diluent buffer (PBS with 1% BSA – Merk Millipore, Watford, UK), 100 µL was added to
duplicate wells. Plates were washed between steps, as recommended, 3x with 400 µL PBS with 0.05%
Tween 20 (Sigma-Aldrich). The plate was developed with 100 µL per well of Tetramethylbenzidine
(TMB)-containing buffer (20mL Phosphocitrate buffer (2.84 g Na2HPO4, 1.92 g anhydrous citric acid in
200 mL distilled water - pH 5), 200 µL TMB and 6 µL of 30% hydrogen peroxide solution – all reagents
from Sigma-Aldrich). TMB-buffer was added for 30 minutes, or until significant colour change was
observed in highest concentration controls, in the dark. Colour development was completed and
arrested by adding 50 µL 1.8 M sulphuric acid (Sigma-Aldrich) per well. Plates were read at 450nm on
a 96 well Emax plate reader (Molecular Probes, Oregon, USA) and analysis was carried out on Softmax
Pro software (Molecular Devices Corporation, USA).
2.7.2. Multiplex ELISA
Multiplex ELISA (Merk Millipore) was carried out in experiments that called for multiple analytes to be
assessed from limited samples. MILLIPLEX xMAP MAGPIX multiplex assays were used, both the 42
analyte (HCYTOMAG-60K-42plex) and 25 analyte (HT17MG-14K-PX25) ELISAs were used.
Supernatants stored at -20 °C for no more than 3 months were fully defrosted at 4 °C and allowed to
come to 20 °C before vortexing and addition where appropriate. The protocol was performed
according to manufacturer’s instructions. Briefly, all wells were washed with 200 µL of assay buffer
and shaken for 10 minutes before decanting. 25 µL of sample was added to samples wells or 25 µL of
TCM to standards, background and quality control (QC) wells. Assay buffer was added to all wells
(containing cytokine standard dilutions or QCs where appropriate) followed by vortexed and sonicated
magnetic cytokine detection beads. The plate was covered and incubated overnight at 4 °C
continuously shaken. Magnetic beads were then twice washed with wash buffer (provided) and
incubated with detection antibodies for 1 hour at room temperature. Following incubation,
streptavidin-phycoerythrin was added and incubated for 30 minutes at room temperature. Magnetic
beads were twice washed and before reconstituting in MAGPIX sheath fluid. The plate was then run
on MAGPIX with xPONENT software (Merk Millipore) to determine MFI (of at least 50 beads) per well
for each analyte being tested. The concentrations of analytes tested were determined based on the
standard curve for known standards and confirmed by concentrations of 2 known QCs provided.
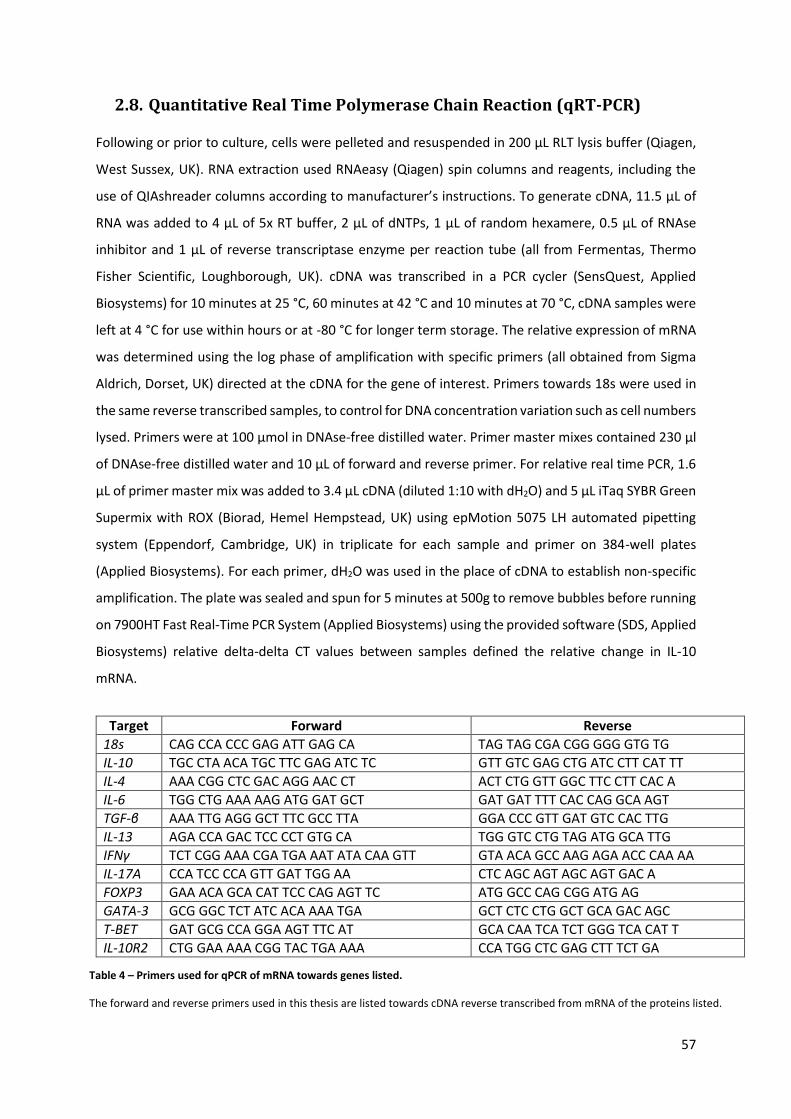
57
2.8. Quantitative Real Time Polymerase Chain Reaction (qRT-PCR)
Following or prior to culture, cells were pelleted and resuspended in 200 µL RLT lysis buffer (Qiagen,
West Sussex, UK). RNA extraction used RNAeasy (Qiagen) spin columns and reagents, including the
use of QIAshreader columns according to manufacturer’s instructions. To generate cDNA, 11.5 µL of
RNA was added to 4 µL of 5x RT buffer, 2 µL of dNTPs, 1 µL of random hexamere, 0.5 µL of RNAse
inhibitor and 1 µL of reverse transcriptase enzyme per reaction tube (all from Fermentas, Thermo
Fisher Scientific, Loughborough, UK). cDNA was transcribed in a PCR cycler (SensQuest, Applied
Biosystems) for 10 minutes at 25 °C, 60 minutes at 42 °C and 10 minutes at 70 °C, cDNA samples were
left at 4 °C for use within hours or at -80 °C for longer term storage. The relative expression of mRNA
was determined using the log phase of amplification with specific primers (all obtained from Sigma
Aldrich, Dorset, UK) directed at the cDNA for the gene of interest. Primers towards 18s were used in
the same reverse transcribed samples, to control for DNA concentration variation such as cell numbers
lysed. Primers were at 100 μmol in DNAse-free distilled water. Primer master mixes contained 230 μl
of DNAse-free distilled water and 10 μL of forward and reverse primer. For relative real time PCR, 1.6
μL of primer master mix was added to 3.4 μL cDNA (diluted 1:10 with dH2O) and 5 μL iTaq SYBR Green
Supermix with ROX (Biorad, Hemel Hempstead, UK) using epMotion 5075 LH automated pipetting
system (Eppendorf, Cambridge, UK) in triplicate for each sample and primer on 384-well plates
(Applied Biosystems). For each primer, dH2O was used in the place of cDNA to establish non-specific
amplification. The plate was sealed and spun for 5 minutes at 500g to remove bubbles before running
on 7900HT Fast Real-Time PCR System (Applied Biosystems) using the provided software (SDS, Applied
Biosystems) relative delta-delta CT values between samples defined the relative change in IL-10
mRNA.
Target Forward Reverse
18s CAG CCA CCC GAG ATT GAG CA TAG TAG CGA CGG GGG GTG TG
IL-10 TGC CTA ACA TGC TTC GAG ATC TC GTT GTC GAG CTG ATC CTT CAT TT
IL-4 AAA CGG CTC GAC AGG AAC CT ACT CTG GTT GGC TTC CTT CAC A
IL-6 TGG CTG AAA AAG ATG GAT GCT GAT GAT TTT CAC CAG GCA AGT
TGF-β AAA TTG AGG GCT TTC GCC TTA GGA CCC GTT GAT GTC CAC TTG
IL-13 AGA CCA GAC TCC CCT GTG CA TGG GTC CTG TAG ATG GCA TTG
IFNγ TCT CGG AAA CGA TGA AAT ATA CAA GTT GTA ACA GCC AAG AGA ACC CAA AA
IL-17A CCA TCC CCA GTT GAT TGG AA CTC AGC AGT AGC AGT GAC A
FOXP3 GAA ACA GCA CAT TCC CAG AGT TC ATG GCC CAG CGG ATG AG
GATA-3 GCG GGC TCT ATC ACA AAA TGA GCT CTC CTG GCT GCA GAC AGC
T-BET GAT GCG CCA GGA AGT TTC AT GCA CAA TCA TCT GGG TCA CAT T
IL-10R2 CTG GAA AAA CGG TAC TGA AAA CCA TGG CTC GAG CTT TCT GA
Table 4 – Primers used for qPCR of mRNA towards genes listed.
The forward and reverse primers used in this thesis are listed towards cDNA reverse transcribed from mRNA of the proteins listed.
58
2.9. IL-10 FluoroSpot
IL-10 FluoroSpot (Diaclone, Oxford, UK) was used to quantify proportions of IL-10-producing B cells.
The protocol was followed as per manufacturer’s instructions. Briefly, 96 well PVDF (polyvinylidene
difluoride)-bottomed plates were washed and coated with IL-10 capture antibody overnight at 4 °C.
The plate was washed and incubated with TCM for 2 hours at room temperature before washing and
adding 5x10⁵ B cells in medium, along with the stimulatory conditions specified, totalling 200 µL/well.
Where B cell numbers permitted, wells were repeated in triplicate and averages were taken of spot
counts between these repeats. Wells A1-A4 always remained acellular with medium alone in order to
determine assay background following development and IL-10 spot detection. The plate was
incubated at 37 °C and 5% CO2 for 42 hours, strictly motionless, to allow spots to form. Following
incubation, wells were emptied and incubated with 100 µL wash buffer (PBS + 0.05% Tween 20) for 10
minutes at 4 °C before washing 3x. The plate was kept in the dark as much as possible from this point
forward. FITC-conjugated anti-IL-10 detection antibody was made up in PBS with 1% BSA and added
(100 µL per well) and incubated for 1.5 hours. Wells were washed 3x and incubated with anti-FITC
green fluorescence conjugate (100 µL per well in PBS + 1% BSA) for 1 hour before washing again. Finally
wells are incubated with 100 µL of 5% fluorescence buffer in PBS per well for 15 minutes before
washing 3x as before and the membrane was washed in distilled water. The membrane was allowed
to dry in the dark and a plate reader fitted with a UV light used to visualise IL-10 spots (green),
automated image capture and counting of IL-10 spots was carried out on an AID iSpot FluoroSpot
Reader System (Oxford Biosystems Cadama, Oxford, UK). Automated counting settings were adapted
to count spots of all sizes, including the smallest, whilst sensitivity was adjusted to minimise counting
of medium only wells. All plates were developed and analysed blind and counts of spots in acellular
wells (mean of A1-A4) were deducted from the counts in every condition of that plate.
2.10. Cross-sectional study
Donors were recruited for a cross-sectional single-blinded (researchers and clinical staff) study of AIT.
14 SAR patients and 18 AIT-treated subjects were recruited from the Royal Brompton Hospital Allergy
Clinic. 14 non-allergic healthy controls were recruited through advertisements for comparison. Of the
immunotherapy treated participants, 8 had received SCIT and 6 SLIT, 4 subjects (2 on SCIT and 2 on
SLIT had completed immunotherapy 12-48 months earlier, referred to as the ‘immunotherapy
withdrawal group’. Clinical administrators blinded all clinical staff and researchers to volunteer
phenotype until analysis from the point at which volunteers were successfully included in the study,
following clinical history and screening.
59
2.10.1. Inclusion and exclusion criteria
Volunteers for this study were screened and included on the basis of the previously described clinical
criteria (section 2.2) before being admitted onto this study. Volunteer total and allergen specific (Phl
p 5) IgE is also shown for these patients, but as before allergic donors had allergen-specific IgE > 0.35
IU/mL (quantified by technicians following manufacturer’s instructions (ImmunoCAP, Phadia, Thermo
Scientific) and in line with NHS routine diagnostic procedures). Donors were included based on
meeting the minimal allergic or non-allergic criteria and were excluded if they experienced chronic or
recurrent sinusitis, were currently smoking or had a smoking history of >5 pack years, had perennial
asthma or FEV1 <70% of that predicted based on gender and age. This study was conducted outside
of the grass pollen season in the UK.
2.10.2. Self-assessment questionnaires
Global evaluation of symptoms was a subjective symptom rating from 0 to 3 (labelled “none, mild,
moderate and severe”) for symptoms when they were at their most severe during the last grass pollen
season (each of runny nose, blocked nose, sneezing, itchy nose, itchy eyes and watery eyes were
rated), the maximum score of 18 could be achieved. This global evaluation is a long standing symptom
score (Bousquet et al., 1987), which has recently also been validated and adapted within the
department (Scadding et al., 2012). Change in pollen symptoms was a subjective assessment of how
patients’ hay fever this last year was, compared to previous years. Where 0 represented ‘the same’,
+3 was labelled ‘much better’ and -3 was labelled ‘much worse’. Patients receiving immunotherapy
were asked how their hay fever this year compared with the years before they had started treatment.
For those patients initially screened prior to their first pollen season, their initial data was excluded
and change in pollen symptoms, global evaluation and pollen season mRQLQ (mini Rhinoconjunctivitis
Quality of Life Questionnaire) were repeated following their first pollen season. mRQLQ testing
recorded retrospective rhinoconjunctivitis quality of life outside of the grass pollen season and during
the pollen season, both were retrospectively recorded. As mentioned, AIT patients who had not yet
experienced a grass pollen season since commencement of AIT were followed up after their first
season. mRQLQ reported scores from 0 (not troubled) to 6 (extremely troubled) for 3 discrete life
impacts within each of the following sections; daily activities, nose symptoms, eye symptoms, other
symptoms (fatigue, thirst and irritability) and 2 which impact practical problems. Scores were totalled
and the mean was taken, with 6 being the greatest possible score.
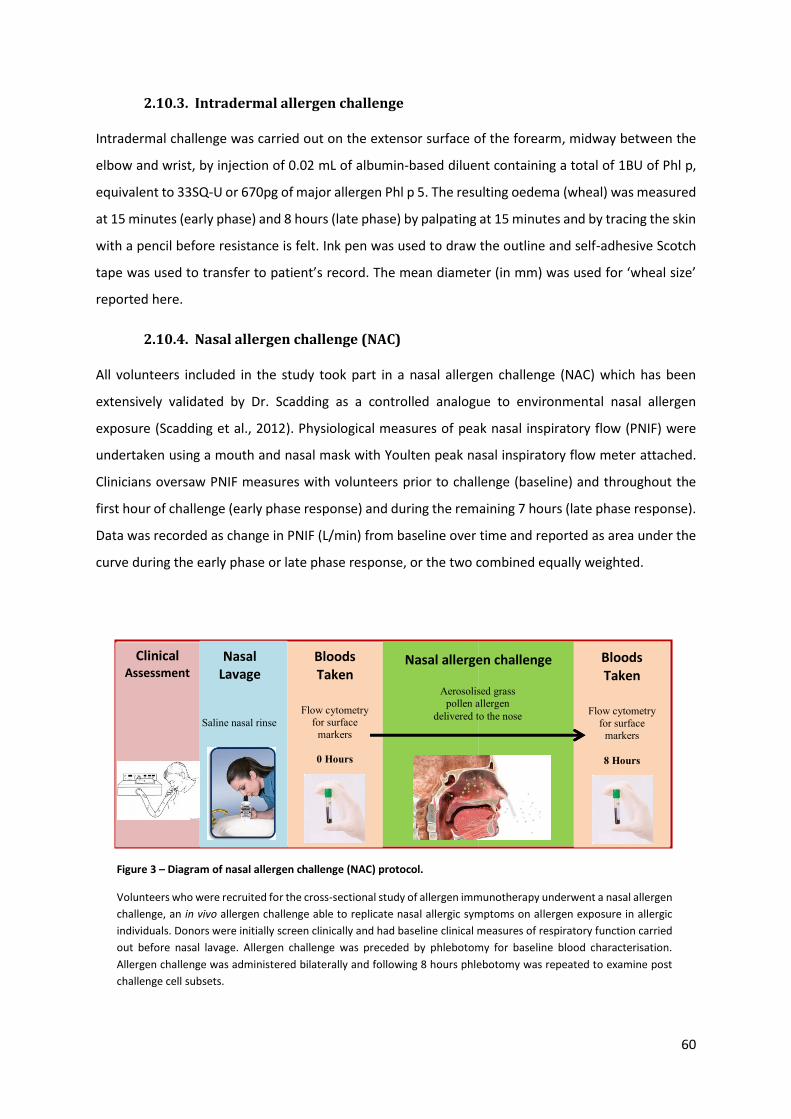
60
2.10.3. Intradermal allergen challenge
Intradermal challenge was carried out on the extensor surface of the forearm, midway between the
elbow and wrist, by injection of 0.02 mL of albumin-based diluent containing a total of 1BU of Phl p,
equivalent to 33SQ-U or 670pg of major allergen Phl p 5. The resulting oedema (wheal) was measured
at 15 minutes (early phase) and 8 hours (late phase) by palpating at 15 minutes and by tracing the skin
with a pencil before resistance is felt. Ink pen was used to draw the outline and self-adhesive Scotch
tape was used to transfer to patient’s record. The mean diameter (in mm) was used for ‘wheal size’
reported here.
2.10.4. Nasal allergen challenge (NAC)
All volunteers included in the study took part in a nasal allergen challenge (NAC) which has been
extensively validated by Dr. Scadding as a controlled analogue to environmental nasal allergen
exposure (Scadding et al., 2012). Physiological measures of peak nasal inspiratory flow (PNIF) were
undertaken using a mouth and nasal mask with Youlten peak nasal inspiratory flow meter attached.
Clinicians oversaw PNIF measures with volunteers prior to challenge (baseline) and throughout the
first hour of challenge (early phase response) and during the remaining 7 hours (late phase response).
Data was recorded as change in PNIF (L/min) from baseline over time and reported as area under the
curve during the early phase or late phase response, or the two combined equally weighted.
Clinical Assessment
Flow cytometry for surface
markers
0 Hours
Aerosolised grass
pollen allergen
delivered to the nose
Bloods Taken
Nasal allergen challenge Bloods Taken
Flow cytometry
for surface
markers
8 Hours
Saline nasal rinse
Nasal Lavage
Figure 3 – Diagram of nasal allergen challenge (NAC) protocol.
Volunteers who were recruited for the cross-sectional study of allergen immunotherapy underwent a nasal allergen
challenge, an in vivo allergen challenge able to replicate nasal allergic symptoms on allergen exposure in allergic
individuals. Donors were initially screen clinically and had baseline clinical measures of respiratory function carried
out before nasal lavage. Allergen challenge was preceded by phlebotomy for baseline blood characterisation.
Allergen challenge was administered bilaterally and following 8 hours phlebotomy was repeated to examine post
challenge cell subsets.
61
For the examination of B cells, 10 mL of blood was taken as previously described (section 2.3.1) before
(0 hours) and after (8 hours) NAC in order to quantify B cell subsets by whole blood flow cytometry
(described in section 2.6.5), as outlined in Figure 3. All volunteers underwent baseline observations of
blood pressure, temperature, peak nasal inspiratory flow and spirometry. A bilateral saline nasal rinse
(SinusRinse, Neilmed, USA) was carried out, following manufacturer’s instructions. Following nasal
rinse, 10,000 BU/mL of Phl p was administered in separate 100 µL sprays, one per nostril, by an
applicator device (Aptar Pharma, Germany) aimed posterio-laterally.
2.11. Immunohistochemistry
Tonsil sections were received from routine tonsillectomy immersed in 5% paraformaldehyde (Sigma
Aldrich) in PBS before storage. Sections of tonsil initially fixed in acetone had also been used, however
although staining was successful, the morphology of the section was disrupted making it features
unrecognisable in acetone fixed samples. Nasal sections were similarly treated, but acquired in the
weeks prior to staining as part of routine validation of immunohistochemical staining from a pool of
n=6 allergic donors (n=4 untreated allergic, n=2 SCIT). Nasal sections were taken from the inferior
turbinate of either nostril. Biopsies were stored at -80 °C before cryostat sectioning to cut 3 sequential
4 µm sections per glass slide. Sections were allowed to dry onto the slides at 37 °C overnight before
being wrapped in aluminium foil and stored at -80 °C until use.
2.11.1. Immunostaining
On the day of staining, sections were thawed at room temperature; slides were labelled with the
staining they would receive in pencil, before a silicone ring was drawn around the section using an
Immune Edge pen H4000 (Vector labs). Some tonsil sections had been stored unfixed, so were fixed
on thawing in 4% paraformaldehyde in PBS for 5 minutes. All sections were then washed twice in PBS
for 5 minutes with agitation and biotin block was used (Vector labs, Peterborough, UK). 1 drop of
Avidin D solution was added to each section and incubated for 15 minutes, before washing for 5
minutes in PBS and again incubating for 15 minutes with 1 drop of biotin solution. Sections are washed
once again for 5 minutes in PBS before being blocked with 60 µl per section of serum from the animal
the secondary antibody was raised in. For donkey, 20% normal donkey serum (Stratech, Suffolk, UK),
made up in PBS was used. Horse serum was used from Vectastain ABC-AP mouse IgG kit (Vector labs,
Peterborough, UK), from which 3 drops were added to 10 mL of PBS. Where dual staining was carried
out the IL-10-staining secondary antibody serum was prioritised (donkey serum). Blocking serum was
incubated for 30 minutes at room temperature in a humid chamber with the lid on. Sections were not
allowed to dry out once they had been immersed in PBS until the end of the protocol. Sections were
incubated with primary antibody at the dilution indicated in Table 5 if not stated, for 1 hour at room

62
temperature. Dilutions of primary antibody were made up in 5% normal human male AB serum (NHS)
(Sigma Aldrich) in PBS. Slides were washed 3x for 5 minutes in PBS with agitation before incubation in
60µl of secondary antibody as shown in Figure 4, to stain for detection by ABC-AP (Figure 4 A and B)
or fluorescence microscopy (Figure 4 C). Secondary antibody, made up in 10% NHS, was incubated for
45 minutes at room temperature in a humidity chamber. The remaining staining is described below,
for ABC-AP or fluorescence microscopy.
Antigen
Antigen
Antigen
Antigen
A B
C
IL-10 optimisation CD20/CD138 optimisation
Dual IL-10 and CD20/CD138 fluorescence staining
B
i
o
t
i
n
B
i
o
t
i
n
IL-10
Goat anti-IL-10
Donkey anti-
goat biotin
CD20/CD138
Mouse anti-CD20/138
Horse anti-
mouse biotin
IL-10
Goat anti-IL-10
Donkey anti-
goat biotin
CD20/CD138
Mouse anti-
CD20/138
Rabbit anti-
mouse IgG
Streptavidin
Alexa Flour 488
B
i
o
t
i
n
Swine anti-
rabbit TRITC
Figure 4 – Diagram of immunohistochemistry staining antibodies used.
Triple layer staining of IL-10, CD20 and CD138 was carried out to detect these antigens by light (A and B) and fluorescence
(C) microscopy. Antibodies and substrates are listed, which were added in turn as described in the text.
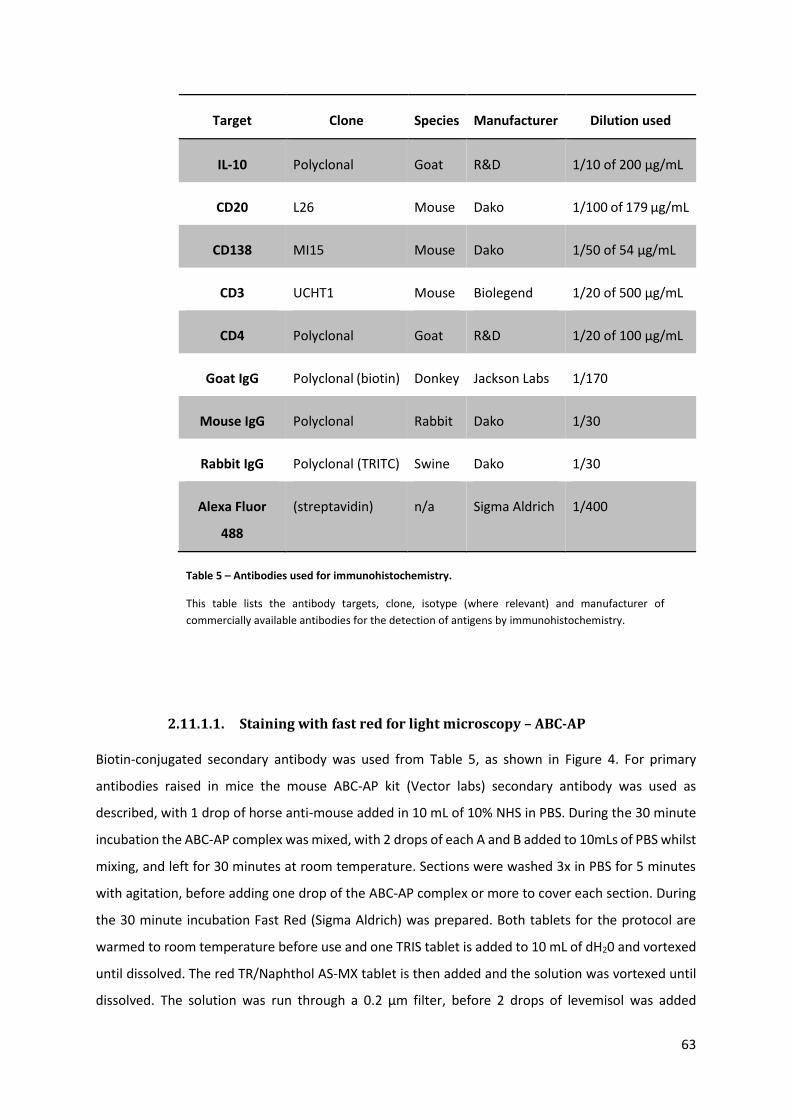
63
Target Clone Species Manufacturer Dilution used
IL-10 Polyclonal Goat R&D 1/10 of 200 µg/mL
CD20 L26 Mouse Dako 1/100 of 179 µg/mL
CD138 MI15 Mouse Dako 1/50 of 54 µg/mL
CD3 UCHT1 Mouse Biolegend 1/20 of 500 µg/mL
CD4 Polyclonal Goat R&D 1/20 of 100 µg/mL
Goat IgG Polyclonal (biotin) Donkey Jackson Labs 1/170
Mouse IgG Polyclonal Rabbit Dako 1/30
Rabbit IgG Polyclonal (TRITC) Swine Dako 1/30
Alexa Fluor
488
(streptavidin) n/a Sigma Aldrich 1/400
2.11.1.1. Staining with fast red for light microscopy – ABC-AP
Biotin-conjugated secondary antibody was used from Table 5, as shown in Figure 4. For primary
antibodies raised in mice the mouse ABC-AP kit (Vector labs) secondary antibody was used as
described, with 1 drop of horse anti-mouse added in 10 mL of 10% NHS in PBS. During the 30 minute
incubation the ABC-AP complex was mixed, with 2 drops of each A and B added to 10mLs of PBS whilst
mixing, and left for 30 minutes at room temperature. Sections were washed 3x in PBS for 5 minutes
with agitation, before adding one drop of the ABC-AP complex or more to cover each section. During
the 30 minute incubation Fast Red (Sigma Aldrich) was prepared. Both tablets for the protocol are
warmed to room temperature before use and one TRIS tablet is added to 10 mL of dH20 and vortexed
until dissolved. The red TR/Naphthol AS-MX tablet is then added and the solution was vortexed until
dissolved. The solution was run through a 0.2 µm filter, before 2 drops of levemisol was added
Table 5 – Antibodies used for immunohistochemistry.
This table lists the antibody targets, clone, isotype (where relevant) and manufacturer of
commercially available antibodies for the detection of antigens by immunohistochemistry.
64
(provided in the fast red staining kit, Sigma Aldrich, at 150 µg/mL) and the solution was stored in the
dark before use. Following ABC-AP incubation, sections were washed 3x in PBS with agitation, at least
60 µL of fast red solution was then added to each section. Sections were incubated for 20 minutes at
room temperature. During this incubation time hematoxylin (VWR, East Grinstead, UK) was filtered
through filter paper. Following fast red incubation, the reaction was stopped in a cold tap water bath
and agitated. To visualise cell nuclei, slides were added to a bath of the filtered hematoxylin for 5
seconds and washed in successive baths of fresh tap water, until the water was clear. Sections were
dried briefly and a coverslip was fitted with faramount mounting medium (Dako), avoiding bubble.
Slides were visualised by light microscopy using a Nikon Eclipse E400, with images captured at 20x
unless stated using an attached camera and Lucia 4.8 software.
2.11.1.2. Staining with fluorochrome conjugates for UV microscopy
Fluorescence staining was carried out as shown in Figure 4 C, with the secondary antibodies shown
and described in Table 5. Following the incubation of sections with secondary antibodies, as described
above, slides were washed 3x in PBS with agitation for 5 minutes before the addition of the tertiary
antibody or reagent. Initially, excess diluted streptavidin Alexa Fluor 488 (1/400 in PBS) in 1.5 mL micro
centrifuge tubes was spun at >8000g for 3 minutes. The required quantity was pipetted from the top,
leaving at least 50 µL, which prevented larger clumps of fluorescence appearing on the sections, swine
anti-rabbit TRITC was added to the spun Alexa Fluor 488 to produce the final concentration of both
shown in Table 5. At least 60 µL was incubated with sections for 30 minutes at room temperature in
the dark in a humidity chamber. Slides were all washed 3x in PBS with agitation and sections were
briefly dried, before adding DAPI-containing mountant and affixing coverslips, avoiding bubbles.
Mountant, ProLong Gold (Cell Signalling Technologies, Invitrogen), was prepared following
manufacturer’s instructions and used at room temperature. Following mounting, slides were stored
in slide trays with covers to protect from light, wrapped in aluminium foil, at 4 °C in the fridge. Sections
were visualised under UV light, through appropriate filters, on a Nikon Eclipse E400. Images of
sections, captured sequentially at 20x (unless indicated) using an attached camera and Lucia 4.8
software.

65
2.12. Statistical plan
Hypotheses were tested independently. Where multiple comparisons were performed, Kruskal-Wallis
or Friedman tests (for unpaired or paired data, respectively) were carried out to determine overall
significance. Thereafter, hierarchical testing was performed for the primary hypothesis prior to
secondary or exploratory hypothesis testing. For paired data, Wilcoxon matched-pairs signed-rank test
was used. For unpaired data, the Mann-Whitney U-test was employed.
If hierarchical hypothesis testing was not possible, for example where an optimal concentration of a
reagent was being sought, then Dunn’s test was used to correct for multiple comparisons.
Correlations were assessed by Spearman’s rank correlation method. p values <0.15 were considered
indicative of a trend, whilst p values <0.05 were considered significant.
Unless stated otherwise, data in figures and tables are shown as median and interquartile ranges.
66
3. Generation and function of human IL-10-producing B cells in vitro
This chapter aims to identify IL-10-producing B cell phenotypes (introduced in section 1) in peripheral
blood following specific TLR or CD40 stimulation in vitro, in line with previous data demonstrating
these methods of B cell IL-10 induction (Iwata et al., 2011, Blair et al., 2010). The functional capacity
of IL-10-producing B cells to supress T cell responses will also be investigated.
Hypotheses
1. Peripheral blood B cells produce IL-10 following TLR, CD40 or BCR stimulation, that is
enriched within distinct B cell subsets.
2. Peripheral B cells are capable of suppressing allergen-driven Th2 responses in an IL-10-
dependent manner.
Aims
1. For hypothesis 1:
a. Determine optimal in vitro stimulation for detecting IL-10-producing regulatory B
cells.
b. Determine whether PBMC or isolated B cell stimulation modifies the identification of
IL-10-competent B cells.
c. Assess the proportions of IL-10-producing B cells within CD5hi, CD5+CD1dhi, CD27+,
CD274+ (PD-L1+), CD27+CD24hi and CD24hiCD38hi B cell subsets.
d. Examine cell surface phenotype within IL-10+ and IL-10- subtypes.
e. Determine chemokine receptor expression on IL-10-producing B cells.
2. For hypothesis 2 :
a. Assess whether T cell co-culture with IL-10-primed B cells suppress:
i. Polyclonally-stimulated or
ii. Allergen-stimulated T cell proliferation or inflammatory cytokine production.
b. Assess IL-10, TGFβ or PD-L1 dependency of regulatory B cell suppression of T cell
responses by blocking antibodies during co-culture.
67
3.1. Induction and detection of IL-10 producing B cells
3.1.1. Dose responses
PBMCs were stained for CD19 and IL-10 to discriminate B cells secreting IL-10, as shown in Figure 5 A.
For all conditions, the median percentages of IL-10-producing B cells, at the lowest concentrations,
were between 2 and 3.3%. Increasing concentrations of grass pollen allergen, Phl p (Figure 5 B), CD40
Ligand (Figure 5 C), anti-CD40 antibody (Figure 5 D) or lipopolysaccharide (LPS) (Figure 5 E) did not
show any increase in the proportions of IL-10-producing B cells. CpG stimulation showed a significant
increase in the proportions of IL-10-producing B cells at 1 and 3 µg/mL (Figure 5 F). From a median of
1.95% IL-10+ B cells when stimulated with 0.1 µg/mL CpG, to 8.2% and 9.55% when stimulated with 1
and 3 µg/mL, respectively.
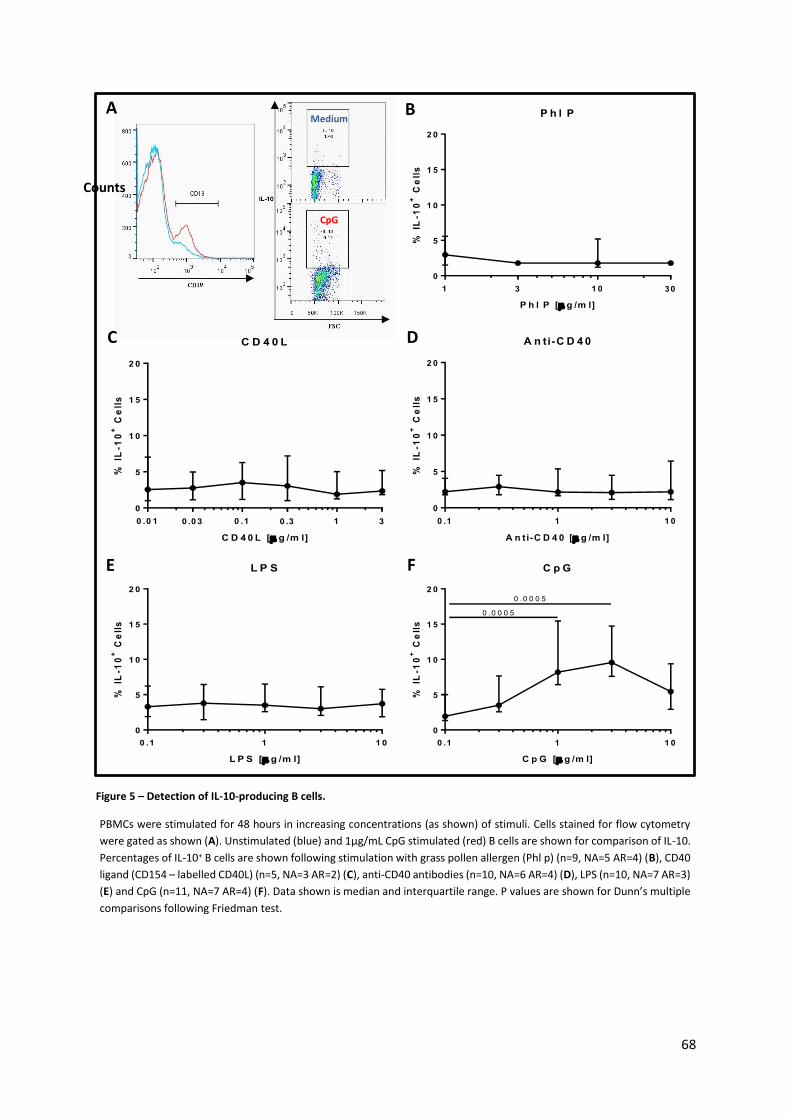
68
Medium
CpG
Mediu
m
L P S
0 .1 1 1 0
0
5
1 0
1 5
2 0
L P S [ g /m l]
% I
L-1
0+
Ce
lls
A n ti-C D 4 0
0 .1 1 1 0
0
5
1 0
1 5
2 0
A n ti-C D 4 0 [ g /m l]
% I
L-1
0+
Ce
lls
P h l P
1 1 0
0
5
1 0
1 5
2 0
P h l P [ g /m l]
% I
L-1
0+
Ce
lls
3 30
A B
D
F E
Figure 5 – Detection of IL-10-producing B cells.
PBMCs were stimulated for 48 hours in increasing concentrations (as shown) of stimuli. Cells stained for flow cytometry
were gated as shown (A). Unstimulated (blue) and 1µg/mL CpG stimulated (red) B cells are shown for comparison of IL-10.
Percentages of IL-10+ B cells are shown following stimulation with grass pollen allergen (Phl p) (n=9, NA=5 AR=4) (B), CD40
ligand (CD154 – labelled CD40L) (n=5, NA=3 AR=2) (C), anti-CD40 antibodies (n=10, NA=6 AR=4) (D), LPS (n=10, NA=7 AR=3)
(E) and CpG (n=11, NA=7 AR=4) (F). Data shown is median and interquartile range. P values are shown for Dunn’s multiple
comparisons following Friedman test.
CpG
C p G
0 .1 1 1 0
0
5
1 0
1 5
2 0
C p G [ g /m l]
% I
L-1
0+
Ce
lls
0 .0 0 0 5
0 .0 0 0 5
Counts
C D 4 0 L
0 .0 1 0 .1 1
0
5
1 0
1 5
2 0
C D 4 0 L [ g /m l]
% I
L-1
0+
Ce
lls
0 .30 .03 3
C
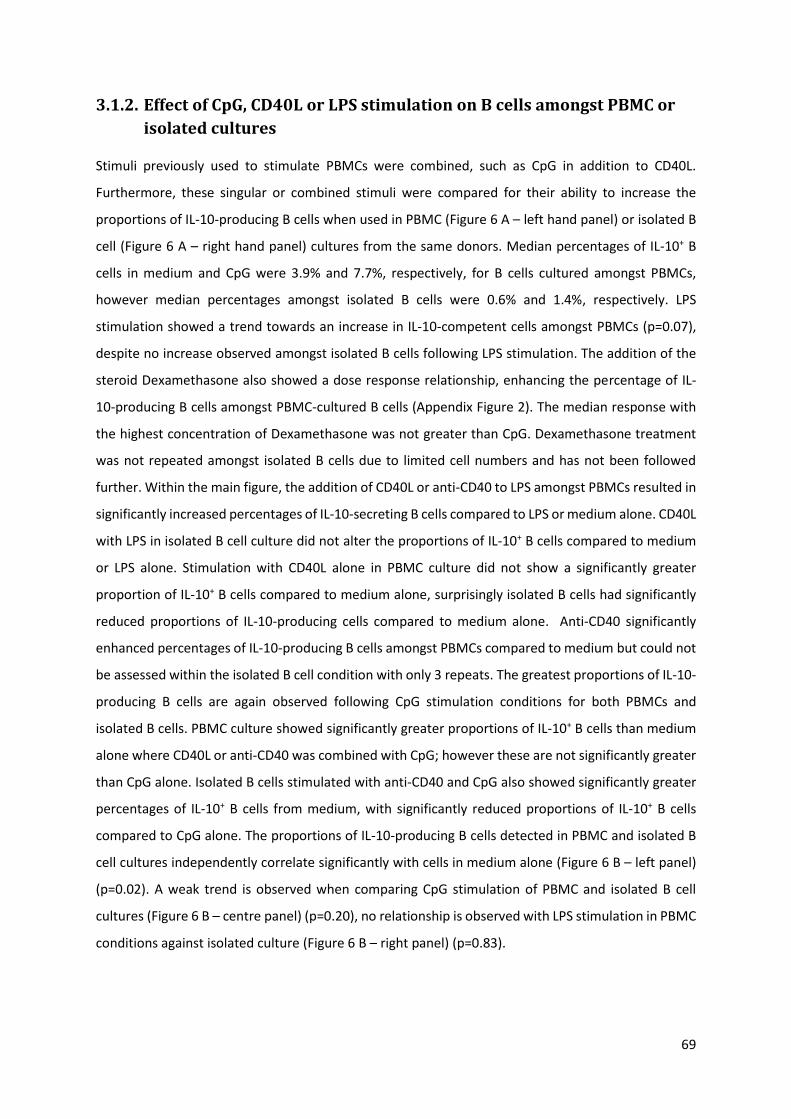
69
3.1.2. Effect of CpG, CD40L or LPS stimulation on B cells amongst PBMC or
isolated cultures
Stimuli previously used to stimulate PBMCs were combined, such as CpG in addition to CD40L.
Furthermore, these singular or combined stimuli were compared for their ability to increase the
proportions of IL-10-producing B cells when used in PBMC (Figure 6 A – left hand panel) or isolated B
cell (Figure 6 A – right hand panel) cultures from the same donors. Median percentages of IL-10+ B
cells in medium and CpG were 3.9% and 7.7%, respectively, for B cells cultured amongst PBMCs,
however median percentages amongst isolated B cells were 0.6% and 1.4%, respectively. LPS
stimulation showed a trend towards an increase in IL-10-competent cells amongst PBMCs (p=0.07),
despite no increase observed amongst isolated B cells following LPS stimulation. The addition of the
steroid Dexamethasone also showed a dose response relationship, enhancing the percentage of IL-
10-producing B cells amongst PBMC-cultured B cells (Appendix Figure 2). The median response with
the highest concentration of Dexamethasone was not greater than CpG. Dexamethasone treatment
was not repeated amongst isolated B cells due to limited cell numbers and has not been followed
further. Within the main figure, the addition of CD40L or anti-CD40 to LPS amongst PBMCs resulted in
significantly increased percentages of IL-10-secreting B cells compared to LPS or medium alone. CD40L
with LPS in isolated B cell culture did not alter the proportions of IL-10+ B cells compared to medium
or LPS alone. Stimulation with CD40L alone in PBMC culture did not show a significantly greater
proportion of IL-10+ B cells compared to medium alone, surprisingly isolated B cells had significantly
reduced proportions of IL-10-producing cells compared to medium alone. Anti-CD40 significantly
enhanced percentages of IL-10-producing B cells amongst PBMCs compared to medium but could not
be assessed within the isolated B cell condition with only 3 repeats. The greatest proportions of IL-10-
producing B cells are again observed following CpG stimulation conditions for both PBMCs and
isolated B cells. PBMC culture showed significantly greater proportions of IL-10+ B cells than medium
alone where CD40L or anti-CD40 was combined with CpG; however these are not significantly greater
than CpG alone. Isolated B cells stimulated with anti-CD40 and CpG also showed significantly greater
percentages of IL-10+ B cells from medium, with significantly reduced proportions of IL-10+ B cells
compared to CpG alone. The proportions of IL-10-producing B cells detected in PBMC and isolated B
cell cultures independently correlate significantly with cells in medium alone (Figure 6 B – left panel)
(p=0.02). A weak trend is observed when comparing CpG stimulation of PBMC and isolated B cell
cultures (Figure 6 B – centre panel) (p=0.20), no relationship is observed with LPS stimulation in PBMC
conditions against isolated culture (Figure 6 B – right panel) (p=0.83).
70
B c e ll IL -1 0 fo llo w in g P B M C c u ltu re
% I
L-1
0+
Ce
lls
M e d iu m C p G L P S C D 4 0 L C D 4 0 L
+ C p G
C D 4 0 L
+ L P S
C D 4 0 C D 4 0
+ C p G
C D 4 0
+ L P S
0
1 0
2 0
3 0
0 .0 0 0 6 0 .0 7 0 .2 0 0 .0 0 0 1 0 .0 0 3 0 .0 3 0 .0 0 0 5 0 .0 0 3
0 .3 0
0 .0 1
0 .1 6
0 .0 3
B c e ll IL -1 0 fo llo w in g is o la te d B c e ll c u ltu re
M e d iu m C p G L P S C D 4 0 L C D 4 0 L
+ C p G
C D 4 0 L
+ L P S
a n t i-C D 4 0 a n t i-C D 4 0
+ C p G
0
2
4
6
> 0 .9 0 .0 1 60 .7 40 .0 3 10 .8 4
0 .0 0 0 2 0 .0 0 1
0 .5 4
0 .0 0 8
C p G
P B M C -c u ltu re d B c e ll IL -1 0
Iso
late
d B
ce
ll I
L-1
0
0 5 1 0 1 5
0
2
4
6
r= 0 .3 6
p = 0 .2 0
L P S
P B M C -c u ltu re d B c e ll IL -1 0
Iso
late
d B
ce
ll I
L-1
0
0 5 1 0 1 5
0 .0
0 .5
1 .0
1 .5
r= 0 .0 6
p = 0 .8 3
M e d iu m a lo n e
P B M C -c u ltu re d B c e ll IL -1 0
Iso
late
d B
ce
ll I
L-1
0
0 5 1 0 1 5
0 .0
0 .5
1 .0
1 .5
r= 0 .6 9
p = 0 .0 2
A
B
Figure 6 – Comparison of IL-10-producing B cells following stimulation in PBMC or isolated culture.
PBMCs or isolated B cells were stimulated for 48 hours in the conditions shown (A). Proportions of IL-10-producing B cells
are subsequently detected by flow cytometry. Donor numbers differed for PBMC culture (n=17, NA=6, AR=9, AIT=2)
compared to isolated B cell cultures (for medium, CpG and LPS n=13, NA=6, AR=7 – for CD40L+CpG and CD40L+LPS n=10,
NA=6, AR=4 – for anti-CD40 n=4 all AR – for anti-CD40+CpG n=9, NA=6, AR=3). Wilcoxon matched-pairs signed-rank test
was used to compare for differences, following significant Friedman test (p<0.0001 for both). Proportions of IL-10+ B cells
following culture in (from left to right) medium alone, CpG or LPS are shown for PBMC against isolated B cell cultures (B)
(for medium n=11, NA=5, AR=6 – for CpG and LPS n=13, NA=6, AR=7).
71
3.1.3. Time course of IL-10 induction by CpG amongst B cells
Representative flow cytometry staining for IL-10 is shown following 1 µg/mL CpG at 0, 24, 48, 72 and
96 hours (Figure 7 A) and at 48 hours with 0, 1 and 3 µg/mL CpG (Figure 7 B). Flow cytometry shows
an increase in IL-10 producing B cells at 48 hours following 1 µg/mL and at 72 hours following 3 µg/mL,
compared to 0 µg/mL controls. qPCR showed significantly increased mRNA for IL-10 at 24 hours for 1
µg/mL and both 1 and 3 µg/mL at 48 hours relative to 0 µg/mL CpG controls (Figure 7 D). IL-10
concentrations were significantly greater in both 1 and 3 µg/mL CpG cultures relative to unstimulated
cells at 48 hours, maintained through 72 and 96 hour time points.
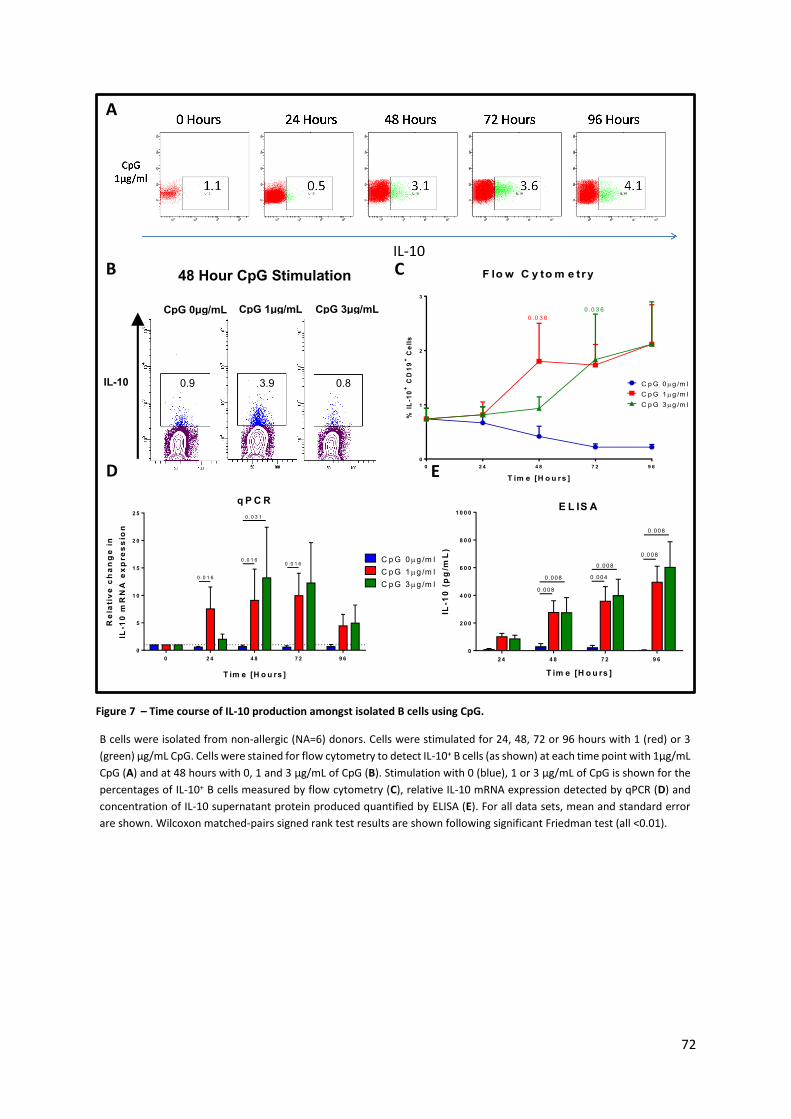
72
F lo w C y to m e try
0 2 4 4 8 7 2 9 6
0
1
2
3
C p G 0 g /m l
C p G 1 g /m l
C p G 3 g /m l
T im e [H o u rs ]
% I
L-1
0+
CD
19
+C
ell
s
0 .0 3 6
0 .0 3 6
IL-10
CpG 1μg/mL CpG 0μg/mL CpG 3μg/mL
0.9 3.9 0.8
48 Hour CpG Stimulation
IL-10
q P C R
0 2 4 4 8 7 2 9 6
0
5
1 0
1 5
2 0
2 5
C p G 0 g /m l
C p G 1 g /m l
C p G 3 g /m l
T im e [H o u rs ]
Re
lati
ve
ch
an
ge
in
IL-1
0 m
RN
A e
xp
re
ss
ion
0 .0 1 6
0 .0 1 60 .0 1 6
0 .0 3 1
E L IS A
2 4 4 8 7 2 9 6
0
2 0 0
4 0 0
6 0 0
8 0 0
1 0 0 0
T im e [H o u rs ]
IL-1
0 (
pg
/mL
)
0 .008
0 .008
0 .008
0 .008
0 .008
0 .004
A
B C
D E
Figure 7 – Time course of IL-10 production amongst isolated B cells using CpG.
B cells were isolated from non-allergic (NA=6) donors. Cells were stimulated for 24, 48, 72 or 96 hours with 1 (red) or 3
(green) µg/mL CpG. Cells were stained for flow cytometry to detect IL-10+ B cells (as shown) at each time point with 1µg/mL
CpG (A) and at 48 hours with 0, 1 and 3 µg/mL of CpG (B). Stimulation with 0 (blue), 1 or 3 µg/mL of CpG is shown for the
percentages of IL-10+ B cells measured by flow cytometry (C), relative IL-10 mRNA expression detected by qPCR (D) and
concentration of IL-10 supernatant protein produced quantified by ELISA (E). For all data sets, mean and standard error
are shown. Wilcoxon matched-pairs signed rank test results are shown following significant Friedman test (all <0.01).
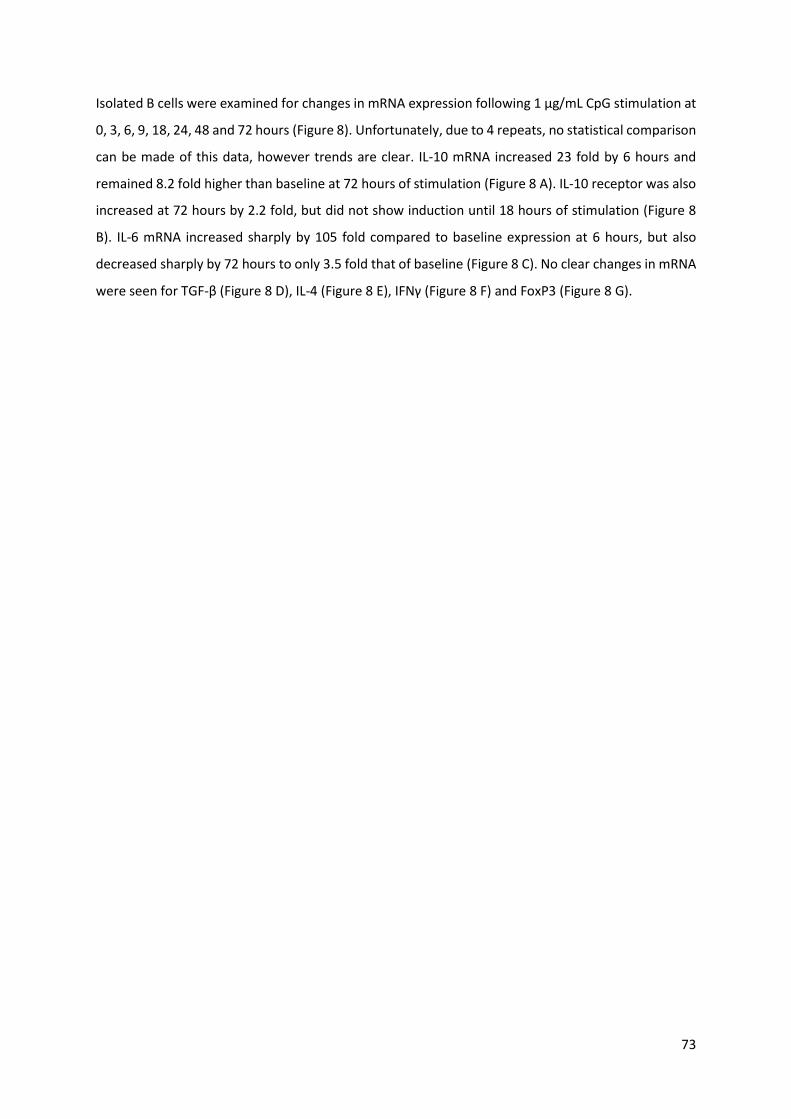
73
Isolated B cells were examined for changes in mRNA expression following 1 µg/mL CpG stimulation at
0, 3, 6, 9, 18, 24, 48 and 72 hours (Figure 8). Unfortunately, due to 4 repeats, no statistical comparison
can be made of this data, however trends are clear. IL-10 mRNA increased 23 fold by 6 hours and
remained 8.2 fold higher than baseline at 72 hours of stimulation (Figure 8 A). IL-10 receptor was also
increased at 72 hours by 2.2 fold, but did not show induction until 18 hours of stimulation (Figure 8
B). IL-6 mRNA increased sharply by 105 fold compared to baseline expression at 6 hours, but also
decreased sharply by 72 hours to only 3.5 fold that of baseline (Figure 8 C). No clear changes in mRNA
were seen for TGF-β (Figure 8 D), IL-4 (Figure 8 E), IFNγ (Figure 8 F) and FoxP3 (Figure 8 G).
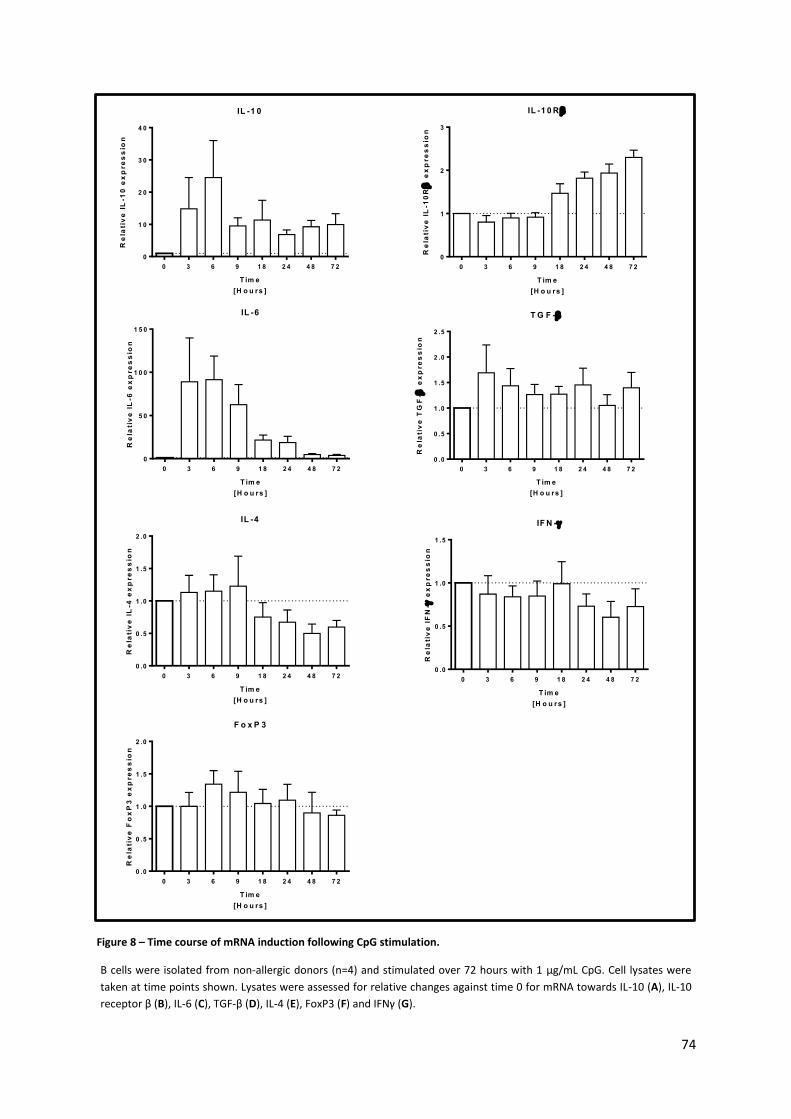
74
IL -1 0
0 3 6 9 1 8 2 4 4 8 7 2
0
1 0
2 0
3 0
4 0
T im e
[H o u rs ]
Re
lati
ve
IL
-10
ex
pre
ss
ion
IL -1 0 R
0 3 6 9 1 8 2 4 4 8 7 2
0
1
2
3
T im e
[H o u rs ]
Re
lati
ve
IL
-10
R
ex
pre
ss
ion
IL -6
0 3 6 9 1 8 2 4 4 8 7 2
0
5 0
1 0 0
1 5 0
T im e
[H o u rs ]
Re
lati
ve
IL
-6 e
xp
re
ss
ion
T G F -
0 3 6 9 1 8 2 4 4 8 7 2
0 .0
0 .5
1 .0
1 .5
2 .0
2 .5
T im e
[H o u rs ]
Re
lati
ve
TG
F-
ex
pre
ss
ion
IL -4
0 3 6 9 1 8 2 4 4 8 7 2
0 .0
0 .5
1 .0
1 .5
2 .0
T im e
[H o u rs ]
Re
lati
ve
IL
-4 e
xp
re
ss
ion
F o x P 3
0 3 6 9 1 8 2 4 4 8 7 2
0 .0
0 .5
1 .0
1 .5
2 .0
T im e
[H o u rs ]
Re
lati
ve
Fo
xP
3 e
xp
re
ss
ion
IF N -
0 3 6 9 1 8 2 4 4 8 7 2
0 .0
0 .5
1 .0
1 .5
T im e
[H o u rs ]
Re
lati
ve
IF
N-
ex
pre
ss
ion
Figure 8 – Time course of mRNA induction following CpG stimulation.
B cells were isolated from non-allergic donors (n=4) and stimulated over 72 hours with 1 µg/mL CpG. Cell lysates were
taken at time points shown. Lysates were assessed for relative changes against time 0 for mRNA towards IL-10 (A), IL-10
receptor β (B), IL-6 (C), TGF-β (D), IL-4 (E), FoxP3 (F) and IFNγ (G).
A B
C D
E F
G
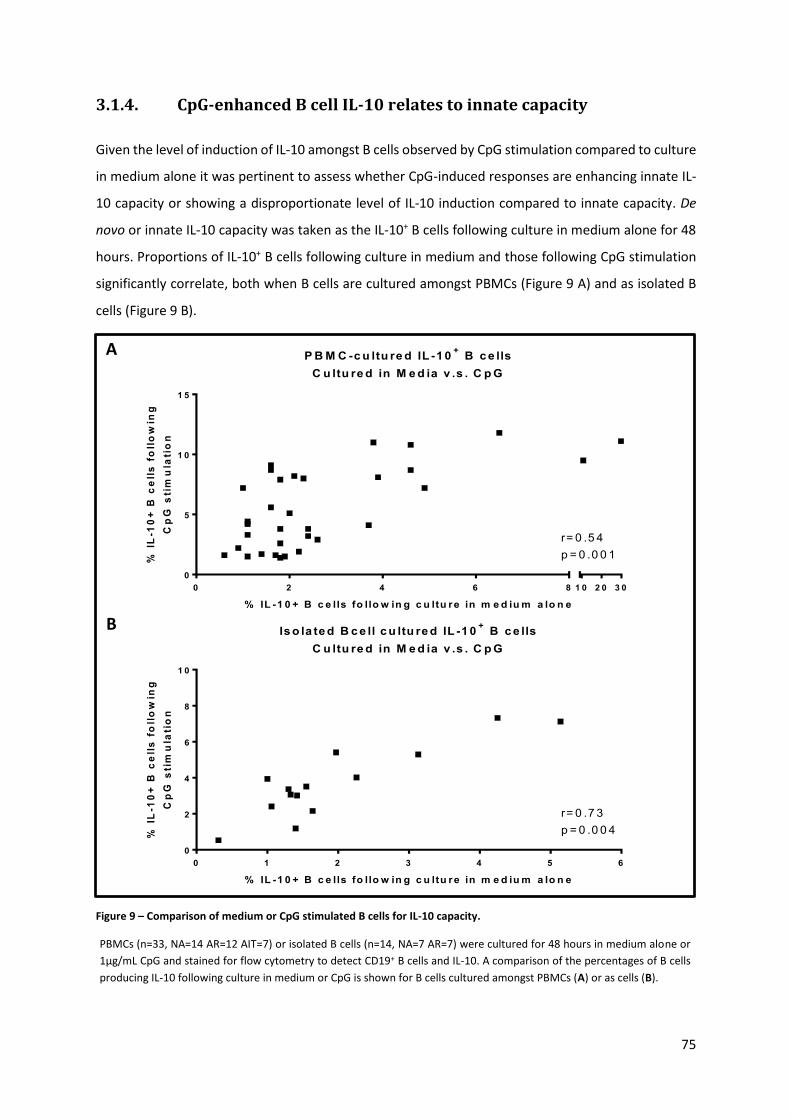
75
3.1.4. CpG-enhanced B cell IL-10 relates to innate capacity
Given the level of induction of IL-10 amongst B cells observed by CpG stimulation compared to culture
in medium alone it was pertinent to assess whether CpG-induced responses are enhancing innate IL-
10 capacity or showing a disproportionate level of IL-10 induction compared to innate capacity. De
novo or innate IL-10 capacity was taken as the IL-10+ B cells following culture in medium alone for 48
hours. Proportions of IL-10+ B cells following culture in medium and those following CpG stimulation
significantly correlate, both when B cells are cultured amongst PBMCs (Figure 9 A) and as isolated B
cells (Figure 9 B).
P B M C -c u ltu re d IL -1 0+
B c e lls
C u ltu re d in M e d ia v .s . C p G
% IL -1 0 + B c e lls fo llo w in g c u ltu re in m e d iu m a lo n e
% I
L-1
0+
B c
ell
s f
oll
ow
ing
Cp
G s
tim
ula
tio
n
0 2 4 6 8
0
5
1 0
1 5
1 0 2 0 3 0
r= 0 .5 4
p = 0 .0 0 1
Figure 9 – Comparison of medium or CpG stimulated B cells for IL-10 capacity.
PBMCs (n=33, NA=14 AR=12 AIT=7) or isolated B cells (n=14, NA=7 AR=7) were cultured for 48 hours in medium alone or
1µg/mL CpG and stained for flow cytometry to detect CD19+ B cells and IL-10. A comparison of the percentages of B cells
producing IL-10 following culture in medium or CpG is shown for B cells cultured amongst PBMCs (A) or as cells (B).
Is o la te d B c e ll c u ltu re d IL -1 0+
B c e lls
C u ltu re d in M e d ia v .s . C p G
% IL -1 0 + B c e lls fo llo w in g c u ltu re in m e d iu m a lo n e
% I
L-1
0+
B c
ell
s f
oll
ow
ing
Cp
G s
tim
ula
tio
n
0 1 2 3 4 5 6
0
2
4
6
8
1 0
r= 0 .7 3
p = 0 .0 0 4
A
B
76
3.1.5. Phenotyping of IL-10-producing B cells
Isolated B cells were examined for their expression of IL-10 in concert with B cell subsets previously
identified as containing increased concentrations of IL-10-producing B cells (CD24hiCD38hi, CD27+,
CD10+, CD27+CD24hi, PD-L1+ and CD5hi) (Figure 10 and Figure 11). IL-10+ B cells were significantly
enriched amongst CD24hiCD38hi B cells relative to CD24intCD38int and CD24hiCD38lo B cells following 1
or 3 µg/mL CpG (Figure 10 B and C). In the absence of CpG at 48 hours there was no enrichment within
the CD24hiCD38hi subset (Figure 10 A). All 3 subsets have significantly increased proportions of IL-10+
B cells following either 1 or 3 µg/mL CpG (Figure 10 E, F and G). Gating of IL-10+, CD27+, CD10+,
CD27+CD24hi, PD-L1+ and CD5hi B cell subsets (Figure 11 A) has allowed the comparison of IL-10
capacity amongst individual subsets with respect to the total B cell population. Significantly greater
proportions of IL-10+ B cells were found within CD10+, CD27+CD24hi, PD-L1+, CD5hi and CD24hiCD38hi
subsets relative to the whole CD19+ population (Figure 11 B). CD27+ B cells showed no change in the
proportion of IL-10+ B cells in the absence of CpG but had significantly fewer IL-10-producing B cells
post CpG stimulation. Amongst both medium cultured and CpG stimulated B cells the subset with the
greatest proportion of IL-10+ B cells was within the CD24hiCD38hi B cells. IL-10+ B cells increased from
medians of 1.49% in medium to 17.9% within the CD24hiCD38hi subset in the absence of CpG and from
3.44% to 13.6% with CpG. The phenotype within both the IL-10+ and IL-10- B cell populations shows
all B cell markers were expressed to a significantly greater extent within the IL-10+ subset compared
to non-IL-10-producing B cells with the exception of CD27 expression on CpG-stimulated cells (Figure
11 C). Single molecule surface expressions are shown with respect to IL-10+ (red lines) and IL-10- (blue
lines) (Figure 11 D), showing CD27 expression within IL-10+ B cells decreased, however CD10, CD5 and
CD274 (PD-L1) clearly increased in signal intensity amongst IL-10+ B cells compared to IL-10- B cells.
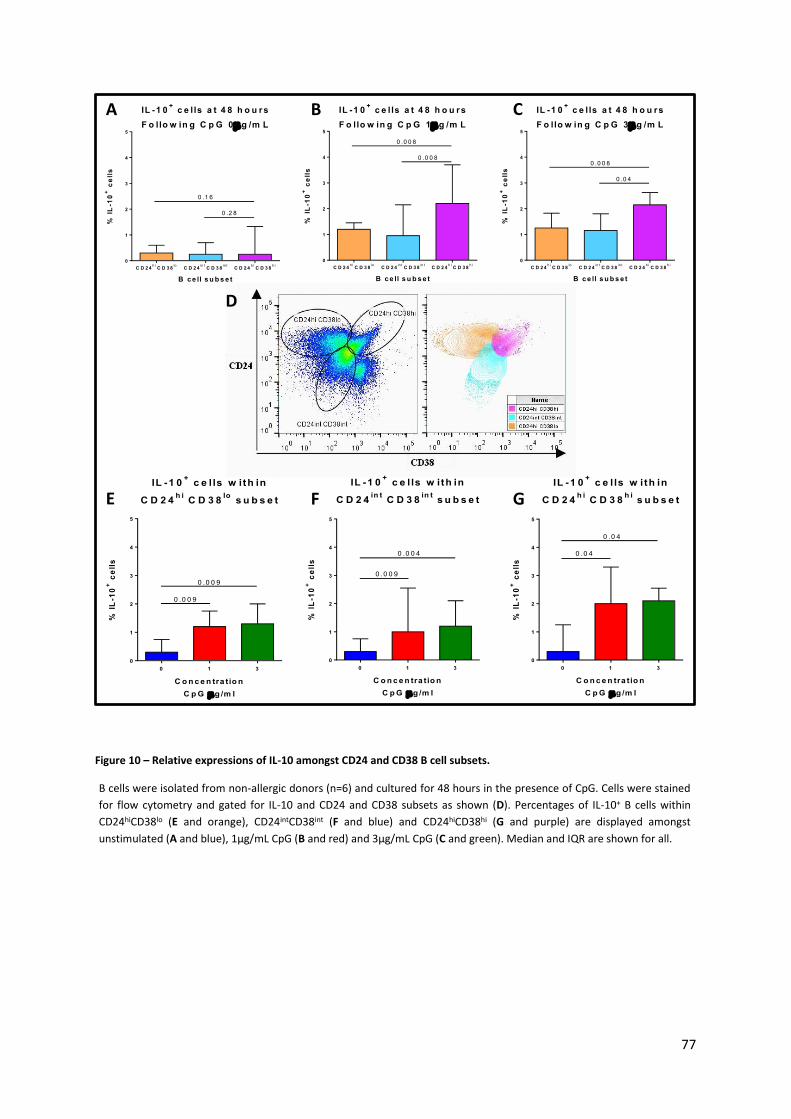
77
IL -1 0+
c e l ls a t 4 8 h o u rs
F o llo w in g C p G 1 g /m L
C D 2 4h i
C D 3 8lo
C D 2 4in t
C D 3 8in t
C D 2 4h i
C D 3 8h i
0
1
2
3
4
5
B c e ll s u b s e t
% I
L-1
0+
ce
lls
0 .0 0 8
0 .0 0 8
IL -1 0+
c e l ls a t 4 8 h o u r s
F o llo w in g C p G 0 g /m L
C D 2 4h i
C D 3 8lo
C D 2 4in t
C D 3 8in t
C D 2 4h i
C D 3 8h i
0
1
2
3
4
5
B c e ll s u b s e t
% I
L-1
0+
ce
lls
0 .1 6
0 .2 8
IL -1 0+
c e l ls a t 4 8 h o u rs
F o llo w in g C p G 3 g /m L
C D 2 4h i
C D 3 8lo
C D 2 4in t
C D 3 8in t
C D 2 4h i
C D 3 8h i
0
1
2
3
4
5
B c e ll s u b s e t
% I
L-1
0+
ce
lls
0 .0 0 8
0 .0 4
IL -1 0+
c e l ls w ith in
C D 2 4h i
C D 3 8lo
s u b s e t
0 1 3
0
1
2
3
4
5
C o n c e n tra tio n
C p G g /m l
% I
L-1
0+
ce
lls
0 .0 0 9
0 .0 0 9
IL -1 0+
c e l ls w ith in
C D 2 4in t
C D 3 8in t
s u b s e t
0 1 3
0
1
2
3
4
5
C o n c e n tra tio n
C p G g /m l
% I
L-1
0+
ce
lls
0 .0 0 9
0 .0 0 4
IL -1 0+
c e l ls w ith in
C D 2 4h i
C D 3 8h i
s u b s e t
0 1 3
0
1
2
3
4
5
C o n c e n tra tio n
C p G g /m l
% I
L-1
0+
ce
lls
0 .0 4
0 .0 4
A B
D
F
C
E
G
A B C
E F G
D
Figure 10 – Relative expressions of IL-10 amongst CD24 and CD38 B cell subsets.
B cells were isolated from non-allergic donors (n=6) and cultured for 48 hours in the presence of CpG. Cells were stained
for flow cytometry and gated for IL-10 and CD24 and CD38 subsets as shown (D). Percentages of IL-10+ B cells within
CD24hiCD38lo (E and orange), CD24intCD38int (F and blue) and CD24hiCD38hi (G and purple) are displayed amongst
unstimulated (A and blue), 1µg/mL CpG (B and red) and 3µg/mL CpG (C and green). Median and IQR are shown for all.
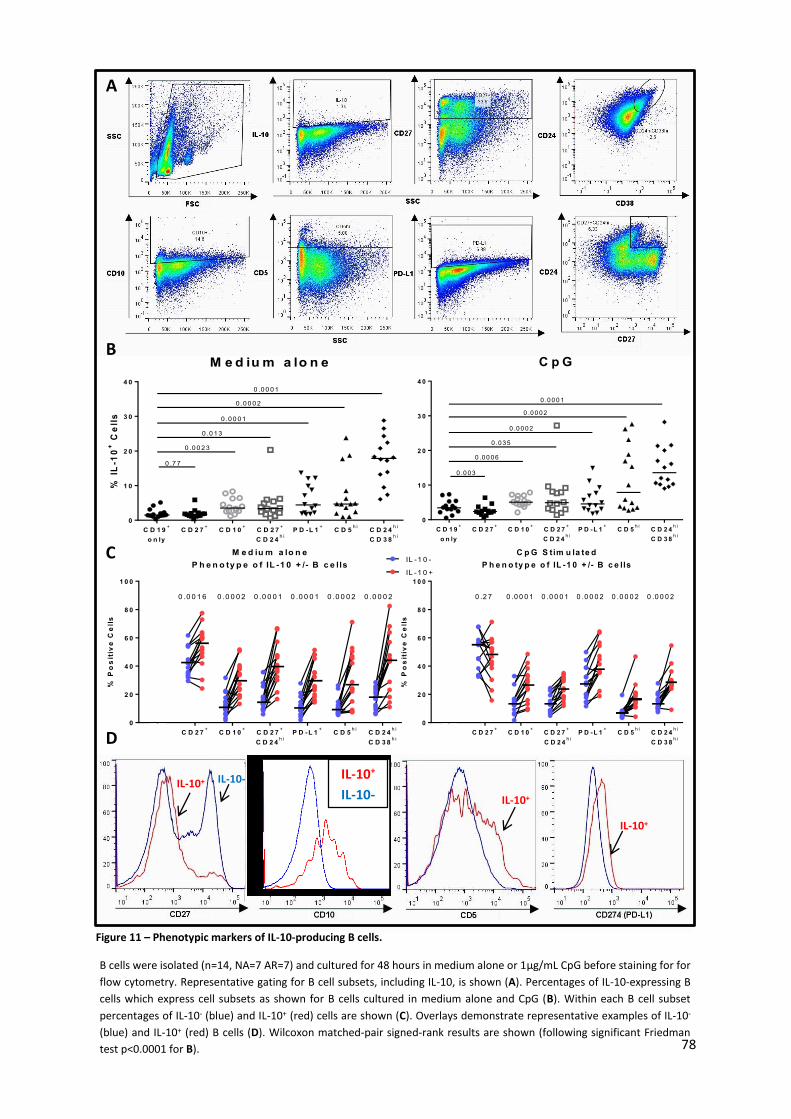
78
M e d iu m a lo n e
P h e n o ty p e o f IL -1 0 + /- B c e lls
% P
os
itiv
e C
ell
s
C D 2 7+
C D 1 0+
C D 2 7+
C D 2 4h i
P D -L 1+
C D 5h i
C D 2 4h i
C D 3 8h i
0
2 0
4 0
6 0
8 0
1 0 0
0 .0 0 1 6 0 .0 0 0 2 0 .0 0 0 1 0 .0 0 0 1 0 .0 0 0 2 0 .0 0 0 2
IL -1 0 -
IL -1 0 +
M e d iu m a lo n e
% I
L-1
0+
Ce
lls
C D 1 9+
o n ly
C D 2 7+
C D 1 0+
C D 2 7+
C D 2 4h i
P D -L 1+
C D 5h i
C D 2 4h i
C D 3 8h i
0
1 0
2 0
3 0
4 0
0 .77
0 .00 23
0 .013
0 .00 01
0 .00 02
0 .00 01
C p G
C D 1 9+
o n ly
C D 2 7+
C D 1 0+
C D 2 7+
C D 2 4h i
P D -L 1+
C D 5h i
C D 2 4h i
C D 3 8h i
0
1 0
2 0
3 0
4 0
0 .003
0 .00 06
0 .035
0 .00 02
0 .00 02
0 .00 01
C p G S tim u la te d
P h e n o ty p e o f IL -1 0 + /- B c e lls
% P
os
itiv
e C
ell
s
C D 2 7+
C D 1 0+
C D 2 7+
C D 2 4
h i
P D -L 1+
C D 5h i
C D 2 4h i
C D 3 8h i
0
2 0
4 0
6 0
8 0
1 0 0
0 .2 7 0 .0 0 0 1 0 .0 0 0 1 0 .0 0 0 2 0 .0 0 0 2 0 .0 0 0 2
IL-10+
IL-10+
IL-
10-
IL-10+ IL-10+
IL-10-
A
B
C
D
Figure 11 – Phenotypic markers of IL-10-producing B cells.
B cells were isolated (n=14, NA=7 AR=7) and cultured for 48 hours in medium alone or 1µg/mL CpG before staining for for
flow cytometry. Representative gating for B cell subsets, including IL-10, is shown (A). Percentages of IL-10-expressing B
cells which express cell subsets as shown for B cells cultured in medium alone and CpG (B). Within each B cell subset
percentages of IL-10- (blue) and IL-10+ (red) cells are shown (C). Overlays demonstrate representative examples of IL-10-
(blue) and IL-10+ (red) B cells (D). Wilcoxon matched-pair signed-rank results are shown (following significant Friedman
test p<0.0001 for B). r 1µg/mL CpG. Cells were further stimulated with PMA and Ionomycin in the context of Brefeldin A
IL-10+
IL-10+
IL-10-
79
Whole blood ex vivo staining was carried out within 2 hours of phlebotomy and proportions of B cell
subsets were compared with matched 48 hour CpG stimulated (Figure 12 – right hand panels) or un-
stimulated (Figure 12 – left hand panels) proportions of IL-10-producing B cells within PBMC culture.
All comparisons showed greater correlation between phenotype ex vivo and proportions of IL-10-
producing B cells following CpG stimulation compared to medium alone. These show greater
proportions of IL-10-producing B cells after culture correlated with greater proportions of CD27
expressing B cells prior to culture both in medium and CpG (Figure 12 A and B). CD10 expression
showed no correlation with subsequent proportions of IL-10-producing B cells following culture
(Figure 12 C and D). CD24hiCD27+ B cells showed a significant positive correlation with respect to
proportions of IL-10-producing B cells (Figure 12 E and F). Expression of PD-L1 showed a strong trend
towards correlation with medium cultured IL-10+ B cells and significant correlation with CpG culture
(p=0.056 and p=0.019 respectively) (Figure 12 G and H). CD5+ B cells prior to culture correlated
significantly with subsequent proportions of IL-10+ B cells in both medium and CpG culture (Figure 12
I and J). There was an inverse correlation observed between the proportions of CD24hiCD38hi B cells
ex vivo and the proportions of IL-10-producing B cells in vitro (p=0.0007 and p=0.0004 for cells cultured
in medium and CpG respectively) (Figure 12 K and L).
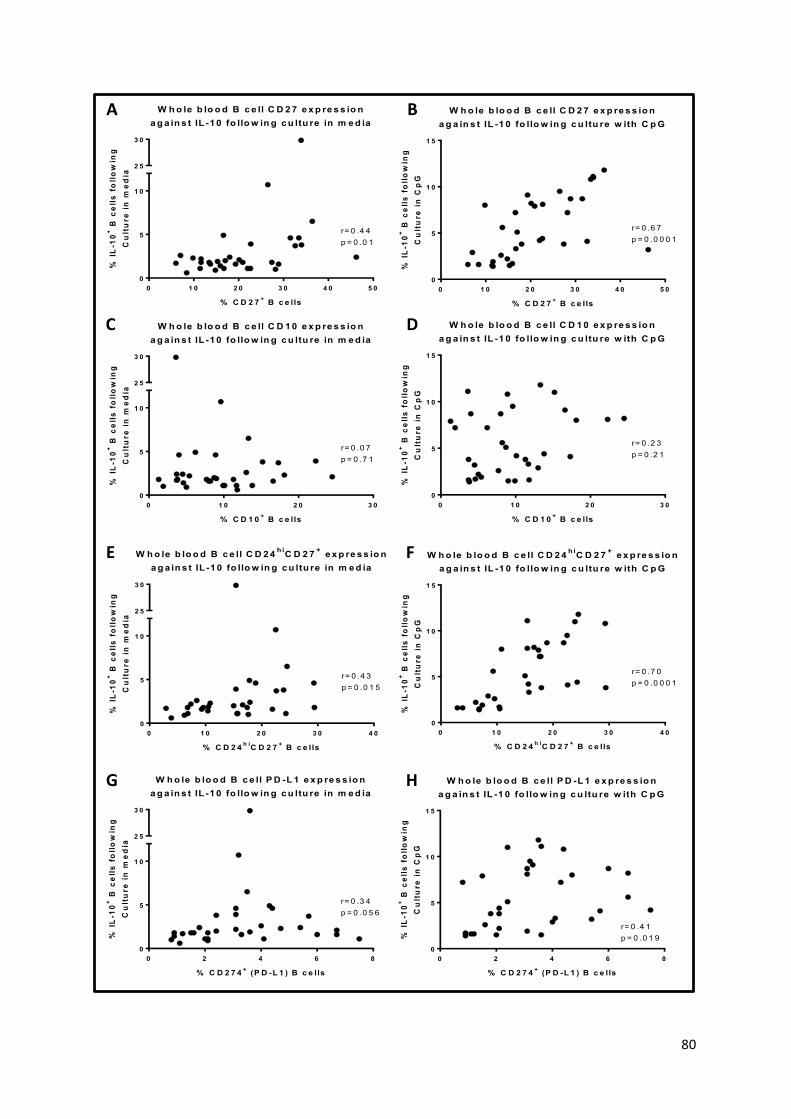
80
W h o le b lo o d B c e ll C D 2 7 e x p re s s io n
a g a in s t IL -1 0 fo llo w in g c u ltu re in m e d ia
% C D 2 7+ B c e lls
% I
L-1
0+ B
ce
lls
fo
llo
win
g
Cu
ltu
re
in
me
dia
0 1 0 2 0 3 0 4 0 5 0
0
5
1 0
2 5
3 0
r= 0 .4 4
p = 0 .0 1
W h o le b lo o d B c e ll C D 2 7 e x p re s s io n
a g a in s t IL -1 0 fo llo w in g c u ltu re w ith C p G
% C D 2 7+ B c e lls
% I
L-1
0+ B
ce
lls
fo
llo
win
g
Cu
ltu
re
in
Cp
G
0 1 0 2 0 3 0 4 0 5 0
0
5
1 0
1 5
r= 0 .6 7
p = 0 .0 0 0 1
W h o le b lo o d B c e ll C D 1 0 e x p re s s io n
a g a in s t IL -1 0 fo llo w in g c u ltu re in m e d ia
% C D 1 0+ B c e lls
% I
L-1
0+ B
ce
lls
fo
llo
win
g
Cu
ltu
re
in
me
dia
0 1 0 2 0 3 0
0
5
1 0
2 5
3 0
r= 0 .0 7
p = 0 .7 1
W h o le b lo o d B c e ll C D 1 0 e x p re s s io n
a g a in s t IL -1 0 fo llo w in g c u ltu re w ith C p G
% C D 1 0+ B c e lls
% I
L-1
0+ B
ce
lls
fo
llo
win
g
Cu
ltu
re
in
Cp
G
0 1 0 2 0 3 0
0
5
1 0
1 5
r= 0 .2 3
p = 0 .2 1
W h o le b lo o d B c e ll C D 2 4h i
C D 2 7+
e x p re s s io n
a g a in s t IL -1 0 fo llo w in g c u ltu re in m e d ia
% C D 2 4h i
C D 2 7+ B c e lls
% I
L-1
0+ B
ce
lls
fo
llo
win
g
Cu
ltu
re
in
me
dia
0 1 0 2 0 3 0 4 0
0
5
1 0
2 5
3 0
r= 0 .4 3
p = 0 .0 1 5
W h o le b lo o d B c e ll C D 2 4h i
C D 2 7+
e x p re s s io n
a g a in s t IL -1 0 fo llo w in g c u ltu re w ith C p G
% C D 2 4h i
C D 2 7+ B c e lls
% I
L-1
0+ B
ce
lls
fo
llo
win
g
Cu
ltu
re
in
Cp
G
0 1 0 2 0 3 0 4 0
0
5
1 0
1 5
r= 0 .7 0
p = 0 .0 0 0 1
W h o le b lo o d B c e ll P D -L 1 e x p re s s io n
a g a in s t IL -1 0 fo llo w in g c u ltu re in m e d ia
% C D 2 7 4+ (P D -L 1 ) B c e lls
% I
L-1
0+ B
ce
lls
fo
llo
win
g
Cu
ltu
re
in
me
dia
0 2 4 6 8
0
5
1 0
2 5
3 0
r= 0 .3 4
p = 0 .0 5 6
W h o le b lo o d B c e ll P D -L 1 e x p re s s io n
a g a in s t IL -1 0 fo llo w in g c u ltu re w ith C p G
% C D 2 7 4+ (P D -L 1 ) B c e lls
% I
L-1
0+ B
ce
lls
fo
llo
win
g
Cu
ltu
re
in
Cp
G
0 2 4 6 8
0
5
1 0
1 5
r= 0 .4 1
p = 0 .0 1 9
C D
F E
H G
A B
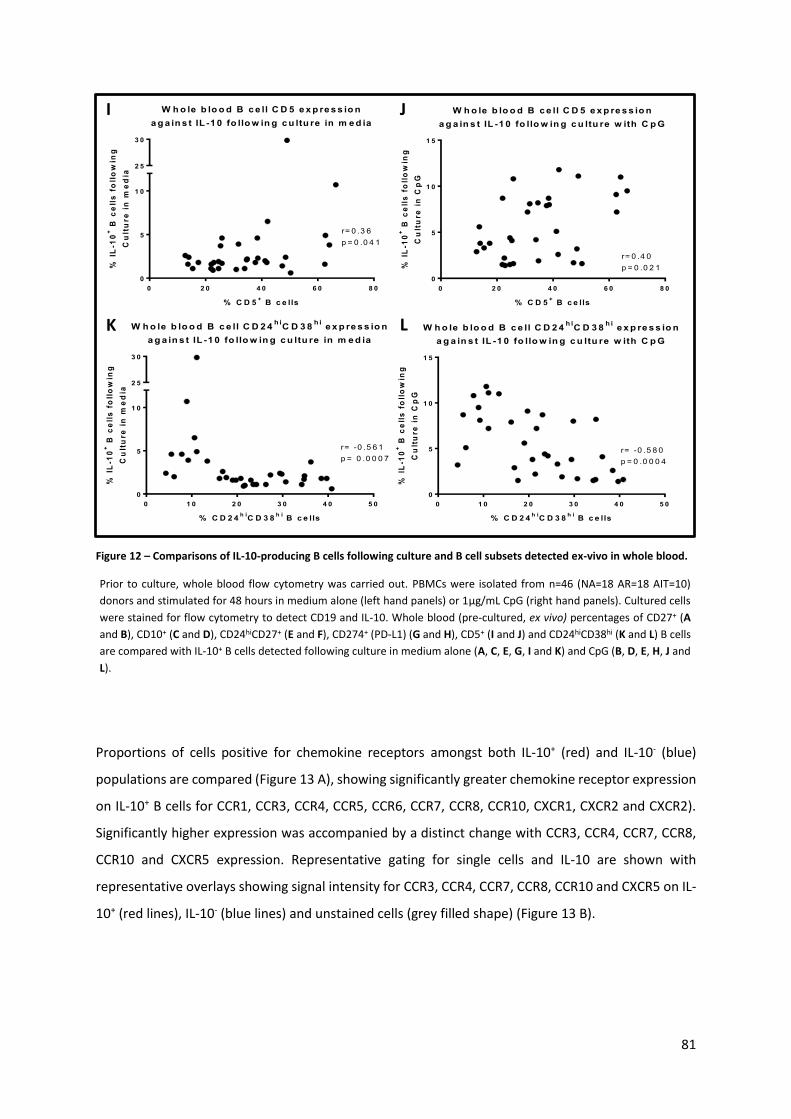
81
Proportions of cells positive for chemokine receptors amongst both IL-10+ (red) and IL-10- (blue)
populations are compared (Figure 13 A), showing significantly greater chemokine receptor expression
on IL-10+ B cells for CCR1, CCR3, CCR4, CCR5, CCR6, CCR7, CCR8, CCR10, CXCR1, CXCR2 and CXCR2).
Significantly higher expression was accompanied by a distinct change with CCR3, CCR4, CCR7, CCR8,
CCR10 and CXCR5 expression. Representative gating for single cells and IL-10 are shown with
representative overlays showing signal intensity for CCR3, CCR4, CCR7, CCR8, CCR10 and CXCR5 on IL-
10+ (red lines), IL-10- (blue lines) and unstained cells (grey filled shape) (Figure 13 B).
W h o le b lo o d B c e ll C D 5 e x p re s s io n
a g a in s t IL -1 0 fo llo w in g c u ltu re in m e d ia
% C D 5+ B c e lls
% I
L-1
0+ B
ce
lls
fo
llo
win
g
Cu
ltu
re
in
me
dia
0 2 0 4 0 6 0 8 0
0
5
1 0
2 5
3 0
r= 0 .3 6
p = 0 .0 4 1
W h o le b lo o d B c e ll C D 5 e x p re s s io n
a g a in s t IL -1 0 fo llo w in g c u ltu re w ith C p G
% C D 5+ B c e lls
% I
L-1
0+ B
ce
lls
fo
llo
win
g
Cu
ltu
re
in
Cp
G
0 2 0 4 0 6 0 8 0
0
5
1 0
1 5
r= 0 .4 0
p = 0 .0 2 1
W h o le b lo o d B c e ll C D 2 4h i
C D 3 8h i
e x p re s s io n
a g a in s t IL -1 0 fo llo w in g c u ltu re in m e d ia
% C D 2 4h i
C D 3 8h i
B c e lls
% I
L-1
0+ B
ce
lls
fo
llo
win
g
Cu
ltu
re
in
me
dia
0 1 0 2 0 3 0 4 0 5 0
0
5
1 0
2 5
3 0
r= -0 .5 6 1
p = 0 .0 0 0 7
W h o le b lo o d B c e ll C D 2 4h i
C D 3 8h i
e x p re s s io n
a g a in s t IL -1 0 fo llo w in g c u ltu re w ith C p G
% C D 2 4h i
C D 3 8h i
B c e lls
% I
L-1
0+ B
ce
lls
fo
llo
win
g
Cu
ltu
re i
n C
pG
0 1 0 2 0 3 0 4 0 5 0
0
5
1 0
1 5
r= -0 .5 8 0
p = 0 .0 0 0 4
J I
L K
Figure 12 – Comparisons of IL-10-producing B cells following culture and B cell subsets detected ex-vivo in whole blood.
Prior to culture, whole blood flow cytometry was carried out. PBMCs were isolated from n=46 (NA=18 AR=18 AIT=10)
donors and stimulated for 48 hours in medium alone (left hand panels) or 1µg/mL CpG (right hand panels). Cultured cells
were stained for flow cytometry to detect CD19 and IL-10. Whole blood (pre-cultured, ex vivo) percentages of CD27+ (A
and B), CD10+ (C and D), CD24hiCD27+ (E and F), CD274+ (PD-L1) (G and H), CD5+ (I and J) and CD24hiCD38hi (K and L) B cells
are compared with IL-10+ B cells detected following culture in medium alone (A, C, E, G, I and K) and CpG (B, D, E, H, J and
L).

82
C h e m o k in e re c e p to r -e x p re s s in g B c e lls%
Po
sit
ive
Ce
lls
C C R 1 C C R 2 C C R 3 C C R 4 C C R 5 C C R 6 C C R 7 C C R 8 C C R 9 C C R 1 0 C X C R 1 C X C R 2 C X C R 3 C X C R 4 C X C R 5
0
2 0
4 0
6 0
8 0
1 0 0
IL -1 0 -
0 .0 3 1
0 .0 3 1 0 .0 3 1
0 .0 3 1
0 .0 3 1
0 .0 6 3
0 .0 3 1
0 .0 3 1 0 .1 6
0 .0 3 1
0 .0 3 1 0 .0 3 1 0 .3 1 0 .2 2
0 .0 3 1
IL -1 0 +
IL-10-
IL-10+
A
Figure 13 – Chemokine receptor expression on IL-10-producing B cells.
B cells were isolated (n=6, NA=1 AR=2AIT=3) and cultured for 48 hours in the presence of CpG. Cells were stained for flow
cytometry to detect cell surface chemokine receptor expression as well as intracellular IL-10. Events were gated to exclude
doublets, representative gating is shown (B). Individual chemokine receptors as described were gated against unstained
controls cells. Percentage expression of each receptor is shown for IL-10- (blue) and IL-10+ (red) B cells (A). Wilcoxon
matched-pairs signed-rank test was used, p values are shown.
B Unstained
IL-10 Negative

83
3.2. Regulation of T cell responses
3.2.1. Suppression of polyclonal T cell responses
The proportions of T cells proliferating in co-culture with 48 hour CpG-primed B cells (red) are shown
relative to T cells proliferating with un-primed B cells (blue). Representative gating for proliferation at
day 9 of co-culture illustrates suppression of T cell proliferation with CpG-primed B cells compared to
un-primed B cells (Figure 14 A). Suppression is not observed at days 3 and 6 of co-culture and shows
significant suppression only at day 9, maintained (but not significant) through to day 12 (Figure 14 B).
B cells used in decreasing proportions with respect to T cells, beginning at in equal numbers at 1:1 of
T:B cells decreasing to 32:1, shows significant suppression at 1:1, slightly decreased at 2:1, with and
no suppression observed at 4:1 onwards (Figure 14 C).
T im e c o u rs e o f p o ly c lo n a l C D 4+
T c e ll
p ro life ra t io n w ith c o -c u ltu re a t 1 :1
D a y 3 D a y 6 D a y 9 D a y 1 2
0
5 0
1 0 0
1 5 0
T c e lls + u n -p r im e d B
c e ll c o n tro ls
T c e lls + C p G -p r im e d
B c e lls
% C
D4
+ T
ce
ll P
ro
life
ra
tio
n
no
rm
ali
se
d t
o B
ce
ll c
o-c
ult
ure -2 8 .1 %
-4 .8 %
3 0 .6 %3 4 .6 %
0 .0 2 3
P o ly c lo n a l C D 4+
T c e ll p ro life ra t io n a t d a y 9
w ith d e c re a s in g B c e lls in c o -c u ltu re
1 :1 2 :1 4 :1 8 :1 3 2 :1
0
5 0
1 0 0
2 0 0
3 0 0
4 0 0
% C
D4
+ T
ce
ll P
ro
life
ra
tio
n
no
rm
ali
se
d t
o B
ce
ll c
o-c
ult
ure
3 0 .6 % 3 4 .7 %
1 .6 %
-1 5 .4 % -1 8 0 %
0 .0 2 3 0 .0 6 3
CFSE
CD4
Proliferating Day 9 - 74.0%
Proliferating Day 9 - 45.4%
T cells + CpG-primed B cells T cells + un-primed B cell controls
Figure 14 – Co-culture of CpG-primed B cells with polyclonally stimulated T cells
Percentages of proliferating T cells following polyclonal stimulus in co-culture with un-primed (top left/blue) and CpG-
primed (right/red) B cells were gated as shown (A). T cell proliferation with un-primed B cells is shown as 100%, relative
proliferation of T cells with CpG-primed B cells is shown as a percentage thereof (where <100% indicates reduced
proliferation and vice versa). Proliferation with 1:1 of T:B cells is shown at days 3, 6, 9 and 12 (B). For which Days 3 and 6
n=11 (NA=5 AR=5 AIT=1), at day 9 n=8 (NA=4 AR=3 AIT=1) and at day 12 n=4 (NA=2 AR=1 AIT=1). 9 day co-cultures had
decreasing ratios of B cells used with respect to T cells (ratios show T:B), for both un-primed and CpG-primed B cells (C).
For B cell titration numbers were; 1:1 n=8, 2:1 n=6, 4:1 n=7, 8:1 n=5, 32:1 n=4 and 64:1 n=4. Mean and standard error are
represented with percentage suppression. Wilcoxon matched-pairs signed-rank test was used with paired raw data.
A
B C
84
Proportions of regulatory T cells (gated as CD25hi CD127lo FoxP3+) and Tr1 regulatory T cells (IL-10+ T
cells) were examined by flow cytometry on days 3, 6 and 9, representative gating is shown for day 9
in Figure 15 A. Neither FoxP3+ regulatory T cells (Figure 15 B) nor IL-10+ T cells changed in abundance
over time between the two cultures (Figure 15 D). The relative proportions of T cell populations are
similar despite titration of B cells relative to T cells at day 9 (Figure 15 C and E).
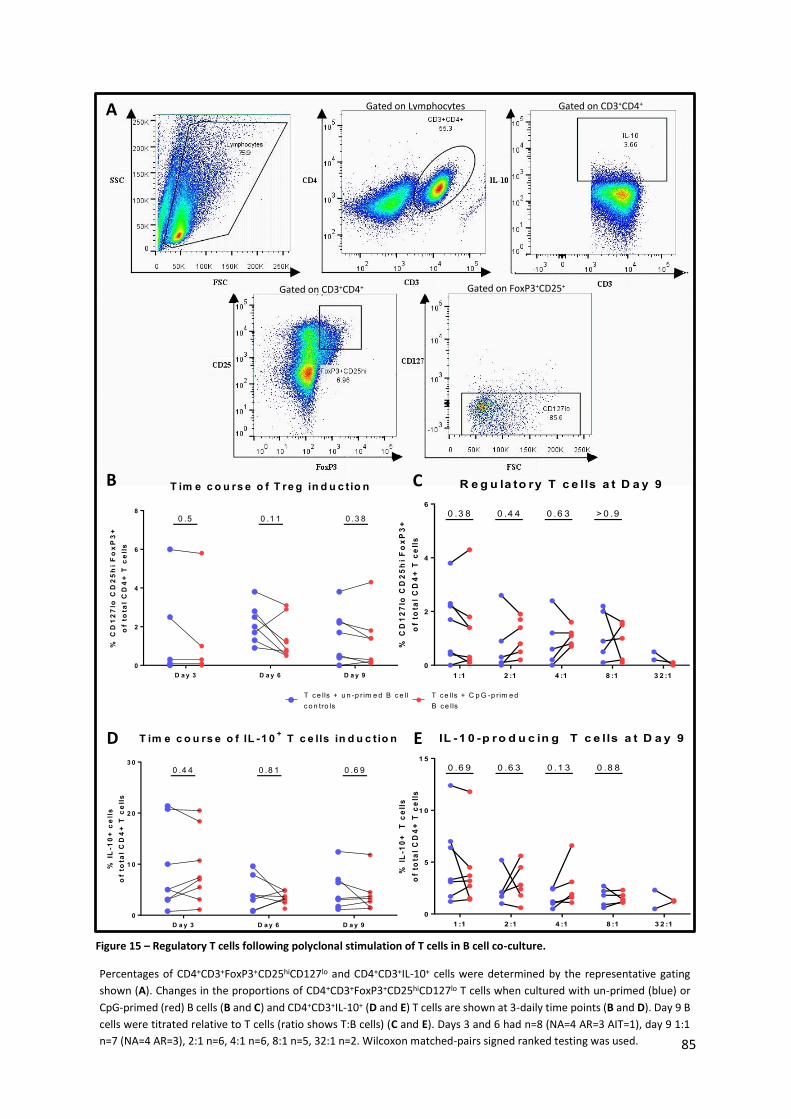
85
Gated on Lymphocytes Gated on CD3+CD4+
Gated on CD3+CD4+ Gated on FoxP3+CD25+
R e g u la to ry T c e lls a t D a y 9
1 :1 2 :1 4 :1 8 :1 3 2 :1
0
2
4
6
% C
D1
27
lo C
D2
5h
i F
ox
P3
+
of
tota
l C
D4
+ T
ce
lls
0 .6 30 .3 8 0 .4 4 > 0 .9
IL -1 0 -p ro d u c in g T c e lls a t D a y 9
1 :1 2 :1 4 :1 8 :1 3 2 :1
0
5
1 0
1 5
% I
L-1
0+
T
ce
lls
of
tota
l C
D4
+ T
ce
lls
0 .1 30 .6 9 0 .6 3 0 .8 8
T im e c o u rs e o f T re g in d u c t io n
D a y 3 D a y 6 D a y 9
0
2
4
6
8
% C
D1
27
lo C
D2
5h
i F
ox
P3
+
of
tota
l C
D4
+ T
ce
lls
0 .1 1 0 .3 8
T c e lls + u n -p r im e d B c e ll
c o n tro ls
0 .5
T c e lls + C p G -p r im e d
B c e lls
T im e c o u rs e o f IL -1 0+
T c e lls in d u c t io n
D a y 3 D a y 6 D a y 9
0
1 0
2 0
3 0
% I
L-1
0+
ce
lls
of
tota
l C
D4
+ T
ce
lls
0 .8 1 0 .6 90 .4 4
B C
D E
Figure 15 – Regulatory T cells following polyclonal stimulation of T cells in B cell co-culture.
Percentages of CD4+CD3+FoxP3+CD25hiCD127lo and CD4+CD3+IL-10+ cells were determined by the representative gating
shown (A). Changes in the proportions of CD4+CD3+FoxP3+CD25hiCD127lo T cells when cultured with un-primed (blue) or
CpG-primed (red) B cells (B and C) and CD4+CD3+IL-10+ (D and E) T cells are shown at 3-daily time points (B and D). Day 9 B
cells were titrated relative to T cells (ratio shows T:B cells) (C and E). Days 3 and 6 had n=8 (NA=4 AR=3 AIT=1), day 9 1:1
n=7 (NA=4 AR=3), 2:1 n=6, 4:1 n=6, 8:1 n=5, 32:1 n=2. Wilcoxon matched-pairs signed ranked testing was used.
A

86
At day 9 of T and B cell co-cultures (with T and B cells in equal proportion) relative expression of IL-
10 mRNA is significantly greater in co-cultures with CpG-primed compared with un-primed B cells
(Figure 16 A). There is a notable trend towards reduced relative expression of GATA-3 mRNA with
CpG-primed B cells. Supernatant cytokine concentrations were analysed by 42plex ELISA, the full
data set is shown in the appendix (
Appendix Table 2). These protein concentrations showed a non-significant trend towards greater IL-
10 concentrations (p=0.08) and significantly lower concentrations of IL-2, IFNγ, IL-6, IL-4, IL-5, IL-9
and IL-13 (Figure 16 B).
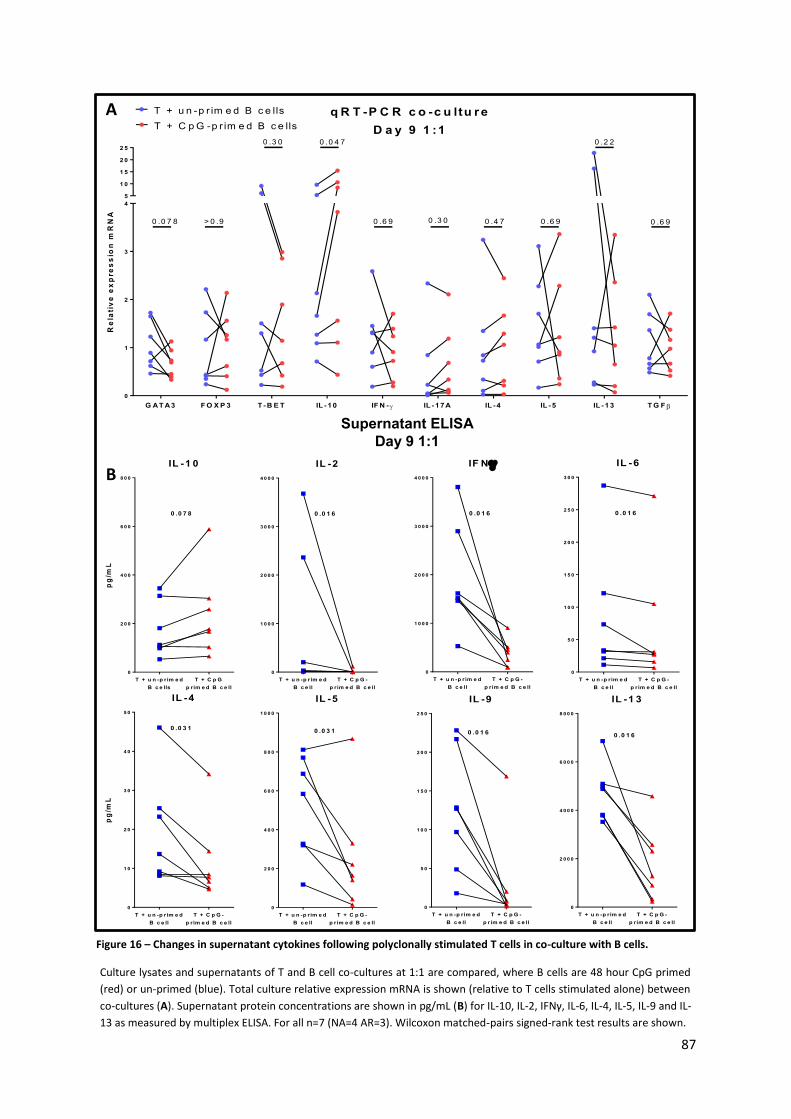
87
q R T -P C R c o -c u ltu r e
D a y 9 1 :1
G AT A3 F O X P 3 T -B E T IL -10 IF N - IL -17A IL -4 IL -5 IL -13 T G F
0
1
2
3
4
5
1 0
1 5
2 0
2 5
Re
lati
ve
ex
pre
ss
ion
mR
NA
0 .0 7 8 > 0 .9
0 .3 0 0 .0 4 7
0 .6 9 0 .3 0 0 .4 7 0 .6 9
0 .2 2
0 .6 9
T + u n -p r im e d B c e lls
T + C p G -p r im e d B c e lls
IL -2
T + u n -p r im e d
B c e ll
T + C p G -
p rim e d B c e ll
0
1 0 0 0
2 0 0 0
3 0 0 0
4 0 0 0
0 .0 1 6
IF N
T + u n -p r im e d
B c e ll
T + C p G -
p rim e d B c e ll
0
1 0 0 0
2 0 0 0
3 0 0 0
4 0 0 0
0 .0 1 6
IL -6
T + u n -p r im e d
B c e ll
T + C p G -
p rim e d B c e ll
0
5 0
1 0 0
1 5 0
2 0 0
2 5 0
3 0 0
0 .0 1 6
IL -1 0
pg
/mL
T + u n -p r im e d
B c e lls
T + C p G
p rim e d B c e ll
0
2 0 0
4 0 0
6 0 0
8 0 0
0 .0 7 8
IL -4
pg
/mL
T + u n -p r im e d
B c e ll
T + C p G -
p rim e d B c e ll
0
1 0
2 0
3 0
4 0
5 0
0 .0 3 1
IL -5
T + u n -p r im e d
B c e ll
T + C p G -
p rim e d B c e ll
0
2 0 0
4 0 0
6 0 0
8 0 0
1 0 0 0
0 .0 3 1
IL -9
T + u n -p r im e d
B c e ll
T + C p G -
p rim e d B c e ll
0
5 0
1 0 0
1 5 0
2 0 0
2 5 0
0 .0 1 6
IL -1 3
T + u n -p r im e d
B c e ll
T + C p G -
p rim e d B c e ll
0
2 0 0 0
4 0 0 0
6 0 0 0
8 0 0 0
0 .0 1 6
A
B
Figure 16 – Changes in supernatant cytokines following polyclonally stimulated T cells in co-culture with B cells.
Culture lysates and supernatants of T and B cell co-cultures at 1:1 are compared, where B cells are 48 hour CpG primed
(red) or un-primed (blue). Total culture relative expression mRNA is shown (relative to T cells stimulated alone) between
co-cultures (A). Supernatant protein concentrations are shown in pg/mL (B) for IL-10, IL-2, IFNγ, IL-6, IL-4, IL-5, IL-9 and IL-
13 as measured by multiplex ELISA. For all n=7 (NA=4 AR=3). Wilcoxon matched-pairs signed-rank test results are shown.
Supernatant ELISA
Day 9 1:1
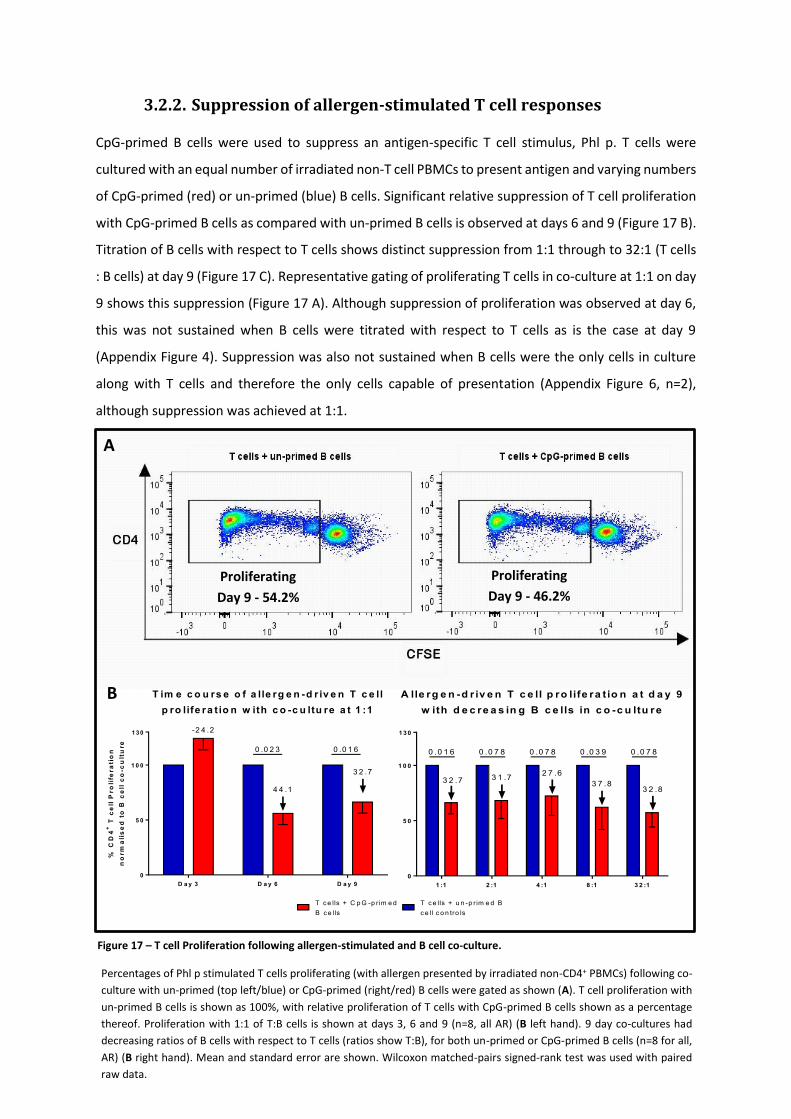
88
3.2.2. Suppression of allergen-stimulated T cell responses
CpG-primed B cells were used to suppress an antigen-specific T cell stimulus, Phl p. T cells were
cultured with an equal number of irradiated non-T cell PBMCs to present antigen and varying numbers
of CpG-primed (red) or un-primed (blue) B cells. Significant relative suppression of T cell proliferation
with CpG-primed B cells as compared with un-primed B cells is observed at days 6 and 9 (Figure 17 B).
Titration of B cells with respect to T cells shows distinct suppression from 1:1 through to 32:1 (T cells
: B cells) at day 9 (Figure 17 C). Representative gating of proliferating T cells in co-culture at 1:1 on day
9 shows this suppression (Figure 17 A). Although suppression of proliferation was observed at day 6,
this was not sustained when B cells were titrated with respect to T cells as is the case at day 9
(Appendix Figure 4). Suppression was also not sustained when B cells were the only cells in culture
along with T cells and therefore the only cells capable of presentation (Appendix Figure 6, n=2),
although suppression was achieved at 1:1.
T im e c o u rs e o f a lle rg e n -d r iv e n T c e ll
p ro life ra t io n w ith c o -c u ltu re a t 1 :1
D a y 3 D a y 6 D a y 9
0
5 0
1 0 0
T c e lls + u n -p r im e d B
c e ll c o n tro ls
T c e lls + C p G -p r im e d
B c e lls
% C
D4
+ T
ce
ll P
ro
life
ra
tio
n
no
rm
ali
se
d t
o B
ce
ll c
o-c
ult
ure
4 4 .1
130
3 2 .7
-2 4 .2
0 .0 2 3 0 .0 1 6
A lle rg e n -d r iv e n T c e ll p ro life ra t io n a t d a y 9
w ith d e c re a s in g B c e lls in c o -c u ltu re
1 :1 2 :1 4 :1 8 :1 3 2 :1
0
5 0
1 0 0
3 2 .7 3 1 .7
130
2 7 .6
3 7 .83 2 .8
0 .0 1 6 0 .0 7 8 0 .0 7 8 0 .0 3 9 0 .0 7 8
A
Figure 17 – T cell Proliferation following allergen-stimulated and B cell co-culture.
Percentages of Phl p stimulated T cells proliferating (with allergen presented by irradiated non-CD4+ PBMCs) following co-
culture with un-primed (top left/blue) or CpG-primed (right/red) B cells were gated as shown (A). T cell proliferation with
un-primed B cells is shown as 100%, with relative proliferation of T cells with CpG-primed B cells shown as a percentage
thereof. Proliferation with 1:1 of T:B cells is shown at days 3, 6 and 9 (n=8, all AR) (B left hand). 9 day co-cultures had
decreasing ratios of B cells with respect to T cells (ratios show T:B), for both un-primed or CpG-primed B cells (n=8 for all,
AR) (B right hand). Mean and standard error are shown. Wilcoxon matched-pairs signed-rank test was used with paired
raw data.
Proliferating
Day 9 - 54.2%
Proliferating
Day 9 - 46.2%
B

89
Regulatory T cells (CD4+CD25hiFoxP3+) were stained and gated as shown in Figure 18 A. Proportions of
regulatory T cells were significantly fewer in the presence CpG-primed B cells compared to un-primed
B cells in equal proportions (1:1) at days 6 and 9 (Figure 18 B). No change in the proportions of
regulatory T cells was observed between co-cultures when B cells were titrated relative to T cells
(Figure 18 C). T cell CD25 MFI was significantly lower amongst CpG-primed B cell co-cultures at day 6
and trended towards significance at day 9 (Figure 18 D), whilst trending towards decrease throughout
titration of B cells relative to T cells (Figure 18 E).

90
R e g u la to ry T c e lls a t D a y 9
1 :1 2 :1 4 :1 8 :1 3 2 :1
0
5
1 0
1 5
% C
D2
5h
i F
ox
P3
+
of
tota
l C
D4
+ T
ce
lls
0 .6 30 .3 8 0 .6 3 > 0 .9 0 .1 3
T im e c o u rs e o f T re g in d u c t io n
D a y 3 D a y 6 D a y 9
0
5
1 0
1 5
% C
D2
5h
i F
ox
P3
+
of
tota
l C
D4
+ T
ce
lls
0 .0 3 1 0 .0 4 8
T c e lls + u n -p r im e d B c e ll
c o n tro ls
T c e lls +
C p G -p rim e d B c e lls
0 .8 8
A
B C
Figure 18 - Tregs following allergen-stimulated and B cell co-culture.
T cells were co-cultured with equal numbers of irradiated non-CD4+ PBMCs and Phl P along with B cells which had been
either un-primed (blue) or CpG-primed (red). At days 3 (n=4), 6 (n=7) and 9 (n=10) CD4+ CD25hi FoxP3+ were gated as shown
(A) and percentages represented in (B). At day 9 B cells were titrated relative to T cells (T:B ratios are shown) (C). CD25 MFI
is assessed amongst CD4+ T cells across co-cultures during days 3, 6 and 9 (D) and with B cell titration (E).
D a y 9 T c e ll C D 2 5 M F I
1 :1 2 :1 4 :1 8 :1 3 2 :1
0
1 0 0 0
2 0 0 0
3 0 0 0
4 0 0 0
CD
25
Me
dia
n F
luo
re
sc
en
ce
In
ten
sit
y
T im e c o u rs e o f T c e ll C D 2 5 M F I
D a y 3 D a y 6 D a y 9
0
1 0 0 0
2 0 0 0
3 0 0 0
4 0 0 0
5 0 0 0
CD
25
Me
dia
n F
luo
re
sc
en
ce
In
te
ns
ity
0 .0 1 6 0 .0 8 4> 0 .9
D E
91
Total co-culture mRNA assessed for IL-10 and IL-17A shows a significantly greater relative increase in
CpG-primed compared to un-primed B cell co-cultures (Figure 19 A). None of GATA3, FOXP3, T-BET,
IFNγ, IL-4, IL-6 IL-13 and TGFβ mRNA had significantly different relative expression in co-cultures with
CpG-primed or un-primed B cells. Supernatant were analysed by 25plex ELISA, the complete data set
is shown in the appendix (Appendix Table 3). Significantly greater IL-10 (not IL-17A) protein
concentration was found in co-cultures with CpG-primed B cells as compared with un-primed B cells
(Figure 19 B). Supernatant concentrations of IL-2, IFNγ, IL-12p70, IL-4, IL-5, IL-9 and IL-13 all
significantly decreased in CpG-primed compared to un-primed B cell co-cultures (Figure 19 B).

92
q R T -P C R c o -c u ltu r e
D a y 9 1 :1
G AT A3 F O X P 3 T -B E T IL -10 IF N -G IL -17A IL -4 IL -5 IL -13 T G F b
0
2
4
1 0
1 5
2 0
2 5
Re
lati
ve
ex
pre
ss
ion
mR
NA
0 .7 4 0 .7 4 0 .5 5 0 .0 0 8
0 .9 5 0 .0 2 0 .2 5 0 .4 6 0 .7 4 0 .1 5
T + u n -p r im e d B c e lls
T + C p G -p r im e d B c e lls
IL -2
pg
/mL
T + u n -p r im e d
B c e ll
T + C p G -
p rim e d B c e ll
0
1 0 0
2 0 0
3 0 0
4 0 0
5 0 0
0 .0 0 3
IF N
T + u n -p r im e d
B c e ll
T + C p G -
p rim e d B c e ll
0
2 0 0 0
4 0 0 0
6 0 0 0
0 .0 0 0 1
IL -6
T + u n -p r im e d
B c e ll
T + C p G -
p rim e d B c e ll
0
1 0 0
2 0 0
3 0 0
2 0 0 0
4 0 0 0
0 .5 6
5 000
IL -1 0
pg
/mL
T + u n -p r im e d
B c e ll
T + C p G -
p rim e d B c e ll
0
1 0 0
2 0 0
3 0 0
4 0 0
0 .0 0 9
IL -4
T + u n -p r im e d
B c e ll
T + C p G -
p rim e d B c e ll
0
5 0
1 0 0
1 5 0
2 0 0
2 5 0
0 .0 1 8
IL -5
T + u n -p r im e d
B c e ll
T + C p G -
p rim e d B c e ll
0
5 0 0
1 0 0 0
1 5 0 0
0 .0 0 3
IL -9
T + u n -p r im e d
B c e ll
T + C p G -
p rim e d B c e ll
0
1 0 0
2 0 0
3 0 0
4 0 0
5 0 0
0 .0 1 6
IL -1 3
T + u n -p r im e d
B c e ll
T + C p G -
p rim e d B c e ll
0
5 0 0 0
1 0 0 0 0
1 5 0 0 0
0 .0 0 0 3
IL -1 2 p 7 0
T + u n -p r im e d
B c e ll
T + C p G -
p rim e d B c e ll
0
2
4
6
8
1 0
0 .0 4 3
A
B
Figure 19 – Changes in supernatant cytokines following allergen-stimulated T cells in co-culture with B cells.
T cells were stimulated with Phl P in the presence of un-primed (blue) or CpG-primed (red) B cells. At 9 days supernatants
were removed for ELISA and total co-culture cells lysed for mRNA analysis. Relative expression of mRNA is shown against
that found in T cells stimulated in the absence of B cells (A). ELISA established protein concentrations (B). Wilcoxon
matched-pairs signed-rank test results are shown.
IL -1 7 A
T + u n -p r im e d
B c e ll
T + C p G -
p rim e d B c e ll
0
5 0
1 0 0
2 0 0
2 5 0
3 0 0
3 5 0
4 0 0
0 .4 9
Supernatant ELISA
Day 9 1:1
93
Cell death was assessed with Annexin V and 7AAD. Double negative events are live cells (bottom left
of dot plot), 7AAD- and Annexin V+ identifies pre-apoptotic dying cells (bottom right of dot plot) and
dual positive events are apoptotic cells (top right of dot plot) in the data shown in Figure 20 A (top
centre plot). Gating of these populations is shown for all events and separately for CD4+ events alone
(Figure 20 A - top centre and bottom set, respectively). At day 6 no difference in the proportions of
live, dying or dead cells was observed between any of the culture conditions for either all events or
CD4+ events (Appendix Figure 3), especially comparing un-primed (blue) and CpG-primed (red) B cell
co-cultures. This is also the case at day 9 with respect to B cell co-cultures (Figure 20 D and E),
however there are greater proportions of dead cells amongst T cell conditions in the absence of B
cells; T cells unstimulated (grey) and T cells stimulated (green).
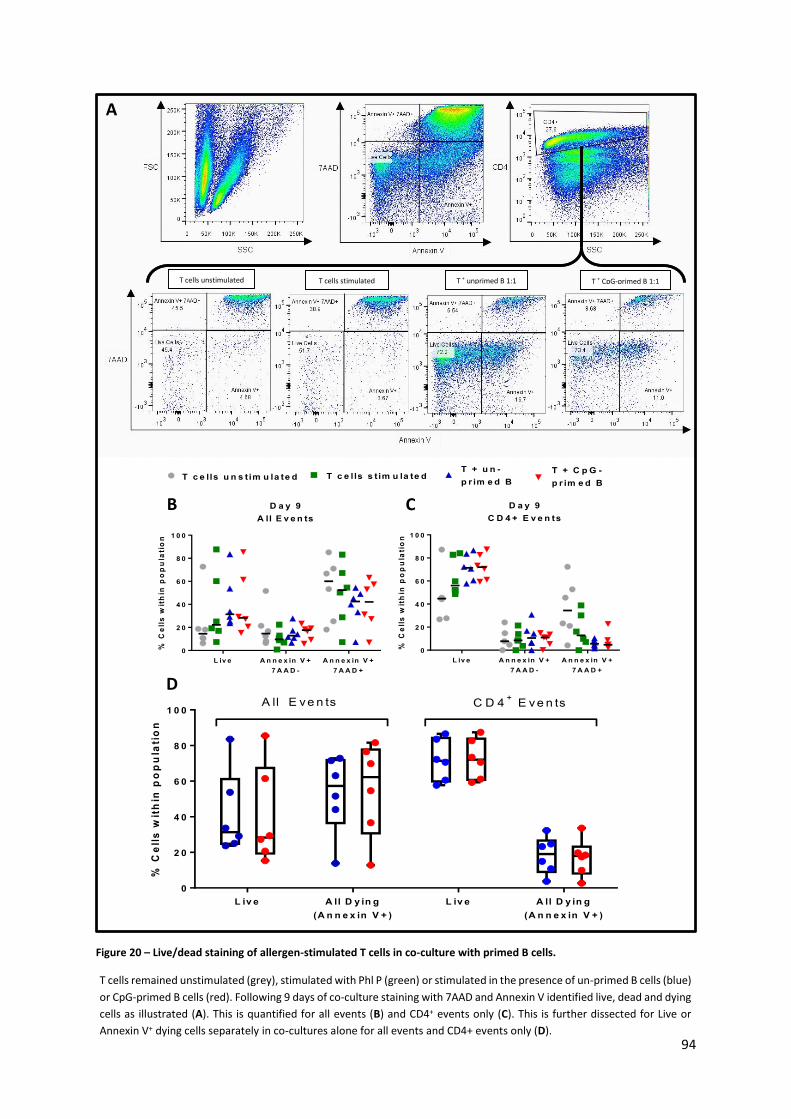
94
T ce lls u n s tim u la te d T ce lls s tim u la te d T + B c e lls 1 :1 T + B re g s 1 :1
D a y 9
A ll E v e n ts
% C
ell
s w
ith
in p
op
ula
tio
n
L iv e A n n e x in V +
7 A A D -
A n n e x in V +
7 A A D +
0
2 0
4 0
6 0
8 0
1 0 0
T c e lls u n s tim u la te d T c e lls s t im u la te dT + u n -
p r im e d B
T + C p G -
p r im e d B
D a y 9
C D 4 + E v e n ts
% C
ell
s w
ith
in p
op
ula
tio
n
L iv e A n n e x in V +
7 A A D -
A n n e x in V +
7 A A D +
0
2 0
4 0
6 0
8 0
1 0 0
% C
ell
s w
ith
in p
op
ula
tio
n
L iv e A ll D y in g
(A n n e x in V + )
L iv e A ll D y in g
(A n n e x in V + )
0
2 0
4 0
6 0
8 0
1 0 0A ll E v e n ts C D 4
+ E v e n ts
Figure 20 – Live/dead staining of allergen-stimulated T cells in co-culture with primed B cells.
T cells remained unstimulated (grey), stimulated with Phl P (green) or stimulated in the presence of un-primed B cells (blue)
or CpG-primed B cells (red). Following 9 days of co-culture staining with 7AAD and Annexin V identified live, dead and dying
cells as illustrated (A). This is quantified for all events (B) and CD4+ events only (C). This is further dissected for Live or
Annexin V+ dying cells separately in co-cultures alone for all events and CD4+ events only (D).
A
B C
D
T + unprimed B 1:1 T + CpG-primed B 1:1 T cells stimulated T cells unstimulated
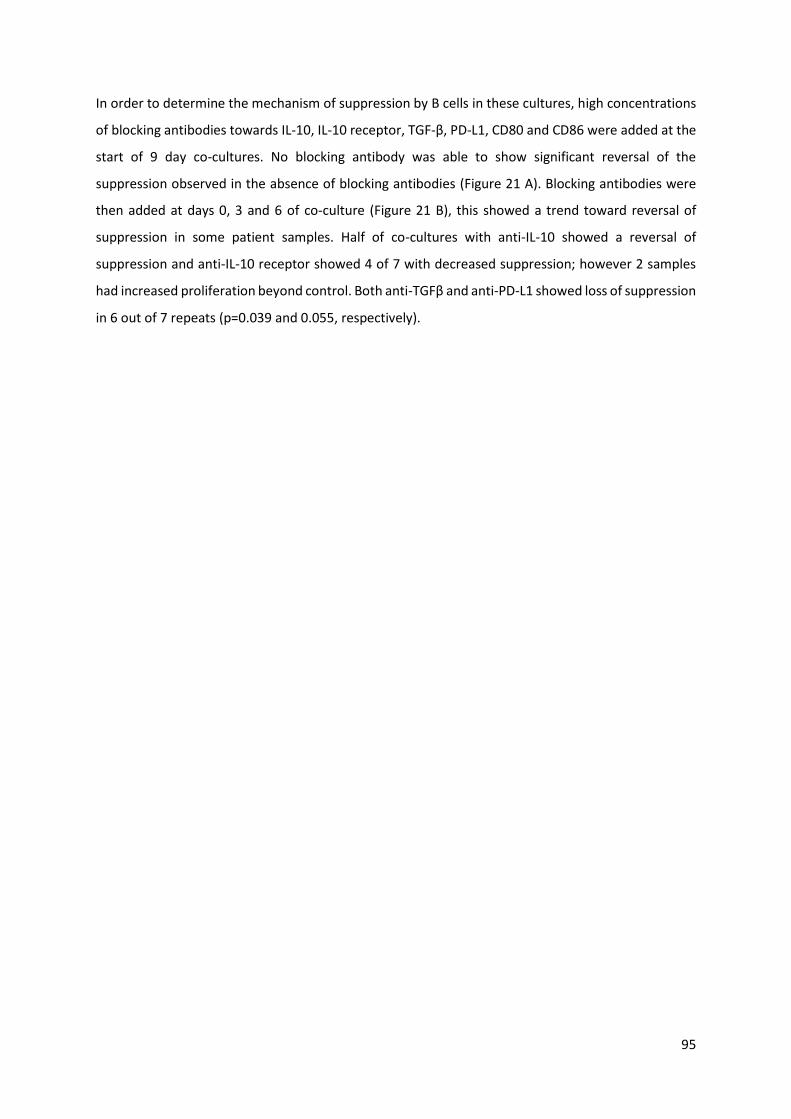
95
In order to determine the mechanism of suppression by B cells in these cultures, high concentrations
of blocking antibodies towards IL-10, IL-10 receptor, TGF-β, PD-L1, CD80 and CD86 were added at the
start of 9 day co-cultures. No blocking antibody was able to show significant reversal of the
suppression observed in the absence of blocking antibodies (Figure 21 A). Blocking antibodies were
then added at days 0, 3 and 6 of co-culture (Figure 21 B), this showed a trend toward reversal of
suppression in some patient samples. Half of co-cultures with anti-IL-10 showed a reversal of
suppression and anti-IL-10 receptor showed 4 of 7 with decreased suppression; however 2 samples
had increased proliferation beyond control. Both anti-TGFβ and anti-PD-L1 showed loss of suppression
in 6 out of 7 repeats (p=0.039 and 0.055, respectively).
96
S u p p re s s io n W ith In h ib ito ry A n tib o d ie s
S in g le D o s e o f A n tib o d ie s
% s
up
pre
ss
ion
of
T c
ell
pro
life
ra
tio
n
N o Ab s a IL -1 0 a IL -1 0 R a T G F b a P D -L 1 a C D 8 0 a C D 8 6
-6 0 0
-4 0 0
-2 0 0
-1 0 0
-5 0
0
5 0
1 0 0
1 5 0
2 0 0
0 .5 4
0 .3 6
0 .5 4
0 .3 6
0 .5 0
0 .7 5
S u p p re s s io n W ith In h ib ito ry A n tib o d ie s
R e p e a te d A d d itio n o f A n tib o d ie s
% S
up
pre
ss
ion
of
T c
ell
pro
life
rati
on
IC a IL -1 0 a IL -1 0 R a T G F b a P D -L 1 N il
-4 5
-3 0
0
1 0
2 0
3 0
4 0
5 0 0.2188
0.2891
0.0391
0.0547
0.8125
-15
-6
A
B
Figure 21 – Allergen stimulated T and B cell co-cultures with the addition of inhibitory antibodies.
Suppression of T cell proliferation is shown; with and without the addition of 5µg/mL of antibodies blocking the cytokine
or receptor shown. Antibodies are added at the start of 9 day co-culture (A) or at days 0, 3 and 6 (B). Percentage
suppression is defined by the percentage less proliferation of Phl P stimulated T cells in the company of CpG-primed B cells
compared with un-primed B cells. Wilcoxon matched-pairs signed-rank test results are shown.
Medium

97
3.3. Discussion
3.3.1. CpG-induced IL-10
In this chapter it was demonstrated that B cells can produce IL-10 which can be further induced by
CpG. Concentrations of 1 and 3 µg/mL of CpG were optimum to increase the proportions of IL-10-
producing B cells, with IL-10 enhanced at 48 hours and beyond. These concentrations are consistent
with published accounts of IL-10-producing B cells, increased following CpG stimulation, following 48
(Bouaziz et al., 2010, Iwata et al., 2011) or 72 hours (Blair et al., 2010, Lemoine et al., 2011, van de
Veen et al., 2013).
3.3.2. LPS and CD40 responses
A dose-dependent induction of IL-10 was not observed following either LPS or CD40 stimulation. This
finding is not in agreement with published data (Iwata et al., 2011, DiLillo et al., 2013, Gantner et al.,
2003, Blair et al., 2010, Lemoine et al., 2011). Both LPS and CD40 stimulation were explored in further
detail at published concentrations, as discussed below.
3.3.2.1. LPS
Isolated B cells do not produce more IL-10 following LPS stimulation, compared to culture in medium
alone, detected by flow cytometry or supernatant ELISA. However, there was a trend of increased IL-
10 amongst PBMC-cultured B cells. For this reason PBMC and isolated B cell cultures were compared.
The proportions of IL-10-producing B cells in both cultures correlated significantly in medium re-
stimulated cells and trended towards significance with CpG (likely due to few repeats) suggesting that
under these conditions other PBMCs do not sufficiently interfere with native B cell IL-10 capacity. Lack
of any correlation in B cell IL-10 capacity following LPS stimulation, however, suggests TLR4 stimulation
of non-B cells may induce IL-10 amongst B cells in the mixed PBMC cultures, which was not otherwise
induced or detected in the isolated B cell cultures. Increased B cell IL-10 potential may be due to other
cells within these cultures bolstering the IL-10-producing capacity of B cells by cell to cell contact or
secreted factors, although this was not tested further here. Indeed human B cells from healthy donors
have been reported to express very low if any levels of TLR4 (Hornung et al., 2002, Ganley-Leal et al.,
2010, Bourke et al., 2003), although TLR4 expression is reported to be increased in vitro following
inflammatory stimuli (such as IL-4, IL-2 and anti-CD40) and amongst Crohn’s disease patients (Ganley-
Leal et al., 2010). Whilst it is clear that mouse B cells certainly express TLR4, it is unclear why LPS is
reported capable of enhancing IL-10 production amongst human B cells (Iwata et al., 2011, DiLillo et
al., 2013). The first of these studies showed PBMCs stimulated with LPS, which may suggest this was
98
a bystander enrichment of IL-10 capacity, whilst the second used isolated B cells. Both identify LPS as
a weaker inducer of IL-10 than CpG.
3.3.2.2. CD40 stimulation
Studies using CpG or LPS as a method of enhancing the proportions of IL-10-competent B cells have
shown further increased proportions of IL-10-producing B cells with the addition of CD40 stimuli
(Gantner et al., 2003, Iwata et al., 2011, Todd et al., 2014). However, in agreement with this thesis,
others have shown the addition of CD40 ligand to show no increase in the proportions of IL-10-
producing B cells (Daien et al., 2014, Bouaziz et al., 2010). These studies have used isolated B cells
predominantly, so this is unlikely an effect on other PBMCs as described with LPS. Some of the studies
successful in inducing IL-10 may be encouraging CD40 cross-linking, which is essential for CD40-
mediated activation (Pound et al., 1999), by the use of CHO-expressing CD40L (Gantner et al., 2003,
Blair et al., 2010) or fibroblast-expressing CD40L cells (Lemoine et al., 2011), given that cellular-
expressed CD40L forms a trimer this may be more biologically relevant. CD40 stimulation may be
more biologically relevant, given the necessity of CD40 co-stimulation for competent humoral
immunity (Quezada et al., 2004). In addition, CD40 has been shown to be relevant to IL-10-producing
B cells since the interesting observation that transgenic over-expression of CD40L in mice
(accompanied by loss of CD22, which negatively regulates CD40 signalling) produces increased
proportions of IL-10-producing B cells (Poe et al., 2011). However, one study that did employ CD40L-
transfected L cells to promote cross linking of CD40 (Bouaziz et al., 2010) was unable to show increased
IL-10.
A clear understanding the role CD40 stimulation is able to play in promoting pan-immunological
tolerance is pertinent due to the development of agonistic monoclonal CD40 therapies currently
seeking approval for the treatment of both solid and circulating cancers (Khong et al., 2012). Murine
data using agonistic anti-CD40 treatment of predisposed autoimmune mice shows expansion of
regulatory B cells, which increased murine survival and abated disease in this model (Blair et al., 2009).
Peculiarly, a clinically trialled anti-CD40 agonist was suggested to have greater T cell priming capacity
in vitro when used with CpG (Carpenter et al., 2009). This study demonstrated significant IL-10 and IL-
6 induction following anti-CD40 and CpG B cell priming. However, T cell co-cultures were carried out
with primed but lethally irradiated B cells, likely incapacitating any B cell regulatory capacity. Whilst
CD40 agonists likely promote anti-tumour B cell activity in an inflammatory microenvironment by
presentation and cytotoxic T cell activation, there may be a risk of Breg induction in
microenvironments with a paucity of inflammatory mediators. Whilst CD40 mAbs may additionally be
able to target oncological B cells for destruction, the use of agonistic CD40 mAbs risks promoting

99
‘regulatory B cell tumours’. Use of CD40 mAbs in the treatment of B cell cancers, such as chronic
lymphocytic leukaemia (CLL) which has been shown to have an increased regulatory B cell potential
(DiLillo et al., 2013), will require further work to fully understand the context within which CD40
stimulators induce either B cell regulators or pro-inflammatory presenters.
3.3.3. Detection of B cell mRNA following CpG stimulation
Interestingly, although both IL-10 and IL-6 mRNA peak at 6 hours following stimulation, IL-10 remains
high through to 72 hours, suggesting consistently enhanced IL-10 gene induction. In comparison, IL-6
mRNA is induced to a greater extent at 6 hours, but declines rapidly and greatly by 72 hours. However,
it is clear from examination of the supernatant cytokine concentrations in the next chapter that IL-6
is strongly expressed, whilst this is discussed in the next chapter (section 4.4.2.3). Induction of IL-6 to
a greater degree than IL-10 may be relevant to the lack of regulatory T cells observed in co-cultures
with primed B cells, as discussed in detail later (section 3.3.7). Despite the presence of IL-6, these
primed B cells were able to mediate T cell suppression.
IL-10Rβ mRNA induction shown here increases from 18 hours through to 72 hours following CpG
stimulation, suggesting autologous IL-10 feedback in CpG-activated B cells. Autocrine action of IL-10
may promote B cell survival (Gary-Gouy et al., 2002) and has been shown to drive plasmablast
generation and later IgM or IgG secretion (Heine et al., 2014), which may feed into the production of
IL-10-producing plasma cells, which have been recently detected (Shen et al., 2014). Interestingly, a
case study of 5 patients with non-EBV large B cell lymphomas shows IL-10 receptor loss of function
mutations as the trigger of this uncontrolled proliferation (Neven et al., 2013), suggesting the integral
role of the IL-10 receptor to human B cells in vivo.
3.3.4. The relevance of CpG-induced IL-10
The purpose of this chapter is to identify B cells capable of IL-10 production by phenotype, but also to
develop a means by which all IL-10 competent B cells can be identified. However, it may be suggested
that CpG is an artificial stimulus, irrelevant in vivo, for this reason it was pertinent to demonstrate that
proportions of IL-10-producing B cells detected following CpG stimulation closely related to those
detected following culture in medium alone (before PMA and Ionomycin re-stimulation). Medium-
cultured B cells, receiving only 5 hours of PMA and Ionomycin stimulation may be compared to the
‘B10’ population described by Tedder et al (Iwata et al., 2011), whilst the 48 hour CpG-induced IL-10
B cells detected here would have been described as ‘B10 and B10-pro’ B cells, detected after a period
of expansion. Much like their study, these populations closely correlated in this work. Whist PBMC-
cultured B cell IL-10 correlated significantly, but less closely, than B cells in isolation (r=0.54 compared
100
with r=0.73). However, as mentioned above (section 3.3.2.1), this may be due to other cells acting on
B cells in PBMC culture.
Gray and colleagues have demonstrated that both murine and human B cells cultured with apoptotic
cells, which had with exposed DNA, produced IL-10 driven by TLR9 signalling (Gray et al., 2007, Miles
et al., 2012). These studies show a clear in vivo relevance for TLR9-mediated IL-10 B cell responses
driven by apoptotic cellular DNA in the microenvironment, suggesting anti-inflammatory B cell
responses contribute to prevent inappropriate inflammation in response to controlled cell death.
3.3.5. Phenotyping IL-10-producing B cells
Phenotypic characterisation showed increased proportions of IL-10-producing B cells amongst
CD24hiCD38hi B cells, compared to CD24intCD38int or CD24hiCD38lo populations, consistent with that
found following CD40 stimulation (Blair et al., 2010). IL-10 restriction to CD24hiCD38hi B cells in the
previously cited study was induced following CD40 stimulation by CD40L-expressing CHO cells. It is
possible that CD40 stimulation in the absence of BCR or cytokine signals polarises IL-10 production to
this naïve subset. Despite this, it is clear that IL-10-producing B cells exist amongst the non-
CD24hiCD38hi populations and are also expanded following culture in CpG. The CD24hiCD38hi B cells
were not the sole IL-10 competent B cell population in this study or others (Das et al., 2012, Silva et
al., 2012).
This thesis shows comparable proportions of IL-10-producing cells amongst all three subsets with PMA
and Ionomycin stimulation in the absence of CpG. CD10+, CD27+CD24hi, CD274+ (PD-L1+), CD5hi and
CD24hiCD38hi B cells separately all showed significantly increased proportions of IL-10-producing cells
compared to the whole CD19+ B cell population, as well as significantly greater expression amongst IL-
10+ B cells than IL-10-. Of the markers examined, CD27 was the only one not to show increased
proportions of IL-10-producing B cells, or to be increased in the IL-10 population (following CpG
stimulation). This is consistent with the mixed data within the literature. Tedder and colleagues, who
identified the CD27+CD24hi subset as a regulator of monocytes, showed increased CD27 expression
amongst IL-10-positive B cells following CpG (Iwata et al., 2011). A number of other studies have found
IL-10+ human B cells do not reside entirely within the CD27+ population (Bouaziz et al., 2010, Lemoine
et al., 2011, Heine et al., 2014). A clear phenotype with which to define the IL-10-competent B cell has
yet to emerge, however this study highlights that CD5-expressing or CD24hiCD38hi B cells are beneficial
phenotypes to identify in order to determine B cell IL-10 capacity.
101
3.3.6. Exploring the predictive value of ex vivo phenotyping on in vitro
IL-10 capacity
Given the identification of markers which identified B cell populations with greater IL-10 competency,
it stands that the proportions of B cells expressing these markers in whole blood, established directly
ex vivo, should correlate with subsequent proportions of IL-10-producing B cells in vitro.
In most cases, expression of phenotypic markers ex vivo correlated with proportions of IL-10-
producing B cells at 48 hours, in the presence or absence of CpG. Where correlations did occur, CpG
stimulation only served to increase the confidence and significance of the relationship present with
medium re-stimulated B cells alone. This is likely due to the greater spread in the proportions of IL-10-
producing B cells detected between patients following CpG stimulation, allowing for a greater
sensitivity in detecting variation. Proportions of CD10+ B cells were the only subset not to correlate
with later IL-10 capacity, surprisingly as CD10 is a marker of naïve/transitional B cells identified as
strongly IL-10 competent (Blair et al., 2010).
Expression of CD27 and CD24hiCD27+ amongst B cells ex vivo showed a greater correlation coefficient
and higher significance with CpG-induced IL-10 than medium alone. This may be due to CD27+ B cells
preferentially responding to TLR9 stimulus (Bernasconi et al., 2002), however, CD27- B cells still
express and respond to TLR9 stimulation. Although, as this relationship was significant in the absence
of CpG, this may be due to CpG producing greater IL-10 responses, as mentioned above.
Weakly significant correlations were observed between the ex vivo proportions of PD-L1+ (CD274+) or
CD5+ B cells and subsequent in vitro IL-10. CD5 expression has been established to itself induce IL-10
amongst B cells (Garaud et al., 2009, Garaud et al., 2011, Gary-Gouy et al., 2002, Mageed et al., 2012).
IL-10-producing B cells have been shown to express PD-L1 (Kubo et al., 2012, van de Veen et al., 2013),
potentially as a result of CpG stimulation, which may act as a mechanism of B cell mediated
suppression of Th2 cells (Kubo et al., 2012). The fact that this study showed weak correlation with PD-
L1 expression prior to culture reinforces this marker as indicative of IL-10 capacity in spite of CpG
stimulation.
Surprisingly, the most significant correlation of in vitro proportions of IL-10-producing B cells observed
was an inverse correlation with respect to the proportions of CD24hiCD38hi B cells ex vivo. This suggests
that greater proportions of CD24hiCD38hi B cells in whole blood indicates fewer proportions of IL-10+
B cells likely to be detected. The reverse was shown in a recent study (Todd et al., 2014), in which a
highly significant positive correlation was drawn between proportions of CD24hiCD38hi B cells and
proportions of CpG+CD40L-induced IL-10-producing B cells. In addition, many studies have used
102
proportions of CD24hiCD38hi B cells as a measure of the proportions of regulatory B cells in a given
patient population (Li et al., 2012, Blair et al., 2010, Das et al., 2012, Silva et al., 2012, Flores-Borja et
al., 2013, van der Vlugt et al., 2014, Saussine et al., 2012, Duggal et al., 2013, Todd et al., 2014, Lepse
et al., 2014, Cherukuri et al., 2014). In all but three of these studies cited, the patient group with
greater proportions of CD24hiCD38hi B cells had a correspondingly greater proportion of IL-10-
producing B cells. Two studies have shown significantly fewer proportions of CD24hiCD38hi B cells
amongst either active vasculitis or renal graft rejection patients compared to controls (Lepse et al.,
2014, Cherukuri et al., 2014); despite no change in the proportions of IL-10-producing B cells following
CpG stimulation. The only one of these studies to show a reversal in this relationship assessed a group
of allergic asthmatics who had greater proportions of CD24hiCD38hi B cells but fewer LPS-induced (from
isolated B cell cultures) IL-10-producing B cells compared to healthy controls (van der Vlugt et al.,
2013).
It is unclear why fewer CD24hiCD38hi B cells in whole blood result in greater proportions of IL-10-
producing B cells in culture, despite this subset being the dominant source of IL-10-producing B cells
detected in this study, as discussed above.
The chemokine receptors CCR3, CCR4, CCR7, CCR8, CCR10 and CXCR5 showed both a significant and
clearly defined increase in expression amongst IL-10+ B cells compared with IL-10- B cells. Whilst this
data is limited to the staining of surface receptor expression, and has not shown a functional migratory
response, this is suggestive of a potential homing (or identifiable) phenotype. Significant with respect
to allergic inflammation is the expression of CCR3 and CCR4, expressed by Th2 cells (Sallusto et al.,
1998, Bonecchi et al., 1998). CCR4 in particular identifies Th2 cells able to home to the lung (Mikhak
et al., 2013) and is critical for allergic inflammation (Banfield et al., 2010, Kaminuma et al., 2012),
which may suggest the co-localisation of Th2 and IL-10-producing B cells in vivo. CCR3 expression on
B cells has been shown to be induced by IL-4, inducing no chemotactic capacity but driving the
expression of CD95 and CD95L, making these cells more susceptible to apoptosis (Jinquan et al., 2003),
although no assessment of CD95 or CD95L took place in this thesis. Additionally, the expression of
CCR10 has been associated with IgE-secreting B cells predisposed to home to the asthmatic lung
(Scanlon et al., 2011). CCR10 expression is also associated with recruitment to the mucosa, especially
for IgA-expressing plasmablasts (Liang et al., 2011).
Increased expression of both CXCR5 and CCR7 may further, or separately, identify these IL-10-
producing cells as predominantly naïve B cells, able to enter and interact with both DCs and T cells
within the germinal centre (Okada and Cyster, 2006). Finally, CCR8 expression has been suggested to
synergise with TLR4-mediated stimulation of murine monocytes to induce expression of IL-10, IL-6 and
103
TNFα (Oshio et al., 2014), which bears some similarity to the phenotype observed here. However, very
little is known of CCR8 expression amongst B cells.
3.3.7. B cell mediated suppression of stimulated T cells
The use of CpG-primed (and therefore IL-10-enriched) B cells in co-culture with CD4+ T cells showed
no suppression of proliferation until day 9 of co-culture, suggesting a much delayed response beyond
that which would be expected with IL-10 alone. A similar time course of CpG-primed suppression has
been previously reported, in which suppression was not apparent at day 4 and only began from day 5
of co-culture (Lemoine et al., 2011). Suppression was maintained when a T:B ratio of 1:1 or 2:1 was
used but not when B cells were diluted beyond this, in the context of a polyclonal T cell stimulus. This
suggests a T:B ratio of 2:1 is required for B cells to achieve potency for suppression. Conversely ratios
of 8:1 and 32:1 showed increased CD4+ T cell proliferation in CpG-primed compared to un-primed B
cell co-cultures, suggesting that CpG priming enhanced T cell activation or proliferation. This may be
due to IL-6 and TNFα drowning out IL-10 or cell-cell mediated suppression at these ratios, although
this observation was not pursued further in this thesis.
Given polyclonal T cell activation is scarcely representative of activation in vivo, a system of Th2 T cell
stimulation, using purified grass pollen allergen in T cell cultures, presented by irradiated PBMCs, was
used to demonstrate suppression by CpG-primed B cells. Suppression of allergen-driven T cell
proliferation, conversely, was maintained at T:B ratios of up to 32:1. This is likely due to the
infrequency of grass pollen allergen-specific CD4+ T cells. A study using T cell peptide antigen tetramers
identifies the most common antigens recognised by as few as 1 in 10,000 T cells (Wambre et al., 2014).
Experiments using EliSpot showed roughly 1 in 10,000 PBMCs secreting IL-4 in response to allergen
stimulation (Gabrielsson et al., 1997, Horiguchi et al., 2008). Given IL-4 is only produced by CD4+ T cells
which make up approximately 30% of PBMCs, this would suggest around 1 in 3,000 CD4+ T cells is
capable of an allergen-specific IL-4 response. Studies of IL-4-producing T cells following re-stimulation
with PMA and Ionomycin were not included to account solely for allergen-induced responses. The
paucity of allergen-specific T cells, even amongst allergics as used for allergen-driven co-cultures here,
suggests few T cells capable of responding to allergen stimulation and may explain the increased
potency of suppression at 32:1. This protocol activates the so-called ‘B10 and B10-pro’ B cells, as
described by Tedder et al., which have IL-10 capacity following TLR9 (or, in their hands, TLR4)
stimulation (Iwata et al., 2011). However, the potency shown here of CpG-primed B cells may be
considered surprising given CpG priming merely increased the proportions of IL-10-producing B cells
from 0.6% to 1.4% (medians following culture in medium or CpG). However, this may be explained by
their active role in IL-10 production, with IL-10 protein detected by ELISA in supernatants, at up to 4
104
days following CpG stimulation, with no detectable IL-10 from medium-cultured B cell conditions. Both
primed and un-primed B cell co-cultures will also contain the identical regulatory subsets, although
the suggestion is that these may be either expanded or ‘activated’ by CpG-priming and thus have
regulatory activity subsequently. A previous study of isolated (un-primed) IL-10-competent B cell
subsets achieved a much reduced potency of suppression with antigen-specific stimulation (van de
Veen et al., 2013). CD73-CD25+CD71+ B cells used to suppress PPD-stimulated PBMCs showed loss of
CD4+ T cell suppression at a ratio of 25 PBMCs to 1 B cell (roughly, this is a T:B ratio of 4:1).
With allergen stimulation suppression was also observed earlier at day 6, suggesting that suppression
of proliferation is also achieved earlier with fewer responding T cells, although this was not maintained
with dilution of B cells at this time point. B cells are potent APCs, and B cell co-cultures resulted in
greater T cell proliferation than T cells achieved with irradiated PBMCs alone. It is therefore likely that
B cells in allergen-driven cultures maintained T cell survival or drove maturation to a greater degree
than in polyclonal T cell stimulation co-cultures; as such there was further potential interaction
between B and T cells through which active, or passive, suppression may have taken place.
Suppression of proliferation at day 9 with a T:B cell ratio of 1:1 was accompanied by significant
suppression of Th1 and Th2 cytokine concentrations in supernatants where CpG-primed B cells were
used, with the exception of IL-10 which was greater. It is no surprise that greater IL-10 was detected
in CpG-primed B cell co-cultures, likely from the IL-10-induced B cells. The reduced proliferation of T
cells (and therefore fewer cells in the respective culture) may explain the reduced concentrations of
inflammatory cytokines. However, whilst some cytokines had a modest reduction in concentration,
others reduced by twice the percentage than the decrease in proliferation, such as IL-13 which
reduced by 73% and 61% in polyclonal and allergen-driven cultures, respectively compared to a
suppression of proliferation of 31% and 33%, respectively. Cytokine suppression may in part be
attributed to fewer cells able to produce cytokine, but B cell inhibition of cytokine production directly
should not be discounted.
Suppression of proliferation in both cases was not due to the induction of FoxP3+ regulatory T cells,
nor IL-10-producing T cells (examined in the polyclonal condition only). In fact, it was a surprise to find
that in the allergen-driven co-cultures, CpG-primed B cells were accompanied by significantly fewer
proportions of CD25hiFoxP3+ Tregs than un-primed B cell co-culture. This may be due to the reduced
IL-2 detected in these supernatants, which is required for Treg survival (Setoguchi et al., 2005), or due
to decreased overall T cell activation. Suppression of total T cell activation (including that of Treg,
which may impact survival) is supported by the persistent suppression of the activation marker CD25
amongst T cells at days 6 and 9, in spite of B cell titration relative to T cells. This suggests a regulatory

105
mechanism which arrests T cell activation, resulting in impaired T cell responsiveness globally
(proliferation and cytokine production).
Alternatively, or additionally, the significant reduction in Tregs may be due to the previously observed
production of significant amounts of IL-6 by CpG-stimulated B cells. IL-6 drives regulatory T cells into
a Th17 (IL-17-producing) phenotype (Komatsu et al., 2014). This is supported by the significant
induction of IL-17A mRNA from allergen-driven co-cultures and lack of suppression observed in IL-17A
protein concentration (unlike all other cytokines shown, with the exception of IL-6 (also no significant
change) and IL-10 which significantly increases). Although one may expect IL-6 to increase significantly
in CpG-primed B cell cultures if this were a significant factor, much like IL-10 concentration.
Reduced T cell CD25 expression or suppression of proliferation may have been due to T cell exhaustion
and subsequent early death or B cell-induced killing of activated T cells. This was investigated using
cell death assays. No change in total or T cell death was observed between B cell co-cultures either at
day 6 or 9, although death was increased amongst cultures lacking in B cells and, unsurprisingly,
unstimulated T cells showed the greatest death. Both suggesting that stimulation, and furthermore B
cells in co-culture, sustain T cell survival. Comparable proportions of live, dying and dead cells between
CpG-primed and un-primed B cells, however, indicate cell killing or activation induced cell death is not
a mechanism of suppression in this system.
3.3.7.1. Use of inhibitory antibodies
It is clear that the exploration of the effects of inhibitory antibodies on Breg-induced suppression of T
cells in these co-culture experiments are in need of further optimisation. The single addition of
blocking antibodies was unable to show any impact on the suppressive capacity of these cells at day
9. Due to the long term nature of these cultures, inhibitory antibodies were added repeatedly at the
same concentrations, which achieved partial reversal of suppression in some conditions, likely limited
by few repeats. Reversal of suppression was achieved in about half of cases, which may suggest
differing suppressive actions between individuals. The reversal of suppression by anti-TGFβ antibodies
which achieved statistical significance, in contrast to IL-10, suggests IL-10 may not be the only
suppressive cytokine produced by Bregs, although unfortunately TGFβ levels in supernatants from co-
cultures were not checked by ELISA. Furthermore, ELISA may have been useful to confirm successful
blockade of supernatant cytokines within these culture. The quantity of anti-IL-10 added was at least
5x the OD50 required to neutralise a lower concentration of recombinant protein.

106
3.4. Future work
I was unable to confirm work by others that may suggest cross linking of CD40, but not CD40
stimulation alone (as carried out here), induced or increased IL-10 competence. It would be of interest
to compare the use of anti-CD40 antibodies with the addition of cross-linking antibody to form
complexes. In addition, the effect of other cells producing IL-10 or responding to LPS appeared to act
on B cells in these experiments. Future experiments should explore B cell dynamics with other cells,
which are likely to play a greater role in vivo. The autocrine and exogenous actions of IL-10 on B cells
may further act on B cells within this microenvironment and may be relevant in vivo, given the
infrequency of IL-10-producing B cells, requires further exploration.
Little previous work has explored the triad of IL-10, IL-6 and TNFα responses observed following B cell
stimulation with CpG. Further work would be required to dissect the cytokine responses towards IL-
10-inducing stimuli, the ratio of pro and anti-inflammatory cytokines as well as characterising the
differently cytokine competent B cells. Experiments performed by other groups have shown the
suppressive capacity of isolated B cell subsets demonstrated here to have greater IL-10 capacity.
However, although suppression of Th2 responses were shown here using CpG-primed B cells as a
whole, this may differ if IL-10+ or subsets of IL-10 capable B cells were sorted. Further work is required
to determine whether specific subsets of IL-10 capable B cells are unique or dissimilar from one
another with respect to phenotype or mechanism of suppression. Whilst every other reported and
confirmed IL-10 competent phenotype shown by proportion of expression in whole blood correlated
with later IL-10 release, this was the inverse for percentages of CD24hiCD38hi B cells. There is a clear
need to confirm and identify why or how increased proportions of CD24hiCD38hi B cells limit the later
proportions of IL-10-producing B cells.
The potential for reversal of Breg mediated suppression of Th2 T cell activation by inhibitory antibodies
requires further work. Further work should investigate the potential for TGFβ or IL-35-production by
these B cells to mediate T cell suppression, particularly in light of recent published data that showed
significant reversal of suppression by TGFβ inhibitory antibodies and demonstrating IL-35-producing
B cells (Lee et al., 2014, Shen et al., 2014).

107
4. Influence of grass pollen immunotherapy on peripheral IL-10+ Breg responses ex vivo
Studies which have compared healthy and allergic rhinitic allergen-induced IL-10 production, by either
PBMCs or T cells, do not show a loss of IL-10 capacity amongst allergic donors, by examination of
supernatant cytokine concentration (Kailaanmaki et al., 2014, Domdey et al., 2010, Akdis et al., 2004).
Furthermore, allergics have been shown by some studies to have increased proportions of IL-10-
producing T cells in response to allergen, compared to non-allergic controls (Han et al., 2010, Akdis et
al., 2004, Yamanaka et al., 2011), likely due to IL-10 associated with Th2 responses rather than
production by Tr1 or Treg cells.
In contrast, prior to this study the B cell compartment has scarcely been examined amongst allergic
individuals, compared to either healthy controls or AIT-treated allergic donors. One study has shown
fewer IL-10-producing B cells in response to LPS stimulation amongst allergic asthmatic subjects
compared to healthy controls (van der Vlugt et al., 2014). However, proportions of IL-10-producing B
cells were unaltered in the context of with CpG or anti-IgM stimulation or re-stimulation following
culture in medium alone. The authors partly accounted for this by showing reduced expression of TLR4
on B cells from allergic asthmatics compared to healthy controls. A single study examined IL-10-
producing B cells in relation to AIT administered for bee venom anaphylaxis (van de Veen et al., 2013).
In patients undergoing bee venom AIT there were greater proportions of IL-10-producing B cells that
were allergen-specific and accounted for a much greater proportion of total circulating B cells
compared to those from untreated donors. Interestingly, healthy ‘tolerant’ bee keepers, who were
naturally heavily exposed to venom through bee stings independent of AIT, had an even greater
proportion of specific IL-10-producing B cells than observed for bee venom allergic individuals
undergoing AIT.
This chapter will examine the ex vivo IL-10 capacity of B cells in grass allergic individuals compared
with non-allergic control subjects and grass allergic individuals who are grass pollen tolerised following
high dose allergen immunotherapy. Identification of IL-10-producing B cells following CpG stimulation,
using methodology optimised in the previous chapter and described above (section 2.3), their
proportions and phenotypic characteristics will be compared between clinical categories.
108
Hypotheses
1) Allergic individuals have fewer regulatory B cells compared to non-allergic controls, which are
restored following successful allergen immunotherapy.
2) Allergic individuals have impaired regulatory B cell responses to allergen that are restored
following successful allergen immunotherapy.
Aims
To use a cross-sectional study of non-allergic, grass pollen allergic and grass pollen immunotherapy-
treated allergic participants to investigate:
1. Proportions of peripheral IL-10-competent B cells
2. Regulatory B cell subsets in peripheral blood
3. Proportions of regulatory B cell subsets after nasal allergen challenge

109
4.1. Pilot comparisons of B cells from allergic and non-allergic participants
PBMCs and isolated B cells were cultured from non-allergic and allergic volunteers (2 SCIT samples
were available for PBMCs) and compared by flow cytometry (Figure 22 A and B, respectively). PBMC
culture showed significantly reduced proportions of IL-10-producing B cells amongst allergic donors
compared to non-allergic controls following stimulation with CpG or LPS (Figure 22 A). However no
differences were observed for medium alone. In contrast, amongst isolated B cell cultures the
proportions of IL-10-producing B cells were identical between groups (Figure 22 B). Since the disparity
in IL-10-producing B cells between allergic and non-allergic donors cannot be reproduced in isolated
B cells, FluoroSpot was used as an alternative method for detecting IL-10 production amongst isolated
B cells (in a subset of the same donors). Significantly fewer IL-10+ B cells were observed amongst
allergic individuals compared to healthy controls following CpG stimulation (Figure 22 C). Few B cells
produced IL-10 with LPS stimulation or in medium alone.
P B M C c u ltu re d B c e lls e x p r e s s in g IL -1 0
% I
L-1
0+
Ce
lls
M e d iu m C p G L P S
0
5
1 0
1 5
A lle rg ic /A to p ic
N o n -a to p ic
S C IT
0 .5 9 0 .0 2 6 0 .0 1 3
Is o la te d B c e lls e x p re s s in g IL -1 0
M e d iu m C p G L P S
0
2
4
6
0 .6 0 0 .8 6 > 0 .9
IL -1 0 F lu o ro s p o t o f is o la te d B c e lls
IL-1
0 S
po
ts p
er 5
x1
05
B c
ell
s
M e d iu m C p G L P S
0
5 0
1 0 0
1 5 0
2 0 0
2 5 0
0 .8 7 0 .0 4 8 0 .9 3
A B
C
Figure 22 –Comparison of B cell IL-10 from non-allergic, allergic and immunotherapy-treated donors.
PBMCs (n=17, NA=6, AR=9, AIT=2) or isolated B cells (n=13, NA=6 AR=7) were cultured from NA (blue), AR (red) or AIT
(green) donors. Cells were stimulated for 48 hours with 1µg/mL CpG, LPS or left in medium alone. Cells stained for flow
cytometry were gated for their percentages of IL-10+ B cells following PBMC (A) or isolated B cell culture (B). IL-10 detection
by fluoroSpot (n=9, NA=6, AR=3) was used to quantify numbers of B cells producing detectable IL-10 (C). Data shows median
with interquartile range.
110
4.2. Effect of allergen-specific immunotherapy on IL-10-producing Bregs
4.2.1. Cross-sectional participant’s baseline demographic and clinical data
On the basis of the above preliminary data a larger cross-sectional study was initiated to confirm the
preliminary findings and compare the impact of allergen immunotherapy on IL-10-producing Bregs, as
described in section 2.10, on p58. Allergic donors were recruited from the Royal Brompton hospital
allergy clinic in response to advertisements, along with 14 non-allergic control donors from external
sources. Allergic donors were untreated (n=14) or AIT-treated (n=8 SCIT and n=6 SLIT).
Demographic details of the volunteers show a similar age across all groups (Table 6). There was a
gender bias towards females amongst non-allergic and SLIT donors and towards males amongst
untreated seasonal allergic, SCIT and AIT withdrawal donors. SLIT donors had a greater duration of AIT
compared to SCIT donors (median of 34 compared to 6 months, respectively), whilst the withdrawal
group have been treated the longest (median 62 months). Serological testing showed raised total and
allergen-specific IgE amongst all allergic participants.
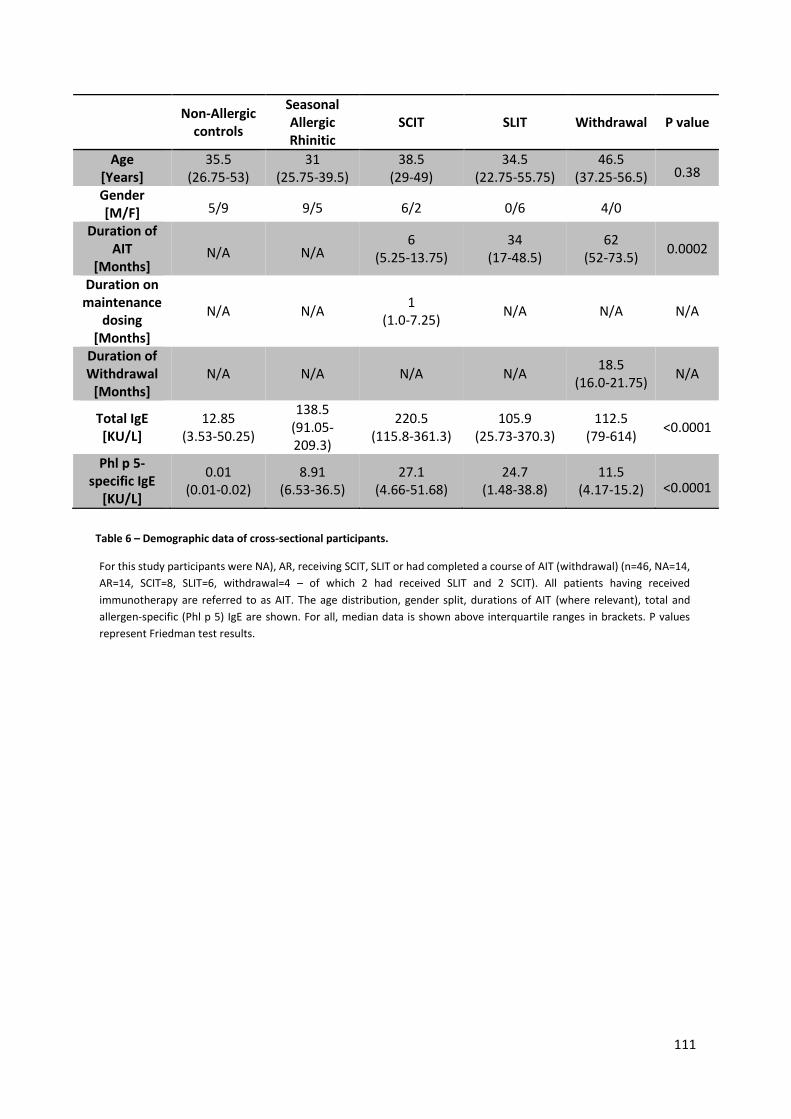
111
Non-Allergic
controls
Seasonal Allergic Rhinitic
SCIT SLIT Withdrawal P value
Age [Years]
35.5 (26.75-53)
31 (25.75-39.5)
38.5 (29-49)
34.5 (22.75-55.75)
46.5 (37.25-56.5) 0.38
Gender [M/F] 5/9 9/5 6/2 0/6 4/0
Duration of AIT
[Months] N/A N/A
6 (5.25-13.75)
34 (17-48.5)
62 (52-73.5)
0.0002
Duration on maintenance
dosing [Months]
N/A N/A 1
(1.0-7.25) N/A N/A N/A
Duration of Withdrawal
[Months] N/A N/A N/A N/A
18.5 (16.0-21.75)
N/A
Total IgE [KU/L]
12.85 (3.53-50.25)
138.5 (91.05-209.3)
220.5 (115.8-361.3)
105.9 (25.73-370.3)
112.5 (79-614)
<0.0001
Phl p 5-specific IgE
[KU/L]
0.01 (0.01-0.02)
8.91 (6.53-36.5)
27.1 (4.66-51.68)
24.7 (1.48-38.8)
11.5 (4.17-15.2) <0.0001
Table 6 – Demographic data of cross-sectional participants.
For this study participants were NA), AR, receiving SCIT, SLIT or had completed a course of AIT (withdrawal) (n=46, NA=14,
AR=14, SCIT=8, SLIT=6, withdrawal=4 – of which 2 had received SLIT and 2 SCIT). All patients having received
immunotherapy are referred to as AIT. The age distribution, gender split, durations of AIT (where relevant), total and
allergen-specific (Phl p 5) IgE are shown. For all, median data is shown above interquartile ranges in brackets. P values
represent Friedman test results.
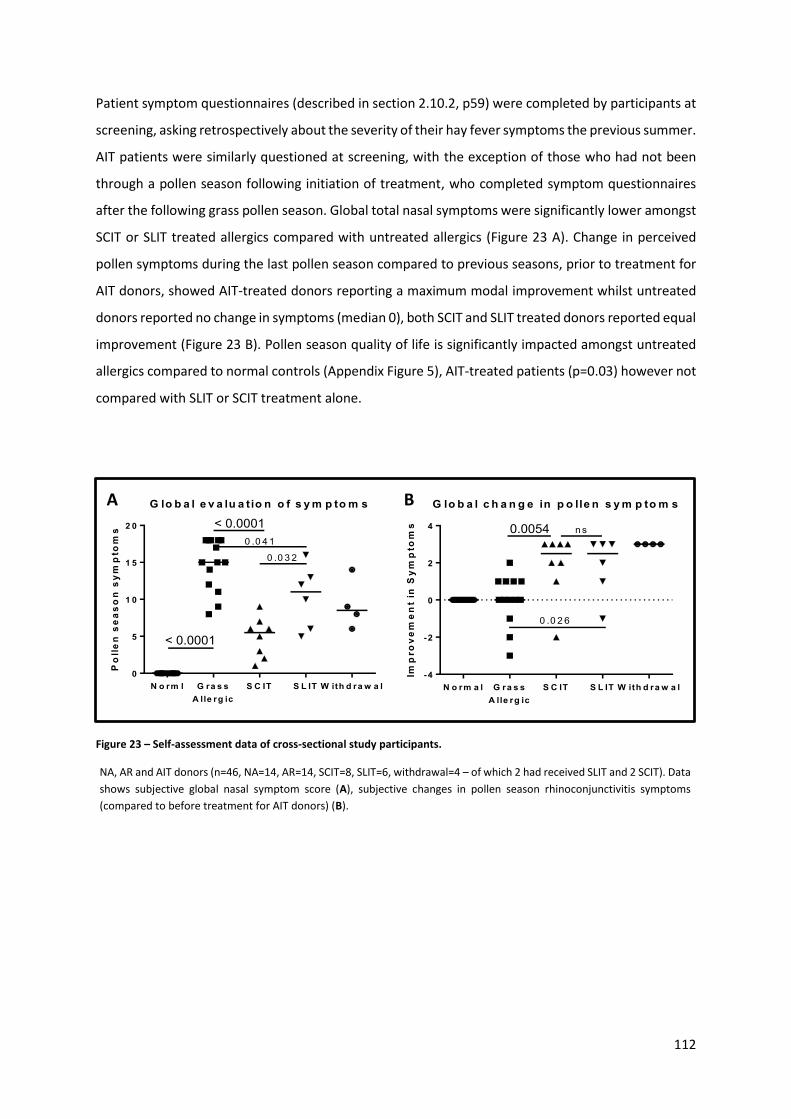
112
Patient symptom questionnaires (described in section 2.10.2, p59) were completed by participants at
screening, asking retrospectively about the severity of their hay fever symptoms the previous summer.
AIT patients were similarly questioned at screening, with the exception of those who had not been
through a pollen season following initiation of treatment, who completed symptom questionnaires
after the following grass pollen season. Global total nasal symptoms were significantly lower amongst
SCIT or SLIT treated allergics compared with untreated allergics (Figure 23 A). Change in perceived
pollen symptoms during the last pollen season compared to previous seasons, prior to treatment for
AIT donors, showed AIT-treated donors reporting a maximum modal improvement whilst untreated
donors reported no change in symptoms (median 0), both SCIT and SLIT treated donors reported equal
improvement (Figure 23 B). Pollen season quality of life is significantly impacted amongst untreated
allergics compared to normal controls (Appendix Figure 5), AIT-treated patients (p=0.03) however not
compared with SLIT or SCIT treatment alone.
G lo b a l e v a lu a tio n o f s y m p to m s
Po
lle
n s
ea
so
n s
ym
pto
ms
N o rm l G ra s s
A lle rg ic
S C IT S L IT W ith d ra w a l
0
5
1 0
1 5
2 0 < 0.0001
< 0.0001
0 .0 3 2
0 .0 4 1
G lo b a l c h a n g e in p o lle n s y m p to m s
Imp
ro
ve
me
nt
in S
ym
pto
ms
N o rm a l G ra s s
A lle rg ic
S C IT S L IT W ith d ra w a l
-4
-2
0
2
4 0.0054
0 .0 2 6
n s
A
Figure 23 – Self-assessment data of cross-sectional study participants.
NA, AR and AIT donors (n=46, NA=14, AR=14, SCIT=8, SLIT=6, withdrawal=4 – of which 2 had received SLIT and 2 SCIT). Data
shows subjective global nasal symptom score (A), subjective changes in pollen season rhinoconjunctivitis symptoms
(compared to before treatment for AIT donors) (B).
B
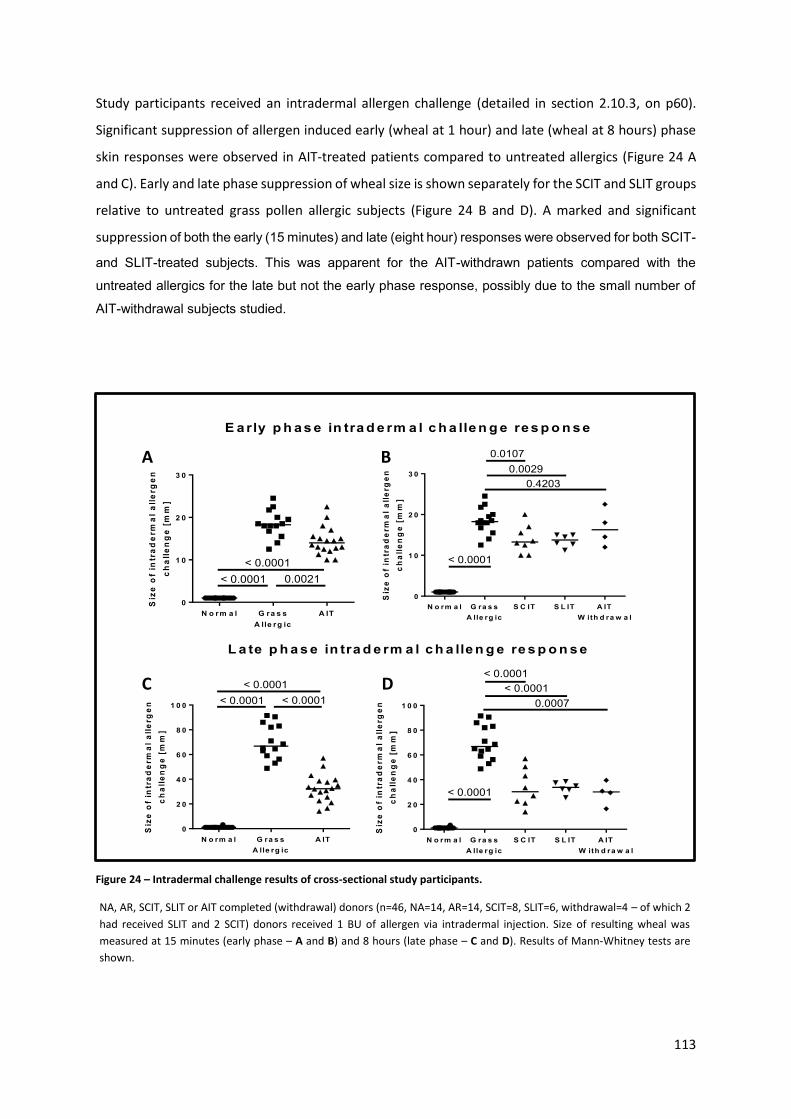
113
Study participants received an intradermal allergen challenge (detailed in section 2.10.3, on p60).
Significant suppression of allergen induced early (wheal at 1 hour) and late (wheal at 8 hours) phase
skin responses were observed in AIT-treated patients compared to untreated allergics (Figure 24 A
and C). Early and late phase suppression of wheal size is shown separately for the SCIT and SLIT groups
relative to untreated grass pollen allergic subjects (Figure 24 B and D). A marked and significant
suppression of both the early (15 minutes) and late (eight hour) responses were observed for both SCIT-
and SLIT-treated subjects. This was apparent for the AIT-withdrawn patients compared with the
untreated allergics for the late but not the early phase response, possibly due to the small number of
AIT-withdrawal subjects studied.
Siz
e o
f in
tra
de
rma
l a
lle
rge
n
ch
all
en
ge
[m
m]
N o rm a l G ra s s
A lle rg ic
A IT
0
1 0
2 0
3 0
< 0.0001
< 0.0001
0.0021
Siz
e o
f in
tra
de
rma
l a
lle
rge
n
ch
all
en
ge
[m
m]
N o rm a l G ra s s
A lle rg ic
S C IT S L IT A IT
W ith d ra w a l
0
1 0
2 0
3 0
< 0.0001
0.0107
0.0029
0.4203
Siz
e o
f in
tra
de
rma
l a
lle
rge
n
ch
all
en
ge
[m
m]
N o rm a l G ra s s
A lle rg ic
S C IT S L IT A IT
W ith d ra w a l
0
2 0
4 0
6 0
8 0
1 0 0
< 0.0001
< 0.0001
0.0007
< 0.0001
E a rly p h a s e in tra d e rm a l c h a lle n g e re s p o n s e
L a te p h a s e in tra d e rm a l c h a lle n g e re s p o n s e
Siz
e o
f in
tra
de
rma
l a
lle
rge
n
ch
all
en
ge
[m
m]
N o rm a l G ra s s
A lle rg ic
A IT
0
2 0
4 0
6 0
8 0
1 0 0< 0.0001
< 0.0001
< 0.0001
A B
C D
Figure 24 – Intradermal challenge results of cross-sectional study participants.
NA, AR, SCIT, SLIT or AIT completed (withdrawal) donors (n=46, NA=14, AR=14, SCIT=8, SLIT=6, withdrawal=4 – of which 2
had received SLIT and 2 SCIT) donors received 1 BU of allergen via intradermal injection. Size of resulting wheal was
measured at 15 minutes (early phase – A and B) and 8 hours (late phase – C and D). Results of Mann-Whitney tests are
shown.
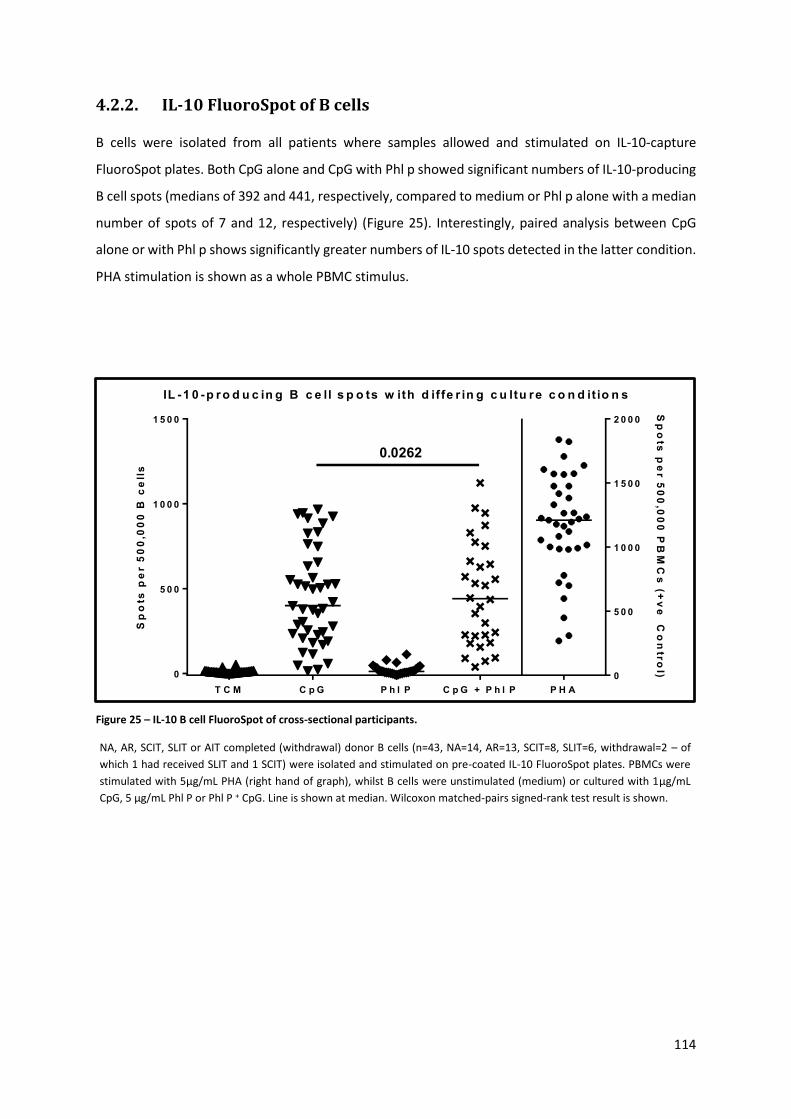
114
4.2.2. IL-10 FluoroSpot of B cells
B cells were isolated from all patients where samples allowed and stimulated on IL-10-capture
FluoroSpot plates. Both CpG alone and CpG with Phl p showed significant numbers of IL-10-producing
B cell spots (medians of 392 and 441, respectively, compared to medium or Phl p alone with a median
number of spots of 7 and 12, respectively) (Figure 25). Interestingly, paired analysis between CpG
alone or with Phl p shows significantly greater numbers of IL-10 spots detected in the latter condition.
PHA stimulation is shown as a whole PBMC stimulus.
IL -1 0 -p r o d u c in g B c e ll s p o ts w ith d iffe r in g c u ltu re c o n d it io n s
Sp
ots
pe
r 5
00
,00
0 B
ce
lls
Sp
ots
pe
r 5
00
,00
0 P
BM
Cs
(+v
e C
on
tro
l)
T C M C p G P h l P C p G + P h l P P H A
0
5 0 0
1 0 0 0
1 5 0 0
0
5 0 0
1 0 0 0
1 5 0 0
2 0 0 0
0.0262
Figure 25 – IL-10 B cell FluoroSpot of cross-sectional participants.
NA, AR, SCIT, SLIT or AIT completed (withdrawal) donor B cells (n=43, NA=14, AR=13, SCIT=8, SLIT=6, withdrawal=2 – of
which 1 had received SLIT and 1 SCIT) were isolated and stimulated on pre-coated IL-10 FluoroSpot plates. PBMCs were
stimulated with 5µg/mL PHA (right hand of graph), whilst B cells were unstimulated (medium) or cultured with 1µg/mL
CpG, 5 µg/mL Phl P or Phl P + CpG. Line is shown at median. Wilcoxon matched-pairs signed-rank test result is shown.
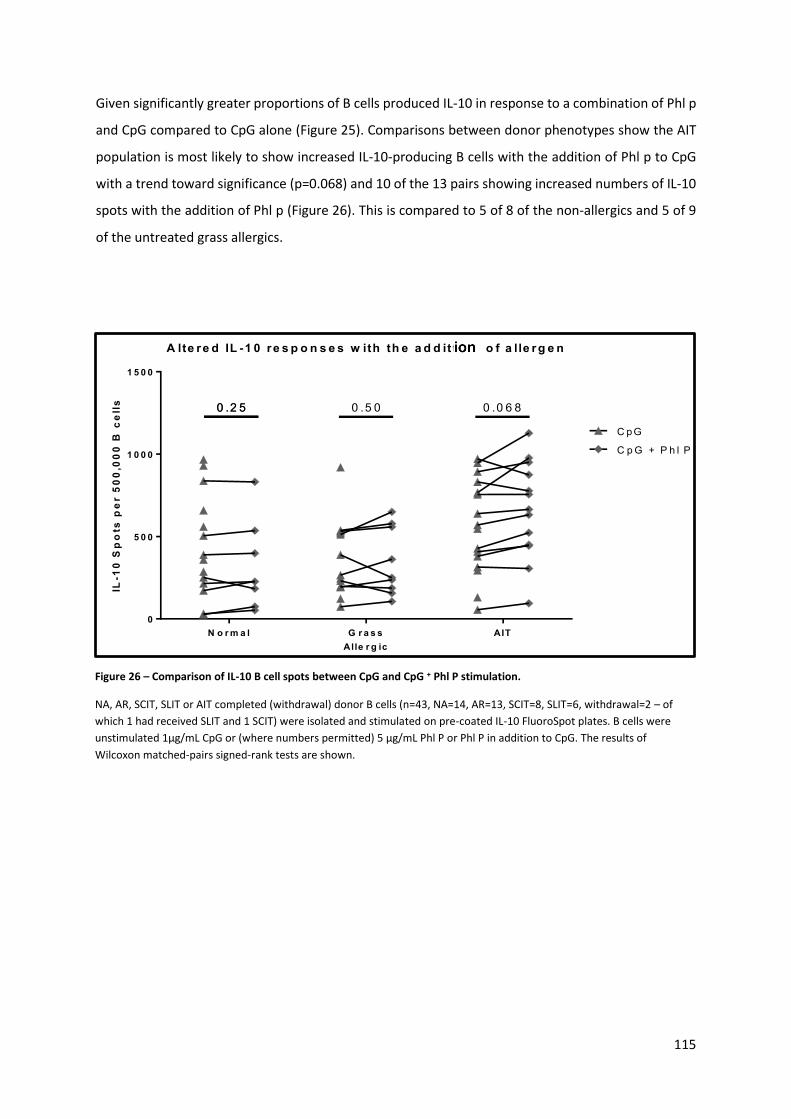
115
Given significantly greater proportions of B cells produced IL-10 in response to a combination of Phl p
and CpG compared to CpG alone (Figure 25). Comparisons between donor phenotypes show the AIT
population is most likely to show increased IL-10-producing B cells with the addition of Phl p to CpG
with a trend toward significance (p=0.068) and 10 of the 13 pairs showing increased numbers of IL-10
spots with the addition of Phl p (Figure 26). This is compared to 5 of 8 of the non-allergics and 5 of 9
of the untreated grass allergics.
A lte re d IL -1 0 re s p o n s e s w ith th e a d d it t io n o f a lle r g e n
IL-1
0 S
po
ts p
er 5
00
,00
0 B
ce
lls
N o r m a l G r a s s
Alle r g ic
AIT
0
5 0 0
1 0 0 0
1 5 0 0
C pG
C p G + P h l P
0 .2 50 .2 5 0 .5 0 0 .0 6 8
Figure 26 – Comparison of IL-10 B cell spots between CpG and CpG + Phl P stimulation.
NA, AR, SCIT, SLIT or AIT completed (withdrawal) donor B cells (n=43, NA=14, AR=13, SCIT=8, SLIT=6, withdrawal=2 – of
which 1 had received SLIT and 1 SCIT) were isolated and stimulated on pre-coated IL-10 FluoroSpot plates. B cells were
unstimulated 1µg/mL CpG or (where numbers permitted) 5 µg/mL Phl P or Phl P in addition to CpG. The results of
Wilcoxon matched-pairs signed-rank tests are shown.
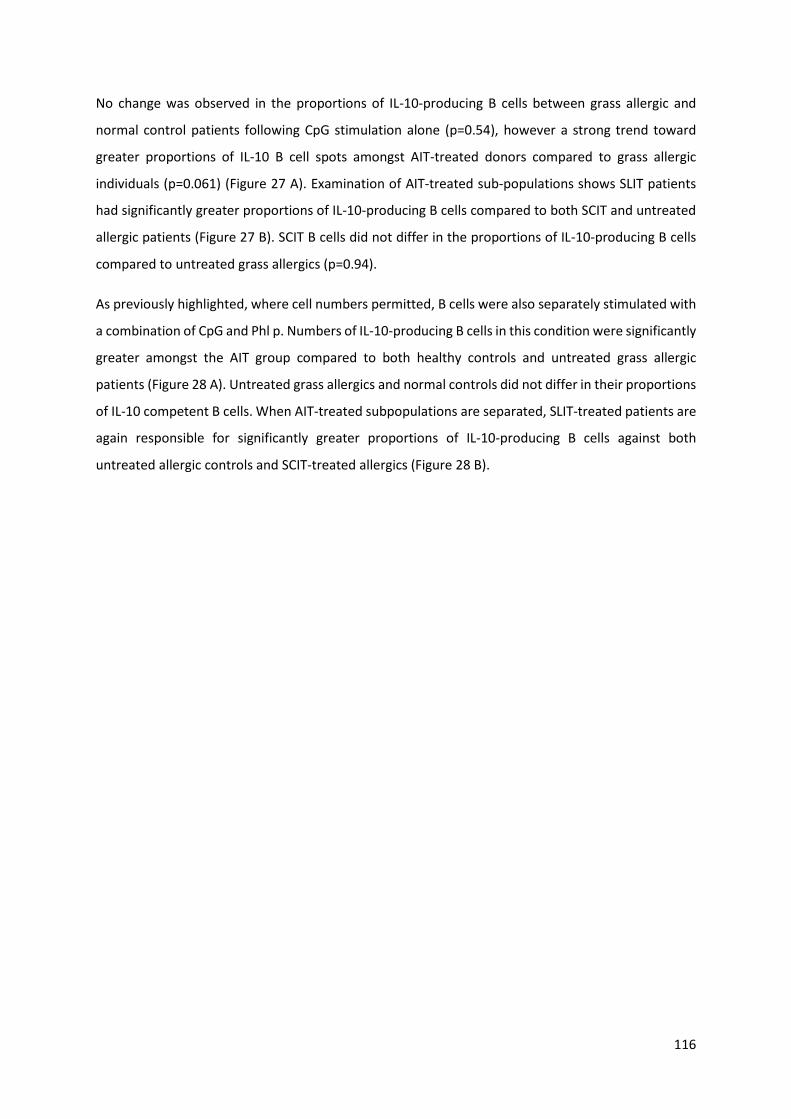
116
No change was observed in the proportions of IL-10-producing B cells between grass allergic and
normal control patients following CpG stimulation alone (p=0.54), however a strong trend toward
greater proportions of IL-10 B cell spots amongst AIT-treated donors compared to grass allergic
individuals (p=0.061) (Figure 27 A). Examination of AIT-treated sub-populations shows SLIT patients
had significantly greater proportions of IL-10-producing B cells compared to both SCIT and untreated
allergic patients (Figure 27 B). SCIT B cells did not differ in the proportions of IL-10-producing B cells
compared to untreated grass allergics (p=0.94).
As previously highlighted, where cell numbers permitted, B cells were also separately stimulated with
a combination of CpG and Phl p. Numbers of IL-10-producing B cells in this condition were significantly
greater amongst the AIT group compared to both healthy controls and untreated grass allergic
patients (Figure 28 A). Untreated grass allergics and normal controls did not differ in their proportions
of IL-10 competent B cells. When AIT-treated subpopulations are separated, SLIT-treated patients are
again responsible for significantly greater proportions of IL-10-producing B cells against both
untreated allergic controls and SCIT-treated allergics (Figure 28 B).

117
IL -1 0 -p ro d u c in g B c e ll s p o ts fo llo w in g C p G s tim u la tio n
Sp
ots
pe
r 5
00
,00
0 B
ce
lls
N o r m a l G r a s s
A lle r g ic
A IT
0
5 0 0
1 0 0 0
1 5 0 0
W ith d ra w a l
S C IT
S L IT
0 .5 4 0 .0 6 1
0 .2 5
B
A
Figure 27 – IL-10 spots following CpG stimulation.
NA, AR, SCIT, SLIT or AIT completed (withdrawal) donor B cells were isolated for IL-10 capture FluoroSpot (n=43, NA=14,
AR=13, SCIT=8, SLIT=6, withdrawal=2 – of which 1 had received SLIT and 1 SCIT). B cells were stimulated with 1µg/mL CpG
and numbers of IL-10 B cell spots per 500,000 cells are shown for patient populations with AIT groups combined (A) and
individual AIT patient populations evaluated in (B).
Sp
ots
pe
r 5
00
,00
0 B
ce
lls
N o r m a l G r a s s
A lle r g ic
S C IT S L IT W ith d r a w a l
0
5 0 0
1 0 0 0
1 5 0 0
0 .9 4 0 .0 0 8
0 .0 0 0 9
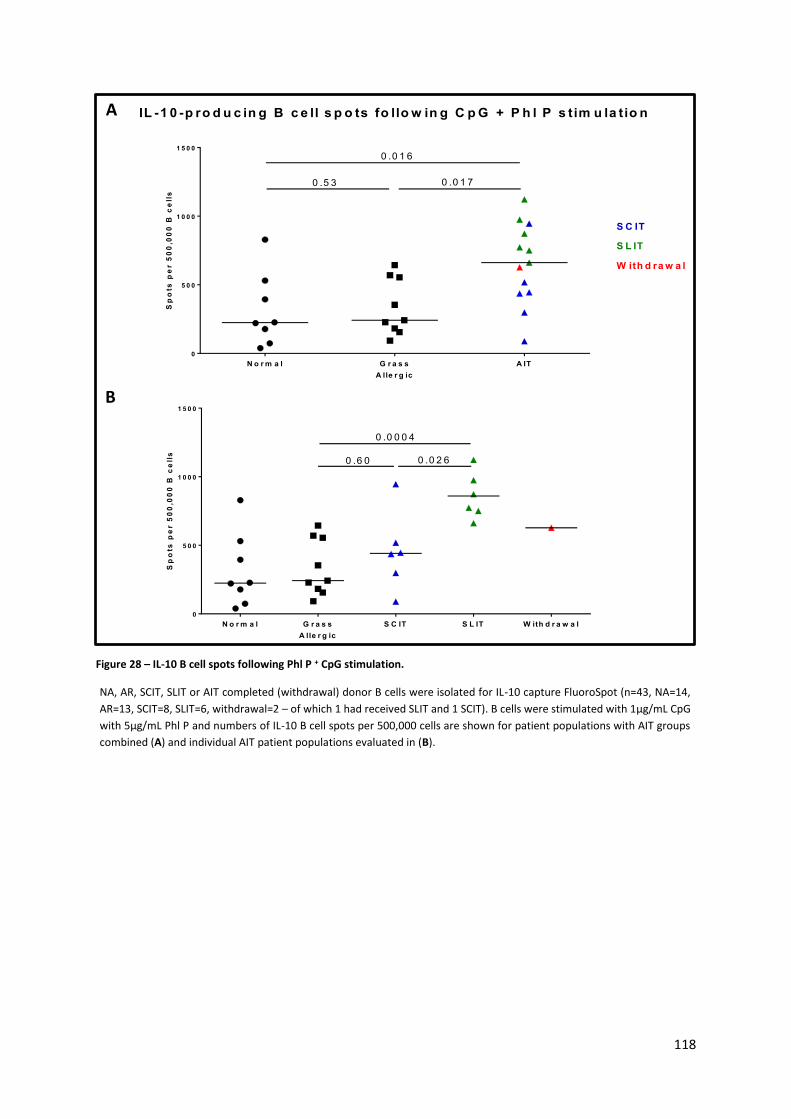
118
B
A
Figure 28 – IL-10 B cell spots following Phl P + CpG stimulation.
NA, AR, SCIT, SLIT or AIT completed (withdrawal) donor B cells were isolated for IL-10 capture FluoroSpot (n=43, NA=14,
AR=13, SCIT=8, SLIT=6, withdrawal=2 – of which 1 had received SLIT and 1 SCIT). B cells were stimulated with 1µg/mL CpG
with 5µg/mL Phl P and numbers of IL-10 B cell spots per 500,000 cells are shown for patient populations with AIT groups
combined (A) and individual AIT patient populations evaluated in (B).
IL -1 0 -p ro d u c in g B c e ll s p o ts fo llo w in g C p G + P h l P s tim u la tio n
Sp
ots
pe
r 5
00
,00
0 B
ce
lls
N o r m a l G r a s s
A lle r g ic
A IT
0
5 0 0
1 0 0 0
1 5 0 0
W ith d ra w a l
S C IT
S L IT
0 .5 3 0 .0 1 7
0 .0 1 6S
po
ts p
er 5
00
,00
0 B
ce
lls
N o r m a l G r a s s
A lle r g ic
S C IT S L IT W ith d r a w a l
0
5 0 0
1 0 0 0
1 5 0 0
0 .6 0 0 .0 2 6
0 .0 0 0 4

119
Phl p stimulation alone across all groups showed no significant differences in the proportions of IL-10-
producing B cells (Figure 29). Non-allergic controls and AIT-treated patients show a trend towards
greater proportions of IL-10-producing B cells compared to untreated grass allergic patients (p=0.12
and p=0.11 respectively). SCIT (blue) and SLIT (green) treated patients do not show disparate
proportions of B cell IL-10 spots. Relatively few IL-10-producing spots are shown, however proportions
of IL-10-producing B cells in the presence of allergen compared to medium alone is significantly
greater (for all volunteers, p=0.0027). Negative values exist in this condition as some wells had a
greater number of spots on background wells containing medium alone.
IL-10-producing B cells following allergen stimulation alone
Sp
ots
pe
r 5
00
,00
0 B
ce
lls
N o r m a l G r a s s
Alle r g ic
AIT
0
2 0
4 0
6 0
8 0
1 0 0
1 2 0
W ith d ra w a l
S C IT
S L IT
0 .1 2 0 .1 1
0 .4 4
-10
Figure 29 – B cell IL-10 spots following allergen stimulation.
NA, AR, SCIT (blue), SLIT (green) or AIT completed (withdrawal - red) donor B cells were isolated for IL-10 capture
FluoroSpot (n=28, NA=7, AR=8, SCIT=6, SLIT=6, withdrawal=1 – SCIT). B cells were stimulated with 5µg/mL Phl P and
numbers of IL-10 B cell spots per 500,000 cells are shown for patient populations with AIT groups combined.
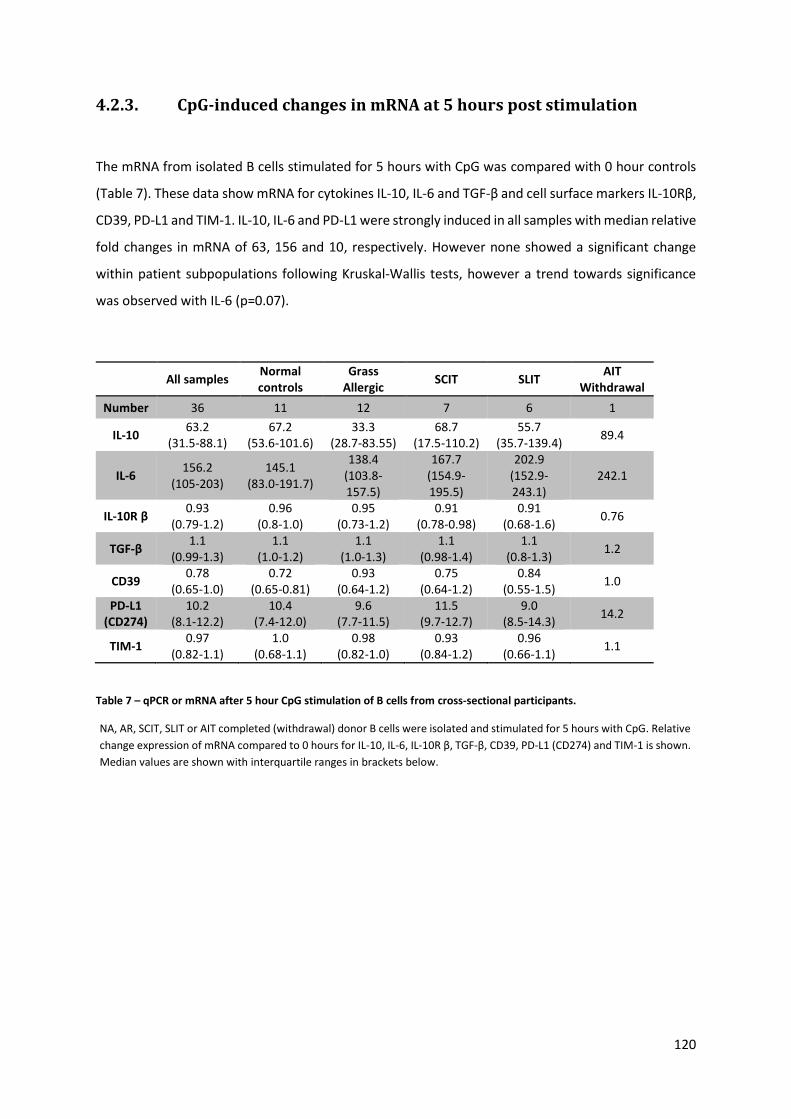
120
4.2.3. CpG-induced changes in mRNA at 5 hours post stimulation
The mRNA from isolated B cells stimulated for 5 hours with CpG was compared with 0 hour controls
(Table 7). These data show mRNA for cytokines IL-10, IL-6 and TGF-β and cell surface markers IL-10Rβ,
CD39, PD-L1 and TIM-1. IL-10, IL-6 and PD-L1 were strongly induced in all samples with median relative
fold changes in mRNA of 63, 156 and 10, respectively. However none showed a significant change
within patient subpopulations following Kruskal-Wallis tests, however a trend towards significance
was observed with IL-6 (p=0.07).
All samples Normal controls
Grass Allergic
SCIT SLIT AIT
Withdrawal
Number 36 11 12 7 6 1
IL-10 63.2
(31.5-88.1) 67.2
(53.6-101.6) 33.3
(28.7-83.55) 68.7
(17.5-110.2) 55.7
(35.7-139.4) 89.4
IL-6 156.2
(105-203) 145.1
(83.0-191.7)
138.4 (103.8-157.5)
167.7 (154.9-195.5)
202.9 (152.9-243.1)
242.1
IL-10R β 0.93
(0.79-1.2) 0.96
(0.8-1.0) 0.95
(0.73-1.2) 0.91
(0.78-0.98) 0.91
(0.68-1.6) 0.76
TGF-β 1.1
(0.99-1.3) 1.1
(1.0-1.2) 1.1
(1.0-1.3) 1.1
(0.98-1.4) 1.1
(0.8-1.3) 1.2
CD39 0.78
(0.65-1.0) 0.72
(0.65-0.81) 0.93
(0.64-1.2) 0.75
(0.64-1.2) 0.84
(0.55-1.5) 1.0
PD-L1 (CD274)
10.2 (8.1-12.2)
10.4 (7.4-12.0)
9.6 (7.7-11.5)
11.5 (9.7-12.7)
9.0 (8.5-14.3)
14.2
TIM-1 0.97
(0.82-1.1) 1.0
(0.68-1.1) 0.98
(0.82-1.0) 0.93
(0.84-1.2) 0.96
(0.66-1.1) 1.1
Table 7 – qPCR or mRNA after 5 hour CpG stimulation of B cells from cross-sectional participants.
NA, AR, SCIT, SLIT or AIT completed (withdrawal) donor B cells were isolated and stimulated for 5 hours with CpG. Relative
change expression of mRNA compared to 0 hours for IL-10, IL-6, IL-10R β, TGF-β, CD39, PD-L1 (CD274) and TIM-1 is shown.
Median values are shown with interquartile ranges in brackets below.
121
This data has been examined in more detail with respect to relative changes in IL-10 and IL-6 mRNA
(Figure 30). IL-10 mRNA did not show any significant changes between allergic groups (Figure 30 A),
however there is a trend towards a reduced induction of IL-10 mRNA induced amongst untreated
allergics (median 33) compared to non-allergic controls (median 67) (p=0.059). Collectively AIT-
treated patients had a greater induction of IL-6 mRNA compared with grass allergic patients (p=0.022)
(Figure 30 B). SLIT and SCIT patients independently suggested a trend towards increased 5 hour IL-6
mRNA against grass allergics (p=0.13 and p=0.068).
IL -1 0 m R N A 5 h o u rs p o s t
C p G s tim u la tio n
Re
lati
ve
ch
an
ge
in
IL
-10
mR
NA
ex
pre
ss
ion
N o r m a l G r a s s
Alle r g ic
S C IT S L IT AIT
W ith d r a w a l
0
5 0
1 0 0
1 5 0
2 0 0
2 5 00 .5 7
0 .4 6
0 .0 5 9 0 .8 0 0 .7 4
IL -6 m R N A 5 h o u rs p o s t
C p G s tim u la tio nR
ela
tiv
e c
ha
ng
e i
n I
L-6
mR
NA
ex
pre
ss
ion
N o r m a l G r a s s
Alle r g ic
S C IT S L IT AIT
W ith d r a w l
0
2 0 0
4 0 0
6 0 0
8 0 0
1 0 0 0
0 .1 3
0 .0 6 8 0 .3 4
0 .0 2 2
A B
Figure 30 – Relative IL-10 and IL-6 mRNA expression in cross-sectional populations after stimulation.
NA, AR, SCIT, SLIT or AIT completed (withdrawal) donor B cells were isolated and stimulated for 5 hours with CpG. Relative
change in expression of mRNA compared to 0 hours for IL-10 and IL-6 is shown for all clinical phenotypes. P values are
shown as the result of Mann-Whitney tests.
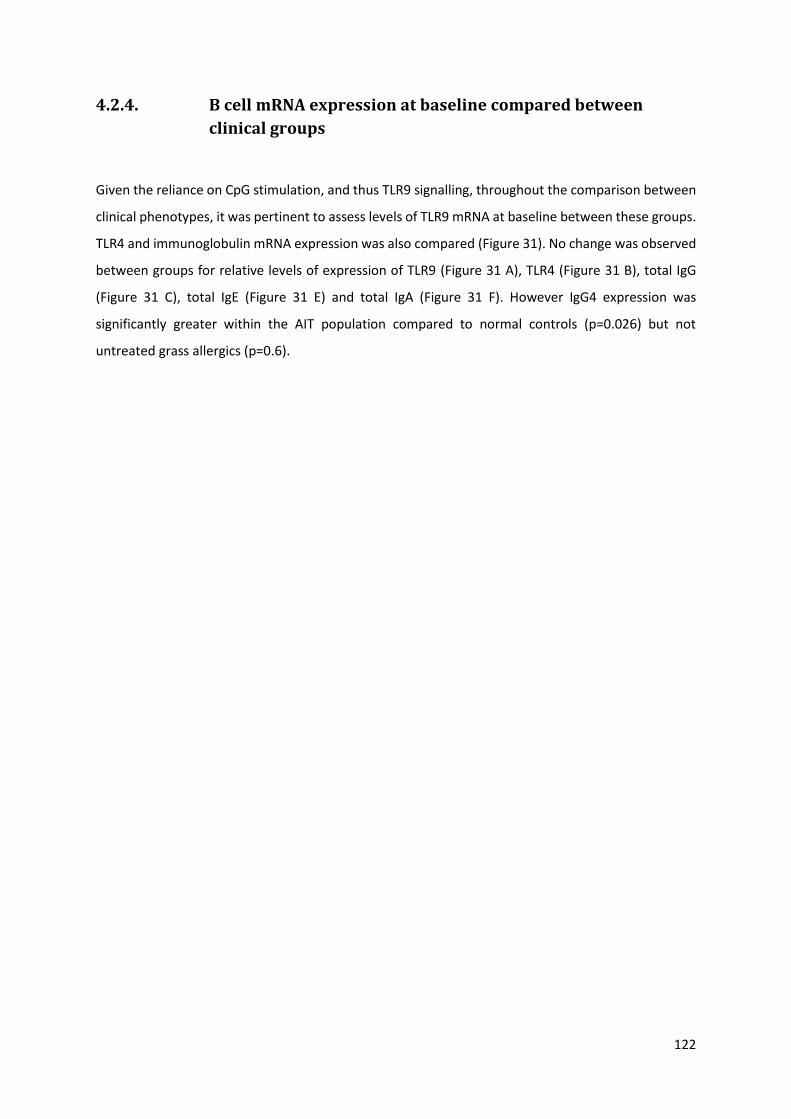
122
4.2.4. B cell mRNA expression at baseline compared between
clinical groups
Given the reliance on CpG stimulation, and thus TLR9 signalling, throughout the comparison between
clinical phenotypes, it was pertinent to assess levels of TLR9 mRNA at baseline between these groups.
TLR4 and immunoglobulin mRNA expression was also compared (Figure 31). No change was observed
between groups for relative levels of expression of TLR9 (Figure 31 A), TLR4 (Figure 31 B), total IgG
(Figure 31 C), total IgE (Figure 31 E) and total IgA (Figure 31 F). However IgG4 expression was
significantly greater within the AIT population compared to normal controls (p=0.026) but not
untreated grass allergics (p=0.6).
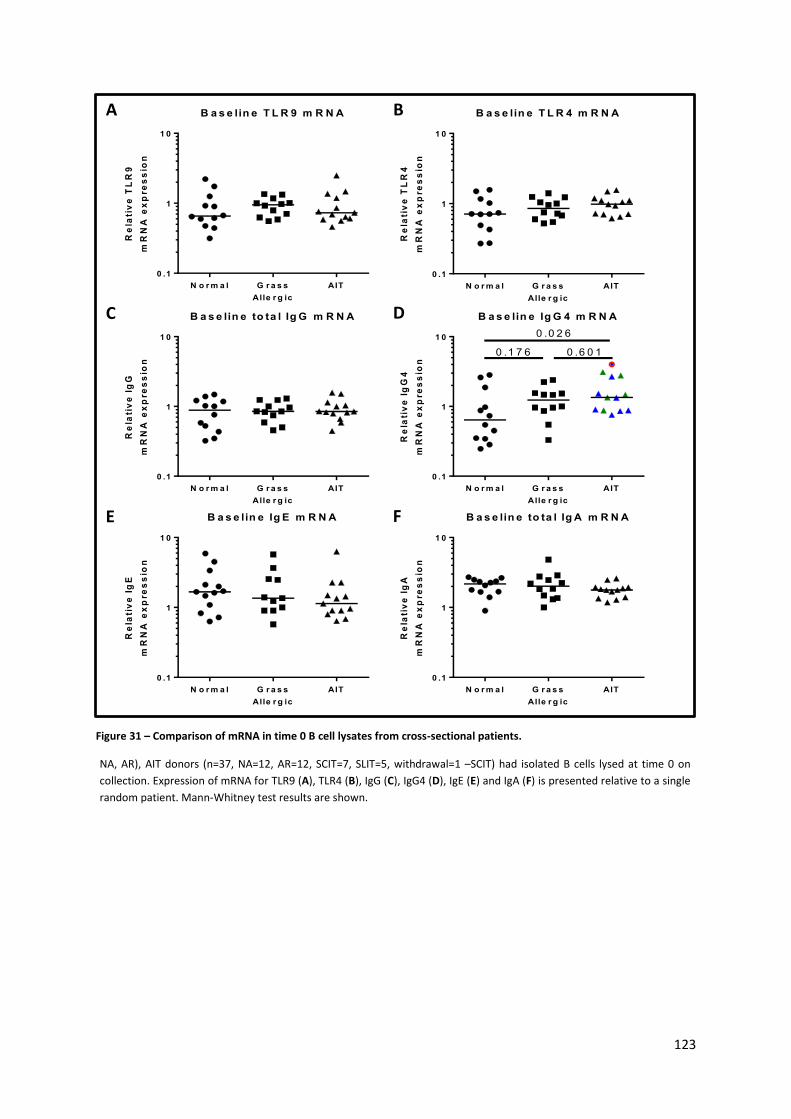
123
B a s e lin e T L R 9 m R N A
Re
lati
ve
TL
R9
mR
NA
ex
pre
ss
ion
N o r m a l G r a s s
Alle r g ic
AIT
0 .1
1
1 0
B a s e lin e T L R 4 m R N A
Re
lati
ve
TL
R4
mR
NA
ex
pre
ss
ion
N o r m a l G r a s s
Alle r g ic
AIT
0 .1
1
1 0
B a s e lin e to ta l Ig G m R N A
Re
lati
ve
Ig
G
mR
NA
ex
pre
ss
ion
N o r m a l G r a s s
Alle r g ic
AIT
0 .1
1
1 0
B a s e lin e Ig G 4 m R N A
Re
lati
ve
Ig
G4
mR
NA
ex
pre
ss
ion
N o r m a l G r a s s
Alle r g ic
AIT
0 .1
1
1 0
0 .1 7 6 0 .6 0 1
0 .0 2 6
B a s e lin e Ig E m R N A
Re
lati
ve
Ig
E
mR
NA
ex
pre
ss
ion
N o r m a l G r a s s
Alle r g ic
AIT
0 .1
1
1 0
B a s e lin e to ta l Ig A m R N A
Re
lati
ve
Ig
A
mR
NA
ex
pre
ss
ion
N o r m a l G r a s s
Alle r g ic
AIT
0 .1
1
1 0
A B
C D
E F
Figure 31 – Comparison of mRNA in time 0 B cell lysates from cross-sectional patients.
NA, AR), AIT donors (n=37, NA=12, AR=12, SCIT=7, SLIT=5, withdrawal=1 –SCIT) had isolated B cells lysed at time 0 on
collection. Expression of mRNA for TLR9 (A), TLR4 (B), IgG (C), IgG4 (D), IgE (E) and IgA (F) is presented relative to a single
random patient. Mann-Whitney test results are shown.
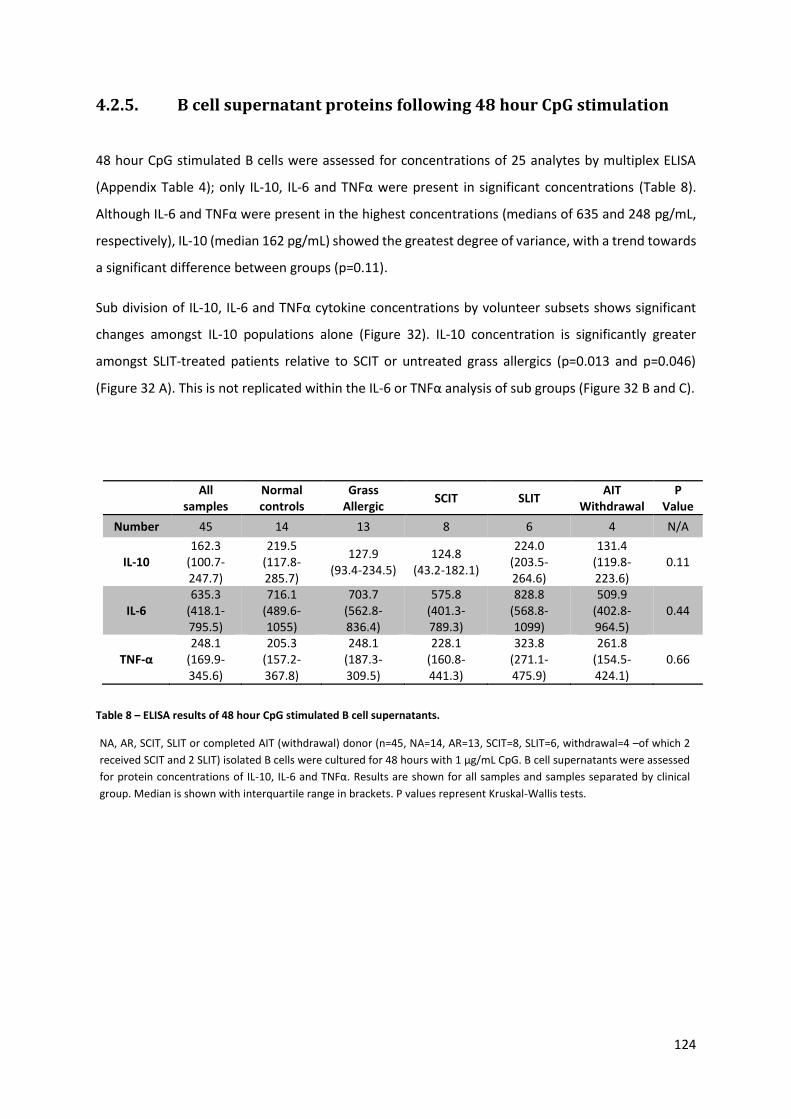
124
4.2.5. B cell supernatant proteins following 48 hour CpG stimulation
48 hour CpG stimulated B cells were assessed for concentrations of 25 analytes by multiplex ELISA
(Appendix Table 4); only IL-10, IL-6 and TNFα were present in significant concentrations (Table 8).
Although IL-6 and TNFα were present in the highest concentrations (medians of 635 and 248 pg/mL,
respectively), IL-10 (median 162 pg/mL) showed the greatest degree of variance, with a trend towards
a significant difference between groups (p=0.11).
Sub division of IL-10, IL-6 and TNFα cytokine concentrations by volunteer subsets shows significant
changes amongst IL-10 populations alone (Figure 32). IL-10 concentration is significantly greater
amongst SLIT-treated patients relative to SCIT or untreated grass allergics (p=0.013 and p=0.046)
(Figure 32 A). This is not replicated within the IL-6 or TNFα analysis of sub groups (Figure 32 B and C).
Table 8 – ELISA results of 48 hour CpG stimulated B cell supernatants.
NA, AR, SCIT, SLIT or completed AIT (withdrawal) donor (n=45, NA=14, AR=13, SCIT=8, SLIT=6, withdrawal=4 –of which 2
received SCIT and 2 SLIT) isolated B cells were cultured for 48 hours with 1 µg/mL CpG. B cell supernatants were assessed
for protein concentrations of IL-10, IL-6 and TNFα. Results are shown for all samples and samples separated by clinical
group. Median is shown with interquartile range in brackets. P values represent Kruskal-Wallis tests.
All
samples Normal controls
Grass Allergic
SCIT SLIT AIT
Withdrawal P
Value
Number 45 14 13 8 6 4 N/A
IL-10 162.3
(100.7-247.7)
219.5 (117.8-285.7)
127.9 (93.4-234.5)
124.8 (43.2-182.1)
224.0 (203.5-264.6)
131.4 (119.8-223.6)
0.11
IL-6 635.3
(418.1-795.5)
716.1 (489.6-1055)
703.7 (562.8-836.4)
575.8 (401.3-789.3)
828.8 (568.8-1099)
509.9 (402.8-964.5)
0.44
TNF-α 248.1
(169.9-345.6)
205.3 (157.2-367.8)
248.1 (187.3-309.5)
228.1 (160.8-441.3)
323.8 (271.1-475.9)
261.8 (154.5-424.1)
0.66
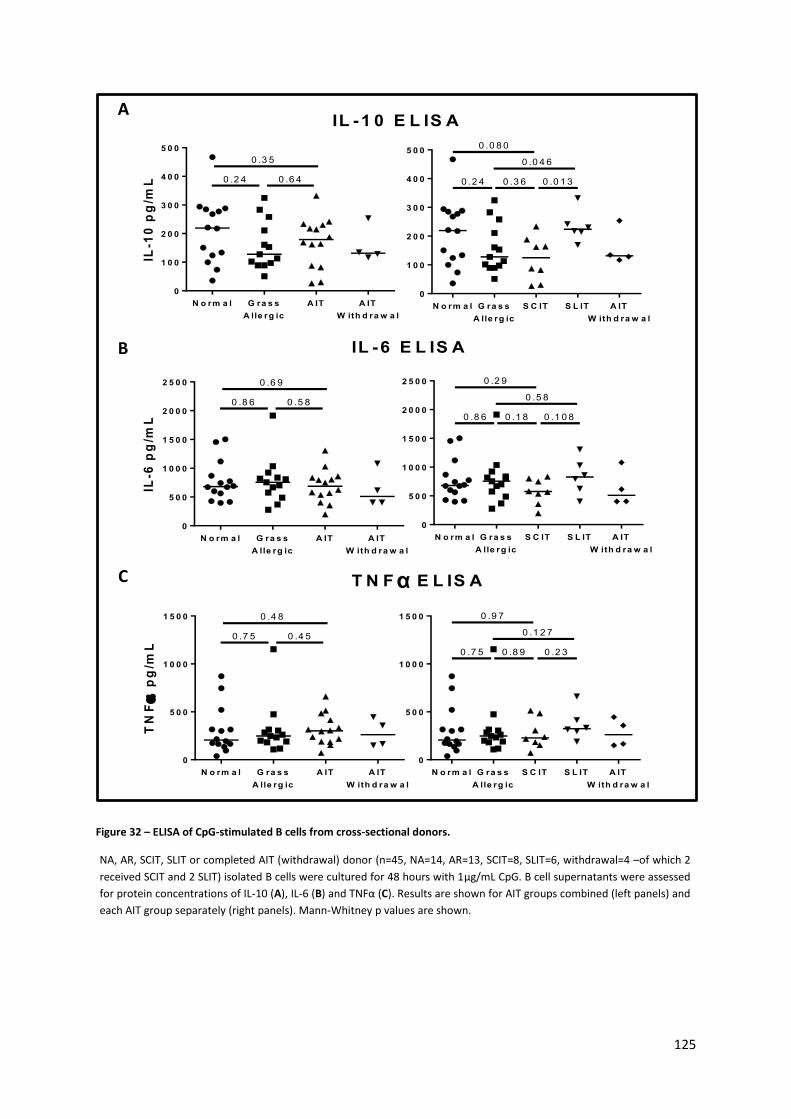
125
IL-1
0 p
g/m
L
N o rm a l G ra s s
A lle rg ic
A IT A IT
W ith d ra w a l
0
1 0 0
2 0 0
3 0 0
4 0 0
5 0 0
0 .3 5
0 .2 4 0 .6 4
N o rm a l G ra s s
A lle rg ic
S C IT S L IT A IT
W ith d ra w a l
0
1 0 0
2 0 0
3 0 0
4 0 0
5 0 0
0 .0 4 6
0 .2 4 0 .3 6 0 .0 1 3
0 .0 8 0IL
-6 p
g/m
L
N o rm a l G ra s s
A lle rg ic
A IT A IT
W ith d ra w a l
0
5 0 0
1 0 0 0
1 5 0 0
2 0 0 0
2 5 0 0 0 .6 9
0 .8 6 0 .5 8
N o rm a l G ra s s
A lle rg ic
S C IT S L IT A IT
W ith d ra w a l
0
5 0 0
1 0 0 0
1 5 0 0
2 0 0 0
2 5 0 0
0 .5 8
0 .8 6 0 .1 8 0 .1 0 8
0 .2 9
TN
F
pg
/mL
N o rm a l G ra s s
A lle rg ic
A IT A IT
W ith d ra w a l
0
5 0 0
1 0 0 0
1 5 0 0 0 .4 8
0 .7 5 0 .4 5
N o rm a l G ra s s
A lle rg ic
S C IT S L IT A IT
W ith d ra w a l
0
5 0 0
1 0 0 0
1 5 0 0
0 .1 2 7
0 .7 5 0 .8 9 0 .2 3
0 .9 7
IL -1 0 E L IS A
IL -6 E L IS A
T N F E L IS A
A
Figure 32 – ELISA of CpG-stimulated B cells from cross-sectional donors.
NA, AR, SCIT, SLIT or completed AIT (withdrawal) donor (n=45, NA=14, AR=13, SCIT=8, SLIT=6, withdrawal=4 –of which 2
received SCIT and 2 SLIT) isolated B cells were cultured for 48 hours with 1µg/mL CpG. B cell supernatants were assessed
for protein concentrations of IL-10 (A), IL-6 (B) and TNFα (C). Results are shown for AIT groups combined (left panels) and
each AIT group separately (right panels). Mann-Whitney p values are shown.
B
C α
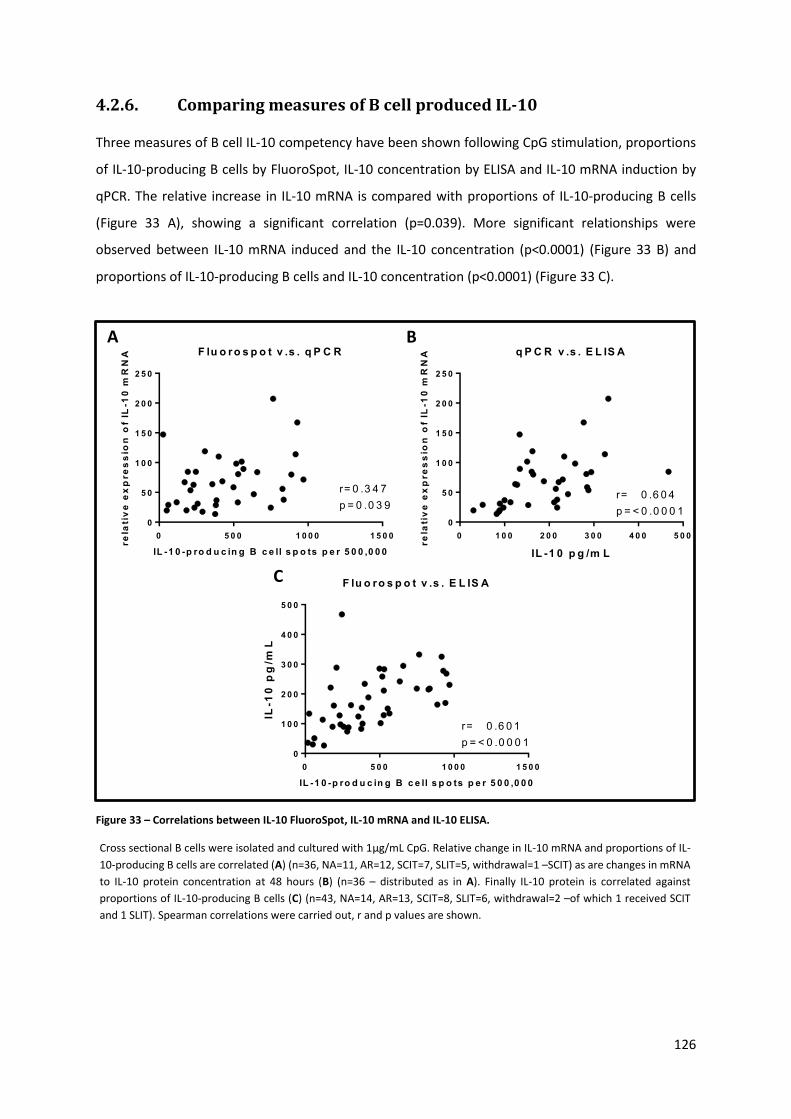
126
4.2.6. Comparing measures of B cell produced IL-10
Three measures of B cell IL-10 competency have been shown following CpG stimulation, proportions
of IL-10-producing B cells by FluoroSpot, IL-10 concentration by ELISA and IL-10 mRNA induction by
qPCR. The relative increase in IL-10 mRNA is compared with proportions of IL-10-producing B cells
(Figure 33 A), showing a significant correlation (p=0.039). More significant relationships were
observed between IL-10 mRNA induced and the IL-10 concentration (p<0.0001) (Figure 33 B) and
proportions of IL-10-producing B cells and IL-10 concentration (p<0.0001) (Figure 33 C).
F lu o r o s p o t v .s . q P C R
IL -1 0 -p ro d u c in g B c e ll s p o ts p e r 5 0 0 ,0 0 0
re
lati
ve
ex
pre
ss
ion
of
IL-1
0 m
RN
A
0 5 0 0 1 0 0 0 1 5 0 0
0
5 0
1 0 0
1 5 0
2 0 0
2 5 0
r= 0 .3 4 7
p = 0 .0 3 9
q P C R v .s . E L IS A
IL -1 0 p g /m L
re
lati
ve
ex
pre
ss
ion
of
IL-1
0 m
RN
A
0 1 0 0 2 0 0 3 0 0 4 0 0 5 0 0
0
5 0
1 0 0
1 5 0
2 0 0
2 5 0
r= 0 .6 0 4
p = < 0 .0 0 0 1
F lu o ro s p o t v .s . E L IS A
IL -1 0 -p ro d u c in g B c e ll s p o ts p e r 5 0 0 ,0 0 0
IL-1
0 p
g/m
L
0 5 0 0 1 0 0 0 1 5 0 0
0
1 0 0
2 0 0
3 0 0
4 0 0
5 0 0
r= 0 .6 0 1
p = < 0 .0 0 0 1
B A
C
Figure 33 – Correlations between IL-10 FluoroSpot, IL-10 mRNA and IL-10 ELISA.
Cross sectional B cells were isolated and cultured with 1µg/mL CpG. Relative change in IL-10 mRNA and proportions of IL-
10-producing B cells are correlated (A) (n=36, NA=11, AR=12, SCIT=7, SLIT=5, withdrawal=1 –SCIT) as are changes in mRNA
to IL-10 protein concentration at 48 hours (B) (n=36 – distributed as in A). Finally IL-10 protein is correlated against
proportions of IL-10-producing B cells (C) (n=43, NA=14, AR=13, SCIT=8, SLIT=6, withdrawal=2 –of which 1 received SCIT
and 1 SLIT). Spearman correlations were carried out, r and p values are shown.
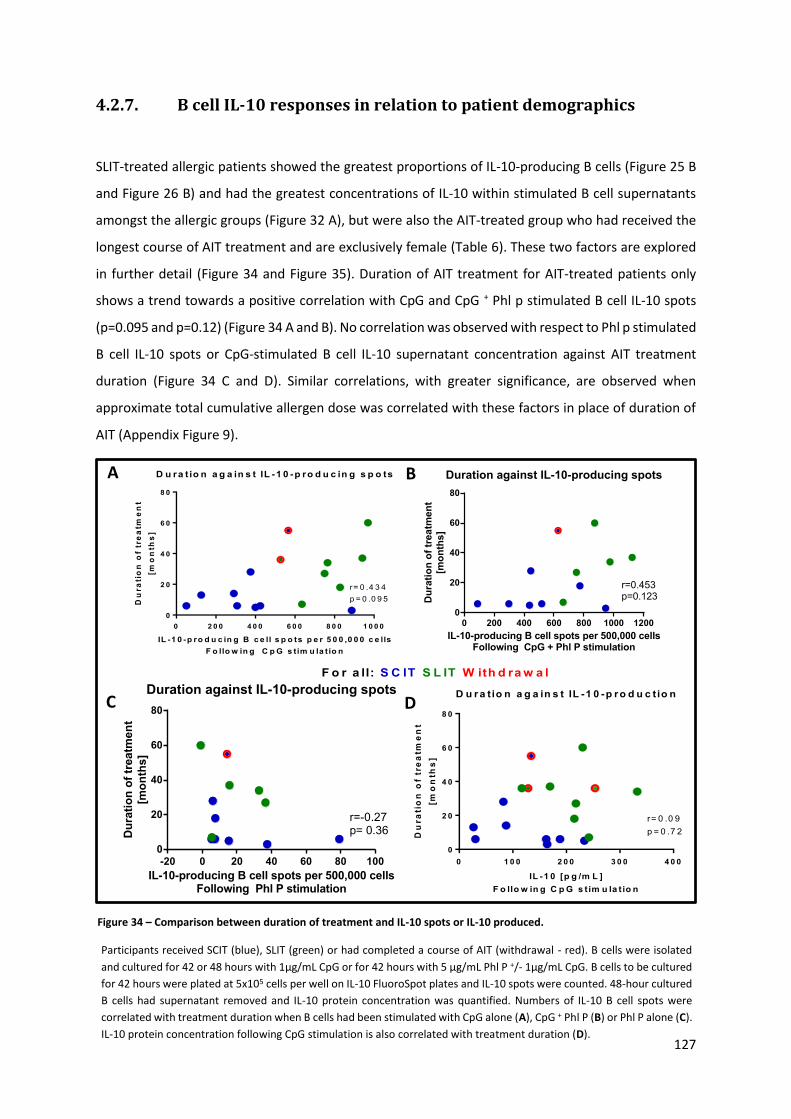
127
4.2.7. B cell IL-10 responses in relation to patient demographics
SLIT-treated allergic patients showed the greatest proportions of IL-10-producing B cells (Figure 25 B
and Figure 26 B) and had the greatest concentrations of IL-10 within stimulated B cell supernatants
amongst the allergic groups (Figure 32 A), but were also the AIT-treated group who had received the
longest course of AIT treatment and are exclusively female (Table 6). These two factors are explored
in further detail (Figure 34 and Figure 35). Duration of AIT treatment for AIT-treated patients only
shows a trend towards a positive correlation with CpG and CpG + Phl p stimulated B cell IL-10 spots
(p=0.095 and p=0.12) (Figure 34 A and B). No correlation was observed with respect to Phl p stimulated
B cell IL-10 spots or CpG-stimulated B cell IL-10 supernatant concentration against AIT treatment
duration (Figure 34 C and D). Similar correlations, with greater significance, are observed when
approximate total cumulative allergen dose was correlated with these factors in place of duration of
AIT (Appendix Figure 9).
D u ra t io n a g a in s t IL -1 0 -p ro d u c in g s p o ts
IL -1 0 -p ro d u c in g B c e ll s p o ts p e r 5 0 0 ,0 0 0 c e lls
F o llo w in g C p G s tim u la t io n
Du
ra
tio
n o
f tr
ea
tme
nt
[mo
nth
s]
0 2 0 0 4 0 0 6 0 0 8 0 0 1 0 0 0
0
2 0
4 0
6 0
8 0
r= 0 .4 3 4
p = 0 .0 9 5
F o r a ll: S C IT S L IT W ith d ra w a l
A B
Figure 34 – Comparison between duration of treatment and IL-10 spots or IL-10 produced.
Participants received SCIT (blue), SLIT (green) or had completed a course of AIT (withdrawal - red). B cells were isolated
and cultured for 42 or 48 hours with 1µg/mL CpG or for 42 hours with 5 µg/mL Phl P +/- 1µg/mL CpG. B cells to be cultured
for 42 hours were plated at 5x10⁵ cells per well on IL-10 FluoroSpot plates and IL-10 spots were counted. 48-hour cultured
B cells had supernatant removed and IL-10 protein concentration was quantified. Numbers of IL-10 B cell spots were
correlated with treatment duration when B cells had been stimulated with CpG alone (A), CpG + Phl P (B) or Phl P alone (C).
IL-10 protein concentration following CpG stimulation is also correlated with treatment duration (D).
C D u r a tio n a g a in s t IL -1 0 -p ro d u c tio n
IL -1 0 [p g /m L ]
F o llo w in g C p G s t im u la t io n
Du
ra
tio
n o
f tr
ea
tme
nt
[mo
nth
s]
0 1 0 0 2 0 0 3 0 0 4 0 0
0
2 0
4 0
6 0
8 0
r= 0 .0 9
p = 0 .7 2
Duration against IL-10-producing spots
IL-10-producing B cell spots per 500,000 cellsFollowing Phl P stimulation
Du
rati
on
of
trea
tmen
t
[mo
nth
s]
-20 0 20 40 60 80 1000
20
40
60
80
r=-0.27p= 0.36
Duration against IL-10-producing spots
IL-10-producing B cell spots per 500,000 cellsFollowing CpG + Phl P stimulation
Du
rati
on
of
trea
tmen
t
[mo
nth
s]
0 200 400 600 800 1000 12000
20
40
60
80
r=0.453p=0.123
D
128
Age shows a weak negative trend towards correlation against both proportions of IL-10-producing B
cells and IL-10 protein concentration following CpG stimulation (p=0.14 and p=0.102) (Figure 35 A and
B). When these same measures are compared for males v.s. females there is a trend towards greater
proportions of IL-10 spots amongst females (p=0.096) with a significantly greater concentration of IL-
10 amongst females (p=0.0007) for all donors (Figure 35 C and D). When the AIT samples are excluded
the trend is lost with IL-10 spots, but significance remains with respect to IL-10 protein produced
(p=0.0033) (Figure 35 E and F). IL-6 and TNFα protein concentrations were also significantly greater
amongst the female population as a whole, but show no significant difference when AIT donors are
excluded (Appendix Figure 10).
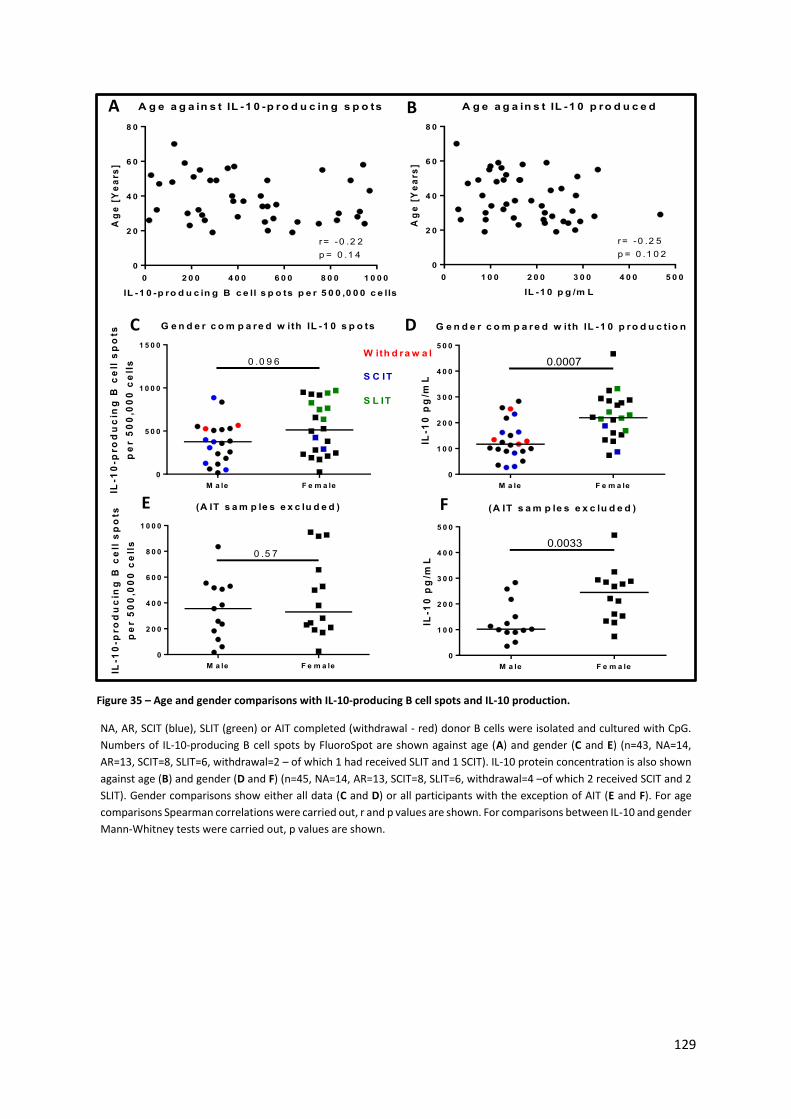
129
A A g e a g a in s t IL -1 0 p ro d u c e d
IL -1 0 p g /m L
Ag
e [
Ye
ars
]
0 1 0 0 2 0 0 3 0 0 4 0 0 5 0 0
0
2 0
4 0
6 0
8 0
r= -0 .2 5
p = 0 .1 0 2
G e n d e r c o m p a re d w ith IL -1 0 s p o ts
IL-1
0-p
ro
du
cin
g B
ce
ll s
po
ts
pe
r 5
00
,00
0 c
ell
s
M a le F e m a le
0
5 0 0
1 0 0 0
1 5 0 0
W ith d ra w a l
S C IT
S L IT
0 .0 9 6
G e n d e r c o m p a r e d w ith IL -1 0 p r o d u c tio n
IL-1
0 p
g/m
L
M a le F e m a le
0
1 0 0
2 0 0
3 0 0
4 0 0
5 0 0
0.0007
A g e a g a in s t IL -1 0 -p r o d u c in g s p o ts
IL -1 0 -p ro d u c in g B c e ll s p o ts p e r 5 0 0 ,0 0 0 c e lls
Ag
e [
Ye
ars
]
0 2 0 0 4 0 0 6 0 0 8 0 0 1 0 0 0
0
2 0
4 0
6 0
8 0
r= -0 .2 2
p = 0 .1 4
(A IT s a m p le s e x c lu d e d )
IL-1
0-p
ro
du
cin
g B
ce
ll s
po
ts
pe
r 5
00
,00
0 c
ell
s
M a le F e m a le
0
2 0 0
4 0 0
6 0 0
8 0 0
1 0 0 0
0 .5 7
(A IT s a m p le s e x c lu d e d )
IL-1
0 p
g/m
L
M a le F e m a le
0
1 0 0
2 0 0
3 0 0
4 0 0
5 0 0
0.0033
B
E F
C D
Figure 35 – Age and gender comparisons with IL-10-producing B cell spots and IL-10 production.
NA, AR, SCIT (blue), SLIT (green) or AIT completed (withdrawal - red) donor B cells were isolated and cultured with CpG.
Numbers of IL-10-producing B cell spots by FluoroSpot are shown against age (A) and gender (C and E) (n=43, NA=14,
AR=13, SCIT=8, SLIT=6, withdrawal=2 – of which 1 had received SLIT and 1 SCIT). IL-10 protein concentration is also shown
against age (B) and gender (D and F) (n=45, NA=14, AR=13, SCIT=8, SLIT=6, withdrawal=4 –of which 2 received SCIT and 2
SLIT). Gender comparisons show either all data (C and D) or all participants with the exception of AIT (E and F). For age
comparisons Spearman correlations were carried out, r and p values are shown. For comparisons between IL-10 and gender
Mann-Whitney tests were carried out, p values are shown.
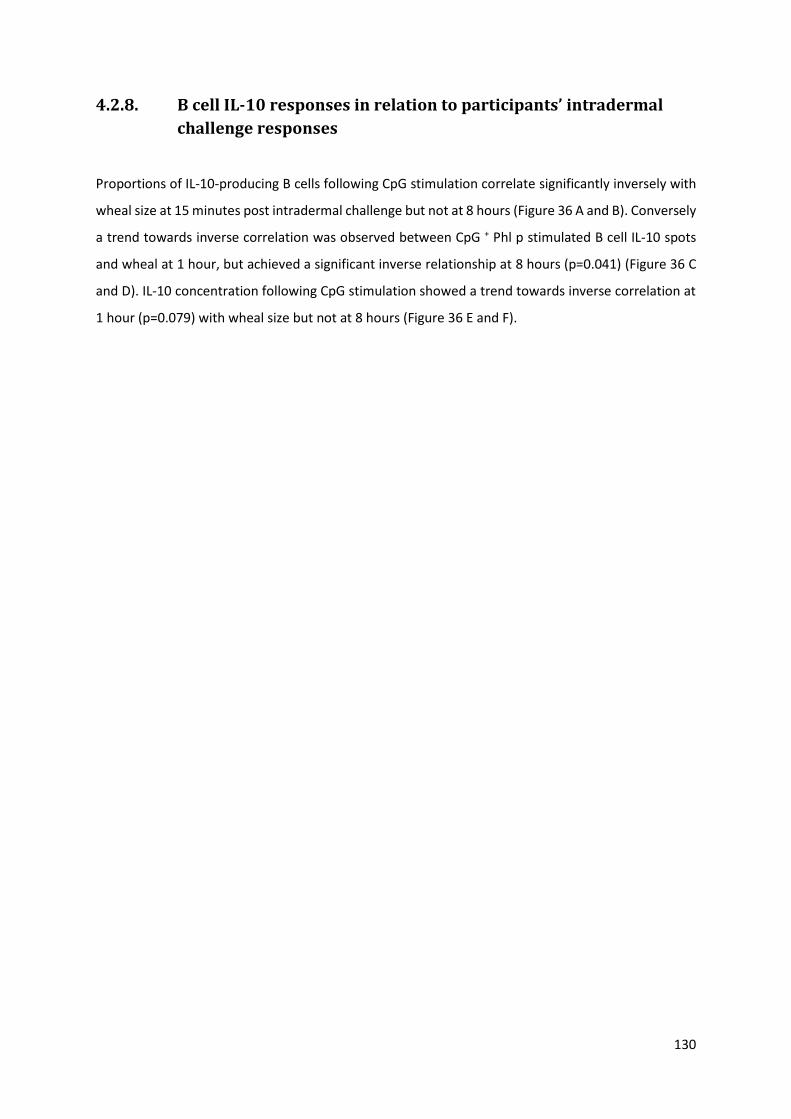
130
4.2.8. B cell IL-10 responses in relation to participants’ intradermal
challenge responses
Proportions of IL-10-producing B cells following CpG stimulation correlate significantly inversely with
wheal size at 15 minutes post intradermal challenge but not at 8 hours (Figure 36 A and B). Conversely
a trend towards inverse correlation was observed between CpG + Phl p stimulated B cell IL-10 spots
and wheal at 1 hour, but achieved a significant inverse relationship at 8 hours (p=0.041) (Figure 36 C
and D). IL-10 concentration following CpG stimulation showed a trend towards inverse correlation at
1 hour (p=0.079) with wheal size but not at 8 hours (Figure 36 E and F).
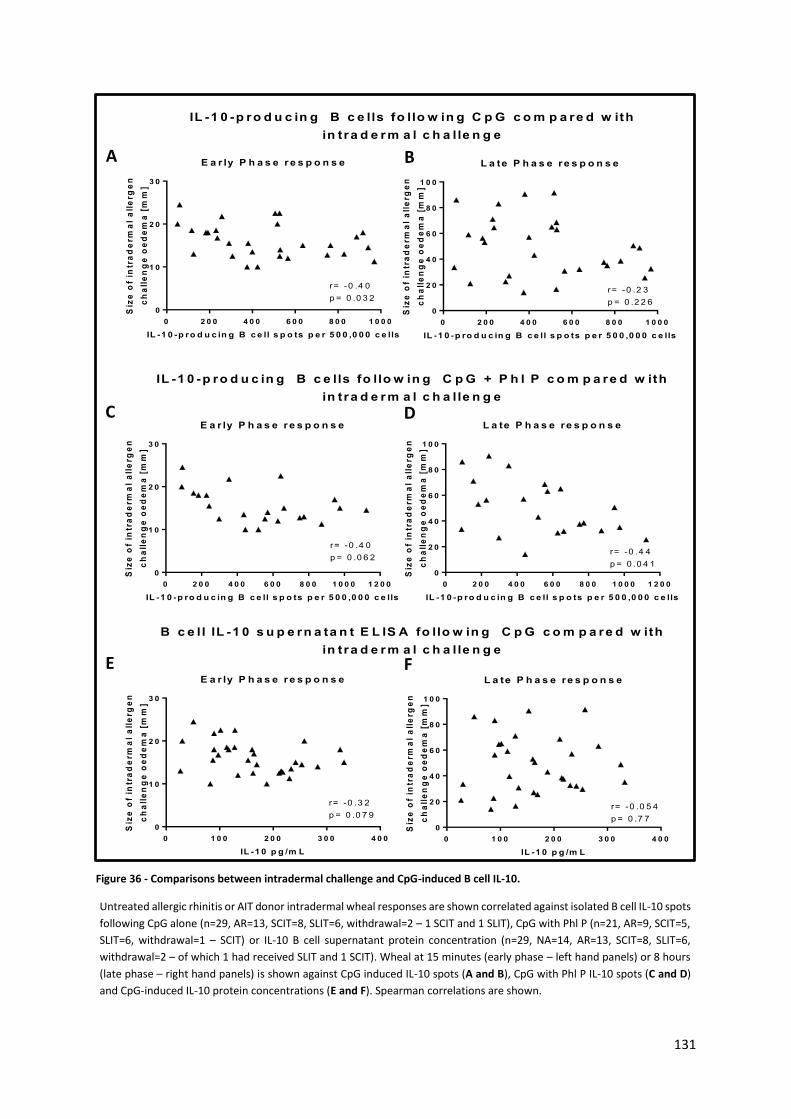
131
E a r ly P h a s e r e s p o n s e
IL -1 0 -p ro d u c in g B c e ll s p o ts p e r 5 0 0 ,0 0 0 c e lls
Siz
e o
f in
tra
de
rma
l a
lle
rge
n
ch
all
en
ge
oe
de
ma
[m
m]
0 2 0 0 4 0 0 6 0 0 8 0 0 1 0 0 0 1 2 0 0
0
1 0
2 0
3 0
r= -0 .4 0
p = 0 .0 6 2
L a te P h a s e r e s p o n s e
IL -1 0 -p ro d u c in g B c e ll s p o ts p e r 5 0 0 ,0 0 0 c e lls
Siz
e o
f in
tra
de
rma
l a
lle
rge
n
ch
all
en
ge
oe
de
ma
[m
m]
0 2 0 0 4 0 0 6 0 0 8 0 0 1 0 0 0 1 2 0 0
0
2 0
4 0
6 0
8 0
1 0 0
r= -0 .4 4
p = 0 .0 4 1
E a r ly P h a s e r e s p o n s e
IL -1 0 p g /m L
Siz
e o
f in
tra
de
rma
l a
lle
rge
n
ch
all
en
ge
oe
de
ma
[m
m]
0 1 0 0 2 0 0 3 0 0 4 0 0
0
1 0
2 0
3 0
r= -0 .3 2
p = 0 .0 7 9
L a te P h a s e r e s p o n s e
IL -1 0 p g /m L
Siz
e o
f in
tra
de
rma
l a
lle
rge
n
ch
all
en
ge
oe
de
ma
[m
m]
0 1 0 0 2 0 0 3 0 0 4 0 0
0
2 0
4 0
6 0
8 0
1 0 0
r= -0 .0 5 4
p = 0 .7 7
IL -1 0 -p ro d u c in g B c e lls fo llo w in g C p G c o m p a re d w ith
in tra d e r m a l c h a lle n g e
IL -1 0 -p ro d u c in g B c e lls fo llo w in g C p G + P h l P c o m p a re d w ith
in tra d e r m a l c h a lle n g e
E a r ly P h a s e r e s p o n s e
IL -1 0 -p ro d u c in g B c e ll s p o ts p e r 5 0 0 ,0 0 0 c e lls
Siz
e o
f in
tra
de
rma
l a
lle
rge
n
ch
all
en
ge
oe
de
ma
[m
m]
0 2 0 0 4 0 0 6 0 0 8 0 0 1 0 0 0
0
1 0
2 0
3 0
r= -0 .4 0
p = 0 .0 3 2
L a te P h a s e r e s p o n s e
IL -1 0 -p ro d u c in g B c e ll s p o ts p e r 5 0 0 ,0 0 0 c e lls
Siz
e o
f in
tra
de
rma
l a
lle
rge
n
ch
all
en
ge
oe
de
ma
[m
m]
0 2 0 0 4 0 0 6 0 0 8 0 0 1 0 0 0
0
2 0
4 0
6 0
8 0
1 0 0
r= -0 .2 3
p = 0 .2 2 6
B c e ll IL -1 0 s u p e rn a ta n t E L IS A fo llo w in g C p G c o m p a re d w ith
in tra d e r m a l c h a lle n g e
A B
Figure 36 - Comparisons between intradermal challenge and CpG-induced B cell IL-10.
Untreated allergic rhinitis or AIT donor intradermal wheal responses are shown correlated against isolated B cell IL-10 spots
following CpG alone (n=29, AR=13, SCIT=8, SLIT=6, withdrawal=2 – 1 SCIT and 1 SLIT), CpG with Phl P (n=21, AR=9, SCIT=5,
SLIT=6, withdrawal=1 – SCIT) or IL-10 B cell supernatant protein concentration (n=29, NA=14, AR=13, SCIT=8, SLIT=6,
withdrawal=2 – of which 1 had received SLIT and 1 SCIT). Wheal at 15 minutes (early phase – left hand panels) or 8 hours
(late phase – right hand panels) is shown against CpG induced IL-10 spots (A and B), CpG with Phl P IL-10 spots (C and D)
and CpG-induced IL-10 protein concentrations (E and F). Spearman correlations are shown.
C D
E F

132
4.2.9. Clinical outcomes of nasal allergen challenge
Nasal allergen challenge (NAC) was carried out on participants of this study (as described in 2.10.4, on
p60). Clinical outcomes are reported to demonstrate successful allergen challenge (Figure 37 and
Appendix Table 5) (data presented with kind permission of Dr. Guy Scadding, unpublished data).
Physiological response to NAC is measured by change in peak nasal inspiratory flow (PNIF) from
baseline. Data shows area under the curve for change in the first hour (early phase response) in
addition to change over the remaining 7 hours (late phase response) combined equally. Significant
reduction in nasal inspiratory flow was observed amongst untreated grass allergics compared to
normal controls. Significantly reduced nasal blockage amongst AIT-treated donors combined is
observed as compared with untreated grass allergic donors. Significance is achieved when SCIT-
treated donors alone are compared with untreated allergics, however, SLIT-treated donors alone do
not obtain significantly reduced nasal blockage compared to untreated allergics. Despite just 4 donors,
AIT-withdrawal donors also had significantly reduced nasal blockage compared to untreated donors.
Ch
an
ge
in
P
NIF
- E
PR
+ L
PR
[are
a u
nd
er c
urv
e]
N o rm a l G ra s s
A lle rg ic
A IT A IT
W ith d ra w a l
-4 0 0
-2 0 0
0
2 0 0< 0 .0 0 0 1 0 .0 1 6
0 .0 0 5
N o rm a l G ra s s
A lle rg ic
S C IT S L IT A IT
W ith d ra w a l
-4 0 0
-2 0 0
0
2 0 0
0 .2 7
< 0 .0 0 0 1 0 .0 0 8 0 .5 5
N a s a l b lo c k a g e fo l lo w in g a lle rg e n c h a l le n g e
Figure 37 – Change in peak nasal flow demonstrates nasal blockage following allergen challenge.
Patients were monitored before and throughout nasal allergen challenge for nasal blockage by measurement of peak nasal
inspiratory flow (PNIF). Data shows change in PNIF from baseline over the first hour (EPR) and during hours 1-8 (LPR) equally
weighted (EPR+LPR) as change in PNIF, area under the curve for each. Values shown are p values resulting from Mann-
Whitney tests. Line shows median values for each group. Data courtesy of Dr Guy Scadding (Scadding, G.W. et al.,
unpublished data).

133
4.2.10. B cell sub populations before and after nasal allergen challenge
Proportions of B cell subsets previously examined for IL-10 capacity (Figure 11) are explored across
the clinical phenotypes within this study (Figure 38). Study participants received an NAC. Pre and post
NAC blood was taken and directly stained for B cell surface markers in conjunction with counting
beads, and gated as shown (Figure 38).
Figure 38 – B cell subset analysis of nasal allergen challenge during cross-sectional study.
NA, AR, SCIT, SLIT and AIT completed (withdrawal) (n=46, NA=14, AR=14, SCIT=8, SLIT=6, withdrawal=4 – of which 2 had
received SLIT and 2 SCIT) volunteers underwent grass-pollen nasal allergen challenge during a single day. Blood was taken
before and 8 hours following allergen challenge. Whole blood was stained for flow cytometry and run with cell counting
beads in order to quantify B cell subsets. Representative staining of B cell subsets is shown, top to bottom and left to right:
whole population by size (FSC/SSC), gating of counting beads, gating for CD19, and within CD19 population CD27+,
CD24hiCD27+, CD5hi, CD5+CD1dhi, CD24hiCD38hi, CD71+CD73- and CD25+ are gated.

134
4.2.10.1. Baseline comparison of B cell subsets between study
participants
Comparison of numbers of circulating total CD19+ B cells in the absence of challenge at baseline shows
significantly greater numbers of total B cells amongst grass allergics compared to normal controls
(p=0.022), and a trend towards greater numbers amongst AIT-treated allergics against normal controls
(p=0.076) (Figure 39). Possibly as a result of these differences in overall numbers, all subsets show
similar differences between the clinical phenotypes.
Thus percentages of B cell subsets are shown within the clinical groups (Figure 40). No differences
were observed between non-allergic controls, allergic patients and immunotherapy-treated patients
where percentages of CD24hi CD27+ (Figure 40 B) or CD5hi (Figure 40 D) are compared. CD27-expressing
B cells amongst AIT-treated patients showed a trend towards greater proportions compared to normal
controls (p=0.13) (Figure 40 A). Grass allergics had a trend toward greater proportions of CD5+ CD1dhi
B cells compared to non-allergic controls (p=0.13) and significantly greater than AIT-treated patients
(p=0.012) (Figure 40 C). A non-significant trend towards increased grass allergic CD24hi CD38hi B cells
against normal controls (p=0.13) (Figure 40 E). Proportions of CD71+ CD73- B cells trended towards
greater AIT-treated patients compared with non-allergic controls (p=0.14) (Figure 40 F). AIT-
withdrawal patients had significantly greater proportions of CD71+ CD73- B cells compared to
untreated allergics (p=0.046). Proportions of CD25+ B cells show a trend to be fewer within the AIT-
treated group compared to untreated patients (p=0.15) (Figure 40 G).
N u m b e rs o f C D 1 9+ c e lls a t b a s e lin e
Ce
lls
/ul
of
wh
ole
blo
od
N o r m a l G r a s s
Alle r g ic
AIT AIT
W ith d r a w a l
0
2 0 0
4 0 0
6 0 0
8 0 0
0 .0 2 2 0 .7 6
0 .0 7 6
For AIT samples: SCIT SLIT
Figure 39 – Numbers of CD19+ B cells at baseline between clinical groups
NA, AR, SCIT, SLIT and AIT completed (withdrawal) (n=46, NA=14, AR=14, SCIT=8, SLIT=6, withdrawal=4 – of which 2 had
received SLIT and 2 SCIT) volunteers underwent grass-pollen nasal allergen challenge during a single day. Blood was taken
before and 8 hours following allergen challenge. CD19+ B cell numbers are shown, compared by Mann-Whitney test, p
values are shown.
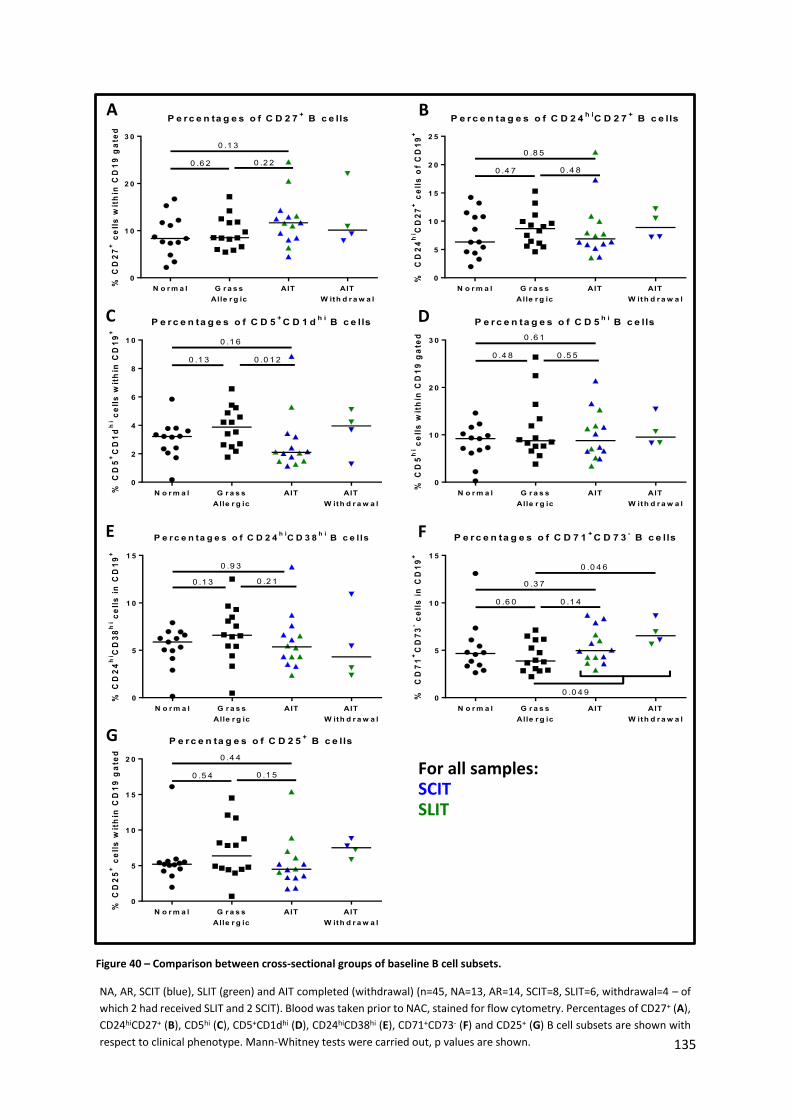
135
P e r c e n ta g e s o f C D 2 7+ B c e lls
% C
D2
7+
ce
lls
wit
hin
CD
19
ga
ted
N o r m a l G r a s s
Alle r g ic
AIT AIT
W ith d r a w a l
0
1 0
2 0
3 0
0 .6 2 0 .2 2
0 .1 3
P e r c e n ta g e s o f C D 2 4h i
C D 2 7+ B c e lls
%
CD
24
hi C
D2
7+
ce
lls
of
CD
19
+
N o r m a l G r a s s
Alle r g ic
AIT AIT
W ith d r a w a l
0
5
1 0
1 5
2 0
2 5
0 .4 7 0 .4 8
0 .8 5
P e r c e n ta g e s o f C D 5h i
B c e lls
% C
D5
hi c
ell
s w
ith
in C
D1
9 g
ate
d
N o r m a l G r a s s
Alle r g ic
AIT AIT
W ith d r a w a l
0
1 0
2 0
3 0
0 .4 8 0 .5 5
0 .6 1
P e r c e n ta g e s o f C D 2 4h i
C D 3 8h i
B c e l ls
% C
D2
4h
i CD
38
hi c
ell
s i
n C
D1
9+
N o r m a l G r a s s
Alle r g ic
AIT AIT
W ith d r a w a l
0
5
1 0
1 5
0 .1 3 0 .2 1
0 .9 3
P e r c e n ta g e s o f C D 7 1+C D 7 3
- B c e lls
%
CD
71
+C
D7
3- c
ell
s i
n C
D1
9+
N o r m a l G r a s s
Alle r g ic
AIT AIT
W ith d r a w a l
0
5
1 0
1 5
0 .6 0 0 .1 4
0 .3 7
0 .0 4 6
0 .0 4 9
P e r c e n ta g e s o f C D 2 5+ B c e lls
% C
D2
5+
ce
lls
wit
hin
CD
19
ga
ted
N o r m a l G r a s s
Alle r g ic
AIT AIT
W ith d r a w a l
0
5
1 0
1 5
2 0
0 .5 4 0 .1 5
0 .4 4
C D
E F
G
For all samples: SCIT SLIT
Figure 40 – Comparison between cross-sectional groups of baseline B cell subsets.
NA, AR, SCIT (blue), SLIT (green) and AIT completed (withdrawal) (n=45, NA=13, AR=14, SCIT=8, SLIT=6, withdrawal=4 – of
which 2 had received SLIT and 2 SCIT). Blood was taken prior to NAC, stained for flow cytometry. Percentages of CD27+ (A),
CD24hiCD27+ (B), CD5hi (C), CD5+CD1dhi (D), CD24hiCD38hi (E), CD71+CD73- (F) and CD25+ (G) B cell subsets are shown with
respect to clinical phenotype. Mann-Whitney tests were carried out, p values are shown.
A B
P e r c e n ta g e s o f C D 5+C D 1 d
h i B c e lls
% C
D5
+C
D1
dh
i ce
lls
wit
hin
CD
19
+
N o r m a l G r a s s
Alle r g ic
AIT AIT
W ith d r a w a l
0
2
4
6
8
1 0
0 .1 3 0 .0 1 2
0 .1 6

136
4.2.10.2. Changes in B cell subsets following nasal allergen challenge (NAC)
Numbers of B cells per µL of blood showed a clear trend towards an increase following allergen
challenge (compared to baseline) in normal controls, AIT-treated allergic patients and completed AIT-
treated allergics (p=0.08, p=0.032 and p=0.13 respectively) (Figure 41 A), however grass allergic
patients did not respond in the same way, of whom just 6 of the 11 patients had increased numbers
of B cells post NAC (p=0.58). This increase in total number of B cells in all groups except grass allergics
is repeated in all B cell subsets showing the same trend for numbers of CD27+, CD24hiCD27+, CD5hi,
CD5+CD1dhi, CD24hiCD38hi and CD25+ B cells (Appendix Figure 13) increased following NAC. Due to this
trend largely being attributed to changes in the whole CD19+ population, percentages of B cell subsets
will take the focus of examination post NAC. Percentages of CD27-expressing B cells trend towards an
increase following NAC in the normal control group alone (p=0.12) (Figure 41 B), furthermore the
percentages of CD24hi CD27+ B cells were significantly increased following NAC in normal controls
alone (p=0.0002) (Figure 41 C). CD5hi B cells show a non-significant increase following NAC in non-
allergic controls alone (p=0.057) (Figure 41 D), despite only a minor change in median percentages of
cells (from 9.2% to 9.53%). No significant change was observed following NAC in the proportions of
CD5+ CD1dhi B cells (Figure 41 E), despite a trend towards a decrease within the grass allergic
population (p=0.12). The only B cell subset in which the change in proportions of B cells (replicated by
the change in numbers) following challenge is within the CD24hiCD38hi population (Figure 41 F). The
percentages within both normal control and AIT-treated groups increased significantly (p=0.027 and
p=0.005) (Figure 41 K), without any significant change in the grass allergic group. Percentages of
CD71+CD73- B cells show a non-significant trend towards a decrease in the AIT-treated population
alone (p=0.08) (Figure 41 M). Finally, the proportions of CD25+ B cells significantly increased following
challenge in the non-allergic group alone (Figure 41 O).
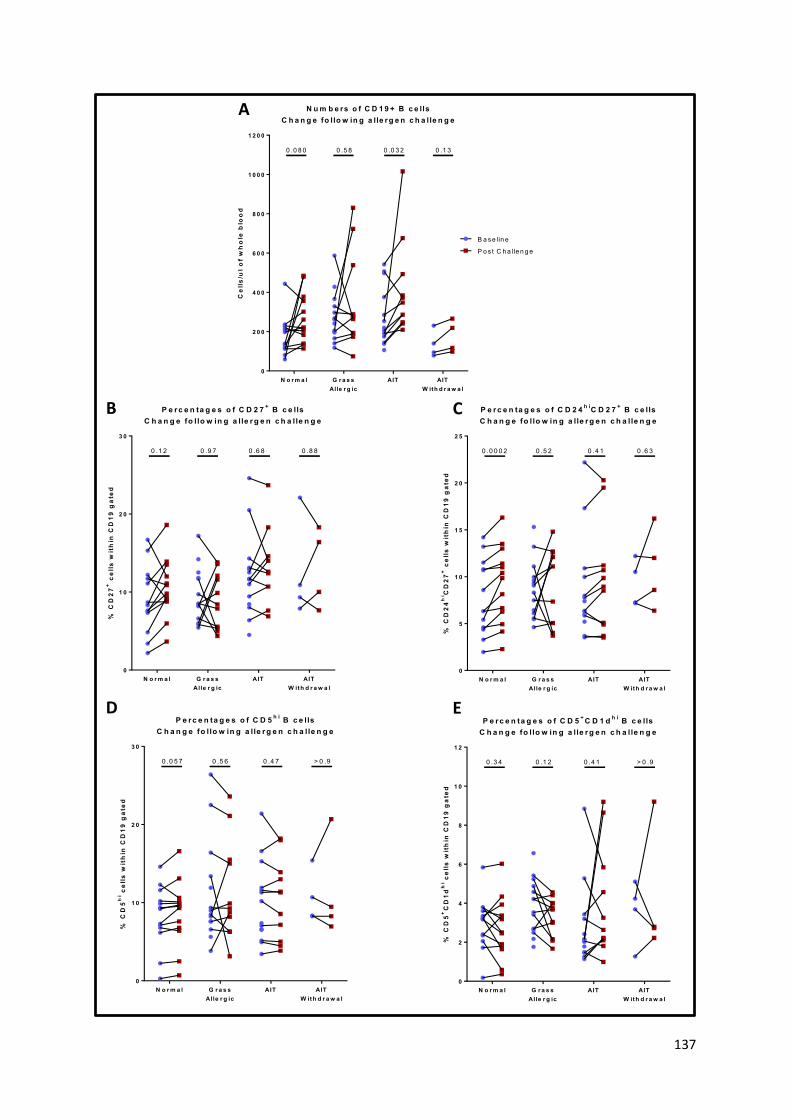
137
N u m b e rs o f C D 1 9 + B c e lls
C h a n g e fo l lo w in g a lle r g e n c h a lle n g e
Ce
lls
/ul
of
wh
ole
blo
od
N o r m a l G r a s s
Alle r g ic
AIT AIT
W ith d r a w a l
0
2 0 0
4 0 0
6 0 0
8 0 0
1 0 0 0
1 2 0 0
0 .0 8 0 0 .5 8 0 .0 3 2 0 .1 3
B a s e lin e
P o s t C h a lle n g e
P e r c e n ta g e s o f C D 2 7+ B c e lls
C h a n g e fo l lo w in g a lle r g e n c h a lle n g e
% C
D2
7+
ce
lls
wit
hin
CD
19
ga
ted
N o r m a l G r a s s
Alle r g ic
AIT AIT
W ith d r a w a l
0
1 0
2 0
3 0
0 .1 2 0 .9 7 0 .6 8 0 .8 8
P e r c e n ta g e s o f C D 2 4h i
C D 2 7+ B c e lls
C h a n g e fo l lo w in g a lle r g e n c h a lle n g e
% C
D2
4h
i CD
27
+ c
ell
s w
ith
in C
D1
9 g
ate
d
N o r m a l G r a s s
Alle r g ic
AIT AIT
W ith d r a w a l
0
5
1 0
1 5
2 0
2 5
0 .0 0 0 2 0 .5 2 0 .4 1 0 .6 3
P e r c e n ta g e s o f C D 5+C D 1 d
h i B c e lls
C h a n g e fo l lo w in g a lle r g e n c h a lle n g e
% C
D5
+C
D1
dh
i ce
lls
wit
hin
CD
19
ga
ted
N o r m a l G r a s s
Alle r g ic
AIT AIT
W ith d r a w a l
0
2
4
6
8
1 0
1 2
0 .3 4 0 .1 2 0 .4 1 > 0 .9
P e r c e n ta g e s o f C D 5h i
B c e lls
C h a n g e fo l lo w in g a lle r g e n c h a lle n g e
% C
D5
hi c
ell
s w
ith
in C
D1
9 g
ate
d
N o r m a l G r a s s
Alle r g ic
AIT AIT
W ith d r a w a l
0
1 0
2 0
3 0
0 .0 5 7 0 .5 6 0 .4 7 > 0 .9
B C
A
D E
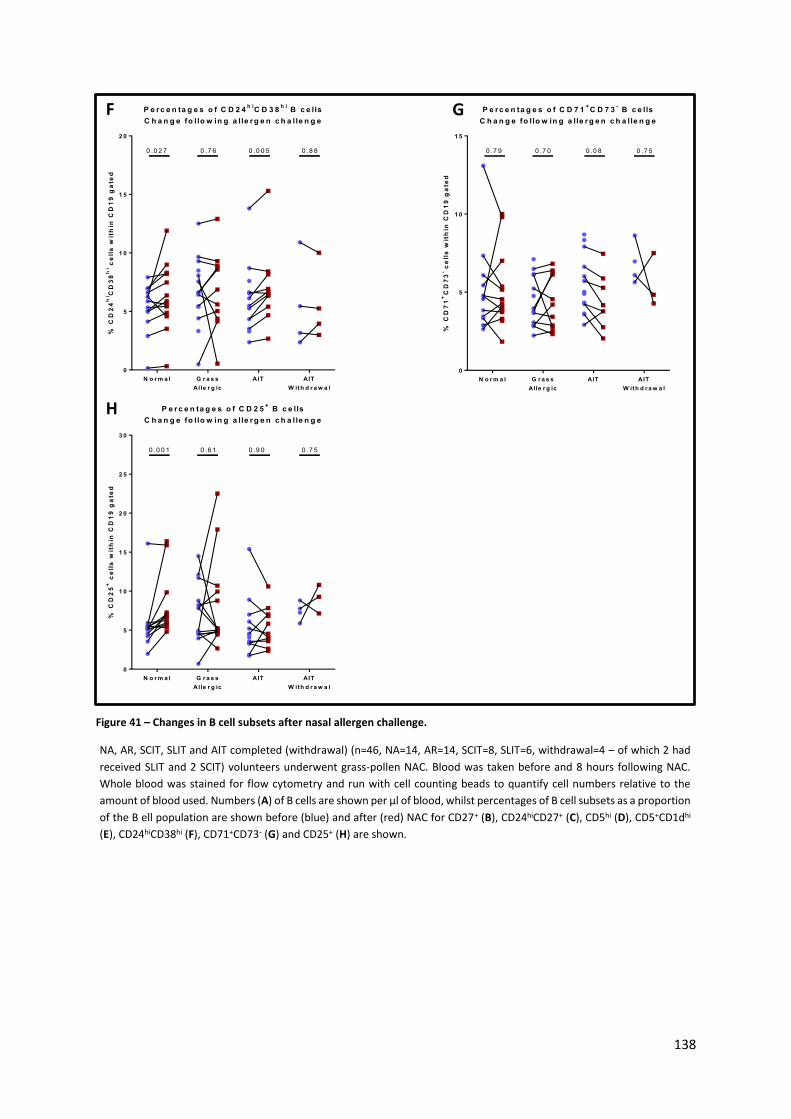
138
P e r c e n ta g e s o f C D 2 4
h iC D 3 8
h i B c e lls
C h a n g e fo l lo w in g a lle r g e n c h a lle n g e
% C
D2
4h
i CD
38
hi c
ell
s w
ith
in C
D1
9 g
ate
d
N o r m a l G r a s s
Alle r g ic
AIT AIT
W ith d r a w a l
0
5
1 0
1 5
2 0
0 .0 2 7 0 .7 6 0 .0 0 5 0 .8 8
P e r c e n ta g e s o f C D 2 5+ B c e lls
C h a n g e fo l lo w in g a lle r g e n c h a lle n g e
% C
D2
5+
ce
lls
wit
hin
CD
19
ga
ted
N o r m a l G r a s s
Alle r g ic
AIT AIT
W ith d r a w a l
0
5
1 0
1 5
2 0
2 5
3 0
0 .0 0 1 0 .6 1 0 .9 0 0 .7 5
P e r c e n ta g e s o f C D 7 1+C D 7 3
- B c e lls
C h a n g e fo l lo w in g a lle r g e n c h a lle n g e
% C
D7
1+
CD
73
- ce
lls
wit
hin
CD
19
ga
ted
N o r m a l G r a s s
Alle r g ic
AIT AIT
W ith d r a w a l
0
5
1 0
1 5
0 .7 9 0 .7 0 0 .0 8 0 .7 5
H
F G
Figure 41 – Changes in B cell subsets after nasal allergen challenge.
NA, AR, SCIT, SLIT and AIT completed (withdrawal) (n=46, NA=14, AR=14, SCIT=8, SLIT=6, withdrawal=4 – of which 2 had
received SLIT and 2 SCIT) volunteers underwent grass-pollen NAC. Blood was taken before and 8 hours following NAC.
Whole blood was stained for flow cytometry and run with cell counting beads to quantify cell numbers relative to the
amount of blood used. Numbers (A) of B cells are shown per µl of blood, whilst percentages of B cell subsets as a proportion
of the B ell population are shown before (blue) and after (red) NAC for CD27+ (B), CD24hiCD27+ (C), CD5hi (D), CD5+CD1dhi
(E), CD24hiCD38hi (F), CD71+CD73- (G) and CD25+ (H) are shown.
139
4.2.10.3. Changes in B cell subsets for non-allergic controls in the
absence of allergen challenge
To control for diurnal variation on the NAC day, which could account for the changes in B cell subsets
attributed to nasal allergen, 7 normal controls were recruited for blood samples at 0 and 8 hours on
an unchallenged control day (Figure 42). Donors differed from the cross-sectional study but were
equally screened for allergic rhinitic symptoms and aeroallergen sensitisation. Proportions of B cell
subsets did not differ throughout the day (Figure 42 B), with the exception of CD1dhi CD5+ B cells which
were significantly decreased at 8 hours compared to baseline. No proportions of B cell subsets
examined were increased at 8 hours, as they were in the NAC day, relative to the whole B cell
population. However, overall B cell numbers were significantly increased at 8 hours compared to
baseline (p=0.016) (Figure 42 A), which resulted in numbers of CD5hi, CD24hi CD38hi and CD71+ CD73-
B cells to be significantly increased (Appendix Figure 14).
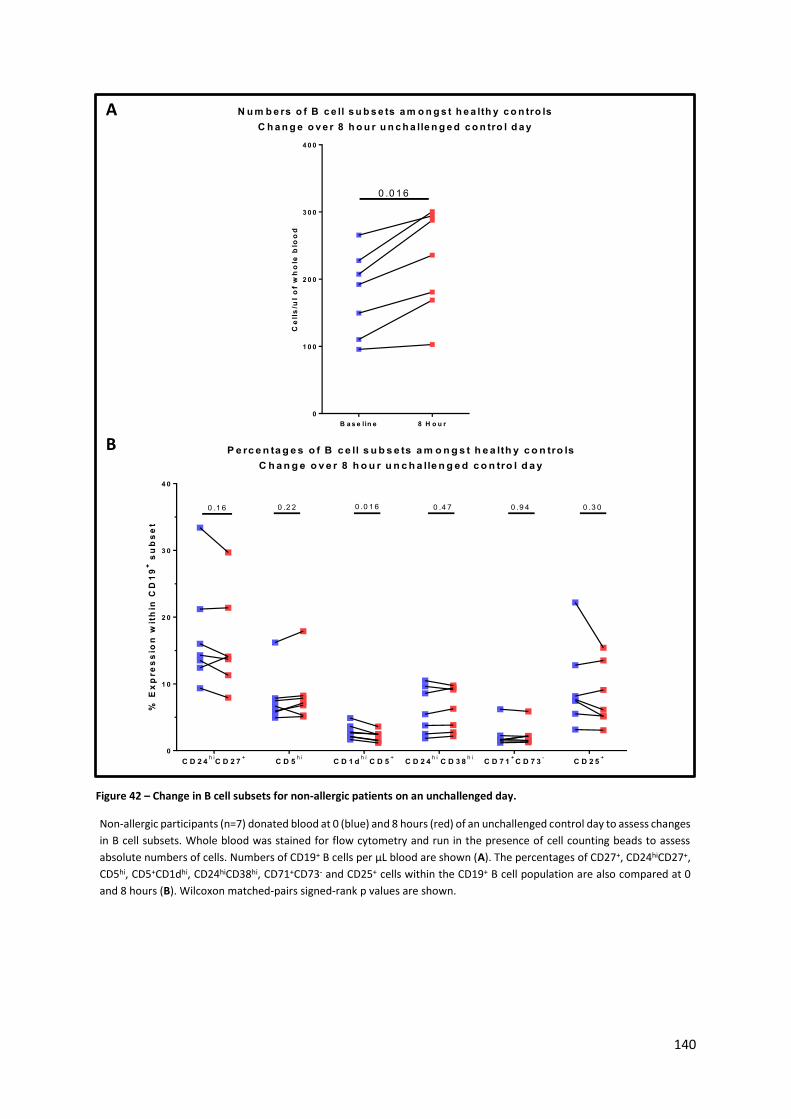
140
A
B
Figure 42 – Change in B cell subsets for non-allergic patients on an unchallenged day.
Non-allergic participants (n=7) donated blood at 0 (blue) and 8 hours (red) of an unchallenged control day to assess changes
in B cell subsets. Whole blood was stained for flow cytometry and run in the presence of cell counting beads to assess
absolute numbers of cells. Numbers of CD19+ B cells per µL blood are shown (A). The percentages of CD27+, CD24hiCD27+,
CD5hi, CD5+CD1dhi, CD24hiCD38hi, CD71+CD73- and CD25+ cells within the CD19+ B cell population are also compared at 0
and 8 hours (B). Wilcoxon matched-pairs signed-rank p values are shown.
N u m b e rs o f B c e ll s u b s e ts a m o n g s t h e a lth y c o n tro ls
C h a n g e o v e r 8 h o u r u n c h a lle n g e d c o n tro l d a y
Ce
lls
/ul
of
wh
ole
blo
od
B a s e lin e 8 H o u r
0
1 0 0
2 0 0
3 0 0
4 0 0
0 .0 1 6
P e rc e n ta g e s o f B c e ll s u b s e ts a m o n g s t h e a lth y c o n tro ls
C h a n g e o v e r 8 h o u r u n c h a lle n g e d c o n tro l d a y
% E
xp
re
ss
ion
wit
hin
CD
19
+ s
ub
se
t
C D 2 4h i
C D 2 7+
C D 5h i
C D 1 dh i
C D 5+
C D 2 4h i
C D 3 8h i
C D 7 1+
C D 7 3-
C D 2 5+
0
1 0
2 0
3 0
4 0
0 .1 6 0 .2 2 0 .0 1 6 0 .4 7 0 .9 4 0 .3 0
141
4.3. Examination of IL-10-producing B cells by histology
4.3.1. Immunohistochemistry staining of tonsil sections
Initially tonsil sections from historical donors undergoing routine tonsillectomy, who were not
clinically phenotyped as to their allergic status, were used in order to validate staining methodology
(detailed in section 2.11 on p61). Initially these sections were stained toward CD19, CD20, CD138 and
IL-10 alone. CD19 antibodies did not stain B cells within the tissue, instead showed only non-specific
staining of the epithelium (data not shown). CD20, CD138 and IL-10 showed positive staining, not
observed in matched sections with negative antibody nor PBS controls (data not shown). All
immunostaining was accompanied by DAPI (a nuclear stain) in order to localise individual cells within
the sections (Figure 43 – A and Figure 44 – A). Combined staining of tonsil sections with CD20 and IL-
10 (Figure 43) or CD138 and IL-10 (Figure 44) showed clearly detectable dual staining of both surface
markers with IL-10. High densities of B cells and good numbers of plasma cells, typically less densely
arranged, were observed in these sample tonsil sections. As staining of other features was not carried
out it is difficult to discriminate exacting location of these cells. CD20+ cells appeared to be within a
region dense with B cells and CD4+ T cells (stained during optimisation), suggesting these cells are
likely follicular B cells. IL-10-expressing B cells were not distinctive by location, given their sparsity in
some sections. CD138+ cells were much larger and scattered throughout the extra-follicular spaces,
with IL-10-expressing plasma cells also unremarkable by location. Dual staining for both CD20 and
CD138 positive cells co-stained for intracellular IL-10 are identified by arrows and appear to be greater
than background for IL-10. Areas containing these dual-stained cells are digitally zoomed for both
CD20 and IL-10 (Figure 43 E and F) and CD138 and IL-10 dual staining (Figure 44 B), with an example
of CD138 staining in the absence of IL-10 shown (Figure 44 C).
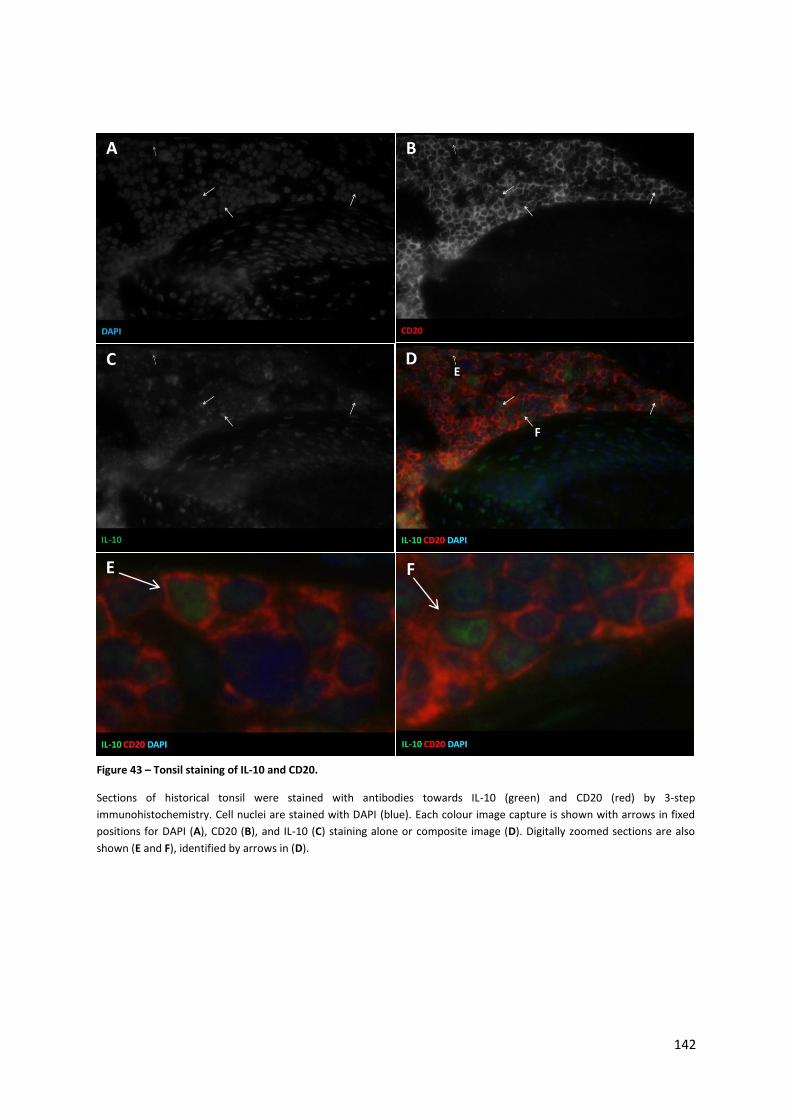
142
Figure 43 – Tonsil staining of IL-10 and CD20.
Sections of historical tonsil were stained with antibodies towards IL-10 (green) and CD20 (red) by 3-step
immunohistochemistry. Cell nuclei are stained with DAPI (blue). Each colour image capture is shown with arrows in fixed
positions for DAPI (A), CD20 (B), and IL-10 (C) staining alone or composite image (D). Digitally zoomed sections are also
shown (E and F), identified by arrows in (D).
E
F
B
C
A
D
E
E
F
F
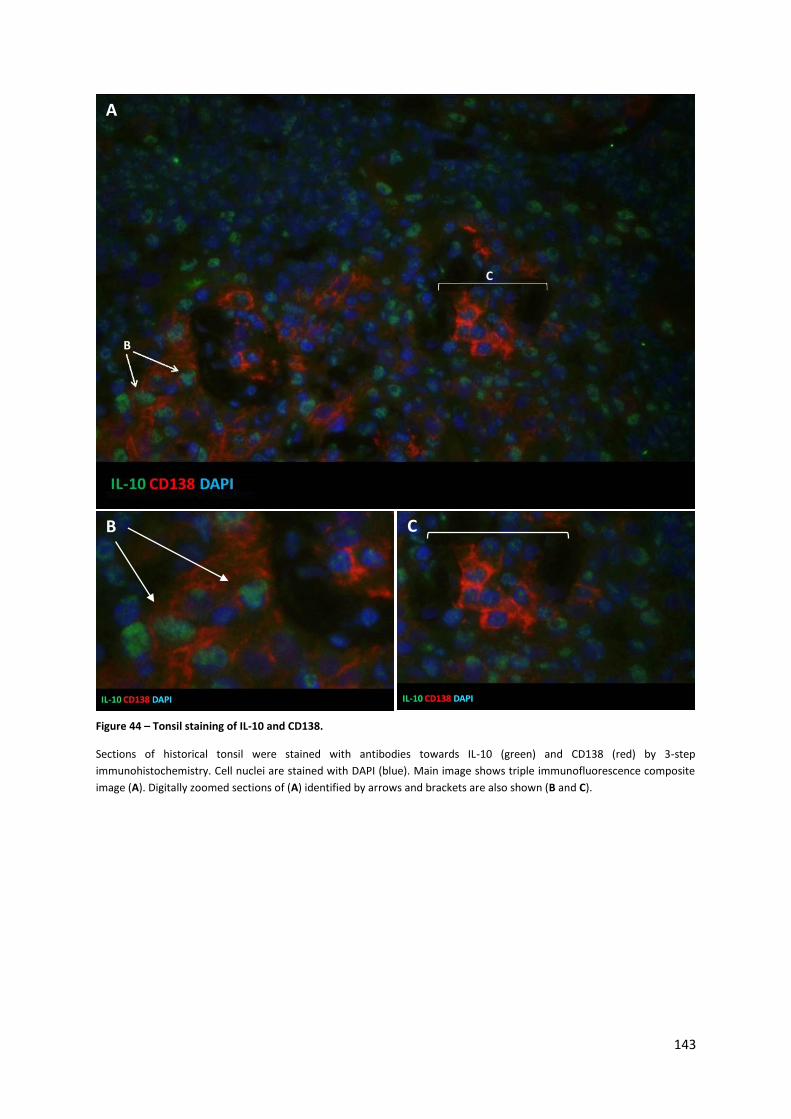
143
B
A
C
B
C
Figure 44 – Tonsil staining of IL-10 and CD138.
Sections of historical tonsil were stained with antibodies towards IL-10 (green) and CD138 (red) by 3-step
immunohistochemistry. Cell nuclei are stained with DAPI (blue). Main image shows triple immunofluorescence composite
image (A). Digitally zoomed sections of (A) identified by arrows and brackets are also shown (B and C).
144
4.3.2. Immunohistochemistry staining of nasal sections
Having validated the antibodies and staining in human tonsillar tissue for IL-10 and dual staining for B
cells (CD20) and plasma cells (CD138), nasal sections were then stained both by light and florescence
microscopy. CD20 and CD138 positive cells were identified in nasal sections by both light microscopy
(Figure 45 A and B, respectively) and fluorescence microscopy (Figure 45 C and D, respectively), with
negative staining observed amongst matched sections using the same concentration of isotype control
antibody (Figure 45 E). Arrows identify the CD20-stained cells which are harder to make out by light
microscope, but remain clear by fluorescence microscopy. Titration of IL-10 also confirmed that
positive staining was observed with IL-10 antibody used at 1 in 5 and 1 in 10 (Figure 46 A and B), but
with higher background observed at these higher concentrations, including non-specific epithelial
staining. Greater dilution of IL-10 did not convincingly reveal positively stained cells (Figure 46 C and
D). In order to confirm efficiency of the protocol an anti-CD3 antibody from the same species and also
a polyclonal antibody was used to demonstrate positive staining (Figure 46 E). Negative control
antibody did not show any positive staining (Figure 46 F), nor did PBS used in place of IL-10 antibody
(data not shown).
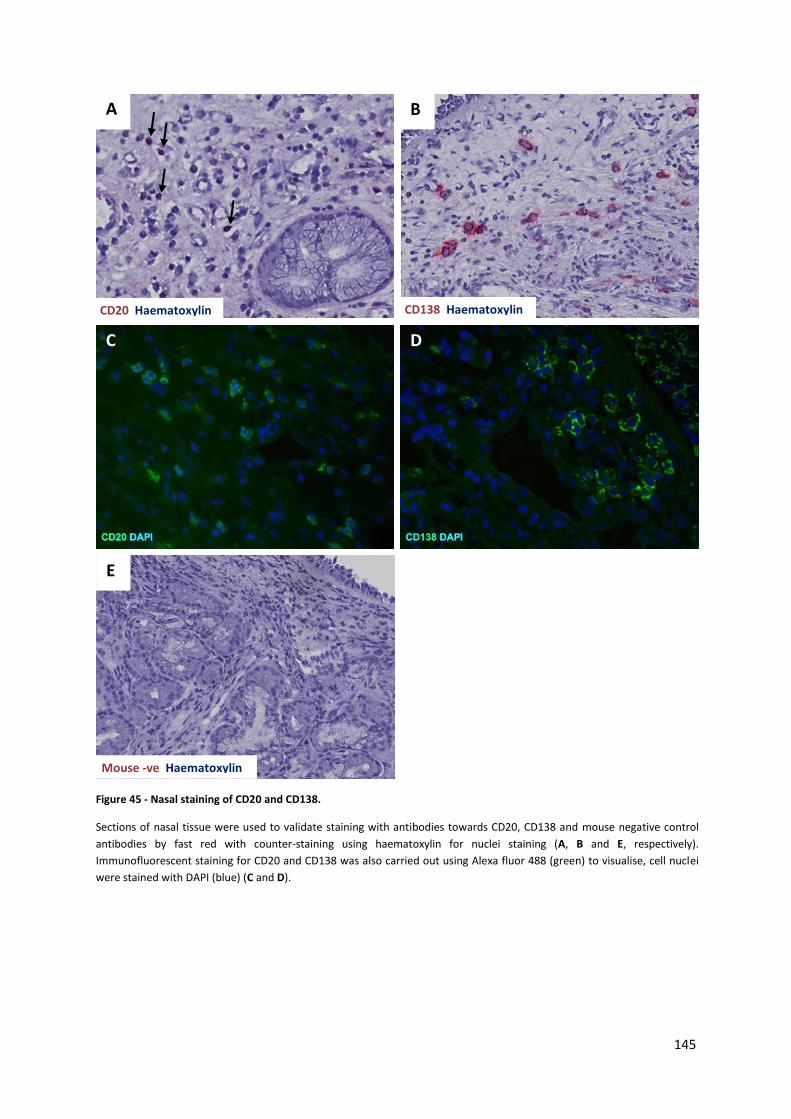
145
C D
Figure 45 - Nasal staining of CD20 and CD138.
Sections of nasal tissue were used to validate staining with antibodies towards CD20, CD138 and mouse negative control
antibodies by fast red with counter-staining using haematoxylin for nuclei staining (A, B and E, respectively).
Immunofluorescent staining for CD20 and CD138 was also carried out using Alexa fluor 488 (green) to visualise, cell nuclei
were stained with DAPI (blue) (C and D).
A
CD20 Haematoxylin CD138 Haematoxylin
B
Mouse -ve Haematoxylin
E
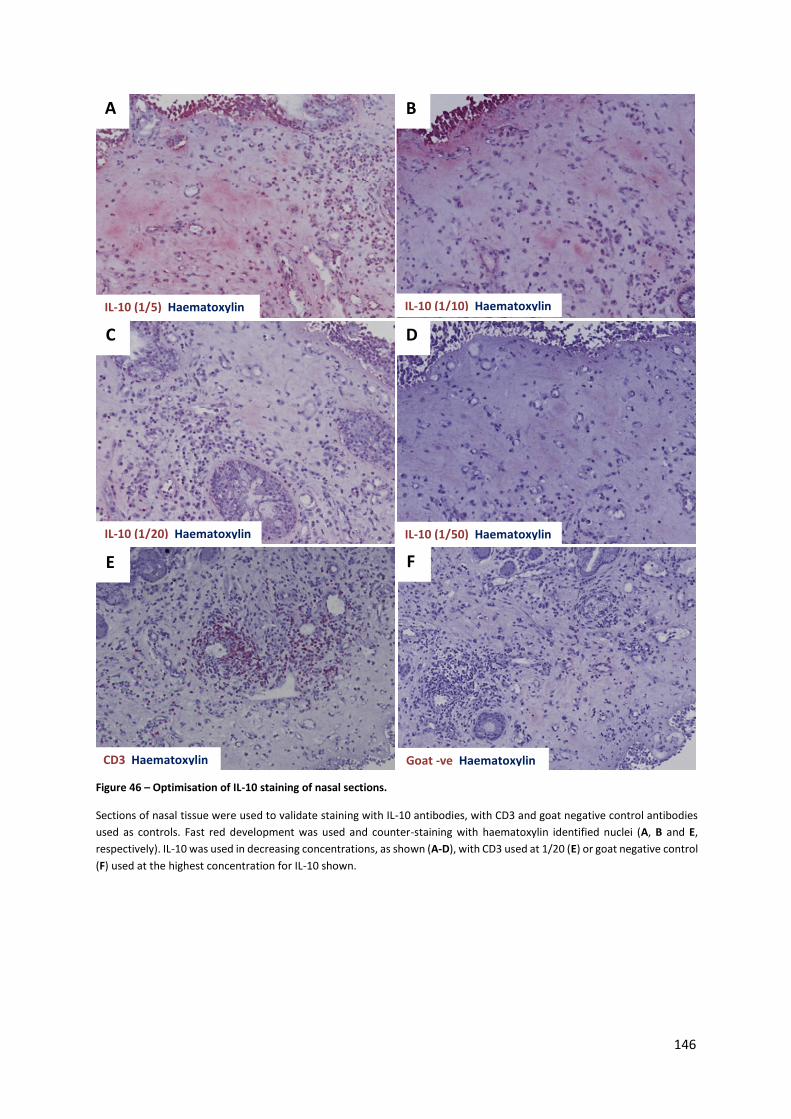
146
IL-10 (1/5) Haematoxylin
A
IL-10 (1/10) Haematoxylin
B
IL-10 (1/20) Haematoxylin
C
IL-10 (1/50) Haematoxylin
D
CD3 Haematoxylin
E
Goat -ve Haematoxylin
F
Figure 46 – Optimisation of IL-10 staining of nasal sections.
Sections of nasal tissue were used to validate staining with IL-10 antibodies, with CD3 and goat negative control antibodies
used as controls. Fast red development was used and counter-staining with haematoxylin identified nuclei (A, B and E,
respectively). IL-10 was used in decreasing concentrations, as shown (A-D), with CD3 used at 1/20 (E) or goat negative control
(F) used at the highest concentration for IL-10 shown.

147
Dual staining of nasal sections was initially carried out with CD4 (green) and CD20 (red) to confirm
both efficacious and discrete staining of these markers. CD4 is raised in goat as a polyclonal antibody,
comparable to the antibody used for IL-10 staining, whilst CD4+ cells are known to be present and
easier to detect. Discrete cellular staining of CD4+ and CD20+ cells was observed in nasal tissue (Figure
47 A). However, staining using the same concentration of goat negative control (green) and antibody
towards CD138 (red) showed non-specific IL-10 staining in these tissues (Figure 47 B, arrowed). This
was also observed with CD20 in the place of CD138 antibody or in the absence of other antibodies
(data not shown). However, closer examination of the green staining (digitally zoomed in Figure 47 C)
shows no background staining with weakly staining green cells. The reverse is shown in staining with
IL-10 antibody (green) and mouse negative control (red), in which clear IL-10 staining can be observed
(Figure 47 D, arrow 1) with weak non-specific staining in red (Figure 47 D, arrows labelled 2). These
non-specific staining cells appear to be eosinophils, with a granular cytoplasm and multi-lobed nuclei,
which have previously been found to show weak non-specific fluorescence under UV with both filters
(personal communication, Mikila Jacobson). Dual IL-10 and CD20 staining showed specific cells
staining for both targets (Figure 47 E); however no cells were co-stained for both CD20 and IL-10 in
these sections. Co-staining of IL-10 and CD138 showed one cell dual positive for both (Figure 47 F,
arrow), with clear staining separately of other cells.
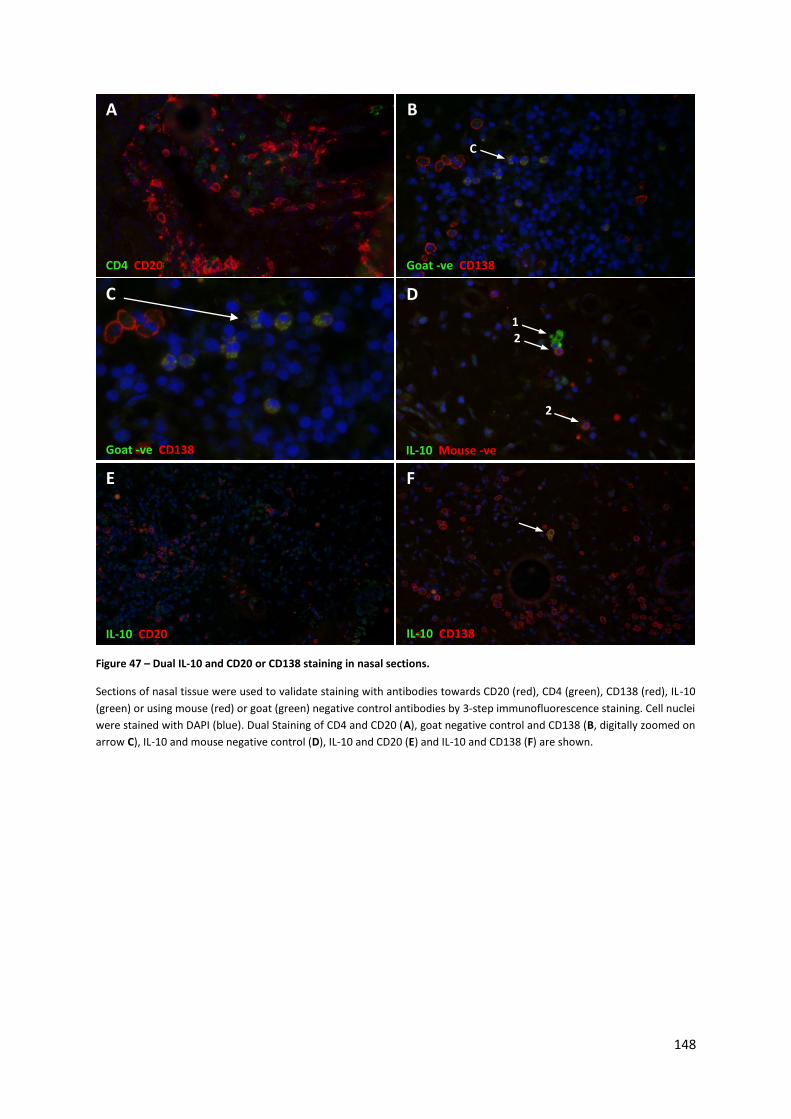
148
CD4 CD20
A
Goat -ve CD138
B
Goat -ve CD138
C
IL-10 Mouse -ve
D
C
IL-10 CD20
E
IL-10 CD138
F
Figure 47 – Dual IL-10 and CD20 or CD138 staining in nasal sections.
Sections of nasal tissue were used to validate staining with antibodies towards CD20 (red), CD4 (green), CD138 (red), IL-10
(green) or using mouse (red) or goat (green) negative control antibodies by 3-step immunofluorescence staining. Cell nuclei
were stained with DAPI (blue). Dual Staining of CD4 and CD20 (A), goat negative control and CD138 (B, digitally zoomed on
arrow C), IL-10 and mouse negative control (D), IL-10 and CD20 (E) and IL-10 and CD138 (F) are shown.
1 2
2
149
4.4. Discussion
4.4.1. Pilot comparison of allergic and non-allergic responsiveness
and identification of IL-10 detection by FluoroSpot
Initial examination of stimulated PBMCs by flow cytometry suggested that there was a reduced
frequency of IL-10-producing B cells in allergic individuals, compared to non-allergic controls.
However, this observation was not replicated with isolated B cells, stimulated with either CpG or LPS,
by flow cytometry. This finding supports the hypothesis, described in the discussion to the previous
chapter (section 3.3.2, on p97), that putative increases in B cell IL-10 responses amongst stimulated
PBMCs is likely to be due to cells other than B cells within these PBMC cultures.
FluoroSpot was the technique subsequently used to detect IL-10-producing B cells in response to CpG,
allergen alone, or in combination. FluoroSpot appeared to offer the greatest sensitivity to detect an
intrinsic defect in B cell IL-10 capacity between clinical groups, without requiring either PMA and
Ionomycin re-stimulation or the presence of other PBMCs in culture. Whilst it is of interest that B cells
from allergic donors showed an IL-10 deficit when cultured amongst PBMCs for flow cytometry
compared to non-allergic donors, this was not replicated by isolated B cells by flow cytometry and
thus may not be attributed to B cells in isolation. Subsequent studies therefore employed isolated B
cells, rather than B cells amongst PBMCs, in order to explore the differences in B cells between allergics
and non-allergic participants and to study the influence of allergen immunotherapy on these
differences.
4.4.2. Cross sectional study
In a clinical cross sectional study of non-allergic volunteers, untreated grass pollen allergic individuals
and seasonal grass allergic donors, who had received allergen immunotherapy, proportions of
regulatory B cells subsets and B cell IL-10 capacity was examined as a putative model for loss of
tolerance amongst the allergic individuals and induction of tolerance following successful AIT. Previous
studies of AIT have demonstrated a significant increase in total IL-10 production from PBMCs (Akdis
et al., 1998, Jutel et al., 2003, Francis et al., 2003, Francis et al., 2008), this has previously been
associated with an increased IL-10 capacity amongst T cells and monocytes (Akdis et al., 1998, Nouri-
Aria et al., 2004, Francis et al., 2003). Akdis and colleagues have twice demonstrated increased B cell
IL-10 capacity following bee venom AIT (van de Veen et al., 2013, Akdis et al., 1998), whereas this has
not previously been explored following AIT for inhalant allergies and in particular seasonal pollinosis.
150
4.4.2.1. Participants
Allergic participants in the cross-sectional study collectively had significantly greater total and specific
IgE with a large range compared to normal controls and no significant difference between untreated-
allergic and AIT-treated participant groups. The duration of AIT varied with SCIT patients having
received significantly fewer months of AIT (a median of 6) compared with SLIT-treated patients
(median of 34 months). It is possible that the differing treatment duration and or varied cumulative
dose of immunotherapy received between SCIT and SLIT may possibly have accounted for some of the
observed differences.
Clinical outcomes in this small study showed that AIT patients reported significantly reduced pollen
seasonal symptoms compared to untreated allergics; however, SCIT patients also had significantly
reduced seasonal symptoms compared to SLIT patients, despite the shorter course of AIT received.
Although adequately controlled, head to head studies are lacking, modelling studies of outcomes
based on meta-analysis suggests a greater suppression of symptoms amongst SCIT-treated, compared
to SLIT-treated, individuals (Di Bona et al., 2012, Meadows et al., 2013). Three small head-to-head
studies of SCIT vs SLIT vs placebo did not show statistically significant differences (Khinchi et al., 2004,
Yukselen et al., 2012, Aasbjerg et al., 2014). However, they were inadequately powered to detect a
difference if one existed and so are of doubtful clinical relevance.
Within this thesis, self-reported clinical outcomes were similar for SCIT and SLIT treatment. Similarly,
the early and late responses to intradermal skin challenge, as a surrogate objective clinical marker,
showed a marked reduction amongst the AIT group compared to untreated controls, including both
SCIT and SLIT-treated participants, with no differences being observed in the reductions for either
early or late phase skin responses between SCIT and SLIT-treated patients compared to controls.
151
4.4.2.2. IL-10 responses of B cells from cross sectional patients
4.4.2.2.1. Allergen-induced responses
B cells stimulated with CpG in addition to allergen had a significantly greater number of IL-10 spots
than CpG alone across all donors (Figure 25), which, although non-significant by clinical phenotype,
was likely to be largely attributed to the AIT-treated group (Figure 26). This suggests that this stimulus
identifies a further subset of IL-10-producing B cells, beyond CpG alone. This should be considered
with a later figure (Figure 29), that showed numbers of IL-10 spots following the addition of allergen
alone. A trend for greater numbers of IL-10 spots were observed amongst normal control or AIT-
treated B cells relative to grass allergics, although the few numbers studied has limited the ability to
detect or not a statistical significance, as the limited numbers of isolated B cells were prioritised for
CpG stimulation. Allergen alone induced IL-10 amongst few B cells, showing a small population of
allergen-specific IL-10+ B cells may be disproportionately detected within the peripheral blood of non-
allergic or AIT-treated individuals. Together this data suggests an altered allergic B cell phenotype
following AIT, with an increased non-specific B cell IL-10 capacity, accompanied by a recovery of
allergen-specific IL-10 responses. A study of naturally tolerant beekeepers and bee venom AIT-treated
patients showed comparable results, with greater IL-10 induced from PLA-specific B cells exposed
amongst non-allergic (tolerant) beekeepers or AIT-treated, but not untreated, allergic individuals
compared to the non-specific PLA- B cell population in the same individuals (van de Veen et al., 2013).
4.4.2.2.2. CpG-induced IL-10 responses
Stimulation of isolated B cells with CpG or with or without allergen, showed an increase in proportions
of IL-10 producing B cells amongst AIT-treated patients compared to untreated allergics (Figure 27 and
Figure 28, respectively). This was largely attributed to B cells derived from SLIT patients, rather than
SCIT- treated subjects. Proportions of IL-10-producing B cells between non-allergic controls and
untreated grass allergic patients was not significantly different, suggesting there is not a loss of
regulatory B cell tolerance amongst grass allergic individuals. Little comparable work exists, which has
examined regulatory B cell IL-10 responses amongst allergics or non-allergic controls. A study of
asthmatics also showed that IL-10-producing B cells following CpG did not differ between allergic
asthmatics and non-allergic controls (van der Vlugt et al., 2014), however, LPS stimulation, despite
poor induction of B cell IL-10, showed significantly fewer IL-10-producing B cells amongst allergic
asthmatics compared to non-allergic controls.

152
Assessment of IL-10 mRNA 5 hours following CpG stimulation showed gene induction in all B cells
(Table 7); however a trend towards significantly reduced IL-10 mRNA induced amongst grass allergic
patients compared to non-allergic controls (Figure 30, p121). If a significantly reduced induction of IL-
10 mRNA could be shown amongst allergics, this may suggest that rapidly inducible IL-10 responses
amongst B cells (at 5 hours) are depressed in allergics compared to non-allergics, despite comparable
proportions of IL-10-producing B cells and IL-10 protein at 48 hours. Tedder et al., have coined the
term ‘B10’ cells to describe B cells which produced IL-10 after 5 hours, as opposed to ‘B10-pro’ cells
which are IL-10 producers by 48 hours of stimulation (Iwata et al., 2011). The potential defect in
allergic IL-10 gene induction at 5 hours may therefore be defined as a reduced B10 capacity, rather
than B10-pro B cells which may be comparable to non-allergics. No change in IL-10 mRNA was
observed compared to or amongst AIT-treated groups.
Relative IL-10 concentrations in the supernatant of CpG-stimulated B cell cultures reproduce the
trends and significant changes observed between clinical groups with respect to proportions of IL-10-
producing B cell spots (Figure 32, on p125). Although the numbers studied are small the relative
proportions of IL-10 competent B cells and the concentration of IL-10 produced are enhanced largely
amongst the SLIT-treated patients. The IL-10-producing B cell bias observed for AIT donors is
strengthened by the repetition of the bias in protein concentration and the concordance observed
between proportions of IL-10 spots, protein concentration and IL-10 mRNA (Figure 33, on p126).
Closer correlations were observed between proportions of IL-10-producing B cells and IL-10
concentration, suggesting that these two factors are more strongly inter-related, also reflected by the
demonstration of an AIT bias. It is therefore likely that increased IL-10 protein concentration amongst
SLIT patients is a result of greater relative numbers of B cells capable of producing IL-10. The weakest
correlation was observed between proportions of IL-10-producing B cells (at 48 hours) and IL-10 mRNA
induction (at 5 hours), suggesting that immediate message induction may be less predictive of 48 hour
IL-10 capacity.
4.4.2.3. IL-10, IL-6 and TNFα detected in culture supernatants
As explored in the introduction, B cells are capable of producing a range of cytokines (section 1, on
p40). For this reason a 25-plex ELISA was carried out on CpG-stimulated B cell supernatant from all
clinical groups, as expected IL-10 protein was significantly greater than medium, however both IL-6
and TNFα were also significantly induced (Figure 32, on p125). The other 22 cytokines examined
showed no significant protein following CpG stimulation (Appendix Table 4). Although IL-10 protein
concentrations were significantly greater amongst SLIT-treated B cells compared to those from SCIT
153
or non-allergic donors, this was not evident for the concentrations IL-6 or TNFα amongst these
supernatants, suggesting a possible IL-10-specific augmentation of B cells in SLIT-treated patients.
IL-6 was detected at 4x greater concentrations than IL-10, whilst TNFα was present 1.5x greater than
IL-10 (Table 8). In view of the substantial amounts of cytokine detected, B cell produced IL-6 and TNFα
warrant further investigation in vitro and in vivo. This data is consistent with levels of IL-10, IL-6 and
TNFα detected following CpG stimulation of isolated B cells by others (Ziegler et al., 2014, Thibult et
al., 2013, Iwata et al., 2012). IL-10, IL-6 and TNFα have also been shown to be produced following
stimulation with the self-antigen, thyroglobulin, by B cells in healthy human donors (Langkjaer et al.,
2012). Human B cells also showed a dose-response relationship to the hormone leptin with respect to
IL-10, IL-6 and TNFα in vitro (Agrawal et al., 2011), with leptin-induced cytokine production increased
by age (Gupta et al., 2013).
Although B cell IL-10 production and capacity is the focus of this thesis, it appears somewhat
contradictory to find the pro-inflammatory cytokines IL-6 and TNFα highly represented amongst B cells
in the context of IL-10. Unfortunately it is unclear from the data collected here whether individual cells
expressing IL-10 co-express either or both of IL-6 or TNFα in addition to IL-10. IL-6-secreting B cells,
induced by R848 (a TLR7 and TLR8 stimuli) show a subset of IL-10-co-expressing B cells (Liu et al.,
2014a). Indeed, whilst B cells were stained for in isolation, IL-10 was always co-expressed with IL-6. It
is not clear whether IL-10-producing CpG-stimulated B cells also all co-express IL-6, although it is likely
that the IL-6-producing B cells outnumber those producing IL-10, given the concentrations of IL-6
detected in this thesis and others. In a separate study, the combined CpG and CD40L stimulation
showed that a subset of IL-10 expressing B cells also co-expressed TNFα (Cherukuri et al., 2014),
although both TNFα and IL-10 were also detected in isolation from B cells. These two studies imply
that most IL-10-producing B cells are also capable of producing TNFα or IL-6 along with IL-10 (and
potentially all three), suggesting a complex phenotype. Neither of these studies was able to define a
pure B cell that produced IL-10 alone.
4.4.2.4. Beyond IL-10 – mRNA at Baseline and following CpG
Due to limitations in cell numbers, protein expression of TLR4 and TLR9 was not examined between
donor groups. Given the reliance on TLR9 signalling within this thesis by the use of CpG, TLR4 and TLR9
mRNA was examined as a compromise, to exclude relative changes between clinical groups as a causal
factor on IL-10 responses (Figure 31, on p123). TLR4 expression was also determined (by mRNA) to
identify any change in B cell TLR4 expression between groups, as observed amongst allergic asthmatics
by protein (van der Vlugt et al., 2014). Neither TLR9 nor TLR4 mRNA differed by clinical phenotype,

154
suggesting that differing B cell IL-10 responses following CpG are not driven by differing TLR9 or TLR4
translation, but a downstream capacity to produce an IL-10-specific response.
Examination of baseline immunoglobulin mRNA (Figure 31, on p123) amongst freshly isolated B cells,
showed significantly greater IgG4 mRNA amongst AIT-treated donors compared with non-allergic
controls. The SLIT group (who have received the longest course of AIT) appeared to have slightly
greater proportions of detectable IgG4 mRNA; however, the limited sample size prevents statistical
analysis. Neither total IgG nor IgA or IgE mRNA differed between clinical groups, with a large spread
detected in IgE for all groups.
Previous data has suggested that serum IgG4 increases early during AIT treatment, typically after 6
months for SCIT (Francis et al., 2008). The median duration of AIT received for SCIT donors in this thesis
was just 6 months, which suggests they may be expected to have lower levels of IgG4 than SLIT
patients, who had received a median of 34 months treatment. Measures of immunoglobulin mRNA
are a surrogate for protein and is not as robust, but indicates a trend consistent with the induction of
allergen-specific IgG4, typically detected during AIT. It should be noted however that this analysis of
CD19+ B cells in the periphery does not account for switched plasma cells, likely to reside within the
bone marrow, spleen or tissue.
-
4.4.2.5. Examination of confounders in detecting increased capacity
for B cell IL-10
4.4.2.5.1. AIT duration
As mentioned, SLIT-treated B cells showed greater concentrations of IL-10 and greater proportions of
IL-10-producers, but had also received a longer course of AIT. AIT duration of treatment showed a
strong trend toward correlation with respect to proportions of IL-10-producers following CpG with
and without allergen (Figure 34, on p127), but not allergen alone or with CpG-induced IL-10 protein
concentration. Within the AIT group alone, few numbers limited the ability to achieve significant
correlates in this group alone. It is clear, however, that there is a relationship between treatment
duration and CpG-induced IL-10 spots. Together, this raises the possibility that a longer duration AIT,
rather than use of SLIT or SCIT, could enhance the global proportions of IL-10-capable B cells, whilst a
more immediate response may be observed by enhanced proportions of allergen-specific IL-10-
producing B cells. It is not clear from these data whether the route of administration rather than the
duration of AIT has the greatest influence on IL-10-producing B cells.
155
4.4.2.5.2. Gender of participants
Given all SLIT donors were female and also showed both greater proportions of IL-10-producing B cells
and greater concentrations of IL-10 from B cell supernatants compared to SCIT-treated or untreated
donors, this led to the hypothesis that the gender of participants contributed to a confounding
variable when examining B cell IL-10 responses (Figure 27, Figure 28 and Figure 32).
This was examined in Figure 35 (p129), which showed both the proportions of IL-10+ B cell spots and
IL-10 concentration by donor gender. When all donors were considered, IL-10 supernatant
concentration is significantly greater amongst female donors, whereas a trend was observed for
proportions of IL-10-producing B cells being greater amongst female donors. In order to further
determine the influence of gender AIT samples were excluded, given AIT is known to induce peripheral
tolerance. Exclusion of AIT subjects did not significantly alter the female bias observed for IL-10
supernatant protein concentration observed, whilst the weak trend toward significance amongst IL-
10 spots was lost. This suggests that female donor B cells do indeed produce significantly greater
concentrations of IL-10 than males. However, proportions of IL-10-producing B cells not being
significantly altered by gender, especially with the exclusion of AIT donors, suggests the possibility
that proportions of IL-10-producing B cells are less influenced by gender than IL-10 protein
concentration. This suggests that the increased proportions of IL-10-producing B cells observed
amongst SLIT-treated donors is unlikely to be explained by them being an entirely female group.
Previously reported data has suggested that IL-10 responses are biased by gender and age. Antigen-
specific stimulation of PBMCs has shown significantly fewer IL-10-producing cells amongst males
(Haralambieva et al., 2013) and polyclonal stimuli have shown significantly lower concentrations of IL-
10 protein in supernatants from males (Giron-Gonzalez et al., 2000). Additionally, TLR4-mediated IL-
10 responses are also greater amongst female-derived PBMCs than male (Ono et al., 2005, Asai et al.,
2001). Although, conversely, TLR9 induced IL-10 has been shown to be produced at higher
concentrations amongst PBMCs from male rather than female donors (Torcia et al., 2012). Female
donors appear to account for the predominant gender bias of IL-10 capacity reported. Murine studies
have suggested that oestrogen is capable of increasing proportions of IL-10-producing B cells
(Bodhankar et al., 2011, Subramanian et al., 2011). To my knowledge there are no reports of AIT
efficacy differing by gender, although one recent study that examined time taken to achieve
maintenance dosing (which may be taken as a surrogate for immunological tolerance of high dose AIT)
showed significantly shorter escalation times amongst females (Jourdy and Reisacher, 2012).

156
4.4.2.5.3. Donor age
Age was equally distributed across donor phenotype, so unlikely to skew outcomes between clinical
phenotypes. IL-10-producing B cells have been shown to be influenced by donor age, a study of CpG-
induced IL-10-producing B cells showed older subjects have fewer IL-10-producing B cells, and
produced lower concentrations of IL-10 (Duggal et al., 2013). This data is in agreement with the
findings reported here, that shows a trend towards increasing age of the participants associated with
both fewer IL-10-producing B cells and lower concentrations of IL-10 in culture supernatants.
4.4.2.6. Relationships between clinical outcomes and IL-10+ B cells
Intradermal allergen challenge responses correlated with proportions of CpG-induced IL-10-producing
spots. Whilst CpG-induced IL-10 spots and protein concentration correlated with early phase wheal
responses only, CpG and allergen-induced IL-10 spots correlated with both early and late responses
(Figure 36, on p131). Together this data suggests that CpG-induced IL-10 responding B cells are more
related to suppression of early phase responses, whilst the addition of allergen allows the detection
of IL-10-producing spots, B cells which relate close to late phase responses. It is these additionally
antigen-responsive IL-10-producing B cells which may act on T cells, which mediate the late phase
response. It is of interest that the addition of allergen to CpG enhanced the significant correlation
between IL-10-producing B cells and the size of the late phase responses. No subjective clinical
measures of rhinitis symptoms related to proportions of IL-10-producing B cells. Given the small size
of this study, it may be more likely that associations between ex vivo measures of tolerance and
physiological responses, rather than subjective symptom scores, are likely to be more readily
achieved. A larger study may allow for the breadth of subjective scores to correlate to a degree with
a greater proportion of regulatory B cells, if a relationship exists. However, subjective experience of
rhinitis during a pollen season are influenced by a multitude of factors such as relative sensitivity to
allergen, variable subjective perception of severity, overlapping viral or alternate-allergen-derived
rhinitic symptoms, variable exposure to pollen due to geography or habit (for example time spend
in/outdoors) etc.
157
4.4.3. Nasal allergen challenge
4.4.3.1. B cell distributions at baseline
The use of nasal allergen challenge permitted the examination of B cell subsets between clinical
phenotypes both at baseline and compared to after an experimental allergen challenge in the target
organ. Baseline characterisation showed fewer overall numbers of B cells amongst normal controls
compared to allergic rhinitic donors; both treated and untreated, although this did not reach
significance following treatment (Figure 39, p134). This suggests that allergic donors have greater
numbers of circulating B cells.
This surprising finding suggests raised numbers of B cells overall in the blood of allergic donors may
account for differences observed in the proportions of IL-10-producing B cells. Donors with reduced
proportions of IL-10-producing B cells may have greater overall numbers of B cells in circulation and
thus a similar number of IL-10 competent B cells. By applying the numbers of B cells from matched
patients to the proportions of IL-10-producing B cells detected by FluoroSpot, differences between
clinical phenotypes remained consistent (Appendix Figure 12, p204). Increased numbers of B cells
amongst allergic donors (treated and untreated) did not affect the observations with respect to
proportions of IL-10-producing B cells, which were increased for SLIT-treated donors compared to
SCIT-treated or untreated controls, when numbers of IL-10-producing B cells are calculated using these
data (Appendix Figure 12). This back-calculation does lend some robustness to the notion that the
SLIT-treated B cells have a greater capacity to produce an IL-10 response, compared to un-treated
allergics in this study. Confirmation will require a prospective controlled study of grass pollen SLIT.
Proportions of B cell subsets at baseline showed marginal differences by phenotype. A significantly
reduced proportion of CD5+CD1dhi B cells were observed amongst AIT-treated B cells, although this
was not reflected in the withdrawal group. Few other subsets showed significant differences, with the
exception of the CD71+CD73- subset, demonstrated recently by Akdis and colleagues (van de Veen et
al., 2013). These cells trended towards greater proportions amongst AIT-treated compared to un-
treated allergics, which was significant for the 4 AIT-completed donors alone and all AIT-treated
donors when the completed donors were included (Figure 40, on p135).
These baseline comparisons suggest few differences between proportions of regulatory B cell
populations in the peripheral compartment between the groups studied. Several investigators have
reported proportions of regulatory B cell subsets in diseased populations, such as vasculitis, Sjögren's
158
syndrome, RA and SLE, in order to demonstrate a regulatory B cell deficits (Todd et al., 2014, Lepse et
al., 2014, Furuzawa-Carballeda et al., 2013, Ma et al., 2013). With respect to allergy, few differences
within the peripheral B cell compartment have been reported. A study of allergic asthmatics has
shown proportions of CD24hiCD38hi B cells to be greater, whilst CD24hiCD27+ B cells fewer, in
proportion and absolute count, relative to healthy controls (van der Vlugt et al., 2014). In addition,
increased proportions of CD5+ B cells (and CD24hi/+CD38hi/+) in early life have been suggested to be
predictive of later development of allergic disease (Lundell et al., 2014).
The data in this thesis, acknowledging the limitations of the small sample studied, support that there
is no clear deficit within Breg subsets amongst allergic individuals compared to non-allergic controls,
nor was there clear evidence of greater proportions of Breg subsets amongst AIT-treated allergics as
a result of treatment, when these subsets are considered at baseline and outside of the pollen season.
4.4.3.2. Comparison of B cells before and after allergen challenge
NAC demonstrated a significant physiological response to allergen, as shown by significant nasal
blockage amongst allergic patients compared to non-allergic controls. The AIT groups showed a
reduction in nasal blockage following NAC compared to untreated allergic controls, however when
examined separately SLIT donors did not show a significant reduction in nasal blockage compared to
untreated allergics (whereas SCIT remain significant), likely due to spread of the data and only 6
repeats.
The numbers and percentages of B cell subsets were examined by flow cytometry at baseline before
nasal challenge and compared with matched samples taken following allergen challenge (Figure 41,
on p138).
Much like the data from the NAC day, the non-challenge control day showed that numbers within
regulatory B cell subsets increased throughout the day, suggesting this change was due to diurnal
variation. However, the percentages of B cell subsets amongst non-allergic donors were not affected
by diurnal variation on the non-challenge day. This suggests that the increased percentages of Breg
subsets recorded on the NAC day may indeed occur as a consequence of allergen challenge. Only the
proportions of CD24hiCD38hi B cells (as a percentage of total B cells) were significantly increased
following NAC for both non-allergics and AIT-treated allergic donors, but not in untreated allergic
patients. This may suggest a challenge-induced mobilisation of a subset of regulatory B cells amongst
159
this transitional subset in order to suppress allergen-driven inflammation. It is unclear to where these
increased proportions of circulating transitional cells are migrating; further work is required to
establish to where these cells localise following NAC. Surprisingly, CD24hiCD27+ and CD25+ B cell
subsets were significantly increased, whilst CD5hi B cells trended towards significance following NAC,
amongst non-allergic donors alone. Non-allergic donors within this study are naturally allergen
tolerant, with no positive skin responses to any common aeroallergens or allergic clinical history. It is
possible that these individuals may have more developed mechanisms of tolerance than those
induced by AIT.
The numbers of total B cells amongst clinical phenotypes at baseline were significantly increased in
AIT-treated donors, with a strong trend amongst normal controls and AIT-completed donors,
compared to strikingly no change amongst grass allergic donors. This was shown to be likely due to
diurnal variation (Figure 42, on p140), not NAC, as a separate group of non-allergics, followed in the
absence of allergen challenge, also demonstrated a significant increase in total B cell numbers. A rise
in B cell numbers throughout the day, specifically absent amongst untreated-allergics compared to
AIT-treated allergics or non-allergic controls, is surprising and suggests B cells are regulated by a
mechanism not observed amongst the grass allergic populations. Little recent data exists to confirm
the diurnal relationship of B cells numbers throughout the day, however this has been examined in
previous decades (Abo et al., 1981, Petitto et al., 1993), and shows significantly increased PBMC and
B cell absolute numbers between 8 am and 4pm, as observed in this study. An inverse relationship
between the absolute number of lymphocytes and serum cortisol was observed, which may suggest
that allergic lymphocytes are insensitive to glucocorticoid suppression. This may additionally explain
the higher baseline absolute count observed in this thesis. Glucocorticoid insensitivity to exogenous
steroid treatment has been well described amongst poorly controlled asthmatics (Chan et al., 1998),
although smoking is often a contributing factor, which was not the case with the population recruited
for this study.
4.4.4. Histological evidence of IL-10-producing B cells in vivo
Dual immunofluorescence staining of tonsils from patients with unknown allergic status showed both
IL-10-producing CD20+ B cells and CD138+ plasma cells. Whilst there was a greater abundance of both
B cells and plasma cells detected amongst the sections from tonsils, none the less staining for IL-10,
CD20 and CD138 was successful in nasal samples. False positive staining was observed for both
colours, principally labelling eosinophils, although the intensity and pattern of staining was distinct
160
from the true positive staining that was co-localised to B cells. No examples of dual staining for CD20
and IL-10 were found amongst nasal examples, whereas dual staining for CD138 and IL-10 was
achieved. This may suggest that outside of secondary lymphoid organs, plasma cells are the dominant
or only IL-10-producing B lineage-derived cells resident in tissues. Recent evidence offers IL-10-
producing plasma cells would support this in vivo finding, showing that IL-10-producing B cells mature
to become IgM- or IgG-secreting plasma cells (Heine et al., 2014, Neves et al., 2010). The paucity of
dual stained cells meant that apart from a qualitative confirmation of dual staining in the human tonsil
and nasal mucosa, it was not possible to undertake a quantitative assessment of the number of cells
detectable in tissue derived from the whole population studied. None the less, analysis of the whole
population for single stained B cells and plasma cells could be performed.
4.4.5. Future work
In view of discrepancies between the ‘pilot’ and ‘cross sectional’ studies of isolated B cells, it is clear
that a much larger blinded study would be required to fully dissect any minor deficiency in B cell IL-10
capacity in allergic compared to non-allergic donors. A comparison of IL-10-producing B cells from
allergic and non-allergic groups, both in and out of the pollen season, might have identified any
variance due to natural allergen exposure. This cross sectional study was carried out before the pollen
season and as such allergics were non-symptomatic at the time IL-10-producing B cells were
examined. Within the cross sectional study there was a random mismatching for both gender and
duration of AIT of participants which confounded the interpretation of the data. Further work should
control for gender, as this has a clear impact on the concentration of IL-10 produced by B cells, and
matched for duration of intervention received. This study did, however, provide evidence for an
enrichment of IL-10-producing B cells in the AIT-treated cohort. A prospective, blinded, study of both
SLIT and SCIT relative to placebo would identify both the time course and degree of IL-10-competent
B cells induced as a result of AIT and these studies are currently in progress. Studies which have
examined the effect of exacerbations and remission during autoimmune disease have demonstrated
that this approach may be relevant to identify immunological changes in regulatory populations. For
example patients with an acute exacerbation of vasculitis show fewer IL-10-producing B cells
compared to patients in remission or to healthy control individuals (Lepse et al., 2014, Todd et al.,
2014, Wilde et al., 2013). Similarly, in the context of allergy, IL-10-producing T cells have been shown
to be increased amongst allergen-tolerant beekeepers during the beekeeping season (Meiler et al.,
2008). In addition, a prospective study of AIT would permit the examination of both Treg and Breg
compartments, in order to determine whether expansion of one compartment might precede the
other during the evolution of allergen-specific tolerance.
161
Examination of IL-10 expression by B cells in non-allergic individuals during the pollen season,
compared to allergics, would test whether the regulatory B cell compartment may be critical for the
development of natural allergen tolerance, such as through mobilisation of a greater variety of
regulatory B cell subsets. AIT-induced tolerance, however, may be a separate immunological
mechanism involving IL-10-producing regulatory B cells to a greater extent. The non-allergic control
group in this study were additionally non-atopic, with no skin prick response nor significant specific
IgE towards any aeroallergen. It would have been of interest to include a group of asymptomatic but
allergen-sensitised participants, with specific IgE and skin prick responses matched to allergics.
Inclusion of such a subset would assess immunological tolerance in a group who are likely to have
genetic predisposition towards sensitisation but who have maintained a natural immunological
tolerance.
Allergen-induced B cell IL-10 requires further investigation, especially with respect to the phenotype
of B cells which produce IL-10 in response to allergen, compared to CpG alone or in combination, as
well as the clinical phenotypes producing allergen-induced B cell IL-10. If these cells can be isolated by
IL-10-capture and cell sorting, this could provide an ideal experiment for measurement of mRNA by
microarray in order to determine the differential subgroups of IL-10-producing B cells. This has been
reported by two groups in recent years, both isolating B cells by IL-10 surface capture of actively IL-
10-producing isolated B cells following CpG stimulation (Lin et al., 2014, van de Veen et al., 2013),
identifying IL-10+ Bregs as germinal centre B cells or CD25+CD71+CD73- B cells, respectively. As part of
this thesis microarray was attempted with IL-10+/- sorted B cells by IL-10-capture at 48 hours following
stimulation (Appendix Figure 1, p190 and Appendix Table 1, p191), however as IL-10 was not returned
as significantly up-regulated amongst the IL-10-sorted population further optimisation is required and
was not therefore included in the main body of this thesis. In this preliminary work, both CD71 and
lymphotoxin alpha were returned as up-regulated amongst IL-10+ B cells, which is consistent with the
previously cited studies.
Unfortunately, IL-6 and TNFα responses to allergen were not examined alongside IL-10. This would
also have provided valuable contribution concerning a likely allergen-specific B cell phenotype. B cell
FluoroSpot allowed for detection of IL-10-secreting B cells, which are unlikely to be captured by flow
cytometry as re-stimulation with PMA and Ionomycin may dilute out any allergen-specific signal.
Further use of dual or triple colour FluoroSpot, would allow the detection of B cells secreting IL-10, IL-
6 and/or TNFα, in isolation or combination, in response to a range of stimuli including CpG and
allergen.

162
This study used baseline B cell mRNA expression to determine TLR4, TLR9 and immunoglobulin
expression amongst the clinical phenotypes. Future work should examine protein expression of these
molecules on B cells by western blot and flow cytometry between clinical groups, but also between
IL-10-expressing and non-expressing B cells. Comparison of serum total and allergen-specific IgG1,
IgG4 and IgA1 and IgA2 should be used to draw correlation between B cell IL-10 capacity and induction
following AIT. This serum antibody data was not available at the time of writing this thesis.
Although there was no clear difference in the proportions of regulatory B cell subsets observed at
baseline amongst allergics (or recovered in AIT - Figure 40, p135), this may be due to the relatively
small numbers of participants per group, or due these patients being non-symptomatic at the time of
assessment. Further work may be able to identify whether the proportions of any Breg subsets differ
at baseline, by comparison of grass pollen seasonal allergic patients in and out of pollen seasons, or
with the use of perennial symptomatic allergics, but certainly with a larger subset of patients in each
group.
More work is needed to examine and explain the possible loss of diurnal variation of B cell numbers
throughout the day amongst untreated allergic donors that was observed on both unchallenged and
challenge days amongst non-allergic individuals. As a non-challenge day was not carried for untreated
allergic or AIT-treated allergic donors, it is unclear whether the increase in B cell numbers observed
amongst AIT donors, not observed for allergics, was truly a diurnal change as for non-allergics, or an
effect of NAC. Future work, should initially aim to repeat the non-challenge day amongst allergic
patients (both treated and untreated), to fully determine whether there is a defect in the diurnal
regulation of B cell numbers amongst untreated allergic individuals, which is restored amongst AIT-
treated patients. Further work would then be required to understand the mechanism underlying
diurnal regulation of B cell numbers, and how this has been recovered amongst AIT-treated allergic
donors. However, the functional relevance of this finding is as yet unclear. Further work may be able
to examine whether IL-10-producing B cells are stable as a proportion of the B cell population
throughout the day and throughout the pollen season. One possible explanation for a loss of diurnal
regulation of global B cell numbers in allergic individuals could be a reduced sensitivity to endogenous
cortisol, although this hypothesis would require investigation
The increased proportions of CD24hiCD38hi B cells (relative to the whole B cell population) observed
following allergen challenge amongst non-allergics or tolerant AIT-treated allergics, but not untreated
allergics, is of potential interest. Ideally this could be reconfirmed in relation to natural pollen
exposure by the taking of blood samples before, during and following the grass pollen season. If
CD24hiCD38hi B cells are indeed proportionally increased during the pollen season amongst naturally

163
or AIT-tolerised donors compared to outside the pollen season, and in contrast to non-tolerant allergic
donors, this subset may be proposed as an in vivo mechanism of tolerance. Whether these cells are
being mobilised in order to migrate to the nasal mucosa, draining lymph or other secondary lymphoid
disuse is unclear and requires further exploration.
Histological evaluation of nasal samples from the cross sectional study was limited by the paucity of
dual-stained cells that could be detected within the nasal mucosa. Sensitivity could likely be increased
by detection of IL-10 mRNA rather than protein in B cells by the use of dual in situ hybridisation and
immunohistochemistry, as previously shown for detection of IL-10-producing T cells during AIT (Nouri-
Aria et al., 2004). Such an approach is planned in relation to a prospective trial of sublingual grass
pollen immunotherapy.
The demonstration that CpG combined with grass pollen enhances the proportions of IL-10-producing
B cells is in line with data showing CpG as an adjuvant in both murine (Hessenberger et al., 2013,
Huang et al., 2007, Tighe et al., 2000) and feline (Reinero et al., 2008) models of allergen
immunotherapy. In these models the addition of CpG was more effective in inducing tolerance to
allergen than administration of high-dose allergen alone. In human studies the focus has largely been
on the potential Th1 polarising effect rather than induction of IL-10 production by CpG adjuvants. A
series of studies have assessed safety and efficacy of CpG-conjugated to ragweed allergen for
subcutaneous immunotherapy. Both suppression of immunological responses and symptom scores
was observed compared to placebo treatment (Simons et al., 2004, Tulic et al., 2004, Creticos et al.,
2006).CpG has shown promise in early clinical studies as an adjuvant for house dust mite
immunotherapy (Senti et al., 2009), or as a therapy alone in the absence of allergen (Klimek et al.,
2011). None of these studies have compared AIT with allergen alone to AIT carried out with allergen
conjugated to CpG in order to appreciate whether CpG provides an additive effect nor have these
studies examined the B cell compartment or IL-10 synthesis in detail following CpG-conjugated
immunotherapy. This fast-developing area of allergen immunotherapy would do well to explore the
comparative immunotype provided by the addition of CpG adjuvants as well as the potential CpG-
conjugated allergen given by alternative routes such as sublingual AIT.

164
5. Summary and concluding remarks Regulatory B cells (Bregs) that are able to regulate inflammatory responses, have largely been defined
by their capacity to produce IL-10. Bregs have been shown to interact with and induce Tregs, the
master regulators. The dysregulation of Bregs amongst individuals with autoimmune diseases suggest
that these cells contribute to regulation of self-tolerance. Research on Bregs has largely explored
diseases such as autoimmunity, cancer, graft versus host disease and infection, with little reported
about the role of Bregs in allergic disease.
A large body of evidence now exists to suggest that IL-10-producing Bregs are detected amongst many
B cell phenotypes. A recent study described two clear subsets for IL-10-Bregs, the transitional
CD24hiCD38hi subset as well as the IgM+CD27+ memory population (Khoder et al., 2014), which may
condense some of the differing subsets of IL-10-Bregs reported. The identification of Bregs at the
transitional stage of B cell development and within the B cell memory pool suggests that Bregs exist
at checkpoints of B cell inflammatory progression. For example, transitional or memory Bregs may
provide a regulatory threshold prior to the development of a GC response or prior to the activation of
a memory response, respectively. Furthermore, murine evidence that IL-10-producing plasma cells
can be detected in vivo (Shen et al., 2014, Neves et al., 2010) or that amongst mice and humans IL-10-
producing B cells can develop into plasma cells (Maseda et al., 2012, van de Veen et al., 2013) suggests
that IL-10-Bregs are present throughout the B cell lifecycle and may be relevant in all diseases in which
humoral immunity is dysregulated.
The first results chapter of this thesis (section 3, p66 onwards) set out to explore methods of
identifying the greatest proportions of IL-10-producing B cells, and following this, explore the surface
markers of B cells which were IL-10+ and IL-10- under the same stimulatory conditions. Following on
from this, IL-10-producing B cells were to be used in T cell co-cultures to show B cell mediated
suppression of allergic inflammation in vitro. The second results chapter (section 4, p107 onwards)
aimed to use allergic rhinitis as a model for a loss of immunological tolerance, with Bregs hypothesised
to be dysregulated in order to permit chronic allergic responses to innocuous environmental antigens.
Allergic rhinitic donors treated with allergen immunotherapy were used as a model of induced
immunological tolerance, within which it was hypothesised Bregs may be induced.
Similar to previous reports, the TLR9 ligand CpG showed the greatest capacity to increase the
proportions of IL-10-producing B cells beyond those detected in medium alone. Whilst some
investigators have shown a similar response with the TLR4 ligand LPS by human B cells, this study
showed an LPS-induced IL-10 response amongst B cells cultured with PBMCs but not in isolation.
165
Whilst CpG demonstrated greater proportions of IL-10-producing B cells compared to medium alone,
these were highly correlated, suggesting CpG is able to enhance the proportions observed in medium
and demonstrate the greatest potential B cell IL-10 capacity. The greatest proportions of IL-10-
producing B cells were detected within the CD24hiCD38hi and CD5hi subsets. The CD27+ subset did not
show greater proportions of B cells producing IL-10 compared to the whole population, suggesting
here that naïve B cells are a more likely regulatory B cell subset. The identification of IL-10+ B cells as
naïve was supported by their chemokine receptor expression compared to IL-10- B cells. The chapter
concludes by demonstrating that CpG-primed B cells suppress both polyclonal and allergen-stimulated
T cells in co-culture, as compared with non-primed B cells. Suppression of both proliferation and pro-
inflammatory supernatant cytokine concentration was observed, which could not be attributed to
altered proportions of FoxP3+ Tregs or T cell death. The addition of blocking antibodies throughout co-
culture demonstrated that IL-10 or TGF-β, or the expression of PD-L1, by CpG-primed B cells may be
factors able to drive T cell suppression in this context.
The chapter exploring Bregs ex vivo (p107 onwards) used CpG stimulation as a method of detecting
the greatest proportion of B cells capable of IL-10 production. B cells from grass pollen allergic donors
were stimulated and proportions of IL-10-producing B cells compared to non-allergic controls and AIT-
treated allergic donors. CpG-induced IL-10-Bregs were not significantly altered amongst the allergic
group compared to non-allergic controls, nor were Breg subsets altered at baseline when examined
prior to nasal allergen challenge. However, trends were observed towards reduced IL-10 mRNA and
allergen-induced proportions of IL-10-Bregs amongst allergic donors compared to non-allergic
controls. This suggests that B cell transcriptional control of IL-10 or allergen-specific IL-10
responsiveness may be dysregulated in allergic rhinitis, although further work is required to confirm
this. A report examining B cells amongst beekeepers and bee sting-AIT-treated patients also showed
B cell IL-10 responses to be allergen-specific (van de Veen et al., 2013). AIT in this study showed a
suppression of subjective and objective clinical measures, with both SCIT and SLIT demonstrating
similar clinical tolerance. IL-10-Bregs were increased amongst the AIT population compared to
untreated AR, particularly for the SLIT-treated donors. The sublingual route of administration may be
able to induce differing immunological tolerance, although due to the confounding effects of gender
and duration of treatment in the small cohort studied, it was not possible to confirm this. None-the-
less, the proportions of IL-10-Bregs amongst treated and untreated AR groups showed significant
correlation with clinical surrogate endpoints, namely the early and late responses to intradermal
allergen challenge, that were inhibited after AIT. This provides support for the concept that AIT-
induced IL-10-Bregs may play a role in vivo in the induction of allergen-induced tolerance. Further
work is required to explore the relationship between Tregs, IgG4 and Bregs in larger prospective
166
controlled trials of AIT by both sublingual and subcutaneous routes. Exploration of the effect of a nasal
allergen challenge on Breg subsets in peripheral blood showed that whereas proportions of several
Breg subsets increased amongst non-allergic donors, only CD24hiCD38hi B cells increased additionally
amongst AIT-treated allergic donors, occurring in similar proportions as observed in untreated
allergics. No other Breg subset was altered by proportion amongst allergic donor groups. Further work
will be required to determine whether these cells were mobilised in response to nasal allergen to
migrate to the site of inflammation. B cells were also explored by immunohistochemistry of human
tonsil as well as in nasal biopsies following allergen challenge. The presence of IL-10+ B cells and plasma
cells was confirmed in tonsillar tissue. Dual IL-10 and CD20 staining was not observed in nasal sections,
despite evidence of plasma cells co-staining with IL-10. Further studies in humans, simultaneously
exploring blood, nasal tissue and bone marrow might identify niches in which various IL-10-Breg
subsets and, possibly, IL-10-plasma cells might exist in vivo and their relative abundance.
Overall, the data presented here demonstrates that B cells are able to regulate allergen-specific T cell
responses from allergic individuals, even at very low relative numbers. This population may be
preferentially induced following AIT, particularly during long-term SLIT. This work supports the
concept that strategies which aim to modify conventional allergen immunotherapy to target the
expansion of an allergen-specific or bystander Breg populations may be a rational approach to
optimise the induction of long term tolerance in allergic disease.

167
6. References AALBERSE, R. C., STAPEL, S. O., SCHUURMAN, J. & RISPENS, T. 2009. Immunoglobulin G4: an odd
antibody. Clin Exp Allergy, 39, 469-77. AASBJERG, K., BACKER, V., LUND, G., HOLM, J., NIELSEN, N. C., HOLSE, M., WAGTMANN, V. R. &
WURTZEN, P. A. 2014. Immunological comparison of allergen immunotherapy tablet treatment and subcutaneous immunotherapy against grass allergy. Clin Exp Allergy, 44, 417-28.
ABO, T., KAWATE, T., ITOH, K. & KUMAGAI, K. 1981. Studies on the bioperiodicity of the immune response. I. Circadian rhythms of human T, B, and K cell traffic in the peripheral blood. J Immunol, 126, 1360-3.
AGRAWAL, S., GOLLAPUDI, S., SU, H. & GUPTA, S. 2011. Leptin activates human B cells to secrete TNF-alpha, IL-6, and IL-10 via JAK2/STAT3 and p38MAPK/ERK1/2 signaling pathway. J Clin Immunol, 31, 472-8.
AGRAWAL, S. & GUPTA, S. 2011. TLR1/2, TLR7, and TLR9 signals directly activate human peripheral blood naive and memory B cell subsets to produce cytokines, chemokines, and hematopoietic growth factors. J Clin Immunol, 31, 89-98.
AKDIS, C. A. & AKDIS, M. 2011. Mechanisms of allergen-specific immunotherapy. J Allergy Clin Immunol, 127, 18-27; quiz 28-9.
AKDIS, C. A., BLESKEN, T., AKDIS, M., WUTHRICH, B. & BLASER, K. 1998. Role of interleukin 10 in specific immunotherapy. J Clin Invest, 102, 98-106.
AKDIS, M. 2009. Immune tolerance in allergy. Curr Opin Immunol, 21, 700-7. AKDIS, M., VERHAGEN, J., TAYLOR, A., KARAMLOO, F., KARAGIANNIDIS, C., CRAMERI, R., THUNBERG,
S., DENIZ, G., VALENTA, R., FIEBIG, H., KEGEL, C., DISCH, R., SCHMIDT-WEBER, C. B., BLASER, K. & AKDIS, C. A. 2004. Immune responses in healthy and allergic individuals are characterized by a fine balance between allergen-specific T regulatory 1 and T helper 2 cells. J Exp Med, 199, 1567-75.
AMU, S., SAUNDERS, S. P., KRONENBERG, M., MANGAN, N. E., ATZBERGER, A. & FALLON, P. G. 2010. Regulatory B cells prevent and reverse allergic airway inflammation via FoxP3-positive T regulatory cells in a murine model. J Allergy Clin Immunol, 125, 1114-1124 e8.
ANDERSSON, K. & LIDHOLM, J. 2003. Characteristics and immunobiology of grass pollen allergens. Int Arch Allergy Immunol, 130, 87-107.
ANGIER, E., WILLINGTON, J., SCADDING, G., HOLMES, S., WALKER, S., BRITISH SOCIETY FOR, A. & CLINICAL IMMUNOLOGY STANDARDS OF CARE, C. 2010. Management of allergic and non-allergic rhinitis: a primary care summary of the BSACI guideline. Prim Care Respir J, 19, 217-22.
ASAI, K., HIKI, N., MIMURA, Y., OGAWA, T., UNOU, K. & KAMINISHI, M. 2001. Gender differences in cytokine secretion by human peripheral blood mononuclear cells: role of estrogen in modulating LPS-induced cytokine secretion in an ex vivo septic model. Shock, 16, 340-3.
ASHINO, S., WAKITA, D., ZHANG, Y., CHAMOTO, K., KITAMURA, H. & NISHIMURA, T. 2008. CpG-ODN inhibits airway inflammation at effector phase through down-regulation of antigen-specific Th2-cell migration into lung. Int Immunol, 20, 259-66.
AVERY, D. T., MA, C. S., BRYANT, V. L., SANTNER-NANAN, B., NANAN, R., WONG, M., FULCHER, D. A., COOK, M. C. & TANGYE, S. G. 2008. STAT3 is required for IL-21-induced secretion of IgE from human naive B cells. Blood, 112, 1784-93.
BANFIELD, G., WATANABE, H., SCADDING, G., JACOBSON, M. R., TILL, S. J., HALL, D. A., ROBINSON, D. S., LLOYD, C. M., NOURI-ARIA, K. T. & DURHAM, S. R. 2010. CC chemokine receptor 4 (CCR4) in human allergen-induced late nasal responses. Allergy, 65, 1126-33.
BAO, Y. & CAO, X. 2014. The immune potential and immunopathology of cytokine-producing B cell subsets: A comprehensive review. J Autoimmun.
168
BARANIUK, J. N. 2001. Mechanisms of allergic rhinitis. Curr Allergy Asthma Rep, 1, 207-17. BARNES, P. J. 2011. Pathophysiology of allergic inflammation. Immunol Rev, 242, 31-50. BARR, T. & GRAY, D. 2012. T(FH) memory: more or less T(FH)? Eur J Immunol, 42, 1977-80. BARR, T. A., GRAY, M. & GRAY, D. 2012. B cells: programmers of CD4 T cell responses. Infect Disord
Drug Targets, 12, 222-31. BELLINGHAUSEN, I., KLOSTERMANN, B., KNOP, J. & SALOGA, J. 2003. Human CD4+CD25+ T cells
derived from the majority of atopic donors are able to suppress TH1 and TH2 cytokine production. J Allergy Clin Immunol, 111, 862-8.
BERNASCONI, N. L., TRAGGIAI, E. & LANZAVECCHIA, A. 2002. Maintenance of Serological Memory by Polyclonal Activation of Human Memory B Cells. Science, 298, 2199-2202.
BIELI, C., EDER, W., FREI, R., BRAUN-FAHRLANDER, C., KLIMECKI, W., WASER, M., RIEDLER, J., VON MUTIUS, E., SCHEYNIUS, A., PERSHAGEN, G., DOEKES, G., LAUENER, R., MARTINEZ, F. D. & GROUP, P. S. 2007. A polymorphism in CD14 modifies the effect of farm milk consumption on allergic diseases and CD14 gene expression. J Allergy Clin Immunol, 120, 1308-15.
BLAIR, P. A., CHAVEZ-RUEDA, K. A., EVANS, J. G., SHLOMCHIK, M. J., EDDAOUDI, A., ISENBERG, D. A., EHRENSTEIN, M. R. & MAURI, C. 2009. Selective targeting of B cells with agonistic anti-CD40 is an efficacious strategy for the generation of induced regulatory T2-like B cells and for the suppression of lupus in MRL/lpr mice. J Immunol, 182, 3492-502.
BLAIR, P. A., NORENA, L. Y., FLORES-BORJA, F., RAWLINGS, D. J., ISENBERG, D. A., EHRENSTEIN, M. R. & MAURI, C. 2010. CD19(+)CD24(hi)CD38(hi) B cells exhibit regulatory capacity in healthy individuals but are functionally impaired in systemic Lupus Erythematosus patients. Immunity, 32, 129-40.
BODHANKAR, S., GALIPEAU, D., VANDENBARK, A. A. & OFFNER, H. 2013. PD-1 Interaction with PD-L1 but not PD-L2 on B-cells Mediates Protective Effects of Estrogen against EAE. J Clin Cell Immunol, 4, 143.
BODHANKAR, S., WANG, C., VANDENBARK, A. A. & OFFNER, H. 2011. Estrogen-induced protection against experimental autoimmune encephalomyelitis is abrogated in the absence of B cells. Eur J Immunol, 41, 1165-75.
BOHLE, B., KINACIYAN, T., GERSTMAYR, M., RADAKOVICS, A., JAHN-SCHMID, B. & EBNER, C. 2007. Sublingual immunotherapy induces IL-10-producing T regulatory cells, allergen-specific T-cell tolerance, and immune deviation. J Allergy Clin Immunol, 120, 707-13.
BONECCHI, R., BIANCHI, G., BORDIGNON, P. P., D'AMBROSIO, D., LANG, R., BORSATTI, A., SOZZANI, S., ALLAVENA, P., GRAY, P. A., MANTOVANI, A. & SINIGAGLIA, F. 1998. Differential expression of chemokine receptors and chemotactic responsiveness of type 1 T helper cells (Th1s) and Th2s. J Exp Med, 187, 129-34.
BONVALET, M., MOUSSU, H., WAMBRE, E., RICARTE, C., HORIOT, S., RIMANIOL, A. C., KWOK, W. W., HORAK, F., DE BEAUMONT, O., BARON-BODO, V. & MOINGEON, P. 2012. Allergen-specific CD4(+) T cell responses in peripheral blood do not predict the early onset of clinical efficacy during grass pollen sublingual immunotherapy. Clin Exp Allergy, 42, 1745-55.
BOUAZIZ, J.-D., CALBO, S., MAHO-VAILLANT, M., SAUSSINE, A., BAGOT, M., BENSUSSAN, A. & MUSETTE, P. 2010. IL-10 produced by activated human B cells regulates CD4+ T-cell activation in vitro. European journal of immunology, 40, 2686-2691.
BOURKE, E., BOSISIO, D., GOLAY, J., POLENTARUTTI, N. & MANTOVANI, A. 2003. The toll-like receptor repertoire of human B lymphocytes: inducible and selective expression of TLR9 and TLR10 in normal and transformed cells. Blood, 102, 956-63.
BOUSQUET, J., HEINZERLING, L., BACHERT, C., PAPADOPOULOS, N. G., BOUSQUET, P. J., BURNEY, P. G., CANONICA, G. W., CARLSEN, K. H., COX, L., HAAHTELA, T., LODRUP CARLSEN, K. C., PRICE, D., SAMOLINSKI, B., SIMONS, F. E., WICKMAN, M., ANNESI-MAESANO, I., BAENA-CAGNANI, C. E., BERGMANN, K. C., BINDSLEV-JENSEN, C., CASALE, T. B., CHIRIAC, A., CRUZ, A. A., DUBAKIENE, R., DURHAM, S. R., FOKKENS, W. J., GERTH-VAN-WIJK, R., KALAYCI, O., KOWALSKI, M. L., MARI, A., MULLOL, J., NAZAMOVA-BARANOVA, L., O'HEHIR, R. E., OHTA, K.,

169
PANZNER, P., PASSALACQUA, G., RING, J., ROGALA, B., ROMANO, A., RYAN, D., SCHMID-GRENDELMEIER, P., TODO-BOM, A., VALENTA, R., WOEHRL, S., YUSUF, O. M., ZUBERBIER, T., DEMOLY, P., GLOBAL, A., ASTHMA EUROPEAN, N., ALLERGIC, R. & ITS IMPACT ON, A. 2012. Practical guide to skin prick tests in allergy to aeroallergens. Allergy, 67, 18-24.
BOUSQUET, J., LEBEL, B., DHIVERT, H., BATAILLE, Y., MARTINOT, B. & MICHEL, F. B. 1987. NASAL CHALLENGE WITH POLLEN GRAINS, SKIN-PRICK TESTS AND SPECIFIC IGE IN PATIENTS WITH GRASS-POLLEN ALLERGY. Clinical Allergy, 17, 529-536.
BROWNLIE, R. J. & ZAMOYSKA, R. 2013. T cell receptor signalling networks: branched, diversified and bounded. Nat Rev Immunol, 13, 257-69.
BULLENS, D. M., VAN DEN KEYBUS, C., DILISSEN, E., KASRAN, A. & CEUPPENS, J. L. 2004. Allergen-specific T cells from birch-pollen-allergic patients and healthy controls differ in T helper 2 cytokine and in interleukin-10 production. Clin Exp Allergy, 34, 879-87.
BURNEY, P. & ECRHS. 1996. Variations in the prevalence of respiratory symptoms, self-reported asthma attacks, and use of asthma medication in the European Community Respiratory Health Survey (ECRHS). Eur Respir J, 9, 687-95.
BURR, M. L., EMBERLIN, J. C., TREU, R., CHENG, S., PEARCE, N. E. & THE, I. P. O. S. G. 2003. Pollen counts in relation to the prevalence of allergic rhinoconjunctivitis, asthma and atopic eczema in the International Study of Asthma and Allergies in Childhood (ISAAC). Clinical & Experimental Allergy, 33, 1675-1680.
BYSTROM, J., AMIN, K. & BISHOP-BAILEY, D. 2011. Analysing the eosinophil cationic protein--a clue to the function of the eosinophil granulocyte. Respir Res, 12, 10.
CALDERON, M., MOSGES, R., HELLMICH, M. & DEMOLY, P. 2010. Towards evidence-based medicine in specific grass pollen immunotherapy. Allergy, 65, 420-34.
CALDERON, M. A., ALVES, B., JACOBSON, M., HURWITZ, B., SHEIKH, A. & DURHAM, S. 2007. Allergen injection immunotherapy for seasonal allergic rhinitis. Cochrane Database Syst Rev, CD001936.
CARPENTER, A. C. & BOSSELUT, R. 2010. Decision checkpoints in the thymus. Nat Immunol, 11, 666-73.
CARPENTER, E. L., MICK, R., RÜTER, J. & VONDERHEIDE, R. H. 2009. Activation of human B cells by the agonist CD40 antibody CP-870,893 and augmentation with simultaneous toll-like receptor 9 stimulation. Journal of translational medicine, 7, 93.
CARTER, N. A., VASCONCELLOS, R., ROSSER, E. C., TULONE, C., MUNOZ-SUANO, A., KAMANAKA, M., EHRENSTEIN, M. R., FLAVELL, R. A. & MAURI, C. 2011. Mice lacking endogenous IL-10-producing regulatory B cells develop exacerbated disease and present with an increased frequency of Th1/Th17 but a decrease in regulatory T cells. J Immunol, 186, 5569-79.
CHAN, M. T., LEUNG, D. Y., SZEFLER, S. J. & SPAHN, J. D. 1998. Difficult-to-control asthma: clinical characteristics of steroid-insensitive asthma. J Allergy Clin Immunol, 101, 594-601.
CHEN, K. & CERUTTI, A. 2011. The function and regulation of immunoglobulin D. Curr Opin Immunol, 23, 345-52.
CHERUKURI, A., ROTHSTEIN, D. M., CLARK, B., CARTER, C. R., DAVISON, A., HERNANDEZ-FUENTES, M., HEWITT, E., SALAMA, A. D. & BAKER, R. J. 2014. Immunologic Human Renal Allograft Injury Associates with an Altered IL-10/TNF-alpha Expression Ratio in Regulatory B Cells. J Am Soc Nephrol.
CIPRANDI, G., DE AMICI, M., TOSCA, M. A., PISTORIO, A. & MARSEGLIA, G. L. 2009. Sublingual immunotherapy affects specific antibody and TGF-beta serum levels in patients with allergic rhinitis. Int J Immunopathol Pharmacol, 22, 1089-96.
CIRILLO, I., MARSEGLIA, G., KLERSY, C. & CIPRANDI, G. 2007. Allergic patients have more numerous and prolonged respiratory infections than nonallergic subjects. Allergy, 62, 1087-90.
COKER, H. A., DURHAM, S. R. & GOULD, H. J. 2003. Local somatic hypermutation and class switch recombination in the nasal mucosa of allergic rhinitis patients. J Immunol, 171, 5602-10.
170
COOK, K. D. & MILLER, J. 2010. TCR-Dependent Translational Control of GATA-3 Enhances Th2 Differentiation. The Journal of Immunology, 185, 3209-3216.
COOPER, P. J., VACA, M., RODRIGUEZ, A., CHICO, M. E., SANTOS, D. N., RODRIGUES, L. C. & BARRETO, M. L. 2014. Hygiene, atopy and wheeze-eczema-rhinitis symptoms in schoolchildren from urban and rural Ecuador. Thorax, 69, 232-9.
CORREALE, J., FAREZ, M. & RAZZITTE, G. 2008. Helminth infections associated with multiple sclerosis induce regulatory B cells. Ann Neurol, 64, 187-99.
CRETICOS, P. S., SCHROEDER, J. T., HAMILTON, R. G., BALCER-WHALEY, S. L., KHATTIGNAVONG, A. P., LINDBLAD, R., LI, H., COFFMAN, R., SEYFERT, V., EIDEN, J. J., BROIDE, D. & GROUP, I. T. N. 2006. Immunotherapy with a ragweed-toll-like receptor 9 agonist vaccine for allergic rhinitis. N Engl J Med, 355, 1445-55.
CURTISS, M. L., GORMAN, J. V., BUSINGA, T. R., TRAVER, G., SINGH, M., MEYERHOLZ, D. K., KLINE, J. N., MURPHY, A. J., VALENZUELA, D. M., COLGAN, J. D., ROTHMAN, P. B. & CASSEL, S. L. 2012. Tim-1 regulates Th2 responses in an airway hypersensitivity model. Eur J Immunol, 42, 651-61.
CUSTOVIC, A., MARINHO, S. & SIMPSON, A. 2012. Gene-environment interactions in the development of asthma and atopy. Expert Rev Respir Med, 6, 301-8.
CYSTER, J. G. 2010. B cell follicles and antigen encounters of the third kind. Nat Immunol, 11, 989-96. DAIEN, C. I., GAILHAC, S., MURA, T., RACHEL, A., COMBE, B., HAHNE, M. & MOREL, J. 2014.
Regulatory B10 cells are decreased in patients with rheumatoid arthritis and are inversely correlated with disease activity. Arthritis Rheumatol.
DAS, A., ELLIS, G., PALLANT, C., LOPES, A. R., KHANNA, P., PEPPA, D., CHEN, A., BLAIR, P., DUSHEIKO, G., GILL, U., KENNEDY, P. T., BRUNETTO, M., LAMPERTICO, P., MAURI, C. & MAINI, M. K. 2012. IL-10-producing regulatory B cells in the pathogenesis of chronic hepatitis B virus infection. J Immunol, 189, 3925-35.
DAVIES, J. M., PLATTS-MILLS, T. A. & AALBERSE, R. C. 2013. The enigma of IgE+ B-cell memory in human subjects. J Allergy Clin Immunol, 131, 972-6.
DE BRITO, C. A., FUSARO, A. E., VICTOR, J. R., RIGATO, P. O., GOLDONI, A. L., MUNIZ, B. P., DUARTE, A. J. & SATO, M. N. 2010. CpG-induced Th1-type response in the downmodulation of early development of allergy and inhibition of B7 expression on T cells of newborn mice. J Clin Immunol, 30, 280-91.
DE WAAL MALEFYT, R., HAANEN, J., SPITS, H., RONCAROLO, M. G., TE VELDE, A., FIGDOR, C., JOHNSON, K., KASTELEIN, R., YSSEL, H. & DE VRIES, J. E. 1991. Interleukin 10 (IL-10) and viral IL-10 strongly reduce antigen-specific human T cell proliferation by diminishing the antigen-presenting capacity of monocytes via downregulation of class II major histocompatibility complex expression. J Exp Med, 174, 915-24.
DEIFL, S. & BOHLE, B. 2011. Factors influencing the allergenicity and adjuvanticity of allergens. Immunotherapy, 3, 881-93.
DEMOLY, P., CHIRIAC, A. M., BERGE, B. & ROSTIN, M. 2014. Reasons for prescribing second generation antihistamines to treat allergic rhinitis in real-life conditions and patient response. Allergy Asthma Clin Immunol, 10, 29.
DEVILLIER, P., LE GALL, M. & HORAK, F. 2011. The allergen challenge chamber: a valuable tool for optimizing the clinical development of pollen immunotherapy. Allergy, 66, 163-9.
DI BONA, D., PLAIA, A., LETO-BARONE, M. S., LA PIANA, S. & DI LORENZO, G. 2012. Efficacy of subcutaneous and sublingual immunotherapy with grass allergens for seasonal allergic rhinitis: a meta-analysis-based comparison. J Allergy Clin Immunol, 130, 1097-1107 e2.
DILILLO, D. J., WEINBERG, J. B., YOSHIZAKI, A., HORIKAWA, M., BRYANT, J. M., IWATA, Y., MATSUSHITA, T., MATTA, K. M., CHEN, Y., VENTURI, G. M., RUSSO, G., GOCKERMAN, J. P., MOORE, J. O., DIEHL, L. F., VOLKHEIMER, A. D., FRIEDMAN, D. R., LANASA, M. C., HALL, R. P. & TEDDER, T. F. 2013. Chronic lymphocytic leukemia and regulatory B cells share IL-10 competence and immunosuppressive function. Leukemia, 27, 170-82.

171
DING, Q., YEUNG, M., CAMIRAND, G., ZENG, Q., AKIBA, H., YAGITA, H., CHALASANI, G., SAYEGH, M. H., NAJAFIAN, N. & ROTHSTEIN, D. M. 2011. Regulatory B cells are identified by expression of TIM-1 and can be induced through TIM-1 ligation to promote tolerance in mice. J Clin Invest, 121, 3645-56.
DING, Y., QIN, L., ZAMARIN, D., KOTENKO, S. V., PESTKA, S., MOORE, K. W. & BROMBERG, J. S. 2001. Differential IL-10R1 expression plays a critical role in IL-10-mediated immune regulation. J Immunol, 167, 6884-92.
DOMDEY, A., LIU, A., MILLNER, A., LUND, K., JACOBI, H., MALLING, H. J., SONDERGAARD, I. & WURTZEN, P. A. 2010. The T cell response to major grass allergens is regulated and includes IL-10 production in atopic but not in non-atopic subjects. Int Arch Allergy Immunol, 152, 243-54.
DUGGAL, N. A., UPTON, J., PHILLIPS, A. C., SAPEY, E. & LORD, J. M. 2013. An age-related numerical and functional deficit in CD19(+) CD24(hi) CD38(hi) B cells is associated with an increase in systemic autoimmunity. Aging Cell, 12, 873-81.
DURHAM, S. R., EMMINGER, W., KAPP, A., DE MONCHY, J. G., RAK, S., SCADDING, G. K., WURTZEN, P. A., ANDERSEN, J. S., THOLSTRUP, B., RIIS, B. & DAHL, R. 2012. SQ-standardized sublingual grass immunotherapy: confirmation of disease modification 2 years after 3 years of treatment in a randomized trial. J Allergy Clin Immunol, 129, 717-725 e5.
DURHAM, S. R. & LEUNG, D. Y. 2011. One hundred years of allergen immunotherapy: time to ring the changes. J Allergy Clin Immunol, 127, 3-7.
DURHAM, S. R., WALKER, S. M., VARGA, E. M., JACOBSON, M. R., O'BRIEN, F., NOBLE, W., TILL, S. J., HAMID, Q. A. & NOURI-ARIA, K. T. 1999. Long-term clinical efficacy of grass-pollen immunotherapy. N Engl J Med, 341, 468-75.
ECKL-DORNA, J. & BATISTA, F. D. 2009. BCR-mediated uptake of antigen linked to TLR9 ligand stimulates B-cell proliferation and antigen-specific plasma cell formation. Blood, 113, 3969-77.
EGE, M. J., BIELI, C., FREI, R., VAN STRIEN, R. T., RIEDLER, J., UBLAGGER, E., SCHRAM-BIJKERK, D., BRUNEKREEF, B., VAN HAGE, M., SCHEYNIUS, A., PERSHAGEN, G., BENZ, M. R., LAUENER, R., VON MUTIUS, E., BRAUN-FAHRLANDER, C. & PARSIFAL STUDY, T. 2006. Prenatal farm exposure is related to the expression of receptors of the innate immunity and to atopic sensitization in school-age children. J Allergy Clin Immunol, 117, 817-23.
EGE, M. J., HERZUM, I., BUCHELE, G., KRAUSS-ETSCHMANN, S., LAUENER, R. P., ROPONEN, M., HYVARINEN, A., VUITTON, D. A., RIEDLER, J., BRUNEKREEF, B., DALPHIN, J. C., BRAUN-FAHRLANDER, C., PEKKANEN, J., RENZ, H., VON MUTIUS, E. & PROTECTION AGAINST ALLERGY STUDY IN RURAL ENVIRONMENTS STUDY, G. 2008. Prenatal exposure to a farm environment modifies atopic sensitization at birth. J Allergy Clin Immunol, 122, 407-12, 412 e1-4.
EIBEL, H., KRAUS, H., SIC, H., KIENZLER, A. K. & RIZZI, M. 2014. B cell biology: an overview. Curr Allergy Asthma Rep, 14, 434.
EIFAN, A. O., SHAMJI, M. H. & DURHAM, S. R. 2011. Long-term clinical and immunological effects of allergen immunotherapy. Curr Opin Allergy Clin Immunol, 11, 586-93.
ELIASHAR, R. & LEVI-SCHAFFER, F. 2005. The role of the eosinophil in nasal diseases. Curr Opin Otolaryngol Head Neck Surg, 13, 171-5.
EVANS, J. G., CHAVEZ-RUEDA, K. A., EDDAOUDI, A., MEYER-BAHLBURG, A., RAWLINGS, D. J., EHRENSTEIN, M. R. & MAURI, C. 2007. Novel suppressive function of transitional 2 B cells in experimental arthritis. J Immunol, 178, 7868-78.
FILLATREAU, S. 2012. B Lymphocytes as Programmers and Effectors of Immunity, their Roles Beyond Antibody Production. Infectious Disorders – Drug Targets, 12, 179-80.
FILLATREAU, S., SWEENIE, C. H., MCGEACHY, M. J., GRAY, D. & ANDERTON, S. M. 2002. B cells regulate autoimmunity by provision of IL-10. Nat Immunol, 3, 944-50.
172
FINBLOOM, D. S. & WINESTOCK, K. D. 1995. IL-10 induces the tyrosine phosphorylation of tyk2 and Jak1 and the differential assembly of STAT1 alpha and STAT3 complexes in human T cells and monocytes. J Immunol, 155, 1079-90.
FLORES-BORJA, F., BOSMA, A., NG, D., REDDY, V., EHRENSTEIN, M. R., ISENBERG, D. A. & MAURI, C. 2013. CD19+CD24hiCD38hi B cells maintain regulatory T cells while limiting TH1 and TH17 differentiation. Sci Transl Med, 5, 173ra23.
FONSECA, D. E. & KLINE, J. N. 2009. Use of CpG oligonucleotides in treatment of asthma and allergic disease. Adv Drug Deliv Rev, 61, 256-62.
FONSECA, D. M., PAULA, M. O., WOWK, P. F., CAMPOS, L. W., GEMBRE, A. F., TURATO, W. M., RAMOS, S. G., DIAS-BARUFFI, M., BARBOZA, R., GOMES, E., HORN, C., MARCHAL, G., ARRUDA, L. K., RUSSO, M. & BONATO, V. L. 2011. IFN-gamma-mediated efficacy of allergen-free immunotherapy using mycobacterial antigens and CpG-ODN. Immunol Cell Biol, 89, 777-85.
FRANCIS, J. N., JAMES, L. K., PARASKEVOPOULOS, G., WONG, C., CALDERON, M. A., DURHAM, S. R. & TILL, S. J. 2008. Grass pollen immunotherapy: IL-10 induction and suppression of late responses precedes IgG4 inhibitory antibody activity. J Allergy Clin Immunol, 121, 1120-1125 e2.
FRANCIS, J. N., TILL, S. J. & DURHAM, S. R. 2003. Induction of IL-10+CD4+CD25+ T cells by grass pollen immunotherapy. Journal of Allergy and Clinical Immunology, 111, 1255-1261.
FRANSSON, M., BENSON, M., ERJEFALT, J. S., JANSSON, L., UDDMAN, R., BJORNSSON, S., CARDELL, L. O. & ADNER, M. 2007. Expression of Toll-like receptor 9 in nose, peripheral blood and bone marrow during symptomatic allergic rhinitis. Respir Res, 8, 17.
FREW, A. J. 2010. Allergen immunotherapy. J Allergy Clin Immunol, 125, S306-13. FURUZAWA-CARBALLEDA, J., HERNANDEZ-MOLINA, G., LIMA, G., RIVERA-VICENCIO, Y., FEREZ-
BLANDO, K. & LLORENTE, L. 2013. Peripheral regulatory cells immunophenotyping in Primary Sjogren's Syndrome: a cross-sectional study. Arthritis Res Ther, 15, R68.
GABRIELSSON, S., PAULIE, S., RAK, S., LAGGING, E., VAN HAGE-HAMSTEN, M., HARFAST, B. & TROYE-BLOMBERG, M. 1997. Specific induction of interleukin-4-producing cells in response to in vitro allergen stimulation in atopic individuals. Clin Exp Allergy, 27, 808-15.
GANLEY-LEAL, L. M., LIANG, Y., JAGANNATHAN-BOGDAN, M., FARRAYE, F. A. & NIKOLAJCZYK, B. S. 2010. Differential regulation of TLR4 expression in human B cells and monocytes. Mol Immunol, 48, 82-8.
GANTNER, F., HERMANN, P., NAKASHIMA, K., MATSUKAWA, S., SAKAI, K. & BACON, K. B. 2003. CD40-dependent and -independent activation of human tonsil B cells by CpG oligodeoxynucleotides. Eur J Immunol, 33, 1576-85.
GAO, Z., RENNIE, D. C. & SENTHILSELVAN, A. 2010. Allergic rhinitis and genetic components: focus on Toll-like receptors (TLRs) gene polymorphism. Appl Clin Genet, 3, 109-20.
GARAUD, S., LE DANTEC, C., DE MENDOZA, A. R., MAGEED, R. A., YOUINOU, P. & RENAUDINEAU, Y. 2009. IL-10 production by B cells expressing CD5 with the alternative exon 1B. Ann N Y Acad Sci, 1173, 280-5.
GARAUD, S., MORVA, A., LEMOINE, S., HILLION, S., BORDRON, A., PERS, J. O., BERTHOU, C., MAGEED, R. A., RENAUDINEAU, Y. & YOUINOU, P. 2011. CD5 promotes IL-10 production in chronic lymphocytic leukemia B cells through STAT3 and NFAT2 activation. J Immunol, 186, 4835-44.
GARRAUD, O., BORHIS, G., BADR, G., DEGRELLE, S., POZZETTO, B., COGNASSE, F. & RICHARD, Y. 2012. Revisiting the B-cell compartment in mouse and humans: more than one B-cell subset exists in the marginal zone and beyond. BMC Immunol, 13, 63.
GARY-GOUY, H., HARRIAGUE, J., BISMUTH, G., PLATZER, C., SCHMITT, C. & DALLOUL, A. H. 2002. Human CD5 promotes B-cell survival through stimulation of autocrine IL-10 production. Blood, 100, 4537-43.
GATTO, D. & BRINK, R. 2010. The germinal center reaction. J Allergy Clin Immunol, 126, 898-907; quiz 908-9.
173
GAUGRIS, S., SAZONOV-KOCEVAR, V. & THOMAS, M. 2006. Burden of concomitant allergic rhinitis in adults with asthma. J Asthma, 43, 1-7.
GAUVREAU, G. M., HESSEL, E. M., BOULET, L. P., COFFMAN, R. L. & O'BYRNE, P. M. 2006. Immunostimulatory sequences regulate interferon-inducible genes but not allergic airway responses. Am J Respir Crit Care Med, 174, 15-20.
GHOURI, N., HIPPISLEY-COX, J., NEWTON, J. & SHEIKH, A. 2008. Trends in the epidemiology and prescribing of medication for allergic rhinitis in England. J R Soc Med, 101, 466-72.
GIESECKE, C., FROLICH, D., REITER, K., MEI, H. E., WIRRIES, I., KUHLY, R., KILLIG, M., GLATZER, T., STOLZEL, K., PERKA, C., LIPSKY, P. E. & DORNER, T. 2014. Tissue distribution and dependence of responsiveness of human antigen-specific memory B cells. J Immunol, 192, 3091-100.
GIRON-GONZALEZ, J. A., MORAL, F. J., ELVIRA, J., GARCIA-GIL, D., GUERRERO, F., GAVILAN, I. & ESCOBAR, L. 2000. Consistent production of a higher TH1:TH2 cytokine ratio by stimulated T cells in men compared with women. Eur J Endocrinol, 143, 31-6.
GONZALEZ, S. F., DEGN, S. E., PITCHER, L. A., WOODRUFF, M., HEESTERS, B. A. & CARROLL, M. C. 2011. Trafficking of B cell antigen in lymph nodes. Annu Rev Immunol, 29, 215-33.
GRAY, M., MILES, K., SALTER, D., GRAY, D. & SAVILL, J. 2007. Apoptotic cells protect mice from autoimmune inflammation by the induction of regulatory B cells. Proc Natl Acad Sci U S A, 104, 14080-5.
GREINER, A. N., HELLINGS, P. W., ROTIROTI, G. & SCADDING, G. K. 2011. Allergic rhinitis. Lancet, 378, 2112-22.
GRUNIG, G., CORRY, D. B., LEACH, M. W., SEYMOUR, B. W., KURUP, V. P. & RENNICK, D. M. 1997. Interleukin-10 is a natural suppressor of cytokine production and inflammation in a murine model of allergic bronchopulmonary aspergillosis. J Exp Med, 185, 1089-99.
GUPTA, R., SHEIKH, A., STRACHAN, D. P. & ANDERSON, H. R. 2004. Burden of allergic disease in the UK: secondary analyses of national databases. Clin Exp Allergy, 34, 520-6.
GUPTA, S., AGRAWAL, S. & GOLLAPUDI, S. 2013. Increased activation and cytokine secretion in B cells stimulated with leptin in aged humans. Immun Ageing, 10, 3.
HAGN, M., EBEL, V., SONTHEIMER, K., SCHWESINGER, E., LUNOV, O., BEYER, T., FABRICIUS, D., BARTH, T. F., VIARDOT, A., STILGENBAUER, S., HEPP, J., SCHARFFETTER-KOCHANEK, K., SIMMET, T. & JAHRSDORFER, B. 2010. CD5+ B cells from individuals with systemic lupus erythematosus express granzyme B. Eur J Immunol, 40, 2060-9.
HAGN, M., SCHWESINGER, E., EBEL, V., SONTHEIMER, K., MAIER, J., BEYER, T., SYROVETS, T., LAUMONNIER, Y., FABRICIUS, D., SIMMET, T. & JAHRSDORFER, B. 2009. Human B cells secrete granzyme B when recognizing viral antigens in the context of the acute phase cytokine IL-21. J Immunol, 183, 1838-45.
HAGN, M., SONTHEIMER, K., DAHLKE, K., BRUEGGEMANN, S., KALTENMEIER, C., BEYER, T., HOFMANN, S., LUNOV, O., BARTH, T. F., FABRICIUS, D., TRON, K., NIENHAUS, G. U., SIMMET, T., SCHREZENMEIER, H. & JAHRSDORFER, B. 2012. Human B cells differentiate into granzyme B-secreting cytotoxic B lymphocytes upon incomplete T-cell help. Immunol Cell Biol, 90, 457-67.
HAN, D., WANG, C., LOU, W., GU, Y., WANG, Y. & ZHANG, L. 2010. Allergen-specific IL-10-secreting type I T regulatory cells, but not CD4(+)CD25(+)Foxp3(+) T cells, are decreased in peripheral blood of patients with persistent allergic rhinitis. Clin Immunol, 136, 292-301.
HARALAMBIEVA, I. H., OVSYANNIKOVA, I. G., KENNEDY, R. B., LARRABEE, B. R., SHANE PANKRATZ, V. & POLAND, G. A. 2013. Race and sex-based differences in cytokine immune responses to smallpox vaccine in healthy individuals. Hum Immunol, 74, 1263-6.
HAWRYLOWICZ, C. M. & O'GARRA, A. 2005. Potential role of interleukin-10-secreting regulatory T cells in allergy and asthma. Nat Rev Immunol, 5, 271-83.
HEINE, G., DROZDENKO, G., GRÜN, J. R., CHANG, H.-D., RADBRUCH, A. & WORM, M. 2014. Autocrine IL-10 promotes human B-cell differentiation into IgM- or IgG-secreting plasmablasts. European Journal of Immunology, 44, 1615-1621.
174
HEJL, C., WURTZEN, P. A., KLEINE-TEBBE, J., JOHANSEN, N., BROGE, L. & IPSEN, H. 2009. Phleum pratense alone is sufficient for allergen-specific immunotherapy against allergy to Pooideae grass pollens. Clin Exp Allergy, 39, 752-9.
HESSENBERGER, M., WEISS, R., WEINBERGER, E. E., BOEHLER, C., THALHAMER, J. & SCHEIBLHOFER, S. 2013. Transcutaneous delivery of CpG-adjuvanted allergen via laser-generated micropores. Vaccine, 31, 3427-34.
HEYDENREICH, B., BELLINGHAUSEN, I., KONIG, B., BECKER, W. M., GRABBE, S., PETERSEN, A. & SALOGA, J. 2012. Gram-positive bacteria on grass pollen exhibit adjuvant activity inducing inflammatory T cell responses. Clin Exp Allergy, 42, 76-84.
HOLAN, V., ZAJICOVA, A., JAVORKOVA, E., TROSAN, P., CHUDICKOVA, M., PAVLIKOVA, M. & KRULOVA, M. 2013. Distinct cytokines balance the development of regulatory T cells and IL-10-producing regulatory B cells. Immunology.
HOLGATE, S., BUHL, R., BOUSQUET, J., SMITH, N., PANAHLOO, Z. & JIMENEZ, P. 2009. The use of omalizumab in the treatment of severe allergic asthma: A clinical experience update. Respir Med, 103, 1098-113.
HORIGUCHI, S., TANAKA, Y., UCHIDA, T., CHAZONO, H., OOKAWA, T., SAKURAI, D. & OKAMOTO, Y. 2008. Seasonal changes in antigen-specific T-helper clone sizes in patients with Japanese cedar pollinosis: a 2-year study. Clin Exp Allergy, 38, 405-12.
HORNUNG, V., ROTHENFUSSER, S., BRITSCH, S., KRUG, A., JAHRSDORFER, B., GIESE, T., ENDRES, S. & HARTMANN, G. 2002. Quantitative expression of toll-like receptor 1-10 mRNA in cellular subsets of human peripheral blood mononuclear cells and sensitivity to CpG oligodeoxynucleotides. Journal of immunology, 168, 4531-7.
HSIEH, C. S., LEE, H. M. & LIO, C. W. 2012. Selection of regulatory T cells in the thymus. Nat Rev Immunol, 12, 157-67.
HUANG, C. F., WANG, C. C., WU, T. C., CHU, C. H. & PENG, H. J. 2007. Effect of sublingual administration with a native or denatured protein allergen and adjuvant CpG oligodeoxynucleotides or cholera toxin on systemic T(H)2 immune responses and mucosal immunity in mice. Ann Allergy Asthma Immunol, 99, 443-52.
HUGGINS, J., PELLEGRIN, T., FELGAR, R. E., WEI, C., BROWN, M., ZHENG, B., MILNER, E. C., BERNSTEIN, S. H., SANZ, I. & ZAND, M. S. 2007. CpG DNA activation and plasma-cell differentiation of CD27- naive human B cells. Blood, 109, 1611-9.
HUSSAARTS, L., VAN DER VLUGT, L. E., YAZDANBAKHSH, M. & SMITS, H. H. 2011. Regulatory B-cell induction by helminths: implications for allergic disease. J Allergy Clin Immunol, 128, 733-9.
ISHIDA, H., HASTINGS, R., KEARNEY, J. & HOWARD, M. 1992. Continuous anti-interleukin 10 antibody administration depletes mice of Ly-1 B cells but not conventional B cells. J Exp Med, 175, 1213-20.
ITO, Y., ADACHI, Y., MAKINO, T., HIGASHIYAMA, H., FUCHIZAWA, T., SHIMIZU, T. & MIYAWAKI, T. 2009. Expansion of FOXP3-positive CD4+CD25+ T cells associated with disease activity in atopic dermatitis. Ann Allergy Asthma Immunol, 103, 160-5.
IWATA, S., YAMAOKA, K., NIIRO, H., NAKANO, K., WANG, S. P., AKASHI, K. & TANAKA, Y. 2012. Amplification of Toll-like receptor-mediated signaling through spleen tyrosine kinase in human B-cell activation. J Allergy Clin Immunol, 129, 1594-601 e2.
IWATA, Y., MATSUSHITA, T., HORIKAWA, M., DILILLO, D. J., YANABA, K., VENTURI, G. M., SZABOLCS, P. M., BERNSTEIN, S. H., MAGRO, C. M., WILLIAMS, A. D., HALL, R. P., ST CLAIR, E. W. & TEDDER, T. F. 2011. Characterization of a rare IL-10-competent B-cell subset in humans that parallels mouse regulatory B10 cells. Blood, 117, 530-41.
JAMES, L. K., SHAMJI, M. H., WALKER, S. M., WILSON, D. R., WACHHOLZ, P. A., FRANCIS, J. N., JACOBSON, M. R., KIMBER, I., TILL, S. J. & DURHAM, S. R. 2011a. Long-term tolerance after allergen immunotherapy is accompanied by selective persistence of blocking antibodies. J Allergy Clin Immunol, 127, 509-516 e1-5.
175
JAMES, L. K., SHAMJI, M. H., WALKER, S. M., WILSON, D. R., WACHHOLZ, P. A., FRANCIS, J. N., JACOBSON, M. R., KIMBER, I., TILL, S. J. & DURHAM, S. R. 2011b. Long-term tolerance after allergen immunotherapy is accompanied by selective persistence of blocking antibodies. J Allergy Clin Immunol, 127, 509-516.e1-5.
JEANNIN, P., LECOANET, S., DELNESTE, Y., GAUCHAT, J.-F. & BONNEFOY, J.-Y. 1998. IgE Versus IgG4 Production Can Be Differentially Regulated by IL-10. The Journal of Immunology, 160, 3555-3561.
JIANG, W., LEDERMAN, M. M., HARDING, C. V. & SIEG, S. F. 2011. Presentation of soluble antigens to CD8+ T cells by CpG oligodeoxynucleotide-primed human naive B cells. J Immunol, 186, 2080-6.
JIAO, Y., WANG, X., ZHANG, T., LIJUN, S., WANG, R., LI, W., JI, Y., WU, H. & LIU, C. 2014. Regulatory B cells correlate with HIV disease progression. Microbiol Immunol, 58, 449-55.
JINQUAN, T., JACOBI, H. H., JING, C., MILLNER, A., STEN, E., HVIID, L., ANTING, L., RYDER, L. P., GLUE, C., SKOV, P. S., JARMAN, E., LAMBERTH, K., MALLING, H. J. & POULSEN, L. K. 2003. CCR3 expression induced by IL-2 and IL-4 functioning as a death receptor for B cells. J Immunol, 171, 1722-31.
JOHANSSON-LINDBOM, B. & BORREBAECK, C. A. K. 2002. Germinal Center B Cells Constitute a Predominant Physiological Source of IL-4: Implication for Th2 Development In Vivo. The Journal of Immunology, 168, 3165-3172.
JOINT-FORMULARY-COMMITTEE 2014. Section 3.4.2. Allergen immunotherapy British National Formulary (online). July ed. http://www.evidence.nhs.uk/formulary/bnf/current/3-respiratory-system/34-antihistamines-hyposensitisation-and-allergic-emergencies/342-allergen-immunotherapy#: London: BMJ Group and Pharmaceutical Press
JOURDY, D. N. & REISACHER, W. R. 2012. Factors affecting time required to reach maintenance dose during subcutaneous immunotherapy. Int Forum Allergy Rhinol, 2, 294-9.
JUTEL, M. & AKDIS, C. A. 2011. T-cell subset regulation in atopy. Curr Allergy Asthma Rep, 11, 139-45. JUTEL, M., AKDIS, M., BUDAK, F., AEBISCHER-CASAULTA, C., WRZYSZCZ, M., BLASER, K. & AKDIS, C. A.
2003. IL-10 and TGF-beta cooperate in the regulatory T cell response to mucosal allergens in normal immunity and specific immunotherapy. Eur J Immunol, 33, 1205-14.
KAILAANMAKI, A., KINNUNEN, T., KWOK, W. W., RYTKONEN-NISSINEN, M., RANDELL, J. & VIRTANEN, T. 2014. Differential CD4+ T-cell responses of allergic and non-allergic subjects to the immunodominant epitope region of the horse major allergen Equ c 1. Immunology, 141, 52-60.
KAMINUMA, O., OHTOMO, T., MORI, A., NAGAKUBO, D., HIESHIMA, K., OHMACHI, Y., NODA, Y., KATAYAMA, K., SUZUKI, K., MOTOI, Y., KITAMURA, N., SAEKI, M., NISHIMURA, T., YOSHIE, O. & HIROI, T. 2012. Selective down-regulation of Th2 cell-mediated airway inflammation in mice by pharmacological intervention of CCR4. Clin Exp Allergy, 42, 315-25.
KATZ, S. I., PARKER, D. & TURK, J. L. 1974. B-cell suppression of delayed hypersensitivity reactions. Nature, 251, 550-1.
KEARLEY, J., BARKER, J. E., ROBINSON, D. S. & LLOYD, C. M. 2005. Resolution of airway inflammation and hyperreactivity after in vivo transfer of CD4+CD25+ regulatory T cells is interleukin 10 dependent. J Exp Med, 202, 1539-47.
KEMENY, D. M. 2012. The role of the T follicular helper cells in allergic disease. Cell Mol Immunol, 9, 386-9.
KESSEL, A., HAJ, T., PERI, R., SNIR, A., MELAMED, D., SABO, E. & TOUBI, E. 2012. Human CD19(+)CD25(high) B regulatory cells suppress proliferation of CD4(+) T cells and enhance Foxp3 and CTLA-4 expression in T-regulatory cells. Autoimmun Rev, 11, 670-7.
KHINCHI, M. S., POULSEN, L. K., CARAT, F., ANDRE, C., HANSEN, A. B. & MALLING, H. J. 2004. Clinical efficacy of sublingual and subcutaneous birch pollen allergen-specific immunotherapy: a randomized, placebo-controlled, double-blind, double-dummy study. Allergy, 59, 45-53.
176
KHODER, A., SARVARIA, A., ALSULIMAN, A., CHEW, C., SEKINE, T., COOPER, N., MIELKE, S., DE LAVALLADE, H., MUFTUOGLU, M., FERNANDEZ CURBELO, I., LIU, E., MURARO, P. A., ALOUSI, A., STRINGARIS, K., PARMAR, S., SHAH, N., SHAIM, H., YVON, E., MOLLDREM, J., ROUCE, R., CHAMPLIN, R., MCNIECE, I., MAURI, C., SHPALL, E. J. & REZVANI, K. 2014. Regulatory B-Cells Are Enriched Within the IgM Memory and Transitional Subsets in Healthy Donors but Deficient In Chronic Graft-Versus-Host Disease. Blood.
KHONG, A., NELSON, D. J., NOWAK, A. K., LAKE, R. A. & ROBINSON, B. W. 2012. The use of agonistic anti-CD40 therapy in treatments for cancer. Int Rev Immunol, 31, 246-66.
KIEL, M. A., RODER, E., GERTH VAN WIJK, R., AL, M. J., HOP, W. C. & RUTTEN-VAN MOLKEN, M. P. 2013. Real-life compliance and persistence among users of subcutaneous and sublingual allergen immunotherapy. J Allergy Clin Immunol, 132, 353-60 e2.
KIMURA, A. & KISHIMOTO, T. 2010. IL-6: Regulator of Treg/Th17 balance. Eur J Immunol, 40, 1830-1835.
KLIER, J., FUCHS, S., MAY, A., SCHILLINGER, U., PLANK, C., WINTER, G., COESTER, C. & GEHLEN, H. 2012. A nebulized gelatin nanoparticle-based CpG formulation is effective in immunotherapy of allergic horses. Pharm Res, 29, 1650-7.
KLIMEK, L., WILLERS, J., HAMMANN-HAENNI, A., PFAAR, O., STOCKER, H., MUELLER, P., RENNER, W. A. & BACHMANN, M. F. 2011. Assessment of clinical efficacy of CYT003-QbG10 in patients with allergic rhinoconjunctivitis: a phase IIb study. Clin Exp Allergy, 41, 1305-12.
KLINKER, M. W. & LUNDY, S. K. 2012. Multiple mechanisms of immune suppression by B lymphocytes. Mol Med, 18, 123-37.
KNIPPENBERG, S., PEELEN, E., SMOLDERS, J., THEWISSEN, M., MENHEERE, P., COHEN TERVAERT, J. W., HUPPERTS, R. & DAMOISEAUX, J. 2011. Reduction in IL-10 producing B cells (Breg) in multiple sclerosis is accompanied by a reduced naive/memory Breg ratio during a relapse but not in remission. J Neuroimmunol, 239, 80-6.
KOBAYASHI, S., HARUO, N., SUGANE, K., OCHS, H. D. & AGEMATSU, K. 2009. Interleukin-21 stimulates B-cell immunoglobulin E synthesis in human beings concomitantly with activation-induced cytidine deaminase expression and differentiation into plasma cells. Hum Immunol, 70, 35-40.
KOELSCH, K., ZHENG, N. Y., ZHANG, Q., DUTY, A., HELMS, C., MATHIAS, M. D., JARED, M., SMITH, K., CAPRA, J. D. & WILSON, P. C. 2007. Mature B cells class switched to IgD are autoreactive in healthy individuals. J Clin Invest, 117, 1558-65.
KOMATSU, N., OKAMOTO, K., SAWA, S., NAKASHIMA, T., OH-HORA, M., KODAMA, T., TANAKA, S., BLUESTONE, J. A. & TAKAYANAGI, H. 2014. Pathogenic conversion of Foxp3+ T cells into TH17 cells in autoimmune arthritis. Nat Med, 20, 62-8.
KOPF, M., LE GROS, G., BACHMANN, M., LAMERS, M. C., BLUETHMANN, H. & KOHLER, G. 1993. Disruption of the murine IL-4 gene blocks Th2 cytokine responses. Nature, 362, 245-8.
KOPP, M. V., HAMELMANN, E., BENDIKS, M., ZIELEN, S., KAMIN, W., BERGMANN, K. C., KLEIN, C., WAHN, U. & GROUP, D. S. 2013. Transient impact of omalizumab in pollen allergic patients undergoing specific immunotherapy. Pediatr Allergy Immunol, 24, 427-33.
KRAWCZYK, C. M., SHEN, H. & PEARCE, E. J. 2007. Functional plasticity in memory T helper cell responses. J Immunol, 178, 4080-8.
KUBO, S., YAMADA, T., OSAWA, Y., ITO, Y., NARITA, N. & FUJIEDA, S. 2012. Cytosine-phosphate-guanosine-DNA induces CD274 expression in human B cells and suppresses T helper type 2 cytokine production in pollen antigen-stimulated CD4-positive cells. Clin Exp Immunol, 169, 1-9.
KUHN, R., LOHLER, J., RENNICK, D., RAJEWSKY, K. & MULLER, W. 1993. Interleukin-10-deficient mice develop chronic enterocolitis. Cell, 75, 263-74.
KURATA, H., LEE, H. J., MCCLANAHAN, T., COFFMAN, R. L., O'GARRA, A. & ARAI, N. 2002. Friend of GATA is expressed in naive Th cells and functions as a repressor of GATA-3-mediated Th2 cell development. J Immunol, 168, 4538-45.
177
LAFFER, S., SPITZAUER, S., SUSANI, M., PAIRLEITNER, H., SCHWEIGER, C., GRONLUND, H., MENZ, G., PAULI, G., ISHII, T., NOLTE, H., EBNER, C., SEHON, A. H., KRAFT, D., EICHLER, H. G. & VALENTA, R. 1996. Comparison of recombinant timothy grass pollen allergens with natural extract for diagnosis of grass pollen allergy in different populations. J Allergy Clin Immunol, 98, 652-8.
LANGKJAER, A., KRISTENSEN, B., HANSEN, B. E., SCHULTZ, H., HEGEDUS, L. & NIELSEN, C. H. 2012. B-cell exposure to self-antigen induces IL-10 producing B cells as well as IL-6- and TNF-alpha-producing B-cell subsets in healthy humans. Clin Immunol, 145, 1-10.
LEE, J. H., NOH, J., NOH, G., CHOI, W. S., CHO, S. & LEE, S. S. 2011. Allergen-specific transforming growth factor-beta-producing CD19+CD5+ regulatory B-cell (Br3) responses in human late eczematous allergic reactions to cow's milk. J Interferon Cytokine Res, 31, 441-9.
LEE, K. M., KIM, J. I., STOTT, R., SOOHOO, J., O'CONNOR, M. R., YEH, H., ZHAO, G., ELIADES, P., FOX, C., CHENG, N., DENG, S. & MARKMANN, J. F. 2012. Anti-CD45RB/anti-TIM-1-induced tolerance requires regulatory B cells. Am J Transplant, 12, 2072-8.
LEE, K. M., STOTT, R. T., ZHAO, G., SOOHOO, J., XIONG, W., LIAN, M. M., FITZGERALD, L., SHI, S., AKRAWI, E., LEI, J., DENG, S., YEH, H., MARKMANN, J. F. & KIM, J. I. 2014. TGF-beta-producing regulatory B cells induce regulatory T cells and promote transplantation tolerance. Eur J Immunol, 44, 1728-36.
LEE, Y. K., TURNER, H., MAYNARD, C. L., OLIVER, J. R., CHEN, D., ELSON, C. O. & WEAVER, C. T. 2009. Late developmental plasticity in the T helper 17 lineage. Immunity, 30, 92-107.
LEMOINE, S., MORVA, A., YOUINOU, P. & JAMIN, C. 2011. Human T cells induce their own regulation through activation of B cells. J Autoimmun, 36, 228-38.
LEPSE, N., ABDULAHAD, W. H., RUTGERS, A., KALLENBERG, C. G., STEGEMAN, C. A. & HEERINGA, P. 2014. Altered B cell balance, but unaffected B cell capacity to limit monocyte activation in anti-neutrophil cytoplasmic antibody-associated vasculitis in remission. Rheumatology (Oxford).
LEVY, Y. & BROUET, J. C. 1994. Interleukin-10 prevents spontaneous death of germinal center B cells by induction of the bcl-2 protein. J Clin Invest, 93, 424-8.
LEXBERG, M. H., TAUBNER, A., FORSTER, A., ALBRECHT, I., RICHTER, A., KAMRADT, T., RADBRUCH, A. & CHANG, H. D. 2008. Th memory for interleukin-17 expression is stable in vivo. Eur J Immunol, 38, 2654-64.
LEYNAERT, B., NEUKIRCH, C., KONY, S., GUENEGOU, A., BOUSQUET, J., AUBIER, M. & NEUKIRCH, F. 2004. Association between asthma and rhinitis according to atopic sensitization in a population-based study. J Allergy Clin Immunol, 113, 86-93.
LI, X., ZHONG, H., BAO, W., BOULAD, N., EVANGELISTA, J., HAIDER, M. A., BUSSEL, J. & YAZDANBAKHSH, K. 2012. Defective regulatory B-cell compartment in patients with immune thrombocytopenia. Blood, 120, 3318-25.
LIANG, Y., HASTURK, H., ELLIOT, J., NORONHA, A., LIU, X., WETZLER, L. M., MASSARI, P., KANTARCI, A., WINTER, H. S., FARRAYE, F. A. & GANLEY-LEAL, L. M. 2011. Toll-like receptor 2 induces mucosal homing receptor expression and IgA production by human B cells. Clin Immunol, 138, 33-40.
LIEW, F. Y., XU, D., BRINT, E. K. & O'NEILL, L. A. 2005. Negative regulation of toll-like receptor-mediated immune responses. Nat Rev Immunol, 5, 446-58.
LIN, S. C., CHUANG, Y. H., YANG, Y. H. & CHIANG, B. L. 2011. Decrease in interleukin-21 in children suffering with severe atopic dermatitis. Pediatr Allergy Immunol, 22, 869-75.
LIN, W., CERNY, D., CHUA, E., DUAN, K., YI, J. T., SHADAN, N. B., LUM, J., MAHO-VAILLANT, M., ZOLEZZI, F., WONG, S. C., LARBI, A., FINK, K., MUSETTE, P., POIDINGER, M. & CALBO, S. 2014. Human regulatory B cells combine phenotypic and genetic hallmarks with a distinct differentiation fate. J Immunol, 193, 2258-66.

178
LIN, Z., ZHOU, L., LUO, X., XIA, W., CHEN, D., XU, R., WANG, J., LUO, R., XU, G. & LI, H. 2013. Suppression of TIM-1 predicates clinical efficacy of sublingual immunotherapy for allergic rhinitis in children. Int J Pediatr Otorhinolaryngol, 77, 1345-9.
LINDNER, S., DAHLKE, K., SONTHEIMER, K., HAGN, M., KALTENMEIER, C., BARTH, T. F., BEYER, T., REISTER, F., FABRICIUS, D., LOTFI, R., LUNOV, O., NIENHAUS, G. U., SIMMET, T., KREIENBERG, R., MOLLER, P., SCHREZENMEIER, H. & JAHRSDORFER, B. 2013. Interleukin 21-induced granzyme B-expressing B cells infiltrate tumors and regulate T cells. Cancer Res, 73, 2468-79.
LING, E. M., SMITH, T., NGUYEN, X. D., PRIDGEON, C., DALLMAN, M., ARBERY, J., CARR, V. A. & ROBINSON, D. S. 2004. Relation of CD4+CD25+ regulatory T-cell suppression of allergen-driven T-cell activation to atopic status and expression of allergic disease. Lancet, 363, 608-15.
LINNEBERG, A., JACOBSEN, R. K., JESPERSEN, L. & ABILDSTROM, S. Z. 2012. Association of subcutaneous allergen-specific immunotherapy with incidence of autoimmune disease, ischemic heart disease, and mortality. J Allergy Clin Immunol, 129, 413-9.
LISTON, A. & GRAY, D. H. 2014. Homeostatic control of regulatory T cell diversity. Nat Rev Immunol, 14, 154-65.
LIU, B.-S., CAO, Y., HUIZINGA, T. W., HAFLER, D. A. & TOES, R. E. M. 2014a. TLR-mediated STAT3 and ERK activation controls IL-10 secretion by human B cells. European Journal of Immunology, n/a-n/a.
LIU, B. S., STOOP, J. N., HUIZINGA, T. W. & TOES, R. E. 2013a. IL-21 Enhances the Activity of the TLR-MyD88-STAT3 Pathway but Not the Classical TLR-MyD88-NF-kappaB Pathway in Human B Cells To Boost Antibody Production. J Immunol, 191, 4086-94.
LIU, J., ZHAN, W., KIM, C. J., CLAYTON, K., ZHAO, H., LEE, E., CAO, J. C., ZIEGLER, B., GREGOR, A., YUE, F. Y., HUIBNER, S., MACPARLAND, S., SCHWARTZ, J., SONG, H. H., BENKO, E., GYENES, G., KOVACS, C., KAUL, R. & OSTROWSKI, M. 2014b. IL-10-producing B cells are induced early in HIV-1 infection and suppress HIV-1-specific T cell responses. PLoS One, 9, e89236.
LIU, Y., YU, S., LI, Z., MA, J., ZHANG, Y., WANG, H., YANG, B. & WU, C. 2013b. TGF-beta enhanced IL-21-induced differentiation of human IL-21-producing CD4+ T cells via Smad3. PLoS One, 8, e64612.
LIU, Y., ZENG, M. & LIU, Z. 2014c. Th17 response and its regulation in inflammatory upper airway diseases. Clin Exp Allergy.
LLUIS, A., DEPNER, M., GAUGLER, B., SAAS, P., CASACA, V. I., RAEDLER, D., MICHEL, S., TOST, J., LIU, J., GENUNEIT, J., PFEFFERLE, P., ROPONEN, M., WEBER, J., BRAUN-FAHRLANDER, C., RIEDLER, J., LAUENER, R., VUITTON, D. A., DALPHIN, J. C., PEKKANEN, J., VON MUTIUS, E., SCHAUB, B. & PROTECTION AGAINST ALLERGY: STUDY IN RURAL ENVIRONMENTS STUDY, G. 2014. Increased regulatory T-cell numbers are associated with farm milk exposure and lower atopic sensitization and asthma in childhood. J Allergy Clin Immunol, 133, 551-9.
LOSS, G., APPRICH, S., WASER, M., KNEIFEL, W., GENUNEIT, J., BUCHELE, G., WEBER, J., SOZANSKA, B., DANIELEWICZ, H., HORAK, E., VAN NEERVEN, R. J., HEEDERIK, D., LORENZEN, P. C., VON MUTIUS, E., BRAUN-FAHRLANDER, C. & GROUP, G. S. 2011. The protective effect of farm milk consumption on childhood asthma and atopy: the GABRIELA study. J Allergy Clin Immunol, 128, 766-773 e4.
LUGER, E. O., FOKUHL, V., WEGMANN, M., ABRAM, M., TILLACK, K., ACHATZ, G., MANZ, R. A., WORM, M., RADBRUCH, A. & RENZ, H. 2009. Induction of long-lived allergen-specific plasma cells by mucosal allergen challenge. J Allergy Clin Immunol, 124, 819-26 e4.
LUNDELL, A. C., JOHANSEN, S., ADLERBERTH, I., WOLD, A. E., HESSELMAR, B. & RUDIN, A. 2014. High Proportion of CD5+ B Cells in Infants Predicts Development of Allergic Disease. J Immunol.
LUNDY, S. K. 2002. Fas Ligand-Expressing B-1a Lymphocytes Mediate CD4+-T-Cell Apoptosis during Schistosomal Infection: Induction by Interleukin 4 (IL-4) and IL-10. Infection and Immunity, 70, 812-819.
179
LUNDY, S. K. & FOX, D. A. 2009. Reduced Fas ligand-expressing splenic CD5+ B lymphocytes in severe collagen-induced arthritis. Arthritis Res Ther, 11, R128.
MA, L., LIU, B., JIANG, Z. & JIANG, Y. 2013. Reduced numbers of regulatory B cells are negatively correlated with disease activity in patients with new-onset rheumatoid arthritis. Clin Rheumatol.
MADDALY, R., PAI, G., BALAJI, S., SIVARAMAKRISHNAN, P., SRINIVASAN, L., SUNDER, S. S. & PAUL, S. F. 2010. Receptors and signaling mechanisms for B-lymphocyte activation, proliferation and differentiation--insights from both in vivo and in vitro approaches. FEBS Lett, 584, 4883-94.
MAGEED, R. A., GARAUD, S., TAHER, T. E., PARIKH, K., PERS, J. O., JAMIN, C., RENAUDINEAU, Y. & YOUINOU, P. 2012. CD5 expression promotes multiple intracellular signaling pathways in B lymphocyte. Autoimmun Rev, 11, 795-8.
MAGGI, E., VULTAGGIO, A. & MATUCCI, A. 2012. T-cell responses during allergen-specific immunotherapy. Curr Opin Allergy Clin Immunol, 12, 1-6.
MAGGI, L., SANTARLASCI, V., LIOTTA, F., FROSALI, F., ANGELI, R., COSMI, L., MAGGI, E., ROMAGNANI, S. & ANNUNZIATO, F. 2007. Demonstration of circulating allergen-specific CD4+CD25highFoxp3+ T-regulatory cells in both nonatopic and atopic individuals. J Allergy Clin Immunol, 120, 429-36.
MAHESH, P. A., VEDANTHAN, P. K., HOLLA, A. D., JAYARAJ, B. S. & PRABHAKAR, A. K. 2009. Time interval and the factors associated with the development of asthma in patients with allergic rhinitis. Lung, 187, 393-400.
MAJKOWSKA-WOJCIECHOWSKA, B., PELKA, J., KORZON, L., KOZLOWSKA, A., KACZALA, M., JARZEBSKA, M., GWARDYS, T. & KOWALSKI, M. L. 2007. Prevalence of allergy, patterns of allergic sensitization and allergy risk factors in rural and urban children. Allergy, 62, 1044-50.
MAKELA, M. J., KANEHIRO, A., BORISH, L., DAKHAMA, A., LOADER, J., JOETHAM, A., XING, Z., JORDANA, M., LARSEN, G. L. & GELFAND, E. W. 2000. IL-10 is necessary for the expression of airway hyperresponsiveness but not pulmonary inflammation after allergic sensitization. Proc Natl Acad Sci U S A, 97, 6007-12.
MANTEL, P. Y., KUIPERS, H., BOYMAN, O., RHYNER, C., OUAKED, N., RUCKERT, B., KARAGIANNIDIS, C., LAMBRECHT, B. N., HENDRIKS, R. W., CRAMERI, R., AKDIS, C. A., BLASER, K. & SCHMIDT-WEBER, C. B. 2007. GATA3-driven Th2 responses inhibit TGF-beta1-induced FOXP3 expression and the formation of regulatory T cells. PLoS Biol, 5, e329.
MARIE-CARDINE, A., DIVAY, F., DUTOT, I., GREEN, A., PERDRIX, A., BOYER, O., CONTENTIN, N., TILLY, H., TRON, F., VANNIER, J. P. & JACQUOT, S. 2008. Transitional B cells in humans: characterization and insight from B lymphocyte reconstitution after hematopoietic stem cell transplantation. Clin Immunol, 127, 14-25.
MAROGNA, M., SPADOLINI, I., MASSOLO, A., CANONICA, G. W. & PASSALACQUA, G. 2010. Long-lasting effects of sublingual immunotherapy according to its duration: a 15-year prospective study. J Allergy Clin Immunol, 126, 969-75.
MASEDA, D., SMITH, S. H., DILILLO, D. J., BRYANT, J. M., CANDANDO, K. M., WEAVER, C. T. & TEDDER, T. F. 2012. Regulatory B10 cells differentiate into antibody-secreting cells after transient IL-10 production in vivo. J Immunol, 188, 1036-48.
MAURI, C. & BOSMA, A. 2012. Immune regulatory function of B cells. Annu Rev Immunol, 30, 221-41. MAURI, C. & EHRENSTEIN, M. R. 2008. The 'short' history of regulatory B cells. Trends Immunol, 29,
34-40. MAURI, C., GRAY, D., MUSHTAQ, N. & LONDEI, M. 2003. Prevention of arthritis by interleukin 10-
producing B cells. J Exp Med, 197, 489-501. MEADOWS, A., KAAMBWA, B., NOVIELLI, N., HUISSOON, A., FRY-SMITH, A., MEADS, C., BARTON, P. &
DRETZKE, J. 2013. A systematic review and economic evaluation of subcutaneous and sublingual allergen immunotherapy in adults and children with seasonal allergic rhinitis. Health Technol Assess, 17, vi, xi-xiv, 1-322.
180
MEILER, F., ZUMKEHR, J., KLUNKER, S., RUCKERT, B., AKDIS, C. A. & AKDIS, M. 2008. In vivo switch to IL-10-secreting T regulatory cells in high dose allergen exposure. J Exp Med, 205, 2887-98.
MIKHAK, Z., STRASSNER, J. P. & LUSTER, A. D. 2013. Lung dendritic cells imprint T cell lung homing and promote lung immunity through the chemokine receptor CCR4. J Exp Med, 210, 1855-69.
MILES, K., HEANEY, J., SIBINSKA, Z., SALTER, D., SAVILL, J., GRAY, D. & GRAY, M. 2012. A tolerogenic role for Toll-like receptor 9 is revealed by B-cell interaction with DNA complexes expressed on apoptotic cells. Proc Natl Acad Sci U S A, 109, 887-92.
MILLS, C. D. 2012. M1 and M2 Macrophages: Oracles of Health and Disease. Crit Rev Immunol, 32, 463-88.
MILNER, J. D., FAZILLEAU, N., MCHEYZER-WILLIAMS, M. & PAUL, W. 2010. Cutting edge: lack of high affinity competition for peptide in polyclonal CD4+ responses unmasks IL-4 production. J Immunol, 184, 6569-73.
MILOVANOVIC, M., HEINE, G., ZUBERBIER, T. & WORM, M. 2009. Allergen extract-induced interleukin-10 in human memory B cells inhibits immunoglobulin E production. Clin Exp Allergy, 39, 671-8.
MIZOGUCHI, A., MIZOGUCHI, E., SMITH, R. N., PREFFER, F. I. & BHAN, A. K. 1997. Suppressive role of B cells in chronic colitis of T cell receptor alpha mutant mice. J Exp Med, 186, 1749-56.
MIZOGUCHI, A., MIZOGUCHI, E., TAKEDATSU, H., BLUMBERG, R. S. & BHAN, A. K. 2002. Chronic intestinal inflammatory condition generates IL-10-producing regulatory B cell subset characterized by CD1d upregulation. Immunity, 16, 219-30.
MÖBS, C., IPSEN, H., MAYER, L., SLOTOSCH, C., PETERSEN, A., WÜRTZEN, P. A., HERTL, M. & PFÜTZNER, W. 2012. Birch pollen immunotherapy results in long-term loss of Bet v 1–specific TH2 responses, transient TR1 activation, and synthesis of IgE-blocking antibodies. Journal of Allergy and Clinical Immunology, 130, 1108-1116.e6.
MOBS, C., SLOTOSCH, C., LOFFLER, H., JAKOB, T., HERTL, M. & PFUTZNER, W. 2010. Birch pollen immunotherapy leads to differential induction of regulatory T cells and delayed helper T cell immune deviation. J Immunol, 184, 2194-203.
MORRIS, G. P. & ALLEN, P. M. 2012. How the TCR balances sensitivity and specificity for the recognition of self and pathogens. Nat Immunol, 13, 121-8.
MOSSER, D. M. & EDWARDS, J. P. 2008. Exploring the full spectrum of macrophage activation. Nat Rev Immunol, 8, 958-69.
MOTHES, N., HEINZKILL, M., DRACHENBERG, K. J., SPERR, W. R., KRAUTH, M. T., MAJLESI, Y., SEMPER, H., VALENT, P., NIEDERBERGER, V., KRAFT, D. & VALENTA, R. 2003. Allergen-specific immunotherapy with a monophosphoryl lipid A-adjuvanted vaccine: reduced seasonally boosted immunoglobulin E production and inhibition of basophil histamine release by therapy-induced blocking antibodies. Clin Exp Allergy, 33, 1198-208.
NAUNDORF, S., SCHRODER, M., HOFLICH, C., SUMAN, N., VOLK, H. D. & GRUTZ, G. 2009. IL-10 interferes directly with TCR-induced IFN-gamma but not IL-17 production in memory T cells. Eur J Immunol, 39, 1066-77.
NAUSCH, N., MIDZI, N., MDULUZA, T., MAIZELS, R. M. & MUTAPI, F. 2011. Regulatory and activated T cells in human Schistosoma haematobium infections. PLoS One, 6, e16860.
NEILL, D. R., WONG, S. H., BELLOSI, A., FLYNN, R. J., DALY, M., LANGFORD, T. K., BUCKS, C., KANE, C. M., FALLON, P. G., PANNELL, R., JOLIN, H. E. & MCKENZIE, A. N. 2010. Nuocytes represent a new innate effector leukocyte that mediates type-2 immunity. Nature, 464, 1367-70.
NETA, R. & SALVIN, S. B. 1974. Specific suppression of delayed hypersensitivity: the possible presence of a suppressor B cell in the regulation of delayed hypersensitivity. J Immunol, 113, 1716-25.
NEVEN, B., MAMESSIER, E., BRUNEAU, J., KALTENBACH, S., KOTLARZ, D., SUAREZ, F., MASLIAH-PLANCHON, J., BILLOT, K., CANIONI, D., FRANGE, P., RADFORD-WEISS, I., ASNAFI, V., MURUGAN, D., BOLE, C., NITSCHKE, P., GOULET, O., CASANOVA, J. L., BLANCHE, S., PICARD,

181
C., HERMINE, O., RIEUX-LAUCAT, F., BROUSSE, N., DAVI, F., BAUD, V., KLEIN, C., NADEL, B., RUEMMELE, F. & FISCHER, A. 2013. A Mendelian predisposition to B-cell lymphoma caused by IL-10R deficiency. Blood, 122, 3713-22.
NEVES, P., LAMPROPOULOU, V., CALDERON-GOMEZ, E., ROCH, T., STERVBO, U., SHEN, P., KUHL, A. A., LODDENKEMPER, C., HAURY, M., NEDOSPASOV, S. A., KAUFMANN, S. H., STEINHOFF, U., CALADO, D. P. & FILLATREAU, S. 2010. Signaling via the MyD88 adaptor protein in B cells suppresses protective immunity during Salmonella typhimurium infection. Immunity, 33, 777-90.
NG, T. H., BRITTON, G. J., HILL, E. V., VERHAGEN, J., BURTON, B. R. & WRAITH, D. C. 2013. Regulation of adaptive immunity; the role of interleukin-10. Front Immunol, 4, 129.
NGUYEN, H. H., TRAN, B. T., MULLER, W. & JACK, R. S. 2012. IL-10 acts as a developmental switch guiding monocyte differentiation to macrophages during a murine peritoneal infection. J Immunol, 189, 3112-20.
NIEDERBERGER, V., LAFFER, S., FROSCHL, R., KRAFT, D., RUMPOLD, H., KAPIOTIS, S., VALENTA, R. & SPITZAUER, S. 1998. IgE antibodies to recombinant pollen allergens (Phl p 1, Phl p 2, Phl p 5, and Bet v 2) account for a high percentage of grass pollen-specific IgE. J Allergy Clin Immunol, 101, 258-64.
NISHIMURA, M., KOGA, T., KAMIMURA, T., SATO, R., NATORI, H., MATSUO, K. & AIZAWA, H. 2011. Comparison of leukotriene receptor antagonists and anti-histamines as an add-on therapy in patients with asthma complicated by allergic rhinitis. Kurume Med J, 58, 9-14.
NOH, J., LEE, J. H., NOH, G., BANG, S. Y., KIM, H. S., CHOI, W. S., CHO, S. & LEE, S. S. 2010. Characterisation of allergen-specific responses of IL-10-producing regulatory B cells (Br1) in Cow Milk Allergy. Cell Immunol, 264, 143-9.
NOURI-ARIA, K. T., WACHHOLZ, P. A., FRANCIS, J. N., JACOBSON, M. R., WALKER, S. M., WILCOCK, L. K., STAPLE, S. Q., AALBERSE, R. C., TILL, S. J. & DURHAM, S. R. 2004. Grass pollen immunotherapy induces mucosal and peripheral IL-10 responses and blocking IgG activity. J Immunol, 172, 3252-9.
O'GARRA, A., CHANG, R., GO, N., HASTINGS, R., HAUGHTON, G. & HOWARD, M. 1992. Ly-1 B (B-1) cells are the main source of B cell-derived interleukin 10. Eur J Immunol, 22, 711-7.
O'GARRA, A., STAPLETON, G., DHAR, V., PEARCE, M., SCHUMACHER, J., RUGO, H., BARBIS, D., STALL, A., CUPP, J., MOORE, K. & ET AL. 1990. Production of cytokines by mouse B cells: B lymphomas and normal B cells produce interleukin 10. Int Immunol, 2, 821-32.
O'GARRA, A. & VIEIRA, P. 2007. T(H)1 cells control themselves by producing interleukin-10. Nat Rev Immunol, 7, 425-8.
OKADA, T. & CYSTER, J. G. 2006. B cell migration and interactions in the early phase of antibody responses. Curr Opin Immunol, 18, 278-85.
OLKHANUD, P. B., DAMDINSUREN, B., BODOGAI, M., GRESS, R. E., SEN, R., WEJKSZA, K., MALCHINKHUU, E., WERSTO, R. P. & BIRAGYN, A. 2011. Tumor-evoked regulatory B cells promote breast cancer metastasis by converting resting CD4(+) T cells to T-regulatory cells. Cancer Res, 71, 3505-15.
ONO, S., TSUJIMOTO, H., HIRAKI, S., TAKAHATA, R., KINOSHITA, M. & MOCHIZUKI, H. 2005. Sex differences in cytokine production and surface antigen expression of peripheral blood mononuclear cells after surgery. Am J Surg, 190, 439-44.
OSEROFF, C., SIDNEY, J., KOTTURI, M. F., KOLLA, R., ALAM, R., BROIDE, D. H., WASSERMAN, S. I., WEISKOPF, D., MCKINNEY, D. M., CHUNG, J. L., PETERSEN, A., GREY, H., PETERS, B. & SETTE, A. 2010. Molecular determinants of T cell epitope recognition to the common Timothy grass allergen. J Immunol, 185, 943-55.
OSHIO, T., KAWASHIMA, R., KAWAMURA, Y. I., HAGIWARA, T., MIZUTANI, N., OKADA, T., OTSUBO, T., INAGAKI-OHARA, K., MATSUKAWA, A., HAGA, T., KAKUTA, S., IWAKURA, Y., HOSOKAWA, S. & DOHI, T. 2014. Chemokine receptor CCR8 is required for lipopolysaccharide-triggered cytokine production in mouse peritoneal macrophages. PLoS One, 9, e94445.
182
PARIKH, S. A., CHO, S. H. & OH, C. K. 2003. Preformed enzymes in mast cell granules and their potential role in allergic rhinitis. Curr Allergy Asthma Rep, 3, 266-72.
PEREIRA-SANTOS, M. C., BAPTISTA, A. P., MELO, A., ALVES, R. R., SOARES, R. S., PEDRO, E., PEREIRA-BARBOSA, M., VICTORINO, R. M. & SOUSA, A. E. 2008. Expansion of circulating Foxp3+)D25bright CD4+ T cells during specific venom immunotherapy. Clin Exp Allergy, 38, 291-7.
PERKIN, M. R. & STRACHAN, D. P. 2006. Which aspects of the farming lifestyle explain the inverse association with childhood allergy? J Allergy Clin Immunol, 117, 1374-81.
PETITTO, J. M., FOLDS, J. D. & EVANS, D. L. 1993. Abnormal diurnal variation of B lymphocyte circulation patterns in major depression. Biol Psychiatry, 34, 268-70.
PIEPER, K., GRIMBACHER, B. & EIBEL, H. 2013. B-cell biology and development. J Allergy Clin Immunol, 131, 959-71.
PILETTE, C., NOURI-ARIA, K. T., JACOBSON, M. R., WILCOCK, L. K., DETRY, B., WALKER, S. M., FRANCIS, J. N. & DURHAM, S. R. 2007. Grass pollen immunotherapy induces an allergen-specific IgA2 antibody response associated with mucosal TGF-beta expression. J Immunol, 178, 4658-66.
POE, J. C., SMITH, S. H., HAAS, K. M., YANABA, K., TSUBATA, T., MATSUSHITA, T. & TEDDER, T. F. 2011. Amplified B lymphocyte CD40 signaling drives regulatory B10 cell expansion in mice. PLoS One, 6, e22464.
PONE, E. J., ZHANG, J., MAI, T., WHITE, C. A., LI, G., SAKAKURA, J. K., PATEL, P. J., AL-QAHTANI, A., ZAN, H., XU, Z. & CASALI, P. 2012. BCR-signalling synergizes with TLR-signalling for induction of AID and immunoglobulin class-switching through the non-canonical NF-kappaB pathway. Nat Commun, 3, 767.
POUND, J. D., CHALLA, A., HOLDER, M. J., ARMITAGE, R. J., DOWER, S. K., FANSLOW, W. C., KIKUTANI, H., PAULIE, S., GREGORY, C. D. & GORDON, J. 1999. Minimal cross-linking and epitope requirements for CD40-dependent suppression of apoptosis contrast with those for promotion of the cell cycle and homotypic adhesions in human B cells. International Immunology, 11, 11-20.
PRICE, D., ZHANG, Q., KOCEVAR, V. S., YIN, D. D. & THOMAS, M. 2005. Effect of a concomitant diagnosis of allergic rhinitis on asthma-related health care use by adults. Clin Exp Allergy, 35, 282-7.
PRITCHARD, D. I., BLOUNT, D. G., SCHMID-GRENDELMEIER, P. & TILL, S. J. 2012. Parasitic worm therapy for allergy: is this incongruous or avant-garde medicine? Clin Exp Allergy, 42, 505-12.
PROVOOST, S., MAES, T., VAN DURME, Y. M., GEVAERT, P., BACHERT, C., SCHMIDT-WEBER, C. B., BRUSSELLE, G. G., JOOS, G. F. & TOURNOY, K. G. 2009. Decreased FOXP3 protein expression in patients with asthma. Allergy, 64, 1539-46.
PUGA, I., COLS, M., BARRA, C. M., HE, B., CASSIS, L., GENTILE, M., COMERMA, L., CHORNY, A., SHAN, M., XU, W., MAGRI, G., KNOWLES, D. M., TAM, W., CHIU, A., BUSSEL, J. B., SERRANO, S., LORENTE, J. A., BELLOSILLO, B., LLORETA, J., JUANPERE, N., ALAMEDA, F., BARO, T., DE HEREDIA, C. D., TORAN, N., CATALA, A., TORREBADELL, M., FORTUNY, C., CUSI, V., CARRERAS, C., DIAZ, G. A., BLANDER, J. M., FARBER, C. M., SILVESTRI, G., CUNNINGHAM-RUNDLES, C., CALVILLO, M., DUFOUR, C., NOTARANGELO, L. D., LOUGARIS, V., PLEBANI, A., CASANOVA, J. L., GANAL, S. C., DIEFENBACH, A., AROSTEGUI, J. I., JUAN, M., YAGUE, J., MAHLAOUI, N., DONADIEU, J., CHEN, K. & CERUTTI, A. 2012. B cell-helper neutrophils stimulate the diversification and production of immunoglobulin in the marginal zone of the spleen. Nat Immunol, 13, 170-80.
QUAN, S. H., ZHANG, Y. L., HAN, D. H., IWAKURA, Y. & RHEE, C. S. 2012. Contribution of interleukin 17A to the development and regulation of allergic inflammation in a murine allergic rhinitis model. Ann Allergy Asthma Immunol, 108, 342-50.
QUEZADA, S. A., JARVINEN, L. Z., LIND, E. F. & NOELLE, R. J. 2004. CD40/CD154 interactions at the interface of tolerance and immunity. Annu Rev Immunol, 22, 307-28.
183
RADULOVIC, S., CALDERON, M. A., WILSON, D. & DURHAM, S. 2010. Sublingual immunotherapy for allergic rhinitis. Cochrane Database Syst Rev, CD002893.
RADULOVIC, S., JACOBSON, M. R., DURHAM, S. R. & NOURI-ARIA, K. T. 2008. Grass pollen immunotherapy induces Foxp3-expressing CD4+ CD25+ cells in the nasal mucosa. J Allergy Clin Immunol, 121, 1467-72, 1472 e1.
RAY, A., BASU, S., WILLIAMS, C. B., SALZMAN, N. H. & DITTEL, B. N. 2012. A novel IL-10-independent regulatory role for B cells in suppressing autoimmunity by maintenance of regulatory T cells via GITR ligand. J Immunol, 188, 3188-98.
REINERO, C. R., COHN, L. A., DELGADO, C., SPINKA, C. M., SCHOOLEY, E. K. & DECLUE, A. E. 2008. Adjuvanted rush immunotherapy using CpG oligodeoxynucleotides in experimental feline allergic asthma. Vet Immunol Immunopathol, 121, 241-50.
RONDON, C., CAMPO, P., TOGIAS, A., FOKKENS, W. J., DURHAM, S. R., POWE, D. G., MULLOL, J. & BLANCA, M. 2012. Local allergic rhinitis: concept, pathophysiology, and management. J Allergy Clin Immunol, 129, 1460-7.
ROOK, G. A. 2009. Review series on helminths, immune modulation and the hygiene hypothesis: the broader implications of the hygiene hypothesis. Immunology, 126, 3-11.
ROSEWICH, M., SCHULZE, J., EICKMEIER, O., TELLES, T., ROSE, M. A., SCHUBERT, R. & ZIELEN, S. 2010. Tolerance induction after specific immunotherapy with pollen allergoids adjuvanted by monophosphoryl lipid A in children. Clin Exp Immunol, 160, 403-10.
ROUSSET, F., GARCIA, E., DEFRANCE, T., PERONNE, C., VEZZIO, N., HSU, D. H., KASTELEIN, R., MOORE, K. W. & BANCHEREAU, J. 1992. Interleukin 10 is a potent growth and differentiation factor for activated human B lymphocytes. Proc Natl Acad Sci U S A, 89, 1890-3.
ROYER, B., VARADARADJALOU, S., SAAS, P., GUILLOSSON, J. J., KANTELIP, J. P. & AROCK, M. 2001. Inhibition of IgE-induced activation of human mast cells by IL-10. Clin Exp Allergy, 31, 694-704.
SABAT, R., GRÜTZ, G., WARSZAWSKA, K., KIRSCH, S., WITTE, E., WOLK, K. & GEGINAT, J. 2010. Biology of interleukin-10. Cytokine & growth factor reviews, 21, 331-344.
SACKESEN, C., VAN DE VEEN, W., AKDIS, M., SOYER, O., ZUMKEHR, J., RUCKERT, B., STANIC, B., KALAYCI, O., ALKAN, S. S., GURSEL, I. & AKDIS, C. A. 2013. Suppression of B-cell activation and IgE, IgA, IgG1 and IgG4 production by mammalian telomeric oligonucleotides. Allergy, 68, 593-603.
SAKAGUCHI, S., YAMAGUCHI, T., NOMURA, T. & ONO, M. 2008. Regulatory T cells and immune tolerance. Cell, 133, 775-87.
SALLUSTO, F., LENIG, D., MACKAY, C. R. & LANZAVECCHIA, A. 1998. Flexible programs of chemokine receptor expression on human polarized T helper 1 and 2 lymphocytes. J Exp Med, 187, 875-83.
SALZER, E., KANSU, A., SIC, H., MAJEK, P., IKINCIOGULLARI, A., DOGU, F. E., PRENGEMANN, N. K., SANTOS-VALENTE, E., PICKL, W. F., BILIC, I., BAN, S. A., KULOGLU, Z., DEMIR, A. M., ENSARI, A., COLINGE, J., RIZZI, M., EIBEL, H. & BOZTUG, K. 2014. Early-onset inflammatory bowel disease and common variable immunodeficiency-like disease caused by IL-21 deficiency. J Allergy Clin Immunol, 133, 1651-9 e12.
SARAIVA, M., CHRISTENSEN, J., VELDHOEN, M., MURPHY, T., MURPHY, K. & O'GARRA, A. 2009. Interleukin-10 production by Th1 cells requires interleukin-12-induced STAT4 transcription factor and ERK MAP kinase activation by high antigen dose. Immunity, 31, 209-19.
SARAIVA, M. & O'GARRA, A. 2010. The regulation of IL-10 production by immune cells. Nat Rev Immunol, 10, 170-81.
SATOGUINA, J., ADJOBIMEY, T., ARNDTS, K., HOCH, J., OLDENBURG, J., LAYLAND, L. & HOERAUF, A. 2008. Tr1 and naturally occurring regulatory T cells induce IgG4 in B cells through GITR/GITR-L interaction, IL-10 and TGF-beta. Eur J Immunol, 38, 3101-13.
SATOGUINA, J. S., WEYAND, E., LARBI, J. & HOERAUF, A. 2005. T regulatory-1 cells induce IgG4 production by B cells: role of IL-10. J Immunol, 174, 4718-26.
184
SAUSSINE, A., TAZI, A., FEUILLET, S., RYBOJAD, M., JUILLARD, C., BERGERON, A., DESSIRIER, V., BOUHIDEL, F., JANIN, A., BENSUSSAN, A., BAGOT, M. & BOUAZIZ, J. D. 2012. Active chronic sarcoidosis is characterized by increased transitional blood B cells, increased IL-10-producing regulatory B cells and high BAFF levels. PLoS One, 7, e43588.
SCADDING, G. 2014. Cytokine profiles in allergic rhinitis. Curr Allergy Asthma Rep, 14, 435. SCADDING, G. K., DURHAM, S. R., MIRAKIAN, R., JONES, N. S., LEECH, S. C., FAROOQUE, S., RYAN, D.,
WALKER, S. M., CLARK, A. T., DIXON, T. A., JOLLES, S. R., SIDDIQUE, N., CULLINAN, P., HOWARTH, P. H., NASSER, S. M., BRITISH SOCIETY FOR, A. & CLINICAL, I. 2008. BSACI guidelines for the management of allergic and non-allergic rhinitis. Clin Exp Allergy, 38, 19-42.
SCADDING, G. W., CALDERON, M. A., BELLIDO, V., KOED, G. K., NIELSEN, N. C., LUND, K., TOGIAS, A., PHIPPARD, D., TURKA, L. A., HANSEL, T. T., DURHAM, S. R. & WURTZEN, P. A. 2012. Optimisation of grass pollen nasal allergen challenge for assessment of clinical and immunological outcomes. J Immunol Methods, 384, 25-32.
SCADDING, G. W., SHAMJI, M. H., JACOBSON, M. R., LEE, D. I., WILSON, D., LIMA, M. T., PITKIN, L., PILETTE, C., NOURI-ARIA, K. & DURHAM, S. R. 2010. Sublingual grass pollen immunotherapy is associated with increases in sublingual Foxp3-expressing cells and elevated allergen-specific immunoglobulin G4, immunoglobulin A and serum inhibitory activity for immunoglobulin E-facilitated allergen binding to B cells. Clin Exp Allergy, 40, 598-606.
SCALA, E., ALESSANDRI, C., BERNARDI, M. L., FERRARA, R., PALAZZO, P., POMPONI, D., QUARATINO, D., RASI, C., ZAFFIRO, A., ZENNARO, D. & MARI, A. 2010. Cross-sectional survey on immunoglobulin E reactivity in 23,077 subjects using an allergenic molecule-based microarray detection system. Clin Exp Allergy, 40, 911-21.
SCANLON, K. M., HAWKSWORTH, R. J., LANE, S. J. & MAHON, B. P. 2011. IL-17A induces CCL28, supporting the chemotaxis of IgE-secreting B cells. Int Arch Allergy Immunol, 156, 51-61.
SCHULTEN, V., GREENBAUM, J. A., HAUSER, M., MCKINNEY, D. M., SIDNEY, J., KOLLA, R., LINDESTAM ARLEHAMN, C. S., OSEROFF, C., ALAM, R., BROIDE, D. H., FERREIRA, F., GREY, H. M., SETTE, A. & PETERS, B. 2013. Previously undescribed grass pollen antigens are the major inducers of T helper 2 cytokine-producing T cells in allergic individuals. Proc Natl Acad Sci U S A, 110, 3459-64.
SEDER, R. A., PAUL, W. E., DAVIS, M. M. & FAZEKAS DE ST GROTH, B. 1992. The presence of interleukin 4 during in vitro priming determines the lymphokine-producing potential of CD4+ T cells from T cell receptor transgenic mice. J Exp Med, 176, 1091-8.
SENTI, G., JOHANSEN, P., HAUG, S., BULL, C., GOTTSCHALLER, C., MULLER, P., PFISTER, T., MAURER, P., BACHMANN, M. F., GRAF, N. & KUNDIG, T. M. 2009. Use of A-type CpG oligodeoxynucleotides as an adjuvant in allergen-specific immunotherapy in humans: a phase I/IIa clinical trial. Clin Exp Allergy, 39, 562-70.
SERCARZ, E. E. & MAVERAKIS, E. 2003. Mhc-guided processing: binding of large antigen fragments. Nat Rev Immunol, 3, 621-9.
SETOGUCHI, R., HORI, S., TAKAHASHI, T. & SAKAGUCHI, S. 2005. Homeostatic maintenance of natural Foxp3(+) CD25(+) CD4(+) regulatory T cells by interleukin (IL)-2 and induction of autoimmune disease by IL-2 neutralization. J Exp Med, 201, 723-35.
SHAMJI, M. H., LJORRING, C., FRANCIS, J. N., CALDERON, M. A., LARCHE, M., KIMBER, I., FREW, A. J., IPSEN, H., LUND, K., WURTZEN, P. A. & DURHAM, S. R. 2012. Functional rather than immunoreactive levels of IgG4 correlate closely with clinical response to grass pollen immunotherapy. Allergy, 67, 217-26.
SHEN, P., ROCH, T., LAMPROPOULOU, V., O'CONNOR, R. A., STERVBO, U., HILGENBERG, E., RIES, S., DANG, V. D., JAIMES, Y., DARIDON, C., LI, R., JOUNEAU, L., BOUDINOT, P., WILANTRI, S., SAKWA, I., MIYAZAKI, Y., LEECH, M. D., MCPHERSON, R. C., WIRTZ, S., NEURATH, M., HOEHLIG, K., MEINL, E., GRUTZKAU, A., GRUN, J. R., HORN, K., KUHL, A. A., DORNER, T., BAR-OR, A., KAUFMANN, S. H., ANDERTON, S. M. & FILLATREAU, S. 2014. IL-35-producing B cells

185
are critical regulators of immunity during autoimmune and infectious diseases. Nature, 507, 366-70.
SHLOMCHIK, M. J. & WEISEL, F. 2012. Germinal center selection and the development of memory B and plasma cells. Immunol Rev, 247, 52-63.
SIEWE, B., STAPLETON, J. T., MARTINSON, J., KESHAVARZIAN, A., KAZMI, N., DEMARAIS, P. M., FRENCH, A. L. & LANDAY, A. 2013. Regulatory B cell frequency correlates with markers of HIV disease progression and attenuates anti-HIV CD8(+) T cell function in vitro. J Leukoc Biol, 93, 811-8.
SILVA, H. M., TAKENAKA, M. C., MORAES-VIEIRA, P. M., MONTEIRO, S. M., HERNANDEZ, M. O., CHAARA, W., SIX, A., AGENA, F., SESTERHEIM, P., BARBE-TUANA, F. M., SAITOVITCH, D., LEMOS, F., KALIL, J. & COELHO, V. 2012. Preserving the B-cell compartment favors operational tolerance in human renal transplantation. Mol Med, 18, 733-43.
SIMONS, F. E., SHIKISHIMA, Y., VAN NEST, G., EIDEN, J. J. & HAYGLASS, K. T. 2004. Selective immune redirection in humans with ragweed allergy by injecting Amb a 1 linked to immunostimulatory DNA. J Allergy Clin Immunol, 113, 1144-51.
SIMPSON, A., JOHN, S. L., JURY, F., NIVEN, R., WOODCOCK, A., OLLIER, W. E. & CUSTOVIC, A. 2006. Endotoxin exposure, CD14, and allergic disease: an interaction between genes and the environment. Am J Respir Crit Care Med, 174, 386-92.
SIMS, G. P., ETTINGER, R., SHIROTA, Y., YARBORO, C. H., ILLEI, G. G. & LIPSKY, P. E. 2005. Identification and characterization of circulating human transitional B cells. Blood, 105, 4390-8.
SINGH, A., HOLVOET, S., WEISS, M., BEAUMONT, M., ZUERCHER, A. W. & MERCENIER, A. 2011. Increased IL-5 and IL-13 cytokine level in ex vivo stimulated whole blood cells from grass pollen allergic donors correlate with seasonal exposure. Results Immunol, 1, 18-23.
SMITH, H. E., HOGGER, C., LALLEMANT, C., CROOK, D. & FREW, A. J. 2009. Is structured allergy history sufficient when assessing patients with asthma and rhinitis in general practice? J Allergy Clin Immunol, 123, 646-50.
SMITH, M., JAGER, S., BERGER, U., SIKOPARIJA, B., HALLSDOTTIR, M., SAULIENE, I., BERGMANN, K. C., PASHLEY, C. H., DE WEGER, L., MAJKOWSKA-WOJCIECHOWSKA, B., RYBNICEK, O., THIBAUDON, M., GEHRIG, R., BONINI, M., YANKOVA, R., DAMIALIS, A., VOKOU, D., GUTIERREZ BUSTILLO, A. M., HOFFMANN-SOMMERGRUBER, K. & VAN REE, R. 2014. Geographic and temporal variations in pollen exposure across Europe. Allergy, 69, 913-23.
SMITS, H. H., VAN RIETSCHOTEN, J. G., HILKENS, C. M., SAYILIR, R., STIEKEMA, F., KAPSENBERG, M. L. & WIERENGA, E. A. 2001. IL-12-induced reversal of human Th2 cells is accompanied by full restoration of IL-12 responsiveness and loss of GATA-3 expression. Eur J Immunol, 31, 1055-65.
SOYER, O. U., AKDIS, M., RING, J., BEHRENDT, H., CRAMERI, R., LAUENER, R. & AKDIS, C. A. 2013. Mechanisms of peripheral tolerance to allergens. Allergy, 68, 161-70.
STELMASZCZYK-EMMEL, A., ZAWADZKA-KRAJEWSKA, A., SZYPOWSKA, A., KULUS, M. & DEMKOW, U. 2013. Frequency and activation of CD4+CD25 FoxP3+ regulatory T cells in peripheral blood from children with atopic allergy. Int Arch Allergy Immunol, 162, 16-24.
STONE, K. D., PRUSSIN, C. & METCALFE, D. D. 2010. IgE, mast cells, basophils, and eosinophils. J Allergy Clin Immunol, 125, S73-80.
SUBRAMANIAN, S., YATES, M., VANDENBARK, A. A. & OFFNER, H. 2011. Oestrogen-mediated protection of experimental autoimmune encephalomyelitis in the absence of Foxp3+ regulatory T cells implicates compensatory pathways including regulatory B cells. Immunology, 132, 340-7.
SUTO, A., NAKAJIMA, H., HIROSE, K., SUZUKI, K., KAGAMI, S., SETO, Y., HOSHIMOTO, A., SAITO, Y., FOSTER, D. C. & IWAMOTO, I. 2002. Interleukin 21 prevents antigen-induced IgE production by inhibiting germ line C(epsilon) transcription of IL-4-stimulated B cells. Blood, 100, 4565-73.
186
SWAMY, R. S., RESHAMWALA, N., HUNTER, T., VISSAMSETTI, S., SANTOS, C. B., BAROODY, F. M., HWANG, P. H., HOYTE, E. G., GARCIA, M. A. & NADEAU, K. C. 2012. Epigenetic modifications and improved regulatory T-cell function in subjects undergoing dual sublingual immunotherapy. J Allergy Clin Immunol, 130, 215-24 e7.
TAKANASKI, S., NONAKA, R., XING, Z., O'BYRNE, P., DOLOVICH, J. & JORDANA, M. 1994. Interleukin 10 inhibits lipopolysaccharide-induced survival and cytokine production by human peripheral blood eosinophils. J Exp Med, 180, 711-5.
TAKEDA, K. & AKIRA, S. 2007. Toll-like receptors. Curr Protoc Immunol, Chapter 14, Unit 14 12. TAKHAR, P., SMURTHWAITE, L., COKER, H. A., FEAR, D. J., BANFIELD, G. K., CARR, V. A., DURHAM, S.
R. & GOULD, H. J. 2005. Allergen drives class switching to IgE in the nasal mucosa in allergic rhinitis. J Immunol, 174, 5024-32.
TANG, Q. & BLUESTONE, J. 2008. The Foxp3+ regulatory T cell: a jack of all trades, master of regulation. Nat Immunol, 9, 239-44.
TAO, X., GRANT, C., CONSTANT, S. & BOTTOMLY, K. 1997. Induction of IL-4-producing CD4+ T cells by antigenic peptides altered for TCR binding. J Immunol, 158, 4237-44.
TESSE, R., PANDEY, R. C. & KABESCH, M. 2011. Genetic variations in toll-like receptor pathway genes influence asthma and atopy. Allergy, 66, 307-16.
THIBULT, M. L., RIVALS, J. P., MAMESSIER, E., GERTNER-DARDENNE, J., PASTOR, S., SPEISER, D. E., DERRE, L. & OLIVE, D. 2013. CpG-ODN-induced sustained expression of BTLA mediating selective inhibition of human B cells. J Mol Med (Berl), 91, 195-205.
THUNBERG, S., AKDIS, M., AKDIS, C. A., GRONNEBERG, R., MALMSTROM, V., TROLLMO, C., VAN HAGE, M. & GAFVELIN, G. 2007. Immune regulation by CD4+CD25+ T cells and interleukin-10 in birch pollen-allergic patients and non-allergic controls. Clin Exp Allergy, 37, 1127-36.
TIGHE, H., TAKABAYASHI, K., SCHWARTZ, D., VAN NEST, G., TUCK, S., EIDEN, J. J., KAGEY-SOBOTKA, A., CRETICOS, P. S., LICHTENSTEIN, L. M., SPIEGELBERG, H. L. & RAZ, E. 2000. Conjugation of immunostimulatory DNA to the short ragweed allergen amb a 1 enhances its immunogenicity and reduces its allergenicity. J Allergy Clin Immunol, 106, 124-34.
TILL, S., DICKASON, R., HUSTON, D., HUMBERT, M., ROBINSON, D., LARCHÉ, M., DURHAM, S., KAY, A. B. & CORRIGAN, C. 1997a. IL-5 secretion by allergen-stimulated CD4+ T cells in primary culture: Relationship to expression of allergic disease. Journal of Allergy and Clinical Immunology, 99, 563-569.
TILL, S., DURHAM, S., DICKASON, R., HUSTON, D., BUNGRE, J., WALKER, S., ROBINSON, D., KAY, A. B. & CORRIGAN, C. 1997b. IL-13 production by allergen-stimulated T cells is increased in allergic disease and associated with IL-5 but not IFN-gamma expression. Immunology, 91, 53-7.
TILLER, T., TSUIJI, M., YURASOV, S., VELINZON, K., NUSSENZWEIG, M. C. & WARDEMANN, H. 2007. Autoreactivity in human IgG+ memory B cells. Immunity, 26, 205-13.
TODD, S. K., PEPPER, R. J., DRAIBE, J., TANNA, A., PUSEY, C. D., MAURI, C. & SALAMA, A. D. 2014. Regulatory B cells are numerically but not functionally deficient in anti-neutrophil cytoplasm antibody-associated vasculitis. Rheumatology (Oxford).
TORCIA, M. G., NENCIONI, L., CLEMENTE, A. M., CIVITELLI, L., CELESTINO, I., LIMONGI, D., FADIGATI, G., PERISSI, E., COZZOLINO, F., GARACI, E. & PALAMARA, A. T. 2012. Sex differences in the response to viral infections: TLR8 and TLR9 ligand stimulation induce higher IL10 production in males. PLoS One, 7, e39853.
TSABOURI, S., TSERETOPOULOU, X., PRIFTIS, K. & NTZANI, E. E. 2014. Omalizumab for the treatment of inadequately controlled allergic rhinitis: a systematic review and meta-analysis of randomized clinical trials. J Allergy Clin Immunol Pract, 2, 332-40 e1.
TSVETKOVA-VICHEVA, V. M., GECHEVA, S. P., KOMSA-PENKOVA, R., VELKOVA, A. S. & LUKANOV, T. H. 2014. IL-17 producing T cells correlate with polysensitization but not with bronchial hyperresponsiveness in patients with allergic rhinitis. Clin Transl Allergy, 4, 3.
TULIC, M. K., FISET, P. O., CHRISTODOULOPOULOS, P., VAILLANCOURT, P., DESROSIERS, M., LAVIGNE, F., EIDEN, J. & HAMID, Q. 2004. Amb a 1-immunostimulatory oligodeoxynucleotide
187
conjugate immunotherapy decreases the nasal inflammatory response. J Allergy Clin Immunol, 113, 235-41.
TUOMELA, S., SALO, V., TRIPATHI, S. K., CHEN, Z., LAURILA, K., GUPTA, B., AIJO, T., OIKARI, L., STOCKINGER, B., LAHDESMAKI, H. & LAHESMAA, R. 2012. Identification of early gene expression changes during human Th17 cell differentiation. Blood, 119, e151-60.
VAN DE VEEN, W., STANIC, B., YAMAN, G., WAWRZYNIAK, M., SOLLNER, S., AKDIS, D. G., RUCKERT, B., AKDIS, C. A. & AKDIS, M. 2013. IgG4 production is confined to human IL-10-producing regulatory B cells that suppress antigen-specific immune responses. J Allergy Clin Immunol, 131, 1204-12.
VAN DER VLUGT, L. E., LABUDA, L. A., OZIR-FAZALALIKHAN, A., LIEVERS, E., GLOUDEMANS, A. K., LIU, K. Y., BARR, T. A., SPARWASSER, T., BOON, L., NGOA, U. A., FEUGAP, E. N., ADEGNIKA, A. A., KREMSNER, P. G., GRAY, D., YAZDANBAKHSH, M. & SMITS, H. H. 2012. Schistosomes induce regulatory features in human and mouse CD1d(hi) B cells: inhibition of allergic inflammation by IL-10 and regulatory T cells. PLoS One, 7, e30883.
VAN DER VLUGT, L. E., MLEJNEK, E., OZIR-FAZALALIKHAN, A., BONAS, M. J., DIJKSMAN, T. R., LABUDA, L. A., SCHOT, R., GUIGAS, B., MOLLER, G. M., HIEMSTRA, P. S., YAZDANBAKHSH, M. & SMITS, H. H. 2013. CD24 CD27 B cells from allergic asthma patients have impaired regulatory activity in response to LPS. Clin Exp Allergy.
VAN DER VLUGT, L. E., MLEJNEK, E., OZIR-FAZALALIKHAN, A., JANSSEN BONAS, M., DIJKSMAN, T. R., LABUDA, L. A., SCHOT, R., GUIGAS, B., MOLLER, G. M., HIEMSTRA, P. S., YAZDANBAKHSH, M. & SMITS, H. H. 2014. CD24(hi)CD27(+) B cells from patients with allergic asthma have impaired regulatory activity in response to lipopolysaccharide. Clin Exp Allergy, 44, 517-28.
VOLLMER, J. & KRIEG, A. M. 2009. Immunotherapeutic applications of CpG oligodeoxynucleotide TLR9 agonists. Adv Drug Deliv Rev, 61, 195-204.
VON HERTZEN, L. C. & HAAHTELA, T. 2004. Asthma and atopy - the price of affluence? Allergy, 59, 124-37.
VOSSENKAMPER, A., LUTALO, P. M. & SPENCER, J. 2012. Translational Mini-Review Series on B cell subsets in disease. Transitional B cells in systemic lupus erythematosus and Sjogren's syndrome: clinical implications and effects of B cell-targeted therapies. Clin Exp Immunol, 167, 7-14.
VRTALA, S., GROTE, M., DUCHENE, M., VAN REE, R., KRAFT, D., SCHEINER, O. & VALENTA, R. 1993. Properties of tree and grass pollen allergens: reinvestigation of the linkage between solubility and allergenicity. Int Arch Allergy Immunol, 102, 160-9.
WAGNER, M., POECK, H., JAHRSDOERFER, B., ROTHENFUSSER, S., PRELL, D., BOHLE, B., TUMA, E., GIESE, T., ELLWART, J. W., ENDRES, S. & HARTMANN, G. 2004. IL-12p70-Dependent Th1 Induction by Human B Cells Requires Combined Activation with CD40 Ligand and CpG DNA. The Journal of Immunology, 172, 954-963.
WALKER, J. A. & MCKENZIE, A. N. 2013. Development and function of group 2 innate lymphoid cells. Curr Opin Immunol, 25, 148-55.
WALKER, S. M., DURHAM, S. R., TILL, S. J., ROBERTS, G., CORRIGAN, C. J., LEECH, S. C., KRISHNA, M. T., RAJAKULASINGHAM, R. K., WILLIAMS, A., CHANTRELL, J., DIXON, L., FREW, A. J., NASSER, S. M., BRITISH SOCIETY FOR, A. & CLINICAL, I. 2011. Immunotherapy for allergic rhinitis. Clin Exp Allergy, 41, 1177-200.
WAMBRE, E., DELONG, J. H., JAMES, E. A., TORRES-CHINN, N., PFUTZNER, W., MOBS, C., DURHAM, S. R., TILL, S. J., ROBINSON, D. & KWOK, W. W. 2014. Specific immunotherapy modifies allergen-specific CD4(+) T-cell responses in an epitope-dependent manner. J Allergy Clin Immunol, 133, 872-9 e7.
WAN, Y. Y. 2014. GATA3: a master of many trades in immune regulation. Trends Immunol, 35, 233-42.
WANG, Y. Y., ZHANG, L., ZHAO, P. W., MA, L., LI, C., ZOU, H. B. & JIANG, Y. F. 2014. Functional implications of regulatory B cells in human IgA nephropathy. Scand J Immunol, 79, 51-60.
188
WARDEMANN, H., YURASOV, S., SCHAEFER, A., YOUNG, J. W., MEFFRE, E. & NUSSENZWEIG, M. C. 2003. Predominant autoantibody production by early human B cell precursors. Science, 301, 1374-7.
WEILL, J. C., WELLER, S. & REYNAUD, C. A. 2009. Human marginal zone B cells. Annu Rev Immunol, 27, 267-85.
WEINER, J. M., ABRAMSON, M. J. & PUY, R. M. 1998. Intranasal corticosteroids versus oral H1 receptor antagonists in allergic rhinitis: systematic review of randomised controlled trials. BMJ, 317, 1624-9.
WILDE, B., THEWISSEN, M., DAMOISEAUX, J., KNIPPENBERG, S., HILHORST, M., VAN PAASSEN, P., WITZKE, O. & COHEN TERVAERT, J. W. 2013. Regulatory B cells in ANCA-associated vasculitis. Ann Rheum Dis, 72, 1416-9.
WILSON, A. M., O'BYRNE, P. M. & PARAMESWARAN, K. 2004. Leukotriene receptor antagonists for allergic rhinitis: a systematic review and meta-analysis. Am J Med, 116, 338-44.
WILSON, N. J., BONIFACE, K., CHAN, J. R., MCKENZIE, B. S., BLUMENSCHEIN, W. M., MATTSON, J. D., BASHAM, B., SMITH, K., CHEN, T., MOREL, F., LECRON, J. C., KASTELEIN, R. A., CUA, D. J., MCCLANAHAN, T. K., BOWMAN, E. P. & DE WAAL MALEFYT, R. 2007. Development, cytokine profile and function of human interleukin 17-producing helper T cells. Nat Immunol, 8, 950-7.
WISNIEWSKI, J., AGRAWAL, R. & WOODFOLK, J. A. 2013. Mechanisms of tolerance induction in allergic disease: integrating current and emerging concepts. Clin Exp Allergy, 43, 164-76.
WOLF, S. D., DITTEL, B. N., HARDARDOTTIR, F. & JANEWAY, C. A., JR. 1996. Experimental autoimmune encephalomyelitis induction in genetically B cell-deficient mice. J Exp Med, 184, 2271-8.
WOOD, N., BOURQUE, K., DONALDSON, D. D., COLLINS, M., VERCELLI, D., GOLDMAN, S. J. & KASAIAN, M. T. 2004. IL-21 effects on human IgE production in response to IL-4 or IL-13. Cell Immunol, 231, 133-45.
XIAO, S., BROOKS, C. R., ZHU, C., WU, C., SWEERE, J. M., PETECKA, S., YESTE, A., QUINTANA, F. J., ICHIMURA, T., SOBEL, R. A., BONVENTRE, J. V. & KUCHROO, V. K. 2012. Defect in regulatory B-cell function and development of systemic autoimmunity in T-cell Ig mucin 1 (Tim-1) mucin domain-mutant mice. Proc Natl Acad Sci U S A, 109, 12105-10.
YAMANAKA, K., YUTA, A., KAKEDA, M., KITAGAWA, H., OGIHARA, H., GABAZZA, E. C., OKUBO, K., KUROKAWA, I., TAKEUCHI, K. & MIZUTANI, H. 2011. SLIT improves cedar pollinosis by restoring IL-10 production from Tr1 and Monocytes approximately IL-10 productivity is critical for becoming allergic approximately. Allergol Int, 60, 45-51.
YANABA, K., BOUAZIZ, J. D., HAAS, K. M., POE, J. C., FUJIMOTO, M. & TEDDER, T. F. 2008. A regulatory B cell subset with a unique CD1dhiCD5+ phenotype controls T cell-dependent inflammatory responses. Immunity, 28, 639-50.
YANG, X., YANG, J., CHU, Y., WANG, J., GUAN, M., ZHU, X., XUE, Y. & ZOU, H. 2013. T follicular helper cells mediate expansion of regulatory B cells via IL-21 in Lupus-prone MRL/lpr mice. PLoS One, 8, e62855.
YOSHIZAKI, A., MIYAGAKI, T., DILILLO, D. J., MATSUSHITA, T., HORIKAWA, M., KOUNTIKOV, E. I., SPOLSKI, R., POE, J. C., LEONARD, W. J. & TEDDER, T. F. 2012. Regulatory B cells control T-cell autoimmunity through IL-21-dependent cognate interactions. Nature, 491, 264-8.
YU, J. E., KNIGHT, A. K., RADIGAN, L., MARRON, T. U., ZHANG, L., SANCHEZ-RAMÓN, S. & CUNNINGHAM-RUNDLES, C. 2009. Toll-like receptor 7 and 9 defects in common variable immunodeficiency. Journal of Allergy and Clinical Immunology, 124, 349-356.e3.
YUKSELEN, A., KENDIRLI, S. G., YILMAZ, M., ALTINTAS, D. U. & KARAKOC, G. B. 2012. Effect of one-year subcutaneous and sublingual immunotherapy on clinical and laboratory parameters in children with rhinitis and asthma: a randomized, placebo-controlled, double-blind, double-dummy study. Int Arch Allergy Immunol, 157, 288-98.
189
ZENG, W. P. 2013. 'All things considered': transcriptional regulation of T helper type 2 cell differentiation from precursor to effector activation. Immunology, 140, 31-8.
ZHA, B., WANG, L., LIU, X., LIU, J., CHEN, Z., XU, J., SHENG, L., LI, Y. & CHU, Y. 2012. Decrease in Proportion of CD19(+)CD24(hi)CD27(+) B Cells and Impairment of Their Suppressive Function in Graves' Disease. PLoS One, 7, e49835.
ZHENG, W.-P. & FLAVELL, R. A. 1997. The Transcription Factor GATA-3 Is Necessary and Sufficient for Th2 Cytokine Gene Expression in CD4 T Cells. Cell, 89, 587-596.
ZHOU, L., CHONG, M. M. & LITTMAN, D. R. 2009a. Plasticity of CD4+ T cell lineage differentiation. Immunity, 30, 646-55.
ZHOU, X., BAILEY-BUCKTROUT, S., JEKER, L. & BLUESTONE, J. 2009b. Plasticity of CD4(+) FoxP3(+) T cells. Curr Opin Immunol, 21, 281-5.
ZIEGLER, S., GARTNER, K., SCHEUERMANN, U., ZOELLER, T., HANTZSCHMANN, J., OVER, B., FOERMER, S., HEEG, K. & BEKEREDJIAN-DING, I. 2014. Ca(2+) -related signaling events influence TLR9-induced IL-10 secretion in human B cells. Eur J Immunol, 44, 1285-98.
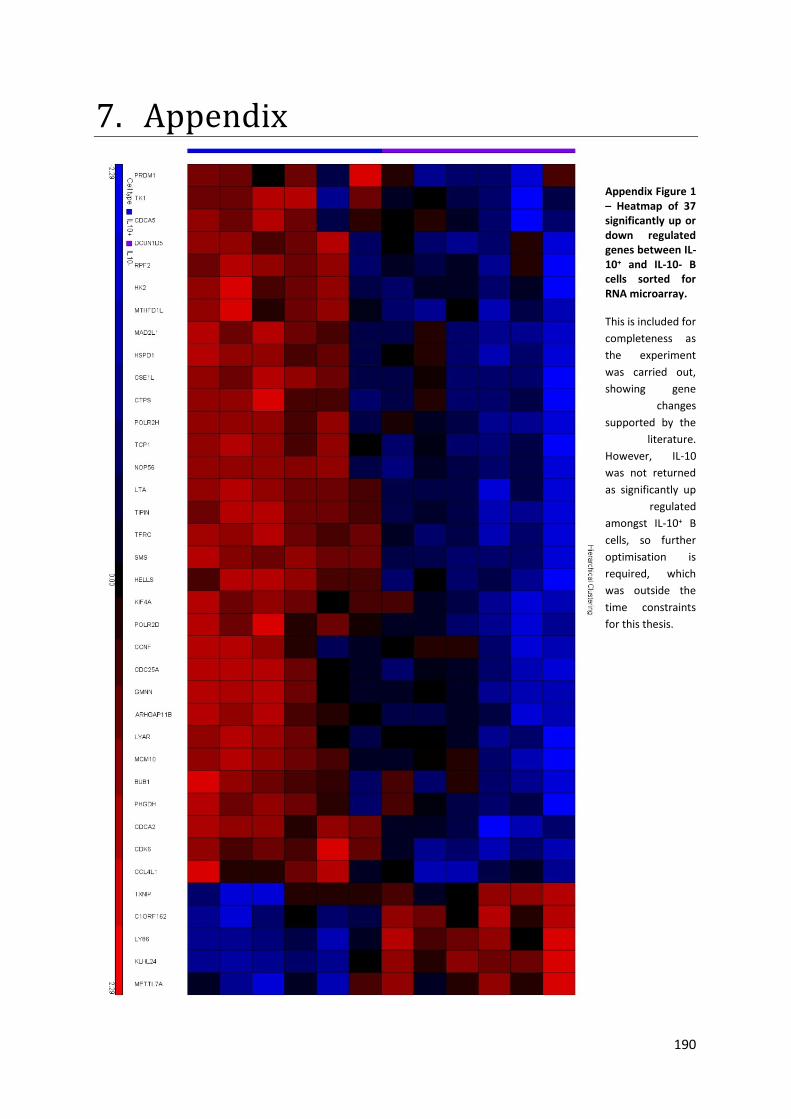
190
7. Appendix
Appendix Figure 1 – Heatmap of 37 significantly up or down regulated genes between IL-10+ and IL-10- B cells sorted for RNA microarray.
This is included for
completeness as
the experiment
was carried out,
showing gene
changes
supported by the
literature.
However, IL-10
was not returned
as significantly up
regulated
amongst IL-10+ B
cells, so further
optimisation is
required, which
was outside the
time constraints
for this thesis.

191
Gene Common Name (Relevance) p-value Fold Change
Direction of change
CCL4L1 0.000138758 2.39496 IL10- down vs IL10+
TFRC CD71 0.000126122 2.17668 IL10- down vs IL10+
LTA Lymphotoxin alpha (TNFβ) 0.000195827 2.0813 IL10- down vs IL10+
MCM10 0.000328083 1.94421 IL10- down vs IL10+
PHGDH 0.000236381 1.78204 IL10- down vs IL10+
CDC25A 7.99E-06 1.68794 IL10- down vs IL10+
CDCA5 0.000235005 1.67023 IL10- down vs IL10+
GMNN 2.12E-06 1.66839 IL10- down vs IL10+
LYAR Ly 1 antibody reactive 0.000217046 1.66726 IL10- down vs IL10+
ARHGAP11B Rho GTPase activating protein 11B 0.00026561 1.66062 IL10- down vs IL10+
MAD2L1 0.000263515 1.6515 IL10- down vs IL10+
NOP56 3.91E-06 1.64958 IL10- down vs IL10+
CDK6 0.000368062 1.63493 IL10- down vs IL10+
CTPS 1.73E-05 1.61842 IL10- down vs IL10+
HSPD1 Heat shock 60kDa protein 1 0.000101394 1.60104 IL10- down vs IL10+
DCUN1D5 0.000161499 1.58341 IL10- down vs IL10+
SMS spermine synthase 0.000170161 1.56941 IL10- down vs IL10+
BUB1 6.30E-05 1.56863 IL10- down vs IL10+
HELLS helicase, lymphoid specific 0.000126154 1.56671 IL10- down vs IL10+
KIF4A kinesin family member 4 0.000204483 1.55789 IL10- down vs IL10+
PRDM1 BLIMP-1 8.98E-05 1.54996 IL10- down vs IL10+
TIPIN TIMELESS interacting protein 4.39E-05 1.54108 IL10- down vs IL10+
RPF2 0.000222218 1.54103 IL10- down vs IL10+
CDCA2 0.000327091 1.53225 IL10- down vs IL10+
POLR2H polymerase (RNA) II (DNA directed) polypeptide H 0.000156648 -1.52933 IL10- down vs IL10+
CCNF Cyclin F 6.04E-05 -1.52456 IL10- down vs IL10+
TCP1 t-complex 1 0.000110687 -1.52099 IL10- down vs IL10+
HK2 hexokinase 2 0.000341117 -1.52044 IL10- down vs IL10+
CSE1L chromosome segregation 1-like (yeast) 1.03E-05 -1.51793 IL10- down vs IL10+
TK1 Thymidine kinase 1, soluble 0.000271782 -1.51573 IL10- down vs IL10+
POLR2D polymerase (RNA) II (DNA directed) polypeptide D 0.000229616 -1.50867 IL10- down vs IL10+ MTHFD1L 5.15E-05 -1.50302 IL10- down vs IL10+
LY86 (RP105-associated (TLR2/4)) 0.000141767 1.57105 IL10- up vs IL10+
METTL7A Methyltransferase Like 7A 1.84E-05 1.59445 IL10- up vs IL10+
TXNIP Thioredoxin Interacting Protein 0.000245581 1.71844 IL10- up vs IL10+
KLHL24 Kelch-Like Family Member 241 9.35E-05 1.76759 IL10- up vs IL10+
C1orf162 chromosome 1 open reading frame 162 0.000256972 1.79032 IL10- up vs IL10+
Appendix Table 1 – Spreadsheet of 37 significantly up (red) or down (blue) regulated genes between IL-10+ and IL-10- B cells sorted for RNA microarray.
RNA affymetrix microarray was carried out following a sort and lysis of 6 IL-10+/- B cells from n=4 non-allergic and n=2 allergic
donors. Two-way ANOVA was carried out against donor (as a random effect) and cell type (IL-10+ or IL-10- ). Genes shown
are greater than 1.5 fold changes (shown), with a p value <0.05 following a false discovery rate (FDR) exclusion. Common
gene names are shown where relevant. Rows in bold are highlighted for interest.
This figure is not included in the main body due to optimisation required, as stated in appendix fig. 1, due to the lack of significant changes
in IL-10 mRNA detected and time constraints to fully optimise.
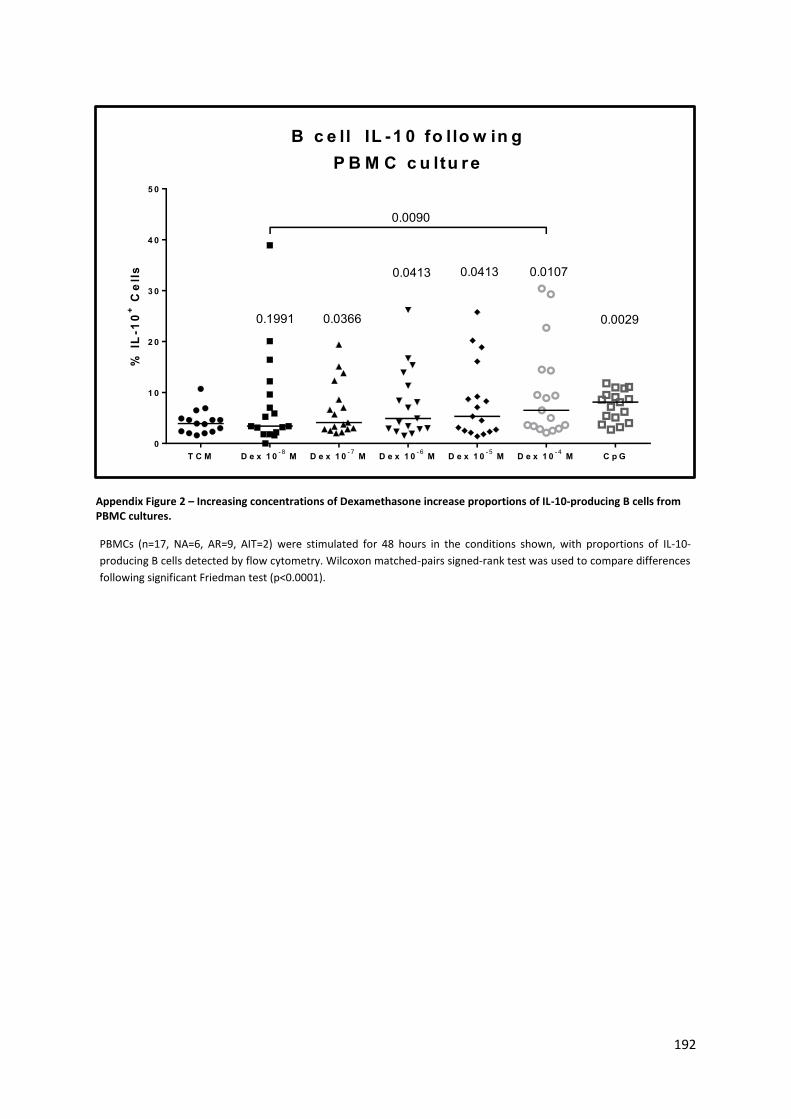
192
B c e ll IL -1 0 fo llo w in g
P B M C c u ltu re
% I
L-1
0+
Ce
lls
T C M D e x 1 0- 8
M D e x 1 0- 7
M D e x 1 0- 6
M D e x 1 0- 5
M D e x 1 0- 4
M C p G
0
1 0
2 0
3 0
4 0
5 0
0.01070.04130.0413
0.00290.03660.1991
0.0090
Appendix Figure 2 – Increasing concentrations of Dexamethasone increase proportions of IL-10-producing B cells from PBMC cultures.
PBMCs (n=17, NA=6, AR=9, AIT=2) were stimulated for 48 hours in the conditions shown, with proportions of IL-10-
producing B cells detected by flow cytometry. Wilcoxon matched-pairs signed-rank test was used to compare differences
following significant Friedman test (p<0.0001).
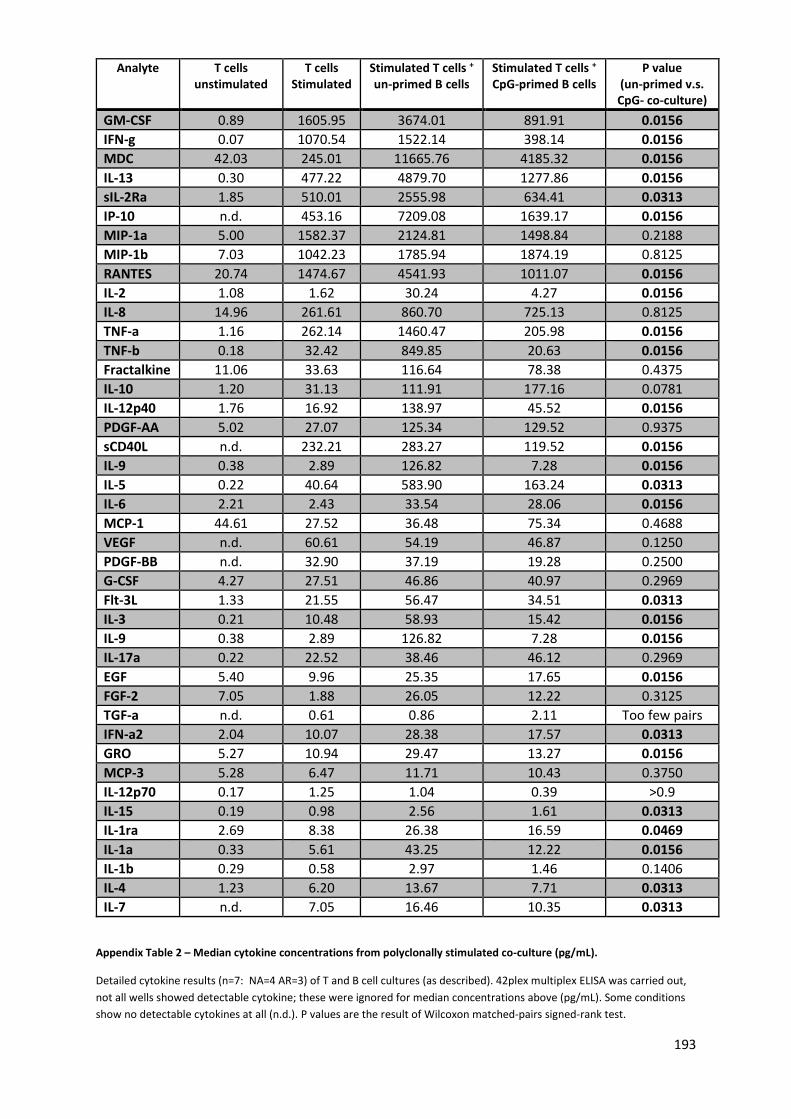
193
Appendix Table 2 – Median cytokine concentrations from polyclonally stimulated co-culture (pg/mL).
Detailed cytokine results (n=7: NA=4 AR=3) of T and B cell cultures (as described). 42plex multiplex ELISA was carried out,
not all wells showed detectable cytokine; these were ignored for median concentrations above (pg/mL). Some conditions
show no detectable cytokines at all (n.d.). P values are the result of Wilcoxon matched-pairs signed-rank test.
Analyte T cells unstimulated
T cells Stimulated
Stimulated T cells + un-primed B cells
Stimulated T cells + CpG-primed B cells
P value (un-primed v.s. CpG- co-culture)
GM-CSF 0.89 1605.95 3674.01 891.91 0.0156
IFN-g 0.07 1070.54 1522.14 398.14 0.0156
MDC 42.03 245.01 11665.76 4185.32 0.0156
IL-13 0.30 477.22 4879.70 1277.86 0.0156
sIL-2Ra 1.85 510.01 2555.98 634.41 0.0313
IP-10 n.d. 453.16 7209.08 1639.17 0.0156
MIP-1a 5.00 1582.37 2124.81 1498.84 0.2188
MIP-1b 7.03 1042.23 1785.94 1874.19 0.8125
RANTES 20.74 1474.67 4541.93 1011.07 0.0156
IL-2 1.08 1.62 30.24 4.27 0.0156
IL-8 14.96 261.61 860.70 725.13 0.8125
TNF-a 1.16 262.14 1460.47 205.98 0.0156
TNF-b 0.18 32.42 849.85 20.63 0.0156
Fractalkine 11.06 33.63 116.64 78.38 0.4375
IL-10 1.20 31.13 111.91 177.16 0.0781
IL-12p40 1.76 16.92 138.97 45.52 0.0156
PDGF-AA 5.02 27.07 125.34 129.52 0.9375
sCD40L n.d. 232.21 283.27 119.52 0.0156
IL-9 0.38 2.89 126.82 7.28 0.0156
IL-5 0.22 40.64 583.90 163.24 0.0313
IL-6 2.21 2.43 33.54 28.06 0.0156
MCP-1 44.61 27.52 36.48 75.34 0.4688
VEGF n.d. 60.61 54.19 46.87 0.1250
PDGF-BB n.d. 32.90 37.19 19.28 0.2500
G-CSF 4.27 27.51 46.86 40.97 0.2969
Flt-3L 1.33 21.55 56.47 34.51 0.0313
IL-3 0.21 10.48 58.93 15.42 0.0156
IL-9 0.38 2.89 126.82 7.28 0.0156
IL-17a 0.22 22.52 38.46 46.12 0.2969
EGF 5.40 9.96 25.35 17.65 0.0156
FGF-2 7.05 1.88 26.05 12.22 0.3125
TGF-a n.d. 0.61 0.86 2.11 Too few pairs
IFN-a2 2.04 10.07 28.38 17.57 0.0313
GRO 5.27 10.94 29.47 13.27 0.0156
MCP-3 5.28 6.47 11.71 10.43 0.3750
IL-12p70 0.17 1.25 1.04 0.39 >0.9
IL-15 0.19 0.98 2.56 1.61 0.0313
IL-1ra 2.69 8.38 26.38 16.59 0.0469
IL-1a 0.33 5.61 43.25 12.22 0.0156
IL-1b 0.29 0.58 2.97 1.46 0.1406
IL-4 1.23 6.20 13.67 7.71 0.0313
IL-7 n.d. 7.05 16.46 10.35 0.0313
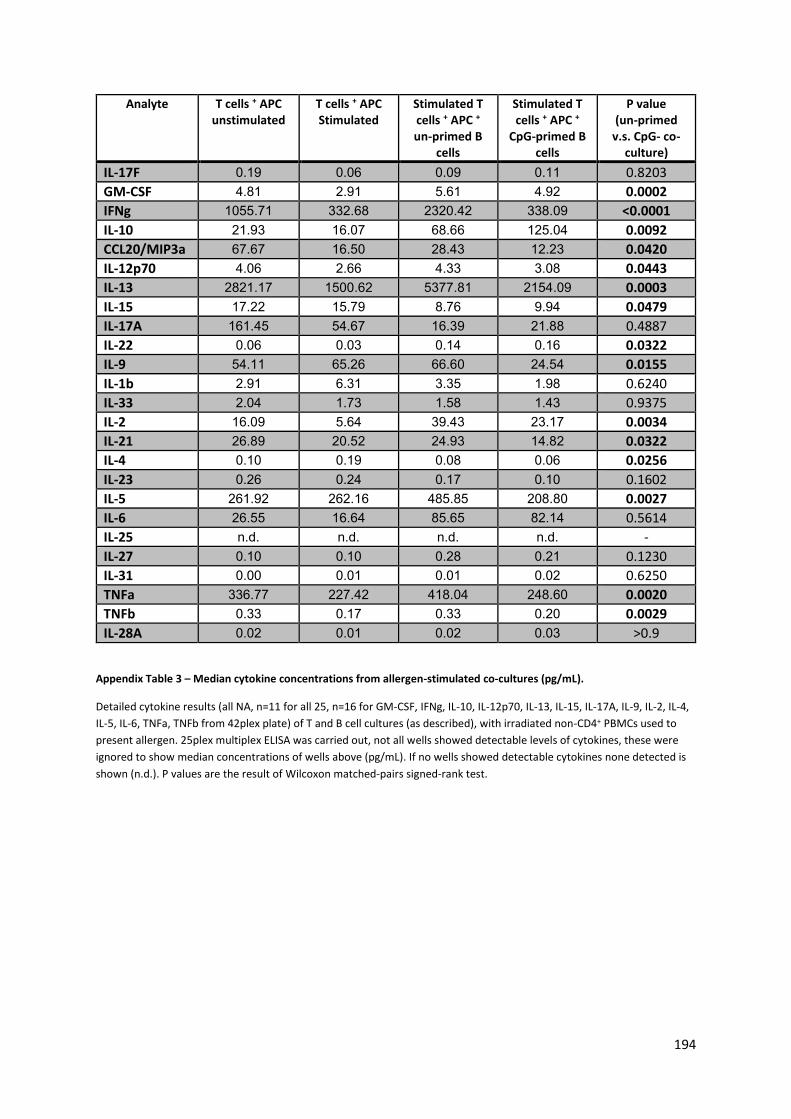
194
Analyte T cells + APC unstimulated
T cells + APC Stimulated
Stimulated T cells + APC + un-primed B
cells
Stimulated T cells + APC +
CpG-primed B cells
P value (un-primed
v.s. CpG- co-culture)
IL-17F 0.19 0.06 0.09 0.11 0.8203
GM-CSF 4.81 2.91 5.61 4.92 0.0002
IFNg 1055.71 332.68 2320.42 338.09 <0.0001
IL-10 21.93 16.07 68.66 125.04 0.0092
CCL20/MIP3a 67.67 16.50 28.43 12.23 0.0420
IL-12p70 4.06 2.66 4.33 3.08 0.0443
IL-13 2821.17 1500.62 5377.81 2154.09 0.0003
IL-15 17.22 15.79 8.76 9.94 0.0479
IL-17A 161.45 54.67 16.39 21.88 0.4887
IL-22 0.06 0.03 0.14 0.16 0.0322
IL-9 54.11 65.26 66.60 24.54 0.0155
IL-1b 2.91 6.31 3.35 1.98 0.6240
IL-33 2.04 1.73 1.58 1.43 0.9375
IL-2 16.09 5.64 39.43 23.17 0.0034
IL-21 26.89 20.52 24.93 14.82 0.0322
IL-4 0.10 0.19 0.08 0.06 0.0256
IL-23 0.26 0.24 0.17 0.10 0.1602
IL-5 261.92 262.16 485.85 208.80 0.0027
IL-6 26.55 16.64 85.65 82.14 0.5614
IL-25 n.d. n.d. n.d. n.d. -
IL-27 0.10 0.10 0.28 0.21 0.1230
IL-31 0.00 0.01 0.01 0.02 0.6250
TNFa 336.77 227.42 418.04 248.60 0.0020
TNFb 0.33 0.17 0.33 0.20 0.0029
IL-28A 0.02 0.01 0.02 0.03 >0.9
Appendix Table 3 – Median cytokine concentrations from allergen-stimulated co-cultures (pg/mL).
Detailed cytokine results (all NA, n=11 for all 25, n=16 for GM-CSF, IFNg, IL-10, IL-12p70, IL-13, IL-15, IL-17A, IL-9, IL-2, IL-4,
IL-5, IL-6, TNFa, TNFb from 42plex plate) of T and B cell cultures (as described), with irradiated non-CD4+ PBMCs used to
present allergen. 25plex multiplex ELISA was carried out, not all wells showed detectable levels of cytokines, these were
ignored to show median concentrations of wells above (pg/mL). If no wells showed detectable cytokines none detected is
shown (n.d.). P values are the result of Wilcoxon matched-pairs signed-rank test.
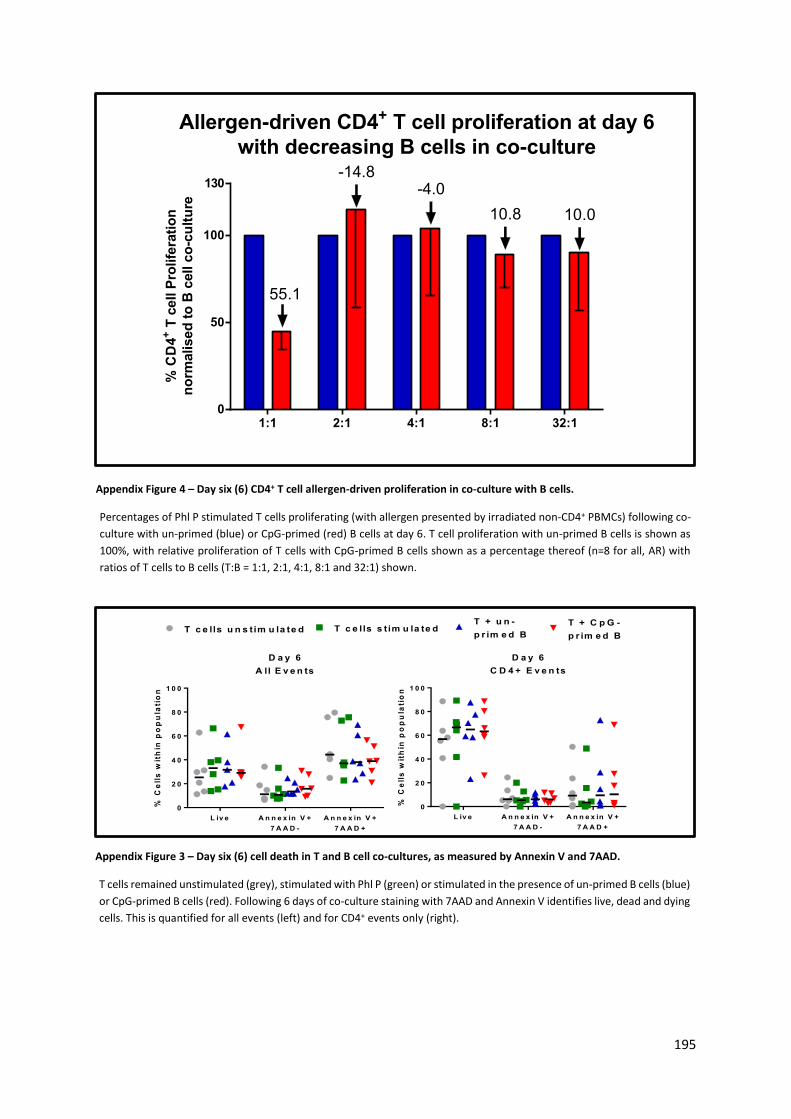
195
D a y 6
A ll E v e n ts
% C
ell
s w
ith
in p
op
ula
tio
n
L iv e A n n e x in V +
7 A A D -
A n n e x in V +
7 A A D +
0
2 0
4 0
6 0
8 0
1 0 0
T c e lls u n s tim u la te d T c e lls s t im u la te dT + u n -
p r im e d B
T + C p G -
p r im e d B
D a y 6
C D 4 + E v e n ts
% C
ell
s w
ith
in p
op
ula
tio
n
L iv e A n n e x in V +
7 A A D -
A n n e x in V +
7 A A D +
0
2 0
4 0
6 0
8 0
1 0 0
Allergen-driven CD4+ T cell proliferation at day 6
with decreasing B cells in co-culture
1:1 2:1 4:1 8:1 32:10
50
100
% C
D4
+ T
cell P
rolife
rati
on
no
rmalised
to
B c
ell c
o-c
ult
ure
55.1
-14.8130 -4.0
10.8 10.0
Appendix Figure 4 – Day six (6) CD4+ T cell allergen-driven proliferation in co-culture with B cells.
Percentages of Phl P stimulated T cells proliferating (with allergen presented by irradiated non-CD4+ PBMCs) following co-
culture with un-primed (blue) or CpG-primed (red) B cells at day 6. T cell proliferation with un-primed B cells is shown as
100%, with relative proliferation of T cells with CpG-primed B cells shown as a percentage thereof (n=8 for all, AR) with
ratios of T cells to B cells (T:B = 1:1, 2:1, 4:1, 8:1 and 32:1) shown.
Appendix Figure 3 – Day six (6) cell death in T and B cell co-cultures, as measured by Annexin V and 7AAD.
T cells remained unstimulated (grey), stimulated with Phl P (green) or stimulated in the presence of un-primed B cells (blue)
or CpG-primed B cells (red). Following 6 days of co-culture staining with 7AAD and Annexin V identifies live, dead and dying
cells. This is quantified for all events (left) and for CD4+ events only (right).
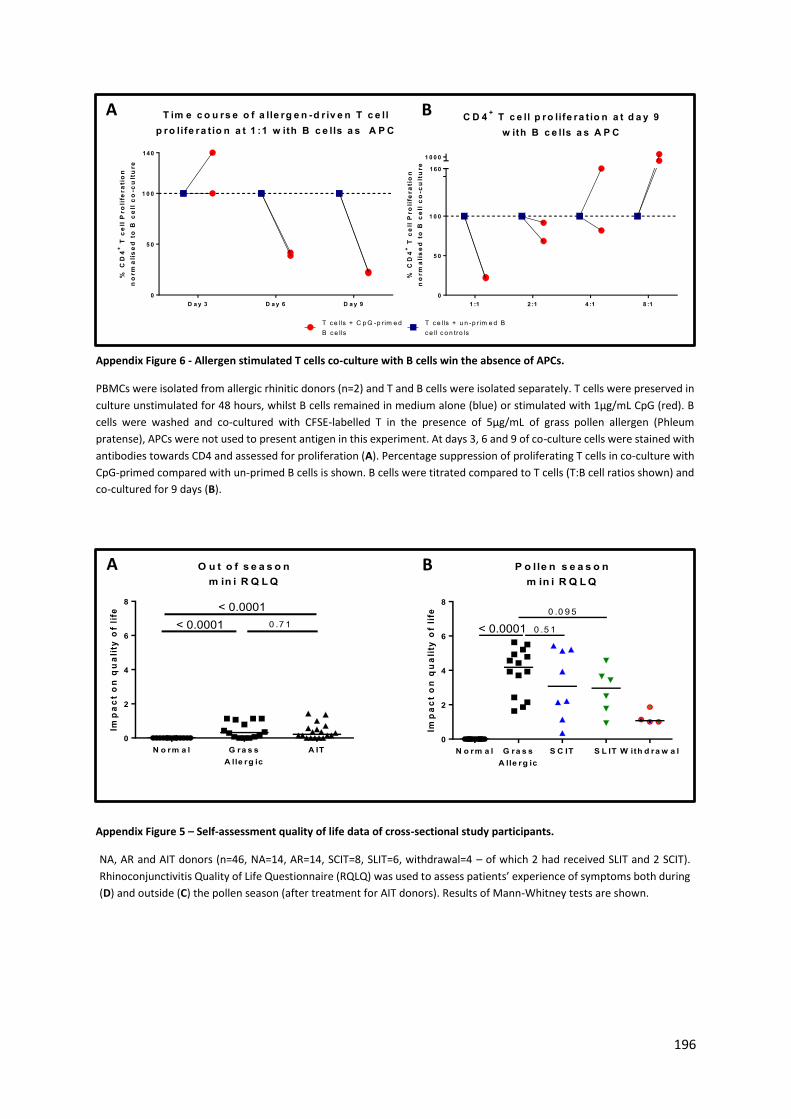
196
T im e c o u rs e o f a lle rg e n -d r iv e n T c e ll
p ro life ra t io n a t 1 :1 w ith B c e lls a s A P C
D a y 3 D a y 6 D a y 9
0
5 0
1 0 0
T c e lls + u n -p r im e d B
c e ll c o n tro ls
T c e lls + C p G -p r im e d
B c e lls
% C
D4
+ T
ce
ll P
ro
life
ra
tio
n
no
rm
ali
se
d t
o B
ce
ll c
o-c
ult
ure
140
C D 4+
T c e ll p ro life ra t io n a t d a y 9
w ith B c e lls a s A P C
1 :1 2 :1 4 :1 8 :1
0
5 0
1 0 0
1 0 0 0
% C
D4
+ T
ce
ll P
ro
life
ra
tio
n
no
rm
ali
se
d t
o B
ce
ll c
o-c
ult
ure
160
Appendix Figure 6 - Allergen stimulated T cells co-culture with B cells win the absence of APCs.
PBMCs were isolated from allergic rhinitic donors (n=2) and T and B cells were isolated separately. T cells were preserved in
culture unstimulated for 48 hours, whilst B cells remained in medium alone (blue) or stimulated with 1µg/mL CpG (red). B
cells were washed and co-cultured with CFSE-labelled T in the presence of 5µg/mL of grass pollen allergen (Phleum
pratense), APCs were not used to present antigen in this experiment. At days 3, 6 and 9 of co-culture cells were stained with
antibodies towards CD4 and assessed for proliferation (A). Percentage suppression of proliferating T cells in co-culture with
CpG-primed compared with un-primed B cells is shown. B cells were titrated compared to T cells (T:B cell ratios shown) and
co-cultured for 9 days (B).
A B
O u t o f s e a s o n
m in i R Q L Q
Imp
ac
t o
n q
ua
lity
of
life
N o rm a l G ra s s
A lle rg ic
A IT
0
2
4
6
8
0 .7 1< 0.0001
< 0.0001
P o lle n s e a s o n
m in i R Q L Q
Imp
ac
t o
n q
ua
lity
of
life
N o rm a l G ra s s
A lle rg ic
S C IT S L IT W ith d ra w a l
0
2
4
6
8
0 .0 9 5
< 0.0001 0 .5 1
A B
Appendix Figure 5 – Self-assessment quality of life data of cross-sectional study participants.
NA, AR and AIT donors (n=46, NA=14, AR=14, SCIT=8, SLIT=6, withdrawal=4 – of which 2 had received SLIT and 2 SCIT).
Rhinoconjunctivitis Quality of Life Questionnaire (RQLQ) was used to assess patients’ experience of symptoms both during
(D) and outside (C) the pollen season (after treatment for AIT donors). Results of Mann-Whitney tests are shown.
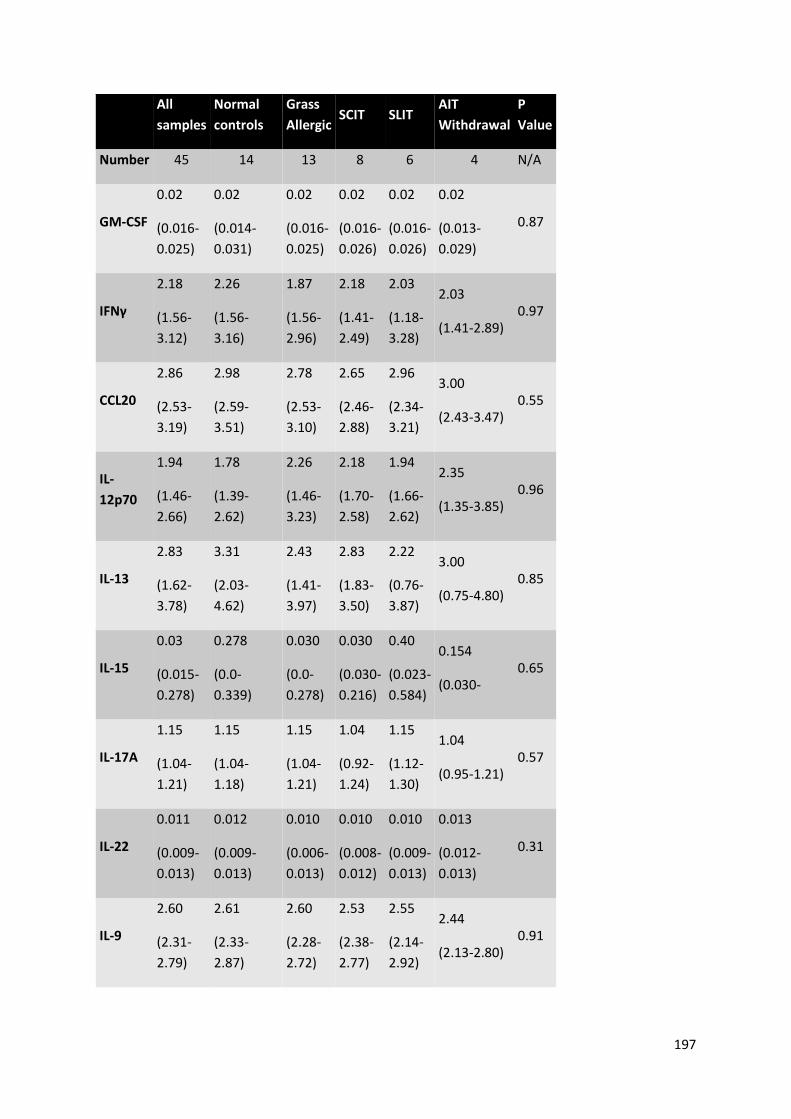
197
All
samples
Normal
controls
Grass
Allergic SCIT SLIT
AIT
Withdrawal
P
Value
Number 45 14 13 8 6 4 N/A
GM-CSF
0.02
(0.016-
0.025)
0.02
(0.014-
0.031)
0.02
(0.016-
0.025)
0.02
(0.016-
0.026)
0.02
(0.016-
0.026)
0.02
(0.013-
0.029)
0.87
IFNγ
2.18
(1.56-
3.12)
2.26
(1.56-
3.16)
1.87
(1.56-
2.96)
2.18
(1.41-
2.49)
2.03
(1.18-
3.28)
2.03
(1.41-2.89) 0.97
CCL20
2.86
(2.53-
3.19)
2.98
(2.59-
3.51)
2.78
(2.53-
3.10)
2.65
(2.46-
2.88)
2.96
(2.34-
3.21)
3.00
(2.43-3.47) 0.55
IL-
12p70
1.94
(1.46-
2.66)
1.78
(1.39-
2.62)
2.26
(1.46-
3.23)
2.18
(1.70-
2.58)
1.94
(1.66-
2.62)
2.35
(1.35-3.85) 0.96
IL-13
2.83
(1.62-
3.78)
3.31
(2.03-
4.62)
2.43
(1.41-
3.97)
2.83
(1.83-
3.50)
2.22
(0.76-
3.87)
3.00
(0.75-4.80) 0.85
IL-15
0.03
(0.015-
0.278)
0.278
(0.0-
0.339)
0.030
(0.0-
0.278)
0.030
(0.030-
0.216)
0.40
(0.023-
0.584)
0.154
(0.030- 0.65
IL-17A
1.15
(1.04-
1.21)
1.15
(1.04-
1.18)
1.15
(1.04-
1.21)
1.04
(0.92-
1.24)
1.15
(1.12-
1.30)
1.04
(0.95-1.21) 0.57
IL-22
0.011
(0.009-
0.013)
0.012
(0.009-
0.013)
0.010
(0.006-
0.013)
0.010
(0.008-
0.012)
0.010
(0.009-
0.013)
0.013
(0.012-
0.013)
0.31
IL-9
2.60
(2.31-
2.79)
2.61
(2.33-
2.87)
2.60
(2.28-
2.72)
2.53
(2.38-
2.77)
2.55
(2.14-
2.92)
2.44
(2.13-2.80) 0.91
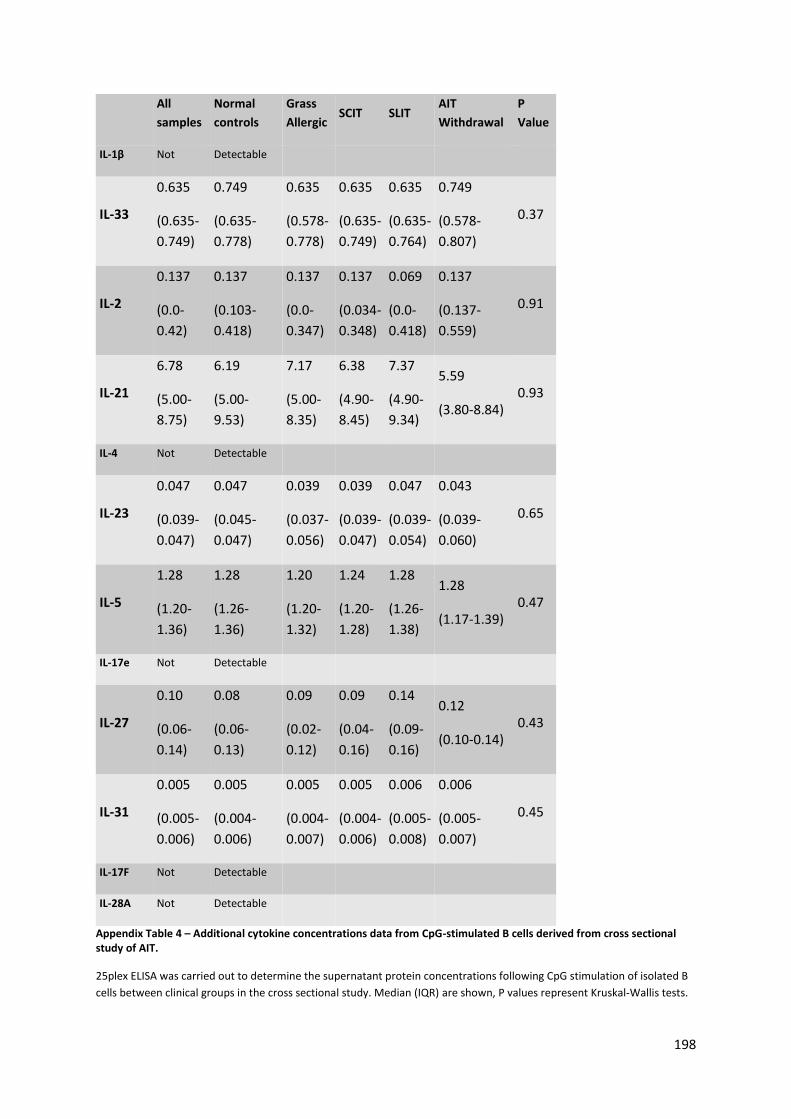
198
All
samples
Normal
controls
Grass
Allergic SCIT SLIT
AIT
Withdrawal
P
Value
IL-1β Not Detectable
IL-33
0.635
(0.635-
0.749)
0.749
(0.635-
0.778)
0.635
(0.578-
0.778)
0.635
(0.635-
0.749)
0.635
(0.635-
0.764)
0.749
(0.578-
0.807)
0.37
IL-2
0.137
(0.0-
0.42)
0.137
(0.103-
0.418)
0.137
(0.0-
0.347)
0.137
(0.034-
0.348)
0.069
(0.0-
0.418)
0.137
(0.137-
0.559)
0.91
IL-21
6.78
(5.00-
8.75)
6.19
(5.00-
9.53)
7.17
(5.00-
8.35)
6.38
(4.90-
8.45)
7.37
(4.90-
9.34)
5.59
(3.80-8.84) 0.93
IL-4 Not Detectable
IL-23
0.047
(0.039-
0.047)
0.047
(0.045-
0.047)
0.039
(0.037-
0.056)
0.039
(0.039-
0.047)
0.047
(0.039-
0.054)
0.043
(0.039-
0.060)
0.65
IL-5
1.28
(1.20-
1.36)
1.28
(1.26-
1.36)
1.20
(1.20-
1.32)
1.24
(1.20-
1.28)
1.28
(1.26-
1.38)
1.28
(1.17-1.39) 0.47
IL-17e Not Detectable
IL-27
0.10
(0.06-
0.14)
0.08
(0.06-
0.13)
0.09
(0.02-
0.12)
0.09
(0.04-
0.16)
0.14
(0.09-
0.16)
0.12
(0.10-0.14) 0.43
IL-31
0.005
(0.005-
0.006)
0.005
(0.004-
0.006)
0.005
(0.004-
0.007)
0.005
(0.004-
0.006)
0.006
(0.005-
0.008)
0.006
(0.005-
0.007)
0.45
IL-17F Not Detectable
IL-28A Not Detectable
Appendix Table 4 – Additional cytokine concentrations data from CpG-stimulated B cells derived from cross sectional study of AIT.
25plex ELISA was carried out to determine the supernatant protein concentrations following CpG stimulation of isolated B
cells between clinical groups in the cross sectional study. Median (IQR) are shown, P values represent Kruskal-Wallis tests.

199
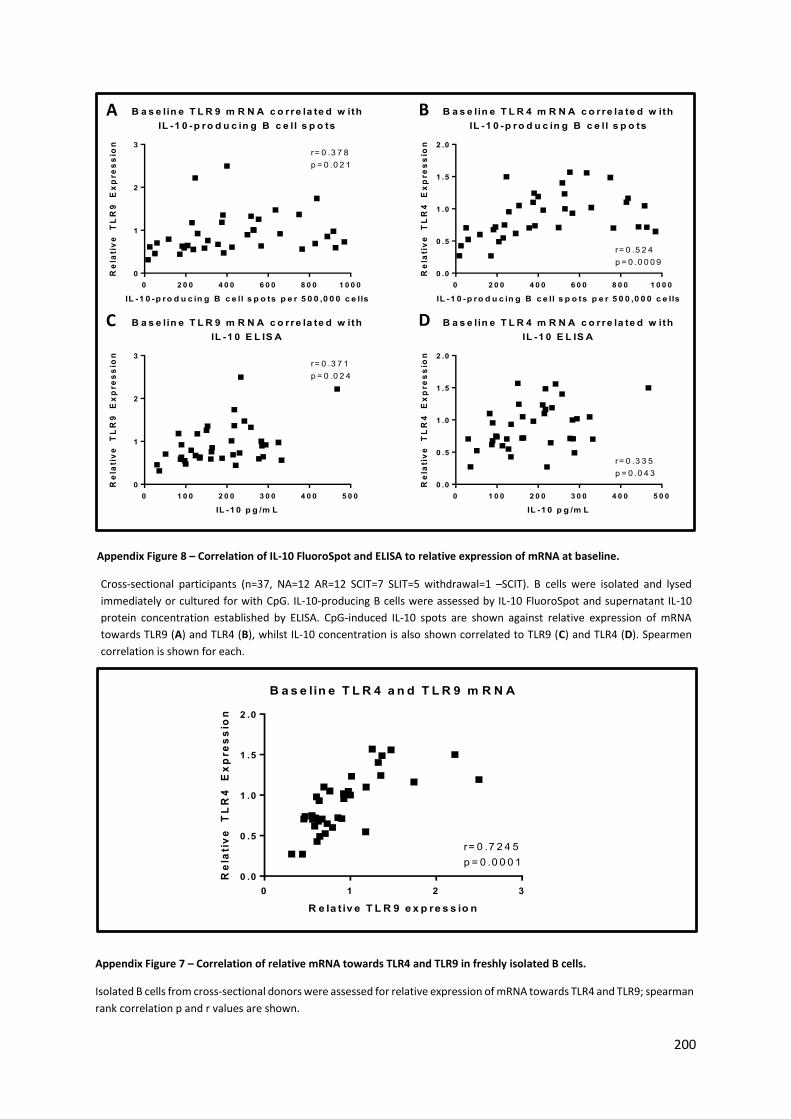
200
B a s e lin e T L R 4 a n d T L R 9 m R N A
R e la t iv e T L R 9 e x p re s s io n
Re
lati
ve
T
LR
4
Ex
pre
ss
ion
0 1 2 3
0 .0
0 .5
1 .0
1 .5
2 .0
r= 0 .7 2 4 5
p = 0 .0 0 0 1
Appendix Figure 7 – Correlation of relative mRNA towards TLR4 and TLR9 in freshly isolated B cells.
Isolated B cells from cross-sectional donors were assessed for relative expression of mRNA towards TLR4 and TLR9; spearman
rank correlation p and r values are shown.
B a s e lin e T L R 9 m R N A c o rre la te d w ith
IL -1 0 -p ro d u c in g B c e ll s p o ts
IL -1 0 -p ro d u c in g B c e ll s p o ts p e r 5 0 0 ,0 0 0 c e lls
Re
lati
ve
T
LR
9
Ex
pre
ss
ion
0 2 0 0 4 0 0 6 0 0 8 0 0 1 0 0 0
0
1
2
3r= 0 .3 7 8
p = 0 .0 2 1
B a s e lin e T L R 4 m R N A c o rre la te d w ith
IL -1 0 -p ro d u c in g B c e ll s p o ts
IL -1 0 -p ro d u c in g B c e ll s p o ts p e r 5 0 0 ,0 0 0 c e lls
Re
lati
ve
T
LR
4
Ex
pre
ss
ion
0 2 0 0 4 0 0 6 0 0 8 0 0 1 0 0 0
0 .0
0 .5
1 .0
1 .5
2 .0
r= 0 .5 2 4
p = 0 .0 0 0 9
B a s e lin e T L R 9 m R N A c o rre la te d w ith
IL -1 0 E L IS A
IL -1 0 p g /m L
Re
lati
ve
T
LR
9
Ex
pre
ss
ion
0 1 0 0 2 0 0 3 0 0 4 0 0 5 0 0
0
1
2
3r= 0 .3 7 1
p = 0 .0 2 4
B a s e lin e T L R 4 m R N A c o rre la te d w ith
IL -1 0 E L IS A
IL -1 0 p g /m L
Re
lati
ve
T
LR
4
Ex
pre
ss
ion
0 1 0 0 2 0 0 3 0 0 4 0 0 5 0 0
0 .0
0 .5
1 .0
1 .5
2 .0
r= 0 .3 3 5
p = 0 .0 4 3
A B
C D
Appendix Figure 8 – Correlation of IL-10 FluoroSpot and ELISA to relative expression of mRNA at baseline.
Cross-sectional participants (n=37, NA=12 AR=12 SCIT=7 SLIT=5 withdrawal=1 –SCIT). B cells were isolated and lysed
immediately or cultured for with CpG. IL-10-producing B cells were assessed by IL-10 FluoroSpot and supernatant IL-10
protein concentration established by ELISA. CpG-induced IL-10 spots are shown against relative expression of mRNA
towards TLR9 (A) and TLR4 (B), whilst IL-10 concentration is also shown correlated to TLR9 (C) and TLR4 (D). Spearmen
correlation is shown for each.
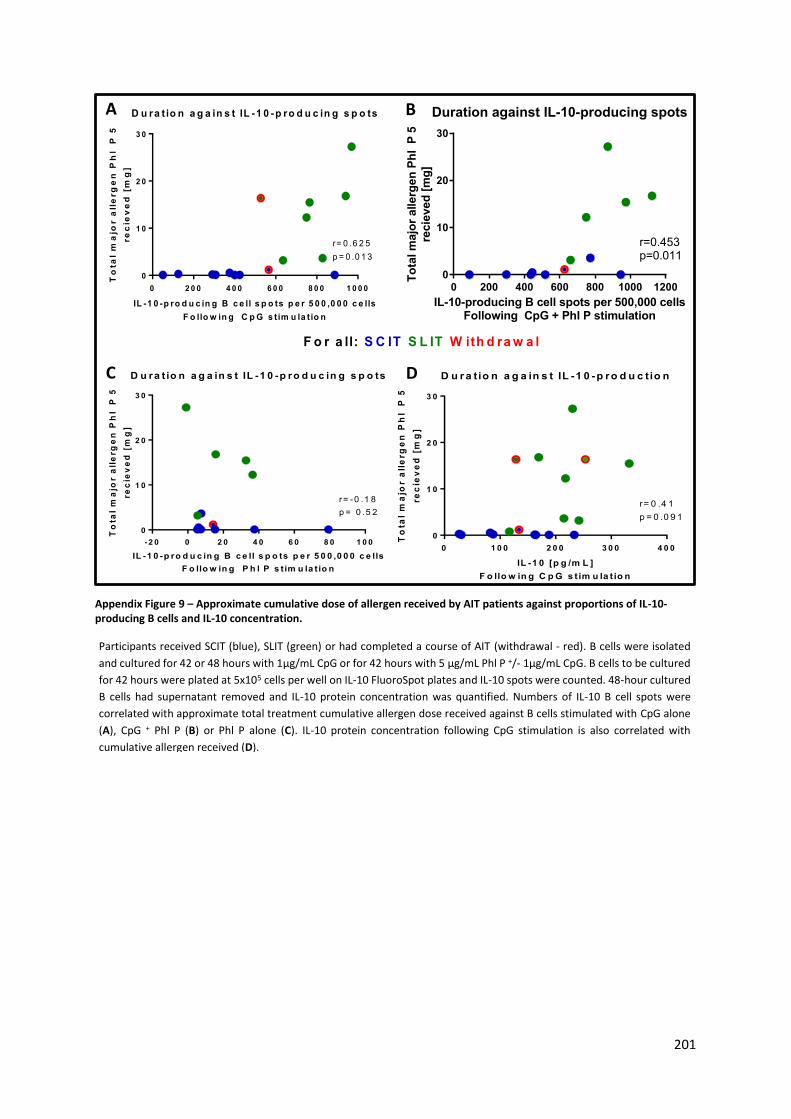
201
D u ra t io n a g a in s t IL -1 0 -p ro d u c in g s p o ts
IL -1 0 -p ro d u c in g B c e ll s p o ts p e r 5 0 0 ,0 0 0 c e lls
F o llo w in g C p G s tim u la t io n
To
tal
ma
jor a
lle
rg
en
Ph
l P
5
re
cie
ve
d [
mg
]
0 2 0 0 4 0 0 6 0 0 8 0 0 1 0 0 0
0
1 0
2 0
3 0
r= 0 .6 2 5
p = 0 .0 1 3
F o r a ll: S C IT S L IT W ith d ra w a l
Duration against IL-10-producing spots
IL-10-producing B cell spots per 500,000 cellsFollowing CpG + Phl P stimulation
To
tal m
ajo
r allerg
en
Ph
l P
5
recie
ved
[m
g]
0 200 400 600 800 1000 12000
10
20
30
r=0.453p=0.011
D u ra t io n a g a in s t IL -1 0 -p ro d u c in g s p o ts
IL -1 0 -p ro d u c in g B c e ll s p o ts p e r 5 0 0 ,0 0 0 c e lls
F o llo w in g P h l P s t im u la t io n
To
tal
ma
jor a
lle
rg
en
Ph
l P
5
re
cie
ve
d [
mg
]
-2 0 0 2 0 4 0 6 0 8 0 1 0 0
0
1 0
2 0
3 0
r= -0 .1 8
p = 0 .5 2
D u r a tio n a g a in s t IL -1 0 -p ro d u c tio n
IL -1 0 [p g /m L ]
F o llo w in g C p G s t im u la t io n
To
tal
ma
jor a
lle
rg
en
Ph
l P
5
re
cie
ve
d [
mg
]
0 1 0 0 2 0 0 3 0 0 4 0 0
0
1 0
2 0
3 0
r= 0 .4 1
p = 0 .0 9 1
Appendix Figure 9 – Approximate cumulative dose of allergen received by AIT patients against proportions of IL-10-producing B cells and IL-10 concentration.
Participants received SCIT (blue), SLIT (green) or had completed a course of AIT (withdrawal - red). B cells were isolated
and cultured for 42 or 48 hours with 1µg/mL CpG or for 42 hours with 5 µg/mL Phl P +/- 1µg/mL CpG. B cells to be cultured
for 42 hours were plated at 5x10⁵ cells per well on IL-10 FluoroSpot plates and IL-10 spots were counted. 48-hour cultured
B cells had supernatant removed and IL-10 protein concentration was quantified. Numbers of IL-10 B cell spots were
correlated with approximate total treatment cumulative allergen dose received against B cells stimulated with CpG alone
(A), CpG + Phl P (B) or Phl P alone (C). IL-10 protein concentration following CpG stimulation is also correlated with
cumulative allergen received (D).
A B
C D

202
G e n d e r c o m p a re d w ith IL -6 p r o d u c tio nIL
-6 p
g/m
L
M a le F e m a le
0
5 0 0
1 0 0 0
1 5 0 0
2 0 0 0
2 5 0 0
0.0460
(AIT samples excluded)
IL-6
pg
/mL
Male Female0
500
1000
1500
2000
2500
0.3450
G e n d e r c o m p a r e d w ith T N F p ro d u c t io n
TN
F
pg
/mL
M a le F e m a le
0
5 0 0
1 0 0 0
1 5 0 0
0.0105
(AIT samples excluded)
TN
F
pg
/mL
Male Female0
500
1000
1500
0.2358
A B
C D
Appendix Figure 10 – Concentrations of IL-6 and TNFα in CpG-stimulated B cell supernatants by gender.
Concentrations of IL-6 (A and C) and TNFα (B and D) were established from isolated, CpG-stimulated, B cell supernatants by
multiplex ELISA. These are stratified for all donors by gender (A and B) and also with AIT donors removed from analysis (C
and D). Values shown are the resulting p values of a Man-Whitney U test between the groups.
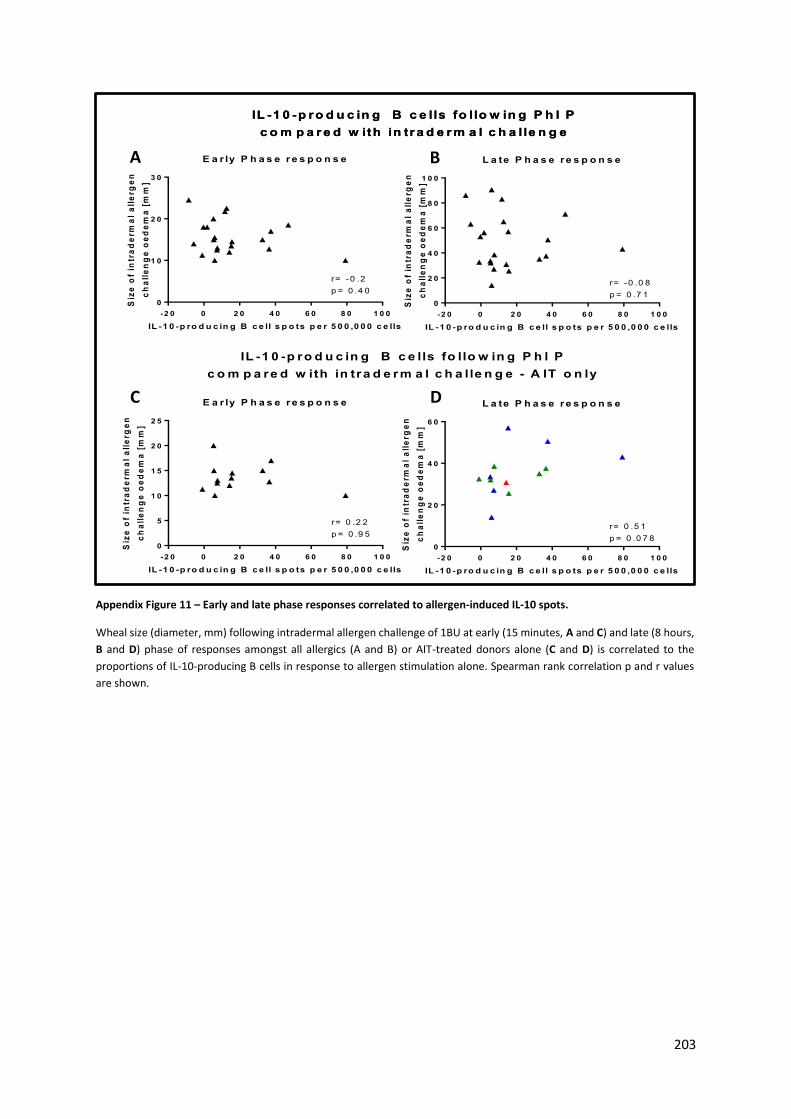
203
IL -1 0 -p ro d u c in g B c e lls fo llo w in g P h l P
c o m p a r e d w ith in tr a d e r m a l c h a lle n g e
E a r ly P h a s e r e s p o n s e
IL -1 0 -p ro d u c in g B c e ll s p o ts p e r 5 0 0 ,0 0 0 c e lls
Siz
e o
f in
tra
de
rma
l a
lle
rge
n
ch
all
en
ge
oe
de
ma
[m
m]
-2 0 0 2 0 4 0 6 0 8 0 1 0 0
0
1 0
2 0
3 0
r= -0 .2
p = 0 .4 0
L a te P h a s e r e s p o n s e
IL -1 0 -p ro d u c in g B c e ll s p o ts p e r 5 0 0 ,0 0 0 c e lls
Siz
e o
f in
tra
de
rma
l a
lle
rge
n
ch
all
en
ge
oe
de
ma
[m
m]
-2 0 0 2 0 4 0 6 0 8 0 1 0 0
0
2 0
4 0
6 0
8 0
1 0 0
r= -0 .0 8
p = 0 .7 1
IL -1 0 -p ro d u c in g B c e lls fo llo w in g P h l P
c o m p a r e d w ith in tr a d e r m a l c h a lle n g e
IL -1 0 -p ro d u c in g B c e lls fo llo w in g P h l P
c o m p a re d w ith in tra d e r m a l c h a lle n g e - A IT o n ly
E a r ly P h a s e r e s p o n s e
IL -1 0 -p ro d u c in g B c e ll s p o ts p e r 5 0 0 ,0 0 0 c e lls
Siz
e o
f in
tra
de
rma
l a
lle
rge
n
ch
all
en
ge
oe
de
ma
[m
m]
-2 0 0 2 0 4 0 6 0 8 0 1 0 0
0
5
1 0
1 5
2 0
2 5
r= 0 .2 2
p = 0 .9 5
L a te P h a s e r e s p o n s e
IL -1 0 -p ro d u c in g B c e ll s p o ts p e r 5 0 0 ,0 0 0 c e lls
Siz
e o
f in
tra
de
rma
l a
lle
rge
n
ch
all
en
ge
oe
de
ma
[m
m]
-2 0 0 2 0 4 0 6 0 8 0 1 0 0
0
2 0
4 0
6 0
r= 0 .5 1
p = 0 .0 7 8
Appendix Figure 11 – Early and late phase responses correlated to allergen-induced IL-10 spots.
Wheal size (diameter, mm) following intradermal allergen challenge of 1BU at early (15 minutes, A and C) and late (8 hours,
B and D) phase of responses amongst all allergics (A and B) or AIT-treated donors alone (C and D) is correlated to the
proportions of IL-10-producing B cells in response to allergen stimulation alone. Spearman rank correlation p and r values
are shown.
A B
C D
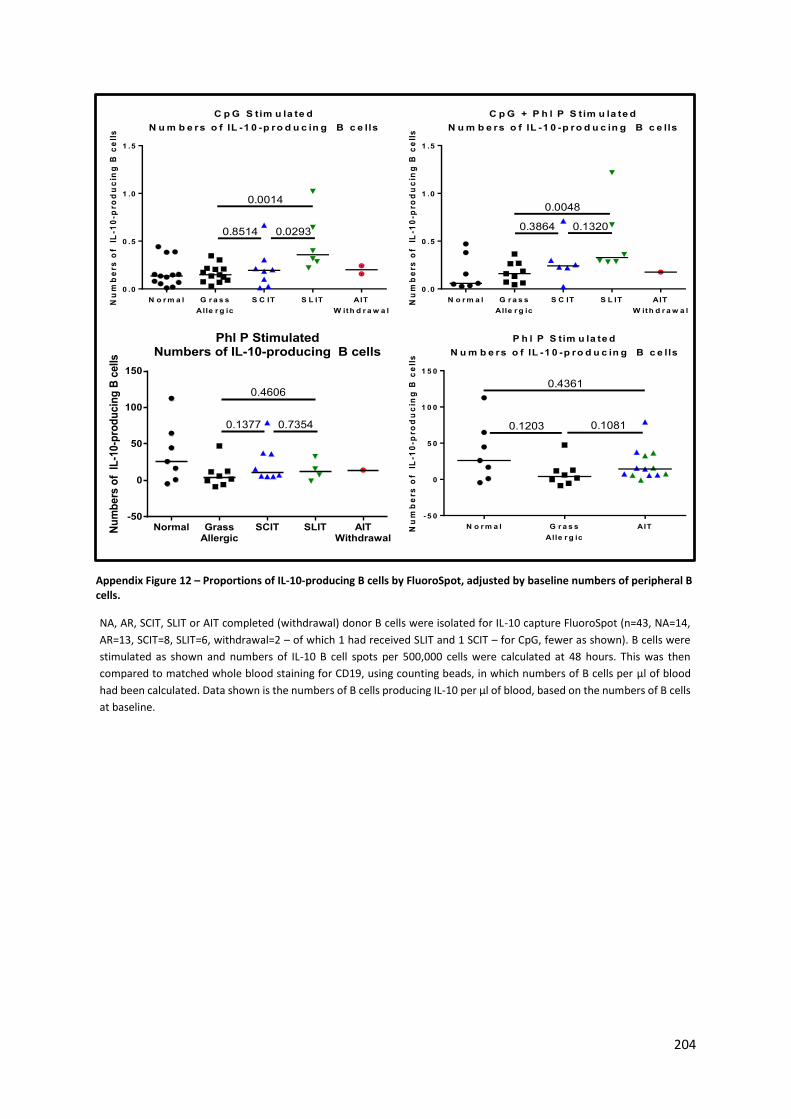
204
C p G S tim u la te d
N u m b e rs o f IL -1 0 -p ro d u c in g B c e lls
Nu
mb
ers
of
IL
-10
-pro
du
cin
g B
ce
lls
N o r m a l G r a s s
Alle r g ic
S C IT S L IT AIT
W ith d r a w a l
0 .0
0 .5
1 .0
1 .5
0.0293
0.0014
0.8514
C p G + P h l P S tim u la te d
N u m b e rs o f IL -1 0 -p ro d u c in g B c e lls
Nu
mb
ers
of
IL
-10
-pro
du
cin
g B
ce
lls
N o r m a l G r a s s
Alle r g ic
S C IT S L IT AIT
W ith d r a w a l
0 .0
0 .5
1 .0
1 .5
0.1320
0.0048
0.3864
P h l P S tim u la te d
N u m b e rs o f IL -1 0 -p ro d u c in g B c e lls
Nu
mb
ers
of
IL
-10
-pro
du
cin
g B
ce
lls
N o r m a l G r a s s
Alle r g ic
AIT
-5 0
0
5 0
1 0 0
1 5 0
0.10810.1203
0.4361
Phl P StimulatedNumbers of IL-10-producing B cells
Nu
mb
ers
of
IL
-10-p
rod
ucin
g B
cells
Normal GrassAllergic
SCIT SLIT AITWithdrawal
-50
0
50
100
150
0.7354
0.4606
0.1377
Appendix Figure 12 – Proportions of IL-10-producing B cells by FluoroSpot, adjusted by baseline numbers of peripheral B cells.
NA, AR, SCIT, SLIT or AIT completed (withdrawal) donor B cells were isolated for IL-10 capture FluoroSpot (n=43, NA=14,
AR=13, SCIT=8, SLIT=6, withdrawal=2 – of which 1 had received SLIT and 1 SCIT – for CpG, fewer as shown). B cells were
stimulated as shown and numbers of IL-10 B cell spots per 500,000 cells were calculated at 48 hours. This was then
compared to matched whole blood staining for CD19, using counting beads, in which numbers of B cells per µl of blood
had been calculated. Data shown is the numbers of B cells producing IL-10 per µl of blood, based on the numbers of B cells
at baseline.
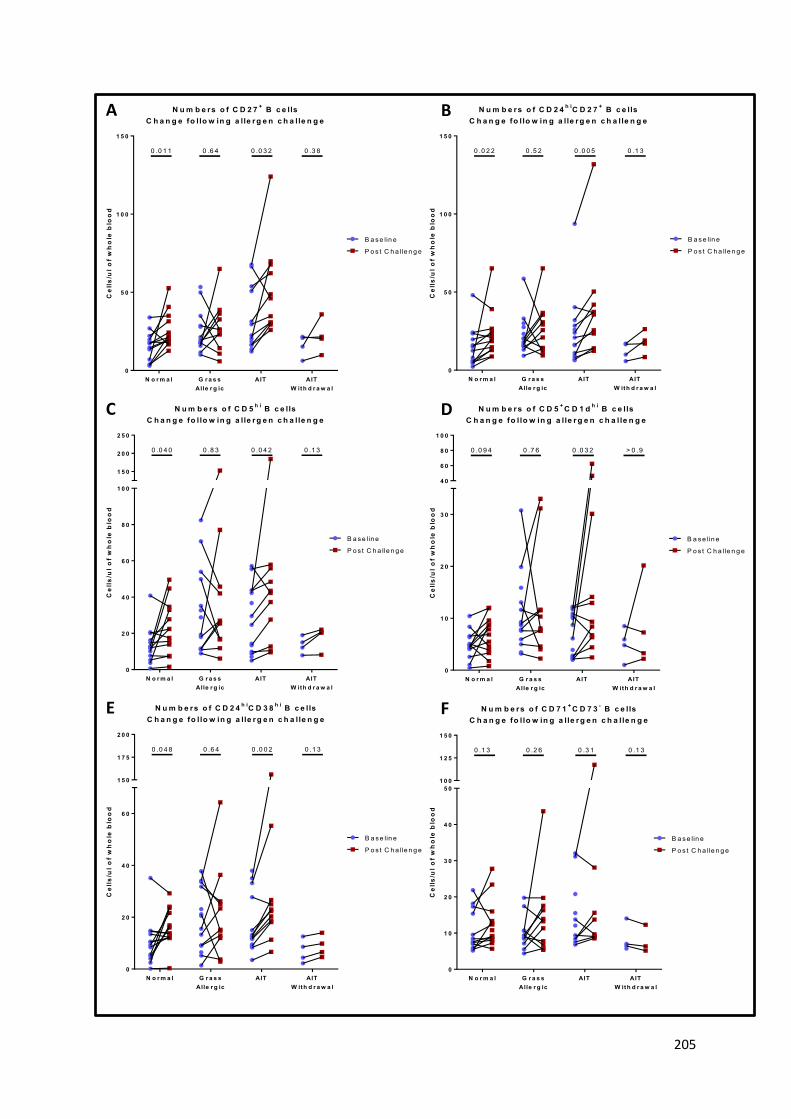
205
N u m b e rs o f C D 2 4
h iC D 2 7
+ B c e lls
C h a n g e fo l lo w in g a lle r g e n c h a lle n g e
Ce
lls
/ul
of
wh
ole
blo
od
N o r m a l G r a s s
Alle r g ic
AIT AIT
W ith d r a w a l
0
5 0
1 0 0
1 5 0
0 .0 2 2 0 .5 2 0 .0 0 5 0 .1 3
B a s e lin e
P o s t C h a lle n g e
N u m b e rs o f C D 2 7+ B c e lls
C h a n g e fo l lo w in g a lle r g e n c h a lle n g e
Ce
lls
/ul
of
wh
ole
blo
od
N o r m a l G r a s s
Alle r g ic
AIT AIT
W ith d r a w a l
0
5 0
1 0 0
1 5 0
0 .0 1 1 0 .6 4 0 .0 3 2 0 .3 8
B a s e lin e
P o s t C h a lle n g e
N u m b e rs o f C D 5h i
B c e lls
C h a n g e fo l lo w in g a lle r g e n c h a lle n g e
Ce
lls
/ul
of
wh
ole
blo
od
N o r m a l G r a s s
Alle r g ic
AIT AIT
W ith d r a w a l
0
2 0
4 0
6 0
8 0
1 0 0
1 5 0
2 0 0
2 5 0
0 .0 4 0 0 .8 3 0 .0 4 2 0 .1 3
B a s e lin e
P o s t C h a lle n g e
N u m b e rs o f C D 2 4h i
C D 3 8h i
B c e lls
C h a n g e fo l lo w in g a lle r g e n c h a lle n g e
Ce
lls
/ul
of
wh
ole
blo
od
N o r m a l G r a s s
Alle r g ic
AIT AIT
W ith d r a w a l
0
2 0
4 0
6 0
1 5 0
1 7 5
2 0 0
0 .0 4 8 0 .6 4 0 .0 0 2 0 .1 3
B a s e lin e
P o s t C h a lle n g e
N u m b e rs o f C D 5+C D 1 d
h i B c e lls
C h a n g e fo l lo w in g a lle r g e n c h a lle n g e
Ce
lls
/ul
of
wh
ole
blo
od
N o r m a l G r a s s
Alle r g ic
AIT AIT
W ith d r a w a l
0
1 0
2 0
3 0
4 0
6 0
8 0
1 0 0
0 .0 9 4 0 .7 6 0 .0 3 2 > 0 .9
B a s e lin e
P o s t C h a lle n g e
N u m b e rs o f C D 7 1+C D 7 3
- B c e lls
C h a n g e fo l lo w in g a lle r g e n c h a lle n g e
Ce
lls
/ul
of
wh
ole
blo
od
N o r m a l G r a s s
Alle r g ic
AIT AIT
W ith d r a w a l
0
1 0
2 0
3 0
4 0
5 0
1 0 0
1 2 5
1 5 0
0 .1 3 0 .2 6 0 .3 1 0 .1 3
B a s e lin e
P o s t C h a lle n g e
A B
C D
E F
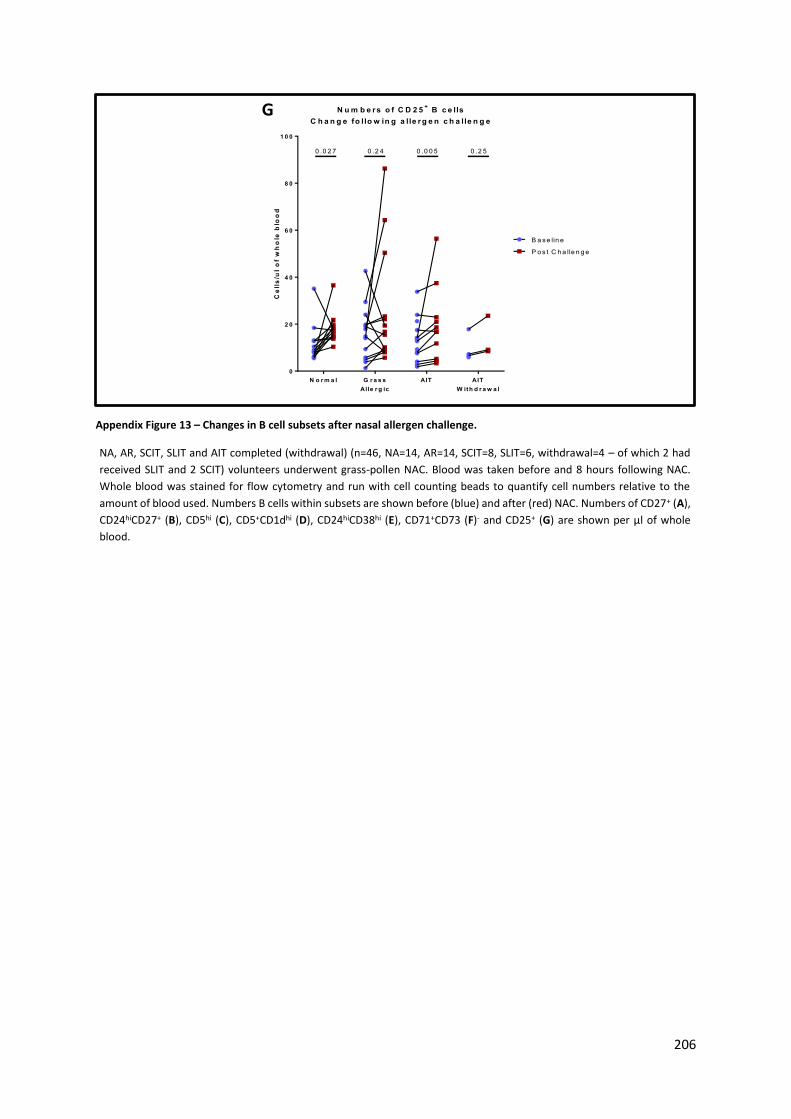
206
N u m b e rs o f C D 2 5
+ B c e lls
C h a n g e fo l lo w in g a lle r g e n c h a lle n g e
Ce
lls
/ul
of
wh
ole
blo
od
N o r m a l G r a s s
Alle r g ic
AIT AIT
W ith d r a w a l
0
2 0
4 0
6 0
8 0
1 0 0
0 .0 2 7 0 .2 4 0 .0 0 5 0 .2 5
B a s e lin e
P o s t C h a lle n g e
Appendix Figure 13 – Changes in B cell subsets after nasal allergen challenge.
NA, AR, SCIT, SLIT and AIT completed (withdrawal) (n=46, NA=14, AR=14, SCIT=8, SLIT=6, withdrawal=4 – of which 2 had
received SLIT and 2 SCIT) volunteers underwent grass-pollen NAC. Blood was taken before and 8 hours following NAC.
Whole blood was stained for flow cytometry and run with cell counting beads to quantify cell numbers relative to the
amount of blood used. Numbers B cells within subsets are shown before (blue) and after (red) NAC. Numbers of CD27+ (A),
CD24hiCD27+ (B), CD5hi (C), CD5+CD1dhi (D), CD24hiCD38hi (E), CD71+CD73 (F)- and CD25+ (G) are shown per µl of whole
blood.
G

207
Area under the curve for:
Normal controls
Grass Allergics
SCIT SLIT Withdrawal p value
EPR – Change in peak nasal
inspiratory flow (PNIF) area
under the curve (AOC)
5.833 (-13.3-32.6)
-102.3 (-121.8- -58.0)
-49.69 (-58.9- -20.9)
-66.04 (-90.7- -26.5)
-11.88 (-39.3-5.7)
<0.0001
LPR – change in PNIF, AOC
6.607 (-13.5-27.68)
-32.50 (-65.5- -8.5)
-16.61 (-21.6-25.0)
-20.00 (-49.6-2.05)
20.36 (6.2-33.8)
0.0048
VAS EPR+LPR – equally weighted
16.50 (-25.2-63.0)
-145.4 (-162.5- -64.6)
-67.37 (-77.8-3.7)
-83.18 (-140.3- -28.7)
8.482 (-31.1-37.4)
<0.0001
PNIF EPR+LPR Mann-Whitney p value compared to Grass Allergic
<0.0001 - 0.008 0.27 0.005 -
SCIT + SLIT 0.016
Appendix Table 5 – Changes in peak nasal inspiratory flow following nasal allergen challenge.
Patients were monitored before and throughout nasal allergen challenge for nasal obstruction by measuring peak nasal
inspiratory flow (PNIF). Data shows change in PNIF from baseline over the first hour (EPR), during hours 1-8 (LPR) or both
(equally weighted EPR+LPR). P value column shows Kruskal-Wallis test for data within the row. Mann-Whitney test p value
is shown in the bottom row. Data courtesy of Dr Guy Scadding (Scadding, G.W. et al., unpublished data).

208
N u m b e rs o f B c e ll s u b s e ts a m o n g s t h e a lth y c o n tr o ls
C h a n g e o v e r 8 h o u r u n c h a lle n g e d c o n tr o l d a yC
ell
s/u
l o
f w
ho
le b
loo
dC
ells
/ul o
f wh
ole
blo
od
C D 1 9+
C D 2 4h i
C D 2 7+
C D 5h i
C D 1 dh i
C D 5+
C D 2 4h i
C D 3 8h i
C D 7 1+
C D 7 3-
C D 2 5+
0
1 0 0
2 0 0
3 0 0
4 0 0
0
2 0
4 0
6 0
8 0
0 .1 10 .0 1 6 0 .0 1 6 0 .3 8 0 .0 1 6 0 .0 1 6 0 .2 2
Appendix Figure 14 - Change in B cell subsets for non-allergic patients on an unchallenged day.
Non-allergic participants (n=7) donated blood at 0 (blue) and 8 hours (red) of an unchallenged control day to assess changes
in B cell subsets. Whole blood was stained for flow cytometry and run in the presence of cell counting beads to assess
absolute numbers of cells. Numbers of CD19+ B cells per µL blood are shown along with numbers of CD27+, CD24hiCD27+,
CD5hi, CD5+CD1dhi, CD24hiCD38hi, CD71+CD73- and CD25+ cells within the CD19+ B cell population (A). Wilcoxon matched-
pairs signed-rank p values are shown.
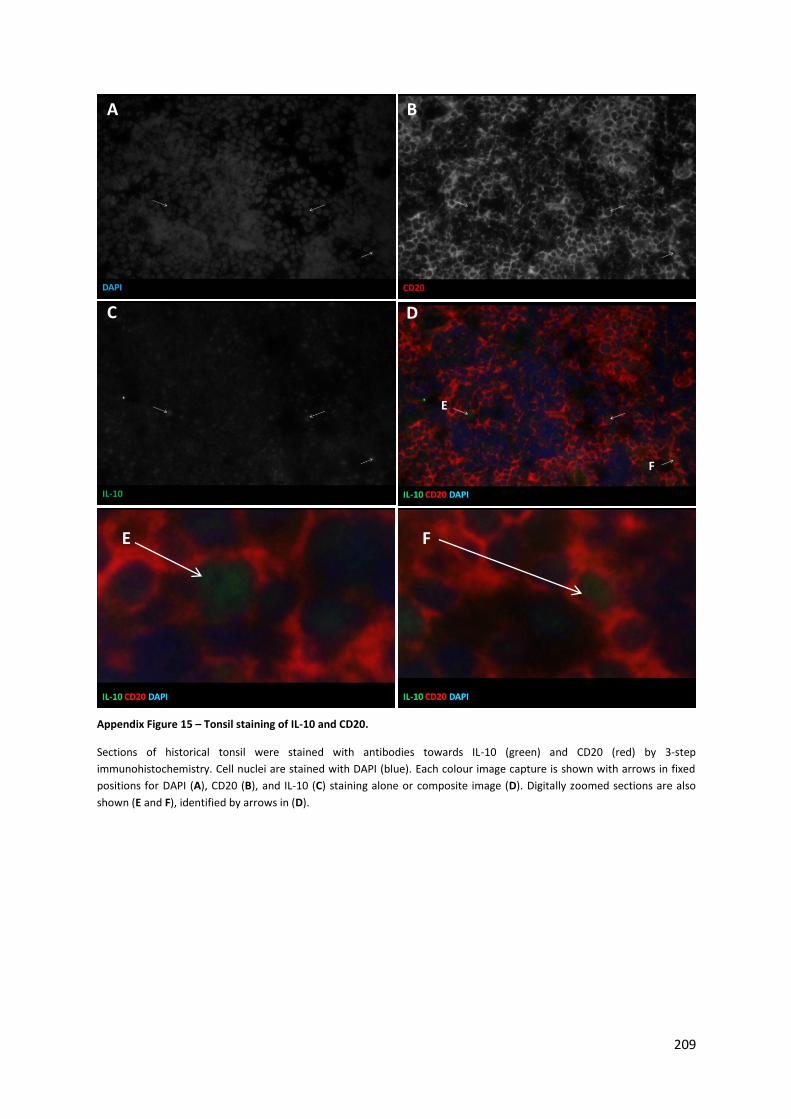
209
B A
D C
E
E
F
F
Appendix Figure 15 – Tonsil staining of IL-10 and CD20.
Sections of historical tonsil were stained with antibodies towards IL-10 (green) and CD20 (red) by 3-step
immunohistochemistry. Cell nuclei are stained with DAPI (blue). Each colour image capture is shown with arrows in fixed
positions for DAPI (A), CD20 (B), and IL-10 (C) staining alone or composite image (D). Digitally zoomed sections are also
shown (E and F), identified by arrows in (D).
Related Documents
![Allergic Rhinitis - sborl.es filesymptoms that continue year round (seasonal or perennial allergic rhinitis) may benefit most from immunotherapy [II D*]. Allergen immunotherapy can](https://static.cupdf.com/doc/110x72/5dd1130ad6be591ccb641892/allergic-rhinitis-sborles-that-continue-year-round-seasonal-or-perennial-allergic.jpg)
![Efficacy and safety of mometasone furoate nasal spray in allergic rhinitis… · 2019-07-12 · Allergic rhinitis is generally classified as either seasonal or peren-nial [5,8,9],](https://static.cupdf.com/doc/110x72/5f0ab4317e708231d42ced7a/efficacy-and-safety-of-mometasone-furoate-nasal-spray-in-allergic-rhinitis-2019-07-12.jpg)