Regulation of energy metabolism in cultured skeletal muscle cells: Effects of exercise, donor differences and perilipin 2 Studies in human and mouse myotubes Jenny Lund Dissertation for the degree of Philosophiae Doctor (Ph.D.) Department of Pharmaceutical Biosciences School of Pharmacy Faculty of Mathematics and Natural Sciences University of Oslo 2017

Welcome message from author
This document is posted to help you gain knowledge. Please leave a comment to let me know what you think about it! Share it to your friends and learn new things together.
Transcript
Regulation of energy metabolism in
cultured skeletal muscle cells: Effects of
exercise, donor differences and perilipin 2
Studies in human and mouse myotubes
Jenny Lund
Dissertation for the degree of Philosophiae Doctor (Ph.D.)
Department of Pharmaceutical Biosciences
School of Pharmacy
Faculty of Mathematics and Natural Sciences
University of Oslo
2017
© Jenny Lund, 2017 Series of dissertations submitted to the Faculty of Mathematics and Natural Sciences, University of Oslo No. 1891 ISSN 1501-7710 All rights reserved. No part of this publication may be reproduced or transmitted, in any form or by any means, without permission. Cover: Hanne Baadsgaard Utigard. Print production: Reprosentralen, University of Oslo.
Contents
ACKNOWLEDGEMENTS ....................................................................................................... 1
LIST OF PUBLICATIONS ....................................................................................................... 2
ABBREVIATIONS ................................................................................................................... 4
ABSTRACT ............................................................................................................................... 6
INTRODUCTION ..................................................................................................................... 8
Energy metabolism in skeletal muscle ................................................................................... 8
Dynamics of skeletal muscle lipid pools .............................................................................. 12
Metabolic flexibility of skeletal muscle ............................................................................... 13
Skeletal muscle fiber types ................................................................................................... 15
Effects of exercise on energy metabolism in skeletal muscle .............................................. 16
Insulin resistance, obesity and type 2 diabetes ..................................................................... 20
AIMS........................................................................................................................................ 23
SUMMARY OF PAPERS ....................................................................................................... 24
METHODOLOGICAL CONSIDERATIONS ........................................................................ 32
Donor characteristics ............................................................................................................ 32
Study design of the in vivo exercise intervention ................................................................. 34
Cultured skeletal muscle cells as an in vitro model ............................................................. 35
Methods used to measure energy metabolism in cultured skeletal muscle cells ................. 38
Data analyses and statistics .................................................................................................. 42
DISCUSSION AND CONCLUSIONS ................................................................................... 43
Oxidative capacity ................................................................................................................ 43
Lipid storage and turnover ................................................................................................... 49
Fiber type transformations in skeletal muscles .................................................................... 50
Effects on insulin sensitivity ................................................................................................ 52
Final considerations.............................................................................................................. 53
REFERENCES ........................................................................................................................ 55


1
ACKNOWLEDGEMENTS
The work presented in this thesis was performed at Department of Pharmaceutical
Biosciences, School of Pharmacy, University of Oslo during the period of 2013-2017. I am
very grateful for getting the opportunity to perform this PhD, and would like to express my
gratitude towards the University and all the people that have made this possible for me.
First of all I would like to thank my supervisors Eili Kase, Arild Rustan, Hege Thoresen, and
Jørgen Jensen for your support, guidance and encouragement; special thanks to the three of
you I have seen and talked to almost every single day. You have made this a great experience.
Next, I would like to thank the rest of my colleagues Nataša Nikolić, Vigdis Aas, Nils
Gunnar Løvsletten, Hege Bakke, and Camilla Stensrud. Also, thanks to the rest of the
members of the muscle research group, past and present, and all the talented master students
that I have had the pleasure of being cosupervisor for throughout these years: Mari Brubak,
Siw Anette Helle, Nils Gunnar Løvsletten, Abel Mengeste, and Sevnur Turan. I also have to
thank the rest of the wonderful people at the department working in Gydas vei; this has been
a great working environment!
Last but not least I would like to thank my wonderful family and friends. There are several
that have been a great support, but I would like to thank six of you in particular. First and
foremost: Mom and dad, you have always been there for me with encouragement, questions
on how my work is going and lots of support. I am so thankful for all the opportunities you
have given me and I love you very much! Next, I would like to thank my friends. Maren, we
met our first day at University and we have been best of friends ever since! Kristine, we have
become great friends throughout these years and I am forever grateful! Kristin, you have
become our “honorary pharmacist” and I am so happy I got to know you! Solveig, we also
met our first day at University and even though you switched career path we have kept the
great friendship and now we are also going to be colleagues. I love you all and look forward
to plenty of more good times with you! Your friendship and support means the world to me.
Oslo, 2017
Jenny Lund
2
LIST OF PUBLICATIONS
Paper I
Lund J, Rustan AC, Løvsletten NG, Mudry JM, Langleite TM, Feng YZ, Stensrud C,
Brubak MG, Drevon CA, Birkeland KI, Kolnes KJ, Johansen EI, Tangen DS, Stadheim HK,
Gulseth HL, Krook A, Kase ET, Jensen J, and Thoresen GH.
Exercise in vivo marks human myotubes in vitro: Training-induced increase in lipid
metabolism.
PLOS ONE, 2017;12(4):e0175441.
Paper II
Lund J, Tangen DS, Wiig H, Stadheim HK, Helle SA, Birk JB, Rustan AC, Thoresen GH,
Wojtaszewski JFP, Kase ET, and Jensen J.
Glucose metabolism and metabolic flexibility in cultured skeletal muscle cells is related to
exercise status in young male subjects.
Submitted to Archives of Physiology and Biochemistry.
Paper III
Lund J, Helle SA, Kase ET, Li Y, Løvsletten NG, Stadheim HK, Jensen J, Thoresen GH,
and Rustan AC.
Higher fatty acid turnover and oxidation in cultured human skeletal muscle cells from trained
young male subjects.
Submitted to PLOS ONE.
Paper IV
Lund J, Aas V, Tingstad RH, Van Hees A, and Nikolić N.
Lactic acid is readily used as an energy source or stored as glycogen and intracellular lipids
in human myotubes.
Submitted to PLOS ONE.
3
Paper V
Feng YZ, Lund J, Li Y, Knabenes IK, Bakke SS, Kase ET, Lee YK, Kimmel AR, Thoresen
GH, Rustan AC, and Dalen KT.
Loss of perilipin 2 in cultured myotubes enhances lipolysis and shifts the metabolic energy
balance from glucose oxidation towards fatty acid oxidation.
Under revision before resubmission to Journal of Lipid Research.
Publications not included in this thesis:
Lund J, Stensrud C, Rajender, Bohov P, Thoresen GH, Berge RK, Wright M, Kamal A,
Rustan AC, Miller AD, Skorve J.
The molecular structure of thio-ether fatty acids influences PPAR-dependent regulation of
lipid metabolism.
Bioorganic & Medical Chemistry, 2016;24(6):1191-1203.

4
ABBREVIATIONS
ABHD5/CGI-58 abhydrolase domain containing 5/comparative gene identification-58
ACAD Acyl-CoA dehydrogenase
ACBP acyl-CoA-binding protein
ACC acetyl-CoA carboxylase
ACL ATP citrate lyase
ACOX acyl-CoA oxidase
ACSL acyl-CoA synthetase
AMPK AMP-activated protein kinase
ASM acid soluble metabolite
ATGL adipose triglyceride lipase
ATP adenosine triphosphate
BMI body mass index
CA cell-associated radioactivity
CE cholesteryl ester
CPT carnitine palmitoyltransferase
DAG diacylglycerol
DGAT diacylglycerol acyltransferase
FABPc/FABPpm cytoplasmic/plasma membrane-associated fatty acid binding protein
FAS fatty acid synthase
FAT/CD36 fatty acid translocase
FATP fatty acid transport protein
(F)FA (free) fatty acid
G0S2 G0/G1 switch 2
G-6-P glucose-6-phosphate
GLUT glucose transporter
GPR G-protein coupled receptor
G(Y)S glycogen synthase
H heart
HK hexokinase
HRmax maximal heart rate
HSL hormone-sensitive lipase
IMCL intramyocellular lipid
IMTG intramyocellular triacylglycerol
IRS insulin receptor substrate
KO knockout
LD lipid droplet
LDH lactate dehydrogenase
LMM linear mixed-model analysis
LPL lipoprotein lipase
M muscle
MAG monoacylglycerol
MCD malonyl-CoA decarboxylase
MCT monocarboxylate transporter
MEF myocyte enhancer factor
MGAT monoacylglycerol acyltransferase
MGL monoacylglycerol lipase
MHC myosin heavy chain
MYF5 myogenic factor 5
5
MYH myosin heavy chain, gene
MYOD myogenic differentiation protein
NAD+/NADH nicotinamide adenine dinucleotide
OA oleic acid
PA palmitic acid
PDC pyruvate dehydrogenase complex
PDHA1 pyruvate dehydrogenase alpha 1
PDK pyruvate dehydrogenase kinase
PHK phosphorylase kinase
PI3K phosphatidylinositol 3-kinase
PKA protein kinase A
PKB/Akt protein kinase B
PKC protein kinase C
PKM muscle pyruvate kinase
PL phospholipid
PLIN perilipin
PPAR peroxisome proliferator-activated receptor
P(PAR)GC peroxisome proliferator-activated receptor gamma coactivator
PYGM muscle-associated glycogen phosphorylase
Rac1 Ras-related C3 botulinum toxin substrate 1
RER respiratory exchange ratio
RM repetition maximum
SCD stearoyl-CoA desaturase
Ser serine
SLC2 solute carrier family 2
SMM skeletal muscle mass
SPA scintillation proximity assay
T2D type 2 diabetes
TAG triacylglycerol
TBC1D1 TBC1 domain family member 1
TBC1D4/AS160 TBC1 domain family member 4/Akt substrate of 160 kDa
TCA tricarboxylic acid
TFAM mitochondrial transcription factor A
Thr threonine
Tyr tyrosine
UCP uncoupling protein
VLDL very low-density lipoprotein
VO2max maximal oxygen uptake
WHO World Health Organization
WHR waist-to-hip ratio
WT wild-type

6
ABSTRACT
The prevalence of metabolic disorders such as overweight, obesity and type 2 diabetes (T2D)
has rapidly increased worldwide during the last decades, and physical activity has preventive
as well as therapeutic benefits for these conditions. Increasing evidence suggests that
dysregulations in lipid influx, storage and/or triacylglycerol (TAG) lipolysis have significant
impact on insulin sensitivity and glucose homeostasis in skeletal muscle. Furthermore, it has
been suggested that the insulin resistance in subjects that are overweight/obese and/or have
T2D is associated with lipid accumulation in their skeletal muscles. Much of the studies that
have been performed have been aimed towards the possibility of increasing lipid utilization
by exercise or pharmacological activation to avoid ectopic lipid accumulation in skeletal
muscle. The nuclear receptor peroxisome proliferator-activated receptor delta (PPAR) has
been shown to be an important regulator of skeletal muscle lipid metabolism. This thesis
aimed to study regulation of energy metabolism in cultured human skeletal muscle cells
isolated from biopsies from subjects with different metabolic profile and training status, and
we also studied effects of an in vivo exercise intervention on in vitro energy metabolism in
the cells. Plasma lactate concentrations increase rapidly during exercise, and was initially
thought of as a waste product; however, recently lactate was found to be a useable energy
source in skeletal muscle. Therefore, we aimed to study lactate metabolism in cultured human
myotubes at rest and to see if acute and chronic lactate exposure affected metabolism of
glucose and oleic acid (OA). The lipid droplet (LD)-associated protein perilipin 2 (PLIN2) is
one of several PPAR target genes, and to study the functional role of PLIN2 and LDs on
energy metabolism in skeletal muscle we also examined myotubes established from Plin2+/+
and Plin2-/-
mice.
The 12-week training intervention, consisting of combined endurance and strength training,
improved endurance, strength and insulin sensitivity in vivo, and reduced the participants’
body weight. Biopsy-derived cultured myotubes from these participants before and after the
exercise intervention showed exercise-induced increase in total cellular OA uptake, oxidation
and lipid accumulation, as well as increased fractional glucose oxidation (glucose oxidation
relative to glucose uptake). Most of these exercise-induced increases were significant in the
overweight group, whereas no changes in OA or glucose metabolism were observed in
myotubes from the normal weight subjects. On the other hand, when studying energy
metabolism in individuals with different inherent training status we observed higher
7
carbohydrate and fat oxidation in vivo in trained and intermediary trained subjects compared
to sedentary untrained subjects. Fiber type distribution did not differ between groups. In
myotubes established from the trained compared to untrained subjects we observed higher
fractional glucose oxidation, and those myotubes were also more sensitive towards the
suppressive action of acutely added OA to the cells. Furthermore, myotubes from trained
subjects had lower fatty acid (FA) accumulation, lower incorporation of OA into total lipids,
TAG, diacylglycerol and cholesteryl ester, higher TAG-related lipolysis and re-esterification,
and also higher FA complete oxidation (CO2) and β-oxidation compared to myotubes from
untrained subjects. When studying lactate metabolism in myotubes established from lean
healthy donors we observed that the cells expressed both of the monocarboxylate transporters,
MCT1 and MCT4, and we observed that lactic acid was a usable substrate for both glycogen
synthesis and incorporation into lipids. Acute addition of lactic acid inhibited glucose and OA
oxidation, whereas OA uptake increased. Pretreatment with lactic acid for 24 h did not affect
glucose or OA metabolism; however, when increasing the exposure time by replacing
glucose with lactic acid in the cell culture media during the whole proliferation and
differentiation period, glucose uptake and oxidation as well as OA oxidation were increased.
Ablation of Plin2 resulted in myotubes with reduced number of LDs, reduced accumulation
of TAG and higher lipolysis. Furthermore, ablation of Plin2 resulted in a metabolic shift in
energy metabolism from utilization of glucose towards FAs. Despite increased oxidative
capacity for FAs, the exercise intervention in vivo, high training status and ablation of Plin2
did not have any impact on insulin-stimulated responses.
The results presented in this thesis shows that exercise is able to induce changes in human
myotubes in vivo that are discernible in vitro and that cultured myotubes retain some the
phenotypic traits of their donors. Ablation of Plin2 shifted the cells from glucose to lipid
metabolism. Furthermore, the results suggest that prolonged exposure to lactate affect
metabolism of glucose and FAs. Also, for the first time we show that lactic acid is a usable
substrate for glycogen synthesis and it can be stored as intracellular lipids in myotubes. Thus,
lactate may be an important regulator of energy metabolism in human myotubes.
8
INTRODUCTION
Energy metabolism in skeletal muscle
Skeletal muscle constitutes about 40% of the body weight in non-obese, adult individuals. It
is the largest insulin-sensitive organ, accounting for more than 80% of insulin-stimulated
glucose disposal. Thus, skeletal muscle is quantitatively the most important site with regards
to insulin resistance [1-3]. Furthermore, skeletal muscle is the largest storage organ for
glycogen, having about 4-fold higher capacity than the liver [4]. At rest, skeletal muscle
accounts for approximately 30% of the resting metabolic rate [5]. During maximal exercise
this can be increased by up to 20-fold. Skeletal muscle is therefore the main contributor to
exercise-induced changes in whole-body energy metabolism [6]. The two main fuel sources
for skeletal muscle are carbohydrates and fatty acids (FAs) [7]. Lipid stores are very large,
and potentially inexhaustible. Carbohydrate stores are on the other hand limited, comprising
400-500 g of glycogen in skeletal muscle, 60-100 g of glycogen in the liver and 4-5 g of
glucose circulating in the blood in the resting situation [8]. With regards to lipid metabolism,
skeletal muscle is also the dominating organ [9, 10]; FA oxidation is the main metabolic
activity of skeletal muscle during fasting [9, 11]. As a consequence, factors regulating
skeletal muscle FA oxidation and mitochondrial function capacity will affect whole-body
energy homeostasis. Therefore, skeletal muscle is of particular interest in metabolic diseases
such as obesity and type 2 diabetes (T2D) due to the critical role that skeletal muscle plays in
glycemic control and metabolic homeostasis.
In skeletal muscle, glucose may be stored as glycogen, be oxidized to produce energy as
adenosine triphosphate (ATP) or act as a precursor for lipid synthesis. During rest, glucose
uptake across the plasma membrane is considered the rate-limiting step for glucose utilization
[12]. A family of transmembrane transport proteins named glucose transporters (GLUTs) is
responsible for this step. In human skeletal muscle cells the majority of the glucose uptake is
mediated by GLUT1 and GLUT4 [13-16]. GLUT1 appears to be the main facilitator of basal
glucose uptake [17], whereas GLUT4 is translocated during insulin-stimulation or contraction
from intracellular vesicles to the cell surface to mediate glucose uptake through different
signaling pathways [18-21]. Some of the factors that has been proposed involved in
regulation of this GLUT4-translocation in skeletal muscle cells are the Rab-GTPase-
activating proteins TBC1 domain family member 1 (TBC1D1) [22] and TBC1 domain family
member 4 (TBC1D4, also known as Akt substrate of 160 kDa (AS160)) [23], Rab8A and
Rab13 [24]. Binding of insulin to its receptor leads to activation by phosphorylation of
9
insulin receptor substrate 1 (IRS1), phosphatidylinositol 3-kinase (PI3K) and protein kinase B
(PKB/Akt) [25]. Thus, PKB/Akt is a principal insulin-regulated signal transductor of
GLUT4-translocation to the cell membrane in response to insulin [25, 26]. Once inside the
cell glucose is phosphorylated to glucose-6-phosphate (G-6-P) by hexokinase (HK) and goes
into glycolysis, generating pyruvate, ATP and nicotinamide adenine dinucleotide (NADH)
(Figure 1). Alternatively, G-6-P can be converted to glycogen by glycogen synthase (GS)
and stored [27]. However, skeletal muscle has as previously mentioned a limited ability to
store glycogen, and in this case or in the case of excessive energy supply most excess glucose
is converted to lipids through lipogenesis [28]. De novo lipogenesis does occur in skeletal
muscle, however to a low extent [29]. Pyruvate, either from plasma glucose or stored
glycogen, can enter mitochondrial oxidation via decarboxylation to acetyl-CoA mediated by
the pyruvate dehydrogenase complex (PDC) [30]. PDC is positioned in such a way that it
plays a central role in regulation of glucose metabolism as well as fuel selection in skeletal
muscle, and it is a crucial regulator of ATP levels and thus maintaining the cells’ energy
balance [31]. In skeletal muscle, pyruvate dehydrogenase kinase (PDK) 4 inhibits the activity
of PDC through phosphorylation. Thus, increased PDK4 levels are associated with reduced
PDC activity and thus reduced glucose oxidation [32].
FAs are delivered to skeletal muscle as free fatty acids (FFAs) bound to albumin, or derived
from triacylglycerol (TAG) in chylomicrons or very low-density lipoproteins (VLDLs) in
plasma, where the FAs are liberated by lipoprotein lipase (LPL) before they are taken up by
the cells [33]. FFAs enter the skeletal muscle cells through passive diffusion over the plasma
membrane or via transport proteins in the plasma membrane (Figure 1). The major transport
proteins regulating skeletal muscle FA uptake are fatty acid translocase (FAT/CD36), plasma
membrane-associated fatty acid-binding protein (FABPpm) and a family of fatty acid
transport proteins (FATP1-6) [34, 35], where FAT/CD36 and FATP4 are considered the
quantitatively most important transport proteins in skeletal muscle [36, 37]. Once inside the
cells, FAs are reversibly bound to the cytoplasmic FABP (FABPc), which protects against
lipotoxic accumulation of FFAs and shuttles FAs throughout the cellular compartments [38].
Mediated by acyl-CoA synthetase (ACSL), FAs are activated to FA-CoA (as acyl-CoA) [39].
Acyl-CoA-binding protein (ACBP) acts as an intracellular carrier of FA-CoA. Further, FA-
CoA can be oxidized in mitochondria for energy production as ATP, esterified to
monoacylglycerol and diacylglycerol (MAG and DAG, respectively), stored as TAG in lipid
droplets (LDs – discussed in more detail under “Dynamics of skeletal muscle lipid pools”,
10
pp. 12-13), incorporated into phospholipids (PLs) for use in cellular membranes, or
metabolized to lipid second messengers [40]. Yet, the FAs are mainly distributed between
mitochondrial oxidation, TAG synthesis and LD storage [35]. Conversion of FA-CoA to
MAG is catalyzed by monoacylglycerol acyltransferase (MGAT) and conversion of DAG to
TAG is catalyzed by diacylglycerol acyltransferase (DGAT) 1 and/or 2 [41, 42]. The fate of
the FAs is influenced by the concentration of the incoming FAs, what type of FAs it is, fiber
type of the muscle, energy requirements of the muscle, and the hormonal ambience [38].
After mitochondrial transport FA-CoA can be oxidized as acyl-L-carnitine by carnitine
palmitoyltransferase (CPT) 1 and 2, located on the outer and inner mitochondrial membrane,
respectively [43]. FAT/CD36 is also found in the mitochondrial membrane, and it has been
suggested that it works in cooperation with CPT1 [44, 45]. Once inside the mitochondrial
matrix FA-CoA is metabolized to acetyl-CoA through -oxidation. Thereafter, acetyl-CoA
from both -oxidation and glycolysis enters the tricarboxylic acid (TCA) cycle (Figure 1).
Previously, regulation of FA oxidation has been considered a trait of transport of FAs across
the mitochondrial membranes, especially by reduced malonyl-CoA inhibition of CPT1
derived from acetyl-CoA from the glycolytic pathways catalyzed by acetyl-CoA carboxylase
(ACC) 2 in oxidative tissues [43]. However, recent work has challenged this perception,
suggesting that the regulation of FA oxidation in skeletal muscle is a much more complicated
process, involving multiple regulatory sites such as FA transport across the cell membrane,
binding and transport of FAs in the cytoplasm, LD formation and degradation, FA transport
across the mitochondrial membrane, and potential regulations within the β-oxidation pathway,
TCA cycle and electron transport chain [46-48]. Malonyl-CoA decarboxylase (MCD)
catalyzes conversion of malonyl-CoA to acetyl-CoA [49]. Malonyl-CoA can be converted to
FAs by the action of FA synthase (FAS) [50] and FAs can be further elongated and
desaturated by elongases and stearoyl-CoA desaturases (SCDs), respectively [51].
11
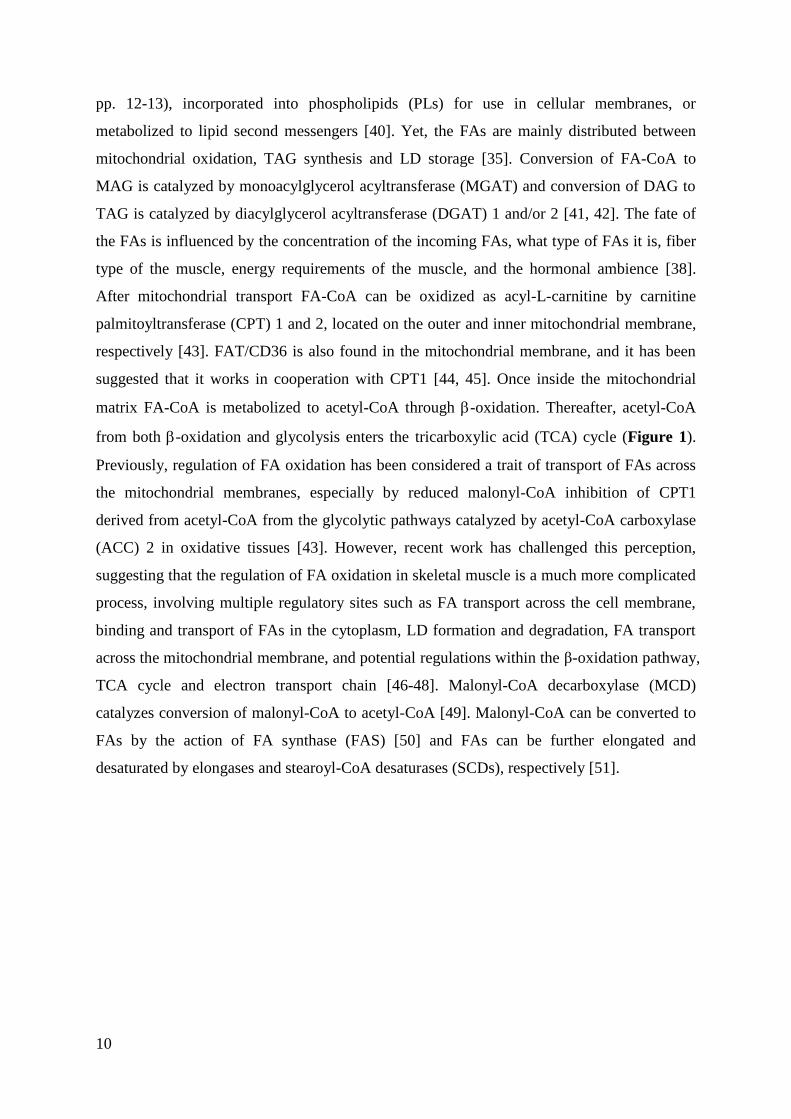
Figure 1. Energy metabolism in skeletal muscle. Glucose is transported into cells by glucose
transporters (GLUT) and is stored as glycogen or utilized through glycolysis to yield pyruvate.
GLUT4 is translocated from intracellular vesicles to the cell surface through activation of the insulin
pathway. Lactate is taken up and extruded by the monocarboxylate transporters MCT1 and MCT4,
respectively. Once inside the cell, lactate dehydrogenases (LDHs) catalyze the interconversion of
pyruvate and NADH to lactate and NAD+; LDH1 and LDH5 are the two isoforms catalyzing the
conversions of lactate to pyruvate and pyruvate to lactate, respectively. Uptake of fatty acids (FAs) is
facilitated by different transport proteins (FAT, FATP and FABPpm). Intracellular FAs are bound to
cytoplasmic FA binding proteins (FABPc) and activated to FA-CoA by acyl-CoA synthetase (ACSL).
Acyl-CoA-binding protein (ACBP) acts as an intracellular carrier of FA-CoA. Under conditions of
excess energy supply FA-CoAs may be incorporated into complex lipids as diacylglycerol (DAG),
triacylglycerol (TAG) and phospholipids (PL), and assembled in lipid droplets (LDs) for storage via
the action of monoacylglycerol acyltransferase (MGAT) and diacylglycerol acyltransferase (DGAT),
respectively. Upon energy demand, TAG, DAG and monoacylglycerol (MAG) are hydrolyzed by
adipose triglyceride lipase (ATGL), hormone-sensitive lipase (HSL) and monoacylglycerol lipase
(MGL) to FAs. FA-CoAs from both exogenous and endogenous derived FAs are used as fuel and
transported into mitochondria as acyl-L-carnitine via carnitine palmitoyltransferase (CPT) 1 and 2,
and thereafter metabolized through β-oxidation, yielding acetyl-CoA which enters the tricarboxylic
acid (TCA) cycle. Pyruvate, either from plasma glucose, lactate or stored glycogen, can enter the
mitochondria via decarboxylation to acetyl-CoA through the action of pyruvate dehydrogenase
complex (PDC). Citrate that escapes from the TCA cycle can be converted to acetyl-CoA in the
cytosol by ATP citrate lyase (ACL), and thereafter to malonyl-CoA by acetyl-CoA carboxylase
(ACC). Malonyl-CoA decarboxylase (MCD) catalyzes the reverse reaction and converts malonyl-
CoA to acetyl-CoA. Malonyl-CoA can be converted to FAs by the action of FA synthase (FAS) and
FAs can be further elongated and desaturated by elongases and stearoyl-CoA desaturases (SCD),
respectively. Malonyl-CoA is a potent inhibitor of CPT1, and can therefore inhibit entry and oxidation
of FAs in the mitochondria. FAs are able to suppress glucose oxidation through inhibition of PDC by
pyruvate dehydrogenase kinase 4 (PDK4) and by acetyl-CoA, as well as inhibition of glycolytic
enzymes by cytosolic citrate.
12
Skeletal muscle is the major site of lactate production and removal in the body [52]. The
lactate G-protein-coupled receptor 81 (GPR81) is mainly expressed in adipocytes [53-55], but
it has also been found in skeletal muscle, liver and kidney [56] as well as in the brain [57].
Lactate transport is mediated by proton-linked monocarboxylate transporters (MCTs), where
MCT1 and MCT4 are the most important and well-described isoforms in skeletal muscle [58].
MCT1 has predominantly been found in oxidative muscle, whereas MCT4 does not appear to
correlate with fiber type [58-60]. It has been observed that MCT1 has higher affinity for
lactate than MCT4, and is therefore thought to be most central for lactate uptake, whereas
MCT4 is considered most central for lactate removal [61] (Figure 1). The molecular
mechanisms involved in MCT regulation are still unclear, but both transcriptional and post-
transcriptional mechanisms are involved. Lactate dehydrogenases (LDHs) are responsible for
the conversion of pyruvate and NADH to lactate and NAD+ [62]. The conversion of pyruvate
into lactate is a necessary step to maintain high glycolytic flux in cells [63]. The LDH
enzymes are active as homo- or heterotetramers composed of muscle (M) and heart (H)
protein subunits, which are encoded by distinct genes: LDHA and LDHB, respectively.
Therefore, the different possible combinations allow the existence of five isoforms of LDH:
LDH1-LDH5 [63]. LDH enzymes with high M-subunit content, i.e. LDH5 in particular
(containing four M-subunits), are abundant in glycolytic skeletal muscles, where they reduce
pyruvate to lactate [64] (Figure 1). LDH enzymes with high H-subunit content, i.e. LDH1 in
particular (containing four H-subunits), are mainly found in aerobic tissues, where they
convert lactate into pyruvate [64] (Figure 1).
Dynamics of skeletal muscle lipid pools
Approximately 50-60% of the FAs taken up by the skeletal muscle cells are stored as TAG in
the LDs [65], and is then usually referred to as intramyocellular lipids (IMCL) [66] or
intramyocellular triacylglycerol (IMTG) [65]. In addition to functioning as a fuel source for
mitochondria, LDs are dynamic cellular organelles involved in signaling and lipid shuttling.
Apart from TAG, LDs also contain DAG, cholesteryl ester (CE) and free cholesterol, and
they are surrounded by a monolayer of PLs and proteins [67, 68]. These LD-binding proteins
are called perilipins (PLINs), and they are thus important in LD biogenesis [69, 70]. It has
been characterized five PLINs in human skeletal muscle, with different tissue expression
patterns [71]. PLINs also differ in size, affinity to the LDs, stability when not bound to the
LDs, and transcriptional regulation. As the PLINs are positioned at the LD surface they
13
manage access of lipases to the lipids within the LD core. Thus, they regulate LD size and
turnover [72]. It has been shown that more than half of the surface area of LDs in human
muscle biopsies is covered by PLIN2 [73], and this PLIN is proposed to protect LDs from
lipolysis [74]. Furthermore, PLIN2 content has been shown to be higher in oxidative type I
muscle fibers compared to glycolytic type II muscle fibers [73]. As LDs in oxidative muscle
often are close to mitochondria they maintain coupling of lipid storage with lipid
consumption as fuel, which appears to be important for efficient energy utilization [68].
Upon energy demand, e.g. during exercise, the enzymatic degradation of the esterified neutral
lipids in the LD core into single lipid species such as FAs or glycerol depends on active
recruitment of lipases to the LD surface. Adipose triglyceride lipase (ATGL) is considered to
be the first step in catabolism of TAG [75]. This generates DAG, which is further degraded
by hormone-sensitive lipase (HSL) [76]. The final step is degradation of MAG to glycerol
and FFA by monoacylglycerol lipase (MGL), thus providing FAs that can undergo
mitochondrial oxidation (Figure 1). Other potentially important proteins in the breakdown
regulation of IMTG are abhydrolase domain containing 5 (ABHD5, also known as
comparative gene identification-58, CGI-58) [32] and G0/G1 switch 2 (G0S2) [77], which are
coactivator and inhibitor of ATGL, respectively. ATGL and ABHD5 are strongly associated
during contraction-induced muscle lipolysis and work together with PLINs to regulate
lipolysis [78]. Activity of HSL is mostly regulated by phosphorylation, such as
phosphorylation on serine 660 (Ser660) [32].
Metabolic flexibility of skeletal muscle
As described previously, skeletal muscle uses both carbohydrates and FAs as fuel. During the
fed state, increased availability of plasma glucose stimulates glucose oxidation and FA
synthesis, whereas FA oxidation increases both during fasting and sustained exercise [79, 80],
but shifts from FA to glucose metabolism when exercise intensity increases [7, 10]. The
molecular mechanisms for this regulation are suggested to involve L-carnitine as an exercise-
induced increase in glycolysis enhances the production of acetyl-CoA and eventually acetyl-
L-carnitine. This results in reduced availability of free L-carnitine, which is a substrate of
CPT1. As a consequence, FA entry into the mitochondria for β-oxidation is reduced [7, 10].
Substrate selection during exercise appears to also be affected by levels of malonyl-CoA,
although this factor may be more important in resting skeletal muscle [10]. Furthermore,
14
activation of β-adrenergic pathways in skeletal muscle is an important event in the early
phases of exercise, leading to activation of protein kinase A (PKA), which in turn activates
HSL, resulting in increased lipolysis [81].
The ability to switch between substrates for fuel, depending on substrate availability, exercise
intensity and physiological conditions, represent an important feature of healthy skeletal
muscle and is called metabolic flexibility [82, 83]. The inhibition of glucose oxidation by
FAs, referred to as “Randle cycle” [84], is mediated by inhibition of several glycolytic steps.
PDK4, the dominant isoform in skeletal muscle, inhibits PDC by phosphorylation and
thereby switch fuel source from glucose to FAs [31] (Figure 1). Excess production of citrate
from enhanced FA oxidation escapes from mitochondria and inhibits the rate-limiting
enzyme of glycolysis, 6-phosphofructo-1-kinase, leading to an increase in G-6-P, which
eventually inhibits HK and leads to reduced glucose uptake and oxidation [46, 85]. The
opposite situation, where glucose suppresses FA oxidation, is usually referred to as “reverse
Randle cycle” [86]. Citrate that escapes from glucose oxidation is transported back to the
cytosol where it is converted to acetyl-CoA by ATP citrate lyase (ACL), which in turn is
converted to malonyl-CoA by ACC. As described above (under “Energy metabolism in
skeletal muscle”, pp. 8-12), malonyl-CoA inhibits CPT1 and thereby entry and oxidation of
FAs in mitochondria [86, 87] (Figure 1). Thus, citrate signals both fed (high concentrations
of glucose) and fasted (high concentrations of FAs) states. Loss of ability to easily switch
between glucose and lipid oxidation is termed metabolic inflexibility [83], and is associated
with reduced lipid oxidation and thereby promotes lipid accumulation in skeletal muscle [88],
which may interfere with insulin signaling and function (discussed in more detail under
“Insulin resistance, obesity and type 2 diabetes”, pp. 20-22). Insulin resistance, obesity
and T2D are linked to reduced lipid oxidation during fasting and impaired postprandial
switch from lipid to glucose oxidation [89], and this inflexibility has also been observed in
individuals with impaired glucose tolerance [90], suggesting that inflexibility plays a role in
the early development of T2D. In fact, it has been observed that cultured skeletal muscle cells
(myotubes) established from subjects with T2D, as well as myotubes established from obese,
have reduced capacity to oxidize FAs compared to myotubes from lean subjects [91-93].
Furthermore, the fact that metabolic flexibility of substrate oxidation is preserved in cells
when grown in culture suggests that metabolic switching is an intrinsic property of skeletal
muscle [94].
15
Metabolic flexibility of myotubes in vitro is referred to as suppressibility, adaptability and
substrate-regulated flexibility [94, 95]. Suppressibility is defined as the ability of cells to
suppress FA oxidation by acute addition of glucose, adaptability is defined as the capacity of
cells to increase FA oxidation upon increased FA availability [94], and substrate-regulated
flexibility is defined as the ability to increase FA oxidation when changing from a “fed” (high
glucose, low FA) to a “fasted” (high FA, no glucose) condition [95]. In vitro suppressibility
has been shown to be inversely correlated with insulin sensitivity and metabolic flexibility in
vivo, whereas adaptability has been found to be positively correlated with the same
parameters [94]. Nevertheless, metabolic inflexibility may be due to both intrinsic and
extrinsic (induced) factors, and the molecular mechanisms underlying metabolic inflexibility
remains to be established.
Skeletal muscle fiber types
Skeletal muscles are composed of different fiber types, and they are all structurally,
functionally and metabolically different. The different phenotypes are classified by
contractile speed, either slow- or fast-twitch, based on the “time-to-peak tension” or “twitch”
characteristics, and the histochemical staining for myofibrillar (myosin) ATPase, where the
slow-twitch phenotype is type 1 and the fast-twitch phenotype is type 2 (highest ATPase
activity). Human skeletal muscle fibers mainly express three isoforms of myosin heavy chain
(MHC): MHC, MHC2A and MHC2X (with respective genes MYH7, MYH2 and MYH1)
[96]. MHC-expressing fibers are the slow, fatigue resistant and oxidative type I muscle
fibers, whereas the MHC2A-expressing fibers are the fast oxidative type IIa muscle fibers,
and the MHC2X-expressing muscle fibers are the fast glycolytic type IIX fibers. The slow-
twitch type I fibers are associated with higher mitochondrial content and GLUT4 protein
expression compared to the fast-twitch type II fibers [97-99]. Furthermore, a composition
consisting of more type I fibers have been associated with increased insulin responsiveness
[100]. Due to differences in abundance of the oxygen transporting protein myoglobin, the
fiber types are different color-wise, where type I fibers are more red in appearance, type 2X
are white and 2A has an intermediate color. This is in turn related to mitochondrial density
and the relative contribution of oxidative metabolism in the respective fibers. Muscle
phenotype is highly influenced by exercise, and muscle cells can change their fiber type and
enzymatic properties according to altered functional demands (reviewed by e.g. Gundersen

16
[101]). However, the mechanisms involved in muscle fiber type switching are complex and
not known in detail, but transcription factors such as myocyte enhancer factor 2 (MEF2) [102]
and its target gene peroxisome proliferator-activated receptor gamma coactivator 1 alpha
(PPARGC1A) [103] have been shown to be involved in control of the slow fiber type
program (discussed in more detail under “Effects of exercise on energy metabolism in
skeletal muscle”, pp. 16-19). Further, after studies on myostatin null mice [104], the growth
factor myostatin has been suggested to be a regulator of the fiber type composition in skeletal
muscles by regulating gene expression of MEF2 and myogenic differentiation 1 (MYOD1).
Effects of exercise on energy metabolism in skeletal muscle
Skeletal muscles are characterized by their ability to adapt and remodel in response to
contractile activity [105], and it allows the muscles to more efficiently utilize substrates for
ATP production and thus become more resistant to fatigue [105, 106]. Energy metabolism,
mitochondrial function, intracellular signaling, gene transcription, as well as contractile
proteins are all affected by contractile activity. Exercise-induced adaptations in energy
metabolism are reflected by changes in both mitochondrial content (both in size and number)
and function [107, 108] and improved oxidative capacity [105, 109-113]. Furthermore, an
acute bout of exercise improves glucose homeostasis by increasing skeletal muscle glucose
uptake, whereas regular exercise induces changes in expression of metabolic genes such as
those involved in mitochondrial activity, muscle fiber type characteristics and GLUT4
expression at protein levels [112]. The functional consequences of these alterations depends
on intensity, duration, frequency, and mode of exercise [105].
Glucose metabolism in skeletal muscle is strongly affected by contractile activity. Trained
muscle fibers import and use more glucose than untrained fibers [114, 115]. It has been
shown that contractile activity increases translocation of GLUT4 and glucose uptake [116],
but appears to involve a different signaling pathway than that activated by insulin (Figure 2).
The mechanism is unclear, but it is known that contraction activates AMP-activated protein
kinase (AMPK), which in turn activates glucose uptake. However, it has also been shown that
contractions could stimulate glucose uptake even in AMPK knockdown mice [117].
Furthermore, there have been indications that TBC1D1 and TBC1D4 might be regulated by
contractile activity through activation by AMPK, but not by PKB/Akt [22, 23]. The
Ca2+
/calmodulin-dependent kinase pathway is probably also involved in this process, and a
17
link between exercise-induced glucose uptake and muscle glycogen content has also been
proposed [118]. Furthermore, it has been suggested that Ras-related C3 botulinum toxin
substrate 1 (Rac1), a small GTPase and member of the Rho family, is a novel regulator of
contraction-induced glucose uptake in skeletal muscle [119]. Exercise-stimulated glucose
uptake by muscle occurs independently of insulin signal transduction [120-122]. In addition
to exerting acute effects on glucose uptake, exercise promotes a short-term increase in insulin
sensitivity after cessation of exercise [123-125].
At rest, about 70% of the FFAs released into the circulation during lipolysis are esterified
back to triacylglycerol instead of being oxidized as measured on whole body metabolism
using stable isotopes [126]. However, during exercise these FAs may be used to supply
energy to skeletal muscle [127]. Both lipid synthesis and oxidation have been shown to be
increased in exercising skeletal muscle [10, 128-131], which takes more of their required
energy from lipids and less from carbohydrates during submaximal work [87, 113, 131]. This
is accounted for by an increase in IMTG utilization in trained muscle [132, 133]. In skeletal
muscle it has previously been accepted that HSL is the principal enzyme responsible for
lipolysis of IMTG during exercise [134, 135], but recently ATGL has emerged as the major
regulator in lipolysis of IMTG during contractile activity [78, 136]. How FA oxidation is
regulated by contractile activity is not clear. Despite observed exercise-induced increase in
FA uptake [137, 138], studies examining effects of exercise on the FA transport proteins
(FAT/CD36 and FABPpm) have given conflicting results, probably due to differences in
exercise intensity and duration in the performed studies [139]. Nevertheless, rates of FA
oxidation may increase by 3- to 10-fold from resting values during exercise at mild to
moderate intensity (25-65% of maximal oxygen uptake (VO2max)) [7, 140]. As FA oxidation
in skeletal muscle is strongly regulated by the mitochondrial FA transport capacity through
translocation of FAT/CD36 to the plasma membrane [139], CPT1 activity and mitochondrial
oxidative capacity, these factors are often used as measures for exercise-induced changes.
Furthermore, several of the important enzymes regulating mitochondrial activity have been
shown to be upregulated after endurance training, including the β-oxidative enzymes short-
chain, medium-chain and very long-chain acyl-CoA dehydrogenases and the TCA cycle
enzyme citrate synthase [130, 141]. Similarly, exercise-induced increase in FA oxidation has
been reported to be accompanied by increased expression and activity of CPT1 [142, 143], as
well as decreased malonyl-CoA, which as previously stated is a potent inhibitor of CPT1
[127, 144, 145]. In fact, reduction of basal malonyl-CoA levels has been proposed to be one
18
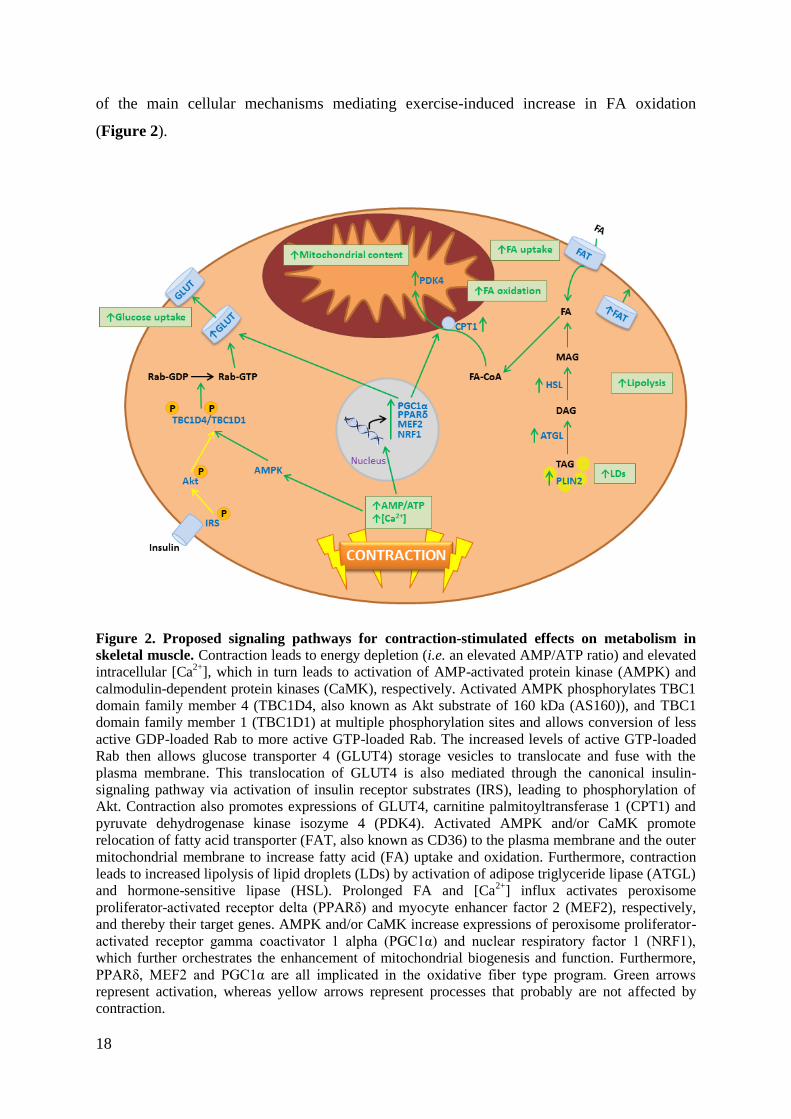
of the main cellular mechanisms mediating exercise-induced increase in FA oxidation
(Figure 2).
Figure 2. Proposed signaling pathways for contraction-stimulated effects on metabolism in
skeletal muscle. Contraction leads to energy depletion (i.e. an elevated AMP/ATP ratio) and elevated
intracellular [Ca2+
], which in turn leads to activation of AMP-activated protein kinase (AMPK) and
calmodulin-dependent protein kinases (CaMK), respectively. Activated AMPK phosphorylates TBC1
domain family member 4 (TBC1D4, also known as Akt substrate of 160 kDa (AS160)), and TBC1
domain family member 1 (TBC1D1) at multiple phosphorylation sites and allows conversion of less
active GDP-loaded Rab to more active GTP-loaded Rab. The increased levels of active GTP-loaded
Rab then allows glucose transporter 4 (GLUT4) storage vesicles to translocate and fuse with the
plasma membrane. This translocation of GLUT4 is also mediated through the canonical insulin-
signaling pathway via activation of insulin receptor substrates (IRS), leading to phosphorylation of
Akt. Contraction also promotes expressions of GLUT4, carnitine palmitoyltransferase 1 (CPT1) and
pyruvate dehydrogenase kinase isozyme 4 (PDK4). Activated AMPK and/or CaMK promote
relocation of fatty acid transporter (FAT, also known as CD36) to the plasma membrane and the outer
mitochondrial membrane to increase fatty acid (FA) uptake and oxidation. Furthermore, contraction
leads to increased lipolysis of lipid droplets (LDs) by activation of adipose triglyceride lipase (ATGL)
and hormone-sensitive lipase (HSL). Prolonged FA and [Ca2+
] influx activates peroxisome
proliferator-activated receptor delta (PPARδ) and myocyte enhancer factor 2 (MEF2), respectively,
and thereby their target genes. AMPK and/or CaMK increase expressions of peroxisome proliferator-
activated receptor gamma coactivator 1 alpha (PGC1α) and nuclear respiratory factor 1 (NRF1),
which further orchestrates the enhancement of mitochondrial biogenesis and function. Furthermore,
PPARδ, MEF2 and PGC1α are all implicated in the oxidative fiber type program. Green arrows
represent activation, whereas yellow arrows represent processes that probably are not affected by
contraction.
19
Plasma lactate concentrations increase rapidly during exercise. Originally lactate was
considered a waste product that was transported to the liver, kidneys or other organs for
clearance [146]. However, it is now generally accepted that lactate is also taken up by the
muscles and oxidized [147]; in fact, the contribution of muscles to total body lactate
clearance is considerable during exercise [147]. For several types of exercise, and especially
sustained submaximal exercise, lactate is transiently released into the bloodstream before a
shift occurs, and active muscle starts to use lactate as an energy source instead of continuing
to produce more [148]. It has been observed that this situation mainly occurs in type I and
type IIa muscle fibers, where lactate predominantly is oxidized, whereas in type IIb fibers
lactate is mainly removed through glyconeogenesis [148]. When the blood lactate
concentration is above the resting value it makes an ideal concentration gradient for lactate
uptake [149]. However, other factors such as muscle metabolic rate, optimal levels of
intracellular and extracellular pH, adequate blood flow, and training status also determine the
rate of lactate consumption by working muscles [150].
Skeletal muscles’ plasticity in response to exercise requires changes in the expression pattern
of muscle-specific genes, and thus extends beyond the described metabolic adaptations.
Among the other reported responses to exercise is increased proportion of oxidative muscle
fibers after endurance exercise [151-153]. The nuclear receptor PPARδ and its coactivator
PGC1α appears to partially mediate some of the positive adaptations to exercise [154-161].
Furthermore, PPARα, PPARδ, PGC1α, and some of the known PPAR target genes, such as
PDK2 and PDK4, increase in the post-exercise period [162]. Therefore, these transcription
factors and the pathways they are involved in may represent some of the molecular substrates
for the effects of exercise in skeletal muscle.
All taken together, exercise leads to extensive adaptations in skeletal muscle, and regular
exercise plays a central role in prevention and also treatment of metabolic disorders such as
obesity and T2D by improvements in insulin sensitivity (discussed in more detail under
“Insulin resistance, obesity and type 2 diabetes”, pp. 20-22). A summary of the proposed
signaling pathways for contraction-stimulated effects on energy metabolism in skeletal
muscle are illustrated in Figure 2 above.
20
Insulin resistance, obesity and type 2 diabetes
Insulin resistance develops when the cells of the body becomes less sensitive and eventually
resistant towards insulin. When the cells no longer are able to absorb adequate amounts of
glucose, manifested as a decrease in glucose uptake and muscle glycogen synthesis [163,
164], it leads to hyperglycemia, affecting the β-cells to produce more insulin which in turn
leads to hyperinsulinemia. When the β-cells no longer are able to produce enough insulin,
hyperglycemia and eventually T2D will become a fact.
One of the biggest risk factors for developing insulin resistance is being overweight or obese,
and it has been shown that both visceral adiposity [165, 166] and subcutaneous adiposity
[166] are correlates of insulin resistance; however, visceral adiposity is more strongly
associated with insulin resistance than subcutaneous adiposity [166]. This association is
thought to be explained by the fact that abdominal fat is resistant towards the anti-lipolytic
effect of insulin, leading to exaggerated release of FAs and increased levels of plasma FFAs
[167], causing lipotoxicity and further reduction of insulin sensitivity, which in turn increases
gluconeogenesis in the liver, inhibits insulin-mediated glucose uptake in skeletal muscle and
elevates serum glucose concentrations. Obesity may also in itself lead to insulin resistance if
the adipocytes reaches a certain size and no longer are able to store more fat, leading to
ectopic lipid accumulation in liver and skeletal muscle [163, 168, 169]. Furthermore, visceral
adipose tissue is prone to inflammation and inflammatory cytokine production, contributing
to a chronic low-grade inflammation [170]. It has become more evident that adipose tissue
secretes several bioactive peptides known as adipokines, and it has been suggested that these
play an important role in the crosstalk between adipose tissue and skeletal muscle [168, 171-
173]. High rates of TAG degradation (lipolysis) and release of FFAs into the circulation are
typical features of a dysfunctional adipose tissue [174]. Thus, imbalance in the secretion of
the pro- and anti-inflammatory adipokines caused by increased TAG accumulation might
contribute to induction and/or promotion of insulin resistance in skeletal muscle [171, 175,
176]. Furthermore, visceral adipose tissue is also associated with intrahepatic TAG content,
and it has been reported that intrahepatic TAG content might be an even better predictor of
metabolic disorders than visceral adiposity [177].
Overweight and obesity are defined either by body mass index (BMI), waist circumference or
waist-to-hip ratio (WHR). The World Health Organization (WHO) has classified BMI
between 18.50 kg/m2 and 24.99 kg/m
2 as normal body weight, BMI ≥ 25 kg/m
2 as overweight
and BMI ≥ 30 kg/m2 as obese [178]. However, several studies indicate that measurement of
21
waist circumference or waist-to-hip ratio, which reflect visceral (abdominal) fat, may be more
suitable for classification of overweight and obesity [179, 180]. For Caucasian European
females/males, a waist circumference and WHR are considered above normal if they are
higher than 80/94 cm and 0.85/0.90, respectively [181, 182]. WHO reported in 2008 that 1.4
billion adults were overweight, and of these 500 million were obese. In most cases,
overweight and obesity is caused by an imbalance between energy intake and energy
expenditure, although genetics and chronic stress also are known contributors [183-185].
More recently evidence for the influence of gut microbiota on metabolic processes and
contribution to low-grade inflammation and obesity has emerged [186-189].
Overweight and obesity are strongly associated with insulin resistance and T2D [190, 191]; in
fact the majority of subjects diagnosed with T2D are classified as overweight or obese [192].
It is established that a family history of T2D markedly increases the risk of developing the
disease, particularly in the first-degree relatives [193-195]. However, genome-wide
association studies have revealed that only 10% of the estimated heritability of T2D can be
explained [196]. Other lifestyle factors than body weight are thus involved in the
development of T2D, including physical inactivity and consumption of a high-fat diet [197-
199]. However, overweight and obesity is preventable, and T2D can be delayed, prevented
and treated by lifestyle interventions such as healthy diet, regular physical activity and weight
loss, as well as by pharmacological treatment [197, 198, 200-202]. Still, the prevalence of
T2D has rapidly increased worldwide during the last decades. In 2015 it was estimated that
415 million people had diabetes, of which most had T2D. By the year of 2040 the number of
people with diabetes is projected to reach 642 million worldwide [203].
The hallmarks of T2D on cellular level are insulin resistance in liver, adipose tissue and
skeletal muscle, increased lipolysis from adipose tissue, increased glucose production in liver,
and increased pancreatic β-cell dysfunction [196]. In skeletal muscle of diabetics,
dysfunctional insulin-stimulated GLUT4 translocation has been associated with increased
lipid accumulation or disruptions in FA metabolism, which may include altered FA uptake,
TAG synthesis and breakdown (lipolysis), FA oxidation, or any combination of these [204-
208]. It has been shown that IMTG content and insulin sensitivity are inversely correlated
[205], but not for endurance-trained athletes [10, 66, 209, 210]. Exercise is known to increase
accumulation of IMTG, but also to improve insulin sensitivity, whereas increased IMTG
content is strongly associated with insulin resistance for individuals with obesity and/or T2D.
This phenomenon has been known as “the athlete’s paradox” [66, 211, 212]. Furthermore, it
22
has been shown that a decrease in IMTG after diet-induced weight loss correlates with
improved insulin sensitivity [213, 214]. Recently it has become more evident that
accumulation of other intracellular lipid intermediates than TAG, like long-chain acyl-CoA,
DAGs and ceramides, are more harmful, having a negative effect on the activation of the
insulin-signaling cascade in skeletal muscle cells [215-217]. Ceramides may inhibit
serine/threonine (Ser/Thr) phosphorylation of PKB/Akt [218], and skeletal muscle ceramide
levels have been reported to be increased in obese [219], insulin resistant [220] and insulin
resistant obese [151] individuals. Activation of protein kinase C (PKC) may disturb GLUT4
translocation by Ser phosphorylation of IRS1 [88, 221]. Furthermore, it has been shown that
lipid-induced insulin resistance is associated with increased intramuscular DAG content [207],
and Bergman et al. showed that membrane, but not cytosolic DAG was associated with PKCε
activation [222]. As mitochondria are the main cellular site devoted to FA oxidation it has
been proposed that impaired mitochondrial function leads to accumulation of IMTG and lipid
intermediates in skeletal muscle [195]. However, this has been argued as the IMTG
accumulation may precede the development of mitochondrial dysfunction and/or that insulin
resistance may arise when mitochondrial function is unaffected or even improved [223, 224].
It has been shown that PLIN2 gene expression is lower in insulin resistant obese subjects
compared to obese controls [220], whereas higher PLIN2 protein content has been found in
skeletal muscle of insulin resistant subjects that have undergone weight loss or used
pharmacological treatment to increase muscle insulin sensitivity [225]. This suggests that
PLIN2 might play a role in decreasing intramuscular lipotoxicity by promoting lipid storage.
Moreover, improvements in insulin sensitivity following endurance [226] or resistance
training [227] are linked to an increase in content of PLIN2 and PLIN5, whereas similar
muscular PLIN2 protein content has been observed between obese non-diabetics and obese
diabetics and it correlated negatively with insulin-stimulated glucose uptake [228]. Overall
this indicates that a high expression level of LD-associated proteins might be preferable, and
further insight into how PLIN2 regulates LDs in skeletal muscle is necessary.
23
AIMS
The overall aim of the present thesis was to study regulation of glucose and lipid metabolism
in cultured skeletal muscle cells related to different metabolic status of the donors and
myotubes; myotubes from young sedentary vs. young trained subjects, myotubes from older
normal weight vs. older overweight subjects before and after 12 weeks of exercise, myotubes
from healthy subjects cultured with lactate, and myotubes from wild-type (WT) vs. Plin2
knockout (KO) mice. More specifically, the objectives of the different studies were:
1) Study the effects of 12 weeks extensive endurance and strength training in vivo on
energy metabolism in cultured human myotubes in vitro from sedentary normal
weight (BMI < 25 kg/m2) and sedentary overweight men (BMI ≥ 25 kg/m
2) in the age
of 40-62 years (paper I).
2) Investigate the effect of training status in vivo on glucose metabolism in myotubes
from sedentary untrained (VO2max < 45 ml/kg/min) and trained (VO2max > 60
ml/kg/min) subjects in the age of 21-38 years (paper II).
3) Explore fatty acid metabolism in myotubes established from trained (VO2max > 60
ml/kg/min) and sedentary untrained (VO2max < 45 ml/kg/min) younger subjects
(paper III).
4) Investigate lactate metabolism in cultured human myotubes and examine if lactate
exposure could affect metabolism of oleic acid and glucose (paper IV).
5) Study lipid storage capacity and turnover, as well as lipid and glucose metabolism and
muscle fiber type characteristics in myotubes from mice lacking Plin2 vs. WT mice
myotubes (paper IV).
24
SUMMARY OF PAPERS
Paper I: Exercise in vivo marks human myotubes in vitro: Training-induced increase in lipid
metabolism
The 12-week training intervention improved endurance, strength and insulin sensitivity in
vivo, and reduced the participants’ body weight and BMI. Biopsy-derived cultured human
myotubes after exercise showed increased total cellular oleic acid (OA) uptake (30%),
oxidation (46%) and lipid accumulation (34%), as well as increased fractional glucose
oxidation (14%) compared to cultures established prior to the exercise intervention. Most of
these exercise-induced changes were significant in the overweight group, whereas the normal
weight group showed no change in OA or glucose metabolism.
In conclusion, 12 weeks of combined endurance and strength training promoted lipid and
glucose metabolism in biopsy-derived cultured human myotubes, showing that training in
vivo are able to induce changes in human myotubes that are discernible in vitro.
The findings from the work in paper I are summarized in Table 1.
25
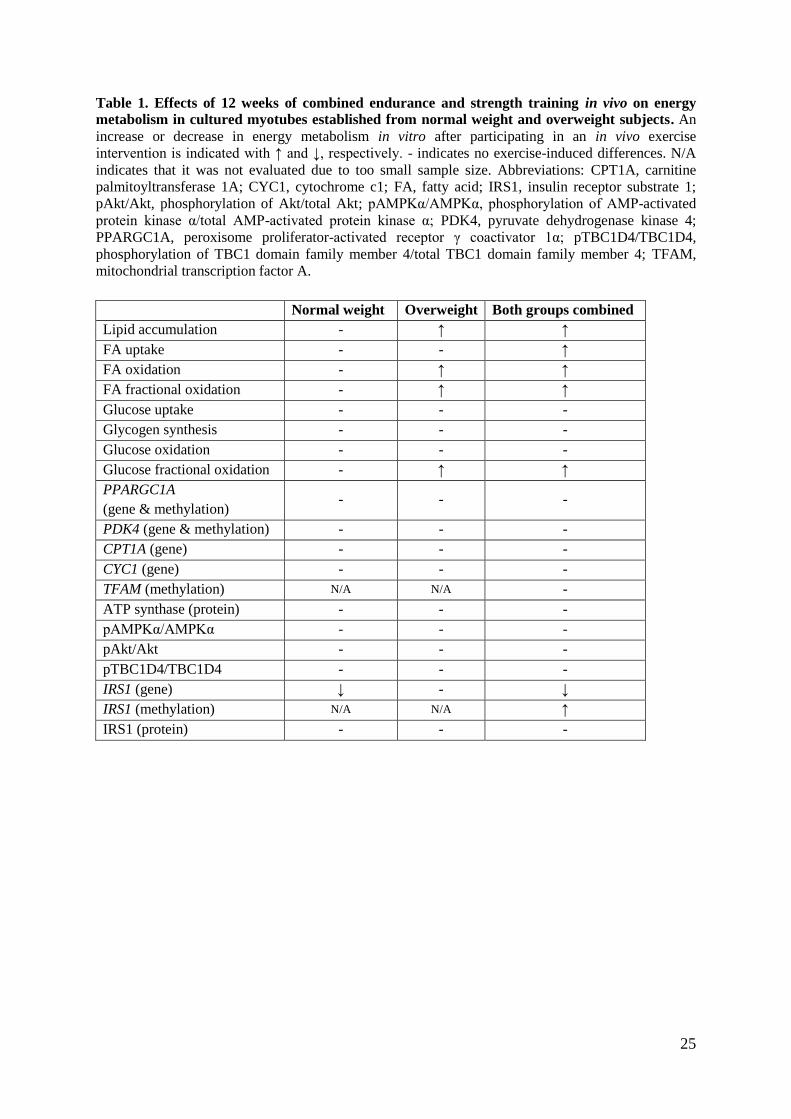
Table 1. Effects of 12 weeks of combined endurance and strength training in vivo on energy
metabolism in cultured myotubes established from normal weight and overweight subjects. An
increase or decrease in energy metabolism in vitro after participating in an in vivo exercise
intervention is indicated with ↑ and ↓, respectively. - indicates no exercise-induced differences. N/A
indicates that it was not evaluated due to too small sample size. Abbreviations: CPT1A, carnitine
palmitoyltransferase 1A; CYC1, cytochrome c1; FA, fatty acid; IRS1, insulin receptor substrate 1;
pAkt/Akt, phosphorylation of Akt/total Akt; pAMPKα/AMPKα, phosphorylation of AMP-activated
protein kinase α/total AMP-activated protein kinase α; PDK4, pyruvate dehydrogenase kinase 4;
PPARGC1A, peroxisome proliferator-activated receptor γ coactivator 1α; pTBC1D4/TBC1D4,
phosphorylation of TBC1 domain family member 4/total TBC1 domain family member 4; TFAM,
mitochondrial transcription factor A.
Normal weight Overweight Both groups combined
Lipid accumulation - ↑ ↑
FA uptake - - ↑
FA oxidation - ↑ ↑
FA fractional oxidation - ↑ ↑
Glucose uptake - - -
Glycogen synthesis - - -
Glucose oxidation - - -
Glucose fractional oxidation - ↑ ↑
PPARGC1A
(gene & methylation) - - -
PDK4 (gene & methylation) - - -
CPT1A (gene) - - -
CYC1 (gene) - - -
TFAM (methylation) N/A N/A -
ATP synthase (protein) - - -
pAMPKα/AMPKα - - -
pAkt/Akt - - -
pTBC1D4/TBC1D4 - - -
IRS1 (gene) ↓ - ↓
IRS1 (methylation) N/A N/A ↑
IRS1 (protein) - - -
26
Paper II: Glucose metabolism and metabolic flexibility in cultured skeletal muscle cells is
related to exercise status in young male subjects
Trained and intermediary trained subjects had higher maximal blood lactate levels than
untrained subjects after an incremental test, and skeletal muscle biopsies from the trained
group contained significantly more glycogen compared to biopsies from the intermediary
trained and untrained groups. Fiber type distribution in biopsies and myotubes was similar
between the groups. In cultured myotubes an increased glucose uptake was observed in cells
from trained subjects compared to cells from untrained. Fractional glucose oxidation was also
enhanced in trained myotubes, which were also more sensitive to the suppressive action of
acutely added OA to the cells.
In conclusion, differentiated skeletal muscle cells established from trained subjects with
increased capacity for energy production retained some of their phenotypes in vitro with
respect to enhanced glucose metabolism and metabolic flexibility.
Paper III: Higher fatty acid turnover and oxidation in cultured human skeletal muscle cells
from trained young male subjects.
Myotubes from trained subjects had lower FA accumulation, lower incorporation of OA into
total lipids, TAG, DAG, and CE, higher TAG-related lipolysis and re-esterification, and
higher FA complete oxidation and β-oxidation compared to myotubes from untrained
subjects. There were no significant differences in mRNA or protein expression between cells
from the two groups, but mRNA expression of CPT1B correlated positively with maximal fat
oxidation in vivo.
To conclude, myotubes established from trained subjects have increased FA turnover and
oxidation compared to myotubes from untrained subjects. Whether these properties in the
satellite cells are inherent from birth or acquired through lifestyle remains unknown.
The findings from the work in papers II and III are summarized in Table 2.
27
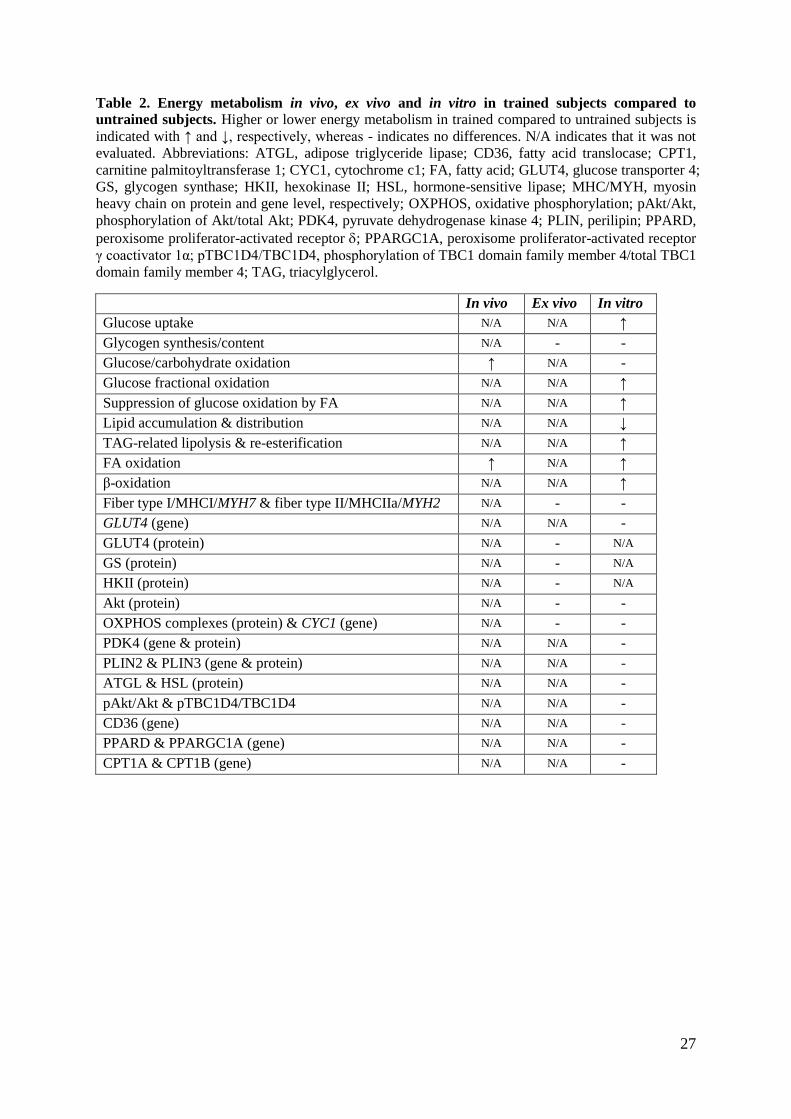
Table 2. Energy metabolism in vivo, ex vivo and in vitro in trained subjects compared to
untrained subjects. Higher or lower energy metabolism in trained compared to untrained subjects is
indicated with ↑ and ↓, respectively, whereas - indicates no differences. N/A indicates that it was not
evaluated. Abbreviations: ATGL, adipose triglyceride lipase; CD36, fatty acid translocase; CPT1,
carnitine palmitoyltransferase 1; CYC1, cytochrome c1; FA, fatty acid; GLUT4, glucose transporter 4;
GS, glycogen synthase; HKII, hexokinase II; HSL, hormone-sensitive lipase; MHC/MYH, myosin
heavy chain on protein and gene level, respectively; OXPHOS, oxidative phosphorylation; pAkt/Akt,
phosphorylation of Akt/total Akt; PDK4, pyruvate dehydrogenase kinase 4; PLIN, perilipin; PPARD,
peroxisome proliferator-activated receptor ; PPARGC1A, peroxisome proliferator-activated receptor
γ coactivator 1α; pTBC1D4/TBC1D4, phosphorylation of TBC1 domain family member 4/total TBC1
domain family member 4; TAG, triacylglycerol.
In vivo Ex vivo In vitro
Glucose uptake N/A N/A ↑
Glycogen synthesis/content N/A - -
Glucose/carbohydrate oxidation ↑ N/A -
Glucose fractional oxidation N/A N/A ↑
Suppression of glucose oxidation by FA N/A N/A ↑
Lipid accumulation & distribution N/A N/A ↓
TAG-related lipolysis & re-esterification N/A N/A ↑
FA oxidation ↑ N/A ↑
β-oxidation N/A N/A ↑
Fiber type I/MHCI/MYH7 & fiber type II/MHCIIa/MYH2 N/A - -
GLUT4 (gene) N/A N/A -
GLUT4 (protein) N/A - N/A
GS (protein) N/A - N/A
HKII (protein) N/A - N/A
Akt (protein) N/A - -
OXPHOS complexes (protein) & CYC1 (gene) N/A - -
PDK4 (gene & protein) N/A N/A -
PLIN2 & PLIN3 (gene & protein) N/A N/A -
ATGL & HSL (protein) N/A N/A -
pAkt/Akt & pTBC1D4/TBC1D4 N/A N/A -
CD36 (gene) N/A N/A -
PPARD & PPARGC1A (gene) N/A N/A -
CPT1A & CPT1B (gene) N/A N/A -
28
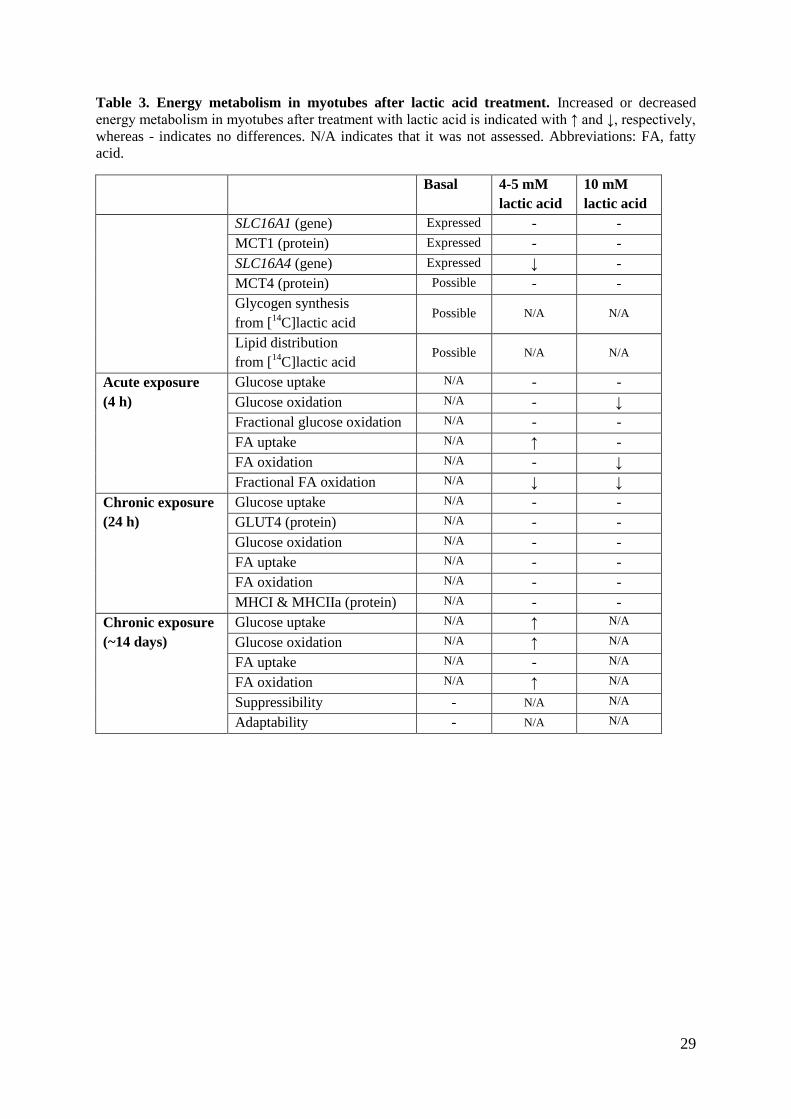
Paper IV: Lactic acid is readily used as an energy source or stored as glycogen and
intracellular lipids in human myotubes.
Myotubes expressed both lactate transporters, MCT1 and MCT4, and lactic acid was found to
be a substrate for both glycogen synthesis and lipid formation. Pyruvate and palmitic acid
(PA) inhibited lactic acid oxidation, whilst glucose and α-cyano-4-hydroxycinnamic acid (a
specific inhibitor of monocarboxylic acid transporters) inhibited lactic acid uptake. Acute
addition of lactic acid inhibited glucose and OA oxidation, whereas lactic acid increased OA
uptake. 24 h incubation with lactic acid did not affect glucose or OA metabolism. However,
when increasing the exposure time to lactic acid by replacing glucose with lactic acid during
the whole proliferation and differentiation period, glucose and OA oxidation as well as
glucose uptake were increased.
In conclusion, prolonged exposure to lactic acid increased glucose metabolism and OA
oxidation. Furthermore, lactic acid was found to be a substrate for glycogen synthesis, and it
was incorporated into lipids. Thus, lactic acid may be an important regulator of energy
metabolism in human skeletal muscle cells.
The findings from the work in paper IV are summarized in Table 3.
29
Table 3. Energy metabolism in myotubes after lactic acid treatment. Increased or decreased
energy metabolism in myotubes after treatment with lactic acid is indicated with ↑ and ↓, respectively,
whereas - indicates no differences. N/A indicates that it was not assessed. Abbreviations: FA, fatty
acid.
Basal 4-5 mM
lactic acid
10 mM
lactic acid
SLC16A1 (gene) Expressed - -
MCT1 (protein) Expressed - -
SLC16A4 (gene) Expressed ↓ -
MCT4 (protein) Possible - -
Glycogen synthesis
from [14
C]lactic acid Possible N/A N/A
Lipid distribution
from [14
C]lactic acid Possible N/A N/A
Acute exposure
(4 h)
Glucose uptake N/A - -
Glucose oxidation N/A - ↓
Fractional glucose oxidation N/A - -
FA uptake N/A ↑ -
FA oxidation N/A - ↓
Fractional FA oxidation N/A ↓ ↓
Chronic exposure
(24 h)
Glucose uptake N/A - -
GLUT4 (protein) N/A - -
Glucose oxidation N/A - -
FA uptake N/A - -
FA oxidation N/A - -
MHCI & MHCIIa (protein) N/A - -
Chronic exposure
(~14 days)
Glucose uptake N/A ↑ N/A
Glucose oxidation N/A ↑ N/A
FA uptake N/A - N/A
FA oxidation N/A ↑ N/A
Suppressibility - N/A N/A
Adaptability - N/A N/A
30
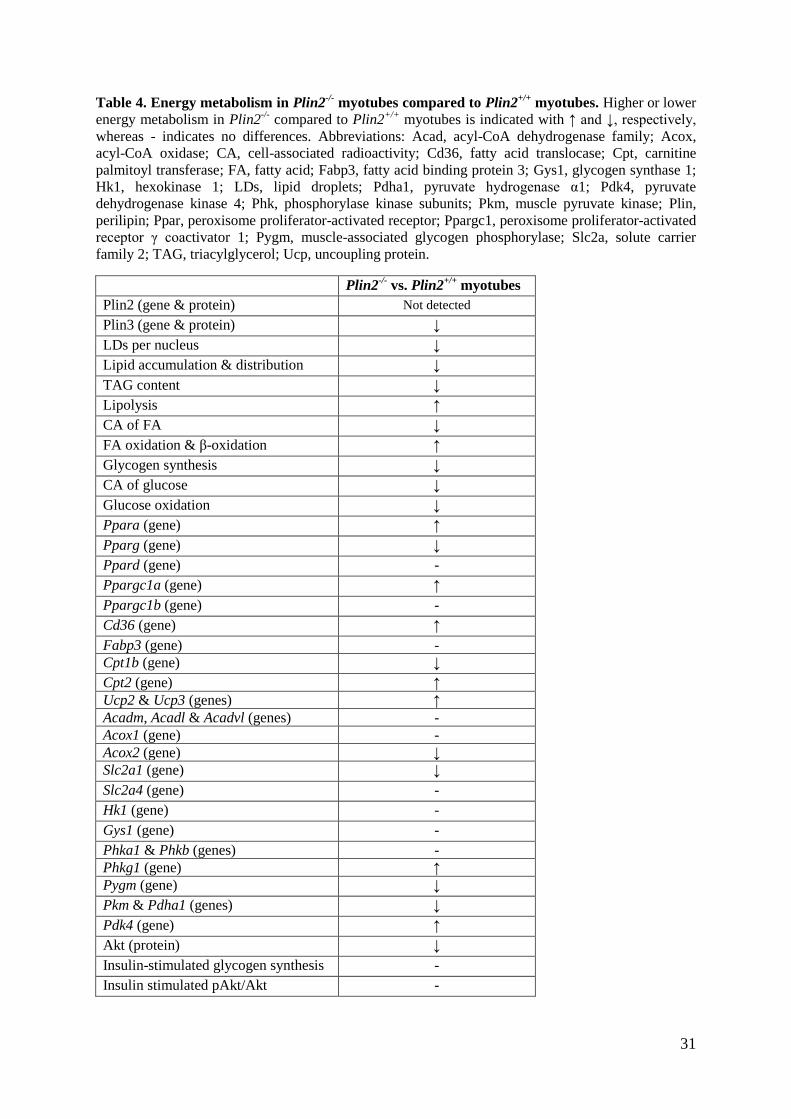
Paper V: Loss of perilipin 2 in cultured myotubes enhances lipolysis and shifts the metabolic
energy balance from glucose oxidation towards fatty acid oxidation.
Myotubes established from Plin2-/-
mice contained reduced content of LDs and accumulated
less OA in TAG and DAG, due to elevated LD hydrolysis compared to corresponding
Plin2+/+
myotubes. The reduced ability to store TAG in LDs in Plin2-/-
myotubes altered
energy metabolism from utilization of glucose towards that of FAs. Plin2-/-
myotubes were
characterized by higher oxidation of OA, lower glycogen synthesis and reduced glucose
oxidation compared to Plin2+/+
myotubes. In accord with these metabolic changes, ablation
of a functional Plin2 protein resulted in higher mRNA expression of Pparα and Ppargc1α,
transcription factors that stimulate expression of genes important for FA oxidation, the FA
transporter Cd36, the mitochondrial FA transporter Cpt2, and uncoupling proteins Ucp2 and
Ucp3. mRNA expressions of Cpt1b, a known facilitator of FA transport into mitochondria,
the peroxisomal acyl-CoA oxidase 2 (Acox2) and the basal glucose transporter Slc2a1 (Glut1)
were lower in Plin2-/-
compared to Plin2+/+
myotubes. On the other hand, mRNA expressions
of the other basal glucose transporter Slc2a4 (Glut4), the hexokinase Hk1, important for
activation of glucose, and the glycogen synthase, Gys1, were unaltered. In contrast, it was
observed a lower expression in mRNA expression of Pygm, involved in pathways leading to
glycogen degradation. Further, mRNA expression of genes involved in mobilization of
pyruvate for the TCA cycle, pyruvate kinase (Pkm) and pyruvate dehydrogenase (Pdha1),
were lower in Plin2-/-
myotubes compared to Plin2+/+
myotubes. mRNA expression of Pdk4,
a negative regulator of Pdha1 and key enzyme for switching fuel source from glucose
towards FAs, was higher in Plin2-/-
compared to Plin2+/+
myotubes. Loss of Plin2 had no
impact on insulin-stimulated Akt phosphorylation.
In conclusion, the results suggest that Plin2 is essential for balancing the pool of skeletal
muscle LDs to avoid an uncontrolled hydrolysis of the intracellular TAG pool. The
consequences of an increased release of FAs due to lack of Plin2 may therefore impact
skeletal muscle energy metabolism.
The findings from the work in paper V are summarized in Table 4.
31
Table 4. Energy metabolism in Plin2-/-
myotubes compared to Plin2+/+
myotubes. Higher or lower
energy metabolism in Plin2-/-
compared to Plin2+/+
myotubes is indicated with ↑ and ↓, respectively,
whereas - indicates no differences. Abbreviations: Acad, acyl-CoA dehydrogenase family; Acox,
acyl-CoA oxidase; CA, cell-associated radioactivity; Cd36, fatty acid translocase; Cpt, carnitine
palmitoyl transferase; FA, fatty acid; Fabp3, fatty acid binding protein 3; Gys1, glycogen synthase 1;
Hk1, hexokinase 1; LDs, lipid droplets; Pdha1, pyruvate hydrogenase α1; Pdk4, pyruvate
dehydrogenase kinase 4; Phk, phosphorylase kinase subunits; Pkm, muscle pyruvate kinase; Plin,
perilipin; Ppar, peroxisome proliferator-activated receptor; Ppargc1, peroxisome proliferator-activated
receptor γ coactivator 1; Pygm, muscle-associated glycogen phosphorylase; Slc2a, solute carrier
family 2; TAG, triacylglycerol; Ucp, uncoupling protein.
Plin2-/-
vs. Plin2+/+
myotubes
Plin2 (gene & protein) Not detected
Plin3 (gene & protein) ↓
LDs per nucleus ↓
Lipid accumulation & distribution ↓
TAG content ↓
Lipolysis ↑
CA of FA ↓
FA oxidation & β-oxidation ↑
Glycogen synthesis ↓
CA of glucose ↓
Glucose oxidation ↓
Ppara (gene) ↑
Pparg (gene) ↓
Ppard (gene) -
Ppargc1a (gene) ↑
Ppargc1b (gene) -
Cd36 (gene) ↑
Fabp3 (gene) -
Cpt1b (gene) ↓
Cpt2 (gene) ↑
Ucp2 & Ucp3 (genes) ↑
Acadm, Acadl & Acadvl (genes) -
Acox1 (gene) -
Acox2 (gene) ↓
Slc2a1 (gene) ↓
Slc2a4 (gene) -
Hk1 (gene) -
Gys1 (gene) -
Phka1 & Phkb (genes) -
Phkg1 (gene) ↑
Pygm (gene) ↓
Pkm & Pdha1 (genes) ↓
Pdk4 (gene) ↑
Akt (protein) ↓
Insulin-stimulated glycogen synthesis -
Insulin stimulated pAkt/Akt -
32
METHODOLOGICAL CONSIDERATIONS
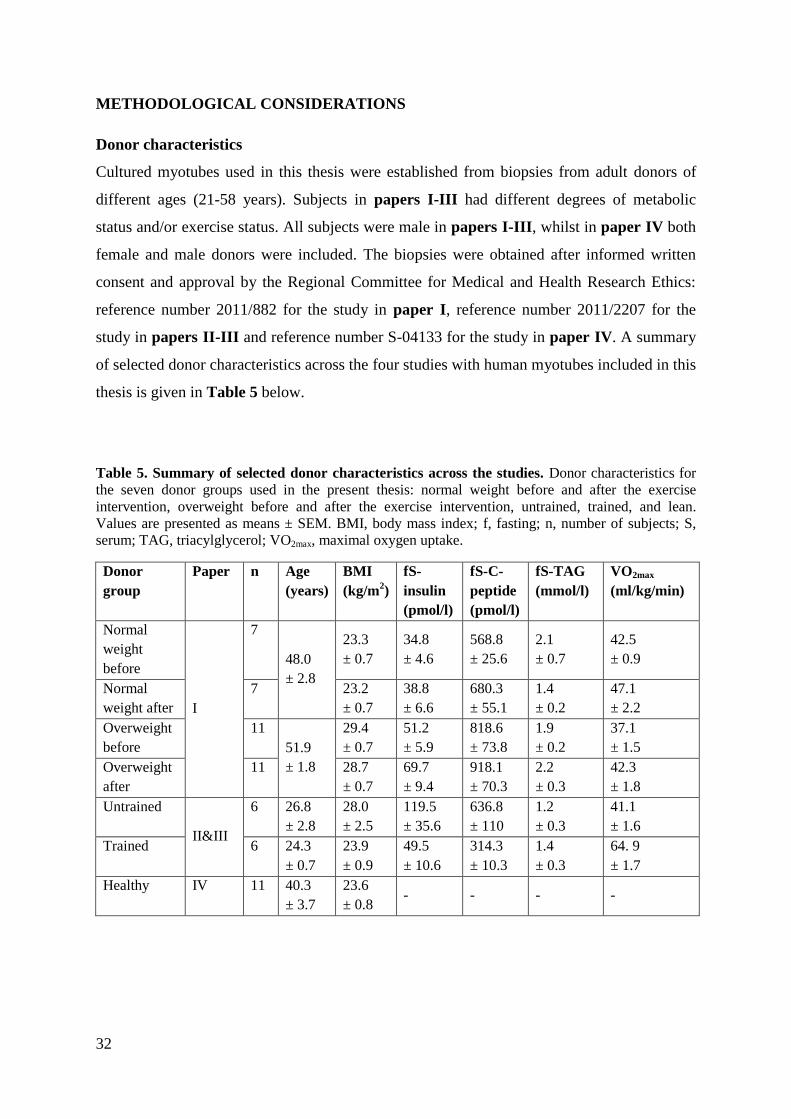
Donor characteristics
Cultured myotubes used in this thesis were established from biopsies from adult donors of
different ages (21-58 years). Subjects in papers I-III had different degrees of metabolic
status and/or exercise status. All subjects were male in papers I-III, whilst in paper IV both
female and male donors were included. The biopsies were obtained after informed written
consent and approval by the Regional Committee for Medical and Health Research Ethics:
reference number 2011/882 for the study in paper I, reference number 2011/2207 for the
study in papers II-III and reference number S-04133 for the study in paper IV. A summary
of selected donor characteristics across the four studies with human myotubes included in this
thesis is given in Table 5 below.
Table 5. Summary of selected donor characteristics across the studies. Donor characteristics for
the seven donor groups used in the present thesis: normal weight before and after the exercise
intervention, overweight before and after the exercise intervention, untrained, trained, and lean.
Values are presented as means ± SEM. BMI, body mass index; f, fasting; n, number of subjects; S,
serum; TAG, triacylglycerol; VO2max, maximal oxygen uptake.
Donor
group
Paper n Age
(years)
BMI
(kg/m2)
fS-
insulin
(pmol/l)
fS-C-
peptide
(pmol/l)
fS-TAG
(mmol/l)
VO2max
(ml/kg/min)
Normal
weight
before
I
7
48.0
± 2.8
23.3
± 0.7
34.8
± 4.6
568.8
± 25.6
2.1
± 0.7
42.5
± 0.9
Normal
weight after
7 23.2
± 0.7
38.8
± 6.6
680.3
± 55.1
1.4
± 0.2
47.1
± 2.2
Overweight
before
11
51.9
± 1.8
29.4
± 0.7
51.2
± 5.9
818.6
± 73.8
1.9
± 0.2
37.1
± 1.5
Overweight
after
11 28.7
± 0.7
69.7
± 9.4
918.1
± 70.3
2.2
± 0.3
42.3
± 1.8
Untrained
II&III
6 26.8
± 2.8
28.0
± 2.5
119.5
± 35.6
636.8
± 110
1.2
± 0.3
41.1
± 1.6
Trained 6 24.3
± 0.7
23.9
± 0.9
49.5
± 10.6
314.3
± 10.3
1.4
± 0.3
64. 9
± 1.7
Healthy IV 11 40.3
± 3.7
23.6
± 0.8 - - - -
33
The use of BMI as a measure of obesity is as previously mentioned much disputed, but due to
its simplicity and validation in multiple epidemiological studies it is widely used. The main
limitations of BMI measurements are that it does not differentiate body fat from lean mass
and central (visceral) fat from peripheral (subcutaneous) fat. Thus, subjects who have a large
muscle mass, e.g. athletes, may be classified as overweight or even obese if BMI alone is
used as the diagnostic criterion. On the other hand, individuals with low lean body mass but
high body fat content may still have BMI within the normal range. Furthermore, individuals
with normal BMI and high body fat percentage also show a high degree of metabolic
dysregulation, known as normal weight obesity [178]. Therefore, other criteria such as waist
circumference or WHR should be included when diagnosing obesity.
It is known that there are differences with regards to energy metabolism between sexes in
vivo [229]. Women have higher expression levels of genes involved in lipid storage and
turnover, FA uptake, insulin sensitivity, and higher level of muscle fiber type 1 than men
[230-235]. On the other hand, men have higher whole-body resting energy expenditure and
skeletal muscle mass (SMM) [236]. This difference does not appear to be reflected in
cultured myotubes, unless incubated in presence of sex hormones [237], as studies have
shown that the metabolism of glucose and PA were similar in myotubes from male and
female donors [238]. The same studies showed similar mRNA expression levels of several
genes important in regulation of glucose and lipid metabolism. Thus, in the studies where
donor differences were of interest (papers I-III) only male donors were used. In paper IV
where we studied effect of lactic acid exposure the influence of using cultured myotubes from
both female and male donors were considered irrelevant.
Another factor that affects several metabolic processes in skeletal muscle in vivo is age. With
increasing age it has been observed an increase in impaired insulin sensitivity and obesity
[239-241], increased IMTG content [242], increased proportion of fast muscle fibers [243],
reduced SMM [244], reduced PPAR content of skeletal muscle [245], reduced
mitochondrial content [242, 246] and function [239], and it has also been associated with
damaged mitochondrial DNA [247-249]. However, it is thought that it is the combination of
obesity and inactivity and not age per se that are more important in age-related declines in
insulin sensitivity [240]. Furthermore, several of these age-related effects may be prevented
by exercise [241, 250], and it has been seen that an exercise-induced increase in muscle
mitochondria is maintained at least up to 70 years of age [251-253]. In this thesis, all muscle
biopsy donors were below 59 years old.
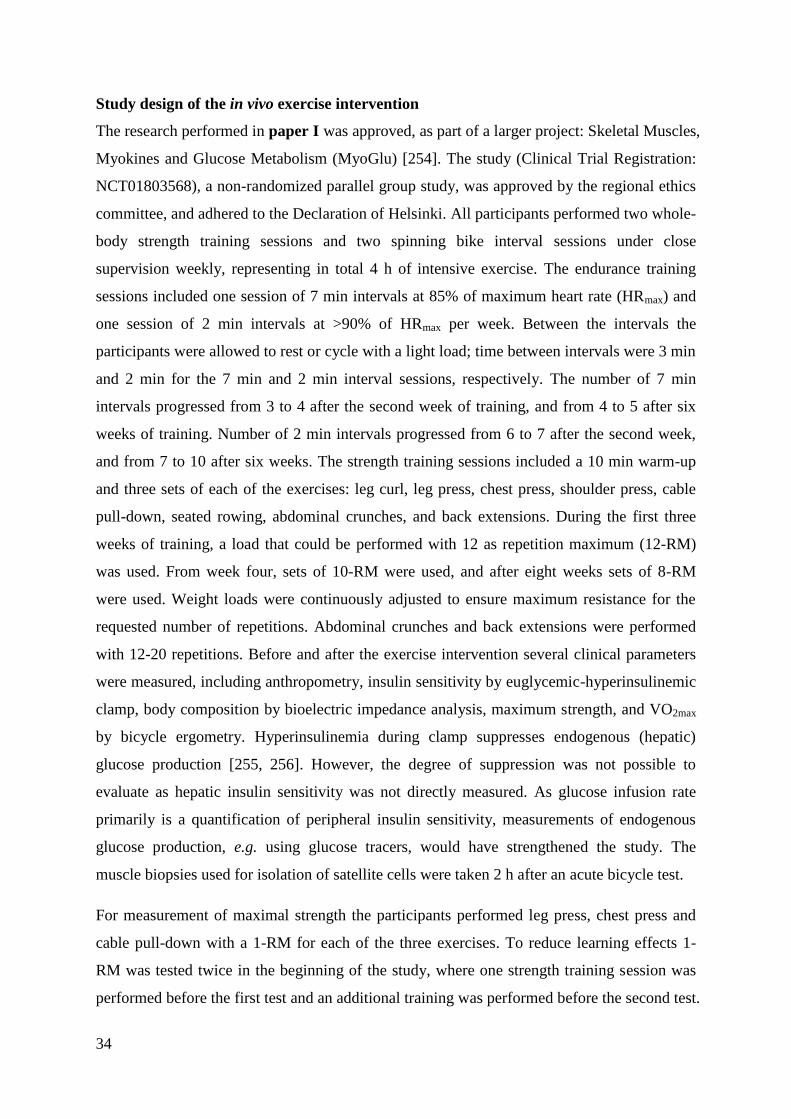
34
Study design of the in vivo exercise intervention
The research performed in paper I was approved, as part of a larger project: Skeletal Muscles,
Myokines and Glucose Metabolism (MyoGlu) [254]. The study (Clinical Trial Registration:
NCT01803568), a non-randomized parallel group study, was approved by the regional ethics
committee, and adhered to the Declaration of Helsinki. All participants performed two whole-
body strength training sessions and two spinning bike interval sessions under close
supervision weekly, representing in total 4 h of intensive exercise. The endurance training
sessions included one session of 7 min intervals at 85% of maximum heart rate (HRmax) and
one session of 2 min intervals at >90% of HRmax per week. Between the intervals the
participants were allowed to rest or cycle with a light load; time between intervals were 3 min
and 2 min for the 7 min and 2 min interval sessions, respectively. The number of 7 min
intervals progressed from 3 to 4 after the second week of training, and from 4 to 5 after six
weeks of training. Number of 2 min intervals progressed from 6 to 7 after the second week,
and from 7 to 10 after six weeks. The strength training sessions included a 10 min warm-up
and three sets of each of the exercises: leg curl, leg press, chest press, shoulder press, cable
pull-down, seated rowing, abdominal crunches, and back extensions. During the first three
weeks of training, a load that could be performed with 12 as repetition maximum (12-RM)
was used. From week four, sets of 10-RM were used, and after eight weeks sets of 8-RM
were used. Weight loads were continuously adjusted to ensure maximum resistance for the
requested number of repetitions. Abdominal crunches and back extensions were performed
with 12-20 repetitions. Before and after the exercise intervention several clinical parameters
were measured, including anthropometry, insulin sensitivity by euglycemic-hyperinsulinemic
clamp, body composition by bioelectric impedance analysis, maximum strength, and VO2max
by bicycle ergometry. Hyperinsulinemia during clamp suppresses endogenous (hepatic)
glucose production [255, 256]. However, the degree of suppression was not possible to
evaluate as hepatic insulin sensitivity was not directly measured. As glucose infusion rate
primarily is a quantification of peripheral insulin sensitivity, measurements of endogenous
glucose production, e.g. using glucose tracers, would have strengthened the study. The
muscle biopsies used for isolation of satellite cells were taken 2 h after an acute bicycle test.
For measurement of maximal strength the participants performed leg press, chest press and
cable pull-down with a 1-RM for each of the three exercises. To reduce learning effects 1-
RM was tested twice in the beginning of the study, where one strength training session was
performed before the first test and an additional training was performed before the second test.
35
After aerobic warm-up for 10 min the strength test started with 10 repetitions at a load below
50% of expected 1-RM, then 6 repetitions below 70%, three repetitions below 80%, one
repetition below 90%, and one repetition at a load below 95% of expected 1-RM. Thereafter,
resistance was gradually increased to reach 1-RM; subjects were allowed two attempts at this
load. Encouragement was given and the subjects were allowed 3 min rest between the
attempts.
The endurance tests were performed with a Monark Ergomedic 839E cycle and oxygen
consumption was measured with an Oxycon Pro. Expiration air was collected with a V2-
mask [257]. Capillary fingertip blood samples were taken for analyses of glucose and lactate.
Endurance sessions and tests were performed with Polar heart rate monitors, and heart rates
were analyzed with Polar ProTrainer 5 software. Subjects reported their perceived exertion
during training sessions and tests according to Borg’s scale [258, 259]. After a standardized
warm-up, the VO2max test started at a workload similar to the final load of an incremental test
in which the relationship between work (watt) and oxygen uptake was established. Subjects
cycled for 1 min and then the workload was increased by 15 watts every 30 seconds until
exhaustion. The test was concluded once oxygen uptake reached plateau (i.e. oxygen
consumption increased less than 0.5 ml/kg/min over a 30 watt increase in workload),
respiratory exchange ratio (RER) values > 1.1 and blood lactate > 7 mM. Before the exercise
intervention VO2max was tested twice (more than 3 days apart), but after the 12 weeks of
training only a single test was performed. The subjects abstained from training two days
before the VO2max tests. HRmax was defined during the VO2max test.
Cultured skeletal muscle cells as an in vitro model
The human muscle cells used in this thesis was obtained from musculus vastus lateralis
(papers I-III) or musculus obliquus internus abdominis (paper IV). The isolation of satellite
cells from all biopsies was performed at the same location and by the same trained
researchers. Multinucleated myotubes were established by activation and proliferation of
satellite cells based on the method of Henry et al. [260] and modified according to Gaster et
al. [261, 262]. During differentiation of activated satellite cells (myoblasts) into myotubes the
expression pattern of key proteins for both glucose [263] and lipid metabolism [264]
increases, and this pattern express a higher resemblance to adult skeletal muscle than the
pattern of myoblasts. Thus, myotubes are preferred in experiments [265]. Moreover, cultured
36
human myotubes have the most relevant genetic background for the study of metabolic
pathways and processes as compared to rodent cell cultures [266].
To be able to study the role of PLIN2 in skeletal muscle, muscle myoblast cultures were
established form the hind leg containing musculus gastrocnemius and musculus soleus from
Plin2+/+
and Plin2-/-
mice (paper V). We disrupted the Plin2 gene using standard
homologous recombination in embryonic stem cells. The use of KO mice enables us to study
the role of one specific protein at a time; however, silencing of a gene may elicit
compensatory cellular responses by up-regulation of genes sharing overlapping functions.
However, as we show in paper V, complete loss of Plin2 was not compensated by other
related Plin genes. Full KO of the gene is superior to silencing with siRNA, as some
expression of the target gene will be retained after silencing with siRNA. When comparing
metabolic studies between different species, it is important to consider the differences
existing between the species with regards to metabolic regulation, as nicely reviewed in [267].
For instance, mice have a basal metabolic rate that is approximately 7.5-fold higher than that
of humans. Furthermore, it appears that glucose tolerance in mice is more closely related to
hepatic insulin action rather than skeletal muscle insulin action.
Cultured human skeletal muscle cells are generally characterized by low mitochondrial
capacity and having fuel preference for carbohydrates over lipids [266]. The GLUT1:GLUT4
ratio is higher in cultured myotubes than in adult skeletal muscle [263, 268], resulting in
lower insulin responsiveness on glucose transport. Typically, insulin increases glucose uptake
by 40-50% in myotubes [263, 269]. However, despite the reduced insulin-responsiveness the
mechanisms involved in glucose uptake in vivo are conserved in vitro [263].
Another aspect to consider when comparing myotubes obtained from different sources of
muscle satellite cells is heterogeneity with respect to muscle fiber types. However, it has been
shown that human satellite cells isolated from either fast or slow muscle fibers form
myotubes in vitro which coexpress both fast and slow fibers independently of the fiber type
from which they were established [270]. Furthermore, it has been reported that myotubes
express fast fiber type regardless of donor muscle having mixed fiber type expression in vivo
[262]. Further, murine satellite cells isolated from various muscles have been shown to be
uniform regardless of muscle origin, and the dominant fiber type is the intermediate fiber
type, i.e. MHCIIa [271]. In our cells we have observed a significant amount of slow fiber
type after 8 days of differentiation [266]. In paper II we for the first time performed a
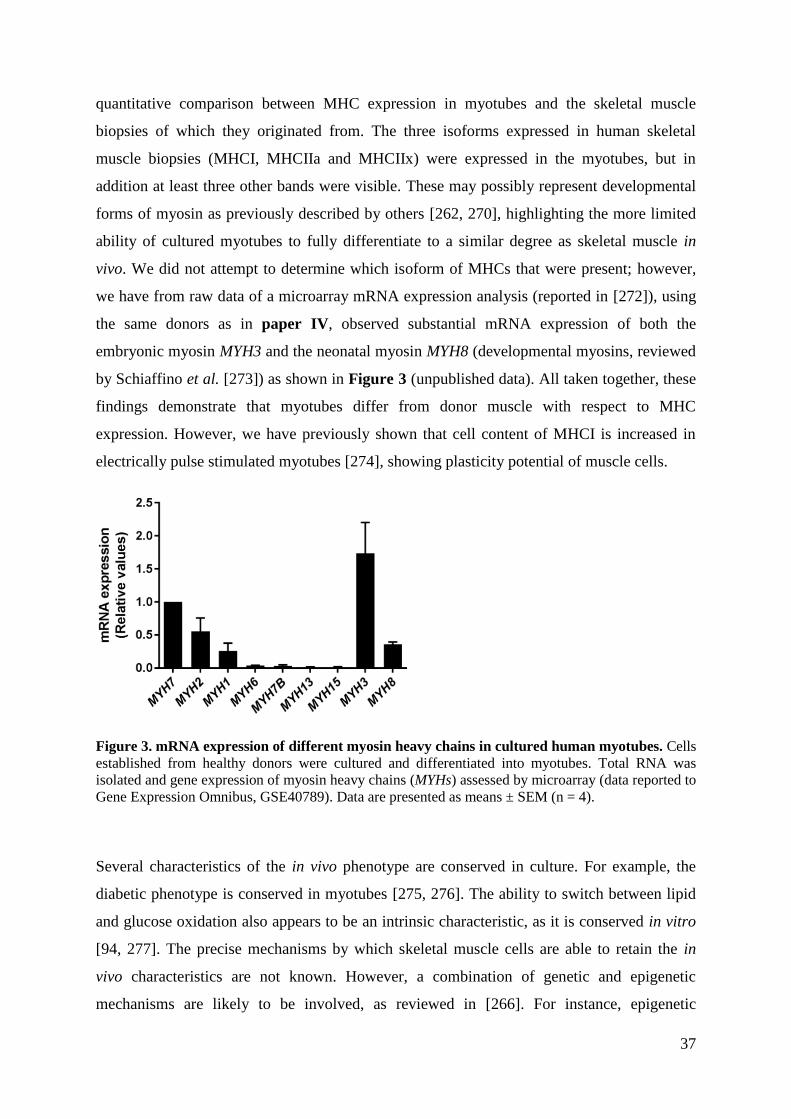
37
quantitative comparison between MHC expression in myotubes and the skeletal muscle
biopsies of which they originated from. The three isoforms expressed in human skeletal
muscle biopsies (MHCI, MHCIIa and MHCIIx) were expressed in the myotubes, but in
addition at least three other bands were visible. These may possibly represent developmental
forms of myosin as previously described by others [262, 270], highlighting the more limited
ability of cultured myotubes to fully differentiate to a similar degree as skeletal muscle in
vivo. We did not attempt to determine which isoform of MHCs that were present; however,
we have from raw data of a microarray mRNA expression analysis (reported in [272]), using
the same donors as in paper IV, observed substantial mRNA expression of both the
embryonic myosin MYH3 and the neonatal myosin MYH8 (developmental myosins, reviewed
by Schiaffino et al. [273]) as shown in Figure 3 (unpublished data). All taken together, these
findings demonstrate that myotubes differ from donor muscle with respect to MHC
expression. However, we have previously shown that cell content of MHCI is increased in
electrically pulse stimulated myotubes [274], showing plasticity potential of muscle cells.
Figure 3. mRNA expression of different myosin heavy chains in cultured human myotubes. Cells
established from healthy donors were cultured and differentiated into myotubes. Total RNA was
isolated and gene expression of myosin heavy chains (MYHs) assessed by microarray (data reported to
Gene Expression Omnibus, GSE40789). Data are presented as means ± SEM (n = 4).
Several characteristics of the in vivo phenotype are conserved in culture. For example, the
diabetic phenotype is conserved in myotubes [275, 276]. The ability to switch between lipid
and glucose oxidation also appears to be an intrinsic characteristic, as it is conserved in vitro
[94, 277]. The precise mechanisms by which skeletal muscle cells are able to retain the in
vivo characteristics are not known. However, a combination of genetic and epigenetic
mechanisms are likely to be involved, as reviewed in [266]. For instance, epigenetic
38
regulation of skeletal muscle stem cells and skeletal muscle differentiation, exercise, diet, and
a family history of T2D have all been described to influence DNA methylation and/or histone
modifications in human skeletal muscle [278, 279], and these are traits that might follow the
isolated satellite cells into their corresponding cultured myotubes.
Even though several traits seems to be intrinsic and conserved in vitro it has to be mentioned
that it has also been shown that the ability of the myoblasts to fuse and differentiate into
myotubes, as well as metabolic processes such as glucose uptake, glycogen synthesis, glucose
and FA oxidation, gradually can become impaired with increased passaging of the muscle
cells [280]. Therefore, all experiments performed in this thesis were on cells from passage
numbers that exerted normal responses, and passage number remained constant for each
experiment and within each donor, e.g. passage number remained constant for cells from
same donor before and after the exercise intervention in paper I.
Taken together, although some limitations, the cell model used in this thesis appears to be
valuable for studying skeletal muscle metabolism including conditions such as exercise
responses, effects of overweight/obesity and insulin resistance. Having the most relevant
genetic background, along with morphological, metabolic and biochemical properties of adult
skeletal muscle, differentiated primary human myotubes derived from satellite cells represent
the best available alternative system to intact human skeletal muscle that can be used to study
human diseases [260, 262, 266]. Moreover, as this system of cells is not immortalized it
allows investigation of the innate characteristics of the donors of which they were obtained
from. Since the extracellular environment can be precisely monitored this system is clearly
valuable for the purpose of research under controlled experimental conditions.
Methods used to measure energy metabolism in cultured skeletal muscle cells
Metabolic processes in this thesis were described by combining functional studies using
radiolabeled substrates with gene expression analyses using qPCR, protein expression
analyses using immunoblotting, DNA-methylation by pyrosequencing after bisulfite
treatment, as well as lipid composition analyses on isolated LDs, staining of LDs and nuclei
followed by live imaging or staining in fixated cells followed by imaging.
Scintillation proximity assay (SPA) [281] was used to study both real-time substrate
accumulation and lipolysis (papers II, III and V). Lipid accumulation of radiolabeled OA
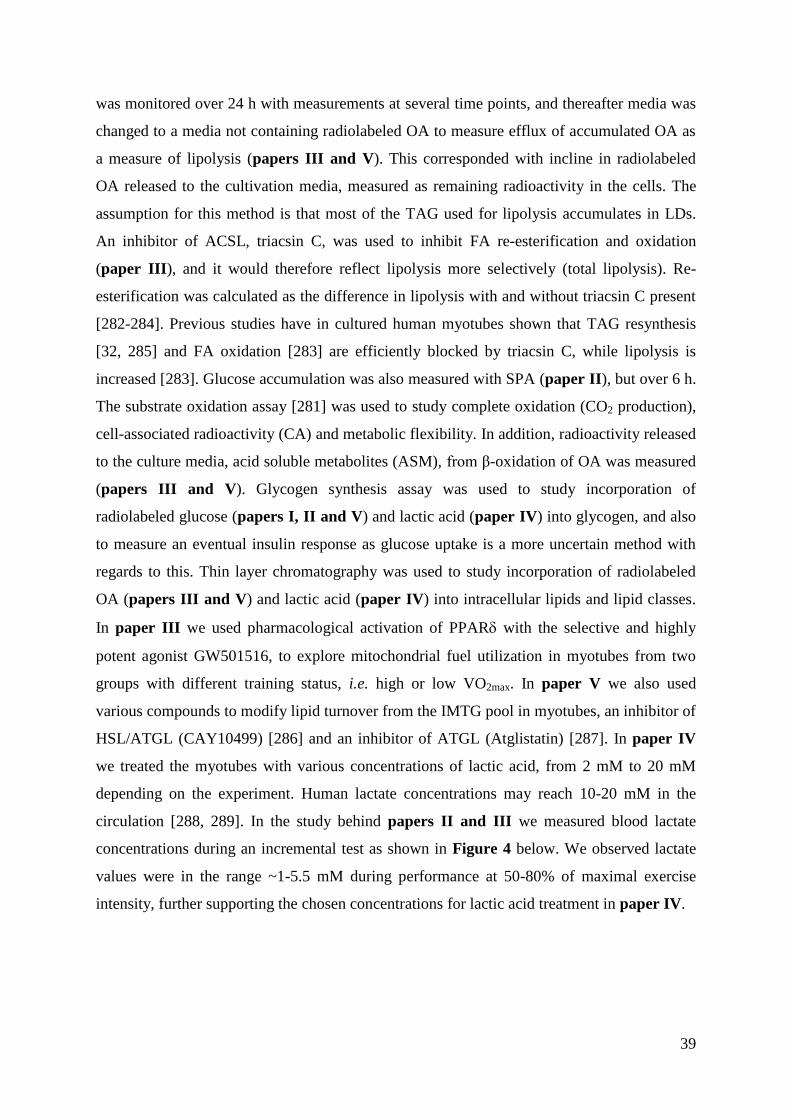
39
was monitored over 24 h with measurements at several time points, and thereafter media was
changed to a media not containing radiolabeled OA to measure efflux of accumulated OA as
a measure of lipolysis (papers III and V). This corresponded with incline in radiolabeled
OA released to the cultivation media, measured as remaining radioactivity in the cells. The
assumption for this method is that most of the TAG used for lipolysis accumulates in LDs.
An inhibitor of ACSL, triacsin C, was used to inhibit FA re-esterification and oxidation
(paper III), and it would therefore reflect lipolysis more selectively (total lipolysis). Re-
esterification was calculated as the difference in lipolysis with and without triacsin C present
[282-284]. Previous studies have in cultured human myotubes shown that TAG resynthesis
[32, 285] and FA oxidation [283] are efficiently blocked by triacsin C, while lipolysis is
increased [283]. Glucose accumulation was also measured with SPA (paper II), but over 6 h.
The substrate oxidation assay [281] was used to study complete oxidation (CO2 production),
cell-associated radioactivity (CA) and metabolic flexibility. In addition, radioactivity released
to the culture media, acid soluble metabolites (ASM), from β-oxidation of OA was measured
(papers III and V). Glycogen synthesis assay was used to study incorporation of
radiolabeled glucose (papers I, II and V) and lactic acid (paper IV) into glycogen, and also
to measure an eventual insulin response as glucose uptake is a more uncertain method with
regards to this. Thin layer chromatography was used to study incorporation of radiolabeled
OA (papers III and V) and lactic acid (paper IV) into intracellular lipids and lipid classes.
In paper III we used pharmacological activation of PPAR with the selective and highly
potent agonist GW501516, to explore mitochondrial fuel utilization in myotubes from two
groups with different training status, i.e. high or low VO2max. In paper V we also used
various compounds to modify lipid turnover from the IMTG pool in myotubes, an inhibitor of
HSL/ATGL (CAY10499) [286] and an inhibitor of ATGL (Atglistatin) [287]. In paper IV
we treated the myotubes with various concentrations of lactic acid, from 2 mM to 20 mM
depending on the experiment. Human lactate concentrations may reach 10-20 mM in the
circulation [288, 289]. In the study behind papers II and III we measured blood lactate
concentrations during an incremental test as shown in Figure 4 below. We observed lactate
values were in the range ~1-5.5 mM during performance at 50-80% of maximal exercise
intensity, further supporting the chosen concentrations for lactic acid treatment in paper IV.
40
Figure 4. Blood lactate at different exercise intensities in subjects with differences in inherent
training status. Blood lactate concentrations were measured in capillary blood at several exercise
intensities during an incremental test using an YSI 1500 Sport Lactate Analyzer. Data are presented as
means ± SEM (n = 6 in untrained group, n = 11 in intermediary trained group and n = 6 in trained
group).
qPCR is useful for investigation of a limited number of anticipated regulated genes. DNA
methylation by pyrosequencing was assessed after bisulfite conversion in paper I. In skeletal
muscle, DNA methylation has been shown to respond to and be modulated by multiple
stimuli, including exercise, diet and metabolic diseases such as diabetes [279, 290-292]. For
selected genes, these studies have suggested a possible role of DNA methylation in muscle
cell metabolism by drawing positive or negative correlations with mRNA expression or
protein abundance. Sequencing techniques do not discriminate between a cytosine and a
methylated cytosine. Bisulfite treatment of DNA samples transforms unmethylated cytosines
into uracil, whereas methylated cytosines remain unchanged. Subsequent PCR amplifies the
target region while tyrosine (Tyr) is incorporated instead of uracils, which also represents
unmethylated cytosines of the original sequence. A challenge is to ensure complete bisulfite
conversion without DNA breakdown. In this thesis the EpiTect Fast Bisulfite Conversion Kit
from QIAGEN was used for this purpose. Pyrosequencing is a method used for de novo
sequencing and, when combined with bisulfite treatment, to determine methylation status of
short regions of DNA. The major challenge that was encountered was to design primers that
would successfully amplify and sequence our target region. Cautions in the design were CpG
density and repetitive motifs, because if the density of CpG was high then the primers would
overlap with CpGs and the binding would be biased or in worst case not effective. In the case
of repetitive motifs, the primer might then have bound at several locations, resulting in
41
amplification of several products. To ensure that good primers had been designed,
electrophoresis was performed before pyrosequencing.
Immunoblotting was applied to study expression and phosphorylation of relevant proteins,
and thus address changes in post-translational modifications. However, immunoblotting is
highly dependent on the quality of the antibodies used, and is a semi-quantitative method.
When studying phosphorylation by immunoblotting it is important to choose the right
phosphorylation site with regards to what the outcome measure is, e.g. effects of exercise or
insulin. The works presented in this thesis have collaterally studied phosphorylation of four
different proteins: Akt/PKB at Ser473, TBC1D4 at Thr642, AMPKα at Thr172, and IRS1 at
Tyr612. TBC1D4 was first discovered while screening for novel substrates of the Ser/Thr
kinase Akt2, which phosphorylates TBC1D4 at Thr642 and Ser588 [23, 293] after insulin
stimulation [294], which in turn is involved in translocation of GLUT4 to the plasma
membrane in adipose and muscle cells [293]. The phosphorylation site we chose for TBC1D4
in papers I and II was therefore Thr642. Akt is a Ser/Thr kinase which is activated by a
variety of growth factors in a PI3K-dependent manner through translocation to the plasma
membrane and phosphorylation at two regulatory sites, namely Thr308 in the activation loop
and Ser473 in the hydrophobic C-terminal regulatory domain [295, 296]. Therefore, an
antibody directed to one of these phosphorylation sites, Ser473, was chosen for
immunoblotting in papers I, II and V. IRS1 is a substrate of the insulin receptor tyrosine
kinase which upon tyrosine phosphorylation functions as a docking molecule to engage and
activate SH2 domain-containing proteins, e.g. PI3K [297]. Phosphorylation of Tyr612 is
mediated by the PKC pathway [298], and was chosen as the phosphorylation site in paper I.
However, IRS1 is also phosphorylated on Ser residues, and modulation of IRS1 Ser
phosphorylation in cells has been observed after treatment with a variety of substances,
including insulin [299, 300], thus phosphorylation at a Ser motif, such as Ser312 and Ser636
[301, 302], would also have been relevant. AMPK is a heterotrimeric complex composed of a
catalytic α subunit and regulatory β and γ subunits, each of which is encoded by two or three
distinct genes [303]. Phosphorylation of Thr172 is required for activation of AMPK [304-
306]; however, AMPKα is also phosphorylated at Thr258 and Ser485 (for α1, Ser491 for α2),
but the upstream kinase and the biological significance of phosphorylation at these sites has
not yet been elucidated [307], thus we chose to study phosphorylation at Thr172 in paper I.
Staining of LDs and nuclei in fixated cells followed by imaging (paper III and V) or
staining in cultured cells followed by live imaging (paper V) were other methods that were
42
used to get a better understanding of the cellular changes. The cells were incubated with
fluorescent substances that are known to diffuse through the plasma membrane and bind to
intracellular organelles. After excitation of the fluorophore the emitted light can be quantified.
In this thesis Hoechst 33258 and Bodipy493/503 were used. Hoechst 33258 binds to double
stranded DNA, and is used for a quantitative measure of DNA, whereas Bodipy 493/502 is a
lipophilic dye that accumulates in non-polar neutral lipids and is quite specific for LDs [308].
Images were taken randomly and acquisition and analysis were according to a standardized
protocol to avoid bias from the operator.
Data analyses and statistics
Most of the statistical methods used in this thesis were non-parametric, i.e. Mann-Whitney
test between different groups or Wilcoxon matched-pairs signed rank test within groups, as
the number of observations were too few to assume normal distribution or as testing of
normal distribution showed otherwise. Where tests confirmed normality, unpaired t test was
used between groups and paired t test was used within groups. Furthermore, linear mixed-
model analysis (LMM) was used, e.g. for time-dependent experiments, to compare the
differences between groups with between-donor variation and simultaneously compare
differences between groups with between-group variation. The LMM analysis includes all
observations and at the same time takes into account that not all observations are independent.
For correlation studies, Spearman correlation analyses were performed. Spearman’s test of
correlation is a non-parametric measure of statistical dependence between two variables. It
assesses how well the relationship between two variables can be described using a monotonic
function. A perfect correlation of +1 or -1 occurs when each of the variables is a perfect
monotone function of the other, and it is Spearman’s correlation coefficient (, most often
denominated as r) that defines the correlation’s strength. All values are reported as means ±
SEM, unless stated otherwise. The value n represents the number of different donors used,
each with at least duplicate samples. Differences were considered significant when p < 0.05.
43
DISCUSSION AND CONCLUSIONS
In this thesis, energy metabolism in cultured human skeletal muscle cells established from
lean, normal weight, overweight, sedentary untrained, and trained subjects was studied, as
well as in cultured skeletal muscle cells from mice expressing or lacking the Plin2 gene. In
paper I, energy metabolism was studied in myotubes established from normal weight and
overweight subjects before and after 12 weeks of combined endurance and strength training
in vivo. In paper II, effects of inherent training status on glucose metabolism and fiber type
distribution were studied in vivo, ex vivo and in vitro, whereas in paper III FA metabolism
was studied in cultured myotubes established from the same untrained and trained subjects as
included in paper II. In paper IV lactate metabolism and the impact of lactate on glucose
and FA metabolism was studied in cultured myotubes established from healthy donors.
Finally, in paper V the functional role of Plin2 on lipid turnover and energy metabolism as
well as muscle fiber remodeling was investigated in myotubes from mice.
Oxidative capacity
Cultured human myotubes are characterized by their low mitochondrial oxidative potential.
Three of the papers presented in this thesis using human myotubes (papers I-III) showed
increased mitochondrial oxidative capacity of OA and somewhat of glucose, using different
experimental approaches. Impairments in skeletal muscle glucose and FA oxidation have
been reported in association with obesity and T2D in the resting state [87, 93, 309]; thus, it is
important to determine whether interventions, either exercise or pharmacological, can reverse
these impairments.
For oxidative use, carbohydrates (derived from circulating plasma glucose or intramuscular
glycogen) can only enter the mitochondria via the decarboxylation of pyruvate to acetyl-CoA,
which is a reaction catalyzed by PDC. Therefore, PDC is positioned in such a way that it
plays one of the most essential roles in regulation of glucose metabolism, as well as fuel
selection in skeletal muscle, and it is also imperative for maintaining the cells’ energy
balance by regulation of ATP levels [31]. In skeletal muscle, PDK4 inhibits the activity of
PDC by phosphorylation, and thus increased PDK4 expression is associated with reduced
PDC activity and thereby reduced glucose oxidation [32]. Therefore, PDK4 plays an
important part in switching the oxidation towards FAs [310].
44
Skeletal muscle FA oxidation reaches its maximum at moderate intensities between 55% and
65% of VO2max, above which a gradual decrease in FA oxidation is observed [10]. This was
confirmed in paper II, where we observed peak fat oxidation in vivo for all participants,
trained, intermediary trained and untrained, at 55% exercise intensity with increased fat
oxidation with better training status. In contrast, prolonged exercise, at low to moderate
intensities, is associated with a steady increase in utilization of long-chain FAs [10].
In paper I we show for the first time effects on both lipid and glucose metabolism in vitro
after an in vivo exercise intervention, i.e. certain impacts of exercise in vivo are retained in
myotubes established from satellite cells from the same donors. Furthermore, we observed
that these exercise-induced changes were predominant in the overweight group. Thus,
cultured, passaged myoblasts established from satellite cells (i.e. progenitor cells) and
differentiated into myotubes, may be used as a model system for studying mechanisms
related to exercise and metabolic diseases. This was first indicated by Bourlier et al. [311],
which observed enhanced glucose metabolism in vivo that also was conserved in vitro after
an 8-week aerobic exercise intervention. However, they concluded that a longer exercise
intervention combining aerobic and anaerobic exercise was warranted to conclude whether
lipid metabolism in fact was not affected [311]. As we show in paper I both glucose and FA
metabolism were affected when increasing duration of the exercise intervention and
combining endurance and strength training. Bourlier et al. also suggested that epigenetic
modifications should be studied [311]. Therefore, in paper I we also examined whether
epigenetic modifications could be involved in the observed exercise-induced changes in
energy metabolism in the myotubes. In skeletal muscle, DNA methylation has been shown to
respond to and be modulated by several stimuli, including exercise [279, 291, 292]. We
investigated selected targets, PDK4, PPARGC1A, PPARD, mitochondrial transcription factor
A (TFAM), and IRS1, and found a significant hypermethylation of IRS1 overall for the three
CpGs examined, and a reduced IRS1 mRNA expression (paper I). No change in protein level
of IRS1 was observed (paper I). Further, one of the eight CpGs within the TFAM sequence
was hypomethylated, but no other CpGs were differentially regulated (paper I). Subtle
differences in DNA methylation could be explained by factors extrinsic to skeletal muscle or
changes in the cellular composition of skeletal muscle rather than changes in the epigenome
of the myonuclei. Furthermore, we only explored the DNA methylation in cultured myotubes,
and differences in the DNA methylation between cells in vivo and in vitro have been reported
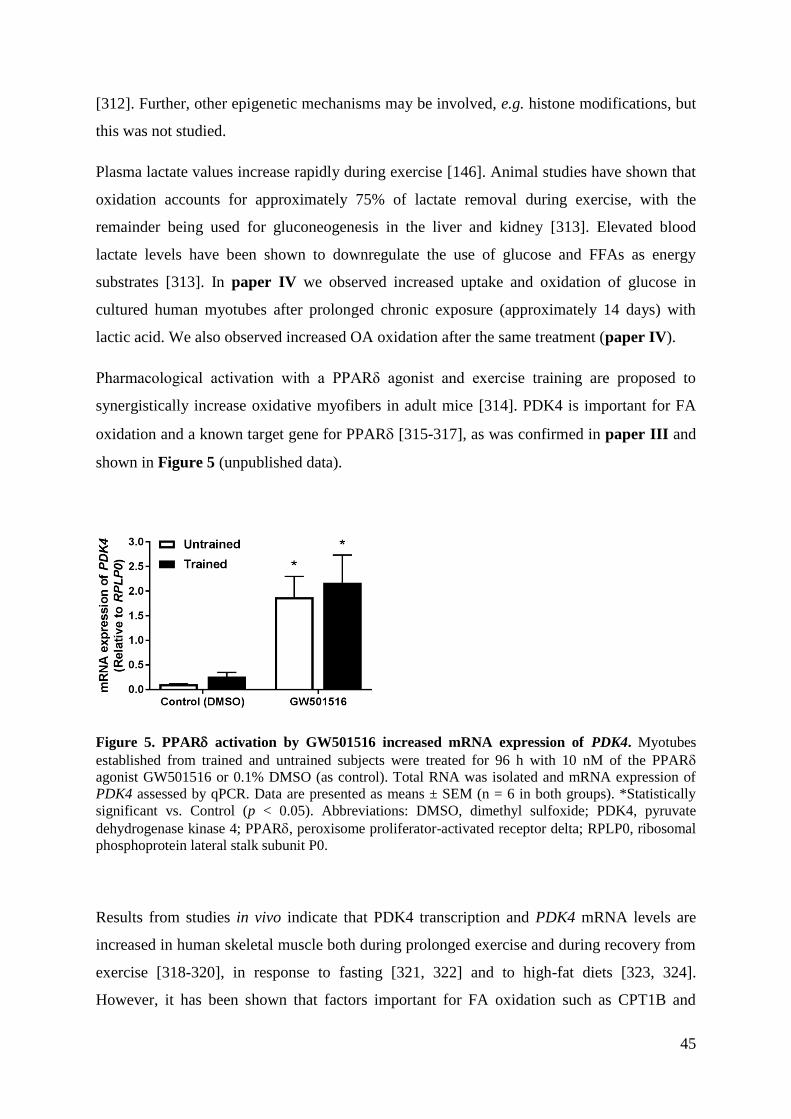
45
[312]. Further, other epigenetic mechanisms may be involved, e.g. histone modifications, but
this was not studied.
Plasma lactate values increase rapidly during exercise [146]. Animal studies have shown that
oxidation accounts for approximately 75% of lactate removal during exercise, with the
remainder being used for gluconeogenesis in the liver and kidney [313]. Elevated blood
lactate levels have been shown to downregulate the use of glucose and FFAs as energy
substrates [313]. In paper IV we observed increased uptake and oxidation of glucose in
cultured human myotubes after prolonged chronic exposure (approximately 14 days) with
lactic acid. We also observed increased OA oxidation after the same treatment (paper IV).
Pharmacological activation with a PPARδ agonist and exercise training are proposed to
synergistically increase oxidative myofibers in adult mice [314]. PDK4 is important for FA
oxidation and a known target gene for PPAR [315-317], as was confirmed in paper III and
shown in Figure 5 (unpublished data).
Figure 5. PPAR activation by GW501516 increased mRNA expression of PDK4. Myotubes
established from trained and untrained subjects were treated for 96 h with 10 nM of the PPAR
agonist GW501516 or 0.1% DMSO (as control). Total RNA was isolated and mRNA expression of
PDK4 assessed by qPCR. Data are presented as means ± SEM (n = 6 in both groups). *Statistically
significant vs. Control (p < 0.05). Abbreviations: DMSO, dimethyl sulfoxide; PDK4, pyruvate
dehydrogenase kinase 4; PPAR, peroxisome proliferator-activated receptor delta; RPLP0, ribosomal
phosphoprotein lateral stalk subunit P0.
Results from studies in vivo indicate that PDK4 transcription and PDK4 mRNA levels are
increased in human skeletal muscle both during prolonged exercise and during recovery from
exercise [318-320], in response to fasting [321, 322] and to high-fat diets [323, 324].
However, it has been shown that factors important for FA oxidation such as CPT1B and
46
PDK4 are not further induced with exercise compared to PPARδ activation alone [314],
which is consistent with the findings in paper III that myotubes from subjects with higher
training status did not experience a higher PPAR agonist-induced mRNA expression of
CD36 (paper III) or PDK4 (Figure 5) compared to myotubes from subjects with lower
training status.
In both rodent and human skeletal muscle, PPARD mRNA is expressed to a greater extent
than PPARA, whereas mRNA expression of PPARG is very low [325, 326], as also observed
in cultured mice myotubes in paper V. They are transcription factors known to be activated
by FAs [327, 328]. When comparing myotubes from Plin2-/-
with Plin2+/+
mice we observed
similar mRNA levels of Ppard, the predominant subtype in skeletal muscle, but higher levels
of Ppara, which is abundantly expressed in tissues with high FA catabolism including
skeletal muscle [329-331], and lower levels of Pparg, which primarily is expressed in white
adipose tissue and stimulates expression of genes promoting lipid storage [332] (paper V).
Similar differences in PPARα expression have been observed in liver of Plin2+/+
and Plin2-/-
mice [333], whereas the opposite expression pattern has been found in muscle electroporated
to overexpress Plin2 [334]. Ablation of Plin2 in mice also resulted in a metabolic shift in
energy metabolism from utilization of glucose towards utilization of FAs, i.e. a higher FA
oxidation and lower glucose metabolism was observed in Plin2-/-
myotubes (paper V). In line
with this, mRNA expressions of the fatty acid transporter Cd36 as well as Ppargc1a, a master
regulator of mitochondrial biogenesis [103] and known to facilitate FA oxidation [158, 264],
the mitochondrial FA transporter Cpt2, and the uncoupling proteins (Ucp) 2 and 3 were
higher in Plin2-/-
compared to Plin2+/+
myotubes. Genes encoding for mitochondrial acyl-
CoA dehydrogenases (Acadm, Acadl and Acadvl) as well as peroxisomal acyl-CoA oxidase 1
(Acox1) were unaltered, whereas mRNA expression of Cpt1b, known to facilitate FA
transport into mitochondria [45], and Acox2 were lower in Plin2-/-
than Plin2+/+
myotubes
(paper V). With regards to genes involved in glucose metabolism, mRNA expression of
solute carrier family 2 member 1 (Slc2a1, encoding for Glut1) was lower in Plin2-/-
than
Plin2+/+
myotubes, whereas mRNA expressions of Slc2a4 (encoding for Glut4), Hk1,
important for activation of glucose, glycogen synthase 1 (Gys1), and genes encoding for two
of the subunits in phosphorylase kinase (Phka1 and Phkb) were similar between the two WT
and KO myotubes (paper V). Expression of a third phosphorylase kinase subunit (Phkg1)
was elevated, whereas lower mRNA expressions of muscle-associated glycogen
phosphorylase (Pygm), involved in the pathways leading to glycogen degradation, pyruvate
47
kinase (Pkm) and pyruvate dehydrogenase alpha 1 (Pdha1), both involved in mobilization of
pyruvate for the TCA cycle, were observed in Plin2-/-
compared to Plin2+/+
myotubes (paper
V). Also, mRNA expression of Pdk4, a negative regulator of Pdha1, was higher in Plin2-/-
than Plin2+/+
myotubes (paper V). Altogether, although these transcriptional changes in the
Plin2-/-
myotubes do not fully overlap with transcriptional changes reported for mice with
overexpression of Ppara in muscle [335], repression of genes important for glucose uptake
(Slc2a1), degradation of glycogen (Pygm) and glycolysis (Pkm, Phda1 and Pdk4) may
explain the reduced glucose oxidation in the Plin2-/-
myotubes (paper V).
As described above, PDC is positioned in such a way that it has one of the most central roles
in regulation of glucose metabolism as well as fuel selection in skeletal muscle [31]. Both
pharmacological activation of PPAR by GW501516 (paper III and Figure 5) and ablation
of Plin2 (paper V) resulted in an increase in mRNA expression of PDK4. However, no
difference in protein expression of PDK4 was observed (paper II). As PDK4 is known to
inhibit PDC, and thereby reduce glucose oxidation [31], we indicate in paper V that PDK4 is
an important enzyme for switching the fuel source from glucose towards FAs. However, in
papers II and III we observed both increased fractional glucose oxidation and FA oxidation
in myotubes from trained compared to myotubes from untrained. Others have also observed
that PDK4 expression is increased after PPAR activation [315-317, 336]. Furthermore,
PDK4 inhibition of glucose oxidation in response to elevated plasma FA availability has been
observed both during fasting [321, 322] and high-fat diet [337]. At these conditions the
availability of carbohydrates is low, so PDK4 contributes to glucose preservation by
preventing its oxidation. Therefore, by regulation of PDK4, PPAR is suggested to play a
role in utilization of FAs under physiological conditions. On the other hand, trained muscle
fibers have been shown to use more glucose than untrained fibers [114, 115]. This was
confirmed in myotubes from trained subjects compared to myotubes from untrained subjects
in paper II, and with enhanced oxidation of carbohydrates after exercise in obese subjects
[311], in line with what we observed in paper I in cells from overweight subjects compared
to cells from normal weight subjects after an exercise intervention in vivo. Increased glucose
oxidation after exercise has also been shown in subjects with T2D [338], and our group have
also shown that electric pulse stimulation is able to increase the oxidative capacity of glucose
in human myotubes isolated from lean, healthy subjects and severely obese subjects with or
without T2D [339].
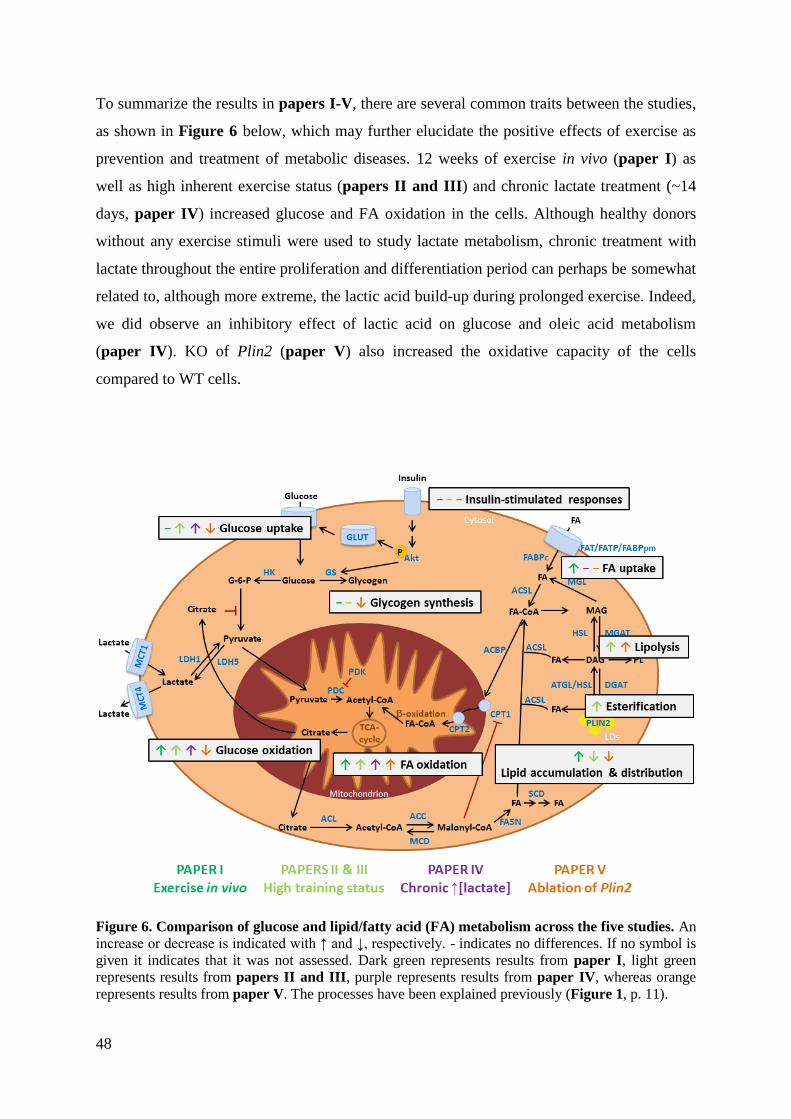
48
To summarize the results in papers I-V, there are several common traits between the studies,
as shown in Figure 6 below, which may further elucidate the positive effects of exercise as
prevention and treatment of metabolic diseases. 12 weeks of exercise in vivo (paper I) as
well as high inherent exercise status (papers II and III) and chronic lactate treatment (~14
days, paper IV) increased glucose and FA oxidation in the cells. Although healthy donors
without any exercise stimuli were used to study lactate metabolism, chronic treatment with
lactate throughout the entire proliferation and differentiation period can perhaps be somewhat
related to, although more extreme, the lactic acid build-up during prolonged exercise. Indeed,
we did observe an inhibitory effect of lactic acid on glucose and oleic acid metabolism
(paper IV). KO of Plin2 (paper V) also increased the oxidative capacity of the cells
compared to WT cells.
Figure 6. Comparison of glucose and lipid/fatty acid (FA) metabolism across the five studies. An
increase or decrease is indicated with ↑ and ↓, respectively. - indicates no differences. If no symbol is
given it indicates that it was not assessed. Dark green represents results from paper I, light green
represents results from papers II and III, purple represents results from paper IV, whereas orange
represents results from paper V. The processes have been explained previously (Figure 1, p. 11).
49
Lipid storage and turnover
LDs are dynamic organelles resulting from the balance between storage and breakdown of
TAG by lipases to generate FAs available for oxidation in the mitochondria [340]. Exercise
has been found to increase lipid storage in skeletal muscle [152, 153, 341], but as we show in
paper III myotubes from trained subjects had in fact lower fatty acid accumulation and
incorporation into complex lipids compared to myotubes from untrained subjects.
High levels of IMTG have been shown to correlate with insulin resistance [205, 342-344].
However, it has also been observed that insulin resistance can occur independently of
changes in IMTG content, and thereby dissociating IMTG concentrations from insulin
resistance [345]. Studies using cultured human myotubes have shown increased storage of
neutral lipids together with improved glucose metabolism and metabolic switching of the
cells [95, 346, 347], which suggests that to enhance partitioning of excess FAs towards
storage is beneficial to prevent insulin resistance by limiting accumulation of lipotoxic
intermediates [348-351]. It has been hypothesized that insulin resistance develops due to
lower lipid accumulation and higher lipolysis without an increase in FA oxidation [352],
processes which may lead to increased accumulation of lipotoxic intermediates that could
interfere with insulin signaling [217, 222, 350, 353]. In accordance, as we show in paper III,
myotubes from trained subjects had lower lipid accumulation and higher TAG-related
lipolysis and re-esterification than myotubes from untrained subjects, but myotubes from
trained also had higher FA oxidation than myotubes from untrained. We did not measure
lipolysis in paper I; however, lipid accumulation and FA oxidation were measured.
Myotubes from overweight participants isolated before the exercise intervention showed
lower lipid accumulation and no differences in FA oxidation compared to myotubes from
normal weight participants (paper I). However, after the exercise intervention myotubes
from overweight had higher lipid accumulation and FA oxidation compared to myotubes
from normal weight (paper I). Moreover, there were no exercise-induced differences in gene
expressions of either PLIN2 or CD36 (paper I).
Using Plin2-/-
myotubes we demonstrated that Plin2 plays an essential role in skeletal muscle
lipid storage and turnover (paper V). Similar to earlier studies based on partial ablation of
Plin2 [334, 354], we showed that complete removal of Plin2 in myotubes (paper V)
generated cells with reduced number of LDs and with less accumulated TAG. We also
showed that loss of Plin2 did not affect the FA uptake rate across the plasma membrane or
the amount of FAs incorporated into LDs, but merely increased degradation of the TAG
50
deposited within LDs by interfering with lipolysis (paper V). In support of this, earlier
studies have shown that overexpression of PLIN2 in embryonic kidney cells from hamster
limited the interaction of lipases with LDs [355] and increased lipolysis in mouse hepatocytes
with combined PLIN2 and PLIN3 knockdown [354]. Furthermore, as we show in paper V,
inhibitors against ATGL and HSL only had an effect on LD accumulation in Plin2-/-
myotubes, suggesting that ATGL and HSL gained more access to LDs or increased in activity
in cells lacking Plin2. In support of this, it has been observed higher TAG accumulation and
lower lipolysis in skeletal muscle of ATGL-/-
mice [356], whereas HSL-/-
mice has been
shown to contain higher levels of DAG [357]. In line with a functional role of PLIN2 as TAG
protector, Plin2-/-
myotubes exposed to OA accumulated less DAG (paper V), a finding that
contradicts the previous report of increased incorporation of PA into DAG in PLIN2
knockdown C2C12 cells [334]. As it has been shown a functional redundancy among some
PLINs [354], the incomplete removal of the PLIN2 protein in PLIN2 knockdown cells [334]
compared to complete removal of PLIN2 in our Plin2-/-
cells (paper V) likely contributes to
these discrepancies. Furthermore, the different types of labeled FAs used may also contribute,
as PA is accumulated to a lower extent into LDs than OA in myotubes [283]. Interestingly, in
paper IV we show for the first time in cultured human myotubes that lactic acid is able to be
stored as lipids. Chen et al. has shown that lactate can be metabolized to lipids in cultured
HeLa cells and H460 human lung cancer cells [358], and Jin et al. has shown that lactic acid
can be converted to glycerol in rat muscle [359].
Fiber type transformations in skeletal muscles
It has been suggested that there is an association between insulin sensitivity and the amount
of oxidative type I fibers, as lower expression of type I fibers has been observed in muscle
biopsies from subjects with insulin resistance and T2D when compared to healthy subjects
[360, 361]. However, it has also been shown that there were no differences in fiber type
distribution between muscle biopsies from lean non-diabetic and obese diabetic subjects
[362]. Furthermore, myotubes in culture differ from donor muscle as human satellite cells
form myotubes in vitro independently of the fiber type from which they originated [262, 270,
271]. In paper I we did not observe any differences in protein expressions of MHCI
(representing type I muscle fibers) or MHCIIa (representing type II muscle fibers) between
the groups or as a result of the exercise intervention. We did not observe any differences in
protein expression of these MHCs in paper IV either after 24 h incubation with lactic acid. In
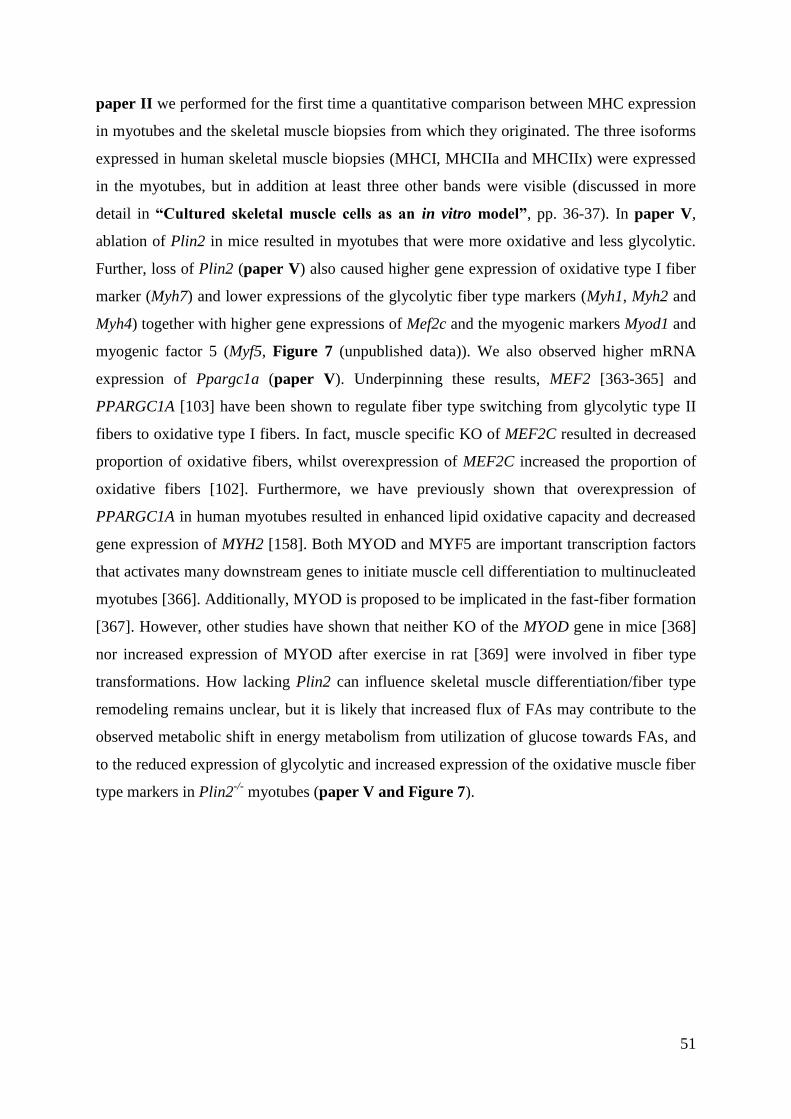
51
paper II we performed for the first time a quantitative comparison between MHC expression
in myotubes and the skeletal muscle biopsies from which they originated. The three isoforms
expressed in human skeletal muscle biopsies (MHCI, MHCIIa and MHCIIx) were expressed
in the myotubes, but in addition at least three other bands were visible (discussed in more
detail in “Cultured skeletal muscle cells as an in vitro model”, pp. 36-37). In paper V,
ablation of Plin2 in mice resulted in myotubes that were more oxidative and less glycolytic.
Further, loss of Plin2 (paper V) also caused higher gene expression of oxidative type I fiber
marker (Myh7) and lower expressions of the glycolytic fiber type markers (Myh1, Myh2 and
Myh4) together with higher gene expressions of Mef2c and the myogenic markers Myod1 and
myogenic factor 5 (Myf5, Figure 7 (unpublished data)). We also observed higher mRNA
expression of Ppargc1a (paper V). Underpinning these results, MEF2 [363-365] and
PPARGC1A [103] have been shown to regulate fiber type switching from glycolytic type II
fibers to oxidative type I fibers. In fact, muscle specific KO of MEF2C resulted in decreased
proportion of oxidative fibers, whilst overexpression of MEF2C increased the proportion of
oxidative fibers [102]. Furthermore, we have previously shown that overexpression of
PPARGC1A in human myotubes resulted in enhanced lipid oxidative capacity and decreased
gene expression of MYH2 [158]. Both MYOD and MYF5 are important transcription factors
that activates many downstream genes to initiate muscle cell differentiation to multinucleated
myotubes [366]. Additionally, MYOD is proposed to be implicated in the fast-fiber formation
[367]. However, other studies have shown that neither KO of the MYOD gene in mice [368]
nor increased expression of MYOD after exercise in rat [369] were involved in fiber type
transformations. How lacking Plin2 can influence skeletal muscle differentiation/fiber type
remodeling remains unclear, but it is likely that increased flux of FAs may contribute to the
observed metabolic shift in energy metabolism from utilization of glucose towards FAs, and
to the reduced expression of glycolytic and increased expression of the oxidative muscle fiber
type markers in Plin2-/-
myotubes (paper V and Figure 7).
52
Figure 7. mRNA expression of fiber type markers in Plin2+/+
and Plin2-/-
myotubes. Differentiated
Plin2+/+
and Plin2-/-
myotubes was analyzed by qPCR. (A) Expression of myosin heavy chains (Myhs)
linked to muscle fiber type: Myh1 (type IIx fibers), Myh2 (type IIa fibers), Myh4 (type IIb fibers), and
Myh7 (type I fibers). (B) Expression of myogenic regulatory factors: Myocyte enhancer factor 2c
(Mef2c), myogenic differentiation 1 (Myod1) and myogenic factor 5 (Myf5). Data are presented as
means ± SEM (n = 3) normalized to expression of the housekeeping control TATA box binding
protein (Tbp).
Effects on insulin sensitivity
Disturbances in energy metabolism of skeletal muscle are associated with metabolic diseases
related to insulin resistance [370, 371]. In paper I we found a significantly increased glucose
infusion rate in vivo after the exercise intervention in both normal weight and overweight
subjects, indicating increased insulin sensitivity. However, we did not observe any exercise-
induced changes in in vitro insulin response, i.e. insulin-stimulated Akt phosphorylation,
TBC1D4 phosphorylation or glycogen synthesis. This may possibly be explained by
suboptimal experimental conditions in vitro, e.g. treatment with an insulin concentration
leading to maximal insulin stimulation; however, we have previously been able to detect
donor-specific differences in insulin-response with the same experimental setup as in paper I
[284, 352]. Thus, the lack of exercise-induced changes in insulin response in vitro may also
be a result of the underlying study in vivo where the difference in insulin sensitivity was quite
small, though significant, between the normal weight group and overweight group, and that
this difference was too small to be able to detect in vitro. Others have shown higher exercise-
induced changes in insulin sensitivity in subjects who were more insulin-resistant at baseline
[372, 373], and even more evident in obese men compared to lean men [373], which also has
been observed after electric pulse stimulation of myotubes in vitro [339]. We were not able to
replicate this in paper I, where most of the subjects in the overweight group also were
dysglycemic, but with no greater insulin-stimulated responses in their myotubes after the in
53
vivo exercise intervention. However, we do not rule out the possibility that interventions with
an increased physical activity level may be effective to improve insulin sensitivity in
myotubes from population groups with insulin resistance or are prone to have insulin
resistance.
We did not observe any differences in in vitro insulin response between myotubes from
trained and untrained subjects (paper II), and these two donor groups also had quite similar
insulin sensitivity in vivo. As previously stated, it has been hypothesized that insulin
resistance is a result of lower lipid accumulation and higher lipolysis without increased FA
oxidation [352], processes which may lead to higher accumulation of lipotoxic intermediates
that could interfere with insulin signaling. This is in accordance with what we showed in
paper III where myotubes from trained subjects also had lower lipid accumulation and
higher lipolysis, but additionally they showed higher FA oxidation.
Ablation of Plin2 (paper V) did not affect insulin sensitivity in myotubes measured as an
effect on insulin-stimulated responses despite of improvement in lipid oxidative capacity.
This suggests that insulin resistance in skeletal muscle is not solely dependent on increased
lipid accumulation. Although a complete loss of Plin2 in myotubes did not affect insulin-
stimulated responses, it generated cells with reduced expression of total Akt protein that may
contribute to the reduced glucose metabolism observed in Plin2-/-
cells (paper V). However,
the three different isoforms of Akt (Akt1-3) have been shown to have distinct roles, where
Akt2 is specifically involved in the maintenance of glucose homeostasis [122, 374], and
therefore it remains to clarify which isoform(s) of the Akt proteins is reduced in our Plin2-/-
muscle cells.
Final considerations
The myotubes used in this thesis were established from donors of different origin, age and
physical activity level. Metabolism of OA and glucose in the cells was increased in human
myotubes as a result of an in vivo exercise intervention (paper I) and higher in myotubes
from trained compared to untrained donors (papers II and III). We have also, to the best of
our knowledge, shown for the first time that myotubes from trained subjects were more
flexible with regards to exploiting the available fuel source as seen by more effective
inhibition of glucose oxidation by FAs in myotubes from trained subjects compared to
myotubes from untrained subjects (paper II). This may possibly be explained by altered

54
access for FAs to mitochondria. Furthermore, myotubes from trained subjects had a higher
FA turnover and oxidation compared to myotubes from untrained subjects, indicating a
higher preference for FA metabolism with higher training status (paper III). In summary
(papers II and III), myotubes from trained subjects appear to have different metabolic
properties than myotubes from untrained, but whether these differences are inherent from
birth or acquired through e.g. lifestyle remains unknown. Lactate exposure affected
metabolism of two other major substrates for energy metabolism, namely glucose and OA, in
cultured human myotubes, and the impact of lactate exposure appeared to be related to the
exposure time (paper IV). This may further be related to the lactic acid build-up during
strenuous exercise, although more extreme. Thus, we suggest that lactate may have an
important role in regulation of energy metabolism on a cellular level (paper IV). Oxidative
capacity was also increased in myotubes established from mice lacking Plin2 (paper V), and
the increase was associated with a shift from glucose utilization towards FA utilization. We
also concluded that Plin2 was essential for balancing the pool of skeletal muscle LDs to
avoid an uncontrolled hydrolysis of the intracellular TAG pool (paper V). Interestingly, in
paper IV we showed for the first time in cultured human myotubes that lactic acid was
incorporated into lipids and glycogen. Increased physical activity (paper I), having high
training status (papers II and III) or ablation of Plin2 (paper V) did not affect insulin-
stimulated responses in cultured myotubes. Finally, we conclude that cultured, passaged
myotubes are valuable as an in vitro model system for studying mechanisms related to
exercise and metabolic diseases.
55
REFERENCES
1. Patti, M.-E. and S. Corvera, The role of mitochondria in the pathogenesis of type 2
diabetes. Endocrine reviews, 2010. 31(3): p. 364-395.
2. de Lange, P., et al., Peroxisome proliferator-activated receptor delta: a conserved
director of lipid homeostasis through regulation of the oxidative capacity of muscle.
PPAR research, 2008. 2008.
3. DeFronzo, R., et al., The effect of insulin on the disposal of intravenous glucose:
results from indirect calorimetry and hepatic and femoral venous catheterization.
Diabetes, 1981. 30(12): p. 1000-1007.
4. Egan, B. and J.R. Zierath, Exercise metabolism and the molecular regulation of
skeletal muscle adaptation. Cell metabolism, 2013. 17(2): p. 162-184.
5. Zurlo, F., et al., Skeletal muscle metabolism is a major determinant of resting energy
expenditure. Journal of Clinical Investigation, 1990. 86(5): p. 1423.
6. Gaitanos, G.C., et al., Human muscle metabolism during intermittent maximal
exercise. Journal of applied physiology, 1993. 75(2): p. 712-719.
7. van Loon, L.J., et al., The effects of increasing exercise intensity on muscle fuel
utilisation in humans. The Journal of Physiology, 2001. 536(1): p. 295-304.
8. Wasserman, D.H., Four grams of glucose. American Journal of Physiology-
Endocrinology and Metabolism, 2009. 296(1): p. E11-E21.
9. Houmard, J.A., Intramuscular lipid oxidation and obesity. American Journal of
Physiology-Regulatory, Integrative and Comparative Physiology, 2008. 294(4): p.
R1111-R1116.
10. Kiens, B., Skeletal muscle lipid metabolism in exercise and insulin resistance.
Physiological reviews, 2006. 86(1): p. 205-243.
11. Dagenais, G.R., R. Tancredi, and K. Zierler, Free fatty acid oxidation by forearm
muscle at rest, and evidence for an intramuscular lipid pool in the human forearm.
Journal of Clinical Investigation, 1976. 58(2): p. 421.
12. Ren, J.-M., et al., Evidence from transgenic mice that glucose transport is rate-
limiting for glycogen deposition and glycolysis in skeletal muscle. Journal of
Biological Chemistry, 1993. 268(22): p. 16113-16115.
13. Devaskar, S.U. and M.M. Mueckler, The mammalian glucose transporters. Pediatric
research, 1992. 31(1): p. 1-13.
14. Mueckler, M., Family of glucose-transporter genes: implications for glucose
homeostasis and diabetes. Diabetes, 1990. 39(1): p. 6-11.
15. Mueckler, M.M., The molecular biology of mammalian glucose transporters. Current
opinion in nephrology and hypertension, 1992. 1(1): p. 12-20.
16. Zierath, J.R. and Y. Kawano, The effect of hyperglycaemia on glucose disposal and
insulin signal transduction in skeletal muscle. Best Practice & Research Clinical
Endocrinology & Metabolism, 2003. 17(3): p. 385-398.
17. Ciaraldi, T.P., et al., Skeletal muscle GLUT1 transporter protein expression and basal
leg glucose uptake are reduced in type 2 diabetes. The Journal of Clinical
Endocrinology & Metabolism, 2005. 90(1): p. 352-358.
18. Guma, A., et al., Insulin induces translocation of GLUT-4 glucose transporters in
human skeletal muscle. American Journal of Physiology-Endocrinology And
Metabolism, 1995. 268(4): p. E613-E622.
19. Lauritzen, H.P., Insulin and Contraction-induced GLUT4 Traffic in Muscle: Insights
from a Novel Imaging Approach. Exercise and sport sciences reviews, 2013. 41(2): p.
77.
56
20. Ploug, T., et al., Analysis of GLUT4 distribution in whole skeletal muscle fibers:
identification of distinct storage compartments that are recruited by insulin and
muscle contractions. The Journal of cell biology, 1998. 142(6): p. 1429-1446.
21. James, D.E., M. Strube, and M. Muecdler, Molecular cloning and characterization of
an insulin-regulatable glucose transporter. Nature, 1989. 338(6210): p. 83-87.
22. Pehmøller, C., et al., Genetic disruption of AMPK signaling abolishes both
contraction-and insulin-stimulated TBC1D1 phosphorylation and 14-3-3 binding in
mouse skeletal muscle. American Journal of Physiology-Endocrinology and
Metabolism, 2009. 297(3): p. E665-E675.
23. Sakamoto, K. and G.D. Holman, Emerging role for AS160/TBC1D4 and TBC1D1 in
the regulation of GLUT4 traffic. American Journal of Physiology-Endocrinology and
Metabolism, 2008. 295(1): p. E29-E37.
24. Sun, Y., et al., Rab8A and Rab13 are activated by insulin and regulate GLUT4
translocation in muscle cells. Proceedings of the National Academy of Sciences, 2010.
107(46): p. 19909-19914.
25. Kido, Y., J. Nakae, and D. Accili, The Insulin Receptor and Its Cellular Targets 1.
The Journal of Clinical Endocrinology & Metabolism, 2001. 86(3): p. 972-979.
26. Shepherd, P.R., D.J. Withers, and K. Siddle, Phosphoinositide 3-kinase: the key
switch mechanism in insulin signalling. Biochemical Journal, 1998. 333(3): p. 471-
490.
27. Jensen, T.E. and E.A. Richter, Regulation of glucose and glycogen metabolism during
and after exercise. The Journal of physiology, 2012. 590(5): p. 1069-1076.
28. Dashty, M., A quick look at biochemistry: carbohydrate metabolism. Clinical
biochemistry, 2013. 46(15): p. 1339-1352.
29. Aas, V., et al., Chronic hyperglycaemia promotes lipogenesis and triacylglycerol
accumulation in human skeletal muscle cells. Diabetologia, 2004. 47(8): p. 1452-1461.
30. Peters, S., Regulation of PDH activity and isoform expression: diet and exercise.
Biochemical Society Transactions, 2003. 31(6): p. 1274-1280.
31. Jeong, J.Y., et al., Transcriptional regulation of pyruvate dehydrogenase kinase.
Diabetes & metabolism journal, 2012. 36(5): p. 328-335.
32. Badin, P.-M., et al., Regulation of skeletal muscle lipolysis and oxidative metabolism
by the co-lipase CGI-58. Journal of lipid research, 2012. 53(5): p. 839-848.
33. Wang, H. and R.H. Eckel, Lipoprotein lipase: from gene to obesity. American Journal
of Physiology-Endocrinology and Metabolism, 2009. 297(2): p. E271-E288.
34. Kazantzis, M. and A. Stahl, Fatty acid transport proteins, implications in physiology
and disease. Biochimica et Biophysica Acta (BBA)-Molecular and Cell Biology of
Lipids, 2012. 1821(5): p. 852-857.
35. Glatz, J.F., J.J. Luiken, and A. Bonen, Membrane fatty acid transporters as regulators
of lipid metabolism: implications for metabolic disease. Physiological reviews, 2010.
90(1): p. 367-417.
36. Nickerson, J.G., et al., Greater transport efficiencies of the membrane fatty acid
transporters FAT/CD36 and FATP4 compared with FABPpm and FATP1 and
differential effects on fatty acid esterification and oxidation in rat skeletal muscle.
Journal of Biological Chemistry, 2009. 284(24): p. 16522-16530.
37. Coburn, C.T., et al., Role of CD36 in membrane transport and utilization of long-
chain fatty acids by different tissues. Journal of Molecular Neuroscience, 2001. 16(2-
3): p. 117-121.
38. Watt, M.J. and A.J. Hoy, Lipid metabolism in skeletal muscle: generation of adaptive
and maladaptive intracellular signals for cellular function. American Journal of
Physiology-Endocrinology and Metabolism, 2012. 302(11): p. E1315-E1328.
57
39. Doege, H. and A. Stahl, Protein-mediated fatty acid uptake: novel insights from in
vivo models. Physiology, 2006. 21(4): p. 259-268.
40. Faergeman, N.J. and J. Knudsen, Role of long-chain fatty acyl-CoA esters in the
regulation of metabolism and in cell signalling. Biochemical Journal, 1997. 323(1): p.
1-12.
41. Zammit, V.A., et al., Diacylglycerol acyltransferases: potential roles as
pharmacological targets. Pharmacology & therapeutics, 2008. 118(3): p. 295-302.
42. Bell, R.M. and R.A. Coleman, Enzymes of glycerolipid synthesis in eukaryotes.
Annual review of biochemistry, 1980. 49(1): p. 459-487.
43. Schreurs, M., F. Kuipers, and F. Van Der Leij, Regulatory enzymes of mitochondrial
β‐oxidation as targets for treatment of the metabolic syndrome. obesity reviews,
2010. 11(5): p. 380-388.
44. Bezaire, V., et al., Identification of fatty acid translocase on human skeletal muscle
mitochondrial membranes: essential role in fatty acid oxidation. American Journal of
Physiology-Endocrinology and Metabolism, 2006. 290(3): p. E509-E515.
45. Campbell, S.E., et al., A novel function for fatty acid translocase (FAT)/CD36
involvement in long chain fatty acid transfer into the mitochondria. Journal of
Biological Chemistry, 2004. 279(35): p. 36235-36241.
46. Spriet, L.L., New insights into the interaction of carbohydrate and fat metabolism
during exercise. Sports medicine, 2014. 44(1): p. 87-96.
47. Smith, B.K., A. Bonen, and G.P. Holloway, A dual mechanism of action for skeletal
muscle FAT/CD36 during exercise. Exercise and sport sciences reviews, 2012. 40(4):
p. 211-217.
48. Yoshida, Y., et al., Exercise‐and training‐induced upregulation of skeletal muscle
fatty acid oxidation are not solely dependent on mitochondrial machinery and
biogenesis. The Journal of physiology, 2013. 591(18): p. 4415-4426.
49. Nasreen, A. and E.D. SAGGERSON, Malonyl-CoA and the regulation of fatty acid
oxidation in soleus muscle. Biochemical Journal, 1998. 334(1): p. 233-241.
50. Wakil, S.J., Fatty acid synthase, a proficient multifunctional enzyme. Biochemistry,
1989. 28(11): p. 4523-4530.
51. Ntambi, J.M. and M. Miyazaki, Regulation of stearoyl-CoA desaturases and role in
metabolism. Progress in lipid research, 2004. 43(2): p. 91-104.
52. Cruz, R.S.d.O., et al., Intracellular shuttle: the lactate aerobic metabolism. The
Scientific World Journal, 2012. 2012.
53. Ahmed, K., et al., An autocrine lactate loop mediates insulin-dependent inhibition of
lipolysis through GPR81. Cell metabolism, 2010. 11(4): p. 311-319.
54. Cai, T.-Q., et al., Role of GPR81 in lactate-mediated reduction of adipose lipolysis.
Biochemical and biophysical research communications, 2008. 377(3): p. 987-991.
55. Liu, C., et al., Lactate inhibits lipolysis in fat cells through activation of an orphan G-
protein-coupled receptor, GPR81. Journal of Biological Chemistry, 2009. 284(5): p.
2811-2822.
56. Rooney, K. and P. Trayhurn, Lactate and the GPR81 receptor in metabolic regulation:
implications for adipose tissue function and fatty acid utilisation by muscle during
exercise. British journal of nutrition, 2011. 106(09): p. 1310-1316.
57. Lauritzen, K.H., et al., Lactate receptor sites link neurotransmission, neurovascular
coupling, and brain energy metabolism. Cerebral cortex, 2013: p. bht136.
58. Juel, C. and A.P. Halestrap, Lactate transport in skeletal muscle—role and regulation
of the monocarboxylate transporter. The Journal of physiology, 1999. 517(3): p. 633-
642.
58
59. Dubouchaud, H., et al., Endurance training, expression, and physiology of LDH,
MCT1, and MCT4 in human skeletal muscle. American Journal of Physiology-
Endocrinology And Metabolism, 2000. 278(4): p. E571-E579.
60. Pilegaard, H., et al., Distribution of the lactate/H+ transporter isoforms MCT1 and
MCT4 in human skeletal muscle. American Journal of Physiology-Endocrinology And
Metabolism, 1999. 276(5): p. E843-E848.
61. Thomas, C., et al., Effects of acute and chronic exercise on sarcolemmal MCT1 and
MCT4 contents in human skeletal muscles: current status. American Journal of
Physiology-Regulatory, Integrative and Comparative Physiology, 2012. 302(1): p.
R1-R14.
62. Everse, J. and N.O. Kaplan, Lactate dehydrogenases: structure and function. Adv
Enzymol Relat Areas Mol Biol, 1973. 37: p. 61-133.
63. Spriet, L.L., R.A. Howlett, and G.J. Heigenhauser, An enzymatic approach to lactate
production in human skeletal muscle during exercise. Medicine and science in sports
and exercise, 2000. 32(4): p. 756-763.
64. Draoui, N. and O. Feron, Lactate shuttles at a glance: from physiological paradigms
to anti-cancer treatments. Disease models & mechanisms, 2011. 4(6): p. 727-732.
65. Sacchetti, M., et al., High triacylglycerol turnover rate in human skeletal muscle. The
Journal of physiology, 2004. 561(3): p. 883-891.
66. Goodpaster, B.H., et al., Skeletal muscle lipid content and insulin resistance: evidence
for a paradox in endurance-trained athletes. The Journal of Clinical Endocrinology &
Metabolism, 2001. 86(12): p. 5755-5761.
67. Guo, Y., et al., Lipid droplets at a glance. J Cell Sci, 2009. 122(6): p. 749-752.
68. Walther, T.C. and R.V. Farese Jr, Lipid droplets and cellular lipid metabolism.
Annual review of biochemistry, 2012. 81: p. 687.
69. Brasaemle, D.L., Thematic review series: adipocyte biology. The perilipin family of
structural lipid droplet proteins: stabilization of lipid droplets and control of lipolysis.
Journal of lipid research, 2007. 48(12): p. 2547-2559.
70. Dalen, K.T., et al., LSDP5 is a PAT protein specifically expressed in fatty acid
oxidizing tissues. Biochimica et Biophysica Acta (BBA)-Molecular and Cell Biology
of Lipids, 2007. 1771(2): p. 210-227.
71. Kimmel, A.R., et al., Adoption of PERILIPIN as a unifying nomenclature for the
mammalian PAT-family of intracellular lipid storage droplet proteins. Journal of lipid
research, 2010. 51(3): p. 468-471.
72. Bickel, P.E., J.T. Tansey, and M.A. Welte, PAT proteins, an ancient family of lipid
droplet proteins that regulate cellular lipid stores. Biochimica et Biophysica Acta
(BBA)-Molecular and Cell Biology of Lipids, 2009. 1791(6): p. 419-440.
73. Shaw, C.S., et al., Adipophilin distribution and colocalisation with lipid droplets in
skeletal muscle. Histochemistry and cell biology, 2009. 131(5): p. 575-581.
74. Londos, C., et al., Role of PAT proteins in lipid metabolism. Biochimie, 2005. 87(1): p.
45-49.
75. Zimmermann, R., et al., Fat mobilization in adipose tissue is promoted by adipose
triglyceride lipase. Science, 2004. 306(5700): p. 1383-1386.
76. Haemmerle, G., et al., Hormone-sensitive lipase deficiency in mice causes diglyceride
accumulation in adipose tissue, muscle, and testis. Journal of Biological Chemistry,
2002. 277(7): p. 4806-4815.
77. Schweiger, M., et al., G0/G1 switch gene-2 regulates human adipocyte lipolysis by
affecting activity and localization of adipose triglyceride lipase. Journal of lipid
research, 2012. 53(11): p. 2307-2317.
59
78. MacPherson, R.E., et al., Skeletal muscle PLIN proteins, ATGL and CGI-58,
interactions at rest and following stimulated contraction. American Journal of
Physiology-Regulatory, Integrative and Comparative Physiology, 2013. 304(8): p.
R644-R650.
79. Kelley, D.E., et al., Effects of insulin on skeletal muscle glucose storage, oxidation,
and glycolysis in humans. American Journal of Physiology-Endocrinology And
Metabolism, 1990. 258(6): p. E923-E929.
80. Henriksson, J., Muscle fuel selection: effect of exercise and training. Proceedings of
the Nutrition Society, 1995. 54(01): p. 125-138.
81. Talanian, J.L., et al., Adrenergic regulation of HSL serine phosphorylation and
activity in human skeletal muscle during the onset of exercise. American Journal of
Physiology-Regulatory, Integrative and Comparative Physiology, 2006. 291(4): p.
R1094-R1099.
82. Thoresen, G.H., et al., Metabolic switching of human skeletal muscle cells in vitro.
Prostaglandins, Leukotrienes and Essential Fatty Acids (PLEFA), 2011. 85(5): p. 227-
234.
83. Kelley, D.E. and L.J. Mandarino, Fuel selection in human skeletal muscle in insulin
resistance: a reexamination. Diabetes, 2000. 49(5): p. 677-683.
84. Randle, P., et al., The glucose fatty-acid cycle its role in insulin sensitivity and the
metabolic disturbances of diabetes mellitus. The Lancet, 1963. 281(7285): p. 785-789.
85. Hue, L. and H. Taegtmeyer, The Randle cycle revisited: a new head for an old hat.
American Journal of Physiology-Endocrinology and Metabolism, 2009. 297(3): p.
E578-E591.
86. Sidossis, L.S., et al., Glucose plus insulin regulate fat oxidation by controlling the
rate of fatty acid entry into the mitochondria. Journal of Clinical Investigation, 1996.
98(10): p. 2244.
87. Kiens, B., T.J. Alsted, and J. Jeppesen, Factors regulating fat oxidation in human
skeletal muscle. Obesity reviews, 2011. 12(10): p. 852-858.
88. Timmers, S., P. Schrauwen, and J. de Vogel, Muscular diacylglycerol metabolism and
insulin resistance. Physiology & behavior, 2008. 94(2): p. 242-251.
89. Kelley, D.E., et al., Skeletal muscle fatty acid metabolism in association with insulin
resistance, obesity, and weight loss. American Journal of Physiology-Endocrinology
And Metabolism, 1999. 277(6): p. E1130-E1141.
90. Corpeleijn, E., et al., Impaired Skeletal Muscle Substrate Oxidation in Glucose‐intolerant Men Improves After Weight Loss. Obesity, 2008. 16(5): p. 1025-1032.
91. Gaster, M., Reduced lipid oxidation in myotubes established from obese and type 2
diabetic subjects. Biochemical and biophysical research communications, 2009.
382(4): p. 766-770.
92. Gaster, M., et al., Reduced Lipid Oxidation in Skeletal Muscle From Type 2 Diabetic
Subjects May Be of Genetic Origin. Diabetes, 2004. 53(3): p. 542-548.
93. Berggren, J.R., et al., Skeletal muscle lipid oxidation and obesity: influence of weight
loss and exercise. American Journal of Physiology-Endocrinology and Metabolism,
2008. 294(4): p. E726-E732.
94. Ukropcova, B., et al., Dynamic changes in fat oxidation in human primary myocytes
mirror metabolic characteristics of the donor. The Journal of clinical investigation,
2005. 115(7): p. 1934-1941.
95. Hessvik, N.P., et al., Metabolic switching of human myotubes is improved by n-3 fatty
acids. Journal of lipid research, 2010. 51(8): p. 2090-2104.
96. Schiaffino, S. and C. Reggiani, Fiber types in mammalian skeletal muscles.
Physiological reviews, 2011. 91(4): p. 1447-1531.
60
97. Howald, H., et al., Influences of endurance training on the ultrastructural
composition of the different muscle fiber types in humans. Pflügers Archiv, 1985.
403(4): p. 369-376.
98. Kong, X., et al., Glucose transporters in single skeletal muscle fibers. Relationship to
hexokinase and regulation by contractile activity. Journal of Biological Chemistry,
1994. 269(17): p. 12963-12967.
99. Daugaard, J.R., et al., Fiber type-specific expression of GLUT4 in human skeletal
muscle: influence of exercise training. Diabetes, 2000. 49(7): p. 1092-1095.
100. Stuart, C.A., et al., Slow-twitch fiber proportion in skeletal muscle correlates with
insulin responsiveness. The Journal of Clinical Endocrinology & Metabolism, 2013.
98(5): p. 2027-2036.
101. Gundersen, K., Determination of muscle contractile properties: the importance of the
nerve. Acta Physiologica Scandinavica, 1998. 162(3): p. 333-341.
102. Potthoff, M.J., et al., Histone deacetylase degradation and MEF2 activation promote
the formation of slow-twitch myofibers. The Journal of clinical investigation, 2007.
117(9): p. 2459-2467.
103. Lin, J., et al., Transcriptional co-activator PGC-1α drives the formation of slow-
twitch muscle fibres. Nature, 2002. 418(6899): p. 797-801.
104. Hennebry, A., et al., Myostatin regulates fiber-type composition of skeletal muscle by
regulating MEF2 and MyoD gene expression. American Journal of Physiology-Cell
Physiology, 2009. 296(3): p. C525-C534.
105. Coffey, V.G. and J.A. Hawley, The molecular bases of training adaptation. Sports
medicine, 2007. 37(9): p. 737-763.
106. Röckl, K.S., C.A. Witczak, and L.J. Goodyear, Signaling mechanisms in skeletal
muscle: acute responses and chronic adaptations to exercise. IUBMB life, 2008.
60(3): p. 145-153.
107. Holloszy, J.O. and F.W. Booth, Biochemical adaptations to endurance exercise in
muscle. Annual review of physiology, 1976. 38(1): p. 273-291.
108. Holloszy, J.O. and E.F. Coyle, Adaptations of skeletal muscle to endurance exercise
and their metabolic consequences. Journal of applied physiology, 1984. 56(4): p. 831-
838.
109. Flück, M., Functional, structural and molecular plasticity of mammalian skeletal
muscle in response to exercise stimuli. Journal of Experimental Biology, 2006.
209(12): p. 2239-2248.
110. Chow, L.S., et al., Impact of endurance training on murine spontaneous activity,
muscle mitochondrial DNA abundance, gene transcripts, and function. Journal of
applied physiology, 2007. 102(3): p. 1078-1089.
111. Toledo, F.G. and B.H. Goodpaster, The role of weight loss and exercise in correcting
skeletal muscle mitochondrial abnormalities in obesity, diabetes and aging.
Molecular and cellular endocrinology, 2013. 379(1): p. 30-34.
112. Röckl, K.S., et al., Skeletal muscle adaptation to exercise training. Diabetes, 2007.
56(8): p. 2062-2069.
113. O'Gorman, D.J. and A. Krook, Exercise and the treatment of diabetes and obesity.
Endocrinology and metabolism clinics of North America, 2008. 37(4): p. 887-903.
114. Richter, E.A. and N.B. Ruderman, AMPK and the biochemistry of exercise:
implications for human health and disease. Biochem J, 2009. 418(2): p. 261-75.
115. Santos, J.M., et al., Skeletal muscle pathways of contraction-enhanced glucose uptake.
Int J Sports Med, 2008. 29(10): p. 785-94.
61
116. Rose, A.J., et al., Effects of contraction on localization of GLUT4 and v-SNARE
isoforms in rat skeletal muscle. American Journal of Physiology-Regulatory,
Integrative and Comparative Physiology, 2009. 297(5): p. R1228-R1237.
117. Maarbjerg, S.J., et al., Genetic impairment of AMPKα2 signaling does not reduce
muscle glucose uptake during treadmill exercise in mice. American Journal of
Physiology-Endocrinology and Metabolism, 2009. 297(4): p. E924-E934.
118. Aslesen, R., et al., Glucose uptake and metabolic stress in rat muscles stimulated
electrically with different protocols. Journal of Applied Physiology, 2001. 91(3): p.
1237-1244.
119. Sylow, L., et al., Rac1 is a novel regulator of contraction-stimulated glucose uptake
in skeletal muscle. Diabetes, 2013. 62(4): p. 1139-1151.
120. Ploug, T., H. Galbo, and E.A. Richter, Increased muscle glucose uptake during
contractions: no need for insulin. American Journal of Physiology-Endocrinology
And Metabolism, 1984. 247(6): p. E726-E731.
121. Wojtaszewski, J.F., et al., Exercise modulates postreceptor insulin signaling and
glucose transport in muscle-specific insulin receptor knockout mice. The Journal of
clinical investigation, 1999. 104(9): p. 1257-1264.
122. Sakamoto, K., et al., Role of Akt2 in contraction-stimulated cell signaling and glucose
uptake in skeletal muscle. American Journal of Physiology-Endocrinology and
Metabolism, 2006. 291(5): p. E1031-E1037.
123. Richter, E.A., et al., Effect of exercise on insulin action in human skeletal muscle.
Journal of Applied Physiology, 1989. 66(2): p. 876-885.
124. Richter, E.A., et al., Muscle glucose metabolism following exercise in the rat:
increased sensitivity to insulin. Journal of Clinical Investigation, 1982. 69(4): p. 785.
125. Bogardus, C., et al., Effect of muscle glycogen depletion on in vivo insulin action in
man. Journal of Clinical Investigation, 1983. 72(5): p. 1605.
126. Wolfe, R.R., et al., Role of triglyceride-fatty acid cycle in controlling fat metabolism
in humans during and after exercise. American Journal of Physiology-Endocrinology
And Metabolism, 1990. 258(2): p. E382-E389.
127. Rasmussen, B.B. and R.R. Wolfe, Regulation of fatty acid oxidation in skeletal
muscle. Annual review of nutrition, 1999. 19(1): p. 463-484.
128. van Loon, L.J., Intramyocellular triacylglycerol as a substrate source during exercise.
Proceedings of the Nutrition Society, 2004. 63(02): p. 301-307.
129. Hood, D.A., et al., Coordination of metabolic plasticity in skeletal muscle. Journal of
experimental biology, 2006. 209(12): p. 2265-2275.
130. Tarnopolsky, M.A., et al., Influence of endurance exercise training and sex on
intramyocellular lipid and mitochondrial ultrastructure, substrate use, and
mitochondrial enzyme activity. American Journal of Physiology-Regulatory,
Integrative and Comparative Physiology, 2007. 292(3): p. R1271-R1278.
131. Kiens, B. and E.A. Richter, Utilization of skeletal muscle triacylglycerol during
postexercise recovery in humans. American Journal of Physiology-Endocrinology
And Metabolism, 1998. 275(2): p. E332-E337.
132. Hurley, B., et al., Muscle triglyceride utilization during exercise: effect of training.
Journal of applied Physiology, 1986. 60(2): p. 562-567.
133. Martin, W.d., et al., Effect of endurance training on plasma free fatty acid turnover
and oxidation during exercise. American Journal of Physiology-Endocrinology And
Metabolism, 1993. 265(5): p. E708-E714.
134. Prats, C., et al., Decrease in intramuscular lipid droplets and translocation of HSL in
response to muscle contraction and epinephrine. Journal of lipid research, 2006.
47(11): p. 2392-2399.
62
135. Jocken, J.W., et al., Hormone-sensitive lipase serine phosphorylation and glycerol
exchange across skeletal muscle in lean and obese subjects. Diabetes, 2008. 57(7): p.
1834-1841.
136. Alsted, T.J., et al., Contraction‐induced lipolysis is not impaired by inhibition of
hormone‐sensitive lipase in skeletal muscle. The Journal of physiology, 2013.
591(20): p. 5141-5155.
137. Turcotte, L.P., et al., Contraction-induced increase in Vmax of palmitate uptake and
oxidation in perfused skeletal muscle. Journal of Applied Physiology, 1998. 84(5): p.
1788-1794.
138. Turcotte, L.P., E.A. Richter, and B. Kiens, Increased plasma FFA uptake and
oxidation during prolonged exercise in trained vs. untrained humans. American
Journal of Physiology-Endocrinology And Metabolism, 1992. 262(6): p. E791-E799.
139. Turcotte, L.P. and J.S. Fisher, Skeletal muscle insulin resistance: roles of fatty acid
metabolism and exercise. Physical therapy, 2008. 88(11): p. 1279-1296.
140. Romijn, J., et al., Regulation of endogenous fat and carbohydrate metabolism in
relation to exercise intensity and duration. American Journal of Physiology-
Endocrinology And Metabolism, 1993. 265(3): p. E380-E391.
141. Horowitz, J.F., et al., Effect of endurance training on lipid metabolism in women: a
potential role for PPARα in the metabolic response to training. American Journal of
Physiology-Endocrinology And Metabolism, 2000. 279(2): p. E348-E355.
142. Tunstall, R.J., et al., Exercise training increases lipid metabolism gene expression in
human skeletal muscle. American Journal of Physiology-Endocrinology and
Metabolism, 2002. 283(1): p. E66-E72.
143. Bruce, C.R., et al., Endurance training in obese humans improves glucose tolerance
and mitochondrial fatty acid oxidation and alters muscle lipid content. American
Journal of Physiology-Endocrinology and Metabolism, 2006. 291(1): p. E99-E107.
144. Kuhl, J.E., et al., Exercise training decreases the concentration of malonyl-CoA and
increases the expression and activity of malonyl-CoA decarboxylase in human muscle.
American Journal of Physiology-Endocrinology and Metabolism, 2006. 290(6): p.
E1296-E1303.
145. Eriksen, L., et al., Comparison of the effect of multiple short-duration with single
long-duration exercise sessions on glucose homeostasis in type 2 diabetes mellitus.
Diabetologia, 2007. 50(11): p. 2245-2253.
146. van Hall, G., Lactate kinetics in human tissues at rest and during exercise. Acta
physiologica, 2010. 199(4): p. 499-508.
147. van Hall, G., et al., Leg and arm lactate and substrate kinetics during exercise.
American Journal of Physiology-Endocrinology And Metabolism, 2003. 284(1): p.
E193-E205.
148. Donovan, C.M. and M.J. Pagliassotti, Quantitative assessment of pathways for lactate
disposal in skeletal muscle fiber types. Medicine and Science in Sports and Exercise,
2000. 32(4): p. 772-777.
149. Gladden, L.B., The role of skeletal muscle in lactate exchange during exercise:
introduction. Medicine & Science in Sports & Exercise, 2000. 32(4): p. 753-755.
150. Gladden, L.B., Muscle as a consumer of lactate. Medicine and Science in Sports and
Exercise, 2000. 32(4): p. 764-771.
151. Amati, F., et al., Skeletal muscle triglycerides, diacylglycerols, and ceramides in
insulin resistance. Diabetes, 2011. 60(10): p. 2588-2597.
152. Dubé, J.J., et al., Exercise-induced alterations in intramyocellular lipids and insulin
resistance: the athlete's paradox revisited. American Journal of Physiology-
Endocrinology and Metabolism, 2008. 294(5): p. E882-E888.
63
153. Pruchnic, R., et al., Exercise training increases intramyocellular lipid and oxidative
capacity in older adults. American Journal of Physiology-Endocrinology and
Metabolism, 2004. 287(5): p. E857-E862.
154. Pilegaard, H., B. Saltin, and P.D. Neufer, Exercise induces transient transcriptional
activation of the PGC‐1α gene in human skeletal muscle. The Journal of
physiology, 2003. 546(3): p. 851-858.
155. Luquet, S., et al., Peroxisome proliferator-activated receptor δ controls muscle
development and oxidative capability. The FASEB Journal, 2003. 17(15): p. 2299-
2301.
156. Little, J.P., et al., Acute endurance exercise increases the nuclear abundance of PGC-
1α in trained human skeletal muscle. American Journal of Physiology-Regulatory,
Integrative and Comparative Physiology, 2010. 298(4): p. R912-R917.
157. Little, J.P., et al., An acute bout of high-intensity interval training increases the
nuclear abundance of PGC-1α and activates mitochondrial biogenesis in human
skeletal muscle. American Journal of Physiology-Regulatory, Integrative and
Comparative Physiology, 2011. 300(6): p. R1303-R1310.
158. Nikolic, N., et al., Overexpression of PGC-1alpha increases fatty acid oxidative
capacity of human skeletal muscle cells. Biochem Res Int, 2012. 2012: p. 714074.
159. Yamaguchi, T., et al., Continuous mild heat stress induces differentiation of
mammalian myoblasts, shifting fiber type from fast to slow. American Journal of
Physiology-Cell Physiology, 2010. 298(1): p. C140-C148.
160. Takikita, S., et al., Fiber type conversion by PGC-1α activates lysosomal and
autophagosomal biogenesis in both unaffected and Pompe skeletal muscle. PloS one,
2010. 5(12): p. e15239.
161. Rasbach, K.A., et al., PGC-1α regulates a HIF2α-dependent switch in skeletal muscle
fiber types. Proceedings of the National Academy of Sciences, 2010. 107(50): p.
21866-21871.
162. Watt, M.J. and L.L. Spriet, Regulation and role of hormone-sensitive lipase activity in
human skeletal muscle. Proceedings of the Nutrition Society, 2004. 63(02): p. 315-
322.
163. Hardy, O.T., M.P. Czech, and S. Corvera, What causes the insulin resistance
underlying obesity? Current opinion in endocrinology, diabetes, and obesity, 2012.
19(2): p. 81.
164. Abdul-Ghani, M.A. and R.A. DeFronzo, Pathogenesis of insulin resistance in skeletal
muscle. BioMed Research International, 2010. 2010.
165. Gastaldelli, A., et al., Metabolic effects of visceral fat accumulation in type 2 diabetes.
The Journal of Clinical Endocrinology & Metabolism, 2002. 87(11): p. 5098-5103.
166. Preis, S.R., et al., Abdominal subcutaneous and visceral adipose tissue and insulin
resistance in the Framingham heart study. Obesity, 2010. 18(11): p. 2191-2198.
167. Arner, P. and M. Ryden, Fatty acids, obesity and insulin resistance. Obesity facts,
2015. 8(2): p. 147-155.
168. Eckardt, K., A. Taube, and J. Eckel, Obesity-associated insulin resistance in skeletal
muscle: role of lipid accumulation and physical inactivity. Reviews in Endocrine and
Metabolic Disorders, 2011. 12(3): p. 163-172.
169. Van Herpen, N. and V. Schrauwen-Hinderling, Lipid accumulation in non-adipose
tissue and lipotoxicity. Physiology & behavior, 2008. 94(2): p. 231-241.
170. Wellen, K.E. and G.S. Hotamisligil, Inflammation, stress, and diabetes. The Journal
of clinical investigation, 2005. 115(5): p. 1111-1119.
64
171. Sell, H., J. Eckel, and D. Dietze-Schroeder, Pathways leading to muscle insulin
resistance–the muscle–fat connection. Archives of physiology and biochemistry, 2006.
112(2): p. 105-113.
172. Taube, A., et al., Adipokines promote lipotoxicity in human skeletal muscle cells.
Archives of physiology and biochemistry, 2012. 118(3): p. 92-101.
173. Greenberg, A.S. and M.S. Obin, Obesity and the role of adipose tissue in
inflammation and metabolism. The American journal of clinical nutrition, 2006. 83(2):
p. 461S-465S.
174. de Ferranti, S. and D. Mozaffarian, The perfect storm: obesity, adipocyte dysfunction,
and metabolic consequences. Clinical chemistry, 2008. 54(6): p. 945-955.
175. Kalupahana, N.S., N. Moustaid-Moussa, and K.J. Claycombe, Immunity as a link
between obesity and insulin resistance. Molecular aspects of medicine, 2012. 33(1): p.
26-34.
176. Eckardt, K., H. Sell, and J. Eckel, Novel aspects of adipocyte-induced skeletal muscle
insulin resistance. Archives of physiology and biochemistry, 2008. 114(4): p. 287-298.
177. Fabbrini, E., et al., Intrahepatic fat, not visceral fat, is linked with metabolic
complications of obesity. Proceedings of the National Academy of Sciences, 2009.
106(36): p. 15430-15435.
178. Oliveros, E., et al., The concept of normal weight obesity. Progress in cardiovascular
diseases, 2014. 56(4): p. 426-433.
179. Ohlson, L.-O., et al., The influence of body fat distribution on the incidence of
diabetes mellitus: 13.5 years of follow-up of the participants in the study of men born
in 1913. Diabetes, 1985. 34(10): p. 1055-1058.
180. Rexrode, K.M., et al., Abdominal adiposity and coronary heart disease in women.
Jama, 1998. 280(21): p. 1843-1848.
181. Alberti, K.G.M., P. Zimmet, and J. Shaw, International Diabetes Federation: a
consensus on Type 2 diabetes prevention. Diabetic Medicine, 2007. 24(5): p. 451-463.
182. Waist Circumference and Waist-Hip Ratio. 2008 [cited 2017, 20.02.]; 1st
edition:[Available from: https://www.dietistas-nutricionistas.com/wp-
content/uploads/2014/11/Waist-Circumference-and-Waist-Hip-Ratio.pdf].
183. Chaput, J.-P. and A. Tremblay, Obesity and physical inactivity: the relevance of
reconsidering the notion of sedentariness. Obesity facts, 2009. 2(4): p. 249-254.
184. Haslam, D.W. and W.P. James, Obesity. Lancet, 2005. 366(9492): p. 1197-209.
185. Tamashiro, K., et al., Chronic stress, metabolism, and metabolic syndrome. Stress,
2011. 14(5): p. 468-474.
186. Moran, C.P. and F. Shanahan, Gut microbiota and obesity: role in aetiology and
potential therapeutic target. Best practice & research Clinical gastroenterology, 2014.
28(4): p. 585-597.
187. Trayhurn, P. and I.S. Wood, Adipokines: inflammation and the pleiotropic role of
white adipose tissue. British Journal of Nutrition, 2004. 92(03): p. 347-355.
188. Tremaroli, V. and F. Bäckhed, Functional interactions between the gut microbiota
and host metabolism. Nature, 2012. 489(7415): p. 242-249.
189. Cox, A.J., N.P. West, and A.W. Cripps, Obesity, inflammation, and the gut
microbiota. The lancet Diabetes & endocrinology, 2015. 3(3): p. 207-215.
190. Kissebah, A.H. and G.R. Krakower, Regional adiposity and morbidity. Physiological
reviews, 1994. 74(4): p. 761-812.
191. Haslam, D., Obesity and diabetes: the links and common approaches. Primary care
diabetes, 2010. 4(2): p. 105-112.
192. Smyth, S. and A. Heron, Diabetes and obesity: the twin epidemics. Nature medicine,
2006. 12(1): p. 75-80.
65
193. Pierce, M., H. Keen, and C. Bradley, Risk of Diabetes in Offspring of Parents with
Non‐insulin‐dependent Diabetes. Diabetic medicine, 1995. 12(1): p. 6-13.
194. Groop, L., et al., Metabolic consequences of a family history of NIDDM (the Botnia
study): evidence for sex-specific parental effects. Diabetes, 1996. 45(11): p. 1585-
1593.
195. Petersen, K.F., et al., Impaired mitochondrial activity in the insulin-resistant offspring
of patients with type 2 diabetes. New England Journal of Medicine, 2004. 350(7): p.
664-671.
196. Herder, C. and M. Roden, Genetics of type 2 diabetes: pathophysiologic and clinical
relevance. European journal of clinical investigation, 2011. 41(6): p. 679-692.
197. Ripsin, C.M., H. Kang, and R.J. Urban, Management of blood glucose in type 2
diabetes mellitus. Am Fam Physician, 2009. 79(1): p. 29-36.
198. Tuomilehto, J., et al., Prevention of type 2 diabetes mellitus by changes in lifestyle
among subjects with impaired glucose tolerance. New England Journal of Medicine,
2001. 344(18): p. 1343-1350.
199. Pedersen, B.K., The diseasome of physical inactivity–and the role of myokines in
muscle–fat cross talk. The Journal of physiology, 2009. 587(23): p. 5559-5568.
200. Strasser, B. and D. Pesta, Resistance training for diabetes prevention and therapy:
experimental findings and molecular mechanisms. BioMed research international,
2013. 2013.
201. Gillies, C.L., et al., Pharmacological and lifestyle interventions to prevent or delay
type 2 diabetes in people with impaired glucose tolerance: systematic review and
meta-analysis. Bmj, 2007. 334(7588): p. 299.
202. Støa, E.M., et al., High-intensity aerobic interval training improves aerobic fitness
and HbA1c among persons diagnosed with type 2 diabetes. European Journal of
Applied Physiology, 2017: p. 1-13.
203. International Diabetes Federation. IDF Diabetes Atlas. 2015 [cited 2017, 21.02.]; 7th
edition:[Available from: http://www.diabetesatlas.org/].
204. Bonen, A., et al., Triacylglycerol accumulation in human obesity and type 2 diabetes
is associated with increased rates of skeletal muscle fatty acid transport and
increased sarcolemmal FAT/CD36. The FASEB Journal, 2004. 18(10): p. 1144-1146.
205. Pan, D., et al., Skeletal muscle triglyceride levels are inversely related to insulin
action. Diabetes, 1997. 46(6): p. 983-988.
206. Powell, D.J., et al., Intracellular ceramide synthesis and protein kinase Cζ activation
play an essential role in palmitate-induced insulin resistance in rat L6 skeletal muscle
cells. Biochemical Journal, 2004. 382(2): p. 619-629.
207. Itani, S.I., et al., Lipid-induced insulin resistance in human muscle is associated with
changes in diacylglycerol, protein kinase C, and IκB-α. Diabetes, 2002. 51(7): p.
2005-2011.
208. Cooney, G., et al., Muscle long‐chain acyl CoA esters and insulin resistance. Annals
of the New York Academy of Sciences, 2002. 967(1): p. 196-207.
209. Kelley, D.E., B.H. Goodpaster, and L. Storlien, Muscle triglyceride and insulin
resistance. Annual review of nutrition, 2002. 22(1): p. 325-346.
210. Roden, M., Muscle triglycerides and mitochondrial function: possible mechanisms for
the development of type 2 diabetes. International Journal of Obesity, 2005. 29: p.
S111-S115.
211. Russell, A., Lipotoxicity: the obese and endurance-trained paradox. International
Journal of Obesity, 2004. 28: p. S66-S71.
212. Van Loon, L.J., et al., Intramyocellular lipid content in type 2 diabetes patients
compared with overweight sedentary men and highly trained endurance athletes.
66
American Journal of Physiology-Endocrinology And Metabolism, 2004. 287(3): p.
E558-E565.
213. Gray, R.E., et al., Effect of weight loss on muscle lipid content in morbidly obese
subjects. American Journal of Physiology-Endocrinology and Metabolism, 2003.
284(4): p. E726-E732.
214. Toledo, F.G., et al., Mitochondrial capacity in skeletal muscle is not stimulated by
weight loss despite increases in insulin action and decreases in intramyocellular lipid
content. Diabetes, 2008. 57(4): p. 987-994.
215. Chavez, J.A. and S.A. Summers, Characterizing the effects of saturated fatty acids on
insulin signaling and ceramide and diacylglycerol accumulation in 3T3-L1 adipocytes
and C2C12 myotubes. Archives of biochemistry and biophysics, 2003. 419(2): p. 101-
109.
216. Ellis, B.A., et al., Long-chain acyl-CoA esters as indicators of lipid metabolism and
insulin sensitivity in rat and human muscle. American Journal of Physiology-
Endocrinology And Metabolism, 2000. 279(3): p. E554-E560.
217. Straczkowski, M., et al., Increased skeletal muscle ceramide level in men at risk of
developing type 2 diabetes. Diabetologia, 2007. 50(11): p. 2366-2373.
218. Stratford, S., et al., Regulation of insulin action by ceramide dual mechanisms linking
ceramide accumulation to the inhibition of Akt/protein kinase B. Journal of Biological
Chemistry, 2004. 279(35): p. 36608-36615.
219. Adams, J.M., et al., Ceramide content is increased in skeletal muscle from obese
insulin-resistant humans. Diabetes, 2004. 53(1): p. 25-31.
220. Coen, P.M., et al., Insulin resistance is associated with higher intramyocellular
triglycerides in type I but not type II myocytes concomitant with higher ceramide
content. Diabetes, 2009.
221. Schmitz‐Peiffer, C., Protein kinase C and lipid‐induced insulin resistance in
skeletal muscle. Annals of the New York Academy of Sciences, 2002. 967(1): p. 146-
157.
222. Bergman, B., et al., Localisation and composition of skeletal muscle diacylglycerol
predicts insulin resistance in humans. Diabetologia, 2012. 55(4): p. 1140-1150.
223. Ara, I., et al., Normal mitochondrial function and increased fat oxidation capacity in
leg and arm muscles in obese humans. International journal of obesity, 2011. 35(1): p.
99-108.
224. Turner, N., et al., Excess lipid availability increases mitochondrial fatty acid oxidative
capacity in muscle. Diabetes, 2007. 56(8): p. 2085-2092.
225. Phillips, S.A., et al., Adipocyte Differentiation‐related Protein in Human Skeletal
Muscle: Relationship to Insulin Sensitivity. Obesity research, 2005. 13(8): p. 1321-
1329.
226. Shepherd, S.O., et al., Sprint interval and traditional endurance training increase net
intramuscular triglyceride breakdown and expression of perilipin 2 and 5. The
Journal of physiology, 2013. 591(3): p. 657-675.
227. Shepherd, S.O., et al., Resistance training increases skeletal muscle oxidative
capacity and net intramuscular triglyceride breakdown in type I and II fibres of
sedentary males. Exp Physiol, 2014. 99(6): p. 894-908.
228. Minnaard, R., et al., Adipocyte differentiation-related protein and OXPAT in rat and
human skeletal muscle: involvement in lipid accumulation and type 2 diabetes
mellitus. The Journal of Clinical Endocrinology & Metabolism, 2009. 94(10): p.
4077-4085.
67
229. Wang, Z., et al., Evaluation of specific metabolic rates of major organs and tissues:
comparison between men and women. American Journal of Human Biology, 2011.
23(3): p. 333-338.
230. Haugaard, S., et al., Intramyocellular triglyceride content in man, influence of sex,
obesity and glycaemic control. European Journal of Endocrinology, 2009. 161(1): p.
57-64.
231. Steffensen, C., et al., Myocellular triacylglycerol breakdown in females but not in
males during exercise. American Journal of Physiology-Endocrinology and
Metabolism, 2002. 282(3): p. E634-E642.
232. Moro, C., et al., Influence of gender, obesity, and muscle lipase activity on
intramyocellular lipids in sedentary individuals. The Journal of Clinical
Endocrinology & Metabolism, 2009. 94(9): p. 3440-3447.
233. Kiens, B., et al., Lipid-binding proteins and lipoprotein lipase activity in human
skeletal muscle: influence of physical activity and gender. Journal of Applied
Physiology, 2004. 97(4): p. 1209-1218.
234. Simoneau, J. and C. Bouchard, Human variation in skeletal muscle fiber-type
proportion and enzyme activities. American Journal of Physiology-Endocrinology
And Metabolism, 1989. 257(4): p. E567-E572.
235. Høeg, L., et al., Higher intramuscular triacylglycerol in women does not impair
insulin sensitivity and proximal insulin signaling. Journal of Applied Physiology,
2009. 107(3): p. 824-831.
236. Regitz-Zagrosek, V., E. Lehmkuhl, and M. Weickert, Gender differences in the
metabolic syndrome and their role for cardiovascular disease. Clinical Research in
Cardiology, 2006. 95(3): p. 147-147.
237. Salehzadeh, F., et al., Testosterone or 17β-estradiol exposure reveals sex-specific
effects on glucose and lipid metabolism in human myotubes. Journal of Endocrinology,
2011. 210(2): p. 219-229.
238. Rune, A., et al., Evidence against a sexual dimorphism in glucose and fatty acid
metabolism in skeletal muscle cultures from age‐matched men and post‐menopausal women. Acta physiologica, 2009. 197(3): p. 207-215.
239. Johannsen, D., et al., Ectopic lipid accumulation and reduced glucose tolerance in
elderly adults are accompanied by altered skeletal muscle mitochondrial activity. The
Journal of Clinical Endocrinology & Metabolism, 2011. 97(1): p. 242-250.
240. Lanza, I. and K. Nair, Muscle mitochondrial changes with aging and exercise. The
American journal of clinical nutrition, 2009. 89(1): p. 467S-471S.
241. Ryan, A., Insulin resistance with aging: effects of diet and exercise. Sports medicine,
2000. 30(5): p. 327-346.
242. Crane, J., et al., The effect of aging on human skeletal muscle mitochondrial and
intramyocellular lipid ultrastructure. The Journals of Gerontology Series A:
Biological Sciences and Medical Sciences, 2010. 65(2): p. 119-128.
243. D'Antona, G., et al., The effect of ageing and immobilization on structure and function
of human skeletal muscle fibres. The Journal of physiology, 2003. 552(2): p. 499-511.
244. Lexell, J., C. Taylor, and M. Sjöström, What is the cause of the ageing atrophy?:
Total number, size and proportion of different fiber types studied in whole vastus
lateralis muscle from 15-to 83-year-old men. Journal of the neurological sciences,
1988. 84(2): p. 275-294.
245. Nilsson, E., et al., Regulation of skeletal muscle PPARδ mRNA expression in twins.
The Journal of physiology, 2007. 584(3): p. 1011-1017.

68
246. Rooyackers, O., et al., Effect of age on in vivo rates of mitochondrial protein synthesis
in human skeletal muscle. Proceedings of the National Academy of Sciences, 1996.
93(26): p. 15364-15369.
247. Hebert, S., I. Lanza, and K. Nair, Mitochondrial DNA alterations and reduced
mitochondrial function in aging. Mechanisms of ageing and development, 2010.
131(7): p. 451-462.
248. Welle, S., et al., Reduced amount of mitochondrial DNA in aged human muscle.
Journal of applied physiology, 2003. 94(4): p. 1479-1484.
249. Short, K., et al., Decline in skeletal muscle mitochondrial function with aging in
humans. Proceedings of the National Academy of Sciences of the United States of
America, 2005. 102(15): p. 5618-5623.
250. Lanza, I., et al., Endurance exercise as a countermeasure for aging. Diabetes, 2008.
57(11): p. 2933-2942.
251. Coggan, A., et al., Skeletal muscle adaptations to endurance training in 60-to 70-yr-
old men and women. Journal of Applied Physiology, 1992. 72(5): p. 1780-1786.
252. Short, K., et al., Impact of aerobic exercise training on age-related changes in insulin
sensitivity and muscle oxidative capacity. Diabetes, 2003. 52(8): p. 1888-1896.
253. Lanza, I. and K. Nair, Regulation of skeletal muscle mitochondrial function: genes to
proteins. Acta Physiologica, 2010. 199(4): p. 529-547.
254. Langleite, T.M., et al., Insulin sensitivity, body composition and adipose depots
following 12 w combined endurance and strength training in dysglycemic and
normoglycemic sedentary men. Archives of Physiology and Biochemistry, 2016.
122(4): p. 167-179.
255. Reaven, G.M., J. Moore, and M. Greenfield, Quantification of insulin secretion and in
vivo insulin action in nonobese and moderately obese individuals with normal glucose
tolerance. Diabetes, 1983. 32(7): p. 600-604.
256. Defronzo, R., et al., Insulin sensitivity and insulin binding to monocytes in maturity-
onset diabetes. J Clin Invest, 1979. 63(5): p. 939-946.
257. Sandvei, M., et al., Sprint interval running increases insulin sensitivity in young
healthy subjects. Archives of physiology and biochemistry, 2012. 118(3): p. 139-147.
258. Borg, G., P. Hassmén, and M. Lagerström, Perceived exertion related to heart rate
and blood lactate during arm and leg exercise. European journal of applied
physiology and occupational physiology, 1987. 56(6): p. 679-685.
259. Buckley, J.P. and G.A. Borg, Borg’s scales in strength training; from theory to
practice in young and older adults. Applied physiology, nutrition, and metabolism,
2011. 36(5): p. 682-692.
260. Henry, R., et al., Insulin action and glucose metabolism in nondiabetic control and
NIDDM subjects: comparison using human skeletal muscle cell cultures. Diabetes,
1995. 44(8): p. 936-946.
261. Gaster, M., H. Beck-Nielsen, and H. Schrøder, Proliferation conditions for human
satellite cells The fractional content of satellite cells. Apmis, 2001. 109(11): p. 726-
734.
262. Gaster, M., et al., A cellular model system of differentiated human myotubes. Apmis,
2001. 109(11): p. 735-744.
263. Al-Khalili, L., et al., Insulin action in cultured human skeletal muscle cells during
differentiation: assessment of cell surface GLUT4 and GLUT1 content. Cellular and
Molecular Life Sciences CMLS, 2003. 60(5): p. 991-998.
264. Muoio, D., et al., Peroxisome proliferator-activated receptor-α regulates fatty acid
utilization in primary human skeletal muscle cells. Diabetes, 2002. 51(4): p. 901-909.
69
265. Berggren, J., C. Tanner, and J. Houmard, Primary cell cultures in the study of human
muscle metabolism. Exercise and sport sciences reviews, 2007. 35(2): p. 56-61.
266. Aas, V., et al., Are cultured human myotubes far from home? Cell and tissue research,
2013. 354(3): p. 671-682.
267. Kowalski, G.M. and C.R. Bruce, The regulation of glucose metabolism: implications
and considerations for the assessment of glucose homeostasis in rodents. American
Journal of Physiology-Endocrinology and Metabolism, 2014. 307(10): p. E859-E871.
268. Sarabia, V., et al., Glucose transport in human skeletal muscle cells in culture.
Stimulation by insulin and metformin. Journal of Clinical Investigation, 1992. 90(4): p.
1386.
269. Aas, V., et al., Electrical stimulation improves insulin responses in a human skeletal
muscle cell model of hyperglycemia. Annals of the New York Academy of Sciences,
2002. 967(1): p. 506-515.
270. Bonavaud, S., et al., A discrepancy resolved: human satellite cells are not
preprogrammed to fast and slow lineages. Neuromuscular Disorders, 2001. 11(8): p.
747-752.
271. LaFramboise, W., et al., Effect of muscle origin and phenotype on satellite cell
muscle-specific gene expression. Journal of molecular and cellular cardiology, 2003.
35(10): p. 1307-1318.
272. Feng, Y.Z., et al., PPARδ activation in human myotubes increases mitochondrial fatty
acid oxidative capacity and reduces glucose utilization by a switch in substrate
preference. Archives of physiology and biochemistry, 2014. 120(1): p. 12-21.
273. Schiaffino, S., et al., Developmental myosins: expression patterns and functional
significance. Skeletal muscle, 2015. 5(1): p. 22.
274. Nikolić, N., et al., Electrical pulse stimulation of cultured human skeletal muscle cells
as an in vitro model of exercise. PloS one, 2012. 7(3): p. e33203.
275. Gaster, M., et al., The Diabetic Phenotype Is Conserved in Myotubes Established
From Diabetic Subjects. Diabetes, 2002. 51(4): p. 921-927.
276. Henry, R.R., et al., Glycogen synthase activity is reduced in cultured skeletal muscle
cells of non-insulin-dependent diabetes mellitus subjects. Biochemical and molecular
mechanisms. Journal of Clinical Investigation, 1996. 98(5): p. 1231.
277. Gaster, M., Metabolic flexibility is conserved in diabetic myotubes. Journal of lipid
research, 2007. 48(1): p. 207-217.
278. Ling, C. and L. Groop, Epigenetics: a molecular link between environmental factors
and type 2 diabetes. Diabetes, 2009. 58(12): p. 2718-2725.
279. Barres, R., et al., Acute exercise remodels promoter methylation in human skeletal
muscle. Cell metabolism, 2012. 15(3): p. 405-411.
280. Nehlin, J.O., et al., Human myotubes from myoblast cultures undergoing senescence
exhibit defects in glucose and lipid metabolism. Biogerontology, 2011. 12(4): p. 349-
365.
281. Wensaas, A., et al., Cell-based multiwell assays for the detection of substrate
accumulation and oxidation. Journal of lipid research, 2007. 48(4): p. 961-967.
282. Bezaire, V., et al., Contribution of adipose triglyceride lipase and hormone-sensitive
lipase to lipolysis in hMADS adipocytes. Journal of Biological Chemistry, 2009.
284(27): p. 18282-18291.
283. Bakke, S.S., et al., Palmitic acid follows a different metabolic pathway than oleic acid
in human skeletal muscle cells; lower lipolysis rate despite an increased level of
adipose triglyceride lipase. Biochimica et Biophysica Acta (BBA)-Molecular and
Cell Biology of Lipids, 2012. 1821(10): p. 1323-1333.
70
284. Kase, E.T., et al., Primary defects in lipolysis and insulin action in skeletal muscle
cells from type 2 diabetic individuals. Biochimica et Biophysica Acta (BBA)-
Molecular and Cell Biology of Lipids, 2015. 1851(9): p. 1194-1201.
285. Igal, R.A., W. Ping, and R.A. Coleman, Triacsin C blocks de novo synthesis of
glycerolipids and cholesterol esters but not recycling of fatty acid into phospholipid:
evidence for functionally separate pools of acyl-CoA. Biochemical Journal, 1997.
324(2): p. 529-534.
286. Grisouard, J., et al., Both inflammatory and classical lipolytic pathways are involved
in lipopolysaccharide-induced lipolysis in human adipocytes. Innate immunity, 2012.
18(1): p. 25-34.
287. Mayer, N., et al., Development of small-molecule inhibitors targeting adipose
triglyceride lipase. Nature chemical biology, 2013. 9(12): p. 785-787.
288. Hughson, R.L., K.H. Weisiger, and G.D. Swanson, Blood lactate concentration
increases as a continuous function in progressive exercise. Journal of Applied
Physiology, 1987. 62(5): p. 1975-1981.
289. Kamijo, Y., et al., Plasma lactate concentration and muscle blood flow during
dynamic exercise with negative-pressure breathing. Journal of applied physiology,
2000. 89(6): p. 2196-2205.
290. Barrès, R., et al., Non-CpG methylation of the PGC-1α promoter through DNMT3B
controls mitochondrial density. Cell metabolism, 2009. 10(3): p. 189-198.
291. Nitert, M.D., et al., Impact of an exercise intervention on DNA methylation in skeletal
muscle from first-degree relatives of patients with type 2 diabetes. Diabetes, 2012.
61(12): p. 3322-3332.
292. Lindholm, M.E., et al., An integrative analysis reveals coordinated reprogramming of
the epigenome and the transcriptome in human skeletal muscle after training.
Epigenetics, 2014. 9(12): p. 1557-1569.
293. Sano, H., et al., Insulin-stimulated phosphorylation of a Rab GTPase-activating
protein regulates GLUT4 translocation. J Biol Chem, 2003. 278(17): p. 14599-602.
294. Kane, S., et al., A method to identify serine kinase substrates. Akt phosphorylates a
novel adipocyte protein with a Rab GTPase-activating protein (GAP) domain. J Biol
Chem, 2002. 277(25): p. 22115-8.
295. Vanhaesebroeck, B. and D.R. Alessi, The PI3K–PDK1 connection: more than just a
road to PKB. Biochemical Journal, 2000. 346(3): p. 561-576.
296. Coffer, P.J., J. Jing, and J.R. Woodgett, Protein kinase B (c-Akt): a multifunctional
mediator of phosphatidylinositol 3-kinase activation. Biochemical Journal, 1998.
335(1): p. 1-13.
297. Myers Jr, M.G. and M.F. White, Insulin signal transduction and the IRS proteins.
Annual review of pharmacology and toxicology, 1996. 36(1): p. 615-658.
298. Ravichandran, L.V., et al., Protein kinase C-ζ phosphorylates insulin receptor
substrate-1 and impairs its ability to activate phosphatidylinositol 3-kinase in
response to insulin. Journal of Biological Chemistry, 2001. 276(5): p. 3543-3549.
299. Yenush, L. and M.F. White, The IRS‐signalling system during insulin and cytokine
action. Bioessays, 1997. 19(6): p. 491-500.
300. Cengel, K.A. and G.G. Freund, JAK1-dependent phosphorylation of insulin receptor
substrate-1 (IRS-1) is inhibited by IRS-1 serine phosphorylation. Journal of Biological
Chemistry, 1999. 274(39): p. 27969-27974.
301. Morino, K., et al., Reduced mitochondrial density and increased IRS-1 serine
phosphorylation in muscle of insulin-resistant offspring of type 2 diabetic parents.
The Journal of clinical investigation, 2005. 115(12): p. 3587-3593.
71
302. Bouzakri, K., et al., Reduced activation of phosphatidylinositol-3 kinase and
increased serine 636 phosphorylation of insulin receptor substrate-1 in primary
culture of skeletal muscle cells from patients with type 2 diabetes. Diabetes, 2003.
52(6): p. 1319-1325.
303. Carling, D., The AMP-activated protein kinase cascade--a unifying system for energy
control. Trends Biochem Sci, 2004. 29(1): p. 18-24.
304. Hawley, S.A., et al., Characterization of the AMP-activated protein kinase kinase
from rat liver and identification of threonine 172 as the major site at which it
phosphorylates AMP-activated protein kinase. J Biol Chem, 1996. 271(44): p. 27879-
87.
305. Lizcano, J.M., et al., LKB1 is a master kinase that activates 13 kinases of the AMPK
subfamily, including MARK/PAR-1. Embo j, 2004. 23(4): p. 833-43.
306. Shaw, R.J., et al., The tumor suppressor LKB1 kinase directly activates AMP-
activated kinase and regulates apoptosis in response to energy stress. Proc Natl Acad
Sci U S A, 2004. 101(10): p. 3329-35.
307. Woods, A., et al., Identification of phosphorylation sites in AMP-activated protein
kinase (AMPK) for upstream AMPK kinases and study of their roles by site-directed
mutagenesis. J Biol Chem, 2003. 278(31): p. 28434-42.
308. Listenberger, L.L. and D.A. Brown, Fluorescent detection of lipid droplets and
associated proteins. Current Protocols in Cell Biology, 2007: p. 24.2. 1-24.2. 11.
309. Kim, J.-Y., et al., Lipid oxidation is reduced in obese human skeletal muscle.
American Journal of Physiology-Endocrinology And Metabolism, 2000. 279(5): p.
E1039-E1044.
310. Buck, M.J., T.L. Squire, and M.T. Andrews, Coordinate expression of the PDK4 gene:
a means of regulating fuel selection in a hibernating mammal. Physiological
genomics, 2002. 8(1): p. 5-13.
311. Bourlier, V., et al., Enhanced glucose metabolism is preserved in cultured primary
myotubes from obese donors in response to exercise training. The Journal of Clinical
Endocrinology & Metabolism, 2013. 98(9): p. 3739-3747.
312. Nestor, C.E., et al., Rapid reprogramming of epigenetic and transcriptional profiles in
mammalian culture systems. Genome biology, 2015. 16(1): p. 11.
313. Brooks, G.A., Cell–cell and intracellular lactate shuttles. The Journal of physiology,
2009. 587(23): p. 5591-5600.
314. Narkar, V.A., et al., AMPK and PPARδ agonists are exercise mimetics. Cell, 2008.
134(3): p. 405-415.
315. Tanaka, T., et al., Activation of peroxisome proliferator-activated receptor δ induces
fatty acid β-oxidation in skeletal muscle and attenuates metabolic syndrome.
Proceedings of the National Academy of Sciences, 2003. 100(26): p. 15924-15929.
316. Krämer, D.K., et al., Role of AMP kinase and PPARδ in the regulation of lipid and
glucose metabolism in human skeletal muscle. Journal of Biological Chemistry, 2007.
282(27): p. 19313-19320.
317. Rakhshandehroo, M., et al., Peroxisome proliferator-activated receptor alpha target
genes. PPAR research, 2010. 2010.
318. Pilegaard, H., et al., Transcriptional regulation of gene expression in human skeletal
muscle during recovery from exercise. American Journal of Physiology-
Endocrinology And Metabolism, 2000. 279(4): p. E806-E814.
319. Mourtzakis, M., et al., Carbohydrate metabolism during prolonged exercise and
recovery: interactions between pyruvate dehydrogenase, fatty acids, and amino acids.
Journal of Applied Physiology, 2006. 100(6): p. 1822-1830.
72
320. Nordsborg, N., J. Bangsbo, and H. Pilegaard, Effect of high-intensity training on
exercise-induced gene expression specific to ion homeostasis and metabolism. Journal
of applied physiology, 2003. 95(3): p. 1201-1206.
321. Pilegaard, H., B. Saltin, and P.D. Neufer, Effect of short-term fasting and refeeding on
transcriptional regulation of metabolic genes in human skeletal muscle. Diabetes,
2003. 52(3): p. 657-662.
322. Wu, P., et al., Mechanism responsible for inactivation of skeletal muscle pyruvate
dehydrogenase complex in starvation and diabetes. Diabetes, 1999. 48(8): p. 1593-
1599.
323. Holness, M.J., et al., Targeted upregulation of pyruvate dehydrogenase kinase (PDK)-
4 in slow-twitch skeletal muscle underlies the stable modification of the regulatory
characteristics of PDK induced by high-fat feeding. Diabetes, 2000. 49(5): p. 775-781.
324. Peters, S.J., et al., Muscle fiber type comparison of PDH kinase activity and isoform
expression in fed and fasted rats. American Journal of Physiology-Regulatory,
Integrative and Comparative Physiology, 2001. 280(3): p. R661-R668.
325. De Lange, P., et al., Combined cDNA array/RT-PCR analysis of gene expression
profile in rat gastrocnemius muscle: relation to its adaptive function in energy
metabolism during fasting. The FASEB journal, 2004. 18(2): p. 350-352.
326. Muoio, D.M., et al., Fatty acid homeostasis and induction of lipid regulatory genes in
skeletal muscles of peroxisome proliferator-activated receptor (PPAR) α knock-out
mice evidence for compensatory regulation by PPARδ. Journal of Biological
Chemistry, 2002. 277(29): p. 26089-26097.
327. la Cour Poulsen, L., M. Siersbæk, and S. Mandrup. PPARs: fatty acid sensors
controlling metabolism. in Seminars in cell & developmental biology. 2012. Elsevier.
328. Nakamura, M.T., B.E. Yudell, and J.J. Loor, Regulation of energy metabolism by
long-chain fatty acids. Progress in lipid research, 2014. 53: p. 124-144.
329. Neels, J.G. and P.A. Grimaldi, Physiological functions of peroxisome proliferator-
activated receptor β. Physiological reviews, 2014. 94(3): p. 795-858.
330. Abbott, B.D., Review of the expression of peroxisome proliferator-activated receptors
alpha (PPARα), beta (PPARβ), and gamma (PPARγ) in rodent and human
development. Reproductive toxicology, 2009. 27(3): p. 246-257.
331. Ehrenborg, E. and A. Krook, Regulation of skeletal muscle physiology and
metabolism by peroxisome proliferator-activated receptor δ. Pharmacological reviews,
2009. 61(3): p. 373-393.
332. Azhar, S., Peroxisome proliferator-activated receptors, metabolic syndrome and
cardiovascular disease. Future cardiology, 2010. 6(5): p. 657-691.
333. McManaman, J.L., et al., Perilipin-2-null mice are protected against diet-induced
obesity, adipose inflammation, and fatty liver disease. Journal of lipid research, 2013.
54(5): p. 1346-1359.
334. Bosma, M., et al., Perilipin 2 improves insulin sensitivity in skeletal muscle despite
elevated intramuscular lipid levels. Diabetes, 2012. 61(11): p. 2679-2690.
335. Finck, B.N., et al., A potential link between muscle peroxisome proliferator-activated
receptor-α signaling and obesity-related diabetes. Cell metabolism, 2005. 1(2): p.
133-144.
336. Dressel, U., et al., The peroxisome proliferator-activated receptor β/δ agonist,
GW501516, regulates the expression of genes involved in lipid catabolism and energy
uncoupling in skeletal muscle cells. Molecular Endocrinology, 2003. 17(12): p. 2477-
2493.
73
337. Spriet, L.L., et al., Pyruvate dehydrogenase activation and kinase expression in
human skeletal muscle during fasting. Journal of applied physiology, 2004. 96(6): p.
2082-2087.
338. Sparks, L.M., et al., Nine months of combined training improves ex vivo skeletal
muscle metabolism in individuals with type 2 diabetes. The Journal of Clinical
Endocrinology & Metabolism, 2013. 98(4): p. 1694-1702.
339. Feng, Y.Z., et al., Myotubes from lean and severely obese subjects with and without
type 2 diabetes respond differently to an in vitro model of exercise. American Journal
of Physiology-Cell Physiology, 2015. 308(7): p. C548-C556.
340. Badin, P.-M., D. Langin, and C. Moro, Dynamics of skeletal muscle lipid pools.
Trends in Endocrinology & Metabolism, 2013. 24(12): p. 607-615.
341. Haus, J.M., et al., Intramyocellular lipid content and insulin sensitivity are increased
following a short-term low-glycemic index diet and exercise intervention. American
Journal of Physiology-Endocrinology and Metabolism, 2011. 301(3): p. E511-E516.
342. Jacob, S., et al., Association of increased intramyocellular lipid content with insulin
resistance in lean nondiabetic offspring of type 2 diabetic subjects. Diabetes, 1999.
48(5): p. 1113-1119.
343. Goodpaster, B.H., et al., Intramuscular lipid content is increased in obesity and
decreased by weight loss. Metabolism, 2000. 49(4): p. 467-472.
344. Krssak, M., et al., Intramyocellular lipid concentrations are correlated with insulin
sensitivity in humans: a 1H NMR spectroscopy study. Diabetologia, 1999. 42(1): p.
113-116.
345. Yu, C., et al., Mechanism by which fatty acids inhibit insulin activation of insulin
receptor substrate-1 (IRS-1)-associated phosphatidylinositol 3-kinase activity in
muscle. Journal of Biological Chemistry, 2002. 277(52): p. 50230-50236.
346. Sparks, L.M., et al., Remodeling lipid metabolism and improving insulin
responsiveness in human primary myotubes. PLoS One, 2011. 6(7): p. e21068.
347. Aas, V., et al., Eicosapentaenoic acid (20: 5 n-3) increases fatty acid and glucose
uptake in cultured human skeletal muscle cells. Journal of Lipid Research, 2006.
47(2): p. 366-374.
348. Bosma, M., et al., Re-evaluating lipotoxic triggers in skeletal muscle: relating
intramyocellular lipid metabolism to insulin sensitivity. Progress in lipid research,
2012. 51(1): p. 36-49.
349. Mantzaris, M.D., E.V. Tsianos, and D. Galaris, Interruption of triacylglycerol
synthesis in the endoplasmic reticulum is the initiating event for saturated fatty acid‐induced lipotoxicity in liver cells. Febs Journal, 2011. 278(3): p. 519-530.
350. Coen, P.M. and B.H. Goodpaster, Role of intramyocelluar lipids in human health.
Trends in Endocrinology & Metabolism, 2012. 23(8): p. 391-398.
351. Schenk, S. and J.F. Horowitz, Acute exercise increases triglyceride synthesis in
skeletal muscle and prevents fatty acid–induced insulin resistance. The Journal of
clinical investigation, 2007. 117(6): p. 1690-1698.
352. Bakke, S.S., et al., Myotubes from severely obese type 2 diabetic subjects accumulate
less lipids and show higher lipolytic rate than myotubes from severely obese non-
diabetic subjects. PloS one, 2015. 10(3): p. e0119556.
353. Kim, Y.-B., et al., Insulin-Stimulated Protein Kinase C λ/ζ Activity Is Reduced in
Skeletal Muscle of Humans With Obesity and Type 2 Diabetes. Diabetes, 2003. 52(8):
p. 1935-1942.
354. Bell, M., et al., Consequences of lipid droplet coat protein downregulation in liver
cells. Diabetes, 2008. 57(8): p. 2037-2045.
74
355. Listenberger, L.L., et al., Adipocyte differentiation-related protein reduces the lipid
droplet association of adipose triglyceride lipase and slows triacylglycerol turnover.
Journal of lipid research, 2007. 48(12): p. 2751-2761.
356. Haemmerle, G., et al., Defective lipolysis and altered energy metabolism in mice
lacking adipose triglyceride lipase. Science, 2006. 312(5774): p. 734-737.
357. Badin, P.-M., et al., High-fat diet-mediated lipotoxicity and insulin resistance is
related to impaired lipase expression in mouse skeletal muscle. Endocrinology, 2013.
154(4): p. 1444-1453.
358. Chen, Y.-J., et al., Lactate metabolism is associated with mammalian mitochondria.
Nature Chemical Biology, 2016.
359. Jin, E.S., A.D. Sherry, and C.R. Malloy, Lactate contributes to glyceroneogenesis and
glyconeogenesis in skeletal muscle by reversal of pyruvate kinase. Journal of
Biological Chemistry, 2015. 290(51): p. 30486-30497.
360. Oberbach, A., et al., Altered fiber distribution and fiber-specific glycolytic and
oxidative enzyme activity in skeletal muscle of patients with type 2 diabetes. Diabetes
care, 2006. 29(4): p. 895-900.
361. Mårin, P., et al., Muscle fiber composition and capillary density in women and men
with NIDDM. Diabetes care, 1994. 17(5): p. 382-386.
362. Chomentowski, P., et al., Skeletal muscle mitochondria in insulin resistance:
differences in intermyofibrillar versus subsarcolemmal subpopulations and
relationship to metabolic flexibility. The Journal of Clinical Endocrinology &
Metabolism, 2010. 96(2): p. 494-503.
363. Wu, H., et al., MEF2 responds to multiple calcium‐regulated signals in the control
of skeletal muscle fiber type. The EMBO journal, 2000. 19(9): p. 1963-1973.
364. Chin, E.R., et al., A calcineurin-dependent transcriptional pathway controls skeletal
muscle fiber type. Genes & development, 1998. 12(16): p. 2499-2509.
365. Anderson, C.M., et al., Myocyte enhancer factor 2C function in skeletal muscle is
required for normal growth and glucose metabolism in mice. Skeletal muscle, 2015.
5(1): p. 7.
366. Braun, T. and M. Gautel, Transcriptional mechanisms regulating skeletal muscle
differentiation, growth and homeostasis. Nature reviews Molecular cell biology, 2011.
12(6): p. 349-361.
367. Ehlers, M.L., B. Celona, and B.L. Black, NFATc1 controls skeletal muscle fiber type
and is a negative regulator of MyoD activity. Cell reports, 2014. 8(6): p. 1639-1648.
368. Rudnicki, M.A., et al., Inactivation of MyoD in mice leads to up-regulation of the
myogenic HLH gene Myf-5 and results in apparently normal muscle development.
Cell, 1992. 71(3): p. 383-390.
369. Aguiar, A., et al., Myogenin, MyoD and IGF-I regulate muscle mass but not fiber-type
conversion during resistance training in rats. International journal of sports medicine,
2013. 34(04): p. 293-301.
370. DeFronzo, R.A., From the triumvirate to the ominous octet: a new paradigm for the
treatment of type 2 diabetes mellitus. Diabetes, 2009. 58(4): p. 773-795.
371. Samuel, V.T. and G.I. Shulman, Mechanisms for insulin resistance: common threads
and missing links. Cell, 2012. 148(5): p. 852-871.
372. Barwell, N.D., et al., Exercise training has greater effects on insulin sensitivity in
daughters of patients with type 2 diabetes than in women with no family history of
diabetes. Diabetologia, 2008. 51(10): p. 1912.
373. Gill, J.M. and D. Malkova, Physical activity, fitness and cardiovascular disease risk
in adults: interactions with insulin resistance and obesity. Clinical science, 2006.
110(4): p. 409-425.
75
374. Cho, H., et al., Insulin resistance and a diabetes mellitus-like syndrome in mice
lacking the protein kinase Akt2 (PKBβ). Science, 2001. 292(5522): p. 1728-1731.


I

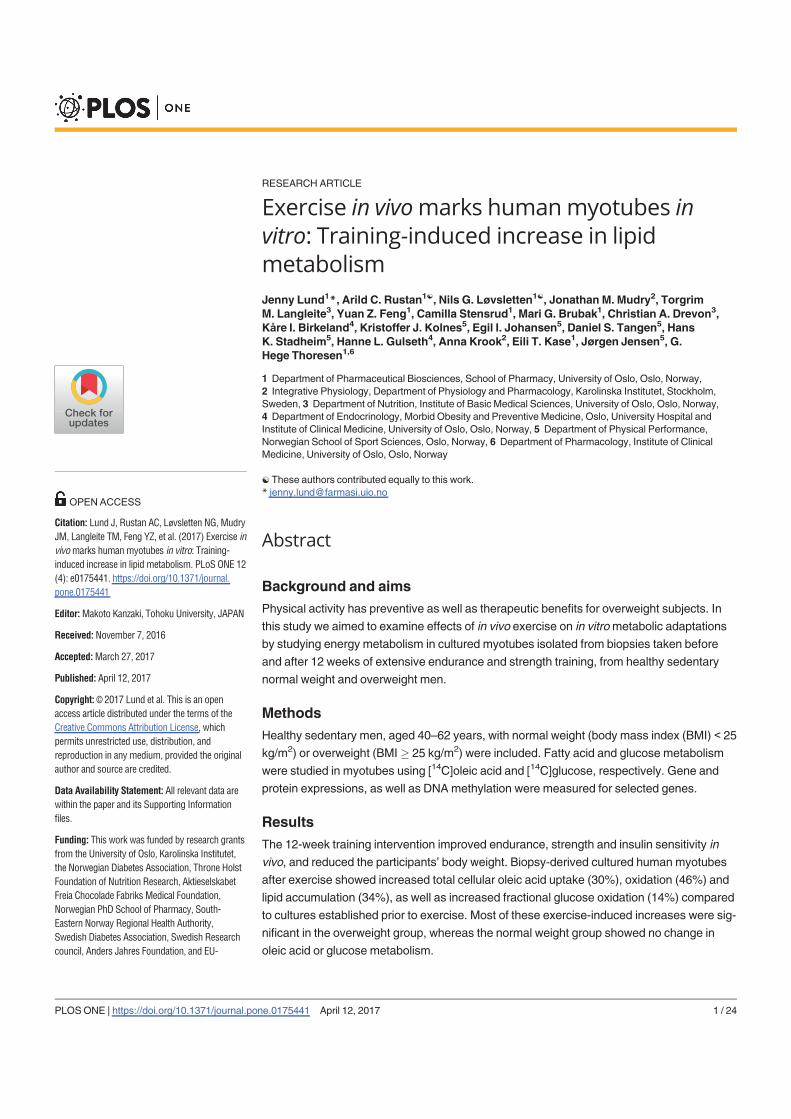
RESEARCH ARTICLE
Exercise in vivomarks humanmyotubes invitro: Training-induced increase in lipidmetabolism
Jenny Lund1 , Arild C. Rustan1 , Nils G. L vsletten1 , Jonathan M. Mudry2, TorgrimM. Langleite3, Yuan Z. Feng1, Camilla Stensrud1, Mari G. Brubak1, Christian A. Drevon3,K re I. Birkeland4, Kristoffer J. Kolnes5, Egil I. Johansen5, Daniel S. Tangen5, HansK. Stadheim5, Hanne L. Gulseth4, Anna Krook2, Eili T. Kase1, J rgen Jensen5, G.Hege Thoresen1,6
1 Department of Pharmaceutical Biosciences, School of Pharmacy, University of Oslo, Oslo, Norway,2 Integrative Physiology, Department of Physiology and Pharmacology, Karolinska Institutet, Stockholm,Sweden, 3 Department of Nutrition, Institute of Basic Medical Sciences, University of Oslo, Oslo, Norway,4 Department of Endocrinology, Morbid Obesity and Preventive Medicine, Oslo, University Hospital andInstitute of Clinical Medicine, University of Oslo, Oslo, Norway, 5 Department of Physical Performance,Norwegian School of Sport Sciences, Oslo, Norway, 6 Department of Pharmacology, Institute of ClinicalMedicine, University of Oslo, Oslo, Norway
These authors contributed equally to this work.* [email protected]
Abstract
Background and aimsPhysical activity has preventive as well as therapeutic benefits for overweight subjects. In
this study we aimed to examine effects of in vivo exercise on in vitrometabolic adaptations
by studying energy metabolism in cultured myotubes isolated from biopsies taken before
and after 12 weeks of extensive endurance and strength training, from healthy sedentary
normal weight and overweight men.
MethodsHealthy sedentary men, aged 40–62 years, with normal weight (body mass index (BMI) < 25kg/m2) or overweight (BMI� 25 kg/m2) were included. Fatty acid and glucose metabolism
were studied in myotubes using [14C]oleic acid and [14C]glucose, respectively. Gene and
protein expressions, as well as DNAmethylation were measured for selected genes.
ResultsThe 12-week training intervention improved endurance, strength and insulin sensitivity in
vivo, and reduced the participants’ body weight. Biopsy-derived cultured human myotubes
after exercise showed increased total cellular oleic acid uptake (30%), oxidation (46%) and
lipid accumulation (34%), as well as increased fractional glucose oxidation (14%) compared
to cultures established prior to exercise. Most of these exercise-induced increases were sig-
nificant in the overweight group, whereas the normal weight group showed no change in
oleic acid or glucose metabolism.
PLOSONE | https://doi.org/10.1371/journal.pone.0175441 April 12, 2017 1 / 24
a1111111111a1111111111a1111111111a1111111111a1111111111
OPENACCESS
Citation: Lund J, Rustan AC, L vsletten NG, MudryJM, Langleite TM, Feng YZ, et al. (2017) Exercise invivomarks humanmyotubes in vitro: Training-induced increase in lipid metabolism. PLoS ONE 12(4): e0175441. https://doi.org/10.1371/journal.pone.0175441
Editor:Makoto Kanzaki, Tohoku University, JAPAN
Received:November 7, 2016
Accepted:March 27, 2017
Published: April 12, 2017
Copyright: 2017 Lund et al. This is an openaccess article distributed under the terms of theCreative Commons Attribution License, whichpermits unrestricted use, distribution, andreproduction in any medium, provided the originalauthor and source are credited.
Data Availability Statement: All relevant data arewithin the paper and its Supporting Informationfiles.
Funding: This work was funded by research grantsfrom the University of Oslo, Karolinska Institutet,the Norwegian Diabetes Association, Throne HolstFoundation of Nutrition Research, AktieselskabetFreia Chocolade Fabriks Medical Foundation,Norwegian PhD School of Pharmacy, South-Eastern Norway Regional Health Authority,Swedish Diabetes Association, Swedish Researchcouncil, Anders Jahres Foundation, and EU-
Conclusions12 weeks of combined endurance and strength training promoted increased lipid and glu-
cose metabolism in biopsy-derived cultured human myotubes, showing that training in vivo
are able to induce changes in human myotubes that are discernible in vitro.
IntroductionPhysical activity has preventive as well as therapeutic benefits for metabolic diseases associated
with insulin resistance such as obesity and type 2 diabetes mellitus (T2D) [1, 2]. In addition to
increased physical activity, dietary changes and weight loss are important lifestyle changes for
prevention as well as treatment of T2D [2], as increased body mass index (BMI) is strongly
associated with the prevalence of metabolic diseases [3, 4], and most type 2 diabetics are over-
weight or obese [5]. Physical activity is known to improve insulin sensitivity and glucose
homeostasis and to increase fatty acid oxidation in skeletal muscle [6–8], as well as to reduce
blood pressure and beneficially influence plasma lipoproteins [9].
Skeletal muscle is the largest glucose-consuming organ in the body and accounts for more
than 80% of the insulin-stimulated glucose disposal [10]. Skeletal muscle is also the primary
site for insulin resistance [11]. Also with regard to fatty acid metabolism, skeletal muscle is
quantitatively the most dominant tissue during exercise [7]. Satellite cells [12] are dormant
cells in mature skeletal muscle in vivo, but are activated in response to stress, e.g. muscle
growth [13], and may be activated in culture to proliferating myoblasts and differentiated into
multinucleated myotubes. Epigenetic changes such as DNA methylation of key regulatory
genes has been proposed as one of several molecular mechanisms to explain the beneficial
effects of lifestyle changes, as both diet and exercise can influence DNAmethylation [14, 15].
Several studies indicate that cultured myotubes retain the in vivo characteristics (see e.g. [11,16–20]), and although the precise mechanisms are not known, epigenetic changes may be
involved (discussed in [21]). Thus, cultured human myotubes may represent an ex vivomodel
system for intact human skeletal muscle [19].
Most studies on the effect of exercise on metabolic diseases have been performed in vivo[22, 23] or directly on muscle biopsies [24, 25]. However, a study on obese donors revealed
that enhanced glucose metabolism noted in vivo following 8 weeks aerobic exercise, was pre-served in cultured primary myotubes [16]. To further explore the effects of in vivo exercise onin vitrometabolic adaptations, we studied different aspects of energy metabolism in cultured
myotubes established from biopsies from healthy sedentary normal weight and overweight
men. Biopsies were obtained before and after 12 weeks of physical training, consisting of both
endurance and strength exercises.
Materials andmethods
MaterialsMaterials are reported in Table 1.
Ethics statementThe biopsies were obtained after informed written consent and approval by the Regional Com-
mittee for Medical and Health Research Ethics North, Tromsø, Norway (reference number:
2011/882). The research performed in this study was approved, as part of a larger project:
Changedmetabolism in myotubes from overweight post-training
PLOSONE | https://doi.org/10.1371/journal.pone.0175441 April 12, 2017 2 / 24
financed FP7 project (NutriTech grant agreementno.: 289511). JJ is a Visiting Professor atDepartment of Nutrition, Exercise and Sports,University of Copenhagen, supported by TheDanish Diabetes Academy and Novo NordiskFoundation.
Competing interests: The authors report noconflicts of interests.
Abbreviations: AMPK, AMP-activated proteinkinase; ANGPTL4, angiopoietin-like 4; BMI, bodymass index; CA, cell-associated radioactivity;CD36, fatty acid translocase; CPT1A, carnitinepalmitoyltransferase 1A; CYC1, cytochrome c-1;GAPDH, glyceraldehyde 3-phosphatedehydrogenase; GIR, glucose infusion rate; IRS1,insulin receptor substrate 1; MHC, myosin heavychain; OXPHOS, oxidative phosphorylation; PDK4,pyruvate dehydrogenase kinase, isoenzyme 4;PPARGC1A, peroxisome proliferator-activatedreceptor gamma, coactivator 1 alpha; PLIN2,perilipin 2; PPARD, peroxisome proliferator-activated receptor delta; RPLP0, large ribosomalprotein P0; T2D, type 2 diabetes mellitus; TBC1D4,TBC1 domain family member 4; TFAM,transcription factor A, mitochondrial; VO2max,maximal oxygen uptake.
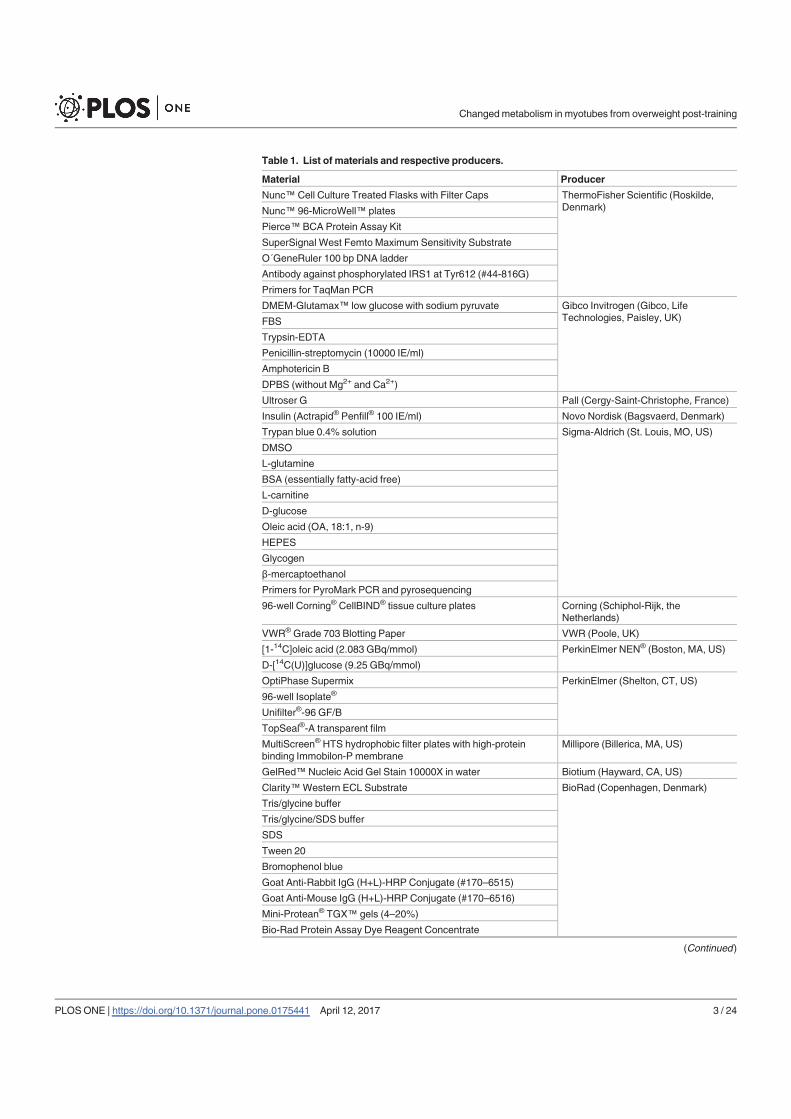
Table 1. List of materials and respective producers.
Material Producer
Nunc™ Cell Culture Treated Flasks with Filter Caps ThermoFisher Scientific (Roskilde,Denmark)Nunc™ 96-MicroWell™ plates
Pierce™ BCA Protein Assay Kit
SuperSignal West Femto Maximum Sensitivity Substrate
O´GeneRuler 100 bp DNA ladder
Antibody against phosphorylated IRS1 at Tyr612 (#44-816G)
Primers for TaqMan PCR
DMEM-Glutamax™ low glucose with sodium pyruvate Gibco Invitrogen (Gibco, LifeTechnologies, Paisley, UK)FBS
Trypsin-EDTA
Penicillin-streptomycin (10000 IE/ml)
Amphotericin B
DPBS (without Mg2+ and Ca2+)
Ultroser G Pall (Cergy-Saint-Christophe, France)
Insulin (Actrapid® Penfill® 100 IE/ml) Novo Nordisk (Bagsvaerd, Denmark)
Trypan blue 0.4% solution Sigma-Aldrich (St. Louis, MO, US)
DMSO
L-glutamine
BSA (essentially fatty-acid free)
L-carnitine
D-glucose
Oleic acid (OA, 18:1, n-9)
HEPES
Glycogen
β-mercaptoethanol
Primers for PyroMark PCR and pyrosequencing
96-well Corning® CellBIND® tissue culture plates Corning (Schiphol-Rijk, theNetherlands)
VWR®Grade 703 Blotting Paper VWR (Poole, UK)
[1-14C]oleic acid (2.083 GBq/mmol) PerkinElmer NEN® (Boston, MA, US)
D-[14C(U)]glucose (9.25 GBq/mmol)
OptiPhase Supermix PerkinElmer (Shelton, CT, US)
96-well Isoplate®
Unifilter®-96 GF/B
TopSeal®-A transparent film
MultiScreen® HTS hydrophobic filter plates with high-proteinbinding Immobilon-P membrane
Millipore (Billerica, MA, US)
GelRed™ Nucleic Acid Gel Stain 10000X in water Biotium (Hayward, CA, US)
Clarity™Western ECL Substrate BioRad (Copenhagen, Denmark)
Tris/glycine buffer
Tris/glycine/SDS buffer
SDS
Tween 20
Bromophenol blue
Goat Anti-Rabbit IgG (H+L)-HRP Conjugate (#170–6515)
Goat Anti-Mouse IgG (H+L)-HRP Conjugate (#170–6516)
Mini-Protean® TGX™ gels (4–20%)
Bio-Rad Protein Assay Dye Reagent Concentrate
(Continued )
Changedmetabolism in myotubes from overweight post-training
PLOSONE | https://doi.org/10.1371/journal.pone.0175441 April 12, 2017 3 / 24
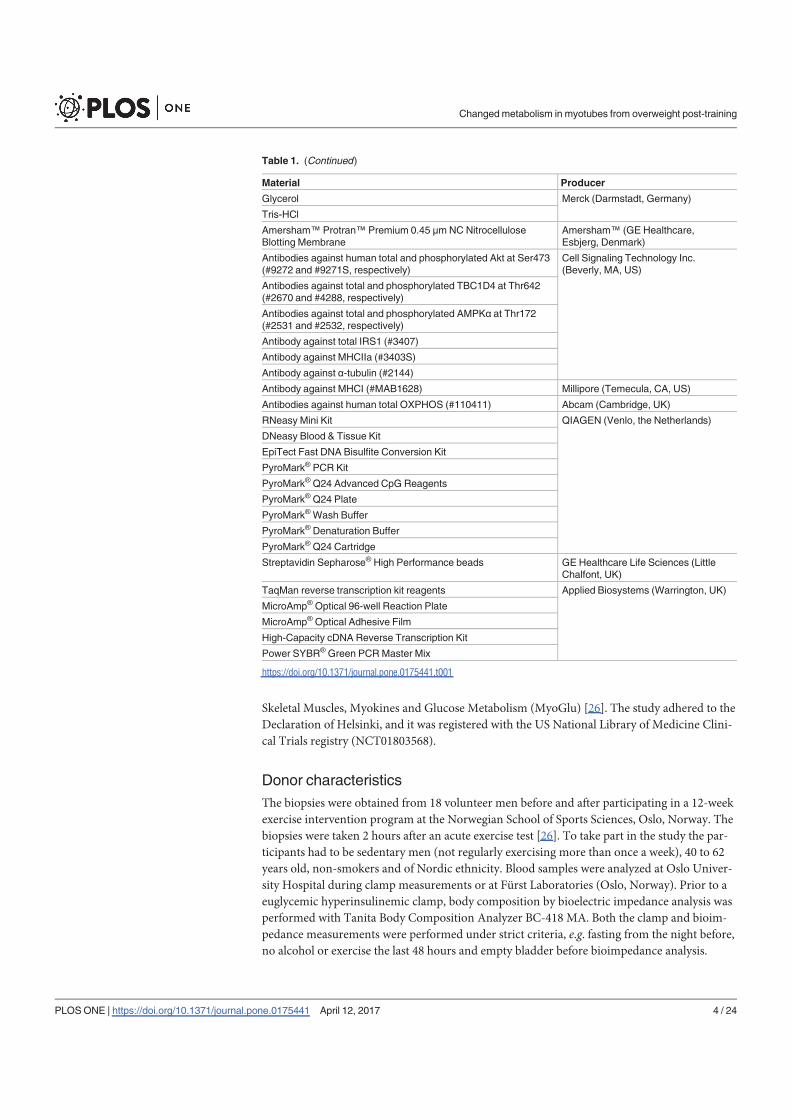
Skeletal Muscles, Myokines and Glucose Metabolism (MyoGlu) [26]. The study adhered to the
Declaration of Helsinki, and it was registered with the US National Library of Medicine Clini-
cal Trials registry (NCT01803568).
Donor characteristicsThe biopsies were obtained from 18 volunteer men before and after participating in a 12-week
exercise intervention program at the Norwegian School of Sports Sciences, Oslo, Norway. The
biopsies were taken 2 hours after an acute exercise test [26]. To take part in the study the par-
ticipants had to be sedentary men (not regularly exercising more than once a week), 40 to 62
years old, non-smokers and of Nordic ethnicity. Blood samples were analyzed at Oslo Univer-
sity Hospital during clamp measurements or at Furst Laboratories (Oslo, Norway). Prior to a
euglycemic hyperinsulinemic clamp, body composition by bioelectric impedance analysis was
performed with Tanita Body Composition Analyzer BC-418 MA. Both the clamp and bioim-
pedance measurements were performed under strict criteria, e.g. fasting from the night before,
no alcohol or exercise the last 48 hours and empty bladder before bioimpedance analysis.
Table 1. (Continued)
Material Producer
Glycerol Merck (Darmstadt, Germany)
Tris-HCl
Amersham™ Protran™ Premium 0.45 μmNC NitrocelluloseBlotting Membrane
Amersham™ (GE Healthcare,Esbjerg, Denmark)
Antibodies against human total and phosphorylated Akt at Ser473(#9272 and #9271S, respectively)
Cell Signaling Technology Inc.(Beverly, MA, US)
Antibodies against total and phosphorylated TBC1D4 at Thr642(#2670 and #4288, respectively)
Antibodies against total and phosphorylated AMPKα at Thr172(#2531 and #2532, respectively)
Antibody against total IRS1 (#3407)
Antibody against MHCIIa (#3403S)
Antibody against α-tubulin (#2144)
Antibody against MHCI (#MAB1628) Millipore (Temecula, CA, US)
Antibodies against human total OXPHOS (#110411) Abcam (Cambridge, UK)
RNeasy Mini Kit QIAGEN (Venlo, the Netherlands)
DNeasy Blood & Tissue Kit
EpiTect Fast DNA Bisulfite Conversion Kit
PyroMark® PCR Kit
PyroMark®Q24 Advanced CpG Reagents
PyroMark®Q24 Plate
PyroMark®Wash Buffer
PyroMark® Denaturation Buffer
PyroMark®Q24 Cartridge
Streptavidin Sepharose® High Performance beads GE Healthcare Life Sciences (LittleChalfont, UK)
TaqMan reverse transcription kit reagents Applied Biosystems (Warrington, UK)
MicroAmp®Optical 96-well Reaction Plate
MicroAmp®Optical Adhesive Film
High-Capacity cDNA Reverse Transcription Kit
Power SYBR®Green PCRMaster Mix
https://doi.org/10.1371/journal.pone.0175441.t001
Changedmetabolism in myotubes from overweight post-training
PLOSONE | https://doi.org/10.1371/journal.pone.0175441 April 12, 2017 4 / 24

The group was further divided in two groups, normal weight and overweight, i.e. below and
above the World Health Organization’s lower limit for overweight (BMI 25 kg/m2), respec-
tively, for all analyses except glycogen synthesis and DNAmethylation experiments where
only a subset of the donors were examined (n< 3 in the normal weight group).
Exercise trainingThe training program was performed at the Norwegian School of Sport Sciences. Each partici-
pant exercised 4 times per week for 12 weeks, both endurance sessions twice weekly and
strength training sessions twice weekly. Endurance sessions consisted of interval-based
cycling, and strength training sessions consisted of 3 sets of 8 exercises (leg press, arm press,
chest press, cable pull-down, leg curls, crunches, seated rowing, and a back exercise). All ses-
sions were supervised by one instructor for two participants. Each session, whether endurance
or strength training, lasted about 60 min, excluding 10–20 min aerobic warm-up. The endur-
ance exercise was performed with two different intervals; one of the sessions was performed at
7 min intervals, whereas the other session was performed at 2 min intervals. Compliance to the
exercise intervention was equally good in the two BMI groups [26].
Maximal strength was tested before and after the exercise intervention in maximal leg
press, cable pull-down, and breast press, whereas endurance capacity before and after the exer-
cise intervention was evaluated as maximal oxygen uptake (VO2max) after 45 min cycling at
70% of estimated VO2max. Each participant followed a standardized warm-up before testing.
Dietary intakes were registered by a food frequency questionnaire [27] before and after the
exercise intervention. There was no significant change in intake of energy-providing nutrients
during the study [28].
Culturing of human myotubesMultinucleated human myotubes were established by activation and proliferation of satellite
cells isolated frommusculus vastus lateralis from 7 sedentary normal weight men and from
11 sedentary overweight men. This was based on the method of Henry et al. [29] and modi-
fied according to Gaster et al. [30, 31]. For proliferation of myoblasts a DMEM-Glutamax™(5.5 mmol/l glucose) medium supplemented with 2% FBS and 2% Ultroser G were used. At
approximately 80% confluence the medium was changed to DMEM-Glutamax™ (5.5 mmol/l
glucose) supplemented with 2% FBS and 25 pmol/l insulin to initiate differentiation into
multinucleated myotubes. The cells were allowed to differentiate for 7 days; no difference in
cell differentiation could be detected based on protein expressions of MHCI and MHCIIa
(S1 Fig), and by visual examination in the microscope. During the culturing process the
muscle cells were incubated in a humidified 5% CO2 atmosphere at 37˚C, and medium was
changed every 2–3 days. Experiments were performed on cells from passage number 2 to 4.
For each experiment and within each donor, i.e. before and after exercise, the passage num-
ber remained constant. Isolation of satellite cells from all biopsies was performed at the same
location and by the same trained researchers. Skeletal muscle cultures have previously been
checked for the adipocyte marker fatty acid binding protein (FABP) 4 to ensure a homoge-
nous skeletal muscle cell-population. All cell cultures were visually checked for fibroblast
content throughout proliferation.
Fatty acid and glucose metabolismSkeletal muscle cells (7000 cells/well) were cultured on 96-well CellBIND1 microplates.
[1-14C]oleic acid (18.5 kBq/ml), 20, 100 or 400 μmol/l, or D-[14C(U)]glucose (21.46 kBq/ml),
200 μmol/l, were given during 4 h CO2 trapping as previously described [32]. In brief, a
Changedmetabolism in myotubes from overweight post-training
PLOSONE | https://doi.org/10.1371/journal.pone.0175441 April 12, 2017 5 / 24
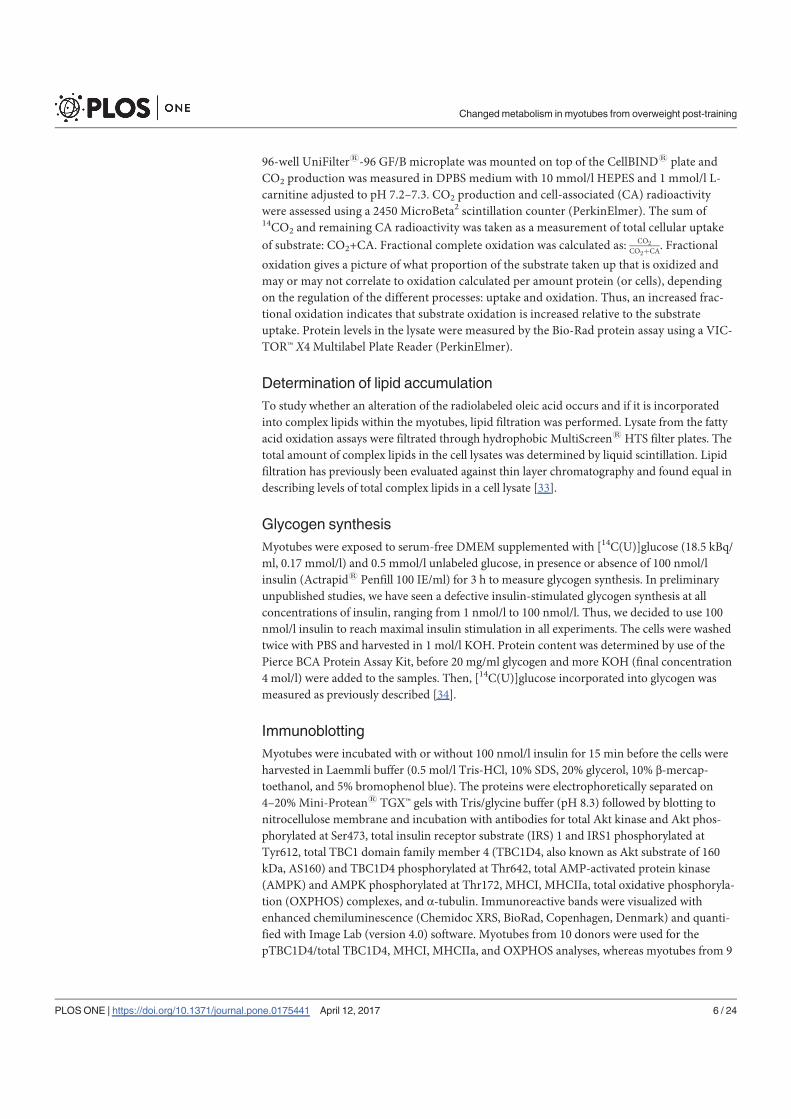
96-well UniFilter1-96 GF/B microplate was mounted on top of the CellBIND1 plate and
CO2 production was measured in DPBS medium with 10 mmol/l HEPES and 1 mmol/l L-
carnitine adjusted to pH 7.2–7.3. CO2 production and cell-associated (CA) radioactivity
were assessed using a 2450 MicroBeta2 scintillation counter (PerkinElmer). The sum of14CO2 and remaining CA radioactivity was taken as a measurement of total cellular uptake
of substrate: CO2+CA. Fractional complete oxidation was calculated as: CO2
CO2þCA. Fractional
oxidation gives a picture of what proportion of the substrate taken up that is oxidized and
may or may not correlate to oxidation calculated per amount protein (or cells), depending
on the regulation of the different processes: uptake and oxidation. Thus, an increased frac-
tional oxidation indicates that substrate oxidation is increased relative to the substrate
uptake. Protein levels in the lysate were measured by the Bio-Rad protein assay using a VIC-
TOR™ X4 Multilabel Plate Reader (PerkinElmer).
Determination of lipid accumulationTo study whether an alteration of the radiolabeled oleic acid occurs and if it is incorporated
into complex lipids within the myotubes, lipid filtration was performed. Lysate from the fatty
acid oxidation assays were filtrated through hydrophobic MultiScreen1 HTS filter plates. The
total amount of complex lipids in the cell lysates was determined by liquid scintillation. Lipid
filtration has previously been evaluated against thin layer chromatography and found equal in
describing levels of total complex lipids in a cell lysate [33].
Glycogen synthesisMyotubes were exposed to serum-free DMEM supplemented with [14C(U)]glucose (18.5 kBq/
ml, 0.17 mmol/l) and 0.5 mmol/l unlabeled glucose, in presence or absence of 100 nmol/l
insulin (Actrapid1 Penfill 100 IE/ml) for 3 h to measure glycogen synthesis. In preliminary
unpublished studies, we have seen a defective insulin-stimulated glycogen synthesis at all
concentrations of insulin, ranging from 1 nmol/l to 100 nmol/l. Thus, we decided to use 100
nmol/l insulin to reach maximal insulin stimulation in all experiments. The cells were washed
twice with PBS and harvested in 1 mol/l KOH. Protein content was determined by use of the
Pierce BCA Protein Assay Kit, before 20 mg/ml glycogen and more KOH (final concentration
4 mol/l) were added to the samples. Then, [14C(U)]glucose incorporated into glycogen was
measured as previously described [34].
ImmunoblottingMyotubes were incubated with or without 100 nmol/l insulin for 15 min before the cells were
harvested in Laemmli buffer (0.5 mol/l Tris-HCl, 10% SDS, 20% glycerol, 10% -mercap-
toethanol, and 5% bromophenol blue). The proteins were electrophoretically separated on
4–20%Mini-Protean1 TGX™ gels with Tris/glycine buffer (pH 8.3) followed by blotting to
nitrocellulose membrane and incubation with antibodies for total Akt kinase and Akt phos-
phorylated at Ser473, total insulin receptor substrate (IRS) 1 and IRS1 phosphorylated at
Tyr612, total TBC1 domain family member 4 (TBC1D4, also known as Akt substrate of 160
kDa, AS160) and TBC1D4 phosphorylated at Thr642, total AMP-activated protein kinase
(AMPK) and AMPK phosphorylated at Thr172, MHCI, MHCIIa, total oxidative phosphoryla-
tion (OXPHOS) complexes, and -tubulin. Immunoreactive bands were visualized with
enhanced chemiluminescence (Chemidoc XRS, BioRad, Copenhagen, Denmark) and quanti-
fied with Image Lab (version 4.0) software. Myotubes from 10 donors were used for the
pTBC1D4/total TBC1D4, MHCI, MHCIIa, and OXPHOS analyses, whereas myotubes from 9
Changedmetabolism in myotubes from overweight post-training
PLOSONE | https://doi.org/10.1371/journal.pone.0175441 April 12, 2017 6 / 24
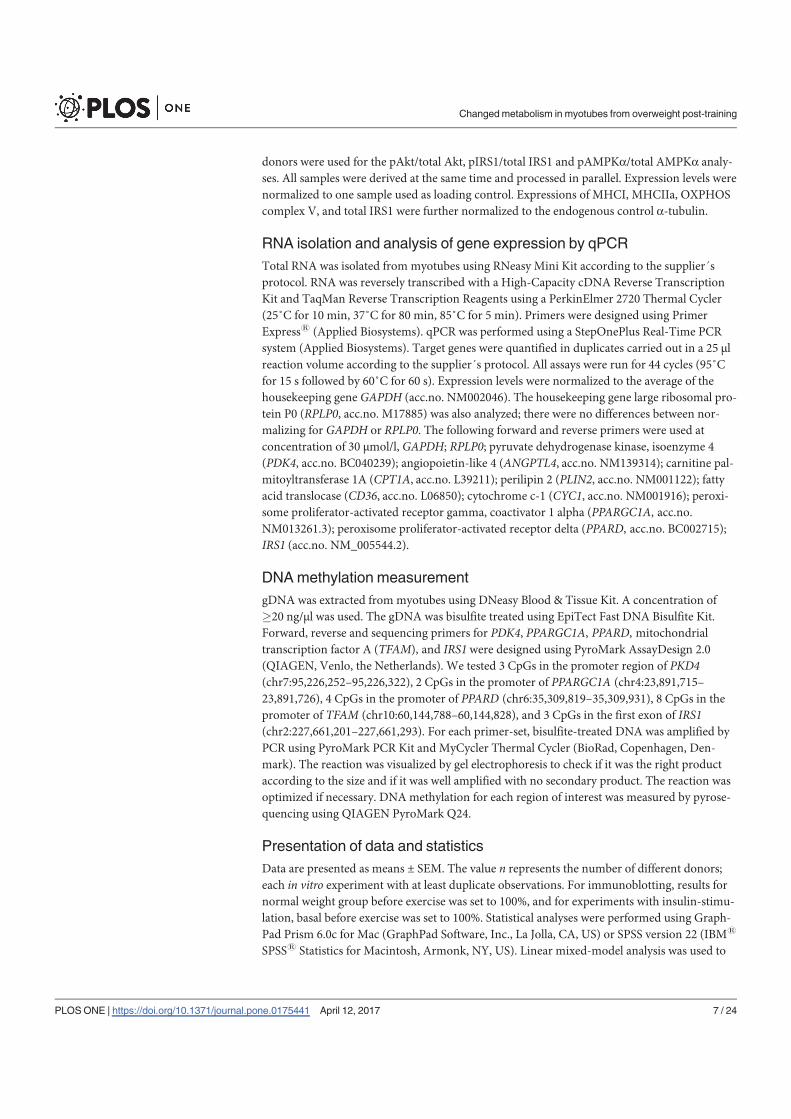
donors were used for the pAkt/total Akt, pIRS1/total IRS1 and pAMPK /total AMPK analy-
ses. All samples were derived at the same time and processed in parallel. Expression levels were
normalized to one sample used as loading control. Expressions of MHCI, MHCIIa, OXPHOS
complex V, and total IRS1 were further normalized to the endogenous control -tubulin.
RNA isolation and analysis of gene expression by qPCRTotal RNA was isolated from myotubes using RNeasy Mini Kit according to the supplier´s
protocol. RNA was reversely transcribed with a High-Capacity cDNA Reverse Transcription
Kit and TaqMan Reverse Transcription Reagents using a PerkinElmer 2720 Thermal Cycler
(25˚C for 10 min, 37˚C for 80 min, 85˚C for 5 min). Primers were designed using Primer
Express1 (Applied Biosystems). qPCR was performed using a StepOnePlus Real-Time PCR
system (Applied Biosystems). Target genes were quantified in duplicates carried out in a 25 μlreaction volume according to the supplier´s protocol. All assays were run for 44 cycles (95˚C
for 15 s followed by 60˚C for 60 s). Expression levels were normalized to the average of the
housekeeping gene GAPDH (acc.no. NM002046). The housekeeping gene large ribosomal pro-
tein P0 (RPLP0, acc.no. M17885) was also analyzed; there were no differences between nor-
malizing for GAPDH or RPLP0. The following forward and reverse primers were used at
concentration of 30 μmol/l, GAPDH; RPLP0; pyruvate dehydrogenase kinase, isoenzyme 4
(PDK4, acc.no. BC040239); angiopoietin-like 4 (ANGPTL4, acc.no. NM139314); carnitine pal-
mitoyltransferase 1A (CPT1A, acc.no. L39211); perilipin 2 (PLIN2, acc.no. NM001122); fatty
acid translocase (CD36, acc.no. L06850); cytochrome c-1 (CYC1, acc.no. NM001916); peroxi-
some proliferator-activated receptor gamma, coactivator 1 alpha (PPARGC1A, acc.no.NM013261.3); peroxisome proliferator-activated receptor delta (PPARD, acc.no. BC002715);IRS1 (acc.no. NM_005544.2).
DNAmethylation measurementgDNA was extracted from myotubes using DNeasy Blood & Tissue Kit. A concentration of
�20 ng/μl was used. The gDNA was bisulfite treated using EpiTect Fast DNA Bisulfite Kit.
Forward, reverse and sequencing primers for PDK4, PPARGC1A, PPARD, mitochondrial
transcription factor A (TFAM), and IRS1were designed using PyroMark AssayDesign 2.0
(QIAGEN, Venlo, the Netherlands). We tested 3 CpGs in the promoter region of PKD4(chr7:95,226,252–95,226,322), 2 CpGs in the promoter of PPARGC1A (chr4:23,891,715–
23,891,726), 4 CpGs in the promoter of PPARD (chr6:35,309,819–35,309,931), 8 CpGs in the
promoter of TFAM (chr10:60,144,788–60,144,828), and 3 CpGs in the first exon of IRS1(chr2:227,661,201–227,661,293). For each primer-set, bisulfite-treated DNA was amplified by
PCR using PyroMark PCR Kit and MyCycler Thermal Cycler (BioRad, Copenhagen, Den-
mark). The reaction was visualized by gel electrophoresis to check if it was the right product
according to the size and if it was well amplified with no secondary product. The reaction was
optimized if necessary. DNAmethylation for each region of interest was measured by pyrose-
quencing using QIAGEN PyroMark Q24.
Presentation of data and statisticsData are presented as means ± SEM. The value n represents the number of different donors;
each in vitro experiment with at least duplicate observations. For immunoblotting, results for
normal weight group before exercise was set to 100%, and for experiments with insulin-stimu-
lation, basal before exercise was set to 100%. Statistical analyses were performed using Graph-
Pad Prism 6.0c for Mac (GraphPad Software, Inc., La Jolla, CA, US) or SPSS version 22 (IBM1
SPSS1 Statistics for Macintosh, Armonk, NY, US). Linear mixed-model analysis was used to
Changedmetabolism in myotubes from overweight post-training
PLOSONE | https://doi.org/10.1371/journal.pone.0175441 April 12, 2017 7 / 24
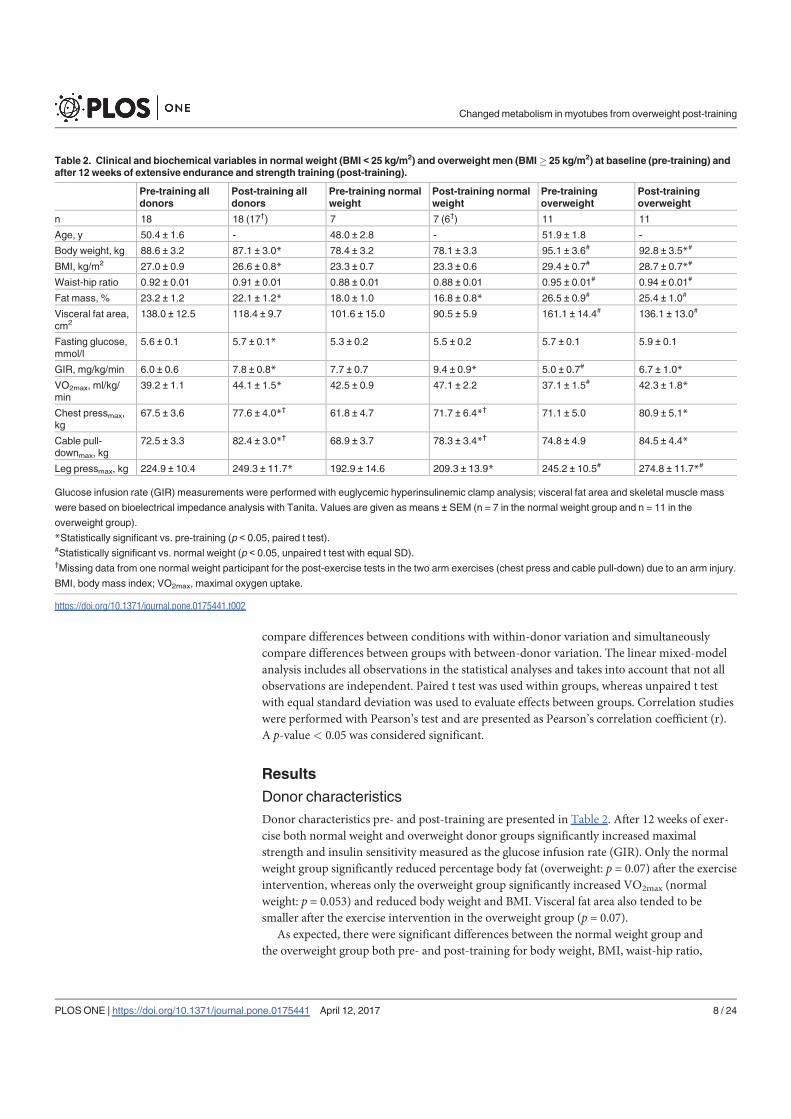
compare differences between conditions with within-donor variation and simultaneously
compare differences between groups with between-donor variation. The linear mixed-model
analysis includes all observations in the statistical analyses and takes into account that not all
observations are independent. Paired t test was used within groups, whereas unpaired t test
with equal standard deviation was used to evaluate effects between groups. Correlation studies
were performed with Pearson’s test and are presented as Pearson’s correlation coefficient (r).
A p-value< 0.05 was considered significant.
Results
Donor characteristicsDonor characteristics pre- and post-training are presented in Table 2. After 12 weeks of exer-
cise both normal weight and overweight donor groups significantly increased maximal
strength and insulin sensitivity measured as the glucose infusion rate (GIR). Only the normal
weight group significantly reduced percentage body fat (overweight: p = 0.07) after the exercise
intervention, whereas only the overweight group significantly increased VO2max (normal
weight: p = 0.053) and reduced body weight and BMI. Visceral fat area also tended to be
smaller after the exercise intervention in the overweight group (p = 0.07).
As expected, there were significant differences between the normal weight group and
the overweight group both pre- and post-training for body weight, BMI, waist-hip ratio,
Table 2. Clinical and biochemical variables in normal weight (BMI 25 kg/m2) and overweight men (BMI� 25 kg/m2) at baseline (pre-training) andafter 12 weeks of extensive endurance and strength training (post-training).
Pre-training alldonors
Post-training alldonors
Pre-training normalweight
Post-training normalweight
Pre-trainingoverweight
Post-trainingoverweight
n 18 18 (17†) 7 7 (6†) 11 11
Age, y 50.4 ± 1.6 - 48.0 ± 2.8 - 51.9 ± 1.8 -
Body weight, kg 88.6 ± 3.2 87.1 ± 3.0* 78.4 ± 3.2 78.1 ± 3.3 95.1 ± 3.6# 92.8 ± 3.5*#
BMI, kg/m2 27.0 ± 0.9 26.6 ± 0.8* 23.3 ± 0.7 23.3 ± 0.6 29.4 ± 0.7# 28.7 ± 0.7*#
Waist-hip ratio 0.92 ± 0.01 0.91 ± 0.01 0.88 ± 0.01 0.88 ± 0.01 0.95 ± 0.01# 0.94 ± 0.01#
Fat mass, % 23.2 ± 1.2 22.1 ± 1.2* 18.0 ± 1.0 16.8 ± 0.8* 26.5 ± 0.9# 25.4 ± 1.0#
Visceral fat area,cm2
138.0 ± 12.5 118.4 ± 9.7 101.6 ± 15.0 90.5 ± 5.9 161.1 ± 14.4# 136.1 ± 13.0#
Fasting glucose,mmol/l
5.6 ± 0.1 5.7 ± 0.1* 5.3 ± 0.2 5.5 ± 0.2 5.7 ± 0.1 5.9 ± 0.1
GIR, mg/kg/min 6.0 ± 0.6 7.8 ± 0.8* 7.7 ± 0.7 9.4 ± 0.9* 5.0 ± 0.7# 6.7 ± 1.0*
VO2max, ml/kg/min
39.2 ± 1.1 44.1 ± 1.5* 42.5 ± 0.9 47.1 ± 2.2 37.1 ± 1.5# 42.3 ± 1.8*
Chest pressmax,kg
67.5 ± 3.6 77.6 ± 4.0*† 61.8 ± 4.7 71.7 ± 6.4*† 71.1 ± 5.0 80.9 ± 5.1*
Cable pull-downmax, kg
72.5 ± 3.3 82.4 ± 3.0*† 68.9 ± 3.7 78.3 ± 3.4*† 74.8 ± 4.9 84.5 ± 4.4*
Leg pressmax, kg 224.9 ± 10.4 249.3 ± 11.7* 192.9 ± 14.6 209.3 ± 13.9* 245.2 ± 10.5# 274.8 ± 11.7*#
Glucose infusion rate (GIR) measurements were performed with euglycemic hyperinsulinemic clamp analysis; visceral fat area and skeletal muscle mass
were based on bioelectrical impedance analysis with Tanita. Values are given as means ± SEM (n = 7 in the normal weight group and n = 11 in the
overweight group).
*Statistically significant vs. pre-training (p < 0.05, paired t test).#Statistically significant vs. normal weight (p < 0.05, unpaired t test with equal SD).†Missing data from one normal weight participant for the post-exercise tests in the two arm exercises (chest press and cable pull-down) due to an arm injury.
BMI, body mass index; VO2max, maximal oxygen uptake.
https://doi.org/10.1371/journal.pone.0175441.t002
Changedmetabolism in myotubes from overweight post-training
PLOSONE | https://doi.org/10.1371/journal.pone.0175441 April 12, 2017 8 / 24
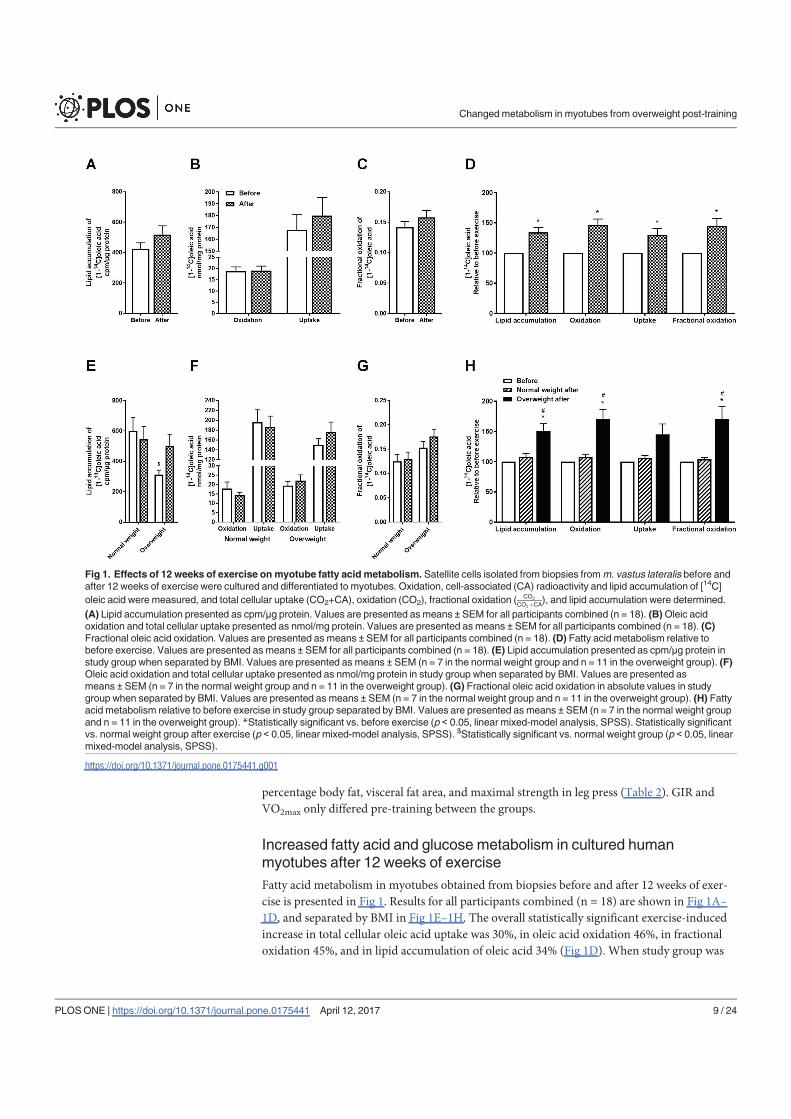
percentage body fat, visceral fat area, and maximal strength in leg press (Table 2). GIR and
VO2max only differed pre-training between the groups.
Increased fatty acid and glucose metabolism in cultured humanmyotubes after 12 weeks of exerciseFatty acid metabolism in myotubes obtained from biopsies before and after 12 weeks of exer-
cise is presented in Fig 1. Results for all participants combined (n = 18) are shown in Fig 1A–
1D, and separated by BMI in Fig 1E–1H. The overall statistically significant exercise-induced
increase in total cellular oleic acid uptake was 30%, in oleic acid oxidation 46%, in fractional
oxidation 45%, and in lipid accumulation of oleic acid 34% (Fig 1D). When study group was
Fig 1. Effects of 12 weeks of exercise onmyotube fatty acid metabolism. Satellite cells isolated from biopsies fromm. vastus lateralis before andafter 12 weeks of exercise were cultured and differentiated to myotubes. Oxidation, cell-associated (CA) radioactivity and lipid accumulation of [14C]oleic acid were measured, and total cellular uptake (CO2+CA), oxidation (CO2), fractional oxidation ( CO2
CO2þCA), and lipid accumulation were determined.(A) Lipid accumulation presented as cpm/μg protein. Values are presented as means ± SEM for all participants combined (n = 18). (B)Oleic acidoxidation and total cellular uptake presented as nmol/mg protein. Values are presented as means ± SEM for all participants combined (n = 18). (C)Fractional oleic acid oxidation. Values are presented as means ± SEM for all participants combined (n = 18). (D) Fatty acid metabolism relative tobefore exercise. Values are presented as means ± SEM for all participants combined (n = 18). (E) Lipid accumulation presented as cpm/μg protein instudy group when separated by BMI. Values are presented as means ± SEM (n = 7 in the normal weight group and n = 11 in the overweight group). (F)Oleic acid oxidation and total cellular uptake presented as nmol/mg protein in study group when separated by BMI. Values are presented asmeans ± SEM (n = 7 in the normal weight group and n = 11 in the overweight group). (G) Fractional oleic acid oxidation in absolute values in studygroup when separated by BMI. Values are presented as means ± SEM (n = 7 in the normal weight group and n = 11 in the overweight group). (H) Fattyacid metabolism relative to before exercise in study group separated by BMI. Values are presented as means ± SEM (n = 7 in the normal weight groupand n = 11 in the overweight group). *Statistically significant vs. before exercise (p < 0.05, linear mixed-model analysis, SPSS). Statistically significantvs. normal weight group after exercise (p < 0.05, linear mixed-model analysis, SPSS). $Statistically significant vs. normal weight group (p < 0.05, linearmixed-model analysis, SPSS).
https://doi.org/10.1371/journal.pone.0175441.g001
Changedmetabolism in myotubes from overweight post-training
PLOSONE | https://doi.org/10.1371/journal.pone.0175441 April 12, 2017 9 / 24
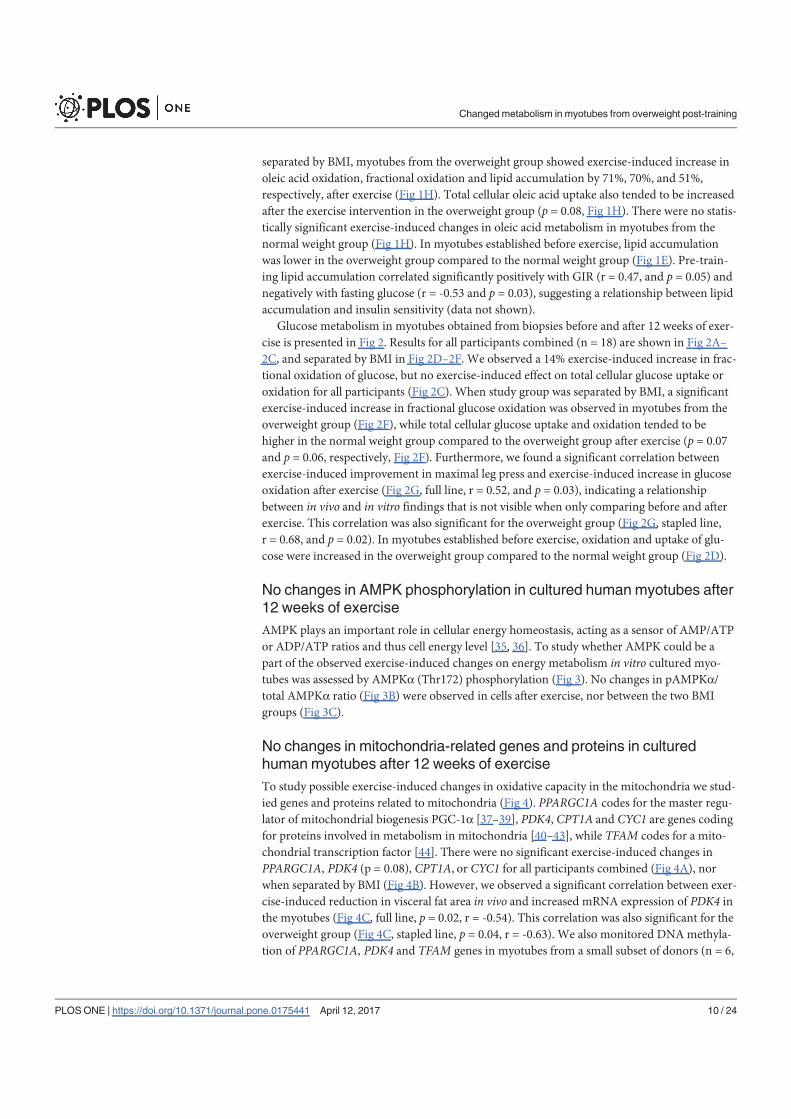
separated by BMI, myotubes from the overweight group showed exercise-induced increase in
oleic acid oxidation, fractional oxidation and lipid accumulation by 71%, 70%, and 51%,
respectively, after exercise (Fig 1H). Total cellular oleic acid uptake also tended to be increased
after the exercise intervention in the overweight group (p = 0.08, Fig 1H). There were no statis-
tically significant exercise-induced changes in oleic acid metabolism in myotubes from the
normal weight group (Fig 1H). In myotubes established before exercise, lipid accumulation
was lower in the overweight group compared to the normal weight group (Fig 1E). Pre-train-
ing lipid accumulation correlated significantly positively with GIR (r = 0.47, and p = 0.05) and
negatively with fasting glucose (r = -0.53 and p = 0.03), suggesting a relationship between lipid
accumulation and insulin sensitivity (data not shown).
Glucose metabolism in myotubes obtained from biopsies before and after 12 weeks of exer-
cise is presented in Fig 2. Results for all participants combined (n = 18) are shown in Fig 2A–
2C, and separated by BMI in Fig 2D–2F. We observed a 14% exercise-induced increase in frac-
tional oxidation of glucose, but no exercise-induced effect on total cellular glucose uptake or
oxidation for all participants (Fig 2C). When study group was separated by BMI, a significant
exercise-induced increase in fractional glucose oxidation was observed in myotubes from the
overweight group (Fig 2F), while total cellular glucose uptake and oxidation tended to be
higher in the normal weight group compared to the overweight group after exercise (p = 0.07
and p = 0.06, respectively, Fig 2F). Furthermore, we found a significant correlation between
exercise-induced improvement in maximal leg press and exercise-induced increase in glucose
oxidation after exercise (Fig 2G, full line, r = 0.52, and p = 0.03), indicating a relationship
between in vivo and in vitro findings that is not visible when only comparing before and after
exercise. This correlation was also significant for the overweight group (Fig 2G, stapled line,
r = 0.68, and p = 0.02). In myotubes established before exercise, oxidation and uptake of glu-
cose were increased in the overweight group compared to the normal weight group (Fig 2D).
No changes in AMPK phosphorylation in cultured human myotubes after12 weeks of exerciseAMPK plays an important role in cellular energy homeostasis, acting as a sensor of AMP/ATP
or ADP/ATP ratios and thus cell energy level [35, 36]. To study whether AMPK could be a
part of the observed exercise-induced changes on energy metabolism in vitro cultured myo-
tubes was assessed by AMPK (Thr172) phosphorylation (Fig 3). No changes in pAMPK /
total AMPK ratio (Fig 3B) were observed in cells after exercise, nor between the two BMI
groups (Fig 3C).
No changes in mitochondria-related genes and proteins in culturedhuman myotubes after 12 weeks of exerciseTo study possible exercise-induced changes in oxidative capacity in the mitochondria we stud-
ied genes and proteins related to mitochondria (Fig 4). PPARGC1A codes for the master regu-
lator of mitochondrial biogenesis PGC-1 [37–39], PDK4, CPT1A and CYC1 are genes codingfor proteins involved in metabolism in mitochondria [40–43], while TFAM codes for a mito-
chondrial transcription factor [44]. There were no significant exercise-induced changes in
PPARGC1A, PDK4 (p = 0.08), CPT1A, or CYC1 for all participants combined (Fig 4A), nor
when separated by BMI (Fig 4B). However, we observed a significant correlation between exer-
cise-induced reduction in visceral fat area in vivo and increased mRNA expression of PDK4 inthe myotubes (Fig 4C, full line, p = 0.02, r = -0.54). This correlation was also significant for the
overweight group (Fig 4C, stapled line, p = 0.04, r = -0.63). We also monitored DNAmethyla-
tion of PPARGC1A, PDK4 and TFAM genes in myotubes from a small subset of donors (n = 6,
Changedmetabolism in myotubes from overweight post-training
PLOSONE | https://doi.org/10.1371/journal.pone.0175441 April 12, 2017 10 / 24
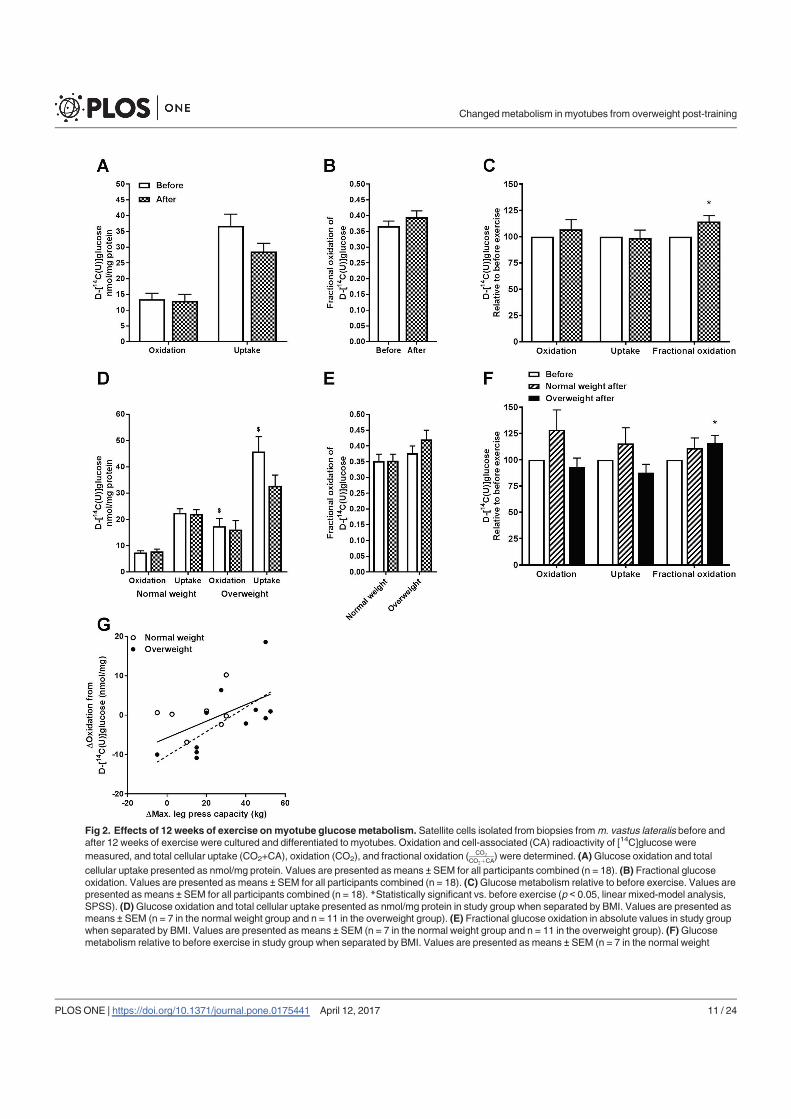
Fig 2. Effects of 12 weeks of exercise onmyotube glucosemetabolism. Satellite cells isolated from biopsies fromm. vastus lateralis before andafter 12 weeks of exercise were cultured and differentiated to myotubes. Oxidation and cell-associated (CA) radioactivity of [14C]glucose weremeasured, and total cellular uptake (CO2+CA), oxidation (CO2), and fractional oxidation ( CO2
CO2þCA) were determined. (A)Glucose oxidation and totalcellular uptake presented as nmol/mg protein. Values are presented as means ± SEM for all participants combined (n = 18). (B) Fractional glucoseoxidation. Values are presented as means ± SEM for all participants combined (n = 18). (C)Glucose metabolism relative to before exercise. Values arepresented as means ± SEM for all participants combined (n = 18). *Statistically significant vs. before exercise (p < 0.05, linear mixed-model analysis,SPSS). (D)Glucose oxidation and total cellular uptake presented as nmol/mg protein in study group when separated by BMI. Values are presented asmeans ± SEM (n = 7 in the normal weight group and n = 11 in the overweight group). (E) Fractional glucose oxidation in absolute values in study groupwhen separated by BMI. Values are presented as means ± SEM (n = 7 in the normal weight group and n = 11 in the overweight group). (F)Glucosemetabolism relative to before exercise in study group when separated by BMI. Values are presented as means ± SEM (n = 7 in the normal weight
Changedmetabolism in myotubes from overweight post-training
PLOSONE | https://doi.org/10.1371/journal.pone.0175441 April 12, 2017 11 / 24
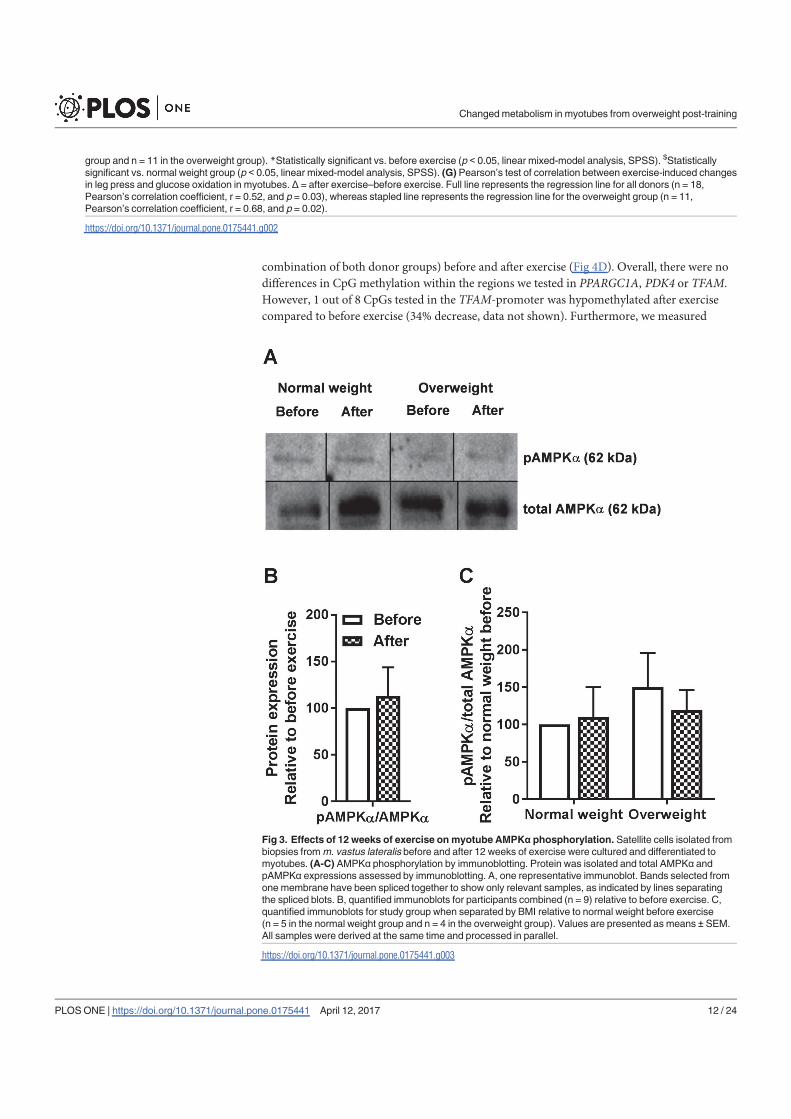
combination of both donor groups) before and after exercise (Fig 4D). Overall, there were no
differences in CpG methylation within the regions we tested in PPARGC1A, PDK4 or TFAM.
However, 1 out of 8 CpGs tested in the TFAM-promoter was hypomethylated after exercise
compared to before exercise (34% decrease, data not shown). Furthermore, we measured
group and n = 11 in the overweight group). *Statistically significant vs. before exercise (p < 0.05, linear mixed-model analysis, SPSS). $Statisticallysignificant vs. normal weight group (p < 0.05, linear mixed-model analysis, SPSS). (G) Pearson’s test of correlation between exercise-induced changesin leg press and glucose oxidation in myotubes. Δ = after exercise–before exercise. Full line represents the regression line for all donors (n = 18,Pearson’s correlation coefficient, r = 0.52, and p = 0.03), whereas stapled line represents the regression line for the overweight group (n = 11,Pearson’s correlation coefficient, r = 0.68, and p = 0.02).
https://doi.org/10.1371/journal.pone.0175441.g002
Fig 3. Effects of 12 weeks of exercise onmyotube AMPK phosphorylation. Satellite cells isolated frombiopsies fromm. vastus lateralis before and after 12 weeks of exercise were cultured and differentiated tomyotubes. (A-C) AMPKα phosphorylation by immunoblotting. Protein was isolated and total AMPKα andpAMPKα expressions assessed by immunoblotting. A, one representative immunoblot. Bands selected fromone membrane have been spliced together to show only relevant samples, as indicated by lines separatingthe spliced blots. B, quantified immunoblots for participants combined (n = 9) relative to before exercise. C,quantified immunoblots for study group when separated by BMI relative to normal weight before exercise(n = 5 in the normal weight group and n = 4 in the overweight group). Values are presented as means ± SEM.All samples were derived at the same time and processed in parallel.
https://doi.org/10.1371/journal.pone.0175441.g003
Changedmetabolism in myotubes from overweight post-training
PLOSONE | https://doi.org/10.1371/journal.pone.0175441 April 12, 2017 12 / 24
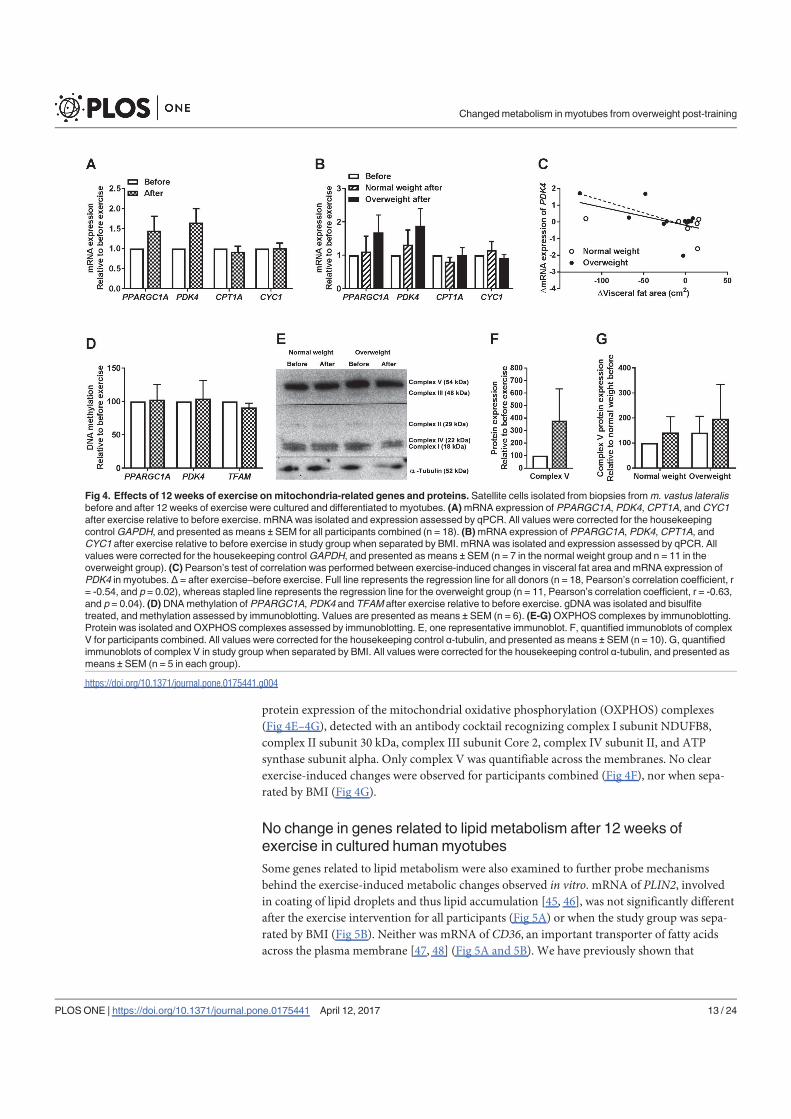
protein expression of the mitochondrial oxidative phosphorylation (OXPHOS) complexes
(Fig 4E–4G), detected with an antibody cocktail recognizing complex I subunit NDUFB8,
complex II subunit 30 kDa, complex III subunit Core 2, complex IV subunit II, and ATP
synthase subunit alpha. Only complex V was quantifiable across the membranes. No clear
exercise-induced changes were observed for participants combined (Fig 4F), nor when sepa-
rated by BMI (Fig 4G).
No change in genes related to lipid metabolism after 12 weeks ofexercise in cultured human myotubesSome genes related to lipid metabolism were also examined to further probe mechanisms
behind the exercise-induced metabolic changes observed in vitro. mRNA of PLIN2, involvedin coating of lipid droplets and thus lipid accumulation [45, 46], was not significantly different
after the exercise intervention for all participants (Fig 5A) or when the study group was sepa-
rated by BMI (Fig 5B). Neither was mRNA of CD36, an important transporter of fatty acids
across the plasma membrane [47, 48] (Fig 5A and 5B). We have previously shown that
Fig 4. Effects of 12 weeks of exercise onmitochondria-related genes and proteins. Satellite cells isolated from biopsies fromm. vastus lateralisbefore and after 12 weeks of exercise were cultured and differentiated to myotubes. (A)mRNA expression of PPARGC1A, PDK4,CPT1A, andCYC1after exercise relative to before exercise. mRNAwas isolated and expression assessed by qPCR. All values were corrected for the housekeepingcontrolGAPDH, and presented as means ± SEM for all participants combined (n = 18). (B)mRNA expression of PPARGC1A, PDK4,CPT1A, andCYC1 after exercise relative to before exercise in study group when separated by BMI. mRNA was isolated and expression assessed by qPCR. Allvalues were corrected for the housekeeping controlGAPDH, and presented as means ± SEM (n = 7 in the normal weight group and n = 11 in theoverweight group). (C) Pearson’s test of correlation was performed between exercise-induced changes in visceral fat area and mRNA expression ofPDK4 in myotubes. Δ = after exercise–before exercise. Full line represents the regression line for all donors (n = 18, Pearson’s correlation coefficient, r= -0.54, and p = 0.02), whereas stapled line represents the regression line for the overweight group (n = 11, Pearson’s correlation coefficient, r = -0.63,and p = 0.04). (D)DNAmethylation of PPARGC1A, PDK4 and TFAM after exercise relative to before exercise. gDNA was isolated and bisulfitetreated, and methylation assessed by immunoblotting. Values are presented as means ± SEM (n = 6). (E-G)OXPHOS complexes by immunoblotting.Protein was isolated and OXPHOS complexes assessed by immunoblotting. E, one representative immunoblot. F, quantified immunoblots of complexV for participants combined. All values were corrected for the housekeeping control α-tubulin, and presented as means ± SEM (n = 10). G, quantifiedimmunoblots of complex V in study group when separated by BMI. All values were corrected for the housekeeping control α-tubulin, and presented asmeans ± SEM (n = 5 in each group).
https://doi.org/10.1371/journal.pone.0175441.g004
Changedmetabolism in myotubes from overweight post-training
PLOSONE | https://doi.org/10.1371/journal.pone.0175441 April 12, 2017 13 / 24
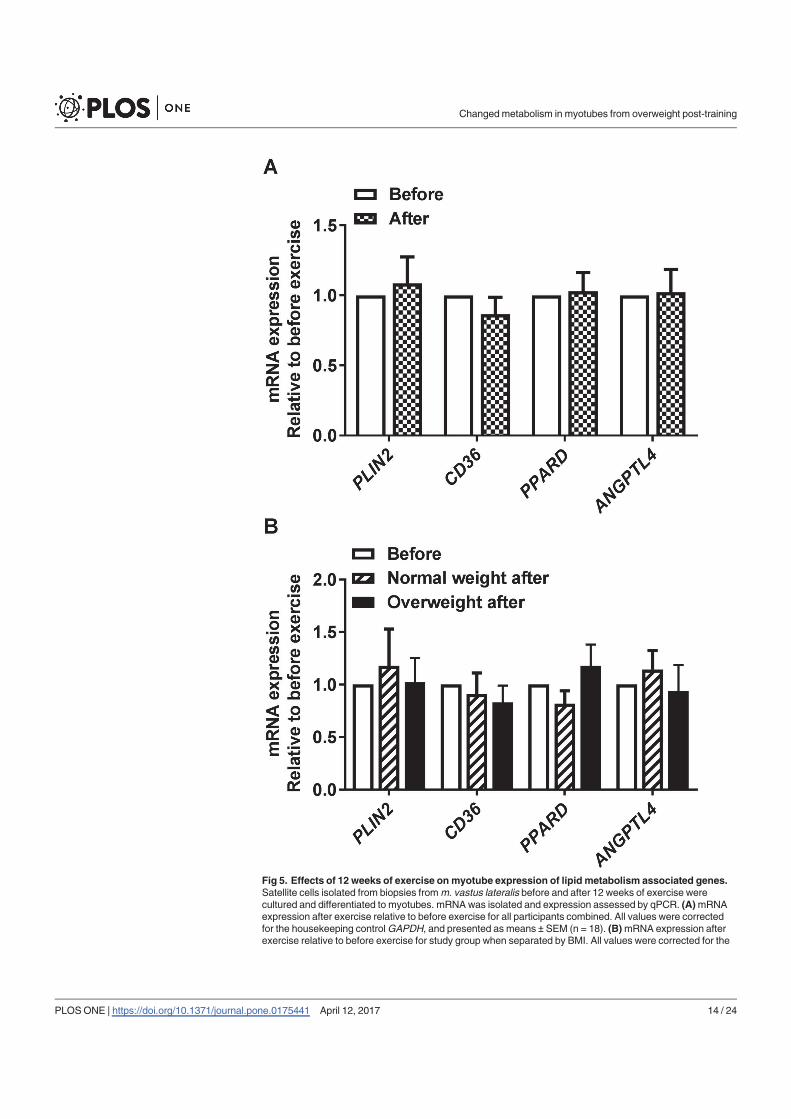
Fig 5. Effects of 12 weeks of exercise onmyotube expression of lipid metabolism associated genes.Satellite cells isolated from biopsies fromm. vastus lateralis before and after 12 weeks of exercise werecultured and differentiated to myotubes. mRNAwas isolated and expression assessed by qPCR. (A)mRNAexpression after exercise relative to before exercise for all participants combined. All values were correctedfor the housekeeping controlGAPDH, and presented as means ± SEM (n = 18). (B)mRNA expression afterexercise relative to before exercise for study group when separated by BMI. All values were corrected for the
Changedmetabolism in myotubes from overweight post-training
PLOSONE | https://doi.org/10.1371/journal.pone.0175441 April 12, 2017 14 / 24
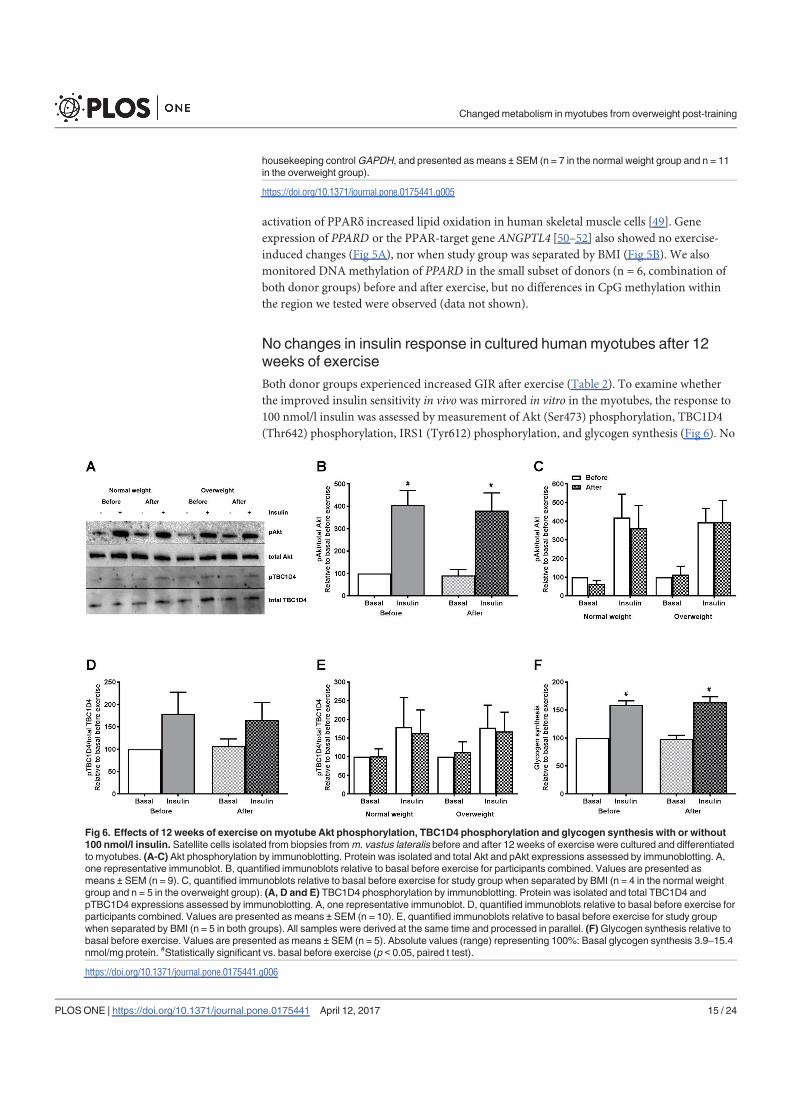
activation of PPAR increased lipid oxidation in human skeletal muscle cells [49]. Gene
expression of PPARD or the PPAR-target gene ANGPTL4 [50–52] also showed no exercise-induced changes (Fig 5A), nor when study group was separated by BMI (Fig 5B). We also
monitored DNAmethylation of PPARD in the small subset of donors (n = 6, combination of
both donor groups) before and after exercise, but no differences in CpG methylation within
the region we tested were observed (data not shown).
No changes in insulin response in cultured human myotubes after 12weeks of exerciseBoth donor groups experienced increased GIR after exercise (Table 2). To examine whether
the improved insulin sensitivity in vivowas mirrored in vitro in the myotubes, the response to
100 nmol/l insulin was assessed by measurement of Akt (Ser473) phosphorylation, TBC1D4
(Thr642) phosphorylation, IRS1 (Tyr612) phosphorylation, and glycogen synthesis (Fig 6). No
housekeeping controlGAPDH, and presented as means ± SEM (n = 7 in the normal weight group and n = 11in the overweight group).
https://doi.org/10.1371/journal.pone.0175441.g005
Fig 6. Effects of 12 weeks of exercise onmyotube Akt phosphorylation, TBC1D4 phosphorylation and glycogen synthesis with or without100 nmol/l insulin. Satellite cells isolated from biopsies fromm. vastus lateralis before and after 12 weeks of exercise were cultured and differentiatedto myotubes. (A-C) Akt phosphorylation by immunoblotting. Protein was isolated and total Akt and pAkt expressions assessed by immunoblotting. A,one representative immunoblot. B, quantified immunoblots relative to basal before exercise for participants combined. Values are presented asmeans ± SEM (n = 9). C, quantified immunoblots relative to basal before exercise for study group when separated by BMI (n = 4 in the normal weightgroup and n = 5 in the overweight group). (A, D and E) TBC1D4 phosphorylation by immunoblotting. Protein was isolated and total TBC1D4 andpTBC1D4 expressions assessed by immunoblotting. A, one representative immunoblot. D, quantified immunoblots relative to basal before exercise forparticipants combined. Values are presented as means ± SEM (n = 10). E, quantified immunoblots relative to basal before exercise for study groupwhen separated by BMI (n = 5 in both groups). All samples were derived at the same time and processed in parallel. (F)Glycogen synthesis relative tobasal before exercise. Values are presented as means ± SEM (n = 5). Absolute values (range) representing 100%: Basal glycogen synthesis 3.9–15.4nmol/mg protein. #Statistically significant vs. basal before exercise (p < 0.05, paired t test).
https://doi.org/10.1371/journal.pone.0175441.g006
Changedmetabolism in myotubes from overweight post-training
PLOSONE | https://doi.org/10.1371/journal.pone.0175441 April 12, 2017 15 / 24
changes in the basal level of pAkt/total Akt ratio or pTBC1D4/total TBC1D4 ratio were
observed in cells after exercise. As expected, insulin significantly increased the pAkt/total Akt
ratio in myotubes from both groups before and after exercise (Fig 6A and 6B), whereas there
were no significant effect of insulin on pTBC1D4/total TBC1D4 ratio (Fig 6A and 6D). When
the study group was separated by BMI, no significant differences in basal or insulin-stimulated
levels of pAkt/total Akt ratio or pTBC1D4/total TBC1D4 ratio were observed (Fig 6C and 6E,
respectively). No changes in the basal level or insulin-stimulated levels of pIRS1/total IRS1
ratio were observed (data not shown). Furthermore, no changes in the basal level of glycogen
synthesis were observed in myotubes, and insulin significantly increased glycogen synthesis by
about 1.5-fold both before and after exercise (Fig 6F). Thus, there was no exercise-effect on
insulin-stimulated Akt phosphorylation, TBC1D4 phosphorylation or glycogen synthesis.
Decreased IRS1mRNA expression and increased DNAmethylationwithin first exon region of IRS1 after 12 weeks of exercise in culturedhuman myotubesTo further study the insulin signaling pathway, we also measured mRNA expression, DNA
methylation and protein expression of IRS1 (Fig 7). We found that the mRNA expression of
IRS1was significantly decreased by 31% after exercise (n = 8, Fig 7A), which was only signifi-
cant in myotubes from the normal weight group upon separation by BMI (n = 3 in the normal
weight group and n = 5 in the overweight group, Fig 7B). Furthermore, DNA methylation of 1
out of 3 CpGs tested within the first exon region of IRS1was significantly increased by 23%
(n = 6, Fig 7C). There were no exercise-induced changes in protein expression of IRS1 detected
with immunoblotting (n = 9, Fig 7E), nor when study group was separated by BMI (n = 5 in
the normal weight group and n = 4 in the overweight group, Fig 7F).
DiscussionWe show that 12 weeks of exercise alters metabolism and gene expression of cultured human
myotubes. Fatty acid metabolism and fractional glucose oxidation were significantly increased
in myotubes established from skeletal muscle isolated from sedentary men after 12 weeks of
exercise. These exercise-induced metabolic changes in fatty acid metabolism in myotubes were
more predominant in cells from overweight subjects. Moreover, we observed a significant
exercise-induced decrease in mRNA expression of IRS1, as well as DNA hypermethylation in
the first exon of IRS1, however not detectable on protein level.
Bourlier et al. showed that cultured myotubes retained the exercise-trained phenotype invitro concerning some aspects of glucose metabolism [16]. Their study involved 8 weeks of aer-
obic exercise intervention and included only obese individuals [16]. In the present study we
examined a broader group of subjects including normal weight and overweight men, a longer
exercise intervention as well as a combination of aerobic and anaerobic exercise, to observe
and possibly explain differences in energy metabolism in cultured myotubes in vitro after thein vivo exercise intervention, and also to explore whether BMI of the subjects affected the
results.
As expected, the exercise intervention significantly increased VO2max (overweight group),
chest press, cable pull-down, and leg press capacity. The exercise intervention also improved
the metabolic health, with a significant increase in GIR, as well as a small, but significant
reduction in BMI. VO2max was not significantly increased in the normal weight group
(p = 0.053) even though they complied to the exercise intervention equally well [26]. The mean
increase was variable between the participants, and combined with the smaller sample size it
may explain the lack of statistical difference.
Changedmetabolism in myotubes from overweight post-training
PLOSONE | https://doi.org/10.1371/journal.pone.0175441 April 12, 2017 16 / 24
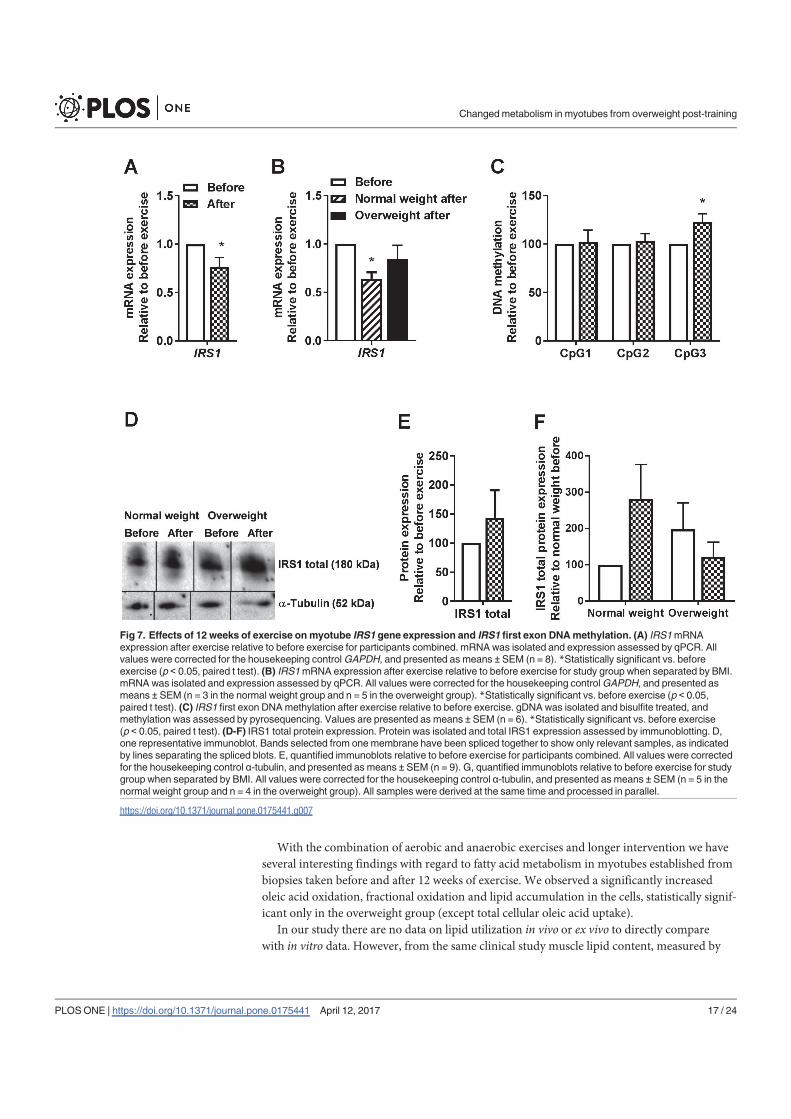
With the combination of aerobic and anaerobic exercises and longer intervention we have
several interesting findings with regard to fatty acid metabolism in myotubes established from
biopsies taken before and after 12 weeks of exercise. We observed a significantly increased
oleic acid oxidation, fractional oxidation and lipid accumulation in the cells, statistically signif-
icant only in the overweight group (except total cellular oleic acid uptake).
In our study there are no data on lipid utilization in vivo or ex vivo to directly compare
with in vitro data. However, from the same clinical study muscle lipid content, measured by
Fig 7. Effects of 12 weeks of exercise onmyotube IRS1 gene expression and IRS1 first exon DNAmethylation. (A) IRS1mRNAexpression after exercise relative to before exercise for participants combined. mRNAwas isolated and expression assessed by qPCR. Allvalues were corrected for the housekeeping controlGAPDH, and presented as means ± SEM (n = 8). *Statistically significant vs. beforeexercise (p < 0.05, paired t test). (B) IRS1mRNA expression after exercise relative to before exercise for study group when separated by BMI.mRNA was isolated and expression assessed by qPCR. All values were corrected for the housekeeping controlGAPDH, and presented asmeans ± SEM (n = 3 in the normal weight group and n = 5 in the overweight group). *Statistically significant vs. before exercise (p < 0.05,paired t test). (C) IRS1 first exon DNAmethylation after exercise relative to before exercise. gDNA was isolated and bisulfite treated, andmethylation was assessed by pyrosequencing. Values are presented as means ± SEM (n = 6). *Statistically significant vs. before exercise(p < 0.05, paired t test). (D-F) IRS1 total protein expression. Protein was isolated and total IRS1 expression assessed by immunoblotting. D,one representative immunoblot. Bands selected from one membrane have been spliced together to show only relevant samples, as indicatedby lines separating the spliced blots. E, quantified immunoblots relative to before exercise for participants combined. All values were correctedfor the housekeeping control α-tubulin, and presented as means ± SEM (n = 9). G, quantified immunoblots relative to before exercise for studygroup when separated by BMI. All values were corrected for the housekeeping control α-tubulin, and presented as means ± SEM (n = 5 in thenormal weight group and n = 4 in the overweight group). All samples were derived at the same time and processed in parallel.
https://doi.org/10.1371/journal.pone.0175441.g007
Changedmetabolism in myotubes from overweight post-training
PLOSONE | https://doi.org/10.1371/journal.pone.0175441 April 12, 2017 17 / 24
magnetic resonance spectrometry in vivo and electron microscopy ex vivo, was found to be
significantly reduced after the exercise intervention [26, 28], in line with an increase in lipid
metabolism in vitro.An exercise-induced increase in lipid oxidation in cultured myotubes is also in accordance
with findings from others in skeletal muscle in vivo during and after combined types of exer-
cise [7, 53]. A study by Ramos-Jimenez et al. [8] showed that lipid oxidation was increased in
endurance trained men (athletes trained at a competitive level) compared to untrained men, as
measured by lower respiratory exchange ratio. Increased lipid oxidation after exercise is also
in line with observations from an in vitromodel (electrical pulse stimulation) of myotube exer-
cise [54, 55]. Bourlier et al. did not observe exercise-induced differences in lipid metabolism
in cultured myotubes, however, they hypothesized that longer exercise interventions and/or
interventions including different types of exercise might lead to functional changes in lipid
metabolism [16].
Bourlier et al. [16] reported increased glucose metabolism in myotubes from obese subjects
after an 8-week aerobic exercise intervention. In our study we observed increased fractional
oxidation of glucose, statistically significant only in the overweight group, as well as a signifi-
cant correlation between exercise-induced increased maximal leg press capacity and increased
oxidation of glucose in the cells, indicating a relationship between glucose oxidation and exer-
cise outcome. However, the effects of exercise on glucose metabolism were less pronounced in
our study than described by Bourlier et al. [16], possibly explained by different donor groups
and exercise programs. Increased storage of glycogen is a well-reported physiologic response
to exercise as a mean to increase endurance capacity during submaximal exercise [11, 56], and
Bourlier et al. also reported increased basal glycogen synthesis in myotubes cultured from sat-
ellite cells after exercise in vivo [16]. However, this was not observed in this study, possibly
caused by different study conditions.
In this study we have compared myotubes from normal weight and overweight subjects. In
pre-training myotubes we found increased oxidation and uptake of glucose and lower lipid
accumulation in the overweight group compared to the normal weight group, as well as a pos-
sible association between lipid accumulation in vitro and insulin sensitivity in vivo. Severalprevious studies show no significant donor-related differences i basal glucose oxidation in
myotubes [54, 57–59], however Gaster [17] observed increased glucose oxidation in myotubes
from obese patients with T2D compared to myotubes from lean donors. It was suggested that
under certain conditions metabolism of myotubes from diabetic donors relies more on glucose
oxidation than myotubes from lean donors [17]. We have previously reported lower lipid accu-
mulation in myotubes from obese subjects with T2D compared to myotubes from obese non-
diabetic donors, explained by a reduced capacity for lipid accumulation and increased lipolysis
[60]. Our overweight donors are not diabetic, however this donor group had reduced pre-
training insulin sensitivity and myotubes from this group may resemble cells from T2D donors
in some ways. The donor-dependent differences in glucose metabolism and lipid accumula-
tion found in pre-training myotubes were evened out after exercise, in line with the increased
response to exercise in myotubes from the overweight group.
Satellite cells are usually dormant in vivo until they are challenged with growth or injury
[13], e.g. exercise. We observed changes in energy metabolism in skeletal muscle cells following
exercise intervention, and aimed to determine whether gene or protein expression were coin-
cident with the observed changes in energy metabolism.
Despite the increased fatty acid oxidation, we did not observe any significant exercise-
induced differences in phosphorylation of AMPK , and no changes in mRNA expression
levels of mitochondria-related genes or genes related to fatty acid metabolism. However,
there was a significant correlation between reduced visceral fat area in vivo and higher
Changedmetabolism in myotubes from overweight post-training
PLOSONE | https://doi.org/10.1371/journal.pone.0175441 April 12, 2017 18 / 24
mRNA expression of PDK4 in vitro. PDK4 is involved in phosphorylation and inactivation of
the pyruvate dehydrogenase complex (PDC). Increased expression of PDK4 inhibits PDCand reduces glucose oxidation, which makes PDK4 a major regulatory metabolic enzyme in
skeletal muscle as it is involved in switching from carbohydrate to lipid utilization [41, 61,
62]. Bourlier et al. [16] found a reduced PDK4mRNA expression after exercise in cultured
myotubes, in line with the increased glucose oxidation [16], while we previously have found
that increased lipid oxidation of cultured human myotubes in vitro simultaneously also
increased PDK4 expression [49, 55, 63]. Thus, the correlation between reduced visceral fat
area and increased PDK4 expression may indicate a relationship between lipid metabolism invivo and in vitro.
DNA methylation has been proposed as a molecular mechanism for exercise-mediated
changes in metabolic health [15] and has been associated with transcriptional silencing [64],
possibly by blocking the promoter that activating transcription factors normally bind. In
our study, DNA methylation of the mitochondrial genes TFAM and PDK4 were not changedin myotubes after exercise. This is in contrast to findings ex vivo after acute exercise. Barrèset al. [65] showed that acute exercise increased mRNA expression of PDK4 and PPARGC1Ain skeletal muscle, and that changes in methylation was part of the explanation. However,
we found both hypermethylation of IRS1 and reduction of IRS1mRNA expression in cul-
tured myotubes after 12 weeks of training, whereas protein expression apparently was
unchanged. The functional significance of these findings is unknown and not easy to
explain. Protein expression of IRS1 has previously been shown to be both increased [66]
and decreased [67] in human skeletal muscle after exercise. We have recently shown
enhanced tyrosine phosphorylation of IRS1, concomitant with increased glucose metabo-
lism in cultured myotubes obtained from donors before and after gastric by-pass surgery
[68]. Our study indicates that exercise-induced changes in promoter methylation may be
retained in satellite cells and during transition of these precursor cells to myoblasts and
finally to myotubes, however, at present we cannot explain a possible link between this and
the metabolic changes observed.
Disturbances in energy metabolism of skeletal muscle are associated with metabolic dis-
eases related to insulin resistance [69, 70]. In vivo we found a significant increased GIR after
training i both donor groups, indicating increased insulin sensitivity, while no exercise-
induced changes in in vitro insulin response (i.e. insulin-stimulated Akt phosphorylation,
TBC1D4 phosphorylation or glycogen synthesis) were observed. This could be explained by
sub-optimal experimental conditions (i.e. a maximal insulin stimulation), though we have
previously been able to detect donor-specific differences in insulin-response with the same
experimental setup [20, 60]. We hypothesize therefore that the lack of these effects are a
result of the underlying study in vivo where the two donor groups were quite similar with
regard to insulin sensitivity, and that the difference were too small to be able to detect invitro.
In conclusion, our data show that a combination of aerobic and anaerobic exercise mediates
changes in fatty acid and glucose metabolism in skeletal muscle cells. Thus, certain impacts of
exercise in vivo are retained in myotubes established from satellite cells, and our findings may
indicate that cultured, passaged myoblasts established from these progenitor cells and differen-
tiated into myotubes, can be used as a model system for studying mechanisms related to exer-
cise and metabolic diseases. Furthermore, we observed that the exercise-induced changes were
predominant in the overweight group. Future studies are required to explore whether epige-
netic or other changes can explain this relationship further, and to get a deeper insight into
molecular mechanisms behind changes in energy metabolism in myotubes after an exercise
intervention.
Changedmetabolism in myotubes from overweight post-training
PLOSONE | https://doi.org/10.1371/journal.pone.0175441 April 12, 2017 19 / 24
Supporting informationS1 Fig. No differences in protein expression of differentiation markers. Satellite cells iso-
lated from biopsies fromm. vastus lateralis before and after 12 weeks of exercise were culturedand differentiated to myotubes. (A, B)MHCI expression by immunoblotting. Protein was iso-
lated and MHCI expression assessed by immunoblotting. A, one representative immunoblot.
Bands selected from one membrane have been spliced together to show only relevant samples,
as indicated by lines separating the spliced blots. B, quantified immunoblots for study group
when separated by BMI relative to normal weight before exercise (n = 5 in both groups). (A,
C)MHCIIa expression by immunoblotting. Protein was isolated and MHCIIa expression
assessed by immunoblotting. A, one representative immunoblot. Bands selected from one
membrane have been spliced together to show only relevant samples, as indicated by lines sep-
arating the spliced blots. C, quantified immunoblots for study group when separated by BMI
relative to normal weight before exercise (n = 5 in both groups). All values were corrected for
the housekeeping control -tubulin. Values are presented as means ± SEM. All samples were
derived at the same time and processed in parallel.
(TIF)
AcknowledgmentsThe authors thank the scientific staff at both Oslo and Stockholm groups for scientific
discussions.
Author Contributions
Conceptualization: JL ACR TML CAD KIB KJK EIJ DST HKS HLG JJ GHT.
Formal analysis: JL.
Funding acquisition: JL ACR CAD KIB AK JJ GHT.
Investigation: JL NGL JMM TML YZF CS MGB KJK EIJ DST HKS HLG.
Methodology: JL ACR AK ETK GHT.
Project administration: JL.
Resources: ACR KIB HLG AK JJ GHT.
Supervision: JL ACR ETK GHT.
Validation: JL ACR ETK GHT.
Visualization: JL.
Writing – original draft: JL.
Writing – review & editing: JL ACR JMM CAD KIB HLG AK ETK JJ GHT.
References1. Ginter E, Simko V. Type 2 diabetes mellitus, pandemic in 21st century. Diabetes: Springer; 2013. p.
42–50.
2. Tuomilehto J, Lindstrom J, Eriksson JG, Valle TT, Hamalainen H, Ilanne-Parikka P, et al. Prevention oftype 2 diabetes mellitus by changes in lifestyle among subjects with impaired glucose tolerance. NewEngland Journal of Medicine. 2001; 344(18):1343–50. https://doi.org/10.1056/NEJM200105033441801PMID: 11333990
Changedmetabolism in myotubes from overweight post-training
PLOSONE | https://doi.org/10.1371/journal.pone.0175441 April 12, 2017 20 / 24
3. Alberti KGM, Zimmet P, Shaw J. International Diabetes Federation: a consensus on Type 2 diabetesprevention. Diabetic Medicine. 2007; 24(5):451–63. https://doi.org/10.1111/j.1464-5491.2007.02157.xPMID: 17470191
4. James PT. Obesity: the worldwide epidemic. Clinics in dermatology. 2004; 22(4):276–80. https://doi.org/10.1016/j.clindermatol.2004.01.010 PMID: 15475226
5. Smyth S, Heron A. Diabetes and obesity: the twin epidemics. Nature medicine. 2006; 12(1):75–80.https://doi.org/10.1038/nm0106-75 PMID: 16397575
6. Turcotte LP, Fisher JS. Skeletal muscle insulin resistance: roles of fatty acid metabolism and exercise.Physical therapy. 2008; 88(11):1279–96. https://doi.org/10.2522/ptj.20080018 PMID: 18801860
7. Kiens B. Skeletal muscle lipid metabolism in exercise and insulin resistance. Physiological Reviews.2006; 86(1):205–43. https://doi.org/10.1152/physrev.00023.2004 PMID: 16371598
8. Ramos-Jimenez A, Hernandez-Torres RP, Torres-Duran PV, Romero-Gonzalez J, Mascher D, Posa-das-Romero C, et al. The respiratory exchange ratio is associated with fitness indicators both in trainedand untrained men: a possible application for people with reduced exercise tolerance. Clinical MedicineInsights Circulatory, Respiratory and Pulmonary Medicine. 2008; 2:1.
9. O’Gorman DJ, Krook A. Exercise and the treatment of diabetes and obesity. Endocrinology and metab-olism clinics of North America. 2008; 37(4):887–903. https://doi.org/10.1016/j.ecl.2008.07.006 PMID:19026938
10. DeFronzo RA, Gunnarsson R, Bjorkman O, Olsson M,Wahren J. Effects of insulin on peripheral andsplanchnic glucosemetabolism in noninsulin-dependent (type II) diabetes mellitus. Journal of ClinicalInvestigation. 1985; 76(1):149. https://doi.org/10.1172/JCI111938 PMID: 3894418
11. Egan B, Zierath JR. Exercise metabolism and the molecular regulation of skeletal muscle adaptation.Cell metabolism. 2013; 17(2):162–84. https://doi.org/10.1016/j.cmet.2012.12.012 PMID: 23395166
12. Mauro A. Satellite cell of skeletal muscle fibers. The Journal of biophysical and biochemical cytology.1961; 9(2):493–5.
13. Blau HM,Webster C. Isolation and characterization of humanmuscle cells. Proceedings of the NationalAcademy of Sciences. 1981; 78(9):5623–7.
14. Ling C, Groop L. Epigenetics: a molecular link between environmental factors and type 2 diabetes. Dia-betes. 2009; 58(12):2718–25. https://doi.org/10.2337/db09-1003 PMID: 19940235
15. Nitert MD, Dayeh T, Volkov P, Elgzyri T, Hall E, Nilsson E, et al. Impact of an exercise intervention onDNAmethylation in skeletal muscle from first-degree relatives of patients with type 2 diabetes. Diabe-tes. 2012; 61(12):3322–32. https://doi.org/10.2337/db11-1653 PMID: 23028138
16. Bourlier V, Saint-Laurent C, Louche K, Badin P-M, Thalamas C, de Glisezinski I, et al. Enhanced Glu-cose Metabolism Is Preserved in Cultured Primary Myotubes FromObese Donors in Response to Exer-cise Training. The Journal of Clinical Endocrinology & Metabolism. 2013; 98(9):3739–47.
17. Gaster M. Metabolic flexibility is conserved in diabetic myotubes. Journal of lipid research. 2007; 48(1):207–17. https://doi.org/10.1194/jlr.M600319-JLR200 PMID: 17062897
18. Green C, Bunprajun T, Pedersen B, Scheele C. Physical activity is associated with retained musclemetabolism in humanmyotubes challenged with palmitate. The Journal of physiology. 2013; 591(18):4621–35. https://doi.org/10.1113/jphysiol.2013.251421 PMID: 23774280
19. Aas V, Bakke SS, Feng YZ, Kase ET, Jensen J, Bajpeyi S, et al. Are cultured humanmyotubes far fromhome? Cell and tissue research. 2013; 354(3):671–82. https://doi.org/10.1007/s00441-013-1655-1PMID: 23749200
20. Kase ET, Feng YZ, Badin P-M, Bakke SS, Laurens C, CoueM, et al. Primary defects in lipolysis andinsulin action in skeletal muscle cells from type 2 diabetic individuals. Biochimica et Biophysica Acta(BBA)-Molecular and Cell Biology of Lipids. 2015; 1851(9):1194–201.
21. Sharples AP, Stewart CE, Seaborne RA. Does skeletal muscle have an ‘epi’-memory? The role of epi-genetics in nutritional programming, metabolic disease, aging and exercise. Aging cell. 2016.
22. Ahlborg G, Felig P, Hagenfeldt L, Hendler R, Wahren J. Substrate turnover during prolonged exercise inman: splanchnic and leg metabolism of glucose, free fatty acids, and amino acids. Journal of ClinicalInvestigation. 1974; 53(4):1080. https://doi.org/10.1172/JCI107645 PMID: 4815076
23. Young D, Pelligra R, Shapira J, Adachi R, Skrettingland K. Glucose oxidation and replacement duringprolonged exercise in man. Journal of applied physiology. 1967; 23(5):734–41. PMID: 6061388
24. Battaglia GM, Zheng D, Hickner RC, Houmard JA. Effect of exercise training on metabolic flexibilityin response to a high-fat diet in obese individuals. American Journal of Physiology-Endocrinologyand Metabolism. 2012; 303(12):E1440–E5. https://doi.org/10.1152/ajpendo.00355.2012 PMID:23047988
Changedmetabolism in myotubes from overweight post-training
PLOSONE | https://doi.org/10.1371/journal.pone.0175441 April 12, 2017 21 / 24
25. Berggren JR, Boyle KE, ChapmanWH, Houmard JA. Skeletal muscle lipid oxidation and obesity: influ-ence of weight loss and exercise. American Journal of Physiology-Endocrinology and Metabolism.2008; 294(4):E726–E32. https://doi.org/10.1152/ajpendo.00354.2007 PMID: 18252891
26. Langleite TM, Jensen J, Norheim F, Gulseth HL, Tangen DS, Kolnes KJ, et al. Insulin sensitivity, bodycomposition and adipose depots following 12 w combined endurance and strength training in dysglyce-mic and normoglycemic sedentary men. Archives of Physiology and Biochemistry. 2016:1–13.
27. Johansson L, Solvoll K, Opdahl S, Bjoerneboe G-EA, Drevon C. Response rates with different distribu-tion methods and reward, and reproducibility of a quantitative food frequency questionnaire. Europeanjournal of clinical nutrition. 1997; 51(6):346–53. PMID: 9192190
28. Li Y, Lee S, Langleite T, Norheim F, Pourteymour S, Jensen J, et al. Subsarcolemmal lipid dropletresponses to a combined endurance and strength exercise intervention. Physiological reports. 2014; 2(11):e12187. https://doi.org/10.14814/phy2.12187 PMID: 25413318
29. Henry RR, Abrams L, Nikoulina S, Ciaraldi TP. Insulin action and glucose metabolism in nondiabeticcontrol and NIDDM subjects: comparison using human skeletal muscle cell cultures. Diabetes. 1995; 44(8):936–46. PMID: 7622000
30. Gaster M, Beck-Nielsen H, Schrøder H. Proliferation conditions for human satellite cells The fractionalcontent of satellite cells. Apmis. 2001; 109(11):726–34. PMID: 11900051
31. Gaster M, Kristensen S, Beck-Nielsen H, Schrøder H. A cellular model system of differentiated humanmyotubes. Apmis. 2001; 109(11):735–44. PMID: 11900052
32. Wensaas A, Rustan A, Lovstedt K, Kull B, Wikstrom S, Drevon C, et al. Cell-based multiwell assays forthe detection of substrate accumulation and oxidation. Journal of lipid research. 2007; 48(4):961–7.https://doi.org/10.1194/jlr.D600047-JLR200 PMID: 17213484
33. Kase ET, Andersen B, Nebb HI, Rustan AC, Thoresen GH. 22-Hydroxycholesterols regulate lipidmetabolism differently than T0901317 in humanmyotubes. Biochimica et Biophysica Acta (BBA)-Molecular and Cell Biology of Lipids. 2006; 1761(12):1515–22.
34. Hessvik NP, Bakke SS, Fredriksson K, Boekschoten MV, Fjørkenstad A, Koster G, et al. Metabolicswitching of humanmyotubes is improved by n-3 fatty acids. Journal of lipid research. 2010; 51(8):2090–104. https://doi.org/10.1194/jlr.M003319 PMID: 20363834
35. Hardie DG, Sakamoto K. AMPK: a key sensor of fuel and energy status in skeletal muscle. Physiology.2006; 21(1):48–60.
36. McGee SL, Howlett KF, Starkie RL, Cameron-Smith D, Kemp BE, Hargreaves M. Exercise increasesnuclear AMPK α2 in human skeletal muscle. Diabetes. 2003; 52(4):926–8. PMID: 12663462
37. Lira VA, Benton CR, Yan Z, Bonen A. PGC-1α regulation by exercise training and its influences on mus-cle function and insulin sensitivity. American Journal of Physiology-Endocrinology and Metabolism.2010; 299(2):E145–E61. https://doi.org/10.1152/ajpendo.00755.2009 PMID: 20371735
38. Koves TR, Sparks LM, Kovalik J, Mosedale M, Arumugam R, DeBalsi KL, et al. PPARγ coactivator-1αcontributes to exercise-induced regulation of intramuscular lipid droplet programming in mice andhumans. Journal of lipid research. 2013; 54(2):522–34. https://doi.org/10.1194/jlr.P028910 PMID:23175776
39. Baar K, Wende AR, Jones TE, Marison M, Nolte LA, ChenM, et al. Adaptations of skeletal muscle toexercise: rapid increase in the transcriptional coactivator PGC-1. The FASEB Journal. 2002; 16(14):1879–86. https://doi.org/10.1096/fj.02-0367com PMID: 12468452
40. Kerner J, Hoppel C. Fatty acid import into mitochondria. Biochimica et Biophysica Acta (BBA)-Molecularand Cell Biology of Lipids. 2000; 1486(1):1–17.
41. Ehrenborg E, Krook A. Regulation of skeletal muscle physiology and metabolism by peroxisome prolif-erator-activated receptor δ. Pharmacological Reviews. 2009; 61(3):373–93. https://doi.org/10.1124/pr.109.001560 PMID: 19805479
42. Kulkarni SS, Salehzadeh F, Fritz T, Zierath JR, Krook A, Osler ME. Mitochondrial regulators of fattyacid metabolism reflect metabolic dysfunction in type 2 diabetes mellitus. Metabolism. 2012; 61(2):175–85. https://doi.org/10.1016/j.metabol.2011.06.014 PMID: 21816445
43. Jager S, Handschin C, Pierre JS-, Spiegelman BM. AMP-activated protein kinase (AMPK) action inskeletal muscle via direct phosphorylation of PGC-1α. Proceedings of the National Academy of Sci-ences. 2007; 104(29):12017–22.
44. Ljubicic V, Joseph A-M, Saleem A, Uguccioni G, Collu-Marchese M, Lai RY, et al. Transcriptional andpost-transcriptional regulation of mitochondrial biogenesis in skeletal muscle: effects of exercise andaging. Biochimica et Biophysica Acta (BBA)-General Subjects. 2010; 1800(3):223–34.
45. Shaw CS, Sherlock M, Stewart PM,Wagenmakers AJ. Adipophilin distribution and colocalisation withlipid droplets in skeletal muscle. Histochemistry and cell biology. 2009; 131(5):575–81. https://doi.org/10.1007/s00418-009-0558-4 PMID: 19169702
Changedmetabolism in myotubes from overweight post-training
PLOSONE | https://doi.org/10.1371/journal.pone.0175441 April 12, 2017 22 / 24
46. BosmaM, Hesselink MK, Sparks LM, Timmers S, Ferraz MJ, Mattijssen F, et al. Perilipin 2 improvesinsulin sensitivity in skeletal muscle despite elevated intramuscular lipid levels. Diabetes. 2012; 61(11):2679–90. https://doi.org/10.2337/db11-1402 PMID: 22807032
47. Koonen DP, Glatz JF, Bonen A, Luiken JJ. Long-chain fatty acid uptake and FAT/CD36 translocation inheart and skeletal muscle. Biochimica et Biophysica Acta (BBA)-Molecular and Cell Biology of Lipids.2005; 1736(3):163–80.
48. Zhang L, KeungW, Samokhvalov V, WangW, Lopaschuk GD. Role of fatty acid uptake and fatty acidβ-oxidation in mediating insulin resistance in heart and skeletal muscle. Biochimica et Biophysica Acta(BBA)-Molecular and Cell Biology of Lipids. 2010; 1801(1):1–22.
49. Feng YZ, NikolićN, Bakke SS, Boekschoten MV, Kersten S, Kase ET, et al. PPARδ activation in humanmyotubes increases mitochondrial fatty acid oxidative capacity and reduces glucose utilization by aswitch in substrate preference. Archives of physiology and biochemistry. 2014; 120(1):12–21. https://doi.org/10.3109/13813455.2013.829105 PMID: 23991827
50. Kersten S, Mandard S, Tan NS, Escher P, Metzger D, Chambon P, et al. Characterization of the fast-ing-induced adipose factor FIAF, a novel peroxisome proliferator-activated receptor target gene. Jour-nal of Biological Chemistry. 2000; 275(37):28488–93. https://doi.org/10.1074/jbc.M004029200 PMID:10862772
51. Mandard S, Zandbergen F, Tan NS, Escher P, Patsouris D, Koenig W, et al. The direct peroxisomeproliferator-activated receptor target fasting-induced adipose factor (FIAF/PGAR/ANGPTL4) ispresent in blood plasma as a truncated protein that is increased by fenofibrate treatment. Journal ofBiological Chemistry. 2004; 279(33):34411–20. https://doi.org/10.1074/jbc.M403058200 PMID:15190076
52. Staiger H, Haas C, Machann J, Werner R, Weisser M, Schick F, et al. Muscle-Derived Angiopoietin-Like Protein 4 Is Induced by Fatty Acids via Peroxisome Proliferator–Activated Receptor (PPAR)-δ andIs of Metabolic Relevance in Humans. Diabetes. 2009; 58(3):579–89. https://doi.org/10.2337/db07-1438 PMID: 19074989
53. Bostrom PA, Graham EL, Georgiadi A, Ma X. Impact of exercise on muscle and nonmuscle organs.IUBMB life. 2013; 65(10):845–50. https://doi.org/10.1002/iub.1209 PMID: 24078392
54. Feng YZ, NikolićN, Bakke SS, Kase ET, Guderud K, Hjelmesæth J, et al. Myotubes from lean andseverely obese subjects with and without type 2 diabetes respond differently to an in vitro model of exer-cise. American Journal of Physiology-Cell Physiology. 2015; 308(7):C548–C56. https://doi.org/10.1152/ajpcell.00314.2014 PMID: 25608533
55. NikolićN, Bakke SS, Kase ET, Rudberg I, Halle IF, Rustan AC, et al. Electrical pulse stimulation of cul-tured human skeletal muscle cells as an in vitro model of exercise. PLoS One. 2012; 7(3).
56. Perseghin G, Price TB, Petersen KF, RodenM, Cline GW, Gerow K, et al. Increased glucose transport–phosphorylation and muscle glycogen synthesis after exercise training in insulin-resistant subjects.New England Journal of Medicine. 1996; 335(18):1357–62. https://doi.org/10.1056/NEJM199610313351804 PMID: 8857019
57. Wensaas AJ, Rustan AC, Just M, Berge RK, Drevon CA, Gaster M. Fatty Acid Incubation of MyotubesFromHumansWith Type 2 Diabetes Leads to Enhanced Release of β-Oxidation Products Because ofImpaired Fatty Acid Oxidation. Diabetes. 2009; 58(3):527–35. https://doi.org/10.2337/db08-1043PMID: 19066312
58. Kase E, Thoresen G,Westerlund S, Højlund K, Rustan A, Gaster M. Liver X receptor antagonistreduces lipid formation and increases glucosemetabolism in myotubes from lean, obese and type 2 dia-betic individuals. Diabetologia. 2007; 50(10):2171–80. https://doi.org/10.1007/s00125-007-0760-7PMID: 17661008
59. Kase ET,Wensaas AJ, Aas V, Højlund K, Levin K, Thoresen GH, et al. Skeletal muscle lipid accumula-tion in type 2 diabetes may involve the liver X receptor pathway. Diabetes. 2005; 54(4):1108–15. PMID:15793250
60. Bakke SS, Feng YZ, NikolićN, Kase ET, Moro C, Stensrud C, et al. Myotubes from severely obese type2 diabetic subjects accumulate less lipids and show higher lipolytic rate than myotubes from severelyobese non-diabetic subjects. PloS one. 2015; 10(3):e0119556. https://doi.org/10.1371/journal.pone.0119556 PMID: 25790476
61. Gerhart-Hines Z, Rodgers JT, Bare O, Lerin C, Kim SH, Mostoslavsky R, et al. Metabolic control of mus-cle mitochondrial function and fatty acid oxidation through SIRT1/PGC-1α. The EMBO journal. 2007; 26(7):1913–23. https://doi.org/10.1038/sj.emboj.7601633 PMID: 17347648
62. Wende AR, Huss JM, Schaeffer PJ, Giguere V, Kelly DP. PGC-1α coactivates PDK4 gene expressionvia the orphan nuclear receptor ERRα: a mechanism for transcriptional control of muscle glucosemetabolism. Molecular and cellular biology. 2005; 25(24):10684–94. https://doi.org/10.1128/MCB.25.24.10684-10694.2005 PMID: 16314495
Changedmetabolism in myotubes from overweight post-training
PLOSONE | https://doi.org/10.1371/journal.pone.0175441 April 12, 2017 23 / 24
63. NikolićN, Rhedin M, Rustan AC, Storlien L, Thoresen GH, Stromstedt M. Overexpression of PGC-1αincreases fatty acid oxidative capacity of human skeletal muscle cells. Biochemistry research interna-tional. 2011; 2012.
64. ReikW. Stability and flexibility of epigenetic gene regulation in mammalian development. Nature. 2007;447(7143):425–32. https://doi.org/10.1038/nature05918 PMID: 17522676
65. Barres R, Yan J, Egan B, Treebak JT, Rasmussen M, Fritz T, et al. Acute exercise remodels promotermethylation in human skeletal muscle. Cell metabolism. 2012; 15(3):405–11. https://doi.org/10.1016/j.cmet.2012.01.001 PMID: 22405075
66. Jorge MLMP, de Oliveira VN, Resende NM, Paraiso LF, Calixto A, Diniz ALD, et al. The effects of aero-bic, resistance, and combined exercise on metabolic control, inflammatory markers, adipocytokines,and muscle insulin signaling in patients with type 2 diabetes mellitus. Metabolism. 2011; 60(9):1244–52. https://doi.org/10.1016/j.metabol.2011.01.006 PMID: 21377179
67. Stuart CA, South MA, Lee ML, McCurry MP, Howell ME, RamseyMW, et al. Insulin responsiveness inmetabolic syndrome after eight weeks of cycle training. Medicine and science in sports and exercise.2013; 45(11):2021. https://doi.org/10.1249/MSS.0b013e31829a6ce8 PMID: 23669880
68. Nascimento EB, Riedl I, Jiang LQ, Kulkarni SS, Naslund E, Krook A. Enhanced glucosemetabolism incultured human skeletal muscle after Roux-en-Y gastric bypass surgery. Surgery for Obesity andRelated Diseases. 2015; 11(3):592–601. https://doi.org/10.1016/j.soard.2014.11.001 PMID: 25862179
69. DeFronzo RA. From the triumvirate to the ominous octet: a new paradigm for the treatment of type 2 dia-betes mellitus. Diabetes. 2009; 58(4):773–95. https://doi.org/10.2337/db09-9028 PMID: 19336687
70. Samuel VT, Shulman GI. Mechanisms for insulin resistance: common threads and missing links. Cell.2012; 148(5):852–71. https://doi.org/10.1016/j.cell.2012.02.017 PMID: 22385956
Changedmetabolism in myotubes from overweight post-training
PLOSONE | https://doi.org/10.1371/journal.pone.0175441 April 12, 2017 24 / 24
Related Documents