Regularized Regression Dudoit Regularization Ridge Regression LASSO Regression Elastic Net Regression Bias-Variance Trade-Off Example: Prostate Cancer Dataset Regularized Regression Data 100: Principles and Techniques of Data Science Sandrine Dudoit Department of Statistics and Division of Biostatistics, UC Berkeley Spring 2019 1 / 30

Welcome message from author
This document is posted to help you gain knowledge. Please leave a comment to let me know what you think about it! Share it to your friends and learn new things together.
Transcript
RegularizedRegression
Dudoit
Regularization
RidgeRegression
LASSORegression
Elastic NetRegression
Bias-VarianceTrade-Off
Example:ProstateCancerDataset
Regularized RegressionData 100: Principles and Techniques of Data Science
Sandrine Dudoit
Department of Statistics and Division of Biostatistics, UC Berkeley
Spring 2019
1 / 30
RegularizedRegression
Dudoit
Regularization
RidgeRegression
LASSORegression
Elastic NetRegression
Bias-VarianceTrade-Off
Example:ProstateCancerDataset
Outline
1 Regularization
2 Ridge Regression
3 LASSO Regression
4 Elastic Net Regression
5 Bias-Variance Trade-Off
6 Example: Prostate Cancer Dataset
Version: 21/03/2019, 16:40
2 / 30

RegularizedRegression
Dudoit
Regularization
RidgeRegression
LASSORegression
Elastic NetRegression
Bias-VarianceTrade-Off
Example:ProstateCancerDataset
Regularization
• Which features/variables should we include in a regressionfunction and “how much” of each variable should weinclude?
• Regularization, also known as shrinkage, is a generalapproach for model/variable selection and for preventingoverfitting.
• The main idea is to introduce additional modelingassumptions or impose constraints on the estimators,usually through a penalty for complexity in the lossfunction.
• As seen earlier, model/estimator complexity can bemeasured in various ways, e.g., in regression, number ofcovariates, magnitude of regression coefficients,smoothness of the regression function.
3 / 30

RegularizedRegression
Dudoit
Regularization
RidgeRegression
LASSORegression
Elastic NetRegression
Bias-VarianceTrade-Off
Example:ProstateCancerDataset
Regularization
• For linear regression, with the squared error/L2 lossfunction, common regularization approaches involve“penalizing” covariates with “large” regression coefficients.
I Ridge regression: Penalty based on sum of squares(Euclidean/L2 norm) of regression coefficients.
I Least absolute shrinkage and selection operator or LASSO:Penalty based on sum of absolute values (L1 norm) ofregression coefficients.
I Elastic net: Both L1 and L2 penalties.
• Regularization techniques may themselves require anotherlayer of model selection, corresponding to the tuning ofcomplexity parameters used to penalize the loss function.Cross-validation may be used for this purpose.
4 / 30

RegularizedRegression
Dudoit
Regularization
RidgeRegression
LASSORegression
Elastic NetRegression
Bias-VarianceTrade-Off
Example:ProstateCancerDataset
Regularization
• In what follows, we assume we have a learning setLn = {(Xi ,Yi ) : i = 1, . . . , n} that is a random sample ofn covariate/outcome pairs from the population of interest.
• Define the design matrix or model matrix Xn as the n × Jmatrix with ith row corresponding to the ith covariatevector Xi , i = 1, . . . , n.
• Define the outcome vector Yn as an n-dimensional columnvector with ith element corresponding to the ith outcomeYi , i = 1, . . . , n.
5 / 30

RegularizedRegression
Dudoit
Regularization
RidgeRegression
LASSORegression
Elastic NetRegression
Bias-VarianceTrade-Off
Example:ProstateCancerDataset
Regularization
• We are interested in fitting linear regression functions ofthe form
E[Y |X ] = X>β =J∑
j=1
βjXj = β1X1 + . . .+ βJXJ , (1)
where the column vector β = (βj : j = 1, . . . , J) ∈ RJ
contains the parameters of the model, referred to asregression coefficients.
6 / 30

RegularizedRegression
Dudoit
Regularization
RidgeRegression
LASSORegression
Elastic NetRegression
Bias-VarianceTrade-Off
Example:ProstateCancerDataset
Regularization
β1
β2
Ridge, α=0Elastic net, α= 1/4, 1/2, 3/4LASSO, α=1
Figure 1: Elastic net regression. Constraints for elastic net, J = 2:α‖β‖1 + (1− α)‖β‖2
2 ≤ κ, κ = 3.
7 / 30
RegularizedRegression
Dudoit
Regularization
RidgeRegression
LASSORegression
Elastic NetRegression
Bias-VarianceTrade-Off
Example:ProstateCancerDataset
Rigde Regression
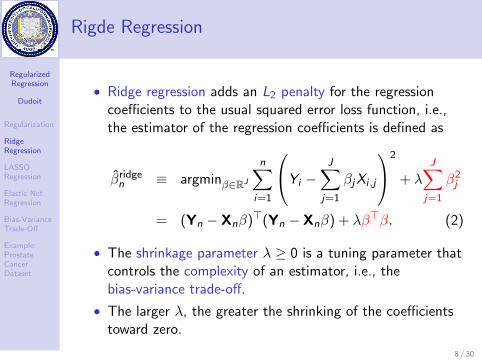
• Ridge regression adds an L2 penalty for the regressioncoefficients to the usual squared error loss function, i.e.,the estimator of the regression coefficients is defined as
βridgen ≡ argminβ∈RJ
n∑i=1
Yi −J∑
j=1
βjXi ,j
2
+ λ
J∑j=1
β2j
= (Yn − Xnβ)>(Yn − Xnβ) + λβ>β. (2)
• The shrinkage parameter λ ≥ 0 is a tuning parameter thatcontrols the complexity of an estimator, i.e., thebias-variance trade-off.
• The larger λ, the greater the shrinking of the coefficientstoward zero.
8 / 30

RegularizedRegression
Dudoit
Regularization
RidgeRegression
LASSORegression
Elastic NetRegression
Bias-VarianceTrade-Off
Example:ProstateCancerDataset
Rigde Regression
• One can show, using an argument similar as in the lectureon “Linear Regression”, that the ridge regression estimatoris
βridgen = (X>n Xn + λIJ)−1X>n Yn. (3)
• When λ = 0, we have the usual linear regression estimator,also known as ordinary least squares (OLS) estimator,
βOLSn = (X>n Xn)−1X>n Yn. (4)
• Ridge regression simply adds a positive constant to thediagonal of X>n Xn, which makes the matrix non-singular,even when the design matrix is not of full rank.
• The ridge estimator is biased, but typically less variablethan the ordinary least squares estimator.
9 / 30

RegularizedRegression
Dudoit
Regularization
RidgeRegression
LASSORegression
Elastic NetRegression
Bias-VarianceTrade-Off
Example:ProstateCancerDataset
Rigde Regression
• As the penalty parameter λ increases, bias tends toincrease while variance tends to decrease.
10 / 30

RegularizedRegression
Dudoit
Regularization
RidgeRegression
LASSORegression
Elastic NetRegression
Bias-VarianceTrade-Off
Example:ProstateCancerDataset
LASSO Regression
• The least absolute shrinkage and selection operator(LASSO) is a shrinkage method similar in spirits to ridgeregression, with subtle, yet important differences.
• LASSO regression adds an L1 penalty for the regressioncoefficients to the usual squared error loss function, i.e.,the estimator of the regression coefficients is defined as
βLASSOn ≡ argminβ∈RJ
n∑i=1
Yi −J∑
j=1
βjXi ,j
2
+ λ
J∑j=1
|βj |
= (Yn − Xnβ)>(Yn − Xnβ) + λ‖β‖1. (5)
• The shrinkage parameter λ ≥ 0 is a tuning parameter thatcontrols the complexity of an estimator.
11 / 30

RegularizedRegression
Dudoit
Regularization
RidgeRegression
LASSORegression
Elastic NetRegression
Bias-VarianceTrade-Off
Example:ProstateCancerDataset
LASSO Regression
• When λ = 0, we have the usual OLS estimator.
• However, unlike ridge regression, there is no closed-formexpression for the LASSO estimator of the regressioncoefficients.
• Instead, one can rely on a variety of numerical optimizationmethods to minimize the penalized risk function.
• Also, unlike ridge regression, the LASSO estimator is notlinear in the outcome Yn.
• The LASSO can be used for variable selection. By virtueof the L1 constraint in Equation (5), making λ sufficientlylarge causes some of the estimators to be exactly zero.
12 / 30

RegularizedRegression
Dudoit
Regularization
RidgeRegression
LASSORegression
Elastic NetRegression
Bias-VarianceTrade-Off
Example:ProstateCancerDataset
LASSO Regression
• While there are no closed-form expressions for the bias andvariance of the LASSO estimator, bias tends to increasewhile variance tends to decrease as the amount ofshrinkage increases.
13 / 30

RegularizedRegression
Dudoit
Regularization
RidgeRegression
LASSORegression
Elastic NetRegression
Bias-VarianceTrade-Off
Example:ProstateCancerDataset
Ridge vs. LASSO Regression
• Interpretative ability: Unlike the LASSO, ridge regressiondoes not perform variable selection, in the sense that itdoes not set regression coefficients exactly to zero unlessλ =∞, in which case they are all zero.
• Predictive ability: Similar mean squared error.
• Computational complexity: Similar; good algorithmsavailable for the LASSO.
14 / 30

RegularizedRegression
Dudoit
Regularization
RidgeRegression
LASSORegression
Elastic NetRegression
Bias-VarianceTrade-Off
Example:ProstateCancerDataset
Elastic Net Regression
• The elastic net estimator of the regression coefficientsgeneralizes both ridge and LASSO regression, in that itinvolves both an L1 and an L2 penalty,
βenetn ≡ argminβ∈RJ
n∑i=1
Yi −J∑
j=1
βjXi ,j
2
(6)
+λ1
J∑j=1
|βj |+ λ2
J∑j=1
β2j .
• The shrinkage parameters λ1 ≥ 0 and λ2 ≥ 0 are tuningparameters that control the strength of the penalty terms,i.e., the complexity or shrinking of the coefficients towardszero.
15 / 30

RegularizedRegression
Dudoit
Regularization
RidgeRegression
LASSORegression
Elastic NetRegression
Bias-VarianceTrade-Off
Example:ProstateCancerDataset
Elastic Net Regression
Table 1: Elastic net regression. The elastic net covers as special casesthe following regression methods.
Method Shrinkage parametersOLS λ1 = λ2 = 0Ridge λ1 = 0, λ2 ≥ 0LASSO λ1 ≥ 0, λ2 = 0Elastic net λ1 ≥ 0, λ2 ≥ 0
βn = 0 λ1 =∞ or λ2 =∞
16 / 30

RegularizedRegression
Dudoit
Regularization
RidgeRegression
LASSORegression
Elastic NetRegression
Bias-VarianceTrade-Off
Example:ProstateCancerDataset
Bias-Variance Trade-Off
• As usual, we are faced with a bias-variance trade-off in thechoice of the shrinkage parameters λ1 and λ2.
• Increasing the amount of shrinkage tends to increase biasand decrease variance.
• By finding the right amount of shrinkage, an increase inbias can be compensated by a decrease in variance, so thatrisk, here mean squared error (MSE), is reduced overall.
• Cross-validation may be used for tuning the shrinkageparameters.
17 / 30

RegularizedRegression
Dudoit
Regularization
RidgeRegression
LASSORegression
Elastic NetRegression
Bias-VarianceTrade-Off
Example:ProstateCancerDataset
Pre-Processing the Covariates
• It is usually appropriate to leave the intercept unpenalized,otherwise, the results would depend on the origin chosenfor the outcome Y .
• One instead considers centered covariates (mean zero),i.e., a column-centered design matrix Xn. The interceptcan then be estimated by the empirical mean of theoutcomes βn,0 = Yn =
∑i Yi/n and the remaining
regression coefficients by regularized regression withoutintercept.
• The same penalty is imposed on all regression coefficientsand their estimators are not invariant to scaling of thecovariates. It is therefore common to scale the covariates(to have variance one) prior to performing regularizedregression.
18 / 30

RegularizedRegression
Dudoit
Regularization
RidgeRegression
LASSORegression
Elastic NetRegression
Bias-VarianceTrade-Off
Example:ProstateCancerDataset
Example: Prostate Cancer Dataset
• The prostate specific antigen (PSA) is present in smallamounts in the serum of men with healthy prostates, butis often elevated in the presence of prostate cancer orother prostate disorders.
• PSA levels are used in the diagnosis and treatment ofprostate cancer.
• We will use the prostate dataset to investigate how PSAlevels (lpsa) relate to the following clinical covariates.
I lcavol: log(cancer volume)I lweight: log(prostate weight)I ageI lbph: log(benign prostatic hyperplasia amount)I svi: seminal vesicle invasionI lcp: log(capsular penetration)I gleason: Gleason score
19 / 30

RegularizedRegression
Dudoit
Regularization
RidgeRegression
LASSORegression
Elastic NetRegression
Bias-VarianceTrade-Off
Example:ProstateCancerDataset
Example: Prostate Cancer Dataset
I pgg45: Percentage Gleason scores 4 or 5.
• The dataset comprises 97 observations in 87 men whowere about to undergo a radical prostatectomy.
• The 97 observations are divided into a learning set (LS) of67 patients and a test set (TS) of 30 patients.
• We will use these data to estimate the regression functionof the lpsa outcome on the 8 clinical covariates andassess the performance of the estimate in terms of risk forthe prediction of PSA levels.
20 / 30

RegularizedRegression
Dudoit
Regularization
RidgeRegression
LASSORegression
Elastic NetRegression
Bias-VarianceTrade-Off
Example:ProstateCancerDataset
Example: Prostate Cancer Dataset
●
● ●●
●
● ●●● ●
●● ●●●●● ●● ● ● ●● ●● ●●● ● ●●● ●●● ●●
● ●●● ●● ●●● ●● ●●● ●● ● ●●●●● ●● ● ●●●● ●●● ● ●●● ●
●●● ●●●● ●●●● ●●●
●● ●●
●
●
●
●●
−1 1 2 3 4
01
23
45
Correlation=0.73
lcavol
lpsa
●
●● ●
●
● ●●●●●●●●
●● ●●● ●●●●● ●● ●●● ● ●●● ●● ●●● ●●● ● ●●●● ●●●● ● ●● ●● ●● ● ●● ●●● ●● ●●● ● ●●● ●●
●● ●●● ●● ● ●●●● ●●
●● ●●
●
●
●
●●
2.5 3.5 4.5
01
23
45
Correlation=0.43
lweight
lpsa
●
● ●●
●
● ●●● ●
●●● ●● ● ●●● ●●●● ● ●●●●●●●● ●● ●●
●● ●● ● ●●●●● ●●● ●●●● ●● ●●● ●● ●● ●●●● ● ●● ●● ●●●
●●● ●●● ●● ●●● ●● ●
● ●●●
●
●
●
●●
40 50 60 70 80
01
23
45
Correlation=0.17
age
lpsa
●
●●●
●
● ● ●●●● ●●●●● ●●●
●● ●● ● ●●● ●●● ●●●●● ●●● ●●●● ●●●● ●●● ●● ●●●● ●● ●● ● ●●● ●● ● ● ●● ●● ●● ●
● ● ●●●● ●●● ● ●● ●●
● ●●●
●
●
●
●●
−1 0 1 2
01
23
45
Correlation=0.18
lbph
lpsa
●
●●●
●
●●●●●●●●●●●●●●●●●●●●●●●●●●●●●●●●● ●●●●●●●● ●●●●●●●●●●●●●●● ●● ●●●●●●●
●● ●●●●
●● ●●●● ●●● ●● ●
●●●●
●
●
●
●●
0.0 0.4 0.8
01
23
45
Correlation=0.57
svi
lpsa
●
●●●
●
●●●●●●● ●● ●● ● ●●●●
●● ●●● ●● ● ●●●●● ●● ●● ●●●● ● ●●● ●●● ●●● ● ●●● ●●●●● ●● ●● ● ●●● ● ●● ● ●
● ●●● ●●● ●● ●● ●● ●
●●●●
●
●
●
●●
−1 0 1 2 3
01
23
45
Correlation=0.55
lcp
lpsa
●
● ●●
●
●●●●●●● ●●
●● ●●●●● ●● ●●● ●●●●●●●●● ● ●●●●
●●● ●●● ●●●● ●● ●●●●●● ●●● ● ●●● ●●●● ●●●●
●●●●●●●●●● ●●●● ●
●●●●
●
●
●
●●
6.0 7.0 8.0 9.0
01
23
45
Correlation=0.37
gleason
lpsa
●
● ●●
●
●●●●●●● ●●●● ●●●●● ●● ●●● ●● ●●●●●●●● ●● ●● ●●●●
●● ●●●● ●● ●●● ●●● ● ●● ● ●●● ● ●●●● ●●● ●● ● ●● ●●● ●● ●● ●● ●
● ●●●
●
●
●
●●
0 40 80
01
23
45
Correlation=0.42
pgg45
lpsa
Prostate
Figure 2: prostate dataset. Scatterplots of lpsa outcome vs. eachof 8 covariates (Red: LS, Blue: TS; Magenta: lm, Cyan: lowess). 21 / 30

RegularizedRegression
Dudoit
Regularization
RidgeRegression
LASSORegression
Elastic NetRegression
Bias-VarianceTrade-Off
Example:ProstateCancerDataset
Example: Prostate Cancer Dataset
Prostate
●●●●●●●●●
●●●●
●
●●●●●●●●●●●●●●
●●●●●●●●●●●●●
●●●●●●●●●●●●●●●●
●●●●●●●●●●
●●●●●●●●●●●●●●●●●
●●●●●●●●●●●●● ●●●●●●●●●●●●●●●
●●●●●●●●●●●●●●●●●●●●
●●●●●●●●●●●●●●●●●●●●●●●●●●●●●●●● ●●●●●●●●●●●●●●●●●●●●●●●●●●●●●●
●
●
●
●
●
●
●
●●●
●●
●
●
●
●
●●
●●
●●●
●
●
●
●
●
●
●●
●
●
●
●
●●
●
●
●
●●
●
●
●
●
●
●
●●
●
●
●
●
●
●
●
●
●
●
●
●
●
●
●
●
●
●
●
●
●
●
●●●●
●
●
●
●
●
●
●
●
●
●
●
●
●●
●
●
●
●●
●
●
●●●●●●
●
●
●
●●●●●●
●
●●●
●●●
●●
●●●
●●●
●●●
●
●
●●●●●●
●
●●
●
●
●
●
●●●●
●●●●●
●
●
●●●●
●
●●
● ●●●●
●●●
●●
●
●
●●
●
●
●●●
●●
●●
●
●
●●●●●● ●●●●●●●●●●●●●●●●●●●●●●●●●●●●●●●●●●●●●●●●●●●●●●●●●●●●●●●●●●●●●●●●●●● ●●●●●●●●●●●●●●●●●●●●●●●●●●●●●●
●●●●●●●●●●●●●●●●●●●●●●●●●●
●
●●●●●●
●
●●●●●●●
●●●●●●
●
●●●●
●●●●●
●
●●●●
●●
●●●
●●●●●
●●●●●●●●●●●●●
●●●●
●●●●●●●●
●●●●●●●●●●●●●●●●●●●●●●●●●●●●●●
●●●●●●●●●●●
●●●●●●●●●●●●●●●●●●●●●●●●●● ●●●●●●●●●●●●●●●●●●●●●●●●●
●●●
●●
●●
●
●●●●●●
●
●
●
●
●●●●●
●
●
●
●●●●
●●
●
●
●
●
●
●
●
●
●
●
●
●
●
●
●
●
●
●
●
●
●
●
●
●
●
●
●
●
●●
●
●
●
●
●
●
●
●
●
●
●●●
●
●
●●
●
●●
●
●
●
●
●●
●
●
●●
●
●
●
●●
●
●
●
●
●
●●●●●●●●●●●●●●●●●●●●●●●●●●●●●●●●●●●●●●●●●●●●●●●●●●●●●●●●●●●●●●●●●●
●
●●●●●●●●●●●●●●●●●●●●●●●●●●●●●●
lcav
ol
lwei
ght
age
lbph sv
i
lcp
glea
son
pgg4
5
lpsa
020
4060
8010
0
●
●
LSTS
Figure 3: prostate dataset. Stripchart of lpsa outcome and 8covariates.
22 / 30

RegularizedRegression
Dudoit
Regularization
RidgeRegression
LASSORegression
Elastic NetRegression
Bias-VarianceTrade-Off
Example:ProstateCancerDataset
Example: Prostate Cancer Dataset
Prostate: Centered and scaled
●
●
●
●
●
●
●
●
●
●●●
●
●
●
●
●
●
●
●
●
●
●
●
●
●
●
●
●●●
●●
●
●
●
●
●●
●
●
●
●●
●
●
●
●
●●
●
●●
●
●●
●
●
●
●
●
●
●
●
●
●
●
●
●
●
●
●
●
●
●
●●
●●
●
●
●
●
●
●
●
●
●●●
●
●
●
●●
●
●
●
●
●
●
●
●
●●●
●●●
●
●
●
●
●●●
●
●
●
●
●
●
●
●
●
●
●
●
●●
●●
●●
●
●
●
●
●
●
●
●
●
●
●
●
●
●●
●
●
●
●
●
●
●
●
●
●
●
●
●●
●
●
●
●
●
●
●
●
●
●
●
●
●
●
●
●
●
●
●
●
●
●
●
●
●●
●
●●
●
●
●
●
●
●
●
●
●
●
●●
●●
●
●
●
●
●●
●
●
●
●●
●
●
●
●
●
●
●
●
●
●
●
●
●
●
●
●
●
●●
●
●
●
●
●
●
●●
●
●
●
●
●
●
●
●
●
●
●
●
●
●
●
●
●●
●
●
●
●
●●●
●
●
●
●
●
●
●
●
●
●
●
●
●
●
●
●
●
●
●
●
●
●
●●●●●●
●
●
●
●●●
●
●●
●
●
●
●
●
●
●
●
●
●
●
●
●
●
●
●●
●
●
●
●●
●
●
●
●
●
●
●
●
●
●
●
●
●
●●
●
●●
●
●
●
●
●●
●
●
●
●●
●
●
●●●
●●
●
●●
●
●
●●
●
●
●●
●
●●
●
●
●
●
●
●
●
●
●
●
●●●●●●●●●●●●●●●●●●●●●●●●●●●
●
●●●●●
●
●●●●●●●●●●●●
●
●
●●
●●
●
●●
●
●
●
●
●●●
●
●●●●
●●●●●●●●●●●●●●●●●●●●
●●
●●
●●
●●
●●
●●●●●●●●●
●
●●
●
●
●●●●
●
●
●
●
●
●
●
●
●
●
●
●
●●
●
●
●●●●●●●
●
●
●
●
●
●
●
●
●
●
●
●
●
●
●
●
●
●
●
●
●
●●
●
●
●
●●●
●
●
●●●●●●●
●
●
●
●
●
●
●
●
●●
●
●
●
●
●
●
●
●
●●
●
●●●●●●
●●
●
●
●●●●●
●●●
●●●●
●
●●●
●
●
●●
●
●
●
●
●
●●
●
●
●●
●
●●●●●●●●●●●●●
●
●●●
●
●●●●
●●●
●●
●●
●
●●
●●●●
●●
●●●●●●
●
●●
●
●
●
●●
●●
●
●●●●●●
●
●
●
●
●●●●●
●
●
●
●●●●
●●
●
●
●
●
●
●
●
●
●
●
●
●
●
●
●
●
●
●
●
●
●
●
●
●
●
●
●
●
●●
●
●
●
●
●
●
●
●
●
●
●●●
●
●
●●
●
●●
●
●●
●
●●
●
●
●●
●
●
●
●●
●
●
●
●
●
●
●●●
●
●●
●●●●●●●
●●●●●●●●●●●
●●●●●●●●●●●●●●●●●●●●●●●
●●●●●●●●●●●●
●●●●
●
●
●
●
●●
●
●●●●
●●●
●●
●●●●●●●●●●●
●●
●●
●
●
lcav
ol
lwei
ght
age
lbph sv
i
lcp
glea
son
pgg4
5
lpsa
−3
−2
−1
01
23
●
●
LSTS
Figure 4: prostate dataset. Stripchart of lpsa outcome and 8covariates, centered and scaled.
23 / 30

RegularizedRegression
Dudoit
Regularization
RidgeRegression
LASSORegression
Elastic NetRegression
Bias-VarianceTrade-Off
Example:ProstateCancerDataset
Example: Prostate Cancer Dataset
0 100 200 300 400 500
−0.
20.
00.
20.
40.
6
Prostate, LS: Ridge
λ
β
lcavol
lweight
age
lbph
svi
lcp
gleason
pgg45
Figure 5: prostate dataset, LS: Ridge. Estimated regressioncoefficients vs. shrinkage parameter λ.
24 / 30

RegularizedRegression
Dudoit
Regularization
RidgeRegression
LASSORegression
Elastic NetRegression
Bias-VarianceTrade-Off
Example:ProstateCancerDataset
Example: Prostate Cancer Dataset
0 100 200 300 400 500
−0.
20.
00.
20.
40.
6
Prostate, LS: LASSO
λ
β
lcavol
lweight
age
lbph
svi
lcp
gleason
pgg45
Figure 6: prostate dataset, LS: LASSO. Estimated regressioncoefficients vs. shrinkage parameter λ.
25 / 30

RegularizedRegression
Dudoit
Regularization
RidgeRegression
LASSORegression
Elastic NetRegression
Bias-VarianceTrade-Off
Example:ProstateCancerDataset
Example: Prostate Cancer Dataset
0 100 200 300 400 500
0.00
00.
005
0.01
00.
015
0.02
00.
025
Prostate, LS: Ridge
λ
Var^
[β]
lcavol
lweightagelbph
svi
lcp
gleason
pgg45
Figure 7: prostate dataset, LS: Ridge. Estimated variance ofestimated regression coefficients vs. shrinkage parameter λ.
26 / 30

RegularizedRegression
Dudoit
Regularization
RidgeRegression
LASSORegression
Elastic NetRegression
Bias-VarianceTrade-Off
Example:ProstateCancerDataset
Example: Prostate Cancer Dataset
0 100 200 300 400 500
0.4
0.6
0.8
1.0
1.2
1.4
Prostate: Ridge and LASSO
λ
MS
E[Y
]
LSTS
RidgeLASSO
Figure 8: prostate dataset: Ridge and LASSO. Learning and testset mean squared error vs. shrinkage parameter λ.
27 / 30
RegularizedRegression
Dudoit
Regularization
RidgeRegression
LASSORegression
Elastic NetRegression
Bias-VarianceTrade-Off
Example:ProstateCancerDataset
Example: Prostate Cancer Dataset
0 100 200 300 400 500
−0.
20.
00.
20.
40.
6
Prostate: Ridge
λ
β
lcavol
lweight
age
lbph
svi
lcp
gleason
pgg45
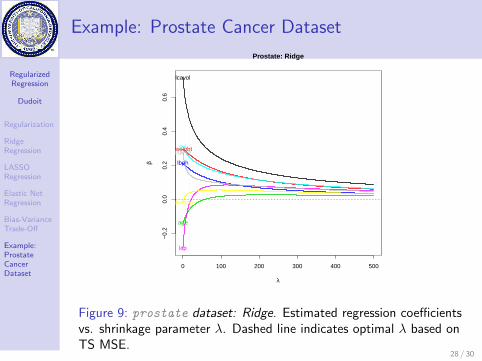
Figure 9: prostate dataset: Ridge. Estimated regression coefficientsvs. shrinkage parameter λ. Dashed line indicates optimal λ based onTS MSE.
28 / 30
RegularizedRegression
Dudoit
Regularization
RidgeRegression
LASSORegression
Elastic NetRegression
Bias-VarianceTrade-Off
Example:ProstateCancerDataset
Example: Prostate Cancer Dataset
0 100 200 300 400 500
−0.
20.
00.
20.
40.
6
Prostate: LASSO
λ
β
lcavol
lweight
age
lbph
svi
lcp
gleason
pgg45
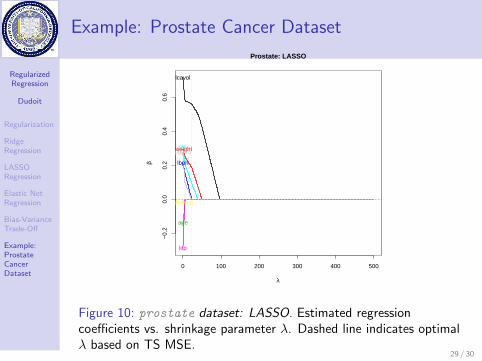
Figure 10: prostate dataset: LASSO. Estimated regressioncoefficients vs. shrinkage parameter λ. Dashed line indicates optimalλ based on TS MSE.
29 / 30

RegularizedRegression
Dudoit
Regularization
RidgeRegression
LASSORegression
Elastic NetRegression
Bias-VarianceTrade-Off
Example:ProstateCancerDataset
Example: Prostate Cancer Dataset
●
●
●
Prostate: Ridge and LASSO
β●
●
●
●
●
●
●
●
●
●
●
●
●
●
●
●
●●
●
●
●
Ridge OLS LASSO
−0.
20.
00.
20.
40.
6
Ridge lambda=22LASSO lambda=17.5
Figure 11: prostate dataset: Ridge and LASSO. Estimatedregression coefficients with optimal λ based on TS MSE.
30 / 30
Related Documents